Embed Size (px)
Citation preview

Catalogue no. 89-642-X — No. 002ISSN 1923-3086 ISBN 978-1-100-16714-5
Ana ly t ica l Paper
Portrait of Official-Language Minorities in Canada -
Anglophones in Quebec
by Jean-Pierre Corbeil, Brigitte Chavez and Daniel Pereira
Social and Aboriginal Statistics Division Jean Talon Building, 7th Floor, 170 Tunney's Pasture Driveway
Ottawa, Ontario K1A 0T6

How to obtain more information
For information about this product or the wide range of services and data available from Statistics Canada, visit our website at www.statcan.gc.ca, e-mail us at [email protected], or telephone us, Monday to Friday from 8:30 a.m. to 4:30 p.m., at the following numbers:
Statistics Canada’s National Contact CentreToll-free telephone (Canada and United States): Inquiries line 1-800-263-1136 National telecommunications device for the hearing impaired 1-800-363-7629 Fax line 1-877-287-4369
Local or international calls: Inquiries line 1-613-951-8116 Fax line 1-613-951-0581
Depository Services Program Inquiries line 1-800-635-7943 Fax line 1-800-565-7757
To access this product
This product, Catalogue no. 89-642-X, is available free in electronic format. To obtain a single issue, visit our website at www.statcan.gc.ca and browse by “Key resource” > “Publications.”
Standards of service to the public
Statistics Canada is committed to serving its clients in a prompt, reliable and courteous manner. To this end, Statistics Canada has developed standards of service that its employees observe. To obtain a copy of these service standards, please contact Statistics Canada toll-free at 1-800-263-1136. The service standards are also published on www.statcan.gc.ca under “About us” > “The agency” > “Providing services to Canadians.”

Statistics Canada
Social and Aboriginal Statistics Division
Portrait of Official-Language Minorities in Canada - Anglophones in Quebec
Note of appreciation
Canada owes the success of its statistical system to a long-standing partnership between Statistics Canada, the citizens of Canada, its businesses, governments and other institutions. Accurate and timely statistical information could not be produced without their continued cooperation and goodwill.
Published by authority of the Minister responsible for Statistics Canada
© Minister of Industry, 2010
All rights reserved. The content of this electronic publication may be reproduced, in whole or in part, and by any means, without further permission from Statistics Canada, subject to the following conditions: that it be done solely for the purposes of private study, research, criticism, review or newspaper summary, and/or for non-commercial purposes; and that Statistics Canada be fully acknowledged as follows: Source (or “Adapted from”, if appropriate): Statistics Canada, year of publication, name of product, catalogue number, volume and issue numbers, reference period and page(s). Otherwise, no part of this publication may be reproduced, stored in a retrieval system or transmitted in any form, by any means—electronic, mechanical or photocopy—or for any purposes without prior written permission of Licensing Services, Client Services Division, Statistics Canada, Ottawa, Ontario, Canada K1A 0T6.
September 2010
Catalogue no. 89-642-X no. 002
ISSN 1923-3086
Frequency: Occasional
Ottawa
Cet publication est egalement disponible en Français.
ISBN 978-1-100-16714-5

User information
Symbols
The following standard symbols are used in Statistics Canada publications:
. not available for any reference period
.. not available for a specific reference period
... not applicable
0 true zero or a value rounded to zero
0s value rounded to 0 (zero) where there is a meaningful distinction between true zero and the value that wasrounded
p preliminary
r revised
x suppressed to meet the confidentiality requirements of the Statistics Act
E use with caution
F too unreliable to be published
Acknowledgements
This report was made possible thanks to the collaboration and financial support of Canadian Heritage’s Official Languages Secretariat, Human Resources and Social Development Canada, and Justice Canada.
The authors wish to specially thank Julie Bertrand of the Language Statistics Section of Statistics Canada for her technical support, her professionalism and her outstanding contribution in this project.
As well, acknowledgement are given to Michèle Lanoue, Denis Theriault, Lucie Parisien, Suzanne Belair, Nathalie Villemure, René Houle and Jean-François Lepage of the Social and Aboriginal Statistics Division for their important
contribution in the completion of this project.

Portrait of Official-Language Minorities in Canada – Anglophones in Quebec
Statistics Canada – Catalogue no. 89-642-X 5
Table of contents
Introduction.............................................................................................................................................................7
Section 1 Definitions of Quebec’s English-speaking population......................................................................8
Data sources ..................................................................................................................................................... 10
Section 2 Evolution of the population by mother tongue and first official language spoken..................... 11
2.1 Evolution of the population by mother tongue............................................................................................. 11
2.2 Evolution of the population by first official language spoken ...................................................................... 13
2.3 Geographic distribution of the population with English as first official language spoken............................ 14
2.4 Relative proportion within municipalities of residence and geographic concentration index...................... 15
Section 3 Factors influencing the evolution of the population with English as a mother tongue.............. 19
3.1 Fertility......................................................................................................................................................... 19
3.2 Transmission of mother tongue and the effect of exogamy........................................................................ 20
3.3 Age structure ............................................................................................................................................... 25
3.4 Language transfers or intragenerational linguistic mobility......................................................................... 30
3.5 Use of English and French in the public sphere ......................................................................................... 38
3.6 Knowledge of English.................................................................................................................................. 42
3.7 Migration (interprovincial and international migratory movements) ............................................................ 46
3.7.1 Place of birth ........................................................................................................................................ 46 3.7.2 International immigration...................................................................................................................... 48 3.7.3 Interprovincial migration....................................................................................................................... 50
Section 4 A few key sectors for the vitality of official-language minority communities.............................. 55
4.1 Health .......................................................................................................................................................... 55
4.2 Justice ......................................................................................................................................................... 57
4.3 Education .................................................................................................................................................... 63
4.3.1 Children................................................................................................................................................ 63 4.3.2 Adults ................................................................................................................................................... 69
4.4 Media, arts and culture................................................................................................................................ 75
4.5 Community life............................................................................................................................................. 78
4.6 Employment and income characteristics .................................................................................................... 80
4.6.1 Distribution within employment sectors by region of residence........................................................... 82 4.6.2 Use of English at work by industry sector............................................................................................ 84 4.6.3 Income differentials.............................................................................................................................. 85

Portrait of Official-Language Minorities in Canada – Anglophones in Quebec
Statistics Canada – Catalogue no. 89-642-X 6
Table of contents (conclude)
Section 5 Subjective vitality ............................................................................................................................... 90
Conclusion ........................................................................................................................................................... 96
Geographical maps ............................................................................................................................................. 99
Appendix A......................................................................................................................................................... 107
Appendix B......................................................................................................................................................... 114
Appendix C......................................................................................................................................................... 118
Appendix D......................................................................................................................................................... 119
Appendix E ......................................................................................................................................................... 120
Appendix F ......................................................................................................................................................... 121
References ......................................................................................................................................................... 122

Portrait of Official-Language Minorities in Canada – Anglophones in Quebec
Statistics Canada – Catalogue no. 89-642-X 7
Introduction This demolinguistic portrait of the English-speaking population in Quebec was undertaken with the financial support of Canadian Heritage’s Official Languages Secretariat, Human Resources and Social Development Canada (HRSDC) and Justice Canada. It is the second of a series of portraits of official-language minorities in Canada, prepared by Statistics Canada’s Language Statistics Section. This study paints a general statistical portrait of the official-language minority in Quebec based on data from the Census of Population and the Survey on the Vitality of Official-Language Minorities in Canada, conducted in 2006. The purpose of such a portrait is to present a set of characteristics, behaviours and perceptions of the official-language minority population, exploiting the analytical opportunities contained in the data. This document is intended to be neither a mere collection of tables nor an in-depth study of the demolinguistic dynamics of the English-speaking population in Quebec. It presents a range of information on a set of themes and issues that are of interest to official-language minorities and anyone interested in the past, present and future of minority official-language populations in Canada. Section 1 of this demolinguistic portrait concerns the choice of criteria for defining the English-speaking population in Quebec, to be used for the purposes of this study. It also provides a brief description of the data sources used. Section 2 presents varied information on how the English-speaking population has evolved and its geographic distribution and concentration in Quebec. This information includes a series of appended maps and a detailed table on the number, relative weight and distribution of the English-speaking population in Quebec. Section 3 concerns the main factors that affect or are affected by changes over time in this province’s English-speaking population: fertility; the transmission of mother tongue and the effect of exogamy; the age structure; intragenerational linguistic mobility; and interprovincial and international migration. It also provides information on the use of English in the public sphere and on how the ability to conduct a conversation in that language has evolved in groups with a mother tongue other than English or French. Section 4 of this portrait looks at a few sectors essential to the vitality of minority official-language communities, as identified in the Roadmap for Canada's Linguistic Duality 2008-2013: health; justice; education and the media, the arts and culture. It also provides statistics on community participation, employment and income characteristics, and the use of English at work. The last section of this portrait presents statistics on Anglophones’ identity, their perceptions regarding the presence of English in their community, the provision of services in English by the federal government, the respect for linguistic rights, and the perceived importance that people work on developing the Anglophone community.

Portrait of Official-Language Minorities in Canada – Anglophones in Quebec
Statistics Canada – Catalogue no. 89-642-X 8
is nglish.
between language groups. In this case, the umber of English mother tongue persons would reach 640,600.
is neither English nor French evertheless use English either predominantly or commonly in their daily lives.
ngue other than English or French (20% in 2006). Such persons are often designated y the term “allophones.”
nes between English and French based on the reported knowledge of one or the other of the official languages.
Section 1 Definitions of Quebec’s English-speaking population This statistical portrait of Quebec’s official-language minority contains information drawn from Canadian census variables. The census includes no fewer than six questions or sub-questions that provide information on official languages, namely knowledge of official languages, language spoken most often at home, other languages spoken on a regular basis at home, mother tongue, language used most often at work, and other languages used on a regular basis at work. What is the definition of the minority official-language group in Quebec? How do we define an Anglophone? There is no established definition of Anglophone. For historical reasons, Statistics Canada has generally used the criterion of mother tongue, that is, the first language learned at home in childhood and still understood at the time of the census. Statistics based on mother tongue have the advantage of being roughly comparable going back more than half a century. Other criteria are also used, opening the way for either more inclusive or more restrictive definitions of English-speaking persons. Thus, does the definition of an Anglophone in Quebec apply to some 607,000 persons who reported having English as their mother tongue1 at the time of the 2006 Census, 995,000 persons with English as their first official language spoken2, or 1,275,000 persons3 who speak English most often (more than 835,000) or on a regular basis (more than 439,000) at home? Or should a broader definition be considered? Such a definition might include all of the approximately 3.4 millions English speakers, or indeed more if we include young children who do not speak English, but who have at least one parent whose mother tongueE Also, in choosing a strategy for estimating a language group, it is important to take account of two main considerations. On the one hand, if the objective is to enumerate the population considering all language groups on an equal basis—in other words, treating them symmetrically and creating mutually exclusive categories for estimating them (e.g., English, French, Other), then this implies an appropriate allocation of multiple responses. In which case, Quebec English-mother-tongue population would number 607,160 persons. On the other hand, if the objective is to focus on a single language group (e.g., Anglophones), the criteria for inclusion can be broadened without being concerned about the implicit overlapsn In this statistical portrait of Anglophones in Quebec, two criteria will mainly be used: mother tongue and first official language spoken. The latter criterion is now used increasingly as a criterion for defining language groups in studies on official-language minorities. The reason for this is that shifts over the years in the composition of the Canadian population tend to call for a redefinition or broadening of the concept of Anglophone group or community, since a significant number of persons whose mother tonguen A number of considerations lay behind the creation of the concept of “first official language spoken.” Firstly, the substantial increase in immigration since the mid-1980s has had the effect of increasing the size of the population with a mother tob Since an allophone cannot become an Anglophone on the basis of mother tongue, but can become one by adopting English as the language used most often at home or in the public sphere, the question arises as to how to designate individuals’ first official language spoken, or, more specifically, how to allocate allopho
1. The number is 640,600 if all single and multiple responses mentioning English are included. 2. This number includes all single responses and half of “English-French” responses. 3. This number includes all single or multiple responses mentioning English.

Portrait of Official-Language Minorities in Canada – Anglophones in Quebec
Statistics Canada – Catalogue no. 89-642-X 9
Questions of this type led to the development of different variants of the concept of first official language spoken (Statistics Canada, 1989).4 This concept echoes the spirit of the current version of the Official Languages Act (1988) which specifies, in section 32(2), that the government may consider “the English or French linguistic minority population of the area served by an office or facility, the particular characteristics of that population and the proportion of that population to the total population of that area.” The concept of first official language spoken was chosen by the federal government, in December 1991, in the Official Languages (Communications with and Services to the Public) Regulations. Section 2 of the Regulations describes the method used to determine “the first official language spoken,” namely the first of the two variants presented in Statistics Canada (1989) a method that successively takes account of the responses to the questions on knowledge of official languages, mother tongue and language spoken most often at home. The “first official language spoken” variable is thus not a census question but is instead derived from three questions in the language module of the census. The concept of first official language spoken (FOLS) serves to allocate the Canadian population between the country’s two main language groups. Thus, in Canada, just over 97% of the population has either English or French as its first official language spoken. The residual portion is comprised of persons who cannot conduct a conversation in either English nor French (1.6 %) and persons who know both official languages and who cannot be assigned one or the other of the two official languages on the basis of the three census variables used for this purpose (1.1%). Unlike the population with English as a mother tongue, English as FOLS excludes persons for whom English is the mother tongue who reported being unable to conduct a conversation in English at the time of the census. Also, the Anglophone population (based on FOLS) includes persons with an “other” mother tongue (other than English or French) who speak English most often at home as well as those who, while having a non-official language as the main home language, can also conduct a conversation in English but not in French. It also includes half the persons who can conduct a conversation in English and French who speak an “other” language or both official languages most often at home. This report will draw a statistical portrait of Anglophones in Quebec, primarily using the FOLS criterion, but when relevant, will also draw from information on mother tongue.5 Following the practice of the Treasury Board Secretariat, Quebec’s Anglophone population will refer here to persons having only English as their first official language spoken (FOLS) and half the population who have both English and French as their FOLS, that is, persons for whom it is not possible to assign either English or French based on responses to the three variables mentioned above. Lastly, it is also worth noting that Quebec has 218,560 persons with both English and French as first official languages spoken in the last census. Because these persons generally have characteristics and behaviours that may significantly differ from those persons who only have English as their FOLS, this report highlights, when relevant, distinctive characteristics which differentiate the two groups. 6
4. Statistics Canada, Population Estimates by First Official Language Spoken, Ottawa, Statistics Canada, Housing and Social
Statistics Division and Language Studies, 1989. 5. In this report we will use interchangeably the terms “Anglophones”, “English-speaking” or “Anglo Quebecers”. With the exception
of when referring specifically to Anglophones by the mother tongue criterion, this report uses the one of first official langue spoken to designate the Anglophone or English-speaking population. In this sense, the target population in this report differs slightly from the one in the report on the first Survey on the Vitality of Official-Language Minorities results published in December 2007.
6. It is worth noting, that 66.2% of Quebecers with English as first official language spoken also have this language as their mother tongue, compared to 3.7% of those who have both English and French as first official language spoken.

Portrait of Official-Language Minorities in Canada – Anglophones in Quebec
Statistics Canada – Catalogue no. 89-642-X 10
Data sources This portrait of the English-speaking population in Quebec contains information drawn from Canadian censuses from 1951 to 2006 and the Survey on the Vitality of Official-Language Minorities (SVOLM)7 conducted in 2006 by Statistics Canada.
Census: The census data contained in this report are drawn from the long census questionnaire, completed by 20% of households and including 61 questions of which 7 are language-related. Survey on the Vitality of Official-Language Minorities (SVOLM): This is a cross-sectional sample survey. Respondents to the (SVOLM) are selected from the sample of persons who completed the long questionnaire in the 2006 Census. The survey focuses on Canada’s official-language minorities, namely French-speaking persons outside Quebec and English-speaking persons in Quebec. The data can be used to gain a deeper understanding of the current situation of individuals belonging to these two groups on subjects as varied as education in the minority language, access to different services in the minority language (the health care sector in particular), language practices in daily activities both in the home and outside the home, and matters of linguistic identity.
7. For information on the SVOLM, the reader is invited to consult the Statistics Canada website at:
http://www.statcan.gc.ca/cgi-bin/imdb/p2SV.pl?Function=getSurvey&SDDS=5099&lang=fr&db=imdb&adm=8&dis=2.

Portrait of Official-Language Minorities in Canada – Anglophones in Quebec
Statistics Canada – Catalogue no. 89-642-X 11
Section 2 Evolution of the population by mother tongue and first official language spoken
2.1 Evolution of the population by mother tongue Quebec’s English-mother-tongue population was 607,165 in 2006 compared to 558,256 in 1951, an increase of 8.8%. By comparison, the French-mother-tongue population grew by 76.8% to 5,916,845 in 2006 while the population with a mother tongue other than English or French increased more than five-fold (506.3%), totalling 911,895 in 2006 compared to just over 150,000 in 1951.8 Table 2.1.1 Population by mother tongue, Quebec, 1951 to 2006
Total
number number % number % number %
1951 4,055,681 558,256 13.8 3,347,030 82.5 150,395 3.7
1961 5,259,211 697,402 13.3 4,269,689 81.2 292,120 5.6
1971 6,027,764 788,833 13.1 4,866,408 80.7 372,523 6.2
1981 6,369,068 693,598 10.9 5,254,196 82.5 421,274 6.6
1991 6,810,300 626,201 9.2 5,585,648 82.0 598,451 8.8
1996 7,045,075 621,860 8.8 5,741,430 81.5 681,785 9.7
2001 7,125,579 591,365 8.3 5,802,020 81.4 732,175 10.3
2006 7,435,903 607,165 8.2 5,916,845 79.6 911,895 12.3
Mother tongue
Year English Other languagesFrench
Note(s): Except 1951 to 1971 censuses, the multiple responses were equally redistributed among the three main linguistic groups. Source(s): Statistics Canada, censuses of population, 1951 to 2006. Table 2.1.2 shows the average annual growth rate for the population of each mother tongue group since 1951. As may be seen, during the postwar period (1951 to 1961), the population with a mother tongue other than French or English grew at an average rate of nearly 9.4% annually because of the strong increase in international immigration, compared to an average annual growth rate of 2.5% for the English-mother-tongue population and 2.8% for the French-mother-tongue population. The table also shows that the average annual increase of the population with English as its mother tongue has been negative in each decade since the early 1970s except for the five-year period 2001 to 2006, when a slightly positive growth rate was recorded. By contrast, the average annual growth rate of the population with an “other” mother tongue has ranged between 0.7% and 4.2% annually since the early 1970s. Owing to the strong growth of international immigration in the last five-year period, the average growth rate of the “other”-mother-tongue population was nearly ten times greater than that of the other two language groups.
8. As will be seen further on in this report, the migration of Anglophones to other Canadian provinces is the main factor explaining
why the number of Anglophones showed so little change.

Portrait of Official-Language Minorities in Canada – Anglophones in Quebec
Statistics Canada – Catalogue no. 89-642-X 12
Table 2.1.2 Yearly average population growth rate by mother tongue, Quebec, 1951 to 2006
English French Other
1951 to 1961 2.49 2.76 9.42
1961 to 1971 1.31 1.40 2.75
1971 to 1981 -1.21 0.80 1.31
1981 to 1991 -0.97 0.63 4.21
1991 to 1996 -0.07 0.28 1.39
1996 to 2001 -0.49 0.11 0.74
2001 to 2006 0.27 0.20 2.45
Mother tongue
Period
percentage
Source(s): Statistics Canada, censuses of population, 1951 to 2006. Canada’s English-mother-tongue population represents 57.8% of the Canadian population as a whole. In Canada, with the exception of Quebec and Nunavut, the English-mother-tongue population predominates in all provinces and territories. In Quebec, the English-mother-tongue population represents 8.2% of the total, while the French-mother-tongue population represents 79.6%. In Nunavut, English is the mother tongue of 27.0% of the population. Quebec Anglophones as a proportion of the English-mother-tongue population outside Quebec declined by half between 1951 and 2006, going from 7.2% to 3.5%.
Table 2.1.3 Number of persons with English mother tongue and relative weight of Quebec Anglophones within the overall Anglophone population outside Quebec, 1951 to 2006
Quebec Canada less Quebec
percentage
1951 558,256 7,722,553 7.2
1961 697,402 9,963,132 7.0
1971 788,833 12,178,610 6.5
1981 693,598 14,091,215 4.9
1991 626,201 15,685,005 4.0
1996 621,858 16,450,574 3.8
2001 591,365 16,930,519 3.5
2006 607,165 17,448,525 3.5
Relative weight of Quebec Anglophones
Year
number
English mother tongue
Source(s): Statistics Canada, censuses of population, 1951 to 2006.

Portrait of Official-Language Minorities in Canada – Anglophones in Quebec
Statistics Canada – Catalogue no. 89-642-X 13
2.2 Evolution of the population by first official language spoken As described in Section 1, the criterion of the first official language spoken (FOLS) offers a more inclusive definition of the Anglophone population. The English FOLS population’s relative share is 11.9% (885,000) excluding those having French and English as a double first official language, and 13.4% (995,000) when half the population with both French and English as FOLS is included. This is a sizable difference, in comparison with the 607,000 persons who have English as their mother tongue. Table 2.2.1 Population by first official language spoken, Quebec, 1971 to 2006
Total
number number % number % number % number % number %
1971 6,027,764 958,250 15.9 4,937,834 81.9 68,236 1.1 63,444 1.1 992,368 16.5
1981 6,369,068 823,746 12.9 5,364,682 84.2 131,733 2.1 48,907 0.8 889,612 14.0
1991 6,810,300 832,048 12.2 5,772,180 84.8 144,506 2.1 61,566 0.9 904,301 13.3
1996 7,045,083 842,104 12.0 5,963,677 84.7 167,458 2.4 71,844 1.0 925,833 13.1
2001 7,125,579 828,730 11.6 6,059,113 85.0 180,452 2.5 57,284 0.8 918,956 12.9
2006 7,435,900 885,445 11.9 6,263,945 84.2 218,555 2.9 67,955 0.9 994,723 13.4
First official language spoken
YearFrench
English
minority1
Neither Englishnor
French
English and
FrenchEnglish
1. Total of FOLS English and half of FOLS English and French. Source(s): Statistics Canada, censuses of population, 1971 to 2006. In light of the results presented in table 2.2.1 and chart 2.2.1, it is clear that the size of the population with English as its mother tongue is smaller than one of the population for whom English is the first official language spoken. Indeed, the gap between the two has widened since 1981, owing to the combined effect of the departure of English-mother-tongue persons to other provinces and the increased immigration of persons with an “other” mother tongue for whom English is the first official language spoken. In particular, between 2001 and 2006, the English-mother-tongue group grew by 16,000 persons, compared to an increase of nearly 76,000 for the group with English as its first official language spoken.

Portrait of Official-Language Minorities in Canada – Anglophones in Quebec
Statistics Canada – Catalogue no. 89-642-X 14
Chart 2.2.1 Number of persons with English as mother tongue and as first official language spoken, Quebec 1951 to 2006
0
100,000
200,000
300,000
400,000
500,000
600,000
700,000
800,000
900,000
1,000,000
1951 1961 1971 1981 1991 2001 2006
num
ber
Mother tongue First official language spoken
Note(s): As the question on home language was introduced in the 1971 Census for the first time, we cannot derive First official language spoken before 1971.
Source(s): Statistics Canada, censuses of population, 1951 to 2006.
2.3 Geographic distribution of the population with English as first official
language spoken While the proportion of Anglophones within the Quebec population is 13.4% province-wide, the geographic distribution of this group is quite uneven. Three regions of the province account for nearly 92% (or 911,000 persons) of the Anglophone population (see table 2.3.1). Thus, Anglophones in the Montréal Census Metropolitan Area (CMA) account for 80.5% (or 801,000 persons) of Quebec’s Anglophone population, and their relative share within the population of that CMA is 22%. In other words, 22% of the population residing in the Montréal CMA has English as its first official language spoken (FOLS). Anglophones in the Outaouais region account for 6% (or 59,000 persons) of Quebec’s Anglophone population, while those in the Estrie and South of Quebec region account for 5% (or 51,000 persons). Their relative weight within the population of those two regions is 17% and 9% respectively. The province’s other Anglophones (8.5% of them) reside in the regions of Québec and surrounding area (1.7%), the East of Quebec (1.7%) and the Rest of Quebec (5.1%). Their relative weight within the whole population of their respective regions barely exceeds 4%.

Portrait of Official-Language Minorities in Canada – Anglophones in Quebec
Statistics Canada – Catalogue no. 89-642-X 15
Table 2.3.1 Number and distribution of Anglophones (first official language spoken) (in %) within the province and proportion of Anglophones within the region of residence, Quebec, 2006
Anglophones
Distribution of Anglophones
within the province
Proportion of Anglophones
within the region
number
Montréal 801,207 80.5 22.3
East 16,454 1.7 4.3
Outaouais 58,842 5.9 17.4
Estrie and South 51,172 5.1 8.7
Québec and surrounding area 17,388 1.7 1.3
Rest of Quebec 50,435 5.1 4.1
Total Quebec 995,500 100.0 13.4
percentage
Region of residence
Source(s): Statistics Canada, 2006 Census of population.
2.4 Relative proportion within municipalities of residence and geographic concentration index
In this statistical portrait of Anglophones in Quebec, we will not limit ourselves to presenting information on each of the six major regions of residence as shown in table 2.3.1. Each of those regions consists of a number of census divisions (CDs) and census subdivisions (CSDs). Because Anglophones are not distributed evenly among these various geographic entities and because the proportion that they represent varies from one CD or CSD to another within the regions, it is quite useful for the purposes of this study to present statistics that take account of their relative share within their municipality of residence. In other words, the proportion that Anglophones represent within their municipality may have a greater influence on their linguistic perception and practices than does their proportion within a larger region. We examined the distribution of Anglophones according to the relative weight of their language group within their municipality of residence (see table 2.4.1). This revealed a distribution that casts new light on the minority/majority ratio. More than 70% of Anglophones (714,000) in Quebec live in a municipality where the Anglophone group represents at least 30% of the population. In fact, approximately half of Quebec’s Anglophones (52% or 515,000 persons) comprise between 30% and 49.9% of the population of the municipality in which they live, and 200,000 of the province’s Anglophones, or 20% of the total, live in municipalities in which they constitute the majority.

Portrait of Official-Language Minorities in Canada – Anglophones in Quebec
Statistics Canada – Catalogue no. 89-642-X 16
Table 2.4.1 Number and percentage of Anglophones by the relative weight of this language group within the municipality of residence, Quebec, 2006
number percentage
0 to 9% 93,049 9.3
10 to 29% 188,276 18.9
30 to 49% 514,669 51.7
50 to 69% 35,347 3.6
70% and over 164,158 16.5
Total 995,500 100.0
Relative weight within the municipality
Anglophones
Source(s): Statistics Canada, 2006 Census of population. With the exception of the region of Québec and surrounding area, the proportion that Anglo Quebecers represent within their municipality of residence varies enormously from one region to another (see chart 2.4.1). Québec and surrounding area accounts for only 1.7% of the province’s Anglophones, but this region stands out from the others by the fact that almost all (97%) of the Anglophones found there reside in municipalities in which their relative weight is less than 10% of the population. By contrast, in the Montréal CMA, which is made up of some 90 municipalities, nearly one Anglophone in five lives in a municipality where this linguistic group forms the majority of the population, a proportion fairly similar to that observed in the Outaouais region.9 Chart 2.4.1 also shows that 62% of Anglophones in the greater Montréal region live in municipalities where they comprise between 30% and 50% of the population. In other words, more than eight Anglophones in ten in this CMA comprise nearly one-third of the population of the municipality in which they live. In the East of Quebec region, which accounts for less than 2% of the province’s Anglophones, 45% of Anglo Quebecers live in a municipality where they form the majority of the population, a proportion slightly higher than what is observed in the “Rest of the Province,” namely 37%.
9.Tables A-1 and A-2 in appendix A and the maps preceding it show the relative weight of the Anglophone population within each
region and within each census division and census subdivision included in it in 2006.

Portrait of Official-Language Minorities in Canada – Anglophones in Quebec
Statistics Canada – Catalogue no. 89-642-X 17
Chart 2.4.1 Distribution of Anglophones in Quebec regions by their relative weight within the municipality of residence, 2006
0
10
20
30
40
50
60
70
80
90
100
Montréal East Outaouais Estrie andSouth
Québec andsurrounding
area
Rest of Quebec
distribution of Anglophones in the municipality of residence
perc
enta
ge
0 to 9% 10 to 29% 30 to 49% 50 to 69% 70% and over
Source(s): Statistics Canada, 2006 Census of population. The information on Anglophones’ proportional weight within their municipality of residence is quite useful in analysing their perceptions and language behaviours. However, the municipalities vary in size, and in the case of large metropolitan areas, for example, this information does not reveal whether Anglophones are spread throughout the area as a whole or are instead concentrated in certain specific regions. It is therefore useful to distinguish municipalities where Anglophones are concentrated in a specific part of the geographic area from those where they do not exhibit any particular concentration. For this purpose, the distribution of Anglophones throughout the geographic area is presented here using a concentration index.10 Table 2.4.2 shows the usefulness of such a concept for each of the major regions studied in this report. Also, this information is highly useful insofar as the concentration of a language group within a given area, like the group’s relative weight, is likely to influence the language practices of its members and the vitality of this linguistic community.
10. See appendix D for a description of the concentration index and the concept of dissemination area.
Portrait of Official-Language Minorities in Canada – Anglophones in Quebec
Statistics Canada – Catalogue no. 89-642-X 18
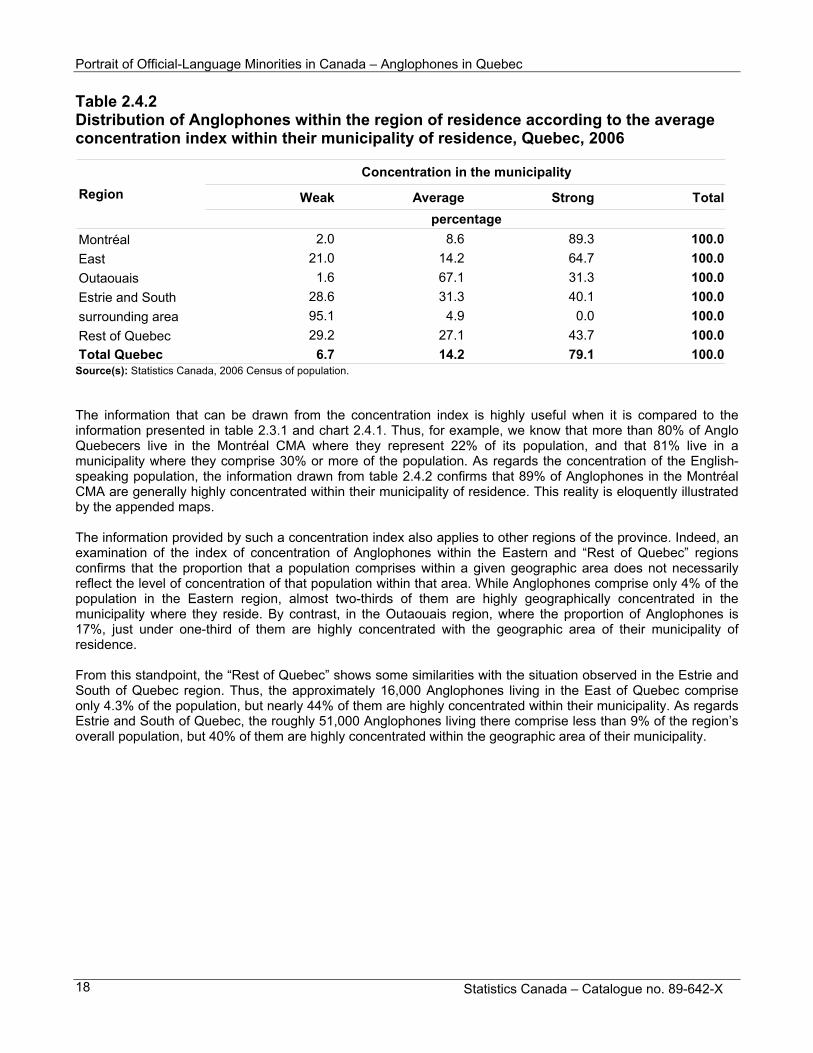
Table 2.4.2 Distribution of Anglophones within the region of residence according to the average concentration index within their municipality of residence, Quebec, 2006
Weak Average Strong Total
Montréal 2.0 8.6 89.3 100.0
East 21.0 14.2 64.7 100.0
Outaouais 1.6 67.1 31.3 100.0
Estrie and South 28.6 31.3 40.1 100.0
surrounding area 95.1 4.9 0.0 100.0
Rest of Quebec 29.2 27.1 43.7 100.0
Total Quebec 6.7 14.2 79.1 100.0
Region
percentage
Concentration in the municipality
Source(s): Statistics Canada, 2006 Census of population. The information that can be drawn from the concentration index is highly useful when it is compared to the information presented in table 2.3.1 and chart 2.4.1. Thus, for example, we know that more than 80% of Anglo Quebecers live in the Montréal CMA where they represent 22% of its population, and that 81% live in a municipality where they comprise 30% or more of the population. As regards the concentration of the English-speaking population, the information drawn from table 2.4.2 confirms that 89% of Anglophones in the Montréal CMA are generally highly concentrated within their municipality of residence. This reality is eloquently illustrated by the appended maps. The information provided by such a concentration index also applies to other regions of the province. Indeed, an examination of the index of concentration of Anglophones within the Eastern and “Rest of Quebec” regions confirms that the proportion that a population comprises within a given geographic area does not necessarily reflect the level of concentration of that population within that area. While Anglophones comprise only 4% of the population in the Eastern region, almost two-thirds of them are highly geographically concentrated in the municipality where they reside. By contrast, in the Outaouais region, where the proportion of Anglophones is 17%, just under one-third of them are highly concentrated with the geographic area of their municipality of residence. From this standpoint, the “Rest of Quebec” shows some similarities with the situation observed in the Estrie and South of Quebec region. Thus, the approximately 16,000 Anglophones living in the East of Quebec comprise only 4.3% of the population, but nearly 44% of them are highly concentrated within their municipality. As regards Estrie and South of Quebec, the roughly 51,000 Anglophones living there comprise less than 9% of the region’s overall population, but 40% of them are highly concentrated within the geographic area of their municipality.

Portrait of Official-Language Minorities in Canada – Anglophones in Quebec
Statistics Canada – Catalogue no. 89-642-X 19
Section 3 Factors influencing the evolution of the population with English as a mother tongue
How the language groups in a given province or region evolve depends on the combined effect of different factors: on the one hand the determinants of natural increase—fertility and mortality—and on the other hand, internal and international migration. An additional factor is intergenerational linguistic continuity, that is, the mother-to-child transmission of the mother tongue.11 Yet another factor will also be described in this section, namely intragenerational linguistic continuity or its obverse, language substitution or transfer. The latter, while it does not directly influence how a language group evolves in the short term, can nevertheless have a major long-term influence, in that the language predominantly used in the home is generally the one transmitted to the children. In this section, much of the information provided will focus on the English-mother-tongue group in Quebec. However, in some cases, in particular the case of interprovincial migration and international immigration, the analysis will also cover the population with English as the first official language spoken.
3.1 Fertility During the first half of the twentieth century, fertility differences between language groups partly accounted for the growth or maintenance of the population of some groups in relation to others. In Quebec in the 1950s and 1960s, Francophone women exhibited higher fertility than Anglophone or allophone women. This high fertility among Francophones, which had prevailed at least since the mid-nineteenth century, thus served to offset the unfavourable effects of international immigration insofar as the latter favoured the growth of the English-mother-tongue population. The fertility of Francophone women then fell substantially, with the result that over a period of just twenty years (from 1956 to 1976), the average number of children per woman went from 4.2 to 1.8. There was also a drop in fertility among women with English as their mother tongue, but it was less dramatic, going from 3.3 to 1.6 during the same period. In the following five-year periods, the fertility trends of Francophone and Anglophone women of Quebec converged, so that between 1981 and 1986, their fertility rates were identical. Demographers have determined that in the current conditions of low mortality, the replacement level corresponds to a rate of 2.1, that is, 2,100 children per 1,000 women. As may be seen in table 3.1, the fertility level of Anglophones and Francophone women in Quebec fell below the replacement level starting in the period 1971 to 1976, while for women with an “other” mother tongue, this phenomenon occurred during the following five-year period, from 1976 to 1981. Another point worth noting is that during the past two decades, from 1986 to 2006, the fertility rates of Anglophones and Francophones in Quebec edged slightly upward and then fell back below the level of 1.5 children per woman. As regards women in the “other”-mother-tongue group, their fertility rate has consistently been higher than that of their Anglophone counterparts since the mid-1960s. In this regard, however, caution is warranted when examining the effect of higher fertility for “other”-mother-tongue women, for as will be seen further on, the transmission of French or English to children is a significant phenomenon, especially when the male partner has English or French as a mother tongue.
11. Of course, a language is also transmitted from fathers to their children, but it is usually the mother’s language that predominates.

Portrait of Official-Language Minorities in Canada – Anglophones in Quebec
Statistics Canada – Catalogue no. 89-642-X 20
Table 3.1 Total fertility rate by mother tongue, Quebec, 1956 to 2006
All languages English French Other
1956 to 1961 3.99 3.26 4.22 2.79
1961 to 1966 3.43 3.04 3.54 2.93
1966 to 1971 2.26 2.09 2.27 2.58
1971 to 1976 1.82 1.62 1.81 2.26
1976 to 1981 1.71 1.46 1.71 2.04
1981 to 1986 1.49 1.46 1.47 1.79
1986 to 1991 1.51 1.54 1.49 1.78
1991 to 1996 1.66 1.63 1.64 1.94
1996 to 2001 1.52 1.48 1.48 1.86
2001 to 2006 1.54 1.44 1.48 1.86
Children per woman
number
Five-year period
Note(s): The method used to calculate the fertility rate is taken from Lachapelle, Réjean. 1988. "Changes in Fertility among Canada's
Linguistic Groups." Canadian Social Trends, no 10, Statistics Canada Catalogue no 11-008-E, pp. 2-8. Source(s): Statistics Canada, censuses of population, 1956 to 2006.
3.2 Transmission of mother tongue and the effect of exogamy Although the total fertility rate provides useful information on the number of births within different mother-tongue groups, it does not provide any information on the mother tongue transmitted to children. The tendency to transmit a language to one’s children varies according to a number of factors, and one of the most important of these is the geographic concentration of the population consisting of a given language group. As will be seen below, this factor also influences the propensity to form an exogamous couple, that is, a couple in which the partners do not have the same mother tongue. Also, the lower the geographic concentration or relative weight of a language group in a given community, the lower the propensity of parents to transmit the minority language. As chart 3.2.1 shows, the proportion of couples with at least one English-mother-tongue partner who transmit English as a mother tongue to their children varies from one region to another in Quebec. In two regions of the province, at least seven children in ten had English transmitted to them as a mother tongue: Montréal (78.4%) and the East of Quebec (69.7%). In the other regions, the proportions are below the provincial average (71.8%): Outaouais (63.4%), Estrie and South of Quebec (64.1%), Rest of the Province (49%) and Québec and surrounding area (34.1%).

Portrait of Official-Language Minorities in Canada – Anglophones in Quebec
Statistics Canada – Catalogue no. 89-642-X 21
Chart 3.2.1 Proportion of children with English as mother tongue among families where at least one of the parents has English as mother tongue by region, Quebec, 2006
78.4
69.763.4 64.1
34.1
49.0
71.8
0
10
20
30
40
50
60
70
80
90
100
Montréal East Outaouais Estrie andSouth
Québec andsurrounding
area
Rest ofQuebec
TotalQuebec
perc
enta
ge
Region
Note(s): Only single responses were used for parents, whereas in the case of children all responses were taken into account. Source(s): Statistics Canada, 2006 Census of population. The proportion of Anglophones within a given region, or indeed their level of geographic concentration, leads to different propensities to form linguistically mixed or exogamous couples. This propensity also results from the fact that for both Anglophones and Francophones, the high level of bilingualism of residents of the Montréal region is likely to increase the incidence of such unions. From 1971 to 2006, the proportion of children living in an English-French and in an English-“other”-language exogamous family greatly increased in Quebec, going from 28% to 45% and from 5% to 14% respectively during this same period (see chart 3.2.2). Conversely, the share of children living in an endogamous family with both parents having English as their mother tongue declined substantially, going from 67% in 1971 to 41% in 2006.

Portrait of Official-Language Minorities in Canada – Anglophones in Quebec
Statistics Canada – Catalogue no. 89-642-X 22
Chart 3.2.2 Percentage of children under 18 years of age living in a family where at least one parent is of English-mother tongue, by mother tongue of parents, Quebec, 1971 and 2006
67.1
41.1
27.7
44.6
5.214.4
0
10
20
30
40
50
60
70
80
90
100
1971 2006
perc
enta
ge
One English, the other an Other languageOne English, the other FrenchBoth English
Note(s): For 2006, multiple responses were equally redistributed among the linguistic groups. The 1971
Census database does not include multiple responses. Source(s): Statistics Canada, 1971 and 2006 Censuses of population. The proportion of children living in an exogamous family also varies according to the region of the province in which these families live (see chart 3.2.3). The East of Quebec and Montréal regions register the highest propensity for children to live in a family with both parents having English as their mother tongue, namely 46% in both cases. In the Outaouais and Estrie and South of Quebec regions, more than one-third (37%) of children live in English-language endogamous families. Anglophones in Québec and surrounding area stand out from those in other regions, in that only 10% of children live in a family with both parents with English as mother tongue, and nearly nine Anglophones in ten live in a family where the English-speaking parent has a French-mother-tongue spouse. It is worth noting that although Anglophones in the East of Quebec and those in Québec and surrounding area both constitute less than 5% of the population of their respective regions, the former are much more concentrated in their municipality of residence than the latter (see table 2.4.2). The proportion of children living in English-French exogamous families in Québec and surrounding area reaches 88% compared to 52% in the East of Quebec.

Portrait of Official-Language Minorities in Canada – Anglophones in Quebec
Statistics Canada – Catalogue no. 89-642-X 23
Chart 3.2.3 Percentage of children under 18 years of age living in a family where at least one parent is of English-mother tongue, by mother tongue of parents, Quebec and regions, 2006
45.6 45.637.3 37.1
9.621.9
41.1
0
10
20
30
40
Montréal East Outaouais
pour
35.7
52.156.7 60.6
87.669.7
44.660
70
80
cent
age
18.78.3 14.4
50
90
Estrie andSouth
Québec andsurrounding
Rest ofQuebec
TotalQuebec
6.0100
area
region
Both English One English, the other French One English, the other an Other language
Note(s): Multiple responses were equally redistributed among linguistic groups. Source(s): Statistics Canada, 2006 Census of population. From 1971 to 2006, the proportion of English-French and English-“other”-language exogamous couples among couples with at least one partner of English mother tongue greatly increased in Quebec, going from 25% to 46% and from 5% to 13% respectively during this same period. Conversely, the share of endogamous couples with both spouses having English as their mother tongue declined substantially, going from 70% in 1971 to 41% in 2006. Because of the strong increase in the proportion of English-French exogamous couples from 1971 to 2006, a drop is observed in the rate of transmission of the minority language (in this case, English) to children. And indeed, the statistics presented in chart 3.24 show a marked decline in the transmission of English to children under 18 born of this type of couple. Although the data for 1971 and 2006 are not exactly comparable, notably because multiple responses were not captured in 1971, 34% of children of French-English couples had English transmitted to them as a mother tongue at the time of the 2006 Census, while the corresponding proportion was 51 % in 1971. However, note that in 2006, 10% of the children born of this type of couple had both French and English transmitted to them as mother tongues.12 In the case of English-mother-tongue spouses whose partner had a mother tongue other than French or English, English was transmitted to their children in a proportion of 82%. This type of couple represented 14% of couples in 2006 in which at least one partner’s mother tongue was English.
12. In the 1981 Census, 43.8% of children of English-French exogamous couples were transmitted English, while 6% were transmitted both English and French as mother tongues.

Portrait of Official-Language Minorities in Canada – Anglophones in Quebec
Statistics Canada – Catalogue no. 89-642-X 24
Chart 3.2.4 Mother tongue of children less then 18 years of age, by mother tongue of parent, Quebec, 1971 and 2006
mot
her
tong
ue o
f chi
ldre
n
0
10
20
30
40
50
60
70
80
90
100
1971 2006 1971 2006 1971 2006 1971 2006 1971 2006
Both English Both a non officiallanguage
One French, theother English
One French, theother a non official
language
One English, theother a non official
language
mother tongue of parents
perc
enta
ge
English French Non official language English-French
Note(s): Only single responses were used for the parents, whereas in the case of children, among the multiple responses, only the English- French category was taken into account. Source(s): Statistics Canada, 1971 and 2006 censuses of population. Women are proportionally more likely to pass on their mother tongue than men. In 1971, 57% of English-mother-tongue mothers whose spouse had French as a mother tongue transmitted English to their children, compared to 46% of English-mother-tongue fathers living with a spouse whose mother tongue was French. In 2006, the gap was even wider, although English was transmitted proportionally less often than in 1971 in English-French exogamous couples. According to the last census, nearly 46% of English-mother-tongue mothers whose spouse had French as his mother tongue transmitted English to their children, compared to 22% of English-mother-tongue fathers living with a French-speaking spouse. This means that when the mother tongue of the mother is French and that of her spouse is English, French is transmitted to the children as the sole mother tongue in 67% of cases, whereas when the mother tongue of the father is French and that of his spouse is English, French is transmitted in a proportion similar to English, at approximately 45%. Note that for French-English exogamous couples overall, both French and English are transmitted as a double mother tongue in approximately 10% of cases.13
13. As noted above, multiple responses were not captured in the 1971 Census, and therefore it is not possible to track the change
over time in the transmission of English and French as a double mother tongue.

Portrait of Official-Language Minorities in Canada – Anglophones in Quebec
Statistics Canada – Catalogue no. 89-642-X 25
Table 3.2.1 reflects the fact that between 1971 and 2006, among French-English exogamous couples there was an increase in the proportion of spouses with English or French as their mother tongue who could conduct a conversation in both English and French. This increase was especially substantial for English-mother-tongue spouses. Thus, while 70% of English-speaking female spouses reported being bilingual in 1971, the corresponding proportion in 2006 was nearly 88%. Among English-speaking males whose female spouse was French speaking, the corresponding proportions were 75% and 87% respectively. The data presented thus reveal that with the increase in the proportion of English-mother-tongue spouses living with a French-speaking spouse as well as the marked increase in the English-French bilingualism rate among the former, there has also been an increase in the transmission of French as the mother tongue to children living in English-French exogamous families. It is also worth noting that in 1971, 32% of English-mother-tongue women living with a French-mother tongue male spouse spoke French most often at home, compared to 41% of English-mother-tongue male spouses living with a French-speaking female spouse (data not in tables). Thirty-five years later, in 2006, the corresponding proportions were 38% and 41% respectively (data not in tables). Furthermore, in 2006, 5.6% of female spouses and 4.4% of male spouses who had English as their mother tongue and were living in an exogamous English-French couple reported speaking both French and English most often at home.14 Table 3.2.1 Proportion of partners with a mother tongue other than English who have knowledge of both official languages by type of couple, Quebec, 1971 and 2006
1971 2006
English male partner and French female partner 74.7 86.8
French male partner and English female partner 70.0 87.7
Other language male partner and English female partner 54.4 78.8
English male partner and Other language female partner 56.5 73.8
percentageType of couple
Source(s): Statistics Canada, 1971 and 2006 censuses of population.
3.3 Age structure It is useful to examine how the age structure of Quebec's Anglophone population has evolved, so as to be able to update part of the past demographic history of that population while providing an indication of its future course. Between 1971 and 2006, this evolution is essentially the result of the decrease in the fertility rate of Anglophone women, the negative net interprovincial migration of the English-mother-tongue population and an increase in international immigration. Added to all these phenomena is the strong tendency for English to be transmitted to children as a mother tongue. As noted above, at the time of the 2006 Census, English had been transmitted as a mother tongue to just over seven in ten children under 18 years of age born of a couple with at least one English-mother-tongue spouse. In Montréal, that proportion was 78%.
14. Idem.

Portrait of Official-Language Minorities in Canada – Anglophones in Quebec
Statistics Canada – Catalogue no. 89-642-X 26
Chart 3.3.1 shows how the age structure of Quebec’s English-mother-tongue population has changed over time. We have already shown that between 1971 and 2006, this language group saw its numbers drop by 23.0% (or 181,670 persons), going from 788,835 to 607,165 persons. The decrease in the English-mother-tongue population strongly affected the sizes of the cohorts under 35 years of age because of a drop in the fertility of Anglophone women, partly owing to a fertility rate below the replacement level. To be sure, the population with English as its mother tongue benefited from international immigration, owing to the fact that some of the children of mothers with an “other” mother tongue had English transmitted to them as a mother tongue. However, this phenomenon was insufficient to offset the low fertility of English-mother-tongue women. At the same time, a decrease is observed in the numbers of persons aged 35 to 64 who were under 30 years of age in 1971, owing to the sizable migration of the English-mother-tongue population to other provinces and territories. However, people aged 70 and over saw an increase in their population, owing to the ageing of the population and lengthened life expectancy. In 2006, the number of children under 5 years of age (34,080) was smaller than the number of adults in the 30 to 34 age group (35,977), the average childbearing age, yielding a ratio of 0.95. By comparison, in 1971 the corresponding ratio was 1.33 (59,411/44,735). Also, as chart 3.3.1 shows, the baby boom generation (born between 1946 and 1966), which corresponded to the age cohorts 5 to 9 to 20 to 24 (305,540) in 1971, is much greater in size than the 40 to 44 to 55 to 59 age cohorts (172,313) 35 years later. Chart 3.3.1 Age structure of the English mother tongue population, Quebec, 1971 and 2006
0 10,000 20,000 30,000 40,000 50,000 60,000 70,000 80,000 90,000
0 to 4 years
5 to 9 years
10 to 14 years
15 to 19 years
20 to 24 years
25 to 29 years
30 to 34 years
35 to 39 years
40 to 44 years
45 to 49 years
50 to 54 years
55 to 59 years
60 to 64 years
65 to 69 years
70 to 74 years
75 to 79 years
80 to 84 years
85 to 89 years
90 years and over
age
gro
up
number
1971 2006
Source(s): Statistics Canada, 1971 and 2006 censuses of population.
Portrait of Official-Language Minorities in Canada – Anglophones in Quebec
Statistics Canada – Catalogue no. 89-642-X 27
All things being otherwise equal, the small size of the youngest cohorts in 2006—combined with the fact that in the coming decades a number of cohorts will move into the over-65 age group—will in the future produce an especially older age structure for the population with English as its mother tongue. While the aging of the English-mother-tongue population is mainly due to a low fertility rate and a steady increase in life expectancy, it can be assumed that it also results from non-transmission of English as a mother tongue to children. We have just shown that the rate of intergenerational transmission of English fell in families composed of English-French exogamous couples between 1971 and 2006: more than half (51%) of children under 18 years of age living in such families were transmitted English as their mother tongue in 1971, compared to just over one-third in 2006. Instead, what predominated in 2006 was the transmission of French (56%) to the children of exogamous couples. Overall, however, intergenerational linguistic continuity favoured the Anglophone population during this period. This phenomenon is measured by determining the ratio (or index) of the number of English-mother-tongue children under age 5 to the number of children whose mother has English as her mother tongue.15 Intergenerational transmission is favourable to the English-mother-tongue population if this intergenerational continuity index is greater than 1.16 This is the case in Quebec, where the index was 1.22 in 2006, up from 1.10 in 1971 (data not in table). In 2006, the English continuity index continued to be higher than the index for French (1.05) and that for “other” mother tongues (0.72). In other words, although this group has had a fertility rate that since 1991 has been either equal to or less than that of the French and “other” mother tongue groups, the higher intergenerational continuity index of the Anglophone group testifies to the fact that this group benefits from the contribution of intergenerational language mobility from the other two groups. Moreover, the steep drop in births exhibited by the English-mother-tongue group in the past 35 years is not unique to this language group. Chart 3.3.2 shows the age structure of the main mother-tongue groups in 2006. As may be seen, while the relative share of the cohorts under 25 years of age within the English-mother-tongue group is greater than within the other two groups, the consequences of a fertility rate below the replacement level are also apparent in this language group. It should also be noted that the over-representation of the "other"-mother-tongue group in the cohorts aged 25 to 44 is mainly dependent on immigration policies that tend to favour the immigration of working-age persons.
15. To establish this ratio, demographers generally look at children living in a two-parent family or a one-parent family headed by a
woman, which account for more than 97% of all children in this age group. 16. For an in-depth examination of this approach, see Lachapelle and Lepage, Languages in Canada: 2006 Census, Statistics
Canada and Canadian Heritage (forthcoming).

Portrait of Official-Language Minorities in Canada – Anglophones in Quebec
Statistics Canada – Catalogue no. 89-642-X 28
Chart 3.3.2 Age structure of French, English and Other mother tongue populations, Quebec, 2006 (Rate per 1,000)
0 20 40 60 80 100 120 140 160 180 200
0 to 4 years
4 to 9 years
10 to 14 years
15 to 24 years
25 to 34 years
35 to 44 years
45 to 54 years
55 to 64 years
65 to 74 years
75 to 84 years
85 years and over
age
grou
p
rate per 1,000
English French Other
Note(s): Multiples responses were equally redistributed among the groups. Source(s): Statistics Canada, 2006 Census of population. Finally, the age structure of the Anglophone group in Quebec must also be examined in light of information on the first official language spoken. We have shown that the population with English as the first official language spoken was 995,000, compared to 607,000 for the population with English as the mother tongue. The statistics presented in chart 3.3.3 accordingly indicate a larger number of English first official language spoken (FOLS) persons in all cohorts, but with greater differences in the 25 to 29 to 45 to 49 age groups. The latter situation is in large measure the combined result of the sizable negative net migration of the English-mother-tongue population during the 1970s and 1980s—a phenomenon that will be examined below—and the fact that the “other”-mother-tongue labour force population, with its roots in international immigration and with English as its first official language spoken, is strongly represented in these age groups.

Portrait of Official-Language Minorities in Canada – Anglophones in Quebec
Statistics Canada – Catalogue no. 89-642-X 29
Chart 3.3.3 Number of persons with English as mother tongue and first official language spoken, Quebec, 2006
0 10,000 20,000 30,000 40,000 50,000 60,000 70,000 80,000 90,000
0 to 4 years
4 to 9 years
10 to 14 years
15 to 19 years
20 to 24 years
25 to 29 years
30 to 34 years
35 to 39 years
40 to 44 years
45 to 49 years
50 to 54 years
55 to 59 years
60 to 64 years
65 to 69 years
70 to 74 years
75 to 79 years
80 to 84 years
85 to 89 years
90 years and over
age
gro
up
number
Mother tongue First official language spoken
Source(s): Statistics Canada, 2006 Census of population.
Apart from the consequences of the negative net migration of Quebecers with English as their mother tongue, the sizable differences observed between the counts of the Anglophone population defined according to different criteria largely result from the contribution of a population with its roots in the international immigration of persons with an “other” mother tongue, a population that either knows only English or knows both French and English but speaks English most often at home. It is to this phenomenon that we will now turn our attention.

Portrait of Official-Language Minorities in Canada – Anglophones in Quebec
Statistics Canada – Catalogue no. 89-642-X 30
3.4 Language transfers or intragenerational linguistic mobility Language transfer, also sometimes called language shift, refers to the phenomenon whereby the main language used at home differs from the individual’s mother tongue. This language mobility phenomenon has no direct bearing on the evolution of language groups defined according to mother tongue. However, insofar as the language that dominates in the home is generally the one that is passed on to the children, it has a long-term influence on the future of language groups. Also, when the criterion used to define language groups is the first official language spoken, the language spoken most often at home has a direct influence on the size of the Anglophone group. For example, according to this criterion, persons who know both official languages, and who have both French and English or an “other” 17 language as their mother tongue, belong to the English-language group if they speak English most often at home. Through successive censuses, there has been a slight increase in language transfers for persons with English as a mother tongue in Quebec. Thus, in 1971, approximately 7.5% of Quebecers with English as a mother tongue reported using another language, usually French, most often at home. Thirty-five years later, 10.6% of English-mother-tongue persons reported speaking a language other than English most often at home. For persons with French as their mother tongue, the proportion of language transfers was lower, and it remained almost stable, ranging from 1.6% in 1971 to 1.3% in 2006. For persons with an “other” mother tongue, language transfers are proportionally much more numerous: they first diminished slightly between 1971 and 1981, going from 31.9% to 29.8%, then gradually increased, reaching 37.4% in 2006. Table 3.4.1 Rate of Language Transfer by mother tongue, Quebec, 1971 to 2006
English French Other
1971 7.5 1.6 31.9
1981 7.5 1.6 29.8
1991 9.9 1.2 33.1
2001 10.4 1.2 36.5
2006 10.6 1.3 37.4
Year
percentage
Mother tongue
Note(s): With the exception of 1971, only single responses were used for mother tongue, whereas all responses were considered
for the main language used at home. Source(s): Statistics Canada, 1971 and 2006 censuses of population. A linguistic continuity index may also be used as a corollary of the language transfer rate. This index is the ratio of the number of persons with a given home language to the number of persons having the corresponding mother tongue. A language group emerges at the top of the mother tongue transmission process when the index is higher than 1. Conversely, transfers are unfavourable to language group when the index is less then 1.
17. As noted earlier, persons with an “other” mother tongue who know only English are assigned English as their first official
language spoken, regardless of whether they speak that language most often at home.

Portrait of Official-Language Minorities in Canada – Anglophones in Quebec
Statistics Canada – Catalogue no. 89-642-X 31
According to the statistics presented in table 3.4.2, the French-mother-tongue group saw its linguistic continuity index go from 1.00 to 1.03 between 1971 and 2006, while that of the Anglophone group went from 1.13 to 1.30. However, this increase in the linguistic continuity index masks the decrease in Quebec’s English-mother-tongue population during this period. Indeed, a sizable portion of this increase in the index is due to a larger decrease in the number of persons with English as their mother tongue (a decrease of 182,000 during the study period) than in the number of English speakers for whom English is the main language spoken at home (a decrease of 100,000 persons during the same period.). In other words, since 1971 the change in Anglophones’ linguistic continuity index has been influenced both by the evolution of language transfers toward English or French and by negative net interprovincial migration for the population with English as its mother tongue. Table 3.4.2 Population by mother tongue, language spoken most often at home and linguistic continuity index, Quebec, 1971 and 2006
English French Other English French Other
Language spoken most often at home 887,874 4,870,102 269,788 787,895 6,085,150 562,860
Mother tongue 788,835 4,866,405 372,525 607,165 5,916,840 911,900
Linguistic continuity index 1.13 1.00 0.72 1.30 1.03 0.62
20061971
number
Linguistic characteristics
Note(s): After equal redistribution of multiple responses in 2006. Source(s): Statistics Canada, 1971 and 2006 censuses of population. The continuity index of 1.30 for the English-mother-tongue group takes account of the fact that in Quebec, 175,300 persons have an "other" mother tongue and speak English most often at home (table 3.4.3). It also takes account of the fact that more than 74,000 French-mother-tongue persons have English as their main language spoken at home and nearly 60,000 English-mother-tongue persons speak French most often at home. Table 3.4.3 Population by mother tongue and language spoken most often at home, and linguistic continuity index, Quebec, 2006
English FrenchOther
languages Total
number 508,409 59,737 7,414 575,555
percentage 88.3 10.4 1.3 100.0
number 74,121 5,786,758 16,771 5,877,660
percentage 1.3 98.5 0.3 100.0
number 175,300 189,863 521,113 886,280
percentage 19.8 21.4 58.8 100.0
Total number 757,830 6,036,358 545,298 7,339,495
1.30 1.03 0.62 ...
Mother tongueLanguage spoken most often at home
English
French
Other languages
Linguistic continuity index
Note(s): With equal redistribution of multiple responses to the language spoken most often at home question and single responses to the mother tongue question.
Source(s): Statistics Canada, 2006 Census of population.

Portrait of Official-Language Minorities in Canada – Anglophones in Quebec
Statistics Canada – Catalogue no. 89-642-X 32
Because individuals’ main home language may differ from their mother tongue, the concept of language transfer has often been seen as a phenomenon indicating abandonment of one’s mother tongue. But since 2001, the Canadian census has included a question on languages, other than the main language, that are spoken on a regular basis at home. Although it may be difficult to judge how respondents interpret this new question, qualitative tests conducted on respondents as well as the results from the Survey on the Vitality of Official-Language Minorities (SVOLM) have shown that respondents usually consider it to refer to daily use of that language. Based on the census results for this question, a distinction can be made between the phenomenon of partial language transfer and that of complete language transfer. As a corollary to this distinction, there is a need to qualify the concept of linguistic continuity, insofar as using one’s mother tongue on a regular basis at home cannot be interpreted as linguistic discontinuity. In 2006, more than 744,000 Quebecers spoke English as the only main language at home, while nearly 91,000 persons reported speaking that language most often in combination with French or an “other” language (table 3.4.4). Thus, 11.2% of Quebecers reported having English as their main language at home. Data from the 2006 Census also show that more than 439,000 persons reported speaking English on a regular basis at home although it was not their main home language (table 3.4.5). In short, English is spoken most often or on a regular basis at home by 17.1% of the population. Table 3.4.4 Population by mother tongue, language spoken most often at home and other languages spoken regularly at home, Quebec, 2006
number % number % number %
Single responses 7,339,495 98.7 7,290,485 98.0 886,135 11.9
English 575,555 7.7 744,430 10.0 400,505 5.4
French 5,877,660 79.0 6,027,735 81.1 281,095 3.8
Other 886,280 11.9 518,320 7.0 204,535 2.8
Multiple responses 96,405 1.3 145,420 2.0 53,125 0.7
English and French 43,335 0.6 52,330 0.7 22,485 0.3
English and Other 16,200 0.2 26,560 0.4 15,820 0.2
French and Other 31,350 0.4 54,490 0.7 14,375 0.2
English and French and Other 5,520 0.1 12,040 0.2 445 0.0
Total 7,435,900 100.0 7,435,900 100.0 … …
Mother tongueLanguage spoken most
often at home
Other language(s) spoken regularly at
homeType of answer
Source(s): Statistics Canada, 2006 Census of population.

Portrait of Official-Language Minorities in Canada – Anglophones in Quebec
Statistics Canada – Catalogue no. 89-642-X 33
Table 3.4.5 Number and proportion of persons with English as mother tongue, first official language spoken, language spoken most often at home and language spoken regularly at home, Quebec, 2006
English language number %
Mother tongue (single and multiple) 640,615 8.6
First official language spoken (single and multiple) 1,104,000 14.8
Language spoken at least regularly at home (single and multiple) 1,274,610 17.1
Language spoken most often at home (single and multiple) 835,355 11.2
Language spoken regularly at home (single and multiple) 439,255 5.9 Source(s): Statistics Canada, 2006 Census of population. Information on the regular use of English as a secondary language in the home serves to distinguish complete language transfers from partial language transfers. Thus, based on single responses to the question on the first language learned and still understood at the time of the 2006 Census (commonly called the mother tongue), table 3.4.6 shows that for Quebec as a whole, 4.7% of persons with English as their mother tongue do not use that language at least regularly at home (complete transfer), whereas 5.9% use it on a regular basis (partial transfer). As was already seen in Section 2.3, Anglophones are rather concentrated geographically in Quebec, and consequently, their language behaviours are influenced by the relative share that they represent within their community. For example, the language transfer rate in the Montréal region is 7.6%, including 3.3% complete transfers and 4.3% partial transfers.18 Conversely, in the region of Québec and surrounding area, where some 17,000 Anglophones comprise scarcely more than 1% of the population, the language transfer rate is 50%, including 25% complete transfers. By the same token, because of their high level of regional concentration, especially within their municipality of residence, Anglophones in the province’s Eastern region have a particularly low language transfer rate, at 14.6% (including 8.1% partial transfers). Table 3.4.6 Rate of complete and partial language transfers by region, persons of English mother tongue, Quebec, 2006
Complete transferPartial
transfer Total
Montréal 3.3 4.3 7.6
East 6.5 8.1 14.6
Outaouais 3.7 6.5 10.2
Estrie and South 6.6 7.5 14.1
Québec and surrounding area 25.1 24.8 49.9
Rest of Quebec 13.7 15.0 28.7
Total Quebec 4.7 5.9 10.6
French mother tongue
percentage
Region
Source(s): Statistics Canada, 2006 Census of population.
18. The sum of the proportions associated with complete and partial transfers in Table 3.4.6 is slightly different owing to rounding of
the values associated with each of these two variables.
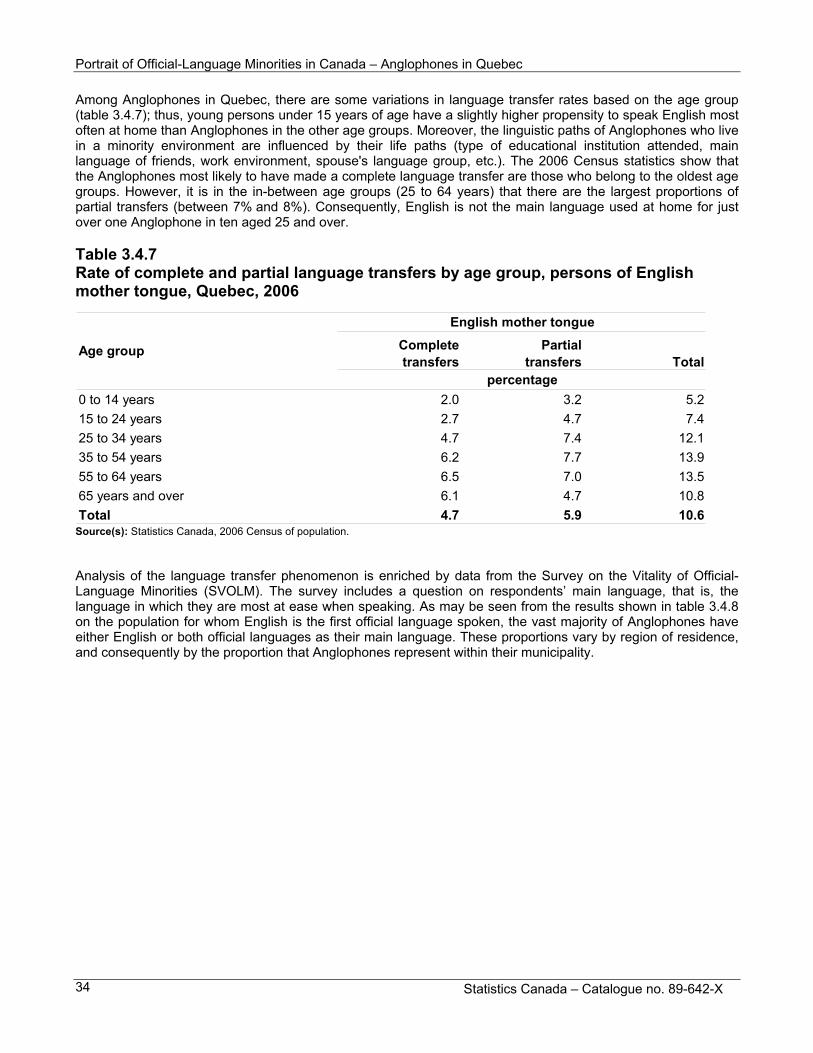
Portrait of Official-Language Minorities in Canada – Anglophones in Quebec
Statistics Canada – Catalogue no. 89-642-X 34
Among Anglophones in Quebec, there are some variations in language transfer rates based on the age group (table 3.4.7); thus, young persons under 15 years of age have a slightly higher propensity to speak English most often at home than Anglophones in the other age groups. Moreover, the linguistic paths of Anglophones who live in a minority environment are influenced by their life paths (type of educational institution attended, main language of friends, work environment, spouse's language group, etc.). The 2006 Census statistics show that the Anglophones most likely to have made a complete language transfer are those who belong to the oldest age groups. However, it is in the in-between age groups (25 to 64 years) that there are the largest proportions of partial transfers (between 7% and 8%). Consequently, English is not the main language used at home for just over one Anglophone in ten aged 25 and over. Table 3.4.7 Rate of complete and partial language transfers by age group, persons of English mother tongue, Quebec, 2006
Complete transfers
Partialtransfers Total
0 to 14 years 2.0 3.2 5.2
15 to 24 years 2.7 4.7 7.4
25 to 34 years 4.7 7.4 12.1
35 to 54 years 6.2 7.7 13.9
55 to 64 years 6.5 7.0 13.5
65 years and over 6.1 4.7 10.8
Total 4.7 5.9 10.6
English mother tongue
percentage
Age group
Source(s): Statistics Canada, 2006 Census of population. Analysis of the language transfer phenomenon is enriched by data from the Survey on the Vitality of Official-Language Minorities (SVOLM). The survey includes a question on respondents’ main language, that is, the language in which they are most at ease when speaking. As may be seen from the results shown in table 3.4.8 on the population for whom English is the first official language spoken, the vast majority of Anglophones have either English or both official languages as their main language. These proportions vary by region of residence, and consequently by the proportion that Anglophones represent within their municipality.

Portrait of Official-Language Minorities in Canada – Anglophones in Quebec
Statistics Canada – Catalogue no. 89-642-X 35
Table 3.4.8 Percentage of Quebec Anglophones by main language and region of residence, Quebec, 2006
English French
Englishand
French Total
Montréal 87 7 6 100
East 88 7 E 4 E 100
Outaouais 86 10 E 4 E 100
Estrie and South 85 6 E 8 E 100
Québec and surrounding area 62 27 11 100
Rest of Quebec 78 10 E 11 E 100
Total Quebec 86 8 6 100
Main language (in which one is most at ease)
percentage
Region
Source(s): Statistics Canada, Survey on the Vitality of Official-Language Minorities, 2006. Concerning the main language, it is useful to distinguish persons who have both French and English from those who have only English as the first official language spoken19 (table 3.4.9). While the latter almost all have English as their main language (92%), persons having both French and English as first official languages spoken reported having French or English as their main language in nearly equal proportions (40% for English and 45% for French),20 while 15% reported being equally at ease when speaking English as when speaking French.
19. In a number of analyses, people who have both French and English as first official language spoken are equally allocated to the
“French” and “English” categories, as is done in table 3.4.8. In Quebec, these people are mainly concentrated in the Montréal region. They are generally persons with another mother tongue who are able to conduct a conversation both in French and in English.
20. The difference is not statistically significant.

Portrait of Official-Language Minorities in Canada – Anglophones in Quebec
Statistics Canada – Catalogue no. 89-642-X 36
Table 3.4.9 Main language of Quebec Anglophones by first official language spoken, Quebec, 2006
English French
Englishand
French Total
English 92 3 5 100
English and French 40 45 15 100
First official language spoken
Main language(in which one is most at ease)
percentage
Source(s): Statistics Canada, Survey on the Vitality of Official-Language Minorities, 2006. When the statistics shown in table 3.4.8 are compared to those on language transfers (table 3.4.6), it emerges that in Quebec as a whole and in several regions, the proportion of Anglophones who report speaking French most often at home (complete and partial language transfers) is larger than the proportion who report being more at ease in French than in English.21 For example, 27% of Anglophones in Québec and surrounding area reported being more at ease in French than in English, while 50% reported speaking French most often at home. However, In Montréal and the Outaouais, the proportion of Anglophones who reported being more at ease in French was fairly similar to the proportion of language transfers. Finally, as noted above, language transfers are proportionally more numerous in Quebec among persons with “other” mother tongues than among Anglophones or Francophones. Whereas in the other provinces, the language transfers made by allophones are primarily toward English, in Quebec they are equally divided between French and English. Thus, in 2006, 50% of allophones who had made a language transfer were mainly using French at home while 48% were mainly using English. In looking at allophones who have made a language transfer, a different picture emerges if a distinction is made between immigrants and Canadians by birth. For immigrants, 39% of language transfers are toward English, compared to 64% for non-immigrants. Furthermore, for immigrants, differences are observed in the language to which the transfer is made, depending on the period of immigration: 74% of language transfers for allophones who immigrated before 196122 are toward English, compared to 53% for those who immigrated between 1961 and 1975, 30% for those who immigrated between 1976 and 1990 and 26% for those who immigrated between 1991 and 2006.23
21. This finding applies to both the population with English as mother tongue and that with English as first official language spoken. 22. More specifically, these are allophones who immigrated to Canada before 1961 and who were living in Quebec in 2006 at the
time of the census. The same applies to the subsequent immigration periods. 23. These observations are based on various phenomena that make interpretation difficult. Not only does duration have an effect, but the
composition of immigration can vary from one period to another (the period effect), as can the age of immigrants when they arrive (the cohort effect). For example, we do not know whether the language transfers observed took place before or after arrival in Canada. A language transfer may also have taken place in another province, before the person settled in Quebec.

Portrait of Official-Language Minorities in Canada – Anglophones in Quebec
Statistics Canada – Catalogue no. 89-642-X 37
Chart 3.4.1 Direction of language transfers among persons whose mother tongue is a language other than English or French (who made a transfer to English and/or French), by immigrant status and period of immigration, Quebec, 2006
0 25 50 75 100
Before 1961
From 1961 to 1975
From 1976 to 1990
From 1991 to 2006
Total - Immigrants
Non immigrants
Total
imm
igra
tion
stat
us a
nd p
erio
d
percentage
Only to English Mainly to English Equally Mainly to French Only to French
Source(s): Statistics Canada, 2006 Census of population. As regards non-immigrants, the direction of language transfers varies greatly, depending on the age group. There are more transfers toward English in the in-between age categories, especially among persons aged 35 to 44, where 83% of transfers are toward English. Among persons aged 0 to 14, 47% of language transfers are toward English, compared to 55% for persons aged 65 and over.

Portrait of Official-Language Minorities in Canada – Anglophones in Quebec
Statistics Canada – Catalogue no. 89-642-X 38
Chart 3.4.2 Direction of language transfers among non-immigrants whose mother tongue is a language other than English or French (who made a language transfer), by age group, Quebec, 2006
0 25 50 75 100
0 to 14 years
15 t0 24 years
25 to 34 years
35 to 44 years
45 to 64 years
65 years and over
Total
age
gro
up
percentage
Only to English Mainly to English Equally Mainly to French Only to French
Source(s): Statistics Canada, 2006 Census of population.
3.5 Use of English and French in the public sphere The information presented thus far has shown that Anglophones in Quebec make considerable use of English at home and that a large proportion of them transmit that language to their children. Statistics from the Census of Population shed light on the use of languages both in the private sphere (at home) and, as will be seen in the section dealing with the labour force, in the workplace. But what do we know about the use of English and French by Anglo Quebecers—especially those with an “other” mother tongue—in other areas of interaction outside the home? The Survey on the Vitality of Official-Language Minorities includes a number of questions on the use of languages in various domains in the public sphere such as stores, health care institutions (which will be examined in detail in the next section), volunteer activities, social support, community or sports activities, etc. Some questions in the survey also deal with domains on the borderline between the private and public spheres, such as the language spoken with friends outside the home or the language in which various media are "consumed." An examination of language practices in various domains in the public and private spheres reveals differences between the population whose first official language spoken is English and the population with both English and French as first official languages spoken (see charts 3.5.1-a and 3.5.1-b). In the English-speaking population, English is greatly predominant in both these spheres. In the population with a dual first official language spoken (FOLS), English is the language most often used when consuming media, whereas French is most often used in the public sphere, and the use of an “other” language predominates at home. However, in all domains there is considerable use of both English and French by the English-French FOLS population.

Portrait of Official-Language Minorities in Canada – Anglophones in Quebec
Statistics Canada – Catalogue no. 89-642-X 39
Chart 3.5.1a reflects the fact that in all domains in the private and public spheres, English is the language used most often by persons whose first official language spoken is English (English FOLS). Although 80% of them report using English almost exclusively at home, with 10% speaking a language other than English or French most often there, it is in media consumption that English is most widespread. In that domain, 97% of the English FOLS population use English most often (alone or with another language), while 53% use it exclusively. Also, 87% use English most often with friends. Apart from language choices in media consumption and the languages used with friends outside the home, English is used to a fairly similar extent in the immediate networks, the workplace and interactions with institutional representatives and in stores. While nearly 60% of Anglophones use English predominantly in their immediate network or in institutions or stores, the proportion who does so in the workplace is 53%. Additionally, almost 20% of this population reported using English equally with French in these three domains of the public sphere. At work, the Survey of the Vitality of Official-Language Minority (SVOLM) data show that nearly 25% of persons for whom English is the first official language spoken use mainly or only French. The corresponding proportion is approximately 20% in the immediate network and in interactions with institutional representatives and in stores. As chart 3.5.1b shows, the population with a dual official language—that is, with both French and English as FOLS—makes rather varied use of languages in the private and public spheres. In this population, the consumption of media in English is very widespread: more than three persons in four use English most often (alone or with another language) in this domain, 47% of them predominantly.24 French is used most often by 53% of French-English FOLS persons in their consumption of media. As regards the language practices of the French-English FOLS population in the other domains, French (alone or with another language) is used most often by more than three persons in four in the public sphere: 80% in institutions and stores, 79% with the immediate network and 76% at work. On the other hand, in these domains the dual use of English and French is fairly widespread: in institutions and stores (21%), at work and in the immediate network (approximately 30%). Note that within this sub-population, the use of an “other” language “predominates” as the only language spoken at home (56%), while English (alone or with French) is spoken “most often” in 31% of cases and French (alone or with English) in 35% of cases.
24. The expression “most often” covers cases in which more than one language is reported, whereas the term “predominant” covers only
those where a single language is reported.

Portrait of Official-Language Minorities in Canada – Anglophones in Quebec
Statistics Canada – Catalogue no. 89-642-X 40
Chart 3.5.1- a Proportion of the population with English only as first official language spoken, by language use in various domains of the public and private spheres, Quebec, 2006
0
10
20
30
40
50
60
70
80
90
100
Home Friends Immediatenetworks
Work Institutionsand stores
Media
domain
perc
enta
ge
English only Mainly English English and French
Mainly French French only Other languages only
Note(s): A note on the construction of the indices for use of language in daily activities is found in appendix C. Source(s): Statistics Canada, Survey on the Vitality of Official-Language Minorities, 2006.

Portrait of Official-Language Minorities in Canada – Anglophones in Quebec
Statistics Canada – Catalogue no. 89-642-X 41
Chart 3.5.1- b Proportion of the population with English and French as first official language spoken, by language use in various domains of the public and private spheres, Quebec, 2006
0
10
20
30
40
50
60
70
80
90
100
Home Friends Immediatenetworks
Work Institutionsand stores
Media
perc
enta
ge
English only Mainly English English and French
Mainly French French only Other languages only
domaine
Note(s): A note on the construction of the indices for use of language in daily activities is found in appendix C. Source(s): Statistics Canada, Survey on the Vitality of Official-Language Minorities, 2006. The use of English in the different domains of the public sphere (media, institutions and stores, work, immediate network and friends outside the home) varies not only according to the first official language spoken of the population, but also according to the region of residence. The data in chart 3.5.2 show that province-wide, 91% of the population for whom English is the only first official language spoken (English FOLS) uses English most often (alone or with another language) in the public sphere.25 The proportions using this language are also high in most regions of the province, at 95% in Montréal, 92% in the Outaouais, 86% in Estrie and South of Quebec and 78% in the East of Quebec. Conversely, the use of French predominates in Québec and surrounding area. Among the Anglophones in this region, English is used most often in the public sphere, alone or with another language, by approximately 40%, including scarcely more than 15% who use it predominantly. English and French are both used by approximately one Anglophone in four in three regions of the province: Estrie and South of Quebec, Québec and surrounding area and the “Rest of the province”. Because the population in Quebec for whom both English and French are the first official language spoken resides primarily in the Montréal region, it is instructive to examine the extent to which the main language used in the public sphere by that population differs from that of the population for whom English is the only first official language spoken. English predominates for 76% of the latter population, compared to only 25% of the population with a dual first official language spoken. In that population, French is used almost exclusively by just under 38% and English and French are used equally by 37%.
25. See appendix C for a description of the general index of use of languages in the public sphere.

Portrait of Official-Language Minorities in Canada – Anglophones in Quebec
Statistics Canada – Catalogue no. 89-642-X 42
Chart 3.5.2 Proportion of the population with English only as First official language spoken by the general language use index in various domains of the public sphere, Quebec and regions, 2006
0
10
20
30
40
50
60
70
80
90
100
Montréal East Outaouais Estrie andSouth
Québec andsurrounding
area
Rest ofQuebec
Total Quebec
region
perc
enta
ge
English only Mainly English English and French
Mainly French French only
Note(s): A note on the construction of the indices for use of language in daily activities is found in appendix C. Source(s): Statistics Canada, Survey on the Vitality of Official-Language Minorities, 2006.
3.6 Knowledge of English Because of the status of English and the predominance of that language both in Canada and in North America as a whole, a sizable proportion of the Quebec population reports being able to conduct a conversation in English. In 2006, although only 8.2% of the Quebec population had English as a mother tongue and only 13.4% had English as a first official language spoken, 45.1% of the Quebec population reported being able to conduct a conversation in English. Among Quebecers with French as a mother tongue the proportion was 36.1% while the “other”-mother-tongue population was 67.5%. The English-French bilingualism rate within the Quebec population remained basically stable, varying from 40.8% in 2001 to 40.6% in 2006. The only gains were recorded for persons with English as their mother tongue. Among the latter, the rate went from 67.2% in 2001 to 69.8% in 2006. Meanwhile, the bilingualism rate for Francophones and allophones remained fairly stable.

Portrait of Official-Language Minorities in Canada – Anglophones in Quebec
Statistics Canada – Catalogue no. 89-642-X 43
Table 3.6.1 Knowledge of official languages by mother tongue, Quebec, 2001 and 2006
English French
English and
French
Neither English
nor French Total English French
English and
French
Neither English
nor French Total
English 31.9 0.8 67.2 0.1 100.0 29.5 0.6 69.8 0.1 100.0
French 0.0 63.1 36.9 0.0 100.0 0.0 63.9 36.1 0.0 100.0
Other 18.6 23.0 50.5 7.9 100.0 17.1 25.0 50.4 7.5 100.0
Total 4.6 53.8 40.8 0.8 100.0 4.5 53.9 40.6 0.9 100.0
percentage
Mother tongue
Knowledge of official languages
2001 2006
Source(s): Statistics Canada, 1971 and 2006 censuses of population. For persons for whom English is not the first official language spoken, the ability to conduct a conversation in English depends on a number of factors, including how interested they are in learning the language and the perceived importance, utility and status of the language. In addition, a major role is played by the demographic characteristics of the population considered, as well as the demolinguistic context. Thus, as charts 3.6.1 and 3.6.2 show, non-Anglophones' ability to conduct a conversation in English greatly depends on the region in which they live and, consequently, on the proportional weight of the English-speaking population in that region. Because of the strong concentration of Anglophones in the Montréal region and the proximity of Ontario in the case of the Outaouais region, the proportions of non-Anglophones who can conduct a conversation in English are high in both those regions. In Quebec as a whole, more than one-third of non-Anglophones can conduct a conversation in English. This proportion is 60% in the Outaouais region, 47% in Montréal and 35% in the region of Estrie and South of Quebec. In Québec and surrounding area and the Rest of the Province, roughly one person in four is able to conduct a conversation in English, while this is the case with only 17% of the non-Anglophone population in the Eastern region.

Portrait of Official-Language Minorities in Canada – Anglophones in Quebec
Statistics Canada – Catalogue no. 89-642-X 44
Chart 3.6.1 Rate of English-French bilinguism among the persons with French only as their first official language spoken by region, Quebec, 2006
0
10
20
30
40
50
60
70
Montréal East Outaouais Estrie andSouth
Québec andsurrounding
area
Rest ofQuebec
TotalQuebec
region
pe
rce
nta
ge
Source(s): Statistics Canada, 2006 Census of population. It has also already been shown that Anglophones living in the Montréal CMA are mainly concentrated on the Island of Montréal, especially its western portion. The proportion of non-Anglophones who can conduct a conversation in English on the Island of Montréal is 54%. Another way to bring out the link between place of residence and knowledge of English among non-Anglophones is to present the statistics according to the relative weight of the Anglophone minority within the municipality of residence. The data in chart 3.6.2 show, that with one exception, the greater the relative share of Anglophones within their municipality, the greater the knowledge of English among Francophones. Thus, in municipalities where Anglophones constitute less than 10% of the population, the French-English bilingualism rate among non-Anglophones is just over 28%, while in municipalities where Anglophones constitute at least 70% of the population, the level of non-Anglophones’ knowledge of English is nearly 82%.

Portrait of Official-Language Minorities in Canada – Anglophones in Quebec
Statistics Canada – Catalogue no. 89-642-X 45
Chart 3.6.2 Rate of English-French bilingualism among persons with French only as their first official language spoken, by the proportion that Anglophones represent within the municipality of residence, Quebec, 2006
0
10
20
30
40
50
60
70
80
90
0 to 9% 10 to 29% 30 to 49% 50 to 69% 70% and over Total
proportion of Anglophones in the municipality of residence
perc
enta
ge
Source(s): Statistics Canada, 2006 Census of population. The data in chart 3.6.3 reveal that with the exception of persons over 80 years of age, English-French bilingualism among non-Anglophones is more widespread among “other”-mother-tongue persons than among those with French as their mother tongue. For young allophones, the English-French bilingualism rate increases from one age group to the next, reaching 68.8% for those aged 15 to 19, an age range in which secondary and college studies are being completed. The rate then gradually declines, falling to 21.3% among persons over 90 years of age. For Francophones, the knowledge of English increases from one age group to the next until it levels off at roughly 51% for the 20 to 34 age groups, an age range generally associated with entry into the labour market. On this score, note that the demands of the labour market probably play a decisive role in the intensive learning of English as a second language, since the bilingualism rate of Francophones in the labour force is higher than that of those not in the labour force.

Portrait of Official-Language Minorities in Canada – Anglophones in Quebec
Statistics Canada – Catalogue no. 89-642-X 46
Chart 3.6.3 Proportion of persons who can conduct a conversation in English and in French, by age group and French or an “other” language as mother tongue, Quebec, 2006
0
10
20
30
40
50
60
70
80
0 to 4years
5 to 9years
10 to14
years
15 to19
years
20 to24
years
25 to29
years
30 to34
years
35 to39
years
40 to44
years
45 to49
years
50 to54
years
55 to59
years
60 to64
years
65 to69
years
70 to74
years
75 to79
years
80 to84
years
85 to89
years
90yearsandover
perc
enta
ge
French Other languages
Source(s): Statistics Canada, 2006 Census of population.
3.7 Migration (interprovincial and international migratory movements) The mobility of Anglophones within Canada and the contribution of international immigration are factors that greatly influence the evolution of the English-speaking population of Quebec. 3.7.1 Place of birth Table 3.7.1 shows the place of birth of Anglophones in Quebec. In 2006, more than 68% of persons with English as their mother tongue were born in Quebec, compared to nearly 57% of those for whom English is the first official language spoken. Depending on the criterion used, the proportion of Quebec Anglophones born in another Canadian province or territory was between 13% and 18%, with the vast majority of them coming from Ontario. As for foreign-born persons, most of whom were immigrants,26 they comprised 14% of the English-mother-tongue population and 31% of the population for whom English is the first official language spoken.
26. Foreign-born persons include immigrants, non-permanent residents and Canadians born abroad.

Portrait of Official-Language Minorities in Canada – Anglophones in Quebec
Statistics Canada – Catalogue no. 89-642-X 47
Table 3.7.1 Place of birth of Anglophones by mother tongue and first official language spoken, Quebec, 2006
number % number % number %
Born in Quebec 414,281 68.2 503,712 56.9 59,497 27.2
Born in another province in Canada 106,441 17.5 111,199 12.6 3,734 1.7
Born in Ontario 63,202 10.4 65,920 7.4 2,649 1.2
Born outside Canada 86,442 14.2 270,535 30.6 155,324 71.1
Total 607,164 100.0 885,446 100.0 218,555 100.0
English English
First official language spoken
English and FrenchPlace of birth
Mother tongue
Source(s): Statistics Canada, 2006 Census of population. The place of birth of the English first official language spoken (FOLS) population varies considerably, depending on the region of residence. As may be seen in chart 3.7.1, only one-third of Anglophones living in the Outaouais and slightly more than half of those living in the Montréal and Québec and surrounding area regions were born in Quebec, whereas in the other regions of the province, the corresponding proportion is much higher, at 70% and over. The Outaouais, a region bordering Ottawa, has the largest proportion of Anglophones born in another province, namely 49%, while in the other regions this proportion ranges between 8% and 23%. As for the foreign-born population, the English-speaking portion tends to head mainly toward the large urban centres. Accordingly, this immigrant population is much more concentrated in the regions of Montréal (40%) and Québec and surrounding area (26%) than in the other regions of Quebec, where the proportions range between 4% and 17%.
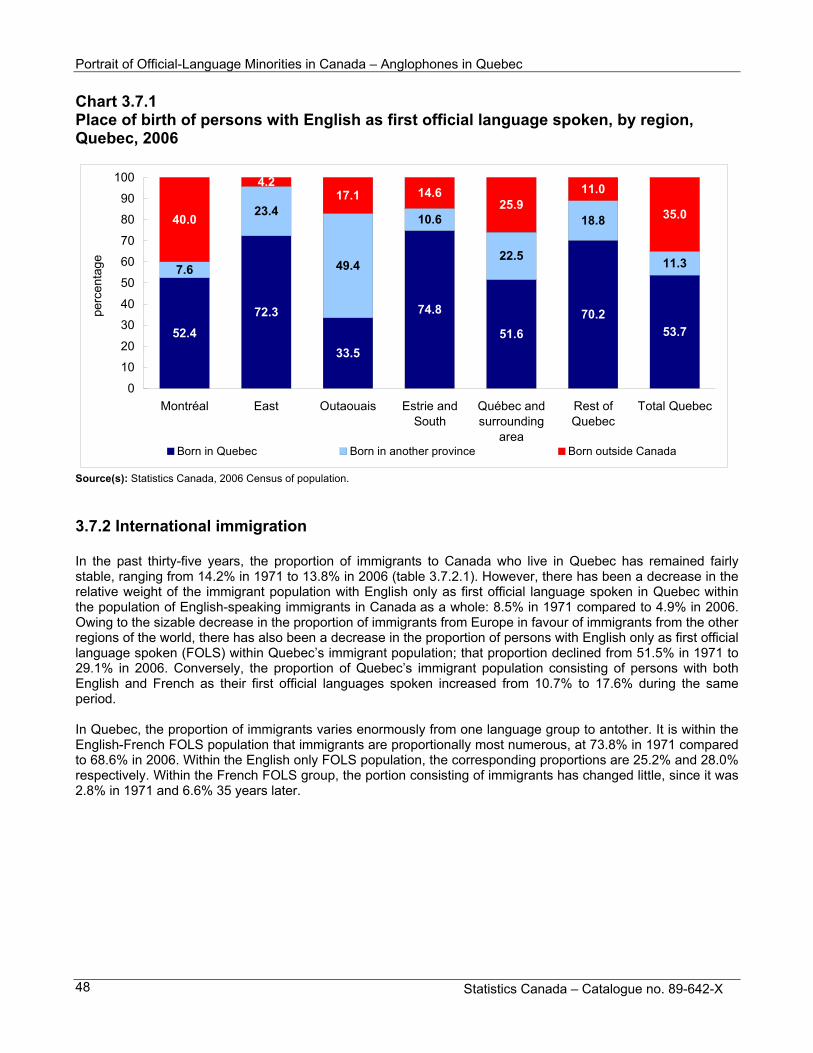
Portrait of Official-Language Minorities in Canada – Anglophones in Quebec
Statistics Canada – Catalogue no. 89-642-X 48
Chart 3.7.1 Place of birth of persons with English as first official language spoken, by region, Quebec, 2006
52.4
72.3
33.5
74.8
51.6
70.2
53.7
7.6
23.4
49.4
10.6
22.5
18.8
11.3
40.0
4.217.1 14.6
25.911.0
35.0
0
10
20
30
40
50
60
70
80
90
100
Montréal East Outaouais Estrie andSouth
Québec andsurrounding
area
Rest ofQuebec
Total Quebec
perc
enta
ge
Born in Quebec Born in another province Born outside Canada
Source(s): Statistics Canada, 2006 Census of population.
3.7.2 International immigration In the past thirty-five years, the proportion of immigrants to Canada who live in Quebec has remained fairly stable, ranging from 14.2% in 1971 to 13.8% in 2006 (table 3.7.2.1). However, there has been a decrease in the relative weight of the immigrant population with English only as first official language spoken in Quebec within the population of English-speaking immigrants in Canada as a whole: 8.5% in 1971 compared to 4.9% in 2006. Owing to the sizable decrease in the proportion of immigrants from Europe in favour of immigrants from the other regions of the world, there has also been a decrease in the proportion of persons with English only as first official language spoken (FOLS) within Quebec’s immigrant population; that proportion declined from 51.5% in 1971 to 29.1% in 2006. Conversely, the proportion of Quebec’s immigrant population consisting of persons with both English and French as their first official languages spoken increased from 10.7% to 17.6% during the same period. In Quebec, the proportion of immigrants varies enormously from one language group to antother. It is within the English-French FOLS population that immigrants are proportionally most numerous, at 73.8% in 1971 compared to 68.6% in 2006. Within the English only FOLS population, the corresponding proportions are 25.2% and 28.0% respectively. Within the French FOLS group, the portion consisting of immigrants has changed little, since it was 2.8% in 1971 and 6.6% 35 years later.

Portrait of Official-Language Minorities in Canada – Anglophones in Quebec
Statistics Canada – Catalogue no. 89-642-X 49
Table 3.7.2.1 Number, percentage and relative share of English and French immigrants, Quebec, 1971 to 2006
1971 1981 1991 2001 2006
English1 266,412 258,161 259,178 283,478 323,272
English only 241,286 222,561 214,800 224,872 248,165
English and French 50,391 72,013 87,929 118,489 149,827
56.8 49.4 43.8 40.1 38.0
English only 51.5 42.6 36.3 31.8 29.1
English and French 10.7 13.8 14.9 16.8 17.6
English1 9.3 7.7 7.0 6.1 6.2
English only 8.5 6.8 5.9 5.0 4.9
English and French 61.0 63.3 67.1 62.9 66.3
English1 26.8 29.0 28.6 30.9 32.5
English only 25.2 27.0 25.8 27.1 28.0
French 3.3 4.3 5.0 6.3 7.6
French only 2.8 3.7 4.3 5.4 6.6
Proportion of the immigrant population within the English and French population English and French 73.8 54.7 60.8 65.7 68.6
14.2 13.6 13.6 13.0 13.8
number
percentage
Immigrant
Number of English immigrants
First official language spoken
Proportion of English-speaking immigrants within the immigrant population
English1
Share of English-speaking immigrants in Quebec within all English-speaking immigrants in Canada
Proportion of immigrants within the English-speaking population
Proportion of the immigrant population within the Francophone population
Relative share of immigrants in Quebec within all of Canada
1. Includes the equal redistribution of the English-French category. Note(s): The populations are defined by first official language spoken criteria. Source(s): Statistics Canada, 1971 to 2006 censuses of population. Quebec’s English-speaking immigrant population comes from various countries. However, a large proportion of these immigrants come from a small number of countries. Table 3.7.2.2 shows the main countries of origin of immigrants residing in Quebec. As may be seen, Italy, the People’s Republic of China and the United States are the countries that supply the greatest number of English-speaking immigrants. The twelve countries shown in this table are the source countries of 56% of English-language immigration to Quebec. Almost half (46.1%) of English-speaking immigrants come from two continents: Europe (24.3%) and Asia (22.1%).

Portrait of Official-Language Minorities in Canada – Anglophones in Quebec
Statistics Canada – Catalogue no. 89-642-X 50
Table 3.7.2.2 Main countries of origin of English-speaking immigrants, Quebec, 2006
number %
Italy 24,766 7.1
China, People's Republic of 22,391 6.4
United States of America 21,570 6.2
Philippines 17,159 4.9
United Kingdom 16,787 4.8
Greece 15,950 4.6
India 14,350 4.1
Lebanon 11,277 3.2
Roumania 10,117 2.9
Poland 8,954 2.6
Sri Lanka 8,163 2.3
Germany 7,991 2.3
Pakistan 7,545 2.2
Vietnam 7,521 2.2
English-speaking immigrantsCountry
Source(s): Statistics Canada, 2006 Census of population. 3.7.3 Interprovincial migration Since 1976, the Anglophone population in Quebec with English as first official language spoken has undergone major migratory losses to other provinces and territories (see table 3.7.3).27 The migration of this population from Quebec to other provinces and territories peaked during the five-year period from 1976 to 1981: more than 151,000 persons left Quebec, while only slightly more than 28,000 persons came to settle in Quebec, this resulted in a negative net figure of nearly 123,000 persons. During the same period, the migratory loss of the population with French as first official language spoken (18,000) was much lower. Starting in 1981 to 1986, the number of Anglophones leaving Quebec declined, falling to 50,000 persons during the period 2001 to 2006, one-third the number of departures recorded in the period 1976 to 1981. Meanwhile, the Anglophone population’s net negative migration also diminished, totalling 16,000 persons during the period 2001 to 2006. Furthermore, not only did 24,000 fewer Anglophones leave Quebec for other provinces between 2001 and 2006 than in the preceding five-year period, but 4,500 more Anglophones left other provinces to come to Quebec between 2001 and 2006 than during the preceding period. Anglophones’ negative net migration thus decreased by 64%, exceeding the 59% slowdown recorded between the period 1976 to 1981 and 1981 to 1986. It is noteworthy that 40% of all Canadian Anglophones born in Quebec and having English as their first official language spoken were living outside that province in 2006—27% in Ontario and 14% elsewhere in Canada (data not in table).
27. Appendix E provides the same table using the criterion of mother tongue.

Portrait of Official-Language Minorities in Canada – Anglophones in Quebec
Statistics Canada – Catalogue no. 89-642-X 51
Table 3.7.3 Interprovincial migration between Quebec and other provinces and territories, by first official language spoken, 1976 to 1981, 1981 to 1986, 1986 to 1991, 1991 to 1996, 1996 to 2001 and 2001 to 2006
Total English French
1976 to 1981 203,035 151,308 51,124
1981 to 1986 130,214 82,805 46,820
1986 to 1991 107,546 67,980 39,047
1991 to 1996 106,337 68,681 36,539
1996 to 2001 119,746 74,352 44,438
2001 to 2006 85,202 50,320 34,088
From other provinces to Quebec
1976 to 1981 61,310 28,255 32,851
1981 to 1986 66,915 32,612 34,112
1986 to 1991 81,995 37,233 44,436
1991 to 1996 68,897 32,522 36,186
1996 to 2001 62,434 29,804 32,410
2001 to 2006 73,554 34,315 38,858
Net migration (arrivals minus departures)
1976 to 1981 -141,725 -123,053 -18,273
1981 to 1986 -63,299 -50,193 -12,708
1986 to 1991 -25,551 -30,747 5,389
1991 to 1996 -37,440 -36,159 -352
1996 to 2001 -57,312 -44,548 -12,028
2001 to 2006 -11,648 -16,005 4,770
number
First official language spoken
Period
From Quebec to other provinces
Note(s): Please see the appendix for the table on interprovincial migration by mother tongue. Source(s): Statistics Canada, censuses of population, 1976 to 2006. Charts 3.7.3.1 and 3.7.3.2 show migratory movements between Quebec and the other provinces and territories from 2001 to 2006. As shown, of the 34,000 Anglophones who came from other provinces and territories to settle in Quebec, nearly two-thirds (66%) were living in Ontario in 2001. The rest of the Anglophones came mainly from British Columbia, Alberta, Nova Scotia and New Brunswick. Also, of the 50,000 Anglophones who were living in Quebec in 2001 and who migrated to other provinces, nearly two-thirds (65%) settled in Ontario while the rest of them mainly chose British Columbia and Alberta.

Portrait of Official-Language Minorities in Canada – Anglophones in Quebec
Statistics Canada – Catalogue no. 89-642-X 52
Chart 3.7.3.1 Origin of Anglophones who lived in other provinces and territories in 2001 and who moved to Quebec between 2001 and 2006
66%
12%
7%
5%
4%6%
Ontario British-Columbia
Alberta Nova-Scotia
New-Brunswick Other provinces and territories
Source(s): Statistics Canada, 2006 Census of population.

Portrait of Official-Language Minorities in Canada – Anglophones in Quebec
Statistics Canada – Catalogue no. 89-642-X 53
Chart 3.7.3.2 Destination of Anglophones who left Quebec between 2001 and 2006
65%
12%
11%
3%3%
2% 4%
Ontario British-ColumbiaAlberta Nova-ScotiaNew-Brunswick ManitobaOther provinces and territoires
Source(s): Statistics Canada, 2006 Census of population. Many studies have been conducted on the geographic mobility of Anglophones in Quebec—younger ones in particular—toward other Canadian provinces, and it is a problem that concerns many players within Quebec’s Anglophone communities.28 On this subject, the Survey on the Vitality of Official-Language Minorities (SVOLM) includes a module on the mobility of official-language minorities, including intentions to leave the province of residence during the next five years. Chart 3.7.3.3 shows that the intention to move outside Quebec is especially strong among youths aged 18 to 24 compared to Anglophones in other age groups. Thus, nearly one young Anglophone in four reports having such an intention compared to one adult in ten aged 25 to 44 or 45 to 64.
28. In particular, see Parenteau, Philippe, Marie-Odile Magnan and Caroline V. Thibault (2008), Portrait socio-économique de la
communauté anglophone au Québec et dans ses régions, Montréal: Institut québécois de recherche sur la culture. Also see Floch, William and Johanne Pocock (2008), “The Socioeconomic status of English-speaking Quebec: Those who left and those who stayed,” in Bourhis, R.Y. (2008) (Ed.). The vitality of the English-speaking communities of Quebec: From Community Decline to Revival. Montréal, Quebec: CEETUM, Université de Montréal.

Portrait of Official-Language Minorities in Canada – Anglophones in Quebec
Statistics Canada – Catalogue no. 89-642-X 54
In the population of young Anglophones aged 18 to 24, the intention to leave the province varies according to whether the person lives in Montréal or another region of the province. The Survey on the Vitality of Official-Language Minorities data show that while 21% of young Montréal Anglophones plan to leave the province in the next five years, the proportion climbs to 29% in the Outaouais, 25% in Estrie and South of Quebec and approximately 40% in the “Rest of the province”. Of the young persons who reported an intention to move, 35% cited Ontario as the main province of destination, while 12% cited British-Columbia as a favoured destination and 24% stated a preference for going outside Canada. Among the reasons cited by young Anglophones as justifying their intention to leave Quebec during the next five years, just under half of young persons cited occupational reasons, 19% cited education-related reasons and nearly 14% cited reasons related to finding a more Anglophone environment. Chart 3.7.3.3 Percentage of Anglophone Adults (first official language spoken) who intend to move from Quebec within the next five years, by age group, Quebec, 2006
0
5
10
15
20
25
18 to 24 years 25 to 44 years 45 to 64 years 65 years and more
age group
perc
enta
ge
Intention to move
Source(s): Statistics Canada, 2006 Census of population.

Portrait of Official-Language Minorities in Canada – Anglophones in Quebec
Statistics Canada – Catalogue no. 89-642-X 55
Section 4 A few key sectors for the vitality of official-language minority communities
The Roadmap for Canada's Linguistic Duality 2008-2013 calls for investing in five key sectors: health, justice, arts and culture, economic development and immigration. This section will present statistics on four of these five key sectors identified in the Roadmap. Also, the Roadmap includes financial support for education in the minority language. This sector was identified as being of great importance to the future of official-language minorities in Canada29, and therefore a section will be devoted to it. Drawing on data from the Survey on the Vitality of Official-Language Minorities (SVOLM) and Census, we will provide general information on the presence of English and the situation of Anglophones in each of these sectors. 4.1 Health A common language between patients and health care professionals is one of the key elements of access to health care services and the effectiveness of the services provided. Language barriers can mean that some members of minority Anglophone communities are less well served by health care services. With this in mind, it is important to examine the situation of Quebec's Anglophone communities regarding various aspects of access to health care services. Excluding Anglophones that do not know French, the SVOLM data shows that 78% of Anglo Quebecers consider it “very important” or “important” for them to obtain health care services in English.30 In the 2006 Census, 86% of doctors working in Quebec, or 9,025, reported being able to conduct a conversation in English, while 51% reported using English at least on a regular basis31 in their work.32 For nurses, the number was 61,320 in 2006, and the proportions were 45% and 37% respectively. The proportion of health care professionals who can conduct a conversation in English and, to a lesser extent, the proportion of those who use that language at least on a regular basis at work, is much higher than the relative share of Anglophones (13.4%) in Quebec. On this subject, the SVOLM results show that the majority of Anglophones in Quebec report using English when consulting the different health care professionals about whom information was collected in the SVOLM, namely regular medical doctors, nurses, and professionals in other places where health care services are provided. However, the proportions vary from one region to another. Also, consultations of the telephone health line (Info-Santé) professionals take place more often in French: province-wide, only 43% of Anglophones in Quebec use English with these professionals. Table 4.1 shows the languages used with health care professionals.
29. Government of Canada’s Report on Consultations on Linguistic Duality and Official Languages, February 2008. 30. This proportion increases to 87% if we include those who cannot conduct a conversation in English and thus to whom the question
was not asked. 31. In other words, most often or on a regular basis. 32. On this subject, see Table 2.1 of the report entitled "Health Care Professionals and Official-Language Minorities in Canada: 2001
and 2006," by C. Blaser, 2006, Catalogue no. 91-550-X.

Portrait of Official-Language Minorities in Canada – Anglophones in Quebec
Statistics Canada – Catalogue no. 89-642-X 56
Table 4.1 Percentage of Anglophones by language used with different health professionals, Quebec and regions, 2006
English French
English and
French English French
English and
French English French
English and
French English French
English and
French
Montréal 80 11 4 E 58 30 11 48 44 7 E 57 35 6
East 63 34 3 E 52 42 6 E F 74 x 50 43 E
Outaouais 74 17 6 E 54 39 7 E 47 E 42 E x 61 32 E
Estrie and South 72 20 7 E 44 49 8 E 28 E 66 x 51 40 9 E
Québec and surrounding area 20 E 75 5 E 11 E 80 F x 95 x 15 E 80 x
Rest of Quebec 61 35 F 37 48 F F 65 x 32 58 F
Total Quebec 76 16 4 54 34 11 43 48 7 E 55 38 6
Nurse
Region
percentage
Family doctor Telephone health line Other place or specialist
7
7
Source(s): Statistics Canada, Survey on the Vitality of Official-Language Minorities, 2006. As the table shows, it is with one’s family doctor that the use of English is most prevalent, especially in the Montréal region, while in interactions with other health care professionals, English is used (either alone or with French) in proportions of 65% with nurses, approximately 50% when using the telephone health line (Info-Santé) and 61% in other places where care is provided. The use of English is lowest in Québec and surrounding area, a region where nearly three Anglophones in ten report being more at ease in French than in English. However, Anglophones report using French with various health care professionals in several regions of Quebec. But because the great majority of the province’s Anglophones live in Montréal, the situation there warrants special attention. As may be seen in the table, while more than 80% of Anglophones use English there (either alone or with another language) with their family doctor, this proportion falls to 69% with nurses, 55% when using the Info-Santé line and 63% in interactions with other health care professionals. Health care professionals' lack of knowledge of English, as perceived by respondents, is the main reason cited by Anglophones to explain why they are not served in that language during their visits/consultations. Overall, the results of the Survey on the Vitality of Official-Language Minorities (SVOLM)) and the census clearly show that the proportion of Anglophones in a municipality of residence, the availability of professionals with knowledge of English and the main language of those requesting service are three important factors that affect the extent of the use of one language or the other with health care professionals. If the Outaouais and Montréal regions stand out from the other regions of Quebec, this is mainly due to the proportionally larger numbers of Anglophones who live there. Thus, as described in the section on use of languages in the public sphere, the greater the proportion of Anglophones in a given region, the more extensive the presence of English in the public sphere and consequently, the greater the opportunities for using it in daily activities. The presence of English-speaking professionals as well as professionals able to conduct a conversation in the minority language is not only likely to increase the accessibility of health care services in that language, but it can also be conducive to a stronger presence and more widespread use of that language in this key sector of the public sphere. According to statistics from the 2006 Census, the Outaouais, Montréal and Estrie and South of Quebec regions have the highest proportions of doctors (97%, 90% and 90% respectively) who are able to conduct a conversation in English. For nurses, the corresponding proportions are 60%, 61% and 49% respectively.

Portrait of Official-Language Minorities in Canada – Anglophones in Quebec
Statistics Canada – Catalogue no. 89-642-X 57
4.2 Justice An examination of the Survey on the Vitality of Official-Language Minorities results concerning the justice field also sheds light on the extent to which English is present in institutions that ensure its use in the public sphere and consequently bolster its status. By measuring access to professionals who are English-speaking or those who are able to converse in English in this field, it is possible to document a phenomenon perceived as being very important by Anglo Quebecers. In Quebec, the SVOLM results show that access to these services in English appears to be valued by Anglophones, in that 84% feel that if they had to use the services of a lawyer, it would be "very important" or "important" for the lawyer to be able to speak English. Also, approximately three out of four English-speaking adults reported that they would feel at ease speaking English if they were dealing with the police. It should be noted that interactions with the justice system and its representatives, especially lawyers and the police, are not widespread in the population. Of Quebec's 773,000 Anglophone adults, 30% reported that they had used the services of a lawyer in the previous two years, while 38% of Anglophones had dealt with the police, either to obtain services or because of an offence. Of those Anglophones, 75% reported having contact with the municipal police, 21% with the provincial police and less than 0.5% (7,700 persons) with the Royal Canadian Mounted Police (RCMP). Because the language barrier can hinder access to justice, the Canadian government has made it a priority to train professionals who can provide service in the minority official language. According to the 2006 Census, Quebec had 16,225 lawyers able to conduct a conversation in English, representing almost 85% of all lawyers in the province. As for Quebec police officers, 63% reported that they were able to conduct a conversation in English. Of course, on this score, regional differences are observed, with the Outaouais and Montréal regions having the largest proportions of lawyers (90% in both regions) and police officers (82% and 73% respectively) able to conduct a conversation in English. In addition to these statistics on availability or the potential pool of justice system professionals who are able to use English when interacting with Anglophones in Quebec, tables 4.2.1 and 4.2.2 show these professionals’ knowledge of English and their use of that language in their work.

Portrait of Official-Language Minorities in Canada – Anglophones in Quebec
Statistics Canada – Catalogue no. 89-642-X 58
Table 4.2.1 Knowledge and use of minority language by police officers (excludes senior management), Quebec and regions, 2006
Total population of police officers
number number % number % number % number % number %
Montréal 8,760 660 7.5 800 9.1 4,960 56.6 5,760 65.7 6,390 72.9
East 880 25 3.0 30 3.9 180 20.4 215 24.3 390 43.8
Outaouais 1,160 100 8.7 420 36.2 590 50.8 1,008 87.0 950 81.7
Estrie and South 1,350 40 2.9 30 2.2 675 49.9 705 52.2 840 62.2
Québec and surrounding area 2,920 40 1.4 50 1.8 500 17.2 560 19.1 1,250 42.9
Rest of Quebec 2,310 140 5.3 150 5.5 740 27.7 890 33.2 1,330 49.4
Total Quebec 17,760 1,010 5.7 1,480 8.3 7,650 43.1 9,135 51.4 11,150 62.8
RegionEnglish1 - First
official language spoken
English - Language used most often at
work
English - Language used
regularly at work
English - Language used
at least regularly at work
Knowledge of English
1. With redistribution of multiple responses. Source(s): Statistics Canada, 2006 Census of population. Table 4.2.2 Knowledge and use of the minority language by lawyers, Quebec and regions, 2006
Total popula-tion of
lawyers
number number % number % number % number % number %
Montréal 12,110 2,210 18.2 3,140 25.9 5,775 47.7 8,915 73.6 10,855 89.6
East 355 10 2.8 10 2.8 75 21.1 80 22.5 205 57.7
Outaouais 1,080 150 13.9 495 45.8 425 39.4 920 85.2 970 89.8
Estrie and South 900 65 7.2 80 8.9 370 41.1 450 50.0 735 81.7
Québec and surrounding area 3,500 55 1.6 50 1.4 850 24.3 905 25.9 2,465 70.4
Rest of Quebec 1,480 40 2.7 115 7.8 410 27.7 530 35.8 990 66.9
Total Quebec 19,430 2,520 13.0 3,885 20.0 7,905 40.7 11,790 60.7 16,225 83.5
RegionEnglish1 - First
official language spoken
English - Language used most often at
work
English - Language used
regularly at work
English - Language used
at least regularly at work
Knowledge of English
1. With redistribution of multiple responses. Source(s): Statistics Canada, 2006 Census of population.

Portrait of Official-Language Minorities in Canada – Anglophones in Quebec
Statistics Canada – Catalogue no. 89-642-X 59
In the 2006 Census, more than 60% of Quebec lawyers reported using English at least on a regular basis in their work. This proportion ranges between 23% and 36% in the regions with small proportions of Anglophones, namely Québec and surrounding area, the East of Quebec and the Rest of Quebec. Among police officers this proportion stands at 51%. In addition, in each region of Quebec, the rate of use of English at work is lower than the proportion of police officers who are able to conduct a conversation in English.33 It is worth noting that according to census data, the number of lawyers and police officers who use English in their work in Quebec is much greater than the number of Anglophone lawyers and police officers. Thus, while nearly 12,000 lawyers reported using English at least on a regular basis at work, 2,500 lawyers have this language as their first official language spoken, or 13% of lawyers in the province, a proportion equal to the weight of the English FOLS population. While the number of police officers who report using English at work is much higher than the number of Anglophone police officers, the Survey on the Vitality of Official-Language Minorities (SVOLM) results show that interactions of Anglophones in Quebec with the municipal police and the provincial police34 are generally in French (see charts 4.2.1 to 4.2.2). Thus, almost one-third (32%) of Anglophones used only or mainly English in their interactions with the municipal police and nearly one-quarter (23%) with the provincial police. Anglophones in the Outaouais region stand out from those in other regions by their more frequent use of English with police officers: more than 40% of them used only or mainly English with the municipal police (44%) and the provincial police (45%). In the Montréal region, the corresponding proportions are 33% and 17% respectively. As for the use of English with lawyers, the SVOLM results show that 61% of Anglophones in Quebec use it predominantly (see chart 4.2.3). In all regions of the province, the use of English predominates in interactions with lawyers, except in the Québec and surrounding area region and the Rest of Quebec. Although French is nevertheless present in a sizable proportion of cases, the widespread use of English with lawyers reflects the fact that the use of a lawyer’s services generally falls into the category of private services and involves a personal choice as to the language of the service provider. This is quite a different situation from those involving interactions with police services, which come under public administration.
33. Just as in the case of health care professionals, the use of English by lawyers and police officers depends on various factors, including
the proportion of Anglophones in a given community. However, an analysis of these factors would go beyond the scope of this study. 34. Because of the very small number of members of the official-language minority who had contact with the RCMP, no conclusions
regarding them can be drawn from the data obtained in the Survey on the Vitality of Official-Language Minorities.

Portrait of Official-Language Minorities in Canada – Anglophones in Quebec
Statistics Canada – Catalogue no. 89-642-X 60
Chart 4.2.1 Proportion of Anglophones by language used with municipal police, Quebec and regions, 2006
0
10
20
30
40
50
60
70
80
90
100
Montréal Outaouais Estrie andSouth
Québec andsurrounding
area
Rest ofQuebec
Total Quebec
perc
enta
ge
English only More English than French English and French equally
More French than English French only
Note(s): The data for East has been suppressed because of the very small number of members of the official-language
minority who had contact with the municipal police. Please refer to Appendix B to obtain quality indicators (coefficient of variation (CV)) for the estimates used to produce this chart.
Source(s): Statistics Canada, Survey on the Vitality of Official-Language Minorities, 2006.

Portrait of Official-Language Minorities in Canada – Anglophones in Quebec
Statistics Canada – Catalogue no. 89-642-X 61
Chart 4.2.2 Proportion of Anglophones by language used with provincial police, Quebec and regions, 2006
0
10
20
30
40
50
60
70
80
90
100
Montréal East Outaouais Estrie andSouth
Québec andsurrounding
area
Rest ofQuebec
TotalQuebec
perc
enta
ge
English only More English than French English and French equally
More French than English French only
Note(s): Please refer to appendix B to obtain quality indicators (coefficient of variation (CV)) for the estimates used to
produce this chart. Source(s): Statistics Canada, Survey on the Vitality of Official-Language Minorities, 2006.

Portrait of Official-Language Minorities in Canada – Anglophones in Quebec
Statistics Canada – Catalogue no. 89-642-X 62
Chart 4.2.3 Proportion of Anglophones by language used with lawyer, Quebec and regions, 2006
0
20
40
60
80
100
Montréal East Outaouais Estrie andSouth
Québec andsurrounding
area
Rest ofQuebec
TotalQuebec
perc
enta
ge
English only More English than French English and French equally
More French than English French only
Note(s): Please refer to appendix B to obtain quality indicators (coefficient of variation (CV)) for the estimates used to produce this chart. Source(s): Statistics Canada, Survey on the Vitality of Official-Language Minorities, 2006.

Portrait of Official-Language Minorities in Canada – Anglophones in Quebec
Statistics Canada – Catalogue no. 89-642-X 63
4.3 Education 4.3.1 Children The problem of access to schooling in English for Quebec’s Anglophone minority is quite different from that faced by Francophones living in a minority situation outside Quebec. For the latter, management of school systems and access to schools in the minority language are relatively recent phenomena, but in the case of Quebec’s Anglophones, management of English-language schools by Anglophones and access to such schools are a much older phenomenon. Thus, well before Confederation in 1867, Quebec’s English-speaking community was headed by powerful and very influential elite (Rudin 1985: 223). Soon after Quebec’s entry into Confederation, the first education act, enacted in 1869, clearly distinguished the Catholic and Protestant sectors and recognized their autonomy by creating two provincial denominational boards. From 1875 to 1964, the year when the Quebec Ministry of Education was created, the Quebec system of denominational schools was run by two distinct denominational committees, each responsible for its respective education system. Accordingly, for educational purposes, Quebecers, regardless of their mother tongue, were divided into two groups: Catholics and Protestants. During this period, the quality and full autonomy of the Protestant school system were assured owing to the economic strength of its members. At the time, residential, commercial and industrial property taxes levied by Protestant school boards were entirely used to finance Protestant schools, and they gave the Protestant school sector—especially in the Montréal area—a superior status within the Quebec education system (Rudin 1985, Martel 1991). During the 20th century, the Quebec education system faced particular difficulties in that it had to accommodate the various religious and language groups that immigrated to Quebec. Since a number of those groups integrated into the English-speaking community, the problems faced by the Quebec education system were to reflect the changes occurring in the composition of Quebec’s English-speaking population. Whereas in 1969, one section of Bill 63 gave parents the right to choose the language of instruction for their children, in 1974, Bill 22 made French the official language of Quebec and restricted enrolment in English schools to children who already had sufficient knowledge of that language. In 1977, the Charter of the French Language or Bill 101 restricted enrolment in English schools to children whose parents had received most of their elementary education in that language in Quebec or whose brother or sister had been educated in that language. In 1984, section 73 of Bill 101 was deemed unconstitutional by the Supreme Court of Canada because it contravened section 23 of the Charter adopted in 1982 on the right to education in the language of the minority. Bill 101 was then amended to allow Anglophone parents who had received their elementary education in English anywhere in Canada (and not only in Quebec) to send their children to an English school in Quebec; this amendment came to be known as the “Canada Clause.” Since 1998, Quebec’s territory has been divided into Anglophone and Francophone school boards rather than Catholic and Protestant boards. According to Quebec government data for 2006, 107,742 students were enrolled in 360 English-language pre-school, elementary or secondary schools under the jurisdiction of Anglophone school boards. In addition, nearly 15,000 students were enrolled in one of the 48 English-language private schools. As pointed out by Lamarre (2008: 63), Bill 101 has had a considerable impact on the English-language school system in Quebec. While in 1971, nearly 248,000 students were enrolled in an English-language school, by 2006 that number had declined to fewer than 108,000 students. The decrease in enrolment numbers is partly due to the drop in the English-speaking school-age population as a result of a total fertility rate below the replacement level. However, the English-language school system was also profoundly changed by the sizable negative net migration experienced by Quebec’s Anglophone population during the 1970s along with the major changes resulting from the application of the Quebec Charter of the French Language in terms of access to English-language schools. In this regard, it is worth noting that according to Quebec government data (2004), almost 90% of first-generation immigrants are now enrolled in French schools. In 1971, 85% were enrolled in English schools (Quebec 1996).

Portrait of Official-Language Minorities in Canada – Anglophones in Quebec
Statistics Canada – Catalogue no. 89-642-X 64
Using the criterion of first official language spoken, data from the Survey on the Vitality of the Official-Language Minorities (SVOLM) reveal that of the 191,380 children whose parents were Anglophones and who were enrolled in school at the time of the survey, approximately 52% were attending an English-language elementary or secondary school, including 22% in a French immersion program (chart 4.3.1-a). Counting only children with at least one parent who had English as a mother tongue, this proportion reaches 58% (chart 4.3.1.-b), whereas when the focus is on children with at least one parent who received part or all of his or her elementary education in English in Canada, the proportion is 65% (chart 4.3.1.-c). In light of the information presented above, it is clear that the language of the school attended by young Anglophones depends on several factors, one of the most important being the restrictions imposed by Quebec language legislation. Added to this is the sizable proportion of French-English exogamous unions as well as the desire of Anglophone parents to further their children’s learning of both French and English. Chart 4.3.1- a Percentage of children with at least one parent with English as first official language spoken (after the redistribution of the French-English category), by language of the school attended, Quebec and regions, 2006
0
10
20
30
40
50
60
70
80
90
100
Montréal East Outaouais Estrie andSouth
Québec andsurrounding
area
Rest ofQuebec
TotalQuebec
perc
enta
ge
English school: regular English school: immersion French school
Source(s): Statistics Canada, Survey on the Vitality of Official-Language Minorities, 2006.
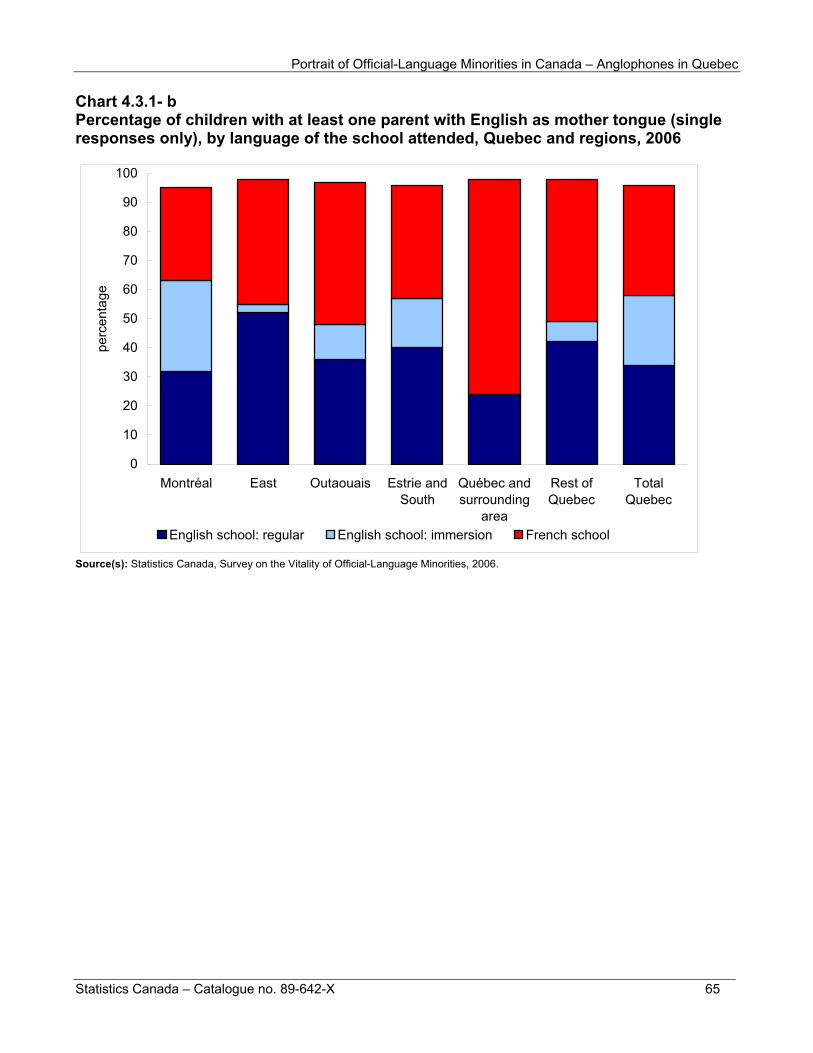
Portrait of Official-Language Minorities in Canada – Anglophones in Quebec
Statistics Canada – Catalogue no. 89-642-X 65
Chart 4.3.1- b Percentage of children with at least one parent with English as mother tongue (single responses only), by language of the school attended, Quebec and regions, 2006
0
10
20
30
40
50
60
70
80
90
100
Montréal East Outaouais Estrie andSouth
Québec andsurrounding
area
Rest ofQuebec
TotalQuebec
pe
rce
nta
ge
English school: regular English school: immersion French school
Source(s): Statistics Canada, Survey on the Vitality of Official-Language Minorities, 2006.
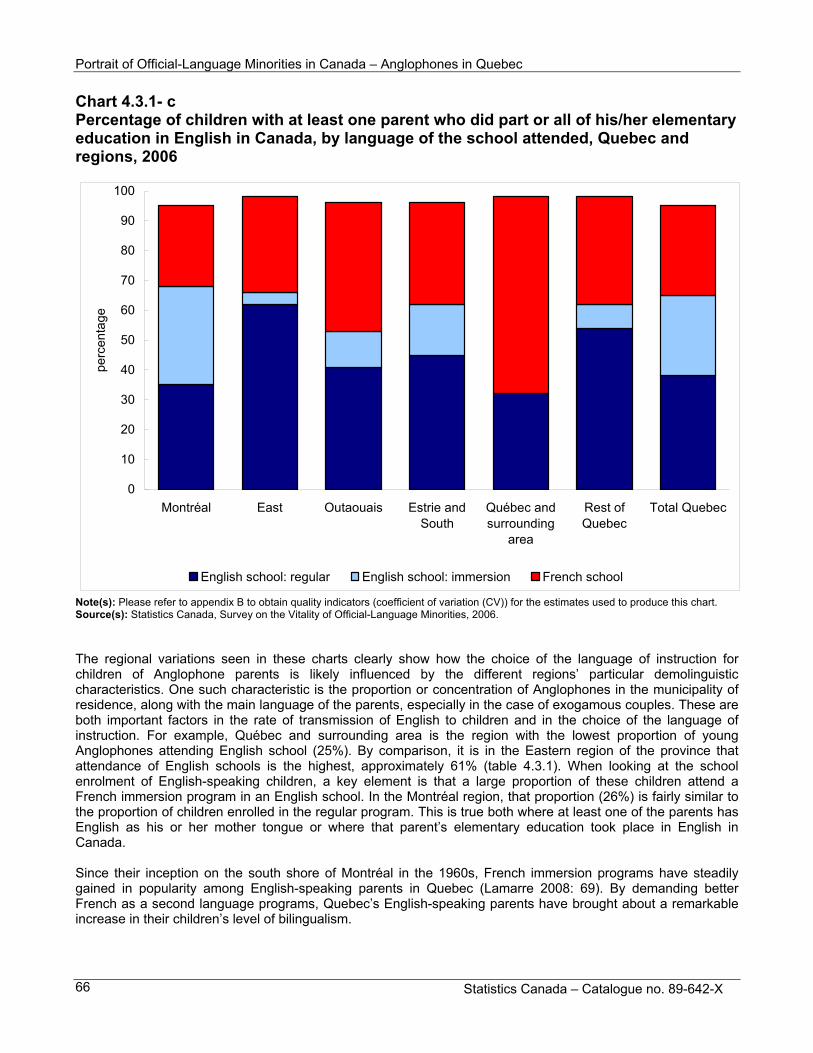
Portrait of Official-Language Minorities in Canada – Anglophones in Quebec
Statistics Canada – Catalogue no. 89-642-X 66
Chart 4.3.1- c Percentage of children with at least one parent who did part or all of his/her elementary education in English in Canada, by language of the school attended, Quebec and regions, 2006
0
10
20
30
40
50
60
70
80
90
100
Montréal East Outaouais Estrie andSouth
Québec andsurrounding
area
Rest ofQuebec
Total Quebec
perc
enta
ge
English school: regular English school: immersion French school
Note(s): Please refer to appendix B to obtain quality indicators (coefficient of variation (CV)) for the estimates used to produce this chart. Source(s): Statistics Canada, Survey on the Vitality of Official-Language Minorities, 2006. The regional variations seen in these charts clearly show how the choice of the language of instruction for children of Anglophone parents is likely influenced by the different regions’ particular demolinguistic characteristics. One such characteristic is the proportion or concentration of Anglophones in the municipality of residence, along with the main language of the parents, especially in the case of exogamous couples. These are both important factors in the rate of transmission of English to children and in the choice of the language of instruction. For example, Québec and surrounding area is the region with the lowest proportion of young Anglophones attending English school (25%). By comparison, it is in the Eastern region of the province that attendance of English schools is the highest, approximately 61% (table 4.3.1). When looking at the school enrolment of English-speaking children, a key element is that a large proportion of these children attend a French immersion program in an English school. In the Montréal region, that proportion (26%) is fairly similar to the proportion of children enrolled in the regular program. This is true both where at least one of the parents has English as his or her mother tongue or where that parent’s elementary education took place in English in Canada. Since their inception on the south shore of Montréal in the 1960s, French immersion programs have steadily gained in popularity among English-speaking parents in Quebec (Lamarre 2008: 69). By demanding better French as a second language programs, Quebec’s English-speaking parents have brought about a remarkable increase in their children’s level of bilingualism.

Portrait of Official-Language Minorities in Canada – Anglophones in Quebec
Statistics Canada – Catalogue no. 89-642-X 67
The growing number of French-English exogamous couples partly explains the fact that many Anglophone parents choose to register their children in a French school. According to data from the Survey on the Vitality of Official-Language Minorities, 40% of children whose respondent parent had English as his or her mother tongue lived in an English endogamous family. Approximately half of them live in an English-French exogamous family. In addition, of the 32,350 children whose English-mother-tongue parent had a spouse with the same mother tongue, 78% were enrolled in an English school at the time of the survey. Conversely, when the spouse of the English-mother-tongue parent had French as his or her mother tongue, 37% of the children were enrolled in an English school and 61% in a French school. With respect to children whose Anglophone parent had a spouse with an “other” mother tongue, almost two in three attended an English school. Besides the growth of exogamy, some historical factors shed light on parents’ motives in this regard. During the 1970s, as a result of the restrictions on the choice of the language of schooling imposed by Bill 101, Protestant school boards started opening French schools for the immigrant population that could not attend English schools. According to Lamarre (2008: 70), such a change “offered a new option to English-speaking families who could now send their children to French Protestant schools that were under the management of the Anglophone community.” Thus, emerged the phenomenon of rights-holder families voluntarily choosing to send their children to French schools, at least at the elementary level (McGlynn and al. 2008, Laperrière 2006). In addition, while a number of parents chose to register their children in a French immersion program, many others chose to exert pressure to improve the teaching of French as a second language in English schools, particularly with respect to written French. Because of the strong relationship between a high level of bilingualism and good employment opportunities for young Anglophones in Quebec, the idea was to ensure not only that the children of Anglophone parents were orally bilingual, but that their literacy in French was equal to that of native French speakers. It is mainly at the elementary level that Anglophone parents choose to enroll their children in a French school. Lamarre (2008: 71) observes that “as students move into high school, the preoccupation with obtaining French skills loses ground to the need for good marks in preparation for post-secondary education in English.” On this subject, the SVOLM results confirm that attending an English school appears to be a more widespread choice at the secondary level. These results indicate that there is considerable exposure to French at the pre-school and kindergarten level (53%) and at the elementary level (48% in a French school and 32% in a French immersion program in an English school). In fact, at the elementary level, only 17% of young Anglophones are enrolled in a regular program in English, compared to 38% at the secondary level. This finding applies to all regions of the province, although in the Eastern region, the proportion of young Anglophones enrolled in the regular education program at the elementary level (34%) is fairly similar to the level observed at the secondary level.

Portrait of Official-Language Minorities in Canada – Anglophones in Quebec
Statistics Canada – Catalogue no. 89-642-X 68
Table 4.3.1 Number and percentages of children of Anglophone (first official language spoken) parents, by language of the school and level of schooling, Quebec and regions, 2006
number % number % number % number %
Montréal 16,080 100 69,060 100 56,430 100 150,500 100
English school regular program 5,740 36 8,980 13 20,400 36 41,310 27
English school immersion program 0 0 25,200 36 13,690 24 38,890 26
French school 8,190 51 31,810 46 21,020 37 62,980 42
Other 2 E 13 E 3 E 4 E 1 E 2 E 7,120 5
East 260 E 100 1,350 100 1,340 100 3,270 100
English school regular program 110 E 42 E 800 59 770 57 1,910 58
English school immersion program 0 0 80 E 6 E x x 110 E 3 E
French school 140 E 54 E 460 34 500 37 1,190 36
Other 0 0 x x x x x x
Outaouais 710 E 100 6,200 100 5,570 100 13,510 100
English school regular program 280 E 39 E 1,630 26 2,230 40 4,490 33
English school immersion program 0 0 690 E 11 E 780 E 14 E 1,470 11
French school 400 E 56 E 3,870 62 2,550 46 7,190 53
Other x x x x x x x
Estrie and South 850 E 100 3,990 100 4,820 100 10,000 100
English school regular program 370 E 44 E 1,230 31 2,280 47 4,080 41
English school immersion program 0 0 960 E 24 E 690 E 14 E 1,660 17
French school F F 1,560 39 1,790 37 3,920 39
Other x 240 E 6 E x x 330 E 3 E
Québec and surrounding area 800 E 100 2,390 100 2,270 100 5,740 100
English school regular program x x 580 24 670 E 30 E 1,420 25
English school immersion program 0 0 x x x x x x
French school 650 E 81 E 1,800 75 1,540 68 4,220 74
Other x x 0 0 0 0 x
Rest of Quebec 470 E 100 3,580 100 3,940 100 8,370 100
English school regular program 150 E 32 E 1,100 31 1,930 49 3,510 42
English school immersion program 0 0 350 E 10 E 270 E 7 E 620 E 7 E
French school 300 E 64 E 2,030 57 1,710 43 4,100 49
Other x x x x x x x
Total Quebec 19,170 100 86,560 100 74,380 100 191,380 100
English school regular program 6,770 35 14,310 17 28,270 38 56,730 30
English school immersion program 0 0 27,300 32 15,510 21 42,810 22
French school 10,120 53 41,520 48 29,120 39 83,600 44
Other 2 E 12 E 3 E 4 E 1 E 2 E 8,060 4
Pre-school and kindergarten
Primary(1 to 8) SecondaryType of school attended by child1 Total
x
x
x
1. Children for whom responding parent has English as first official language spoken. Source(s): Statistics Canada, Survey on the Vitality of Official-Language Minorities, 2006.

Portrait of Official-Language Minorities in Canada – Anglophones in Quebec
Statistics Canada – Catalogue no. 89-642-X 69
4.3.2 Adults 4.3.2.1 Highest level of schooling The portrait of Anglophone adults in Quebec with regards to schooling bears witness to the historical existence of an economic, social and cultural network of institutions unique among English-speaking Canadians. Well before the beginning of Confederation, Anglophones in Quebec were indeed considered an elite within Canada. Moreover, the advantage Anglophones in Quebec had over their Francophone counterparts was also the result of historical factors of a political and cultural nature, namely a lower school attendance by Francophones as well as a lesser value put upon education. In fact, it was not until the 1960s, through the societal shift brought about by the Quiet revolution which saw, among others, the creation of the Royal Commission on Teaching in the province (Parent Commission) and the Quebec Ministry of Education, that Francophones’ relationship to education was transformed. To illustrate the phenomenon, we will first examine the results shown in chart 4.3.2.1 that concern the situation observed in 2006. As may be seen, one Anglophone in five (20%) had no certificate, diploma or degree, compared to one Francophone in four (26%). Apart from persons with no certificate, diploma or degree, the gap observed between the two main language groups for persons with no postsecondary diploma or degree is mainly due to the fact that Anglophones are proportionally more likely to have completed at least a high school diploma, while their Francophone counterparts are proportionally more likely to have a trade school or apprenticeship certificate. Statistics on diplomas, certificates or degrees obtained at the postsecondary level also reveal that there is a sizable gap in university degrees or diplomas in favour of Anglophones: almost 25% of the latter have such a degree or diploma, compared to slightly more than 15% of Francophones.

Portrait of Official-Language Minorities in Canada – Anglophones in Quebec
Statistics Canada – Catalogue no. 89-642-X 70
Chart 4.3.2.1 Highest certificate, diploma or degree obtained, by first official language spoken, Quebec, 2006
19.8
24.9
9.3
16.2
5.2
24.625.5
21.9
16.3 16.1
4.8
15.3
0
5
10
15
20
25
30
No certificate,diploma or
grade
High schoolcertificate orequivalent
Apprenticeshipor trades
certificate ordiploma
College,CEGEP orother non-university
certificate ordiploma
Universitycertificate or
diploma belowbachelor level
Universitycertificate,diploma orgrade at
bachelor's levelor above
diploma or degree
perc
enta
ge
English French
Source(s): Statistics Canada, 2006 Census of Population. Chart 4.3.2.2 shows that for all age groups, the proportion of Anglophones having no certificate, diploma or degree is lower than the corresponding proportion of Francophones, although the gap is much wider for persons aged 65 and over. Reflecting the weight of historical factors, the proportion of Francophones in this age group who have no diploma or certificate is 48%, compared to 36% for Anglophones. Conversely, within the population for which English is the first official language spoken, a larger proportion have a university certificate, diploma or degree than within the French-speaking population. Among persons aged 25 to 34, the gap between the two groups is 12 percentage points. Note that in this regard, the gap between the two groups is slightly larger than when the mother tongue criterion is used; this difference is mainly attributable to the greater weight of immigration within the English-speaking population and the larger proportion of university graduates in the immigrant population. However, it is worth noting that when we only take into account persons of this age group that live in the Montréal CMA, the gap between the two language groups shrinks by approximately 5 percentage points and becomes negligible on the Island of Montréal. In the other large urban centres where Anglophones reside, namely in Outaouais and Sherbrooke, there is practically no gap between the two groups as to the proportion of university degree holders. In other words, since the proportion of university graduates is much greater in the large urban centres and a sizable proportion of the Quebec population lives outside these large centres, any analysis of the education gaps between the two groups must take this reality into consideration

Portrait of Official-Language Minorities in Canada – Anglophones in Quebec
Statistics Canada – Catalogue no. 89-642-X 71
Chart 4.3.2.2 Highest certificate, diploma or degree obtained, by first official language spoken and age group, Quebec, 2006
9.1
19.4
38.1
12.218.0
28.7
36.1
9.615.1
12.2
21.925.7
16.7 17.8 18.7
48.3
8.0 7.7
0
10
20
30
40
50
60
Nocertificate,diploma or
grade
College,CEGEP orother non-universitycertificateor diploma
Universitycertificate,diploma orgrade at
bachelor'slevel orabove
Nocertificate,diploma or
grade
College,CEGEP orother non-universitycertificateor diploma
Universitycertificate,diploma orgrade at
bachelor'slevel orabove
Nocertificate,diploma or
grade
College,CEGEP orother non-universitycertificateor diploma
Universitycertificate,diploma orgrade at
bachelor'slevel orabove
25 to 34 years 35 to 54 years 65 years and over
perc
ent
age
English French
Source(s): Statistics Canada, 2006 Census of population. As just noted, an examination of the educational status of young adults must take an important factor into account, namely Anglophones' place of birth. For example, we know that within both the Anglophone and Francophone groups, immigrants are generally more likely to have a university diploma, one reason being that education level is one of the selection criteria for immigrants to Canada. In 2006, among Anglophones aged 25 to 34, 46% of those born outside Canada had a university diploma, compared to 41% of those born in another province (in most cases, Ontario) while 31% of Anglophones born in Quebec had such a diploma (see chart 4.3.2.3). At lower education levels, the corollary of this situation is observed, namely, Anglophones born in Quebec were much more likely than other Anglophones born outside Quebec to have a high school or college diploma as their highest education level.

Portrait of Official-Language Minorities in Canada – Anglophones in Quebec
Statistics Canada – Catalogue no. 89-642-X 72
Chart 4.3.2.3 Proportion of Anglophones (first official language spoken) aged 25 to 34 years, by the highest certificate, diploma or degree obtained and place of birth, Quebec, 2006
9.7
19.9
11.3
23.5
4.7
30.9
10.0
19.4
7.8
18.1
3.7
41.0
8.0
17.3
6.7
14.9
7.4
45.7
0
5
10
15
20
25
30
35
40
45
50
No certificate,diploma or
grade
High schoolcertificate orequivalent
Apprenticeshipor trades
certificate ordiploma
College,CEGEP orother non-university
certificate ordiploma
Universitycertificate or
diploma belowbachelor level
Universitycertificate,diploma orgrade at
bachelor'slevel or above
perc
en
tag
e
Born in province of residence Born in another province Born outside Canada
Source(s): Statistics Canada, 2006 Census of population. One of the greatest changes resulting from the profound social transformations and educational reforms of the 1960s is undeniably the entry of large numbers of women into post-secondary educational institutions, especially universities. In 1971, the proportion of women holding a university degree was two to three times smaller than the proportion of men, depending on the age group. In 2006, among Anglophones in Quebec, the data show that for persons aged 65 and over—that is, those who were at least 30 years of age in 1971, the proportion of women holding a university diploma is 11%, compared to 20% for men in this age group (see table 4.3.2.1). By contrast, among 20 to 24 year-olds, the situation is reversed: the proportion holding such a diploma is only 12% for men, whereas it is nearly 20% for women. In short, women under 35 years of age are proportionally more likely to have a university diploma or degree than their male counterparts, while the latter are proportionally more likely to have a lower level of education or to have a vocational or trade school diploma.

Portrait of Official-Language Minorities in Canada – Anglophones in Quebec
Statistics Canada – Catalogue no. 89-642-X 73
Table 4.3.2.1 Proportion of Anglophones (first official language spoken) by the highest certificate, diploma or degree obtained, age group and sex, Quebec, 2006
Female Male Female Male Female Male Female Male Female Male Female Male
No certificate, diploma or grade 9.3 13.7 7.5 10.6 8.5 11.8 13.4 15.2 22.1 20.1 38.7 32.9
High school certificate or equivalent 28.8 34.6 17.2 20.4 23.0 21.0 28.9 25.1 27.1 22.0 28.4 20.0Apprenticeship or trades certificate or diploma 5.7 7.9 7.8 10.3 8.9 12.8 8.5 12.7 8.6 13.3 6.2 14.0College, CEGEP or other non-university certificate or diploma 31.4 27.3 20.4 18.5 21.7 16.7 18.5 14.7 12.9 9.7 10.6 8.4
University certificate, diploma or grade at bachelor's level or above
19.5 12.0 41.1 34.9 31.3 32.2 24.3 26.9 22.7 29.9 11.0 20.0
percentage
55 to 64 years 65 years and over20 to 24 years 25 to 34 years 35 to 44 years 45 to 54 years
Certificat, diploma or degree
Source(s): Statistics Canada, 2006 Census of population.
The propensity to be highly educated or less educated usually varies depending on whether individuals live in large urban centres or rural areas. For example, universities are generally located in large urban centres, as are the employers who are likely to hire numerous university graduates. For Anglophones in Quebec, in 2006, the regions of Québec and surrounding area and Montréal had the largest proportions of university graduates, at respectively 28% and 27% (chart 4.3.2.4). The lowest proportions of such graduates were recorded in the East of Quebec, the Estrie and South of Quebec and the “Rest of Quebec” regions, at 7%, 14% and 11% of the population respectively. Conversely, in the East of Quebec and the “Rest of Quebec,” large proportions of the Anglophone population had no certificate, diploma or degree, at 43% and 35% respectively. These results reflect differences in the age structure of Anglophone communities in the various regions of Quebec. Whereas approximately 13% of Montréal’s Anglophone population is aged 65 and over, the regions of Estrie and South of Quebec, the East of Quebec and the “Rest of the province” posted proportions of 21%, 18% and 15% respectively. Conversely, whereas 15% of Montréal’s Anglophone population is aged 25 to 34, the corresponding proportions of adults in this age group in those same three regions are 9%, 10% and 12% respectively.
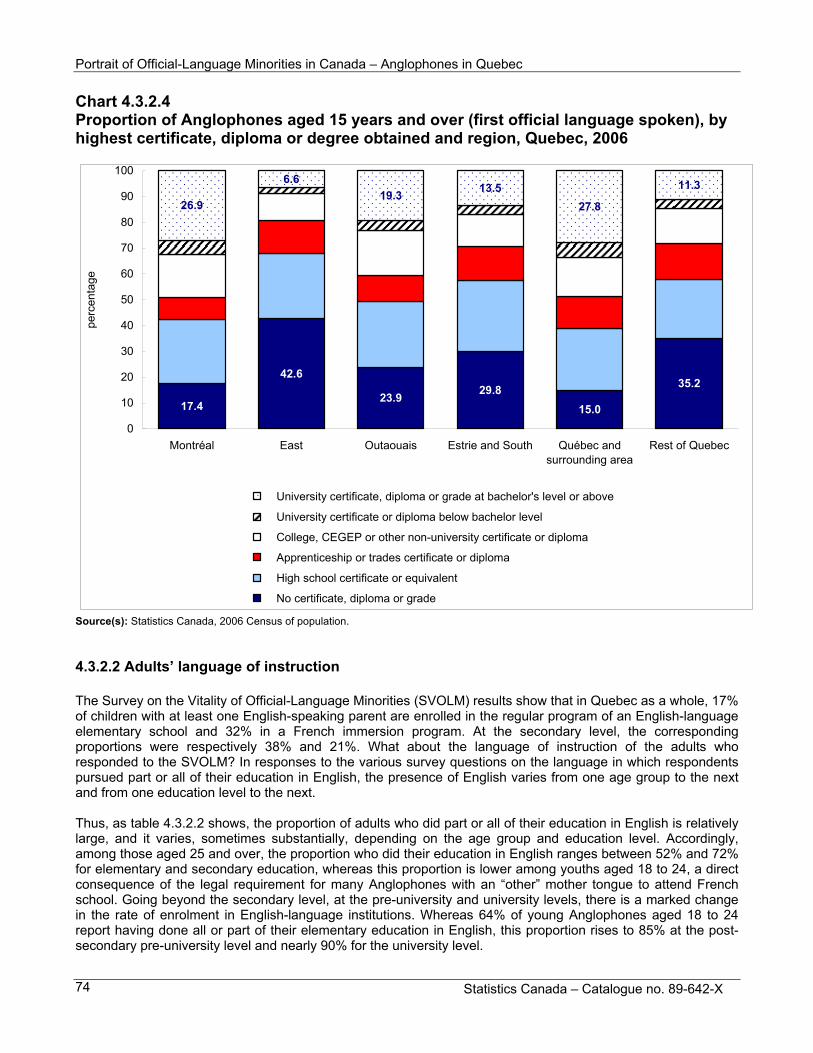
Portrait of Official-Language Minorities in Canada – Anglophones in Quebec
Statistics Canada – Catalogue no. 89-642-X 74
Chart 4.3.2.4 Proportion of Anglophones aged 15 years and over (first official language spoken), by highest certificate, diploma or degree obtained and region, Quebec, 2006
17.4
42.6
23.929.8
15.0
35.2
0
10
20
Montréal East Outaouais Estrie and South Québec andsurrounding area
Rest of Quebec
26.9
80
6.6
19.313.5
27.8
11.390
Région
30
40
50
60
70
perc
enta
ge
100
University certificate, diploma or grade at bachelor's level or above
University certificate or diploma below bachelor level
College, CEGEP or other non-university certificate or diploma
Apprenticeship or trades certificate or diploma
High school certificate or equivalent
No certificate, diploma or grade
Source(s): Statistics Canada, 2006 Census of population. 4.3.2.2 Adults’ language of instruction The Survey on the Vitality of Official-Language Minorities (SVOLM) results show that in Quebec as a whole, 17% of children with at least one English-speaking parent are enrolled in the regular program of an English-language
nd 32% in a French immersion program. At the secondary level, the corresponding age of instruction of the adults who
sponded to the SVOLM? In responses to the various survey questions on the language in which respondents ursued part or all of their education in English, the presence of English varies from one age group to the next
ndary education, whereas this proportion is lower among youths aged 18 to 24, a direct
elementary school aproportions were respectively 38% and 21%. What about the langurepand from one education level to the next. Thus, as table 4.3.2.2 shows, the proportion of adults who did part or all of their education in English is relatively large, and it varies, sometimes substantially, depending on the age group and education level. Accordingly, among those aged 25 and over, the proportion who did their education in English ranges between 52% and 72% for elementary and secoconsequence of the legal requirement for many Anglophones with an “other” mother tongue to attend French school. Going beyond the secondary level, at the pre-university and university levels, there is a marked change in the rate of enrolment in English-language institutions. Whereas 64% of young Anglophones aged 18 to 24 report having done all or part of their elementary education in English, this proportion rises to 85% at the post-secondary pre-university level and nearly 90% for the university level.

Portrait of Official-Language Minorities in Canada – Anglophones in Quebec
Statistics Canada – Catalogue no. 89-642-X 75
Tableau 4.3.2.2
V
Proportion of Anglophones aged 18 years and over who did all or part of their studies in English, by age group and level of schooling, Quebec, 2006
% CV % CV % CV % CV % CV % CV % CV % C
18 to 24 years 39 4.9 25 7.2 50 3.7 20 7.8 72 2.9 13 13.0 83 3.3 7 E 28.0
25 to 44 years 52 3.7 19 8.4 57 3.1 17 8.0 69 3.5 11 15.6 66 3.6 12 13.4
45 to 64 years 66 2.5 12 12.0 72 2.3 9 14.5 67 4.1 9 E 19.6 73 3.5 12 15.7
65 years or over 63 2.3 7 13.2 70 2.3 6 13.6 66 6.5 F F 69 5.0 13 E 19.1
Some in English
Age groupAll in
English
Secondary studiesNon-university post-secondary
studies
Some in English
All in English
Some in English
All in English
Level of schooling
Primary studies University studies
All in English
Some in English
CV coefficient of variation Source(s): Statistics Canada, Survey on the Vitality of Official-Language Minorities, 2006.
4.4 Media, arts and culture Support for the arts and culture is one of the key elements targeted by the Roadmap for Canada’s Linguistic Duality, which recognizes the essential role that the arts and culture play in the development of minority official-language communities. The Survey on the Vitality of Official-Language Minorities (SVOLM) targets six media for measuring access to cultural products in the minority language: television; the Internet; radio; newspapers; books; and live performances or arts events. These days, the Internet and cable television facilitate access to these media from many countries and in numerous languages, thereby increasing the availability of the various English-language cultural products throughout Canada. The results of the Survey on the Vitality of Official-Language Minorities show that Quebec Anglophones, like their Francophone counterparts, are big consumers of the various media, the most important one being television (see table 4.4.1).

Portrait of Official-Language Minorities in Canada – Anglophones in Quebec
Statistics Canada – Catalogue no. 89-642-X 76
Table 4.4.1 Proportion of Anglophones and Francophones by use of certain media, Quebec, 2006
Anglophones Francophones
Watch television 97 93
Listen to the radio 86 77
Read books 85 87
Read newspapers 80 75
Use internet 71 74
Use of mediapercentage
Source(s): Statistics Canada, Survey on the Vitality of Official-Language Minorities, 2006. The data in table 4.4.2 show that for Anglophones, consumption of the different media basically takes place in English, with a majority reporting that it is "only" or "mainly" in that language that they watch television or listen to radio, read books and newspapers and access the Internet. Internet use (86%) and television viewing (82%) are the activities for which the predominance of English is the strongest, while the reading of newspapers only or mainly in English registers the lowest proportion at 67%. Despite the dominance of English in consumption of the various media, it is worth noting that province-wide, 20% of Anglophones listen to the radio in French (exclusively or as often as in English), while this is the case with close to three Anglophones in ten with respect to reading newspapers. In Montréal, the latter proportion is 26%.

Portrait of Official-Language Minorities in Canada – Anglophones in Quebec
Statistics Canada – Catalogue no. 89-642-X 77
Table 4.4.2 Percentage of Anglophones by language used with certain media, Quebec and regions, 2006
Only or mainly in
English
English and
French
Only or mainly in
French
Only or mainly in
English
English and
French
Only or mainly in
French
Only or mainly in
English
English and
French
Only or mainly in
French
Only or mainly in
English
English and
French
Only or mainly in
French
Only or mainly in
English
English and
French
Only or mainly in
French
Montréal 78 11 7 82 11 3 70 11 15 83 7 5 86 6 2
East 58 20 E 19 E 82 13 2 E 50 17 E 31 87 9 E x 79 15 E x
Outaouais 78 12 E 5 E 89 6 E x 75 10 E 12 E 87 4 E F 88 7 E xEstrie and South 76 14 8 E 85 9 3 E 60 17 20 85 9 E F 86 10 E x
Québec and surrounding area 29 19 50 70 21 7 20 19 59 65 20 13 E 70 20 8 E
Rest of Quebec 65 13 16 80 9 E 5 E 54 12 28 79 6 8 E 81 7 E 4 E
Total Quebec 76 12 8 82 11 3 67 12 17 78 9 7 86 7 2
Television Newspapers Books Internet
Region
percentage
Radio
Source(s): Statistics Canada, Survey on the Vitality of Official-Language Minorities, 2006.
Portrait of Official-Lan
guage Minorities in Canada – Anglophones in Quebec
Statistics Canada – Catalogue no. 89-642-X 78
W of Official-L conthe conregiothat their cophenpred East of Quebother resmalle minority of Anglopd
4.5 Community Idimen “[s]oc
ith respect to the choice of the language in which media are consumed, the results of the Survey on the Vitalityanguage Minorities show once again the influence of the Anglophones’ region of residence and,
sequently, the proportion that the Anglophone population represents within that region. Despite the fact that centration of Anglophones within municipalities is higher in the Montréal region than in the Outaouais
n, Anglophones living in the latter are as much if not more inclined than those in the other regions to report nsumption of the various media takes place “only” or “mainly” in English (see table 4.4.2). This
omenon is mainly due to the proximity of Ontario, particularly the city of Ottawa, where English greatly ominates. Anglophones in the region of Québec and surrounding area and, to a lesser extent, those in the
ec are proportionally less likely to listen to the radio “only” or “mainly” in English than those in the gions. Because of widespread access to cable television and the Internet, regional disparities are much
r with respect to the presence of English in the consumption of these media. However, only a smallhones in the region of Québec and surrounding area read newspapers in that language, as
oes at least half of them in the East of Quebec and the “Rest of Quebec.”
life
ndividuals’ involvement in their community and participation in community activities are generally recognized as sions of life in society that contribute to the creation and maintenance of social support networks. Also,
cial capital (broadly defined as participation in social networks) is increasingly being understood as a key omponent of community development or a key aspect of the ‘capacity’ of a community to develop.”35
The Survey on the Vitality of Official-Language Minorities (SVOLM) data can be used to measure variousaspects of Anglophones’ community participation. The statistics on participation in volunteer activities, membership in community organizations and informal care giving shedding light on the extent to whichAnglophones are involved in local associations and their community. The Survey on the Vitality of Official-Language Minorities results show that approximately one-quarter of Quebec’s Anglophones participate in one of the activities on which data were collected in that survey. Thus, 22% of adult Anglophones reported belonging to an organization, network or association during the twelve months preceding the survey, while 24% reported volunteering and 26% reported giving unpaid assistance with activities to someone not living in their household. A number of sociodemographic and economic factors influence community participation, including age, education level, residential environment, socioeconomic status, etc. However, an analysis of these factors goesbeyond the objective of this report. The type of community activities in which Anglophones are involved varies from one region to another. Their level of participation in these activities is roughly the same in all regions of Quebec. However, the language in which these activities take place varies, in particular according to the type of activity and the region. For example, Anglophones’ involvement in volunteering or day-to-day social support activities takes place more often in English than in the case of involvement in organizations, networks or associations. Also, except for what is observed in Québec and surrounding area, regional disparities seem smaller for participation in these day-to-day activities than for other community activities.
35. Rothwell, Neil and Martin Turcotte (2006). “The Influence of Education on Civic Engagement: Differences Across Canada’s Rural-Urban
Spectrum,” Rural and Small Town Canada Analysis Bulletin, Vol. 7, no. 1, July, Catalogue no. 21-006-XIE, page 1.

Portrait of Official-Language Minorities in Canada – Anglophones in Quebec
Statistics Canada – Catalogue no. 89-642-X 79
Chart 4.5.1 Proportion of Anglophones by language used during community activities, Quebec and regions, 2006
0
10
20
30
40
50
60
70
80
90
100
Mon
tréa
l
Eas
t
Out
aoua
is
Est
rie a
nd
So
uth
Qu
ébec
and
surr
oun
ding
area Res
t of
Que
bec
Tot
alQ
ueb
ec
Mon
tréa
l
Eas
t
Out
aoua
is
Est
rie a
nd
So
uth
Qu
ébec
and
surr
oun
ding
area Res
t of
Que
bec
Tot
alQ
ueb
ec
Mon
trea
l
Eas
t
Out
aoua
is
Est
rie a
nd
So
uth
Qu
ébec
and
surr
oun
ding
area Res
t of
Que
bec
Tot
alQ
ueb
ec
Volunteering Organization Daily activities
perc
enta
ge
Only or mainly English English and French Only or mainly French
Note(s): Please refer to Appendix B to obtain quality indicators (coefficient of variation (CV)) for the estimates used to produce this chart. Source(s): Statistics Canada, Survey on the Vitality of Official-Language Minorities, 2006. Note that assistance with day-to-day activities is more often provided to children and other family members (51%) and friends (30%). Furthermore, family and friends seem to rely heavily on the networks of Anglophones in Quebec. Thus, in the event of illness, 18% would turn to their children, while 51% report that they would turn to other family members for support. Also, nearly 15% of Anglophones would turn to community resources, volunteer organizations or public social service institutions for support if they became ill. In general, then, the use of English in social support activities seems to be associated mainly with the private sphere. The Survey on the Vitality of Official-Language Minorities (SVOLM) reveals that 79% of Anglophones report that it is “very important” or “important” to them that individuals or organizations work on the development of the Anglophone community. Here too there are variations according to the region and the concentration of Anglophones within the municipality of residence. Thus, in the East region, where Anglophones’ average index of concentration within their municipality of residence is the highest after that of Montréal Anglophones, the largest proportion of respondents (85%) report that they consider it “very important” or “important” that individuals or organizations work on the development of the Anglophone community. Conversely, that proportion is the lowest in the region of Québec and surrounding area (70%), which has the smallest proportion and the lowest concentration of Anglophones. In the other regions of Quebec, the proportions of those who consider it “very important” or “important” that someone work at developing the community varies little, from 73% to 79%. Although 79% of Anglophones report that it is “important” or “very important” to them that individuals or organizations work at the development of the Anglophone community, less than 12% of those who belong to organizations, networks or associations do so in order to promote or defend the interests of Anglophones.36 Furthermore, the latter proportion shows almost no variation depending on the concentration or proportion of Anglophones in the municipality of residence or the proportion that they represent there.
36. For Ontario Francophones, the proportion is 32%.

Portrait of Official-Language Minorities in Canada – Anglophones in Quebec
Statistics Canada – Catalogue no. 89-642-X 80
4.6 Employment and income characteristics Thus far, we have examined the size of differences in education level between the main language groups in Quebec. Data from both the census and the SVOLM can be used to examine the extent to which Anglophones in Quebec work in different industry sectors than Francophones. It is accordingly possible to identify similarities and differences in how the language groups are distributed among the various industry sectors. A brief analysis of 2006 Census data reveals that Quebec Anglophones are proportionally more likely than Francophones to work in certain sectors, such as professional, scientific and technical services, administrative and management services, or wholesale trade. These three sectors account for respectively 8.7%, 4.8% and 6.7% of the province’s Anglophones, compared to 5.8%, 3.5% and 3.9% of Francophones. For their part, Francophones are present in proportionally larger numbers in positions in retail trade (12.4%), health care and social assistance (11.4%), public administration (6.6%), and construction (5.5%). By comparison, these four sectors employ respectively 10.7%, 8.9%, 3.6%, and 3.5% of the province’s Anglophones. In the other major industry sectors, the gaps between the two groups are smaller.

Portrait of Official-Language Minorities in Canada – Anglophones in Quebec
Statistics Canada – Catalogue no. 89-642-X 81
Chart 4.6.1 Proportion of workers by industry sector and first official language spoken, Quebec, 2006
0.0 2.0 4.0 6.0 8.0 10.0 12.0 14.0
Management of companies and enterprises
Mining and oil and gas extraction
Utilities
Real estate and rental and leasing
Arts, entertainment and recreation
Information and cultural industries
Agriculture, forestry, fishing and hunting
Administrative and support, waste management andremediation services
Finance and insurance
Wholesale trade
Transportation and warehousing
Other services (except public administration)
Construction
Professional, scientific and technical services
Accommodation and food services
Public administration
Educational services
Health care and social assistance
Retail trade
Manufacturing
proportion
English French
Source(s): Statistics Canada, 2006 Census of population.

Portrait of Official-Language Minorities in Canada – Anglophones in Quebec
Statistics Canada – Catalogue no. 89-642-X 82
A number of studies have focused on the participation and presence of Anglo Quebecers in government institutions, and this is an issue that concerns this community’s intellectuals, representatives and leaders.37 Although 3.6% of Anglophone workers and 6.6% of Francophone workers in Quebec work in the public administration sector, what is the Anglophones’ relative share within the workforce of this employment sector? Data from the 2006 Census show that the proportion of Anglo Quebecers employed in the public service (7.0%) is less than their relative weight within all industry sectors combined (13.3%), while for Francophones the reverse is true; they are over-represented (93%) compared to their relative weight in the overall workforce (86.5%). Statistics on the various public administrations—federal (including defence services), provincial and territorial, and local, municipal and regional—also reveal an under-representation of Anglophones and an over-representation of Francophones within each of these groups, especially within the provincial public service. Thus, in Quebec, the federal public service is comprised of 11.7% Anglophones and 88.2% Francophones. As for Quebec’s public service, Anglophones’ relative share is only 2.8% while Francophones constitute 97.2% of the workforce. Finally, Anglophones comprise 7.0% of all workers in the local, municipal and regional public administrations, compared to 93.0% for Francophones. The under-representation of Anglophones in the various levels of government was observed in all regions of Quebec. Moreover, although the Montréal and Outaouais regions have larger proportions of Anglophones working in the public administration sector than other regions of Quebec, these proportions are below this group’s relative share within the combined industry sectors in their respective regions. Thus, although Anglophones comprise 22.1% of all workers in the Montréal metropolitan area, their relative share is lower within the different levels of government in that region: federal (15.9%), provincial (4.9%) and municipal (7.2%). Conversely, whereas Francophones comprise 77.5% of the workforce of that region, they account for respectively 84%, 95% and 92.7% of employees in the federal, provincial, and municipal, local and regional governments. Similarly, in the Outaouais region, Anglophones comprise 17.3% of workers in all industrial sectors combined, but they account for respectively 15.5%, 6.7% and 8.7% of the workforce in the federal, provincial, and local or municipal governments. 4.6.1 Distribution within employment sectors by region of residence In Quebec, the distribution of Anglophones among the different employment sectors varies enormously from one region to another. Thus, it is not surprising that in the Outaouais and in Québec and surrounding area, respectively 18.6% and 11.9% of workers are employed in the public service, compared to 2.5% of Anglophones living in the other regions of the province (see table 4.6.1). Conversely, as the table shows, whereas there are proportionally fewer Anglophones in the Outaouais (5.3%) working in the manufacturing sector, in all other regions the relative proportion of these workers is much higher: for example, 20.3% in the Estrie and South of Quebec region and 14.4% in Montréal. Also, a large proportion (15.8%) of workers are employed in educational services in the region of Québec and surrounding area, more than double the figure for the Outaouais (6.0%) and a slightly larger proportion than in the other regions of Quebec. Finally, retail trade is a sector favoured by Anglophone workers (between 8.0% and 11.0%) in all regions.
37. In particular, see Jedwab (2008, p.16), Government of Quebec (2003) and Scowen (2007).

Portrait of Official-Language Minorities in Canada – Anglophones in Quebec
Statistics Canada – Catalogue no. 89-642-X 83
Table 4.6.1 Distribution of Anglophone workers (first official language spoken) among different industry sectors, by region of residence, Quebec, 2006
Total Quebec
number % number % number % number % number % number % number
Agriculture, forestry, fishing and hunting 1,307 0.3 1,199 14.4 961 2.8 2,438 9.1 180 1.8 1,452 5.3 7,537
Mining and oil and gas extraction 476 0.1 83 1.0 57 0.2 141 0.5 21 0.2 376 1.4 1,153
Utilities 838 0.2 43 0.5 121 0.3 22 0.1 22 0.2 200 0.7 1,245
Construction 14,111 3.0 627 7.5 2,275 6.5 1,249 4.7 367 3.6 1,633 5.9 20,263
Manufacturing 67,264 14.4 798 9.6 1,858 5.3 5,446 20.3 1,002 9.8 2,725 9.9 79,092
Wholesale trade 35,544 7.6 66 0.8 997 2.9 958 3.6 383 3.7 883 3.2 38,832
Retail trade 51,510 11.0 772 9.2 3,519 10.1 2,141 8.0 920 9.0 2,636 9.6 61,498
Transportation and warehousing 24,722 5.3 360 4.3 1,248 3.6 1,640 6.1 426 4.2 1,344 4.9 29,739
Information and cultural industries 16,042 3.4 86 1.0 774 2.2 350 1.3 265 2.6 393 1.4 17,909
Finance and insurance 22,347 4.8 107 1.3 759 2.2 702 2.6 319 3.1 369 1.3 24,603
Real estate and rental and leasing 9,908 2.1 41 0.5 497 1.4 403 1.5 111 1.1 413 1.5 11,373
Professional, scientific and technical services 44,632 9.5 177 2.1 2,331 6.7 1,224 4.6 771 7.5 1,121 4.1 50,256
Management of companies and enterprises 918 0.2 … 0.0 18 0.1 … 0.0 10 0.1 37 0.1 983
Administrative and support, waste management and remediation services 22,682 4.8 271 3.2 2,054 5.9 1,183 4.4 433 4.2 1,102 4.0 27,725
Educational services 36,835 7.9 778 9.3 2,099 6.0 2,383 8.9 1,616 15.8 2,545 9.2 46,255Health care and social assistance 40,769 8.7 882 10.6 2,848 8.2 2,074 7.7 786 7.7 3,669 13.3 51,028
Arts, entertainment and recreation 10,282 2.2 246 3.0 919 2.6 633 2.4 184 1.8 702 2.5 12,966
Accommodation and food services 37,174 7.9 786 9.4 2,968 8.5 1,782 6.6 839 8.2 2,148 7.8 45,697
Other services (except public administration) 22,186 4.7 335 4.0 1,996 5.7 1,194 4.5 381 3.7 1,015 3.7 27,108
Public administration 8,731 1.9 696 8.3 6,480 18.6 850 3.2 1,215 11.9 2,811 10.2 20,784
Total 468,276 100.0 8,353 100.0 34,780 100.0 26,815 100.0 10,251 100.0 27,575 100.0 576,049
Rest of Quebec
Estrie and South
Québec and surrounding
areaIndustry sectors (NAICS) Montréal East Outaouais
Note(s): NAICS = North American Industry Classification System. Source(s): Statistics Canada, 2006 Census of population.

Portrait of Official-Lan
guage Minorities in Canada – Anglophones in Quebec
Statistics Canada – Catalogue no. 89-642-X 84
4.6.2 Use of English at Obasiand 19%
work by industry sector
f all Quebec workers aged 15 and over, 40% (1,722,830) report using English “most often” or “on a regular s” at work. Of the 576,049 Anglophone workers, this proportion reaches nearly 92%, with 74% “most often”
“on a regular basis” (that is, less often than the predominant language).38 Nearly 66% (381,885) of Anglophones report using French “most often” or “on a regular basis” in their work, while almost 35% report “most often”, and almost 32% report “on a regular basis.” In all industry sectors, except utilities, most Anglophones in Quebec report using English “most often” at work. This umanag with 82% “mthose o
se varies from 61% in public administration to 84% in educational services. Anglophone workers in the ement of companies and enterprises sector come a close second as regards the use of English at work,
ost often” and 12% on a “regular basis”. However, Anglophone workers in the utilities sector are with the largest proportion who report using English at least on a regular basis at work, with 49% most
ften and 29% regularly.
38. Data from the Survey on the Vitality of Official-Language Minorities revealed that when respondents report using a language on a regular basis in addition to the one used most often, that use is daily.

Portrait of Official-Language Minorities in Canada – Anglophones in Quebec
Statistics Canada – Catalogue no. 89-642-X 85
Chart 4.6.2 Use of English most often or regularly at work among Anglophones by industry sector, Quebec, 2006
0 10 20 30 40 50 60 70 80 90 100
Agriculture, forestry, fishing and hunting
Mining and oil and gas extraction
Utilities
Construction
Manufacturing
Wholesale trade
Retail trade
Transportation and warehousing
Information and cultural industries
Finance and insurance
Real estate and rental and leasing
Porfessional, scientific and technical services
Management of companies and enterprises
Administrative and support, etc.1
Educational services
Health care and social assistance
Arts, entertainment and recreation
Accommodation and food services
Other services (except public administration)
Public administration
pourcentage
Most often Regularly
1. Administrative and support, waste management and remediation services. Source(s): Statistics Canada, 2006 Census of population. 4.6.3 Income differentials Historically, Anglophones in Canada—especially those of Anglo-Saxon origin—have enjoyed advantages in economic terms (income, education level, occupational structure, etc.).39 Anglophones in Quebec long constituted an elite within English-speaking Canada. Since individuals' income level is highly dependent on their education level, their occupation and the industrial sector in which they work (to name only these factors), it would appear that the substantial changes that Quebec's Anglophone and Francophone communities have undergone over the past forty years have had major effects on their income level.
39 For example, see Porter (1965), Pineo (1977) and Curtis and Scott (1979).

Portrait of Official-Language Minorities in Canada – Anglophones in Quebec
Statistics Canada – Catalogue no. 89-642-X 86
Quebec society has undergone major transformations—cultural, social, economic and demographic—since the 1960s, and these have led to a major diversification of its population. Anglo Quebecers are no exception to this change, in that the ethnic makeup of this group, which was essentially composed of persons of Anglo-Saxon origin at the beginning of the twentieth century, has seen its population diversify considerably, especially in the past thirty years. In 2006, 37% of the roughly 320,000 immigrants who are a part of Quebec’s English-speaking population were born in Europe, compared to 38% who were born in Asia or the Middle East. Among the immigrants who settled in Canada between 2001 and 2006, the corresponding proportions were 19% and 53% respectively. It is beyond the purpose and scope of this report to analyse the factors that have influenced how income differentials between the language groups have evolved. However, statistics from the 2006 Census indicate that the income gap between Anglophones and Francophones has narrowed over time. On the one hand, the major changes that Quebec society has undergone since the Quiet Revolution have considerably improved the status and socioeconomic position of Francophones within Quebec Society. On the other hand, the departure of many Anglophones from the province during the 1970s, along with the arrival of a growing number of international immigrants, many of them from developing countries, have affected the demographic, ethnic and socioeconomic makeup of this language group. A contrasted picture emerges when median and mean incomes of Anglophones and Francophones are compared. The 2006 statistics reveal that the mean income of persons with English as their only first official language spoken (FOLS) is $3,080 higher than that of persons with French as their sole FOLS, whereas the median income of Anglophones is $1,806 lower than that of Francophones. The difference is even greater when the data are broken down by sex: $3,900 for males and $2,200 for females (see table 4.6.2). If the criterion used is mother tongue rather than FOLS, the gap is even wider. The English-mother-tongue population has a mean income $4,760 higher than that of the French-mother-tongue population, while Anglophones’ median income is $820 lower than that of Francophones (data not in tables). These findings suggest that income differences are larger within the Anglophone group than within the Francophone group, with a larger number of Anglophones reporting a high income. And indeed, the 2006 Census data on income show that 4.0% of persons with English as the only first official language spoken earned an income of $100,000 or over compared to 2.3% of those with French as the only FOLS. Among males, the corresponding proportions are 6.4% and 3.7% respectively. On the other hand, 23% of Anglo Quebecers have an annual income under $10,000, compared to 19% of Francophones. When the low-income threshold is used, it emerges that 22% of Anglophones have an income that puts them below the low-income threshold, compared to 16% of Francophones.40 In the Montréal metropolitan area, these proportions are 23% and 19% respectively. Another finding is that the mean and median incomes of persons with both English and French as first official languages spoken are much lower than those of persons in the other two groups. For the population with a dual FOLS, the lower incomes would seem to be explained by the fact that these people are mainly immigrants. Numerous studies have already shown that despite a higher education level, immigrants have a higher unemployment rate and lower income levels than their Canadian-born counterparts.
40. These figures are for income before tax. For after-tax income, the proportions are 16.5% and 11.4% respectively.

Portrait of Official-Language Minorities in Canada – Anglophones in Quebec
Statistics Canada – Catalogue no. 89-642-X 87
Table 4.6.2 Average and median income for females and males by first official language spoken, Quebec, 2006
Average income
Median income
Average income
Median income
English 28,011 20,140 42,374 27,008
French 25,808 20,052 38,457 30,854
English and French 22,297 16,577 28,687 20,789
Total 25,870 19,828 38,509 30,074
dollar
First official language spoken
MalesFemales
Source(s): Statistics Canada, 2006 Census of population. In light of the historical context described above, we know that the median and mean incomes of the two language groups are a function of age, with older Anglophones having a higher median and mean income than older Francophones. The statistics shown in chart 4.6.3-a and 4.6.3-b reflect the fact that for both males and females for whom English is the first official language spoken, the median income of those aged 65 and over is higher than that of Francophones: $3,400 for males and $2,500 for females. Among persons aged 25 to 64, the opposite is true, with a gap of between $4,000 and $5,000 depending on the age group. On the other hand, charts 4.6.3-c and 4.6.3-d show that the gaps between the mean incomes of Anglophone and Francophone males are much larger for those aged 65 and over ($14,600 in favour of Anglophones) and those aged 45 to 64 (nearly $7,500 in favour of Anglophones). Lastly, for those aged 25 to 44, the gap between the mean incomes of the two groups is practically non-existent. A similar phenomenon is observed for females, although the income gaps are smaller. When the analysis is pushed further, using the technique of multivariate statistical analysis, it becomes clear that caution is called for when comparing incomes between the two language groups, because of the many factors that influence these gaps. In fact, while the results on the population as a whole reveal that the mean incomes of Anglophones are higher than those of Francophones (table 4.6.2), it emerges that certain key factors explain these gaps. Thus, an analysis of the data on the average employment incomes of males in the labour force reveals that Francophones have a higher mean income than their Anglophone counterparts when controlling for age, education level, region of residence, industry sector and immigrant status (results not in table). The income gap is larger if the criterion used is mother tongue ($2,700) rather than first official language spoken ($1,900). For females, the gaps are smaller, at $700 and $300 respectively. In other words, a large part of the gap observed between the mean incomes of Anglophones and Francophones is related to differences in age structure, education level, region of residence, industry sector and immigrant status.

Portrait of Official-Language Minorities in Canada – Anglophones in Quebec
Statistics Canada – Catalogue no. 89-642-X 88
Chart 4.6.3- a Median income for females by age group and first official language spoken, Quebec, 2006
0
5,000
10,000
15,000
20,000
25,000
30,000
15 to 24 years 25 to 44 years 45 to 64 years 65 years andover
age group
dolla
r
English French English and French
Source(s): Statistics Canada, 2006 Census of population.
Chart 4.6.3- b Median income for males by age group and first official language spoken, Quebec, 2006
0
5,000
10,000
15,000
20,000
25,000
30,000
35,000
40,000
15 to 24 years 25 to 44 years 45 to 64 years 65 years andover
age group
dolla
r
English French English and French
Source(s): Statistics Canada, 2006 Census of population.

Portrait of Official-Language Minorities in Canada – Anglophones in Quebec
Statistics Canada – Catalogue no. 89-642-X 89
Chart 4.6.3- c Average income for females by age group and first official language spoken, Quebec, 2006
0
5,000
10,000
15,000
20,000
25,000
30,000
35,000
40,000
15 to 24 years 25 to 44 years 45 to 64 years 65 years andover
age group
dolla
r
English French English and French
Source(s): Statistics Canada, 2006 Census of population.
Chart 4.6.3- d Average income for males by age group and first official language spoken, Quebec, 2006
0
10,000
20,000
30,000
40,000
50,000
60,000
15 to 24 years 25 to 44 years 45 to 64 years 65 years andover
age group
dolla
r
English French English and French
Source(s): Statistics Canada, 2006 Census of population.

Portrait of Official-Language Minorities in Canada – Anglophones in Quebec
Statistics Canada – Catalogue no. 89-642-X 90
Section 5 Subjective vitality As has been seen thus far, Anglophones in Quebec do not necessarily form a homogeneous group. We have seen, for example, that they are distributed across various regions of the province, some bordering Ontario; that they live in municipalities in which the proportional weight of their language group varies from one region to another of the province; and that the extent to which they use English in various domains of the private and public spheres depends on a number of factors, some of them of a demo-linguistic nature. This said, the Survey on the Vitality of Official-Language Minorities (SVOLM) results bring out one noteworthy element regarding the degree to which Anglophones identify with one or the other of the province’s two main language groups: the presence of a sense of dual identification with the Anglophone and Francophone groups. These results are noteworthy insofar as issues related to identity are likely to play a role in Anglophones’ sense of belonging to Quebec society. The Survey on the Vitality of Official-Language Minorities (SVOLM) results show that while a majority of Anglophones in Quebec identify with the Anglophone group, a sizable proportion of them identify with both language groups. Approximately 55% reported identifying “mainly” or “only” with the Anglophone group, compared to 37% who reported identifying with both the Anglophone and Francophone groups. An important contrast emerges when Anglo Quebecers with only English as the first official language spoken (FOLS) are distinguished from those having both French and English as FOLS: 59% of the former reported identifying only or mainly with the Anglophone group, compared to 19% of the latter. As to dual identification with the Anglophone and Francophone groups, 35% of the former report this, compared to 52% of the latter. The degree of identification with the two main language groups also varies from one region of Quebec to another (see chart 5.1). As may be seen, Anglophones are more likely to identify primarily with the Anglophone group if they live in the regions of Montréal, the Outaouais and Estrie and South of Quebec, while in the Anglophone population of Québec and surrounding area, only 31% report identifying “only” or mainly” with the Anglophone group. The corollary of these findings is that dual identification with the Francophone and Anglophone groups is highest in Québec and surrounding area (54%) and East of Quebec (50%) while its level in the Montréal metropolitan area is 35%.

Portrait of Official-Language Minorities in Canada – Anglophones in Quebec
Statistics Canada – Catalogue no. 89-642-X 91
Chart 5.1 Percentage of Anglophones by identification to Anglophone and Francophone groups, Quebec and regions, 2006
0
10
20
30
40
50
60
70
80
90
100
Montréal East Outaouais Estrie andSouth
Québec andsurrounding
area
Rest ofQuebec
TotalQuebec
perc
enta
ge
Only to Anglophone group Mainly to Anglophone group Both groups equally
Mainly to Francophone group Only to Franchophone group
Note(s): Please refer to appendix B to obtain quality indicators (coefficient of variation (CV)) for the estimates used to produce this chart. Source(s): Statistics Canada, Survey on the Vitality of Official-Language Minorities, 2006. The sense of belonging and identity are highly complex concepts. Depending on the circumstances, people may identify with their country, their language, their culture, etc. The feeling of belonging to both the Anglophone and Francophone groups, reported by some Anglo Quebecers, suggests that in many cases, immersion in the predominantly French culture and public life may have contributed to the emergence of a phenomenon that combines an appreciation of and an identification with the Francophone cultural and linguistic heritage, and with language practices that reflect the elevated status of English in Montréal, Canada and North America. However, to verify and analyse this hypothesis goes beyond the scope of this analytical report and the limitations of the SVOLM in this regard. Even so, there are several indications that Anglophones in Quebec assign definite value to both English and French. When asked, “How important is it to you that your children be able to speak French?”, 95% of Anglo Quebecers with one or more children living in the household reported that it was “very important” or “important,” a proportion only slightly lower than the responses to the same question on the importance of their children being able to speak English (99%). Of course, a large proportion of Quebec Anglophones (88%) reported that it was “very important” or “important” to them to be able to use English in their daily life. But of those who were able to conduct a conversation in French, 76% also reported that it was “very important” or “important” to them to be able to use French in their daily life. In this regard, it is worth noting that 74% of Anglo Quebecers with English as first official language spoken (FOLS) feel this way, compared to 85% of those with both French and English as FOLS.

Portrait of Official-Language Minorities in Canada – Anglophones in Quebec
Statistics Canada – Catalogue no. 89-642-X 92
The importance assigned to the Anglophone community and English is evident in the following results: nearly eight Anglophones in ten assign importance to having individuals or organizations work on the development of the Anglophone community, 94% feel the same way about government services being provided in English and lastly, 96% assign importance to linguistic rights being respected in their province (see chart 5.2). There is little variation from one region of the province to another in the responses to these questions. Chart 5.2 Percentage of Anglophones by certain indicators of the value assigned to the English language, Quebec and regions, 2006
0
10
20
30
40
50
60
70
80
90
100
Mon
tréa
l
Eas
t
Ou
tao
uais
Est
rie a
nd
Sou
th
Qu
ébe
c an
dsu
rrou
ndin
gar
ea
Res
t of
Que
bec
Tot
alQ
ueb
ec
Mon
tréa
l
Eas
t
Ou
tao
uais
Est
rie a
nd
Sou
th
Qu
ébe
c an
dsu
rrou
ndin
gar
ea
Res
t of
Que
bec
Tot
alQ
ueb
ec
Mon
tréa
l
Eas
t
Ou
tao
uais
Est
rie a
nd
Sou
th
Qu
ébe
c an
dsu
rrou
ndin
gar
ea
Res
t of
Que
bec
Tot
alQ
ueb
ec
Importance that services are offered in English Importance that linguistic rights are respected Importance that individuals or organizations work atthe development of community
perc
ent
age
Very important Important
Source(s): Statistics Canada, Survey on the Vitality of Official-Language Minorities, 2006.

Portrait of Official-Language Minorities in Canada – Anglophones in Quebec
Statistics Canada – Catalogue no. 89-642-X 93
The Survey on the Vitality of Official-Language Minorities collected data on subjective perceptions regarding past and future changes in the presence of the minority language in the community of residence and the vitality of the minority official-language community. On this subject, it is interesting to note that even though fewer Anglophones left Quebec between 2001 and 2006 compared to the preceding five-year period, and even though the proportion of French-mother-tongue persons on the Island of Montréal fell below the 50% mark for the first time in almost a century and half41 and Francophones appear to be concerned about the situation of French in Montréal, 38% of Anglo Quebecers (34% of those living in the Montréal region) reported that the presence of English in their municipality had declined in the past ten years (from 1996 to 2006) whereas only 16% reported that it had increased. When asked how the presence of English would evolve in their municipality in the next ten years, 38% of Anglo Quebecers (and Anglo Montréalers) stated that it would diminish (see chart 5.3). Beyond an examination of the demolinquistic situation in Quebec and the fit between reality and perceptions, it seems clear that Anglo Quebecers are showing some anxiety about the presence of English in their municipality. Chart 5.3 Percentage of Anglophones by the perception of the evolution of English in the municipality of residence, Quebec and regions, 2006
0
10
20
30
40
50
60
70
80
90
100
Montréal East Outaouais Estrie and
South
Québecand
surroundingarea
Restof
Quebec
TotalQuebec
Montréal East Outaouais Estrieand
South
Québecand
surroundingarea
Restof
Quebec
TotalQuebec
Last 10 years Next 10 years
perc
enta
ge
Increased or will increase Same Decreased or will decrease
Source(s): Statistics Canada, Survey on the Vitality of Official-Language Minorities, 2006.
41. The 1851-1852 Census included a question on ethnic origin, not on mother tongue. French Canadians then represented 45% of the population of Montréal.

Portrait of Official-Language Minorities in Canada – Anglophones in Quebec
Statistics Canada – Catalogue no. 89-642-X 94
The Survey on the Vitality of Official-Language Minorities (SVOLM) also asked Anglo Quebecers to indicate how strong or weak the presence of English was in various sectors (businesses and stores, the media and government services) in their municipality. On this score, 42% of them stated that this presence was “very strong” or “strong” in stores and businesses, nearly 62% in media, 42% in locally provided federal government services and 24% in locally provided Quebec government services. The survey yielded results on perceptions regarding the presence of English in various areas of daily life and its evolution in the municipality in the past ten years and in the coming decade. These results appear to indicate concerns on the part of Anglophones in Quebec. However, do perceptions regarding the presence of English and the place that it occupies in the municipality of residence coincide with perceptions regarding the vitality of the Anglophone “community” as seen by Anglo Quebecers themselves? When Anglophones in Quebec were asked to describe the vitality of the Anglophone community in their municipality, 43% stated that it was “strong” or “very strong,” 26% that it was “weak” or “very weak” and 28% that it was neither strong nor weak. There were some regional variations (see chart 5.4). For example, in the region of Québec and surrounding area (51%) and in the “Rest of Quebec” (43%), Anglophones were proportionally more likely to describe the vitality of their language community as “weak” or “very weak,” while those in the East of Quebec (51%) and the Outaouais (48%) were more likely to describe it as “strong” or “very strong.” Chart 5.4 Percentage of Anglophones by the perception of the vitality of the English-speaking community in the municipality of residence, Quebec and regions, 2006
0
10
20
30
40
50
60
70
80
90
100
Montréal East Outaouais Estrie andSouth
Québec andsurrounding
area
Rest ofQuebec
TotalQuebec
perc
enta
ge
Strong or very strong Neither strong nor weak Weak or very weak
Source(s): Statistics Canada, Survey on the Vitality of Official-Language Minorities, 2006.

Portrait of Official-Language Minorities in Canada – Anglophones in Quebec
Statistics Canada – Catalogue no. 89-642-X 95
A noteworthy phenomenon highlighted by the SVOLM data is that the subjective assessment of the vitality of the Anglophone community within the municipality or residence depends, among other things; on the proportional weight of the Anglophone group and its average level of geographic concentration within the municipality (see chart 5.5). Thus, in general, the greater the relative weight of the Anglophone group within the municipality, the greater the inclination of Anglophones to state that the vitality of their community is “strong” or “very strong.” However, data on the average concentration of Anglophones within their municipality show that even when this concentration is high (a situation experienced by nearly three Anglophones in four in the province), less than one Anglophone in two (47%) describes the vitality of the Anglophone community in their municipality as being “strong” or “very strong.” Chart 5.5 Percentage of Anglophones who describe the vitality of their language community in their municipality as being strong or very strong by the proportion and the concentration of this minority in its municipality, Quebec, 2006
0
10
20
30
40
50
60
70
80
90
0 to 9% 10 to29%
30 to49%
50 to69%
70%and over
High Medium Weak
proportion concentration
perc
ent
age
Source(s): Statistics Canada, Survey on the Vitality of Official-Language Minorities, 2006.

Portrait of Official-Language Minorities in Canada – Anglophones in Quebec
Statistics Canada – Catalogue no. 89-642-X 96
Conclusion This demolinguistic portrait of Quebec Anglophones contains considerable and varied information on the characteristics, practices and perceptions of this language group. Of all this information, what stands out? While the following items are not a complete list of the key points contained in this report, a general picture emerges
8,256 persons
Anglophones toward other Canadian provinces is the main factor responsible for the small fluctuation of
and 13.4% (995,000) when half the population with both French and English as FOLS is included. This is a sizable difference, in comparison
Montréal Census Metropolitan Area (CMA) account for 80.5% (or 801,000 persons) of Quebec’s Anglophone population, and their relative
6, the proportion of English-French and English-“other”-language exogamous couples among couples with at least one partner of English mother tongue greatly increased in Quebec, going from
from the .
1. Quebec’s English-mother-tongue population was 607,165 persons in 2006 compared to 55
m
in 9 1 51, an increase of 8.8%. By comparison, the French-mother-tongue population grew by 76.8% to 5,916,845 in 2006 while the population with a mother tongue other than English or French increased more than five-fold (506.3%), totalling 911,895 in 2006 compared to just over 150,000 in 1951. The migration of
the size of the English-mother tongue population.
2. The criterion of the first official language spoken (FOLS) offers a more inclusive definition of the Anglophone population. The English FOLS population’s relative share is 11.9% (885,000) excluding those having French and English as a double first official language,
with the 607,000 persons who have English as their mother tongue. Such a difference is mainly the result of a significant historical attraction to the English language among immigrants that settled in Quebec.
3. While the proportion of Anglophones within the Quebec population is 13.4% province-wide, the geographic distribution of this group is quite uneven. Three regions of the province account for nearly 92% (or 911,000 persons) of the Anglophone population. Thus, Anglophones in the
share within the population of that CMA is 22%. In other words, 22% of the population residing in the Montréal CMA has English as its FOLS.
4. The change over time in the age structure of the Anglophone population of Quebec reflects the ageing of
the population, and it results from the combined effect of a fertility rate below the replacement level and of a sizable negative net migration, particularly during the 1970s, benefiting other provinces, especially Ontario.
5. From 1971 to 200
25% to 46% and from 5% to 13% respectively during this same period.
6. Because of the strong increase in the proportion of English-French exogamous couples from 1971 to 2006, a drop is observed in the rate of transmission of English to children under 18 years of age born from such couples. Thus, 34% of children of French-English couples were transmitted English as a mother tongue at the time of the 2006 Census, while the corresponding proportion was 51% in 1971.
7. Language transfers are proportionally more numerous in Quebec among persons with other mother
tongues than among Anglophones or Francophones. Whereas in the other provinces, the language transfers made by allophones are primarily toward English, in Quebec they are equally divided between French and English. Thus, in 2006, 50% of allophones who had made a language transfer were mainly
he public and private spheres reveals differences between the population whose first official language spoken is English and the population with
ith a dual first official language spoken, English is the language most often used when consuming media, whereas French is most often used in the public sphere, and the use of an “other” language predominates at home. However, in all domains there is considerable use of both English and French by the English-French FOLS population.
using French at home while 48% were mainly using English.
8. An examination of language practices in various domains in t
both English and French as first official languages spoken. In the English-speaking population, English is greatly predominant in both these spheres. In the population w

Portrait of Official-Language Minorities in Canada – Anglophones in Quebec
Statistics Canada – Catalogue no. 89-642-X 97
9. Because of the strong concentration of Anglophones in the Montréal region and the proximity of Ontario in
the case of the Outaouais region, the proportions of non-Anglophones who can conduct a conversation in English are high in both those regions. In Quebec as a whole, more than one-third of non-Anglophones can conduct a conversation in English. This proportion is 60% in the Outaouais region and 47% in Montréal.
10. In 2006, more than 68% of persons with English as their mother tongue were born in Quebec, compared to
just nearly 57% of those for whom English is the first official language spoken.
11. It is noteworthy that 40% of all Canadian Anglophones born in Quebec and having English as their first official language spoken were living outside that province in 2006—27% in Ontario and 14% elsewhere in Canada.
12. In Quebec, the proportion of immigrants varies enormously from one language group to another. It is within
the English-French FOLS population that immigrants are proportionally most numerous, at 73.8% in 1971 compared to 68.6% in 2006. Within the English only FOLS population, the corresponding proportions are 25.2% and 28.0% respectively. Within the French FOLS group, the portion consisting of immigrants has changed little, since it was 2.8% in 1971 and 6.6% 35 years later.
13. Since 1976, the Anglophone population in Quebec with English as first official language spoken has
undergone major migratory losses to other provinces and territories. The migration of this population from Quebec to other provinces and territories peaked during the five-year period from 1976 to 1981: more than 151,000 persons left Quebec, while only slightly more than 28,000 persons went there to settle, this resulted in a negative net figure of 123,000 persons. From 1976 to 2006, 307,000 more Anglophones left Quebec than Anglophones migrated from other provinces to Quebec.
14. Among persons whose first official language is English, it is English that is most often used in all domains
of the private and public spheres. Although 80% of persons reported using English almost exclusively at home, it is in the consumption of media that English is most widespread. In that domain, 97% of the English FOLS population use English most often (alone or with another language). English is equally spoken most often with friends by 87% of Anglophones. While nearly 60% of Anglophones use English predominantly in their immediate network or in institutions or stores, the proportion who does so in the workplace is 53%. The use of English in the various domains of the public sphere varies from one region of the province to another; it is in the Montreal and the Outaouais regions that the use of this language is most widespread.
15. In the 2006 Census, 86% of doctors working in Quebec, or 9,025, reported being able to conduct a
conversation in English, while 51% reported using English at least on a regular basis in their work. For nurses, the number was 61,320 in 2006, and the proportions were 45% and 37% respectively.
16. The Survey on the Vitality of Official-Language Minorities (SVOLM) results show that the majority of Anglophones in Quebec report using English when consulting the different health care professionals about whom information was collected in the SVOLM, namely family doctors, nurses, and professionals in other places where health care services are provided. However, the proportions vary from one region to another. Also, consultations of the telephone health line (Info-Santé) professionals take place more often in French: province-wide, only 43% of Quebec Anglophones use English with these professionals.
17. While the number of police officers who report using English at work is much higher than the number of
Anglophone police officers, the SVOLM results show that Quebec Anglophones’ interactions with the municipal police and the provincial police are generally in French.
18. In all regions of the province, the use of English predominates in interactions with lawyers, except in the
Québec and surrounding area and the “Rest” of Quebec regions.

Portrait of Official-Language Minorities in Canada – Anglophones in Quebec
Statistics Canada – Catalogue no. 89-642-X 98
19. French immersion programs have increasingly gained in popularity among Quebec Anglophone parents in
Quebec since their inception in the 1960’s. In demanding for better French second language teaching programs, Anglophone parents in Quebec have seen to it that their children’s level of bilingualism increased substantially.
20. The growth of English-French exogamous unions explains in part the fact that many Anglophone parents
chose to register their children in a French language school. According to data from the SVOLM, 40 % of children whose parent has English as his/her mother tongue live in English endogamous families. Nearly half of them live in English-French exogamous families.
21. The Survey on the Vitality of Official-Language Minorities (SVOLM) results also show that attendance of an English school appears to be a more popular choice at the secondary level. These results indicate that there is considerable exposure to French at the pre-school and kindergarten level (53%) and at the elementary level (48% in a French school and 32% in a French immersion program in an English school). In fact, at the elementary level, only 17% of young Anglophones are enrolled in a regular program in English, compared to 38% at the secondary level.
22. Statistics on diplomas, certificates or degrees obtained at the postsecondary level also reveal that there is a sizable gap in university degrees or diplomas in favour of Anglophones: almost 25% of the latter have such a degree or diploma, compared to slightly more than 15% of Francophones.
23. Within both the Anglophone and Francophone groups, immigrants are generally more likely to have a
university diploma, one reason being that education level is one of the selection criteria for immigrants to Canada. In 2006, among Anglophones aged 25 to 34, 46% of those born outside Canada had a university diploma, compared to 41% of those born in another province (in most cases, Ontario) while 31% of Anglophones born in Quebec had such a diploma.
24. A brief analysis of 2006 Census data reveals that Anglophones in Quebec are proportionally more likely
than Francophones to work in certain sectors, such as professional, scientific and technical services, administrative and management services, or wholesale trade.
25. Statistics on the various public administrations—federal (including defence services), provincial and
territorial, and local, municipal and regional—also reveal an under-representation of Anglophones and an over-representation of Francophones within each of these groups, especially within the provincial public service. Thus, in Quebec, the federal public service is comprised of 11.7% Anglophones and 88.2% Francophones. As for Quebec’s public service, Anglophones’ relative share is only 2.8% while Francophones constitute 97.2% of the workforce.
26. The 2006 Census data on income show that income differences are larger within the Anglophone group
than within the Francophone group, with a larger proportion of Anglophones reporting an income of $100,000 and over and a larger proportion found below the low-income threshold.
27. When Anglophones in Quebec were asked to describe the vitality of the Anglophone community in their
municipality, 43% stated that it was “strong” or “very strong,” 26% that it was “weak” or “very weak” and 28% that it was neither strong nor weak.

Portrait of Official-Language Minorities in Canada – Anglophones in Quebec
Statistics Canada – Catalogue no. 89-642-X 99
Geographical maps The maps presented in this section are of two types. Most of them illustrate the proportion that Anglophones represent within a given geographic area, whereas those showing the Census Metropolitan Area (CMA) of Montréal illustrate the distribution of this population on the whole territory of this CMA

Portrait of Official-Language Minorities in Canada – Anglophones in Quebec
Statistics Canada – Catalogue no. 89-642-X 100
Map 1.1 Percentage of the population with English as first official language spoken (with random distribution of the English–French category) among census subdivisions, Quebec, 2006.
Note(s): The random distribution of the “English-French” category was implemented with the help of SAS software (RANUNI command) to
attribute half of this category to the “English” group Source(s): Statistics Canada, 2006 Census of population.

Portrait of Official-Language Minorities in Canada – Anglophones in Quebec
Statistics Canada – Catalogue no. 89-642-X 101
Map 1.2 Percentage of the population with English as first official language spoken (with random distribution of the English–French category) among census subdivisions in the region of Montreal, Quebec, 2006
Source(s): Statistics Canada, 2006 Census of population.

Portrait of Official-Language Minorities in Canada – Anglophones in Quebec
Statistics Canada – Catalogue no. 89-642-X 102
Map 1.3 Distribution of Anglophones (first official language spoken) within the Census Metropolitan Area of Montreal by Census Tract, 2006
Note(s): The scale refers to the proportion the Anglophone population of a given census tract represents within the overall Anglophone
population of the Census metropolitan area Source(s): Statistics Canada, 2006 Census of population.

Portrait of Official-Language Minorities in Canada – Anglophones in Quebec
Statistics Canada – Catalogue no. 89-642-X 103
Map 1.4 Percentage of the population with English as first official language spoken (with random distribution of the English–French category) among census subdivisions in the region of East of Quebec, 2006
Source(s): Statistics Canada, 2006 Census of population.

Portrait of Official Language Minorities in Canada – Anglophones in Quebec
Statistics Canada – Catalogue no. 89-642-X 104
Map 1.5 Percentage of the population with English as first official language spoken (with random distribution of the English–French category) among census subdivisions in the region of Outaouais in Quebec, 2006
Source(s): Statistics Canada, 2006 Census of population.

Portrait of Official-Language Minorities in Canada – Anglophones in Quebec
Statistics Canada – Catalogue no. 89-642-X 105
Map 1.6 Percentage of the population with English as first official language spoken (with random distribution of the English–French category) among census subdivisions in the region of Estrie and South of Quebec, 2006
Source(s): Statistics Canada, 2006 Census of population.

Portrait of Official-Language Minorities in Canada – Anglophones in Quebec
Statistics Canada – Catalogue no. 89-642-X 106
Map 1.7 Percentage of the population with English as first official language spoken (with random distribution of the English–French category) among census subdivisions in the region of Québec and surrounding area, Quebec, 2006
Source(s): Statistics Canada, 2006 Census of population.

Portrait of Official-Language Minorities in Canada – Anglophones in Quebec
Statistics Canada – Catalogue no. 89-642-X 107
Appendix A
Table A-1 Anglophone population (first official language spoken) in Quebec by region and census division, 2006
Region, census division and census subdivisionProportion of anglophones
Number of anglophones
Montreal1 25.6 800,555
D'Autray 1.3 528
Lavaltrie 2.0 243
Rouville 2.1 663
Richelieu 1.6 80
Saint-Mathias-sur-Richelieu 5.2 233
La Vallée-du-Richelieu 4.7 4,945
Chambly 6.1 1,378
Carignan 6.9 510
Saint-Basile-le-Grand 3.4 528
McMasterville 2.9 150
Otterburn Park 8.3 700
Mont-Saint-Hilaire 4.8 748
Beloeil 3.7 690
Saint-Mathieu-de-Beloeil 2.2 50
Longueuil 14.4 54,805
Brossard 31.1 22,003
Saint-Lambert 20.1 4,235
Boucherville 3.5 1,333
Saint-Bruno-de-Montarville 12.2 2,945
Longueuil 10.7 24,293
Lajemmerais 1.7 1,178
Sainte-Julie 1.9 558
Saint-Amable 1.8 153
Varennes 1.7 350
Verchères 1.3 68
L'Assomption 1.7 1,900
Charlemagne 1.6 90
Repentigny 2.0 1,505
Saint-Sulpice 1.4 45
L'Assomption 1.3 210
L'Épiphanie 0.4 20
L'Épiphanie 0.8 25

Portrait of Official-Language Minorities in Canada – Anglophones in Quebec
Statistics Canada – Catalogue no. 89-642-X 108
Table A-1 Anglophone population (first official language spoken) in Quebec by region and census division, 2006 (continued)
Region, census division and census subdivisionProportion of anglophones
Number of anglophones
Les Moulins 3.4 4,350
Terrebonne 3.4 3,173
Mascouche 3.5 1,178
Laval 18.8 68,460
Laval 18.8 68,460
Montréal 32.7 595,920
Montréal-Est 5.8 215
Montréal 27.7 441,020
Westmount 72.4 14,330
Montréal-Ouest 80.1 4,140
Côte-Saint-Luc 73.6 22,268
Hampstead 79.1 5,530
Mont-Royal 41.1 7,670
Dorval 61.9 11,073
Pointe-Claire 71.3 21,318
Kirkland 69.8 14,295
Beaconsfield 68.4 13,045
Baie-D'Urfé 74.8 2,910
Sainte-Anne-de-Bellevue 52.8 2,518
Senneville 62.3 595
Dollard-Des Ormeaux 71.9 34,985
Roussillon 13.9 20,690
Saint-Mathieu 6.6 125
Saint-Philippe 4.1 210
La Prairie 6.3 1,358
Candiac 14.3 2,285
Delson 9.1 665
Sainte-Catherine 4.0 640
Saint-Constant 6.3 1,498
Saint-Isidore 4.2 103
Mercier 6.7 675
Châteauguay 30.2 12,673
Léry 19.4 463
Beauharnois-Salaberry 3.3 1,960
Beauharnois 3.7 438

Portrait of Official-Language Minorities in Canada – Anglophones in Quebec
Statistics Canada – Catalogue no. 89-642-X 109
Table A-1 Anglophone population (first official language spoken) in Quebec by region and census division, 2006 (continued)
Region, census division and census subdivision Proportion of anglophones
Number of anglophones
Vaudreuil-Soulanges 25.6 30,583Saint-Zotique 3.5 185Les Coteaux 5.9 220Coteau-du-Lac 3.0 188Les Cèdres 7.8 445
9.3 sedacsaC-sed-etnioP 40L'Île-Perrot 21.6 2,123Notre-Dame-de-l'Île-Perrot 25.4 2,508Pincourt 42.2 4,705Terrasse-Vaudreuil 27.3 540
6.22 noiroD-liuerduaV 5,735Vaudreuil-sur-le-Lac 21.7 280L'Île-Cadieux 61.5 80Hudson 77.1 3,920Saint-Lazare 43.3 7,365
Deux-Montagnes 7.9 6,855Saint-Eustache 4.4 1,838Deux-Montagnes 20.1 3,475Sainte-Marthe-sur-le-Lac 7.8 883Pointe-Calumet 2.8 185Saint-Joseph-du-Lac 4.7 233Oka 6.1 200Saint-Placide 2.2 35
Thérèse-De Blainville 6.7 9,545Boisbriand 7.4 1,948Sainte-Thérèse 5.0 1,253
3.4 ellivnialB 2,010Rosemère 20.5 2,870Lorraine 10.7 1,028Bois-des-Filion 2.2 183Sainte-Anne-des-Plaines 2.0 250
Mirabel 1.9 660Mirabel 1.9 660
La Rivière-du-Nord 2.5 2,535Saint-Colomban 4.0 405Saint-Jérôme 1.8 1,150
Argenteuil 19.3 5,683Gore 40.9 630
1. Only the census subdivisions that form part of the Montreal CMA are included. The observed difference between the total number for the region and the sum of the total of each of the census divisions is the result of random rounding.
Source(s): Statistics Canada, 2006 Census of population.

Portrait of Official-Language Minorities in Canada – Anglophones in Quebec
Statistics Canada – Catalogue no. 89-642-X 110
Table A-2 Anglophone population (first official language spoken) in Quebec by region and census division, 2006
Region, census division and census subdivisionProportion of anglophones
Number of anglophones
East1 4.3 16,413
Les Îles-de-la-Madeleine 6.7 873
Le Rocher-Percé 7.6 1,385
La Côte-de-Gaspé 11.6 2,038
La Haute-Gaspésie 0.4 53
Bonaventure 16.1 2,863
Avignon 15.9 2,290
La Matapédia 0.4 70
Matane 0.7 145
La Mitis 1.1 215
Rimouski-Neigette 0.8 438
Les Basques 0.2 23
Rivière-du-Loup 0.4 143
Témiscouata 0.7 140
Kamouraska 0.5 115
La Haute-Côte-Nord 0.3 40
Manicouagan 0.8 265
Sept-Rivières--Caniapiscau 4.3 1,655
Minganie--Basse-Côte-Nord 31.2 3,665 1. The observed difference between the total number for the region and the one shown in table 2.3.1 is mainly the result of random rounding. Source(s): Statistics Canada, 2006 Census of population.
Table A-3 Anglophone population (first official language spoken) in Quebec by region and census division, 2006
Region, census division and census subdivisionProportion of anglophones
Number of anglophones
Outaouais1 17.4 58,715
Papineau 5.5 1,175
Gatineau 14.3 34,290
Les Collines-de-l'Outaouais 27.3 11,408
La Vallée-de-la-Gatineau 16.5 3,358
Pontiac 58.8 8,485 1. The observed difference between the total number for the region and the one shown in table 2.3.1 is mainly the result of random rounding. Source(s): Statistics Canada, 2006 Census of population.

Portrait of Official-Language Minorities in Canada – Anglophones in Quebec
Statistics Canada – Catalogue no. 89-642-X 111
Table A-4 Anglophone population (first official language spoken) in Quebec by region and census division, 2006
Region, census division and census subdivisionProportion of anglophones
Number of anglophones
Estrie and South1 8.7 51,204
Le Granit 1.4 320
Asbestos 3.8 535
Le Haut-Saint-François 11.2 2,395
Le Val-Saint-François 8.7 2,495
Sherbrooke 5.1 7,390
Coaticook 11.6 2,098
Memphrémagog 18.7 8,348
Brome-Missisquoi 24.3 11,053
La Haute-Yamaska 4.3 3,630
Acton 1.6 233
Le Haut-Richelieu 3.9 4,183
Les Jardins-de-Napierville 7.9 1,885
Le Haut-Saint-Laurent 30.5 6,640 1. The observed difference between the total number for the region and the one shown in table 2.3.1 is mainly the result of random rounding. Source(s): Statistics Canada, 2006 Census of population.

Portrait of Official-Language Minorities in Canada – Anglophones in Quebec
Statistics Canada – Catalogue no. 89-642-X 112
Table A-5 Anglophone population (first official language spoken) in Quebec by region and census division, 2006
Region, census division and census subdivisionProportion of anglophones
Number of anglophones
Québec and surrounding area1 1.3 17,370
Charlevoix-Est 0.5 75
Charlevoix 0.2 20
L'Islet 0.3 50
Montmagny 0.3 70
Bellechasse 0.6 198
L'Île-d'Orléans 1.7 118
La Côte-de-Beaupré 1.0 215
La Jacques-Cartier 4.0 1,190
Québec 1.9 9,780
Lévis 1.4 1,768
La Nouvelle-Beauce 0.7 230
Robert-Cliche 0.9 160
Les Etchemins 0.5 78
Beauce-Sartigan 0.7 338
L'Amiante 1.5 635
Lotbinière 0.6 173
Portneuf 1.0 445
Le Domaine-du-Roy 0.4 130
Maria-Chapdelaine 0.5 140
Lac-Saint-Jean-Est 0.4 198
Le Saguenay-et-son-Fjord 0.8 1,363 1. The observed difference between the total number for the region and the one shown in table 2.3.1 is mainly the result of random rounding. Source(s): Statistics Canada, 2006 Census of population.

Portrait of Official-Language Minorities in Canada – Anglophones in Quebec
Statistics Canada – Catalogue no. 89-642-X 113
Table A-6 Anglophone population (first official language spoken) in Quebec by region and census division, 2006
Region, census division and census subdivisionProportion of anglophones
Number of anglophones
Rest of Quebec1 4.1 50,435
L'Érable 0.5 115
Mékinac 0.6 75
Shawinigan 0.7 373
Francheville 1.1 1,588
Bécancour 0.7 125
Arthabaska 0.9 555
Drummond 1.6 1,435
Nicolet-Yamaska 0.9 190
Maskinongé 0.8 293
D'Autray2 1.0 285
Le Bas-Richelieu 1.0 465
Les Maskoutains 0.9 720
Rouville2 1.7 353
La Vallée-du-Richelieu2 1.7 180
Lajemmerais2 0.7 45
Joliette 0.7 415
Matawinie 4.3 2,128
Montcalm 1.9 795
Beauharnois-Salaberry2 3.2 1,515
Vaudreuil-Soulanges2 14.3 2,248
La Rivière-du-Nord2 3.5 975
Argenteuil2 18.1 5,050
Les Pays-d'en-Haut 11.4 4,103
Les Laurentides 7.4 3,145
Antoine-Labelle 1.9 648
Témiscamingue 14.4 2,418
Rouyn-Noranda 2.5 985
Abitibi-Ouest 0.9 175
Abitibi 1.8 423
La Vallée-de-l'Or 3.3 1,358
La Tuque 1.6 240
Nord-du-Québec 42.8 16,945 1. The observed difference between the total number for the region and the sum of the total of each of the census divisions is the result of random rounding. 2. Does not include census subdivisions that form part of the Montreal Census Metropolitan Area (CMA). Source(s): Statistics Canada, 2006 Census of population.

Portrait of Official-Language Minorities in Canada – Anglophones in Quebec
Statistics Canada – Catalogue no. 89-642-X 114
Appendix B Table 4.2.1 Proportion of Anglophones by language used with municipal police, Quebec and regions, 2006
% CV % CV % CV % CV % CV % CV % CMontréal 100.0 0.0 25.0 7.3 8.0 15.6 11.0 12.7 14.0 11.8 35.0 6.0 7.0 E 24.0East 100.0 0.0 F F x x x x x x F F x xOutaouais 100.0 0.0 32.0 12.6 12.0 E 19.4 8.0 E 22.5 14.0 E 18.8 27.0 14.8 x xEstrie and South 100.0 0.0 10.0 E 30.5 x x 10.0 E 32.2 7.0 E 28.7 59.0 9.9 x xQuébec and surrounding area 100.0 0.0 x x 0.0 0.0 x x 0.0 0.0 86.0 5.4 x xRest of Quebec 100.0 0.0 13.0 E 28.8 x x F F F F 46.0 16.3 F FTotal Quebec 100.0 0.0 24.0 6.5 8.0 13.8 11.0 11.4 13.0 10.7 37.0 5.0 8.0 E 19.0
French only UnknownEnglish onlyRegion
Total
Language used with municipal police
More English than French
English and French equally
More French than English
V
CV coefficient of variation Source(s): Statistics Canada, Survey on the Vitality of Official-Language Minorities, 2006. Table 4.2.2 Proportion of Anglophones by language used with provincial police, Quebec and regions, 2006
% CV % CV % CV % CV % CV % CV % CMontréal 100.0 0.0 17.0 E 19.4 F F x x 16.0 E 33.0 30.0 15.1 26.0 E 20.9East 100.0 0.0 29.0 E 18.2 x x F F F F 40.0 14.8 x xOutaouais 100.0 0.0 36.0 E 20.2 9.0 E 32.8 F F F F F F xEstrie and South 100.0 0.0 25.0 E 17.9 x x 6.0 E 32.3 14.0 E 22.8 44.0 10.7 x xQuébec and surrounding area 100.0 0.0 x x x x 0.0 0.0 x x 65.0 15.9 x xRest of Quebec 100.0 0.0 10.0 E 23.7 x x 6.0 E 30.2 16.0 E 32.0 44.0 13.9 F FTotal Quebec 100.0 0.0 19.0 11.9 4.0 E 24.7 7.0 E 29.4 15.0 E 22.9 33.0 9.5 22.0 E 17.2
Region
Language used with provincial police
More English than French
English and French equally
More French than English nwonknUylno hcnerFylno hsilgnElatoT
V
x
CV coefficient of variation Source(s): Statistics Canada, Survey on the Vitality of Official-Language Minorities, 2006.

Portrait of Official-Language Minorities in Canada – Anglophones in Quebec
Statistics Canada – Catalogue no. 89-642-X 115
Table 4.2.3 Proportion of Anglophones by language used with lawyer, Quebec and regions, 2006
% CV % CV % CV % CV % CV % CV % CV
Montréal 100 0.0 52 4.4 12 11.8 10 13.8 7 E 21.7 12 12.3 7 E 23.5
East 100 0.0 52 12.2 F F F F x x 29 E 22.9 F F
Outaouais 100 0.0 53 8.4 12 E 23.1 6 E 28.2 F F 17 E 24.0 x x
Estrie and South 100 0.0 52 7.9 10 E 18.8 6 E 22.0 10 E 28.7 16 E 21.6 x x
Québec and surrounding area 100 0.0 16 E 21.5 x x F F F F 48 12.1 x x
Rest of Quebec 100 0.0 37 11.2 9 E 27.2 F F 9 E 23.5 27 14.8 F F
Total Quebec 100 0.0 50 3.6 11 9.9 9 11.4 7 16.2 15 8.3 7 E 19.0
More French than English French only OtherTotal English only
Region
Language used with lawyer
More English than French
English and French equally
CV coefficient of variation Source(s): Statistics Canada, Survey on the Vitality of Official-Language Minorities, 2006.
Table 4.3.1-c Percentage of children with at least one parent who did part or all of his/her elementary education in English in Canada, by language of the school attended, Quebec and regions, 2006
% CV % CV % CV % CV % CV % CV
Montréal 100.0 0.0 35.0 5.1 33.0 5.2 27.0 6.5 5.0 15.6 x x
East 100.0 0.0 62.0 5.0 4.0 E 26.0 32.0 9.1 x x 0.0 0.0
Outaouais 100.0 0.0 41.0 9.3 12.0 16.5 43.0 9.7 x x 0.0 0.0
Estrie and South 100.0 0.0 45.0 7.2 17.0 14.5 34.0 10.1 4.0 E 24.9 0.0 0.0
Québec and surrounding area 100.0 0.0 32.0 11.1 x x 66.0 5.5 x x 0.0 0.0
Rest 100.0 0.0 54.0 7.1 8.0 E 19.8 36.0 10.6 x x 0.0 0.0
Total of Quebec 100.0 0.0 38.0 3.8 27.0 4.8 30.0 4.6 4.0 13.9 x x
Region
Total French school Don't know
Language of school attended by child
English school: immersion
English school: regular
Other language school
CV coefficient of variation Source(s): Statistics Canada, Survey on the Vitality of Official-Language Minorities, 2006.

Portrait of Official-Language Minorities in Canada – Anglophones in Quebec
Statistics Canada – Catalogue no. 89-642-X 116
Table 4.5.1 Proportion of Anglophones by language used during community activities, Quebec and regions, 2006
% CV % CV % CV % CV % CMontréal 100 0.0 62 3.9 5 E 19.5 11 14.8 23 9.6East 100 0.0 71 8.8 F F F F x xOutaouais 100 0.0 69 8.1 F F 9 E 29.4 x xEstrie and South 100 0.0 72 5.1 9 E 27.3 12 E 24.3 F FQuébec and surrounding area 100 0.0 40 16.0 F F 46 12.2 x xRest of Quebec 100 0.0 55 10.1 7 E 29.9 23 E 20.7 F F
0.9915.01211.4161.3260.0001cebeuQ latoTRegionMontréal 100 0.0 56 4.7 19 11.1 15 11.3 9 E 20.7East 100 0.0 41 E 17.6 13 E 26.4 42 E 21.6 x xOutaouais 100 0.0 53 9.9 21 E 17.8 22 E 27.1 x xEstrie and South 100 0.0 60 6.1 18 15.6 17 E 17.1 x xQuébec and surrounding area 100 0.0 39 15.3 7 E 26.1 52 11.2 x xRest of Quebec 100 0.0 41 12.9 16 E 22.7 30 16.0 x x
88.7810.9919.3550.0001cebeuQ latoT E 18.1RegionMontréal 100 0.0 56 5.2 19 10.9 14 13.1 11 E 21.4East 100 0.0 45 E 20.8 15 E 32.3 39 E 24.4 x xOutaouais 100 0.0 54 12.1 15 E 26.9 20 E 22.0 x xEstrie and South 100 0.0 44 10.2 31 13.8 22 E 18.8 x xQuébec and surrounding area 100 0.0 26 E 24.0 7 E 25.1 65 9.3 x xRest of Quebec 100 0.0 38 15.9 15 E 24.0 34 E 17.4 x x
015.8817.8915.4350.0001cebeuQ latoT E 19.2
Region
Daily activities
Total Only or mainly English
English and French
Only or mainly French Other
Organization
Volunteering
V
CV coefficient of variation Source(s): Statistics Canada, Survey on the Vitality of Official-Language Minorities, 2006.

Portrait of Official-Language Minorities in Canada – Anglophones in Quebec
Statistics Canada – Catalogue no. 89-642-X 117
Table 5.1 Percentage of Anglophones by identification to Anglophone and Francophone groups, Quebec and regions, 2006
% CV % CV % CV % CV % CV % CV % CVMontréal 100.0 0.0 17.0 5.5 40.0 3.1 35.0 3.3 3.0 12.1 1E 20.6 3.0 11.5East 100.0 0.0 20.0 11.5 27.0 10.3 50.0 6.4 F F x x F FOutaouais 100.0 0.0 16.0 9.7 37.0 6.7 39.0 6.5 5.0 E 32.3 x x 2.0 E 31.9Estrie and South 100.0 0.0 10.0 10.9 42.0 5.2 41.0 5.4 F F x x F FQuébec and surrounding area 100.0 0.0 4.0 E 21.6 27.0 11.0 54.0 5.9 13.0 14.5 2.0 E 28.4 x xRest of Quebec 100.0 0.0 11.0 14.1 34.0 7.1 46.0 5.9 5.0 E 22.0 F F F FTotal Quebec 100.0 0.0 16.0 4.7 39.0 2.6 37.0 2.6 4.0 9.1 1.0 16.3 3.0 10.1
Region Total
Respondent's identificationOnly to
Franchophone group
Mainly to Francophone
group
Both groups equally
Mainly to Anglophone
group
Only to Anglophone
group
None / refusal / Don't know
CV coefficient of variation Source(s): Statistics Canada, Survey on the Vitality of Official-Language Minorities, 2006.

Portrait of Official-Language Minorities in Canada – Anglophones in Quebec
Statistics Canada – Catalogue no. 89-642-X 118
Appendix C Note on the construction of the language use indices The indices used in this section were developed in the following manner. Whether it comes to the use of English or French, in all cases where people use only the language of the majority, they are assigned a value of 1, while those who use only the language of the minority are assigned a value of 5. In general, the large majority of questions consisted of a scale with five levels. For certain questions, there were only three possible categories: “French”, “English and French”, and “English”. The median category therefore corresponds to a value of 3. Two approaches were used to present the results covering each of the indices: one on language categories, another by average level of use of languages. The second approach consisted essentially of summing the values obtained from each of the questions and dividing this sum by the number of questions answered by the respondent. For the first type, the average scores obtained were regrouped into five categories. However, given that the results obtained consisted of a continuous scale from 1 to 5, we identified thresholds which allowed us to redistribute the values among the following five language categories: “Only the majority language”, “Mainly the majority language”, “Both languages equally”, “Mainly the minority language”, “Only the minority language”. The corresponding thresholds for these categories are as follows: “1 to 1.49”, “1.50 to 2.49”, “2.50 to 3.49”, “3.50 to 4.49” and “4.50 to 5.0”. Since no perfect solution exists to carry out such a distribution, this approach has the advantage of centering the values on either side of the median category and cutting down the range of values at the extremities of the scale. Finally, the general language use index was drawn up not by using the average of values for all 23 variables, but by adding the value obtained for the question on languages used with friends to the average values obtained on each of the four following indices: languages at work, immediate contacts, institutions and media. Such an approach offers the advantage of not assigning too much importance to a domain made up of numerous questions to the detriment of another composed of fewer questions. Lastly it should be noted that information covering language used at home was used in the same manner as that regarding friends. By using both the information on language spoken most often and language spoken regularly, the variable created is made up of the same five categories explained above.

Portrait of Official-Language Minorities in Canada – Anglophones in Quebec
Statistics Canada – Catalogue no. 89-642-X 119
Appendix D Description of concentration index Dissemination area: a small, relatively stable geographic unit. All dissemination areas have roughly the same number of residents, namely 400 to 700 persons. For a complete definition, see the 2006 Census Dictionary The definition of concentration takes account of both the proportion and the number of the official-language minority within a dissemination area. A high concentration of the minority group exists when the Anglophone population within a dissemination area constitutes at least 50% of the overall population or at least 200 persons. A medium concentration refers to a situation where the proportion is at least 10% but less than 50% and the number of Anglophones is equal to or more than 50 but less than 200. Finally, the concentration of Anglophones is considered to be low when their proportion within the dissemination area is less than 10% or their number is less than 50 persons. Once a concentration class (i.e. low, average or strong) was assigned to all the dissemination areas in a given municipality (or census subdivision), we chose to assign to the Anglophone population of that municipality the concentration class (or level) containing the largest proportion of the minority population. The total, which represents the largest portion of the total Anglophone population of the municipality, tells us the concentration class assigned to Anglophones of that municipality. In other words, when 64.7% of the Anglophones living in the East of Quebec region are highly concentrated within their municipality of residence, this means that 64.7% of them live in municipalities where, in the majority of cases, either their number exceeds 200 persons or their proportion exceeds 50% of the population within their dissemination area of residence.

Portrait of Official-Language Minorities in Canada – Anglophones in Quebec
Statistics Canada – Catalogue no. 89-642-X 120
Appendix E Table 3.7.3-b Interprovincial migration between Quebec and other provinces and territories by mother tongue, 1971 to 1976, 1976 to 1981, 1981 to 1986, 1986 to 1991, 1991 to 1996, 1996 to 2001 and 2001 to 2006
Total English French Other
From Quebec to other provinces1971 to 1976 145,800 94,100 41,300 10,4001976 to 1981 203,000 131,500 49,900 21,6001981 to 1986 130,200 70,600 45,900 13,7001986 to 1991 107,600 53,800 37,800 16,0001991 to 1996 106,300 51,100 33,600 21,6001996 to 2001 119,700 53,300 39,700 26,7002001 to 2006 85,200 34,100 31,000 20,100
From other provinces to Quebec1971 to 1976 83,800 41,900 37,200 4,7001976 to 1981 61,300 25,200 31,900 4,2001981 to 1986 67,000 29,000 33,000 5,0001986 to 1991 82,000 31,600 43,000 7,4001991 to 1996 68,900 26,600 34,800 7,5001996 to 2001 62,500 24,100 30,800 7,6002001 to 2006 73,500 26,100 36,000 11,400
Net migration (arrivals minus departures)1971 to 1976 -62,000 -52,200 -4,100 -5,7001976 to 1981 -141,700 -106,300 -18,000 -17,4001981 to 1986 -63,200 -41,600 -12,900 -8,7001986 to 1991 -25,600 -22,200 5,200 -8,6001991 to 1996 -37,400 -24,500 1,200 -14,1001996 to 2001 -57,200 -29,200 -8,900 -19,1002001 to 2006 -11,700 -8,000 5,000 -8,700
Period
Mother tongue
number
Source(s): Statistics Canada, censuses of population 1971 to 2006.

Portrait of Official-Language Minorities in Canada – Anglophones in Quebec
Statistics Canada – Catalogue no. 89-642-X 121
Appendix F List of the Quebec Regions and their Census Divisions
Montréal
Gaspésie-Îles-de-la-Madeleine: Îles-de-la-Madeleine (2401), Rocher Percé (2402), Côte-de-Gaspé (2403), Haute-Gaspésie (2404), Bonaventure (2405) and Avignon (2406)
North Coast: La Haute-Côte-Nord (2495), Manicouagan (2496), Sept-Rivières-Caniapiscau (2497) and Minganie-Basse-Côte-Nord-(2498)
Lower-Saint-Laurent: La Matapédia (2407), Matane (2408), La Mitis (2409), Rimouski-Neigette (2410), Les Basques (2411), Rivière-du-Loup (2412), Témiscouata (2413) and Kamouraska (2414)
Outaouais: Papineau (2480), CUO (2481), Collines-de-l'Outaouais (2482), Vallée-de-la-Gatineau (2483) and Pontiac (2484)
Saguenay-Lac-Saint-Jean: Le Domaine-du-Roy (2491), Maria-Chapdelaine (2492), Lac-Saint-Jean-Est (2493), and Le Fjord-du-Saguenay (2494)
Estrie: Granit (2430), Asbestos (2440), Haut-Saint-François (2441), Val-Saint-François (2442), Région-Sherbrookoise (2443), Coaticook (2444) and Memphrémagog (2445)
South of Quebec (part of Montérégie): Brome-Missisquoi (2446), Haute-Yamaska (2447), Acton (2448), Haut-Richelieu (2456), Jardins-de-Napierville (2468) and Haut-Saint-Laurent (2469)
All other CDs and parts of CDs that do not form part of the Montréal CMA.
Outaouais
Rest of Quebec
Québec and surrounding area
Estrie and South
Metropolitan Region of Montréal (CMA: 462)
National Capital Region: Charlevoix-Est (2415), Charlevoix (2416), L'Île-d'Orléans (2420), La Côte-de-Beaupré (2421), La Jacques-Cartier (2422), Communauté-Urbaine-de-Québec (2423) and Portneuf (2434)
Chaudière-Appalaches: L'Islet (2417), Montmagny (2418), Bellechasse (2419), Desjardins (2424), Les Chutes-de-la-Chaudière (2425), La Nouvelle-Beauce (2426), Robert-Cliche (2427), Les Etchemins (2428), Beauce-Sartigan (2429), L'Amiante (2431) and Lotbinière (2433)
East

Portrait of Official-Language Minorities in Canada – Anglophones in Quebec
Statistics Canada – Catalogue no. 89-642-X 122
References Curtis, J. E. and Scott, W. G (1979), Social Stratification: Canada, 2nd ed., Prentice-Hall of Canada,
scarborough, Ontario Floch, William and Johanne Pocock (2008), “The Socio-economic status of English-speaking Quebec:
Those who left and those who stayed”, in Bourhis, R.Y. (2008) (Ed.). The vitality of the English-speaking communities of Quebec: From Community Decline to Revival. Montréal, Qc: CEETUM, Université de Montréal.
Jedwab, J. (2008), «How shall we define thee? Determining who is an English-Speaking Quebecers and
Assessing its Demographic Vitality. The Socio-economic status of English-speaking Quebec: Those who left and those who stayed», in Bourhis, R.Y. (2008) (Ed.). The vitality of the English-speaking communities of Quebec: From Community Decline to Revival. Montréal, Qc: CEETUM, Université de Montréal.
Lamarre, P. (2008), English education in Quebec: Issues and Challenges, in Bourhis, R. Y. (2008) (Ed.).
The vitality of the English-speaking communities of Quebec: From Community Decline to Revival. Montréal, Qc: CEETUM, Université de Montréal.
Laperrière, A. (2006), Franchir les frontières : La traversée vers l’école de langue française des anglophones
ayant-droits de Montréal. Rapport final. Montréal, Québec : Centre d’études ethniques des universités montréalaises.
Martel, A. (1991), Les droits scolaires des minorités de langue officielle au Canada: de l’instruction à la gestion /
Official Language minority education rights in Canada : From instruction to management. Ottawa: Commissariat aux langues officielles
McGlynn, C., Lamarre, P., Montgomery, A. and Laperrière, A. (2008) Journeys into the Unknown: Shared
Schooling in Quebec and Northern Ireland. Comparative Education Journal. Parenteau, P., Magnan, M.-O. and Thibault, C.V. (2008), Portrait socio-économique de la communauté
anglophone au Québec et dans ses régions, Montréal : Institut québécois de recherche sur la culture.
Porter, J. (1965), The Vertical Mosaic: An Analysis of Social Class and Power in Canada. Toronto:
University of Toronto Press. Québec (2006), Statistiques de l’Éducation – édition 2005: Enseignement primaire, secondaire, collégial et
universitaire, Gouvernement du Québec, Ministère de l’Éducation, du Loisirs et du Sport. Québec (2004), Ministère de l’éducation, du Loisir et du Sport (MELS): Déclaration des clientèles scolaires
(DCS) et Déclaration des clientèles en formation professionnelle (DCFP). Québec (2003), La diversité dans la fonction publique québécoise : plan d’action, Secrétariat du Conseil du
Trésor, Gouvernement du Québec Québec (1996). Le français langue commune. Rapport du comité interministériel sur la situation de la langue
française. Québec: Direction des communications, Ministère de la Culture et des communications. Rudin, R. (1985), Forgotten Quebecers: a history of English-speaking Quebec, 1759-1980, Québec,Institut Québécois de recherche sur la culture.
Rudin, R. (1985), Forgotten Quebecers: a history of English-speaking Quebec, 1759-1980, Québec,Institut Québécois de recherche sur la culture.