Embed Size (px)
Citation preview

Food Chemistry 132 (2012) 134–143
Contents lists available at SciVerse ScienceDirect
Food Chemistry
journal homepage: www.elsevier .com/locate / foodchem
Possible causes of variation in acrylamide concentration in French fries preparedin food service establishments: An observational study
M. Sanny a,b, S. Jinap b, E.J. Bakker c, M.A.J.S. van Boekel a, P.A. Luning a,⇑a Product Design and Quality Management Group, Department of Agrotechnology and Food Sciences, Wageningen University, P.O. Box 8129, Bomenweg 2,NL-6700 EV Wageningen, The Netherlandsb Centre of Excellence for Food Safety Research, Faculty of Food Science and Technology, Universiti Putra Malaysia, 43400 Serdang, Selangor, Malaysiac Biometris, Applied Statistics, Department of Plant Sciences, Wageningen University, P.O. Box 100, 6708 PD Wageningen, The Netherlands
a r t i c l e i n f o a b s t r a c t
Article history:Received 28 April 2011Received in revised form 26 August 2011Accepted 12 October 2011Available online 26 October 2011
Keywords:Acrylamide concentrationFrench friesFood service establishments
0308-8146/$ - see front matter � 2011 Elsevier Ltd. Adoi:10.1016/j.foodchem.2011.10.044
⇑ Corresponding author. Tel.: +31 317 482087; fax:E-mail address: [email protected] (P.A. Luni
Acrylamide is a probable human carcinogen, and its presence in a range of fried and oven-cooked foodshas raised considerable health concern world-wide. Dietary intake studies observed significant variationsin acrylamide concentrations, which complicate risk assessment and the establishment of effective con-trol measures. The objective of this study was to obtain an insight into the actual variation in acrylamideconcentrations in French fries prepared under typical conditions in a food service establishment (FSE).Besides acrylamide, frying time, frying temperature, and reducing sugars were measured and the actualpractices at receiving, thawing and frying during French fries preparation were observed and recorded.The variation in the actual frying temperature contributed most to the variation in acrylamide concentra-tions, followed by the variation in actual frying time; no obvious effect of reducing sugars was found. Thelack of standardised control of frying temperature and frying time (due to inadequate frying equipment)and the variable practices of food handlers seem to contribute most to the large variation and high acryl-amide concentrations in French fries prepared in a restaurant type of FSE as compared to chain fast-foodservices, and institutional caterers. The obtained insights in this study can be used to develop dedicatedcontrol measures in FSE, which may contribute to a sustainable reduction in the acrylamide intake.
� 2011 Elsevier Ltd. All rights reserved.
1. Introduction
Acrylamide is a probable human carcinogen (IARC, 1994) and itspresence in a range of fried and oven-cooked foods (Tareke,Rydberg, Karlsson, Eriksson, & Tornqvist, 2000; Tareke, Rydberg,Karlsson, Eriksson, & Tornqvist, 2002) has raised considerablehealth concern world-wide (FAO/WHO, 2002, 2005). The highestconcentrations have been identified in potato based products suchas French fries (Claeys et al., 2010; DiNovi, 2006; Friedman, 2003).In addition, significant variations in acrylamide concentrationswere observed in many dietary intake studies (Dybing & Sanner,2003; Konings et al., 2003; Matthys et al., 2005; Svensson et al.,2003), which complicate risk assessment. Judging the actual riskof acrylamide and developing appropriate control measures, there-fore, requires an insight into the distribution profiles of acrylamideconcentrations (FAO/WHO, 2007).
French fries are considered as a predominant source of acrylam-ide because they are extensively consumed (Fiselier & Grob, 2005).French fries are widely prepared in food service establishments(FSE) and their preparation is apparently a crucial factor because
ll rights reserved.
+31 317 483669.ng).
acrylamide is formed towards the end of the frying process (Am-rein, Andres, Escher, & Amado, 2007; Fiselier, Bazzocco, Gama-Baumgartner, & Grob, 2006). A qualitative study on FSE revealedthat besides the variation in the initial concentration of reducingsugars, the variable frying conditions (time–temperature) seem amajor factor influencing the variation in acrylamide concentration.It was proposed that food handler’s inadequate control on theseinfluencing factors in their daily practise in FSE could lead to thelarge variation and high acrylamide concentration in French fries(Sanny, Luning, Marcelis, Jinap, & van Boekel, 2010). Al-Kahtani(1991) showed that frying practices among various types of FSEdiffered considerably in terms of frying conditions (temperature–time regime), frying equipment selection (design, capacity, heatingsystem and material of fabrication), and quality control duringfrying. Many studies that were done under controlled laboratoryconditions established the relationship between various food prop-erties (e.g. concentration of reducing sugars and amino acids) andprocessing conditions (e.g. frying temperature–time regimes andpH adjustment with organic acids) on acrylamide formation (Jung,Choi, & Ju, 2003; Knol et al., 2005; Mottram, Wedzicha, & Dodson,2002; Stadler et al., 2002). However, there is a restricted insightinto the contribution of actual frying practices in FSE (e.g. using dif-ferent raw materials, applying different frying temperature–time

M. Sanny et al. / Food Chemistry 132 (2012) 134–143 135
regimes and using different frying equipment) to the variation inacrylamide concentration in French fries for consumption.
The objective of this study was to obtain an insight into theactual variation in acrylamide concentrations in French fries pre-pared under typical FSE-conditions. Three types of FSE, i.e. chainfast-food services (CFS), institutional caterers (IC), and restaurants(R) were selected in this observational study to reflect the commontypes of FSE in Malaysia. The actual practices at receiving, thawingand frying during the preparation of French fries were observed toget an insight into the typical frying practices in these FSE types.The set and the actual frying temperature and frying time wererecorded and acrylamide and reducing sugars concentrations wereanalysed. We hypothesised that the mean concentration as well asthe extent of variation in acrylamide concentrations in French friesprepared by the three FSE types would differ.
2. Materials and methods
2.1. Characteristics of food service establishments (FSE)
The study was focused on FSE that located within a 25 kmradius of Serdang, Selangor, Malaysia. This city was selected to rep-resent a typical urban area. Three different establishments withmore than five workers were selected from each FSE type. Theestablishments consisted of local or international chain fast-foodservices for CFS type, caterers in a college or in a university for ICtype, and family style restaurants for R type.
2.2. Sampling and data collection
2.2.1. French fries samplesThe study was focused on straight-cut French fries samples that
were 8 � 8 mm in cross section and 60–70 mm long. Frozen par-fried potato strips were used as raw materials. For each establish-ment, samples were collected over three days of production. Eachday, samples were taken from five different frying batches. In eachfrying batch, a total of four servings of the French fries was col-lected. Of these servings, three were used to determine acrylamideconcentration, whereas the last serving was served to a customer.The determination of acrylamide concentration was done in tripli-cate, one measurement of acrylamide concentration for each serv-ing. Regardless of the serving size of the collected French fries, eachserving weighed approximately 67 g, the recommended servingsize (Shahar et al., 2002). Each serving was coded and stored inpolyethylene bags at �18 �C prior to analysis.
2.2.2. Frozen par-fried potato stripsFrozen par-fried potato strips samples were also collected over
three days of French fries production. Samples were collectedbefore they were used in frying. Each day, samples were takenfrom five different frying batches. In each frying batch, a total ofthree servings of the frozen par-fried potato strips were collected.These servings were used to determine reducing sugars concentra-tion in triplicate, one measurement of reducing sugars for eachserving. Each serving weighed approximately 67 g. Each servingwas coded and stored in polyethylene bags at �18 �C prior toanalysis.
2.2.3. Measurements and observationsThe food handler was asked to fry four servings of French fries
as he normally did. During frying, the following frying practiceswere measured: frying temperature and time, serving size and vol-ume of oil. In addition, the receiving supplied materials, brand offrozen par-fried potato strips, type of fryer, mode of heating, oil
type, thawing practise and presence of procedures and guidelineswere also observed.
The CFS and the IC used a commercial fryer whereas the R useda frying pan to fry French fries. The actual frying temperature oncethe fryer reached the set temperature (thermostat light off) wasmonitored and measured by a digital thermometer 51 series II cou-pled with a temperature probe (Fluke Corporation, Everett, USA).The temperature probe was placed into the oil bath at the samelocation between different measurements and away from thefryer’s/frying pan’s wall. The set frying temperature, as indicatedby the thermostat setting, was also recorded. For a frying pan,the actual frying temperature was monitored and measured bythe same device just before par-fried potato strips were insertedinto the oil.
The actual frying time once the fryer reached the set frying time(timer goes off) was monitored and measured using a built-intimer. The set frying time as indicated by a built-in timer was alsorecorded. For a frying pan, the actual frying time was recordedusing a stopwatch SW01 (ALBA, Japan) just after the removal ofFrench fries from the oil.
2.3. Analysis methods
2.3.1. Chemicals and reagentsD-(+)-Glucose (99.5%) and D-(�)-fructose (99%) were obtained
from Sigma (St. Louis, USA). 13C3-labelled acrylamide (99% isotopicpurity) was obtained from Cambridge Isotope Laboratories (Ando-ver, MA, USA). Acetonitrile, methanol, ethyl-acetate, hexane,hydrobromic acid (47% w/v), bromine (99.99%), potassiumbromide, sodium sulphate anhydrous were purchased from Merck(Darmstadt, Germany). Acrylamide (99%), D-(+)-maltose monohy-drate (99%), triethylamine, and sodium thiosulphate were pur-chased from Fluka Chemie AG (Buchs, Switzerland). Ultra purewater was used throughout the experiments (Purelab Classic UV,Elga Labwater, Lane End, UK). Solid phase extraction cartridges(Oasis Hydrophilic–Lipophilic Balance (HLB), 6cc and OasisMixed-mode Cation-eXchange (MCX), 3cc) were supplied byWaters Corp (Milford, Massachusetts, USA).
A bromination reagent was prepared from potassium bromide(152 g), hydrobromic acid (8 ml), and bromine-saturated water(saturated at 4 �C, 50 ml) and 600 ml distilled water. This reagentwas stored at 4 �C. Stock solutions of acrylamide (0.2 mg/ml) and13C3-labelled acrylamide (4 lg/ml) were prepared by dissolvingthe compound in distilled water. Working standards wereprepared by diluting the stock solution of acrylamide to concentra-tions of 1, 5, and 10 lg/ml with water. All stock solution and work-ing standards were stored in a refrigerator at 4 �C for a maximumof 3 months.
2.3.2. Analysis of fructose, glucose, and sucroseThe procedure was adapted from Vivanti and co-authors (2006).
The sample was grounded in a blender (Braun multiquik ZK3,Frankfurt, Germany). A sub-sample (2 g) was weighed in a 50 mlcentrifuge tube and 10 ml of acetonitrile/water (80:20 v/v) wereadded. The suspension was then centrifuged at 1643 RCF (g) for10 min and the supernatant was passed through a 0.45 lm nylonsyringe filter (Sartorius AG, Goettingen, Germany). Aliquots(50 ll) of the filtrate were injected into a Waters high-performanceliquid chromatography (HPLC) instrument equipped with a refrac-tive index (R.I.) detector and an lBondapack NH2, 3.9 � 300 mmcolumn (Waters Corp, Milford, Massachusetts, USA). An isocraticmode of elution was used with the mobile phase consisting of ace-tonitrile/water (80:20, v/v) at a flow rate of 0.8 ml/min. Maltosewas used as an internal standard. Calibration curves were linear(r2 > 0.999). The detection limit for fructose, glucose and sucrosewas 5 mg/kg. The recoveries for fructose ranged between

136 M. Sanny et al. / Food Chemistry 132 (2012) 134–143
91.3–100.3%, for glucose ranged between 92.9–96.7% and for su-crose ranged between 98.8–106.6%. The intra-day and inter-dayprecisions, expressed as the relative standard deviation, were4.6% and 6.7% (fructose), 11.7% and 13.2% (glucose) and 12.2%and 13.5% (sucrose), respectively.
2.3.3. Analysis of acrylamide2.3.3.1. Extraction. The scheme described by Becalski and co-authors (2005) was followed. The sample was grounded in a blen-der. A sub-sample (2 g) was weighed in a 50 ml centrifuge tube and10 ml of water containing 1000 ng 13C3-labelled acrylamide as theinternal standard (final concentration = 100 ng/ml) were added.The mixture was shaken at medium speed level (ca. 256 pulses/minute) on a vertical shaker (RS-1, Jeio Tech Co., Gyeonggi-do, Kor-ea) for 30 min and centrifuged in a refrigerated centrifuge (3–18 K,Sigma, Gillingham Dorset, United Kingdom) at 10956 RCF (g) for30 min. Oasis HLB were conditioned with 3 ml of methanol andequilibrated with 3 ml of water. The filtrate from the centrifuge(5 ml) was promptly transferred through an Oasis HLB cartridgeconnected in tandem to an Oasis MCX cartridge, and the elutewas collected.
Standards contained acrylamide at concentrations of 10, 25, 50,100, 250, 500, 1000 ng/ml and isotopically labelled acrylamide at100 ng/ml. Elutes or standards (5 ml) was treated with bromina-tion reagent (15 ml) overnight at 4 �C. Excess bromide was decom-posed by adding 0.7 M sodium thiosulphate solution drop wiseuntil the yellow colour disappeared. Calcined sodium sulphateanhydrous (4 g) was added and the mixture was stirred using amagnetic stirrer for 5 min. The mixture was transferred to a125 ml separatory funnel and was extracted twice with 15 ml ofethyl acetate/hexane (4:1, v/v) by shaking using a vertical shakerfor 1 min. After phase separation, the lower aqueous layer wasdiscarded. The organic phase was transferred into a 50 ml centri-fuge tube containing calcined sodium sulphate anhydrous (approx-imately 4 g) and centrifuged at 10956 RCF (g) for 10 min. The liquidphase was decanted through glass wool, into a 50 ml round-bot-tom flask. Pooled fraction was evaporated to dryness under vac-uum at 40 �C using a rotary evaporator (Rotavapor R-210, BuchiLabrortechnik AG, Flawil, Switzerland). The residue was re-dis-solved in 450 ll of ethyl acetate, and 50 ll of triethylamine wasadded to convert 2,3-dibromopropionamide to 2-bromopropena-mide. The resulting solution was transferred into an insert in anamber vial and stored in a freezer at �18 �C until analysis by GasChromatograph–Time-of-Flight-Mass Spectrometry (GC–TOF-MS).
2.3.3.2. GC–TOF-MS analysis. Brominated sample extracts and cali-bration standards were analysed on an Agilent Technologies6890N gas chromatograph (GC) (Agilent Technologies, Palo Alto,CA, USA) coupled to a LECO Pengasus III Time-of-Flight (TOF) MassSpectrometry detector (MSD) with positive electron impact (EI)ionisation (LECO Corporation, Lakeview Avenue, St. Joseph, MI,USA). The GC column was a HP-Innowax capillary column(30 m � 0.25 mm i.d., 0.25 m film thickness; Agilent Technologies,Palo Alto, CA, USA) and the carrier gas was helium at 1.6 ml/min.Following injection, the column was held at 65 �C for 1 min, thenprogrammed at 15 �C/min to 170 �C, 5 �C/min to 200 �C, followedby 40 �C/min to 250 �C, and held for 15 min at 250 �C. Injectionsby an Agilent Technologies 7683 auto-sampler (2 ll) were madein split less mode (split fow 60 ml/min) with a purge activationtime of 1.0 min and an injection temperature of 250 �C. The GC–TOF-MS interface transfer line was held at 260 �C. Ions monitoredwere m/z 70, 149, and 151 for 2-bromopropenamide, and m/z110 and 154 for 2-bromo(13C3)propenamide.
2.3.3.3. Quantification. Acrylamide in French fries samples wasquantified using the ion at m/z 149 for 2-bromopropenamide,
and the ion at m/z 154 for 2-bromo(13C3)propenamide. Other ionsat m/z 70, 110, and 151 were considered only for confirmationpurposes. A calibration graph was constructed by plotting peakarea ratios (149/154) against the corresponding ratios of analyteamounts. Acrylamide concentrations in sample extracts were cal-culated from the calibration slope and intercept value. Calibrationcurves were linear (r2 > 0.999). The limit of detection was 10 lg/kgand the recoveries were in the range between 102–110%. The intra-day and inter-day precisions (expressed as the RSD) were 6.4% and3.1%, respectively.
2.4. Statistical analysis
To construct histograms, the original data of acrylamide concen-tration in each serving of French fries samples were loge trans-formed. Loge transformation was done to improve theapproximation of normal distributions of the data while retaininginformation about the degree of variation in the distribution (Dallal,2009; Garner, 2010; Hopkins, 2003).
An analysis of variance (ANOVA) was used to explore the meandifferences in the loge transformed acrylamide concentrationamong the three FSE types while also investigating the variationdue to different establishments, sampling days and frying batches.A mixed model was used with FSE type as fixed factor and estab-lishment, sampling day and frying batch as random factors. Themixed model was selected because FSE type was used as a controlfactor in the present study, whereas the establishments, samplingdays and frying batches were not fixed in advance and are there-fore considered as random. All factors are nested within the pre-mentioned sampling level. The significance of the differencesamong the three FSE types was determined using Tukey’s HSD test.The obtained means of loge transformed acrylamide concentrationwere back-transformed to an original scale of measurement atwhich they then are the geometric means (Bland & Altman,1996; Petrie & Sabin, 2009). The coefficient of variation (coded asCV) was calculated using the formula of 100(eSD � 1), where SDis the standard deviation of the loge transformed acrylamideconcentration (Dallal, 2009; Hopkins, 2003). The CV is used tocompare the degree of variation for each FSE type to another. Toanalyse the reducing sugars concentrations, the same mixed ANO-VA model with nested factors was used. The CV was calculated asthe standard deviation divided by the mean and is reported as apercentage.
Bivariate correlations were used to investigate the strength anddirection of the relationship of acrylamide formation to a set ofinfluencing factors (frying temperature, frying time, reducingsugars, sucrose and thawing). Results were expressed as Pearsoncorrelations.
Multiple linear regression analysis was used to investigate thepredictive ability of a set of influencing factors (frying temperature,frying time, reducing sugars, sucrose and thawing) as well as toassess the relative contribution of each influencing factor on acryl-amide formation. These influencing factors, considered as possiblepredictors for acrylamide formation, were put into the model. Mul-tiple regression analysis was checked for possible violations fromthe model assumptions during analysis.
In tests, a p-value of 0.05 or less was considered significant. Sta-tistical analyses were performed using the SPSS version 16.0 (SPSSInc., Chicago, IL).
3. Results
Initial data analysis indicated that the frequency distribution ofacrylamide concentration was slightly skewed to the right (datanot shown). This is due to a small number of samples with very
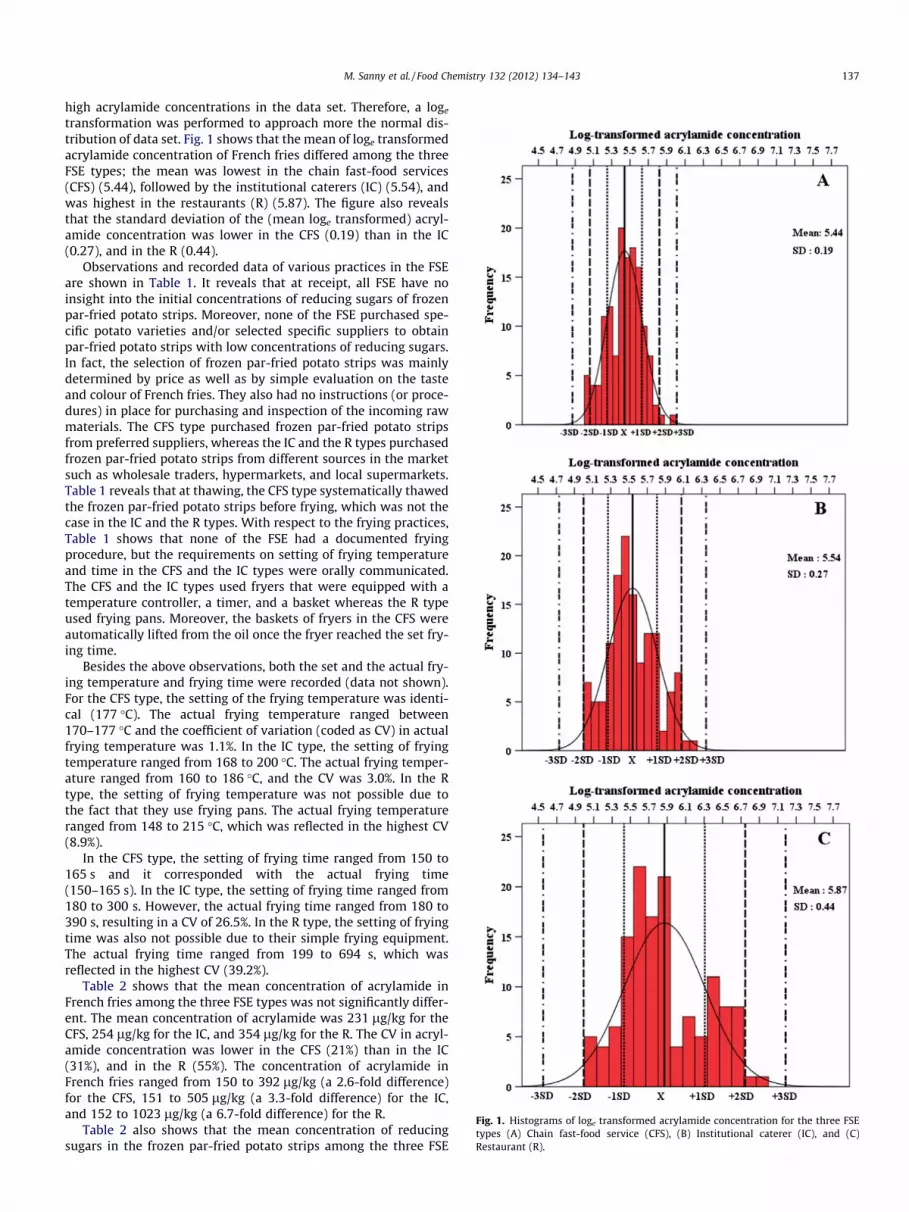
Fig. 1. Histograms of loge transformed acrylamide concentration for the three FSEtypes (A) Chain fast-food service (CFS), (B) Institutional caterer (IC), and (C)Restaurant (R).
M. Sanny et al. / Food Chemistry 132 (2012) 134–143 137
high acrylamide concentrations in the data set. Therefore, a loge
transformation was performed to approach more the normal dis-tribution of data set. Fig. 1 shows that the mean of loge transformedacrylamide concentration of French fries differed among the threeFSE types; the mean was lowest in the chain fast-food services(CFS) (5.44), followed by the institutional caterers (IC) (5.54), andwas highest in the restaurants (R) (5.87). The figure also revealsthat the standard deviation of the (mean loge transformed) acryl-amide concentration was lower in the CFS (0.19) than in the IC(0.27), and in the R (0.44).
Observations and recorded data of various practices in the FSEare shown in Table 1. It reveals that at receipt, all FSE have noinsight into the initial concentrations of reducing sugars of frozenpar-fried potato strips. Moreover, none of the FSE purchased spe-cific potato varieties and/or selected specific suppliers to obtainpar-fried potato strips with low concentrations of reducing sugars.In fact, the selection of frozen par-fried potato strips was mainlydetermined by price as well as by simple evaluation on the tasteand colour of French fries. They also had no instructions (or proce-dures) in place for purchasing and inspection of the incoming rawmaterials. The CFS type purchased frozen par-fried potato stripsfrom preferred suppliers, whereas the IC and the R types purchasedfrozen par-fried potato strips from different sources in the marketsuch as wholesale traders, hypermarkets, and local supermarkets.Table 1 reveals that at thawing, the CFS type systematically thawedthe frozen par-fried potato strips before frying, which was not thecase in the IC and the R types. With respect to the frying practices,Table 1 shows that none of the FSE had a documented fryingprocedure, but the requirements on setting of frying temperatureand time in the CFS and the IC types were orally communicated.The CFS and the IC types used fryers that were equipped with atemperature controller, a timer, and a basket whereas the R typeused frying pans. Moreover, the baskets of fryers in the CFS wereautomatically lifted from the oil once the fryer reached the set fry-ing time.
Besides the above observations, both the set and the actual fry-ing temperature and frying time were recorded (data not shown).For the CFS type, the setting of the frying temperature was identi-cal (177 �C). The actual frying temperature ranged between170–177 �C and the coefficient of variation (coded as CV) in actualfrying temperature was 1.1%. In the IC type, the setting of fryingtemperature ranged from 168 to 200 �C. The actual frying temper-ature ranged from 160 to 186 �C, and the CV was 3.0%. In the Rtype, the setting of frying temperature was not possible due tothe fact that they use frying pans. The actual frying temperatureranged from 148 to 215 �C, which was reflected in the highest CV(8.9%).
In the CFS type, the setting of frying time ranged from 150 to165 s and it corresponded with the actual frying time(150–165 s). In the IC type, the setting of frying time ranged from180 to 300 s. However, the actual frying time ranged from 180 to390 s, resulting in a CV of 26.5%. In the R type, the setting of fryingtime was also not possible due to their simple frying equipment.The actual frying time ranged from 199 to 694 s, which wasreflected in the highest CV (39.2%).
Table 2 shows that the mean concentration of acrylamide inFrench fries among the three FSE types was not significantly differ-ent. The mean concentration of acrylamide was 231 lg/kg for theCFS, 254 lg/kg for the IC, and 354 lg/kg for the R. The CV in acryl-amide concentration was lower in the CFS (21%) than in the IC(31%), and in the R (55%). The concentration of acrylamide inFrench fries ranged from 150 to 392 lg/kg (a 2.6-fold difference)for the CFS, 151 to 505 lg/kg (a 3.3-fold difference) for the IC,and 152 to 1023 lg/kg (a 6.7-fold difference) for the R.
Table 2 also shows that the mean concentration of reducingsugars in the frozen par-fried potato strips among the three FSE

Table 1Observation and recorded data of various practices in the preparation of French fries among the three FSE types.
Chain fast-food service (CFS) Institutional caterer (IC) Restaurant (R)
Aa B C D E F G H I
Practices at different steps in French fries productionReceiving Yes Yes Yes Yes Yes Yes Yes Yes Yes� Initial concentration of reducing sugars unknown� Potato varieties selected� Supplier selected� Description or brand of frozen par-fried potato stripes used
No No No No No No No No NoYes Yes Yes No No No No No NoPS1b PS2c NDd PS2 PS1 PS2 PS2 Pomme
FritesPommeFrites,Golden andSimplot
Presence of (documented) procedures: No No No No No No No No No- Instructions on purchasing raw materials that contain acceptable initial concentration of reducing sugars- Instructions of incoming material inspection
No No No No No No No No No
Thawing Yes Yes Yes Yes Yes No Yes Yes NoFrozen par-fried potato stripes were thawed before frying
Frying Yes Yes Yes Yes Yes Yes No No No� Fryer equipped with a temperature controller, timer and basket� Fryer
– Type of fryer– Type of temperature and time controller– Volume of oil, L� Presence of (documented) frying procedures, i.e. instruction on requirement for thawing time before frying,
oil temperature, frying time, portion size, remaining portions, sort out fines etc.� Oral instruction to set frying temperature and time of the fryer� Used palm oil in frying� Guideline of portion size (10% potato referring to the oil) followed� Estimated maximum portion size� Mean serving size, gram/serve (SD)
– Maximum– Minimum– Number, n� Assigned a dedicated personnel at the frying station
EF1e EF1 EF1 EF2f GF1g EF3h GF2i GF2 GF2Digital Digital Digital Analogue Digital Digital NAj NA NA20k 15 15 6 15 15 8 5 2No No No No No No No No NoYes Yes Yes Yes Yes Yes NA NA NAYes Yes Yes Yes Yes Yes Yes Yes YesNo No No No No No No No No4–6servings
4–6servings
4–6servings
4–5servings
4–6servings
4–6servings
4–6servings
4–5servings
4–5servings
119(4.8)12710145
103(12.2)1278245
102(15.9)1286745
95(11.1)1196945
131(14.4)1618945
96(12.0)1235845
135(14.9)2628330
180(28.8)1096730
90(10.9)2626530
Yes No Yes Yes No Yes No Yes Yes
Holding ND ND ND ND ND ND ND ND NDPractise in holding is not expected as source of variation
a Data from an establishment of each FSE type.b PS1 = frozen par-fried potato stripes type 1 (no brand, expiry date printed on the package).c PS2 = frozen par-fried potato stripes type 2 (no brand, green colour printing on package with expiry date).d ND = no data.e EF1 = Electric fryer, floor model FM II (Frymaster L.L.C, Shreveport, LA, USA). This fryer has a temperature range of 60–195 �C and heating power capability of no more than ±2 �C.f EF2 = Electric fryer, countertop model DFT 2000 (MSM Equipment Manufacturer Sdn. Bhd., Cheras, Malaysia).g GF1 = Gas fryer, floor model BIH 152–2 CSD (Frymaster L.L.C, Shreveport, L.A., USA).h EF3 = Electric fryer, floor model HEF 77 (Hobart, London, United Kingdom).i GF2 = conventional gas-fried steel pan.j NA = not applicable.k This fryer has a bowl of 20L oil capacity, equipped with two static baskets (of which only one was used in the study) and a regulating thermostat.
138M
.Sannyet
al./FoodChem
istry132
(2012)134–
143

Table 2Concentration of acrylamide, reducing sugars, and sucrose in samples from the three FSE types.
Chain fast-food service Institutional caterer Restaurant
Aa B C Overallb D E F Overall G H I Overall
Acrylamide, lg/kgc
Meand,e (SDf) 249 (0.10) 203 (0.17) 243 (0.21) 231 (0.19) 224 (0.28) 234 (0.11) 313 (0.25) 254 (0.27) 281 (0.17) 292 (0.37) 540 (0.38) 354 (0.44)CVg, % 11 19 23 21 32 12 28 31 19 45 46 55Medianh 246 202 246 236 217 238 320 244 280 302 603 330Minimum 197 150 156 150 151 178 177 151 193 575 251 152Maximum 312 302 392 392 414 285 505 505 389 424 1023 1023Range 115 152 236 242 263 107 328 354 197 151 772 871
Reducing sugars, g/kgc
Meani(SDj) 0.33 (0.04) 0.99 (0.1) NDk 0.66 (0.3) 1.15 (0.1) 1.53 (0.3) 1.85 (0.2) 1.51 (0.4) 0.97 (0.1) 1.14 (0.2) 1.20 (0.2) 1.10 (0.2)CVl, % 12.1 10.1 45.5 8.7 19.6 10.8 26.5 10.3 17.5 16.7 18.2Minimum 0.25 0.82 0.25 0.88 1.18 1.33 0.88 0.72 0.81 0.86 0.72Maximum 0.45 1.24 1.24 1.45 2.14 2.22 2.22 1.16 1.62 1.54 1.62Range 0.2 0.42 0.99 0.57 0.96 0.89 1.34 0.44 0.81 0.68 0.9
Sucrose, g/kgc
Meani (SDj) 2.57 (0.2) 0.60 (0.03) ND 1.58 (1.0) 1.64 (0.2) 1.06 (0.2) 1.31 (0.1) 1.34 (0.3) 1.67 (0.1) 1.75 (0.3) 0.53 (0.2) 1.32 (0.6)CV12, % 7.8 5.0 63.3 12.2 18.9 7.6 22.4 6.0 17.1 37.7 45.5Minimum 2.27 0.52 0.52 1.15 0.79 1.12 0.79 1.46 1.25 0.21 0.21Maximum 3.14 0.66 3.14 1.84 1.55 1.58 1.84 1.93 2.58 1.12 2.58Range 0.87 0.14 2.62 0.69 0.76 0.46 1.05 0.47 1.33 0.91 2.37
a Data from an establishment of each FSE type.b Mean of data from three or two (where applicable) different establishments of each FSE type.c Referring to fresh weight.d The mean of loge transformed acrylamide concentration in each establishment was back transformed to an original scale using an anti-logarithmic and expressed as geometric mean.e Mean value based on N = 45.f Standard Deviation (SD) of the loge transformed acrylamide concentration.g The exact coefficient of variation (CV) was calculated using a formula of 100(eSD � 1), where SD is the standard deviation of the loge transformed acrylamide concentration. It compares the degree of variation from each FSE type
to another.h The median of loge transformed acrylamide concentration in each establishment was back transformed to an original scale using an anti-logarithmic and expressed as geometric median.i Arithmetic mean (mean of untransformed data).j Arithmetic standard deviation (standard deviation of untransformed data).k ND = no data.l The CV was defined as the standard deviation divided by the mean, which the result is reported as a percentage.
M.Sanny
etal./Food
Chemistry
132(2012)
134–143
139

Table 3Bivariate correlations and multiple linear regression analyses on the influencing factors (frying temperature, frying time, reducing sugars, sucrose and thawing).
Influencing factors Bivariate correlations analysis Multiple linear regression analysis
Pearson correlation coefficient, r p-Value Betaa p-Value
Frying time, seconds 0.104 <0.05 0.141 <0.05Frying temperature, �C 0.596 <0.05 0.513 <0.05Reducing sugars, g/kgb 0.102 0.053 �0.083 0.078Sucrose, g/kgb �0.231 <0.05 �0.044 0.315Thawing �0.482 <0.05 �0.359 <0.05
N = 360.a Beta values are standardised coefficients.b Referring to fresh weight.
140 M. Sanny et al. / Food Chemistry 132 (2012) 134–143
types was not significantly different. The mean concentration ofreducing sugars was 0.66 g/kg for the CFS, 1.51 g/kg for the IC,and 1.10 g/kg for the R. The CV in reducing sugars concentrationwas 45.5% for the CFS, 26.5% for the IC, and 18.2% for the R. Theconcentration of reducing sugars ranged from 0.25 to 1.24 g/kg (a5.0-fold difference) for the CFS, from 0.88 to 2.22 g/kg (a 2.5-folddifference) for the IC, and from 0.72 to 1.62 g/kg (a 2.3-fold differ-ence) for the R.
Bivariate correlations and multiple linear regression analyseswere performed to investigate the strength and direction of therelationship of the influencing factors (frying temperature, fryingtime, reducing sugars, sucrose and thawing) and their possiblecontribution to the formation of acrylamide. Table 3 shows astrong correlation between frying temperature and acrylamideconcentration (r = 0.596, n = 360, p < 0.05). There was a moderatenegative correlation between thawing practise and acrylamideconcentration (r = �0.482, n = 360, p < 0.05). The frying timeshowed a small but significant correlation with the acrylamideconcentration (r = 0.104, n = 360, p < 0.05). The reducing sugarsshowed no significant correlation with the acrylamide concentra-tion (r = 0.102, n = 360, p = 0.053). The multiple linear regressionmodel revealed that all factors (except reducing sugars andsucrose) significantly contributed to the prediction of acrylamideformation (r2 = 0.483, n = 360, p < 0.05). The order of contributions,from highest to lowest are frying temperature (beta = 0.513), thaw-ing practise (beta = �0.359), and frying time (beta = 0.143).
4. Discussions
The present study shows that although the mean concentrationof acrylamide among the three FSE types was not significantly dif-ferent, the least variation in acrylamide concentration was found inFrench fries prepared in the chain fast-food service (CFS), as com-pared to the institutional caterers (IC), and the restaurants (R). Inaddition, the highest concentration of acrylamide (1023 lg/kg)was found in the R type of FSE. Our study showed that the actualfrying temperature was strongly correlated with the acrylamideconcentration (r = 0.596, n = 360, p < 0.05, Table 3) and contributedthe most to the prediction of acrylamide formation (beta = 0.513,p < 0.05, Table 3). The finding confirms the pronounced effect offrying temperature on the formation of acrylamide as reported instudies that were done under carefully controlled laboratory con-ditions (Amrein, Limacher, Conde-Petit, Amado, & Escher, 2006;Grob et al., 2003; Matthaus, Haase, & Vosmann, 2004). Further,we demonstrated its pronounced effect under typical FSE-condi-tions. Comparing the frying practices among the three FSE typesrevealed that the setting of a low and identical frying temperature(177 �C) of digitally controlled fryers (i.e. sophisticated fryingequipment) in the CFS type apparently resulted in a small rangeof actual frying temperature (170–177 �C). Correspondingly, thelowest variation in acrylamide concentration (i.e. 150 to 392 lg/
kg, a 2.6-fold difference) was found in the CFS type. In the R type,frying pans were used in which the temperature cannot be regu-lated. The food handlers in the R type, visually inspected the oilto estimate its temperature, which apparently resulted in a largerange of actual frying temperatures (148–215 �C). Correspond-ingly, the largest variation in acrylamide concentrations (i.e.152–1023 lg/kg, a 6.7-fold difference) was found in the R type.Food handler’s lack of control on frying temperature seems to con-tribute to the large variation and high acrylamide concentration inFrench fries prepared in the R type as compared to the other FSEtypes. Our findings on the frying practices are consistent withother studies that surveyed the actual frying conditions in FSE.Al-Kahtani (1991) earlier reported that CFS in Saudi Arabia alsotypically set frying temperatures at 177 �C. Morley-John andco-authors (2002) reported that the setting of frying temperaturein the FSE in New Zealand ranged from 175 to 190 �C and the actualfrying temperature ranged from 136 to 233 �C. Furthermore, Gere(1985) also found that frying temperature in nearly 70% of theFSE kitchens in Budapest was not controlled at all.
In our study also, the frying time showed a significant (butsmall) correlation with acrylamide concentration (r = 0.104,n = 360, p < 0.05, Table 3). Similarly, a significant (but little) contri-bution of frying time to the prediction of acrylamide formation wasobserved (beta = 0.141, p < 0.05, Table 3). The finding seems in con-trast to studies that reported a linear relationship between fryingtime and acrylamide concentration (Gokmen & Senyuva, 2006;Matthaus et al., 2004). However, Romani and co-authors (2008)discussed that the increase of time only becomes a key factor inthe formation of acrylamide in French fries after ca. 240 s of frying(at 180 �C). The actual frying times recorded in the CFS and IC typesranged from 150 to 240 s, which are shorter than the identifiedcritical time as mentioned by Romani et al. (2008). Differentauthors reported that after immersion of potato strips, the fryingtemperature drops and slowly recover to the initial setting (Fiselieret al., 2006; Grob, 2007). The short frying time seems to limit theformation of acrylamide, because frying ends before the fryingtemperature recovers to the initial setting, and before the acrylam-ide concentration starts to increase linearly with time. Conversely,the actual frying times recorded in the R type ranged from 199 to694 s, which indicate that longer frying times than 240 s wereapplied. It appears that longer frying times, applied in the R typeas compared to the other FSE types, also contributed to the largevariation and high acrylamide concentration in French fries. Theobserved differences in actual frying times among the CFS (150–165 s), the IC (180–390 s), and the R (199–694 s) are possibly dueto the differences in frying equipment and frying instructions. Inmore detail, the difference in frying equipment refers to the liftingof basket that was digitally controlled in the CFS versus simple fry-ing pans in the R, and the difference in frying instructions refers tothe oral instructions in the CFS and the CI versus no instructions atall in the R. The finding supports earlier suggestions that the fryertype influenced the concentrations of acrylamide (Gertz, Kloster-

M. Sanny et al. / Food Chemistry 132 (2012) 134–143 141
mann, & Kochhar, 2003; Romani et al., 2006; Sanny et al., 2010).Moreover, Haase (2006) observed that food handlers in restaurantstend to have different preferences regarding discoloration whichresulted in individual preparation techniques to meet their specificrequirements.
In our study, no significant correlation between reducing sugarsand acrylamide concentration was found (r = 0.102, n = 360,p = 0.053, Table 3) and reducing sugars also did not significantly con-tribute to the prediction of acrylamide formation (beta =�0.083,p = 0.078, Table 3). Our data showed that a considerable var-iation in reducing sugars concentration was not corresponding tothe variation in acrylamide concentration. To illustrate, the mostvariation in reducing sugars concentration in the CFS (0.25–1.24 g/kg, a 5.0-fold difference) was not reflected in the least variation inacrylamide concentration in French fries for the CFS (150–392 lg/kg, a 2.6-fold difference). Similarly, the least variation in reducingsugars concentration in the R (0.72–1.62 g/kg, a 2.3-fold difference)was also not reflected in the most variation in acrylamide concentra-tion in French fries for the R (152–1023 lg/kg, a 6.7-fold difference).The data seems in contrast to the established literature. Reducingsugars have been frequently mentioned as the limiting factor inthe formation of acrylamide (Amrein et al., 2003, 2004). Other stud-ies established the strong correlation between acrylamide forma-tion and reducing sugars available in potatoes (Amrein et al.,2003; Becalski et al., 2004). However, these cited studies used potatotubers to prepare French fries and Amrein and co-authors (2003), asan example, reported the reducing sugars concentration in tubersranged from 0.1 to 9 g/kg. In contrast, we used commercial par friedpotato strips in the present study, and the reducing sugars concen-tration in potato strips ranged from 0.25 to 2.22 g/kg. Possibly, alower range of reducing sugars concentration of the present studythan the study of Amrein and co-authors (2003) contributed to theobtained insignificant correlation between reducing sugars andacrylamide concentration. The lower reducing sugars concentrationin par fried potato strips than in potato tubers results from the ef-fects of blanching and pre-frying during the production of commer-cial potato strips (Fiselier & Grob, 2005; Grob, 2007). Moreover,various authors proposed that the selection of potato varieties orsupplier (for low concentrations of reducing sugars) could be a sim-ple and efficient measure to reduce the extent of variation in acryl-amide concentration (Fiselier & Grob, 2005; Grob et al., 2003;Lindsay & Jang, 2005; Sanny et al., 2010). However, De Vleeschouwerand co-authors (2008) acknowledged the wide range of sugar con-centrations as well as the highly variable sugar-asparagine ratiosin real products, such as potatoes. They studied the effect of the ini-tial reactant concentrations and ratio on acrylamide formation, andreported a negligible effect of the initial reactant concentration andratio on the kinetic parameters of acrylamide formation in an aspar-agine-glucose model system. The above cited studies were mostlycarried out under strictly controlled laboratory conditions. In ourobservational study, conditions such as reducing sugars, frying tem-perature, frying time and frying equipment were not controlled. Pos-sibly, the effect of reducing sugars is overshadowed by the effects offrying temperature and (less by) frying time. Although the finding ofDe Vleeschouwer and co-authors (2008) supported our observa-tions, further research is needed to investigate the effect of initialconcentration of reducing sugars on the variation in acrylamide con-centration in French fries prepared under carefully controlled condi-tions in FSE.
Interestingly, in our study, the thawing practise also showed amoderate (negative) correlation with acrylamide concentration(r = �0.482, n = 360, p < 0.05, Table 3) and it significantly contrib-uted to the prediction of acrylamide formation (beta = �0.359,p < 0.05, Table 3). Studies showed that thawing of frozen par-friedpotatoes resulted in more oil absorption and greater moisture loss(Burr, 1971; O’Connor, Fisk, Smith, & Melton, 2001), which was
consequently associated with temperature drops during frying(Mehta & Swinburn, 2001). Various authors observed a decreasein acrylamide formation related with temperature drops due toan increase in portion size (Fiselier et al., 2006; Grob et al.,2003). However, few studies have been conducted on the effectof thawing practices on acrylamide formation. Tuta and co-authors(2010) have recently shown that microwave thawing of par-friedpotato strips reduced the acrylamide formation by 89% (fryingtemperature of 180 �C), but a shorter frying time was used forthe thawed par-fried potato strips than for the unthawed potatostrips. Nevertheless, drawing a conclusion on the contribution ofthawing practices to the concentration of acrylamide has to bedone with care. In our observational study, we only measuredthe (initial) frying temperatures, but not the temperature dropover the frying time. Furthermore, it is interesting to note that fry-ing instructions on the packaging, commonly recommended not tothaw the frozen par-fried potatoes before frying, to obtain crispierFrench fries (Lou, 2005; Products, 2009). Further research might benecessary to obtain an insight into the effect of thawing practicesand corresponding frying temperature profiles on the formationof acrylamide. These insights, may have implications on how fryinginstructions on the packaging should be designed (with regard tothawing, besides frying temperature and time) to prevent highacrylamide concentrations in French fries.
When considering our data to reflect FSE as a whole, a 6.8-folddifference in magnitude (from 150 to 1023 lg/kg) in acrylamideconcentrations was found with a median at 256 lg/kg. The medianreported in this study is consistent with Mills and co-authors(2009) who found that the median was 250 lg/kg from approxi-mately 710 samples of French fries (data were taken from theEuropean Union acrylamide monitoring database). Mills and co-authors (2009), however, reported a higher, i.e. a 35-fold differencein magnitude (from 100 to 3500 lg/kg) in acrylamide concentra-tions than our results.
5. Conclusion
In this study, we found that the variation in actual fryingtemperature contributed most to the variation in acrylamide con-centrations, followed by the variation in actual frying time (to alesser extent). We found no obvious effect of reducing sugars.The lack of standardised control of frying temperature and fryingtime (due to inadequate frying equipment) and the variable prac-tices of food handlers seem to contribute most to the large varia-tion and high acrylamide concentrations in French fries preparedin the R type as compared to the other FSE types. The findingsupports our previous discussions about the potential impact ofthe food handler’s behaviour on the variation in food safety andquality (Luning & Marcelis, 2006; Luning & Marcelis, 2007; Sannyet al., 2010). Acrylamide concentrations in French fries as high as1023 lg/kg was obtained in the restaurant type of FSE. Our studyconfirms that high acrylamide concentrations may occur if no spe-cific controls on the influencing factors and people practices aretaken in the preparation of French fries. The obtained insights inthis study can be used to develop dedicated quality control mea-sures in FSE, which may contribute to a sustainable reduction inacrylamide intake. Subsequent studies will focus on investigatingthe effects of technological (focused on raw material properties)and managerial control interventions (focused on food handlers)on the variation of acrylamide concentrations in French fries pre-pared under FSE circumstances.
Acknowledgments
The research is performed as part of project E/4710-1 (Assess-ing risk of acrylamide in French fries production in Malaysian food

142 M. Sanny et al. / Food Chemistry 132 (2012) 134–143
service establishments from a techno-managerial approach), sup-ported by the International Foundation for Science. We thank TuanHj. Jamal Khair bin Hashim and Puan Arnida binti Anuar from theFood Safety and Quality Division, Selangor State Health Depart-ment of Malaysia in obtaining the permission from the CFS toparticipate in this study. We also thank Mohd. Hamdi bin Baharud-din from the Centre of Excellence for Food Safety Research, Facultyof Food Science and Technology, Universiti Putra Malaysia, who as-sisted in the reducing sugars and acrylamide analyses. Finally, wethank all FSEs who were involved in sampling and data collection.
References
Al-Kahtani, H. A. (1991). Survey of quality of used frying oils from restaurants.Journal of the American Oil Chemists Society, 68(11), 857–862.
Amrein, T. M., Andres, L., Escher, F., & Amado, R. (2007). Occurrence of acrylamide inselected foods and mitigation options. Food Additives and Contaminants, 24,13–25.
Amrein, T. M., Bachmann, S., Noti, A., Biedermann, M., Barbosa, M. F., Biedermann-Brem, S., et al. (2003). Potential of acrylamide formation, sugars, and freeasparagine in potatoes: A comparison of cultivars and farming systems. Journalof Agricultural and Food Chemistry, 51(18), 5556–5560.
Amrein, T. M., Limacher, A., Conde-Petit, B., Amado, R., & Escher, F. (2006). Influenceof thermal processing conditions on acrylamide generation and browning in apotato model system. Journal of Agricultural and Food Chemistry, 54(16),5910–5916.
Amrein, T. M., Schonbachler, B., Rohner, F., Lukac, H., Schneider, H., Keiser, A., et al.(2004). Potential for acrylamide formation in potatoes: Data from the 2003harvest. European Food Research and Technology, 219(6), 572–578.
Becalski, A., Lau, B. P. Y., Lewis, D., Seaman, S. W., Hayward, S., Sahagian, M., et al.(2004). Acrylamide in French fries: Influence of free amino acids and sugars.Journal of Agricultural and Food Chemistry, 52(12), 3801–3806.
Becalski, A., Lau, B. P. Y., Lewis, D., Seaman, S. W., & Sun, W. F. (2005). Determinationof acrylamide in various food matrices. In M. Friedman & D. S. Mottram (Eds.),Chemistry and safety of acrylamide in food. Springer Science + Business Media,Inc.
Bland, J. M., & Altman, D. G. (1996). Statistics notes: Transformations, means, andconfidence intervals. BMJ, 312(7038), 1079.
Burr, H. K. (1971). FROZEN FRENCH-FRIED POTATOES. Effects of thawing andholding before finish frying and their nonrelation to starch retrogradation.Journal of Food Science, 36(3), 392–394.
CFS (2011). Centre for Food Safety: Trade Guidelines on Reducing Acrylamide inFood Retrieved 20 April 2011. Available from <http://www.cfs.gov.hk/english/food_leg/files/Draft_Guidelines_Reduce_Acrylamide_in_Food_e.pdf>.
Claeys, W. L., Baert, K., Mestdagh, F., Vercammen, J., Daenens, P., de Meulenaer, B.,et al. (2010). Assessment of the acrylamide intake of the Belgian population andthe effect of mitigation strategies. Food Additives and Contaminants – Part AChemistry, Analysis, Control, Exposure and Risk Assessment, 27(9), 1199–1207.
Dallal, G. E. (2009). Logarithms. Retrieved from <http://www.jerrydallal.com/LHSP/logs.htm>.
De Vleeschouwer, K., Plancken, I. V. d., Van Loey, A., & Hendrickx, M. E. (2008). Thekinetics of acrylamide formation/elimination in asparagine-glucose systems atdifferent initial reactant concentrations and ratios. Food Chemistry, 111(3),719–729.
DiNovi, M. (2006). US FDA/CFSAN. The 2006 Exposure Assessment for Acrylamide.Retrieved from <http://www.cfsan.fda.gov/~dms/acryexpo/acryex4.htm>.
Dybing, E., & Sanner, T. (2003). Risk assessment of acrylamide in foods. ToxicologicalSciences, 75(1), 7–15.
FAO/WHO (2002). FAO/WHO Consultation on the health Implications of Acrylamidein Food Retrieved from <http://www.who.int/foodsafety/publications/chem/en/acrylamide_full.pdf>.
FAO/WHO (2005). Joint FAO/WHO Expert Commitee on Food Additives, Sixty-fourthmeeting, Summary and Conclusions Retrieved from <http://www.who.int/ipcs/food/jecfa/summaries/summary_report_64_final.pdf>.
FAO/WHO (2007). Joint FAO/WHO Food Standards Programme CODEX Committeeon Contaminants in Foods. Proposed draft code of practice for the reduction ofacrylamide in food Retrieved from <ftp://ftp.fao.org/codex/cccf1/cf01_15e.pdf>.
Fiselier, K., Bazzocco, D., Gama-Baumgartner, F., & Grob, K. (2006). Influence of thefrying temperature on acrylamide formation in French fries. European FoodResearch and Technology, 222(3–4), 414–419.
Fiselier, K., & Grob, K. (2005). Legal limit for reducing sugars in prefabricatestargeting 50 lg/kg acrylamide in French fries. European Food Research andTechnology, 220(5–6), 451–458.
Friedman, M. (2003). Chemistry, biochemistry, and safety of acrylamide. A review.Journal of Agricultural and Food Chemistry, 51(16), 4504–4526.
Garner, R. (2010). The Joy of Stats: A Short Guide to Introductory Statistics in theSocial Sciences Available from <http://books.google.com.my/books?id=sl_mrrxEtjIC&pg=PA166&lpg=PA166&dq=The+Joy+of+Stats+and+log+transformation&source=bl&ots=SLSfB–r8C&sig=b_LAkWkvqtSNetPe3p9uZF1a1bc&hl=en#v=onepage&q&f=false>.
Gere, A. (1985). A survey on operating conditions and quality of commercial fryingfats in Hungary. Zeitschrift fuÌ̂r ErnaÌ̂hrungswissenschaft, 24(2), 120–132.
Gertz, C., Klostermann, S., & Kochhar, S. P. (2003). Deep frying: The role of waterfrom food being fried and acrylamide formation. OCL – Oleagineux Corps GrasLipides, 10(4), 297–303.
Gokmen, V., & Senyuva, H. Z. (2006). Study of colour and acrylamide formation incoffee, wheat flour and potato chips during heating. Food Chemistry, 99(2),238–243.
Grob, K. (2007). Options for legal measures to reduce acrylamide contents in themost relevant foods. Food Additives and Contaminants, 24(supp 1), 71–81.
Grob, K., Biedermann, M., Biedermann-Brem, S., Noti, A., Imhof, D., Amrein, T., et al.(2003). French fries with less than 100 lg/kg acrylamide. A collaborationbetween cooks and analysts. European Food Research and Technology, 217(3),185–194.
Haase, N. U. (2006). The formation of acrylamide in potato products. In K. Skog & J.Alexander (Eds.), Acrylamide and other hazardous compounds in heat-treatedfoods. Woodhead Publishing Limited.
Hopkins, W. G. (2003). A New View of Statistics Retrieved 21 November 2010.Available from <http://www.sportsci.org/resource/stats/logtrans.html>.
Jung, M. Y., Choi, D. S., & Ju, J. W. (2003). A novel technique for limitation ofacrylamide formation in fried and baked corn chips and in French fries. Journalof Food Science, 68(4), 1287–1290.
Knol, J. J., Van Loon, W. A. M., Linssen, J. P. H., Ruck, A. L., Van Boekel, M. A. J. S., &Voragen, A. G. J. (2005). Toward a kinetic model for acrylamide formation in aglucose-asparagine reaction system. Journal of Agricultural and Food Chemistry,53(15), 6133–6139.
Konings, E. J. M., Baars, A. J., van Klaveren, J. D., Spanjer, M. C., Rensen, P. M.,Hiemstra, M., et al. (2003). Acrylamide exposure from foods of the Dutchpopulation and an assessment of the consequent risks. Food and ChemicalToxicology, 41(11), 1569–1579.
Lindsay, R. C., & Jang, S. (2005). Chemical intervention strategies for substantialsuppression of acrylamide formation in fried potato products. In M. Friedman &D. S. Mottram (Eds.), Chemistry and safety of acrylamide in food (pp. 393–404).Springer Science + Business Media, Inc.
Lou, L. (2005). Recipe: Freezing potatoes, hash browns, and French fries Retrieved25 February, 2011. Available from <http://www.recipelink.com/mf/20/6643>.
Luning, P. A., & Marcelis, W. J. (2006). A techno-managerial approach in food qualitymanagement research. Trends in Food Science and Technology, 17(7),378–385.
Luning, P. A., & Marcelis, W. J. (2007). A conceptual model of food qualitymanagement functions based on a techno-managerial approach. Trends in FoodScience and Technology, 18(3), 159–166.
Matthaus, B., Haase, N. U., & Vosmann, K. (2004). Factors affecting the concentrationof acrylamide during deep-fat frying of potatoes. European Journal of LipidScience and Technology, 106(11), 793–801.
Matthys, C., Bilau, M., Govaert, Y., Moons, E., De Henauw, S., & Willems, J. L. (2005).Risk assessment of dietary acrylamide intake in Flemish adolescents. Food andChemical Toxicology, 43(2), 271–278.
Mehta, U., & Swinburn, B. (2001). A review of factors affecting fat absorption in hotchips. Critical Reviews in Food Science and Nutrition, 41(2), 133–154.
Mills, C., Mottram, D. S., & Wedzicha, B. L. (2009). Acrylamide. In R. H. Stadler & D. R.Lineback (Eds.), Process-induced food toxicants: Occurence, formation, mitigation,and health risks. New Jersey: John Wiley & Sons, Inc.
Morley-John, J., Swinburn, B. A., Metcalf, P. A., Raza, F., & Wright, H. (2002). Fatcontent of chips, quality of frying fat and deep-frying practices in New Zealandfast food outlets. Australian and New Zealand Journal of Public Health, 26(2),101–106.
Mottram, D. S., Wedzicha, B. L., & Dodson, A. T. (2002). Acrylamide is formed in theMaillard reaction. Nature, 419(6906), 448–449.
O’Connor, C. J., Fisk, K. J., Smith, B. G., & Melton, L. D. (2001). Fat uptake in Frenchfries as affected by different potato varieties and processing. Journal of FoodScience, 66(6), 903–908.
Petrie, A., & Sabin, C. (2009). Medical Statistics at a Glance Available from <http://books.google.com.my/books?id=upQ5tlFEc 1sC&pg=PA30&lpg=PA30&dq=coefficient+of+variation+and+transformed+data&source=bl&ots=RM2e-0MIY0&sig=o7xU5RvY_DZXOpkopoHXJG28QKU&hl=en#v=onepage&q&f=false>.
Products, M. A. (2009). French Fries Retrieved 4 April 2011, 2011. Available from<http://trade.indiamart.com/details.mp?offer=1235038762>.
RC, I. A. (1994). Some Industrial chemicals, Lyon: IARC. IARC Monograph on theEvaluation for Carcinogenic Risk of Chemicals to Human, 60, 435–453.
Romani, S., Bacchiocca, M., Rocculi, P., & Rosa, M. D. (2008). Effect of frying time onacrylamide content and quality aspects of French fries. European Food Researchand Technology, 226(3), 555–560.
Romani, S., Gasparri, A., Bacchiocca, M., Cocci, E., Rocculi, P., & Dalla Rosa, M. (2006).Acrylamide content and quality characteristics of potatoes fried in differentfryers. Contenuto in acrilammide e caratteristiche qualitative di patate fritte indifferenti friggitrici, 45(460), 766–771.
Sanny, M., Luning, P. A., Marcelis, W. J., Jinap, S., & van Boekel, M. A. J. S. (2010).Impact of control behaviour on unacceptable variation in acrylamide in Frenchfries. Trends in Food Science and Technology, 21(5), 256–267.
Shahar, S. S., Ghazali, R., Yusoff, N. A. M., Safii, N. S., Manaf, Z. A., & Noah, S. A. M.(2002). Atlas of food exchanges and portion sizes. Kuala Lumpur: MDC PublishersPrinters Sdn. Bhd.
Stadler, R. H., Blank, I., Varga, N., Robert, F., Hau, J., Guy, P. A., et al. (2002).Acrylamide from Maillard reaction products. Nature, 419(6906), 449–450.
Svensson, K., Abramsson, L., Becker, W., Glynn, A., Hellenas, K. E., Lind, Y., et al.(2003). Dietary intake of acrylamide in Sweden. Food and Chemical Toxicology,41(11), 1581–1586.

M. Sanny et al. / Food Chemistry 132 (2012) 134–143 143
Tareke, E., Rydberg, P., Karlsson, P., Eriksson, S., & Tornqvist, M. (2000). Acrylamide:A cooking carcinogen? Chemical Research in Toxicology, 13(6),517–522.
Tareke, E., Rydberg, P., Karlsson, P., Eriksson, S., & Tornqvist, M. (2002). Analysis ofacrylamide, a carcinogen formed in heated foodstuffs. Journal of Agricultural andFood Chemistry, 50(17), 4998–5006.
Tuta, S., Palazoglu, T. K., & Gokmen, V. (2010). Effect of microwave pre-thawing offrozen potato strips on acrylamide level and quality of French fries. Journal ofFood Engineering, 97(2), 261–266.
Vivanti, V., Finotti, E., & Friedman, M. (2006). Level of acrylamide precursorsasparagine, fructose, glucose, and sucrose in potatoes sold at retail in Italy andin the United States. Journal of Food Science, 71(2), C81–C85.


