Embed Size (px)
Citation preview

Potential Mature StudentsRecruitment to HEProfessor Alistair Ross, Dr Louise Archer, Dr Merryn HutchingsInstitute for Policy Studies in Education
Professor Robert GilchristSTORM
David ThompsonLondon Borough of Hillingdon
with
Charine JohnIPSE
and
Kalliope AkantziliotouSTORM
Research Report RR385
RESEARCH

Research Report No 385
Potential Mature Students Recruitment to HE
Professor Alistair Ross, Dr Louise Archer, Dr Merryn Hutchings Institute for Policy Studies in Education
Professor Robert Gilchrist
STORM
David Thomson London Borough of Hillingdon
with
Charine John
IPSE
and
Kalliope Akantziliotou STORM
The views expressed in this report are the authors' and do not necessarily reflect those of the Department for Education and Skills. © Queen’s Printer 2002. Published with the permission of DfES on behalf of the Controller of Her Majesty's Stationery Office. Applications for reproduction should be made in writing to The Crown Copyright Unit, Her Majesty's Stationery Office, St Clements House, 2-16 Colegate, Norwich NR3 1BQ. ISBN 1 84185 852 8 December 2002

2

3
CONTENTS List of Tables List of Figures Executive Summary p.6 SECTION A: MATURE STUDENTS
Demographics and projections p.11 Characteristics of mature students, mature study trends p.25
SECTION B: POTENTIAL STUDENTS/ NON-PARTICIPANTS
Mature non-participants p. 43 Modelling potential mature participation p.58
Literature on mature students and factors affecting participation p.61
Literature on retention p.68
SECTION C: ENTRY ROUTES Data analysis of entry routes (UCAS and HESA) p.74 Literature on Entry Routes p.87 SECTION D: POLICY CHANGES AND FUTURE TRENDS
Student Finance and Support p.90 CONCLUSIONS AND RECOMMENDATIONS p.95 REFERENCES p.98 APPENDIX Basic Time Series Analyses

4
List of Tables
1 Actual and Estimated size of 21 – 30 population of England by social class, 1993 - 2011
2 Percentages and numbers of 21-30 year olds by social class who have Higher Education qualifications as their highest level of attainment, 2001 – 2011 projections
3 Percentage of total of HE participants from each social class who are enrolled in HE at different ages on full-time courses
4 HE participants from each social class who commence higher education: Cumulative percentage admitted by each age
5 Full-time participation in Higher Education under 21 and over 21, indicating the
potential for mature student participation in HE by social class.
6 Percentage of those with A, AS or degree qualifications at age 21
7 Projecting the 21-30 population who will have entry level qualifications by age 21 but will not enter HE by the age of the 30
8 Full-time students, 1996 – 2000, proportion of mature students
9 Gender of full-time mature students, 1996 - 2000
10 Numbers of Home Students, Full-time, England domiciled students, UCAS and HESA returns
11 Enrolment by mode and level, all students, 1994 – 2000
12 HE full-time entry by social class and age, 2000 13 Proportions of ethnic groups in the age group 20/21 – 29: total population and
population enrolling as full-time students
14 Most popular subjects of choice for non-mature and mature student study, 1996 and 2000: % of full-time students studying selected subjects, by age on enrolment
15 Relationship between highest qualification in QLF Surveys and NVQ levels
16 21-30 year old British Nationals by highest qualification (NVQ equivalents) 1996-2000
17 21-30 year old British nationals with at least a Level 2 qualification but without a Level 4 qualification: gender, class and age characteristics: Percentage by gender and class within age group
18 Either Highest Qualification held, or Highest Qualification being studied for, by age, gender, ethnicity and social class, England resident British nationals 1998-2000: Percentage within gender/ age/ ethnic/ class group
19 Estimated numbers of England residents 2000 by Highest Qualification held or being studied for by age, gender, ethnicity and social class
20 Economic activity, 21-30 year olds with level 3 highest qualification not studying in higher education
21 Time elapsed since leaving last job, 21-30 year olds with level 3 highest qualification not studying in higher education and not in employment
22 Study Level of those with a level 3 highest qualification, but not studying at higher than Level 3. 21-30 year old British nationals

5
23 Major occupation group, 21-30 year old British nationals in employment (excluding full-time students) by highest qualification (percentages)
24 Major occupation groups, 21-30 year old British nationals with a level 3 highest qualification not studying higher education and in employment (excluding full-time students) by age and gender
25 Main occupation by industry sector, 21-30 year old British nationals with a level 3 highest qualification not studying higher education in employment (excluding full-time students) by gender
26 Odds Ratios
27 HESA derivation of Highest Qualifications on entry to Higher Education
28 Qualifications on entry into full-time degree level courses, by age on entry, 1998 – 2000 (Autumn entry only)
29 Qualifications on entry for entrants aged 21 - 30, all higher education courses, by mode, 1998 – 2000 (Autumn entrants only)
List of Figures
1 Highest level of attainment, 21 - 30 year olds, England: Actual 1994 – 2001; Projections to 2011 – social class I
2 Highest level of attainment, 21 - 30 year olds, England: Actual 1994 – 2001, Projections to 2011 – social class II
3 Highest level of attainment, 21 - 30 year olds, England: Actual 1994 – 2001, Projections to 2011 – social class IIIn
4 Highest level of attainment, 21 - 30 year olds, England: Actual 1994 - 2001, Projections to 2011 – social class IIIm
5 Highest level of attainment, 21 - 30 year olds, England: Actual 1994 - 2001, Projections to 2011 – social class IV
6 Highest level of attainment, 21 - 30 year olds, England: Actual 1994 - 2001, Projections to 2011 – social class V
7 Highest level of attainment, 21 - 30 year olds, England: Actual 1994 - 2001, projections to 2011 – whole population
8 UCAS Entry: Students by age and social class, 1994: Distribution of social class: % of all students enrolling by age on admission
9 UCAS Entry: Students by age and social class, 1997: Distribution of social class: % of all students enrolling by age on admission
10 UCAS Entry: Students by age and social class, 2000: Distribution of social class: % of all students enrolling by age on admission
11 Full-time admission to Higher Education 1996 - 2000, by type of course
12 Full-time admission to Higher Education 1996 - 2000, by type of course and by age
13 Changes in admission numbers by specific ages of entry, full-time mature students
14 Enrolment by mode and level, all students, 1994 – 2000

6
15 Qualification aim of English domiciled home students aged 21 - 30 admitted to HE institutions, Autumn 2000
16 Highest qualification on entry, English domiciled home students aged 21 - 30 admitted to HE institutions, Autumn 2000
17 Ethnicity and Age - 2000 entrants, HND and Degree (UCAS)
18 Numbers of Ethnic Minority students, 2000 full and part-time entry, with age on entry
19 Distribution of ethnic minority groups in the 15 –24 population, Great Britain
20 Changes in ages enrolling full-time in Higher Education, 1996 – 2000: different ethnic groups
21 Numbers of full-time mature students from ethnic minorities starting HE courses each year 1996 – 2000 (age over 21)
22 Mature full-time students by age of enrolment (% of all full-time students enrolling between 21 and 30 year olds)
23 Mature part-time students by age of enrolment (% of all part-time students enrolling between 21 and 30)
24 Numbers of mature students recruited by mode of study, 1998 - 2000, by age on entry
25 Percentages of students in different age bands selecting subjects: 1996 and 2000 full-time enrolments
26 Mature students’ admission to selected subjects, by age on enrolment, 1996 – 2000
27 Cohort 1- those aged 21-22 in 1996
28 Cohort 2- those aged 23-24 in 1996
29 Cohort 3- those aged 25-26 in 1996
30 Odds-Ratios for 21-30 year olds comparing levels as in Table 26
31 Highest Qualification on entry: Full-time students starting undergraduate degree programmes under age 21
32 Highest Qualification on entry: Full-time mature students (21 - 30): full-time and part-time modes of study
33 1994 entry - qualifications for entry to full-time undergraduate courses via UCAS by age
34 2000 entry - qualifications for entry by age
35 Degrees full-time 2000 entry: qualifications as % of age cohort
36 Full-time HNDs 2000 entry: qualifications as % of age cohort
37 Entry qualifications to Degree courses, 2000, students over 21 only (full-time and part-time)
38 Entry qualifications to HND courses, 2000, students over 21 only
39 Changes in highest level on entry to degree courses, full-time mode mature students, by age, 1998 – 2000 (autumn entry).

7
FINAL REPORT
'Potential Mature Students Recruitment to HE' Research Team Prof. Alistair Ross, Dr. Louise Archer, Dr. Merryn Hutchings (Institute for Policy Studies in Education), Prof. Robert Gilchrist (STORM) and Mr. David Thomson (London Borough of Hillingdon) with Ms. Charine John (IPSE) and Ms. Kalliope Akantziliotou (STORM). Executive Summary Purpose This report addresses issues around why some mature people participate in higher education and others do not, comparing those who enter HE with those who do not. It makes various estimates of the potential for expanding participation in HE by mature people by examining trends in participation and attainment and the propensity of different groups to enter HE. The report primarily draws upon analyses of HESA and UCAS data (in relation to mature students) and Labour Force Survey (LFS) data in relation to mature non-participants. Additional smaller data sets are also drawn upon: the UNL MORI Survey of Attitudes to HE, the DFES MORI Survey of Potential Mature Student Recruitment to HE (headline results only); the Youth Cohort Study, and data from the Office of National Statistics on population trends. Analyses are supplemented by a review of literature relating to mature students. The first section of the report (Section A) provides an examination of trends (and projections) over time in relation to the characteristics of mature students. Section B examines the pool of mature participants and non-participants (‘potential mature students’) and uses statistical modelling to identify factors affecting propensity to participate. There are also sections summarising literature on mature people’s reasons for non/participation and issues around retention (‘non-completion’). The third section of the report (Section C) considers the different Entry Routes used by mature students. Section D examines the role of policy changes and changes within the labour market more generally upon current and future trends in mature student participation. The Appendix provides further details on the analyses undertaken on particular data sets in relation to Basic Time Series analyses.
8
Key Points • Mature students are a significant element of the body of students in higher education. In
this report we define mature students as those who commence their HE study aged 21 or over, and we focus, where statistics allow, on the 21-30 year old group. Some previous reports have defined mature students as those over the age of 25 years.
• A significant proportion of mature students already have higher education qualifications, and are returning to further study at the same undergraduate level. We have tried, wherever possible, to take these students out of our analysis, because our focus is on increasing the proportion of the population who have experience of higher education study.
• Mature students have rather different characteristics to younger students. They tend to
enter higher education without A-level qualifications or the equivalents, unlike younger students. In terms of their background (based on the data available which is not comprehensive) a higher proportion is recruited from social classes IIIn, IIIm, IV and V. This reflects the lack of Level 3/A-level qualifications amongst these groups. It also reflects that, amongst those who do have level 3 qualifications from these social class backgrounds they are more likely than those from higher social class backgrounds to have fewer A-level points or vocational qualifications which are both linked to lower progression rates to HE.
• Mature students over 24 are more likely to be part-time than full-time. However, many
part-time students already have some HE experience and are returning at the same level. Thus they do not contribute to increasing new entrants in HE.
• In general, students from all Black ethnic groups are more likely to be mature than
students from other ethnic groups. • Women are more likely to enter higher education at a younger age than men. Overall,
there are slightly more male mature students than female mature students. • Mature students have particular subject choices, which are different to those of younger
students. Business and Management, Subjects Allied to Medicine, Performing Arts, Mathematics and IT are all more popular with mature students than with younger students. Social subjects are popular in both categories, mature and non-mature.
• Relatively few people from professional backgrounds over 21 who have not experienced
Higher Education, and thus the principal potential source of mature students will be necessarily from non-professional backgrounds. Although the proportion of these with A-level qualifications is not high, some members of these groups are gaining Level 3 qualifications, and form a more qualified potential pool. These qualifications tend to be largely gained by 26, which would indicate a suitable age range on which to focus recruitment. A larger proportion of members of Black, Asian Bangladeshi and Asian Pakistani communities are found in the potential pool in comparison with other ethnicities.
• Generally, the largest numbers of non-participants with Level 3 qualifications appear to
be amongst skilled manual males and skilled non-manual females. There are also qualified non-participants in the professional and intermediate classes, particularly among 27-30 year olds.
9
• Attitudinal factors affect the propensity of the 21-30 year old working class to enter HE. 'Belief in one's own ability' and having 'no preference for earning money' are significant positive indicators of an interest in HE entry, as are a belief in being able to 'better' oneself through HE study and a lack of inhibiting responsibilities. Whatever the level of qualification, these attitudinal effects appear to be the same.
• Amongst mature students there are a wide range of qualifications used to gain entry to
Higher Education. These vary by the type of course being undertaken – for example, undergraduate degree courses compared to HNDs – the mode of study, by age of the student, by the student’s social class background, and by ethnicity. In any consideration of the potential for recruiting mature students, attention must be given to the diversity of potential qualifications used for admission.
• In considering the potential pool of mature students, attention should not only be focussed
on those non-participants in the 21 – 30 year old cohort who have Level 3 qualifications. Whilst, these will continue to be an important source of supply to the mature student market experience shows that mature people with other/lower qualifications are also successfully participating in Higher Education. Indeed, regard should continue to be paid to those with no formal qualifications who, by virtue or their skills demonstrated in the workplace have the potential to benefit from higher education.
• Information about student financial support systems should be made more widely
available to potential applicants, particularly those who are not currently in education. • A single simplified system for allocating financial support would increase potential
students’ ability to assess their financial commitments in taking on HE study. • Mature women may face particular personal, domestic and child care problems in
participating. Extra targeted resources are needed to encourage mature women students and to support them on courses.
• Being a mature student highlights worries about identity. Changing identity pressures
bear particularly on women students, characterised by sense of loss and separation and/or high social risk.
• A clear conclusion from the literature surveyed is that successful teaching of mature
students who enter HE through non-standard routes involves the provision of extra time and support. This was acknowledged both by HEIs that do take on such students in large numbers, and by those that do not, as well as by those involved in Access courses. Thus, if they are to be successful, HEIs admitting mature students with non-standard qualifications require funding regimes to support both the recruitment and retention of these students.
• Some institutions are more successful at attracting and supporting mature students than
others. These institutions should be encouraged to identify good and effective practices, and to share these with other institutions1.
• The data that is maintained on students is not consistent over time, and different data sets
are collected for different purposes and have different coverage. This can make it difficult
1 Good practice guides have recently been produced by HEFCE and UUK published Social Class and Participation in Higher Education: From Elitism to Inclusion 2 in March 2002); and HEFCE are evaluating their widening participation strategy.

10
to analyse trends in HE over long periods and to make comparisons between different data sets.

11
SECTION A This section examines the characteristics of participants in Higher Education, with a particular emphasis on those in the 21 to 30 age range. It analyses data and trends in participation, comparing the characteristics of those who start their Higher Education experiences before they are 21 with those who enter between 21 and 30. Projections are made by extrapolating existing participation trends forward. This assumes that recent trends will continue.

12
(I) MATURE STUDENTS Class Demographics, Enrolment into HE, Projections of Participation for General Population and by Social Class (1994-2011) The proportion of the 18 - 30 age range that participates in Higher Education has increased each year for several decades. Participation over the last five years has increased steadily but at a slower pace than during the late 1980s and early 1990s. It has been suggested that this stagnation of post-compulsory educational participation rates may be the result of regional or macro economic factors (Clark- CEE DP24, April 2002). To identify the potential nature and size of the population who might enter Higher Education as mature students, the first section of this report describes and analyses younger students, who begin their studies before the age of 21. Having identified this group, we can then identify more accurately the remaining part of the population that could be potential mature students, currently and in the future. This is combined with an initial attempt to project current rates of change over the next decade. This has been done separately for each social class, because there is evidence that participation varies between such groups more than any other factor. This may partly be a consequence of other factors that are associated both with social class and the propensity to enter higher education. Social class is generally considered to be one of an individual’s ascribed characteristics in the early stages of their life, so a person before the age of 21 is generally assigned to the social class determined by their parents’ occupations. It has long been acknowledged that a disproportionate number of young people from the professional social classes have been recruited into higher education, compared to young people from the working classes. This has largely followed lower working class achievement in the statutory phase of education, and in particular lower working class attainment of A-levels. In terms of entry into higher education at the ages of between 18 and 21, the real question may be why people from working class backgrounds do not undertake post compulsory academic qualifications at the age of 16, not after the age of 18. Whatever the causal relationships may be, it will be shown that this means that there will be relatively few people from professional backgrounds over 21 who have not experienced Higher Education, and thus the principal potential source of mature students will be necessarily from amongst those of working class origin. There are considerable difficulties in analysing participation rates at different ages, because social class is not constant. As will be made clear throughout this report, many of the data sets we have used (especially the LFS) recorded social class after the attainment of a qualification or the completion of higher education, and subsequent employment. Figures thus overestimate the numbers of people from professional and intermediate backgrounds attaining higher education qualifications. In later life, social class is more generally considered an achieved characteristic, determined by the individual’s own occupational attainment. Since social class early in life influences educational attainment at school, the attainment of traditional entry qualifications for university entry at eighteen is clearly differentiated by social class (e.g. Himmelweit 1954; Halsey et al., date; Robertson and Hillman, 1997). The situation for mature students or potential mature students is more difficult to analyse, because most data for the adult population is collected on the basis of current social status. Thus, for example, the Quarterly Labour Force Survey data (QLFS) on 21 to 30 year olds records the highest educational attainment level by social class. As many professional positions (by definition social class I and II) now require degree-level training and

13
qualifications, it is unsurprising that a high proportion of this group have HE level qualifications. However, this does not necessarily reflect their social class origins – although, given the correlation between school attainment and social class, in many cases it will do so. The difficulty in determining changes in the social status of mature HE entrants is compounded by the recording of mature students’ social class by their own employment status at the time of application to an HE course, which may not reflect their social class during their school life. Moreover, the social class of many mature entrants will not be recorded at all. This is because many mature students do not apply through UCAS, either because they study part-time or because they apply directly to institutions. Despite these important caveats, the first projections in this report start from the basis of the existing data about participation, both mature (generally based on social class at the time of the data collection) and ‘traditional’ (pre 21 enrolment) HE entry (based on parental socio-economic group or parental social class depending on the data source used). We have generally in this report used data classified by the Registrar General’s Social Class categories. This is currently being replaced by a new classification of National Statistics Socio-economic Classification (NS SEC). This has not been used here because the data sources we use have been prepared on the basis of the Social Class categories: the raw data on occupations was not available for re-categorisation. Social Class in this report is referred to by Roman numbers (I, II, IIIn (non-manual), IIIm (manual), IV and V). We have also on occasion used data classified by Social Grade, a system similar to the Registrar General’s classification, but one devised and used by the Market Research Society. Social Grade in this report is referred to by letters (A, B, C1, C2, D and E). In practice these two classifications are very similar. The data from the Youth Cohort Study is classified by socio-economic group (SEG). This classification aims to bring people together with similar social and economic status. It is derived from occupational unit group, employment status and size of employment. The projections that follow simply extrapolate existing trends, which over the relatively short time-span involved is an approximation that will be indicative of the scale of the issue. Later in this report more complex analysis generates estimates of the size and nature of the pool of potential mature entrants and we have statistically modelled the factors associated with entering HE amongst mature people from working class backgrounds. We start by estimating the population aged 21-30 in each social class from 1993-2011 (see Table 1). The proportion of the population in each class is not static, but the Office of National Statistics does not publish projections of the future class composition of the population. The QLFS sample can be used to detect the changes in the relative proportions of the population in each social class over the past nine years, and if the assumption is made that the same trend will continue over the next decade (see appendix) we can make a projection of the proportions of the future population in each class.2 As the Government Actuary makes projections of the total size of the resident population of England for each year of the next decade by age, it is possible, by combining this with the estimated proportion of the population in each social class derived from the LFS, to estimate the actual size of each social class.
2 It would be possible, if time was available, to calculate more informed projections for changes in the size of each social class, for example, using the Institute for Employment Research’s projections of occupations.

14
Table 1: Actual and Estimated size of 21 – 30 population of England by social class, 1993 - 2011
Size of Social Class 21 – 30 (thousands) Year
Population 21– 30 (‘000) I II IIIn IIIm IV V
1993 7,732 425 2064 2142 1639 1121 286 1994 7,605 430 2054 2108 1582 1103 275 1954 7,435 431 2032 2063 1517 1078 262 1996 7,242 431 2002 2012 1448 1050 249 1997 7,036 429 1967 1956 1379 1020 236 1998 6,833 427 1931 1901 1312 991 223 1999 6,697 429 1914 1865 1259 971 213 2000 6,612 433 1910 1843 1217 959 204 2001 6,546 439 1911 1826 1178 949 196 2002 6,457 442 1906 1803 1137 936 188 2003 6,390 447 1906 1786 1099 927 181 2004 6,366 455 1919 1781 1070 923 174 2004 6,381 466 1943 1787 1046 925 169 2006 6,437 480 1980 1804 1030 933 165 2007 6,526 496 2028 1831 1018 946 162 3008 6,643 515 2085 1865 1010 963 159 2009 6,773 535 2147 1903 1002 982 156 2010 6,855 552 2194 1928 987 994 152 2011 6,914 567 2235 1946 968 1003 147
Sources: England population, 1993 – 2000: Estimated resident population at mid-2000 Population Estimates Unit, ONS; 2001 – 2011: Population projections by the Government Actuary, 2000 base (all by individual year of age); social class calculated from the 21- 30 year old data, 1993 – 2001, with trend line established over this period and projected to 2011. Note that the social class data is based on the percentage of respondents in the sample who were in employment, not the whole population, and has been used to estimate the social class composition of the whole population. This is simplistic and this approach is likely to overestimate those in the higher social classes and underestimate those in the lower social classes. Using the estimates of the size of each social class in Table 1 as a starting point, we have next projected the number of those within each social class who have a Higher Education qualification (and those who have A or other level 3 qualifications, and those with level 1 and 2 qualifications). These projections are generated by estimating LFS data for the last nine years, to establish the trend in the proportion of the population in each social class who have a HE qualification and extrapolating this forward. The analysis of highest qualification is based on the percentage in each social class (based on those in employment) who have HE qualifications. This allows the calculation of the percentage of each class that is projected to have successfully completed HE between 2002 and 2011. This in turn has been used to calculate, using the National Population projections for England, the projected size of the population for each class for these years (Figures 1 to 7). Figure 1: Highest level of attainment, 21 - 30 year olds, England:
Actual 1994 – 2001; Projections to 2011 – social class I
0100200300400500600
1993
1995
1997
1999
2001
2003
2005
2007
2009
2011
num
ber (
'000
s)
totalpopulationHEqualificationA level andequivalentOtherNoneP: HEP: A levelP: OtherP: NoneLevel 1 and 2
no qualification
projected HEqualifications
projected A level &equivalent
projected Level 1 & 2
projected noqualifications
0
100
200
300
400
500
600
1993
1995
1997
1999
2001
2003
2005
2007
2009
2011
num
ber (
'000
s)
totalpopulationHEqualif icationA level andequivalentOther
None
P: HE
P: A level
P: Other
P: None
Level 1 and 2
no qualification
projected HEqualifications
projected A level &equivalent
projected Level 1 & 2
projected noqualifications
15
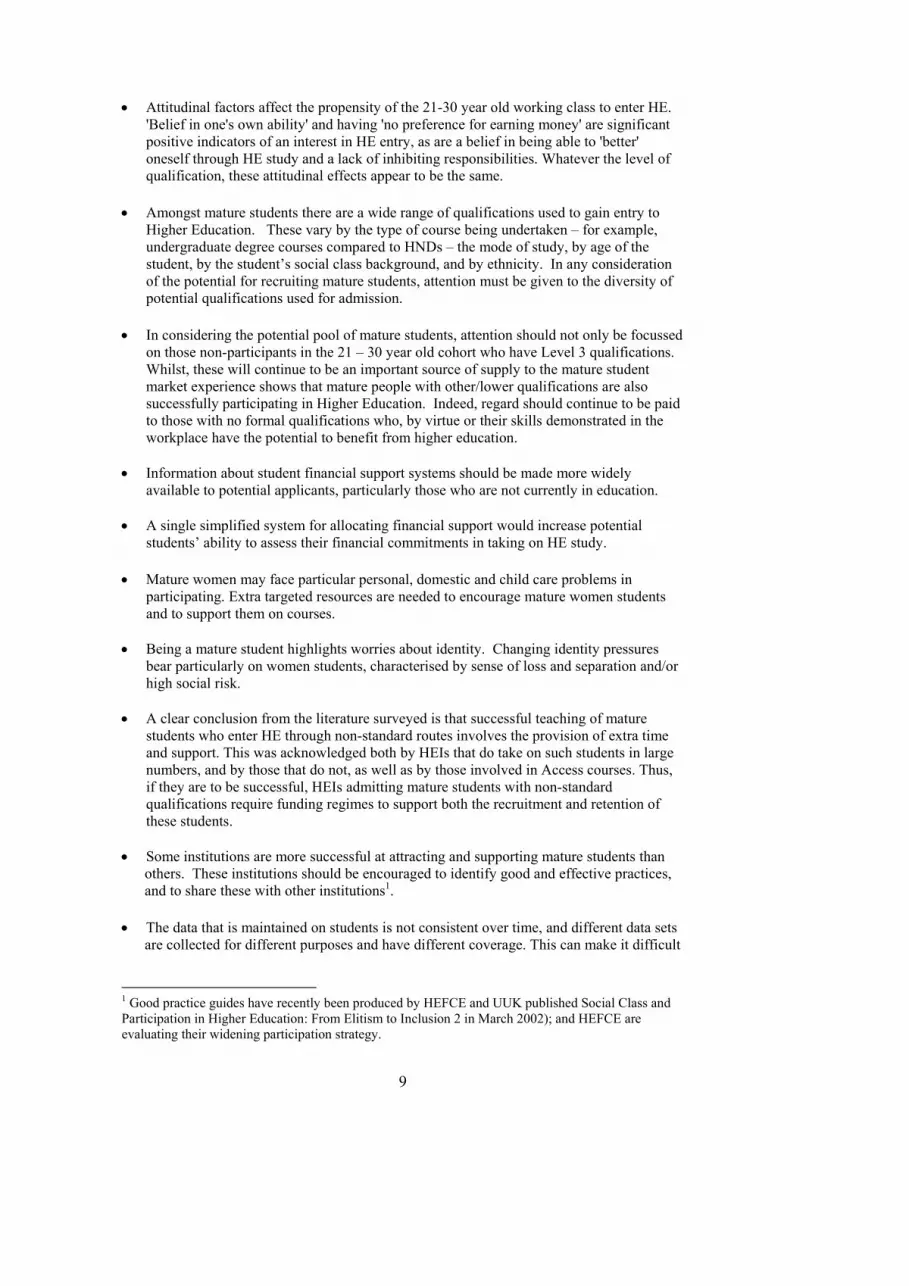
Source: QLFS trend in the percentage of 21-30 population in social class I with different highest qualifications extrapolated from estimated trends in the population in social class I and the extrapolated estimated trend in the proportion of the population in social class I holding different levels of qualification as their highest qualification. Solid markers indicate actual numbers, 1993–2001; Hollow markers for qualifications indicate projected numbers 2001-2011 based on trends in percentage of population in 1993-2001 period. Figure 2: Highest level of attainment, 21 - 30 year olds, England:
Actual 1994 – 2001, Projections to 2011 – social class II
Source: QLFS trend in the percentage of 21-30 population in social class II with different highest qualifications extrapolated from estimated trends in the population in social class II and the extrapolated estimated trend in the proportion of the population in social class II holding different levels of qualification as their highest qualification]Solid markers indicate actual numbers, 1993–2001; Hollow markers for qualifications indicate projected numbers 2001-2011 based on trends in percentage of population in 1993-2001 period (1993 figures ignored as outlier). Figure 3: Highest level of attainment, 21 - 30 year olds, England:
Actual 1994 – 2001, Projections to 2011 – social class IIIn
0
500
1000
1500
2000
2500
1993
1995
1997
1999
2001
2003
2005
2007
2009
2011
num
ber (
'000
s)
totalpopulationHEqualif icationA level andequivalentOther
None
P: HE
P: A level
P: Other
P: None
Level 1 and 2 no qualification projected HE qualifications
projected A-level & equivalent
projected Level 1 & 2 projected no qualifications

16
Source: QLFS trend in the percentage of 21-30 population in social class IIIn with different highest qualifications extrapolated from estimated trends in the population in social class IIIn and the extrapolated estimated trend in the proportion of the population in social class IIIn holding different levels of qualification as their highest qualification. Solid markers indicate actual numbers, 1993–2001; Hollow markers for qualifications indicate projected numbers 2001-2011 based on trends in percentage of population in 1993-2001 period. Figure 4: Highest level of attainment, 21 - 30 year olds, England:
Actual 1994 - 2001, Projections to 2011 – social class IIIm
Source: QLFS trend in the percentage of 21-30 population in social class IIIm with different highest qualifications extrapolated from estimated trends in the population in social class IIIm and the extrapolated estimated trend in the proportion of the population in social class IIIm holding different levels of qualification as their highest qualification. Solid markers indicate actual numbers, 1993–2001; Hollow markers for qualifications indicate projected numbers 2001-2011 based on trends in percentage of population in 1993-2001 period. Figure 5: Highest level of attainment, 21 - 30 year olds, England:
Actual 1994 - 2001, Projections to 2011 – social class IV
0
200
400
600
800
1000
1200
1993 1995 1997 1999 2001 2003 2005 2007 2009 2011
population
HE qualif ication
A level andequivalentOther
None
P: HE
P: A level
P: Other
P: None
Level 1 and 2 no qualification projected HE qualifications
projected A-level & equivalent
projected Level 1 & 2 projected no qualifications
0
200
400
600
800
1000
1200
1400
1600
1800
1993
1995
1997
1999
2001
2003
2005
2007
2009
2011
num
ber (
'000
s)
population
HEqualif icationA level andequivalentOther
None
P: HE
P: A level
P: Other
P: None
Level 1 and 2 no qualification projected HE qualifications
projected A-level & equivalent
projected Level 1 & 2 projected no qualifications
Deleted: <sp>
Deleted: <sp>

17
Source: QLFS trend in the percentage of 21-30 population in social class IV with different highest qualifications extrapolated from estimated trends in the population in social class IV and the extrapolated estimated trend in the proportion of the population in social class IV holding different levels of qualification as their highest qualification. Solid markers indicate actual numbers, 1993–2001; Hollow markers for qualifications indicate projected numbers 2001-2011 based on trends in percentage of population in 1993-2001 period. Figure 6: Highest level of attainment, 21 - 30 year olds, England:
Actual 1994 - 2001, Projections to 2011 – social class V
Source: QLFS trend in the percentage of 21-30 population in social class V with different highest qualifications extrapolated from estimated trends in the population in social class V and the extrapolated estimated trend in the proportion of the population in social class V holding different levels of qualification as their highest qualification. Solid markers indicate actual numbers, 1993–2001; Hollow markers for qualifications indicate projected numbers 2001-2011 based on trends in percentage of population in 1993-2001 period.
Figure 7: Highest level of attainment, 21 - 30 year olds, England:
Actual 1994 - 2001, projections to 2011 – whole population
0
1000
2000
3000
4000
5000
6000
7000
8000
9000
1993
1995
1997
1999
2001
2003
2005
2007
2009
2011
num
ber (
'000
s)
population
HEqualif icationA level andequivalentOther
None
P: HE
P: A level
P: Other
P: None
Level 1 and 2 no qualification projected HE qualifications
projected A-level & equivalent
projected Level 1 & 2 projected no qualifications
0
50
100
150
200
250
300
350
1993
1995
1997
1999
2001
2003
2005
2007
2009
2011
num
ber (
'000
s)
population
HEqualif icationA level andequivalentOther
None
P: HE
P: A level
P: Other
P: None
Level 1 and 2 no qualification projected HE qualifications
projected A-level & equivalent
projected Level 1 & 2 projected no qualifications
0
1000
2000
3000
4000
5000
6000
7000
8000
9000
1993
1995
1997
1999
2001
2003
2005
2007
2009
2011
num
ber (
'000
s)
population
HEqualif icationA level andequivalentOther
None
P: HE
P: A level
P: Other
P: None
Level 1 and 2 no qualification projected HE qualifications
projected A-level & equivalent
projected Level 1 & 2 projected no qualifications
18
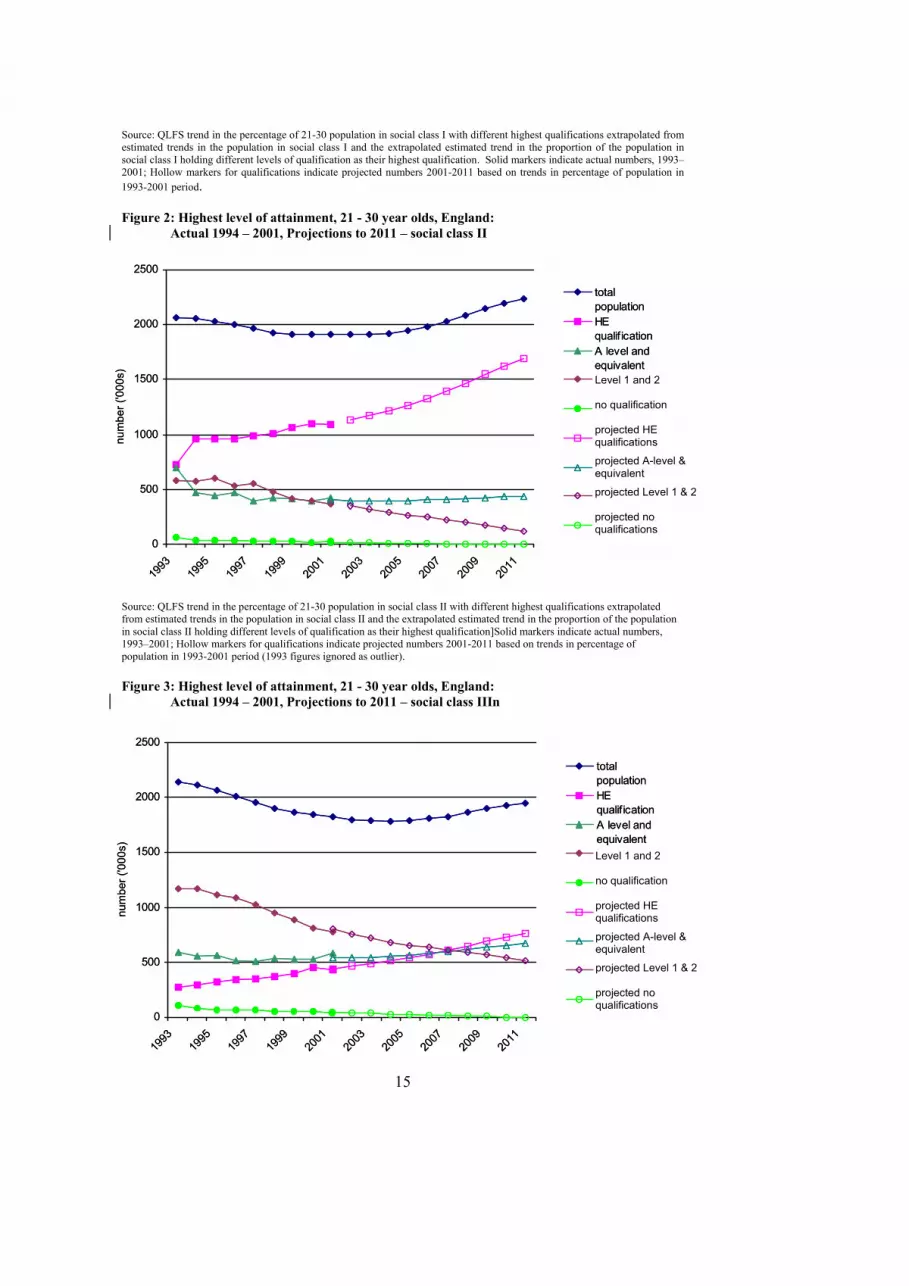
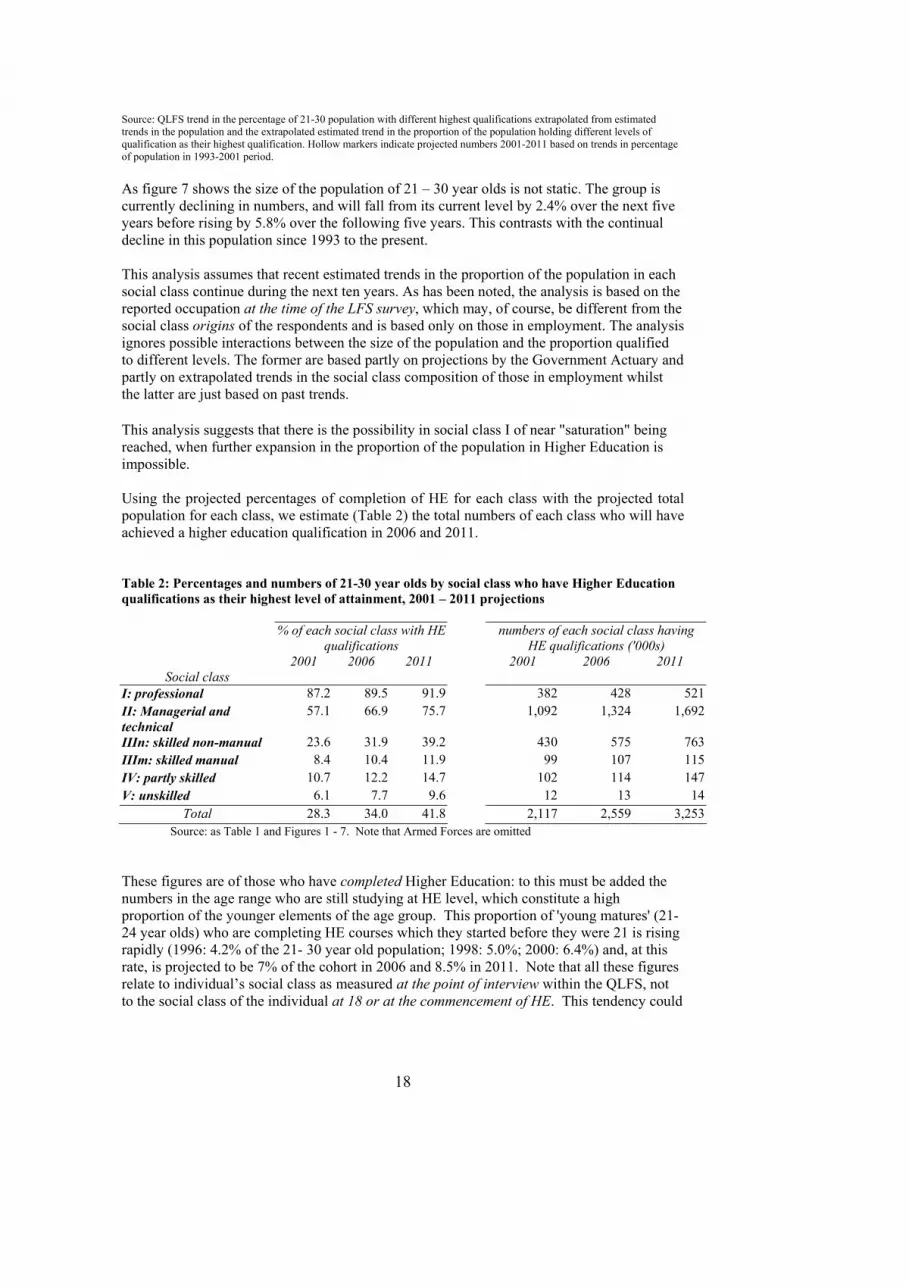
Source: QLFS trend in the percentage of 21-30 population with different highest qualifications extrapolated from estimated trends in the population and the extrapolated estimated trend in the proportion of the population holding different levels of qualification as their highest qualification. Hollow markers indicate projected numbers 2001-2011 based on trends in percentage of population in 1993-2001 period. As figure 7 shows the size of the population of 21 – 30 year olds is not static. The group is currently declining in numbers, and will fall from its current level by 2.4% over the next five years before rising by 5.8% over the following five years. This contrasts with the continual decline in this population since 1993 to the present. This analysis assumes that recent estimated trends in the proportion of the population in each social class continue during the next ten years. As has been noted, the analysis is based on the reported occupation at the time of the LFS survey, which may, of course, be different from the social class origins of the respondents and is based only on those in employment. The analysis ignores possible interactions between the size of the population and the proportion qualified to different levels. The former are based partly on projections by the Government Actuary and partly on extrapolated trends in the social class composition of those in employment whilst the latter are just based on past trends. This analysis suggests that there is the possibility in social class I of near "saturation" being reached, when further expansion in the proportion of the population in Higher Education is impossible. Using the projected percentages of completion of HE for each class with the projected total population for each class, we estimate (Table 2) the total numbers of each class who will have achieved a higher education qualification in 2006 and 2011. Table 2: Percentages and numbers of 21-30 year olds by social class who have Higher Education qualifications as their highest level of attainment, 2001 – 2011 projections
% of each social class with HE qualifications
numbers of each social class having HE qualifications ('000s)
Social class
2001 2006 2011 2001 2006 2011
I: professional 87.2 89.5 91.9 382 428 521 II: Managerial and technical
57.1 66.9 75.7 1,092 1,324 1,692
IIIn: skilled non-manual 23.6 31.9 39.2 430 575 763 IIIm: skilled manual 8.4 10.4 11.9 99 107 115 IV: partly skilled 10.7 12.2 14.7 102 114 147 V: unskilled 6.1 7.7 9.6 12 13 14
Total 28.3 34.0 41.8 2,117 2,559 3,253 Source: as Table 1 and Figures 1 - 7. Note that Armed Forces are omitted These figures are of those who have completed Higher Education: to this must be added the numbers in the age range who are still studying at HE level, which constitute a high proportion of the younger elements of the age group. This proportion of 'young matures' (21-24 year olds) who are completing HE courses which they started before they were 21 is rising rapidly (1996: 4.2% of the 21- 30 year old population; 1998: 5.0%; 2000: 6.4%) and, at this rate, is projected to be 7% of the cohort in 2006 and 8.5% in 2011. Note that all these figures relate to individual’s social class as measured at the point of interview within the QLFS, not to the social class of the individual at 18 or at the commencement of HE. This tendency could
19
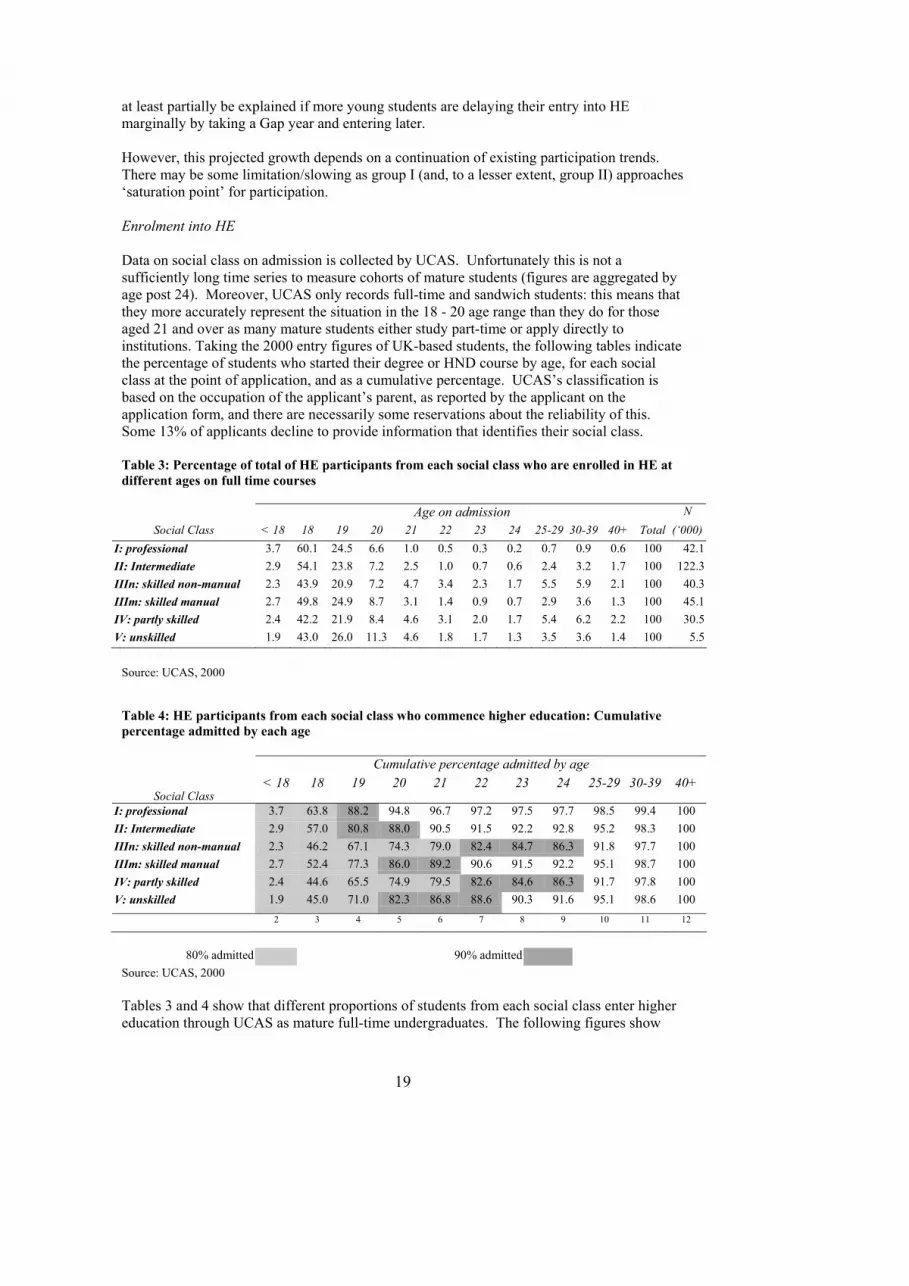
at least partially be explained if more young students are delaying their entry into HE marginally by taking a Gap year and entering later. However, this projected growth depends on a continuation of existing participation trends. There may be some limitation/slowing as group I (and, to a lesser extent, group II) approaches ‘saturation point’ for participation. Enrolment into HE Data on social class on admission is collected by UCAS. Unfortunately this is not a sufficiently long time series to measure cohorts of mature students (figures are aggregated by age post 24). Moreover, UCAS only records full-time and sandwich students: this means that they more accurately represent the situation in the 18 - 20 age range than they do for those aged 21 and over as many mature students either study part-time or apply directly to institutions. Taking the 2000 entry figures of UK-based students, the following tables indicate the percentage of students who started their degree or HND course by age, for each social class at the point of application, and as a cumulative percentage. UCAS’s classification is based on the occupation of the applicant’s parent, as reported by the applicant on the application form, and there are necessarily some reservations about the reliability of this. Some 13% of applicants decline to provide information that identifies their social class. Table 3: Percentage of total of HE participants from each social class who are enrolled in HE at different ages on full time courses
Age on admission N Social Class < 18 18 19 20 21 22 23 24 25-29 30-39 40+ Total (‘000)
I: professional 3.7 60.1 24.5 6.6 1.0 0.5 0.3 0.2 0.7 0.9 0.6 100 42.1 II: Intermediate 2.9 54.1 23.8 7.2 2.5 1.0 0.7 0.6 2.4 3.2 1.7 100 122.3 IIIn: skilled non-manual 2.3 43.9 20.9 7.2 4.7 3.4 2.3 1.7 5.5 5.9 2.1 100 40.3 IIIm: skilled manual 2.7 49.8 24.9 8.7 3.1 1.4 0.9 0.7 2.9 3.6 1.3 100 45.1 IV: partly skilled 2.4 42.2 21.9 8.4 4.6 3.1 2.0 1.7 5.4 6.2 2.2 100 30.5 V: unskilled 1.9 43.0 26.0 11.3 4.6 1.8 1.7 1.3 3.5 3.6 1.4 100 5.5
Source: UCAS, 2000 Table 4: HE participants from each social class who commence higher education: Cumulative percentage admitted by each age
Cumulative percentage admitted by age
Social Class < 18 18 19 20 21 22 23 24 25-29 30-39 40+
I: professional 3.7 63.8 88.2 94.8 96.7 97.2 97.5 97.7 98.5 99.4 100 II: Intermediate 2.9 57.0 80.8 88.0 90.5 91.5 92.2 92.8 95.2 98.3 100 IIIn: skilled non-manual 2.3 46.2 67.1 74.3 79.0 82.4 84.7 86.3 91.8 97.7 100 IIIm: skilled manual 2.7 52.4 77.3 86.0 89.2 90.6 91.5 92.2 95.1 98.7 100 IV: partly skilled 2.4 44.6 65.5 74.9 79.5 82.6 84.6 86.3 91.7 97.8 100 V: unskilled 1.9 45.0 71.0 82.3 86.8 88.6 90.3 91.6 95.1 98.6 100
2 3 4 5 6 7 8 9 10 11 12
80% admitted 90% admitted
Source: UCAS, 2000 Tables 3 and 4 show that different proportions of students from each social class enter higher education through UCAS as mature full-time undergraduates. The following figures show

20
this, and the changes that have occurred over the past six years, using the UCAS data for full-time study for degree and HND qualifications. As mentioned, because these figures are for full-time students, they are more likely to be representative of non-mature students than of mature students. Nevertheless, they do help us understand the nature of the non-mature student body, and thus to infer the potential mature student body. Comparable data on those completing HE courses in not available. Figure 8: UCAS Entry: Students by age and social class, 1994 Distribution of social class: % of all students enrolling by age on admission
0%
10%
20%
30%
40%
50%
60%
70%
80%
90%
100%
Professional Intermediate Skilled non-manual Skilled manual Partly skilled Unskilled
<18 18 19 20 21 22-24 25-29 30+
Source: UCAS, 1994 Figure 8 shows the position in 1994. While 60% of all those in class I who will enter full-time Higher Education have done so by the age of 18, only 37% of those in social class V will have entered by this age. 85% of those in class I who will enter HE have done so by the age of 21, while only 67% of those in social class V will have done so. The distribution within the mature student sector by social class is rather less clear: there was in 1994 a quite distinct (albeit small) tendency for some skilled non-manuals (group IIIn) to enter HE after 30. By 1997 (Figure 9), the situation had changed: higher proportions of students, in all classes except for skilled non-manuals were starting under the age of 21. However, the degree of change was markedly different for each class. Social class V, for example, moved from 33% mature entry to 23% mature entry. But the skilled non-manual class continued – even more so than in 1994 – to recruit from older cohorts of people. There appeared to be a reservoir of older people in this class who successfully sought entry to Higher Education as mature students.

21
Figure 9: UCAS Entry: Students by age and social class, 1997 Distribution of social class: % of all students enrolling by age on admission
0%
10%
20%
30%
40%
50%
60%
70%
80%
90%
100%
Professional Intermediate Skilled non-manual Skilled manual P artly skilled Unskilled
<18 18 19 20 21 22-24 25-29 30+
Source: UCAS, 1997 Since 1997 the proportion in each social class entering as mature students has fallen (Figure 10). Skilled non-manual, partly skilled and unskilled entrants to full-time Higher Education are more likely than students from other social class backgrounds to enrol after the age of 21.

22
Figure 10: UCAS Entry: Students by age and social class, 2000 Distribution of social class: % of all students enrolling by age on admission
0 %
10 %
2 0 %
3 0 %
4 0 %
50 %
6 0 %
70 %
8 0 %
9 0 %
10 0 %
P ro fessio nal Interm ed iate S killed no n-m anual S killed m anual P artly skilled U nskilled
> 18 18 19 20 21 22-24 25-29 30+
Source: UCAS, 2000 The following table combines UCAS data on enrolment by age to full-time undergraduate courses with LFS data on HE achievement (the latter includes those who have studied both part- and full-time). It therefore assumes that UCAS data on enrolment by age for each social class is a reasonable approximation for both full- and part-students. This is questionable since people from lower social classes and those who study part-time are more likely to enrol when they are older. Given the limitations of the data and the difficulties associated with combining different data sources, the following table is only meant to be indicative. For example, column 5 in the table is likely to underestimate, particularly for those not from professional backgrounds, the proportion entering HE between 21-29 years of age. Table 5: Full-time participation in Higher Education under 21 and over 21, indicating the potential for mature student participation in HE by social class
Under 21 21-29
Social Class % of group
starting HE
level of participation
% group 'available'
for HE
% of group starting
HE
level of participation
I: professional 82.7 Virtually saturated 17.3 4.5 Minimal entry - none left
II: Intermediate 50.2 Fairly well saturated 49.8 6.9 IIIn: skilled non-manual 17.5 poor take up 82.5 6.1
large potential entry, with entry qualifications
IIIm: skilled manual 7.2 92.8 1.2 IV: partly skilled 8.0
very poor take up 92.0 2.7
V: unskilled 5.0 Minimal take up 95.0 1.1
very large potential entry, but largely without 'traditional' qualifications for entry
2 3 4 5 6
Sources: Column 2: percentage of each social class who start HE before the age of 21, derived from the percentage of those who have achieved HE qualifications in 2001 (table 2, column 2), multiplied by the percentage of the group who enter HE before 21 (table 4, column 5).This will inevitably underestimate the situation, because there is no comparable data on completion rates. It is also probable that the completion rates vary by social class, and that working class students may have a lower rate of completion than do middle class students, and that therefore that these estimates under-represent the working class students more that they under-represent the middle class students. {For example, 57.1 of social class II have HE qualifications; 88% of those in class II who attain HE qualifications have enrolled by 21, so 50.2% of the whole group enrol as pre-mature students and complete their course.
23
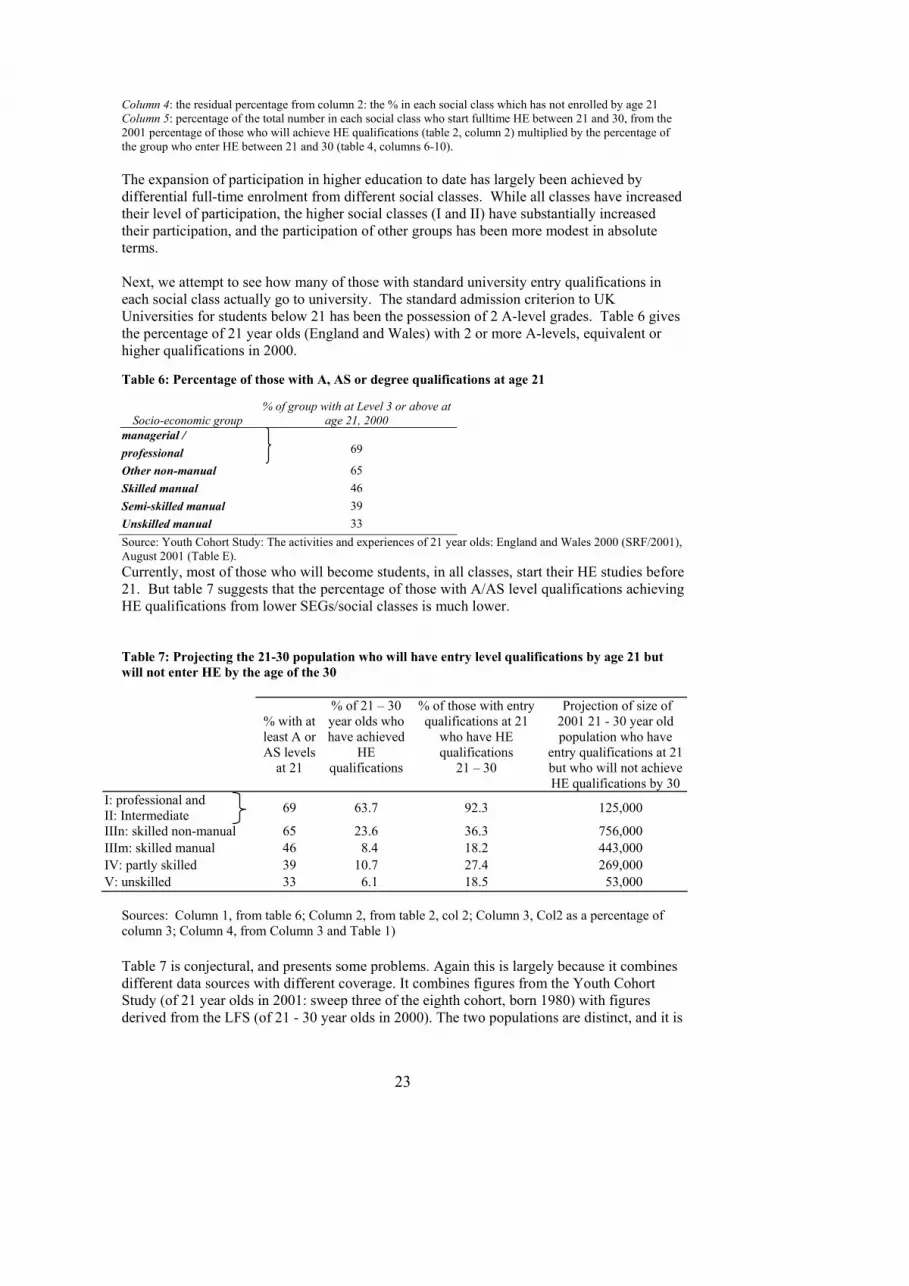
Column 4: the residual percentage from column 2: the % in each social class which has not enrolled by age 21 Column 5: percentage of the total number in each social class who start fulltime HE between 21 and 30, from the 2001 percentage of those who will achieve HE qualifications (table 2, column 2) multiplied by the percentage of the group who enter HE between 21 and 30 (table 4, columns 6-10). The expansion of participation in higher education to date has largely been achieved by differential full-time enrolment from different social classes. While all classes have increased their level of participation, the higher social classes (I and II) have substantially increased their participation, and the participation of other groups has been more modest in absolute terms. Next, we attempt to see how many of those with standard university entry qualifications in each social class actually go to university. The standard admission criterion to UK Universities for students below 21 has been the possession of 2 A-level grades. Table 6 gives the percentage of 21 year olds (England and Wales) with 2 or more A-levels, equivalent or higher qualifications in 2000. Table 6: Percentage of those with A, AS or degree qualifications at age 21
Socio-economic group
% of group with at Level 3 or above at age 21, 2000
managerial / professional
69
Other non-manual 65 Skilled manual 46 Semi-skilled manual 39 Unskilled manual 33 Source: Youth Cohort Study: The activities and experiences of 21 year olds: England and Wales 2000 (SRF/2001), August 2001 (Table E). Currently, most of those who will become students, in all classes, start their HE studies before 21. But table 7 suggests that the percentage of those with A/AS level qualifications achieving HE qualifications from lower SEGs/social classes is much lower. Table 7: Projecting the 21-30 population who will have entry level qualifications by age 21 but will not enter HE by the age of the 30
% with at least A or AS levels
at 21
% of 21 – 30 year olds who have achieved
HE qualifications
% of those with entry qualifications at 21
who have HE qualifications
21 – 30
Projection of size of 2001 21 - 30 year old population who have
entry qualifications at 21 but who will not achieve HE qualifications by 30
I: professional and II: Intermediate
69
63.7
92.3
125,000
IIIn: skilled non-manual 65 23.6 36.3 756,000 IIIm: skilled manual 46 8.4 18.2 443,000 IV: partly skilled 39 10.7 27.4 269,000 V: unskilled 33 6.1 18.5 53,000
Sources: Column 1, from table 6; Column 2, from table 2, col 2; Column 3, Col2 as a percentage of column 3; Column 4, from Column 3 and Table 1) Table 7 is conjectural, and presents some problems. Again this is largely because it combines different data sources with different coverage. It combines figures from the Youth Cohort Study (of 21 year olds in 2001: sweep three of the eighth cohort, born 1980) with figures derived from the LFS (of 21 - 30 year olds in 2000). The two populations are distinct, and it is

24
likely that current 21 year olds have better qualifications, and are more likely to achieve Higher Education entry, than the cohort of 21 year olds in 1991 who will form the 30 year olds in the LFS population. The YCS also uses socio-economic group whilst throughout this report the LFS data has been presented according to social class. For these, and other reasons and assumptions already discussed (e.g. assuming the same LFS social class composition for the non-employed as for the employed) the table only gives a broad indication of the social composition of the pool of potential mature students given the social composition of young students. Taking the population who have Level 3 qualifications, there is a preponderance of those with low A-level point scores, or vocational level 3 qualifications, among the lower socio-economic groups. Although technically qualified for entry to Higher Education, they are less well qualified. Prior attainment – and particularly for traditional Higher Education entry (a high A-level point score) - matters. The YCS shows that the great majority of young people who attain 2+ A-levels by 18 enter Higher Education by the age of 21, irrespective of their socio-economic group. Those from manual backgrounds I who have achieved entry qualifications by age 21 are more likely to have poor A-level point scores, or vocational equivalents to A-level, and are thus less likely to acquire a Higher Education qualifications by the age of 30 compared with those from non-manual backgrounds. This is crucial – why do people from lower socio-economic groups not undertake and complete A levels? The implication is that one of the strategies to widen participation in HE should be getting young people to stay beyond minimum school leaving age and complete A Level (or equivalent) qualifications. Social classes IIIn to V thus form the largest potential for expansion in the mature HE student sector. The percentage of mature full-time entrants (via UCAS) from these social classes is higher than those in classes I and II, although the absolute numbers are still relatively very low. The significance of these social classes for the potential expansion of mature students is that, post 21, entry qualifications for HE become more flexible. To summarise the analysis up to this point: This report is primarily concerned with mature students without prior experience of higher education. These students will necessarily be recruited from the population that has not enrolled in Higher Education before the age of 21. The data above has been used to demonstrate that those who currently engage in Higher Education before the age of 21 display particular social characteristics, being disproportionately drawn from social class I and to a lesser extent social class II. There are relatively small numbers in social class I who are not already in Higher Education by the age of 21, and these groups therefore cannot – even if they are qualified and willing to enrol - play a significant part in any growth of new mature entrants. The most significant areas in terms of numbers of potential recruits after the age of 21 are particularly social classes IIIn, IIIm and IV. Social class V is significant as having proportionally few entrants to Higher Education at any age, but is numerically quite small. Social class II, which is numerically large, still has considerable potential for mature student growth.

25
Characteristics of Mature Students and Trends in Mature Student Study (i) Full-time Students Higher Education full-time student numbers are continuing to grow (figure 11). Figure 11: Full-time admission to Higher Education 1996 - 2000, by type of course
Source: UCAS statistics: first year admissions ‘Traditional’ students – i.e., those starting their courses before the age of 21 - form the very large majority of students (Figure 12). The number of admissions has risen over the past five years, but this overall figure hides the situation for mature students. The numbers of full-time mature students appear to be broadly stagnating over the past five years. Figure 12: Full-time admission to Higher Education 1996-2000, by type of course and by age
Source: UCAS statistics
While the number of mature full-time students remains constant, they form a smaller proportion of all full time students. Table 8 shows more clearly the decline in the proportion of full-time students who are mature.
�������� ���
���������������������������������
������������
�������� ����
��������������������������������������������
������������
0
50000
100000
150000
200000
250000
HND <18 - 21 21 + Degree <18 - 21 21+
199619971998����1999����2000
0
50,000
100,000
150,000
200,000
250,000
300,000
350,000
1996 1997 1998 1999 2000
HNDFirst degree

26
Table 8: Full-time students, 1996 – 2000, proportion of mature students All students <18 - 20 21-24 >24 21+ Mature
students (over 21) as a
% of all 1996 268,289 209,096 24,542 34,651 59,193 22.06 1997 303,318 237,519 27,813 37,986 65,799 21.69 1998 298,220 239,663 25,772 32,785 58,557 19.64 1999 303,065 245,626 25,804 31,635 57,439 18.95 2000 308,718 250,549 26,885 31,284 58,169 18.84
Change 1996-2000
40,429 41,453 2,343 -3,367 -1,024 -3.2
Source: UCAS statistics: first year admissions Figure 13 breaks down full-time UCAS admissions by individual age. It shows that ‘younger’ mature students – those starting their courses at 21 and to a lesser extent at 22 – are continuing to grow in number, while the numbers of students who start their full-time studies from age 23 onwards are in decline (figure 13). It may be that this partly represents an increase in the number of young people deferring the point at which they start HE, though most deferrals are for only a year. Most school leavers who took a two year 'gap' would still be classified as starting before the age of 21.

27
Figure 13: Changes in admission numbers by specific ages of entry, full-time mature students
Source: UCAS admissions. Note numbers are aggregated for 25 – 29, 30 – 39, single years 21 to 24 There is also a rather complex gender difference, shown in Table 9.
Admission at age 21, 1996-2000
0
2,000
4,000
6,000
8,000
10,000
12,000
14,000
1996
1997
1998
1999
2000
Admission at age 24, 1996-2000
0
2,000
4,000
6,000
8,000
10,000
12,000
14,000
1996
1997
1998
1999
2000
Admission at age 23, 1996-2000
0
2,000
4,000
6,000
8,000
10,000
12,000
14,000
1996
1997
1998
1999
2000
Admission at age 22, 1996-2000
0
2,000
4,000
6,000
8,000
10,000
12,000
14,000
1996
1997
1998
1999
2000
Admission at age 25-29, 1996-2000
0
2,000
4,000
6,000
8,000
10,000
12,000
14,000
16,000
1996
1997
1998
1999
2000
Admission at age 30-39, 1996-2000
0
2,000
4,000
6,000
8,000
10,000
12,000
14,000
16,000
18,000
1996
1997
1998
1999
2000

28
Table 9: Gender of full-time mature students, 1996 - 2000 21-23 male 21-23 female 24-29 male 24-29 female
1996 11309 9163 9417 8605 1997 12943 10622 9793 9533 1998 12055 9848 8625 8236 1999 12082 7809 10172 7891 2000 12532 10867 7389 7811
Change 1996-2000
1,223 1,704 -2028 -794
Source: UCAS admissions Table 9 shows that there are more male ‘younger’ matures than there are female. However, these figures are quite volatile over the period and it is difficult to discern any clear trends. (ii) Part-time students Part-time students are not recorded in the UCAS data. The HESA statistics record both full-time and part-time students. Table 10: Numbers of Home Students, Full-time, England domiciled students, UCAS and HESA returns
HESA UCAS First degree Other UG All First degree HND All
1994/95 273,585 46,979 320,564 228,685 22,607 251,292 1995/96 273,494 45,312 318,806 240,710 24,826 265,536 1996/97 276,293 45,053 321,346 246,503 21,785 268,288 1997/98 290,449 44,680 335,129 276,503 26,815 303,318 1998/99 283,302 43,374 326,676 272,340 25,880 298,220 1999/00 281,966 40,583 322,549 277,340 25,725 303,065 2000/01 286,749 49,036 335,785 281,809 26,909 308,718 Change 1994/5-00/01
13,164 2,057 15,221 53,124 4,302 57,426
Sources: UCAS, Annual returns, HESA Annual returns; DfES private communication Much of the variation in the full-time and other undergraduate provision shown in the HESA data is because of the way that Open University students have been categorised (all undergraduates were classified as other undergraduate to 1997/8, since when they have been split between first degree and other undergraduate). Figure 9 shows this year, and should be referred to in conjunction with Figures 8 and 10, which represent years that are possibly less erratic. The discrepancy between HND numbers (UCAS) and Other Undergraduate level numbers (which here include HNDs) (HESA) is explained by the various other forms of courses offered at undergraduate level, which will be explored below. Some of the difference between HESA and UCAS data on full-time students will also be due to some full-time undergraduates applying directly to institutions rather than through UCAS. Table 11 gives the HESA data for admission of UK home, English domicile students, to undergraduate level courses. These suggest that the principal area of expansion among part-time students has been ‘Other Undergraduate level’ courses, which have just over doubled in intake over six years, rising from 18.1% of total first-year enrolments in 1994 to 31.5% of enrolments in 2000. This increase is shown graphically in Figure 14. What is most significant is the relatively much larger proportion of part-time than full-time students who are following undergraduate level courses that are not first degree courses

29
Table 11: Enrolment by mode and level, all students, 1994 – 2000
HESA
First degree Other UG All
Part-time Full-time Part-time Full-time Part-time Full-time 1994/95 49,425 273,585 81,850 46,979 131,275 320,564 1995/96 30,771 273,494 98,622 45,312 129,393 318,806 1996/97 54,805 276,293 115,433 45,053 170,238 321,346 1997/98 29,074 290,449 115,126 44,680 144,200 335,129 1998/99 32,630 282,302 158,886 43,374 191,516 326,676 1999/00 31,410 281,966 165,480 40,583 196,890 322,549 Change 1994/5-99/00
18,015 -8,381 -83,630 6,396 -65,615 -1,985
Source: Students in Higher Education Institutions 1999/2000, HESA, 2001 Figure 14: Enrolment by mode and level, all students, 1994 - 2000
Source: Students in Higher Education Institutions 1999/2000, HESA, 2001 The qualifications aimed at by mature students in the 2000 intake are shown in Figure 15. This suggests that 63% of mature students (aged 21-30) are concentrated on non-degree courses. A very significant proportion of these mature students appear to be aiming at acquiring undergraduate level credits from their Higher Education institutions (28%), or undergraduate level certificates and diplomas, HND and HNCs (24%). 7% are aiming at professional qualifications that are at undergraduate level.
All full-time enrolment First Degree, full-time All part-time enrolment Other undergrad, part-time Other undergrad, full time First degree, part-time
0
50,000
100,000
150,000
200,000
250,000
300,000
350,000
400,000
1994/95 1995/96 1996/97 1997/98 1998/99 1999/00
All full-time enrolment First Degree, full-time All part-time enrolment Other undergrad, part-time Other undergrad, full time First degree, part-time
0
50,000
100,000
150,000
200,000
250,000
300,000
350,000
400,000
1994/95 1995/96 1996/97 1997/98 1998/99 1999/00

30
Figure 16 shows the same group of mature students with their highest qualifications on entry. At least 13.1% have clear graduate qualifications on entry, and a further 20.5% have HE credits, other HE qualifications or professional qualifications. This suggests that at least a third of the current mature student enrolment cannot be considered as contributing to the increase in access to HE, but are ‘returners’ at undergraduate level. Figure 15: Qualification aim of English domiciled home students aged 21 - 30 admitted to HE institutions, autumn 2000
Source: HESA. Note that all HESA data from this point on includes all students at HE Institutions, and all students following HE courses at FE Colleges who make a return to HESA Figure 16: Highest qualification on entry, English domiciled home students aged 21 - 30 admitted to HE institutions, autumn 2000 Source: HESA
���������������������������������������������������������������������������������������������������������������������������������������������������������������������������������������������������������������������������������������������������������������������������������������������������������������������������
���������������������������������������������������������������������������������������������������������������������������������������������������������������������������������������������������������������
������������������������������������������������������������������������������������������������������������������������������������������������
��������������������������������������������������������������������������������������������������������������������������������������������������������������������������������������������������������
���������������������������������������������������������������������������������������������������������������������������������������������������������������������������������������������������������������������������������������������������������������������������������������������������������������������������������������������������������������������������������������������������������������������������������������������������������������������������������������������������������������������������������������������������������������������������������
First degree37%
Professional Qualification at UG level7%
Cert HE2%
Other UG Dips and Certs14%
Other HE less than degree2%
Institutional U credit28%
No formal UG qualification1%
HND/HNC/Dip HE8%
Foundation couse at HE level1%
��������������
����
����������������������������������������������������������
����������
����������������������������������������������������������������������������������������������������������������
��������
����������������������������������������������
������������������������������
������������������������������������
����������������������������������������������������������������������������������������������������������������������
0 5000 10000 15000 20000 25000
���Not knownNo formal quals
������Other quals below L3������APEL/APL other exp������GCSE
Access���A level and equivalentOther level 3���Other HE & professionalHE credits���Other graduate & equiv���UK first degree
������PGCE������postgraduate
18.1% 1.9% 5.4% 4.4% 6.4% 5.8% 2,1%
23.4% 17.6%
1.6% 1.2% 8.9% 0.2% 1.9%

31
We now turn to consider the social class backgrounds of mature students. This has been noted above (table 3, 4 and 5) with reference to full-time students. The only data on social class backgrounds of students is from UCAS. As noted before, UCAS data only covers full-time undergraduates that enter through UCAS and so will not be representative of mature students many of whom study part-time and/or apply directly to institutions. UCAS data suggests that full-time mature students are largely in the intermediate class (II). Although the absolute numbers for social classes IIIn, IIIm, IV and V are smaller, the mature student route is more significant for these classes than for those from higher social class backgrounds (from Table 4: 4.6% of class I who enrol in HE do so as mature (21 - 30 year olds), 10.4% of class II, 23.7% of class IIIn, 13.1% of class IIIm, 23.5% of class IV and 17.0% of class V). The proportion of full-time mature students from each particular social class is shown in the following table, which shows that proportionately more of the post 21 entry is from social classes IIInm and IV, though not for IIIm or V. Table 12: HE full-time entry by social class and age, 2000
Social class age
I Professional
II Intermediate
IIIN Skilled non-Manual
IIIM Skilled Manual
IV Partly Skilled
V Unskilled
under 21 15.3 44.5 12.4 17.4 8.2 2.1 21-29 5.6 33.8 25.7 15.8 16.3 2.7 30 - 39 4.1 39.7 22.1 16.1 15.9 2.0 Source: UCAS 2000. Excludes those where social class is not known There have been some changes in starting dates by different social classes in recent years. In particular, the skilled manual group students (IIIm) appear to be entering HE at younger ages than was the case previously, and earlier than skilled non-manual students (IIInm). This may be due to changes in when members of these social classes achieve entry qualifications Finally, the ethnic characteristics of mature students are different from those of ‘traditional’ students. Over 80% of full-time undergraduates who enter via UCAS from all Asian ethnic groups (except ‘Asians Other’) and whites enter as non-mature students. Black groups (and those whose ethnic origin is not known) all tend to have around 40% of their numbers as mature students. There are some interesting gender variations within these broad figures: while in the Black Caribbean group, males start younger than females, in all other Black groups females are significantly younger starters than males. In the Asian groups, the differences are less, but Indian and Bangladeshi origin females tend to start earlier than the males and the reverse is true of Pakistani and Chinese origin students.

32
Figure 17: Ethnicity and Age - 2000 full-time entrants, HND and Degree (UCAS)
Source: UCAS Figure 17 is only for full-timers applying through UCAS and given the nature of some ethnic groups’ participation in HE this may well not be representative. However, the distribution of the ethnic minorities in Higher Education does not reflect their distribution in the population as a whole in the younger age groups. Figure 18 shows that a particularly high number of young Asian Indian origin students enter HE, and that smaller numbers of Asian Bangladeshi and Black Caribbean students do so. Figure 19 shows that Asian Indian young people form a smaller proportion of the population (using data for the 15 – 24 age range, which is all that is available from the Office of National Census).
������
�����������������
�������������
����������������������������������������������������������������
������������������������������������
����������������������������������������
����������������������
�����������������
0% 20% 40% 60% 80% 100%
Asian Bangladeshi
Asian Chinese
Asian Indian
Asian Pakistani
Asian Other
Total Asian
Black African
Black Caribbean
Black Other
Total Black
White
Other
Not known
<21 21 - 24 25 - 29 �������� 30-39 40+

33
Figure 18: Numbers of Ethnic Minority students, 2000 full and part-time entry, with age on entry
Source: HESA 2000 Figure 19: Distribution of ethnic minority groups in the 15 –24 population, Great Britain
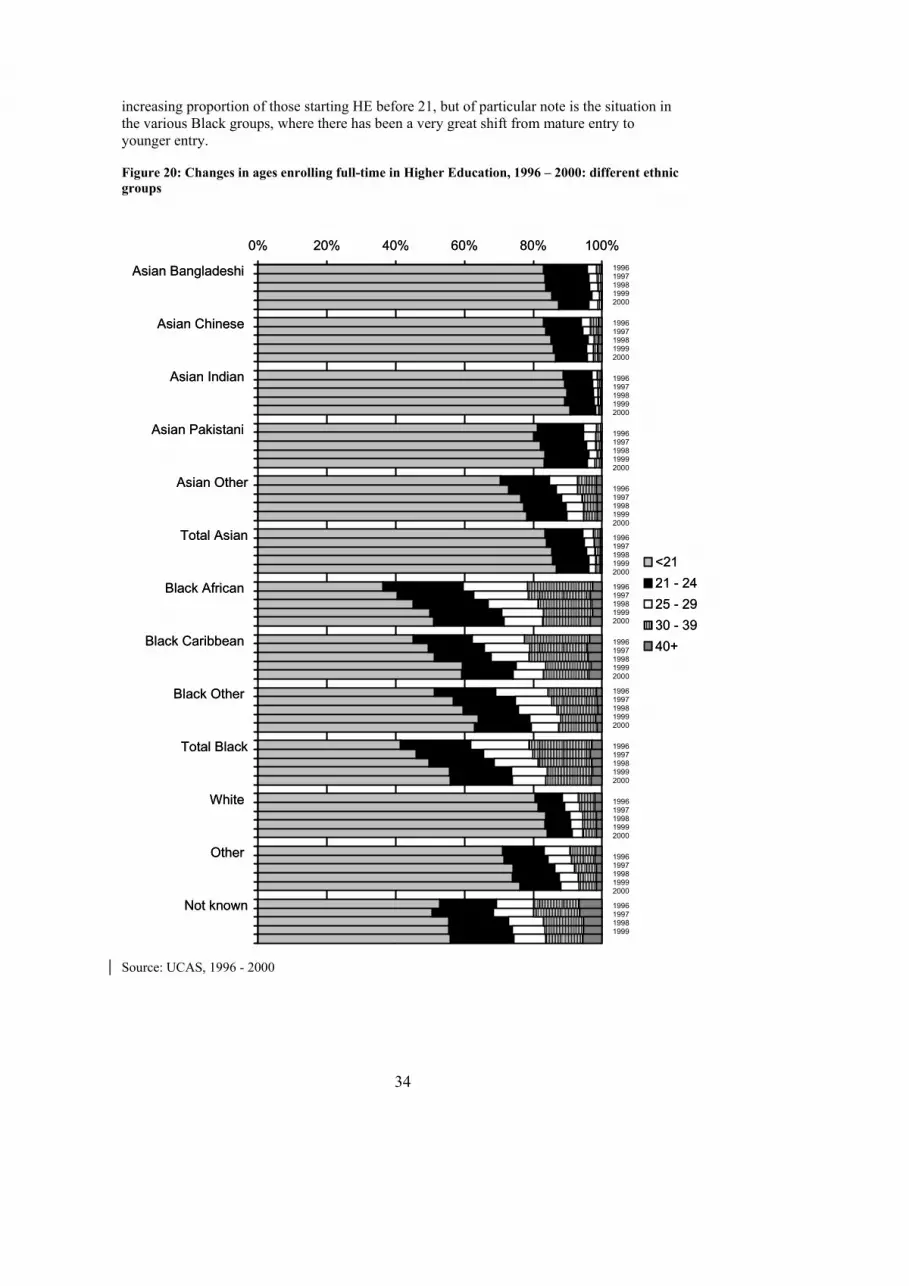
Source: Population Trends 96, The Ethnic Minority populations of Great Britain: latest estimates. Table 4, p 40. 1999. ONS Figure 20 shows the changes over the past five years for each ethnic group, in terms of the age at which they commence full-time Higher Education. Of note in all cases is the
��������������
�������
�������
��������������������� �������
������� �������
�������
��������������
0
5000
10000
15000
20000
25000
Asian Bangladeshi
Asian Chinese
Asian Indian
Asian Pakistani
Asian Other
Black African
Black Caribbean
Black Other
Other
Not know
n
40+������ 30-39
25 - 29 21 - 24<21
0
0.5
1
1.5
2
2.5
Asian Bangladeshi
Asian Chinese
Asian Indian
Asian Pakistani
Asian Other
Black African
Black Caribbean
Black Other
Other
.
perc
enta
ge
34
increasing proportion of those starting HE before 21, but of particular note is the situation in the various Black groups, where there has been a very great shift from mature entry to younger entry. Figure 20: Changes in ages enrolling full-time in Higher Education, 1996 – 2000: different ethnic groups
Source: UCAS, 1996 - 2000
�������������������������
����������������������������������������������������
������������������������������������������������������������
�����������������������������������������
����������������������������������������������������������������������������������������������������������������������������������������������������������������
������������������������������������������������������������������������������������������������������������������������
����������������������������������������������������������������������������������������������
�������������������������������������������������������������������������������������������������������������������������������
���������������������������������������������������������������������������
��������������������������������������������
�����������������������������������������������
������������������������������������������������������������������������
0% 20% 40% 60% 80% 100%
Asian Bangladeshi
Asian Chinese
Asian Indian
Asian Pakistani
Asian Other
Total Asian
Black African
Black Caribbean
Black Other
Total Black
White
Other
Not known
<2121 - 2425 - 29����30 - 3940+
1996 1997 1998 1999 2000 1996 1997 1998 1999 2000 1996 1997 1998 1999 2000 1996 1997 1998 1999 2000 1996 1997 1998 1999 2000 1996 1997 1998 1999 2000 1996 1997 1998 1999 2000 1996 1997 1998 1999 2000 1996 1997 1998 1999 2000 1996 1997 1998 1999 2000 1996 1997 1998 1999 2000 1996 1997 1998 1999 2000 1996 1997 1998 1999

35
Figure 21: Numbers of full-time mature students from ethnic minorities starting HE courses each year 1996 - 2000 (age over 21)
Source: UCAS Finally, Figure 21 is a reminder of the very small number of mature students from the ethnic minorities who are recruited as full-time students. Although the Black population in this age group is only about 40% of the size of the Asian population, Black mature students are highly
0 500 1000 1500 2000 2500 3000
Asian Bangladeshi
Asian Chinese
Asian Indian
Asian Pakistani
Asian Other
Black African
Black Caribbean
Black Other
Other
1996 1997 1998 1999 2000 1996 1997 1998 1999 2000 1996 1997 1998 1999 2000 1996 1997 1998 1999 2000 1996 1997 1998 1999 2000 1996 1997 1998 1999 2000 1996 1997 1998 1999 2000 1996 1997 1998 1999 2000 1996 1997 1998 1999 2000
0 3000 6000 9000 12000 15000
Unknown 1996 1997 1998 1999 2000
1996 1997 1998 1999 2000 1996 1997 1998 1999 2000 1996 1997 1998 1999 2000 1996 1997 1998 1999 2000 1996 1997 1998 1999 2000 1996 1997 1998 1999 2000 1996 1997 1998 1999 2000 1996 1997 1998 1999 2000 1996 1997 1998 1999 2000
0 500 1000 1500 2000 2500 3000
Asian Bangladeshi
Asian Chinese
Asian Indian
Asian Pakistani
Asian Other
Black African
Black Caribbean
Black Other
Other
0 3000 6000 9000 12000 15000
Unknown 1996 1997 1998 1999 2000

36
represented in the mature entry figures, and particularly the Black African group. Over the period, about 55% of all full-time ethnic minority mature students have been from a Black group. Table 13 shows the proportion of each ethnic group in the 20 – 29 population, and the proportion of each ethnic group in the population enrolling as full-time students between 21 and 30 in the following year. Table 13: Proportions of ethnic groups in the age group 20/21 – 29: total population and population enrolling as full-time students
Population aged 20-29
(thousands)
Full-time students, 21-29
% of total 20-29 population
% total full-time students enrolling,
aged 21-29 Asian Bangladeshi 197 261 0.47 0.68 Asian Chinese 137 330 0.41 0.85 Asian Indian 895 1,150 1.79 2.98 Asian Pakistani 573 1,105 1.36 2.86 Asian Other 174 604 0.37 1.56 Black African 319 1,608 0.88 4.17 Black Caribbean 502 723 0.94 1.87 Black Other 161 469 0.28 1.22 White 52,921 25,062 92.60 64.93 Other 453 957 0.91 2.48 Not known 14 6,330 0.00 16.40
Total 56,346 38,599 100.00 100.00 Sources: population: estimates of population by age and ethnic group, GB, calculated from Table 4, in Schuman, J. “The ethnic minority populations of Great Britain – latest estimates”, in Population Trends 96 (Summer 1999); student numbers, UCAS returns, 2000. Note that the two populations are not exactly the same: the population statistics are for GB (England approximately 90% of this), and the two sets of data are not precisely the same age range, even allowing that the 1999 population will have aged by one year when compared to the 2000 student enrolment figures. This shows that all ethnic minority groups are more likely to enrol in full-time higher education courses as mature students (21-30) than their white counterparts. Indeed, while some 92.6% of the age range are white, only 65% of those enrolling as mature students are white. It is also interesting to examine the nature of mature students’ participation in terms of their mode and subject of study. Mature students who undertake full-time courses seem more likely to start these when they are younger. The numbers starting such courses fall away sharply after the age of 24. Part-time courses, on the other hand, become more popular than full-time courses after this age. Figures 22 and 23 show the distribution of ages of enrolment of 21 - 30 year old students on full-time and part-time courses respectively. In the full-time group, 54.6% in 1998 (rising to 58.2% in 2000) of those who would eventually enrol had enrolled by the age of 23. In the part-time group, only 26.5% of those who would enrol had enrolled by age 23 in 1998 (rising to 28.9% in 2000).

37
Figure 22: Mature full-time students by age of enrolment (% of all full-time students enrolling between 21 and 30 year olds)
Source: HESA, Autumn enrolments 1998 - 2000 Figure 23: Mature part-time students by age of enrolment (% of all part-time students enrolling between 21 and 30)
Source: HESA, Autumn enrolments, 1998 – 2000 However, in terms of trends in numbers recruited, it is noticeable that both full and part-time courses show the same characteristics: in recent years, while recruitment of the younger mature students has increased in both modes, it has also declined for students in their mid to late 20s in both modes.
0
5
10
15
20
25
30
35
21 22 23 24 25 26 27 28 29 30
199819992000
0
2
4
6
8
10
12
21 22 23 24 25 26 27 28 29 30
199819992000

38
Figure 24: Numbers of mature students recruited by mode of study, 1998 - 2000, by age on entry
Source: HESA The first triad of each set of vertical bars (black, white and grey) shows full-time mode entrant numbers, and the second triad in each set (patterned bars) shows the part-time entrant numbers. Past the age of 22, the numbers entering are lower. 21 and 22 year olds are much more likely to enrol on full-time courses. Once past 25, more mature students enrol on part-time than full-time courses. ‘Other’ modes (e.g. sandwich, etc.) constitute only about 5% of the total for the age range, and have therefore been omitted from this analysis. Finally, the pattern of subject courses for mature students differs from that of those under the age of 21. The pattern is complex, and Table 14 and Figure 25 are attempts to establish the significant trends.
���������������
����������
������������
������������
��������
���������������
���������������
��������
������������
������������
����������
���������������
������������
��������
������������
������������
��������
������������
������������
��������
���������������
���������������
��������
������������
������������
��������
������������
������������
��������
������������
0
2,000
4,000
6,000
8,000
10,000
12,000
14,000
21 22 23 24 25 26 27 28 29 30
age on enrolment
199819992000Column 4����
����1998����
1999����
2000
Full-time
Part time
Full-time
Part time

39
Table 14: Most popular subjects of choice for non-mature and mature student study, 1996 and 2000: % of full-time students studying selected subjects, by age on enrolment Each column shows the ten most popular subjects chosen by students in the age range in each year, and lists them in rank order (most popular first), with the percentage choosing that subject
1996 2000 Under 21 21-24 25 – 30 under 21 21-24 25 – 30 Social studies
12.7 Social studies
12.8 Social studies
17.2 Social studies
12.2 Creative arts
13.0 Social studies
15.5 Business and administrative studies
10.7
Business and administrative studies
11.7
Education
10.6
Business and administrative studies
10.7
Business and administrative studies
11.5
Subjects allied to medicine
13.7
Languages and related disciplines
7.4
Education
9.6
Subjects allied to medicine
7.3
Creative arts
8.9
Social studies
10.7
Creative arts
10.4 Engineering and technology
7.2
Engineering and technology
7.2
Other general and combined studies
6.7
Mathematical sciences and informatics
8.3
Mathematical sciences and informatics
10.3
Education
8.5 Education
7.1
G Mathematical sciences and informatics
6.7
Business and administrative studies
6.6
Subjects allied to medicine
6.7
Subjects allied to medicine
8.5
Mathematical sciences and informatics
8.0 Mathematical sciences and informatics
6.7
Other general and combined studies
6.1
Mathematical sciences and informatics
5.9
Languages and related disciplines
6.1
Engineering and technology
5.7
Business and administrative studies
5.6 Biological sciences
6.4
Subjects allied to medicine
5.8
Languages and related disciplines
5.6
Biological sciences
5.8
Education
5.1
Biological sciences
4.6 Physical sciences
6.3
Biological sciences
5.1
Biological sciences
5.6
Engineering and technology
5.8
Science combined with social studies or arts 4.6
Languages and related disciplines
4.2 Subjects allied to medicine
4.6
Creative arts
4.9
Humanities
5.5
Physical sciences
4.8
Languages and related disciplines
3.6
Humanities
4.0 Humanities
4.2
Languages and related disciplines
4.0
Engineering and technology
4.6
Science combined with social studies or arts 4.2
Biological sciences
3.6
Science combined with social studies or arts 3.8
Source: UCAS, 1996, 2000 The subject choices of mature students are concentrated in a narrower band of subjects than are the choices of younger students. There are differences in emphasis between 1996 and 2000. The social subjects remain the most popular choice of mature (and non-mature students), but are slightly less popular than in 1996. Subjects allied to medicine and Creative Arts are increasing in popularity, as is, to a lesser extent Mathematical sciences and informatics.

40
Figure 25: Percentages of students in different age bands selecting subjects: 1996 and 2000 full-time enrolments
Sources: UCAS 1996, 2000 (as Table 13) (Note: this figure is shown as continuous data for the ease of the reader: the data is, of course, of separate observations) The following set of figures illustrate changes in enrolment in the six most popular subjects for mature students over the past five years, showing changes in admission age each year. Figure 26: Mature students’ admission to selected subjects, by age on enrolment, 1996 - 2000
0
2
4
6
8
10
12
14
16
18
20
under 21 21-24 25+ under 21 21-24 25+
B Subjects allied to medicine C Biological sciences G Mathematical sciences and informatics H/J Engineering and technology L/M Social studies N Business and administrative studies Q/R/T Languages and related disciplines W Creative arts X Education
1996 entry 2000 entry
������
�������� ��� ���� ���
��������
������������
��������
Education: admission by age 1996 - 2000
0
500
1,000
1,500
2,000
20 21 22 23 24 25-29 30-39 40+
199619971998����
����19992000
1996 entry 2000 entry

41
���������������
������������
������
�������� ���
����������������
������������������
������������
Social Studies: admission by age 1996 - 2000
0
500
1,000
1,500
2,000
2,500
3,000
20 21 22 23 24 25-29 30-39 40+
199619971998����19992000
����������������
��������
������
�������� ����
������������
����������������
��������
subjects allied to Medicine: admission by age 1996 - 2000
0
500
1000
1500
2000
20 21 22 23 24 25-29 30-39 40+
199619971998���19992000
����������������������������
����������������
���������
��������
��������
���������
������������ ����
Business and administrative studies: admission by age 1996 - 2000
0
500
1000
1500
2000
2500
3000
20 21 22 23 24 25-29 30-39 40+
199619971998���
��� 19992000
��������������������
���������
��������
������
��������
���������
������������
������
Mathematical sciences and informatics: admission by age 1996 - 2000
0
500100015002000
20 21 22 23 24 25-29 30-39 40+
199619971998���19992000

42
Source: UCAS 1996 - 2000 Social studies, subjects allied to medicine, business and administration and creative arts have a very dominant position in the 21-30 year group of mature students Subjects allied to medicine are also very important in the 31 – 39 age ranges. The prominence of these subjects may be in part a response to their perceived utility by some students, but there are other factors involved, such as the availability of NHS resources for training particular groups of workers. The analysis of the most popular six full-time subjects by age on admission and years (Table 13) shows that the situation is by no means static: social studies courses are declining in popularity among mature students, while business and administration is in a slower decline. It is also noticeable that some of these subjects have a distinctly different age profile – ‘older’ mature students focussing on subjects allied to medicine, social studies and education, ‘younger’ matures in business and administrative studies.
������������������������
����������������
������������
������
��������
����������������
������������
���������
Creative arts: admission by age 1996 - 2000
0
500
1000
1500
2000
2500
3000
3500
4000
20 21 22 23 24 25-29 30-39 40+
199619971998���19992000

43
SECTION B: MATURE NON-PARTICIPANTS 21-30 Year Old England-Resident UK Nationals (1993-2001) The series of charts in Appendix 1 observe highest qualifications held by 21-30 year old British nationals from 1994 to 2001. The relationships between age, gender, class, ethnicity and region are also included here. This data is derived from the quarterly labour force surveys, all conducted in the period December- February (winter). Our analysis is restricted to British nationals aged 21-30 resident in England. Since spring 1997 the Department for Education and Skills has allocated all the various qualifications recorded by the LFS’s questions on highest qualifications held to different National Vocational Qualification Levels in the way shown in table 15. Table 15: Relationship between highest qualification in QLF Surveys and NVQ levels Highest qualification
Degree and above
Level 4 below degree
Level 3 Level 2 Level 1
Higher degree Yes NVQ level 5 Yes First degree Yes Other degree Yes NVQ level 4 Yes Teaching, further education Yes Teaching, secondary education Yes Teaching, primary education Yes Teaching, level not stated Yes Nursing, etc Yes Diploma in higher education Yes Other HE below degree Yes HNC, HND, BTEC etc higher Yes RSA higher diploma Yes A-level or equivalent If 2+ If 1 Scottish CSYS 67% 33% SCE higher or equivalent If 3+ If 1 or 2 A, S level or equivalent If 4+ If 2 or 3 If 1 RSA advanced diploma Yes OND, ONC, BTEC etc national Yes City & Guilds advanced craft Yes Trade apprenticeship 50% 50% NVQ level 3 Yes GNVQ advanced Yes O level, GCSE grade A-C or equiv If 5+ If <5 NVQ level 2 Yes GNVQ intermediate Yes RSA diploma Yes City and Guilds craft Yes BTEC, SCOTVEC first or gen dip Yes CSE below grade 1, GCSE below C Yes NVQ level 1 Yes GNVQ, GSVQ foundation level Yes BTEC, SCOTVEC first or gen cert Yes SCOPTVEC modules Yes RSA other Yes YT, YTP certificate Yes Other qualifications Other 10% Other 35% Other 55% Don’t know/NA Pro rata Pro rata Pro rata Pro rata

44
We have only been partly able to use this with the QLFS data, because before spring 1997 the information recorded in the survey is insufficiently detailed about current study (it does not, for example, record the number of A-levels being studied for). We have, however, adopted it for analyses of highest qualification held. It should be noted that the highest qualification held field in the QLFS, which itself is a variable derived from responses to a number of questions, changed in 1997. Appendix A, particularly A1, shows what appears to be an anomalous leap in the proportion of 21 to 30 year olds at NVQ level 1. This, we believe, is due to this new highest qualification variable, with proportionately more individuals assigned to the “O Level below grade C or equivalent” category than in previous or subsequent years. The approach used is detailed in following sections. The proportion of the 21-30 year old population with a level 4 or higher qualification rose from 23% in 1994 to 29% in 2001 (A1). In addition, the proportion of this age group holding a level 3 qualification has risen from 15% to 21% whilst the proportions without qualifications has been declining (A1). However, it should be noted that changes were made to the way in which qualifications were coded in the LFS in 1997. Nonetheless, it would appear that more females are gaining level 3 and level 4 qualifications (A3). In 1994, 36% of females held at least a level 3 qualification. This rose to 48% in 2001. These figures are derived from A3 by summing the proportion of females with a level 4 qualification and the proportion with a level 3 qualification. The gender balance amongst 21-30 year olds holding a level 4 qualification or higher has been fairly even since 1994, although the LFS data shows that 52% of this population was female in 2001 (A21). This may be a result of sampling. The UCAS data shown in Figure 14 show that, among the 21 – 30 population, more males than females enter full-time higher education. The HEFCE Performance Indicator reports however, show that females are less likely to withdraw than males. Analyses by class (A4 to A13) indicate that proportionately more and more professional, intermediate and skilled non-manual individuals hold level 4 qualifications, with participation amongst the professional classes approaching saturation (A4). This is something of a tautology. Holding a degree is a key to a higher social class based on employment status. What we do not hold data on is social class at age 18 or some other variable defining social class prior to entry into higher education. However, the LFS data do show large proportions amongst the skilled non-manual (A6) and manual classes (A7) with at least level 3 qualifications, around 34% with respect to the former and 49% to the latter. Skilled non-manuals increasingly hold level 4 qualifications, from 17% in 1994 to 24% in 2001 (A6). There are differences between men and women. The proportion of males with level 4 qualifications increased from 23% in 1994 to 31% in 2001 (A10), whereas the proportion of females with similar qualifications rose from 14% to 21% over the same period (A11). Amongst the skilled manuals, females are almost twice as likely to hold a level 4 qualification (13% females and 7% males in 2001, A12 and A13). 21-30 year olds living in London are the most likely to hold HE qualifications (A19c). This does not mean that the market for entering HE has been met in London, but that of those now living in London, a high proportion have HE qualifications - many of these will have migrated to London as a location with many openings for graduate employment. Demographics and Characteristics of Non-Participants in HE by Social Class In this section estimates are made of recent trends in mature student participation. Participation is defined here as holding a qualification at level 4 or higher although it should be noted that many individuals without a Level 4 qualification have entered higher education without obtaining a qualification.

45
Quarterly labour force surveys relating to the autumn quarters of 1996, 1998 and 2000 were aggregated. Two year intervals were selected as respondents are replaced over a period of five quarters; hence 20% of respondents surveyed in autumn 1996 were surveyed in autumn 1997. Aggregating QLFS in this way does present some difficulties. In particular, over the four years one would expect the qualifications held by the population to change. Table 16: 21-30 year old British Nationals by highest qualification (NVQ equivalents) 1996-2000 Highest qualification YEAR L4 or
higher L3 L2 Below L2 None
1996 23.6% 17.8% 21.5% 27.0% 10.1% 1998 27.2 20.4 21.5 22.6 8.3 2000 29.4 22.4 21.3 18.9 10.1 Average 26.6% 17.8% 21.6 23.0% 8.9% Source: QLFS` We consider the characteristics of those whose highest qualification is at Level 3 below, following Table 19. Table 16 shows highest qualifications held by England-resident British nationals aged 21-30 according to the QLFS data files, and the methodology employed by the Department for Education and Skills of allocating highest qualifications to “levels”, with higher education represented by Level 4 or higher. We are unable to use this methodology for the number of qualifications currently being studied for as the QLFS is insufficiently detailed for this purpose for reasons outlined above. The proportion of 21-30 year olds with a Level 4 qualification or higher is estimated to have increased from 23% in 1996 to 29% in 2000. Alongside this, the proportion of 21-30 year olds with qualifications suitable for university entrance, level 3, has also been increasing, from 17% in 1996 to almost 23% in 2000. The previous section demonstrated that the proportion of 21-30 year olds holding an A-level standard qualification as their highest qualification remaining fairly constant at around 25- 27% over the period 1994-2001. The fact that the proportion at Level 3 increased over this period suggests that proportionately more 21-30 year olds gained 2 A-levels or their equivalent, the “rule of thumb” definition of Level 3. With the proportion of 21-30 year olds holding level 2 qualifications (equivalent to 5 GCSEs at grade C or higher) remaining fairly constant, the inference is that 21-30 year olds are becoming more highly qualified. The largest numbers of 21-30 year olds without level 4 are amongst the skilled non-manual classes. 25.4% of non-participating 21-23 year olds, according to aggregated 1996, 1998 and 2000 QLFS data (because we are using data from alternate years, there is no double counting) are female skilled non-manuals, with male equivalents accounting for 11.7% of non-participating 21-23 year olds. However amongst older groups, proportionately more non-participants are of the professional and intermediate classes. Around 60% of 21-23 year old non-participants are employed, compared with 75% in older age groups. Whilst the gender balance of non-participants amongst the professional and intermediate classes tends to be fairly even, skilled non-manual non-participants tend to be predominantly female, and skilled manual non-participants tend to be predominantly male. Table 17 shows the gender/ class composition of England-resident UK nationals with at least a Level 2 qualification but without a HE qualification within three age groups. The data uses aggregated QLFS data from the autumn of 1996, 1998 and 2000. The reasons for this selection were

46
♦ The data for 1994 appears erratic ♦ Using one quarter for each year minimises the repetition of data (each quarterly cohort
contains 80% of the previous cohort’s interviewees It would also have been possible to use average data for each year, which may have produced data that recognised changes over the four-year period, but this would then be based on a marginally smaller sample of cases. Aggregating the data over such a time period means that the qualification levels of the population are likely to be underestimated since the qualification levels of the population have risen over time. Table 17: 21-30 year old British nationals with at least a Level 2 qualification but without a Level 4 qualification: gender, class and age characteristics: Percentage by gender and class within age group Social Class
Age group Professional & Intermediate
Skilled non-manual Skilled manual Partly/ unskilled
21-23 Male 8.6 11.7 21.4 10.4 Female 8.8 25.4 6.0 7.8
24-26 Male 11.6 10.4 21.3 9.2 Female 11.2 23.4 5.6 7.3
27-30 Male 14.7 8.4 23.2 7.5 Female 13.0 22.7 4.5 6.1
Source: QLFS, Autumn Quarter data: removing from the data all cases not resident in England, not British nationals, and aged under 21 or over 30. Cohort Progression Data This section again uses the 1996-2000 QLFS data (merged, not aggregated, datasets) to observe how pseudo-cohorts become increasingly qualified over time. This section moves beyond highest qualifications held, and incorporates current level of study. However, the QLFS datasets do not contain sufficient detail to map qualifications being studied for to NVQ level equivalents. For instance, studying for 2 or more A-levels converts to Level 3, whilst studying for 1 converts to Level 2, but the QLFS data does not indicate the number of A-levels being studied. It is assumed here that those studying for A/ AS levels are all studying towards Level 3. It is not unreasonable to assume that those studying for A/AS levels are all studying towards Level 3: there are probably few people studying for a single A level as their highest qualification. It should be noted that the data is gathered from different samples in successive years, and that this analysis is therefore of pseudo-cohorts, not true cohorts. Individuals within the LFS sample have been banded into age groups covering intervals of two years. It can be seen how a cohort gains qualifications as its members get older. Note that LFS respondents are surveyed over five quarters and then replaced. We observe cohorts at two-yearly intervals, hence at each observation, the cohort is composed of entirely different individuals. Cohort 1 (Figure 27) were aged 21-22 in 1996. By 1998, the proportion with a HE qualification amongst the cohort had risen to 31.5% from 19% two years earlier. This is unsurprising, as this cohort would have included some 1996 undergraduates, who had entered HE aged 18/19 years, including those who had taken a gap year or who were following a four year degree programme. The proportion with at most a Level 3 qualification hovers between 16% and 18% between 1996 and 2000. The proportion with at least a Level 3 qualification rose from 47% in 1996 to 54% in 2000. This suggests that the population with at most a Level 3 qualification is being replenished as the population at Level 4 or higher increases in number.

47
Figure 27: Cohort 1- those aged 21-22 in 1996
0%5%
10%15%20%25%30%35%40%
1996 1998 2000
Completed HE Studying HE
L3, not studying higher Studying L3
Cohort 2 (Figure 28) were aged 23-24 in 1996. 26% held a HE qualification in 1996, and this rose to 33% by 2000. In addition, the proportion with at least a Level 3 qualification rose from 45% to 52% over the same period. Again, this would suggest that the population at “Level 3 only” is being replenished as the population at Level 4 or higher increases in number. Figure 28: Cohort 2- those aged 23-24 in 1996
0%5%
10%15%
20%25%30%35%
1996 1998 2000
Completed HE Studying HE
L3, not studying higher Studying L3
Cohort 3 (Figure 29) tells a different story. These individuals were aged 25-26 in 1996. Over the period 1996-2000, the proportion with a HE qualification rose marginally, by two percentage points to 27.4%. As we are dealing with independent samples, we cannot assume this to be significant.

48
Figure 29: Cohort 3- those aged 25-26 in 1996
0%
5%
10%
15%
20%
25%
30%
1996 1998 2000
Completed HE Studying HE
L3, not studying higher Studying L3
To assess significance, independent sample t-tests were conducted on the 2000 LFS data. Individuals are banded into age groups with 2-year intervals, and the proportions with a HE qualification, or studying for HE, are calculated. The proportions with a Level 3 qualification or higher (which includes HE entrants) are also calculated. Returning to two years earlier, the corresponding proportions for the same cohorts have been calculated, and t-tests run to establish whether there is sufficient evidence from the sample to suggest that the proportions are genuinely increasing. Unsurprisingly, the proportion of 23-24 year olds in 2000 with a HE qualification was significantly higher than the proportion of 21-22 year olds in 1998. Also, the proportion of 25-26 year olds in 2000 at Level 3 or higher was significantly higher than the proportion of 23-24 year olds in 1998. No other tests were significant, so it could be suggested that proportions gaining a HE qualification show little increase beyond the age of 23, and that the majority of those who will gain Level 3 qualifications will have done so by the age of 26 years. In other words, 23-26 is the time to build on qualifications gained at school. Below (Table 18) we report of the total size of the population with Level 3 qualifications who are not in higher education, and examine some of their characteristics. Modelling the Size of the Non-participating Population
Elsewhere within this report (Tables 1-7, 9, Figures 17 - 21), the individual (bivariate) relationships of each of age, gender, class and ethnicity on highest qualification obtained have been noted. These associations underpin this attempt to model the size of the 21-30 year old population in England with Level 3 qualifications, but without a higher education qualification, or who are not presently studying in higher education. The DfES method of converting qualifications to NVQ levels (Table 15) has not been used in this section for two reasons. Firstly QLFS data do not include sufficient detail on qualifications currently being studied for. Secondly, the methodology involves weighting certain types of qualifcations to levels. For instance, individuals categorised as having “other” qualifications as highest obtained count 10% to the Level 3 group, 35% to the Level 2 group

49
and 55% to the Level 1 group. The modelling procedure used requires individuals to be coded fully within a single highest qualification variable. To circumvent these problems, use has been made of a derived variable within the QLFS datasets which has already converted highest qualifications to the equivalences listed above, and mapped current students to those categories. Although the groupings used in this analysis are similar to NVQ level equivalents, there are some differences. We can compare total numbers of 21-30 year olds in the groups used in table 18 with total numbers within the NVQ equivalent groups used in table 16, to observe the differences in number between the two approaches. The “A-level” group is smaller than the DfES Level 3 group, and, by contrast, this “GCSE” group is larger than the DfES Level 2 group. We estimate that around 13.5% of our “GCSE” group are at, or studying for, Level 3 and 4% of the “Other” group are at, or studying for, Level 2.[Note- for reasons previously explained, we did not use the DFES methodology here, and so these figures represent an attempt to reconcile the two approaches] . Conversely, less than 1% of those within the “A Level group” are estimated to be at Level 3, whilst 2% of the “GCSE” group are estimated to be below Level 2. In simple terms, the model produced calculates the probability of being in a particular “highest qualification group” based on age, gender, social class and ethnicity. These probabilities are then applied to population estimates to estimate the size of the non-participating population. Four groups have been identified • Those with a higher education qualification • Those with an A Level or equivalent qualification but without a higher education
qualification • Those with GCSE grade A*-C or equivalent qualifications • Those without qualifications or with qualifications below A*-C or equivalent This method is based on neither causation nor correlation. These groups also include individuals presently studying for such qualifications. However, groups without higher education qualifications will contain individuals who entered, but did not complete, higher education. Prior participation does not of course prevent returning to the higher education sector. To estimate the probabilities of group membership, data from autumn quarterly labour force surveys 1998 and 2000 were aggregated to generate sufficient data to model. Data on highest qualifications and current study are collected twice yearly, rather than quarterly and the sample only changes by 20% between each quarter. Data on some 33000 21-30 year old England-resident British nationals were used in the procedure. There are too few cases to compare those who have completed qualifications at HE Level with those who are currently enrolled in Higher Education. A saturated model has been produced by assigning these individuals to highest qualifications group and then simply cross-tabulating by age, gender, social class and ethnicity to generate, for each combination of the four independent variables, the percentage within each of the highest qualification groups. However, as sample data is being used, randomness will not be removed. To attempt to remove some of this randomness, a backwards-elimination hierarchical loglinear model was produced, with the fitted values representing the probability of an individual being within each high of the highest qualification groups based on age, gender, social class and ethnicity. To ensure sufficient cases per cell within the model, age, class and ethnicity variables were aggregated. This method was judged the most appropriate to allocate

50
the data to groups based on the survey counts, given both that this model is not intended to be predictive in nature, and that no causal relationship was being assumed between the independent variables of class and age with the highest qualification obtained (in which case a logit model might be more appropriate). Differences in higher education participation had earlier been noted within this report between 21-23 year olds, 24-26 year olds and 27-30 year olds. Therefore, these bands were retained to create an age group variable with three levels. Similarly, participation amongst professional and intermediate classes, given small numbers of professionals, led to both classes being aggregated. Skilled non-manual and skilled manual classes were retained, and unskilled and partly skilled classes aggregated due to sharing similar tendencies towards higher education participation. This produced a class variable with four levels (Table 18). Note that the variables are specified in the table, and that a hierarchical backwards elimination model has been employed.

51
Table 18: Either Highest Qualification held, or Highest Qualification being studied for, by age, gender, ethnicity and social class, England resident British nationals 1998-2000: Percentage within gender/ age/ ethnic/ class group
Highest qualification
Age Ethnicity Class HE A Level GCSE A*-C
Other
Prof & int 53.2 21.4 14.4 11.0 skilled non-m 38.8 24.6 22.2 14.4 skilled manual 11.5 26.0 35.4 27.1 Partly/ unskilled 17.7 12.4 23.0 46.8
White
All Classes 27.8 21.2 24.9 26.0 Prof & int 63.5 17.3 7.7 11.5 skilled non-m 50.0 20.3 12.5 17.2 skilled manual 15.8 23.7 23.7 36.8 Partly/ unskilled 22.8 10.5 12.3 54.4
21-23
Other
All Classes 39.8 17.5 13.3 29.4 Prof & int 64.5 12.9 12.4 10.1 skilled non-m 35.1 20.2 24.2 20.6 skilled manual 10.1 21.4 35.1 33.4 Partly/ unskilled 10.1 10.5 26.7 52.7
White
All Classes 33.5 16.2 23.7 26.6 Prof & int 73.7 10.1 6.1 10.1 skilled non-m 45.6 17.6 13.2 23.5 skilled manual 13.6 20.3 22.0 44.1 Partly/ unskilled 13.7 9.6 15.1 61.6
24-26
Other
All Classes 40.8 13.7 13.0 32.4 Prof & int 59.7 13.0 14.0 13.3 skilled non-m 25.7 20.6 27.3 26.4 skilled manual 7.3 19.3 34.6 38.9 Partly/ unskilled 6.5 8.1 23.9 61.6
White
All Classes 30.0 15.1 23.8 31.1 Prof & int 68.6 9.9 7.3 14.1 skilled non-m 34.2 18.4 15.8 31.6 skilled manual 10.3 18.4 21.8 49.4 Partly/ unskilled 8.3 6.9 13.9 70.8
Mal
e
27-30
Other
All Classes 40.4 12.7 12.9 34.0 Prof & int 59.2 19.0 14.0 7.8 skilled non-m 29.7 22.9 28.4 19.0 skilled manual 20.5 22.8 34.7 22.0 Partly/ unskilled 25.1 14.8 21.7 38.4
White
All Classes 35.4 20.3 24.1 20.3 Prof & int 72.5 15.0 7.5 5.0 skilled non-m 45.1 22.5 16.7 15.7 skilled manual 30.8 23.1 23.1 23.1 Partly/ unskilled 40.0 15.0 12.5 32.5
21-23
Other
All Classes 48.7 19.5 14.4 17.4 Prof & int 67.3 11.7 12.4 8.7 skilled non-m 23.2 17.5 29.2 30.1 skilled manual 16.3 18.4 33.7 31.6 Partly/ unskilled 12.9 12.2 24.6 50.3
White
All Classes 37.1 14.6 22.7 25.5 Prof & int 80.0 9.1 5.5 5.5 skilled non-m 36.8 18.4 18.4 26.3 skilled manual 28.6 19.0 23.8 28.6 Partly/ unskilled 22.7 13.6 18.2 45.5
24-26
Other
All Classes 52.8 14.2 13.5 19.5 Prof & int 61.5 11.2 14.8 12.5 skilled non-m 15.2 15.3 31.4 38.1 skilled manual 11.3 15.3 34.2 39.2 Partly/ unskilled 7.8 8.5 22.2 61.6
White
All Classes 32.0 12.6 23.6 31.8 Prof & int 75.5 9.1 7.0 8.4 skilled non-m 26.1 17.2 21.0 35.7 skilled manual 18.8 18.8 25.0 37.5 Partly/ unskilled 13.6 9.1 15.9 61.4
Fem
ale
27-30
Other
All Classes 43.9 13.1 15.0 28.1

52
Due to small numbers, the ethnic group variable had just two levels, white and other. Gender, of course, has just two levels. This produced a multi-way table with 4*3*4*2*2 = 192 cells. A hierarchical loglinear analysis was run which produced a model with a number of 3-way interactions, but no higher order effects. The three interactions all include highest qualification group, which can be considered to be a dependent variable in this operation. HIGHEST QUALIFICATION GROUP*AGE GROUP*GENDER HIGHEST QUALIFICATION GROUP*AGE GROUP*CLASS HIGHEST QUALIFICATION GROUP*ETHNICITY*GENDER HIGHEST QUALIFICATION GROUP*GENDER*CLASS Table 19 shows the percentage within each grouping of gender, age, ethnicity and class attached to each of the highest qualification groups. For example amongst males aged 21-23 who are white professionals or intermediates, 53.2% have a higher education qualification, and 21.4% have at least an A-level standard qualification which is below HE standard. To estimate the size of the non-participating population, 1999 mid-year estimates of the 21-30 year old population resident in England (ONS, 1999) were used as the basis for deriving the number of individuals in each of the dimensions of the table above, e.g. the number of professional and intermediate white males aged 21-30. Ages were rolled forward a year to make these data as temporally consistent with the labour force data as possible. The total size of this population is 6.5 million. As before, it is assumed that the social class composition of the whole population is the same as for the employed population. The problems with this assumption have already been discussed. The mid-year estimates simply provided numbers by single year of age and gender. To estimate the numbers by age group, gender, class and ethnicity, the proportion of each combination of class and ethnic group within each combination of age group and gender was estimated from labour force data. For example, the mid-year estimates provided the number of 21-23 year old males. We then needed to break this down further by ethnicity and social class. At this stage, the England resident data includes non-British nationals, but we make the necessary judgement later. Once this task was completed, the probabilities computed above can be applied to estimated numbers. In Table 19 the columns show the number of UK residents within each of the four ‘highest qualification’ groups by gender, age, ethnicity and social class. However, because we are using sample data we have grouped ages into bands (e.g. 21-23) to attempt to model actual numbers. The final column (number/ yr. A-level) divides the number of UK residents with an A-level standard qualification below HE by the number of years in the age group (i.e. 3 for 21-23 but 4 for 27-30) to allow for better comparability between age bands. Groups with the largest numbers of individuals with A level or equivalent qualifications as their highest qualification are shaded in grey.
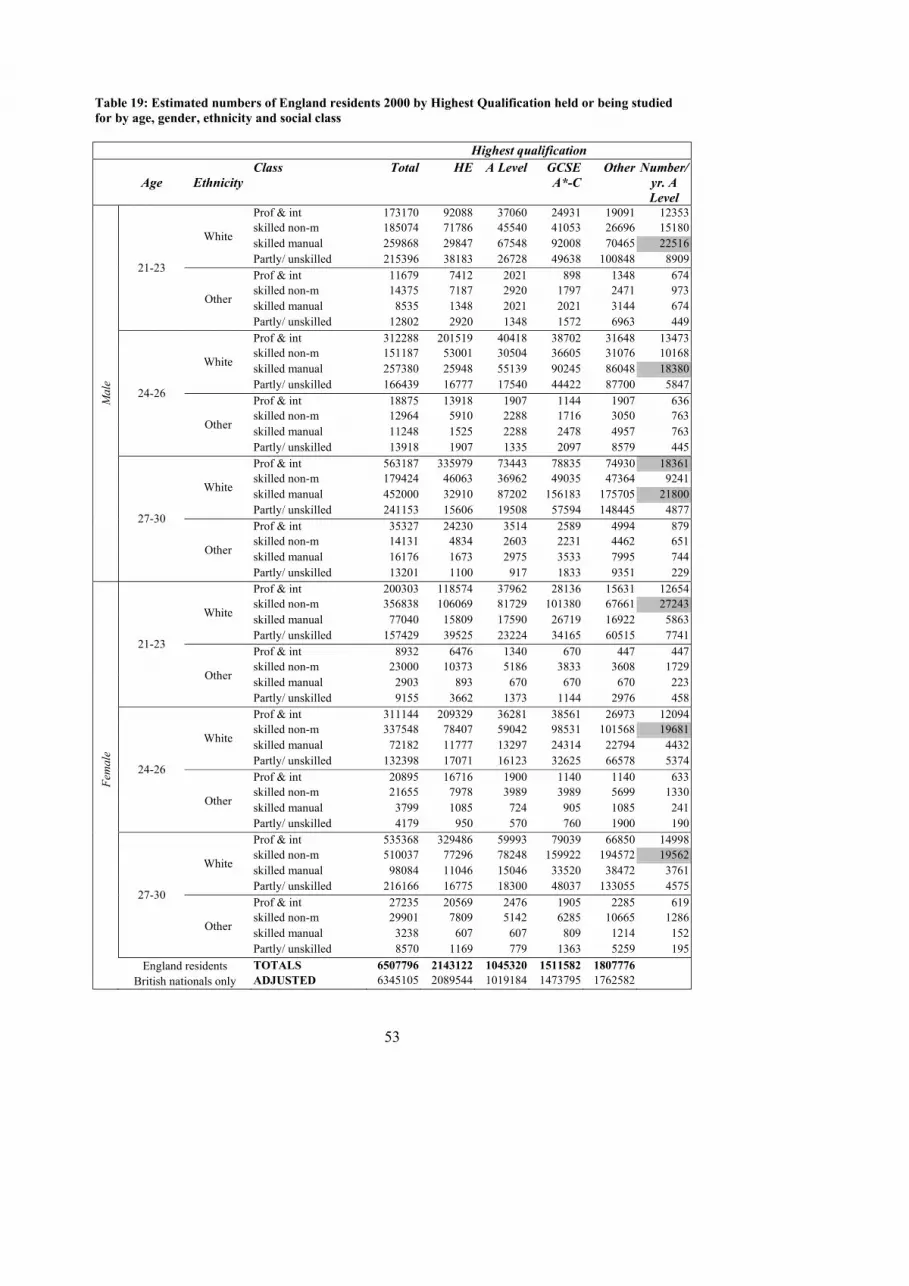
53
Table 19: Estimated numbers of England residents 2000 by Highest Qualification held or being studied for by age, gender, ethnicity and social class
Highest qualification
Age Ethnicity Class Total HE A Level GCSE
A*-C Other Number/
yr. A Level
Prof & int 173170 92088 37060 24931 19091 12353 skilled non-m 185074 71786 45540 41053 26696 15180 skilled manual 259868 29847 67548 92008 70465 22516 White
Partly/ unskilled 215396 38183 26728 49638 100848 8909 Prof & int 11679 7412 2021 898 1348 674 skilled non-m 14375 7187 2920 1797 2471 973 skilled manual 8535 1348 2021 2021 3144 674
21-23
Other
Partly/ unskilled 12802 2920 1348 1572 6963 449 Prof & int 312288 201519 40418 38702 31648 13473 skilled non-m 151187 53001 30504 36605 31076 10168 skilled manual 257380 25948 55139 90245 86048 18380 White
Partly/ unskilled 166439 16777 17540 44422 87700 5847 Prof & int 18875 13918 1907 1144 1907 636 skilled non-m 12964 5910 2288 1716 3050 763 skilled manual 11248 1525 2288 2478 4957 763
24-26
Other
Partly/ unskilled 13918 1907 1335 2097 8579 445 Prof & int 563187 335979 73443 78835 74930 18361 skilled non-m 179424 46063 36962 49035 47364 9241 skilled manual 452000 32910 87202 156183 175705 21800 White
Partly/ unskilled 241153 15606 19508 57594 148445 4877 Prof & int 35327 24230 3514 2589 4994 879 skilled non-m 14131 4834 2603 2231 4462 651 skilled manual 16176 1673 2975 3533 7995 744
Mal
e
27-30
Other
Partly/ unskilled 13201 1100 917 1833 9351 229 Prof & int 200303 118574 37962 28136 15631 12654 skilled non-m 356838 106069 81729 101380 67661 27243 skilled manual 77040 15809 17590 26719 16922 5863 White
Partly/ unskilled 157429 39525 23224 34165 60515 7741 Prof & int 8932 6476 1340 670 447 447 skilled non-m 23000 10373 5186 3833 3608 1729 skilled manual 2903 893 670 670 670 223
21-23
Other
Partly/ unskilled 9155 3662 1373 1144 2976 458 Prof & int 311144 209329 36281 38561 26973 12094 skilled non-m 337548 78407 59042 98531 101568 19681 skilled manual 72182 11777 13297 24314 22794 4432 White
Partly/ unskilled 132398 17071 16123 32625 66578 5374 Prof & int 20895 16716 1900 1140 1140 633 skilled non-m 21655 7978 3989 3989 5699 1330 skilled manual 3799 1085 724 905 1085 241
24-26
Other
Partly/ unskilled 4179 950 570 760 1900 190 Prof & int 535368 329486 59993 79039 66850 14998 skilled non-m 510037 77296 78248 159922 194572 19562 skilled manual 98084 11046 15046 33520 38472 3761 White
Partly/ unskilled 216166 16775 18300 48037 133055 4575 Prof & int 27235 20569 2476 1905 2285 619 skilled non-m 29901 7809 5142 6285 10665 1286 skilled manual 3238 607 607 809 1214 152
Fem
ale
27-30
Other
Partly/ unskilled 8570 1169 779 1363 5259 195 England residents TOTALS 6507796 2143122 1045320 1511582 1807776 British nationals only ADJUSTED 6345105 2089544 1019184 1473795 1762582

54
This analysis includes those who are studying towards Level 3 and 2 qualifications, as well as those who already hold such qualifications, because mature students at this level are potential recruits to higher education, who are demonstrating their interest in study, and are likely to be studying at further education institutions, and thus more accessible to targetting to be recruited into higher education. Thus, we estimate that there were around 1 million 21-30 year olds in England in 2000 with, or studying for, A-Level or equivalent qualifications but who were not currently participating in higher education. In addition, there were around 1.5 million 21-30 year old British nationals resident in England with, or studying for, a GCSE grade A*-C or equivalent qualification as their highest qualification and who were not currently studying at a higher level. Of this 1.5 million, given the reasons highlighted on page 49, we estimate that 13.5% of this group are at NVQ Level 3. This means that we would estimate that in 2000, there were 1.25 million 21-30 year olds resident in England who were studying for a Level 3 qualification or who already held a Level 3 qualification but who were not studying in higher education. The proportion of this group currently studying for level 3 is relatively small, at around 7%. The QLFS can be used to provide further information on 21-30 year olds with level 3 qualifications who are not studying at a higher level. Again, we use merged data from the autumn quarters of 1996, 1998 and 2000. The QLFS does not report whether such individuals entered higher education but did not subsequently complete their course. Of the 21-30 year olds identified as having a level 3 highest qualification but who were not studying higher, a small percentage (1.6%) reported being engaged in full-time study below higher education. However, this proportion is even smaller (less than 1 percent) when respondents are asked to report their primary economic activity. The vast majority are in employment. Table 20: Economic activity, 21-30 year olds with level 3 highest qualification not studying in higher education Economic activity percentage Employee- Full time Permanent 67.5 Employee- Full time Temporary 3.8 Employee- part time 8.9 Self-employed 7.2 Government emp & training programmes 0.3 Unpaid family worker 0.1 ILO unemployed 4.4 Inactive- student 1.0 Inactive- looking after family 4.5 Inactive- sick/ disabled 1.3 Inactive- other 1.0 Source: QLFS, 1996, 1998, 2000, autumn quarters Of the 12.2% not in employment, 40% had left their previous job within the previous 12 months. However, almost one-in-three had left their previous job 4 or more years previously or had never been in paid employment.

55
Table 21: Time elapsed since leaving last job, 21-30 year olds with level 3 highest qualification not studying in higher education and not in employment
Percent Cumulative
Percent Less than 3 months 12.8 12.8 3 months but less than 6 months 11.6 24.4 6 months but less than 12 months 14.5 39.0 1 year but less than 2 years 13.5 52.5 2 years but less than 3 years 9.4 61.9 3 years but less than 4 years 5.8 67.7 4 years but less than 5 years 5.1 72.8 5 years or more 12.6 85.5 Never had paid job 14.5 100.0 Source: QLFS, 1996, 1998, 2000, autumn quarters A small proportion of this group (under 12%) is engaged in study below the level of higher education. Table 22: Study Level of those with a level 3 highest qualification, but not studying at higher than Level 3. 21-30 year old British nationals
Study level % Level 3 2.8 Level 2 1.4 Level 1 1.0 Other 6.3 None 88.4
Source: QLFS, 1996, 1998, 2000, autumn quarters In terms of major occupation groups, 21-30 year olds with level 3 highest qualifications tend mainly to be found in administrative roles (managerial and clerical/ secretarial) and in craft and related occupations. Table 23: Major occupation group, 21-30 year old British nationals in employment (excluding full-time students) by highest qualification (percentages) Level 4 Level 3 Other 1 Managers and administrators 17.2 16.5 10.3 2 Professional occupations 27.5 3.5 1.3 3 Associate prof & tech occupations 24.5 10.6 4.5 4 Clerical,secretarial occupations 13.3 22.7 21.0 5 Craft and related occupations 3.5 18.0 15.4 6 Personal,protective occupations 5.8 11.8 13.5 7 Sales occupations 5.6 8.7 10.5 8 Plant and machine operatives 1.4 5.1 14.0 9 Other occupations 1.2 3.0 9.5 104 102.9 100 Source: QLFS, 1996, 1998, 2000, autumn quarters Occupations held by those with level 3 highest qualifications also tend to vary by age and gender. Perhaps unexpectedly, there are proportionately more mangers and administrators amongst the 27-30 year olds, and proportionately more males than females are engaged in craft and related occupations.

56
Table 24: Major occupation groups, 21-30 year old British nationals with a level 3 highest qualification not studying higher education and in employment (excluding full-time students) by age and gender Age group Male Female all
1 Managers and administrators 11.0 11.2 11.1 2 Professional occupations 2.8 2.0 2.4 3 Associate prof & tech occupations 10.6 7.5 9.1 4 Clerical, secretarial occupations 17.3 36.4 26.4 5 Craft and related occupations 27.7 1.4 15.2 6 Personal, protective occupations 7.6 21.9 14.4 7 Sales occupations 9.9 15.7 12.7 8 Plant and machine operatives 7.4 1.6 4.6
21-23
9 Other occupations 5.6 2.3 4.1 1 Managers and administrators 13.5 19.4 16.2 2 Professional occupations 3.9 2.3 3.2 3 Associate prof & tech occupations 9.7 9.2 9.5 4 Clerical, secretarial occupations 15.2 36.9 25.0 5 Craft and related occupations 33.6 1.0 18.8 6 Personal, protective occupations 6.3 18.4 11.8 7 Sales occupations 7.1 8.7 7.8 8 Plant and machine operatives 7.4 2.0 4.9
24-26
9 Other occupations 3.3 2.0 2.7 1 Managers and administrators 16.7 22.5 19.1 2 Professional occupations 5.2 3.0 4.3 3 Associate prof & tech occupations 13.5 10.5 12.2 4 Clerical, secretarial occupations 8.3 36.0 19.9 5 Craft and related occupations 31.6 1.4 19.0 6 Personal, protective occupations 7.8 13.9 10.4 7 Sales occupations 4.9 10.5 7.3 8 Plant and machine operatives 8.3 0.8 5.1
27-30
9 Other occupations 3.8 1.4 2.8 Source: QLFS, 1996, 1998, 2000, autumn quarters Table 25: Main occupation by industry sector, 21-30 year old British nationals with a level 3 highest qualification not studying higher education in employment (excluding full-time students) by gender
Male Female all A-B: Agriculture & fishing 1.7 0.5 1.1 C,E: Energy & water 1.3 1.0 1.1 D: Manufacturing 22.8 10.4 17.4 F: Construction 14.7 1.5 8.9 G-H: Distribution, hotels & restaurants 20.1 22.6 21.2 I: Transport & communication 7.6 6.5 7.1 J-K: Banking, finance & insurance etc 17.1 24.1 20.2 L-N: Public admin, education & health 10.2 25.1 16.8 O-Q: Other services 4.4 8.3 6.1
Source: QLFS, 1996, 1998, 2000, autumn quarters Almost half of the males work in the manufacturing or construction industry or are engaged in craft or related occupations in other industries. By contrast, females are more likely to be employed in financial and public service sectors.

57
From the labour force survey, we estimate that 2.5% of the 21-30 year old population resident in England are not British nationals. There are insufficient cases to estimate the proportion of non-British nationals falling into each of the highest qualification bands; hence we assume this is consistent across them to adjust the totals to include only British nationals. We estimate that in mid-year 2000, there were 4.25 million (67%) 21-30 year olds without, or not currently studying for, a higher education qualification. The largest numbers of non-participants appear to be amongst skilled manual males and skilled non-manual females right across the 21-30 age range. As higher education qualifications generally confer social status, and given that more and more under 21s are entering higher education, the size of this group is likely to diminish in future

58
MODELLING POTENTIAL MATURE PARTICIPATION This section examines the characteristics of participants and non-participants in Higher Education, with a particular emphasis on those in the 21 to 30 age range. It seeks to model the factors that effect the propensity for entering HE amongst this age group. The UNL Mori Data: Factors Affecting Participation Using the UNL MORI data3, we modelled the non-participant over 21 year olds, to discover the factors affecting their propensity to enter HE. A multinomial logit model was used (Aitkin, et al, 19894), with plans to enter HE taken as a 3 level response (namely, ‘definitely plan to go’, ‘may go’, ‘do not plan to go’). Plans to enter HE are, perhaps unsurprisingly, dependent upon qualifications. Once allowance has been made for differences in qualifications, the propensity to enter HE is not affected by social class (note we here are only dealing with C1, C2, D and E). This leads to our consideration of the factors which might affect younger people's decisions to enter HE. In Collier, Gilchrist and Phillips (2002), it is reported that the plans of 16-18 year olds in this study (with parents from social classes C1, C2, D and E) were affected by a different group of factors that are shown in figure 30. The plans to enter HE of 16-18 year olds were (naturally) affected by qualifications and belief in ability. There was a very marked difference between those who would rather earn money and those who would not. The other attitudinal factors (enjoy study, responsibilities, betterment) were not significant for the 16-18 year olds; however, mothers’ and friends' encouragement and access to information on HE were significant. Unlike the over 21s, there was a social class effect for the 16-18 year olds, with the children of C1 parents being more likely to plan to enter HE than the rest. Similarly, having allowed for the different qualification levels, the propensity to enter HE is not different for men and women, nor is it different for the ethnic groupings here considered (White, Black, Asian). An important aspect of our findings is that it appears that, given qualifications, there is no effect of the socio-demographic factors. Thus one does not gain any information from these socio-demographic factors, given knowledge of the qualifications of the working class mature person. See previous point.
3 A survey on ‘Attitudes Towards Higher Education’ was commissioned from MORI for the Social Class and Widening Participation in HE Project. For this, a nationally representative quota sample of 1,278 ‘lower middle’ and ‘working class’ adults in England and Wales were interviewed during June 1999, over three consecutive weekly waves of MORI’s Omnibus survey. Respondents aged between 16-30 years, from social classes C1, C2, D, and E were asked about their plans and intentions, and their attitudes towards Higher Education. Information was also gathered on their educational qualifications, sources of encouragement (or discouragement) for continuing with education after the age of 16, as well as standard demographics. Respondents were interviewed across 198 constituency-based sampling points. Interviews were carried out using CAPI (Computer Assisted personal Interviewing) face-to-face in respondents’ homes on the following dates: 10-15 June 1999, 18-21 June 1999, 24-29 June 1999. This survey utilised the social class definitions used by the Institute of Practitioners in Advertising, namely the social grade classifications to denote ‘lower middle class’ (C1) and ‘working class’ (C2, D, E) backgrounds, and which are standard categories on all surveys carried out by Market and Opinion Research International Limited (MORI). 4 Aitkin, M.A. , Anderson, D. A, Francis, B.J. and Hinde, J.P. (1989). Statistical modelling in GLIM. Oxford: Oxford University Press

59
Our data shows that there are attitudinal factors which have an additional affect upon the propensity of the 21-30 year old working class to enter HE. Thus, belief in one's ability and having no preference for earning money are significant positive indicators of an interest in HE entry, as are a belief in betterment and perceived lack of inhibiting responsibilities. These factors act 'orthogonally' to the qualification effect. Hence, whatever the level of qualification, these attitudinal effects appear to be the same. We therefore have determined that the propensity of the mature working class to enter HE depends upon qualifications, but is independent of their particular working class classification, their gender and their ethnicity. There are also attitudinal factors which affect the propensity to enter HE and these have the same effect whatever the level of qualifications. The strength and direction of the relationships between the various factors and plans are quantified by their odds-ratios. The accompanying Table 26 gives the odds-ratios for planning to go as opposed to not going (the extremes of the plans response variable), comparing the extremes of each factor (e.g. the ratio of planning to go/not planning to go for those in social class C1 compared to the same for those in social class E). The absence of an odds ratio indicates no significant effect (equivalent to an odds ratio of 1.0). Table 26: Odds Ratios
21-30 year olds
Factor Levels compared Odds-Ratio Belief in Ability Yes/No 9.1 Rather Earn Money Disagree/Agree 5.1 Qualifications ≥2 A-levels/No
Formal 4.4
Enjoy Study Yes/No 11.8
Betterment Yes/No 8.8
Parental Encouragement Strong/None
Friends' Encouragement Strong/None
Teachers' Encouragement Strong/none
Responsibilities No/Yes 2.7
Social Class C1/E Age 16 ,17,18
19-20,21-2,…,29-30.
Gender Female/Male It may be noted that the odds ratios in Table 26 are chosen as the most extreme for display purposes. Odds ratios for less extreme comparisons are (equally) significant whenever the extreme comparison is significant (i.e. wherever a value is shown in Table 26). Thus, for example, the odds ratios for comparing the 'definites' and 'maybes' (or, indeed equivalently, for the 'maybes' and definitely nots') are given by the square root of the values in Table 26, for the same (extreme) levels of the explanatory factors shown. For example, the definite/maybe odds ratio for belief in ability/no belief in ability is the square root of 9.1, namely 3.0.

60
Odds ratios for less extreme values of the explanatory factors can be calculated similarly. Thus, for definite/maybe, for belief in ability/unsure re ability, the odds ratio is the square root of 3.0, namely 1.7. According to this model, belief in ability to pass a degree and enjoyment of study have large associations with the plans of working class 21-30 year olds to enter HE. For example, the odds-ratio suggests that, with all other factors being the same, those who believe that they are capable of passing a degree are nine times more likely to plan to enter HE as opposed to not enter HE than those who do not believe in their ability. The table includes possible encouragement factors. None of these (parental, friends’, teachers' encouragement) are clearly significant. There is some weak evidence of a mothers' encouragement effect (which interestingly does appear significant for the under 21s, who are not considered in this report). It may be conjectured that, for the 21-30 year olds, a possible mother’s encouragement effect is being subsumed to some extent in the qualification effect, as it becomes significant (with odds ratio of 3.4) when the qualification effect is removed from the model. In considering the effect of encouragement, for all age groups, the fathers' encouragement effect is highly correlated with the mother's encouragement effect but is not quite as strong. (Fathers' encouragement does not appear significant for the 21-30 year olds). It may also be noted that there are no joint (interaction) effects of any of the factors on plans. In particular, there is no age effect (interaction) for plans and any of the other factors. The model can be conveniently shown in figure 30, as below. Figure30: Odds-Ratios for 21-30 year olds comparing levels as in the Table 26
Responsibilities
Plans
Belief in ability
Rather earn money
Enjoy study
Betterment
Ethnicity
Information
Qualifications
Gender
AgeParental
Friends Teachers
Social class
4.4
5.1
11.8
2.7
8.8
9.1
In summary: Our analysis of the UNL MORI data indicates that, in addition to having appropriate educational qualifications for university entry, the profile of a ‘typical’ potential working class participant would be a person who believes they have the ability to pass a degree and is prepared to postpone earning money to go to university. They state that they enjoy studying, believe they would be better off through having a degree and are less likely to feel that they have responsibilities, which would make degree study difficult.

61
LITERATURE ON MATURE STUDENTS AND FACTORS AFFECTING PARTICIPATION Most research on mature students has been either large scale, statistical analysis of data sets or small-scale, qualitative analysis of specific sub-groups of mature students (e.g. women/ part-timers/those studying in particular institutions). Both of these approaches entail potential limitations and benefit to an analysis of (potential) mature student participation. Broad brush, quantitative analyses of HE datasets can provide valuable overviews but, as Davies (1997) comprehensively discusses, the inconsistencies over time in the collection of HE data, and the differences between separate sources, means that such analyses are often very problematic. This has also been highlighted in earlier sections of the report where data limitations have led to different data sources being combined despite the difficulties and limitations involved. Small-scale qualitative studies, on the other hand, may provide valid, highly contextualised analyses of multiple factors effecting mature student participation. However, the highly specific context of these studies means that findings are often not easily generalisable. In addition, many of the studies reviewed in this and other sections involve only very small sample sizes, which means that there are issues about how far they might be generalisable even within a particular context. This report provides a summary of trends and findings within a range of literature sources. However, we only report findings from studies that we deem to be of ‘sound’ quality (i.e. no obvious methodological flaws that would cast doubt on the validity of findings). The first part of Section A suggested that overall the number of full-time mature entrants has fallen slightly and is now levelling off (although this figure contains an increase in ‘younger’ matures and a decrease in ‘older’ matures) (see Figure 13). This broadly reflects the literature, which suggests that there has been a significant fall in applications from full-time mature entrants following post-Dearing funding changes (Adnett & Coates, 2000)5. HEFCE 2001 also states that the population from which mature first-time entrants to HE are drawn is reducing, which partly explains the recent decline in full-time mature student numbers. Taken together with demographic trends, it also means that it will be very difficult to achieve any increase in mature first-time entrants in the foreseeable future. However, in July 2001, UCAS reported a 6.2% rise in the number of (full-time) mature applicants (UCAS press release, 20.07.01), and in October 2001, they reported that the number of mature full-time students had increased by 8.7% from 2000 figures (UCAS press release 12.10.01). Throughout this review one should be bear in mind that some of the research cited is highly contextualised and not easily generalisable. In light of this summaries of coverage and sample sizes are included for many of the studies cited. The plethora of research available reiterates the finding from Section A that there is no singular 'mature student', although mature students do exhibit certain trends in their modes of participation. Literature sources point to sub-sections of the mature student population having diverse needs, abilities and aspirations e.g. Wilson (1997), Williams, (1997), James (1995) and Ecclestone (2000). Most mature students are concentrated in 'new' universities (Wisker, 1996), attend particular modes of study, types of course6 (James, 1995) and receive proportionally fewer resources than younger students (Yarnit, 1989). The majority of part-time students are mature aged over 25 years7 (Broomfield, 1993) and female. Most mature students are women and mature women account for 25% of students (Maynard & Pearsall, 1994)8 . There are differences between
5 This study examined the labour market earnings gap for mature female entrants through an economic assessment and meta-analysis of existing empirical studies. 6 Although our analyses of current HESA data suggest that patterns of study and course choices are quite complex, as indicated in Section A 7 See also our analyses in Section A of current HESA data which indicated that mature students aged under 24 are more likely to study full-time, whereas those aged over 24 are more likely to study part-time 8 The research investigates the extent to which domestic commitments may or may not constrain men from entering higher education and the difficulties that these may present for them once on their studies. Maynard and Pearsell explored the way in which the process of personal transformation on entry to higher education is experienced by male students and the impact of this on personal relationships, not only with partners, but also on others close to them. They also looked at the ‘single’ mature student. They conducted a detailed study of a

62
which mature women participate in terms of class, sexuality, disability, area and ethnicity (Coates, 1989). Similarly, as our analyses pointed to age differences within the 21-29 age range, other studies have also noted important differences between the characteristics of ‘older’ and ‘younger’ mature students (Baxter & Hatt, 19999; Hoskins et al., 199710). In particular, some evidence suggests that older mature students gain better degrees on average than younger students, and mature students with non-traditional qualifications obtain the best degrees of all (Hoskins et al, 1997). But there is divided evidence in the research literature as to whether mature students are more likely to withdraw from their courses. Work by HEFCE suggests that retention is lower amongst matures. On the question of 'why do mature students return to study?' the following motivations have been identified: - There are no single reasons or motivations, but 'clusters' of reasons (Neville, 1994)11 and often
reasons can only be revealed in retrospect (Blaxter & Tight, 1993). - Davies et al (2002) found that the five most important motivating factors for new entrants were: to
enhance career prospects, interest in subject, desire to improve qualifications, to change direction of life and to improve long-term financial situation. The survey, focus groups and interviews with potential entrants showed that their motivations were similar to new entrants.
- Motivations to study do seem to vary however with age and gender (Blaxter & Tight, 1993). Women may have been delayed from continued study due to marriage at a young age and the birth of children, and particular personal life events/problems (e.g. marriage breakdown, illness, children leaving home) may prompt them to return to study (Cochrane, 1991)12. Women may also cite 'personal betterment' reasons (Archer & Hutchings, 2000; Leathwood et al., 2001).
- Different 'types' of mature student have been identified by Wakeford (1994) and Green & Webb (1997). For example, in their interviews with 92 students, Green & Webb identified three main motivations among mature respondents for returning to study: these all related to prior experiences of schooling when they had experienced their potential as ‘untapped’ or ‘wasted’ or when further study had been ‘denied’ (as ‘not for the likes of us’).
- Men students are more likely to frame their motivations to return to study in terms of escaping unsatisfactory work situations (Maynard & Pearsall, 1994; Archer, Pratt & Phillips, 2001, Neville, 1994), but some also mention the personal satisfaction they get from studying (Blaxter & Tight, 1993).
- Although single employed men received family scepticism about returning to study, male breadwinners who had returned to study received greater encouragement from their families than female students, 'despite the fact that this often meant that the family would have to live in relatively straightened circumstances' (Maynard & Pearsall, 1994; p.231).
The benefits of higher education study to mature students are at present rather inconclusive. Small-scale reports from actual students have identified women as reporting gaining confidence and assertiveness, whereas men report becoming more considerate, tolerant, happier in relationships and small number of full-time undergraduates at a college of higher education comprising about 2500 students. Thirty students were interviewed, 10 were female and 20 were male. 9 The focus of this article was on a group of mature students on a social science programme. Empirical work deals with their progression from 1st to 2nd year of study. The study reports data from 87 mature students (aged 21+) from a larger cohort of 487. 10 The computerised records of a large university were analysed in an attempt to determine which variables served as predictors of degree performance. 6,866 student entries were analysed in the database from a single institution (Plymouth, 1991-95, some entries excluded by the authors). 11 This study explored what motivates adults to join an Access course, questioning whether there are there any major differences between males and females in this respect. Neville conducted a survey of Access students in 12 F&HE institutions, West Yorkshire, 1992. 359 (41%) of students completed questionnaire, 124 male (35%), 235 female (65%). 12 In this study of mature female students, six mature women students were interviewed.

63
gaining in confidence, knowledge and skills (Maynard & Pearsall, 1994). In terms of broader economic returns from participation, the returns for mature students are thought to be lower than for younger students (Field, 2000) but it is recognised that relatively little is known about the rates of return for mature students from HE, particularly mature women (Coffield & Vignoles, 1997). Blundell et al. (1996) calculated a return to a degree of 12-14% for all males, and just 5-7% for those starting over the age of 21. The private economic returns associated with lifelong learning have been researched, and found to be negligible in terms of earnings, although there does appear to be some improvement in the likelihood of being employed and a reduction in the likelihood of being unemployed (Jenkins et al (2002) CEE DP 19, Conlon (2001) CEE DP 13 ). Mature females however, earned the same return to their degree as young women. These results suggest that older students may earn a lower return to their degree. However, the definition of mature may matter. Egerton and Parry (2001) suggest that, in comparison with the 2+ A-level group, mature graduates, who acquired their degree after the age of 25, earn a private rate of return of 1.5% for males and 5.6% for females (which is very low compared to the figures for all graduates). Even more recent work by Jenkins et al (2001) found no return to a degree for mature students who took a degree between the age of 33 and 42. This seems to indicate that the return to a degree may decline quite sharply with age of commencing study.13 Reasons for Non-Participation Very little research has been conducted to examine the views of non-participants. The following evidence comes from the UNL Social Class & Widening Participation in HE Project14 (e.g. Archer et al., forthcoming; Archer, 2001; Archer & Hutchings 2000; Hutchings & Archer, 2001; Archer, Pratt
13 Much of the material cited here on the returns to mature students is extracted from work done for the DfES by Anna Vignoles (LSE, CEP). 14 The research project was conducted in three main phases and utilised a mixture of methods. Focus groups were conducted with inner city, ethnically diverse working class respondents, including both ‘non-participants’ (people who were not in higher education and who were unlikely to apply) and ‘participants’ (current HE students from working class backgrounds). The ‘generalisability’ of focus group findings was explored through a national survey. Phase One: Focus groups with ‘non-participants’ Sixteen focus group discussions were carried out with a total of 118 working class14 people aged 16-30 living in north and east London. Approximately one third of the sample identified themselves as ‘black’ (Black African, Black Caribbean, Black-Mixed race), one third ‘Asian’ (Pakistani, Bangladeshi and Asian-Mixed) and one third ‘white’ (white-British, white-Italian and white-Turkish)14. Ten groups took place in further education (FE) colleges, where respondents were attending courses from which they were considered to be unlikely to progress to HE (e.g. NVQ Level 1). Six further groups were recruited from the general public according to gender and ethnicity (African Caribbean, Bengali, white). These ‘single sex/separate ethnicity’ groups mostly included people who were not participating in any form of education, (many of whom had left school at 16 and were now working or unemployed) although some respondents were studying part-time in FE. Of the non-participant sample, 16 said that they definitely hoped to go to university (though only 9 of these were currently taking level 3 courses). About the same number explicitly rejected the idea. Many of the remainder expressed some interest, but said they were unlikely to enter HE. Phase Two: A National Survey: Focus group findings informed the design of a national survey questionnaire. Questions were administered through the MORI Omnibus survey to adults from social classes C1, C2, D and E, aged 16-30 years living in England or Wales. Questions were asked over three survey sweeps and a total of 1,278 respondents were successfully targeted. Of these respondents, 56% were female and 44% male. 91% of respondents were white and 9% from ethnic minorities. Overall, 17% of the sample had been/were at university, 17% expressed possible plans to apply and 59% did not plan to go to university at all. Among respondents, 13% held a degree, 9% had HND/C or equivalent, 24% had 2 or more A Levels and 40% had 5 or more GCSEs, 22% had less than 5 GCSEs, Level1/2 NVQ. 7% did not hold any formal educational qualifications. Phase Three: Focus groups with ‘participants. Seventeen focus group discussions and interviews were conducted with a total of 85 new first year undergraduates at an inner-city, post-1992 University. Respondents were recruited from a range of courses from across the faculties. Of these respondents, 51 were women and 34 were men. Approximately 30% of respondents could be identified as 'white British', 20% as Asian, 20% as black and 27% were from other (mainly white European) backgrounds.

64
& Phillips, 2001; Archer, Leathwood & Hutchings, 2001 amongst numerous other papers) and from Davies et al (2002).15 Our research identified a complex range of factors impacting upon non-participation, but the ‘strongest’ factors that acted as barriers to access are detailed below. This section also looks at participants and the factors which inhibited or discouraged their participation in HE. • ‘Knowing someone’ For many focus group respondents, the possibility of going to university was a ‘non-choice’; it had never entered into their choice/decision-making horizon. The UNL MORI survey revealed that 59% of the sample did not plan to ever go to university, and almost half of all respondents (49%) had never thought about doing a degree (this figure rose to 60% among social class E interviewees)16. Qualitative analysis revealed that few working class respondents were able to draw on a family history of HE participation to support and guide them through the process of application and entry. As a result, most respondents knew relatively little about how to apply to university, what it might be like there or what studying in higher education might cost and entail (See Hutchings & Archer, 2001). It could be argued that working class families are highly disadvantaged within the HE process as compared to middle class applicants, who are able to draw upon greater cultural capital and resources (e.g. Reay, 1998). Indeed, the working class student interviewees said that knowing someone who had been to university was a very important factor in their decision to apply. This personal contact not only introduced university into respondents’ horizons of choice but provided a trusted/valued information source (see below), support and advice on how to apply and represented the ‘achievability’ of university participation for ‘people like us’. ‘Knowing someone’ who had been also helped work against the sometimes strong ‘cultural’ resistance to participation that respondents recounted from friends, peers and families. Women in particular identified family and social/ community opposition to the idea of their going to university because it would entail getting ‘above your station’ (Hutchings, Archer & Leathwood, 2000) and/or because for those with children it was considered ‘irresponsible’. Interestingly, ‘knowing someone’ did not come out as clearly in research by Davies et al (2002) although it was highlighted as a reason for not thinking about HE at the time that respondents were leaving school. The fragmented nature of the information available was important, as was the timing of information although these issues were raised more in relation to the choice of HEI and course rather in relation to the decision about whether or not to participate. • Risk Across all phases of the study, working class respondents recognised that participation will entail considerable social and economic risks, costs, financial hardship and insecurity, and all with no guarantees of success. Respondents could recognise benefits but were in ‘impossible’ positions and constrained by material situations and needs as well as identity/attitudes. This combination of risk, cost and uncertainty permeated through the HE process, from application, to participation and graduate employment prospects. It is widely agreed that debt is riskier for working class groups and respondents highlighted the diverse, but very real, possibilities of failure (drawing upon their own experiences of educational failure) and the diverse social and economic consequences of failure for themselves and their families. In the face of these risks, many respondents’ reasons for not wanting to participate could be identified as using pragmatic rational strategies of risk management, ‘sticking to
15 This study focused on nine case study institutions (7 in England, 1 in Wales and 1 in Scotland) where there were both a large number of mature students and where there had been a significant decline in recent years. Through these HEIs, new mature entrants in 1999 in specific subject areas were identified and contacted using a questionnaire (866 responses). Through their guidance and recruitment activities, their own feeder provision and their local FE colleges, potential entrants (in 2000 or later) were identified and contacted by questionnaire (79 valid responses), focus groups (21 groups with a total of 220 participants) and interviews (187). Interviews were also conducted with key personnel in each HEI. The range of methods and tools were used to elicit rich qualitative data rather than quantitatively representative data. 16 Prior educational qualifications were related to plans to go to university: Among those with 2 or more A Levels, one in three planned to go to university. However, among those with no formal qualifications, nine out of ten said they had no plans to participate.

65
what you know’. The risks associated with mature participation in HE were also clear in Davies et al (2002). The risk comes about because of the range of different motivations and barriers, which interact and weigh against one another. Risks were large, interrelated and related to the costs of participating in a broad sense – “the cost in terms of time, money and pressure against the uncertainty of outcomes.” • Finance The impact of financial barriers for working class participation were emphasised consistently and uniformly across the research. Even the most academically qualified respondents, and those already at university, felt hindered by poverty and actual, or potential, debt. Both HE participants and non-participants appeared confused about grants/loans and fees, and even current applicants reported that they did not know about recent changes in the funding system. There was also confusion among students with regard to the necessity for LEA assessment to set the levels of fees paid. Student loans were widely assumed to be same as bank loans and were associated with a fear of debt. They were thought to be ‘unfair’ by some students and part of a governmental ‘money-making scheme’, a form of ‘double tax’ for graduates who would later contribute through higher earnings tax. The process of applying for financial support was found to be highly complex and repetitive; different authorities (LEA, Student Loans Company, the University) all requiring the same information. Within the UNL MORI survey, men appeared to hold slightly more negative views of university participation than women: For example, slightly fewer reported enjoying studying and higher percentages of men said they would ‘rather earn money’ and thought university and the student image was ‘not for them’. In comparison, women appeared to be slightly more constrained by situational barriers; higher percentages of women said they would only study locally and part-time, and would do a degree ‘if it did not cost so much’. Throughout the research study, respondents identified the current shift to mass higher education as a barrier to participation. These disadvantages were framed in terms of the resultant ‘over-crowded’ graduate job market in which working class graduates (having attended ‘second rate’ universities and having achieved lower qualifications as a result of juggling work, financial and social pressures) would be the first to be ‘squeezed out’. Issues around retention crosscut with many other themes, such as finance, ‘risk’ and access routes. Many students identified that they were at risk of ‘dropping out’ due to financial difficulties. Single mothers and those students previously on benefits were particularly at risk. The necessity for working class students to continue in paid employment throughout their period of study was widely identified as a disadvantaging factor. Davies et al (2002) found that finance is both a key motivator and an important barrier to participation. Enhanced employment outcomes were most commonly given as the most important reasons for participating in HE. However, the costs of study were the principal barrier to participation. Particularly important was the lack of knowledge of financial regulations and support for mature students. • Information Respondents largely lacked (and distrusted) information and encouragement from schools or colleges. Within the MORI survey, 44% reported receiving no information from their schools or colleges regarding higher education. Again, this may reflect the nature of the sample. 29% of respondents did not have level 2 qualifications and so, at the time that they were at school, would not have been in the group who were equipped to progress to level 3 and higher education at that time. Ball & Vincent (1998)17 found a wide mistrust of particular ‘official’ sources of information among working class families and a heavy reliance upon ‘hot’ or ‘grapevine’ knowledge. Similarly in this research, qualitative analysis revealed that official sources were regarded as biased in that they represented institutional or governmental interests. These sources of information were contrasted with ‘informal’, local sources, which were regarded as more useful and reliable. Working class HE 17 This article draws on interviews with 172 parents (138 actual interviews) about the processes involved in choosing secondary schools for their children.

66
students narrated the importance of having had trusted friends or family members who encouraged them through entry routes and provided an important motivation to apply for university. The majority of non-participants were unclear about what entry qualifications are required for university, but it was widely assumed that whatever these were, they would be higher than the ones they personally held. The MORI survey revealed that only 32% of respondents thought that they had the grades or qualifications which would allow them to go to university, and this figure fell to 17% among social class E. Among mature respondents, prior educational qualifications also had a strong influence on their potential plans. Appropriately qualified respondents were five times more likely to consider applying than those with no formal qualifications. However, there was also an influencing factor of belief in one’s ability to pass a degree, which was not highly correlated with level of qualification (i.e. Levels of self-belief were also present among those respondents who actually lacked the required HE entrance qualifications). Where focus group respondents had knowledge of alternative entry routes, the legitimacy of these was often questioned. Both HE participants and non-participants thought that the qualifications they held (such as GNVQ, BTEC, Access courses) were regarded less highly than A Levels. It was also argued that within universities, working class students with ‘non-traditional’ qualifications are ‘labeled’ and/or unprepared. The non-participant respondents were largely employed in occupations from which it is difficult to accumulate the forms of accreditation that are currently recognized as routes for entry to HE. Mechanisms that do recognize more diverse forms of potential and life experiences, such as APEL, remain marginalised within the HE system and thus offer limited potential for widening participation. Many respondents appeared to be skeptical of the educational system as a whole. For example, they regarded routes designed to widen access as ‘money-making’ schemes. Davies et al (2002) also highlighted the importance of information. In particular, mature applicants or potential applicants found it difficult to get full information, particularly in relation to financial support and institutional timetables, at the appropriate time. • HE Cultures Higher Education was talked about as a middle class system in which working class students were disadvantaged and ‘different’. 45% of the MORI sample agreed that ‘the student image is not for me’. Some focus group respondents anticipated, or recounted, being intimidated by middle class students. Mature students were particularly likely to voice fears of being ‘out of place’. Some mature female students also felt they did not understand the culture and language of the middle class staff. A number of non-participant women talked about universities as ‘big and scary’ and ‘snobby’. Independent of whether respondents personally expressed a wish to go to university or not, ‘students’ were widely represented as middle class (and white) and therefore ‘different’ to oneself. Images of (middle class) students were largely negative, with students positioned as ‘lacking common sense’, ‘immature’ and as socially inadequate. This latter view was particularly prevalent amongst white respondents. Many respondents shared a view of university student life as characterized by ‘drinking and partying’, but this stereotype was generally regarded as negative for a number of reasons. For example, participants and non-participants emphasized the risks of alcoholism and debt associated with a culture of ‘cheap drink’. Mature and Muslim students felt that the ‘partying’ image promoted by university student unions marginalised and did not represent their own experiences and values. Classed, gendered and racialised identities also provided an important, and highly resilient, source of resistance to participation. Black and white male non-participants in particular had a sense of masculinity and male authority that were closely identified with paid work, and were experienced as antithetical to ‘feminised’ study (see also Bernard, 1981; Brannen & Moss, 1987; Henwood et al., 1987). In our research, working class men felt that had 'more to lose' (in masculinity terms) by giving up their 'local power' and entering the middle class male world of HE (Archer, Pratt & Phillips, 2001). Davies et al (2002) did not find that institutional factors were common or high up on the list of general motivations and barriers. However, many factors were important in the choice of HEI

67
including advice, attitudes and admissions procedures. As with other research reviewed this study did get a strong sense that mature respondents had a particular institution or type of institution that they regarded as appropriate to them. This was reflected in one of the case study HEIs where more than 75% of students were mature, a very high percentage were from ethnic minority groups and most lived locally. • Time and Other Responsibilities Respondents in our research also talked about not having the ‘time’ to enable them to participate in higher education. Non-participant men were more likely to frame these concerns in terms of their responsibilities to undertaking paid employment and, among the younger men, to maintaining the symbols of ‘successful masculinity’ (e.g. a car, designer clothes, desirable lifestyle- see Archer, Pratt & Phillips, 2001). Women, however, were more likely to suggest that their family (and domestic financial) responsibilities would prohibit them from participating in higher education (e.g. see Archer and Hutchings, 2000). Davies, et al (2002) also found that time and responsibilities were cited as key barriers to mature student participation; ‘Barriers to entry were linked to the realities of mature student lives: a multiplicity or roles, costs of study, the need for a reliable source of income to meet existing commitments, the importance and value of caring responsibilities, and time problems’.

68
LITERATURE ON RETENTION There appears to be limited quantitative evidence in the literature on retention of mature students. However, Smith and Naylor, 200118 (who analysed a ‘true’ cohort from 1989 through to completion) have modelled the dropout rate of the 1989 cohort in pre 1992 universities. They show an increased chance of drop out with increasing age (except for over 34-year-old females). Poor social background is related to withdrawal (although Smith and Naylor only found a significant effect associated with social class 1). It is higher for those with lower qualifications (e.g. Smith and Naylor estimate that each A-level point for males contributes 1.4 percentage points better retention; for females, although statistically significant, the effect is less pronounced). HEFCE (1997) state that mature students have a higher dropout rate. It appears that retention is better for women than men and that there is a difference in retention for different subjects. HEFCE (2000) calculates that non-continuation rates for mature entrants to full-time first degrees are higher than for young students. Much of this difference is associated with differences in entry qualifications between young and mature entrants. Qualitative and questionnaire research around retention is notoriously difficult to conduct. However, excellent studies by Benn (1995)19, Ozga & Sukhnandan (1997)20, Yorke et al., (1997)21, and Davies & Elias (forthcoming)22 do provide very useful indications of the factors affecting ‘drop-out’. In addition, the Sixth Report of the Education and Employment Select Committee (2001) cites evidence, which suggests that a fairly robust conclusion can be drawn that students from economically and educationally disadvantaged backgrounds are vulnerable to non-completion although also highlighted that the exact nature of this relationship is not straightforward. Moreover, much of the variation in non-completion by social class is likely to be explained by their lower entry qualifications and choice of subject.
18 This study used a data set based on anonymized individual universities student records for the full populations of undergraduate students leaving the traditional ‘pre 1992’ universities in one of the years 1990-1993. Data contained information on about 400 000 students, about 100,000 per cohort. 19 The article examines the factors affecting student withdrawal from higher education. Benn measured attrition rates in 1986 for 7 countries (Belgium, Denmark, Germany, Italy, Netherlands, Spain and UK) using source data from Educational statistics for the UK. 20 This study presents an explanatory model of undergraduate non-completion, based, primarily, on the findings of a qualitative case study. The project was conducted in 2 parts: 1st part examined and analysed a sample of non-completers from 3 ‘types’ of HEI and compared trends with national data. For this paper, the 2nd part of the study consisted of a case study of non-completion at a single university. Based on a matched sample: 169 students who had withdrawn, matched as closely as possible with a completer. The study also utilised a random sample of academic staff drawn from approximately half the departments. Postal questionnaires were sent to non-completers and matched completers (N= 41, 28%). Follow-up interviews were conducted with willing non-completers (N=20). Follow up, face-to-face interviews were run with completers who had considered withdrawal (N=8); and Face to face interviews with members of staff (N=14). 21 A questionnaire survey was undertaken with the students who had left the 6 project institutions during, or at the end of, 1994-95 without completing their programmes of study. 1083 responses from a mailing of 5512 (response rate ~20%). They also undertook a telephone survey of non-respondents to amplify the number of respondents, this resulted in a further 533 responses (overall response rate of >30% for FT and sandwich students). 22 This study obtained a sample of persons regarded as ‘withdrawers’ from a database of student records maintained by the Higher Education Funding Council for England (HEFCE). Potential withdrawers were identified for the years 1996/7 and 1998/9 for 30 selected institutions of higher education. Approximately 16,400 ‘withdrawers’ were identified. Questionnaires were mailed to approximately 15,200 of these people, of whom 10 per cent replied. A follow up telephone survey was conducted for 100 respondents to the postal questionnaire. Response bias means that the findings are from the better-qualified segment of those who discontinue their studies.

69
The UK has relatively low rates of attrition compared to other European countries (Benn, 1995), but withdrawal is still problematic because it is thought to disproportionately affect particular social groups (mature students, some minority ethnic groups, working class) and because it costs 'student time, money and self-esteem' (Benn, 1995). In relation to the issue of whether mature students have higher rates of attrition, the literature suggests the following: - There is a need to be wary with statistics. Non-completion rates are difficult to ascertain/ assess
due to differing ways of defining and calculating non-completion (Ozga & Sukhnandan, 1997); crudeness of the data smoothes over distinctions between differences in the HE sector and differences in calculations/definitions (Benn, 1995) and between part-time/full-time drop out and mature/non-mature attrition.
- Research into factors associated with non-completion offers a very partial picture. This is partly because it relies on post-hoc rationalisations of the reasons for leaving, and partly because response rates among students who have withdrawn tend to be very low (Benn, 1995). Davies & Elias (forthcoming) report an overall response rate of 8.6%. However, within this they found interesting variations by gender, pre-entry qualification level and age. Women, younger students and those with higher pre-entry qualifications were more likely to respond. This means that response rates for mature students are lower than 8.6%.
- The important differences between 'old' and 'new' sectors has been confused within some research. There is particularly little work on factors affecting withdrawal of non-traditional students in 'old' HEIs (CVCP, 1993). In the 'old' sector, mature students seem more likely to withdraw (Lucas & Ward, 1985; the Exeter study cited in Benn 1995 showed 16% mature withdrawal and only 8% of younger students). However, it is important to remember that mature students achieve equally well.
- As a result of these factors, there is contradictory evidence. Some claim that mature students are more likely to fail than younger students (e.g. Woodley et al., 1987). Others claim that (older) mature students are more likely to complete than younger students (Walker, 1975; Nisbet & Welsh, 1972; Lucas & Ward, 1985; Richardson, 1994b, Richardson 1995). There is also evidence that younger mature female students have the worst rates of progression (Baxter & Hatt, 1999).
Some mature students may have a greater propensity to withdraw than others; studies have identified the following groups as particularly vulnerable: - men (Benn, 1995), particularly poorer men who have been unemployed (Smith & Naylor, 2001) - those living far away from the course (Benn, 1995) - students who are unmarried or have no partner (Benn, 1995, Lund, 1989). However, it is generally agreed across the literature that there is no single reason or cause for student withdrawal (e.g. Benn, 1995) and that decisions result from the interaction of different factors. Thus non-completion needs to be understood as 'part of a complex social process of student-institution negotiation' (Ozga & Sukhnandan, 1997). Factors cited by students as reasons for withdrawal Various studies have identified broadly similar lists of factors cited by students for withdrawing from HE courses. Yorke et al. (1997), investigating withdrawal in all age groups, identified incompatibility between course and student as the main reason for withdrawal, followed by lack of preparation for entry to HE (both in terms of self-management skills and study skills), then lack of commitment, financial hardship and poor academic progress. A more recent study by Davies & Elias (forthcoming) has similar findings: mistaken choice of course was overall the most frequently cited factor, followed by financial problems, personal problems and academic difficulties. However, the reasons for withdrawal among mature (over 21) students are rather different from those found among the younger students. Davies & Elias found that 56% of the mature students withdrawing cited financial problems as a contributory factor, and for 23% this was the main factor

70
involved in their decision. Personal problems were identified by 46% as a contributory factor (and as a main factor by 17%), and academic problems by 32%. In this age group mistaken choice of course was much less important than for the younger students (only 28% cited it, in comparison with 55% of those under 21). Evidence from the DfES MORI survey (2001) produces a similar range of factors, but indicates different relative importance. However, the numbers involved are small. Overall there were 400 respondents aged 21-30 who had level 2 or 3 qualifications. Of these, 59 (15%) had started a Higher Education course but not completed it. Of these 59, 22% claimed they did not like the course or it was not what they expected, with 36% stating that they left for ‘personal reasons’. 24% said that they left because they could not afford it, 7% to take up employment, and 5% claimed that they left because the course was too difficult. In the section that follows each of the factors implicated in withdrawal is considered in more detail. Institutional Factors Mature students generally see themselves as having a much more limited choice of institution than younger students because they are less mobile (Davies, et al, 2002). As a result, ‘mistaken choice of institution’ was a much less important factor in withdrawal among the over 21s (15%) than among the younger students (30%) (Davies & Elias, forthcoming). Davies et al 2002 reports that some HEIs were moving away from recruiting mature students.23 Those at the top end of the hierarchy of universities tended to prioritise A-level entry: thus mature students may be labelled, particularly by elite institutions, as high risk, different (Bamber & Tett, 2001)24. A factor in withdrawal is the existence of institutional cultures which are hostile/indifferent to non-traditional students, particularly those from Access routes (Armstrong, 199625, Waters & Gibson, 200126) and lesbian/gay students (Jordan, 2001). Institutional policies can impact on retention of mature students: - It is important that the institution provides clear, concise and up-to-date information to students.
'Good quality contact with, and attention from, staff' can help lower attrition (Hayes, 1996)27. Attrition is also linked with institutional cultures in that withdrawal can be reduced by providing clear pre-entry/induction advice and guidance and by changing institutional cultures (Armstrong, 1996). Provision of information also to part-time students has been identified as important (Bourner et al, 1991, Benn, 1995).
- The institutional image is important, and in particular, how it presents itself and deals with queries. Archer et al (forthcoming) report that mature students were easily deterred by responses that were seen as unwelcoming or patronising. There is a need for the provision of services for mature students to be evaluated by HEIs, whilst recognising the local context practicalities in order to provide better environments for adult learners (McGivney, 1991).
23 As mentioned, it is important to note that this study selected a small not necessarily representative sample of HEIs to focus on the decline in mature full-time enrolments in HE during the mid to late 1990s. Consequently, the results are not generalisable to all HEIs. 24 This article aimed to illuminate the dilemmas involved in widening participation at an elite university; with a focus on issues of progression, retention and the quality of student experience. 18 participants (6 male) were interviewed individually, and in small groups, at the start of the course and after 3 months. Individual interviews held with 10 of the students during their 3rd year. 25 This article did not give details about number of participants citing only that it was ‘a representative cross-section of students on the Access programme’. 26 This study examined psycho-social causes of withdrawal from Access courses. 45 students (33 female) responded to an invitation to participate in a semi-structured interview. Only 4 of the 79 who withdrew (from an original 260) were interviewed, so responses are largely based on those who remained on the course.All students came from the same institution. 27 Hayes’ article summarises findings from a NIACE seminar on Student Retention and completion, but source studies, data/samples etc are not reported in this report.

71
- Need to increase Access students' confidence once at university through increased staff contact (Waters & Gibson, 2001)
- Among post-1992 part-time students, the main factor affecting completion was identified as evening only provision (Bourner et al., 1991)
- The role of personal tutors in directing students ‘at risk’ towards appropriate sources of help should be promoted (Davies & Elias forthcoming).
Choice of course A ‘mistaken choice of course’ was identified as the most important factor in deciding to withdraw by 24%, and as a relevant factor by 55% of the 1,510 respondents in Davies & Elias’ (forthcoming) survey for the DfES. However, among the over 21s only 28% cited it as a relevant factor, and it did not figure in the three main factors in decisions to withdraw by this age group. Domestic and Personal Factors ‘Personal problems’ were cited as a factor in deciding to withdraw by 45% of the over 21s in Davies & Elias’ (forthcoming). This was the second most cited factor among mature students, and was more important for this group than for younger students. The over 21s were also very much more likely to cite caring for dependants, illness and disability as factors in withdrawal. Previous studies have also found that mature students are more likely to withdraw due to external factors such as family commitments, time and money (e.g. Ozga & Sukhnandan, 1999; Bamber & Tett, 2001). Benn (1995) reports that 'stayers' were more likely not to have dependent children. Obviously financial and personal factors are closely linked, but here we have considered them separately. Not being married/ partnered can increase the risk of dropping out among mature students (Bourner et al., 1991). Benn (1995) reports on the Exeter study in which 'stayers' were more likely to be older women with partners. Lund (USA) found that married mature women part-time students finished significantly more often than single mature women on part-time courses. Mature students may face a lack of support from families and friends (Bamber & Tett, 2001; Waters & Gibson, 2001) so on-course peer group dynamics/mentoring is important (Benn, 1995) as is social integration (Smith & Naylor, 2001). Financial Factors These are widely cited as severely impacting on mature student retention e.g. by Ozga & Sukhnandan, 1999; Bamber & Tett, 2001, Bourner et al., 1991, Marks, 1999; Jordan, 2001. Davies & Elias ( forthcoming) found that 56% of mature respondents identified financial problems as having impacted upon their decision to withdraw from university; this was the most frequently cited factor for the mature group, and was very much more important for them than for younger students. 23% of mature students withdrawing from HE identified finance as the most important factor. They report that those for whom student loans were the main source of income were more likely to report that they had withdrawn for financial reasons than those whose main source of income was grants. Davies et al (2002) report that potential entrants in focus groups felt that little recognition is given to the fact that most mature students have financial commitments in the form of dependants and mortgages, and their circumstances are very different from those of school leavers. The NUS believes that the chief cause of students dropping out of their courses is hardship (NUS 1999). They found that over 50% of students had considered giving up their course, and that finance was a strong factor in this for around a third of all students. It is unfortunate that the Student Income and Expenditure Survey (Callender and Kemp, 200028) does not differentiate between students under 21 and aged 21 and over. Instead it uses 25 years as the
28 This report focussed on the Student Income and Expenditure Survey, conducted 1998-1999, which recruited a representative sample of 2,054 full-time and 747 part-time students from 87 HEIs. Students were interviewed and further details were collected through the completion of weekly expenditure diaries.

72
boundary between young and mature students. However, they report that lone parents (who generally are in the 21 and over age group) were the most likely to report financial problems, and that they had cut back on expenditure in almost every area. They reported that their children had to go without items such as toys, books and presents because they could not afford them. They had virtually no contingency funds to call on, and had the largest debts of any student group. This was, according to Callender and Kemp, because in this group there was a high take-up of student loans (94%) and a reliance on commercial sources of credit. Only a minority received financial support from their families, and they generally found that their employment opportunities were restricted by domestic responsibilities. Those lone parents who did work were the lowest paid group at £4.71 an hour (compared with an average of £5.31 an hour for those aged 25 and over), and Callender and Kemp suggest that this reflects the types of jobs available that were compatible with their domestic responsibilities. Some mature lone parents in the first week of their courses reported that they were uncertain whether they would be able to continue, and anticipated possibly dropping out (Archer et al, forthcoming). The introduction of the child-care grant thus seems to be a particularly positive step that is likely to continue to produce increased applications from this group, providing that information about it is sufficiently well disseminated, and should also reduce the numbers dropping out for financial reasons. The NUS (1999) report that 41% of full-time undergraduates had a job in term-time and that they were working on average 13 hours a week. A significant proportion felt that their employment was detrimental to their studies (54% of undergraduates). Barke et al. (2000)29 found that students working in term-time on average had slightly lower marks in assessments. This may mean that they could be more likely to leave as a result of poor academic performance. Mature students have been found to be less likely than younger students to work in term-time (Barke et al., 2000; Callender and Kemp, 2000) though it should be noted that these studies have defined mature students as 26 and over or 25 and over respectively. However, Barke et al. report that those mature students that do work are likely to be working above the median hours per week, and are more likely than younger students to indicate that they are working ‘simply to remain at university’. From this the authors conclude that some mature students may be facing considerable financial hardship. Academic Factors Academic difficulties were the third most cited factor in withdrawal from courses among mature students, mentioned by 32% (compared with 30% of younger students) (Davies & Elias, forthcoming). However, they suggest that academic difficulties actually play a much more important role than this figure indicates, since many of the early leavers also indicated, in response to other survey questions that keeping up with the course was a problem. (However, academic difficulties may be attributed to mistaken choice of course or to personal and financial difficulties). It has been suggested that length of time between gaining entry qualifications and HE entry may be linked to non-completion among mature entrants (CNAA, 1992). Both high and low levels of prior educational attainment can affect dropout (unable to keep up versus not taxing enough) (Bourner et al., 1991, Benn, 1995). When ‘aiming for accreditation / certification’ is not the main aim of undertaking the course, this can increase attrition rates among mature students (Benn, 1995, Lund, 1989). A number of writers have called for there to be a re-definition of non-completion: for example, suggesting that some adult non-completers could be re-classified as 'early completers' who have gained all the benefits they require from post-compulsory education, which may not necessarily entail gaining accreditation (Harvey 1995). From an international perspective, high rates of attrition are not always perceived as problematic or undesirable, such as in Italy (Benn, 1995). Jones & Thomas (2001) criticise current assumptions around student retention for being very narrow, addressing only standardised rates of completion. They propose an alternative approach, emphasising institutional 29 In this study, questionnaires were sent to students at the University of Northumbria, findings are based upon 879 responses.

73
flexibility, credit accumulation, transferability in tune with Lifelong Learning. This alternative approach stresses frequent periods of learning (with breaks) and moves away from traditional time/location constraints. 'It may also be instructive to look at different models of student participation and completion in an institutional context' (p.2). They criticise traditional HEI models for pathologising and blaming 'new' constituencies of learners, e.g. for being 'poorly prepared' for HE or lacking academic ability. 'This effectively attributes a relationship of cause and effect to the higher rates of participation by non-traditional entrants and the slight increase in instances of non-completion over the last decade' (ibid.). They question this assumption, and suggest causes could lie instead with personal, institutional and/or financial issues. They suggest these are crucial concerns because they can lead to 'questionable and perhaps damaging policies and practices'. Davies & Elias (forthcoming) report that those students withdrawing from courses made relatively limited use of the support systems available to them. The personal tutor was the most frequently used source of advice (by 42% of over 21s and 48% of under 21s). However, a quarter of those who had consulted personal tutors reported that they were ‘not useful at all’, compared with only 13% who regarded them as ‘very useful’. Over 21s were more likely than younger students to report making use of counselling services (23% of over 21s but only 13% of under 21s). The usefulness ratings were similar to those for personal tutors. Mature students were also more likely than younger students to seek advice about deferral (21% over 21, 9% under 21) - perhaps as a result of a stronger commitment to entering HE in the first place. They were also more likely than younger students to seek financial advice and to apply for Access or Hardship funds. Overall the mature group in Davies & Elias’ study emphasised the importance of financial support in preventing withdrawal. Jones and Thomas (2001) argue that HE cultures need to change to respond to the needs of mature students. They consider that currently institutional responses bolt on additional support services for helping students adapt to an alien environment, rather than change institutional culture. They therefore recommend new patterns of staff recruitment, progressive teaching/learning practices, curriculum breadth, alternative assessment practices and cultural shifts concerning what constitutes knowledge, 'all of which should be tailored to accommodate difference'. International Studies Work from other countries points to the importance upon retention rates of factors including academic integration, social integration, institutional commitment, grade point average, financial satisfaction and goal commitment (Sandler, no date). Inadequately trained mentors (Marinelli, 1991), the perceived utility of education for future employment, satisfaction with student role, opportunity to transfer and age (Metzner & Bean, 1987) may also impact upon non-completion rates among mature students. An Australian study with 118 mature female students shows they perform academically well (above average) and have confidence in their abilities, and being a mother is not a barrier to achievement. But 42% of such students failed to complete due to a variety of reasons including family responsibilities, work responsibilities, practical difficulties, financial problems, lack of support from family members, dissatisfaction with course/lack of academic feedback and staff attitudes in particular subjects (law, economics, business) (Scott et al., 1996). The importance of provision of information and guidance is also highlighted by Brindley (no date) in relation to improving retention in Canadian HE.

74
SECTION C: ENTRY ROUTES While students under 21 are very largely admitted by A-level routes, this is not the case with students post 21. A wide range of admission patterns is displayed. These vary by the type of course being undertaken – for example, undergraduate degree courses compared to HNDs – the mode of study, by age, by social class background, and by ethnicity. In any consideration of the potential for recruiting mature students, attention must be given to the diversity of potential qualifications used for admission. In the following analysis qualifications have been categorised using the standard HESA derivation (table 27) Table 27: HESA derivation of Highest Qualifications on entry to Higher Education HESA categorisation Description of qualification on entry Postgraduate Higher degree of UK institution Postgraduate diploma or certificate, excluding PGCE Postgraduate equivalent qualification not elsewhere specified PGCE PGCE with QTS/GTC Registration PGCE without QTS/GTC Registration UK First degree Undergraduate qualifications with QTS First degree of UK institution Other graduate & equivalent Graduate of EU institution Graduate of other overseas institution NVQ/SVQ level 5 Graduate equivalent qualification not elsewhere specified HE credits O.U. credit(s) Other credits from UK HE institution Other HE & Professional Certificate or diploma of education (i.e. non-graduate) HNC or HND (including BTEC and SCOTVEC equivalents) Dip HE. NVQ/SVQ level 4 Professional qualifications. Foundation course at HE level Other HE qualification of less than degree standard Level 3 Any combinations of GCE A/SCE Higher and GNVQ/GSVQ or NVQ/S ONC or OND (including BTEC and SCOTVEC equivalents) A Level equivalents A-level equivalent qualification not elsewhere specified Access ACCESS course GCSE GCSE/O level qualifications only; SCE O grades and Standard Other Foundation course at FE level Baccalaureate Other non-advanced qualification Other non-UK qualification, level not known No formal qualifications Accreditation of Prior (Experiential) Learning (APEL/APL) Mature student admitted on basis of previous experience Student has no formal qualification

75
Figure 31: Highest Qualification on entry: Full-time students starting undergraduate degree programmes under age 21
0%10%20%30%40%50%60%70%80%90%
100%
1998 1999 2000
no formal quals
Other
GCSE
access
equiv Level 3
A level
HE credit
Source: UCAS Figure 32: Highest Qualification on entry: Full-time mature students (21 - 30): full-time and part-time modes of study
Source: HESA data (autumn entry) Figures 31 and 32 show very dramatically that students under 21 rely on A Level or equivalent other Level 3 qualifications for entry, while mature students are far less dependent on this entry route. Part-time mature students in particular are least likely to enter with such qualifications. Previous HE credits and study form the most substantial route into part-time HE courses, which suggests again that many part-time mature students are returners to HE, rather than initial students, even though they are taking courses at undergraduate level. Access routes are more commonly used for full-time mature entry than for either young full-time entrants or for mature part-time entrants A substantial number of mature students – and an apparently growing number – are entering with ‘unknown’ qualifications. There are significant proportions of mature students who are entering with no formal qualifications
������������������������������������������������������������������������������������������
������������������������������������������������������������������������������������������
������������������������������������������������������������������������
������������������������������������������������������������������������������������������������������������
������������������������������������
������������������������������������
������������������������������������������������������
������������������
������������������������������������������������������
������������������������������������������������������������������������
������������������������������������������������������������������������
percentage of part-time students 21-30 by entry qualifications
0%
10%
20%
30%
40%
50%
60%
70%
80%
90%
100%
1998 1999 2000
������������������������������������������������
������������������������������������������������
������������������������������������������������
������������������������������������������������
������������������������������������������������������������������������������������������������
������������������������������������������������
��������������������������������
��������������������������������
������������������������������������������������
percentage of full-time students 21-30 by entry qualifications
0%
20%
40%
60%
80%
100%
1998 1999 2000
������unknown
no formal quals���Other���GCSEAccess
������A levek equiv
Level 3���HE and ProfessionalHE credit

76
(defined by HESA to include APEL/APL and previous experience: see the HESA derivations in Table 26 above). This variation by age can be shown in more detail in figures 33 and 34, for the 1994 and the 2000 entry (full-time students on degree and HND courses combined). The higher the A-level point score (or the equivalent Scottish Highers score), the younger the point of entry into Higher Education. (Data is used from UCAS because only this has the A-level point score). Figure 33: 1994 entry - qualifications for entry to full-time undergraduate courses via UCAS by age
Source UCAS Access course entry, and entry with partial degree credits, are seen to be almost exclusively post 21 modes of entry (and indeed, largely post 25 entry). The distribution in 2000 (Figure 34) shows that the tendency had shifted towards younger entry, almost whatever the qualifications level, and there are also fewer students starting after 40.
������������������������������������������������������������������������������������������������������������������������
�������������������������������������������������������������������������������������������������������������������
�������������������������������������������������������������������������������������������������������������������
��������������������������������������������������������������������������������������������������������������
������������������������������������������������������������������������������������
�����������������������������������������������������������������������������������������������
��������������������������������������������������������������������������������������������������������������
������������������������������������������������������������������������������������������������
�������������������������������������������������������������������������������������������������������������������
����������������������������������������������������������������������������������������
�������������������������������������������������������������������������������������������������������������������
���������������������������������������������������������������������������������������������������������
������������������������������������������������������������������������
����������������������������������������������������������������������
����������
����������
��������������������������������������������������
����������������������������������������
����� ����������
���������� �����
����������������� �����
����������
���������������
���� ���������� ����
����
���������� �����
���������� ����
������������
�����������������������������������
����������������������������������������
������������������������������
�������������������������
������������������������
0%
20%
40%
60%
80%
100%
high
point score
A Levels
low
all A levels
high
Scottish Highers
low
all Scot Highers
GN
VQ
Baccularate
BTEC/SC
OTVEC
part degree credit
Access
Other
None
������ Under 21
������ 21 - 24 25 - 39 40 and over

77
Figure 34: 2000 entry - qualifications for entry by age
Source: UCAS The type of course being studied is also significant. The highest qualifications on entry vary between HND courses and Degree courses, and within each of these also between mature and non-mature students. Figures 34 and 35 show the qualification levels of both kinds of full-time courses, showing four columns representing students under 21, the ‘young matures’ of 21 – 24, the older matures of 24 to 39, and the post 40 year old students (UCAS data with A Level point scores is only provided in these categories). In terms of degree students, once past the age of 21 the entry characteristics are very different: around 17% of all mature students start with no qualifications recorded. 'Other’ qualifications and Access course entry increase sharply after the age of 24. BTEC qualifications are particularly important for the 21 to 24 year old entrants, and GNVQ qualifications are significant for both the under 21 and the 21 – 24 groups (about 7% in each case), and much less significant for older mature students.
�������������������������������������������������������������������������������������������������������������������
��������������������������������������������������������������������������������������������������������������
��������������������������������������������������������������������������������������������������������������
��������������������������������������������������������������������������������������������������������������
���������������������������������������������������������������������������������������������������������
����������������������������������������������������������������������������������������������������
����������������������������������������������������������������������������������������
�������������������������������������������������������������������������������������������������������������������
����������������������������������������������������������������������������������������
��������������������������������������������������������������������������������������������������������������
��������������������������������������������������������������������������������������������������������������
���������������������������������������������������������������������������������������������������������
���������������������������������������������
����������������������������������������������������������������� ����� ����
��������������������������������������������������
��������������������������������������������������
����� ����������
����������
���������� �����
��������������������
��������
����� ��������
����������
����������
��������������� �����
������������������������������������������������������������
�����������������������������������
��������������������������������������������������
������������������������
������������������������������
�����������������������������������
0%
10%
20%
30%
40%
50%
60%
70%
80%
90%
100%
high
point score
A Levels
low
all A levels
high
Scottish Highers
low
all Scot Highers
GN
VQ
Baccularate
BTEC/SC
OTVEC
part degree credit
Access
Other
None
������Under 21
������21 - 24 25 - 39 40 and over

78
Figure 35: Degrees full-time 2000 entry: qualifications as % of age cohort
Source: UCAS HND students (Figure 36) show an analogous pattern, but one in which there is already much greater diversification of entry qualifications among the under 21 students. Only around 25% of these young students enter with A-level qualifications or Scottish Highers. No formal qualifications are recorded for over a third of all post 21 students, and for over 40% of all students of 25 and older.
������������������������������������������������������������������������������������������������������������������������������������
������������������������������������������������������� �����������
����������������������
����������������������
���������������������������������
����������������������
����������� �����������
��������������������������������������������
���������������������������������
���������������������� �����������
�����������
����������������������
����������������������
�����������
���������������������������������
���������������������������������
��������������������������������������������
�����������
��������������������������������������������
�������������������������������������������������������
�����������������������������������������������������������������������������
����������������������
������������������������������������������������������������������
�����������������������������������������������������������������������������
�����������������������������������������������������������������������������
0%
10%
20%
30%
40%
50%
60%
70%
80%
90%
100%
<21 21-24 25-39 40+
������ None
������ Other
Access
���Previous degree/partialdegree credits
BTEC/SCOTVEC
������ Baccalaureate
��� GNVQ
���Scot highers
A level <10
������ A level 10 - 20
A level 20 +
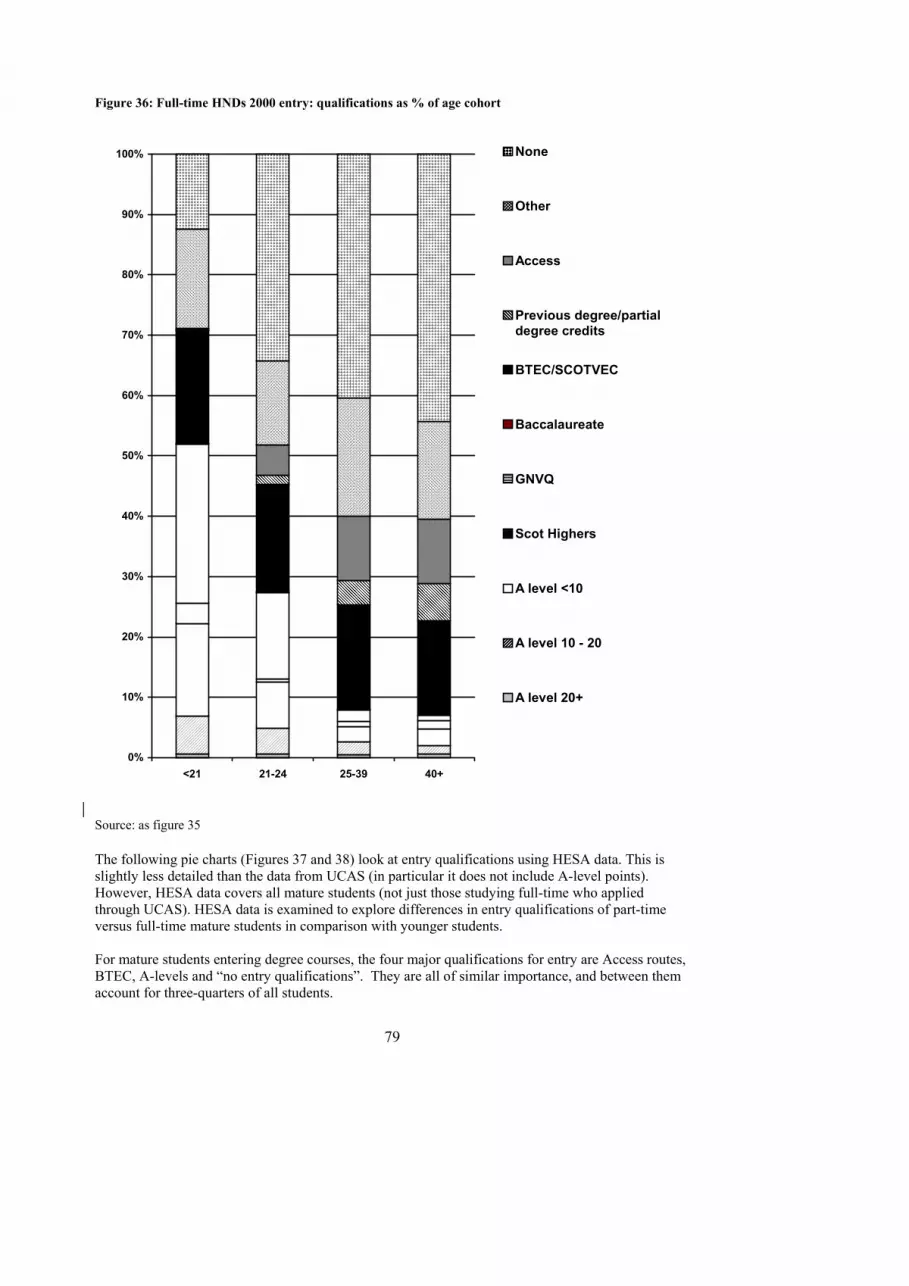
79
Figure 36: Full-time HNDs 2000 entry: qualifications as % of age cohort
Source: as figure 35 The following pie charts (Figures 37 and 38) look at entry qualifications using HESA data. This is slightly less detailed than the data from UCAS (in particular it does not include A-level points). However, HESA data covers all mature students (not just those studying full-time who applied through UCAS). HESA data is examined to explore differences in entry qualifications of part-time versus full-time mature students in comparison with younger students. For mature students entering degree courses, the four major qualifications for entry are Access routes, BTEC, A-levels and “no entry qualifications”. They are all of similar importance, and between them account for three-quarters of all students.
���������������������������������������
������������������������ ������������� ������������
��������������������������
������������
��������������������������
������������������������
����������������������������������������������������������������������������������������������������������������������������������
������������������������������������������������������������������������
������������� ������������
�������������
������������������������
���������������������������������������
������������������������������������
�������������������������������������������������������������������������������������������
������������������������������������������������������������������������
��������������������������������������������������������������������������������������������������������
������������������������������������������������������������������������������������
�����������������������������������������������������������������
������������������������������������������������������������������������������������������������������������������������������������������������������������
���������������������������������������������������������������������������������������������������������������������������������������������������������������������������������������������������
������������������������������������������������������������������������������������������������������������������������������������������������������������������������������������������������
0%
10%
20%
30%
40%
50%
60%
70%
80%
90%
100%
<21 21-24 25-39 40+
����None
����Other
Access
�������� Previous degree/partial
degree credits
BTEC/SCOTVEC
Baccalaureate
�������� GNVQ
�������� Scot Highers
A level <10
����A level 10 - 20
A level 20+

80
Figure 37: Entry qualifications to Degree courses, 2000, students over 21 only (full-time and part-time)
Source: HESA For mature HND students (far fewer in number), over one third arrive with no formal qualifications, and ‘other’ qualifications and BTEC are the other two major types of qualification used for entry. These three account for over 70% of all mature HND students.
������������������������������������������������������������������������������������������������������������������������������������������������������������������������������������������������������������������������������������������������������������������������������������������������������������������������������������������
������������������������������������������������������������������������������������������������������������������������������������������������������������������������������������������������������������������������������������������������������������������������������������������������������������������������������������������������������������������������������������������
������������������������������������������������������������������������������������������������������������������������������������������������������������������������������������������������������������������������������������������������������������������������������������������������������������������������������������������������������������������������������������������������������
�����������������������������������������������������������������������������������������������������������������������������������������������������������������������������������������������������������������������������������������������������������������������������������������������������������������������������������������������������������������������������������
����������������������������������������������������������������������������������������������������������������������������������������������������������������������������������������������������������������������������������������������������������������������������������������������������������������������������������������������������������������������������������������������������������������������������������������������������������������������������������������������������������������������������������������������������������������������������������������������������
A levels17%
BTEC/SCOTVEC18%
Previous degree/partial degree credits
7%
Access22%
Foundation3%
Other11%
None
Scottish Highers 1%
GNVQ4%

81
Figure 38: Entry qualifications to HND courses, 2000, students over 21 only
Source: HESA This suggests that, in considering the potential pool of mature students, attention should not only be focussed on those non-participants in the 21 – 30 year old cohort who have Level 3 qualifications, or even those with Level 2 qualifications. These will constitute an important source of supply to the mature student market – but it is also important to attract some non-participants with no formal qualifications who demonstrate, e.g. through APEL or previous experience, that they have the potential and motivation to benefit from HE. Table 28 shows the various highest qualification levels mature full-time students have on entering degree level courses for 1998 - 2000, using the autumn entry data. Unlike the material in Figure 34, this includes the 20% of students who have previous experience of HE (as reflected in having HE level qualifications or HE credits) and unknowns, and, as with figures 37 and 38 it is collected by HESA. For these students, Level 3 qualifications become increasingly less significant with age: almost half the 21 year olds enter on the basis of level 3 or equivalent qualifications, and less than a quarter of the 28 to 30 year olds.
������������������������������������������������������������������������������������������������������������������������������������������������������������������������������������������������������������������������������������������������������������������������������������������������������������������������������������������������������������������������������������������������������������������������������������
���������������������������������������������������������������������������������������������������������������������������������������������������������������������������������������
�����������������������������������������������������������������������������
��������������������������������������������������������������������������������������������������������������������������������������������������������������������������������������������������������������������������������������������������������������������������������������������������������������������������������������������������������������������������������������������������������������������������������������������������������������������������������������������������������������������������������������������������������������������������������������������������������������������������������������������
A levels8%
cottish Highers1%
BTEC/SCOTVEC19%
Previous degree/partial degree credits
2% Access10%
Other16%
None
GNVQ8%

82
Table 28: Qualifications on entry into full-time degree level courses, by age on entry, 1998 – 2000 (autumn entry only)
1998 1999 2000 Age Group
n % N % n %
21 HE credits 187 1.9 220 2.3 252 2.6 Other HE & Professional 2335 24.3 2021 21.1 1839 18.7 Level 3 4473 46.5 4316 45.1 4643 47.2 A Level equivalents 434 4.5 318 3.3 257 2.6 Access 357 3.7 409 4.3 382 3.9 GCSE 157 1.6 163 1.7 146 1.5 Other 564 5.9 590 6.2 598 6.1 No formal qualifications 255 2.7 281 2.9 259 2.6 Unknown 857 8.9 1242 13.0 1452 14.8 9619 100.0 9560 100.0 9828 100.0
22 HE credits 126 2.2 142 2.6 144 2.6 Other HE & Professional 1356 23.2 1147 21.0 988 17.8 Level 3 2304 39.4 2107 38.6 2246 40.5 A Level equivalents 225 3.9 174 3.2 149 2.7 Access 461 7.9 442 8.1 502 9.0 GCSE 113 1.9 119 2.2 77 1.4 Other 434 7.4 375 6.9 360 6.5 No formal qualifications 249 4.3 191 3.5 183 3.3 Unknown 576 9.9 762 14.0 898 16.2 5844 100.0 5459 100.0 5547 100.0
23-24 HE credits 145 2.1 156 2.5 143 2.3 Other HE & Professional 1336 19.4 1183 18.8 1057 17.3 Level 3 2368 34.4 2073 32.9 2121 34.8 A Level equivalents 231 3.4 178 2.8 186 3.0 Access 977 14.2 875 13.9 755 12.4 GCSE 184 2.7 156 2.5 100 1.6 Other 612 8.9 529 8.4 469 7.7 No formal qualifications 338 4.9 304 4.8 296 4.9 Unknown 696 10.1 851 13.5 972 15.9 6887 100.0 6305 100.0 6099 100.0
25-27 HE credits 149 2.2 150 2.5 105 1.9 Other HE & Professional 1303 19.1 1159 19.2 975 17.7 Level 3 1897 27.8 1550 25.6 1547 28.1 A Level equivalents 221 3.2 144 2.4 145 2.6 Access 1294 18.9 1168 19.3 977 17.7 GCSE 216 3.2 170 2.8 127 2.3 Other 595 8.7 458 7.6 405 7.4 No formal qualifications 483 7.1 394 6.5 363 6.6 Unknown 673 9.9 854 14.1 862 15.7 6831 100.0 6047 100.0 5506 100.0
.... continued

83
1998 1999 2000 Age
Group
n % N % n %
28-30 HE credits 108 2.1 117 2.5 106 2.4 Other HE & Professional 917 17.8 868 18.7 766 17.6 Level 3 1188 23.1 979 21.1 998 22.9 A Level equivalents 146 2.8 95 2.0 92 2.1 Access 1221 23.7 1071 23.1 986 22.6 GCSE 173 3.4 140 3.0 97 2.2 Other 444 8.6 387 8.3 303 7.0 No formal qualifications 431 8.4 336 7.2 313 7.2 Unknown 515 10.0 646 13.9 696 16.0 5143 100.0 4639 100.0 4357 100.0
Source: HESA data. As with the earlier analyses of HESA data in this report, this includes all FE colleges conducting HE work who make returns to HESA. Table 29 contrasts the highest qualification on entry by different modes of study, and includes all HE students (including full-time students on non-degree level courses, unlike Table 22). The significance here is the almost identical profile of the full-time with the "other" mode (principally sandwich mode, which is relatively very small), where Level 3 and equivalent courses are very important (about 38% of the total). Part-time students have very different entry routes, using other HE and professional qualifications - and many "unknown" routes.

84
Table 29: Qualifications on entry for entrants aged 21 - 30, all higher education courses, by mode, 1998 – 2000 (autumn entrants only) Mode: Full-time Year 1998 1999 2000 HE credits 795 866 811
1.8 2.1 2.0 Other HE & Professional 8271 7214 6415
19.1 17.8 16.0 Level 3 14849 13766 14297
34.3 34.0 35.6 A Level equivalents 1550 1057 1076
3.6 2.6 2.7 Access 4927 4582 4334
11.4 11.3 10.8 GCSE 1704 1668 1370
3.9 4.1 3.4 Other 3448 3155 2868
8.0 7.8 7.1 No formal qualifications 2649 2196 1961
6.1 5.4 4.9 Unknown 5151 6002 7063
11.9 14.8 17.6 Total 43344 40506 40195
100 100 100 Mode: Part-time Year 1998 1999 2000 HE credits 371 365 409
1.1 1.2 1.5 Other HE & Professional 12219 10788 8145
37.6 34.6 29.9 Level 3 5308 4959 4391
16.4 15.9 16.1 A Level equivalents 659 593 599
2.0 1.9 2.2 Access 346 386 314
1.1 1.2 1.2 GCSE 1638 1474 1153
5.0 4.7 4.2 Other 2525 1893 1374
7.8 6.1 5.0 No formal qualifications 3580 2496 2658
11.0 8.0 9.7 Unknown 5817 8269 8223
17.9 26.5 30.2 Total 32463 31223 27266
100 100 100
.... continued

85
Mode: Other Year 1998 1999 2000 HE credits 101 107 117
2.0 2.4 2.9 Other HE & Professional 1177 931 740
22.8 20.6 18.5 Level 3 1870 1558 1587
36.2 34.5 39.7 A Level equivalents 84 52 71
1.6 1.2 1.8 Access 488 480 444
9.5 10.6 11.1 GCSE 95 106 69
1.8 2.4 1.7 Other 439 360 239
8.5 8.0 6.0 No formal qualifications 298 280 256
5.8 6.2 6.4 Unknown 610 636 472
11.8 14.1 11.8 Total 5162 4510 3995
The following figure (Figure 39) shows changes in mature student entry qualifications over the past three years, by age. Each set of three rows represent three years for one age set. These figures are based on HESA data, and these include part-time students, and students who are re-entering Higher Education at undergraduate level: note the numbers (between 20 and 25%) entering with HE credits or HE and other professional qualifications. There is an increasing number of ‘unknown’ qualification levels year on year.

86
Figure 39: Changes in highest level on entry to degree courses, full-time mode mature students, by age, 1998 – 2000 (autumn entry).
Source: HESA
������������������������������������������������������������������
����������������������������������������������������������
������������������������������������������������������������������������������
��������������������������������������������������������������
���������������������������������������������������������������������������������������
��������������������������������������������������
������������������������������������������������������������������������������
����������������������������������������������������
������������������������������������������������
����������������������������������������������������
������������������������������������������������������������������������������
��������������������������������������������������
������������������������������������������������������������������������
����������������������������������������������������
������������������������������������������������
������������
��������������
������������������
����������������������
������������������������������������
��������������������������
������������������������������������������������������������
��������������������������������������
����������������������������������
����������������������������������������������������
������������������������������������������������������������������������������
��������������������������������������������������
������������������������������������������������������������������������������������������������
��������������������������������������������������������������
��������������������������������������������������������������
������������������
������������������
���������������������������
��������������������
������������������������������
������������������
������������������������������������
������������������������
������������������������
��������������������������
���������������������������������
����������������������
���������������������������������������
������������������������
��������������������
��������
����������
���������������
��������������
������������������
������������
������������������������
��������������
��������������
��������������������
���������������������������
������������������
������������������������������������
����������������������
����������������������
��������������������������
������������������������������������
������������������������������������������������������������
����������������������������
���������������������������������������������������������
��������������������������������������������
������������������������������������������
��������������������������������������
��������������������������������������������
����������������������������
������������������������������������������������������������
��������������������������������������������
������������������������������������������
��������������������������������������
��������������������������������������������
0% 10% 20% 30% 40% 50% 60% 70% 80% 90% 100%
21 years 1998
1999
2000
.
22 years 1998
1999
2000
.
23 - 24 years 1998
1999
2000
.
25 - 27 years 1998
1999
2000
.
28 - 30 years 1998
1999
2000
HE credits���
Other HE & Professional Level 3
A Level equivalents���
Access GCSE���Other
���No formal quals
���Unknown

87
LITERATURE ON ENTRY ROUTES An important issue is the degree to which HE staff welcome applications from mature students. This relates both to age and to the entry routes that mature students use. These two aspects are not easily separable, as mature students tend to enter HE with qualifications other than A-levels. Davies et al. (2002), interviewing staff in 9 HEIs with higher than average numbers of mature students, report a wide variation in enthusiasm about taking on mature students, both between institutions and between departments within institutions. Some departments reported that they had no particular focus on recruitment of mature students, or that they did not target them. Others argued that while application rates were healthy there was no need to target mature students, who were thus seen as an optional extra, available for filling places if needed. One tutor reported active discouragement of mature applicants and entrants because the environment of a campus university was difficult for them. Some prioritised the recruitment of younger non-traditional students - those from ethnic minority groups or those with disabilities. More often it appeared that the lack of enthusiasm for recruiting mature students was connected to a concern for academic reputation. In one institution a senior manager argued that recruitment of mature students with alternative qualifications would damage the positioning of the institution in HE league tables. Some HEIs had used recruitment requirements to raise their academic standing, emphasising A-level point scores. That inevitably militated against mature applicants who, as we have shown, generally offer non-standard qualifications. In some cases particular departments, rather than whole institutions, had raised their A-level points requirements. Some respondents pointed out that mature students without A-levels had less chance of doing well on the course. There is a strong sense in many of the responses that mature students are more time-consuming (and therefore costly) and are less likely to do well, and so are not welcome. Other institutions and departments, however, argued that the recruitment of mature students was embedded in the institutional policy agenda. Such institutions generally had well-developed AP(E)L arrangements leading to the award of credits and advanced standing. Case studies identify good practice in this area (e.g. Peters, Pokorny & Sheibani, 1999). Such arrangements are more likely to attract potential mature students. These contrasting attitudes to recruitment of mature students can be seen in Hogarth et al.’s (1997)30 case study of two universities. In interviews at a ‘Civic’ university academic staff in some disciplines had quite negative views of Access students, and commented that they tended to end up in the bottom of the cohort. Mature students and those with non-standard qualifications were estimated to cost more because they required more support. But in other disciplines staff had a far more positive attitude. At a ‘Campus’ university one department reserved a third of its places for mature students in the belief that they enliven sessions and make a positive contribution with their wider experience. This positive view of teaching mature students is common among staff that teach them on a regular basis; many prefer to teach such students (Davies et al., 2002). However, those universities that recruit a high proportion of mature students are found in the lower part of university league tables. Some staff suggested that the commitment of senior management to access is variable and changes with policy initiatives and funding arrangements.
30 The aims were addressed from an empirical point of view based on the following elements (1) an analysis of the educational and demographic characteristics of traditional and non-traditional students based on the Labour Force Survey. (2) A postal questionnaire survey of traditional and non-traditional students whose final year of study was in 1995/6 to address their perceptions about the returns to HE (3) A telephone survey of 500 non-traditional students – drawn from the postal survey- to capture a more in-depth set of views about their experiences of HE (4) 5 case studies of HE institutions to address the relative costs and benefits to the institution of providing HE to traditional and non-traditional students respectively.

88
The wide variety of vocational or access qualifications, or lack of qualifications, with which mature students enter HE can thus be seen as a way in which the hierarchy of universities is maintained. For many working class students, their local university is a post-1992 institution with a strong tradition of access but a low ranking in league tables. Reay (1999), interviewing Access students, found that some were unwilling to enter the universities that would be likely to offer them places. The hierarchy of HEIs is thus a deterrent to some potential mature students. Although studies have been carried out on mature students in HE, little has been written on mature applicants who were unsuccessful. Murphy & Inglis (2000)31 investigated the experiences of mature applicants who were unsuccessful in gaining entry to their chosen university, which did not encourage mature applicants and admitted low numbers. It did not operate any recognised access routes for mature applicants. Unsuccessful applicants were unhappy with the way they were rejected and concerned at the lack of information available on how to gain entry. The experience of being rejected resulted in feelings of inadequacy. However, around half persisted and eventually gained places elsewhere. Hutchings & Archer (2001) found that there was considerable confusion among working class non-participants about the qualifications required for entry to HE. This was particularly strong among the mature non-participants. This partly results from the very wide range of named qualifications: A and AS levels, GCSE, GNVQ, BTEC, City and Guilds and so on. Some respondents in this research were aware that the various qualifications are differently valued by universities, and this led to concerns that universities would not welcome applicants with vocational qualifications, or that those entering with vocational qualifications would be labelled and would not be able to achieve the highest marks in HE. Access routes were also discussed with suspicion; respondents were concerned that universities were simply trying to make money by asking potential entrants to do a course before embarking on higher education. Similarly the notion that one might be able to enter HE without qualifications was greeted with concern, as this could lead to mixed ability groupings, and those with lesser ability might dominate class time and hold other students back. Davies et al (2002) identify considerable variation in the level of resources committed to recruitment, support and retention of mature students. As mentioned previously, this report is based on research in a small number of HEIs that take large numbers of mature students. It is thus likely that a wider study, including HEIs that do not target mature students, would reveal wider variations. It can be argued that without the provision of a high level of support, there is little point in offering entry to students from non-traditional academic backgrounds. The data on withdrawal suggests that level of qualifications on entry is a significant factor in drop out. Those with vocational and Access qualifications are more likely to drop out than those with A-levels. Thus, if participation is to be widened by admitting students with qualifications other than A-levels, appropriate funding needs to follow to ensure that such students are successful. Bamber & Tett (1999) offer a case study of an HE course in which a high level of resources is devoted to the support of mature working class adults who have had negative experiences of school. A high level of tutorial and study skills support is provided to build on the strong personal aspirations that these students bring to the course. A high proportion of entrants complete the course, despite their low pre-entry qualifications. This case study illustrates the argument that widening participation must be concerned not only with entry, but also with successful completion (Woodrow, 1996). There is a substantial literature about Access courses, designed to enable mature people without standard qualifications to gain entry to HE. Such courses often focus on particular disadvantaged groups, though it has been reported that some have been ‘colonised’ by the middle classes (Wakeford, 1993; Davies 1995). A major emphasis in all such studies is the need to support students, not only on the Access course but also when they enter HE. Neville (1994) aimed to find out what makes
31 This study examined unsuccessful mature applicants. They recruited a random sample of 200 names from a list of unsuccessful applicants in 1997 and sent out a postal questionnaire, of which 74 were returned (37% response rate). A sample of 10 applicants was chosen and 2 focus groups of 5 respondents were held.

89
adults join Access courses. The study reports that the access course was widely perceived as part of 'unfinished business' of on-going continuing education to 'compensate for interrupted or discontinued secondary school education'. The most frequently cited reason for returning to study was being in low-paid, low control employment; better job and career prospects were ranked as the main motivation by 44% of respondents32. Neville also reports that many students reported feeling isolated, and alienated from friends and families. Thus the Access course needs to provide such support to those returning to study. Capizzi (1996) highlights the limited statistics available on completion rates for Access courses, and reports on the studies that do exist considering achievement rates on ‘kitemarked’ Access certificates and the percentage progressing to HE. She argues that Access programmes were conceived of as a risky enterprise, and one would not expect such high levels of completion as for more conventional entry routes to HE. However, the data examined suggests that in general Access courses may be delivering somewhat higher completion rates for mature students. A further way of assessing Access courses is on the achievement of Access students once they enter HE. Waters and Gibson (2001), in a longitudinal research project with students on a university-based Access course, emphasise the importance of such courses in building up students’ self-esteem. The Access course was important in helping them to believe in themselves and believe they can enter and succeed in university. However, such support needs to be continued in HE. Current models of student support are inadequate because students will not necessarily access them, precisely because they lack confidence. They recommend that tutors and support staff need more time in which to 'develop and sustain confidence in the mature adult's own self-integrity'. Another study of progression to HE was carried out by Inman (1999), focusing on the progression of mature students from the Science Access Programme at University College Stockton (UCS). She found that 59% of those who embarked on the Access course with the aim of progressing to another course had achieved this. But students also cited many other gains: in particular the course had increased their self-confidence. There are many other case studies of Access courses. Researchers have also evaluated other widening participation initiatives: for example, Walker (1999)33 carried out a longitudinal study of drop-out and continuing students who attended a pre-University Summer School. This study unequivocally states that the students’ own motivation is the crucial factor affecting retention/attrition. It concludes that successful students could not have been predicted based on background information such as family tradition or previous qualification. A clear conclusion from the literature surveyed is that successful teaching of mature students who enter HE through non-standard routes involves the provision of extra time and support. This was acknowledged both by HEIs that do take on such students in large numbers, and by those that do not, as well as by those involved in Access courses. Thus, if they are to be successful, HEIs admitting mature students with non-standard qualifications require extra funding. However, any funding should be conditional on universities and colleges demonstrating that their processes are effective in assessing the potential of applicants.
32 This study used a questionnaire survey of 124 male and 235 female Access students 33 This article examined problems encountered by (and the similarities and differences between) students who drop-out and those who continue at University. 57 participants were interviewed, 18 dropped out over the period of time examined.

90
SECTION D: POLICY CHANGES AND FUTURE TRENDS Student Finance The evidence available suggests that in comparison with younger age groups, mature student participation is more sensitive to changes in student finance arrangements. This can be seen both from qualitative research examining the views of students, applicants and potential students, and more dramatically, from changes in mature student full-time applications since 1997. The excellent large-scale survey research conducted by Connor et al. (1999)34, Connor and Dewson (2001)35, Callender and Kempson (1996), and Callender and Kemp, 2000)36 in this area also provides sound and valuable data in respect of the impact of financial changes upon participation. Between 1997 and 1998 (when tuition fees were introduced) UCAS figures relating to full-time students show that the number of mature applicants accepted onto degree courses decreased by 11.41% (whereas under 21s increased by 1.17%) (UCAS, 1999). By 2000, the enrolment figures for mature full-time students were down by 26% since 1997 (THES, 20.7.01). However, in July 2001, UCAS reported a 6.2% rise in the number of mature applicants (UCAS press release, 20.07.01), and in October 2001, they reported that the number of mature full-time students had increased by 8.7% from 2000 figures (UCAS press release 12.10.01). This increase coincided with the introduction of a grant for mature students to cover 85% of the costs of childcare. It would seem, then, that policy changes in relation to student finance may have an immediate impact on participation. It should be noted, and it has been highlighted in the research reviewed in this report, that there are many interrelated factors that affect people’s decision to participate in HE. As a result, it is extremely difficult to isolate the impact of any one factor, such as student finance, on the decision to participate or to explain changes in participation in terms of changes in just one factor. There are other reasons for treating these figures with some caution. First it should be noted that while there was a decrease in mature student full-time recruitment in 1998, this followed an increase of 8.9% in 1997. Thus some students may have entered in 1997 rather than 1998 because of the changing financial arrangements, but it is not clear that large numbers decided not to enter at all. However, it does seem that finance is likely to have been one of the factors in the continuing decline in numbers from 1998 – and in the increased recruitment reported in 2001 by UCAS. A second factor is the possibility that some students decided to study part-time rather than full-time as a result of the changes in financial support systems. However, Table 11 in this report shows that there was a considerable decrease in the number of part-time students studying for first degrees between 1996-7 and 1997-8, and only a very small increase in numbers in 1998-9. There is then no indication 34 The overall aim of the study was to explore factors that shape decisions to enter FT HE in the UK and students’ choices of institutions. Its objectives focused on 3 key issues. (1) the importance of ‘informed choice’ (2) the need to widen participation and (3) the introduction of fees and increased costs to students of HE study. The Research comprised a number of modules: (1) National questionnaire survey of 36,245 applicants for entry into degrees and HNDs, which achieved a 61% response rate. Follow-up interviews were also conducted with 200 survey respondents. (2) National survey of 3,000 Year 11 school pupils and their Scottish equivalents covering 16 schools with a response rate of 65%, and six focus groups on their future plans and attitudes to HE. 35 The research focused on 3 target groups of respondents: (1) Potential entrants from lower social class backgrounds, currently taking qualifications that would give them entry to an undergraduate course. A sample of 223 students at 20 colleges and schools took part in focus groups. (2) Current first-year HE students from both lower and higher social class backgrounds. A sample of 1, 600 students at 14 institutions in England and Wales responded to a postal questionnaire survey (response rate 41%), a further 20 took part in follow-up interviews. (3) Non-HE entrants from lower social class groups, ages 20/21 years who were qualified to enter HE but decided not to: 112 in sample interviewed by telephone. 36 Callender and Kempson (1996) and Callender and Kemp (2000) are the most recent of a series of Student Income and Expenditure Surveys. The most recent of these, conducted in 1998-9, involved face-to-face interviews with a representative sample of 2054 full-time and 747 part-time undergraduate and PGCE students attending 87 HE Institutions throughout the UK.

91
that substantial numbers decided on part-time rather than full-time study for their first degree. There was a larger increase in the number of part-timers studying for other undergraduate level courses including HE credits, but many of these students already had HE qualifications or credits and thus they were not all new entrants to HE. A third factor here is the data used. We have already pointed out the difference in coverage between UCAS and HESA figures. But further confusion is introduced by different definitions of the populations to be studied (students studying for degrees, Dip HE, HND, undergraduate credits); by collection of data at different times of year and by different methods; and by the inclusion of different institutions (e.g. the 2001 UCAS data includes institutions that were not previously included – though these have been removed in the 8.9% year on year increase in mature student enrolment). One result of this is that using different data sets can arrive at very different patterns of mature student numbers. For example, HEFCE (2001) identify a pattern of steady year on year decline in full-time mature student numbers, whereas the UCAS figures for full-time students, as described above, showed an increase in 1997. Further evidence of the sensitivity of mature students to financial issues comes from various surveys of mature student and potential mature student attitudes to participation and the factors that affect their decision-making. Obviously the most useful evidence comes from potential entrants, as those who are already students or are applicants have presumably decided that the benefits (financial and other) outweigh the disadvantages. Connor and Dewson (2001) report that in comparison with younger people, mature potential entrants focused more on financial issues whether they planned to enter HE or not, and that they were more likely to see cost as a barrier. In particular, single parents worried about loss of benefits, and those that had worked were worried about the financial wrench of loss of salary. The DfES MORI survey (2001) found that 46% of mature potential applicants claimed that financial issues had influenced their decisions to a great extent and a further 15% to a fair extent – either stopping them from applying, delaying application or contributing to a decision to study part-time. Similarly Connor et al. (1999) reported that more mature applicants said that they had considered not doing the course at all on financial grounds (29% of 21-24 year olds and 39% of the 25 plus age group, compared with only 17% of those under 21 years). They conclude that for mature students the decision to apply for a university or college place is ‘fragile’ and susceptible to cost considerations. Similarly Davies et al. (2002) found that both new entrants and potential entrants identified finance as the most important disincentive to entry, mentioning fees, loans, costs and debts. Of new entrants, 20% ranked cost as the most important barrier, and 56% ranked it in the top five barriers. But among the potential entrants, cost was identified as the most important barrier by 45% of women and 30% of men. Fear of long-term debt was also widely mentioned. Respondents emphasised that most mature students have financial commitments such as mortgages and dependants, and that their circumstances are different from those of school-leavers. While some mature students acknowledge that the existence of loans has made it possible to study full-time the level of loan was not seen as large enough to cover outgoings. A similar pattern was also found by Hogarth et al. (1997) reporting on students who graduated in 1996; their survey of non-traditional students included those aged 25 and over. They found that among these students a greater proportion expressed doubts about entering HE relating to finance, childcare and domestic responsibilities. It may be reasonable to conclude, then, that financial issues will always be high on the agenda for mature students, and that in recent years these concerns have become more acute, e.g. following the replacement of the general maintenance grant with income contingent loans and the introduction of means-tested contributions to tuition fees. Mature potential students generally rate the potential financial benefits of HE highly. Connor and Dewson (2001) found that potential entrants believed strongly that a higher education qualification would lead to a better job and better pay. Davies et al. (2002) showed that among new mature entrants labour market and employment related factors were the most important reasons for applying to enter HE. Overall they saw HE as preparing them for a new career rather than enhancing their prospects in their previous or current occupation. However, not surprisingly, while full-time students emphasised

92
preparation for a new career, part-time students tended to stress the enhancement of opportunities in their current work. New entrants had an optimistic view of the labour market and of their prospects. The role of labour market and employment factors in decision-making was similar for new entrants and potential entrants. The DfES MORI survey shows that those who intended to enter HE and those who did not understood the financial benefits of achieving a degree. The benefit rated most highly was enhancement of career prospects /promotion/salary, indicated by 59% of those intending not to apply and 71% of those intending to. 14% of those not intending to apply and 11% of those intending to identified improvement in long-term financial position. In contrast other benefits of HE (e.g. self-esteem, interest in subject) were rated considerably higher by those who intended to apply. This emphasis on financial benefits contrasts with the findings of Hogarth et al. (1997). They found that among those aged 25 and over going to University was seen as a means of self-development and raising self-esteem, and that in comparison with traditional students, the decision to enter HE was less geared to improving employment prospects and enhancing earnings. This may reflect rather different motivations among mature students at a time when HE was less costly. Qualitative research suggests that there are differences in these perceptions of benefit between men and women, and across ethnic groups. In particular men rate the career and financial aspects more highly, while women take a broader view of ‘bettering themselves’ (Archer, Phillips and Pratt 2001, Archer, Hutchings and Leathwood 2001). This suggests that the ‘rational’ view of decision-making put forward in Dearing Report (NCIHE 1997), which argued that ‘the economic benefits to individuals from participating in higher education … are probably the most significant factor affecting demand’ (paragraph 6.16) may not be appropriate to all potential entrants. These economic benefits were defined in terms of employment rates and pay levels, which can then be set against the costs incurred (including opportunity costs). The Report claimed that the private rates of return of gaining a degree would stimulate levels of demand for HE, if they were well known to students. Given the importance attached to labour market benefits from participation by the vast majority of students this is a reasonable generalisation. However, it is important to recognise that there are significant numbers of mature people whose main reasons for entering HE are to do with personal betterment, self-esteem and interest in learning or the subject rather than simply the expected financial rewards (although the latter will still in many such cases be important). The Dearing Report assumed a decision-making process informed by adequate knowledge. While potential mature students do have some knowledge of the eventual economic benefits, researchers have generally found that there is considerable uncertainty among mature applicants and potential applicants about the financial costs involved in participation. They would like to have more precise guarantees of the nature of funding before deciding to enter HE (DfEE, 2000). Many of them say that they cannot tell whether they will be able to manage financially as students unless they know exactly what their income will be. At present there are too many imponderables which are accentuated by changes to student support arrangements over time. There is evidence that mature students are more active in seeking out information about financial support than their younger counterparts; Connor and Dewson (2001) found that mature students are more likely to have made detailed financial plans for time in HE. Many had obviously sought out information about the level of fees, other funds available, and course specific bursaries and so on. In comparison to younger people they are more used to taking responsibility for their own finances. However, it has also been found that many potential mature students often lack information about student support systems. This was particularly so among those not based in any educational institution. Those in schools seem to be most likely to have adequate information, and those in FE

93
colleges rather less (Roberts and Allen, 1997)37. Callender and Kemp (2000) found that students aged 25 or over were the least informed about the funding arrangements. Connor and Dewson (2001) found that most potential students were aware that student finance had changed, but were unclear about the specifics. Very few potential students knew about hardship and access funds. Davies et al 2002 also reports a high degree of uncertainty among applicants, even at a very late stage in the applications cycle. The DfES MORI survey supports the view that potential mature students generally feel that they know little or nothing about sources of funding available. 70% responded that they did not know how much the maximum student loan was. A forthcoming report commissioned by HEFCE (The Impact of Tuition Fees and Changes in HE Student Support on Student Demand, by Nigel Brown), is cited in HEFCE (2001) as claiming that the level of understanding of the arrangements for financial support for students in HE remains poor, especially among lower socio-economic groups. There is ignorance about means-testing arrangements. The DfES MORI survey (2001) supports this claim: 72% of potential mature students indicated that those entering full-time HE courses have to pay all or part of their tuition fees; only 16% selected the option that ‘it depends on their ability to pay’. Similarly Hutchings and Archer (2001) found that none of the non-participants they talked with mentioned means testing; they all believed that everyone has to pay fees. The system for allocating student support is perceived by mature students as overly complex and therefore discouraging (Connor and Dewson, 2001). This is partly because of the time taken to assess loans and fees, which poses a particular problem for mature students who often apply late in the application cycle. At the beginning of the academic year, many mature students still had no idea what their income would be, or how they would make ends meet (Archer et al., forthcoming). A second factor in this complexity is the number of different agencies and forms involved: the LEA, the Student Loan Company and the HE Institution. Students are often asked for the same information several times over. Forms and information leaflets have been identified as complex and off-putting (one mature student described the DfEE leaflet as ‘video manual language’). A further complication is the impact of student funding on benefits. The loss of benefits is perceived as unfair by mature entrants, and had not been anticipated (Archer et al., forthcoming). While the most recent policy changes (Access Bursaries and child-care grants) are clearly positive, it is difficult for potential applicants to keep themselves informed when support arrangements have changed each year since 1997. Inevitably many are making plans on the basis of out-dated and inaccurate information. The financial issues facing part-time students were rather different. Davies et al. (2002) report that the majority of part-time students claimed that the need to pay fees had obliged them to study part-time or had delayed their entry. Potential entrants lack clear information about the financial arrangements for part-time students and the recent changes to these. However, Callender and Kemp (2000) report that while all students had limited awareness of sources of support such as bursaries, money from charitable foundations, career development loans, money from students’ employers, tax relief, etc., those part-time students who were short of money were more likely to have explored such sources than were full-time students, and nearly a quarter of part-time students obtained some funding from such sources. The most important among these sources for part-time students were their employers. One in five obtained help towards their study costs. However, those most likely to be receiving such
37 This study explored perceptions of HE held by young people in June of Year 12 and again in March of year 13. In April 1995, 90 schools/colleges participated in the first part of the research. In March, 160 took part. In total the research is based on responses from 1, 479 17 and 18 year olds, 624 in year 12 and 855 in year 13.Questionnaires were completed in supervised classroom situations with no access to handbooks etc to look up the answers and to prevent conferring/copying. Pupils had to be <19 years, permanent UK residents studying for A/AS levels, BTEC National or GNVQ advanced and intending to apply for FT entry to HE, or had already applied.

94
help were those in better paid jobs. Callender and Kemp also report that three times as many part-time as full-time students experienced difficulties in paying their fees, and that the nature of financial problems experienced by part-timers was particularly severe. Other policies that might make HE more accessible to mature people One of the main strategies to make HE accessible and attractive to a wider range of the population is to introduce different types of courses. One such initiative that is proving attractive to mature applicants is the introduction of foundation degrees. These are designed to make Higher Education more affordable, accessible and appealing to a wider range of students, and a graduate with a foundation degree is expected to be immediately attractive to employers. The foundation degree Support team report that 90% of part-time foundation degree students are aged 25 and over. Many of those on foundation degrees enter via non-academic routes; as we have demonstrated earlier, only a minority of mature entrants to HE come with standard A-level qualifications. Retention during the first term on the degree has proved high (95%) suggesting that these degrees are meeting participants’ needs and expectations. Policy/ Action Implications • There is a need to make information about student financial support systems more widely known
among potential applicants, and particularly those who are not currently in education. • This would be greatly helped by the introduction of a single system for allocating financial
support, in which applicants would only need to provide the information about their financial situation once and would only need to deal with one body. An effective computerised system would allow the information to be shared between all the agencies that needed it.
• Such a programme could also be used to enable applicants and potential applicants to obtain earlier and more realistic estimates of their predicted income as students.
There are a number of encouraging indications that these issues are being addressed. A review of student support was announced in autumn 2001. This should help to address some of the issues highlighted above. It aims to simplify they system and ensure those in financial need receive the support that they require. At the time of writing the outcomes are not published. In addition a modernisation programme is in progress. Colleagues at the DfES inform us that this involves a single system which, when implemented, will allow those who are involved in administration of student support to have access to information held on individual students. This will reduce the need for students to provide information more than once and to several different bodies. The eventual aim is to join with other agencies to reduce further the amount of information students are required to provide. A rationalisation of application forms should further reduce the amount of data students must supply, as should the business process changes, which are being piloted this year. Students will be offered a choice of how to find out about and apply for support. This will include on-line application forms.

95
Conclusions and Recommendations Mature students will necessarily play an important part in the initiative to increase participation in Higher Education amongst 18-30 year olds towards 50%. While it is hoped that improved attainment and progression in secondary schools will achieve much of the increase in participation, mature participation is essential to complement this if the 50% target is to be achieved. The focus of this report is mature people with the potential to enter higher education for the first time (not mature students undertaking a second undergraduate level course). It is about these potential students, who would be enrolling to complete a first undergraduate level qualification, that the following conclusions and recommendations are concerned. The problems with increasing the numbers of mature students without previous experience of higher education can be grouped into three broad areas:
They are concentrated in a particular set of socio-economic groups, which have a tradition of not entering higher education. Many members of this group feel that their identity will be changed in some way if they follow a course of higher education, and many feel threatened by this. Very broadly speaking, those whom it is necessary to attract into HE are not inclined to consider what is on offer, or to want to accept the offer.
They have already entered adulthood, and have often acquired a range of adult responsibilities
and commitments that they feel that they cannot easily sustain if they become students. They perceive the financial support systems that do exist as being complex in organisation, and parsimonious in their benefits. Those whom it is necessary to attract into HE consider that they, and those for whom they feel responsible, will be unduly financially penalised if they enter higher education.
Many of them have failed in their educational experiences in the past. Most do not have the
‘conventional’ A-level entry qualifications. They have experienced educational failure, and expect not to successfully complete educational courses. They assume that higher education study will be similar to their school experiences, in content, delivery and in their chances of success. Those whom it is necessary to attract into HE feel that they will not be able to successfully complete a higher education course.
In consequence, for many potential mature students higher education is seen as a high-risk activity. They will be starting something that they feel will change them in ways that they do not necessarily want to be changed, and they will be alienated from their roots; they will be unable to continue to support themselves and their dependants at the level they have become used to; and they feel that they will not be successful in educational studies. This is not necessarily an unrealistic assessment on their part. Mature students are more likely not to complete, as are students without conventional A-level entry qualifications who principally enter after the age of 21. These risks for the student must be balanced by some robust and authoritative assurances, backed by policy initiatives, that the risks will be minimised. Complementary to this student perspective must be added the institutional risk for higher education institutions. Taking on mature students, possibly with less high entry qualifications, is potentially damaging for institutions. It is more likely that these students will not successfully complete their courses. Institutions are penalised, financially and in league tables, for such performance. Institutions are also judged by their ability to maintain high levels of entry qualifications. For a higher educational institution to take on more mature students is a high-risk strategy.

96
Any policy to increase mature student numbers must therefore be designed to demonstrably minimise these risks. Although these risks have been separated for the purposes of analysis, they appear to be seen by potential students as closely linked, and it is therefore important that all of the risks are addressed together in a coherent manner, and not tackled piecemeal. Five key complementary policy areas are suggested. 1 Target specific groups of mature students We have identified where there are particularly large or significant groups of potential students, by age (23 – 26), socio-economic group, gender and ethnicity. Clearly, in addition to simply raising the numbers of younger people entering higher education, there will be a policy of social inclusion, where participation in higher education is seen as an aspiration and ambition open to all, and not simply as a matter of routine social behaviour by particular social categories. Nevertheless, within such a policy it is possible to identify groups more likely – at this stage - to be recruited than others. 2 Encourage HEIs to provide the courses sought by mature students: in subjects that are
perceived to have relevance to their lives and careers, that are organised in ways that allow them to continue to support their families, that are not seen to threaten their identity
The courses and qualifications that are offered for mature students need to carefully address these students’ needs. Unlike the 18 year old student, for many of whom the decision to enter higher education is a taken-for-granted way of life, these students will be making careful decisions and assessing risks that are based on making a substantial change to their life course to date. Institutions will need to be mindful of this if they are to successfully attract such students. Courses will need to be in subjects and disciplines that students feel are related to their career and life ambitions, since these seem to be the motivators for mature enrolment. Awards will need to be at levels that seem useful to these students. Courses and attendance patterns will need to be organised in ways that accommodate mature people with family commitments: this may involve the provision of teaching and facilities over weekends, in the evenings, in conventional academic vacations, and the provision of adequate and inexpensive crèche facilities. It may involve the provision or loan of IT facilities where students cannot afford these. Institutions will need to develop processes that recognise the contingencies of family life, and be flexible in allowing mature students to attend to these without feeling threatened. 3. Encourage HEIs to broaden their entry requirements for mature people with the ability to
benefit from higher education whilst minimising any additional period of study that might be required.
Institutions need to develop methods of assessing the potential of people who have minimal or no conventional qualifications, as well as those who have achieved level 3 and 2 qualifications. For example, by paying attention to the skills people demonstrate in the workplace. Institutions will have to consider how and what kinds of support are appropriate to ensure that students admitted by different routes rapidly achieve the necessary study skills to succeed, preferably without increasing the total study period by a large amount of time (for example, through intensive summer schools). These potential students do not have periods of their lives to spare. Such induction needs as far as possible to be seamless with the substantive study, so that it is not perceived as yet another hurdle to be overcome. Many of these potential students have experiences of hitherto falling at all the educational hurdles they have encountered. 4. Act as far as possible to ensure success and minimise risk for mature non-standard entrants:
Provide clear and simple financial support mechanisms for mature students seeking higher education qualifications

97
One of the major reasons that mature students do not embark on higher education courses is because they feel that the financial cost of study is too great. They have far more complex financial lives than young students – and they are far more aware of the costs, risks and potential dis-benefits of forgoing current actual income for hypothetically increased earnings in the future. Current financial support systems are seen as overly complex, operating in an erratic manner, and not providing sufficient support, particularly for their dependants. Relieving mature students from their current high levels of financial stress would address the issue of students dropping out of courses for financial reasons, and encourage potential mature students currently not enrolling because of financial concerns. Much progress has already been made in recent years with increased support for mature students (childcare grant, travel books & equipment grant, etc). The DfES report that the recent increases in full-time participation by matures suggests that these targeted sources of help are already having an impact. Moreover, the review of student finance will again be looking at ways to ensure those who have the potential to benefit from HE are not prevented from participating because of financial constraints. 5. Act as far as possible to ensure success and minimise risk for mature non-standard entrants:
Provide coherent targeted academic support systems within HEIs to support mature students with non-standard entry qualifications
Linked to all the forgoing is the necessity to ensure that potential mature students know that they will be fully supported to achieve academic success. If mature students, particularly those without the conventional academic entry qualifications, feel that starting a higher education course is a high-risk strategy, then they are unlikely to start. The evidence is that it is a high-risk strategy particularly for those with non-traditional entry qualifications. Institutions need therefore to be resourced with additional targeted funds to specifically address the learning and support needs for students whom they recruit with non-traditional qualifications. Institutions need to feel confident that the risk that they take in enrolling such students – who will make additional and substantial demands for academic support, and whose very presence will jeopardise the institution’s standing in league tables – will be minimised by resources that will ensure that these students will successfully complete their courses. Institutions with high non-completion records are financially penalised: it currently makes little economic sense for them to recruit additional numbers of students who are likely to increase that penalty. The widespread knowledge of successful completion of higher education courses is an essential prerequisite for increasing mature student numbers. It is crucial that potential mature students see that enrolling in higher education is not a high-risk strategy. It is also important that institutions see that they are not putting themselves at risk by recruiting such students.

98
Selected Publications from the UNL Social Class & Widening Participation in HE Project Archer, L. (2001) Social Class and Access to Higher Education. Appendix 10, in Education and
Employment Select Committee Sixth Report, Higher Education: Student Retention pp.191-197 (London, The Stationary Office)
Archer, L. & Hutchings, M. (2000) 'Bettering Yourself'? Discourses of Risk, Cost and Benefit in Ethnically Diverse, Young Working Class Non-Participants' Constructions of HE. British Journal of Sociology of Education, 21(4) 555-574
Archer, L., Leathwood, C. & Hutchings, M. (2001) Engaging with commonality and difference: Theoretical tensions in the analysis of working class women’s educational discourses International Studies in Sociology of Education, 11(1) 41-62
Archer, L., Hutchings, M., & Ross, A. (forthcoming) Higher Education and Social Class: Issues of exclusion and inclusion. FalmerRoutledge.
Archer, L., Pratt, S. & Phillips, D. (2001) Working class men's constructions of masculinity and negotiations of (non)participation in higher education. Gender and Education, Vol. 13 No.4, 431-449
Collier, T , Gilchrist, R and Phillips, D (2002). Who plans to go to university? Statistical modelling of potential working class participants. Educational Research and Evaluation. To appear.
Hutchings, M. & Archer, L. (2001) ‘Higher than Einstein’: constructions of going to university among working class non-participants. Research Papers in Education 16 (1) 69-91
References Cited and Literature Informing the Review Abramson, M., and Jones, P. (2001). “Getting Students off to a flying start: improving the retention of
advanced GNVQ students entering Higher Education.” Widening Participation and Lifelong Learning 3(2): 34-37.
Ackaaert, L., and Verhaeghe, J.P. (2000). The influence of financial factors on participation in higher education. ECER, Edinburgh.
Adnett, N., and Coates, G. (2000). “Mature female entrants to higher education: closing the gender gap in the UK labour market.” Higher Education Quarterly 54(2): 187-201.
Aitkin, M. A., Anderson, D.A., Francis, B.J., and Hinde, J.P. (1989). Statistical modelling in GLIM. Oxford, Oxford University Press.
Aldridge, F., and Tuckett, A. (2001). Winners and Losers in an Expanding System: The NIACE Survey on Adult Participation in Learning 2001. Leiecester, NIACE.
Archer, L. (2001) Social Class and Access to Higher Education. Appendix 10, in Education and Employment Select Committee Sixth Report, Higher Education: Student Retention pp.191-197 (London, The Stationary Office)
Archer, L. & Hutchings, M. (2000) 'Bettering Yourself'? Discourses of Risk, Cost and Benefit in Ethnically Diverse, Young Working Class Non-Participants' Constructions of HE. British Journal of Sociology of Education, 21(4) 555-574
Archer, L., Leathwood, C. & Hutchings, M. (2001) Engaging with commonality and difference: Theoretical tensions in the analysis of working class women’s educational discourses International Studies in Sociology of Education, 11(1) 41-62
Archer, L., Hutchings, M., & Ross, A. (forthcoming) ‘Higher Education and Social Class: Issues of exclusion and inclusion'. London: FalmerRoutledge.

99
Archer, L., Pratt, S. & Phillips, D. (2001) Working class men's constructions of masculinity and negotiations of (non)participation in higher education. Gender and Education, Vol. 13 No.4, 431-449
Armstrong, A. (1996). “Access and Stakeholder Culture: the issue of student retention and completion.” Journal of Access Studies 11(2): 189-200.
Arnett, J. (1989). “Obstacle Courses: Learning the hard way.” Adults Learning 1(3): 71-72. Ashar, H., and Skenes, R (1993). “Can Tinto's Student Departure Model be Applied to Nontraditional
Students?” Adult Education Quarterly 43(2): 90-100. Ball, S. J., and Vincent, C. (1998). “'I heard it on the grapevine' : 'hot' knowledge and school choice.”
British Journal of Sociology of Education 19: 377-400. Bamber, J. (1997). “Resistance and determination: working class adults in higher education.”
Research in Post-Compulsory Education 2(1): 17-28. Bamber, J., and Tett, L. (1999). “Opening the doors of higher education to working class adults: a
case study.” International Journal of Lifelong Education 18(6): 465-475. Bamber, J., and Tett, L. (2001). “Ensuring Integrative Learning Experiences for Non-traditional
students in Higher Education.” Widening Participation and Lifelong Learning 3(1). Barke, M., Braidford, P., Houston, M., Hunt, A., Lincoln, I., Morphet, C., Sone, I., and Walker, A.
(2000). Students in the Labour Market: Nature, extent and implications of term-time employment among University of Northumbria undergraduates. London, DfEE.
Baxter, A., and Hatt, S. (1999). “Old and young mature students: painting a fuller picture.” Journal of Access and Credit Studies 1(2): 137-148.
Beckett, F. (1994). Students neglected in their old age. Times Educational Supplement: 16-17. Benn, R. (1991). “The need for a fourth recognised route into higher education.” Journal of Access
Studies 7(1): 2-4. Benn, R. (1995). “Higher education: non-standard students and withdrawals.” Journal of Further and
Higher Education 19(3): 3-12. Benn, R. (1995). “Strangers in a Strange Land: Participation and withdrawals on university
certificates.” Studies in the Education of Adults 27(2): 187-199. Ben-Yoseph, M., Ryan, P., and Benjamin, E. (1999). “Retention of Adult Students in a competence-
based individualized degree-programme: Lessons learned.” Journal of Continuing Higher Education 47(1): 24-30.
Blackstone, T. (1992). “Mature students: part-time study.” Education Today 42(1): 2-4. Blaxter, L., Dodd, K., and Tight, M. (1996). “Mature student markets: an institutional case study.”
Higher Education 31(2). Blaxter, L. and M. Tight (1993). “'I'm only doing it to get in the black gown': dream and reality for
adults in part-time higher education.” Journal of Further and Higher Education 17(1): 13-21. Blundell, R., Dearden, L., Goodman, A. and Reed, H. (1996). ‘Higher Education, Employment and
Earnings in Britain’, IFS report. Boland, M. (1997). Drop-out rates mar expansion success. Times Higher Education Supplement: 8. Bowl, M. (2000). “Listening to the voices of non-traditional students.” Widening Participation and
Lifelong Learning 2(1): 32-40. Brindley, J. E. Attrition and Completion in Distance Education: The student's perspective. Brindley, J. E. Retention Strategies: A Pre-Admission Program for Adult Distance Learners. Bristow, S. (1988). “The access agenda: some British and Canadian comparisons.” Core 12(3). Britton, C. B., A. (1994). “Mature students' routes into higher education.” Journal of Access Studies
9(2): 215-228.

100
Broomfield, C. (1993). “The importance of mature, part-time students to higher education in the UK.” Higher Education 25(2): 189-205.
Brown, A., and Webb, J. (1990). “The higher education route to the labour market for mature students.” British Journal of Education and Work 4(1): 5-21.
Bryant, R. (1990). “Loans and Adult Students.” Adults Learning 2(2): 40-41. Bryant, R. (1995). “Why does being a mature student have to be so painful?” Adults Learning 6(9):
270-271. Bryant, R., and Noble, M. (1989). “Grants, debts and second-chance students.” Adult Education
61(4): 336-341. Callendar, C. (2001). “Changing student finances in Higher Education: Policy contradictions under
New Labour.” Widening Participation and Lifelong Learning 3(2): 5-15. Callendar, C., and Kemp, M. (2000). Changing Student Finances: Income, Expenditure and the Take-
Up of Student Loans among Full- and Part-time Higher Education Students in 1998/9. London, DfEE.
Callendar, C., and Kempson, E (1996). Student Finances: Income, Expenditure and Take-Up of Student Loans. London, Policy Studies Institute Report no.825.
Capizzi, E. (1996). “Measuring the effectiveness of access: methods and minefields.” Journal of Access Studies 11(1): 34-58.
Caudrey, A. (1987). “The mature student boom: Birkbeck college.” New Society 82: 11-13. CIHE The Value of Graduates. Clark, F., and Anderson, G. (1992). “Benefits adults experience through participation in continuing
higher education.” Higher Education 24(3): 379-390. Cleveland-Innes, M. (1994). “Adult student drop-out at post-secondary institutions.” Review of
Higher Education 17(4): 423-45. Coates, M. (1989). “Support for women learners: requirements and resources.” Adults Learning 1(4):
104-105. Cochrane, C. (1991). “First year at university: a study of mature female students.” Irish Journal of
Education 25(1-2): 42-51. Coffield, F. and A. Vignoles (1997). Widening Participation in Higher Education by Ethnic
Minorities, Women and Alternative Students, NCIHE Report 5. Coles, J. (2001). Wasted Journeys? Mature Students who withdraw from teacher training courses.
SCUTREA, University of East London, Pilgrim College, University of Nottingham. Collier, T , Gilchrist, R and Phillips, D (2002). Who plans to go to university? Statistical modelling
of potential working class participants. Educational Research and Evaluation. To appear. Committee, E. a. E. S. (2001). Higher Education: Access. London, Stationary Office. Committee, E. a. E. S. (2001). Higher Education: Student Retention. London, The Stationary Office. Connor, H., Burton, R., Pearson, R., Pollard, E., and Regan, J. (1999). Making the Right Choice: How
students choose universities and colleges. London, CVCP. Connor, H., Dewson, S., with Tyers, C., Eccles, J., Regan, J., Aston, J. (2001). Social Class and
Higher Education: Issues affecting decisions on participation by lower social class groups. London, DfEE.
Connor, H., Pearson, R., Court, G., and Jagger, R. (1996). University Challenge: Student Choices for the 21st Century. Grantham, IES Report 306.
Cooke, A., and Spackman, A. (1994). “Widening Adult Access to Higher Education? Denmark and the Netherlands compared.” Scottish Journal of Adult and Continuing Education 1(2): 30-40.
Cox, R. P., G. (1994). “Individualism, self-evaluation and self-fulfillment in the experience of mature women students.” International Journal of Lifelong Education 13(2): 159-173.

101
Crowther, J. (2000). “Participation in adult and continuing education: a discourse of discriminating returns.” International Journal of Lifelong Education 19(6): 479-492.
Crozier, R., Garbert-Jones, A. (1996). “Finding a voice: shyness in mature students' experience of university.” Adults Learning 7(8): 195-198.
Cullen, M. (1994). Weighing It Up: A Case Study of Discontinuing Access Students. Edinburgh, Scotland, University of Edinburgh, Centre for Continuing Education.
CVCP (1999). Briefing Note: Student fees and loans in UK Higher Education. CVCP (1999). Briefing Note: Widening Participation. Dadzie, S. (1999). Adult Education in Multi-Ethnic Europe. Leicester, NIACE. D'Amico-Samuels, D. (1990). Access to Adult Basic Education: African-American Perspectives. Davies, P. “Student retention in further education: a problem of quality or of student finance?”. Davies, P. (1990). “Marketing further education to adult learners.” Adults Learning 2(2): 46-48. Davies, P. (1994). “Misson Possible? Institutional factors in patterns of alternative entry to higher
education.” Scottish Journal of Adult and Continuing Education 1(2): 18-29. Davies, P. (1995). “Response or resistance? Access students and government policies on admissions.”
Journal of Access Studies 10(1): 72-80. Davies, P. (1999). “Half-full, not half-empty: a positive look at part-time higher education.” Higher
Education Quarterly 53(2): 141-155. Davies, P., and Yates, J. (1987). “The progress of former access students in higher education.”
Journal of Access Studies 2(1): 7-11. Davies, P., Osborne, M., and Williams, J. (2002). For Me or Not For Me? - that is the question. A
study of mature students' decision making and Higher Education. London, DfES. Davies, R., and Elias, P. (2001, draft). Dropping Out: A Study of Early Leavers from Higher
Education, Institute for Employment Research/ DfES. de Wit, P. (1987). “Access to higher education: from part-time to full-time: students' views.”
Teaching News 31: 7-8. de Wit, P. (1988). “Students and the institution in a university access scheme.” Journal of Access
Studies 3(2): 21-28. DfEE (2000). Report of the Access Funds and Hardship Loans Review: Student Support Division 1.
London, DfEE. DfEE (2001). Graduate Earnings in Britain. DfEE (2001). Social Class and Higher Education: Issues Affecting Decisions on Participation by
Lower Social Classes. London, DfEE. DfES (2001). MORI Survey. DfES (unpublished). Draft Report on Mature Students Survey. Dirkx, J. M., and Jha, L.R. (1994). “Completion and Attrition in Adult Basic Education.” Adult
Education Quarterly 45(1): 269-285. Duke, F. (1987). “Degrees of experience: are the needs and expectations of mature adults and school-
leavers compatible?” Journal of Access Studies 2(1): 54-63. Ecclestone (2000). Held back by the taint of stereotypes. Times Educational Supplement. Edwards, R. (1990). “Access and Assets: The experience of mature mother students in higher
education.” Journal of Access Studies 5(2): 188-202. Egerton, M. (2001). “Mature graduates I: occupational attainment and the effects of labour market
duration.” Oxford Review of Education 27(1): 135-150. Egerton, M. (2001). “Mature Graduates II: Occupational attainment and the effects of social class.”
Oxford Review of Education 27(2): 271-286.

102
Egerton, M. and Parry, G. (2001). ‘Lifelong Debt: Rates of Return to Mature Study’, Higher Education Quarterly, 55/1.
Evans,D. (1995). In search of a broader clientele. Times Educational Supplement: 10. FEDA (1995). Supporting adult part-time learners in further education colleges. London, FEDA. FEFC Widening Participation in Further Education: Statistical Evidence, FEFC. FEFC (1999). Two Research Studies on Student Support and Access Funds. Coventry, FEFC. FEFC (2000). Student Numbers, In-year Retention, Achievements and Destinations,
www.fefc.ac.uk/news/pn41-00.html. Field, J. (Mature students in the undergraduate community: What kind of special case?). Pastoral
Care in Education” 7 3(16-18). Foreman-Peck, L. (1999). “Choice, support and accountability: issues raised from the experience of
non-completing GNVQ students.” Westminster Studies in Education 22: 49-62. Frankel, A. Causal Attribution of control on ten variables effecting student attrition/ retention in
college. Gardner, P. P., J. (1992). “Learning to live with Madonna: or mature students on campus.” Pastoral
Care in Education 10(4): 3-8. Garner, A. (1990). “Stepping out: a mature student's view of higher education.” Journal of Access
Studies 5(2): 218-220. Garner, I., R. (1996). “More bricks in the wall: the ending of the Older Students' Allowance and the
new '16 hour' rule. Has the cost of higher education for mature students finally got too high?” Journal of Access Studies 11(1): 97-110.
Gerver, E. (1990). “Access: some awkward challenges.” Scottish Journal of Adult and Continuing Education 9(4): 37-42.
Gibson, A. (1986). “Providing for the learning needs of non-traditional students in higher education.” Journal of Access Studies 1(2): 38-52.
GMB, N. (1997). Students At Work. Goldthorpe, J. H. (1996). “Class analysis and the reorientation of class theory: the case of persisting
differentials in educational attainment.” British Journal of Sociology 47(3): 481-505. Gooderham, P. D., M. (1995). “The second-rate second chance? A comparison of the fates of mature
graduates in the labour market in Britain and Norway.” International Journal of Lifelong Education 14(1): 3-21.
Grainger, R. W. (1979). “Working class mature students in full-time higher education.” Adult Education 52(4): 237-242.
Grayson, P. J. (1997). “Institutional failure or student choice? The retention of adult students in Atkinson College.” Canadian Journal for the study of Adult Education 11(2): 7-30.
Groombridge, B. (1990). “Falling Walls: adults and the university.” Adults Learning 1(5): 140-142. Grubb, N. W. The causes and consequences of enrollments in Higher Education: Evidence from the
National Longitudinal Study of the Class of 1972. Final Report. Berkely, CA, Institute for the Study of Family, Work and Community.
Guardian (2000). Back to the Future. The Guardian. Guardian (2000). Close to the Edge. The Guardian. Guardian (2000). Flat Earth. The Guardian. Guardian (2000). Inequality Street. The Guardian. Hagedorn, L. S. (1993). Graduate Retention. Hagedorn, L. S. (1999). “Factors related to the retention: research, theory and practice of female
graduate students over 30.” Journal of College Student Retention 1(2): 99-114.

103
Hartley, J. (1994). “The attainments, strategies and experiences of mature students in higher education.” Psychology Teaching Review 3(1): 58-59.
Harvey, C. (1995). “Increasing course completion rates.” Adults Learning 6(6): 178-179. Hayes, A. (1996). “Assisting adult students on award-bearing courses: some key issues and
strategies.” Adults Learning 7(8): 192-194. HEFCE (1999). Widening Participation in HE: Funding Decision. HEFCE (2000). Higher Education Students Early Statistics Survey. HEFCE (2000) Mature students: - measuring participation and achievement– presentation to the
CVCP conference (10 October 2000) HEFCE (2001). Higher Education in Further Education Colleges: Annual Monitoring Return.
HEFCE. HEFCE (2001). Higher Education in Further Education Students Survey 2001-2. HEFCE. HEFCE (2001). Regional Profiles of Higher Education. HEFCE. HEFCE (2001). Strategies for Widening Participation in Higher Educaiton: A Guide to Good
Practice. HEFCE. HEFCE (2001). Supply and Demand in Higher Education, HEFCE. HEFCE (2001). Supporting Higher Education in Further Education Colleges. HEFCE. HEFCE (2001). Wider Benefits of Higher Education. HEFCE. Henderson, M. (1999). Living cost is the new university challenge. The Times: 8. Hibbett, A. (1986). “Dropping out or staying on: characteristics of drop-out students and course
completers.” Studies in the Education of Adults 18(2): 71-81. Hill, Y., MacGregor, J. (1998). “Support systems for women in part-time study.” Journal of Further
and Higher Education 22(2): 143-149. Hillage, J., Uden, T., Aldridge, F. & Eccles, J. (2000). Adult Learning in England: A Review.
Leicester, NIACE. HMSO (2001). Education (student support) regulations. Hogarth, T., Maguire, M., Pitcher, J., Purcell, K., and Wilson, R. (1997). The Participation of Non-
Traditional Students in Higher Education. Bristol, Institute for Employment Research / HEFCE.
Hoskins, S., Newstead, S., and Dennis, I. (1997). “Degree performance as a function of age, gender, prior qualfications and discipline studied.” Assessment and Evaluation in Higher Education 22(3): 317-328.
Hutchings, M. & Archer, L. (2001) ‘Higher than Einstein’: constructions of going to university among working class non-participants. Research Papers in Education 16 (1) 69-91 Hutchings, M., Archer, L., Leathwood, C. (2000). 'Above my Station'? Gender, race and class in
women's discourses of higher education. ESREA Access Network Conference, University of Barcelona, 25-26 Sept 2000.
Inman, J. (1999). “Does an access course really open doors?” Innovations in Education and Training International 36(3): 244-255.
James, D. (1995). “Mature studentship in higher education: Beyond a 'species' approach.” British Journal of Sociology of Education 16(4): 451-466.
James, O. (2001). “Holding on? The effect of student funding on retention in Higher Education in the UK.” Widening Participation and Lifelong Learning 3(2): 29-33.
Jenkins, A., Vignoles, A., Wolf, A. and Galindo-Rueda, F. (2001). ‘The Determinants and Effects of Lifelong Learning’, Centre for the Economics of Education discussion paper.

104
Johnes, J. (1990). “Determinants of student wastage in higher education.” Studies in Higher Education 15(1): 87-99.
Johnes, J. T., J. (1989). “Undergraduate non-completion rates: differences between UK universities.” Higher Education 18(2): 209-225.
Johnes, J. T., J. (1990). “Under-graduate non-completion rates: a reply.” Higher Education 19(3): 385-390.
Johnes, J. t., J. (1991). “Non-completion of a degree course and its effect on the subsequent experience of non-completers in the labour market.” Studies in Higher Education 16(1): 73-81.
Johnson, C. (1989). “Mature students: higher education institutions need to recognise the specific needs of mature students.” Management in Education 3(4): 11-12.
Johnstone, M. C., A-M (1995). “Moving on or moving out? The retention of access students.” Scottish Journal of Adult and Continuing Education 2(1): 23-39.
Johnstone, M. C., A-M (1995). Student retention in further and higher education: the evidence. Bristol, Further Education Development Agency.
Jones, P. (1990). “Access courses into the 1990s.” Adults Learning 1(5): 145-146. Jones, R., and Thomas, L. (2001). “Not just 'passing through': Making retention work for present and
future learners.” Widening Participation and Lifelong Learning 3(2): 2-4. Jordan, C. (2001). “Broken promises: Barriers to course completion from the students' perspective.”
Widening Participation and Lifelong Learning 3(2): 24-29. Kambouri, M. F., H. (1994). Time to Leave? London, Literacy and Basic Skills Unit. Karkales, A. M., A. (1995). “Travelling Hopefully: Access and post-access experience of adults who
do not proceed to higher education.” Journal of Access Studies 10(1): 20-39. Kelly, P. (1989). “Older Students in Education.” Adults Learning 1(1): 10-13. Kelly, T. (1996). Access and Equity. UACE Seminar, Aston University, 9 September 1996. Kerka, S. “Part-time students in Higher Education: Trends and issues.”. Kerka, S. (1989). “Retaining Adult Students in Higher education.”. Kerka, S. (1995). Adult Learner Retention Revisited. Washington DC, Office of Educational Research
and Improvement. King, M. (1989). “Mature-age students in higher education.” Core 13(3): 5-7. Kingston, P. (1999). New Class Barriers. The Guardian: 18-19. Knowles, J. (2000). “Access for Few? Student Funding and its Impact on Aspirations to Enter Higher
Education.” Widening Participation and Lifelong Learning 2(2). Knowles, J. (2000). Pity the Poor Students: Educational Success, Social Exclusion and Exclusiveness.
Lincoln, University of Lincolnshire & Humberside. Kwong, T. M., Mok, Y.F., and Kwong, M.L. (1997). “Social factors and adult learners' motivations in
re-entering higher education.” International Journal of Lifelong Education 16(6): 518-534. Lambert, P. (1987). “The mature student, formal assessment and entry into higher education.” Journal
of Access Studies 2(2): 66-77. Leathwood, C., Archer, L., and Hutchings, M. (2001). The influence of class, 'race', and gender in
working class women's negotiations of participation in higher education. Gender and Education Conference, Institute of Education, London.
Locke, M. J., C. (1989). “Institutional provision for mature students in higher education.” New Era in Education 70(3): 66-69.
MacDonald, C. S., E. (1998). “Academic work, gender and subjectivity: mature non-standard entrants in higher education.” Studies in the Education of Adults 30(1): 67-79.

105
MacDonald, I. (1993). “Meeting the needs of non-traditional learners in higher education: grasping the nettle.” Scottish Journal of Adult and Continuing Education 1(4): 5-12.
Malach, A. (2001). Colour Blind: A Practical Guide to Teaching Black Adult Learners. Leicester, NIACE.
Malicky, G. V. N., C.A. (1994). “Participation Patterns in Adult Literacy Programs.” Adult Basic Education 4(3): 144-156.
Marinelli, R. D. (1991). “Attrition of Adult learners in a nontraditional college.” Journal of Continuing Higher Education 39(3): 17-19.
Marks, A. (1999). “A manifesto for Adult Learning.” Adults Learning: 16-17. Marks, A. (1999). “Really Useful Knowledge: The new vocationalism in Higher Education and its
consequences for mature students.” British Journal of Educational Studies 47(2): 157-169. Marks, A. (1999). “Taking the Water to the Horse.” Adults Learning: 11-13. Marks, A. (2000). “Academia.com: Reflections on the (virtual) realities of internet delivery and its
implications for non-traditional learners in Scotland.” Scottish Journal of Adult and Continuing Education 6(1): 83-93.
Marks, A. (2000). “In Search of the 'Local' University: Considering Issues of Access for Mature Learners.” Journal of Further and Higher Education 24(3): 363-371.
Marks, A. (2000). “Men's Health in the Era of 'Crisis' Masculinities.” Adults Learning: 11-13. Martinez, P. (1995). Student retention in further and higher education: the evidence. Bristol, Further
Education Development Agency. Martinez, P. M., F. (1998). “9000 voices: student persistence and drop-out in further education.”
FEDA Report 2(7): 1-166. Mason, R. (1987). “The logic of non-standard entry: mature students and higher education.” Journal
of Further and Higher Education 11(3): 51-59. Maynard, E. (1992). “Are mature students a problem?” Journal of Access Studies 7(1): 106-111. Maynard, E., & Pearsall, S. (1994). “What about male mature students? A comparison of the
experiences of men and women students.” Journal of Access Studies 9(2): 229-240. McCaffery, S. A Key to Survival: The Retention of Adult Students in an External Degree Program. McGivney, V. (1991). “Come in, the door is open: Results of a NIACE project on making colleges
more attractive to adult learners.” Education 178(9): 167-168. McGivney, V. (1996). “Staying or Leaving the course: non-completion and retention.” Adults
Learning 7(6): 133-135. McGivney, V. (1997). Staying or Leaving the Course: Non-Completion and Retention of Mature
Students in Further and Higher Education. Leicester, NIACE. McGivney, V. (1999). Excluded Men. Leicester, NIACE. McGivney, V. (2001). Fixing or Changing the Patterns? Reflections on Adult Participation in
Learning. Leicester, NIACE. McPherson, A. P., L. (1990). “Undergraduate non-completion rates: a comment.” Higher Education
19(3): 377-383. Merrick, N. (1999). Wider access brings tensions. Times Educational Supplement. Merrill, B., and McKie, J. (1998). “Money and the Mature Student.” Adults Learning 9(6): 6-7. Metzner, B., and Bean, J. (1987). “The Estimation of a Conceptual Model of Nontraditional
Undergraduate Student Attrition.” Research in Higher Education 27(1): 15-38. Mills, A. M., S. (1989). “Experiencing the experienced: the impact of non-standard entrants upon a
programme of higher education.” Studies in Higher Education 14(1): 41-54.

106
Mirich, C., Shreeve, W., Perrenoud, P. (1991). “Retention: An educational dilemma.” Early Child Development and Care 75: 115-120.
Mitchell, H., and Tallentyre, F. (1988). “Widening access to higher education.” Education & Training 30(5): 11-14.
Morrissey, M. (1990). “Mature students and continuing education in Ireland.” Irish Journal of Education 24(1-2): 12-26.
Murphy, M. (2000). How the other half lives: a case study of successful and unsuccessful mature applicants in Irish higher education. SCUTREA, University of Nottingham.
Murphy, M., and Fleming, T. (1998). College Knowledge: power, policy and the mature student experience at university. SCUTREA Conference, July 6-8 1998, University of Exeter.
Murphy, M., and Inglis, T. (2000). “Unsuccessful mature applicants and Irish Universities: A case study.” Journal of Access and Credit Studies 2(1): 100-111.
Murray, J. A. U., N.P. (1988). Using SAS to track both Traditional and Nontraditional Undergraduate Student Attrition. Association for Institutional Research Annual Forum.
NCIHE (1997). Higher Education in the Learning Society (The Dearing Report). London, The Stationery Office.
Nehusi, K. G., D. (2001). Travellers Tales from the University of East London: The experience of 'black' adult learners. SCUTREA, University of East London, Pilgrims College, University of Nottingham.
Neville, C. (1994). “Access students in West Yorkshire.” Journal of Access Studies 9(2): 297-300. Norton, L. (1998). “Full-time study and long-term relationships: make or break for mature students?”
British Journal of Guidance and Counselling 26(1): 75-88. NUS (1999). Student Hardship Survey. NUS (2000). Equal access or elitist entry? The impact of student funding on access to higher
education: four international case studies. NUS (2000). Student Income and Expenditure Survey. O'Leary, J. (1999). Oxford is told to seek out mature students. The Times: 9. O'Leary, J. (1999). Poorer students dropping out. The Times: 14. O'Leary, J. (1999). Why the government needs mature students. The Times: 43. O'Leary, J. (2000). Demand on the Decline. The Times: 13. O'Leary, J. (2001). Student Drop-out may reach record. The Times: 8. Ozga, J., and Sukhnandan, L. (1997). Undergraduate Non-Completion: Report 2. Bristol, HEFCE. Ozga, J., and Sukhnandan, L. (1998). “Undergraduate non-completion: developing an explanatory
model.” Higher Education Quarterly 52(3): 316-333. Pappas, J. P., and Loring, R.K. (1985). Returning Learners. Increasing Student Retention. R. L. D. S.
> Noel. San Fransisco, Jossey-Bass. Parry, G. (1986). “From Patronage to Partnership.” Journal of Access Studies 1(1): 43-53. Pascall, G., and Cox, R. (1993). Women Returning to Higher Education. Buckingham, SHRE/Open
University Press. Payne, J. C., C. (1997). Student Loans: Who borrows and why?, Policy Studies Institute. Pedder, S. (1991). “Adults in higher education: the next five years.” Open Learning 6(2): 60-61. Peinovic, P. (1996). “Conditions of openness to mature learners in English Universities 1995: A view
from the United States.” Journal of Access Studies 11(1): 59-75. Peliassier, C. (1987). “The Essex access scheme: a negotiated, student-centred programme of study
for mature students.” Journal of Access Studies 2(1): 64-71.

107
Percy, K. (1991). Managing part-time study, Universities Council for Adult and Continuing Education.
Perin, D., and Greenberg, D. (1994). “Understanding Dropout in an Urban Worker Education Program.” Urban Education 29(2): 169-187.
Peters, H., Pokorny, H. & Sheibani, A. (1999). Fitting in: What place is accorded to the experiential learning mature students bring with them to Higher Education? SCUTREA July5-7, University of Warwick.
Peterson, S., Kovel-Jarboe, P. & schwartz, S. (1997). “Quality improvement in higher education: implications for student retention.” Quality in Higher Education 3(2): 131-141.
Phillips, C. J. (1986). “Full-time mature students in higher education: a survey of their characteristics, experiences and expectations.” British Educational Research Journal 21(3): 289-308.
Preece, J. w. W., C. & Woodrow, M. (1998). Beyond the Boundaries: Exploring the Potential of Widening Provision in Higher Education. Leicester, NIACE.
Purcell, K. h., T. (1999). Graduate Opportunities: Social Class and Age: Employers' Recruitment Strategies in the New Graduate Labour Market. London, Council for Industry and Higher Education.
Quigley, B. (1995). Reasons for Resistance to Attending Adult Basic Literacy. Kent, Ohio Literacy Resource Centre.
Ramsden, B. (2001). Patterns of Higher Education Institutions in the United Kingdom. London, Universities UK.
Ramsden, S. (1999). Sleeves up for learning. The Guardian: iv. Reay, D. (1999). “Class Acts: Educational involvement and psycho-sociological class processes.”
Feminism and Psychology 9(1): 89-106. Richardson, J. (1994). “Mature students in higher education: academic performance and intellectual
ability.” Higher Education 28(3): 373-386. Roberts, D., and Allen, A. (1997). Young Applicants' Perceptions of Higher Education. Leeds,
HEIST. Roche, J., Shale, D. & Kelly, W Comparative Studies on the Differentiated nature of part-time
students. Roper, B., Ross, A. & Thomson, D (2000). Locked Out. The Guardian: 10-11. Rose, D. (1996). “Retaining Students: A matter of customer service?” Education Marketing 8: 28-29. Rowsell, L. V. (1992). “Adults Dropping Out? Try Repgrid!” ELT Journal 46(4): 362-372. Sandler, M. “A Focal examination of integration, commitment, and academic performance: three
subsystems from the integrated model of student persistence with sociostructural background variable effects.”.
Sargant N. with Field, J., Francis, H., Schuller, T., and Tuckettt, A. (1997). The Learning Divide: A Report of Findings of a UK_wide Survey on Adult Participation in Education and Training. Leicester, NIACE.
Sawyer, B. C., L Attitudes to student financial support systems. Student Finance: Fairness for the Future Research Report, The Independent Committee of Enquiry into Student Finance. 2.
Schlossberg, N. K., Lynch, A.Q. & Chickering, A.W. (1989). Improving Higher Education Environments for Adults. San Fransisco, Jossey-Bass.
Scott, C., Burns, A., Cooney, G. (1996). “Reasons for discontinuing study: the case of mature age female students with children.” Higher Education 31(2): 233-253.
Sewell, P. (2000). “Mature students in part-time higher education- perceptions of skills.” Innovations in Education and Training International 37(4): 304-313.

108
Sharkey, S. e. a. (1987). “Pioneer Programs for Retaining 'At Risk' Students.” New Directions for Higher Education 15(4): 61-86.
Shere, C. (1988). “Who is the Adult Learner?” Journal of College Admissions(121): 18-27. Simonite, V. (1997). “Academic achievement of mature students on a modular degree course.”
Journal of Further and Higher Education 21(2): 241-249. Slowey, M. (1988). “Adult Students: The new mission for higher education?” Higher Education
Quarterly 42(4): 301-316. Smith, D., Bargh, C. & Scott, P. (1995). “Standard systems, non-standard students: the impact of
consolidation on access to higher education.” Journal of Access Studies 10(2): 120-136. Smith, G. B., V. (1993). Staying the Course. London, Business and Technology Education Council. Smith, J. (2000). “Reaching out to the region: what works? Evaluating Higher Education Strategies
for Widening Participation in the context of a national policy initiative.” Widening Participation and Lifelong Learning 2(3).
Smith, J., and Naylor, R. (2001). “Dropping out of university: a statistical analysis of the probability of withdrawal for UK university students.” Journal of the Royal Statistical Society Series A 164(2): 389-405.
Smith, T. M. (1997). The Pocket Condition of Education 1997. Sperling, L. (1991). “Can the barriers be breached? Mature women's access to higher education.”
Gender & Education 3(2): 199-213. Steele, T. (1999). “Access, but not as we know it.” Adults Learning 10(7): 22-24. Stephenson, P. P., K. (1989). “The meaning of 'confidence': student attitudes and experience on an
Access course.” Journal of Access Studies 4(1-2): 25-42. Stoecker, J., Pascarella, E.T. & Wolfle, L.M. (1988). “Persistence in Higher Education.” Journal of
College Student Development 29(3): 196-209. Sunday, I. o. (2000). Parents Guide: Student Finance. Independent on Sunday. Sutherland, P. M., A. (2001). “The Man Learner: Neglected Species or Dying Breed?” Adults
Learning: 11-13. Tett, L. (1999). “Widening provision in higher education: some non-traditional participants'
experiences.” Research Papers in Education 14(1): 107-119. THES (1999). Degrees do deliver for graduate job-seekers. Times Higher Education Supplement. THES (2000). Loans plus rent equals misery. Times Higher Education Section. THES (2001). Grants receive mature interest. Times Higher Education Supplement. THES (2001). Great news for Hodge as enrolments soar. Times Higher Education Supplement. Tight, M. (1988). “The practical implications for non-traditional provision.” Teaching News 34: 3-4. Tracy-Mumford, F. e. a. (1994). Student Retention: Creating Student Success. Washington DC,
National Adult education Professional Development Consortium. Tuckett, A. A mature higher education system? Tuckett, A. S., N. (1999). Marking Time: The NIACE Survey on Adult Participation in Learning
1999. Leicester, NIACE. Tysome, T. (1998). Money: Key factor for older students. Times Higher Education Supplement: 2-3. UCAS (1997). Home based UK applicants by ethnic origin by age: 1997. UCAS (2000). Statistical Bulletin on Widening Participation. Cheltenham, UCAS. UCAS (2001). Mature applicants on the increase. Press Release. Universities, I. A. o. (1989). “Access to higher education: Proceedings.” Higher Education Policy
2(1): 7-34.

109
Usher, R. (1986). “Adults Students and their experience: developing a resource for learning.” Studies in the Education of Adults 18(1): 24-34.
UUK (2000). Second Report from the funding options review group. Waddington, P. (1989). “Access: a rich man's market.” Education 174(5): 101-102. Waddington, P. (1989). “Access: the name of the game.” Education 174(5): 101-102. Wake, C. (1988). “Access courses and the universities.” Journal of Access Studies 3(1): 8-16. Wakeford, N. (1993). “Beyond Educating Rita: mature students and access courses.” Oxford Review
of Education 19(2): 217-230. Wakeford, N. (1994). “Becoming a mature student: the social risks of identification.” Journal of
Access Studies 9(2): 241-256. Walker, L. (1999). “Longitudinal study of drop-out and continuing students who attended the pre-
university summer school at the University of Glasgow.” International Journal of Lifelong Education 18(3): 217-233.
Waters, J. and K. Gibson (2001). “Lost at the starting gate: an investigation into the psycho-social causes of withdrawal from Access courses.” Widening Participation and Lifelong Learning 3(2): 16-23.
Watt, S. Balancing the Books: Pounds and Potential: Annexe L. Student Finance: Fairness for the Future, Independent Committee of Enquiry into Student Finance. 1.
Weidman, J. C. (1985). Retention of Nontraditional Students in Postsecondary Education. American Educational Research Association Conference.
West, L., Hore, T. (1989). “The impact of higher education on adult students in Australia: Employment.” Higher Education 18(3): 341-352.
Wicks, M. (2000). Rhetoric must become a reality. Times Educational Supplement. Williams, J. (1988). “Access and success: mature students' perceptions of further education and higher
education.” Journal of Access Studies 3(1): 44-63. Williams, J., Ed. (1997). Negotiating Access to Higher Education: The discourse of selectivity and
equity. Buckingham, SRHE / Open University Press. Wilson, F. (1997). “The construction of paradox? One case of mature students in higher education.”
Higher Education Quarterly 51(4): 347-366. Wisker, G., Zeitlyn, A. & Brennan, L. (1991). “Non-traditional learners in a traditional institution.”
Adults Learning 2(8): 228-232. Woodley, A. (1991). “Access to what? A study of mature graduate outcomes.” Higher Education
Quarterly 45(1): 91-108. Woodrow, M. (2000). “Class- the last frontier.” The Lecturer. Woodrow, M. (2001). Are access policies and funding arrangements compatible? Access and
Retention in Higher Education, London, Centre for Higher Education Research and Information.
Wray, D. (2000). Getting in and getting on: the experiences and outcomes of access students entering higher education in contrast with students entering with no formal qualifications. SCUTREA 3-5 July 2000, University of Nottingham.
Yarnit, M. (1989). “Raising our sights: A better deal for adult learners.” Adults Learning 1(3): 69-70. Yorke, M. Leaving Early: Non-Completion in HE. London, Falmer. Yorke, M. (1997). Undergraduate Non-completion in Higher Education in England. Bristol, HEFCE.


