Embed Size (px)
Citation preview
arX
iv:1
012.
5074
v1 [
cs.C
E]
22 D
ec 2
010
1
Power-Rate Allocation in DS/CDMA Based on
Discretized Verhulst Equilibrium
Lucas Dias H. Sampaio§, Moises F.Lima§, Mario Lemes Proenca Jr.§ & Taufik Abrao‡, §
§Computer Department, State University of Londrina, PR, 86051-990, Brazil
[email protected], [email protected], [email protected], [email protected]
‡Dept. of Electrical Engineering; State University of Londrina, Brazil;
[email protected] www.uel.br/pessoal/taufik
Abstract
This paper proposes to extend the discrete Verhulst power equilibrium approach, previously suggested in
[1], to the power-rate optimal allocation problem. Multirate users associated to different types of traffic are
aggregated to distinct user’ classes, with the assurance ofminimum rate allocation per user and QoS. Herein,
Verhulst power allocation algorithm was adapted to the single-input-single-output DS/CDMA jointly power-rate
control problem. The analysis was carried out taking into account the convergence time, quality of solution, in
terms of the normalized squared error (NSE), when compared with the analytical solution based on interference
matrix inverse, and computational complexity. Numerical results demonstrate the validity of the proposed resource
allocation methodology.
Index Terms
Power-rate allocation control; SISO multirate DS/CDMA; discrete Verhulst equilibrium equation; QoS.
I. INTRODUCTION
In the last years many efforts has been spent trying to find thebest resource allocation algorithm that
could be easy applied to DS/CDMA communications systems. The Foschini and Miljanic [2] studies
can be considered as a foundation of many well-known distributed power control algorithms (DPCA) in
scientific literature, because they try to solve an ordinarydifferential equation (ODE, eq. (1) in [2]), which
with some minor alterations is also considered in many othersubsequent studies. Therefore, a new ODE
can lead to a new algorithm, more promising in several aspects, such as, convergence, proximity to the
optimum value, and sensibility to estimation errors as well.
With this context in mind, the work in [1] proposed and analysed a new ODE for the DPCA based
on the Verhulst equation [3]. The discrete version of the Verhulst population model is more diffused in

2
the literature and it is called logistic map. The logistic map was studied thoroughly by R.M. May in [4].
Von Neumann and Ulam [5] also studied the logistic map and they evaluated the possibility to use it as
random generator number, which is gotten in certain conditions.
The Verhulst model was initially designed to describe population growth of biological species with food
and physical space restriction. With the successfully mathematical model adaptation to power control in a
single-rate DS/CDMA systems proposed in [1], this work suggests an expansion of the Verhulst approach
to other optimization problems, such as the power-rate allocation problem, and its multi-objective versions,
due to DPCA performance× complexity gain when compared to the classical algorithms such as Foschini
or sigmoidal.
In this paper we have adapted the Verhulst approach to the power-rate allocation problem with multirate
QoS associated to different types of traffic (based on user classes), and satisfying the minimum rate
allocation per user requirement. Hence, the Verhulst powerallocation algorithm of [1] was adapted to the
power-multirate control problem. The analysis was carriedout taking into account the convergence time,
quality of solution when compared with the analytical solution based on interference matrix inverse, and
computational complexity.
This paper is organized as follows: Section II gives an overview of the power control classical solution
and how it is adapted to multirate problem. In Section III thepower-rate Verhulst algorithm is proposed.
Numerical results with corresponding simulation parameters setup are treated in Section IV. Finally, the
conclusions are offered in Section V.
II. POWER AND RATE ALLOCATION PROBLEM
In a multiple access system, such as direct sequence code division multiple access (DS/CDMA), the
power control problem is of great importance in order to achieve relevant system capacity and throughput.
The power control problem can be solved by a vector that contain the minimum power to be assigned in
the next time slot to each active user, in order to achieve theminimum quality of service (QoS) through
the minimum carrier to interference ratio (CIR).
In multirate multiple access wireless communications systems the bit error rate (BER) is often used as
a QoS measure and, since the BER is directly linked to the signal to interference plus noise ratio (SNIR),
we are able to use the SNIR parameter as QoS measurement. Hence, associating the SNIR to the CIR at
time slotn results:
δi[n] =Rc
Ri[n]× Γi[n], n = 0, 1, . . .N (1)
whereδi[n] is the SNIR of useri at thenth iteration,Rc is the chip rate,Ri[n] is the data rate for user
i, Γi[n] is the CIR for useri at iterationn, andN is the maximal number of iterations. From (1) we are

3
able to calculate the data rate for useri at iterationn:
Ri[n] =Rc
δi[n]× Γi[n], n = 0, 1, . . . , N (2)
The CIR for theith user can be calculated as [1], [6]:
Γi[n] =Pi[n]gii[n]
K∑j=1j 6=i
Pi[n]gij [n] + σ2
, i = 1, . . . , K (3)
wherePi[n] is the power allocated to theith user at time slotn and is bounded by[Pmin; Pmax], the
channel gain (including path loss, fading and shadowing effects) between userj and user (or base station)
i is identified bygij, K is the number of active users in the system, andσ2i = σ2
j = σ2 is the average
power of the additive white Gaussian noise (AWGN) at the input of ith receiver, admitted identical for
all users. Therefore, in DS/CDMA multirate systems the CIR relation to achieve the minimum rate can
be calculated to each user class as follows [7]:
Γℓmin =
Rℓminδ
∗
Rc
, ℓ = 1 · · ·L (4)
where Γℓmin and Rℓ
min is the minimum CIR and minimum user rate associated to theℓth user class,
respectively,δ∗ is the minimum (or target) signal to noise ratio (SNR) to achieve minimum acceptable
BER (or QoS), andL is the total number of user classes in the system (voice, data, video, and so on).
Besides, the power allocated to thekth user belonging to theℓth class atnth iteration is:
pℓk[n], k = 1 · · ·Kℓ; ℓ = 1 · · ·L, (5)
hence, the total number of active users in the system is givenby K = K1∪ . . .∪Kℓ ∪ . . .∪KL. Note that
indexes associated to theK users are obtained by concatenation of ascending rates fromdifferent user’s
classes. Hence,K1 identifies the lowest user’s rate class, andKL the highest.
TheK ×K channel gain matrix, considering path loss, shadowing and fading effects, between userj
and useri (or base station) is given by:
G =
g11 g12 · · · g1K
g21 g22 · · · g2K...
.... . .
...
gK1 gK2 · · · gKK
,
which could be assumed static or even dynamically changing over the optimization window (N time
slots).

4
Assuming multirate user classes we are able to adapt the classical power control problem to achieve
the minimum rates for each user, simply using the Shannon capacity relation between minimum CIR and
minimum rate in each user class, resulting:
Γℓmin = 2R
ℓmin − 1 (6)
Now, considering aK ×K interference matrixB
Bij =
0, i = j;Γi,mingji
gii, i 6= j;
(7)
whereΓi,min can be obtained from (4), taking into account each rate classrequirement, and the following
column vectorK × 1:
ui =Γi,minσ
2i
gii, (8)
we can obtain the analytical optimal power vector allocation simply by matrix inversion as:
p∗ = (I−B)−1u (9)
if and only if the maximum eigenvalue ofB is smaller than 1 [8];I is theK ×K identity matrix. In this
situation, the power control problem shows a feasible solution.
Herein, the classical power allocation problem is extendedto incorporate multirate criterium in order
to guarantee the minimum data rate per user class. Mathematically, we want to solve the following
optimization problem:
min p =[p11 . . . p
1K1, . . . , pℓ1 . . . p
ℓKℓ, . . . , pL1 . . . p
LKL
]
s.t. P ℓmin ≤ pℓk ≤ P ℓ
max (10)
Rℓ = Rℓmin, ∀k ∈ Kℓ, and∀ ℓ = 1, 2, · · ·L
III. V ERHULST POWER-RATE OPTIMIZATION APPROACH
The Verhulst mathematical model was first idealized to describe population dynamics based on food
and space limitation. In [1] that model was adapted to single-rate DS/CDMA distributed power control
using a discrete iterative convergent equation as follows:
pi[n + 1] = (1 + α) pi[n]− α
[δi[n]
δ∗i
]pi[n], i = 1, · · · , K (11)
wherepi[n+1] is the useri power at then+1 iteration,α ∈ (0; 1] is the Verhulst convergence factor,δi[n]
is the ith user’ SNIR at iterationn, δ∗i is the minimum SNR for theith user that guarantee a minimum
QoS in terms of performance (BER).

5
The recursion (11) can be effectively implemented in theith mobile unit since all necessary parameters
α, the QoS level given bydelta∗i , the transmitted powerpi[n], exceptδi[n], can be considered known in
the mobile uniti. The SINRδi[n] can be obtained only at the correspondent base station that demodulates
the signal from useri. In this way, the BS estimatesδi[n], quantizes it in a convenient number of bits,
and transmits this information to theith user through the direct channel. Thus, (11) depends on local
parameters just allowing that the power control works in a distributed manner, i.e., each one of theK
links (mobile terminals to base station) carries out separately the respective power control mechanism,
justifying the name distributed power control algorithm (DPCA).
Equation (11) gives a recursive power update, close to the optimal power solution afterN iteration.
However, originally it does not consider the rate requirements in a multirate environment. In order to
achieve the QoS to each user class, (11) must be adapted to reach the equilibrium limn→∞
pi[n] = p∗i when
the power allocated to each user satisfies the minimum rate constraint given in (10). Hence, the recursive
equation must be rewritten considering SNIR per user class,via (1), in order to incorporate multirate
scenario. The minimum CIR per user class is obtained directly by (4). In this way, considering the
relation between CIR and SNIR in a multirate DS/CDMA context, we propose the equation below in
order to iteratively solve optimization problem in (10):
δi[n] = F × Γi[n] (12)
= F ×Pi[n]gii[n]
K∑j=1j 6=i
Pi[n]gij [n] + σ2
, i = 1, . . . , K
whereF is the spreading factor per user class, given by:
F =Rc
Rℓmin
(13)
Note that the CIR ofith user at thenth iteration is weighted by spreading factor; so the corresponding
SNIR is inversely proportional to the actual (minimum) rateof the ith user of theℓth class.
A. Quality of Solution × Convergence Speed
The quality of solution achieved by iterative Verhulst equation (11) is measured by how close to the
optimum solution isp[n], and can be quantified by means of the normalized squared error (NSE) when
equilibrium is reached. The NSE definition is given by:
NSE[n] = E
[‖p[n]− p∗‖2
‖p∗‖2
],
where‖ · ‖2 denotes the squared Euclidean distance to the origin, andE[·] the expectation operator.

6
On the other hand, the convergence speed in Verhulst equation is dictated by the parameterα. Hence,
for small values of convergence factor, i.e.,α → 0, the convergence is slow, but the NSE is very small
after N iteration, when compared with the opposite configuration: the convergence is fast whenα → 1,
but the NSE is a concern. So, in order to accelerate convergence, we propose two adaptive criteria for
convergence factorα when iterations evolve, based on a) SNIR to target SNR difference, and b) tanh
mapping for this difference, as following:
a) αi[n] = min
{αmax;
|δi[n− 1]− δ∗i |
δ∗i+ αmin
}, (14)
b) αi[n] = max {αmin; tanh(|δi[n− 1]− δ∗i |)} , (15)
with αmin = 0.1 andαmax = 0.95.
IV. NUMERICAL RESULTS
Simulations were carried out through the MatLab ver.7.3 platform, with system parameters indicated in
Table I. For all simulation results discussed in this section, it was assumed a retangular multicell geometry
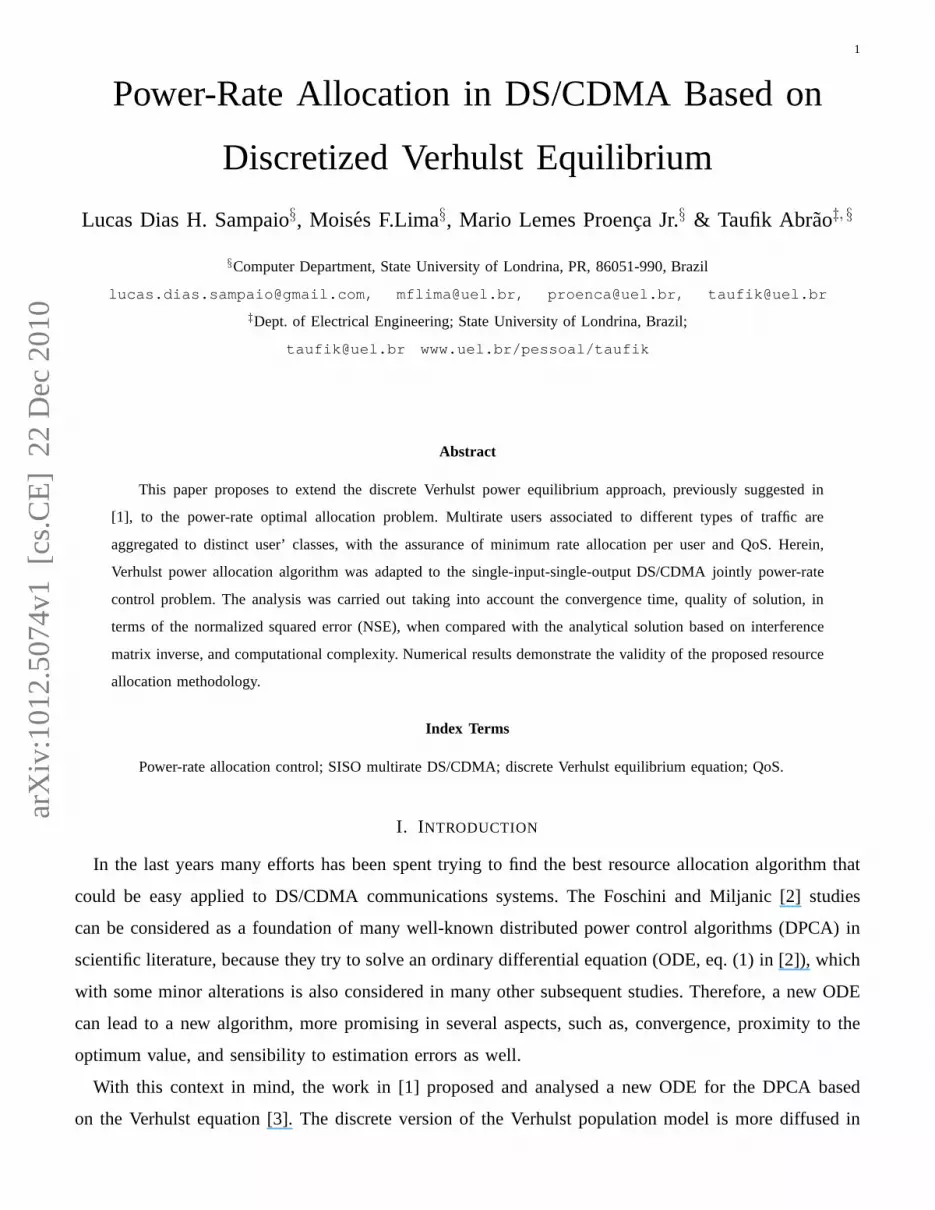
with a number of base station equal to4 and mobile terminals uniformly distributed. A typical placement
for mobile terminals (mt) and base stations(BS) is providedin Fig. 1. Besides, the rate assignment for
all multirate users was considered uniformly distributed as three submultiple rates of chip rate,Rmin =
[ 1128
; 132; 1
16]Rc [bps].
A number of mobile terminals ranging fromK = 5 to 30 was considered, which experiment slow
fading channels, i.e., the following relation is always satisfied:
Tslot < (∆t)c (16)
whereTslot is the time slot duration, and(∆t)c is the coherence time of the channel1. This condition is
part of the SINR estimation process, and it implies that eachpower updating accomplished by the DPCA
happens with rate ofT−1slot, assumed here equal to1500 updated per second. The recursion in (11) should
converge to the optimum point before each channel gaingij experiments significant changing. Note that
satisfying (16) the gain matrices remain static during one convergence process interval.
In all simulations the entries values for the QoS targets were fixed inδ∗ = 4 dB, the adopted receiver
noise power for all users wasPn = −63 dBm, and the gain matrixG entries had intermediate values
between those used in [9] and [7]. Furthermore, in order to evaluate and highlight the different aspects
and features of the proposed resource allocation methodology, the simulation results discussed hereafter
1Corresponds to the time interval in which the channel characteristics do not suffer expressive variations.

7
were obtained under static channels condition, situation where the channel gain’ coefficients hold constant
during all convergence period, i.e., forN iterations executed on eachTslot seconds. It is straightforward
to show that those analyses and results can be applied considering the dynamic channels condition, where
the channel coefficients changing following the coherence time of the channel, been observed the bound:
Tslot ≫ (∆t)c ≈1
fDmax
, for all adopted mobilities, bounded by the maximal DopplerfrequencyfDmax.
TABLE I
MULTIRATE DS/CDMA SYSTEM PARAMETERS
Parameters Adopted Values
DS/CDMA Power-Rate Allocation System
Noise Power Pn = −63 [dBm]
Chip rate Rc = 3.84× 10⁶
Min. Signal-noise ratio SNRmin = 4 dB
Max. power per user Pmax = 20 [dBm]
Min. Power per user Pmin = SNRmin + Pn [dBm]
Time slot duration Tslot = 666.7µs
# mobile terminals K ∈ {5; 30}
# base station BS= 4
cell geometry rectangular, withxcell = ycell = 5 Km
mobile term. distrib. ∼ U [xcell, ycell]
Channel Gain
path loss ∝ d−2
shadowing uncorrelated log-normal,σ2 = 6 dB
fading Rice:[0.6; 0.4]
Max. Doppler freq. fDmax = 11.1 Hz
Error estimates G = (1 + ε)G, whereε ∼ U [±δ]
δ = 0 : 0.02 : 0.2
User Types
# user classes L = 3 (voice, data, video)
User classes Rates Rmin = [ 1
128; 1
32; 1
16]Rc [bps]
Verhulst Power-Rate algorithm
Type partially distributed
α range[0.10; 0.95]
Optimization window N ∈ [100; 1000] iterations
Performance parameters
Trials number, TR 100 samples
8
0 500 1000 1500 2000 2500 3000 3500 4000 4500 50000
500
1000
1500
2000
2500
3000
3500
4000
4500
5000
distance [m]
dist
ance
[m]
Multi−cell: four base and K= 25 mobile stations location
Fig. 1. K = 25 Mobile terminals and4 base stations location over 25 Km2 multicell rectangular geometry.
A. Typical Convergence Performance
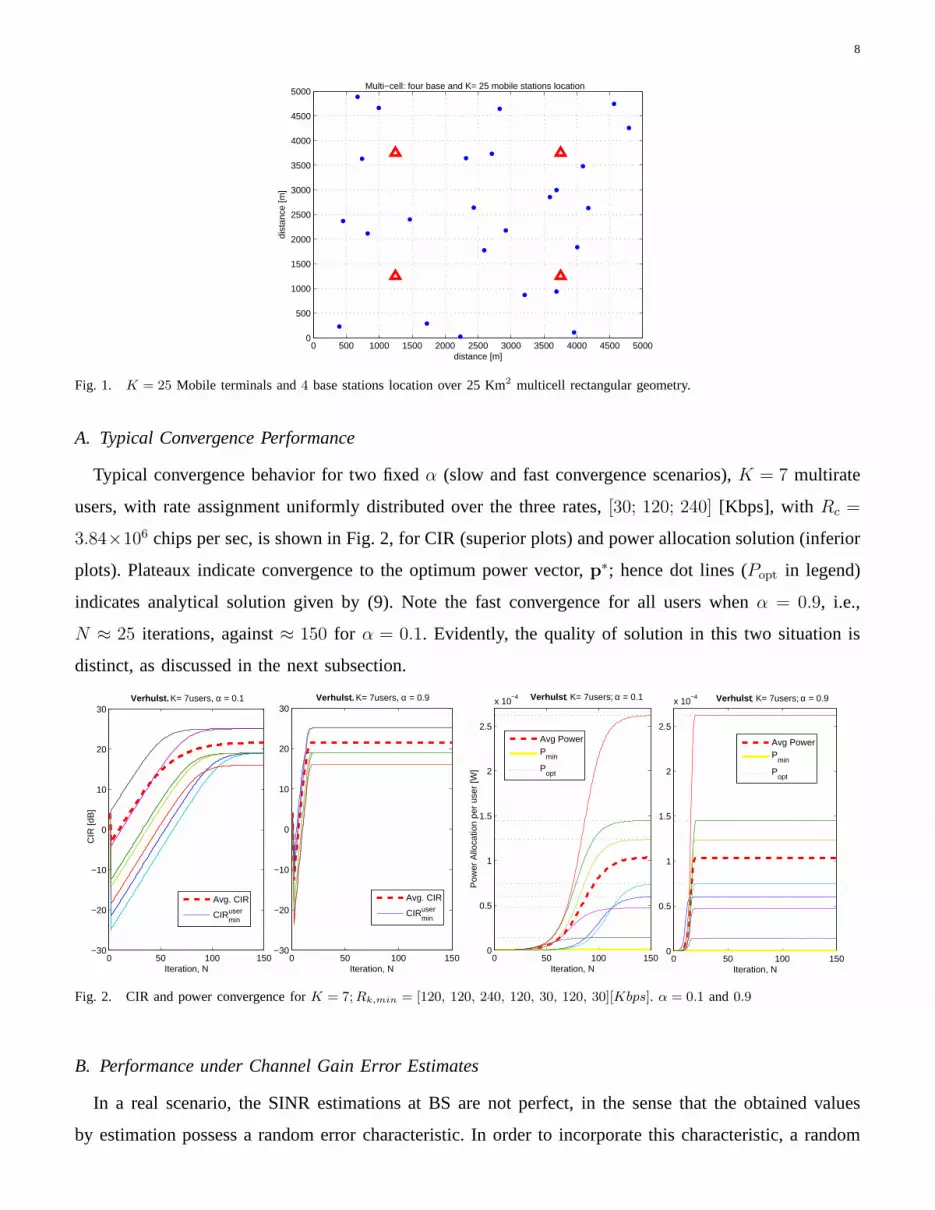
Typical convergence behavior for two fixedα (slow and fast convergence scenarios),K = 7 multirate
users, with rate assignment uniformly distributed over thethree rates,[30; 120; 240] [Kbps], with Rc =
3.84×10⁶ chips per sec, is shown in Fig. 2, for CIR (superior plots) andpower allocation solution (inferior
plots). Plateaux indicate convergence to the optimum powervector,p∗; hence dot lines (Popt in legend)
indicates analytical solution given by (9). Note the fast convergence for all users whenα = 0.9, i.e.,
N ≈ 25 iterations, against≈ 150 for α = 0.1. Evidently, the quality of solution in this two situation is
distinct, as discussed in the next subsection.
0 50 100 150−30
−20
−10
0
10
20
30
Iteration, N
Verhulst. K= 7users, α = 0.9
Avg. CIR
CIRminuser
0 50 100 150−30
−20
−10
0
10
20
30
Iteration, N
CIR
[dB
]
Verhulst. K= 7users, α = 0.1
Avg. CIR
CIRminuser
0 50 100 1500
0.5
1
1.5
2
2.5
x 10−4
Iteration, N
Verhulst ; K= 7users; α = 0.9
Avg PowerP
min
Popt
0 50 100 1500
0.5
1
1.5
2
2.5
x 10−4
Iteration, N
Pow
er A
lloca
tion
per
user
[W]
Verhulst ; K= 7users; α = 0.1
Avg PowerP
min
Popt
Fig. 2. CIR and power convergence forK = 7;Rk,min = [120, 120, 240, 120, 30, 120, 30][Kbps]. α = 0.1 and0.9
B. Performance under Channel Gain Error Estimates
In a real scenario, the SINR estimations at BS are not perfect, in the sense that the obtained values
by estimation possess a random error characteristic. In order to incorporate this characteristic, a random

9
error is added in each element of channel gain matrix, in eachiteration basis. The ratio of the estimated
and real channel gain values is given bygij = (1+ε)gij, whereε will be considered as a random variable
with uniform distribution in the range[−δ; δ]. In the subsequent simulations the adopted range values for
δ were0 to 0.2, in steps of0.02.
1) Dependence of Solution Quality in terms of α: Since we have some idea how fast the Verhulst
algorithm reaches the equilibrium with different values ofα, it is important to determine solution quality
in terms of convergence time. For the same system configuration of Fig. 2, we have obtained in Fig. 3
the associated NSE ratio, defined as:
NSER =NSE(α = 0.9)
NSE(α = 0.1)=
NSE(fast converg.)
NSE(slow converg.)(17)
One can see from Fig. 3 that regardless of channel error estimatesδ, the quality of solution for both
α = 0.9 (fast) andα = 0.1 (slow convergence) at the final section of iterations (N > 170) shows
high similarity (NSER ≈ 1), but with a slight advantage in terms of convergence forα = 0.1. In that
region, with both convergence factors, the algorithm approaches to the optimal solution at same speed;
as a consequence theNSER → 1. Conversely, after a initial approaching convergence, i.e., after23 and
until ≈ 120 iterations, the Verhulst algorithm withα = 0.9 produces a much better solution, resulting in
NSE(α = 0.9) << NSE(α = 0.1). Due to the insufficient number of iterations, the algorithmis not
able to achieve convergence forα = 0.1.
In conclusion, the best choice forα depends on the number of iterations constraint. If the number of
iteration is a concern, the natural choice consists in to adjust the convergence factor as high as possible.
Otherwise low values forα produce NSE slightly smaller.
0 50 100 150 200 250 300
0
0.1
0.20
0.2
0.4
0.6
0.8
1
Iteration, NG error estimate, δ
NS
E R
atio
0
50
100
150
0
0.05
0.1
0.15
0.20
0.1
0.2
0.3
0.4
0.5
0.6
0.7
0.8
Iteration, NG error estimate, δ
NS
E R
atio
Fig. 3. NSE Ratio considering fast (α = 0.9) and slow (α = 0.1) power convergence behavior ofK = 7 mt, andδ channel gain estimation
error values. Bottom graph is a zoom in overN ∈ [21; 150] initial iterations.

10
2) Solution Quality as a Function of System Loading: Fig. 4 shows the average NSE behavior when
the channel gain errorδ increases for the1000th iteration and increasing system loading,K = 10, 20 and
30 mobile terminals with different user class rates realizations (and uniformly distributed over the three
user class rates). The convergence factor was assumed fixedα = 0.2 and the algorithm convergence ran
100 times to each combination ofK, δ and user rates.
Note from Fig. 4 that the NSE values increase for low system loading (smallK), showing an increasing
degradation rate under specific system loading when the channel error estimatesδ increase. We can explain
this dependence by granularity effect, i.e., under high system loading, the average norm distances between
the proposed algorithm solution and the analytical optimumsolution results smaller due to large number
of active users (high granularity), when compared to the lowloading system cases (smallK and low
granularity). Anyway, in terms of NSE, the channel gain error estimates has a progressive effect over the
solution quality.
10
15
20
25
30 00.05
0.10.15
0.2
0
1
2
3
4
5
6
x 10−3
δ
Gerror
= G(1+ε), ε uniformly distrib. [−δ, δ]. Avg. over TR = 100 samples. α= 0.2
Users, K
Nor
mal
ized
Squ
ared
Err
or, N
SE
Fig. 4. NSE degradation as a function ofK mobile terminals andδ channel gain estimation error,α = 0.2.
C. Adaptive Convergence Methods Performance
In order to speed up the algorithm convergence, we have suggested in section III-A two adaptive criteria
based on SNIR’s difference. There are two important performance aspects to be analyzed, considering
adaptive methods against fixedα optimization methods: convergence time and solution quality. However,
in order to privilege the quality solution analysis, in thissubsection the lower convergence factor was
adopted for the three methods; hence, in the next we evaluatethe results just in terms of convergence
time (number of iterations,N), considering fixed the convergence factor,α = 0.1.
A first approach to evaluate the reduction in the convergencetime with the adoption of adaptive
convergence factor is provided in Figure 5. Both plots were generated under the same channel conditions
with K = 30 users and no channel gain error estimates. As expected, the convergence rate, mainly at

11
the beginning (early iterations), is greatly speeded up. One can see that roughly the adaptive tanh−α
procedure allows the proposed algorithm to achieve total convergence50% early regards to the fixed
factorα = 0.1.
0 200 400 600 8000
1
2
3
4
5
6
7
8x 10
−4
Iteration, N
Pow
er A
lloca
tion
per
user
[W]
Fixed α; K= 30; α = 0; δ = 0
Avg PowerP
min
Popt
0 200 400 600 8000
1
2
3
4
5
6
7
8x 10
−4
Iteration, N
Tanh−α; K= 30; α = 0; δ = 0
Avg PowerP
min
Popt
Fig. 5. Convergence speed: adaptiveα with tanh function (right) and the classical fixedα method (left).
In order to quantify theα-adaptation effect over the normalized square error, Fig. 6shows the NSE
and NSER for each number of iterations in the range[0; 700], and considering the same scenario of
Fig. 5. Note that for any iteration after the initial iterations (N > 100) the adaptive convergence factor
provides at least one and half order better performance in terms of NSE. Specifically, forN > 200 results
NSE(αAdpt) ≈ 2 ·10−2NSE(α = 0.1). In other words, the proposed tanhα adaptive method can achieve
the same solution quality ofα = 0.1 using less iterations (≈ 140 less iterations whenN > 100).
100 200 300 400 500 600 70010
−7
10−6
10−5
10−4
10−3
10−2
10−1
100
Iteration, N
NS
E
NSE and NSER for α=0.1 and Adaptative α (Hyperbolic Tangent) K= 30 users
Tanhα = 0.1
100 200 300 400 500 600 70010
−2
10−1
100
Iteration, N
NS
ER
NSER
Fig. 6. NSE and NSER to the adaptive method using tanh function against fixedα = 0.1.
Finally, in order to determine the best adaptive convergence factor method suggested by (14) and (15)

12
we can compare the NSE for both methods under the same channeland system conditions. Fig. 7 shows
the simulation results consideringK = 30 users andδ = 0. Note that the hyperbolic tangent mapping
always results a lower NSE, although this difference is marginal. Therefore, for any number of iterations
the convergence solution provided by thetanh method is better than that provided by the SNR to SNR
target difference mapping of (14), at cost of a marginal increment in computational effort spent with tanh
evaluation.
50 100 150 200 250 300 350 40010
−5
10−4
10−3
10−2
10−1
100
Iteration, N
NS
ESNR based and Hyperbolic Tangent Adaptative α K= 30 users
SNR diff, eq. (14)Tanh map., eq (15)
Fig. 7. NSE for bothα−adaptive methods.K = 30 users
D. Computational Complexity
As in a distributed method, each link mobile terminal-BS performs separately their updating, i.e., as
a whole the power control is performed byK processors in parallel and each one performs only scalar
operations. Hence, the analysis is reduced to the study of one iteration on each mobile terminal. So,
comparing the proposed and the classical Foschini [2] algorithms, both result in same complexity.
On the other hand, in order to compare the computational complexity of the proposed algorithm with
analytical matrix inversion approach, we have to quantify the number of additions and multiplications
as a function of the number of interfering mobile terminals(K − 1). Equations (11), (12) and (15) are
evaluated at each iteration in each terminal using the proposed algorithm with adaptiveα-tanh method.
Table II shows the number of additions and multiplications operations executed per iteration. TheK tanh
evaluations per iteration were admitted as a look-up table operations.
Hence, computational complexity of the proposed algorithmis N (K + 10), whereN is the number
of iterations necessary for convergence. Comparing with the best case complexity of the matrix inversion
operation, which is given byO[K2 · log(K)] [10], [11], the proposed optimization methodology achieves a
considerable complexity reduction when the number of mobile terminals is large and the NSE requirement

13
TABLE II
OPERATIONS PER ITERATION FOR THE PROPOSED ALGORITHM EXECUTED ON EACH MOBILE TERMINAL .
Equation Operation Number of Operations
(11) Additions 2
Multiplications 3
(12) Additions K
Multiplications K + 3
(15) Additions 1
look-up table 1
is not excessively tight. Besides, in the proposed method, the complexity could be controlled simply
specifying the maximal admissible NSE.
V. CONCLUSIONS
An extension on discrete Verhulst power equilibrium approach, previously suggested in literature was
proposed, taking into account the jointly power-rate optimal allocation problem. For this purpose, multirate
users associated to voice, data and video types of traffic were aggregated as distinct user’ classes, with
the assurance of QoS and minimum rate allocation per user. Furthermore, two criteria for convergence
speed up were suggested and compared with the fixed convergence factor case.
Numerical results for convergence time (number of iterations), quality of solution (NSE) and number of
basic operations (multiplications and sums) point out advantages of the Verhulst power-rateα−adaptive
algorithm when compared to analytical solution based on theinterference matrix inverse.
Finally, the logistic map approach applied to resource allocation problem in DS/CDMA systems sug-
gested here demonstrates tremendous potential of applicability. Future directions include a) power-rate
allocation for multiple-input-multiple-output (MIMO) CDMA systems, and b) discrete Verhulst equilibrium
adaptation to jointly minimize power consumption and maximize the throughput by changing the last
constraint in (10) toRℓ ≥ Rℓmin.
REFERENCES
[1] T. J. Gross, T. Abrao, and P. J. E. Jeszensky, “Distributed power control algorithm for multiple access systems based on verhulst
model,” AEU - International Journal of Electronics and Communications, vol. In Press, Corrected Proof, pp. –, 2010.
[2] G. Foschini and Z. Miljanic, “A simple distributed autonomous power control algorithm and its convergence,”IEEE Transactions on
Vehicular Technology, vol. 42, no. 4, pp. 641–646, Nov. 1993.
[3] P. F. Verhulst, “Notice sur la loi que la population pursuit dans son accroissement,”Corresp. Math. Phys., vol. 10, pp. 113–121, 1838.
[4] R. M. May, “Simple mathematical models with very complicated dynamics,”Nature, no. 261, pp. 459–467, 1976.
[5] S. M. Ulam and J. von Neumann, “On combination of stochastic and deterministic processes,”Bull. Am. Math. Soc., vol. 53, p. 1120,
1947.

14
[6] M. Elmusrati and H. Koivo, “Multi-objective totally distributed power and rate control for wireless communications,” in The 57th IEEE
Semiannual Vehicular Technology Conference, VTC’03-Spring, vol. 4, no. 1, Apr. 2003, pp. 2216–2220.
[7] M. Elmusrati, H. El-Sallabi, and H. Koivo, “Applications of multi-objective optimization techniques in radio resource scheduling of
cellular communication systems,”IEEE Transactions on Wireless Communications, vol. 7, no. 1, pp. 343–353, Jan. 2008.
[8] E. Seneta,Non-Negative Matrices and Markov Chains, 2nd ed. New York: Springer-Verlag, 1981.
[9] Z. Uykan and H. Koivo, “Sigmoid-basis nonlinear power-control algorithm for mobile radio systems,”IEEE Transactions on Vehicular
Technology, vol. 53, no. 1, pp. 265–271, Jan 2004.
[10] G. H. Golub and C. F. V. Loan,Matrix Computations. Maryland, USA: Johns Hopkins University Press, 1996.
[11] A. Tveit, “On the complexity of matrix inversion,”Mathematical Note, p. 1, November 2003, trondheim, Norway.