Embed Size (px)
Citation preview
PowerShares Global Funds Ireland plc
(an umbrella investment company with variable capital and segregated liability between its Funds)
ANNUAL REPORT AND AUDITED FINANCIAL STATEMENTS For the financial year ended 30 September 2016
2 PowerShares Global Funds Ireland plc
Table of Contents Pages
General Information 4-5
Investment Policy and Description of the Fund 6-7
Investment Manager’s Report 8-12 Directors’ Report 13-26 Audit Committee Report 27 Other Information (unaudited) 28 Report of the Depositary to the Shareholders 29 Independent Auditors’ Report to the Shareholders 30-34 Schedule of Investments 35-135 Statement of Financial Position as at 30 September 2016 136-141 Statement of Financial Position as at 30 September 2015 142-146 Statement of Comprehensive Income for financial year ended 30 September 2016 147-152 Statement of Comprehensive Income for financial year ended 30 September 2015 153-157 Statement of Changes in Net Assets Attributable to Holders of Redeemable Participating Shares for financial year ended 30 September 2016 158-163
Statement of Changes in Net Assets Attributable to Holders of Redeemable Participating Shares for financial year ended 30 September 2015 164-168 Notes to the Financial Statements 169-203
US Equity ETFs
PowerShares EQQQ NASDAQ-100 UCITS ETF
Schedule of Investments 35 Statement of Changes in Composition of the Portfolio 204
PowerShares FTSE RAFI US 1000 UCITS ETF
Schedule of Investments 37 Statement of Changes in Composition of the Portfolio 206
PowerShares Dynamic US Market UCITS ETF
Schedule of Investments 53 Statement of Changes in Composition of the Portfolio 206
PowerShares S&P 500 High Dividend Low Volatility UCITS ETF
Schedule of Investments F
55 Statement of Changes in Composition of the Portfolio 207
PowerShares S&P 500 VEQTOR UCITS ETF
Schedule of Investments
57 Statement of Changes in Composition of the Portfolio 208
Intelligent Access ETFs
PowerShares Global Clean Energy UCITS ETF
Schedule of Investments 66 Statement of Changes in Composition of the Portfolio 209
PowerShares Global Listed Private Equity UCITS ETF
Schedule of Investments 69 Statement of Changes in Composition of the Portfolio 210
PowerShares Global Water UCITS ETF
Schedule of Investments 71 Statement of Changes in Composition of the Portfolio 211
PowerShares Global Agriculture UCITS ETF
Schedule of Investments 73 Statement of Changes in Composition of the Portfolio 212
PowerShares Global Buyback Achievers UCITS ETF
Schedule of Investments 75 Statement of Changes in Composition of the Portfolio 213
3 PowerShares Global Funds Ireland plc
Table of Contents (continued) Global ETFs
PowerShares FTSE RAFI Developed 1000 UCITS ETF*
Schedule of Investments N/A Statement of Changes in Composition of the Portfolio 214
PowerShares FTSE RAFI Europe Mid-Small UCITS ETF
Schedule of Investments 80 Statement of Changes in Composition of the Portfolio 215
PowerShares FTSE RAFI All-World 3000 UCITS ETF
Schedule of Investments 89 Statement of Changes in Composition of the Portfolio 216
PowerShares FTSE RAFI Emerging Markets UCITS ETF
Schedule of Investments 110 Statement of Changes in Composition of the Portfolio 217
PowerShares FTSE RAFI Asia Pacific Ex-Japan UCITS ETF*
Schedule of Investments N/A Statement of Changes in Composition of the Portfolio 218
PowerShares FTSE RAFI Europe UCITS ETF Schedule of Investments 116 Statement of Changes in Composition of the Portfolio 219
PowerShares EURO STOXX High Dividend Low Volatility UCITS ETF*
Schedule of Investments 124 Statement of Changes in Composition of the Portfolio 220
PowerShares FTSE Emerging Markets High Dividend Low Volatility UCITS ETF*
Schedule of Investments 126 Statement of Changes in Composition of the Portfolio 221
PowerShares FTSE UK High Dividend Low Volatility UCITS ETF*
Schedule of Investments 129 Statement of Changes in Composition of the Portfolio 222
Country Specified ETFs
PowerShares FTSE RAFI UK 100 UCITS ETF
Schedule of Investments 131 Statement of Changes in Composition of the Portfolio 223
PowerShares FTSE RAFI Italy 30 UCITS ETF*
Schedule of Investments N/A Statement of Changes in Composition of the Portfolio 224
PowerShares FTSE RAFI Switzerland UCITS ETF*
Schedule of Investments N/A Statement of Changes in Composition of the Portfolio 225
PowerShares FTSE RAFI Hong Kong China UCITS ETF*
Schedule of Investments N/A Statement of Changes in Composition of the Portfolio 226
Fixed Income ETFs
PowerShares EuroMTS Cash 3 Months UCITS ETF
Schedule of Investments 133 Statement of Changes in Composition of the Portfolio 227
PowerShares US High Yield Fallen Angels UCITS ETF*
Schedule of Investments 134 Statement of Changes in Composition of the Portfolio 228
Additional Information (Unaudited)
Remuneration Policy 229
Securities Financing Transactions Regulation 230
UK Reporting 232
* Funds launched and liquidated during the period, refer to note 19 of the financial statements.
4 PowerShares Global Funds Ireland plc
General Information
PowerShares Global Funds Ireland plc (the “Company”) was incorporated on 5 February 2002 and is established as an open-ended investment company with variable capital (“OEIC”) under the laws of Ireland as a public limited company pursuant to the Companies Act 2014, registration number 352941 and the European Communities (Undertakings for Collective Investment in Transferable Securities) Regulations, 2015 (as amended). As at 30 September 2016, twenty active funds of the Company had been established (each a “Fund” and together the “Funds”). PowerShares FTSE RAFI Developed 1000 UCITS ETF, PowerShares FTSE RAFI Asia Pacific Ex-Japan UCITS ETF, PowerShares FTSE RAFI Italy 30 UCITS ETF, PowerShares FTSE RAFI Switzerland UCITS ETF and PowerShares FTSE RAFI Hong Kong China UCITS ETF liquidated on 10 March 2016. The list of current Funds is as follows;
US Equity ETFs PowerShares EQQQ NASDAQ-100 UCITS ETF PowerShares FTSE RAFI US 1000 UCITS ETF PowerShares Dynamic US Market UCITS ETF PowerShares S&P 500 High Dividend Low Volatility UCITS ETF PowerShares S&P 500 VEQTOR UCITS ETF
Intelligent Access ETFs PowerShares Global Clean Energy UCITS ETF PowerShares Global Listed Private Equity UCITS ETF PowerShares Global Water UCITS ETF PowerShares Global Agriculture UCITS ETF PowerShares Global Buyback Achievers UCITS ETF Global ETFs PowerShares FTSE RAFI Europe Mid-Small UCITS ETF PowerShares FTSE RAFI All-World 3000 UCITS ETF PowerShares FTSE RAFI Emerging Markets UCITS ETF PowerShares FTSE RAFI Europe UCITS ETF PowerShares EURO STOXX High Dividend Low Volatility UCITS ETF* PowerShares FTSE Emerging Markets High Dividend Low Volatility UCITS ETF** PowerShares FTSE UK High Dividend Low Volatility UCITS ETF**
Country Specified ETFs PowerShares FTSE RAFI UK 100 UCITS ETF
Fixed Income ETFs PowerShares EuroMTS Cash 3 Months UCITS ETF PowerShares US High Yield Fallen Angels UCITS ETF*** * Fund launched on 6 January 2016, see note 20 for details. ** Fund launched on 27 May 2016, see note 20 for details. *** Fund launched on 1 September 2016, see note 20 for details.
5 PowerShares Global Funds Ireland plc
General Information (continued) Board of Directors: Registered Office:
Adrian Waters (Irish)* Central Quay
Cormac O’Sullivan (Irish)** Riverside IV
Douglas J. Sharp (Canadian) ** (resigned on 18 October 2016) Sir John Rogerson’s Quay
Karen Dunn Kelley (American)** (retired on 5 September 2016) Dublin 2
Leslie Schmidt (American)** Ireland
Sybille Hofmann (German)** (resigned on 24 May 2016) William Manahan (Irish)*
Bernhard Langer (German) ** (appointed 5 September 2016)
Graeme Proudfoot (British) ** (appointed 18 October 2016)
*Independent non-executive director Manager: ** Non-executive director Invesco Global Asset Management DAC*
Central Quay
Riverside IV
Sir John Rogerson’s Quay
Dublin 2
Investment Manager: Administrator, Registrar and Transfer Agent: Invesco PowerShares Capital Management LLC BNY Mellon Fund Services (Ireland) Designated Activity Company**
3500 Lacey Road Guild House
Suite 700 Downers Grove Guild Street
Illinois 60515 International Financial Services Centre
United States Dublin 1
Ireland
Auditors and Reporting Accountant Depositary: PricewaterhouseCoopers BNY Mellon Trust Company (Ireland) Limited
One Spencer Dock Guild House
North Wall Quay Guild Street
Dublin 1 International Financial Services Centre
Ireland Dublin 1
Ireland
Secretary: Sub - Custodian: Invesco Asset Management Limited The Bank of New York Mellon
Perpetual Park One Wall Street
Perpetual Park Drive New York, NY 10286
Henley-on-Thames USA
Oxfordshire RG9 1HH
United Kingdom
Legal Advisers to the Company: Computershare Sub - Transfer Agent: William Fry Computershare Investor Services (Ireland) Limited
2 Grand Canal Square Heron House
Dublin 2 Corrig Road
Ireland Sandyford Industrial Estate
Dublin 18
Ireland
* Effective 12 May 2016, the Manager converted to a Designated Activity Company pursuant to the Companies Act 2014 and, changed its name from Invesco Global Asset Management Limited to Invesco Global Assets Management DAC. ** Effective 27 January 2016, the Administrator converted to a Designated Activity Company pursuant to the Companies Act 2014 and, changed its name from BNY Mellon Fund Services (Ireland) Limited to BNY Mellon Fund Services (Ireland) Designated Activity Company.
6 PowerShares Global Funds Ireland plc
Investment Policy and Description of the Fund
Investment Strategy for the Financial Year
PowerShares EQQQ NASDAQ-100 UCITS ETF The investment objective of the Fund is to provide investors with investment results which, before expenses, generally correspond to the price and yield performance of the NASDAQ-100 Notional Index (Net Total Return) in USD. The Investment Manager uses the full physical replication method of the ‘index tracking’ strategy whereby the Fund will so far as possible and practicable hold all of the components of the Index in their respective weightings subject to the investment restrictions as disclosed in the Fund’s Prospectus.
PowerShares FTSE RAFI US 1000 UCITS ETF The investment objective of the Fund is to provide investors with investment results which, before expenses, correspond to the price and yield performance of the FTSE RAFI US 1000 Index (Net Total Return) in USD. The Investment Manager uses the full physical replication method of the ‘index-tracking’ strategy whereby the Fund will so far as possible and practicable hold all of the components of the Index in their respective weightings subject to the investment restrictions as disclosed in the Fund’s Prospectus.
PowerShares Dynamic US Market UCITS ETF The investment objective of the Fund is to provide investors with investment results which, before expenses, correspond to the price and yield performance of the Dynamic Market Intellidex Index (Net Total Return) in USD. The Investment Manager uses the full physical replication method of the ‘index-tracking’ strategy whereby the Fund will so far as possible and practicable hold all of the components of the Index in their respective weightings subject to the investment restrictions as disclosed in the Fund’s Prospectus.
PowerShares S&P 500 High Dividend Low Volatility UCITS ETF The investment objective of the Fund is to generate income, together with capital growth which, before expenses, would correspond to, or track, the return on the S&P 500 Low Volatility High Dividend Index (Net Total Return) in USD. The Investment Manager uses a full physical replication method of the ‘index-tracking’ strategy whereby the Fund will, so far as possible and practicable hold all the components of the Index in their respective weightings subject to the investment restrictions as disclosed in the Fund’s Prospectus.
PowerShares S&P 500 VEQTOR UCITS ETF The investment objective of the Fund is to generate capital growth and income which, before expenses, would correspond to, or track, the return on the S&P 500 Dynamic VEQTOR Index (Net Total Return) in USD. The Fund will invest in a combination of equity securities contained in the S&P 500 Index; futures contracts that reflect exposure to the S&P 500 VIX Short-Term Futures Index; and money market funds, money market instruments and cash subject to the investment restrictions as disclosed in the Fund’s Prospectus.
PowerShares Global Clean Energy UCITS ETF The investment objective of the Fund is to provide investors with investment results which, before expenses, correspond to the price and yield performance of the WilderHill New Energy Global Innovation Index (Net Total Return) in EUR. The Investment Manager uses the full physical replication method of the ‘index-tracking’ strategy whereby the Fund will so far as possible and practicable hold all of the components of the Index in their respective weightings subject to the investment restrictions as discussed in the Fund’s Prospectus.
PowerShares Global Listed Private Equity UCITS ETF The investment objective of the Fund is to provide investors with investment results which, before expenses, correspond to the price and yield performance of the Red Rocks Global Listed Private Equity Index (Net Total Return) in EUR. The Investment Manager uses the full physical replication method of the ‘index-tracking’ strategy whereby the Fund will so far as possible and practicable hold all of the components in the Index in their respective weightings subject to the investment restrictions as disclosed in the Fund’s Prospectus.
PowerShares Global Water UCITS ETF The investment objective of the Fund is to provide investment results which, before expenses, correspond to the price and yield performance of the NASDAQ OMX Global Water Index (Net Total Return) ("the Index") in Euro terms, by, so far as possible and practicable, holding all of the shares in the Index in their respective weightings in the Index, subject to the investment restrictions as disclosed in the Fund's Prospectus.
PowerShares Global Agriculture UCITS ETF The investment objective of the Fund is to provide investors with investment results which, before expenses, correspond to the price and yield performance of the NASDAQ OMX Global Agriculture Notional Index (Net Total Return) in USD. The Investment Manager uses the full physical replication method of the ‘index-tracking’ strategy whereby the Fund will so far as possible and practicable hold all of the components of the Index in their respective weightings subject to the investment restrictions as disclosed in the Fund’s Prospectus.
PowerShares Global Buyback Achievers UCITS ETF The investment objective of the Fund is to provide investors with investment results which, before expenses, correspond to the price and yield performance of the NASDAQ Global Buyback Achievers Index (Net Total Return) in USD. The Investment Manager uses the full physical replication method of the ‘index-tracking’ strategy whereby the Fund will so far as possible and practicable hold all of the components of the Index in their respective weightings subject to the investment restrictions as disclosed in the Fund’s Prospectus.
PowerShares FTSE RAFI Developed 1000 UCITS ETF* The investment objective of the Fund was to provide investors with investment results which, before expenses, correspond to the price and yield performance of the FTSE RAFI Developed 1000 Index (Net Total Return) in EUR. The Investment Manager used the full physical replication method of the ‘index-tracking’ strategy whereby the Fund will so far as possible and practicable hold all of the components of the Index in their respective weightings subject to the investment restrictions as disclosed in the Fund’s Prospectus. With effect from 10 March 2016 the Fund closed.
PowerShares FTSE RAFI Europe Mid-Small UCITS ETF The investment objective of the Fund is to provide investors with investment results which, before expenses, corresponded to the price and yield performance of the FTSE RAFI Developed Europe Mid-Small Index (Net Total Return) in EUR. The Investment Manager uses the full physical replication method of the ‘index-tracking’ strategy whereby the Fund would so far as possible and practicable hold all of the components of the Index in their respective weightings subject to the investment restrictions as disclosed in the Fund’s Prospectus.
PowerShares FTSE RAFI All-World 3000 UCITS ETF The investment objective of the Fund is to provide investors with investment results which, before expenses, correspond to the price and yield performance of the FTSE RAFI All-World 3000 Index (Net Total Return) in USD. The Investment Manager uses an optimal sampling method of the ‘index-tracking’ strategy whereby the Fund will so far as possible and practicable hold a sample of the components of the Index subject to the investment restrictions as disclosed in the Fund’s Prospectus.
7 PowerShares Global Funds Ireland plc
Investment Policy and Description of the Fund (continued)
Investment Strategy for the Financial Year (continued)
PowerShares FTSE RAFI Emerging Markets UCITS ETF The investment objective of the Fund is to provide investors with investment results which, before expenses, correspond to the price and yield performance of the FTSE RAFI Emerging Markets Index (Net Total Return) in US Dollar terms, by using full physical replication method as the only 'index tracking' strategy whereby the Fund will so far as possible and practicable, hold all of the shares in the Index in their respective weightings in the Index, subject to the investment restrictions as disclosed in the Fund's Prospectus.
PowerShares FTSE RAFI Asia Pacific Ex-Japan UCITS ETF* The investment objective of the Fund was to provide investment results which, before expenses, correspond to the price and yield performance of the FTSE RAFI Asia Pacific Ex-Japan Index (Net Total Return) ("the Index") in US Dollar terms, by, so far as possible and practicable, holding all of the shares in the Index in their respective weightings in the Index, subject to the investment restrictions as disclosed in the Fund's Prospectus. With effect from 10 March 2016, the Fund closed.
PowerShares FTSE RAFI Europe UCITS ETF The investment objective of the Fund is to provide investment results which, before expenses, correspond to the price and yield performance of the FTSE RAFI Europe-Index (Net Total Return) ("the Index") in Euro terms, by, so far as possible and practicable, holding all of the shares in the Index in their respective weightings in the Index, subject to the investment restrictions as disclosed in the Fund's Prospectus.
PowerShares EURO STOXX High Dividend Low Volatility UCITS ETF** The investment objective of the Fund is to generate income, together with capital growth which, before expenses, correspond to, or track the result on the EURO iSTOXX High Dividend Low Volatility 50 Index ("the Index") in Euro terms, by, so far as possible and practicable, holding all of the shares in the Index in their respective weightings in the Index, subject to the investment restrictions as disclosed in the Fund's Prospectus.
PowerShares FTSE Emerging Markets High Dividend Low Volatility UCITS ETF*** The investment objective of the Fund is to generate income, together with capital growth which, before expenses, would correspond to, or track, the return on the FTSE Emerging Markets High Dividend Low Volatility Index (Net Total Return) ("the Index") in US Dollar terms, by, so far as possible and practicable, holding all of the shares in the Index in their respective weightings in the Index, subject to the investment restrictions as disclosed in the Fund's Prospectus.
PowerShares FTSE UK High Dividend Low Volatility UCITS ETF*** The investment objective of the Fund is to generate income, together with capital growth which, before expenses, would correspond to, or track, the return on the FTSE UK High Dividend Low Volatility Index (Net Total Return) ("the Index") in Sterling terms, by, so far as possible and practicable, holding all of the shares in the Index in their respective weightings in the Index, subject to the investment restrictions as disclosed in the Fund's Prospectus.
PowerShares FTSE RAFI UK 100 UCITS ETF The investment objective of the Fund is to provide investment results which, before expenses, correspond to the price and yield performance of the FTSE RAFI UK 100 Index (Net Total Return) ("the Index") in Sterling terms, by, so far as possible and practicable, holding all of the shares in the Index in their respective weightings in the Index, subject to the investment restrictions as disclosed in the Fund's Prospectus.
PowerShares FTSE RAFI Italy 30 UCITS ETF* The investment objective of the Fund was to provide investment results which, before expenses, correspond to the price and yield performance of the FTSE RAFI Italy 30 Index (Net Total Return) ("the Index") in Euro terms, by, so far as possible and practicable, holding all of the shares in the Index in their respective weightings in the Index, subject to the investment restrictions as disclosed in the Fund's Prospectus. With effect from 10 March 2016, the Fund closed.
PowerShares FTSE RAFI Switzerland UCITS ETF* The investment objective of the Fund was to provide investment results which, before expenses, correspond to the price and yield performance of the FTSE RAFI Switzerland Index (Net Total Return) ("the Index") in Swiss Franc terms, by, so far as possible and practicable, holding all of the shares in the Index in their respective weightings in the Index, subject to the investment restrictions as disclosed in the Fund's Prospectus. With effect from 10 March 2016, the Fund closed.
PowerShares FTSE RAFI Hong Kong China UCITS ETF* The investment objective of the Fund was to provide investment results which, before expenses, correspond to the price and yield performance of the FTSE RAFI Hong Kong China Index (Net Total Return) ("the Index") in US Dollar terms, by, so far as possible and practicable, holding all of the shares in the Index in their respective weightings in the Index, subject to the investment restrictions as disclosed in the Fund's Prospectus. With effect from 10 March 2016, the Fund closed.
PowerShares EuroMTS Cash 3 Months UCITS ETF The investment objective of the Fund is to provide investment results which, before expenses, correspond to the price and yield performance of the FTSE MTS Eurozone Government Bill 0-6 Month Capped Index ("the Index") in Euro terms, by holding a portfolio of securities that consist of the component securities of the Index. PowerShares US High Yield Fallen Angels UCITS ETF**** The investment objective of the Fund is to provide investors with investment results which, before expenses, correspond to the price and yield performance of Citi Time-Weighted US Fallen Angel Bond Select Index (Net Total Return) ("the Index") in US Dollar terms,by, so far as possible and practicable, holding all of the shares in the Index in their respective weightings in the Index, subject to the investment restrictions as disclosed in the Fund's Prospectus. * Fund liquidated on 10 March 2016. ** Fund launched on 6 January 2016. *** Fund launched on 27 May 2016. **** Fund launched on 1 September 2016.
8 PowerShares Global Funds Ireland plc
Investment Manager’s Report
Performance Analysis
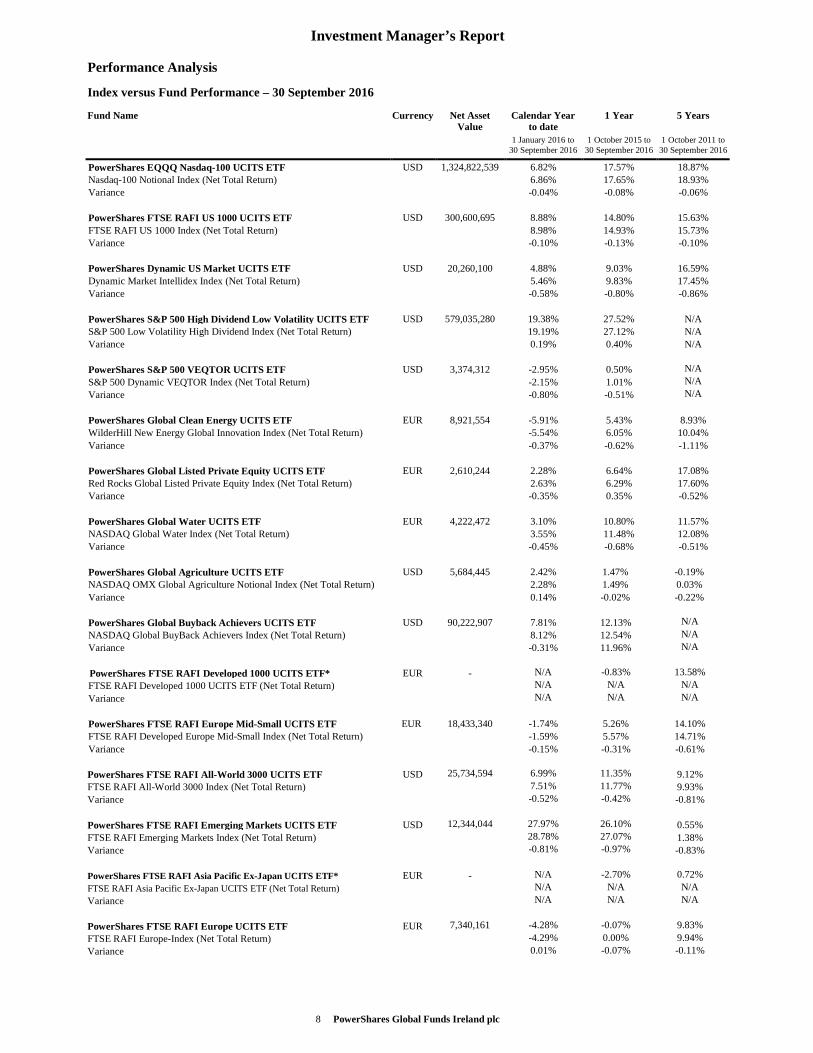
Index versus Fund Performance – 30 September 2016
Fund Name Currency Net Asset Value
Calendar Year to date
1 Year 5 Years
1 January 2016 to 30 September 2016
1 October 2015 to 30 September 2016
1 October 2011 to 30 September 2016
PowerShares EQQQ Nasdaq-100 UCITS ETF USD 1,324,822,539 6.82% 17.57% 18.87% Nasdaq-100 Notional Index (Net Total Return) 6.86% 17.65% 18.93% Variance -0.04% -0.08% -0.06% PowerShares FTSE RAFI US 1000 UCITS ETF USD 300,600,695 8.88% 14.80% 15.63% FTSE RAFI US 1000 Index (Net Total Return) 8.98% 14.93% 15.73% Variance -0.10% -0.13% -0.10% PowerShares Dynamic US Market UCITS ETF USD 20,260,100 4.88% 9.03% 16.59% Dynamic Market Intellidex Index (Net Total Return) 5.46% 9.83% 17.45% Variance -0.58% -0.80% -0.86% PowerShares S&P 500 High Dividend Low Volatility UCITS ETF USD 579,035,280 19.38% 27.52% N/A S&P 500 Low Volatility High Dividend Index (Net Total Return) 19.19% 27.12% N/A Variance 0.19% 0.40% N/A PowerShares S&P 500 VEQTOR UCITS ETF USD 3,374,312 -2.95% 0.50% N/A S&P 500 Dynamic VEQTOR Index (Net Total Return) -2.15% 1.01% N/A Variance -0.80% -0.51% N/A PowerShares Global Clean Energy UCITS ETF EUR 8,921,554 -5.91% 5.43% 8.93% WilderHill New Energy Global Innovation Index (Net Total Return) -5.54% 6.05% 10.04% Variance -0.37% -0.62% -1.11% PowerShares Global Listed Private Equity UCITS ETF EUR 2,610,244 2.28% 6.64% 17.08% Red Rocks Global Listed Private Equity Index (Net Total Return) 2.63% 6.29% 17.60% Variance -0.35% 0.35% -0.52% PowerShares Global Water UCITS ETF EUR 4,222,472 3.10% 10.80% 11.57% NASDAQ Global Water Index (Net Total Return) 3.55% 11.48% 12.08% Variance -0.45% -0.68% -0.51% PowerShares Global Agriculture UCITS ETF USD 5,684,445 2.42% 1.47% -0.19% NASDAQ OMX Global Agriculture Notional Index (Net Total Return) 2.28% 1.49% 0.03% Variance 0.14% -0.02% -0.22% PowerShares Global Buyback Achievers UCITS ETF USD 90,222,907 7.81% 12.13% N/A NASDAQ Global BuyBack Achievers Index (Net Total Return) 8.12% 12.54% N/A Variance -0.31% 11.96% N/A PowerShares FTSE RAFI Developed 1000 UCITS ETF*
EUR - N/A -0.83% 13.58% FTSE RAFI Developed 1000 UCITS ETF (Net Total Return) N/A N/A N/A Variance N/A N/A N/A PowerShares FTSE RAFI Europe Mid-Small UCITS ETF EUR 18,433,340 -1.74% 5.26% 14.10% FTSE RAFI Developed Europe Mid-Small Index (Net Total Return) -1.59% 5.57% 14.71% Variance -0.15% -0.31% -0.61% PowerShares FTSE RAFI All-World 3000 UCITS ETF USD 25,734,594 6.99% 11.35% 9.12% FTSE RAFI All-World 3000 Index (Net Total Return) 7.51% 11.77% 9.93% Variance -0.52% -0.42% -0.81% PowerShares FTSE RAFI Emerging Markets UCITS ETF USD 12,344,044 27.97% 26.10% 0.55% FTSE RAFI Emerging Markets Index (Net Total Return) 28.78% 27.07% 1.38% Variance -0.81% -0.97% -0.83% PowerShares FTSE RAFI Asia Pacific Ex-Japan UCITS ETF* EUR - N/A -2.70% 0.72% FTSE RAFI Asia Pacific Ex-Japan UCITS ETF (Net Total Return) N/A N/A N/A Variance N/A N/A N/A PowerShares FTSE RAFI Europe UCITS ETF EUR 7,340,161 -4.28% -0.07% 9.83% FTSE RAFI Europe-Index (Net Total Return) -4.29% 0.00% 9.94% Variance 0.01% -0.07% -0.11%
9 PowerShares Global Funds Ireland plc
Investment Manager’s Report (continued)
Performance Analysis (continued)
Fund Name Currency Net Asset Value
Calendar Year to date
1 Year 5 Years
1 January 2016 to 30 September 2016
1 October 2015 to 30 September 2016
1 October 2011 to 30 September 2016
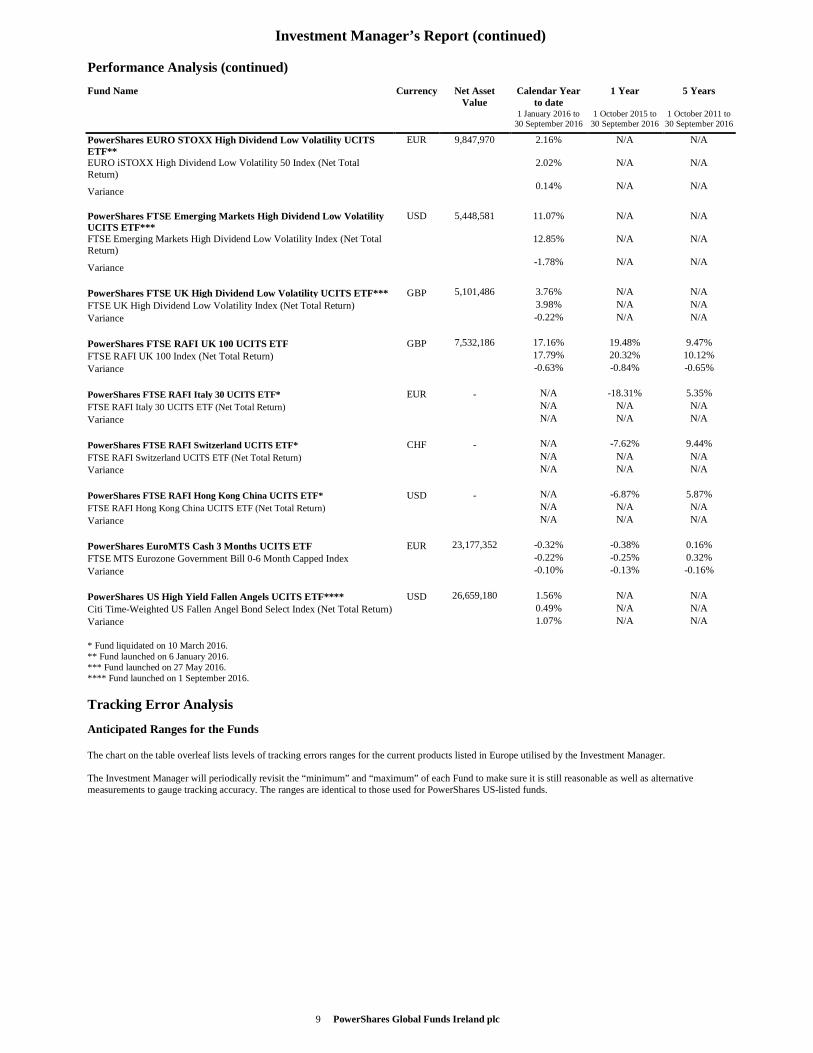
PowerShares EURO STOXX High Dividend Low Volatility UCITS ETF**
EUR 9,847,970 2.16% N/A N/A
EURO iSTOXX High Dividend Low Volatility 50 Index (Net Total Return)
2.02% N/A N/A
Variance 0.14% N/A N/A
PowerShares FTSE Emerging Markets High Dividend Low Volatility UCITS ETF***
USD 5,448,581 11.07% N/A N/A
FTSE Emerging Markets High Dividend Low Volatility Index (Net Total Return)
12.85% N/A N/A
Variance -1.78% N/A N/A
PowerShares FTSE UK High Dividend Low Volatility UCITS ETF*** GBP 5,101,486 3.76% N/A N/A FTSE UK High Dividend Low Volatility Index (Net Total Return) 3.98% N/A N/A Variance -0.22% N/A N/A PowerShares FTSE RAFI UK 100 UCITS ETF GBP 7,532,186 17.16% 19.48% 9.47% FTSE RAFI UK 100 Index (Net Total Return) 17.79% 20.32% 10.12% Variance -0.63% -0.84% -0.65% PowerShares FTSE RAFI Italy 30 UCITS ETF* EUR - N/A -18.31% 5.35% FTSE RAFI Italy 30 UCITS ETF (Net Total Return) N/A N/A N/A Variance N/A N/A N/A
PowerShares FTSE RAFI Switzerland UCITS ETF* CHF - N/A -7.62% 9.44% FTSE RAFI Switzerland UCITS ETF (Net Total Return) N/A N/A N/A Variance N/A N/A N/A PowerShares FTSE RAFI Hong Kong China UCITS ETF* USD - N/A -6.87% 5.87% FTSE RAFI Hong Kong China UCITS ETF (Net Total Return) N/A N/A N/A Variance N/A N/A N/A PowerShares EuroMTS Cash 3 Months UCITS ETF EUR 23,177,352 -0.32% -0.38% 0.16% FTSE MTS Eurozone Government Bill 0-6 Month Capped Index -0.22% -0.25% 0.32% Variance -0.10% -0.13% -0.16%
PowerShares US High Yield Fallen Angels UCITS ETF**** USD 26,659,180 1.56% N/A N/A Citi Time-Weighted US Fallen Angel Bond Select Index (Net Total Return) 0.49% N/A N/A Variance 1.07% N/A N/A * Fund liquidated on 10 March 2016. ** Fund launched on 6 January 2016. *** Fund launched on 27 May 2016. **** Fund launched on 1 September 2016.
Tracking Error Analysis
Anticipated Ranges for the Funds The chart on the table overleaf lists levels of tracking errors ranges for the current products listed in Europe utilised by the Investment Manager. The Investment Manager will periodically revisit the “minimum” and “maximum” of each Fund to make sure it is still reasonable as well as alternative measurements to gauge tracking accuracy. The ranges are identical to those used for PowerShares US-listed funds.
10 PowerShares Global Funds Ireland plc
Investment Manager’s Report (continued)
Tracking Error Analysis (continued)
Acceptable Ranges for the Funds
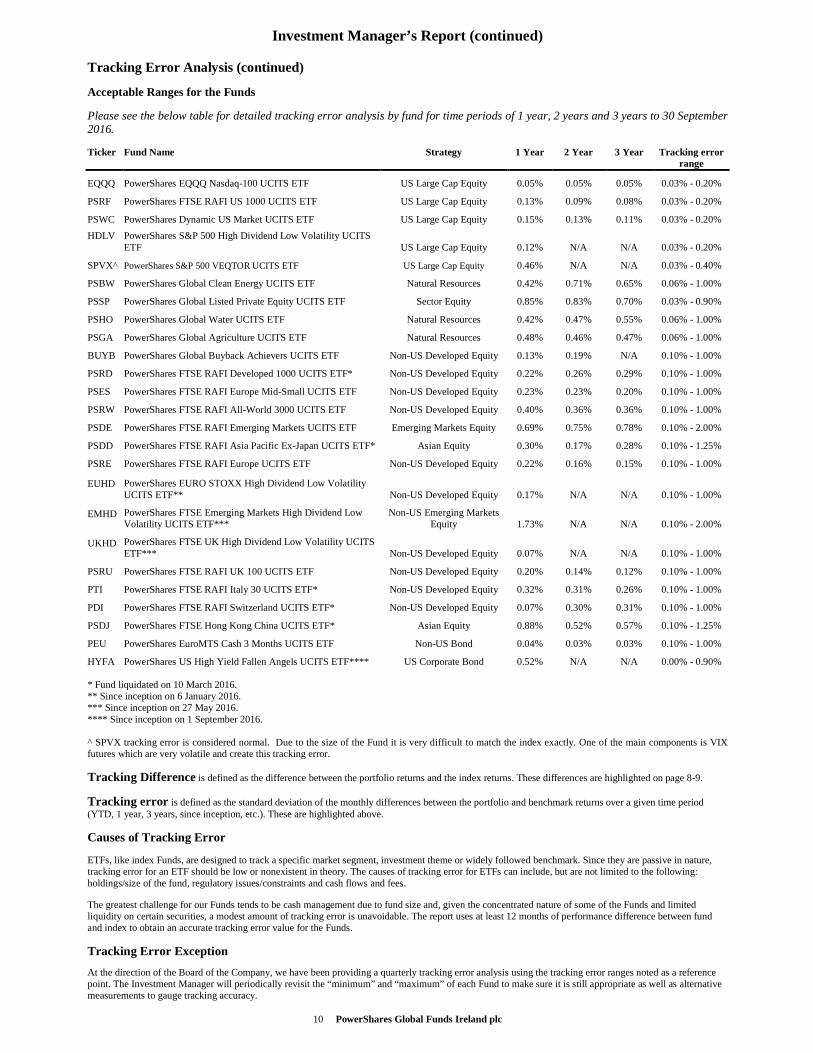
Please see the below table for detailed tracking error analysis by fund for time periods of 1 year, 2 years and 3 years to 30 September 2016.
Ticker Fund Name Strategy 1 Year 2 Year 3 Year Tracking error range
EQQQ PowerShares EQQQ Nasdaq-100 UCITS ETF US Large Cap Equity 0.05% 0.05% 0.05% 0.03% - 0.20%
PSRF PowerShares FTSE RAFI US 1000 UCITS ETF US Large Cap Equity 0.13% 0.09% 0.08% 0.03% - 0.20%
PSWC PowerShares Dynamic US Market UCITS ETF US Large Cap Equity 0.15% 0.13% 0.11% 0.03% - 0.20%
HDLV PowerShares S&P 500 High Dividend Low Volatility UCITS ETF US Large Cap Equity 0.12% N/A N/A 0.03% - 0.20%
SPVX ̂ PowerShares S&P 500 VEQTOR UCITS ETF US Large Cap Equity 0.46% N/A N/A 0.03% - 0.40%
PSBW PowerShares Global Clean Energy UCITS ETF Natural Resources 0.42% 0.71% 0.65% 0.06% - 1.00%
PSSP PowerShares Global Listed Private Equity UCITS ETF Sector Equity 0.85% 0.83% 0.70% 0.03% - 0.90%
PSHO PowerShares Global Water UCITS ETF Natural Resources 0.42% 0.47% 0.55% 0.06% - 1.00%
PSGA PowerShares Global Agriculture UCITS ETF Natural Resources 0.48% 0.46% 0.47% 0.06% - 1.00%
BUYB PowerShares Global Buyback Achievers UCITS ETF Non-US Developed Equity 0.13% 0.19% N/A 0.10% - 1.00%
PSRD PowerShares FTSE RAFI Developed 1000 UCITS ETF* Non-US Developed Equity 0.22% 0.26% 0.29% 0.10% - 1.00%
PSES PowerShares FTSE RAFI Europe Mid-Small UCITS ETF Non-US Developed Equity 0.23% 0.23% 0.20% 0.10% - 1.00%
PSRW PowerShares FTSE RAFI All-World 3000 UCITS ETF Non-US Developed Equity 0.40% 0.36% 0.36% 0.10% - 1.00%
PSDE PowerShares FTSE RAFI Emerging Markets UCITS ETF Emerging Markets Equity 0.69% 0.75% 0.78% 0.10% - 2.00%
PSDD PowerShares FTSE RAFI Asia Pacific Ex-Japan UCITS ETF* Asian Equity 0.30% 0.17% 0.28% 0.10% - 1.25%
PSRE PowerShares FTSE RAFI Europe UCITS ETF Non-US Developed Equity 0.22% 0.16% 0.15% 0.10% - 1.00%
EUHD PowerShares EURO STOXX High Dividend Low Volatility UCITS ETF** Non-US Developed Equity 0.17% N/A N/A 0.10% - 1.00%
EMHD PowerShares FTSE Emerging Markets High Dividend Low Volatility UCITS ETF***
Non-US Emerging Markets Equity 1.73% N/A N/A 0.10% - 2.00%
UKHD PowerShares FTSE UK High Dividend Low Volatility UCITS ETF*** Non-US Developed Equity 0.07% N/A N/A 0.10% - 1.00%
PSRU PowerShares FTSE RAFI UK 100 UCITS ETF Non-US Developed Equity 0.20% 0.14% 0.12% 0.10% - 1.00%
PTI PowerShares FTSE RAFI Italy 30 UCITS ETF* Non-US Developed Equity 0.32% 0.31% 0.26% 0.10% - 1.00%
PDI PowerShares FTSE RAFI Switzerland UCITS ETF* Non-US Developed Equity 0.07% 0.30% 0.31% 0.10% - 1.00%
PSDJ PowerShares FTSE Hong Kong China UCITS ETF* Asian Equity 0.88% 0.52% 0.57% 0.10% - 1.25%
PEU PowerShares EuroMTS Cash 3 Months UCITS ETF Non-US Bond 0.04% 0.03% 0.03% 0.10% - 1.00%
HYFA PowerShares US High Yield Fallen Angels UCITS ETF**** US Corporate Bond 0.52% N/A N/A 0.00% - 0.90%
* Fund liquidated on 10 March 2016. ** Since inception on 6 January 2016. *** Since inception on 27 May 2016. **** Since inception on 1 September 2016. ^ SPVX tracking error is considered normal. Due to the size of the Fund it is very difficult to match the index exactly. One of the main components is VIX futures which are very volatile and create this tracking error.
Tracking Difference is defined as the difference between the portfolio returns and the index returns. These differences are highlighted on page 8-9.
Tracking error is defined as the standard deviation of the monthly differences between the portfolio and benchmark returns over a given time period (YTD, 1 year, 3 years, since inception, etc.). These are highlighted above.
Causes of Tracking Error
ETFs, like index Funds, are designed to track a specific market segment, investment theme or widely followed benchmark. Since they are passive in nature, tracking error for an ETF should be low or nonexistent in theory. The causes of tracking error for ETFs can include, but are not limited to the following: holdings/size of the fund, regulatory issues/constraints and cash flows and fees.
The greatest challenge for our Funds tends to be cash management due to fund size and, given the concentrated nature of some of the Funds and limited liquidity on certain securities, a modest amount of tracking error is unavoidable. The report uses at least 12 months of performance difference between fund and index to obtain an accurate tracking error value for the Funds.
Tracking Error Exception
At the direction of the Board of the Company, we have been providing a quarterly tracking error analysis using the tracking error ranges noted as a reference point. The Investment Manager will periodically revisit the “minimum” and “maximum” of each Fund to make sure it is still appropriate as well as alternative measurements to gauge tracking accuracy.
11 PowerShares Global Funds Ireland plc
Investment Manager’s Report (continued)
Correlation Analysis
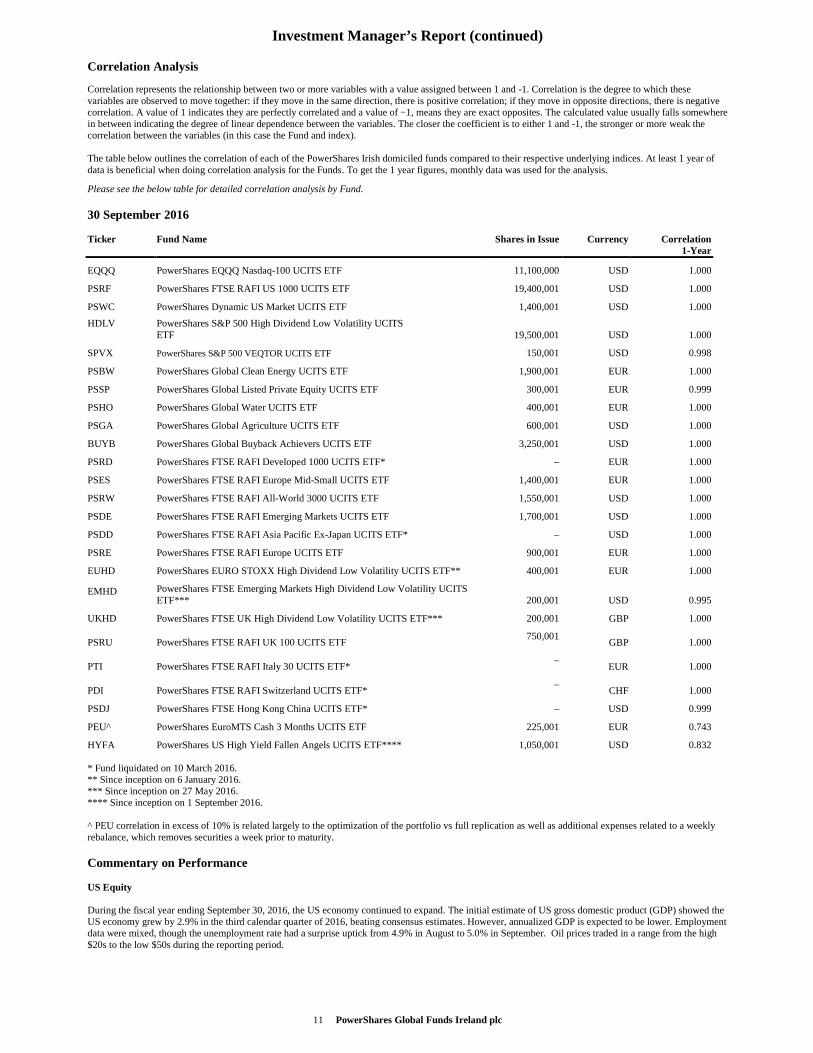
Correlation represents the relationship between two or more variables with a value assigned between 1 and -1. Correlation is the degree to which these variables are observed to move together: if they move in the same direction, there is positive correlation; if they move in opposite directions, there is negative correlation. A value of 1 indicates they are perfectly correlated and a value of −1, means they are exact opposites. The calculated value usually falls somewhere in between indicating the degree of linear dependence between the variables. The closer the coefficient is to either 1 and -1, the stronger or more weak the correlation between the variables (in this case the Fund and index). The table below outlines the correlation of each of the PowerShares Irish domiciled funds compared to their respective underlying indices. At least 1 year of data is beneficial when doing correlation analysis for the Funds. To get the 1 year figures, monthly data was used for the analysis.
Please see the below table for detailed correlation analysis by Fund.
30 September 2016 Ticker
Fund Name
Shares in Issue
Currency
Correlation
1-Year
EQQQ PowerShares EQQQ Nasdaq-100 UCITS ETF 11,100,000 USD 1.000
PSRF PowerShares FTSE RAFI US 1000 UCITS ETF 19,400,001 USD 1.000 PSWC PowerShares Dynamic US Market UCITS ETF 1,400,001 USD 1.000 HDLV PowerShares S&P 500 High Dividend Low Volatility UCITS
ETF 19,500,001 USD 1.000 SPVX PowerShares S&P 500 VEQTOR UCITS ETF 150,001 USD 0.998 PSBW PowerShares Global Clean Energy UCITS ETF 1,900,001 EUR 1.000 PSSP PowerShares Global Listed Private Equity UCITS ETF 300,001 EUR 0.999 PSHO PowerShares Global Water UCITS ETF 400,001 EUR 1.000 PSGA PowerShares Global Agriculture UCITS ETF 600,001 USD 1.000 BUYB PowerShares Global Buyback Achievers UCITS ETF 3,250,001 USD 1.000 PSRD PowerShares FTSE RAFI Developed 1000 UCITS ETF* – EUR 1.000 PSES PowerShares FTSE RAFI Europe Mid-Small UCITS ETF 1,400,001 EUR 1.000 PSRW PowerShares FTSE RAFI All-World 3000 UCITS ETF 1,550,001 USD 1.000 PSDE PowerShares FTSE RAFI Emerging Markets UCITS ETF 1,700,001 USD 1.000 PSDD PowerShares FTSE RAFI Asia Pacific Ex-Japan UCITS ETF* – USD 1.000 PSRE PowerShares FTSE RAFI Europe UCITS ETF 900,001 EUR 1.000 EUHD PowerShares EURO STOXX High Dividend Low Volatility UCITS ETF** 400,001 EUR 1.000 EMHD PowerShares FTSE Emerging Markets High Dividend Low Volatility UCITS
ETF*** 200,001
USD 0.995 UKHD PowerShares FTSE UK High Dividend Low Volatility UCITS ETF*** 200,001 GBP 1.000
PSRU PowerShares FTSE RAFI UK 100 UCITS ETF 750,001
GBP 1.000
PTI PowerShares FTSE RAFI Italy 30 UCITS ETF* –
EUR 1.000
PDI PowerShares FTSE RAFI Switzerland UCITS ETF* –
CHF 1.000 PSDJ PowerShares FTSE Hong Kong China UCITS ETF* – USD 0.999
PEU^ PowerShares EuroMTS Cash 3 Months UCITS ETF 225,001 EUR 0.743 HYFA PowerShares US High Yield Fallen Angels UCITS ETF**** 1,050,001 USD 0.832 * Fund liquidated on 10 March 2016. ** Since inception on 6 January 2016. *** Since inception on 27 May 2016. **** Since inception on 1 September 2016. ^ PEU correlation in excess of 10% is related largely to the optimization of the portfolio vs full replication as well as additional expenses related to a weekly rebalance, which removes securities a week prior to maturity.
Commentary on Performance US Equity During the fiscal year ending September 30, 2016, the US economy continued to expand. The initial estimate of US gross domestic product (GDP) showed the US economy grew by 2.9% in the third calendar quarter of 2016, beating consensus estimates.
However, annualized GDP is expected to be lower. Employment
data were mixed, though the unemployment rate had a surprise uptick from 4.9% in August to 5.0% in September. Oil prices traded in a range from the high $20s to the low $50s during the reporting period.
12 PowerShares Global Funds Ireland plc
Investment Manager’s Report (continued)
Commentary on Performance (continued) US Equity (continued) The US Federal Reserve (the Fed) raised interest rates in December 2015 — its first increase since 2006 — but that was its only increase during the reporting period. Major US stock market indexes posted gains for the reporting period, but they were fairly volatile. Stocks began calendar year 2016 on a negative note, driven by investor concerns about economic weakness in China, falling oil prices and uncertainty over Fed policy, including rumors of possible negative interest rates in the US. Markets recovered in late February and posted gains until June when UK voters opted to leave the European Union, sending markets sharply lower once again. Markets again recovered, and major US equity indexes hit record highs during the summer.
In this environment, investors generally
favored the perceived safety of government bonds and more defensive, dividend-paying equities often found in the telecommunication services, utilities and consumer staples sectors. Global Equity The global economy continued to expand, albeit slowly, for the fiscal year ended September 30, 2016. However, that growth became increasingly uneven across developed and emerging economies, amid continued volatility in oil prices and as the policies of central banks globally began to diverge. Equity market rallies in October and November 2015 were offset by negative performance in December, as a late-year crash in oil prices rattled the markets. Also in December, the US Federal Reserve (the Fed) followed through on its commitment to normalize monetary policy by raising interest rates — its first increase since 2006 — even as the European Central Bank extended its asset purchase program and Japan introduced additional quantitative easing and negative interest rates. Stocks began calendar year 2016 on a negative note, driven by investor concerns about economic weakness in China and falling oil prices. Markets recovered in late February and posted gains amid concerted central bank commitments to very loose monetary policy. As a result, the US dollar fell sharply against the euro and Japanese yen, a development that was largely supportive of oil and stock prices. All major global stock indexes experienced steep declines again in June after UK voters opted to leave the European Union — resulting in a sharp stock-market sell-off. Stocks in economically sensitive sectors, including energy and financials, were hardest hit, and investors flocked to the perceived safety of US Treasuries and more defensive, dividend-paying equities often found in the telecommunication services, utilities and consumer staples sectors. After the initial shock of the UK vote, stocks made a strong recovery, regaining most of their losses as fears of a shock to consumer confidence never materialized. For the remainder of the reporting period, emerging markets outperformed as the Fed left interest rates unchanged and expectations for an interest rate increase were delayed again. Commodity Market For the fiscal year ending September 30, 2016, commodity markets endured significant volatility and increased dispersion between underlying sectors. The commodities broad based indices, as a whole, were down on the year, except for the Deutsche Bank OY Diversified Index which was up 0.11%, versus -2.6% for the Bloomberg Commodity Index and -12.2% for the energy focused S&P Goldman Sachs Commodity Index. Crude Oil prices plummeted in December 2015 and January 2016 as global stockpiles surged. Energy prices bottomed out in February 2016, however, despite a rebound in the second half of the fiscal year, the energy sector was still down -18.4%. The Industrial metals sector returned 4.0%, driven entirely by Zinc prices surging 37.8% due to mine shutdowns curtailing supply and an increase in global demand, thus moving the market further into deficit. Finally, the best performing commodity constituent was Sugar, which was up 71.2% due to adverse weather in Thailand, India and Brazil. The collapse of an output agreement ahead of the December, 2015 OPEC meeting sent crude prices towards $40 a barrel in early 20016, as concerns that forced cuts could be ineffectual in the face of non-OPEC supply growth. Low prices in Q1 2016 curbed supply growth in the US and disruptions in Nigeria, Iran and Libya started to moderate the global overhangs. Gasoline and Heating Oil returns followed crude throughout the fiscal year. Natural Gas lagged the rest of the energy complex due to an unusually warm winter (2015/2016), which left inventories elevated going into the summer injection season. The fiscal year was a mixed bag of improved economic data from the US and Emerging markets; uncertainty about whether the UK electorate would vote to leave the EU and, upon affirming the protest vote, how the UK would leave the EU in an orderly fashion; worsening economic conditions in Europe and concerns about China maintaining the high levels of Economic growth. Despite USD strength, Gold managed to rally 17.3% due to uncertainty surrounding the UK’s vote to leave the EU and the increasing likelihood that Donald Trump could become the 45th President of the United States. Fixed Income The fiscal year began amid heightened global financial market volatility triggered by a significant summer sell-off in Chinese equities caused by economic growth concerns and uncertainty over the country’s monetary and fiscal policy response. The 10-year US Treasury yield mirrored this volatility as lower oil prices began to threaten the solvency of several US energy companies. In January 2016, the confluence of these factors produced a “perfect storm” that roiled global financial markets. This caused Treasury prices to rise as Treasury bonds played their traditional role of buffering risk-asset volatility such as that of equities. Riskier asset classes posted significant losses. The US Federal Reserve (the Fed) went ahead with its first interest rate hike in nearly a decade in December 2015, lifting the federal funds rate, the rate that banks lend to each other overnight, from a range of zero to 0.25% to a range of 0.25% to 0.50%. Realizing the systemic risks from the fallout of financial markets and the subsequent financial tightening which could significantly hamper economic growth and overall economic health, global central banks quickly acted to provide liquidity and more accommodative monetary policy measures to help spur growth. The Bank of Japan (BOJ) and the European Central Bank (ECB) adopted negative interest rates in an attempt to stimulate growth by forcing investors to spend rather than save. These actions along with the stabilization in oil prices, calmed markets and induced a significant rally across most risk assets. This rally more than offset the losses posted at the beginning of the year and carried through to the end of the reporting period. Geopolitics, including the decision by UK voters to leave the European Union, did its part to reignite volatility. However, it was short-lived as central banks remained committed to keeping financial markets functioning and to promote economic growth. This had the effect of driving the 10-year US Treasury yield to an all-time low of 1.37%. For the reporting period, the broader bond market posted gains largely attributable to the decline in US Treasury yields and global government bond yields. All fixed income sectors (Treasuries, global government bonds, corporate, and securitized) posted positive returns for the fiscal year. Riskier fixed income sectors, such as high yield and emerging market (EM) debt, notched strong gains despite concerns over global growth, volatile commodity prices and the possibility of Fed interest rate hikes. Invesco PowerShares Capital Management LLC
5 January 2017
13 PowerShares Global Funds Ireland plc
Directors’ Report for the financial year ended 30 September 2016
The Directors submit their annual report together with the audited financial statements for the financial year ended 30 September 2016.
Statement of Directors’ Responsibilities The Directors are responsible for preparing the Directors’ Report and the financial statements in accordance with Irish law.
Irish company law requires the Directors to prepare financial statements for each financial period which give a true and fair view of the state of affairs of the Company and of the profit or loss of the Company for that period. In preparing those financial statements, the Directors are required to:
• select suitable accounting policies and then apply them consistently; • make judgements and estimates that are reasonable and prudent; • state whether the financial statements have been prepared in accordance with the applicable accounting standards and identify the standards in
question, subject to any material departures from those standards being disclosed and explained in the notes to the financial statements; and • prepare the financial statements on a going concern basis unless it is inappropriate to presume that the Company will continue in business.
The Directors are responsible for preparing the Directors’ report and the financial statements in accordance with Irish law and accounting standards issued by the Financial Reporting Council and promulgated by the Institute of Chartered Accountants in Ireland, including FRS102 “The Financial Reporting Standards applicable in the UK and Republic of Ireland” (Generally Accepted Accounting Principles in Ireland). The Directors confirm that they have complied with the above requirements in preparing the financial statements in accordance with applicable Irish Law and generally accepted accounting principles in Ireland.
The Directors confirm that an audit committee is established that meets the requirements of section 167 of the Companies Act 2014.
The Directors also confirm that, in accordance with the provisions of the 2014 UK Code of Corporate Governance (“UK Code”), the annual report together with the audited financial statements for the financial year ended 30 September 2016 (“annual financial report”), taken as a whole, is fair, balanced and understandable and provides the information necessary for shareholders to assess the performance, business model and strategy of the Company.
The Company’s business activities, together with the factors likely to affect its future development, performance and position are set out in the Investment Manager's Report. The financial position of the Company is described in the financial statements on pages 136 to 168. In addition, the Investment Manager's Report sets out the objectives of each Fund and the outlook for the Funds. The Company has considerable assets under management with minimal to moderate levels of tracking error. As a consequence, the Directors believe that the Company is well placed to manage its business successfully.
The Directors have a reasonable expectation that the Company has adequate resources to continue in operational existence for the foreseeable future. Thus they continue to adopt the going concern basis of accounting in preparing the annual financial statements.
The Directors are responsible for keeping adequate accounting records that are sufficient to: • correctly record and explain the transactions of the company; • enable, at any time, the assets, liabilities, financial position and profit or loss of the company to be determined with reasonable accuracy; and • enable the directors to ensure that the financial statements comply with the Companies Act 2014 and enable those financial statements to be
audited. The Directors believe that they have complied with the requirements of Section 281 to 285 of the Companies Act 2014 with regard to accounting records by engaging the services of an Administrator employing personnel with appropriate expertise and adequate resources to provide the Company’s finance function. The Directors are also responsible for safeguarding the assets of the company and hence for taking reasonable steps for the prevention and detection of fraud and other irregularities. The Directors acknowledge that they are responsible for securing the Company’s compliance with the relevant obligations as set out in Section 225 of the Act. The Directors confirm that:
1) A compliance policy document has been drawn up that sets out policies, that in our opinion are appropriate to the Company, respecting compliance by the Company with its relevant obligations;
2) appropriate arrangements or structures are in place that are, in our opinion, designed to secure material compliance with the Company's relevant obligations, and;
3) during the financial year, the arrangements or structures referred to in (2) have been reviewed.
The Directors believe that they have complied with the requirements of Section 330 of the Companies Act 2014 as follows:
• so far as the Directors are aware, there is no relevant audit information of which the Company’s statutory auditors are unaware, and • the Directors have taken all the steps that they ought to have taken as directors in order to make himself or herself aware of any relevant audit
information and to establish that the Company’s statutory auditors are aware of that information. The Company has appointed Invesco Global Asset Management DAC (“the Manager”) as manager of the Company who has, in turn delegated certain duties to the Investment Manager, Invesco PowerShares Capital Management LLC (the “Investment Manager”) and the Administrator, BNY Mellon Fund Services (Ireland) Designated Activity Company (the “Administrator”). The Company has appointed BNY Mellon Trust Company (Ireland) Limited (the “Depositary”) to act as Depositary of the Company’s assets.
The measures taken by the Directors to secure compliance with the Company’s obligations to keep proper accounting records include the use of appropriate systems and procedures and the employment of competent persons. The accounting records are retained at the office of the Administrator at Guild House, Guild Street, International Financial Services Centre, Dublin 1.
Going Concern and Viability Statement The Directors have assessed the viability of the Company over a five year period to 30 September 2021, taking account of the Company’s current position and the potential impact of the principal risks documented in note 14 of the Financial Statements. This assessment has considered the potential impacts of these risks on the business model, future performance, solvency and liquidity over the period. The Company is a collective investment scheme rather than a commercial business venture and is designed and managed for long term investment. Long term for this purpose is considered to be at least five years and so the Directors have assessed the Company’s viability over that period. The Directors consider five years to be an appropriate period to review as they do not expect there to be any significant change in the Company's current principal risks and adequacy of the mitigating controls during that period. Also, the Directors do not envisage any change in strategy or objectives or any events that would prevent the Company from continuing to operate over that period as the Company's assets are sufficiently liquid and the Company intends to continue to operate as an investment company.
14 PowerShares Global Funds Ireland plc
Directors’ Report for the financial year ended 30 September 2016 (continued)
Going Concern and Viability Statement (continued) In making this statement the Directors have considered the resilience of the Company, taking account of its current position, the principal risks facing the business in severe but reasonable scenarios, and the effectiveness of any mitigating actions. A substantial financial crisis affecting the global economy could have an impact on this assessment. The Directors have determined that the five year period to 30 September 2020 is an appropriate period over which to provide its viability statement. Based on this assessment, the Directors have a reasonable expectation that the Company will be able to continue in operation and meet its liabilities as they fall due over the period to 30 September 2020.
Corporate Governance Statement
General Principles and Compliance Responsibility for good governance lies with the Board. The governance framework of the Company reflects the fact that, as a collective investment scheme, it has no employees and outsources investment management and administration. The Board is committed to maintaining the highest standards of corporate governance and is accountable to shareholders for the governance of the Company’s affairs. The Company fully complies with the voluntary Corporate Governance Code for Irish Collective Investment Schemes, issued by Irish Funds (the “IF Code”). The IF Code is available at www.irishfunds.ie.
The UK Listing Authority’s Disclosure and Transparency Rules require companies with a premium listing in the UK to disclose how they have applied the principles and complied with the UK Code. The UK Code is available at www.frc.org.uk.
The Company has complied with the relevant provisions of the UK Code, except those set out below:
(i) the role of the chief executive; (ii) the nomination of a senior independent director, (iii) executive directors’ remuneration; (iv) the establishment of a nomination committee; (v) the establishment of a remuneration committee; (vi) the appointment of at least three independent non-executive directors on the Audit Committee; (vii) the appointment of a majority of independent non-executive directors on the Board; (viii) the appointment of an independent non-executive director as Chairman; and; (ix) the establishment of an internal audit function.
The Board does not consider these provisions relevant to the Company, being an externally managed investment company without any employees and, in relation to (ix) above, in view of the Manager having an internal audit function.
Composition of the Board and Succession Planning The IF and UK Code recommendations differ with respect to the composition of the Board. The UK Code requires that a majority of the Board be independent non-executive directors, one of whom should be the Chairman. The IF Code requires a majority of the Board to be non-executive directors, at least one of whom should be an independent non-executive director. The IF Code does not require the Chairman to be independent. As the IF Code has been tailored specifically for collective investment schemes, the Board has resolved to follow the IF Code in this regard. The Board comprises seven Directors, all of whom are non-executive, two of whom are considered independent. Three of the Directors are Irish residents (including both Independent Non-executive Directors) and are therefore reasonably available to meet the Central Bank at short notice, if so required. The Directors have a range of relevant financial, operational and investment management skills and experience relevant to the direction and control of the Company. Details of the Directors’ skills and experience can be found in their individual biographies on pages 17 to 18.
Leslie Schmidt has acted as the Company’s Chairman since her appointment to the Board on 18 November 2011. Whilst she is not considered an independent director, by virtue of the fact that she is an employee of Invesco, she has demonstrated the ability to make objective decisions. The Board considers that Ms Schmidt leads the Board well, ensuring that critical discussions take place and third parties are challenged effectively and appropriately. She also promotes effective communication between members of the Board. It is for these reasons that the Company has resolved to follow the IF Code rather than the UK Code in relation to whether the Chairman should be an independent non-executive director. The Chairman regularly holds meetings with the independent non- executive directors without the other non-executive directors or management present. Directors’ Independence As it is tailored specifically for collective investment schemes, the Board considers that the independence criteria specified in the IF Code to be appropriate for the purposes of determining the independence of Directors. The Board has considered the independence of William Manahan and Adrian Waters and, in addition to meeting the criteria for independence laid down by the IF Code, is satisfied that the actions of these Directors on behalf of the Company demonstrate that they remain independent.
As an investment company, the relationship between the Board and the Manager is such that the Board does not consider it necessary to nominate a senior independent director, other than the Chairman. All the Directors are available to shareholders if they have concerns when contact through the normal channels of Chairman, Manager or Company Secretary has failed to resolve or for which such contact is inappropriate.
Directors’ Commitment The Board recognises the importance of ensuring that all Directors are able to allocate sufficient time to the Company in order to discharge their responsibilities effectively. As part of the selection and appointment process, potential Directors are provided with an assessment of the time commitment expected (including an estimate of the time required for additional or ad hoc matters) to undertake the requirements of the role. Potential Directors are required to confirm that they have sufficient time to undertake the requirements of the role and to disclose all other significant commitments they have. Once Directors are appointed to the Board, they must disclose any changes to their significant commitments as and when they arise. As part of the 2015 Directors’ Performance Evaluation, Directors confirmed that they continue to have sufficient time to act as Directors of the Company. The significant commitments of the Directors can be found in their individual biographies on pages 17 to 18.
Appointment, Re-election and Tenure of Directors The Board is responsible for reviewing the size, structure and composition of the Board and considering any changes or new appointments.
The Board has formulated a formal, rigorous and transparent procedure for the selection and appointment of any new Director to the Board. The Board may appoint an external search consultancy to identify potential candidates. However, to date the Board has been able to identify the most appropriate candidates to join the Board through its own selection process and has therefore not considered it necessary to appoint an external search consultancy. Appointments to the Board are subject to the approval of the Central Bank of Ireland.
The Directors do not have a formal service contract with the Company. Directors’ terms and conditions of appointment are set out in letters of appointment, which are available for inspection at the registered office of the Company and will be available at the Annual General Meeting (“AGM”).
15 PowerShares Global Funds Ireland plc
Directors’ Report for the financial year ended 30 September 2016 (continued)
Corporate Governance Statement (continued)
Appointment, Re-election and Tenure of Directors (continued) The UK Code requires that each Director shall retire at an AGM at least every three years after appointment or (as the case may be) last reappointment, and may offer him or herself for re-election. Directors who serve on the Board for longer than nine years are subject to annual re-election. Bernhard Langer was appointed to the Board on 5 September 2016 and will therefore seek election at this year’s AGM. Adrian Waters and William Manahan will seek re-election at this year’s AGM. The Board confirms that the performance of Mr Langer, Mr Manahan, and Mr Waters continues to be effective and that each Director demonstrates commitment to their respective roles and recommends that shareholders vote in favour of the resolutions for their election/re-election at the AGM.
Board Changes There has been various changes to the Board since the publication of the annual financial report for the financial year ended 30 September 2015.
In 2016 the Board was pleased to announce the appointment of Bernhard Langer (appointed 5 September 2016) to the Board in order to further enhance the balance of appropriate skills, knowledge and experience on the Board (his biography can be found on page 18).
Sybille Hofmann (appointed in April 2015) resigned as a Director of the Company and Karen Dunn Kelley (appointed in February 2014) retired as a Director of the Company on 24 May 2016 and 5 September 2016 respectively. As Directors they made invaluable contributions during their service.
Board Diversity The Board considers that diversity in its membership is beneficial and therefore seeks to ensure that the Board’s size, structure and composition, including skills, knowledge, experience and diversity (including gender), is sufficient for the effective direction and control of the Company. However, as the Board is committed to appointing the most appropriate candidates as Directors of the Company, it has not set any measurable objectives in respect of this policy. The Board comprises six non-executive directors of whom two are women, thereby constituting 33.3% female representation.
Chief Executive The Company is an externally managed investment company without any employees. Therefore, the Board does not consider it appropriate to appoint a Chief Executive.
The Secretary The Board has direct access to the advice and services of the Company Secretary, Invesco Asset Management Limited, which is responsible for ensuring that the Board and Committee procedures are followed and compliant with applicable rules and regulations. The Company Secretary is also responsible to the Board for ensuring timely delivery of information and reports and that the statutory obligations of the Company are met. Additionally, the Company Secretary is responsible for advising the Board through the Chairman on all governance matters.
Annual General Meeting (AGM) The Notice of the AGM of the Company, which is to be held in March 2017, will be sent to shareholders in due course. The Board urges all shareholders to vote in favour of these resolutions by returning their completed voting papers. The following summarises the current business of the forthcoming AGM of the Company:
Ordinary Resolutions Resolution 1 is for shareholders to receive this Annual Financial Report; Resolution 2 is to re-appoint the auditors and to authorise the Directors to determine the auditors’ remuneration. PricewaterhouseCoopers has expressed willingness to continue to hold office until the conclusion of the next annual general meeting of the Company; Resolution 3 is to re-elect William Manahan a Director of the Company; Resolution 4 is to re-elect Adrian Waters a Director of the Company. Resolution 5 is to elect Bernhard Langer as a Director of the Company. More detail in relation to each resolution (including any further business that may be approved by the Board for shareholder consideration at the AGM) will be included in the Notice of the AGM.
Directors’ Remuneration The Board as a whole reviews Directors’ remuneration, having agreed that a separate remuneration committee is not appropriate for a Company of this size and nature. The Company does not have any executive directors, therefore, the provisions of the UK Code relating to executive directors’ remuneration are not applicable. The Directors seek advice from the Secretary, when considering the level of Directors’ fees. The Board’s policy is that the remuneration of Independent Non-Executive Directors should be fair and reasonable in relation to the time commitment and responsibilities of the Directors. The amount of Directors’ fees paid during the financial year ended 30 September 2016 can be found in Note 12 to the financial statements.
Conflicts of Interest A Director must avoid a situation where he or she has an interest that conflicts with the Company’s interests. In any matter for consideration before the Board where a Director believes that a conflict may arise affecting him or her, the n unless otherwise generally agreed in accordance with the provisions of the Companies Act 2014, he or she shall disclose such conflict to the Board before the issue is considered by the Board. The Directors have the authority to authorise potential conflicts of interest. Firstly, only Directors who have no interest in the matter being considered are able to take the relevant decision, and secondly, in taking the decision the Directors must act in a way they consider, in good faith, will be most likely to promote the Company’s success.
The Directors have declared any potential conflicts of interest to the Company.
Directors’ Development Prior to his or her appointment each new Director is fully briefed as to his or her responsibilities and is continually updated throughout his or her office on industry and regulatory matters. The Manager and Board have a programme of induction training for newly appointed Directors. They have also put arrangements in place to address the ongoing development requirements of Directors, which includes regular briefings from, amongst others, key members of the Manager’s staff, auditors, investment strategists, trustees and legal advisors regarding any proposed product developments or changes in laws or regulations that could affect the Company.
16 PowerShares Global Funds Ireland plc
Directors’ Report for the financial year ended 30 September 2016 (continued)
Corporate Governance Statement (continued)
Board and Directors’ Performance Evaluation Both the IF and UK Codes require the Board to undertake a review of the overall performance of the Board and that of individual Directors annually with a formal documented review taking place at least once every three years. The Board carried out its first documented formal review in September 2014. In 2015, the Board carried out an informal review by way of one to one discussions between the Chairman and each individual Director. A review of the performance of the Chairman was undertaken by Adrian Waters, who is an Independent Non-Executive Director.
The findings indicated that the Directors individually, and the Board as a whole, continued to function efficiently, that the composition of the Board is appropriately aligned to the Company’s activities and that the Directors are able to effectively discharge their responsibilities to the Company and its Shareholders.
Board Responsibilities The Board is responsible for the Company’s overall direction and strategy and to this end it reserves the decision making power on issues such as the determination of medium and long term goals, reviewing managerial performance, organisational structure and capital needs and commitments to achieve the Company’s strategic goals. To achieve these responsibilities, the Board meets at least quarterly to review the operations of the Company, address matters of strategic importance and to receive reports from the Manager, the Administrator and the Custodian. However, a Director or the Secretary may, on the requisition of a Director, at any time summon a meeting of the Directors. Additional ad hoc meetings are convened as required. The Board is supplied with information in a timely manner and in a form and of a quality appropriate to enable it to discharge its duties.
The Board also approves the Prospectus, circulars to shareholders, listing particulars and other relevant legal documentation. A formal schedule of matters specifically reserved for decision by the Board has been defined. The Directors also have access to the advice and services of the Secretary, external counsel and the resources of the Investment Manager should they be needed. Where necessary, in the furtherance of their duties, the Board and individual Directors may seek independent professional advice at the expense of the Company. Any Director who resigns their position is obliged, if appropriate to confirm to the Board and the Central Bank of Ireland that the resignation is not connected with any issues with or claims against the Company. Furthermore, any Director who has concerns about the running of the Company or a proposed course of action may provide a written statement to the Chairman outlining his concerns for circulation to the Board or alternatively may have his concerns formally recorded in the minutes of a Board meeting.
Decisions arising at any meeting of the Directors are determined by a majority of votes. In the case of an equality of votes, the Chairman has a second or casting vote. The quorum necessary for the transaction of business at a meeting of the Directors is two.
The Company has maintained appropriate Directors’ and officers’ liability insurance cover throughout the financial year.
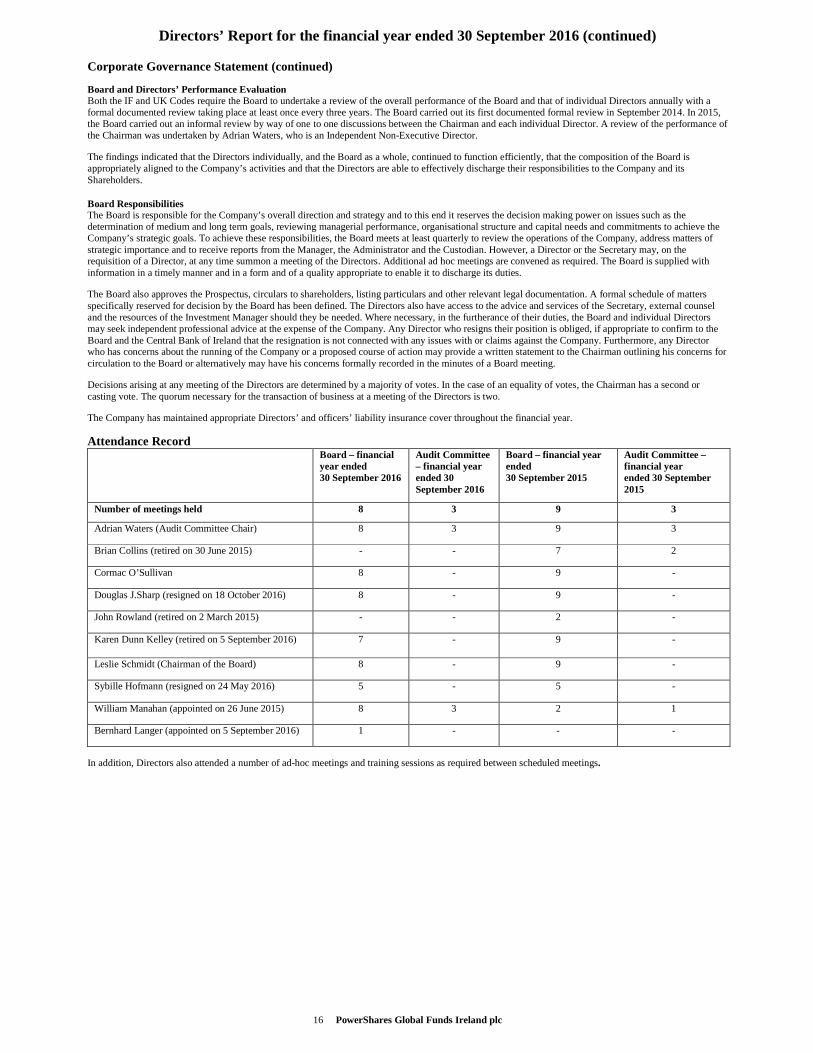
Attendance Record Board – financial year ended 30 September 2016
Audit Committee – financial year ended 30 September 2016
Board – financial year ended 30 September 2015
Audit Committee – financial year ended 30 September 2015
Number of meetings held 8 3 9 3
Adrian Waters (Audit Committee Chair) 8 3 9 3
Brian Collins (retired on 30 June 2015) - - 7 2
Cormac O’Sullivan 8 - 9 -
Douglas J.Sharp (resigned on 18 October 2016) 8 - 9 -
John Rowland (retired on 2 March 2015) - - 2 -
Karen Dunn Kelley (retired on 5 September 2016) 7 - 9 -
Leslie Schmidt (Chairman of the Board) 8 - 9 -
Sybille Hofmann (resigned on 24 May 2016) 5 - 5 -
William Manahan (appointed on 26 June 2015) 8 3 2 1
Bernhard Langer (appointed on 5 September 2016) 1 - - -
In addition, Directors also attended a number of ad-hoc meetings and training sessions as required between scheduled meetings.
17 PowerShares Global Funds Ireland plc
Directors’ Report for the financial year ended 30 September 2016 (continued)
Corporate Governance Statement (continued)
Directors’ Biographies Adrian Waters – Independent Non-Executive Director / Chairman of the Audit Committee
Mr. Adrian Waters (Irish) resident in Ireland, is a Fellow of The Institute of Chartered Accountants in Ireland and of The Institute of Directors. He is a Chartered Director (UK Institute of Directors) and he specialises in risk management and governance. He has over 25 years’ experience in the funds industry. He is a director of several other investment funds. From 1993 to 2001, he held various executive positions within The BISYS Group, Inc. (now part of the Citi Group), including Chief Executive Officer of BISYS Fund Services (Ireland) Limited and finally as Senior Vice President – Europe for BISYS Investment Services out of London. From 1989 to 1993, he was employed by the Investment Services Group of PricewaterhouseCoopers in New York and prior to that by Oliver Freaney and Company, Chartered Accountants, in Dublin. Mr. Waters holds a Bachelor of Commerce degree and a Post Graduate Diploma in Corporate Governance both received from University College Dublin in 1985 and 2005, respectively. Additionally, in 2013, he has received a Master of Science degree in Risk Management from the Stern Business School at New York University. Mr. Waters was appointed to the Board with effective date 8 August 2007. Cormac O’Sullivan – Non-Executive Director
Cormac O’Sullivan (Irish) is Head of the Program Management Office (Europe), part of a global group, which provides project management consultancy and support across the Invesco organisation. Mr. O’Sullivan joined Invesco in 2000 and has served in various management roles and capacities. In 2010 he was appointed Head of the Dublin Office with responsibility for the effective oversight and coordination of risk, controls and communications of that office. He is a member of the EMEA Operations Management Group. Mr. O’Sullivan is a Director of Invesco Global Asset Management Limited, an Irish management company. He is also a Director of a number of Invesco promoted funds. Prior to joining Invesco in 2000, Mr. O’Sullivan worked with the Bank of Ireland in a number of progressive roles within their information technology division. Mr. O’Sullivan is a member of the Institute of Bankers in Ireland.
Mr. O’Sullivan was appointed to the Board with effective date 18 November 2011.
Douglas J. Sharp – Non-Executive Director
Douglas J. Sharp (Canadian) is the head of EMEA Retail for Invesco. In this role, he leads the retail business across the UK, Continental Europe and the Middle East, including direct responsibility for sales, marketing and product development efforts. Mr. Sharp is also responsible for the Exchange-Traded Fund business across EMEA. Prior to this role, he served as the head of Cross-border Retail, and was also the head of Strategy and Business Planning for Invesco. Mr. Sharp joined Invesco from the strategy consulting firm McKinsey & Co. where he served clients in the financial services, energy and logistics sectors. Mr. Sharp earned an MBA from the Tuck School of Business at Dartmouth College, a master’s degree in accounting from Georgia State University, and a BA in economics from McGill University.
Mr. Sharp was appointed to the Board with effective date 16 May 2013 and resigned on 18 October 2016.
Karen Dunn Kelley – Non-Executive Director
Karen Dunn Kelley (American) is a senior managing director of Investments. She is responsible for Invesco’s fundamental equities business, global asset allocation, quantitative strategies, global equities investment teams, equity trading and investment administration. She also leads the Office of Investments at Invesco.
She is also co-chair of the Investors’ Forum, a member of Invesco’s Worldwide Institutional Strategy Committee, president and principal executive officer of Short-Term Investments Trust and AIM Treasurer’s Series Trust (Invesco Treasurer’s Series Trust). Additionally, she serves on the boards for the Short-Term Investments Company (Global Series) plc, Invesco Global Management Co. Ltd and Invesco Mortgage Capital Inc.
Ms. Dunn Kelley joined Invesco in 1989 as a money market portfolio manager, and in 1992, she was named chief money market and government officer. In April 2007, she was named chief executive officer of Invesco’s newly combined fixed income and cash management teams. Ms. Dunn Kelley began her career at Drexel Burnham Lambert in 1982 on the Fixed Income High Grade Retail Desk, and in 1986, she joined Federated Investors (Pittsburgh) in the Fixed Income Division.
Ms. Dunn Kelley graduated magna cum laude with a B.S. from the Villanova University College of Commerce and Finance. She is a member of the Women’s Bond Club of New York and a founding member of the Invesco Women’s Network. She is also involved in a number of boards and activities in Pittsburgh.
Ms. Dunn Kelley was appointed to the Board on 17 February 2014 and retired on 5 September 2016.
Leslie Schmidt – Chairman of the Board/ Non-Executive Director
Leslie Schmidt (American), Certificate Public Accountant (CPA), serves as President and CEO of Invesco Trust Company. She is also Senior Vice President of Invesco Advisers, Inc., a U.S. registered investment adviser subsidiary of Invesco Ltd. Since 1992 Ms. Schmidt has served in various roles and capacities with Invesco Ltd. and its various investment advisory and distributor subsidiaries in various locations. She is also a director of a number of Invesco related funds/companies, including Invesco Management S.A, Invesco Global Asset Management Limited and Invesco Trust Company. Prior to joining Invesco, Ms. Schmidt spent seven years with KPMG Peat Marwick in a number of progressive auditing roles primarily in the investment services area. Ms. Schmidt is a Certified Public Accountant and a member of the American Institute of Certified Public Accountants. Ms. Schmidt is chairman of PowerShares Global Funds Ireland plc and has had no changes to any other significant commitments at the financial year ending 30 September 2016.
Ms. Schmidt was appointed to the Board with effective date 18 November 2011.
18 PowerShares Global Funds Ireland plc
Directors’ Report for the financial year ended 30 September 2016 (continued)
Corporate Governance Statement (continued)
Directors’ Biographies (continued) Sybille Hofmann – Non-Executive Director
Sybille Hofmann (German) is responsible for the effective coordination of operational activity supporting the Invesco EMEA Business. She oversees the outsourced Transfer Agency and Fund Accounting as well as general delegation and is also a Director of a number of Invesco promoted funds.
Between July 2012 and February 2015 she led the European Risk function and held a number of other responsibilities within Invesco before, including Chief Administration Officer for “Administration”, Risk Management roles for Operations & Technology and Non-North-America and Chief Operations & Services Officer at Invesco Continental Europe.
Prior to joining Invesco in 2003, Dr. Hofmann spent twelve years working in a variety of roles at Deutsche Bank in Frankfurt and London. She studied Mathematics and Physics at the University of Bayreuth (Germany), where she completed her Doctorate in Mathematics. Sybille also holds an MBA from Henley Management College (UK).
Sybille Hofmann was appointed to the Board in April 2015 and resigned on 24 May 2016.
William Manahan – Independent Non-Executive Director
William Manahan (Irish) has spent over thirty years in Asset Management and Asset Servicing as a Sales and Services Manager for Bank of Ireland Asset Management and was a founding Director of Bank of Ireland Securities Services.
As CEO of Bank of Ireland Securities Services he set strategic direction for the business, agreed and delivered on specific goals and increased profitability on an annual basis. More recently he has acted as a Risk Advisor to the Central Bank of Ireland.
Mr. Manahan is a past council member of the Irish Funds Industry Association and past Chairman of the association through 2006-2007. He currently acts as an Independent Non-Executive Director to Fund companies.
William Manahan was appointed to the Board with effective date 26 June 2015.
Bernhard Langer – Non-Executive Director
Bernhard Langer (German) is Chief Investment Officer (CIO) for the Invesco Quantitative Strategies team. Mr. Langer was named CIO for Invesco Quantitative Strategies in January 2009 and is responsible for the quantitative equities investment approach, related products and clients. He oversees more than 40 investment professionals worldwide, with team members in New York, Boston, Frankfurt, Melbourne and Tokyo. Mr. Langer began his investment career in 1989 with Bayerische Vereinsbank, moving to their asset management function where he led the strategy team from 1992 until his departure. He joined Invesco in 1994 as a portfolio manager for equities and became head of equities in 1996 and CIO for Germany in 2000. In 2002, he assumed responsibility for the Quantitative Strategies Group (International).
Mr. Langer earned an MBA with a focus on economics and banking from the University of Munich. He is also a CFA charterholder.
Bernhard Langer was appointed to the Board with effective date 5 September 2016.
19 PowerShares Global Funds Ireland plc
Directors’ Report for the financial year ended 30 September 2016 (continued)
Corporate Governance Statement (continued)
Internal Control and Risk Management The Company’s risk assessment and the way in which significant risks are identified and managed is a key area of focus for the Board. The Board has undertaken a robust assessment of the risks to the Company, both in respect of its operations and longer term viability. This assessment took into consideration the controls exercised by the Board and its delegates, the Manager and other service providers. The Board is responsible for ensuring that the Company maintains a sound system of internal control to mitigate risk and safeguard shareholders’ investments and the Company’s assets. The effectiveness of the Company’s system on internal controls, including financial, operational and compliance and risk management systems is reviewed at least annually. The management and administration of the Company is delegated to the Manager, Investment Manager, Administrator and Custodian, all of whom maintain their own systems of internal controls and the Board and Audit Committee receive regular reports from the internal audit, independent risk and compliance teams of these service providers, as required, to enable the effectiveness of the Company’s system of internal controls to be assessed. It is not necessary for the Company to have its own internal audit function because all of the management and administration of the Company is delegated to the Manager, Investment Manager, Administrator and Custodian. The Board recognises that these control systems can only be designed to manage rather than eliminate the risk of failure to achieve fund objectives, and to provide reasonable, but not absolute, assurance against material misstatement or loss, and relies on the operating controls established by the service providers. The Board is also responsible for ensuring that financial information published or used within the business is reliable, and for regularly monitoring compliance with regulations governing the operation of the Company. The Board is assisted in this regard by the Audit Committee and together they review the effectiveness of the internal control systems on an ongoing basis to identify, evaluate and manage the Company’s significant risks. As part of this process, there are procedures designed to capture and evaluate any failings or weaknesses. Should a case be categorised by the Board as significant, procedures exist to ensure that necessary action is taken to remedy the failings. The Board is not aware of any significant failings or weaknesses in internal control arising in the period under review. The Company does not have any employees and therefore it does not have a “Whistleblowing” policy. However, the Manager has a “Whistleblowing” policy under which its staff, in confidence, may raise concerns about possible improprieties in matters of financial reporting or other matters in so far as they may affect the Company. During the financial year ended 30 September 2016, the Board was responsible for the approval of the annual financial statements as set out in the Statement of Directors’ Responsibilities. It is a statutory requirement that the annual financial statements are audited by one or more persons empowered to audit accounts in accordance with the Irish Companies Acts and in this regard the Board, on the Company’s behalf, engages the auditor.
The annual financial statements of the Company are produced by the Administrator, reviewed by the Manager, then presented to the Audit Committee for consideration prior to the Audit Committee's recommendation to the Board. The Audit Committee supports the work of the Board in ensuring that records are correctly maintained to support the production of the annual financial statements. As part of its review procedures the Audit Committee receives presentations from relevant parties including consideration of Irish accounting standards and their impact on the annual financial statements, and presentations and reports on the audit process. The Chairman of the Audit Committee reports directly to the Board and presents the findings of the Audit Committee at the board meeting where the Board is asked to approve the annual financial statements. Once the annual financial statements are approved by the Board of Directors, the annual financial statements are filed with the Central Bank of Ireland, the Irish Stock Exchange and the UK Listing Authority, the German Federal Financial Supervisory Authority (BaFin), the Swiss Financial Market Supervisory authority (FINMA), French Financial Markets Authority (AMF), Italian Commissione Nazionale per le Società la Borsa (CONSOB), and the Netherlands Authority for Financial Markets (AFM).
Shareholder Relations Shareholder relations are given high priority by the Board and the Manager. Direct contact with shareholders is usually through the Manager who then reports back to the Directors and this is normally the main forum through which the Directors develop an understanding of the views of major shareholders. However, the Directors are always available to discuss any concerns or views of shareholders. The Company also communicates to shareholders through the annual and half-yearly financial reports, which aim to provide shareholders with a full understanding of the Company’s activities and its results. This information is supplemented by the daily calculation of the NAV of the Company’s shares, which is published via the London Stock Exchange and daily factsheets and other documentation and news placed on the Company’s website at www.invescopowershares.net. All shareholders are encouraged to attend the AGM to discuss the business tabled and to exercise their voting rights. The Company announces the result of resolutions proposed at general meetings but does not make the full details of voting available on its website. Shareholders wishing to lodge questions in advance of the AGM are invited to do so, either on the reverse of the proxy card, via the Company’s website or in writing to the Company Secretary at the address given on page 5.
Shareholder Meetings and Rights attaching to Shares The convening and conduct of shareholders’ meetings are governed by the Articles of Association of the Company (the “Articles”) and the Irish Companies Acts. Although the Directors may convene an extraordinary general meeting of the Company at any time, the Directors were required to convene the first AGM of the Company within eighteen months of incorporation and each subsequent AGM thereafter must be within fifteen months of the date of the previous AGM provided that an AGM is held once in each year within six months of the financial year end of the Company. Shareholders representing not less than one-tenth of the paid up share capital of the Company may also request the Directors to convene a shareholders’ meeting. At least twenty one clear days’ notice of every AGM and any meeting convened for the passing of a special resolution must be given to shareholders and fourteen days’ notice must be given in the case of any other general meeting, unless the Auditors and all the shareholders of the Company entitled to attend and vote thereat, agree to shorter notice.
Two shareholders present either in person or by proxy constitutes a quorum at a general meeting. The share capital of the Company is divided into different classes of shares and the Irish Companies Acts and the Articles of Association provide that the quorum for a general meeting convened to consider any alteration to the rights attached to any class of shares, is two or more shareholders present in person or by proxy, holding or representing by proxy at least one third of the issued shares of the relevant class.
Every holder of participating shares or non-participating shares present, in person or by proxy, who votes on a show of hands is entitled to one vote. On a poll, every holder of participating shares present, in person or by proxy, is entitled to one vote in respect of each share held by him and every holder of non-participating shares is entitled to one vote in respect of all non-participating shares held by him. At any general meeting, a resolution put to the vote of the meeting is decided on a show of hands unless, before or upon the declaration of the result of the show of hands, a poll is demanded by the chairman of the general meeting, or by at least five shareholders present having the right to vote at such meeting, or any holder or holders of participating shares present, in person or by proxy, representing at least one tenth of the shares in issue having the right to vote at such meeting.
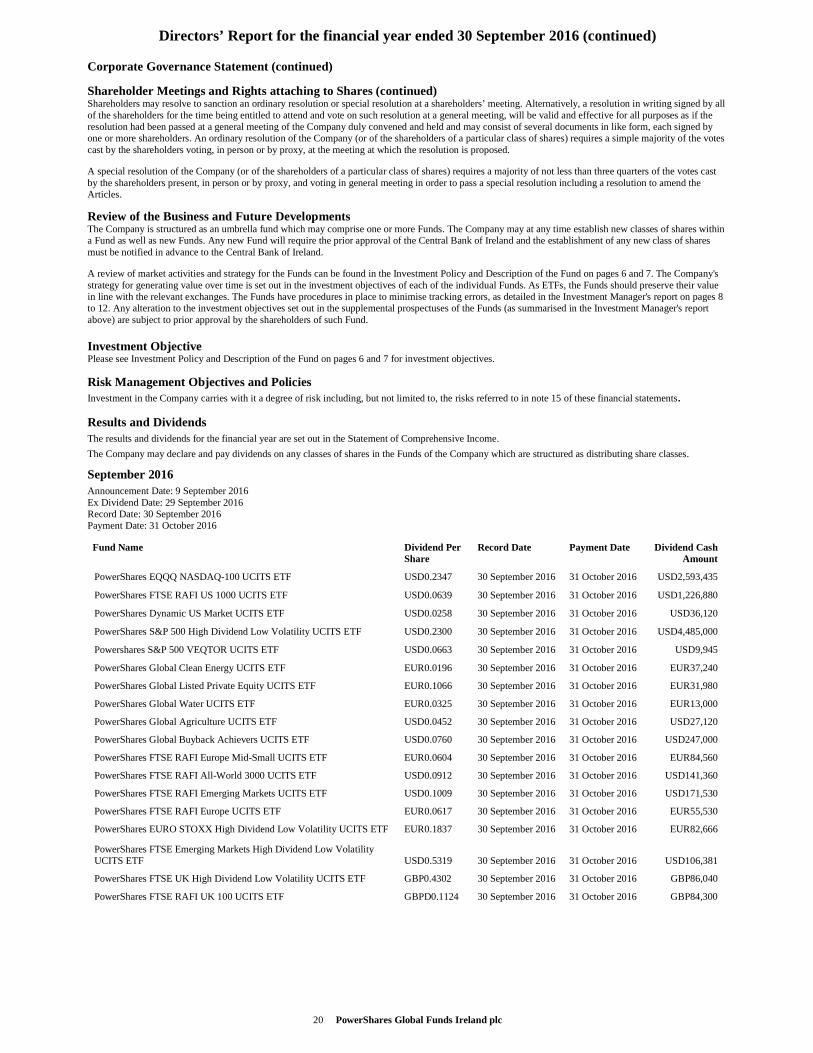
20 PowerShares Global Funds Ireland plc
Directors’ Report for the financial year ended 30 September 2016 (continued)
Corporate Governance Statement (continued)
Shareholder Meetings and Rights attaching to Shares (continued) Shareholders may resolve to sanction an ordinary resolution or special resolution at a shareholders’ meeting. Alternatively, a resolution in writing signed by all of the shareholders for the time being entitled to attend and vote on such resolution at a general meeting, will be valid and effective for all purposes as if the resolution had been passed at a general meeting of the Company duly convened and held and may consist of several documents in like form, each signed by one or more shareholders. An ordinary resolution of the Company (or of the shareholders of a particular class of shares) requires a simple majority of the votes cast by the shareholders voting, in person or by proxy, at the meeting at which the resolution is proposed.
A special resolution of the Company (or of the shareholders of a particular class of shares) requires a majority of not less than three quarters of the votes cast by the shareholders present, in person or by proxy, and voting in general meeting in order to pass a special resolution including a resolution to amend the Articles.
Review of the Business and Future Developments The Company is structured as an umbrella fund which may comprise one or more Funds. The Company may at any time establish new classes of shares within a Fund as well as new Funds. Any new Fund will require the prior approval of the Central Bank of Ireland and the establishment of any new class of shares must be notified in advance to the Central Bank of Ireland.
A review of market activities and strategy for the Funds can be found in the Investment Policy and Description of the Fund on pages 6 and 7. The Company's strategy for generating value over time is set out in the investment objectives of each of the individual Funds. As ETFs, the Funds should preserve their value in line with the relevant exchanges. The Funds have procedures in place to minimise tracking errors, as detailed in the Investment Manager's report on pages 8 to 12. Any alteration to the investment objectives set out in the supplemental prospectuses of the Funds (as summarised in the Investment Manager's report above) are subject to prior approval by the shareholders of such Fund.
Investment Objective Please see Investment Policy and Description of the Fund on pages 6 and 7 for investment objectives.
Risk Management Objectives and Policies Investment in the Company carries with it a degree of risk including, but not limited to, the risks referred to in note 15 of these financial statements.
Results and Dividends The results and dividends for the financial year are set out in the Statement of Comprehensive Income.
The Company may declare and pay dividends on any classes of shares in the Funds of the Company which are structured as distributing share classes.
September 2016 Announcement Date: 9 September 2016 Ex Dividend Date: 29 September 2016 Record Date: 30 September 2016 Payment Date: 31 October 2016
Fund Name Dividend Per Share
Record Date Payment Date Dividend Cash Amount
PowerShares EQQQ NASDAQ-100 UCITS ETF USD0.2347 30 September 2016 31 October 2016 USD2,593,435
PowerShares FTSE RAFI US 1000 UCITS ETF USD0.0639 30 September 2016 31 October 2016 USD1,226,880
PowerShares Dynamic US Market UCITS ETF USD0.0258 30 September 2016 31 October 2016 USD36,120
PowerShares S&P 500 High Dividend Low Volatility UCITS ETF USD0.2300 30 September 2016 31 October 2016 USD4,485,000
Powershares S&P 500 VEQTOR UCITS ETF USD0.0663 30 September 2016 31 October 2016 USD9,945
PowerShares Global Clean Energy UCITS ETF EUR0.0196 30 September 2016 31 October 2016 EUR37,240
PowerShares Global Listed Private Equity UCITS ETF EUR0.1066 30 September 2016 31 October 2016 EUR31,980
PowerShares Global Water UCITS ETF EUR0.0325 30 September 2016 31 October 2016 EUR13,000
PowerShares Global Agriculture UCITS ETF USD0.0452 30 September 2016 31 October 2016 USD27,120
PowerShares Global Buyback Achievers UCITS ETF USD0.0760 30 September 2016 31 October 2016 USD247,000
PowerShares FTSE RAFI Europe Mid-Small UCITS ETF EUR0.0604 30 September 2016 31 October 2016 EUR84,560
PowerShares FTSE RAFI All-World 3000 UCITS ETF USD0.0912 30 September 2016 31 October 2016 USD141,360
PowerShares FTSE RAFI Emerging Markets UCITS ETF USD0.1009 30 September 2016 31 October 2016 USD171,530
PowerShares FTSE RAFI Europe UCITS ETF EUR0.0617 30 September 2016 31 October 2016 EUR55,530
PowerShares EURO STOXX High Dividend Low Volatility UCITS ETF EUR0.1837 30 September 2016 31 October 2016 EUR82,666
PowerShares FTSE Emerging Markets High Dividend Low Volatility UCITS ETF USD0.5319 30 September 2016 31 October 2016 USD106,381
PowerShares FTSE UK High Dividend Low Volatility UCITS ETF GBP0.4302 30 September 2016 31 October 2016 GBP86,040
PowerShares FTSE RAFI UK 100 UCITS ETF GBPD0.1124 30 September 2016 31 October 2016 GBP84,300
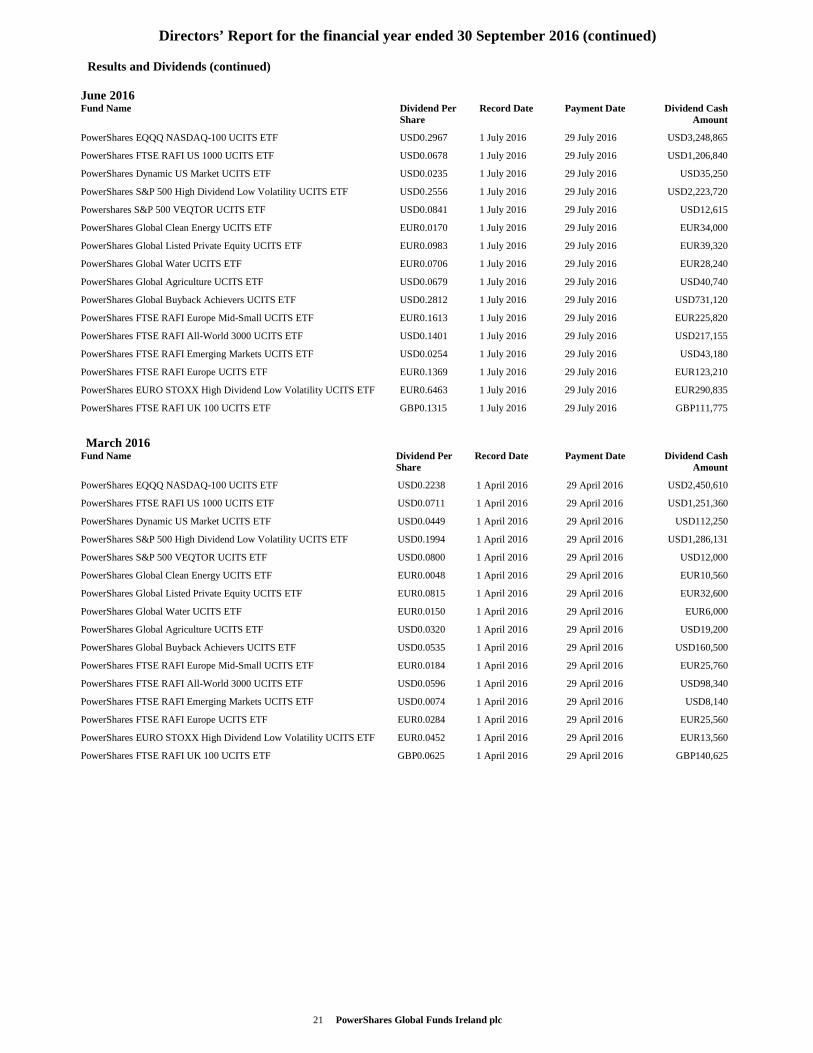
21 PowerShares Global Funds Ireland plc
Directors’ Report for the financial year ended 30 September 2016 (continued)
Results and Dividends (continued) June 2016
Fund Name Dividend Per Share
Record Date Payment Date
Dividend Cash Amount
PowerShares EQQQ NASDAQ-100 UCITS ETF USD0.2967 1 July 2016 29 July 2016 USD3,248,865
PowerShares FTSE RAFI US 1000 UCITS ETF USD0.0678 1 July 2016 29 July 2016 USD1,206,840
PowerShares Dynamic US Market UCITS ETF USD0.0235 1 July 2016 29 July 2016 USD35,250
PowerShares S&P 500 High Dividend Low Volatility UCITS ETF USD0.2556 1 July 2016 29 July 2016 USD2,223,720
Powershares S&P 500 VEQTOR UCITS ETF USD0.0841 1 July 2016 29 July 2016 USD12,615
PowerShares Global Clean Energy UCITS ETF EUR0.0170 1 July 2016 29 July 2016 EUR34,000
PowerShares Global Listed Private Equity UCITS ETF EUR0.0983 1 July 2016 29 July 2016 EUR39,320
PowerShares Global Water UCITS ETF EUR0.0706 1 July 2016 29 July 2016 EUR28,240
PowerShares Global Agriculture UCITS ETF USD0.0679 1 July 2016 29 July 2016 USD40,740
PowerShares Global Buyback Achievers UCITS ETF USD0.2812 1 July 2016 29 July 2016 USD731,120
PowerShares FTSE RAFI Europe Mid-Small UCITS ETF EUR0.1613 1 July 2016 29 July 2016 EUR225,820
PowerShares FTSE RAFI All-World 3000 UCITS ETF USD0.1401 1 July 2016 29 July 2016 USD217,155
PowerShares FTSE RAFI Emerging Markets UCITS ETF USD0.0254 1 July 2016 29 July 2016 USD43,180
PowerShares FTSE RAFI Europe UCITS ETF EUR0.1369 1 July 2016 29 July 2016 EUR123,210
PowerShares EURO STOXX High Dividend Low Volatility UCITS ETF EUR0.6463 1 July 2016 29 July 2016 EUR290,835
PowerShares FTSE RAFI UK 100 UCITS ETF GBP0.1315 1 July 2016 29 July 2016 GBP111,775
March 2016 Fund Name Dividend Per
Share Record Date Payment Date
Dividend Cash
Amount
PowerShares EQQQ NASDAQ-100 UCITS ETF USD0.2238 1 April 2016 29 April 2016 USD2,450,610
PowerShares FTSE RAFI US 1000 UCITS ETF USD0.0711 1 April 2016 29 April 2016 USD1,251,360
PowerShares Dynamic US Market UCITS ETF USD0.0449 1 April 2016 29 April 2016 USD112,250
PowerShares S&P 500 High Dividend Low Volatility UCITS ETF USD0.1994 1 April 2016 29 April 2016 USD1,286,131
PowerShares S&P 500 VEQTOR UCITS ETF USD0.0800 1 April 2016 29 April 2016 USD12,000
PowerShares Global Clean Energy UCITS ETF EUR0.0048 1 April 2016 29 April 2016 EUR10,560
PowerShares Global Listed Private Equity UCITS ETF EUR0.0815 1 April 2016 29 April 2016 EUR32,600
PowerShares Global Water UCITS ETF EUR0.0150 1 April 2016 29 April 2016 EUR6,000
PowerShares Global Agriculture UCITS ETF USD0.0320 1 April 2016 29 April 2016 USD19,200
PowerShares Global Buyback Achievers UCITS ETF USD0.0535 1 April 2016 29 April 2016 USD160,500
PowerShares FTSE RAFI Europe Mid-Small UCITS ETF EUR0.0184 1 April 2016 29 April 2016 EUR25,760
PowerShares FTSE RAFI All-World 3000 UCITS ETF USD0.0596 1 April 2016 29 April 2016 USD98,340
PowerShares FTSE RAFI Emerging Markets UCITS ETF USD0.0074 1 April 2016 29 April 2016 USD8,140
PowerShares FTSE RAFI Europe UCITS ETF EUR0.0284 1 April 2016 29 April 2016 EUR25,560
PowerShares EURO STOXX High Dividend Low Volatility UCITS ETF EUR0.0452 1 April 2016 29 April 2016 EUR13,560
PowerShares FTSE RAFI UK 100 UCITS ETF GBP0.0625 1 April 2016 29 April 2016 GBP140,625
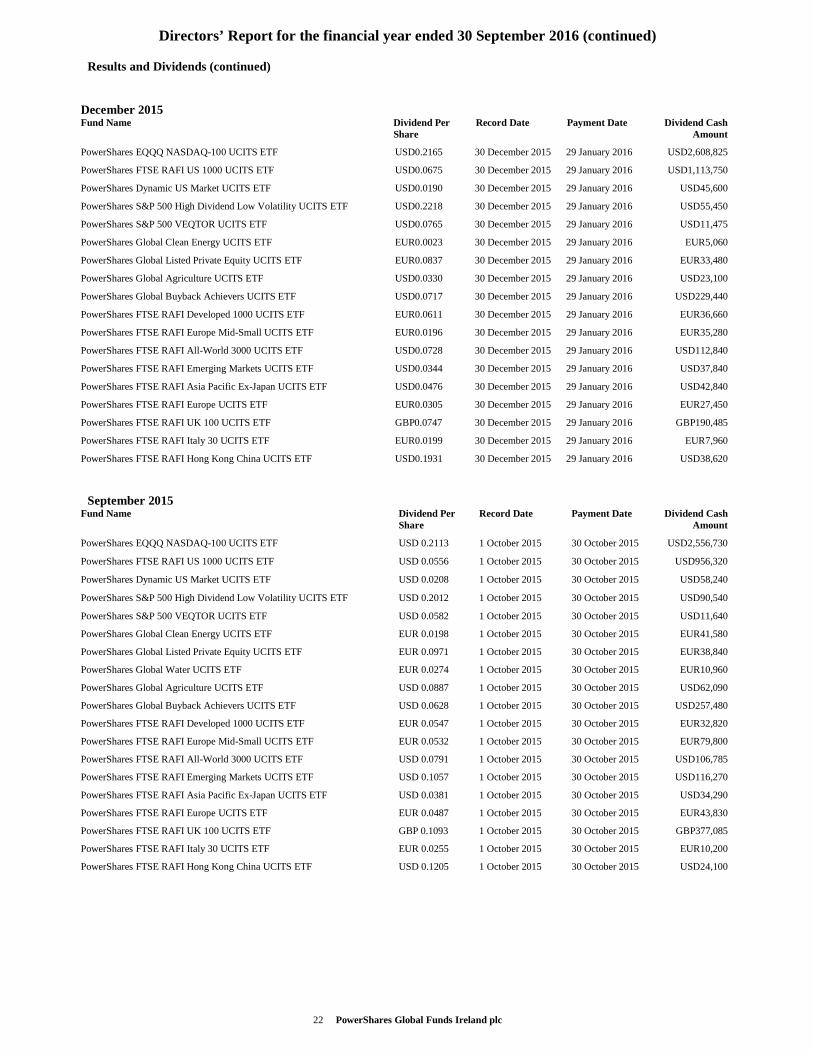
22 PowerShares Global Funds Ireland plc
Directors’ Report for the financial year ended 30 September 2016 (continued)
Results and Dividends (continued)
December 2015 Fund Name Dividend Per
Share Record Date Payment Date
Dividend Cash
Amount
PowerShares EQQQ NASDAQ-100 UCITS ETF USD0.2165 30 December 2015 29 January 2016 USD2,608,825
PowerShares FTSE RAFI US 1000 UCITS ETF USD0.0675 30 December 2015 29 January 2016 USD1,113,750
PowerShares Dynamic US Market UCITS ETF USD0.0190 30 December 2015 29 January 2016 USD45,600
PowerShares S&P 500 High Dividend Low Volatility UCITS ETF USD0.2218 30 December 2015 29 January 2016 USD55,450
PowerShares S&P 500 VEQTOR UCITS ETF USD0.0765 30 December 2015 29 January 2016 USD11,475
PowerShares Global Clean Energy UCITS ETF EUR0.0023 30 December 2015 29 January 2016 EUR5,060
PowerShares Global Listed Private Equity UCITS ETF EUR0.0837 30 December 2015 29 January 2016 EUR33,480
PowerShares Global Agriculture UCITS ETF USD0.0330 30 December 2015 29 January 2016 USD23,100
PowerShares Global Buyback Achievers UCITS ETF USD0.0717 30 December 2015 29 January 2016 USD229,440
PowerShares FTSE RAFI Developed 1000 UCITS ETF EUR0.0611 30 December 2015 29 January 2016 EUR36,660
PowerShares FTSE RAFI Europe Mid-Small UCITS ETF EUR0.0196 30 December 2015 29 January 2016 EUR35,280
PowerShares FTSE RAFI All-World 3000 UCITS ETF USD0.0728 30 December 2015 29 January 2016 USD112,840
PowerShares FTSE RAFI Emerging Markets UCITS ETF USD0.0344 30 December 2015 29 January 2016 USD37,840
PowerShares FTSE RAFI Asia Pacific Ex-Japan UCITS ETF USD0.0476 30 December 2015 29 January 2016 USD42,840
PowerShares FTSE RAFI Europe UCITS ETF EUR0.0305 30 December 2015 29 January 2016 EUR27,450
PowerShares FTSE RAFI UK 100 UCITS ETF GBP0.0747 30 December 2015 29 January 2016 GBP190,485
PowerShares FTSE RAFI Italy 30 UCITS ETF EUR0.0199 30 December 2015 29 January 2016 EUR7,960
PowerShares FTSE RAFI Hong Kong China UCITS ETF USD0.1931 30 December 2015 29 January 2016 USD38,620 September 2015
Fund Name Dividend Per Share
Record Date Payment Date
Dividend Cash Amount
PowerShares EQQQ NASDAQ-100 UCITS ETF USD 0.2113 1 October 2015 30 October 2015 USD2,556,730
PowerShares FTSE RAFI US 1000 UCITS ETF USD 0.0556 1 October 2015 30 October 2015 USD956,320
PowerShares Dynamic US Market UCITS ETF USD 0.0208 1 October 2015 30 October 2015 USD58,240
PowerShares S&P 500 High Dividend Low Volatility UCITS ETF USD 0.2012 1 October 2015 30 October 2015 USD90,540
PowerShares S&P 500 VEQTOR UCITS ETF USD 0.0582 1 October 2015 30 October 2015 USD11,640
PowerShares Global Clean Energy UCITS ETF EUR 0.0198 1 October 2015 30 October 2015 EUR41,580
PowerShares Global Listed Private Equity UCITS ETF EUR 0.0971 1 October 2015 30 October 2015 EUR38,840
PowerShares Global Water UCITS ETF EUR 0.0274 1 October 2015 30 October 2015 EUR10,960
PowerShares Global Agriculture UCITS ETF USD 0.0887 1 October 2015 30 October 2015 USD62,090
PowerShares Global Buyback Achievers UCITS ETF USD 0.0628 1 October 2015 30 October 2015 USD257,480
PowerShares FTSE RAFI Developed 1000 UCITS ETF EUR 0.0547 1 October 2015 30 October 2015 EUR32,820
PowerShares FTSE RAFI Europe Mid-Small UCITS ETF EUR 0.0532 1 October 2015 30 October 2015 EUR79,800
PowerShares FTSE RAFI All-World 3000 UCITS ETF USD 0.0791 1 October 2015 30 October 2015 USD106,785
PowerShares FTSE RAFI Emerging Markets UCITS ETF USD 0.1057 1 October 2015 30 October 2015 USD116,270
PowerShares FTSE RAFI Asia Pacific Ex-Japan UCITS ETF USD 0.0381 1 October 2015 30 October 2015 USD34,290
PowerShares FTSE RAFI Europe UCITS ETF EUR 0.0487 1 October 2015 30 October 2015 EUR43,830
PowerShares FTSE RAFI UK 100 UCITS ETF GBP 0.1093 1 October 2015 30 October 2015 GBP377,085
PowerShares FTSE RAFI Italy 30 UCITS ETF EUR 0.0255 1 October 2015 30 October 2015 EUR10,200
PowerShares FTSE RAFI Hong Kong China UCITS ETF USD 0.1205 1 October 2015 30 October 2015 USD24,100
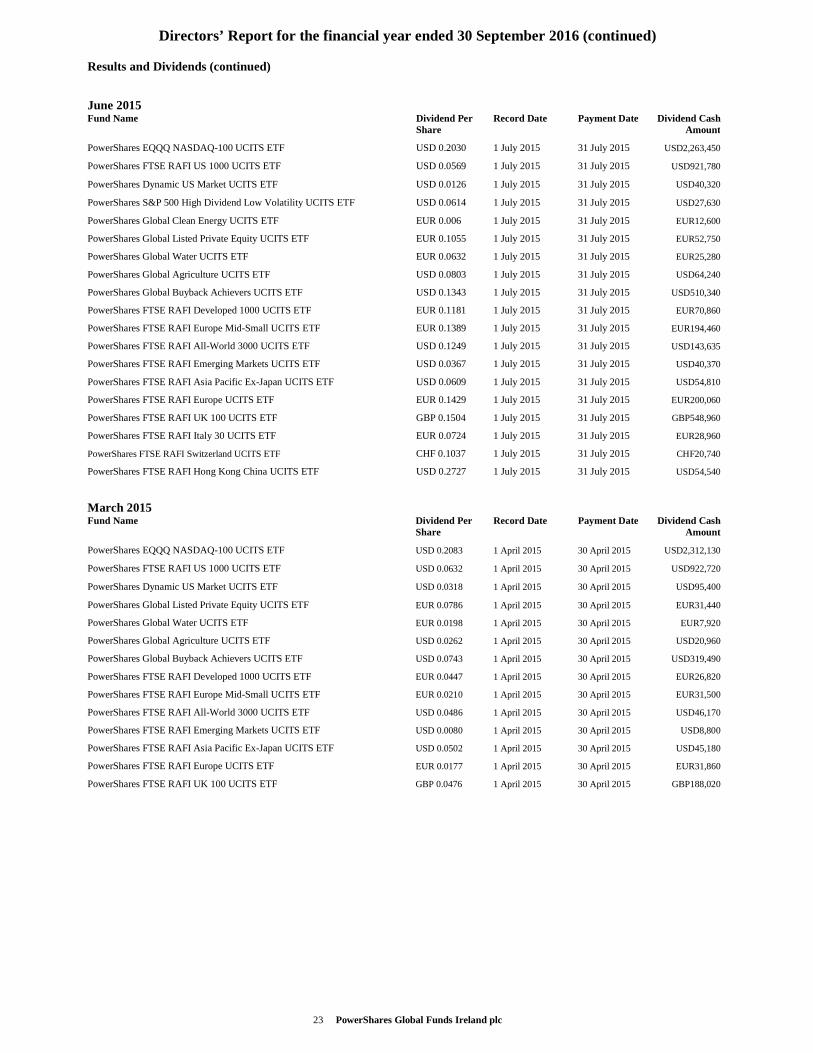
23 PowerShares Global Funds Ireland plc
Directors’ Report for the financial year ended 30 September 2016 (continued)
Results and Dividends (continued)
June 2015 Fund Name Dividend Per
Share Record Date Payment Date
Dividend Cash
Amount
PowerShares EQQQ NASDAQ-100 UCITS ETF USD 0.2030 1 July 2015 31 July 2015 USD2,263,450
PowerShares FTSE RAFI US 1000 UCITS ETF USD 0.0569 1 July 2015 31 July 2015 USD921,780
PowerShares Dynamic US Market UCITS ETF USD 0.0126 1 July 2015 31 July 2015 USD40,320
PowerShares S&P 500 High Dividend Low Volatility UCITS ETF USD 0.0614 1 July 2015 31 July 2015 USD27,630
PowerShares Global Clean Energy UCITS ETF EUR 0.006 1 July 2015 31 July 2015 EUR12,600
PowerShares Global Listed Private Equity UCITS ETF EUR 0.1055 1 July 2015 31 July 2015 EUR52,750
PowerShares Global Water UCITS ETF EUR 0.0632 1 July 2015 31 July 2015 EUR25,280
PowerShares Global Agriculture UCITS ETF USD 0.0803 1 July 2015 31 July 2015 USD64,240
PowerShares Global Buyback Achievers UCITS ETF USD 0.1343 1 July 2015 31 July 2015 USD510,340
PowerShares FTSE RAFI Developed 1000 UCITS ETF EUR 0.1181 1 July 2015 31 July 2015 EUR70,860
PowerShares FTSE RAFI Europe Mid-Small UCITS ETF EUR 0.1389 1 July 2015 31 July 2015 EUR194,460
PowerShares FTSE RAFI All-World 3000 UCITS ETF USD 0.1249 1 July 2015 31 July 2015 USD143,635
PowerShares FTSE RAFI Emerging Markets UCITS ETF USD 0.0367 1 July 2015 31 July 2015 USD40,370
PowerShares FTSE RAFI Asia Pacific Ex-Japan UCITS ETF USD 0.0609 1 July 2015 31 July 2015 USD54,810
PowerShares FTSE RAFI Europe UCITS ETF EUR 0.1429 1 July 2015 31 July 2015 EUR200,060
PowerShares FTSE RAFI UK 100 UCITS ETF GBP 0.1504 1 July 2015 31 July 2015 GBP548,960
PowerShares FTSE RAFI Italy 30 UCITS ETF EUR 0.0724 1 July 2015 31 July 2015 EUR28,960
PowerShares FTSE RAFI Switzerland UCITS ETF CHF 0.1037 1 July 2015 31 July 2015 CHF20,740
PowerShares FTSE RAFI Hong Kong China UCITS ETF USD 0.2727 1 July 2015 31 July 2015 USD54,540 March 2015 Fund Name Dividend Per
Share Record Date Payment Date
Dividend Cash
Amount
PowerShares EQQQ NASDAQ-100 UCITS ETF USD 0.2083 1 April 2015 30 April 2015 USD2,312,130
PowerShares FTSE RAFI US 1000 UCITS ETF USD 0.0632 1 April 2015 30 April 2015 USD922,720
PowerShares Dynamic US Market UCITS ETF USD 0.0318 1 April 2015 30 April 2015 USD95,400
PowerShares Global Listed Private Equity UCITS ETF EUR 0.0786 1 April 2015 30 April 2015 EUR31,440
PowerShares Global Water UCITS ETF EUR 0.0198 1 April 2015 30 April 2015 EUR7,920
PowerShares Global Agriculture UCITS ETF USD 0.0262 1 April 2015 30 April 2015 USD20,960
PowerShares Global Buyback Achievers UCITS ETF USD 0.0743 1 April 2015 30 April 2015 USD319,490
PowerShares FTSE RAFI Developed 1000 UCITS ETF EUR 0.0447 1 April 2015 30 April 2015 EUR26,820
PowerShares FTSE RAFI Europe Mid-Small UCITS ETF EUR 0.0210 1 April 2015 30 April 2015 EUR31,500
PowerShares FTSE RAFI All-World 3000 UCITS ETF USD 0.0486 1 April 2015 30 April 2015 USD46,170
PowerShares FTSE RAFI Emerging Markets UCITS ETF USD 0.0080 1 April 2015 30 April 2015 USD8,800
PowerShares FTSE RAFI Asia Pacific Ex-Japan UCITS ETF USD 0.0502 1 April 2015 30 April 2015 USD45,180
PowerShares FTSE RAFI Europe UCITS ETF EUR 0.0177 1 April 2015 30 April 2015 EUR31,860
PowerShares FTSE RAFI UK 100 UCITS ETF GBP 0.0476 1 April 2015 30 April 2015 GBP188,020
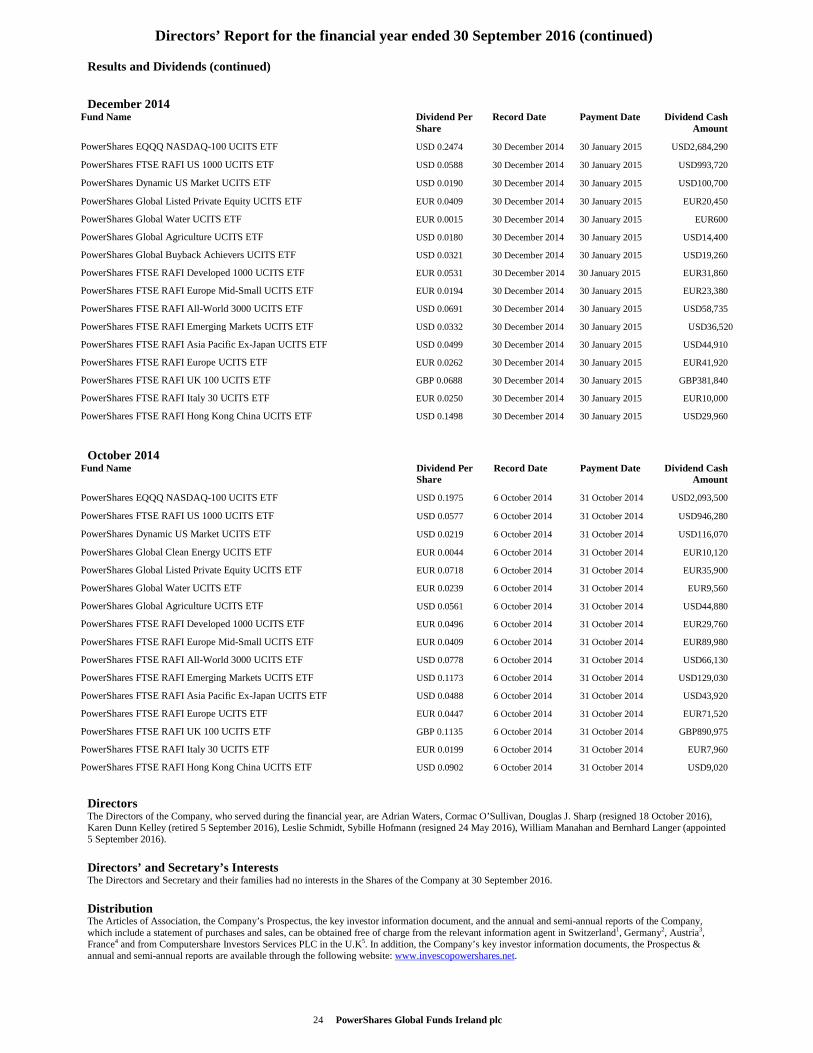
24 PowerShares Global Funds Ireland plc
Directors’ Report for the financial year ended 30 September 2016 (continued)
Results and Dividends (continued)
December 2014 Fund Name Dividend Per
Share Record Date Payment Date
Dividend Cash
Amount
PowerShares EQQQ NASDAQ-100 UCITS ETF USD 0.2474 30 December 2014 30 January 2015 USD2,684,290
PowerShares FTSE RAFI US 1000 UCITS ETF USD 0.0588 30 December 2014 30 January 2015 USD993,720
PowerShares Dynamic US Market UCITS ETF USD 0.0190 30 December 2014 30 January 2015 USD100,700
PowerShares Global Listed Private Equity UCITS ETF EUR 0.0409 30 December 2014 30 January 2015 EUR20,450
PowerShares Global Water UCITS ETF EUR 0.0015 30 December 2014 30 January 2015 EUR600
PowerShares Global Agriculture UCITS ETF USD 0.0180 30 December 2014 30 January 2015 USD14,400
PowerShares Global Buyback Achievers UCITS ETF USD 0.0321 30 December 2014 30 January 2015 USD19,260
PowerShares FTSE RAFI Developed 1000 UCITS ETF EUR 0.0531 30 December 2014 30 January 2015 EUR31,860
PowerShares FTSE RAFI Europe Mid-Small UCITS ETF EUR 0.0194 30 December 2014 30 January 2015 EUR23,380
PowerShares FTSE RAFI All-World 3000 UCITS ETF USD 0.0691 30 December 2014 30 January 2015 USD58,735
PowerShares FTSE RAFI Emerging Markets UCITS ETF USD 0.0332 30 December 2014 30 January 2015 USD36,520
PowerShares FTSE RAFI Asia Pacific Ex-Japan UCITS ETF USD 0.0499 30 December 2014 30 January 2015 USD44,910
PowerShares FTSE RAFI Europe UCITS ETF EUR 0.0262 30 December 2014 30 January 2015 EUR41,920
PowerShares FTSE RAFI UK 100 UCITS ETF GBP 0.0688 30 December 2014 30 January 2015 GBP381,840
PowerShares FTSE RAFI Italy 30 UCITS ETF EUR 0.0250 30 December 2014 30 January 2015 EUR10,000
PowerShares FTSE RAFI Hong Kong China UCITS ETF USD 0.1498 30 December 2014 30 January 2015 USD29,960
October 2014 Fund Name Dividend Per
Share Record Date Payment Date
Dividend Cash
Amount
PowerShares EQQQ NASDAQ-100 UCITS ETF USD 0.1975 6 October 2014 31 October 2014 USD2,093,500
PowerShares FTSE RAFI US 1000 UCITS ETF USD 0.0577 6 October 2014 31 October 2014 USD946,280
PowerShares Dynamic US Market UCITS ETF USD 0.0219 6 October 2014 31 October 2014 USD116,070
PowerShares Global Clean Energy UCITS ETF EUR 0.0044 6 October 2014 31 October 2014 EUR10,120
PowerShares Global Listed Private Equity UCITS ETF EUR 0.0718 6 October 2014 31 October 2014 EUR35,900
PowerShares Global Water UCITS ETF EUR 0.0239 6 October 2014 31 October 2014 EUR9,560
PowerShares Global Agriculture UCITS ETF USD 0.0561 6 October 2014 31 October 2014 USD44,880
PowerShares FTSE RAFI Developed 1000 UCITS ETF EUR 0.0496 6 October 2014 31 October 2014 EUR29,760
PowerShares FTSE RAFI Europe Mid-Small UCITS ETF EUR 0.0409 6 October 2014 31 October 2014 EUR89,980
PowerShares FTSE RAFI All-World 3000 UCITS ETF USD 0.0778 6 October 2014 31 October 2014 USD66,130
PowerShares FTSE RAFI Emerging Markets UCITS ETF USD 0.1173 6 October 2014 31 October 2014 USD129,030
PowerShares FTSE RAFI Asia Pacific Ex-Japan UCITS ETF USD 0.0488 6 October 2014 31 October 2014 USD43,920
PowerShares FTSE RAFI Europe UCITS ETF EUR 0.0447 6 October 2014 31 October 2014 EUR71,520
PowerShares FTSE RAFI UK 100 UCITS ETF GBP 0.1135 6 October 2014 31 October 2014 GBP890,975
PowerShares FTSE RAFI Italy 30 UCITS ETF EUR 0.0199 6 October 2014 31 October 2014 EUR7,960
PowerShares FTSE RAFI Hong Kong China UCITS ETF USD 0.0902 6 October 2014 31 October 2014 USD9,020
Directors The Directors of the Company, who served during the financial year, are Adrian Waters, Cormac O’Sullivan, Douglas J. Sharp (resigned 18 October 2016), Karen Dunn Kelley (retired 5 September 2016), Leslie Schmidt, Sybille Hofmann (resigned 24 May 2016), William Manahan and Bernhard Langer (appointed 5 September 2016).
Directors’ and Secretary’s Interests The Directors and Secretary and their families had no interests in the Shares of the Company at 30 September 2016.
Distribution The Articles of Association, the Company’s Prospectus, the key investor information document, and the annual and semi-annual reports of the Company, which include a statement of purchases and sales, can be obtained free of charge from the relevant information agent in Switzerland1, Germany2, Austria3, France4 and from Computershare Investors Services PLC in the U.K5. In addition, the Company’s key investor information documents, the Prospectus & annual and semi-annual reports are available through the following website: www.invescopowershares.net.
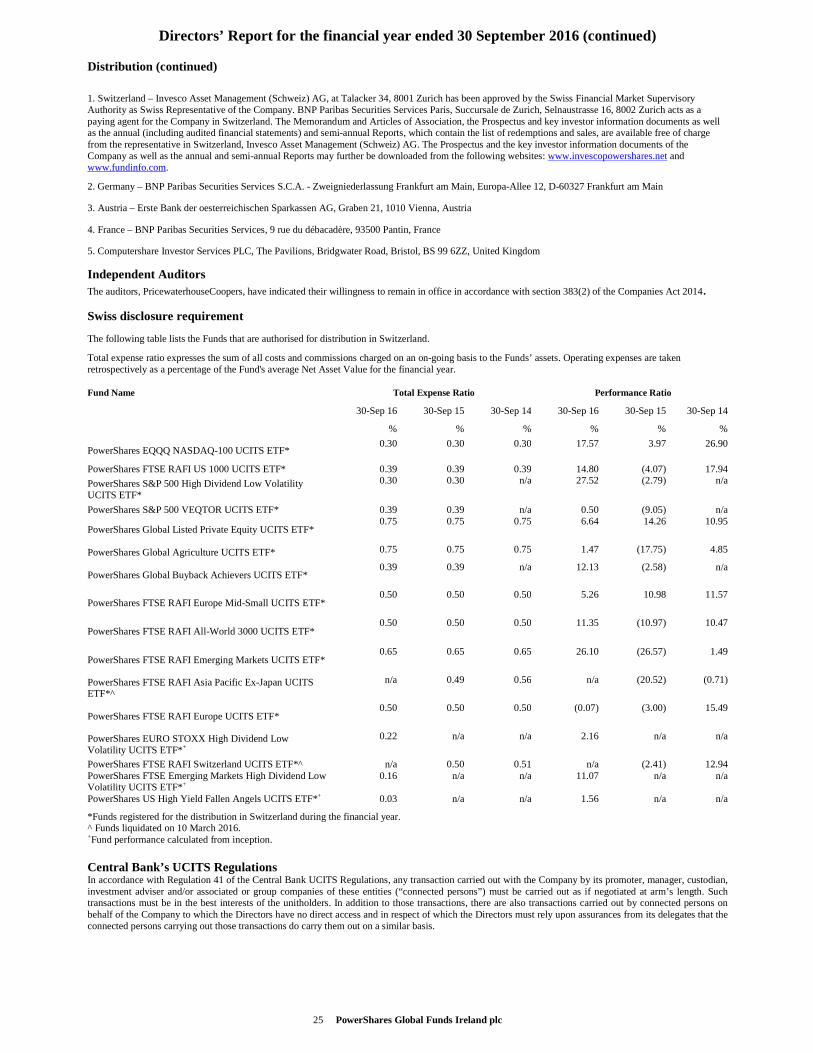
25 PowerShares Global Funds Ireland plc
Directors’ Report for the financial year ended 30 September 2016 (continued)
Distribution (continued)
1. Switzerland – Invesco Asset Management (Schweiz) AG, at Talacker 34, 8001 Zurich has been approved by the Swiss Financial Market Supervisory Authority as Swiss Representative of the Company. BNP Paribas Securities Services Paris, Succursale de Zurich, Selnaustrasse 16, 8002 Zurich acts as a paying agent for the Company in Switzerland. The Memorandum and Articles of Association, the Prospectus and key investor information documents as well as the annual (including audited financial statements) and semi-annual Reports, which contain the list of redemptions and sales, are available free of charge from the representative in Switzerland, Invesco Asset Management (Schweiz) AG. The Prospectus and the key investor information documents of the Company as well as the annual and semi-annual Reports may further be downloaded from the following websites: www.invescopowershares.net and www.fundinfo.com.
2. Germany – BNP Paribas Securities Services S.C.A. - Zweigniederlassung Frankfurt am Main, Europa-Allee 12, D-60327 Frankfurt am Main
3. Austria – Erste Bank der oesterreichischen Sparkassen AG, Graben 21, 1010 Vienna, Austria
4. France – BNP Paribas Securities Services, 9 rue du débacadère, 93500 Pantin, France
5. Computershare Investor Services PLC, The Pavilions, Bridgwater Road, Bristol, BS 99 6ZZ, United Kingdom
Independent Auditors The auditors, PricewaterhouseCoopers, have indicated their willingness to remain in office in accordance with section 383(2) of the Companies Act 2014.
Swiss disclosure requirement
The following table lists the Funds that are authorised for distribution in Switzerland.
Total expense ratio expresses the sum of all costs and commissions charged on an on-going basis to the Funds’ assets. Operating expenses are taken retrospectively as a percentage of the Fund's average Net Asset Value for the financial year.
Fund Name Total Expense Ratio Performance Ratio
30-Sep 16 30-Sep 15 30-Sep 14 30-Sep 16 30-Sep 15 30-Sep 14
% % % % % %
PowerShares EQQQ NASDAQ-100 UCITS ETF* 0.30 0.30 0.30 17.57 3.97 26.90
PowerShares FTSE RAFI US 1000 UCITS ETF* 0.39 0.39 0.39 14.80 (4.07) 17.94
PowerShares S&P 500 High Dividend Low Volatility UCITS ETF*
0.30 0.30 n/a 27.52 (2.79) n/a
PowerShares S&P 500 VEQTOR UCITS ETF* 0.39 0.39 n/a 0.50 (9.05) n/a
PowerShares Global Listed Private Equity UCITS ETF* 0.75 0.75 0.75 6.64 14.26 10.95
PowerShares Global Agriculture UCITS ETF* 0.75 0.75 0.75 1.47 (17.75) 4.85
PowerShares Global Buyback Achievers UCITS ETF* 0.39 0.39 n/a 12.13 (2.58) n/a
PowerShares FTSE RAFI Europe Mid-Small UCITS ETF* 0.50 0.50 0.50 5.26 10.98 11.57
PowerShares FTSE RAFI All-World 3000 UCITS ETF* 0.50 0.50 0.50 11.35 (10.97) 10.47
PowerShares FTSE RAFI Emerging Markets UCITS ETF* 0.65 0.65 0.65 26.10 (26.57) 1.49
PowerShares FTSE RAFI Asia Pacific Ex-Japan UCITS ETF*^
n/a 0.49 0.56 n/a (20.52) (0.71)
PowerShares FTSE RAFI Europe UCITS ETF* 0.50 0.50 0.50 (0.07) (3.00) 15.49
PowerShares EURO STOXX High Dividend Low Volatility UCITS ETF*+
0.22 n/a n/a 2.16 n/a n/a
PowerShares FTSE RAFI Switzerland UCITS ETF*^ n/a 0.50 0.51 n/a (2.41) 12.94PowerShares FTSE Emerging Markets High Dividend Low Volatility UCITS ETF*+
0.16 n/a n/a 11.07 n/a n/a
PowerShares US High Yield Fallen Angels UCITS ETF*+ 0.03 n/a n/a 1.56 n/a n/a
*Funds registered for the distribution in Switzerland during the financial year. ^ Funds liquidated on 10 March 2016. +Fund performance calculated from inception. Central Bank’s UCITS Regulations In accordance with Regulation 41 of the Central Bank UCITS Regulations, any transaction carried out with the Company by its promoter, manager, custodian, investment adviser and/or associated or group companies of these entities (“connected persons”) must be carried out as if negotiated at arm’s length. Such transactions must be in the best interests of the unitholders. In addition to those transactions, there are also transactions carried out by connected persons on behalf of the Company to which the Directors have no direct access and in respect of which the Directors must rely upon assurances from its delegates that the connected persons carrying out those transactions do carry them out on a similar basis.
26 PowerShares Global Funds Ireland plc
Directors’ Report for the financial year ended 30 September 2016 (continued)
Central Bank’s UCITS Regulations (continued)
Shareholders should have regard to the governance structure of the Company as more particularly described in the Corporate Governance Statement section of the Directors Report to these audited financial statements and the roles and responsibilities of the Company’s respective delegates subject to the overall supervision of the Board. Further, Shareholders should refer to the Prospectus which identifies many of the connected person transactions and the general nature of the contractual arrangements with the principal connected persons but it is not exhaustive of all connected person transactions. Shareholders should also refer to the provisions of the Prospectus dealing with conflicts of interest. Therefore, having regard to confirmations from the Company’s management and its relevant delegates, the Board of Directors of the Company is satisfied that (i) there are arrangements (as evidenced by written procedures documented by the Investment Manager) in place to ensure that the obligations described above are applied to all transactions with connected persons; and (ii) transactions with connected persons entered into during the period complied with these obligations, as attested by the Investment Manager through regular updates to the Directors. The Board of Directors is not aware of any transactions with connected persons during the twelve months ended 30 September 2016, other than those disclosed in these financial statements. Note 12 details related party transactions in the period as required by accounting standards generally accepted in Ireland (“Irish GAAP”). However, shareholders should understand that not all “connected persons” are related parties as such latter expression is defined by Irish GAAP. In response to the CBI publishing the Central Bank (Supervision and Enforcement) Act 2013 (Section 48(1)) Investor Money Regulations 2015 for Fund Service Providers (the “Investor Money Regulations” or “IMR”) in March 2015 (effective from 1 July 2016), the Company undertook, together with BNY Mellon Fund Services (Ireland) Designated Activity Company a review of the way in which subscription, distribution and redemption monies are channeled to and from the Company. As a result of this review, subscription and redemptions monies will (effective from 1 July 2016), be channeled through an umbrella cash collection account in the name of the Company and, in respect of any sub-funds considered to be highly leveraged, sub-fund cash collection accounts in the name of the relevant sub-fund(s). Pending issue of the shares and/or payment of subscription proceeds to an account in the name of the Company or the relevant sub-fund(s), and pending payment of redemption proceeds or distributions, the relevant investor will be an unsecured creditor of the relevant sub-fund in respect of amounts paid by or due to it.
Significant Events during the financial year Board Changes: Effective 24 May 2016 Sybille Hofmann resigned from the Board.
Effective 5 September 2016 Karen Dunn Kelley retired from the Board.
Effective 5 September 2016, Bernhard Langer was appointed to the Board.
Fund related changes during the financial year: An updated Prospectus was issued on 22 July 2016. Effective 6 January 2016 the PowerShares EURO STOXX High Dividend Low Volatility UCITS ETF was launched. Effective 27 May 2016 the PowerShares FTSE Emerging Markets High Dividend Low Volatility UCITS ETF and PowerShares FTSE UK High Dividend Low Volatility UCITS ETF were launched. Effective 1 September 2016 the PowerShares US High Yield Fallen Angels UCITS ETF was launched. Effective 10 March 2016 the following funds liquidated: PowerShares FTSE RAFI Developed 1000 UCITS ETF PowerShares FTSE RAFI Asia Pacific Ex-Japan UCITS ETF PowerShares FTSE RAFI Italy 30 UCITS ETF PowerShares FTSE RAFI Switzerland UCITS ETF PowerShares FTSE RAFI Hong Kong China UCITS ETF Apart from the above there were no other significant events during the financial year that require disclosure in the financial statements.
Significant Events After the Financial Year End
Effective 18 October Douglas Sharp resigned from the Board. Effective 18 October 2016 Graeme Proudfoot was appointed to the Board. An updated Prospectus was issued on 18 November 2016. Effective 1 January 2017 there will be a reduction in the management fees for the following funds: Current Rate Revised Rate Powershares FTSE RAFI Europe UCITS ETF 0.50% 0.39% Powershares FTSE RAFI Emerging Markets UCITS ETF 0.65% 0.49% Powershares FTSE RAFI All-World 3000 UCITS ETF 0.50% 0.39% Powershares FTSE RAFI Europe Mid-Small UCITS ETF 0.50% 0.39% Powershares FTSE RAFI UK 100 UCITS ETF 0.50% 0.39% Apart from the above there were no other significant events after the financial year end that require disclosure in the financial statements. On behalf of the Board ______________________________ _____________________________ Director: Director:
27 PowerShares Global Funds Ireland plc
Audit Committee Report
Audit Committee
In accordance with section 167 of the Companies Act 2014 and the UK Code, the Board of Directors has concluded that the Company is a “larger company” in terms of market capitalisation and, as such, the Companies Act 2014 provides for a minimum of one independent non-execuative director and the UK Code provides for a minimum of three independent non-executive directors on the Audit Committee. The Audit Committee currently comprises two independent non-executive directors. The Board has reviewed the Audit Committee’s membership, taking into consideration the fact that the Company is an externally managed investment company without any employees or commercial operations other than investment management. It has satisfied itself that, collectively, Adrian Waters and William Manahan have the relevant expertise, skill and ability as well as the time to carry out the authorities delegated to them by the Board. The Board has therefore concluded that it is not necessary to appoint a third independent non-executive director to the Audit Committee. The Board reviews the Audit Committee membership at least annually.
The Audit Committee is responsible for reviewing each aspect of the financial reporting process, the systems of internal control and the management of financial risks, the audit process, relationships with external auditors, the Company’s process for monitoring compliance with laws and regulations and for making recommendations to the Board on such matters. The Audit Committee meets at least twice a year to review and agree the audit plan and timetable (in advance of the financial year end), to review the internal financial controls, to approve the contents of the draft annual and half-yearly financial reports and to review the Company’s accounting policies. The Audit Committee undertakes a review of the content of the annual financial report with a view to advising the Board on whether, taken as a whole, it is fair, balanced and understandable and provides the information necessary for shareholders to assess the Company’s performance, business model and strategy. The Audit Committee has written terms of reference which are reviewed as and when appropriate and clearly define its responsibilities and duties. These terms are available for inspection at the AGM and the registered office of the Company. The members of the Audit Committee consider that, collectively, they possess the appropriate experience to fulfil the role required.
The Audit Committee is responsible for making recommendations to the Board in respect of the appointment, re-appointment and removal of the auditors. It is also responsible for making recommendations on the auditor’s remuneration, including both fees for audit and non-audit services, and that the level of fees is appropriate to enable an effective audit to be conducted.
The Audit Committee also reviews the Auditor’s independence, objectivity and effectiveness and, together with the Manager, reviews the Company’s compliance with financial reporting and regulatory requirements. Representatives of the Manager’s internal audit and compliance teams attend at least two meetings each year. Representatives of the external auditor, PricewaterhouseCoopers attend the Audit Committee Meeting at which the draft annual financial report is reviewed and the planning presentation is presented.
The Audit Committee has assessed the effectiveness and objectivity of the audit process for the financial year ended 30 September 2016, as well as the auditor’s effectiveness, performance and independence. This assessment covered areas such as the calibre of the audit firm including its reputation and standing in the Industry; the level and adequacy of quality controls in place; the performance of the audit team; the ethical standards such as independence and integrity; and the reasonableness of the audit fees. As a result, the Audit Committee concluded that it is satisfied that PricewaterhouseCoopers has fulfilled its obligations to shareholders as independent auditor of the Company. The Audit Committee has accordingly recommended to the Board the inclusion of a resolution proposing the re-appointment of PricewaterhouseCoopers at the forthcoming AGM.
PricewaterhouseCoopers were first appointed to conduct the 30 September 2002 audit. Following the satisfactory outcome to the Audit Committee’s regular review of auditor effectiveness, performance and independence as well as the objectivity of the audit process, the Audit Committee has concluded that it does not need to initiate a tendering process at this time, but will continue to keep the situation under review. During the financial year ended 30 September 2016, the tax department within PricewaterhouseCoopers provided tax compliance services to the Company. The provision of these services was approved by the Audit Committee. The Audit Committee is satisfied that there are sufficient safeguards in place to protect the objectivity and independence of the Auditor. The specific safeguards in place include the segregation between the departments providing the services within PricewaterhouseCoopers and that PricewaterhouseCoopers do not make management decisions on behalf of the Company. The amount of fees payable to the auditor as at 30 September 2016 can be found in note 12 to the financial statements.
Significant Issues
The Audit Committee has considered the appropriateness of its accounting policies and agreed with the auditor when discussing the audit the issues that it considered to be significant to the financial statements. For the financial year ended 30 September 2016, the accounting matters that were subject to particular focus by the Audit Committee in consultation with the auditor, where appropriate.
- Valuation of financial assets at fair value through profit or loss: The Investment Manager delegates valuation responsibility to the Fund Administrator using an agreed pricing policy. During the financial year and at the financial year end, the Board receives confirmation from the Investment Manager that the pricing basis is appropriate and in line with the agreed pricing policy. The Audit Committee discussed with the auditor the results of the financial year end audit procedures over the valuation of investments.
- Existence of financial assets at fair value through profit or loss: The Investment Manager delegates asset reconciliation responsibility to the Fund Administrator and in turn receives regular reporting on all issues. During the financial year and at financial year end, the Board receive detailed administration reporting including portfolio composition. The Audit Committee discussed with the auditor the results of the financial year end audit procedures over the existence of investments.
As the responsibility for the valuation of assets and asset reconciliation has been delegated by the Board to the Administrator, the Board regularly reviews the mechanisms in place to monitor these delegated functions in general and, more specifically, the controls in place to monitor the valuation of assets and asset reconciliation. The Audit Committee considers that the procedures that the Board has in place to monitor the Administrator are adequate and appropriate. On behalf of the Audit Committee _______________________________ Mr Adrian Waters Chairman of the Audit Committee
28 PowerShares Global Funds Ireland plc
Other Information (unaudited)
PEA Eligibility (Plan d'Epargne en Actions)
This PEA Eligibility test is to ensure that the ETFs noted below are eligible to French investors wishing to invest in the Funds within their PEA (French saving plan). The requirement is that 75% of their net assets must be in equity securities issued by companies with their head office in the European Union, Norway or Iceland. This is an annual check for the regulators, however, quarterly we keep track of PEA Eligibility status for the Board.
During the financial year ended 30 September 2016, the PowerShares FTSE RAFI Europe UCITS ETF has invested on average 89.268% of its net assets in equity securities, as listed in article L.221-31, I, 1, a, b, and c of the Code Monétaire et Financier, issued by companies which have their head office in the European Union, Norway or Iceland.
During the financial year ended 30 September 2016, the PowerShares EURO STOXX High Dividend low Volatility UCITS ETF has invested on average 99.485% of its net assets in equity securities, as listed in article L.221-31, I, 1, a, b, and c of the Code Monétaire et Financier, issued by companies which have their head office in the European Union, Norway or Iceland.
During the financial year ended 30 September 2016, the PowerShares FTSE RAFI Europe Mid-Small UCITS ETF has invested on average 87.710% of its net assets in equity securities, as listed in article L.221-31, I,1, a, b, and c of the Code Monétaire et Financier, issued by companies which have their head office in the European Union, Norway or Iceland.
29 PowerShares Global Funds Ireland plc
Report of the Depositary to the Shareholders
For the period from 1 October 2015 to 30 September 2016 (the “Period”) BNY Mellon Trust Company (Ireland) Limited (the “Depositary” “us”, “ we”, or “our”), has enquired into the conduct of PowerShares Global Funds Ireland plc (the “Company”) for the Period ended 30 September 2016, in its capacity as depositary to the Company. This report including the opinion has been prepared for and solely for the shareholders in the Company, in accordance with our role as depositary to the Company and for no other purpose. We do not, in giving this opinion, accept or assume responsibility for any other purpose or to any other person to whom this report is shown. Responsibilities of the Depositary Our duties and responsibilities are outlined in Regulation 34 of the European Communities (Undertakings for Collective Investment in Transferable Securities) Regulations 2011 (S.I. No 352 of 2011), as amended (the “Regulations”).
Our report shall state whether, in our opinion, the Company has been managed in that period in accordance with the provisions of the Company’s Memorandum and Articles of Association and the Regulations. It is the overall responsibility of the Company to comply with these provisions. If the Company has not been so managed, we as depositary must state in what respects it has not been so managed and the steps which we have taken in respect thereof. Basis of Depositary Opinion The Depositary conducts such reviews as it, in its reasonable opinion, considers necessary in order to comply with its duties and to ensure that, in all material respects, the Company has been managed (i) in accordance with the limitations imposed on its investment and borrowing powers by the provisions of its constitutional documentation and the appropriate regulations and (ii) otherwise in accordance with the Company’s constitutional documentation and the appropriate regulations. Opinion In our opinion, the Company has been managed during the Period, in all material respects: (i) in accordance with the limitations imposed on the investment and borrowing powers of the Company by the Memorandum and Articles of Association and by the Regulations; and
(ii) otherwise in accordance with the provisions of the Memorandum and Articles of Association and the Regulations. __________________________ For and on behalf of BNY Mellon Trust Company (Ireland) Limited, Guild House, Guild Street, IFSC, Dublin 1. 23 January 2017
PricewaterhouseCoopers, One Spencer Dock, North Wall Quay, Dublin 1, Ireland, I.D.E. Box No. 137
T: +353 (0) 1 7926000, F: +353 (0) 21 4276630, www.pwc.ie
Independent auditors' report to the members of PowerShares Global Funds Ireland plc
Report on the financial statements
Our opinion
In our opinion, PowerShares Global Funds Ireland plc's financial statements (the “financial statements”):
• give a true and fair view of the Company's and Funds' (as listed on pages 2 and 3) assets, liabilities and financial position as at 30 September 2016 and of their results for the year then ended;
• have been properly prepared in accordance with Generally Accepted Accounting Practice in Ireland; and
• have been properly prepared in accordance with the requirements of the Companies Act 2014 and the European Communities (Undertakings for Collective Investment in Transferable Securities) Regulations 2011 (as amended).
What we have audited
The financial statements, included within the “Annual Report and Audited Financial Statements” (the “Annual Report”), comprise:
• the Company and Funds' Statements of Financial Position as at 30 September 2016;
• the Company and Funds' Statements of Comprehensive Income for the year then ended;
• the Company and Funds' Statements of Changes in Net Assets Attributable to Holders of Redeemable Participating Shares for the year then ended;
• the Schedule of Investments for each of the Funds as at 30 September 2016; and
• the notes to the financial statements for the Company and for each of its Funds, which include a summary of the significant accounting policies and other explanatory information.
The financial reporting framework that has been applied in the preparation of the financial statements is Irish law and accounting standards issued by the Financial Reporting Council and promulgated by the Institute of Chartered Accountants in Ireland (Generally Accepted Accounting Practice in Ireland), including Financial Reporting Standard 102 “ The Financial Reporting Standard applicable in the UK and Republic of Ireland”.
Our audit approach
Overview
Materiality
Overall materiality: 50 basis points of Net Asset Value ("NAV") at 30 September 2016 for each of the Company's Funds.
Audit scope
• The Company is an open-ended investment company with variable capital and engages Invesco Global Asset Management Designated Activity Company (the "Manager") to manage certain duties and responsibilities with regards to the day-to-day management of the Company.
• We tailored the scope of our audit taking into account the types of investments within the Company, the involvement of the third parties referred to overleaf, the accounting processes and controls and the industry in which the Company operates. We look at each Fund at an individual level.
Areas of focus
• Existence of financial assets at fair value through profit or loss. • Valuation of financial assets at fair value through profit or loss.
31
The scope of our audit and our areas of focus
We conducted our audit in accordance with International Standards on Auditing (UK and Ireland) (“ISAs (UK & Ireland)”).
We designed our audit by determining materiality and assessing the risks of material misstatement in the financial statements. In particular, we looked at where the Directors made subjective judgements, for example the selection of pricing sources to value the investment portfolios. As in all of our audits, we also addressed the risk of management override of internal controls, including evaluating whether there was evidence of bias by the Directors that may represent a risk of material misstatement due to fraud.
The risks of material misstatement that had the greatest effect on our audit, including the allocation of our resources and effort, are identified as “areas of focus” in the table below together with an explanation of how we tailored our audit to address these specific areas. This is not a complete list of all risks identified by our audit.
Area of focus How our audit addressed the area of focus
Existence of financial assets at fair value through profit or loss
The financial assets at fair value through profit or loss included in the Statement of Financial Position of each Fund are held in the Fund's name at 30 September 2016.
We focused on this area because it represents the principal element of the financial statements.
We obtained independent confirmation from the Depositary and counterparties of the investment portfolio held at 30 September 2016, agreeing the amounts held to the accounting records of each Fund.
Valuation of financial assets at fair value through profit or loss
The financial assets at fair value through profit or loss included in the Statement of Financial Position of each Fund at 30 September 2016 are valued at fair value in line with Generally Accepted Accounting Practice in Ireland.
We focused on this area because it represents the principal element of the financial statements.
We tested the valuation of the investment portfolios by independently agreeing the valuation of investments to third party vendor sources.
How we tailored the audit scope
As at the year-end there are 25 Funds operating. The Company's Statement of Financial Position, Statement of Comprehensive Income and the Statement of Changes in Net Assets Attributable to Holders of Redeemable Participating Shares are an aggregation of the positions and results of the 25 Funds.
The Directors control the affairs of the Company and are responsible for the overall investment policy which is determined by them. The Company engages the Manager to manage certain duties and responsibilities with regards to the day-to-day management of the Company.
The Manager has delegated certain responsibilities to Invesco PowerShares Capital Management LLC (the "Investment Manager") and to BNY Mellon Fund Services (Ireland) Designated Activity Company (the "Administrator"). The financial statements, which remain the responsibility of the Directors, are prepared on their behalf by the Administrator. The Company has appointed BNY Mellon Trust Company (Ireland) Limited (the "Depositary") to act as Depositary of the Company's assets.
In establishing the overall approach to our audit we assessed the risk of material misstatement at a Fund level, taking into account the nature, likelihood and potential magnitude of any misstatement. As part of our risk assessment, we considered the Company's interaction with the Administrator, and we assessed the control environment in place at the Administrator.
Materiality
The scope of our audit is influenced by our application of materiality. We set certain quantitative thresholds for materiality. These, together with qualitative considerations, helped us to determine the scope of our audit and the nature, timing and extent of our audit procedures and to evaluate the effect of misstatements, both individually and on the financial statements as a whole.
Based on our professional judgement, we determined materiality for each of the Company's Funds as follows:
Overall materiality and how we determined it
50 basis points (2015: 50 basis points) of Net Asset Value ("NAV") at 30 September 2016 for each of the Company’s Funds.
Rationale for benchmark applied
We have applied this benchmark because the main objective of the Company is to provide investors with a total return at a Fund level, taking into account the capital and income returns.
32
We agreed with the Audit Committee that we would report to them misstatements identified during our audit above 5 basis points of each Fund’s NAV, for NAV per share impacting differences (2015: 5 basis points of each Fund's NAV, for NAV per share impacting differences) as well as misstatements below that amount that, in our view, warranted reporting for qualitative reasons.
Going concern
Under the Listing Rules we are required to review the Directors' statement, set out on pages 13 and 14, in relation to going concern. We have nothing to report having performed our review.
Under ISAs (UK & Ireland) we are required to report to you if we have anything material to add or to draw attention to in relation to the Directors' statement about whether they considered it appropriate to adopt the going concern basis in preparing the financial statements and their identification of any material uncertainties. We have nothing material to add or to draw attention to.
As noted in the Directors' statement, the Directors have concluded that it is appropriate to adopt the going concern basis in preparing the financial statements. The going concern basis presumes that the Company has adequate resources to remain in operation, and that the Directors intend it to do so, for at least one year from the date the financial statements were signed. As part of our audit we have concluded that the Directors' use of the going concern basis is appropriate. However, because not all future events or conditions can be predicted, these statements are not a guarantee as to the Company’s ability to continue as a going concern.
Other required reporting
Consistency of other information
Companies Act 2014 opinion
In our opinion, the Directors' Report is consistent with the financial statements.
ISAs (UK & Ireland) reporting
Under ISAs (UK & Ireland) we are required to report to you if, in our opinion:
• information in the Annual Report is:
− materially inconsistent with the information in the audited financial statements; or − apparently materially incorrect based on, or materially inconsistent with, our knowledge
of the Company acquired in the course of performing our audit; or
− is otherwise misleading.
We have no exceptions to report arising from this responsibility.
• the statement given by the Directors on page 13, in accordance with provision C.1.1 of the UK Corporate Governance Code (“the Code”), that they consider the Annual Report taken as a whole to be fair, balanced and understandable and provides the information necessary for members to assess the Company’s and Funds' position and performance, business model and strategy is materially inconsistent with our knowledge of the Company acquired in the course of performing our audit.
We have no exceptions to report arising from this responsibility.
• the section of the Annual Report on page 27, as required by provision C.3.8 of the Code, describing the work of the Audit Committee does not appropriately address matters communicated by us to the Audit Committee.
We have no exceptions to report arising from this responsibility.
The Directors' assessment of the prospects of the Company and the principal risks that would threaten the solvency or liquidity of the Company
Under ISAs (UK & Ireland) we are required to report to you if we have anything material to add or to draw attention to in
relation to:
• the Directors confirmation on page 19 of the Annual Report in accordance with provision C.2.1 of the Code, that they have carried out a robust assessment of the principal risks facing the Company, including those that would threaten its business model, future performance, solvency and liquidity.
We have nothing material to add or to draw attention to.
33
• the disclosures in the Annual Report that describe those risks and explain how they are being managed or mitigated.
We have nothing material to add or to draw attention to.
• the Directors' explanation on page 13 of the Annual Report, in accordance with provision C.2.2 of the Code, as to how they have assessed the prospects of the Company, over what period they have done so and why they consider that period to be appropriate, and a statement as to whether they have a reasonable expectation that the Company will be able to continue in operation and meet its liabilities as they fall due over the period of their assessment, including any related disclosures drawing attention to any necessary qualifications or assumptions.
We have nothing material to add or to draw attention to.
Under the Listing Rules we are required to review the Directors’ statement that they have carried out a robust assessment of the principal risks facing the Company and the Directors ' statement in relation to the longer term viability of the Company. Our review was substantially less in scope than an audit and only consisted of making inquiries and considering the Directors' process supporting their statements; checking that the statements are in alignment with the relevant provisions of the Code; and considering whether the statements are consistent with the knowledge acquired by us in the course of performing our audit. We have nothing to report having performed our review.
Directors’ remuneration and transactions
Under the Companies Act 2014, we are required to report to you if, in our opinion, the disclosure of Directors' remuneration and transactions specified by sections 305 to 312 of that Act have not been made. We have no exceptions to report arising from this responsibility.
Corporate governance statement
• In our opinion based on the work undertaken in the course of our audit of the financial statements, the description of the main features of the internal control and risk management systems in relation to the financial reporting process included in the Corporate Governance Statement, is consistent with the financial statements and has been prepared in accordance with section 1373(2)(c) of the Companies Act 2014.
• Based on our knowledge and understanding of the Company and its environment obtained in the course of our audit of the financial statements, we have not identified material misstatements in the description of the main features of the internal control and risk management systems in relation to the financial reporting process included in the Corporate Governance Statement.
• In our opinion, based on the work undertaken during the course of our audit of the financial statements, the information required by section 1373(2)(a),(b),(e) and (f) is contained in the Corporate Governance Statement.
• Under the Listing Rules we are required to review the part of the Corporate Governance Statement relating to the Company’s compliance with ten provisions of the UK Corporate Governance Code specified for our review. We have nothing to report having performed our review.
Other matters on which we are required to report by the Companies Act 2014
• We have obtained all the information and explanations which we consider necessary for the purposes of our audit. • In our opinion the accounting records of the Company were sufficient to permit the financial statements to be readily and
properly audited.
• The financial statements are in agreement with the accounting records.
Responsibilities for the financial statements and the audit
Our responsibilities and those of the Directors
As explained more fully in the Statement of Directors' Responsibilities set out on page 13 the Directors are responsible for the preparation of the financial statements and for being satisfied that they give a true and fair view.
Our responsibility is to audit and express an opinion on the financial statements in accordance with Irish law and ISAs (UK & Ireland). Those standards require us to comply with the Auditing Practices Board's Ethical Standards for Auditors.
This report, including the opinions, has been prepared for and only for the Company's members as a body in accordance with section 391 of the Companies Act 2014 and for no other purpose. We do not, in giving these opinions, accept or assume responsibility for any other purpose or to any other person to whom this report is shown or into whose hands it may come save where expressly agreed by our prior consent in writing.
34
What an audit of financial statements involves
An audit involves obtaining evidence about the amounts and disclosures in the financial statements sufficient to give reasonable assurance that the financial statements are free from material misstatement, whether caused by fraud or error. This includes an assessment of:
• whether the accounting policies are appropriate to the Company's circumstances and have been consistently applied and adequately disclosed;
• the reasonableness of significant accounting estimates made by the Directors; and
• the overall presentation of the financial statements.
We primarily focus our work in these areas by assessing the Directors' judgements against available evidence, forming our own judgements, and evaluating the disclosures in the financial statements.
We test and examine information, using sampling and other auditing techniques, to the extent we consider necessary to provide a reasonable basis for us to draw conclusions. We obtain audit evidence through testing the effectiveness of controls, substantive procedures or a combination of both.
In addition, we read all the financial and non-financial information in the Annual Report to identify material inconsistencies with the audited financial statements and to identify any information that is apparently materially incorrect based on, or materially inconsistent with, the knowledge acquired by us in the course of performing the audit. If we become aware of any apparent material misstatements or inconsistencies we consider the implications for our report.
Declan Murphy for and on behalf of PricewaterhouseCoopers Chartered Accountants and Statutory Audit Firm Dublin 23 January 2017
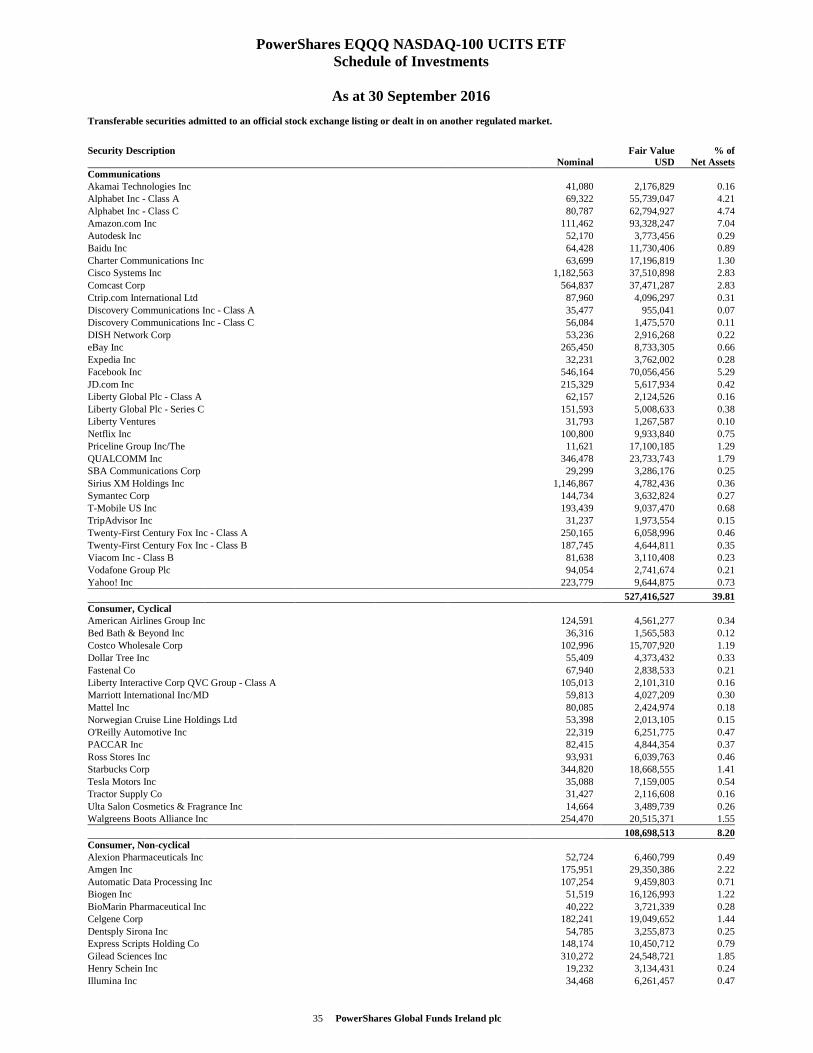
35 PowerShares Global Funds Ireland plc
PowerShares EQQQ NASDAQ-100 UCITS ETF Schedule of Investments
As at 30 September 2016
Transferable securities admitted to an official stock exchange listing or dealt in on another regulated market.
Security Description Nominal
Fair ValueUSD
% ofNet Assets
Communications Akamai Technologies Inc 41,080 2,176,829 0.16Alphabet Inc - Class A 69,322 55,739,047 4.21Alphabet Inc - Class C 80,787 62,794,927 4.74Amazon.com Inc 111,462 93,328,247 7.04Autodesk Inc 52,170 3,773,456 0.29Baidu Inc 64,428 11,730,406 0.89Charter Communications Inc 63,699 17,196,819 1.30Cisco Systems Inc 1,182,563 37,510,898 2.83Comcast Corp 564,837 37,471,287 2.83Ctrip.com International Ltd 87,960 4,096,297 0.31Discovery Communications Inc - Class A 35,477 955,041 0.07Discovery Communications Inc - Class C 56,084 1,475,570 0.11DISH Network Corp 53,236 2,916,268 0.22eBay Inc 265,450 8,733,305 0.66Expedia Inc 32,231 3,762,002 0.28Facebook Inc 546,164 70,056,456 5.29JD.com Inc 215,329 5,617,934 0.42Liberty Global Plc - Class A 62,157 2,124,526 0.16Liberty Global Plc - Series C 151,593 5,008,633 0.38Liberty Ventures 31,793 1,267,587 0.10Netflix Inc 100,800 9,933,840 0.75Priceline Group Inc/The 11,621 17,100,185 1.29QUALCOMM Inc 346,478 23,733,743 1.79SBA Communications Corp 29,299 3,286,176 0.25Sirius XM Holdings Inc 1,146,867 4,782,436 0.36Symantec Corp 144,734 3,632,824 0.27T-Mobile US Inc 193,439 9,037,470 0.68TripAdvisor Inc 31,237 1,973,554 0.15Twenty-First Century Fox Inc - Class A 250,165 6,058,996 0.46Twenty-First Century Fox Inc - Class B 187,745 4,644,811 0.35Viacom Inc - Class B 81,638 3,110,408 0.23Vodafone Group Plc 94,054 2,741,674 0.21Yahoo! Inc 223,779 9,644,875 0.73
527,416,527 39.81Consumer, Cyclical American Airlines Group Inc 124,591 4,561,277 0.34Bed Bath & Beyond Inc 36,316 1,565,583 0.12Costco Wholesale Corp 102,996 15,707,920 1.19Dollar Tree Inc 55,409 4,373,432 0.33Fastenal Co 67,940 2,838,533 0.21Liberty Interactive Corp QVC Group - Class A 105,013 2,101,310 0.16Marriott International Inc/MD 59,813 4,027,209 0.30Mattel Inc 80,085 2,424,974 0.18Norwegian Cruise Line Holdings Ltd 53,398 2,013,105 0.15O'Reilly Automotive Inc 22,319 6,251,775 0.47PACCAR Inc 82,415 4,844,354 0.37Ross Stores Inc 93,931 6,039,763 0.46Starbucks Corp 344,820 18,668,555 1.41Tesla Motors Inc 35,088 7,159,005 0.54Tractor Supply Co 31,427 2,116,608 0.16Ulta Salon Cosmetics & Fragrance Inc 14,664 3,489,739 0.26Walgreens Boots Alliance Inc 254,470 20,515,371 1.55
108,698,513 8.20Consumer, Non-cyclical Alexion Pharmaceuticals Inc 52,724 6,460,799 0.49Amgen Inc 175,951 29,350,386 2.22Automatic Data Processing Inc 107,254 9,459,803 0.71Biogen Inc 51,519 16,126,993 1.22BioMarin Pharmaceutical Inc 40,222 3,721,339 0.28Celgene Corp 182,241 19,049,652 1.44Dentsply Sirona Inc 54,785 3,255,873 0.25Express Scripts Holding Co 148,174 10,450,712 0.79Gilead Sciences Inc 310,272 24,548,721 1.85Henry Schein Inc 19,232 3,134,431 0.24Illumina Inc 34,468 6,261,457 0.47
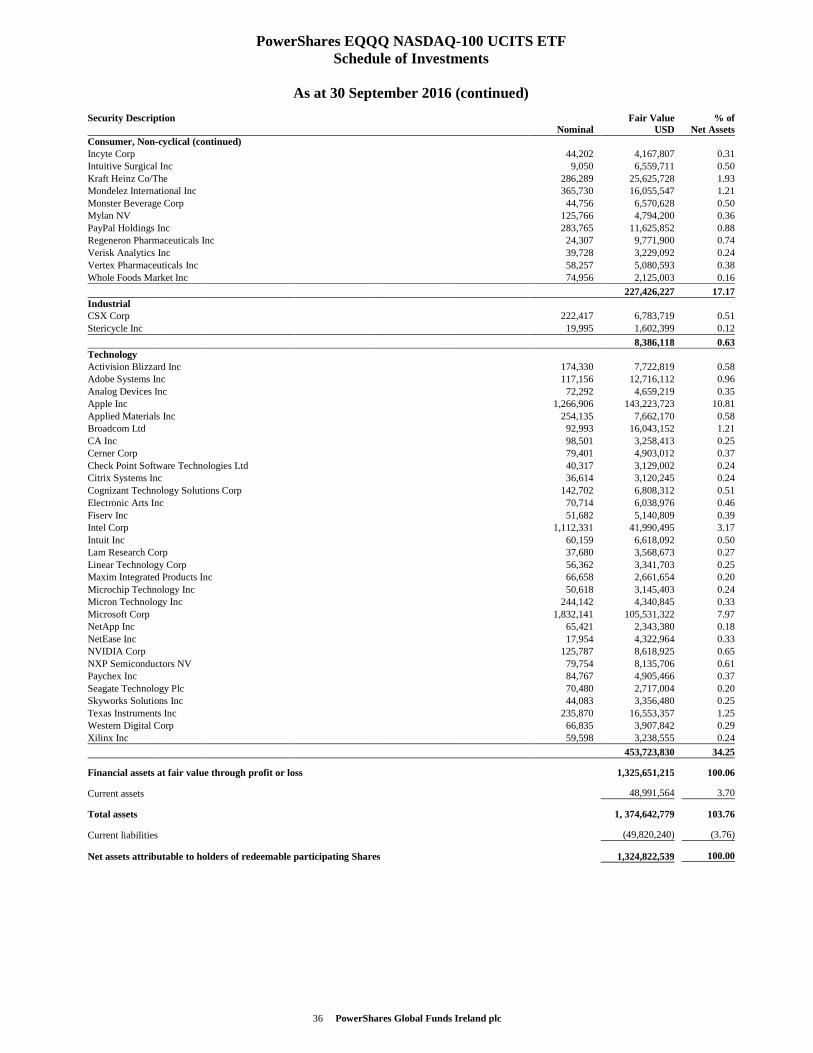
36 PowerShares Global Funds Ireland plc
PowerShares EQQQ NASDAQ-100 UCITS ETF Schedule of Investments
As at 30 September 2016 (continued)
Security Description Nominal
Fair ValueUSD
% ofNet Assets
Consumer, Non-cyclical (continued) Incyte Corp 44,202 4,167,807 0.31Intuitive Surgical Inc 9,050 6,559,711 0.50Kraft Heinz Co/The 286,289 25,625,728 1.93Mondelez International Inc 365,730 16,055,547 1.21Monster Beverage Corp 44,756 6,570,628 0.50Mylan NV 125,766 4,794,200 0.36PayPal Holdings Inc 283,765 11,625,852 0.88Regeneron Pharmaceuticals Inc 24,307 9,771,900 0.74Verisk Analytics Inc 39,728 3,229,092 0.24Vertex Pharmaceuticals Inc 58,257 5,080,593 0.38Whole Foods Market Inc 74,956 2,125,003 0.16
227,426,227 17.17Industrial CSX Corp 222,417 6,783,719 0.51Stericycle Inc 19,995 1,602,399 0.12
8,386,118 0.63Technology Activision Blizzard Inc 174,330 7,722,819 0.58Adobe Systems Inc 117,156 12,716,112 0.96Analog Devices Inc 72,292 4,659,219 0.35Apple Inc 1,266,906 143,223,723 10.81Applied Materials Inc 254,135 7,662,170 0.58Broadcom Ltd 92,993 16,043,152 1.21CA Inc 98,501 3,258,413 0.25Cerner Corp 79,401 4,903,012 0.37Check Point Software Technologies Ltd 40,317 3,129,002 0.24Citrix Systems Inc 36,614 3,120,245 0.24Cognizant Technology Solutions Corp 142,702 6,808,312 0.51Electronic Arts Inc 70,714 6,038,976 0.46Fiserv Inc 51,682 5,140,809 0.39Intel Corp 1,112,331 41,990,495 3.17Intuit Inc 60,159 6,618,092 0.50Lam Research Corp 37,680 3,568,673 0.27Linear Technology Corp 56,362 3,341,703 0.25Maxim Integrated Products Inc 66,658 2,661,654 0.20Microchip Technology Inc 50,618 3,145,403 0.24Micron Technology Inc 244,142 4,340,845 0.33Microsoft Corp 1,832,141 105,531,322 7.97NetApp Inc 65,421 2,343,380 0.18NetEase Inc 17,954 4,322,964 0.33NVIDIA Corp 125,787 8,618,925 0.65NXP Semiconductors NV 79,754 8,135,706 0.61Paychex Inc 84,767 4,905,466 0.37Seagate Technology Plc 70,480 2,717,004 0.20Skyworks Solutions Inc 44,083 3,356,480 0.25Texas Instruments Inc 235,870 16,553,357 1.25Western Digital Corp 66,835 3,907,842 0.29Xilinx Inc 59,598 3,238,555 0.24
453,723,830 34.25
Financial assets at fair value through profit or loss 1,325,651,215 100.06
Current assets 48,991,564 3.70
Total assets 1, 374,642,779 103.76
Current liabilities (49,820,240) (3.76)
Net assets attributable to holders of redeemable participating Shares 1,324,822,539 100.00
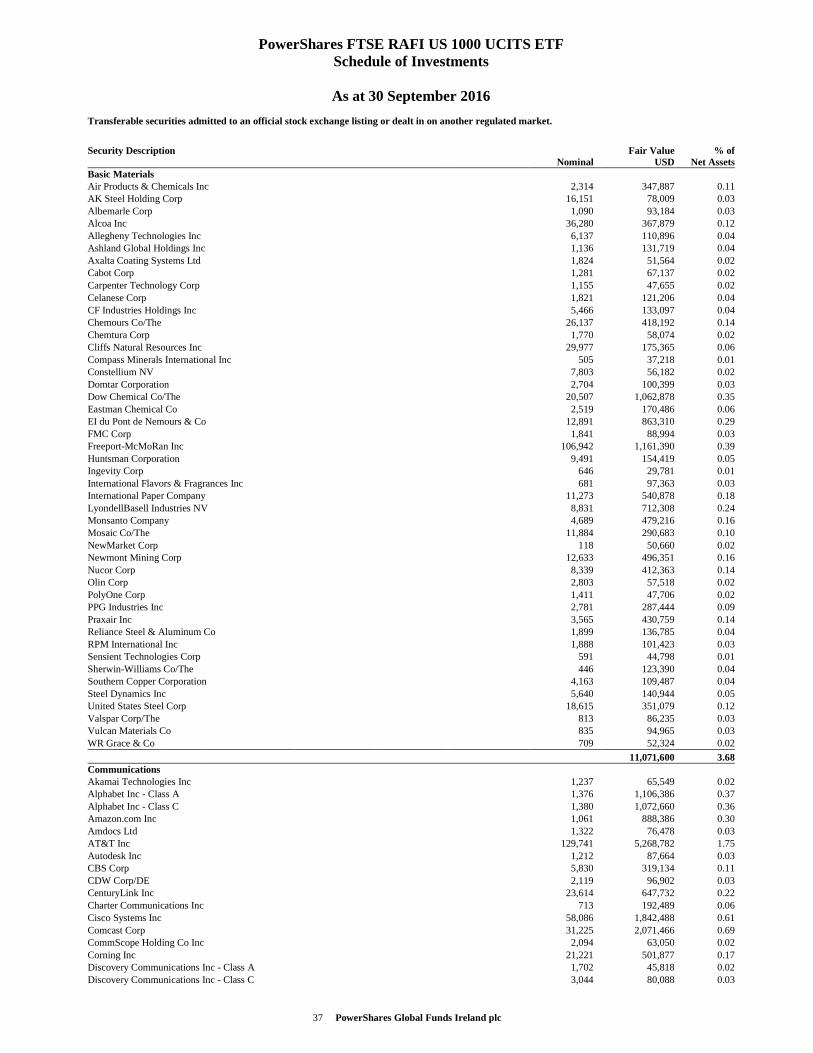
37 PowerShares Global Funds Ireland plc
PowerShares FTSE RAFI US 1000 UCITS ETF Schedule of Investments
As at 30 September 2016
Transferable securities admitted to an official stock exchange listing or dealt in on another regulated market.
Security Description Nominal
Fair ValueUSD
% ofNet Assets
Basic Materials Air Products & Chemicals Inc 2,314 347,887 0.11AK Steel Holding Corp 16,151 78,009 0.03Albemarle Corp 1,090 93,184 0.03Alcoa Inc 36,280 367,879 0.12Allegheny Technologies Inc 6,137 110,896 0.04Ashland Global Holdings Inc 1,136 131,719 0.04Axalta Coating Systems Ltd 1,824 51,564 0.02Cabot Corp 1,281 67,137 0.02Carpenter Technology Corp 1,155 47,655 0.02Celanese Corp 1,821 121,206 0.04CF Industries Holdings Inc 5,466 133,097 0.04Chemours Co/The 26,137 418,192 0.14Chemtura Corp 1,770 58,074 0.02Cliffs Natural Resources Inc 29,977 175,365 0.06Compass Minerals International Inc 505 37,218 0.01Constellium NV 7,803 56,182 0.02Domtar Corporation 2,704 100,399 0.03Dow Chemical Co/The 20,507 1,062,878 0.35Eastman Chemical Co 2,519 170,486 0.06EI du Pont de Nemours & Co 12,891 863,310 0.29FMC Corp 1,841 88,994 0.03Freeport-McMoRan Inc 106,942 1,161,390 0.39Huntsman Corporation 9,491 154,419 0.05Ingevity Corp 646 29,781 0.01International Flavors & Fragrances Inc 681 97,363 0.03International Paper Company 11,273 540,878 0.18LyondellBasell Industries NV 8,831 712,308 0.24Monsanto Company 4,689 479,216 0.16Mosaic Co/The 11,884 290,683 0.10NewMarket Corp 118 50,660 0.02Newmont Mining Corp 12,633 496,351 0.16Nucor Corp 8,339 412,363 0.14Olin Corp 2,803 57,518 0.02PolyOne Corp 1,411 47,706 0.02PPG Industries Inc 2,781 287,444 0.09Praxair Inc 3,565 430,759 0.14Reliance Steel & Aluminum Co 1,899 136,785 0.04RPM International Inc 1,888 101,423 0.03Sensient Technologies Corp 591 44,798 0.01Sherwin-Williams Co/The 446 123,390 0.04Southern Copper Corporation 4,163 109,487 0.04Steel Dynamics Inc 5,640 140,944 0.05United States Steel Corp 18,615 351,079 0.12Valspar Corp/The 813 86,235 0.03Vulcan Materials Co 835 94,965 0.03WR Grace & Co 709 52,324 0.02
11,071,600 3.68Communications Akamai Technologies Inc 1,237 65,549 0.02Alphabet Inc - Class A 1,376 1,106,386 0.37Alphabet Inc - Class C 1,380 1,072,660 0.36Amazon.com Inc 1,061 888,386 0.30Amdocs Ltd 1,322 76,478 0.03AT&T Inc 129,741 5,268,782 1.75Autodesk Inc 1,212 87,664 0.03CBS Corp 5,830 319,134 0.11CDW Corp/DE 2,119 96,902 0.03CenturyLink Inc 23,614 647,732 0.22Charter Communications Inc 713 192,489 0.06Cisco Systems Inc 58,086 1,842,488 0.61Comcast Corp 31,225 2,071,466 0.69CommScope Holding Co Inc 2,094 63,050 0.02Corning Inc 21,221 501,877 0.17Discovery Communications Inc - Class A 1,702 45,818 0.02Discovery Communications Inc - Class C 3,044 80,088 0.03
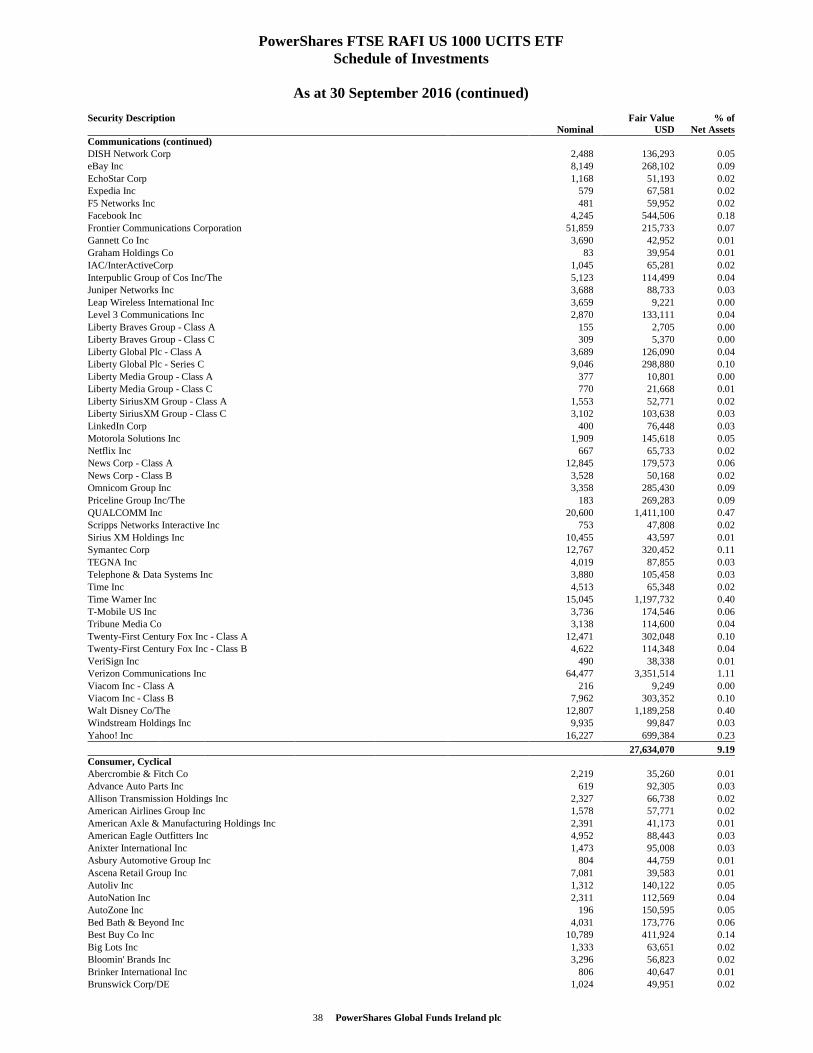
38 PowerShares Global Funds Ireland plc
PowerShares FTSE RAFI US 1000 UCITS ETF Schedule of Investments
As at 30 September 2016 (continued)
Security Description Nominal
Fair ValueUSD
% ofNet Assets
Communications (continued) DISH Network Corp 2,488 136,293 0.05eBay Inc 8,149 268,102 0.09EchoStar Corp 1,168 51,193 0.02Expedia Inc 579 67,581 0.02F5 Networks Inc 481 59,952 0.02Facebook Inc 4,245 544,506 0.18Frontier Communications Corporation 51,859 215,733 0.07Gannett Co Inc 3,690 42,952 0.01Graham Holdings Co 83 39,954 0.01IAC/InterActiveCorp 1,045 65,281 0.02Interpublic Group of Cos Inc/The 5,123 114,499 0.04Juniper Networks Inc 3,688 88,733 0.03Leap Wireless International Inc 3,659 9,221 0.00Level 3 Communications Inc 2,870 133,111 0.04Liberty Braves Group - Class A 155 2,705 0.00Liberty Braves Group - Class C 309 5,370 0.00Liberty Global Plc - Class A 3,689 126,090 0.04Liberty Global Plc - Series C 9,046 298,880 0.10Liberty Media Group - Class A 377 10,801 0.00Liberty Media Group - Class C 770 21,668 0.01Liberty SiriusXM Group - Class A 1,553 52,771 0.02Liberty SiriusXM Group - Class C 3,102 103,638 0.03LinkedIn Corp 400 76,448 0.03Motorola Solutions Inc 1,909 145,618 0.05Netflix Inc 667 65,733 0.02News Corp - Class A 12,845 179,573 0.06News Corp - Class B 3,528 50,168 0.02Omnicom Group Inc 3,358 285,430 0.09Priceline Group Inc/The 183 269,283 0.09QUALCOMM Inc 20,600 1,411,100 0.47Scripps Networks Interactive Inc 753 47,808 0.02Sirius XM Holdings Inc 10,455 43,597 0.01Symantec Corp 12,767 320,452 0.11TEGNA Inc 4,019 87,855 0.03Telephone & Data Systems Inc 3,880 105,458 0.03Time Inc 4,513 65,348 0.02Time Warner Inc 15,045 1,197,732 0.40T-Mobile US Inc 3,736 174,546 0.06Tribune Media Co 3,138 114,600 0.04Twenty-First Century Fox Inc - Class A 12,471 302,048 0.10Twenty-First Century Fox Inc - Class B 4,622 114,348 0.04VeriSign Inc 490 38,338 0.01Verizon Communications Inc 64,477 3,351,514 1.11Viacom Inc - Class A 216 9,249 0.00Viacom Inc - Class B 7,962 303,352 0.10Walt Disney Co/The 12,807 1,189,258 0.40Windstream Holdings Inc 9,935 99,847 0.03Yahoo! Inc 16,227 699,384 0.23
27,634,070 9.19Consumer, Cyclical Abercrombie & Fitch Co 2,219 35,260 0.01Advance Auto Parts Inc 619 92,305 0.03Allison Transmission Holdings Inc 2,327 66,738 0.02American Airlines Group Inc 1,578 57,771 0.02American Axle & Manufacturing Holdings Inc 2,391 41,173 0.01American Eagle Outfitters Inc 4,952 88,443 0.03Anixter International Inc 1,473 95,008 0.03Asbury Automotive Group Inc 804 44,759 0.01Ascena Retail Group Inc 7,081 39,583 0.01Autoliv Inc 1,312 140,122 0.05AutoNation Inc 2,311 112,569 0.04AutoZone Inc 196 150,595 0.05Bed Bath & Beyond Inc 4,031 173,776 0.06Best Buy Co Inc 10,789 411,924 0.14Big Lots Inc 1,333 63,651 0.02Bloomin' Brands Inc 3,296 56,823 0.02Brinker International Inc 806 40,647 0.01Brunswick Corp/DE 1,024 49,951 0.02
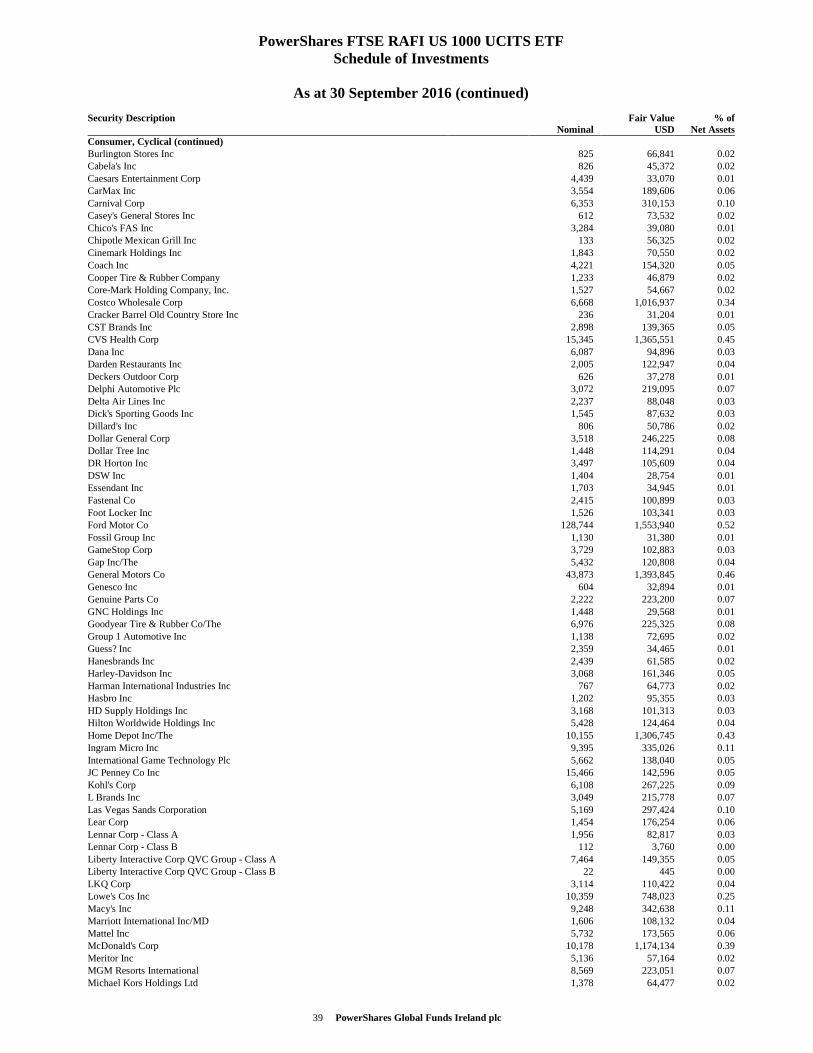
39 PowerShares Global Funds Ireland plc
PowerShares FTSE RAFI US 1000 UCITS ETF Schedule of Investments
As at 30 September 2016 (continued)
Security Description Nominal
Fair ValueUSD
% ofNet Assets
Consumer, Cyclical (continued) Burlington Stores Inc 825 66,841 0.02Cabela's Inc 826 45,372 0.02Caesars Entertainment Corp 4,439 33,070 0.01CarMax Inc 3,554 189,606 0.06Carnival Corp 6,353 310,153 0.10Casey's General Stores Inc 612 73,532 0.02Chico's FAS Inc 3,284 39,080 0.01Chipotle Mexican Grill Inc 133 56,325 0.02Cinemark Holdings Inc 1,843 70,550 0.02Coach Inc 4,221 154,320 0.05Cooper Tire & Rubber Company 1,233 46,879 0.02Core-Mark Holding Company, Inc. 1,527 54,667 0.02Costco Wholesale Corp 6,668 1,016,937 0.34Cracker Barrel Old Country Store Inc 236 31,204 0.01CST Brands Inc 2,898 139,365 0.05CVS Health Corp 15,345 1,365,551 0.45Dana Inc 6,087 94,896 0.03Darden Restaurants Inc 2,005 122,947 0.04Deckers Outdoor Corp 626 37,278 0.01Delphi Automotive Plc 3,072 219,095 0.07Delta Air Lines Inc 2,237 88,048 0.03Dick's Sporting Goods Inc 1,545 87,632 0.03Dillard's Inc 806 50,786 0.02Dollar General Corp 3,518 246,225 0.08Dollar Tree Inc 1,448 114,291 0.04DR Horton Inc 3,497 105,609 0.04DSW Inc 1,404 28,754 0.01Essendant Inc 1,703 34,945 0.01Fastenal Co 2,415 100,899 0.03Foot Locker Inc 1,526 103,341 0.03Ford Motor Co 128,744 1,553,940 0.52Fossil Group Inc 1,130 31,380 0.01GameStop Corp 3,729 102,883 0.03Gap Inc/The 5,432 120,808 0.04General Motors Co 43,873 1,393,845 0.46Genesco Inc 604 32,894 0.01Genuine Parts Co 2,222 223,200 0.07GNC Holdings Inc 1,448 29,568 0.01Goodyear Tire & Rubber Co/The 6,976 225,325 0.08Group 1 Automotive Inc 1,138 72,695 0.02Guess? Inc 2,359 34,465 0.01Hanesbrands Inc 2,439 61,585 0.02Harley-Davidson Inc 3,068 161,346 0.05Harman International Industries Inc 767 64,773 0.02Hasbro Inc 1,202 95,355 0.03HD Supply Holdings Inc 3,168 101,313 0.03Hilton Worldwide Holdings Inc 5,428 124,464 0.04Home Depot Inc/The 10,155 1,306,745 0.43Ingram Micro Inc 9,395 335,026 0.11International Game Technology Plc 5,662 138,040 0.05JC Penney Co Inc 15,466 142,596 0.05Kohl's Corp 6,108 267,225 0.09L Brands Inc 3,049 215,778 0.07Las Vegas Sands Corporation 5,169 297,424 0.10Lear Corp 1,454 176,254 0.06Lennar Corp - Class A 1,956 82,817 0.03Lennar Corp - Class B 112 3,760 0.00Liberty Interactive Corp QVC Group - Class A 7,464 149,355 0.05Liberty Interactive Corp QVC Group - Class B 22 445 0.00LKQ Corp 3,114 110,422 0.04Lowe's Cos Inc 10,359 748,023 0.25Macy's Inc 9,248 342,638 0.11Marriott International Inc/MD 1,606 108,132 0.04Mattel Inc 5,732 173,565 0.06McDonald's Corp 10,178 1,174,134 0.39Meritor Inc 5,136 57,164 0.02MGM Resorts International 8,569 223,051 0.07Michael Kors Holdings Ltd 1,378 64,477 0.02
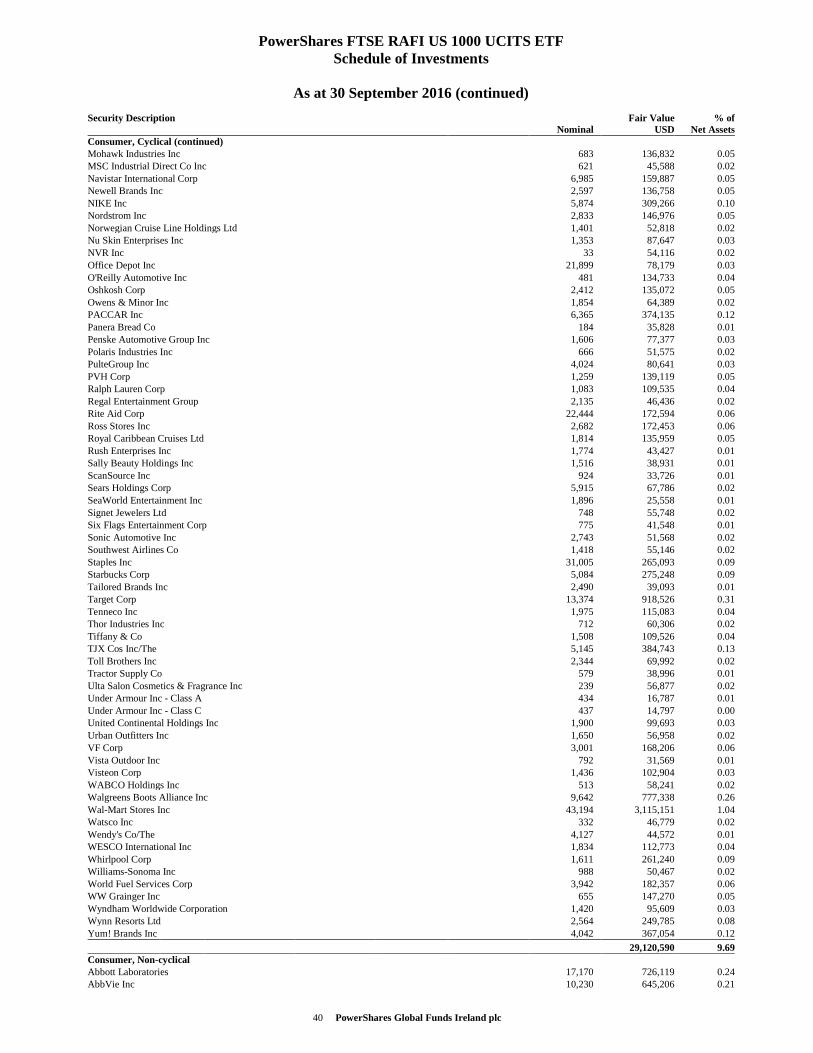
40 PowerShares Global Funds Ireland plc
PowerShares FTSE RAFI US 1000 UCITS ETF Schedule of Investments
As at 30 September 2016 (continued)
Security Description Nominal
Fair ValueUSD
% ofNet Assets
Consumer, Cyclical (continued) Mohawk Industries Inc 683 136,832 0.05MSC Industrial Direct Co Inc 621 45,588 0.02Navistar International Corp 6,985 159,887 0.05Newell Brands Inc 2,597 136,758 0.05NIKE Inc 5,874 309,266 0.10Nordstrom Inc 2,833 146,976 0.05Norwegian Cruise Line Holdings Ltd 1,401 52,818 0.02Nu Skin Enterprises Inc 1,353 87,647 0.03NVR Inc 33 54,116 0.02Office Depot Inc 21,899 78,179 0.03O'Reilly Automotive Inc 481 134,733 0.04Oshkosh Corp 2,412 135,072 0.05Owens & Minor Inc 1,854 64,389 0.02PACCAR Inc 6,365 374,135 0.12Panera Bread Co 184 35,828 0.01Penske Automotive Group Inc 1,606 77,377 0.03Polaris Industries Inc 666 51,575 0.02PulteGroup Inc 4,024 80,641 0.03PVH Corp 1,259 139,119 0.05Ralph Lauren Corp 1,083 109,535 0.04Regal Entertainment Group 2,135 46,436 0.02Rite Aid Corp 22,444 172,594 0.06Ross Stores Inc 2,682 172,453 0.06Royal Caribbean Cruises Ltd 1,814 135,959 0.05Rush Enterprises Inc 1,774 43,427 0.01Sally Beauty Holdings Inc 1,516 38,931 0.01ScanSource Inc 924 33,726 0.01Sears Holdings Corp 5,915 67,786 0.02SeaWorld Entertainment Inc 1,896 25,558 0.01Signet Jewelers Ltd 748 55,748 0.02Six Flags Entertainment Corp 775 41,548 0.01Sonic Automotive Inc 2,743 51,568 0.02Southwest Airlines Co 1,418 55,146 0.02Staples Inc 31,005 265,093 0.09Starbucks Corp 5,084 275,248 0.09Tailored Brands Inc 2,490 39,093 0.01Target Corp 13,374 918,526 0.31Tenneco Inc 1,975 115,083 0.04Thor Industries Inc 712 60,306 0.02Tiffany & Co 1,508 109,526 0.04TJX Cos Inc/The 5,145 384,743 0.13Toll Brothers Inc 2,344 69,992 0.02Tractor Supply Co 579 38,996 0.01Ulta Salon Cosmetics & Fragrance Inc 239 56,877 0.02Under Armour Inc - Class A 434 16,787 0.01Under Armour Inc - Class C 437 14,797 0.00United Continental Holdings Inc 1,900 99,693 0.03Urban Outfitters Inc 1,650 56,958 0.02VF Corp 3,001 168,206 0.06Vista Outdoor Inc 792 31,569 0.01Visteon Corp 1,436 102,904 0.03WABCO Holdings Inc 513 58,241 0.02Walgreens Boots Alliance Inc 9,642 777,338 0.26Wal-Mart Stores Inc 43,194 3,115,151 1.04Watsco Inc 332 46,779 0.02Wendy's Co/The 4,127 44,572 0.01WESCO International Inc 1,834 112,773 0.04Whirlpool Corp 1,611 261,240 0.09Williams-Sonoma Inc 988 50,467 0.02World Fuel Services Corp 3,942 182,357 0.06WW Grainger Inc 655 147,270 0.05Wyndham Worldwide Corporation 1,420 95,609 0.03Wynn Resorts Ltd 2,564 249,785 0.08Yum! Brands Inc 4,042 367,054 0.12
29,120,590 9.69Consumer, Non-cyclical Abbott Laboratories 17,170 726,119 0.24AbbVie Inc 10,230 645,206 0.21
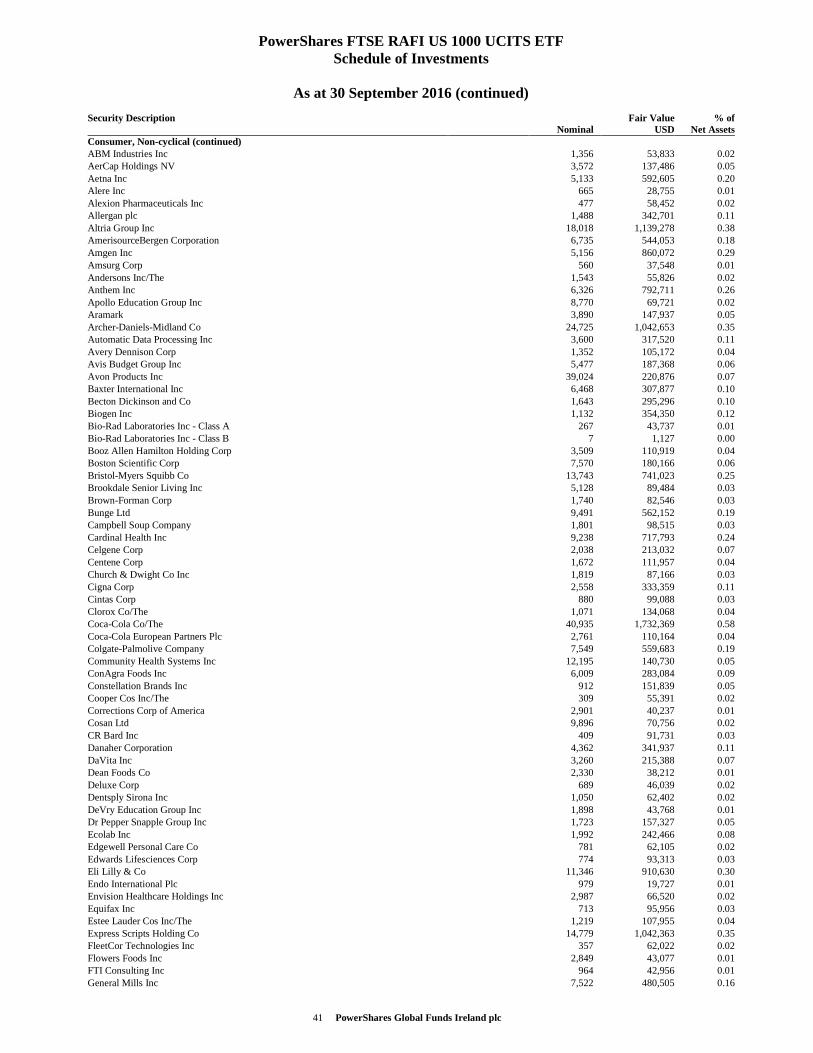
41 PowerShares Global Funds Ireland plc
PowerShares FTSE RAFI US 1000 UCITS ETF Schedule of Investments
As at 30 September 2016 (continued)
Security Description Nominal
Fair ValueUSD
% ofNet Assets
Consumer, Non-cyclical (continued) ABM Industries Inc 1,356 53,833 0.02AerCap Holdings NV 3,572 137,486 0.05Aetna Inc 5,133 592,605 0.20Alere Inc 665 28,755 0.01Alexion Pharmaceuticals Inc 477 58,452 0.02Allergan plc 1,488 342,701 0.11Altria Group Inc 18,018 1,139,278 0.38AmerisourceBergen Corporation 6,735 544,053 0.18Amgen Inc 5,156 860,072 0.29Amsurg Corp 560 37,548 0.01Andersons Inc/The 1,543 55,826 0.02Anthem Inc 6,326 792,711 0.26Apollo Education Group Inc 8,770 69,721 0.02Aramark 3,890 147,937 0.05Archer-Daniels-Midland Co 24,725 1,042,653 0.35Automatic Data Processing Inc 3,600 317,520 0.11Avery Dennison Corp 1,352 105,172 0.04Avis Budget Group Inc 5,477 187,368 0.06Avon Products Inc 39,024 220,876 0.07Baxter International Inc 6,468 307,877 0.10Becton Dickinson and Co 1,643 295,296 0.10Biogen Inc 1,132 354,350 0.12Bio-Rad Laboratories Inc - Class A 267 43,737 0.01Bio-Rad Laboratories Inc - Class B 7 1,127 0.00Booz Allen Hamilton Holding Corp 3,509 110,919 0.04Boston Scientific Corp 7,570 180,166 0.06Bristol-Myers Squibb Co 13,743 741,023 0.25Brookdale Senior Living Inc 5,128 89,484 0.03Brown-Forman Corp 1,740 82,546 0.03Bunge Ltd 9,491 562,152 0.19Campbell Soup Company 1,801 98,515 0.03Cardinal Health Inc 9,238 717,793 0.24Celgene Corp 2,038 213,032 0.07Centene Corp 1,672 111,957 0.04Church & Dwight Co Inc 1,819 87,166 0.03Cigna Corp 2,558 333,359 0.11Cintas Corp 880 99,088 0.03Clorox Co/The 1,071 134,068 0.04Coca-Cola Co/The 40,935 1,732,369 0.58Coca-Cola European Partners Plc 2,761 110,164 0.04Colgate-Palmolive Company 7,549 559,683 0.19Community Health Systems Inc 12,195 140,730 0.05ConAgra Foods Inc 6,009 283,084 0.09Constellation Brands Inc 912 151,839 0.05Cooper Cos Inc/The 309 55,391 0.02Corrections Corp of America 2,901 40,237 0.01Cosan Ltd 9,896 70,756 0.02CR Bard Inc 409 91,731 0.03Danaher Corporation 4,362 341,937 0.11DaVita Inc 3,260 215,388 0.07Dean Foods Co 2,330 38,212 0.01Deluxe Corp 689 46,039 0.02Dentsply Sirona Inc 1,050 62,402 0.02DeVry Education Group Inc 1,898 43,768 0.01Dr Pepper Snapple Group Inc 1,723 157,327 0.05Ecolab Inc 1,992 242,466 0.08Edgewell Personal Care Co 781 62,105 0.02Edwards Lifesciences Corp 774 93,313 0.03Eli Lilly & Co 11,346 910,630 0.30Endo International Plc 979 19,727 0.01Envision Healthcare Holdings Inc 2,987 66,520 0.02Equifax Inc 713 95,956 0.03Estee Lauder Cos Inc/The 1,219 107,955 0.04Express Scripts Holding Co 14,779 1,042,363 0.35FleetCor Technologies Inc 357 62,022 0.02Flowers Foods Inc 2,849 43,077 0.01FTI Consulting Inc 964 42,956 0.01General Mills Inc 7,522 480,505 0.16
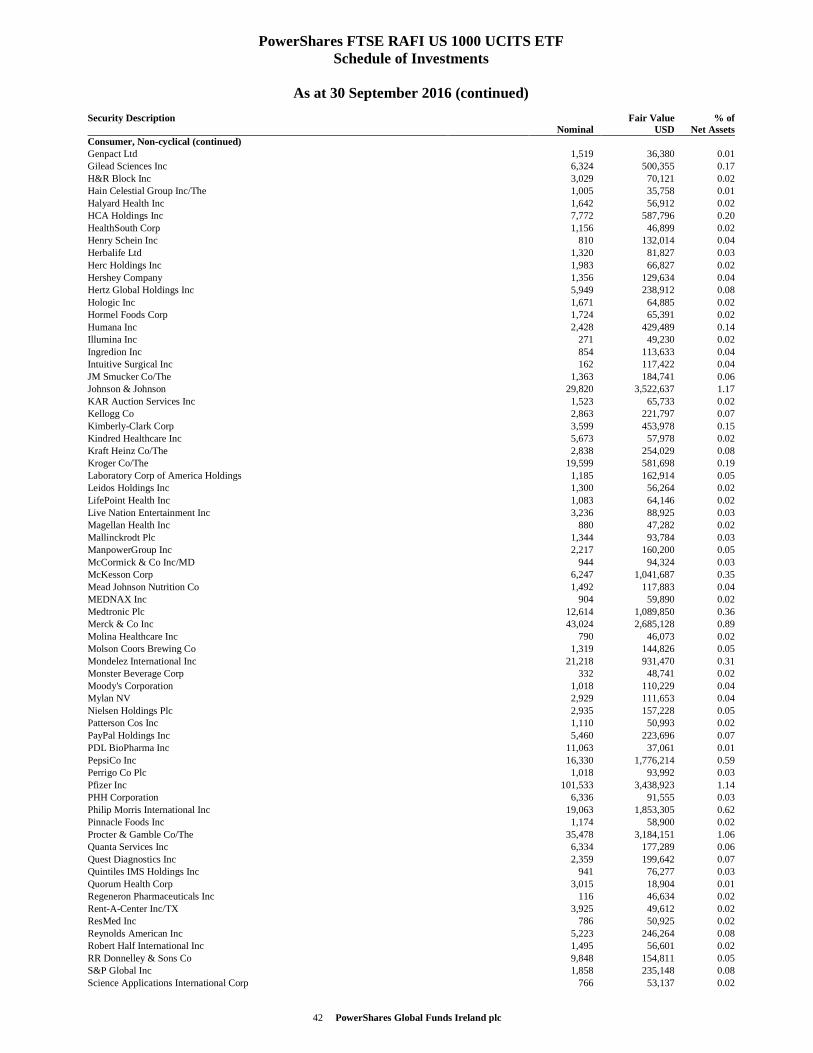
42 PowerShares Global Funds Ireland plc
PowerShares FTSE RAFI US 1000 UCITS ETF Schedule of Investments
As at 30 September 2016 (continued)
Security Description Nominal
Fair ValueUSD
% ofNet Assets
Consumer, Non-cyclical (continued) Genpact Ltd 1,519 36,380 0.01Gilead Sciences Inc 6,324 500,355 0.17H&R Block Inc 3,029 70,121 0.02Hain Celestial Group Inc/The 1,005 35,758 0.01Halyard Health Inc 1,642 56,912 0.02HCA Holdings Inc 7,772 587,796 0.20HealthSouth Corp 1,156 46,899 0.02Henry Schein Inc 810 132,014 0.04Herbalife Ltd 1,320 81,827 0.03Herc Holdings Inc 1,983 66,827 0.02Hershey Company 1,356 129,634 0.04Hertz Global Holdings Inc 5,949 238,912 0.08Hologic Inc 1,671 64,885 0.02Hormel Foods Corp 1,724 65,391 0.02Humana Inc 2,428 429,489 0.14Illumina Inc 271 49,230 0.02Ingredion Inc 854 113,633 0.04Intuitive Surgical Inc 162 117,422 0.04JM Smucker Co/The 1,363 184,741 0.06Johnson & Johnson 29,820 3,522,637 1.17KAR Auction Services Inc 1,523 65,733 0.02Kellogg Co 2,863 221,797 0.07Kimberly-Clark Corp 3,599 453,978 0.15Kindred Healthcare Inc 5,673 57,978 0.02Kraft Heinz Co/The 2,838 254,029 0.08Kroger Co/The 19,599 581,698 0.19Laboratory Corp of America Holdings 1,185 162,914 0.05Leidos Holdings Inc 1,300 56,264 0.02LifePoint Health Inc 1,083 64,146 0.02Live Nation Entertainment Inc 3,236 88,925 0.03Magellan Health Inc 880 47,282 0.02Mallinckrodt Plc 1,344 93,784 0.03ManpowerGroup Inc 2,217 160,200 0.05McCormick & Co Inc/MD 944 94,324 0.03McKesson Corp 6,247 1,041,687 0.35Mead Johnson Nutrition Co 1,492 117,883 0.04MEDNAX Inc 904 59,890 0.02Medtronic Plc 12,614 1,089,850 0.36Merck & Co Inc 43,024 2,685,128 0.89Molina Healthcare Inc 790 46,073 0.02Molson Coors Brewing Co 1,319 144,826 0.05Mondelez International Inc 21,218 931,470 0.31Monster Beverage Corp 332 48,741 0.02Moody's Corporation 1,018 110,229 0.04Mylan NV 2,929 111,653 0.04Nielsen Holdings Plc 2,935 157,228 0.05Patterson Cos Inc 1,110 50,993 0.02PayPal Holdings Inc 5,460 223,696 0.07PDL BioPharma Inc 11,063 37,061 0.01PepsiCo Inc 16,330 1,776,214 0.59Perrigo Co Plc 1,018 93,992 0.03Pfizer Inc 101,533 3,438,923 1.14PHH Corporation 6,336 91,555 0.03Philip Morris International Inc 19,063 1,853,305 0.62Pinnacle Foods Inc 1,174 58,900 0.02Procter & Gamble Co/The 35,478 3,184,151 1.06Quanta Services Inc 6,334 177,289 0.06Quest Diagnostics Inc 2,359 199,642 0.07Quintiles IMS Holdings Inc 941 76,277 0.03Quorum Health Corp 3,015 18,904 0.01Regeneron Pharmaceuticals Inc 116 46,634 0.02Rent-A-Center Inc/TX 3,925 49,612 0.02ResMed Inc 786 50,925 0.02Reynolds American Inc 5,223 246,264 0.08Robert Half International Inc 1,495 56,601 0.02RR Donnelley & Sons Co 9,848 154,811 0.05S&P Global Inc 1,858 235,148 0.08Science Applications International Corp 766 53,137 0.02
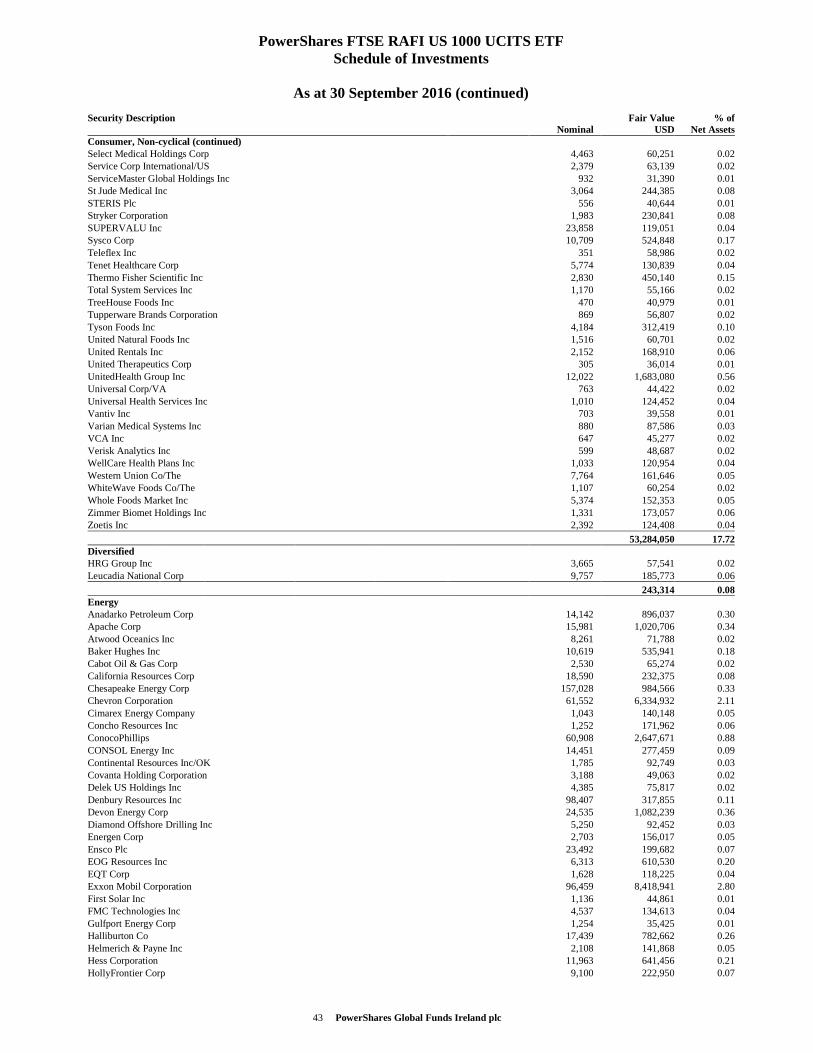
43 PowerShares Global Funds Ireland plc
PowerShares FTSE RAFI US 1000 UCITS ETF Schedule of Investments
As at 30 September 2016 (continued)
Security Description Nominal
Fair ValueUSD
% ofNet Assets
Consumer, Non-cyclical (continued) Select Medical Holdings Corp 4,463 60,251 0.02Service Corp International/US 2,379 63,139 0.02ServiceMaster Global Holdings Inc 932 31,390 0.01St Jude Medical Inc 3,064 244,385 0.08STERIS Plc 556 40,644 0.01Stryker Corporation 1,983 230,841 0.08SUPERVALU Inc 23,858 119,051 0.04Sysco Corp 10,709 524,848 0.17Teleflex Inc 351 58,986 0.02Tenet Healthcare Corp 5,774 130,839 0.04Thermo Fisher Scientific Inc 2,830 450,140 0.15Total System Services Inc 1,170 55,166 0.02TreeHouse Foods Inc 470 40,979 0.01Tupperware Brands Corporation 869 56,807 0.02Tyson Foods Inc 4,184 312,419 0.10United Natural Foods Inc 1,516 60,701 0.02United Rentals Inc 2,152 168,910 0.06United Therapeutics Corp 305 36,014 0.01UnitedHealth Group Inc 12,022 1,683,080 0.56Universal Corp/VA 763 44,422 0.02Universal Health Services Inc 1,010 124,452 0.04Vantiv Inc 703 39,558 0.01Varian Medical Systems Inc 880 87,586 0.03VCA Inc 647 45,277 0.02Verisk Analytics Inc 599 48,687 0.02WellCare Health Plans Inc 1,033 120,954 0.04Western Union Co/The 7,764 161,646 0.05WhiteWave Foods Co/The 1,107 60,254 0.02Whole Foods Market Inc 5,374 152,353 0.05Zimmer Biomet Holdings Inc 1,331 173,057 0.06Zoetis Inc 2,392 124,408 0.04
53,284,050 17.72Diversified HRG Group Inc 3,665 57,541 0.02Leucadia National Corp 9,757 185,773 0.06
243,314 0.08Energy Anadarko Petroleum Corp 14,142 896,037 0.30Apache Corp 15,981 1,020,706 0.34Atwood Oceanics Inc 8,261 71,788 0.02Baker Hughes Inc 10,619 535,941 0.18Cabot Oil & Gas Corp 2,530 65,274 0.02California Resources Corp 18,590 232,375 0.08Chesapeake Energy Corp 157,028 984,566 0.33Chevron Corporation 61,552 6,334,932 2.11Cimarex Energy Company 1,043 140,148 0.05Concho Resources Inc 1,252 171,962 0.06ConocoPhillips 60,908 2,647,671 0.88CONSOL Energy Inc 14,451 277,459 0.09Continental Resources Inc/OK 1,785 92,749 0.03Covanta Holding Corporation 3,188 49,063 0.02Delek US Holdings Inc 4,385 75,817 0.02Denbury Resources Inc 98,407 317,855 0.11Devon Energy Corp 24,535 1,082,239 0.36Diamond Offshore Drilling Inc 5,250 92,452 0.03Energen Corp 2,703 156,017 0.05Ensco Plc 23,492 199,682 0.07EOG Resources Inc 6,313 610,530 0.20EQT Corp 1,628 118,225 0.04Exxon Mobil Corporation 96,459 8,418,941 2.80First Solar Inc 1,136 44,861 0.01FMC Technologies Inc 4,537 134,613 0.04Gulfport Energy Corp 1,254 35,425 0.01Halliburton Co 17,439 782,662 0.26Helmerich & Payne Inc 2,108 141,868 0.05Hess Corporation 11,963 641,456 0.21HollyFrontier Corp 9,100 222,950 0.07
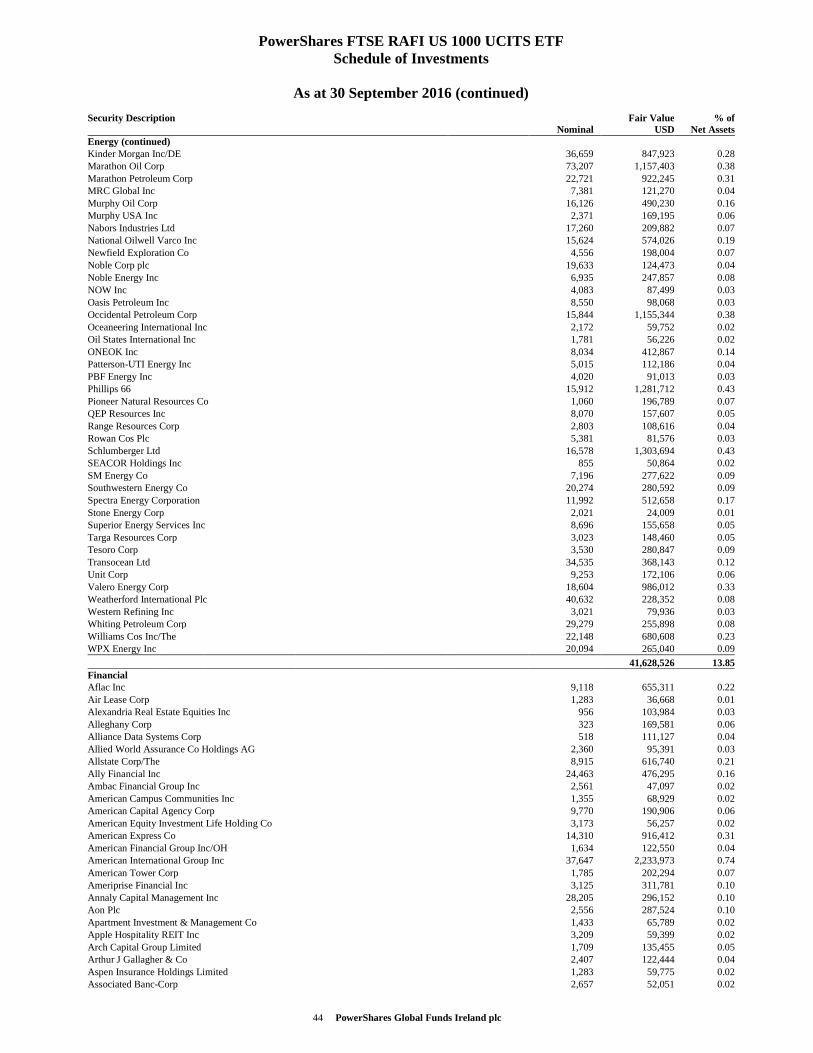
44 PowerShares Global Funds Ireland plc
PowerShares FTSE RAFI US 1000 UCITS ETF Schedule of Investments
As at 30 September 2016 (continued)
Security Description Nominal
Fair ValueUSD
% ofNet Assets
Energy (continued) Kinder Morgan Inc/DE 36,659 847,923 0.28Marathon Oil Corp 73,207 1,157,403 0.38Marathon Petroleum Corp 22,721 922,245 0.31MRC Global Inc 7,381 121,270 0.04Murphy Oil Corp 16,126 490,230 0.16Murphy USA Inc 2,371 169,195 0.06Nabors Industries Ltd 17,260 209,882 0.07National Oilwell Varco Inc 15,624 574,026 0.19Newfield Exploration Co 4,556 198,004 0.07Noble Corp plc 19,633 124,473 0.04Noble Energy Inc 6,935 247,857 0.08NOW Inc 4,083 87,499 0.03Oasis Petroleum Inc 8,550 98,068 0.03Occidental Petroleum Corp 15,844 1,155,344 0.38Oceaneering International Inc 2,172 59,752 0.02Oil States International Inc 1,781 56,226 0.02ONEOK Inc 8,034 412,867 0.14Patterson-UTI Energy Inc 5,015 112,186 0.04PBF Energy Inc 4,020 91,013 0.03Phillips 66 15,912 1,281,712 0.43Pioneer Natural Resources Co 1,060 196,789 0.07QEP Resources Inc 8,070 157,607 0.05Range Resources Corp 2,803 108,616 0.04Rowan Cos Plc 5,381 81,576 0.03Schlumberger Ltd 16,578 1,303,694 0.43SEACOR Holdings Inc 855 50,864 0.02SM Energy Co 7,196 277,622 0.09Southwestern Energy Co 20,274 280,592 0.09Spectra Energy Corporation 11,992 512,658 0.17Stone Energy Corp 2,021 24,009 0.01Superior Energy Services Inc 8,696 155,658 0.05Targa Resources Corp 3,023 148,460 0.05Tesoro Corp 3,530 280,847 0.09Transocean Ltd 34,535 368,143 0.12Unit Corp 9,253 172,106 0.06Valero Energy Corp 18,604 986,012 0.33Weatherford International Plc 40,632 228,352 0.08Western Refining Inc 3,021 79,936 0.03Whiting Petroleum Corp 29,279 255,898 0.08Williams Cos Inc/The 22,148 680,608 0.23WPX Energy Inc 20,094 265,040 0.09
41,628,526 13.85Financial Aflac Inc 9,118 655,311 0.22Air Lease Corp 1,283 36,668 0.01Alexandria Real Estate Equities Inc 956 103,984 0.03Alleghany Corp 323 169,581 0.06Alliance Data Systems Corp 518 111,127 0.04Allied World Assurance Co Holdings AG 2,360 95,391 0.03Allstate Corp/The 8,915 616,740 0.21Ally Financial Inc 24,463 476,295 0.16Ambac Financial Group Inc 2,561 47,097 0.02American Campus Communities Inc 1,355 68,929 0.02American Capital Agency Corp 9,770 190,906 0.06American Equity Investment Life Holding Co 3,173 56,257 0.02American Express Co 14,310 916,412 0.31American Financial Group Inc/OH 1,634 122,550 0.04American International Group Inc 37,647 2,233,973 0.74American Tower Corp 1,785 202,294 0.07Ameriprise Financial Inc 3,125 311,781 0.10Annaly Capital Management Inc 28,205 296,152 0.10Aon Plc 2,556 287,524 0.10Apartment Investment & Management Co 1,433 65,789 0.02Apple Hospitality REIT Inc 3,209 59,399 0.02Arch Capital Group Limited 1,709 135,455 0.05Arthur J Gallagher & Co 2,407 122,444 0.04Aspen Insurance Holdings Limited 1,283 59,775 0.02Associated Banc-Corp 2,657 52,051 0.02
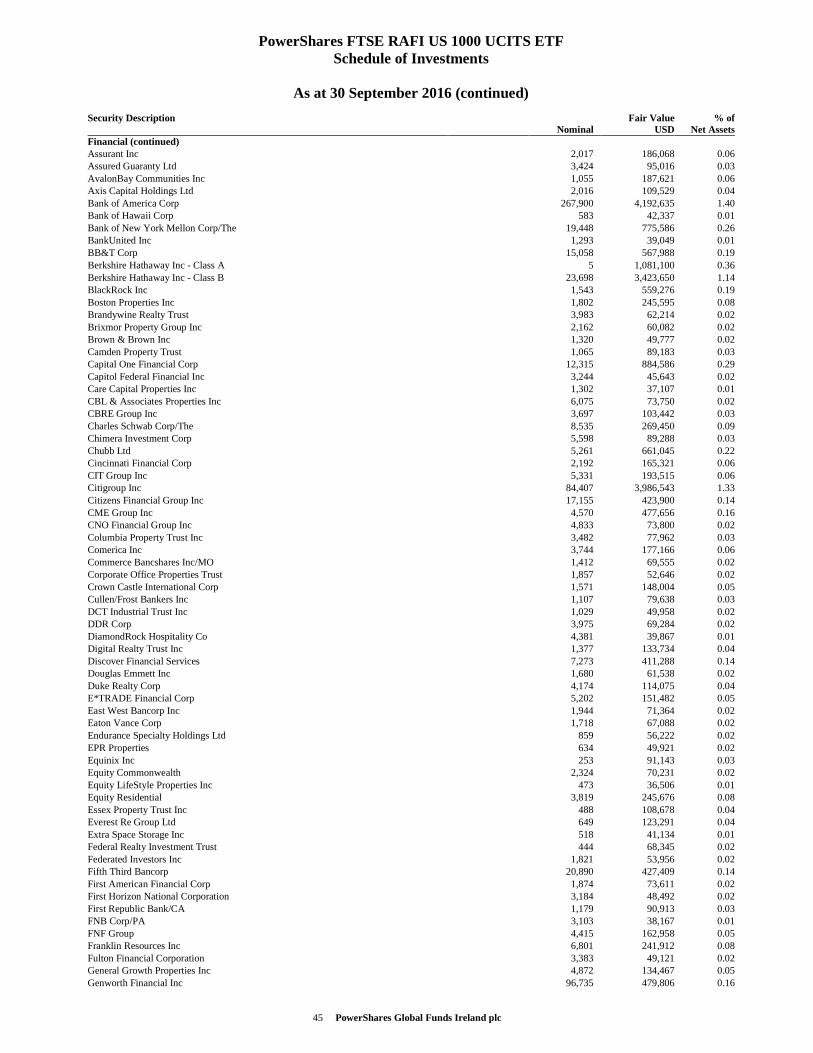
45 PowerShares Global Funds Ireland plc
PowerShares FTSE RAFI US 1000 UCITS ETF Schedule of Investments
As at 30 September 2016 (continued)
Security Description Nominal
Fair ValueUSD
% ofNet Assets
Financial (continued) Assurant Inc 2,017 186,068 0.06Assured Guaranty Ltd 3,424 95,016 0.03AvalonBay Communities Inc 1,055 187,621 0.06Axis Capital Holdings Ltd 2,016 109,529 0.04Bank of America Corp 267,900 4,192,635 1.40Bank of Hawaii Corp 583 42,337 0.01Bank of New York Mellon Corp/The 19,448 775,586 0.26BankUnited Inc 1,293 39,049 0.01BB&T Corp 15,058 567,988 0.19Berkshire Hathaway Inc - Class A 5 1,081,100 0.36Berkshire Hathaway Inc - Class B 23,698 3,423,650 1.14BlackRock Inc 1,543 559,276 0.19Boston Properties Inc 1,802 245,595 0.08Brandywine Realty Trust 3,983 62,214 0.02Brixmor Property Group Inc 2,162 60,082 0.02Brown & Brown Inc 1,320 49,777 0.02Camden Property Trust 1,065 89,183 0.03Capital One Financial Corp 12,315 884,586 0.29Capitol Federal Financial Inc 3,244 45,643 0.02Care Capital Properties Inc 1,302 37,107 0.01CBL & Associates Properties Inc 6,075 73,750 0.02CBRE Group Inc 3,697 103,442 0.03Charles Schwab Corp/The 8,535 269,450 0.09Chimera Investment Corp 5,598 89,288 0.03Chubb Ltd 5,261 661,045 0.22Cincinnati Financial Corp 2,192 165,321 0.06CIT Group Inc 5,331 193,515 0.06Citigroup Inc 84,407 3,986,543 1.33Citizens Financial Group Inc 17,155 423,900 0.14CME Group Inc 4,570 477,656 0.16CNO Financial Group Inc 4,833 73,800 0.02Columbia Property Trust Inc 3,482 77,962 0.03Comerica Inc 3,744 177,166 0.06Commerce Bancshares Inc/MO 1,412 69,555 0.02Corporate Office Properties Trust 1,857 52,646 0.02Crown Castle International Corp 1,571 148,004 0.05Cullen/Frost Bankers Inc 1,107 79,638 0.03DCT Industrial Trust Inc 1,029 49,958 0.02DDR Corp 3,975 69,284 0.02DiamondRock Hospitality Co 4,381 39,867 0.01Digital Realty Trust Inc 1,377 133,734 0.04Discover Financial Services 7,273 411,288 0.14Douglas Emmett Inc 1,680 61,538 0.02Duke Realty Corp 4,174 114,075 0.04E*TRADE Financial Corp 5,202 151,482 0.05East West Bancorp Inc 1,944 71,364 0.02Eaton Vance Corp 1,718 67,088 0.02Endurance Specialty Holdings Ltd 859 56,222 0.02EPR Properties 634 49,921 0.02Equinix Inc 253 91,143 0.03Equity Commonwealth 2,324 70,231 0.02Equity LifeStyle Properties Inc 473 36,506 0.01Equity Residential 3,819 245,676 0.08Essex Property Trust Inc 488 108,678 0.04Everest Re Group Ltd 649 123,291 0.04Extra Space Storage Inc 518 41,134 0.01Federal Realty Investment Trust 444 68,345 0.02Federated Investors Inc 1,821 53,956 0.02Fifth Third Bancorp 20,890 427,409 0.14First American Financial Corp 1,874 73,611 0.02First Horizon National Corporation 3,184 48,492 0.02First Republic Bank/CA 1,179 90,913 0.03FNB Corp/PA 3,103 38,167 0.01FNF Group 4,415 162,958 0.05Franklin Resources Inc 6,801 241,912 0.08Fulton Financial Corporation 3,383 49,121 0.02General Growth Properties Inc 4,872 134,467 0.05Genworth Financial Inc 96,735 479,806 0.16
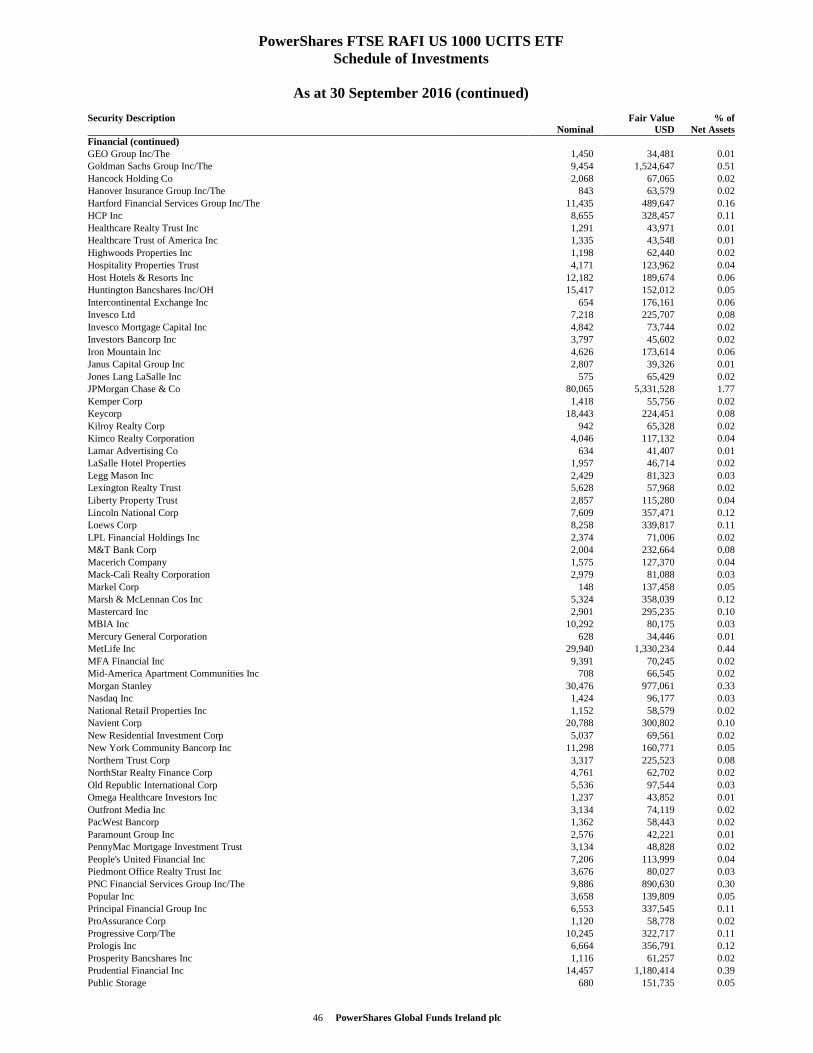
46 PowerShares Global Funds Ireland plc
PowerShares FTSE RAFI US 1000 UCITS ETF Schedule of Investments
As at 30 September 2016 (continued)
Security Description Nominal
Fair ValueUSD
% ofNet Assets
Financial (continued) GEO Group Inc/The 1,450 34,481 0.01Goldman Sachs Group Inc/The 9,454 1,524,647 0.51Hancock Holding Co 2,068 67,065 0.02Hanover Insurance Group Inc/The 843 63,579 0.02Hartford Financial Services Group Inc/The 11,435 489,647 0.16HCP Inc 8,655 328,457 0.11Healthcare Realty Trust Inc 1,291 43,971 0.01Healthcare Trust of America Inc 1,335 43,548 0.01Highwoods Properties Inc 1,198 62,440 0.02Hospitality Properties Trust 4,171 123,962 0.04Host Hotels & Resorts Inc 12,182 189,674 0.06Huntington Bancshares Inc/OH 15,417 152,012 0.05Intercontinental Exchange Inc 654 176,161 0.06Invesco Ltd 7,218 225,707 0.08Invesco Mortgage Capital Inc 4,842 73,744 0.02Investors Bancorp Inc 3,797 45,602 0.02Iron Mountain Inc 4,626 173,614 0.06Janus Capital Group Inc 2,807 39,326 0.01Jones Lang LaSalle Inc 575 65,429 0.02JPMorgan Chase & Co 80,065 5,331,528 1.77Kemper Corp 1,418 55,756 0.02Keycorp 18,443 224,451 0.08Kilroy Realty Corp 942 65,328 0.02Kimco Realty Corporation 4,046 117,132 0.04Lamar Advertising Co 634 41,407 0.01LaSalle Hotel Properties 1,957 46,714 0.02Legg Mason Inc 2,429 81,323 0.03Lexington Realty Trust 5,628 57,968 0.02Liberty Property Trust 2,857 115,280 0.04Lincoln National Corp 7,609 357,471 0.12Loews Corp 8,258 339,817 0.11LPL Financial Holdings Inc 2,374 71,006 0.02M&T Bank Corp 2,004 232,664 0.08Macerich Company 1,575 127,370 0.04Mack-Cali Realty Corporation 2,979 81,088 0.03Markel Corp 148 137,458 0.05Marsh & McLennan Cos Inc 5,324 358,039 0.12Mastercard Inc 2,901 295,235 0.10MBIA Inc 10,292 80,175 0.03Mercury General Corporation 628 34,446 0.01MetLife Inc 29,940 1,330,234 0.44MFA Financial Inc 9,391 70,245 0.02Mid-America Apartment Communities Inc 708 66,545 0.02Morgan Stanley 30,476 977,061 0.33Nasdaq Inc 1,424 96,177 0.03National Retail Properties Inc 1,152 58,579 0.02Navient Corp 20,788 300,802 0.10New Residential Investment Corp 5,037 69,561 0.02New York Community Bancorp Inc 11,298 160,771 0.05Northern Trust Corp 3,317 225,523 0.08NorthStar Realty Finance Corp 4,761 62,702 0.02Old Republic International Corp 5,536 97,544 0.03Omega Healthcare Investors Inc 1,237 43,852 0.01Outfront Media Inc 3,134 74,119 0.02PacWest Bancorp 1,362 58,443 0.02Paramount Group Inc 2,576 42,221 0.01PennyMac Mortgage Investment Trust 3,134 48,828 0.02People's United Financial Inc 7,206 113,999 0.04Piedmont Office Realty Trust Inc 3,676 80,027 0.03PNC Financial Services Group Inc/The 9,886 890,630 0.30Popular Inc 3,658 139,809 0.05Principal Financial Group Inc 6,553 337,545 0.11ProAssurance Corp 1,120 58,778 0.02Progressive Corp/The 10,245 322,717 0.11Prologis Inc 6,664 356,791 0.12Prosperity Bancshares Inc 1,116 61,257 0.02Prudential Financial Inc 14,457 1,180,414 0.39Public Storage 680 151,735 0.05
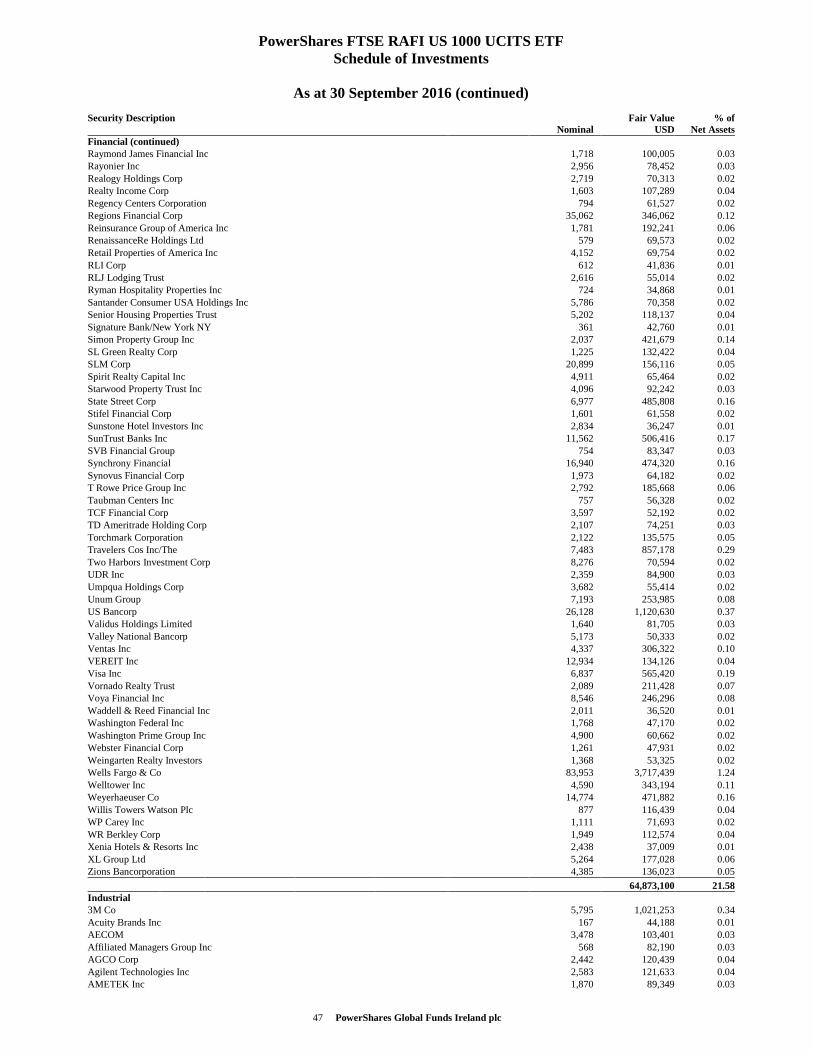
47 PowerShares Global Funds Ireland plc
PowerShares FTSE RAFI US 1000 UCITS ETF Schedule of Investments
As at 30 September 2016 (continued)
Security Description Nominal
Fair ValueUSD
% ofNet Assets
Financial (continued) Raymond James Financial Inc 1,718 100,005 0.03Rayonier Inc 2,956 78,452 0.03Realogy Holdings Corp 2,719 70,313 0.02Realty Income Corp 1,603 107,289 0.04Regency Centers Corporation 794 61,527 0.02Regions Financial Corp 35,062 346,062 0.12Reinsurance Group of America Inc 1,781 192,241 0.06RenaissanceRe Holdings Ltd 579 69,573 0.02Retail Properties of America Inc 4,152 69,754 0.02RLI Corp 612 41,836 0.01RLJ Lodging Trust 2,616 55,014 0.02Ryman Hospitality Properties Inc 724 34,868 0.01Santander Consumer USA Holdings Inc 5,786 70,358 0.02Senior Housing Properties Trust 5,202 118,137 0.04Signature Bank/New York NY 361 42,760 0.01Simon Property Group Inc 2,037 421,679 0.14SL Green Realty Corp 1,225 132,422 0.04SLM Corp 20,899 156,116 0.05Spirit Realty Capital Inc 4,911 65,464 0.02Starwood Property Trust Inc 4,096 92,242 0.03State Street Corp 6,977 485,808 0.16Stifel Financial Corp 1,601 61,558 0.02Sunstone Hotel Investors Inc 2,834 36,247 0.01SunTrust Banks Inc 11,562 506,416 0.17SVB Financial Group 754 83,347 0.03Synchrony Financial 16,940 474,320 0.16Synovus Financial Corp 1,973 64,182 0.02T Rowe Price Group Inc 2,792 185,668 0.06Taubman Centers Inc 757 56,328 0.02TCF Financial Corp 3,597 52,192 0.02TD Ameritrade Holding Corp 2,107 74,251 0.03Torchmark Corporation 2,122 135,575 0.05Travelers Cos Inc/The 7,483 857,178 0.29Two Harbors Investment Corp 8,276 70,594 0.02UDR Inc 2,359 84,900 0.03Umpqua Holdings Corp 3,682 55,414 0.02Unum Group 7,193 253,985 0.08US Bancorp 26,128 1,120,630 0.37Validus Holdings Limited 1,640 81,705 0.03Valley National Bancorp 5,173 50,333 0.02Ventas Inc 4,337 306,322 0.10VEREIT Inc 12,934 134,126 0.04Visa Inc 6,837 565,420 0.19Vornado Realty Trust 2,089 211,428 0.07Voya Financial Inc 8,546 246,296 0.08Waddell & Reed Financial Inc 2,011 36,520 0.01Washington Federal Inc 1,768 47,170 0.02Washington Prime Group Inc 4,900 60,662 0.02Webster Financial Corp 1,261 47,931 0.02Weingarten Realty Investors 1,368 53,325 0.02Wells Fargo & Co 83,953 3,717,439 1.24Welltower Inc 4,590 343,194 0.11Weyerhaeuser Co 14,774 471,882 0.16Willis Towers Watson Plc 877 116,439 0.04WP Carey Inc 1,111 71,693 0.02WR Berkley Corp 1,949 112,574 0.04Xenia Hotels & Resorts Inc 2,438 37,009 0.01XL Group Ltd 5,264 177,028 0.06Zions Bancorporation 4,385 136,023 0.05
64,873,100 21.58Industrial 3M Co 5,795 1,021,253 0.34Acuity Brands Inc 167 44,188 0.01AECOM 3,478 103,401 0.03Affiliated Managers Group Inc 568 82,190 0.03AGCO Corp 2,442 120,439 0.04Agilent Technologies Inc 2,583 121,633 0.04AMETEK Inc 1,870 89,349 0.03
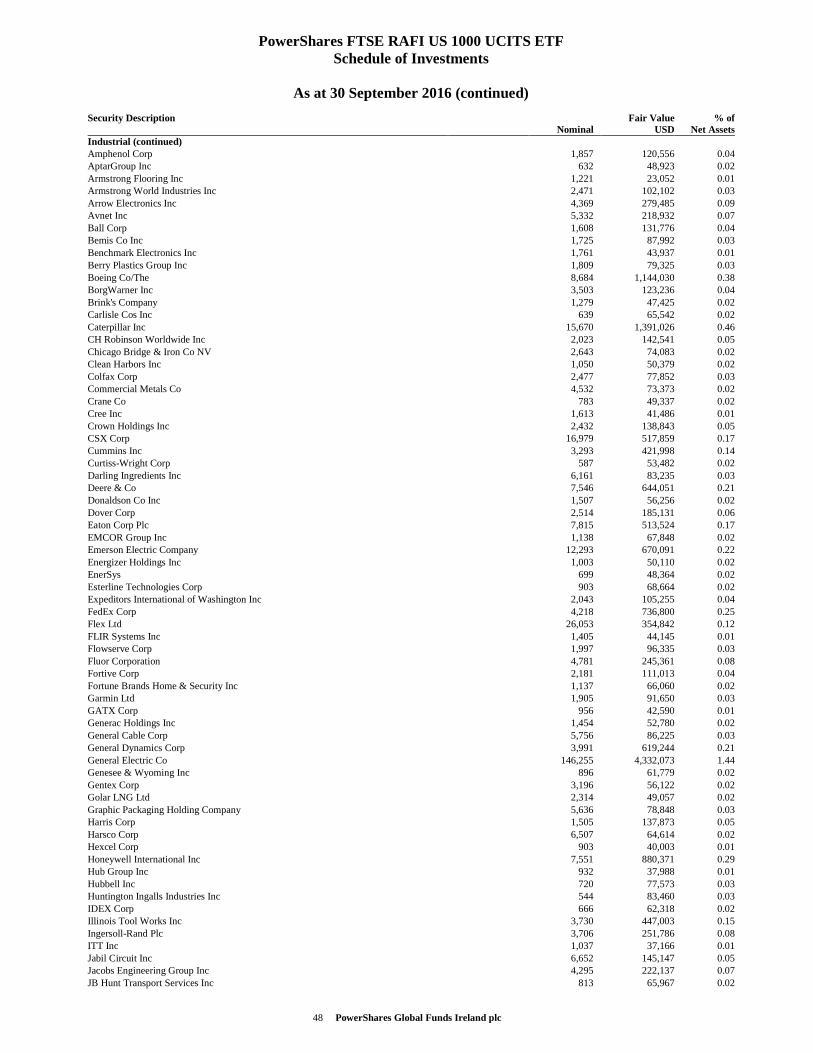
48 PowerShares Global Funds Ireland plc
PowerShares FTSE RAFI US 1000 UCITS ETF Schedule of Investments
As at 30 September 2016 (continued)
Security Description Nominal
Fair ValueUSD
% ofNet Assets
Industrial (continued) Amphenol Corp 1,857 120,556 0.04AptarGroup Inc 632 48,923 0.02Armstrong Flooring Inc 1,221 23,052 0.01Armstrong World Industries Inc 2,471 102,102 0.03Arrow Electronics Inc 4,369 279,485 0.09Avnet Inc 5,332 218,932 0.07Ball Corp 1,608 131,776 0.04Bemis Co Inc 1,725 87,992 0.03Benchmark Electronics Inc 1,761 43,937 0.01Berry Plastics Group Inc 1,809 79,325 0.03Boeing Co/The 8,684 1,144,030 0.38BorgWarner Inc 3,503 123,236 0.04Brink's Company 1,279 47,425 0.02Carlisle Cos Inc 639 65,542 0.02Caterpillar Inc 15,670 1,391,026 0.46CH Robinson Worldwide Inc 2,023 142,541 0.05Chicago Bridge & Iron Co NV 2,643 74,083 0.02Clean Harbors Inc 1,050 50,379 0.02Colfax Corp 2,477 77,852 0.03Commercial Metals Co 4,532 73,373 0.02Crane Co 783 49,337 0.02Cree Inc 1,613 41,486 0.01Crown Holdings Inc 2,432 138,843 0.05CSX Corp 16,979 517,859 0.17Cummins Inc 3,293 421,998 0.14Curtiss-Wright Corp 587 53,482 0.02Darling Ingredients Inc 6,161 83,235 0.03Deere & Co 7,546 644,051 0.21Donaldson Co Inc 1,507 56,256 0.02Dover Corp 2,514 185,131 0.06Eaton Corp Plc 7,815 513,524 0.17EMCOR Group Inc 1,138 67,848 0.02Emerson Electric Company 12,293 670,091 0.22Energizer Holdings Inc 1,003 50,110 0.02EnerSys 699 48,364 0.02Esterline Technologies Corp 903 68,664 0.02Expeditors International of Washington Inc 2,043 105,255 0.04FedEx Corp 4,218 736,800 0.25Flex Ltd 26,053 354,842 0.12FLIR Systems Inc 1,405 44,145 0.01Flowserve Corp 1,997 96,335 0.03Fluor Corporation 4,781 245,361 0.08Fortive Corp 2,181 111,013 0.04Fortune Brands Home & Security Inc 1,137 66,060 0.02Garmin Ltd 1,905 91,650 0.03GATX Corp 956 42,590 0.01Generac Holdings Inc 1,454 52,780 0.02General Cable Corp 5,756 86,225 0.03General Dynamics Corp 3,991 619,244 0.21General Electric Co 146,255 4,332,073 1.44Genesee & Wyoming Inc 896 61,779 0.02Gentex Corp 3,196 56,122 0.02Golar LNG Ltd 2,314 49,057 0.02Graphic Packaging Holding Company 5,636 78,848 0.03Harris Corp 1,505 137,873 0.05Harsco Corp 6,507 64,614 0.02Hexcel Corp 903 40,003 0.01Honeywell International Inc 7,551 880,371 0.29Hub Group Inc 932 37,988 0.01Hubbell Inc 720 77,573 0.03Huntington Ingalls Industries Inc 544 83,460 0.03IDEX Corp 666 62,318 0.02Illinois Tool Works Inc 3,730 447,003 0.15Ingersoll-Rand Plc 3,706 251,786 0.08ITT Inc 1,037 37,166 0.01Jabil Circuit Inc 6,652 145,147 0.05Jacobs Engineering Group Inc 4,295 222,137 0.07JB Hunt Transport Services Inc 813 65,967 0.02
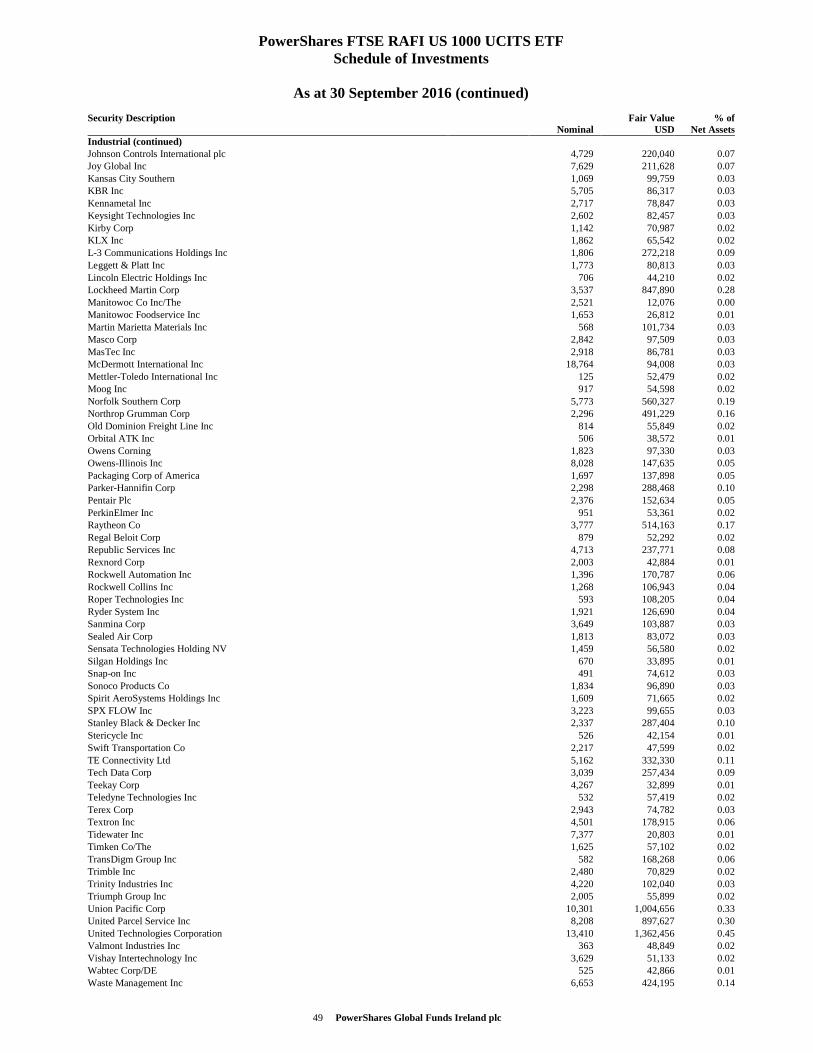
49 PowerShares Global Funds Ireland plc
PowerShares FTSE RAFI US 1000 UCITS ETF Schedule of Investments
As at 30 September 2016 (continued)
Security Description Nominal
Fair ValueUSD
% ofNet Assets
Industrial (continued) Johnson Controls International plc 4,729 220,040 0.07Joy Global Inc 7,629 211,628 0.07Kansas City Southern 1,069 99,759 0.03KBR Inc 5,705 86,317 0.03Kennametal Inc 2,717 78,847 0.03Keysight Technologies Inc 2,602 82,457 0.03Kirby Corp 1,142 70,987 0.02KLX Inc 1,862 65,542 0.02L-3 Communications Holdings Inc 1,806 272,218 0.09Leggett & Platt Inc 1,773 80,813 0.03Lincoln Electric Holdings Inc 706 44,210 0.02Lockheed Martin Corp 3,537 847,890 0.28Manitowoc Co Inc/The 2,521 12,076 0.00Manitowoc Foodservice Inc 1,653 26,812 0.01Martin Marietta Materials Inc 568 101,734 0.03Masco Corp 2,842 97,509 0.03MasTec Inc 2,918 86,781 0.03McDermott International Inc 18,764 94,008 0.03Mettler-Toledo International Inc 125 52,479 0.02Moog Inc 917 54,598 0.02Norfolk Southern Corp 5,773 560,327 0.19Northrop Grumman Corp 2,296 491,229 0.16Old Dominion Freight Line Inc 814 55,849 0.02Orbital ATK Inc 506 38,572 0.01Owens Corning 1,823 97,330 0.03Owens-Illinois Inc 8,028 147,635 0.05Packaging Corp of America 1,697 137,898 0.05Parker-Hannifin Corp 2,298 288,468 0.10Pentair Plc 2,376 152,634 0.05PerkinElmer Inc 951 53,361 0.02Raytheon Co 3,777 514,163 0.17Regal Beloit Corp 879 52,292 0.02Republic Services Inc 4,713 237,771 0.08Rexnord Corp 2,003 42,884 0.01Rockwell Automation Inc 1,396 170,787 0.06Rockwell Collins Inc 1,268 106,943 0.04Roper Technologies Inc 593 108,205 0.04Ryder System Inc 1,921 126,690 0.04Sanmina Corp 3,649 103,887 0.03Sealed Air Corp 1,813 83,072 0.03Sensata Technologies Holding NV 1,459 56,580 0.02Silgan Holdings Inc 670 33,895 0.01Snap-on Inc 491 74,612 0.03Sonoco Products Co 1,834 96,890 0.03Spirit AeroSystems Holdings Inc 1,609 71,665 0.02SPX FLOW Inc 3,223 99,655 0.03Stanley Black & Decker Inc 2,337 287,404 0.10Stericycle Inc 526 42,154 0.01Swift Transportation Co 2,217 47,599 0.02TE Connectivity Ltd 5,162 332,330 0.11Tech Data Corp 3,039 257,434 0.09Teekay Corp 4,267 32,899 0.01Teledyne Technologies Inc 532 57,419 0.02Terex Corp 2,943 74,782 0.03Textron Inc 4,501 178,915 0.06Tidewater Inc 7,377 20,803 0.01Timken Co/The 1,625 57,102 0.02TransDigm Group Inc 582 168,268 0.06Trimble Inc 2,480 70,829 0.02Trinity Industries Inc 4,220 102,040 0.03Triumph Group Inc 2,005 55,899 0.02Union Pacific Corp 10,301 1,004,656 0.33United Parcel Service Inc 8,208 897,627 0.30United Technologies Corporation 13,410 1,362,456 0.45Valmont Industries Inc 363 48,849 0.02Vishay Intertechnology Inc 3,629 51,133 0.02Wabtec Corp/DE 525 42,866 0.01Waste Management Inc 6,653 424,195 0.14
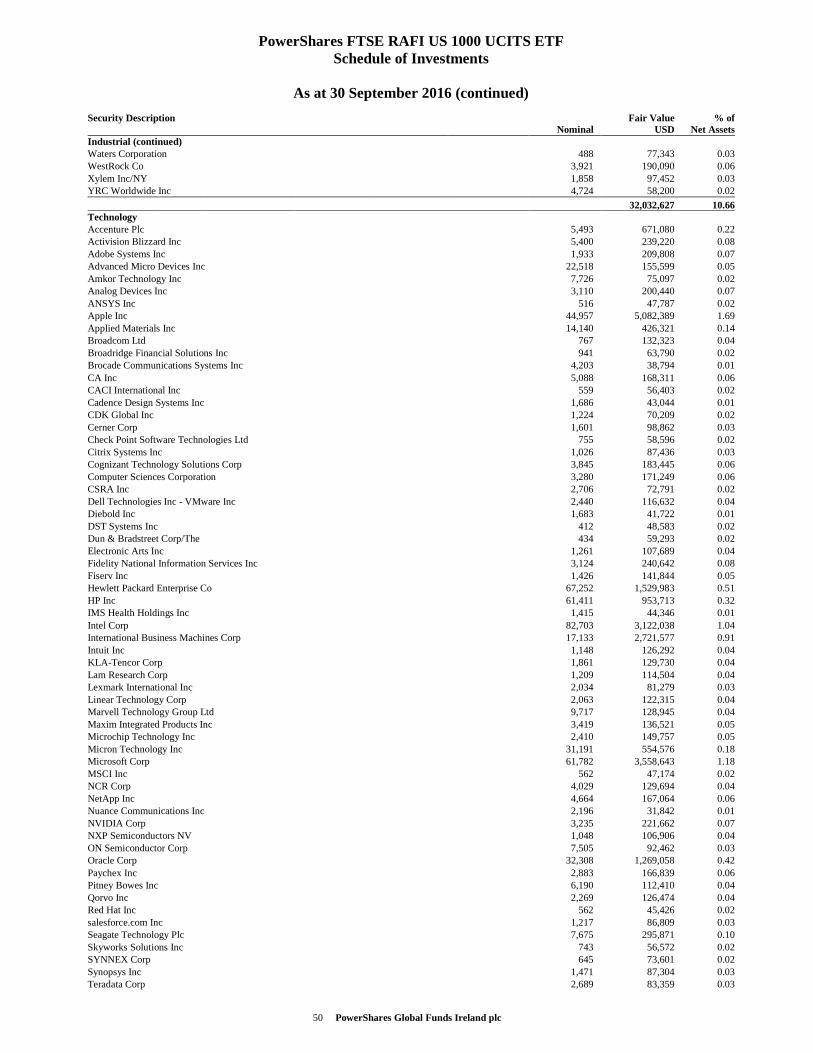
50 PowerShares Global Funds Ireland plc
PowerShares FTSE RAFI US 1000 UCITS ETF Schedule of Investments
As at 30 September 2016 (continued)
Security Description Nominal
Fair ValueUSD
% ofNet Assets
Industrial (continued) Waters Corporation 488 77,343 0.03WestRock Co 3,921 190,090 0.06Xylem Inc/NY 1,858 97,452 0.03YRC Worldwide Inc 4,724 58,200 0.02
32,032,627 10.66Technology Accenture Plc 5,493 671,080 0.22Activision Blizzard Inc 5,400 239,220 0.08Adobe Systems Inc 1,933 209,808 0.07Advanced Micro Devices Inc 22,518 155,599 0.05Amkor Technology Inc 7,726 75,097 0.02Analog Devices Inc 3,110 200,440 0.07ANSYS Inc 516 47,787 0.02Apple Inc 44,957 5,082,389 1.69Applied Materials Inc 14,140 426,321 0.14Broadcom Ltd 767 132,323 0.04Broadridge Financial Solutions Inc 941 63,790 0.02Brocade Communications Systems Inc 4,203 38,794 0.01CA Inc 5,088 168,311 0.06CACI International Inc 559 56,403 0.02Cadence Design Systems Inc 1,686 43,044 0.01CDK Global Inc 1,224 70,209 0.02Cerner Corp 1,601 98,862 0.03Check Point Software Technologies Ltd 755 58,596 0.02Citrix Systems Inc 1,026 87,436 0.03Cognizant Technology Solutions Corp 3,845 183,445 0.06Computer Sciences Corporation 3,280 171,249 0.06CSRA Inc 2,706 72,791 0.02Dell Technologies Inc - VMware Inc 2,440 116,632 0.04Diebold Inc 1,683 41,722 0.01DST Systems Inc 412 48,583 0.02Dun & Bradstreet Corp/The 434 59,293 0.02Electronic Arts Inc 1,261 107,689 0.04Fidelity National Information Services Inc 3,124 240,642 0.08Fiserv Inc 1,426 141,844 0.05Hewlett Packard Enterprise Co 67,252 1,529,983 0.51HP Inc 61,411 953,713 0.32IMS Health Holdings Inc 1,415 44,346 0.01Intel Corp 82,703 3,122,038 1.04International Business Machines Corp 17,133 2,721,577 0.91Intuit Inc 1,148 126,292 0.04KLA-Tencor Corp 1,861 129,730 0.04Lam Research Corp 1,209 114,504 0.04Lexmark International Inc 2,034 81,279 0.03Linear Technology Corp 2,063 122,315 0.04Marvell Technology Group Ltd 9,717 128,945 0.04Maxim Integrated Products Inc 3,419 136,521 0.05Microchip Technology Inc 2,410 149,757 0.05Micron Technology Inc 31,191 554,576 0.18Microsoft Corp 61,782 3,558,643 1.18MSCI Inc 562 47,174 0.02NCR Corp 4,029 129,694 0.04NetApp Inc 4,664 167,064 0.06Nuance Communications Inc 2,196 31,842 0.01NVIDIA Corp 3,235 221,662 0.07NXP Semiconductors NV 1,048 106,906 0.04ON Semiconductor Corp 7,505 92,462 0.03Oracle Corp 32,308 1,269,058 0.42Paychex Inc 2,883 166,839 0.06Pitney Bowes Inc 6,190 112,410 0.04Qorvo Inc 2,269 126,474 0.04Red Hat Inc 562 45,426 0.02salesforce.com Inc 1,217 86,809 0.03Seagate Technology Plc 7,675 295,871 0.10Skyworks Solutions Inc 743 56,572 0.02SYNNEX Corp 645 73,601 0.02Synopsys Inc 1,471 87,304 0.03Teradata Corp 2,689 83,359 0.03
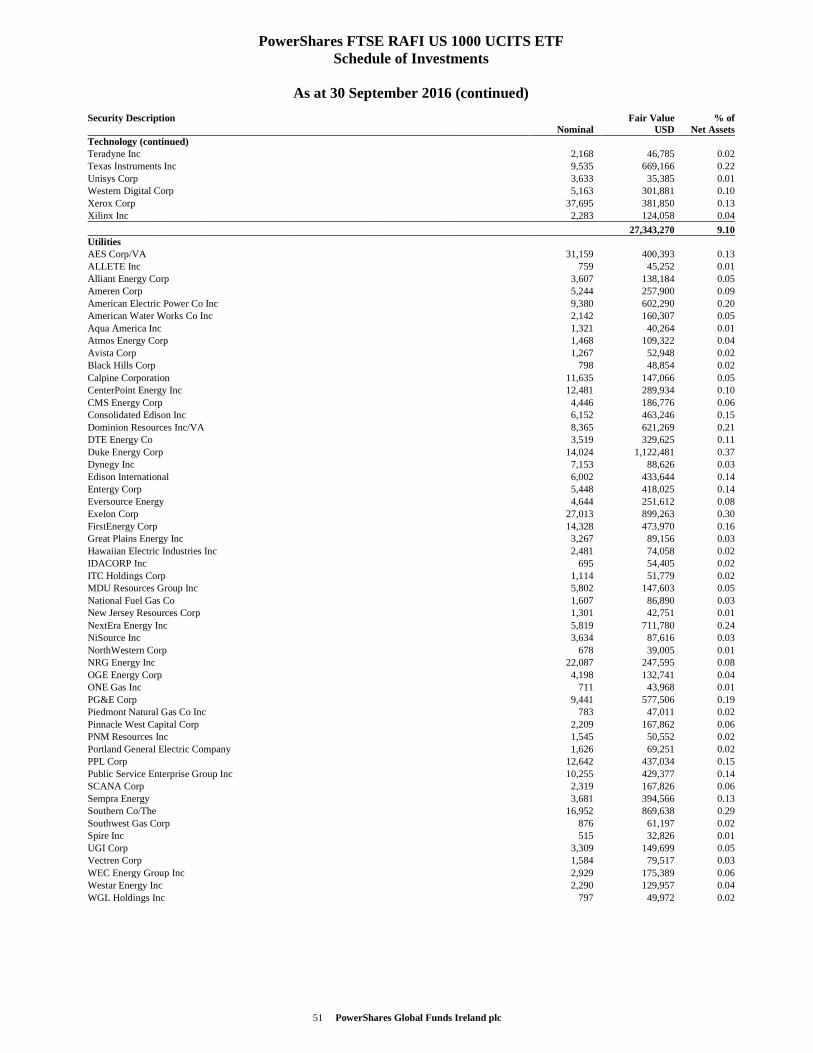
51 PowerShares Global Funds Ireland plc
PowerShares FTSE RAFI US 1000 UCITS ETF Schedule of Investments
As at 30 September 2016 (continued)
Security Description Nominal
Fair ValueUSD
% ofNet Assets
Technology (continued) Teradyne Inc 2,168 46,785 0.02Texas Instruments Inc 9,535 669,166 0.22Unisys Corp 3,633 35,385 0.01Western Digital Corp 5,163 301,881 0.10Xerox Corp 37,695 381,850 0.13Xilinx Inc 2,283 124,058 0.04
27,343,270 9.10Utilities AES Corp/VA 31,159 400,393 0.13ALLETE Inc 759 45,252 0.01Alliant Energy Corp 3,607 138,184 0.05Ameren Corp 5,244 257,900 0.09American Electric Power Co Inc 9,380 602,290 0.20American Water Works Co Inc 2,142 160,307 0.05Aqua America Inc 1,321 40,264 0.01Atmos Energy Corp 1,468 109,322 0.04Avista Corp 1,267 52,948 0.02Black Hills Corp 798 48,854 0.02Calpine Corporation 11,635 147,066 0.05CenterPoint Energy Inc 12,481 289,934 0.10CMS Energy Corp 4,446 186,776 0.06Consolidated Edison Inc 6,152 463,246 0.15Dominion Resources Inc/VA 8,365 621,269 0.21DTE Energy Co 3,519 329,625 0.11Duke Energy Corp 14,024 1,122,481 0.37Dynegy Inc 7,153 88,626 0.03Edison International 6,002 433,644 0.14Entergy Corp 5,448 418,025 0.14Eversource Energy 4,644 251,612 0.08Exelon Corp 27,013 899,263 0.30FirstEnergy Corp 14,328 473,970 0.16Great Plains Energy Inc 3,267 89,156 0.03Hawaiian Electric Industries Inc 2,481 74,058 0.02IDACORP Inc 695 54,405 0.02ITC Holdings Corp 1,114 51,779 0.02MDU Resources Group Inc 5,802 147,603 0.05National Fuel Gas Co 1,607 86,890 0.03New Jersey Resources Corp 1,301 42,751 0.01NextEra Energy Inc 5,819 711,780 0.24NiSource Inc 3,634 87,616 0.03NorthWestern Corp 678 39,005 0.01NRG Energy Inc 22,087 247,595 0.08OGE Energy Corp 4,198 132,741 0.04ONE Gas Inc 711 43,968 0.01PG&E Corp 9,441 577,506 0.19Piedmont Natural Gas Co Inc 783 47,011 0.02Pinnacle West Capital Corp 2,209 167,862 0.06PNM Resources Inc 1,545 50,552 0.02Portland General Electric Company 1,626 69,251 0.02PPL Corp 12,642 437,034 0.15Public Service Enterprise Group Inc 10,255 429,377 0.14SCANA Corp 2,319 167,826 0.06Sempra Energy 3,681 394,566 0.13Southern Co/The 16,952 869,638 0.29Southwest Gas Corp 876 61,197 0.02Spire Inc 515 32,826 0.01UGI Corp 3,309 149,699 0.05Vectren Corp 1,584 79,517 0.03WEC Energy Group Inc 2,929 175,389 0.06Westar Energy Inc 2,290 129,957 0.04WGL Holdings Inc 797 49,972 0.02
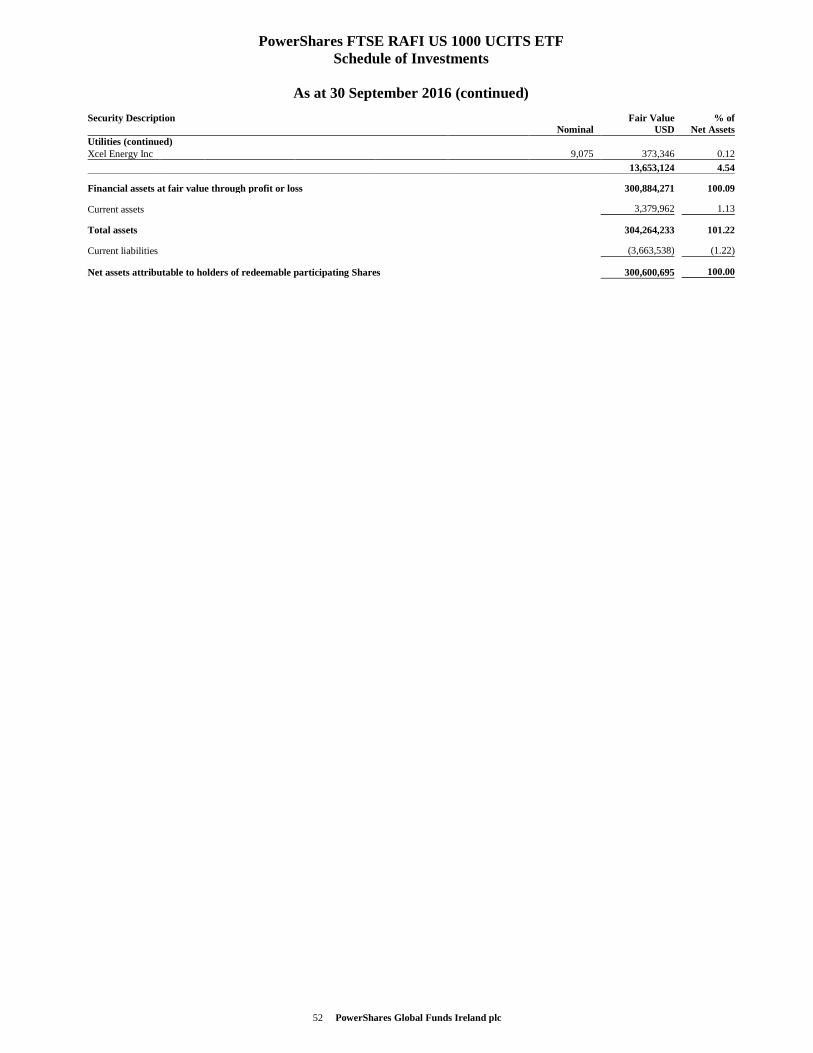
52 PowerShares Global Funds Ireland plc
PowerShares FTSE RAFI US 1000 UCITS ETF Schedule of Investments
As at 30 September 2016 (continued)
Security Description Nominal
Fair ValueUSD
% ofNet Assets
Utilities (continued) Xcel Energy Inc 9,075 373,346 0.12
13,653,124 4.54
Financial assets at fair value through profit or loss 300,884,271 100.09
Current assets 3,379,962 1.13
Total assets 304,264,233 101.22
Current liabilities (3,663,538) (1.22)
Net assets attributable to holders of redeemable participating Shares 300,600,695 100.00
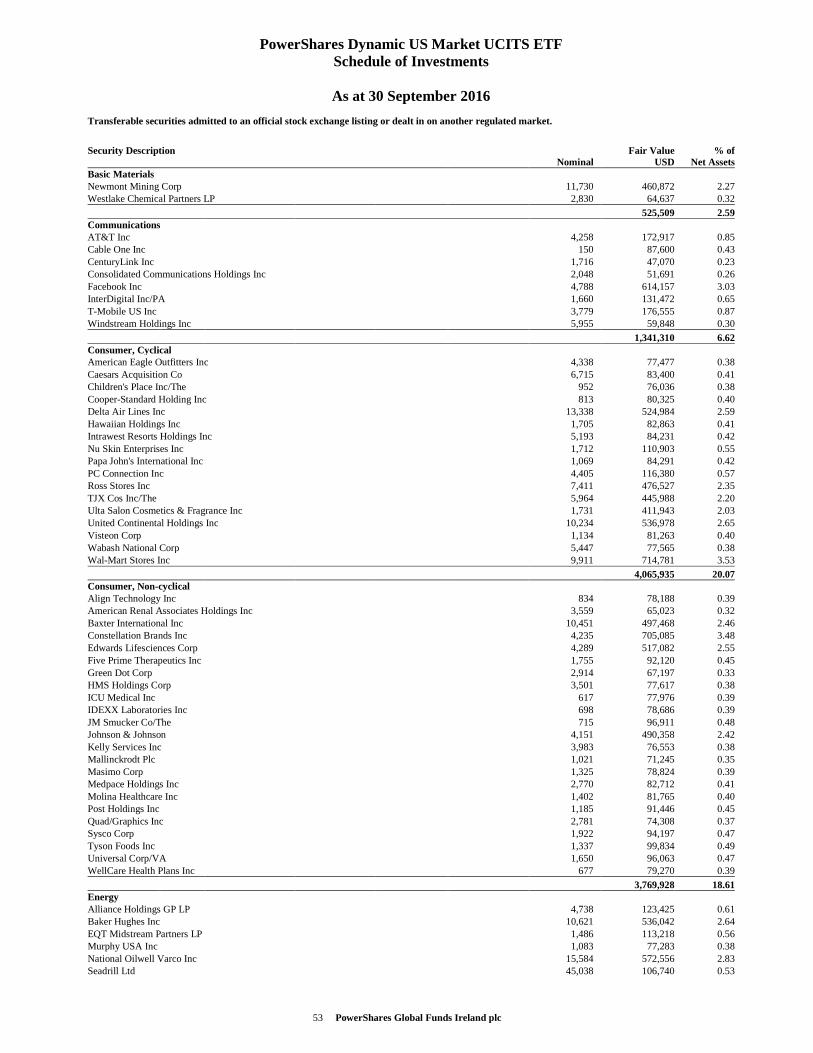
53 PowerShares Global Funds Ireland plc
PowerShares Dynamic US Market UCITS ETF Schedule of Investments
As at 30 September 2016
Transferable securities admitted to an official stock exchange listing or dealt in on another regulated market.
Security Description Nominal
Fair ValueUSD
% ofNet Assets
Basic Materials Newmont Mining Corp 11,730 460,872 2.27Westlake Chemical Partners LP 2,830 64,637 0.32
525,509 2.59Communications AT&T Inc 4,258 172,917 0.85Cable One Inc 150 87,600 0.43CenturyLink Inc 1,716 47,070 0.23Consolidated Communications Holdings Inc 2,048 51,691 0.26Facebook Inc 4,788 614,157 3.03InterDigital Inc/PA 1,660 131,472 0.65T-Mobile US Inc 3,779 176,555 0.87Windstream Holdings Inc 5,955 59,848 0.30
1,341,310 6.62Consumer, Cyclical American Eagle Outfitters Inc 4,338 77,477 0.38Caesars Acquisition Co 6,715 83,400 0.41Children's Place Inc/The 952 76,036 0.38Cooper-Standard Holding Inc 813 80,325 0.40Delta Air Lines Inc 13,338 524,984 2.59Hawaiian Holdings Inc 1,705 82,863 0.41Intrawest Resorts Holdings Inc 5,193 84,231 0.42Nu Skin Enterprises Inc 1,712 110,903 0.55Papa John's International Inc 1,069 84,291 0.42PC Connection Inc 4,405 116,380 0.57Ross Stores Inc 7,411 476,527 2.35TJX Cos Inc/The 5,964 445,988 2.20Ulta Salon Cosmetics & Fragrance Inc 1,731 411,943 2.03United Continental Holdings Inc 10,234 536,978 2.65Visteon Corp 1,134 81,263 0.40Wabash National Corp 5,447 77,565 0.38Wal-Mart Stores Inc 9,911 714,781 3.53
4,065,935 20.07Consumer, Non-cyclical Align Technology Inc 834 78,188 0.39American Renal Associates Holdings Inc 3,559 65,023 0.32Baxter International Inc 10,451 497,468 2.46Constellation Brands Inc 4,235 705,085 3.48Edwards Lifesciences Corp 4,289 517,082 2.55Five Prime Therapeutics Inc 1,755 92,120 0.45Green Dot Corp 2,914 67,197 0.33HMS Holdings Corp 3,501 77,617 0.38ICU Medical Inc 617 77,976 0.39IDEXX Laboratories Inc 698 78,686 0.39JM Smucker Co/The 715 96,911 0.48Johnson & Johnson 4,151 490,358 2.42Kelly Services Inc 3,983 76,553 0.38Mallinckrodt Plc 1,021 71,245 0.35Masimo Corp 1,325 78,824 0.39Medpace Holdings Inc 2,770 82,712 0.41Molina Healthcare Inc 1,402 81,765 0.40Post Holdings Inc 1,185 91,446 0.45Quad/Graphics Inc 2,781 74,308 0.37Sysco Corp 1,922 94,197 0.47Tyson Foods Inc 1,337 99,834 0.49Universal Corp/VA 1,650 96,063 0.47WellCare Health Plans Inc 677 79,270 0.39
3,769,928 18.61Energy Alliance Holdings GP LP 4,738 123,425 0.61Baker Hughes Inc 10,621 536,042 2.64EQT Midstream Partners LP 1,486 113,218 0.56Murphy USA Inc 1,083 77,283 0.38National Oilwell Varco Inc 15,584 572,556 2.83Seadrill Ltd 45,038 106,740 0.53
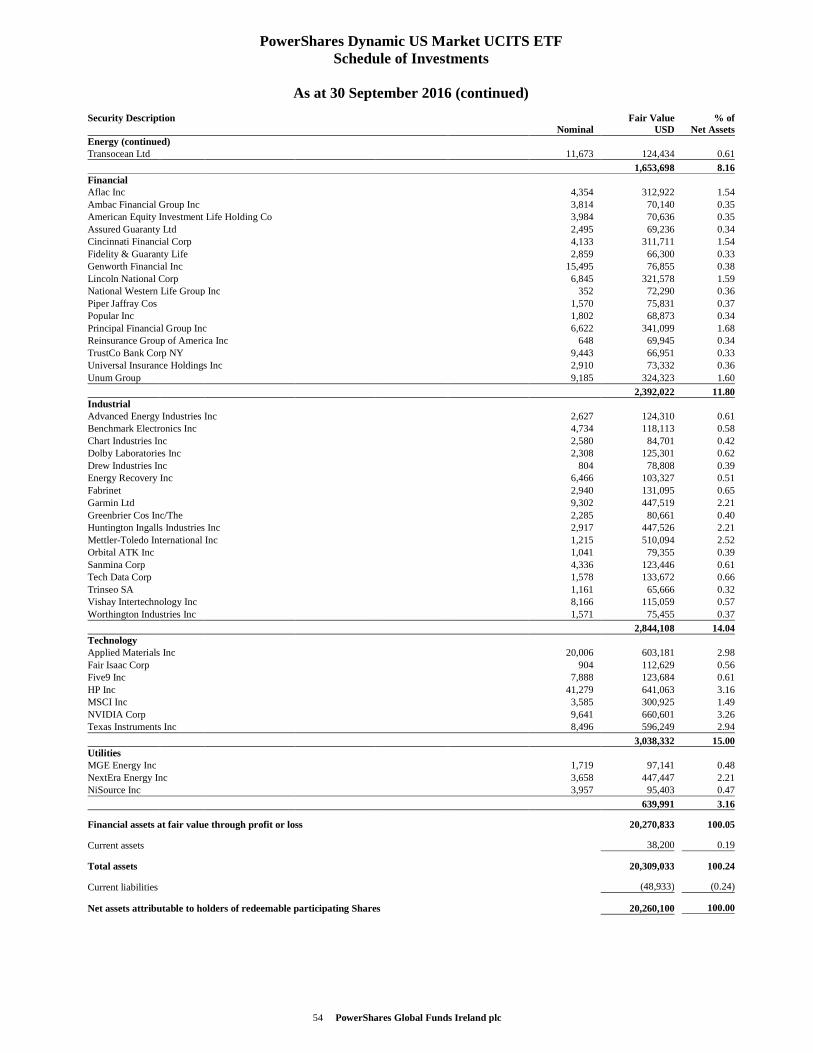
54 PowerShares Global Funds Ireland plc
PowerShares Dynamic US Market UCITS ETF Schedule of Investments
As at 30 September 2016 (continued)
Security Description Nominal
Fair ValueUSD
% ofNet Assets
Energy (continued) Transocean Ltd 11,673 124,434 0.61
1,653,698 8.16Financial Aflac Inc 4,354 312,922 1.54Ambac Financial Group Inc 3,814 70,140 0.35American Equity Investment Life Holding Co 3,984 70,636 0.35Assured Guaranty Ltd 2,495 69,236 0.34Cincinnati Financial Corp 4,133 311,711 1.54Fidelity & Guaranty Life 2,859 66,300 0.33Genworth Financial Inc 15,495 76,855 0.38Lincoln National Corp 6,845 321,578 1.59National Western Life Group Inc 352 72,290 0.36Piper Jaffray Cos 1,570 75,831 0.37Popular Inc 1,802 68,873 0.34Principal Financial Group Inc 6,622 341,099 1.68Reinsurance Group of America Inc 648 69,945 0.34TrustCo Bank Corp NY 9,443 66,951 0.33Universal Insurance Holdings Inc 2,910 73,332 0.36Unum Group 9,185 324,323 1.60
2,392,022 11.80Industrial Advanced Energy Industries Inc 2,627 124,310 0.61Benchmark Electronics Inc 4,734 118,113 0.58Chart Industries Inc 2,580 84,701 0.42Dolby Laboratories Inc 2,308 125,301 0.62Drew Industries Inc 804 78,808 0.39Energy Recovery Inc 6,466 103,327 0.51Fabrinet 2,940 131,095 0.65Garmin Ltd 9,302 447,519 2.21Greenbrier Cos Inc/The 2,285 80,661 0.40Huntington Ingalls Industries Inc 2,917 447,526 2.21Mettler-Toledo International Inc 1,215 510,094 2.52Orbital ATK Inc 1,041 79,355 0.39Sanmina Corp 4,336 123,446 0.61Tech Data Corp 1,578 133,672 0.66Trinseo SA 1,161 65,666 0.32Vishay Intertechnology Inc 8,166 115,059 0.57Worthington Industries Inc 1,571 75,455 0.37
2,844,108 14.04Technology Applied Materials Inc 20,006 603,181 2.98Fair Isaac Corp 904 112,629 0.56Five9 Inc 7,888 123,684 0.61HP Inc 41,279 641,063 3.16MSCI Inc 3,585 300,925 1.49NVIDIA Corp 9,641 660,601 3.26Texas Instruments Inc 8,496 596,249 2.94
3,038,332 15.00Utilities MGE Energy Inc 1,719 97,141 0.48NextEra Energy Inc 3,658 447,447 2.21NiSource Inc 3,957 95,403 0.47
639,991 3.16
Financial assets at fair value through profit or loss 20,270,833 100.05
Current assets 38,200 0.19
Total assets 20,309,033 100.24
Current liabilities (48,933) (0.24)
Net assets attributable to holders of redeemable participating Shares 20,260,100 100.00
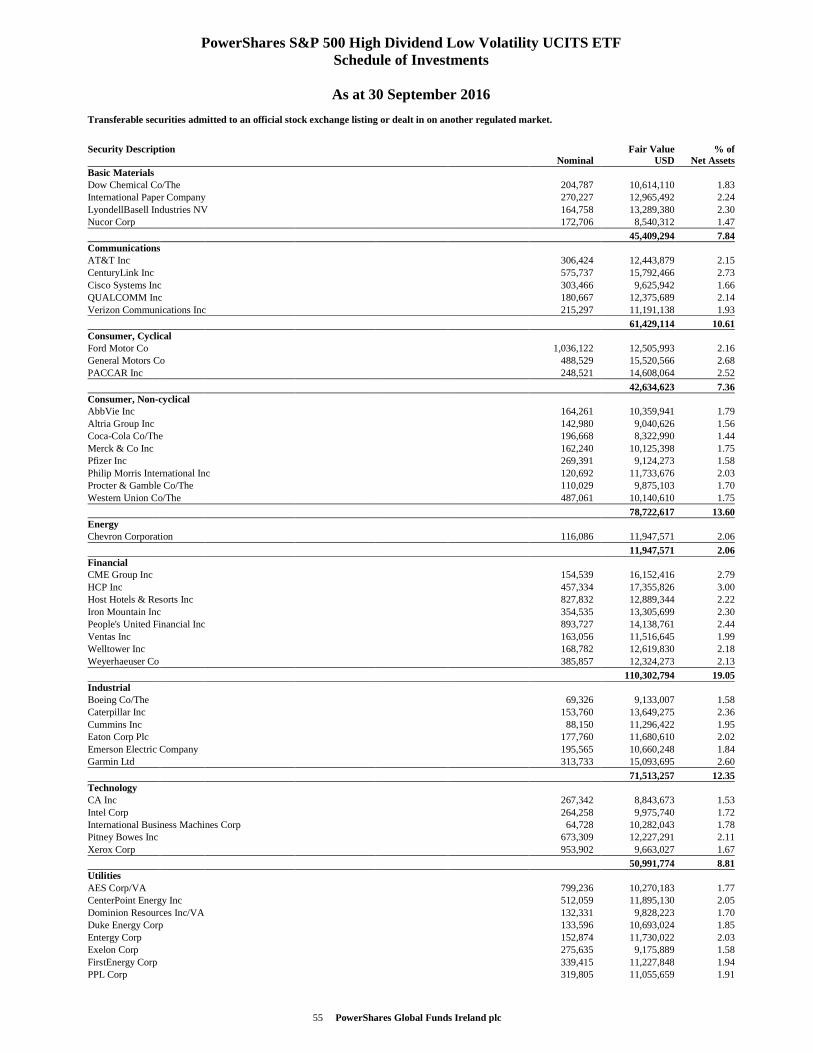
55 PowerShares Global Funds Ireland plc
PowerShares S&P 500 High Dividend Low Volatility UCITS ETF Schedule of Investments
As at 30 September 2016
Transferable securities admitted to an official stock exchange listing or dealt in on another regulated market.
Security Description Nominal
Fair ValueUSD
% ofNet Assets
Basic Materials Dow Chemical Co/The 204,787 10,614,110 1.83International Paper Company 270,227 12,965,492 2.24LyondellBasell Industries NV 164,758 13,289,380 2.30Nucor Corp 172,706 8,540,312 1.47
45,409,294 7.84Communications AT&T Inc 306,424 12,443,879 2.15CenturyLink Inc 575,737 15,792,466 2.73Cisco Systems Inc 303,466 9,625,942 1.66QUALCOMM Inc 180,667 12,375,689 2.14Verizon Communications Inc 215,297 11,191,138 1.93
61,429,114 10.61Consumer, Cyclical Ford Motor Co 1,036,122 12,505,993 2.16General Motors Co 488,529 15,520,566 2.68PACCAR Inc 248,521 14,608,064 2.52
42,634,623 7.36Consumer, Non-cyclical AbbVie Inc 164,261 10,359,941 1.79Altria Group Inc 142,980 9,040,626 1.56Coca-Cola Co/The 196,668 8,322,990 1.44Merck & Co Inc 162,240 10,125,398 1.75Pfizer Inc 269,391 9,124,273 1.58Philip Morris International Inc 120,692 11,733,676 2.03Procter & Gamble Co/The 110,029 9,875,103 1.70Western Union Co/The 487,061 10,140,610 1.75
78,722,617 13.60Energy Chevron Corporation 116,086 11,947,571 2.06
11,947,571 2.06Financial CME Group Inc 154,539 16,152,416 2.79HCP Inc 457,334 17,355,826 3.00Host Hotels & Resorts Inc 827,832 12,889,344 2.22Iron Mountain Inc 354,535 13,305,699 2.30People's United Financial Inc 893,727 14,138,761 2.44Ventas Inc 163,056 11,516,645 1.99Welltower Inc 168,782 12,619,830 2.18Weyerhaeuser Co 385,857 12,324,273 2.13
110,302,794 19.05Industrial Boeing Co/The 69,326 9,133,007 1.58Caterpillar Inc 153,760 13,649,275 2.36Cummins Inc 88,150 11,296,422 1.95Eaton Corp Plc 177,760 11,680,610 2.02Emerson Electric Company 195,565 10,660,248 1.84Garmin Ltd 313,733 15,093,695 2.60
71,513,257 12.35Technology CA Inc 267,342 8,843,673 1.53Intel Corp 264,258 9,975,740 1.72International Business Machines Corp 64,728 10,282,043 1.78Pitney Bowes Inc 673,309 12,227,291 2.11Xerox Corp 953,902 9,663,027 1.67
50,991,774 8.81Utilities AES Corp/VA 799,236 10,270,183 1.77CenterPoint Energy Inc 512,059 11,895,130 2.05Dominion Resources Inc/VA 132,331 9,828,223 1.70Duke Energy Corp 133,596 10,693,024 1.85Entergy Corp 152,874 11,730,022 2.03Exelon Corp 275,635 9,175,889 1.58FirstEnergy Corp 339,415 11,227,848 1.94PPL Corp 319,805 11,055,659 1.91
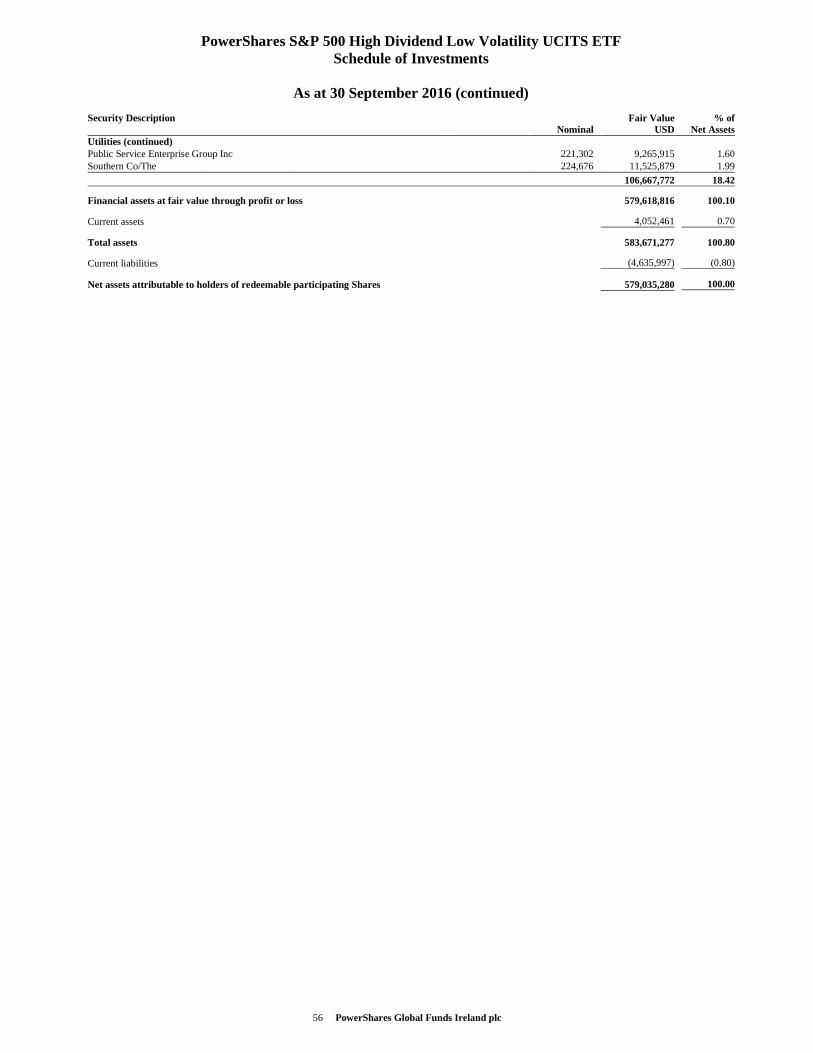
56 PowerShares Global Funds Ireland plc
PowerShares S&P 500 High Dividend Low Volatility UCITS ETF Schedule of Investments
As at 30 September 2016 (continued)
Security Description Nominal
Fair ValueUSD
% ofNet Assets
Utilities (continued) Public Service Enterprise Group Inc 221,302 9,265,915 1.60Southern Co/The 224,676 11,525,879 1.99
106,667,772 18.42
Financial assets at fair value through profit or loss 579,618,816 100.10
Current assets 4,052,461 0.70
Total assets 583,671,277 100.80
Current liabilities (4,635,997) (0.80)
Net assets attributable to holders of redeemable participating Shares 579,035,280 100.00
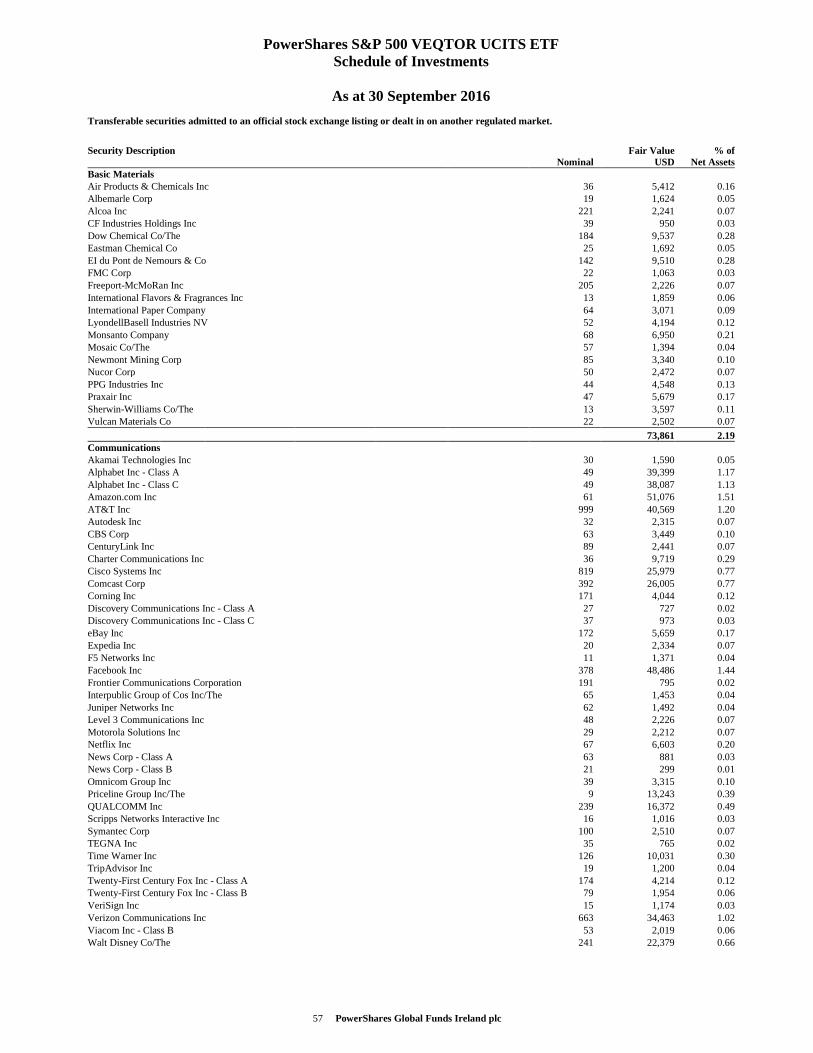
57 PowerShares Global Funds Ireland plc
PowerShares S&P 500 VEQTOR UCITS ETF Schedule of Investments
As at 30 September 2016
Transferable securities admitted to an official stock exchange listing or dealt in on another regulated market.
Security Description Nominal
Fair ValueUSD
% ofNet Assets
Basic Materials Air Products & Chemicals Inc 36 5,412 0.16Albemarle Corp 19 1,624 0.05Alcoa Inc 221 2,241 0.07CF Industries Holdings Inc 39 950 0.03Dow Chemical Co/The 184 9,537 0.28Eastman Chemical Co 25 1,692 0.05EI du Pont de Nemours & Co 142 9,510 0.28FMC Corp 22 1,063 0.03Freeport-McMoRan Inc 205 2,226 0.07International Flavors & Fragrances Inc 13 1,859 0.06International Paper Company 64 3,071 0.09LyondellBasell Industries NV 52 4,194 0.12Monsanto Company 68 6,950 0.21Mosaic Co/The 57 1,394 0.04Newmont Mining Corp 85 3,340 0.10Nucor Corp 50 2,472 0.07PPG Industries Inc 44 4,548 0.13Praxair Inc 47 5,679 0.17Sherwin-Williams Co/The 13 3,597 0.11Vulcan Materials Co 22 2,502 0.07
73,861 2.19Communications Akamai Technologies Inc 30 1,590 0.05Alphabet Inc - Class A 49 39,399 1.17Alphabet Inc - Class C 49 38,087 1.13Amazon.com Inc 61 51,076 1.51AT&T Inc 999 40,569 1.20Autodesk Inc 32 2,315 0.07CBS Corp 63 3,449 0.10CenturyLink Inc 89 2,441 0.07Charter Communications Inc 36 9,719 0.29Cisco Systems Inc 819 25,979 0.77Comcast Corp 392 26,005 0.77Corning Inc 171 4,044 0.12Discovery Communications Inc - Class A 27 727 0.02Discovery Communications Inc - Class C 37 973 0.03eBay Inc 172 5,659 0.17Expedia Inc 20 2,334 0.07F5 Networks Inc 11 1,371 0.04Facebook Inc 378 48,486 1.44Frontier Communications Corporation 191 795 0.02Interpublic Group of Cos Inc/The 65 1,453 0.04Juniper Networks Inc 62 1,492 0.04Level 3 Communications Inc 48 2,226 0.07Motorola Solutions Inc 29 2,212 0.07Netflix Inc 67 6,603 0.20News Corp - Class A 63 881 0.03News Corp - Class B 21 299 0.01Omnicom Group Inc 39 3,315 0.10Priceline Group Inc/The 9 13,243 0.39QUALCOMM Inc 239 16,372 0.49Scripps Networks Interactive Inc 16 1,016 0.03Symantec Corp 100 2,510 0.07TEGNA Inc 35 765 0.02Time Warner Inc 126 10,031 0.30TripAdvisor Inc 19 1,200 0.04Twenty-First Century Fox Inc - Class A 174 4,214 0.12Twenty-First Century Fox Inc - Class B 79 1,954 0.06VeriSign Inc 15 1,174 0.03Verizon Communications Inc 663 34,463 1.02Viacom Inc - Class B 53 2,019 0.06Walt Disney Co/The 241 22,379 0.66
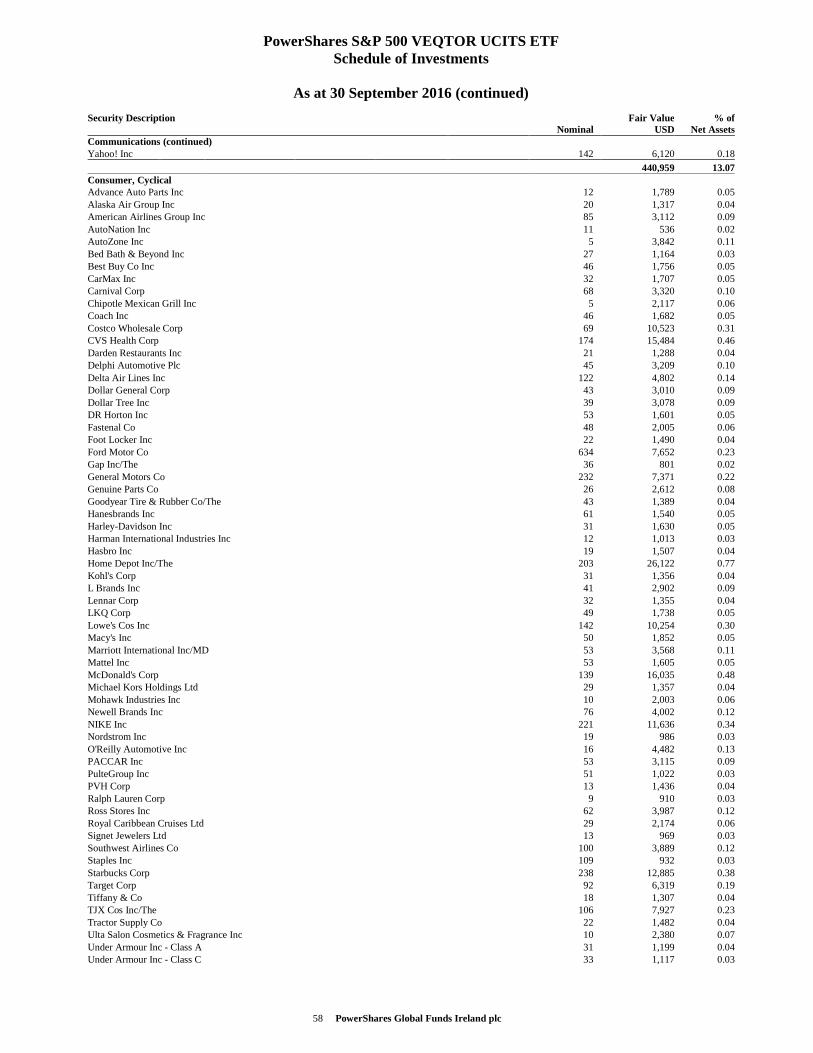
58 PowerShares Global Funds Ireland plc
PowerShares S&P 500 VEQTOR UCITS ETF Schedule of Investments
As at 30 September 2016 (continued)
Security Description Nominal
Fair ValueUSD
% ofNet Assets
Communications (continued) Yahoo! Inc 142 6,120 0.18
440,959 13.07Consumer, Cyclical Advance Auto Parts Inc 12 1,789 0.05Alaska Air Group Inc 20 1,317 0.04American Airlines Group Inc 85 3,112 0.09AutoNation Inc 11 536 0.02AutoZone Inc 5 3,842 0.11Bed Bath & Beyond Inc 27 1,164 0.03Best Buy Co Inc 46 1,756 0.05CarMax Inc 32 1,707 0.05Carnival Corp 68 3,320 0.10Chipotle Mexican Grill Inc 5 2,117 0.06Coach Inc 46 1,682 0.05Costco Wholesale Corp 69 10,523 0.31CVS Health Corp 174 15,484 0.46Darden Restaurants Inc 21 1,288 0.04Delphi Automotive Plc 45 3,209 0.10Delta Air Lines Inc 122 4,802 0.14Dollar General Corp 43 3,010 0.09Dollar Tree Inc 39 3,078 0.09DR Horton Inc 53 1,601 0.05Fastenal Co 48 2,005 0.06Foot Locker Inc 22 1,490 0.04Ford Motor Co 634 7,652 0.23Gap Inc/The 36 801 0.02General Motors Co 232 7,371 0.22Genuine Parts Co 26 2,612 0.08Goodyear Tire & Rubber Co/The 43 1,389 0.04Hanesbrands Inc 61 1,540 0.05Harley-Davidson Inc 31 1,630 0.05Harman International Industries Inc 12 1,013 0.03Hasbro Inc 19 1,507 0.04Home Depot Inc/The 203 26,122 0.77Kohl's Corp 31 1,356 0.04L Brands Inc 41 2,902 0.09Lennar Corp 32 1,355 0.04LKQ Corp 49 1,738 0.05Lowe's Cos Inc 142 10,254 0.30Macy's Inc 50 1,852 0.05Marriott International Inc/MD 53 3,568 0.11Mattel Inc 53 1,605 0.05McDonald's Corp 139 16,035 0.48Michael Kors Holdings Ltd 29 1,357 0.04Mohawk Industries Inc 10 2,003 0.06Newell Brands Inc 76 4,002 0.12NIKE Inc 221 11,636 0.34Nordstrom Inc 19 986 0.03O'Reilly Automotive Inc 16 4,482 0.13PACCAR Inc 53 3,115 0.09PulteGroup Inc 51 1,022 0.03PVH Corp 13 1,436 0.04Ralph Lauren Corp 9 910 0.03Ross Stores Inc 62 3,987 0.12Royal Caribbean Cruises Ltd 29 2,174 0.06Signet Jewelers Ltd 13 969 0.03Southwest Airlines Co 100 3,889 0.12Staples Inc 109 932 0.03Starbucks Corp 238 12,885 0.38Target Corp 92 6,319 0.19Tiffany & Co 18 1,307 0.04TJX Cos Inc/The 106 7,927 0.23Tractor Supply Co 22 1,482 0.04Ulta Salon Cosmetics & Fragrance Inc 10 2,380 0.07Under Armour Inc - Class A 31 1,199 0.04Under Armour Inc - Class C 33 1,117 0.03
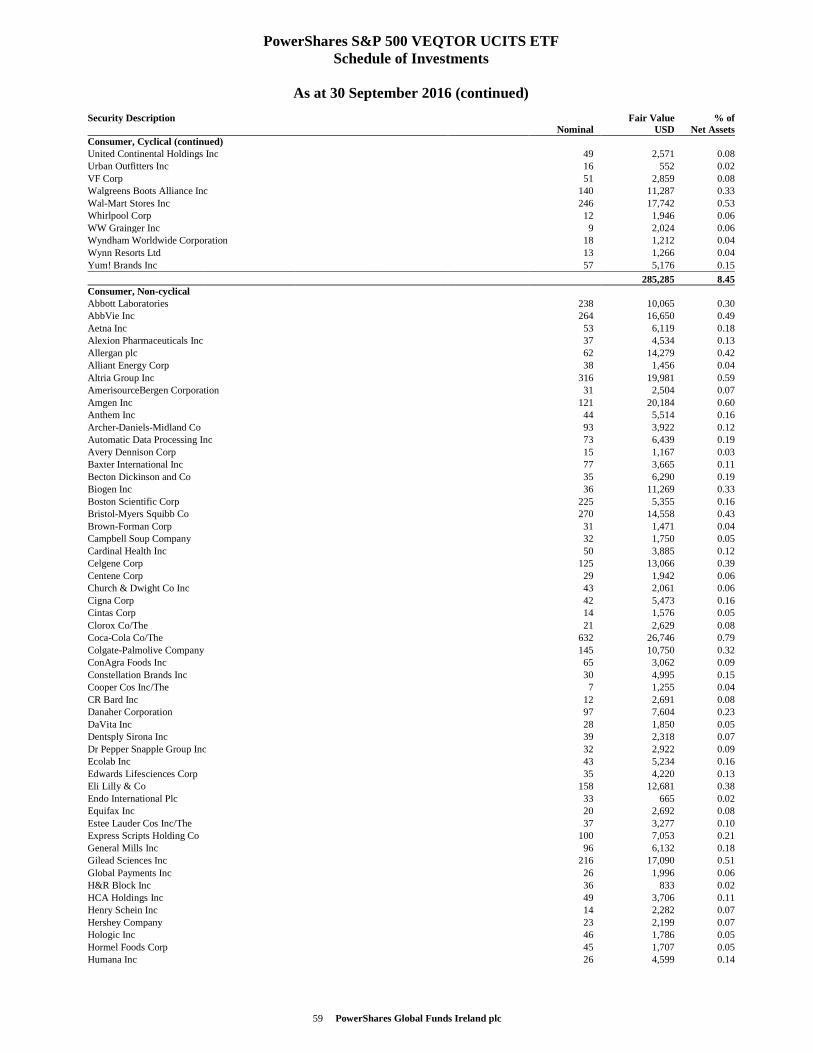
59 PowerShares Global Funds Ireland plc
PowerShares S&P 500 VEQTOR UCITS ETF Schedule of Investments
As at 30 September 2016 (continued)
Security Description Nominal
Fair ValueUSD
% ofNet Assets
Consumer, Cyclical (continued) United Continental Holdings Inc 49 2,571 0.08Urban Outfitters Inc 16 552 0.02VF Corp 51 2,859 0.08Walgreens Boots Alliance Inc 140 11,287 0.33Wal-Mart Stores Inc 246 17,742 0.53Whirlpool Corp 12 1,946 0.06WW Grainger Inc 9 2,024 0.06Wyndham Worldwide Corporation 18 1,212 0.04Wynn Resorts Ltd 13 1,266 0.04Yum! Brands Inc 57 5,176 0.15
285,285 8.45Consumer, Non-cyclical Abbott Laboratories 238 10,065 0.30AbbVie Inc 264 16,650 0.49Aetna Inc 53 6,119 0.18Alexion Pharmaceuticals Inc 37 4,534 0.13Allergan plc 62 14,279 0.42Alliant Energy Corp 38 1,456 0.04Altria Group Inc 316 19,981 0.59AmerisourceBergen Corporation 31 2,504 0.07Amgen Inc 121 20,184 0.60Anthem Inc 44 5,514 0.16Archer-Daniels-Midland Co 93 3,922 0.12Automatic Data Processing Inc 73 6,439 0.19Avery Dennison Corp 15 1,167 0.03Baxter International Inc 77 3,665 0.11Becton Dickinson and Co 35 6,290 0.19Biogen Inc 36 11,269 0.33Boston Scientific Corp 225 5,355 0.16Bristol-Myers Squibb Co 270 14,558 0.43Brown-Forman Corp 31 1,471 0.04Campbell Soup Company 32 1,750 0.05Cardinal Health Inc 50 3,885 0.12Celgene Corp 125 13,066 0.39Centene Corp 29 1,942 0.06Church & Dwight Co Inc 43 2,061 0.06Cigna Corp 42 5,473 0.16Cintas Corp 14 1,576 0.05Clorox Co/The 21 2,629 0.08Coca-Cola Co/The 632 26,746 0.79Colgate-Palmolive Company 145 10,750 0.32ConAgra Foods Inc 65 3,062 0.09Constellation Brands Inc 30 4,995 0.15Cooper Cos Inc/The 7 1,255 0.04CR Bard Inc 12 2,691 0.08Danaher Corporation 97 7,604 0.23DaVita Inc 28 1,850 0.05Dentsply Sirona Inc 39 2,318 0.07Dr Pepper Snapple Group Inc 32 2,922 0.09Ecolab Inc 43 5,234 0.16Edwards Lifesciences Corp 35 4,220 0.13Eli Lilly & Co 158 12,681 0.38Endo International Plc 33 665 0.02Equifax Inc 20 2,692 0.08Estee Lauder Cos Inc/The 37 3,277 0.10Express Scripts Holding Co 100 7,053 0.21General Mills Inc 96 6,132 0.18Gilead Sciences Inc 216 17,090 0.51Global Payments Inc 26 1,996 0.06H&R Block Inc 36 833 0.02HCA Holdings Inc 49 3,706 0.11Henry Schein Inc 14 2,282 0.07Hershey Company 23 2,199 0.07Hologic Inc 46 1,786 0.05Hormel Foods Corp 45 1,707 0.05Humana Inc 26 4,599 0.14
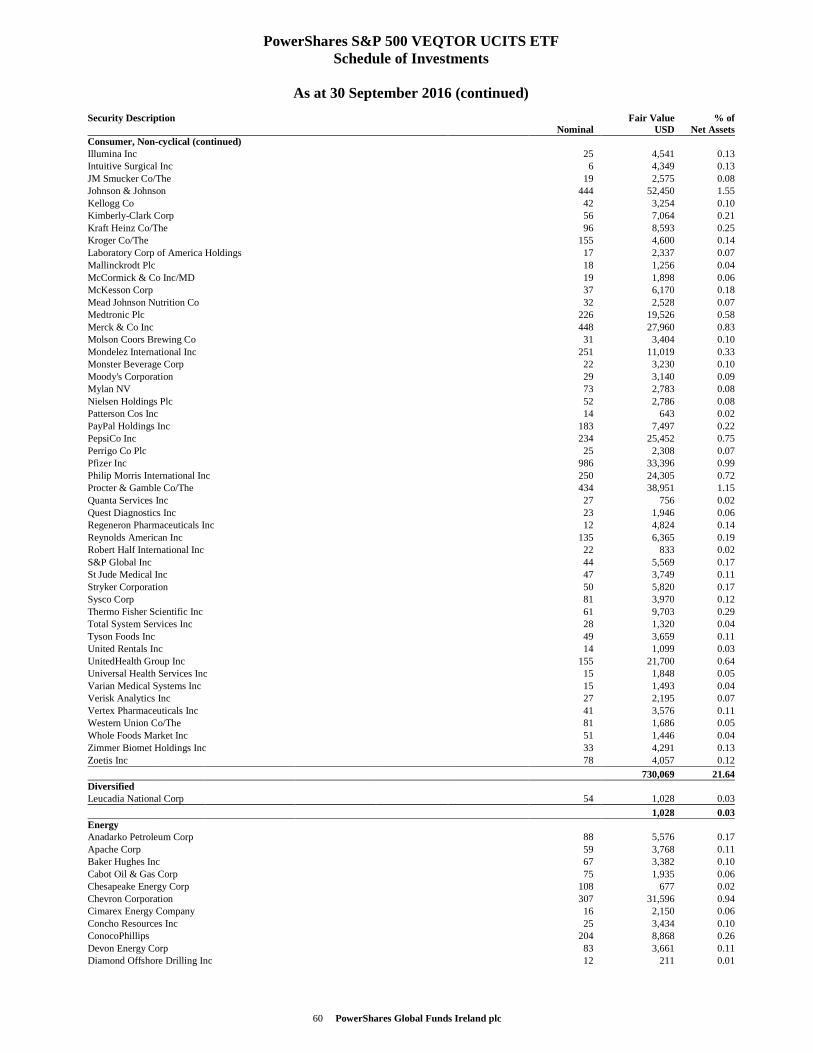
60 PowerShares Global Funds Ireland plc
PowerShares S&P 500 VEQTOR UCITS ETF Schedule of Investments
As at 30 September 2016 (continued)
Security Description Nominal
Fair ValueUSD
% ofNet Assets
Consumer, Non-cyclical (continued) Illumina Inc 25 4,541 0.13Intuitive Surgical Inc 6 4,349 0.13JM Smucker Co/The 19 2,575 0.08Johnson & Johnson 444 52,450 1.55Kellogg Co 42 3,254 0.10Kimberly-Clark Corp 56 7,064 0.21Kraft Heinz Co/The 96 8,593 0.25Kroger Co/The 155 4,600 0.14Laboratory Corp of America Holdings 17 2,337 0.07Mallinckrodt Plc 18 1,256 0.04McCormick & Co Inc/MD 19 1,898 0.06McKesson Corp 37 6,170 0.18Mead Johnson Nutrition Co 32 2,528 0.07Medtronic Plc 226 19,526 0.58Merck & Co Inc 448 27,960 0.83Molson Coors Brewing Co 31 3,404 0.10Mondelez International Inc 251 11,019 0.33Monster Beverage Corp 22 3,230 0.10Moody's Corporation 29 3,140 0.09Mylan NV 73 2,783 0.08Nielsen Holdings Plc 52 2,786 0.08Patterson Cos Inc 14 643 0.02PayPal Holdings Inc 183 7,497 0.22PepsiCo Inc 234 25,452 0.75Perrigo Co Plc 25 2,308 0.07Pfizer Inc 986 33,396 0.99Philip Morris International Inc 250 24,305 0.72Procter & Gamble Co/The 434 38,951 1.15Quanta Services Inc 27 756 0.02Quest Diagnostics Inc 23 1,946 0.06Regeneron Pharmaceuticals Inc 12 4,824 0.14Reynolds American Inc 135 6,365 0.19Robert Half International Inc 22 833 0.02S&P Global Inc 44 5,569 0.17St Jude Medical Inc 47 3,749 0.11Stryker Corporation 50 5,820 0.17Sysco Corp 81 3,970 0.12Thermo Fisher Scientific Inc 61 9,703 0.29Total System Services Inc 28 1,320 0.04Tyson Foods Inc 49 3,659 0.11United Rentals Inc 14 1,099 0.03UnitedHealth Group Inc 155 21,700 0.64Universal Health Services Inc 15 1,848 0.05Varian Medical Systems Inc 15 1,493 0.04Verisk Analytics Inc 27 2,195 0.07Vertex Pharmaceuticals Inc 41 3,576 0.11Western Union Co/The 81 1,686 0.05Whole Foods Market Inc 51 1,446 0.04Zimmer Biomet Holdings Inc 33 4,291 0.13Zoetis Inc 78 4,057 0.12
730,069 21.64Diversified Leucadia National Corp 54 1,028 0.03
1,028 0.03Energy Anadarko Petroleum Corp 88 5,576 0.17Apache Corp 59 3,768 0.11Baker Hughes Inc 67 3,382 0.10Cabot Oil & Gas Corp 75 1,935 0.06Chesapeake Energy Corp 108 677 0.02Chevron Corporation 307 31,596 0.94Cimarex Energy Company 16 2,150 0.06Concho Resources Inc 25 3,434 0.10ConocoPhillips 204 8,868 0.26Devon Energy Corp 83 3,661 0.11Diamond Offshore Drilling Inc 12 211 0.01
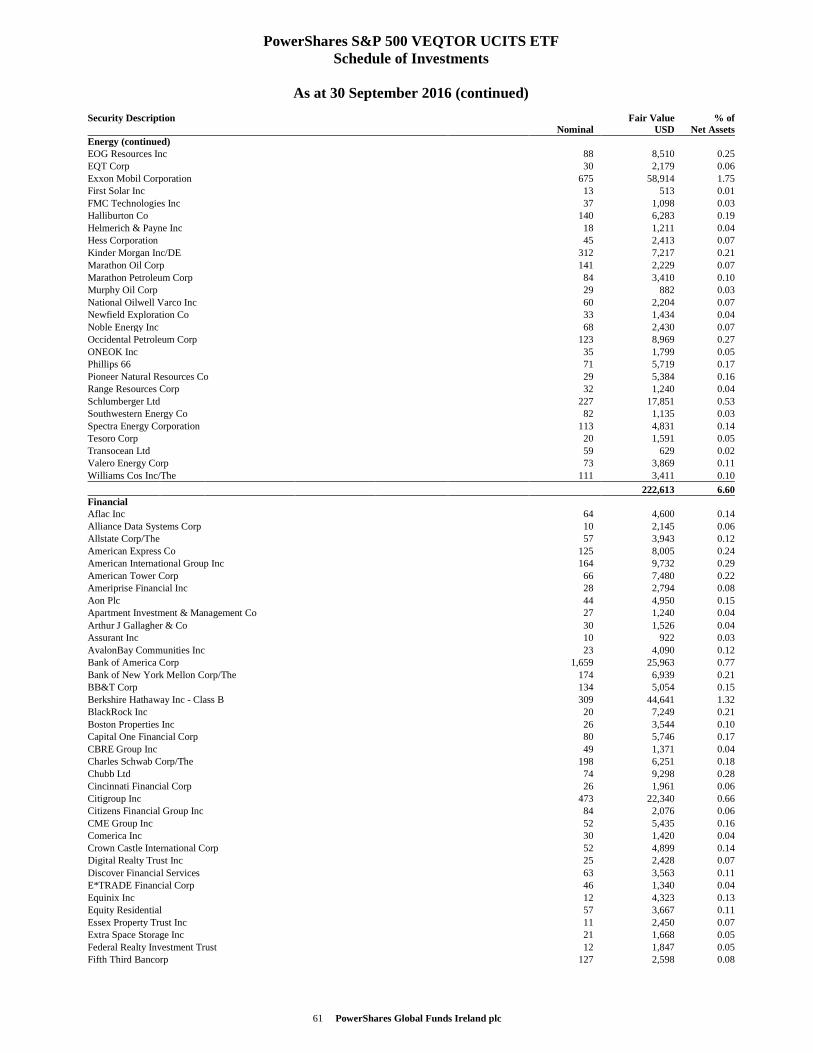
61 PowerShares Global Funds Ireland plc
PowerShares S&P 500 VEQTOR UCITS ETF Schedule of Investments
As at 30 September 2016 (continued)
Security Description Nominal
Fair ValueUSD
% ofNet Assets
Energy (continued) EOG Resources Inc 88 8,510 0.25EQT Corp 30 2,179 0.06Exxon Mobil Corporation 675 58,914 1.75First Solar Inc 13 513 0.01FMC Technologies Inc 37 1,098 0.03Halliburton Co 140 6,283 0.19Helmerich & Payne Inc 18 1,211 0.04Hess Corporation 45 2,413 0.07Kinder Morgan Inc/DE 312 7,217 0.21Marathon Oil Corp 141 2,229 0.07Marathon Petroleum Corp 84 3,410 0.10Murphy Oil Corp 29 882 0.03National Oilwell Varco Inc 60 2,204 0.07Newfield Exploration Co 33 1,434 0.04Noble Energy Inc 68 2,430 0.07Occidental Petroleum Corp 123 8,969 0.27ONEOK Inc 35 1,799 0.05Phillips 66 71 5,719 0.17Pioneer Natural Resources Co 29 5,384 0.16Range Resources Corp 32 1,240 0.04Schlumberger Ltd 227 17,851 0.53Southwestern Energy Co 82 1,135 0.03Spectra Energy Corporation 113 4,831 0.14Tesoro Corp 20 1,591 0.05Transocean Ltd 59 629 0.02Valero Energy Corp 73 3,869 0.11Williams Cos Inc/The 111 3,411 0.10
222,613 6.60Financial Aflac Inc 64 4,600 0.14Alliance Data Systems Corp 10 2,145 0.06Allstate Corp/The 57 3,943 0.12American Express Co 125 8,005 0.24American International Group Inc 164 9,732 0.29American Tower Corp 66 7,480 0.22Ameriprise Financial Inc 28 2,794 0.08Aon Plc 44 4,950 0.15Apartment Investment & Management Co 27 1,240 0.04Arthur J Gallagher & Co 30 1,526 0.04Assurant Inc 10 922 0.03AvalonBay Communities Inc 23 4,090 0.12Bank of America Corp 1,659 25,963 0.77Bank of New York Mellon Corp/The 174 6,939 0.21BB&T Corp 134 5,054 0.15Berkshire Hathaway Inc - Class B 309 44,641 1.32BlackRock Inc 20 7,249 0.21Boston Properties Inc 26 3,544 0.10Capital One Financial Corp 80 5,746 0.17CBRE Group Inc 49 1,371 0.04Charles Schwab Corp/The 198 6,251 0.18Chubb Ltd 74 9,298 0.28Cincinnati Financial Corp 26 1,961 0.06Citigroup Inc 473 22,340 0.66Citizens Financial Group Inc 84 2,076 0.06CME Group Inc 52 5,435 0.16Comerica Inc 30 1,420 0.04Crown Castle International Corp 52 4,899 0.14Digital Realty Trust Inc 25 2,428 0.07Discover Financial Services 63 3,563 0.11E*TRADE Financial Corp 46 1,340 0.04Equinix Inc 12 4,323 0.13Equity Residential 57 3,667 0.11Essex Property Trust Inc 11 2,450 0.07Extra Space Storage Inc 21 1,668 0.05Federal Realty Investment Trust 12 1,847 0.05Fifth Third Bancorp 127 2,598 0.08
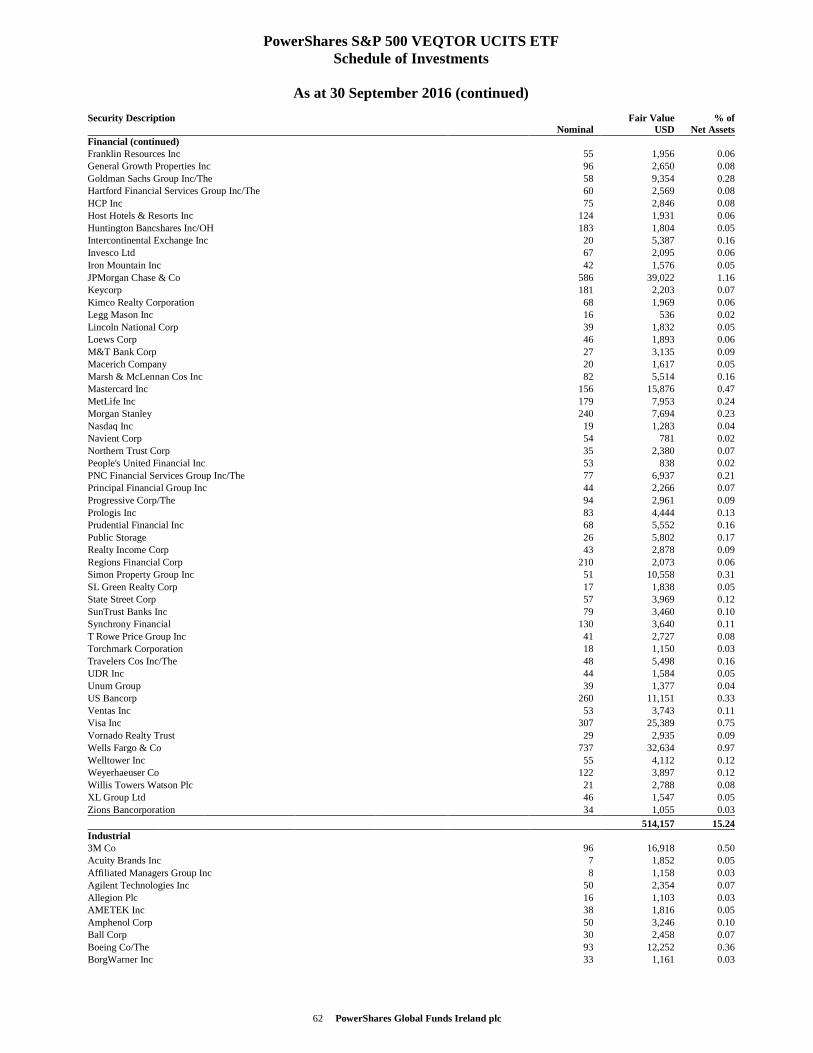
62 PowerShares Global Funds Ireland plc
PowerShares S&P 500 VEQTOR UCITS ETF Schedule of Investments
As at 30 September 2016 (continued)
Security Description Nominal
Fair ValueUSD
% ofNet Assets
Financial (continued) Franklin Resources Inc 55 1,956 0.06General Growth Properties Inc 96 2,650 0.08Goldman Sachs Group Inc/The 58 9,354 0.28Hartford Financial Services Group Inc/The 60 2,569 0.08HCP Inc 75 2,846 0.08Host Hotels & Resorts Inc 124 1,931 0.06Huntington Bancshares Inc/OH 183 1,804 0.05Intercontinental Exchange Inc 20 5,387 0.16Invesco Ltd 67 2,095 0.06Iron Mountain Inc 42 1,576 0.05JPMorgan Chase & Co 586 39,022 1.16Keycorp 181 2,203 0.07Kimco Realty Corporation 68 1,969 0.06Legg Mason Inc 16 536 0.02Lincoln National Corp 39 1,832 0.05Loews Corp 46 1,893 0.06M&T Bank Corp 27 3,135 0.09Macerich Company 20 1,617 0.05Marsh & McLennan Cos Inc 82 5,514 0.16Mastercard Inc 156 15,876 0.47MetLife Inc 179 7,953 0.24Morgan Stanley 240 7,694 0.23Nasdaq Inc 19 1,283 0.04Navient Corp 54 781 0.02Northern Trust Corp 35 2,380 0.07People's United Financial Inc 53 838 0.02PNC Financial Services Group Inc/The 77 6,937 0.21Principal Financial Group Inc 44 2,266 0.07Progressive Corp/The 94 2,961 0.09Prologis Inc 83 4,444 0.13Prudential Financial Inc 68 5,552 0.16Public Storage 26 5,802 0.17Realty Income Corp 43 2,878 0.09Regions Financial Corp 210 2,073 0.06Simon Property Group Inc 51 10,558 0.31SL Green Realty Corp 17 1,838 0.05State Street Corp 57 3,969 0.12SunTrust Banks Inc 79 3,460 0.10Synchrony Financial 130 3,640 0.11T Rowe Price Group Inc 41 2,727 0.08Torchmark Corporation 18 1,150 0.03Travelers Cos Inc/The 48 5,498 0.16UDR Inc 44 1,584 0.05Unum Group 39 1,377 0.04US Bancorp 260 11,151 0.33Ventas Inc 53 3,743 0.11Visa Inc 307 25,389 0.75Vornado Realty Trust 29 2,935 0.09Wells Fargo & Co 737 32,634 0.97Welltower Inc 55 4,112 0.12Weyerhaeuser Co 122 3,897 0.12Willis Towers Watson Plc 21 2,788 0.08XL Group Ltd 46 1,547 0.05Zions Bancorporation 34 1,055 0.03
514,157 15.24Industrial 3M Co 96 16,918 0.50Acuity Brands Inc 7 1,852 0.05Affiliated Managers Group Inc 8 1,158 0.03Agilent Technologies Inc 50 2,354 0.07Allegion Plc 16 1,103 0.03AMETEK Inc 38 1,816 0.05Amphenol Corp 50 3,246 0.10Ball Corp 30 2,458 0.07Boeing Co/The 93 12,252 0.36BorgWarner Inc 33 1,161 0.03
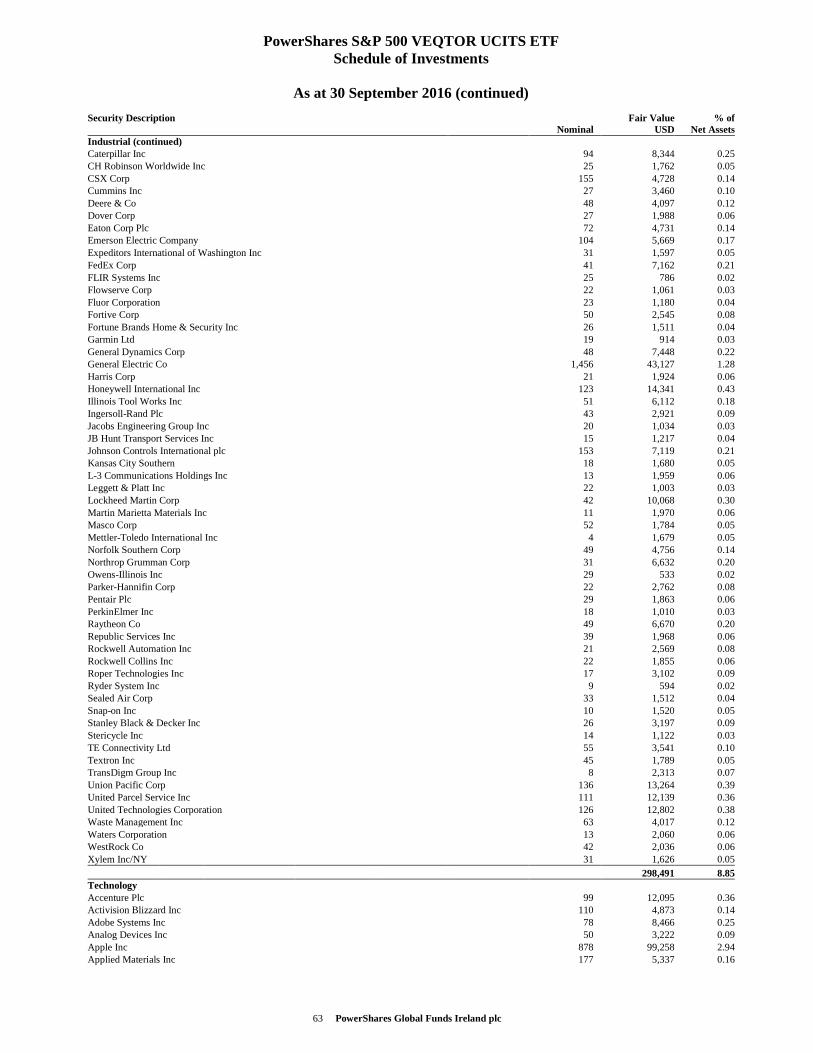
63 PowerShares Global Funds Ireland plc
PowerShares S&P 500 VEQTOR UCITS ETF Schedule of Investments
As at 30 September 2016 (continued)
Security Description Nominal
Fair ValueUSD
% ofNet Assets
Industrial (continued) Caterpillar Inc 94 8,344 0.25CH Robinson Worldwide Inc 25 1,762 0.05CSX Corp 155 4,728 0.14Cummins Inc 27 3,460 0.10Deere & Co 48 4,097 0.12Dover Corp 27 1,988 0.06Eaton Corp Plc 72 4,731 0.14Emerson Electric Company 104 5,669 0.17Expeditors International of Washington Inc 31 1,597 0.05FedEx Corp 41 7,162 0.21FLIR Systems Inc 25 786 0.02Flowserve Corp 22 1,061 0.03Fluor Corporation 23 1,180 0.04Fortive Corp 50 2,545 0.08Fortune Brands Home & Security Inc 26 1,511 0.04Garmin Ltd 19 914 0.03General Dynamics Corp 48 7,448 0.22General Electric Co 1,456 43,127 1.28Harris Corp 21 1,924 0.06Honeywell International Inc 123 14,341 0.43Illinois Tool Works Inc 51 6,112 0.18Ingersoll-Rand Plc 43 2,921 0.09Jacobs Engineering Group Inc 20 1,034 0.03JB Hunt Transport Services Inc 15 1,217 0.04Johnson Controls International plc 153 7,119 0.21Kansas City Southern 18 1,680 0.05L-3 Communications Holdings Inc 13 1,959 0.06Leggett & Platt Inc 22 1,003 0.03Lockheed Martin Corp 42 10,068 0.30Martin Marietta Materials Inc 11 1,970 0.06Masco Corp 52 1,784 0.05Mettler-Toledo International Inc 4 1,679 0.05Norfolk Southern Corp 49 4,756 0.14Northrop Grumman Corp 31 6,632 0.20Owens-Illinois Inc 29 533 0.02Parker-Hannifin Corp 22 2,762 0.08Pentair Plc 29 1,863 0.06PerkinElmer Inc 18 1,010 0.03Raytheon Co 49 6,670 0.20Republic Services Inc 39 1,968 0.06Rockwell Automation Inc 21 2,569 0.08Rockwell Collins Inc 22 1,855 0.06Roper Technologies Inc 17 3,102 0.09Ryder System Inc 9 594 0.02Sealed Air Corp 33 1,512 0.04Snap-on Inc 10 1,520 0.05Stanley Black & Decker Inc 26 3,197 0.09Stericycle Inc 14 1,122 0.03TE Connectivity Ltd 55 3,541 0.10Textron Inc 45 1,789 0.05TransDigm Group Inc 8 2,313 0.07Union Pacific Corp 136 13,264 0.39United Parcel Service Inc 111 12,139 0.36United Technologies Corporation 126 12,802 0.38Waste Management Inc 63 4,017 0.12Waters Corporation 13 2,060 0.06WestRock Co 42 2,036 0.06Xylem Inc/NY 31 1,626 0.05
298,491 8.85Technology Accenture Plc 99 12,095 0.36Activision Blizzard Inc 110 4,873 0.14Adobe Systems Inc 78 8,466 0.25Analog Devices Inc 50 3,222 0.09Apple Inc 878 99,258 2.94Applied Materials Inc 177 5,337 0.16
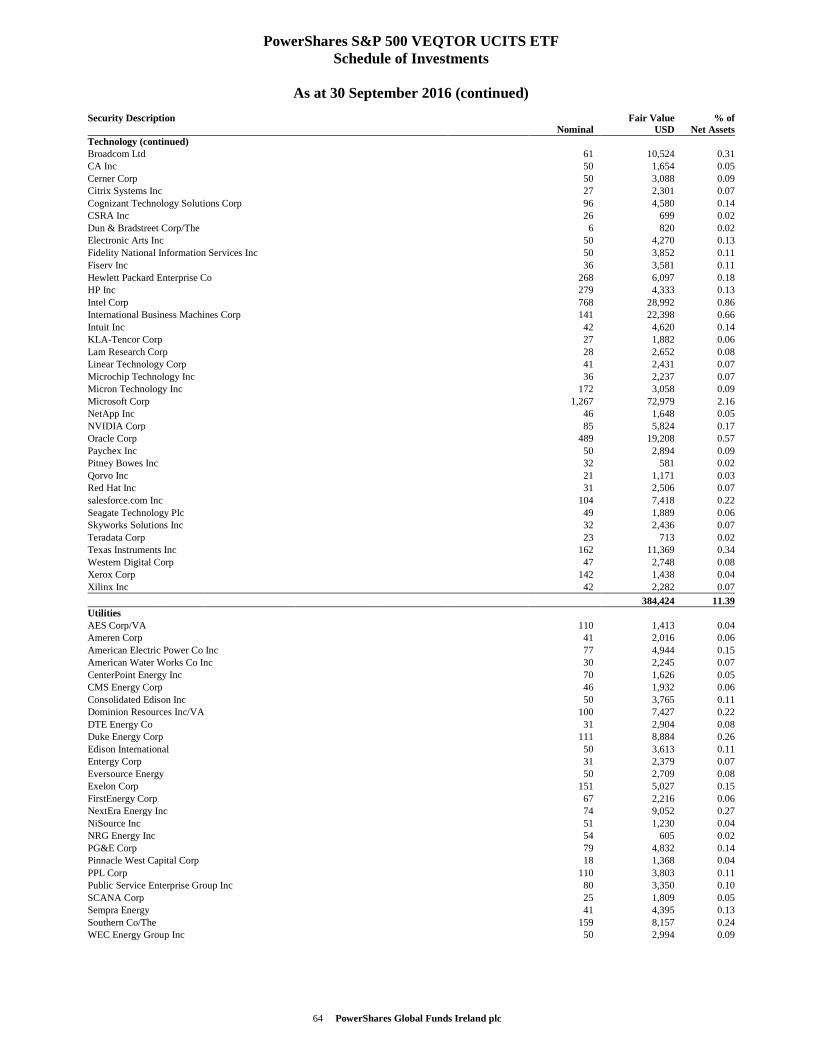
64 PowerShares Global Funds Ireland plc
PowerShares S&P 500 VEQTOR UCITS ETF Schedule of Investments
As at 30 September 2016 (continued)
Security Description Nominal
Fair ValueUSD
% ofNet Assets
Technology (continued) Broadcom Ltd 61 10,524 0.31CA Inc 50 1,654 0.05Cerner Corp 50 3,088 0.09Citrix Systems Inc 27 2,301 0.07Cognizant Technology Solutions Corp 96 4,580 0.14CSRA Inc 26 699 0.02Dun & Bradstreet Corp/The 6 820 0.02Electronic Arts Inc 50 4,270 0.13Fidelity National Information Services Inc 50 3,852 0.11Fiserv Inc 36 3,581 0.11Hewlett Packard Enterprise Co 268 6,097 0.18HP Inc 279 4,333 0.13Intel Corp 768 28,992 0.86International Business Machines Corp 141 22,398 0.66Intuit Inc 42 4,620 0.14KLA-Tencor Corp 27 1,882 0.06Lam Research Corp 28 2,652 0.08Linear Technology Corp 41 2,431 0.07Microchip Technology Inc 36 2,237 0.07Micron Technology Inc 172 3,058 0.09Microsoft Corp 1,267 72,979 2.16NetApp Inc 46 1,648 0.05NVIDIA Corp 85 5,824 0.17Oracle Corp 489 19,208 0.57Paychex Inc 50 2,894 0.09Pitney Bowes Inc 32 581 0.02Qorvo Inc 21 1,171 0.03Red Hat Inc 31 2,506 0.07salesforce.com Inc 104 7,418 0.22Seagate Technology Plc 49 1,889 0.06Skyworks Solutions Inc 32 2,436 0.07Teradata Corp 23 713 0.02Texas Instruments Inc 162 11,369 0.34Western Digital Corp 47 2,748 0.08Xerox Corp 142 1,438 0.04Xilinx Inc 42 2,282 0.07
384,424 11.39Utilities AES Corp/VA 110 1,413 0.04Ameren Corp 41 2,016 0.06American Electric Power Co Inc 77 4,944 0.15American Water Works Co Inc 30 2,245 0.07CenterPoint Energy Inc 70 1,626 0.05CMS Energy Corp 46 1,932 0.06Consolidated Edison Inc 50 3,765 0.11Dominion Resources Inc/VA 100 7,427 0.22DTE Energy Co 31 2,904 0.08Duke Energy Corp 111 8,884 0.26Edison International 50 3,613 0.11Entergy Corp 31 2,379 0.07Eversource Energy 50 2,709 0.08Exelon Corp 151 5,027 0.15FirstEnergy Corp 67 2,216 0.06NextEra Energy Inc 74 9,052 0.27NiSource Inc 51 1,230 0.04NRG Energy Inc 54 605 0.02PG&E Corp 79 4,832 0.14Pinnacle West Capital Corp 18 1,368 0.04PPL Corp 110 3,803 0.11Public Service Enterprise Group Inc 80 3,350 0.10SCANA Corp 25 1,809 0.05Sempra Energy 41 4,395 0.13Southern Co/The 159 8,157 0.24WEC Energy Group Inc 50 2,994 0.09
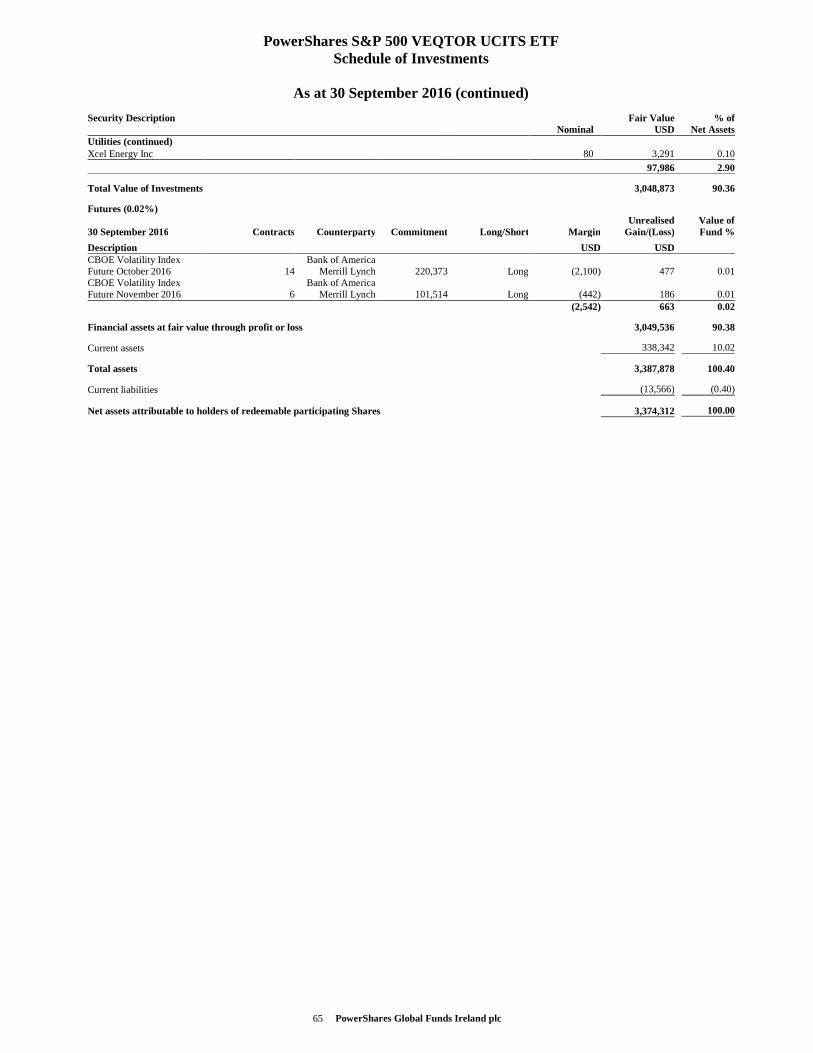
65 PowerShares Global Funds Ireland plc
PowerShares S&P 500 VEQTOR UCITS ETF Schedule of Investments
As at 30 September 2016 (continued)
Security Description Nominal
Fair ValueUSD
% ofNet Assets
Utilities (continued) Xcel Energy Inc 80 3,291 0.10
97,986 2.90
Total Value of Investments 3,048,873 90.36
Futures (0.02%)
30 September 2016 Contracts Counterparty Commitment Long/Short MarginUnrealised
Gain/(Loss)Value of Fund %
Description USD USDCBOE Volatility Index Future October 2016 14
Bank of America Merrill Lynch 220,373 Long (2,100) 477 0.01
CBOE Volatility Index Future November 2016 6
Bank of America Merrill Lynch 101,514 Long (442) 186 0.01
(2,542) 663 0.02
Financial assets at fair value through profit or loss 3,049,536 90.38
Current assets 338,342 10.02
Total assets 3,387,878 100.40
Current liabilities (13,566) (0.40)
Net assets attributable to holders of redeemable participating Shares 3,374,312 100.00
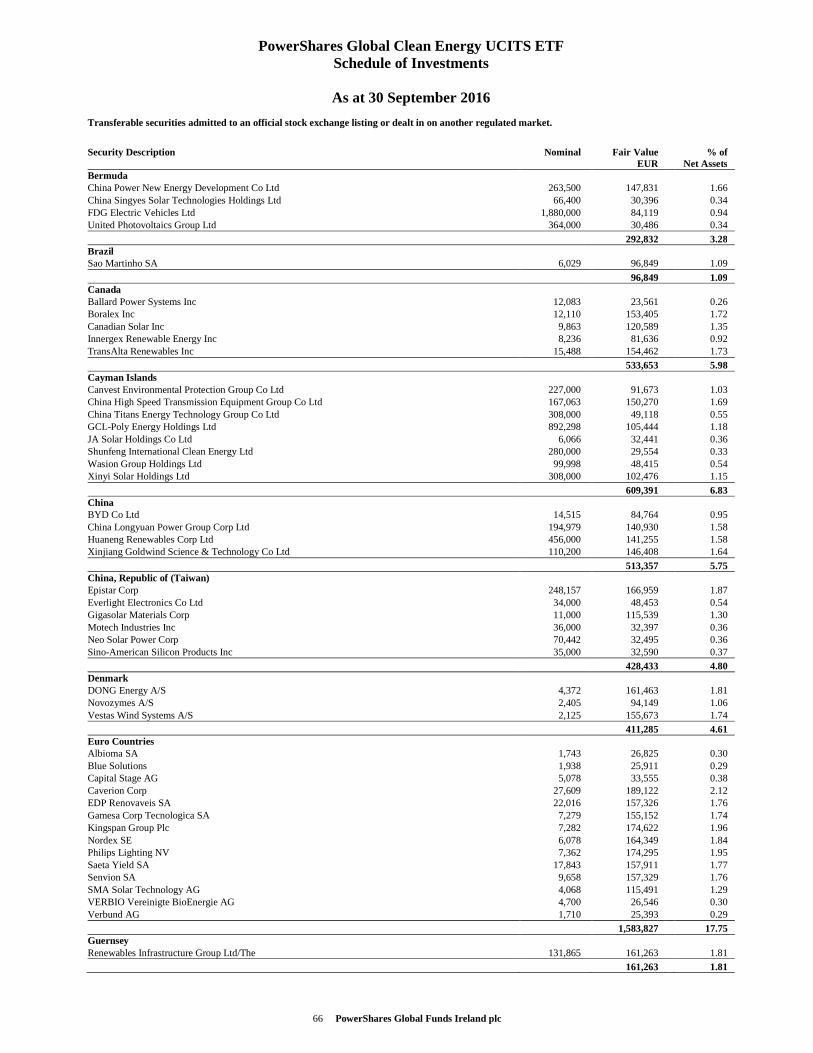
66 PowerShares Global Funds Ireland plc
PowerShares Global Clean Energy UCITS ETF Schedule of Investments
As at 30 September 2016
Transferable securities admitted to an official stock exchange listing or dealt in on another regulated market.
Security Description Nominal Fair Value EUR
% of Net Assets
Bermuda China Power New Energy Development Co Ltd 263,500 147,831 1.66 China Singyes Solar Technologies Holdings Ltd 66,400 30,396 0.34 FDG Electric Vehicles Ltd 1,880,000 84,119 0.94 United Photovoltaics Group Ltd 364,000 30,486 0.34
292,832 3.28 Brazil Sao Martinho SA 6,029 96,849 1.09
96,849 1.09 Canada Ballard Power Systems Inc 12,083 23,561 0.26 Boralex Inc 12,110 153,405 1.72 Canadian Solar Inc 9,863 120,589 1.35 Innergex Renewable Energy Inc 8,236 81,636 0.92 TransAlta Renewables Inc 15,488 154,462 1.73
533,653 5.98 Cayman Islands Canvest Environmental Protection Group Co Ltd 227,000 91,673 1.03 China High Speed Transmission Equipment Group Co Ltd 167,063 150,270 1.69 China Titans Energy Technology Group Co Ltd 308,000 49,118 0.55 GCL-Poly Energy Holdings Ltd 892,298 105,444 1.18 JA Solar Holdings Co Ltd 6,066 32,441 0.36 Shunfeng International Clean Energy Ltd 280,000 29,554 0.33 Wasion Group Holdings Ltd 99,998 48,415 0.54 Xinyi Solar Holdings Ltd 308,000 102,476 1.15
609,391 6.83 China BYD Co Ltd 14,515 84,764 0.95 China Longyuan Power Group Corp Ltd 194,979 140,930 1.58 Huaneng Renewables Corp Ltd 456,000 141,255 1.58 Xinjiang Goldwind Science & Technology Co Ltd 110,200 146,408 1.64
513,357 5.75 China, Republic of (Taiwan) Epistar Corp 248,157 166,959 1.87 Everlight Electronics Co Ltd 34,000 48,453 0.54 Gigasolar Materials Corp 11,000 115,539 1.30 Motech Industries Inc 36,000 32,397 0.36 Neo Solar Power Corp 70,442 32,495 0.36 Sino-American Silicon Products Inc 35,000 32,590 0.37
428,433 4.80 Denmark DONG Energy A/S 4,372 161,463 1.81 Novozymes A/S 2,405 94,149 1.06 Vestas Wind Systems A/S 2,125 155,673 1.74
411,285 4.61 Euro Countries Albioma SA 1,743 26,825 0.30 Blue Solutions 1,938 25,911 0.29 Capital Stage AG 5,078 33,555 0.38 Caverion Corp 27,609 189,122 2.12 EDP Renovaveis SA 22,016 157,326 1.76 Gamesa Corp Tecnologica SA 7,279 155,152 1.74 Kingspan Group Plc 7,282 174,622 1.96 Nordex SE 6,078 164,349 1.84 Philips Lighting NV 7,362 174,295 1.95 Saeta Yield SA 17,843 157,911 1.77 Senvion SA 9,658 157,329 1.76 SMA Solar Technology AG 4,068 115,491 1.29 VERBIO Vereinigte BioEnergie AG 4,700 26,546 0.30 Verbund AG 1,710 25,393 0.29
1,583,827 17.75 Guernsey Renewables Infrastructure Group Ltd/The 131,865 161,263 1.81
161,263 1.81
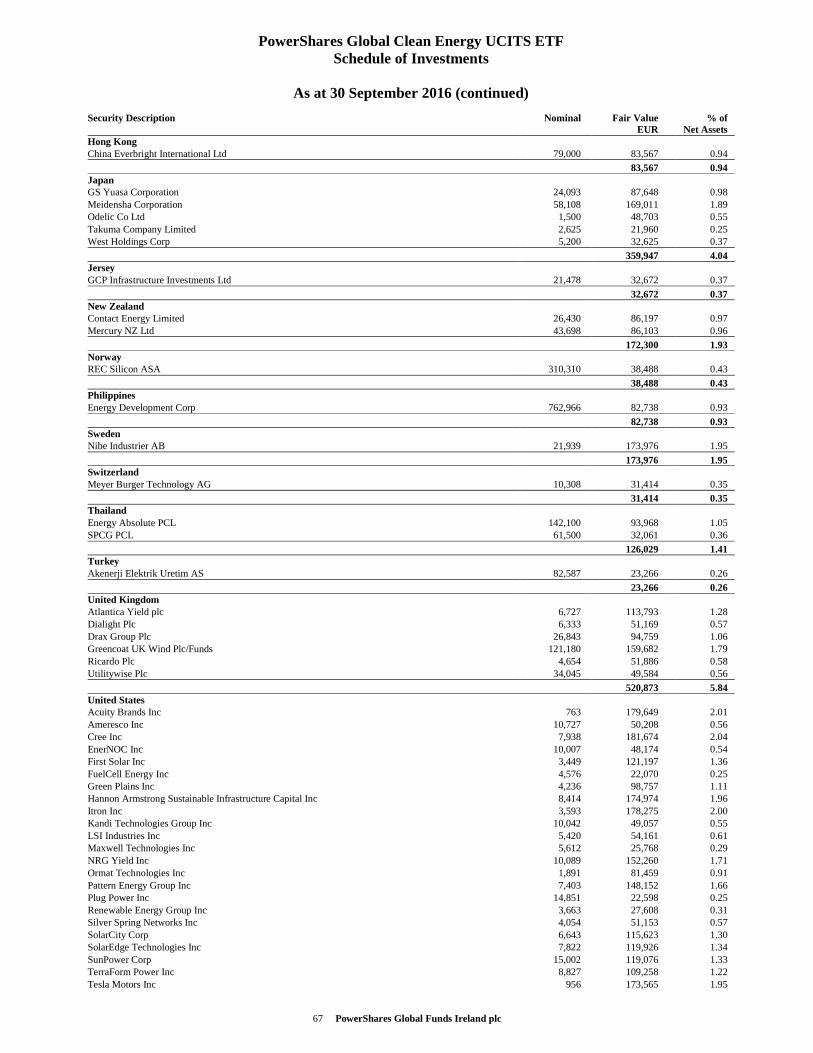
67 PowerShares Global Funds Ireland plc
PowerShares Global Clean Energy UCITS ETF Schedule of Investments
As at 30 September 2016 (continued)
Security Description Nominal Fair Value EUR
% of Net Assets
Hong Kong China Everbright International Ltd 79,000 83,567 0.94
83,567 0.94 Japan GS Yuasa Corporation 24,093 87,648 0.98 Meidensha Corporation 58,108 169,011 1.89 Odelic Co Ltd 1,500 48,703 0.55 Takuma Company Limited 2,625 21,960 0.25 West Holdings Corp 5,200 32,625 0.37
359,947 4.04 Jersey GCP Infrastructure Investments Ltd 21,478 32,672 0.37
32,672 0.37 New Zealand Contact Energy Limited 26,430 86,197 0.97 Mercury NZ Ltd 43,698 86,103 0.96
172,300 1.93 Norway REC Silicon ASA 310,310 38,488 0.43
38,488 0.43 Philippines Energy Development Corp 762,966 82,738 0.93
82,738 0.93 Sweden Nibe Industrier AB 21,939 173,976 1.95
173,976 1.95 Switzerland Meyer Burger Technology AG 10,308 31,414 0.35
31,414 0.35 Thailand Energy Absolute PCL 142,100 93,968 1.05 SPCG PCL 61,500 32,061 0.36
126,029 1.41 Turkey Akenerji Elektrik Uretim AS 82,587 23,266 0.26
23,266 0.26 United Kingdom Atlantica Yield plc 6,727 113,793 1.28 Dialight Plc 6,333 51,169 0.57 Drax Group Plc 26,843 94,759 1.06 Greencoat UK Wind Plc/Funds 121,180 159,682 1.79 Ricardo Plc 4,654 51,886 0.58 Utilitywise Plc 34,045 49,584 0.56
520,873 5.84 United States Acuity Brands Inc 763 179,649 2.01 Ameresco Inc 10,727 50,208 0.56 Cree Inc 7,938 181,674 2.04 EnerNOC Inc 10,007 48,174 0.54 First Solar Inc 3,449 121,197 1.36 FuelCell Energy Inc 4,576 22,070 0.25 Green Plains Inc 4,236 98,757 1.11 Hannon Armstrong Sustainable Infrastructure Capital Inc 8,414 174,974 1.96 Itron Inc 3,593 178,275 2.00 Kandi Technologies Group Inc 10,042 49,057 0.55 LSI Industries Inc 5,420 54,161 0.61 Maxwell Technologies Inc 5,612 25,768 0.29 NRG Yield Inc 10,089 152,260 1.71 Ormat Technologies Inc 1,891 81,459 0.91 Pattern Energy Group Inc 7,403 148,152 1.66 Plug Power Inc 14,851 22,598 0.25 Renewable Energy Group Inc 3,663 27,608 0.31 Silver Spring Networks Inc 4,054 51,153 0.57 SolarCity Corp 6,643 115,623 1.30 SolarEdge Technologies Inc 7,822 119,926 1.34 SunPower Corp 15,002 119,076 1.33 TerraForm Power Inc 8,827 109,258 1.22 Tesla Motors Inc 956 173,565 1.95
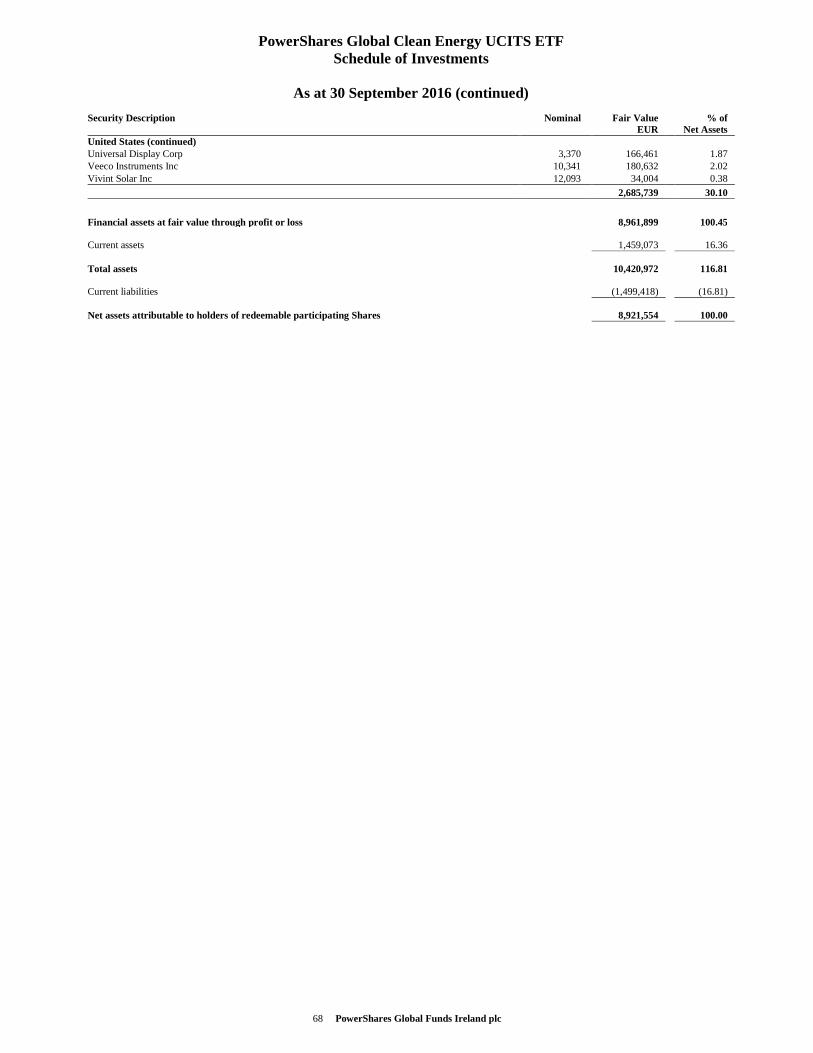
68 PowerShares Global Funds Ireland plc
PowerShares Global Clean Energy UCITS ETF Schedule of Investments
As at 30 September 2016 (continued)
Security Description Nominal Fair Value EUR
% of Net Assets
United States (continued) Universal Display Corp 3,370 166,461 1.87 Veeco Instruments Inc 10,341 180,632 2.02 Vivint Solar Inc 12,093 34,004 0.38
2,685,739 30.10
Financial assets at fair value through profit or loss 8,961,899 100.45 Current assets 1,459,073 16.36 Total assets 10,420,972 116.81 Current liabilities (1,499,418) (16.81) Net assets attributable to holders of redeemable participating Shares 8,921,554 100.00
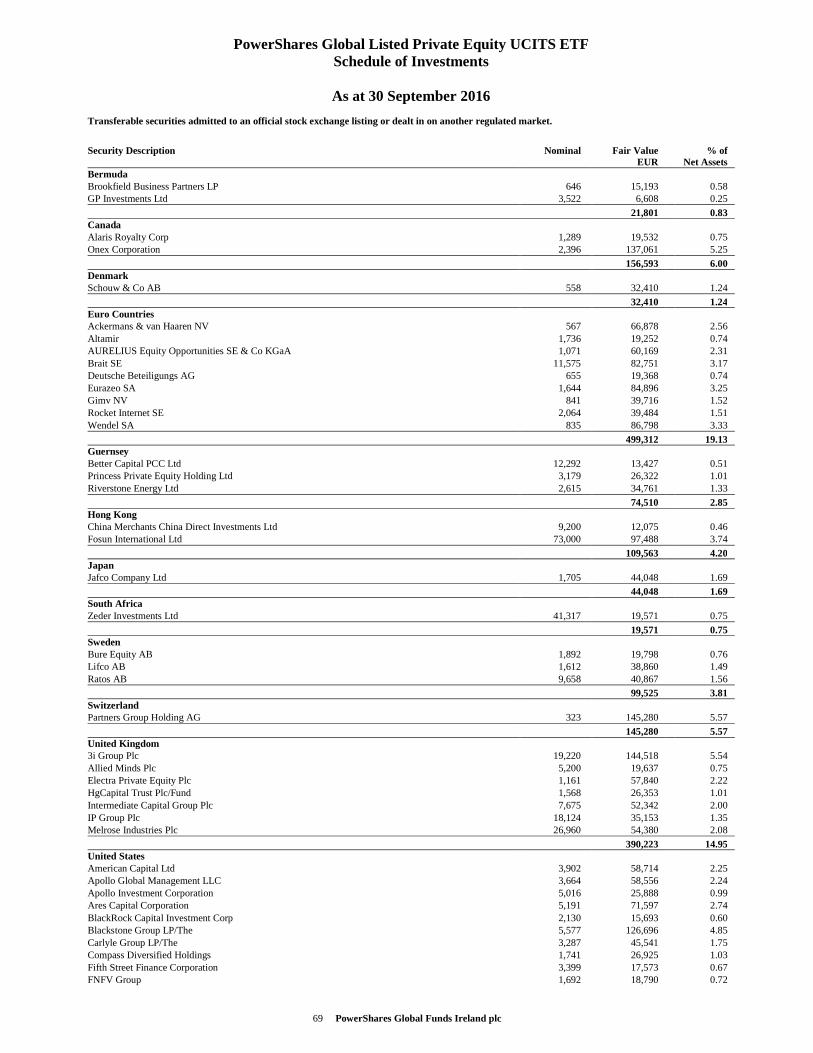
69 PowerShares Global Funds Ireland plc
PowerShares Global Listed Private Equity UCITS ETF Schedule of Investments
As at 30 September 2016
Transferable securities admitted to an official stock exchange listing or dealt in on another regulated market.
Security Description Nominal Fair Value EUR
% of Net Assets
Bermuda Brookfield Business Partners LP 646 15,193 0.58 GP Investments Ltd 3,522 6,608 0.25
21,801 0.83 Canada Alaris Royalty Corp 1,289 19,532 0.75 Onex Corporation 2,396 137,061 5.25
156,593 6.00 Denmark Schouw & Co AB 558 32,410 1.24
32,410 1.24 Euro Countries Ackermans & van Haaren NV 567 66,878 2.56 Altamir 1,736 19,252 0.74 AURELIUS Equity Opportunities SE & Co KGaA 1,071 60,169 2.31 Brait SE 11,575 82,751 3.17 Deutsche Beteiligungs AG 655 19,368 0.74 Eurazeo SA 1,644 84,896 3.25 Gimv NV 841 39,716 1.52 Rocket Internet SE 2,064 39,484 1.51 Wendel SA 835 86,798 3.33
499,312 19.13 Guernsey Better Capital PCC Ltd 12,292 13,427 0.51 Princess Private Equity Holding Ltd 3,179 26,322 1.01 Riverstone Energy Ltd 2,615 34,761 1.33
74,510 2.85 Hong Kong China Merchants China Direct Investments Ltd 9,200 12,075 0.46 Fosun International Ltd 73,000 97,488 3.74
109,563 4.20 Japan Jafco Company Ltd 1,705 44,048 1.69
44,048 1.69 South Africa Zeder Investments Ltd 41,317 19,571 0.75
19,571 0.75 Sweden Bure Equity AB 1,892 19,798 0.76 Lifco AB 1,612 38,860 1.49 Ratos AB 9,658 40,867 1.56
99,525 3.81 Switzerland Partners Group Holding AG 323 145,280 5.57
145,280 5.57 United Kingdom 3i Group Plc 19,220 144,518 5.54 Allied Minds Plc 5,200 19,637 0.75 Electra Private Equity Plc 1,161 57,840 2.22 HgCapital Trust Plc/Fund 1,568 26,353 1.01 Intermediate Capital Group Plc 7,675 52,342 2.00 IP Group Plc 18,124 35,153 1.35 Melrose Industries Plc 26,960 54,380 2.08
390,223 14.95 United States American Capital Ltd 3,902 58,714 2.25 Apollo Global Management LLC 3,664 58,556 2.24 Apollo Investment Corporation 5,016 25,888 0.99 Ares Capital Corporation 5,191 71,597 2.74 BlackRock Capital Investment Corp 2,130 15,693 0.60 Blackstone Group LP/The 5,577 126,696 4.85 Carlyle Group LP/The 3,287 45,541 1.75 Compass Diversified Holdings 1,741 26,925 1.03 Fifth Street Finance Corporation 3,399 17,573 0.67 FNFV Group 1,692 18,790 0.72
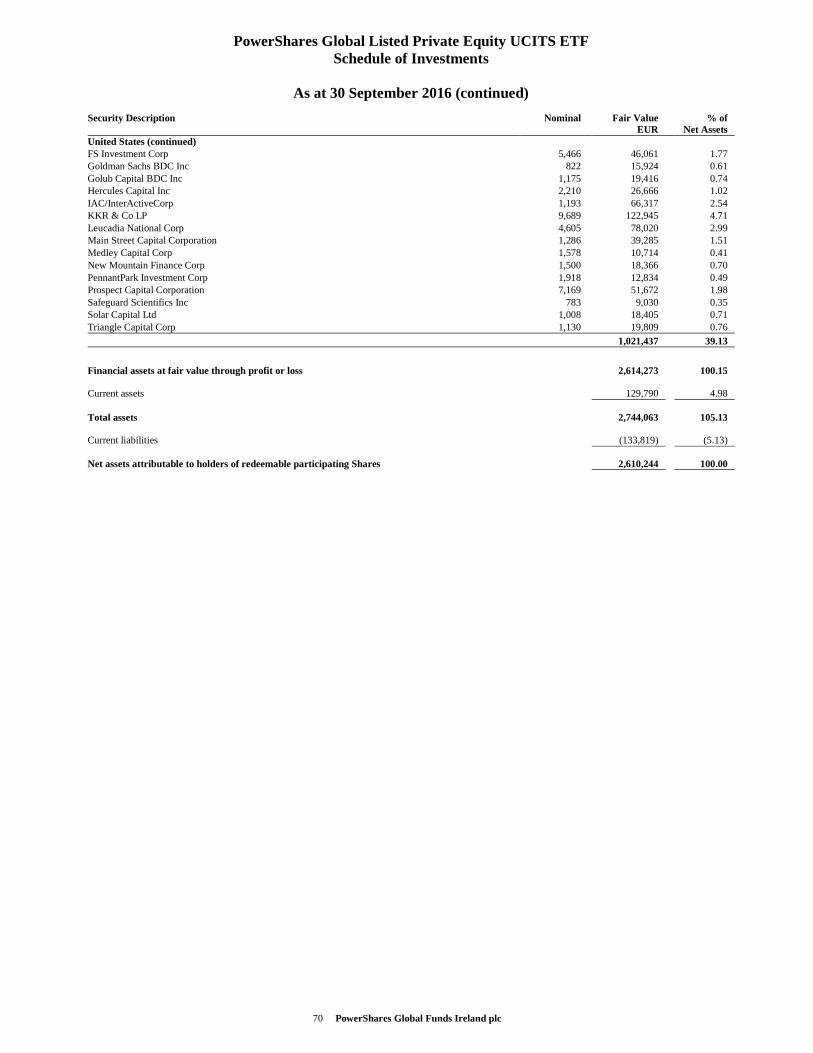
70 PowerShares Global Funds Ireland plc
PowerShares Global Listed Private Equity UCITS ETF Schedule of Investments
As at 30 September 2016 (continued)
Security Description Nominal Fair Value EUR
% of Net Assets
United States (continued) FS Investment Corp 5,466 46,061 1.77 Goldman Sachs BDC Inc 822 15,924 0.61 Golub Capital BDC Inc 1,175 19,416 0.74 Hercules Capital Inc 2,210 26,666 1.02 IAC/InterActiveCorp 1,193 66,317 2.54 KKR & Co LP 9,689 122,945 4.71 Leucadia National Corp 4,605 78,020 2.99 Main Street Capital Corporation 1,286 39,285 1.51 Medley Capital Corp 1,578 10,714 0.41 New Mountain Finance Corp 1,500 18,366 0.70 PennantPark Investment Corp 1,918 12,834 0.49 Prospect Capital Corporation 7,169 51,672 1.98 Safeguard Scientifics Inc 783 9,030 0.35 Solar Capital Ltd 1,008 18,405 0.71 Triangle Capital Corp 1,130 19,809 0.76
1,021,437 39.13
Financial assets at fair value through profit or loss 2,614,273 100.15 Current assets 129,790 4.98 Total assets 2,744,063 105.13 Current liabilities (133,819) (5.13) Net assets attributable to holders of redeemable participating Shares 2,610,244 100.00
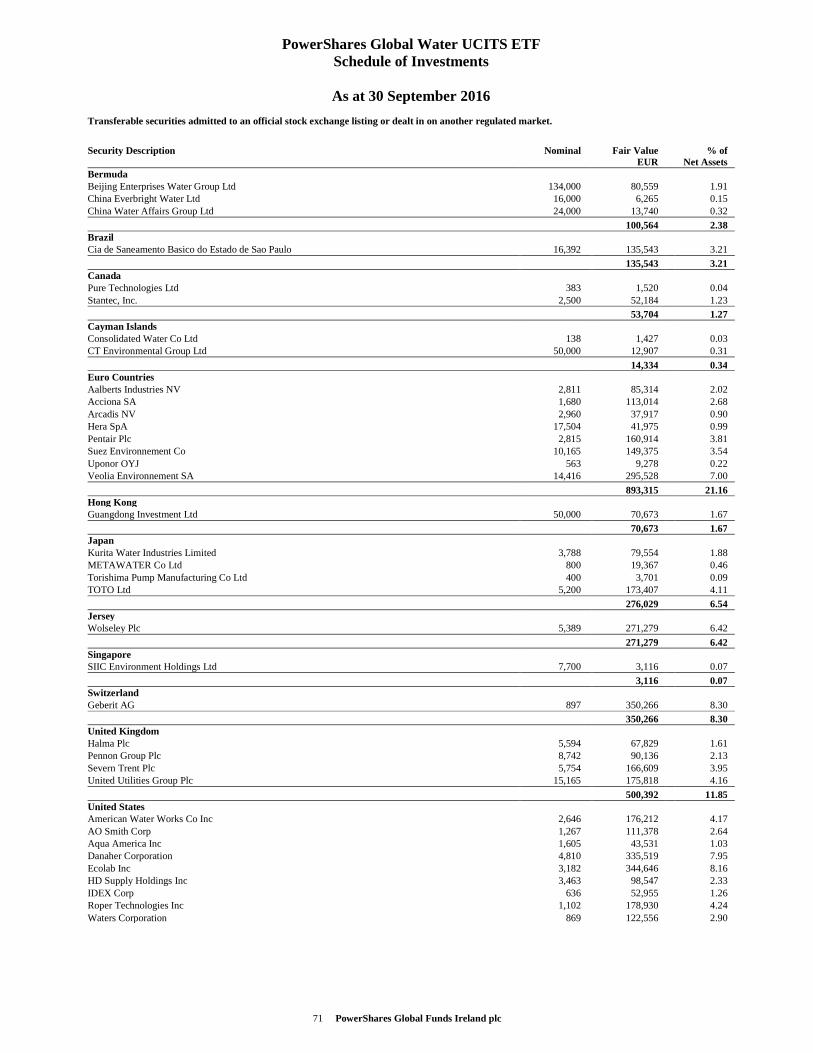
71 PowerShares Global Funds Ireland plc
PowerShares Global Water UCITS ETF Schedule of Investments
As at 30 September 2016
Transferable securities admitted to an official stock exchange listing or dealt in on another regulated market.
Security Description Nominal Fair Value EUR
% of Net Assets
Bermuda Beijing Enterprises Water Group Ltd 134,000 80,559 1.91 China Everbright Water Ltd 16,000 6,265 0.15 China Water Affairs Group Ltd 24,000 13,740 0.32
100,564 2.38 Brazil Cia de Saneamento Basico do Estado de Sao Paulo 16,392 135,543 3.21
135,543 3.21 Canada Pure Technologies Ltd 383 1,520 0.04 Stantec, Inc. 2,500 52,184 1.23
53,704 1.27 Cayman Islands Consolidated Water Co Ltd 138 1,427 0.03 CT Environmental Group Ltd 50,000 12,907 0.31
14,334 0.34 Euro Countries Aalberts Industries NV 2,811 85,314 2.02 Acciona SA 1,680 113,014 2.68 Arcadis NV 2,960 37,917 0.90 Hera SpA 17,504 41,975 0.99 Pentair Plc 2,815 160,914 3.81 Suez Environnement Co 10,165 149,375 3.54 Uponor OYJ 563 9,278 0.22 Veolia Environnement SA 14,416 295,528 7.00
893,315 21.16 Hong Kong Guangdong Investment Ltd 50,000 70,673 1.67
70,673 1.67 Japan Kurita Water Industries Limited 3,788 79,554 1.88 METAWATER Co Ltd 800 19,367 0.46 Torishima Pump Manufacturing Co Ltd 400 3,701 0.09 TOTO Ltd 5,200 173,407 4.11
276,029 6.54 Jersey Wolseley Plc 5,389 271,279 6.42
271,279 6.42 Singapore SIIC Environment Holdings Ltd 7,700 3,116 0.07
3,116 0.07 Switzerland Geberit AG 897 350,266 8.30
350,266 8.30 United Kingdom Halma Plc 5,594 67,829 1.61 Pennon Group Plc 8,742 90,136 2.13 Severn Trent Plc 5,754 166,609 3.95 United Utilities Group Plc 15,165 175,818 4.16
500,392 11.85 United States American Water Works Co Inc 2,646 176,212 4.17 AO Smith Corp 1,267 111,378 2.64 Aqua America Inc 1,605 43,531 1.03 Danaher Corporation 4,810 335,519 7.95 Ecolab Inc 3,182 344,646 8.16 HD Supply Holdings Inc 3,463 98,547 2.33 IDEX Corp 636 52,955 1.26 Roper Technologies Inc 1,102 178,930 4.24 Waters Corporation 869 122,556 2.90
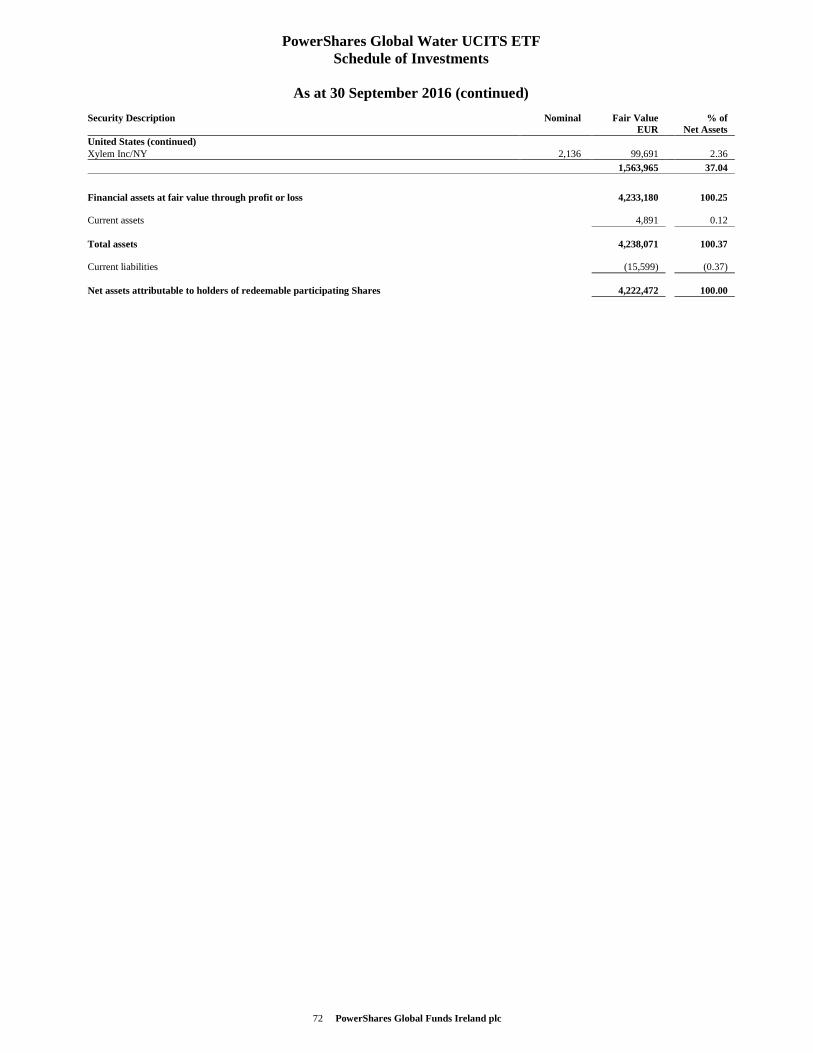
72 PowerShares Global Funds Ireland plc
PowerShares Global Water UCITS ETF Schedule of Investments
As at 30 September 2016 (continued)
Security Description Nominal Fair Value EUR
% of Net Assets
United States (continued) Xylem Inc/NY 2,136 99,691 2.36
1,563,965 37.04
Financial assets at fair value through profit or loss 4,233,180 100.25 Current assets 4,891 0.12 Total assets 4,238,071 100.37 Current liabilities (15,599) (0.37) Net assets attributable to holders of redeemable participating Shares 4,222,472 100.00
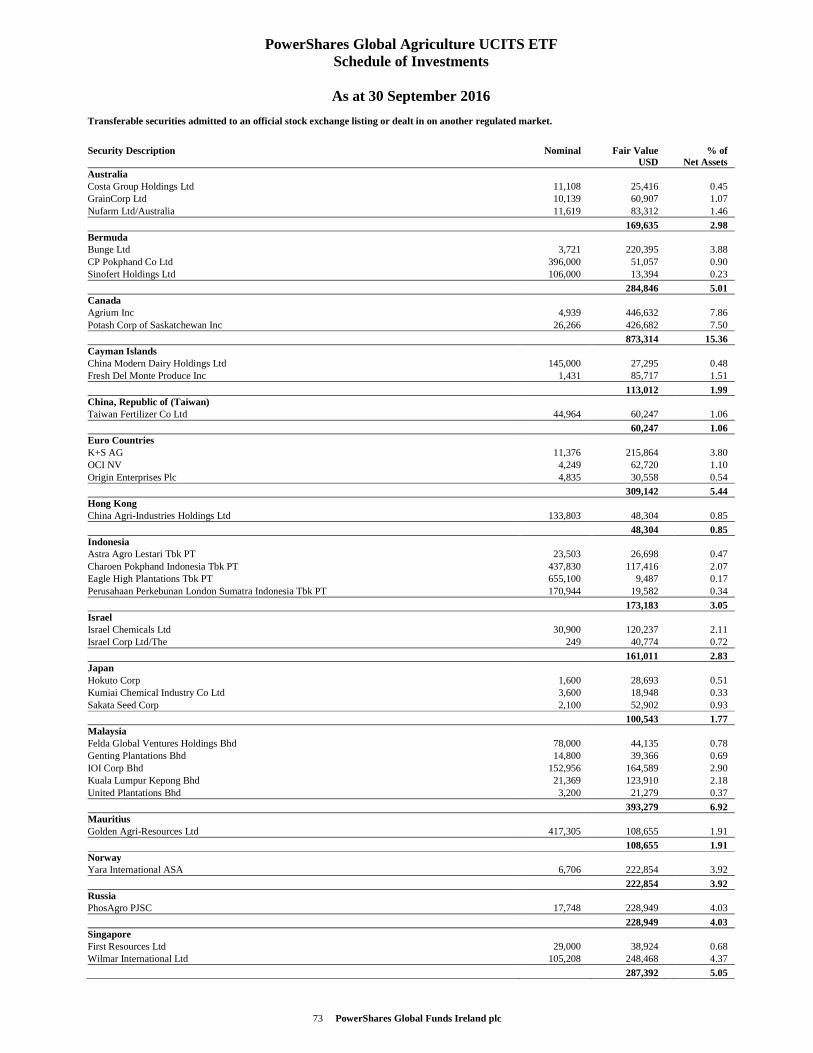
73 PowerShares Global Funds Ireland plc
PowerShares Global Agriculture UCITS ETF Schedule of Investments
As at 30 September 2016
Transferable securities admitted to an official stock exchange listing or dealt in on another regulated market.
Security Description Nominal Fair Value USD
% of Net Assets
Australia Costa Group Holdings Ltd 11,108 25,416 0.45 GrainCorp Ltd 10,139 60,907 1.07 Nufarm Ltd/Australia 11,619 83,312 1.46
169,635 2.98 Bermuda Bunge Ltd 3,721 220,395 3.88 CP Pokphand Co Ltd 396,000 51,057 0.90 Sinofert Holdings Ltd 106,000 13,394 0.23
284,846 5.01 Canada Agrium Inc 4,939 446,632 7.86 Potash Corp of Saskatchewan Inc 26,266 426,682 7.50
873,314 15.36 Cayman Islands China Modern Dairy Holdings Ltd 145,000 27,295 0.48 Fresh Del Monte Produce Inc 1,431 85,717 1.51
113,012 1.99 China, Republic of (Taiwan) Taiwan Fertilizer Co Ltd 44,964 60,247 1.06
60,247 1.06 Euro Countries K+S AG 11,376 215,864 3.80 OCI NV 4,249 62,720 1.10 Origin Enterprises Plc 4,835 30,558 0.54
309,142 5.44 Hong Kong China Agri-Industries Holdings Ltd 133,803 48,304 0.85
48,304 0.85 Indonesia Astra Agro Lestari Tbk PT 23,503 26,698 0.47 Charoen Pokphand Indonesia Tbk PT 437,830 117,416 2.07 Eagle High Plantations Tbk PT 655,100 9,487 0.17 Perusahaan Perkebunan London Sumatra Indonesia Tbk PT 170,944 19,582 0.34
173,183 3.05 Israel Israel Chemicals Ltd 30,900 120,237 2.11 Israel Corp Ltd/The 249 40,774 0.72
161,011 2.83 Japan Hokuto Corp 1,600 28,693 0.51 Kumiai Chemical Industry Co Ltd 3,600 18,948 0.33 Sakata Seed Corp 2,100 52,902 0.93
100,543 1.77 Malaysia Felda Global Ventures Holdings Bhd 78,000 44,135 0.78 Genting Plantations Bhd 14,800 39,366 0.69 IOI Corp Bhd 152,956 164,589 2.90 Kuala Lumpur Kepong Bhd 21,369 123,910 2.18 United Plantations Bhd 3,200 21,279 0.37
393,279 6.92 Mauritius Golden Agri-Resources Ltd 417,305 108,655 1.91
108,655 1.91 Norway Yara International ASA 6,706 222,854 3.92
222,854 3.92 Russia PhosAgro PJSC 17,748 228,949 4.03
228,949 4.03 Singapore First Resources Ltd 29,000 38,924 0.68 Wilmar International Ltd 105,208 248,468 4.37
287,392 5.05
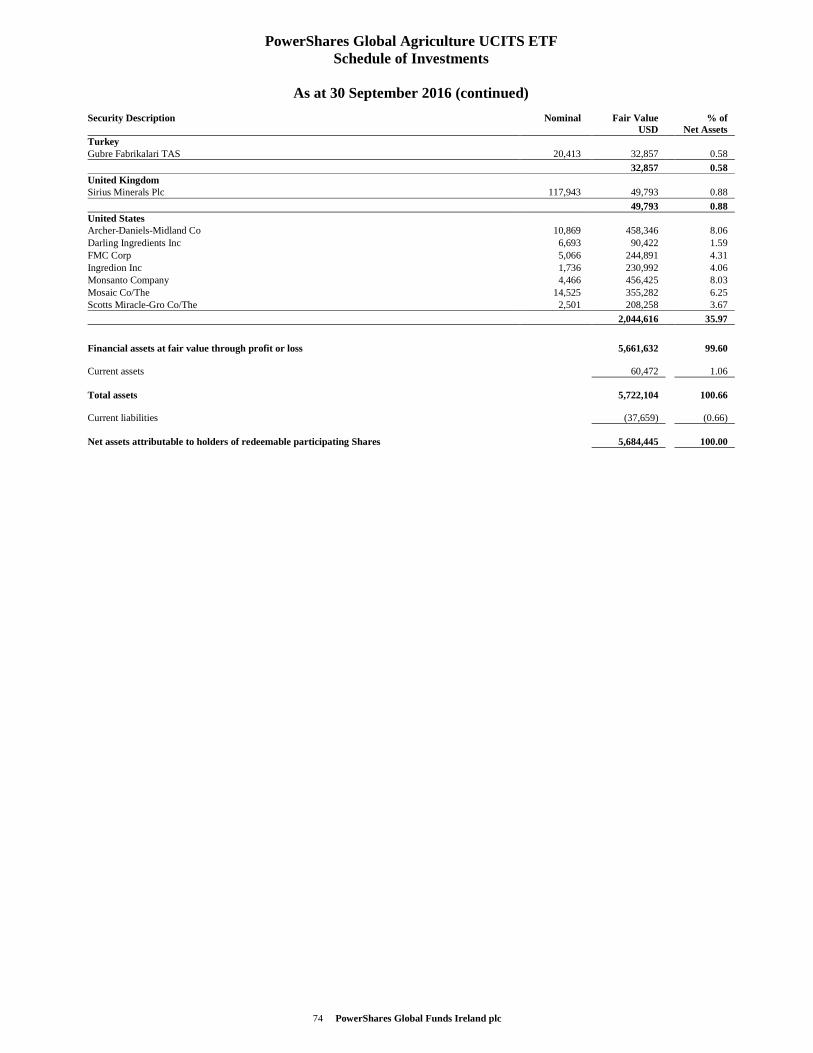
74 PowerShares Global Funds Ireland plc
PowerShares Global Agriculture UCITS ETF Schedule of Investments
As at 30 September 2016 (continued)
Security Description Nominal Fair Value USD
% of Net Assets
Turkey Gubre Fabrikalari TAS 20,413 32,857 0.58
32,857 0.58 United Kingdom Sirius Minerals Plc 117,943 49,793 0.88
49,793 0.88 United States Archer-Daniels-Midland Co 10,869 458,346 8.06 Darling Ingredients Inc 6,693 90,422 1.59 FMC Corp 5,066 244,891 4.31 Ingredion Inc 1,736 230,992 4.06 Monsanto Company 4,466 456,425 8.03 Mosaic Co/The 14,525 355,282 6.25 Scotts Miracle-Gro Co/The 2,501 208,258 3.67
2,044,616 35.97
Financial assets at fair value through profit or loss 5,661,632 99.60 Current assets 60,472 1.06 Total assets 5,722,104 100.66 Current liabilities (37,659) (0.66) Net assets attributable to holders of redeemable participating Shares 5,684,445 100.00
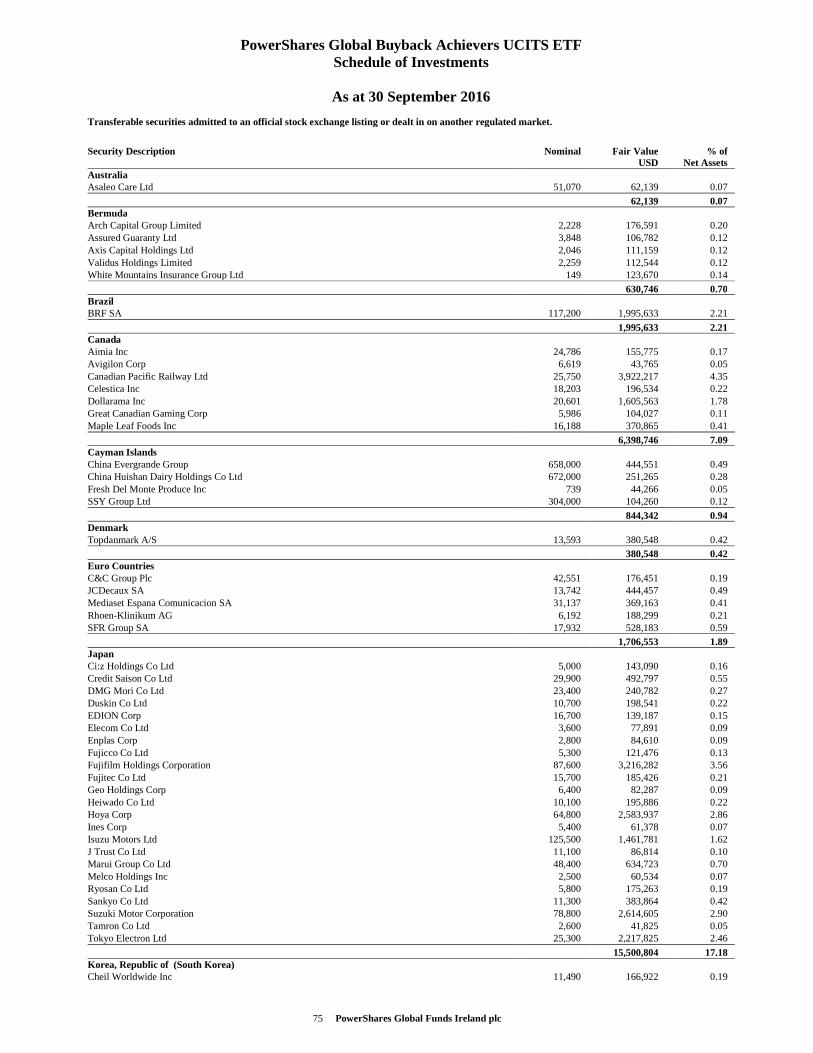
75 PowerShares Global Funds Ireland plc
PowerShares Global Buyback Achievers UCITS ETF Schedule of Investments
As at 30 September 2016
Transferable securities admitted to an official stock exchange listing or dealt in on another regulated market.
Security Description Nominal Fair Value USD
% of Net Assets
Australia Asaleo Care Ltd 51,070 62,139 0.07
62,139 0.07 Bermuda Arch Capital Group Limited 2,228 176,591 0.20 Assured Guaranty Ltd 3,848 106,782 0.12 Axis Capital Holdings Ltd 2,046 111,159 0.12 Validus Holdings Limited 2,259 112,544 0.12 White Mountains Insurance Group Ltd 149 123,670 0.14
630,746 0.70 Brazil BRF SA 117,200 1,995,633 2.21
1,995,633 2.21 Canada Aimia Inc 24,786 155,775 0.17 Avigilon Corp 6,619 43,765 0.05 Canadian Pacific Railway Ltd 25,750 3,922,217 4.35 Celestica Inc 18,203 196,534 0.22 Dollarama Inc 20,601 1,605,563 1.78 Great Canadian Gaming Corp 5,986 104,027 0.11 Maple Leaf Foods Inc 16,188 370,865 0.41
6,398,746 7.09 Cayman Islands China Evergrande Group 658,000 444,551 0.49 China Huishan Dairy Holdings Co Ltd 672,000 251,265 0.28 Fresh Del Monte Produce Inc 739 44,266 0.05 SSY Group Ltd 304,000 104,260 0.12
844,342 0.94 Denmark Topdanmark A/S 13,593 380,548 0.42
380,548 0.42 Euro Countries C&C Group Plc 42,551 176,451 0.19 JCDecaux SA 13,742 444,457 0.49 Mediaset Espana Comunicacion SA 31,137 369,163 0.41 Rhoen-Klinikum AG 6,192 188,299 0.21 SFR Group SA 17,932 528,183 0.59
1,706,553 1.89 Japan Ci:z Holdings Co Ltd 5,000 143,090 0.16 Credit Saison Co Ltd 29,900 492,797 0.55 DMG Mori Co Ltd 23,400 240,782 0.27 Duskin Co Ltd 10,700 198,541 0.22 EDION Corp 16,700 139,187 0.15 Elecom Co Ltd 3,600 77,891 0.09 Enplas Corp 2,800 84,610 0.09 Fujicco Co Ltd 5,300 121,476 0.13 Fujifilm Holdings Corporation 87,600 3,216,282 3.56 Fujitec Co Ltd 15,700 185,426 0.21 Geo Holdings Corp 6,400 82,287 0.09 Heiwado Co Ltd 10,100 195,886 0.22 Hoya Corp 64,800 2,583,937 2.86 Ines Corp 5,400 61,378 0.07 Isuzu Motors Ltd 125,500 1,461,781 1.62 J Trust Co Ltd 11,100 86,814 0.10 Marui Group Co Ltd 48,400 634,723 0.70 Melco Holdings Inc 2,500 60,534 0.07 Ryosan Co Ltd 5,800 175,263 0.19 Sankyo Co Ltd 11,300 383,864 0.42 Suzuki Motor Corporation 78,800 2,614,605 2.90 Tamron Co Ltd 2,600 41,825 0.05 Tokyo Electron Ltd 25,300 2,217,825 2.46
15,500,804 17.18 Korea, Republic of (South Korea) Cheil Worldwide Inc 11,490 166,922 0.19
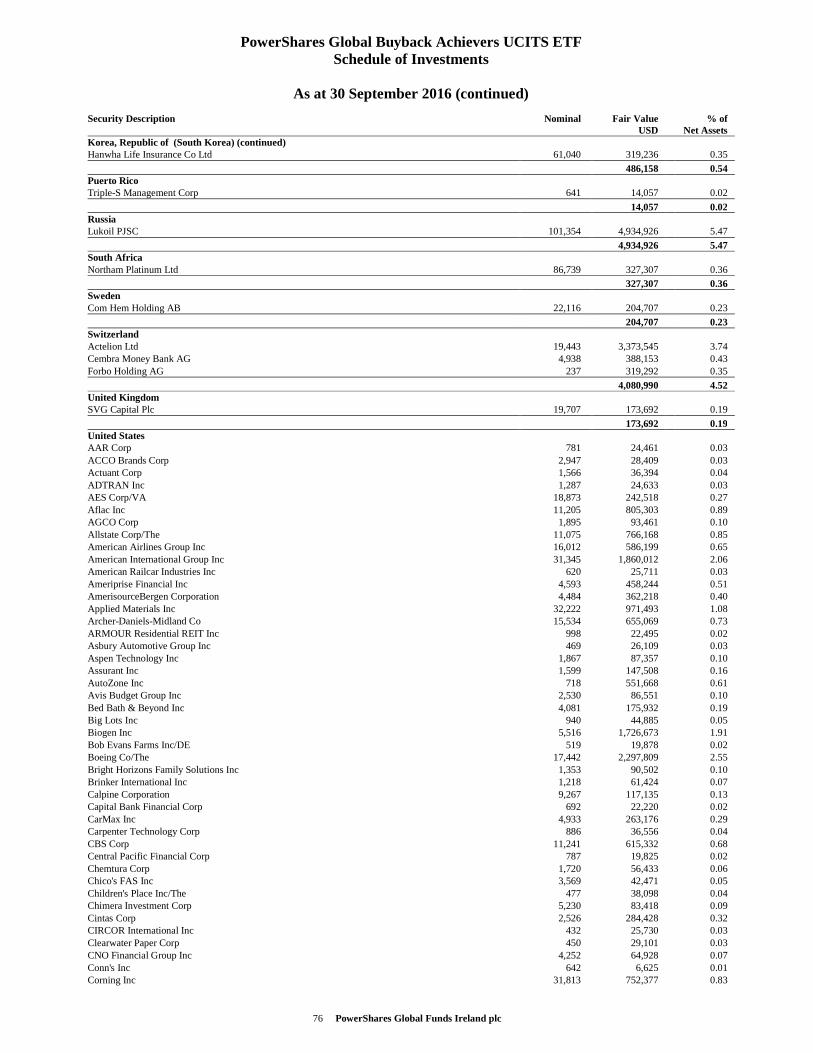
76 PowerShares Global Funds Ireland plc
PowerShares Global Buyback Achievers UCITS ETF Schedule of Investments
As at 30 September 2016 (continued)
Security Description Nominal Fair Value USD
% of Net Assets
Korea, Republic of (South Korea) (continued) Hanwha Life Insurance Co Ltd 61,040 319,236 0.35
486,158 0.54 Puerto Rico Triple-S Management Corp 641 14,057 0.02
14,057 0.02 Russia Lukoil PJSC 101,354 4,934,926 5.47
4,934,926 5.47 South Africa Northam Platinum Ltd 86,739 327,307 0.36
327,307 0.36 Sweden Com Hem Holding AB 22,116 204,707 0.23
204,707 0.23 Switzerland Actelion Ltd 19,443 3,373,545 3.74 Cembra Money Bank AG 4,938 388,153 0.43 Forbo Holding AG 237 319,292 0.35
4,080,990 4.52 United Kingdom SVG Capital Plc 19,707 173,692 0.19
173,692 0.19 United States AAR Corp 781 24,461 0.03 ACCO Brands Corp 2,947 28,409 0.03 Actuant Corp 1,566 36,394 0.04 ADTRAN Inc 1,287 24,633 0.03 AES Corp/VA 18,873 242,518 0.27 Aflac Inc 11,205 805,303 0.89 AGCO Corp 1,895 93,461 0.10 Allstate Corp/The 11,075 766,168 0.85 American Airlines Group Inc 16,012 586,199 0.65 American International Group Inc 31,345 1,860,012 2.06 American Railcar Industries Inc 620 25,711 0.03 Ameriprise Financial Inc 4,593 458,244 0.51 AmerisourceBergen Corporation 4,484 362,218 0.40 Applied Materials Inc 32,222 971,493 1.08 Archer-Daniels-Midland Co 15,534 655,069 0.73 ARMOUR Residential REIT Inc 998 22,495 0.02 Asbury Automotive Group Inc 469 26,109 0.03 Aspen Technology Inc 1,867 87,357 0.10 Assurant Inc 1,599 147,508 0.16 AutoZone Inc 718 551,668 0.61 Avis Budget Group Inc 2,530 86,551 0.10 Bed Bath & Beyond Inc 4,081 175,932 0.19 Big Lots Inc 940 44,885 0.05 Biogen Inc 5,516 1,726,673 1.91 Bob Evans Farms Inc/DE 519 19,878 0.02 Boeing Co/The 17,442 2,297,809 2.55 Bright Horizons Family Solutions Inc 1,353 90,502 0.10 Brinker International Inc 1,218 61,424 0.07 Calpine Corporation 9,267 117,135 0.13 Capital Bank Financial Corp 692 22,220 0.02 CarMax Inc 4,933 263,176 0.29 Carpenter Technology Corp 886 36,556 0.04 CBS Corp 11,241 615,332 0.68 Central Pacific Financial Corp 787 19,825 0.02 Chemtura Corp 1,720 56,433 0.06 Chico's FAS Inc 3,569 42,471 0.05 Children's Place Inc/The 477 38,098 0.04 Chimera Investment Corp 5,230 83,418 0.09 Cintas Corp 2,526 284,428 0.32 CIRCOR International Inc 432 25,730 0.03 Clearwater Paper Corp 450 29,101 0.03 CNO Financial Group Inc 4,252 64,928 0.07 Conn's Inc 642 6,625 0.01 Corning Inc 31,813 752,377 0.83
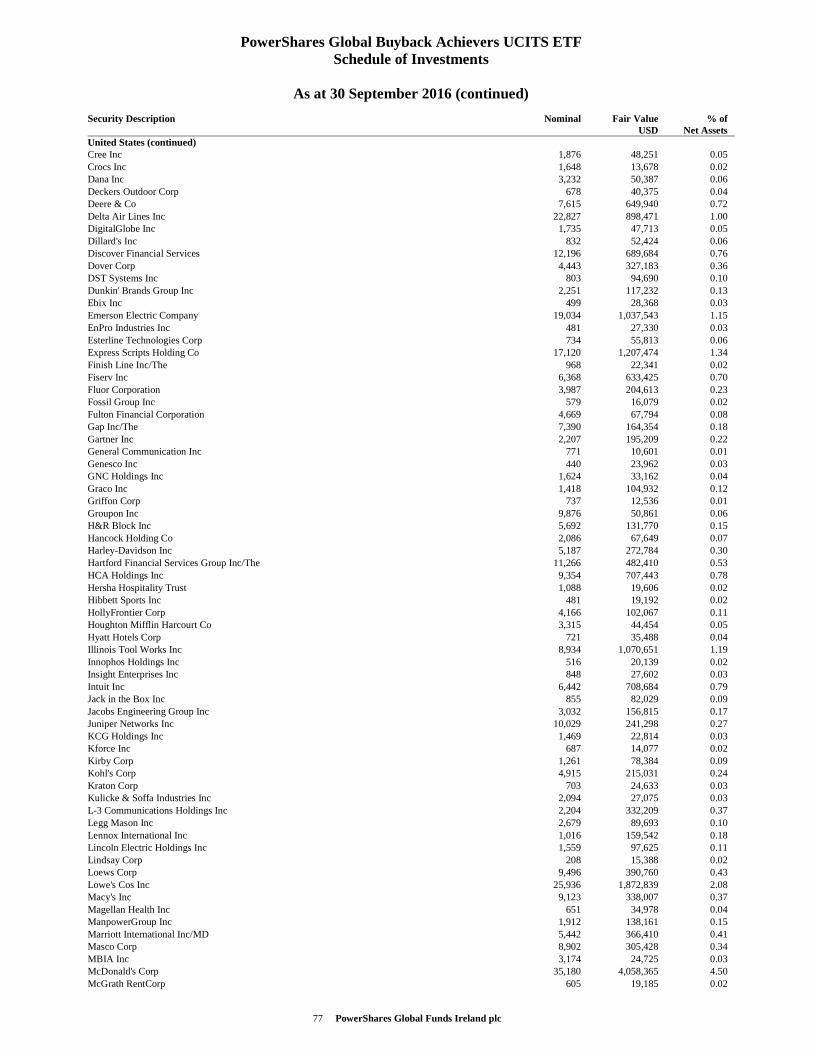
77 PowerShares Global Funds Ireland plc
PowerShares Global Buyback Achievers UCITS ETF Schedule of Investments
As at 30 September 2016 (continued)
Security Description Nominal Fair Value USD
% of Net Assets
United States (continued) Cree Inc 1,876 48,251 0.05 Crocs Inc 1,648 13,678 0.02 Dana Inc 3,232 50,387 0.06 Deckers Outdoor Corp 678 40,375 0.04 Deere & Co 7,615 649,940 0.72 Delta Air Lines Inc 22,827 898,471 1.00 DigitalGlobe Inc 1,735 47,713 0.05 Dillard's Inc 832 52,424 0.06 Discover Financial Services 12,196 689,684 0.76 Dover Corp 4,443 327,183 0.36 DST Systems Inc 803 94,690 0.10 Dunkin' Brands Group Inc 2,251 117,232 0.13 Ebix Inc 499 28,368 0.03 Emerson Electric Company 19,034 1,037,543 1.15 EnPro Industries Inc 481 27,330 0.03 Esterline Technologies Corp 734 55,813 0.06 Express Scripts Holding Co 17,120 1,207,474 1.34 Finish Line Inc/The 968 22,341 0.02 Fiserv Inc 6,368 633,425 0.70 Fluor Corporation 3,987 204,613 0.23 Fossil Group Inc 579 16,079 0.02 Fulton Financial Corporation 4,669 67,794 0.08 Gap Inc/The 7,390 164,354 0.18 Gartner Inc 2,207 195,209 0.22 General Communication Inc 771 10,601 0.01 Genesco Inc 440 23,962 0.03 GNC Holdings Inc 1,624 33,162 0.04 Graco Inc 1,418 104,932 0.12 Griffon Corp 737 12,536 0.01 Groupon Inc 9,876 50,861 0.06 H&R Block Inc 5,692 131,770 0.15 Hancock Holding Co 2,086 67,649 0.07 Harley-Davidson Inc 5,187 272,784 0.30 Hartford Financial Services Group Inc/The 11,266 482,410 0.53 HCA Holdings Inc 9,354 707,443 0.78 Hersha Hospitality Trust 1,088 19,606 0.02 Hibbett Sports Inc 481 19,192 0.02 HollyFrontier Corp 4,166 102,067 0.11 Houghton Mifflin Harcourt Co 3,315 44,454 0.05 Hyatt Hotels Corp 721 35,488 0.04 Illinois Tool Works Inc 8,934 1,070,651 1.19 Innophos Holdings Inc 516 20,139 0.02 Insight Enterprises Inc 848 27,602 0.03 Intuit Inc 6,442 708,684 0.79 Jack in the Box Inc 855 82,029 0.09 Jacobs Engineering Group Inc 3,032 156,815 0.17 Juniper Networks Inc 10,029 241,298 0.27 KCG Holdings Inc 1,469 22,814 0.03 Kforce Inc 687 14,077 0.02 Kirby Corp 1,261 78,384 0.09 Kohl's Corp 4,915 215,031 0.24 Kraton Corp 703 24,633 0.03 Kulicke & Soffa Industries Inc 2,094 27,075 0.03 L-3 Communications Holdings Inc 2,204 332,209 0.37 Legg Mason Inc 2,679 89,693 0.10 Lennox International Inc 1,016 159,542 0.18 Lincoln Electric Holdings Inc 1,559 97,625 0.11 Lindsay Corp 208 15,388 0.02 Loews Corp 9,496 390,760 0.43 Lowe's Cos Inc 25,936 1,872,839 2.08 Macy's Inc 9,123 338,007 0.37 Magellan Health Inc 651 34,978 0.04 ManpowerGroup Inc 1,912 138,161 0.15 Marriott International Inc/MD 5,442 366,410 0.41 Masco Corp 8,902 305,428 0.34 MBIA Inc 3,174 24,725 0.03 McDonald's Corp 35,180 4,058,365 4.50 McGrath RentCorp 605 19,185 0.02
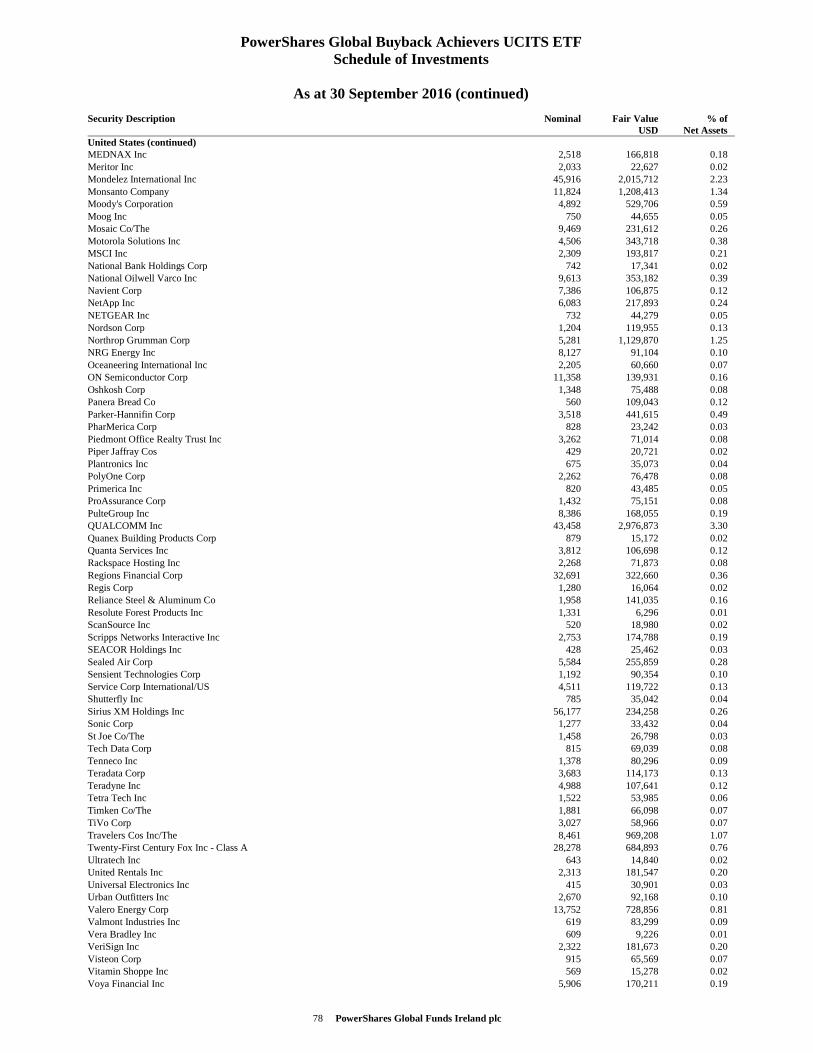
78 PowerShares Global Funds Ireland plc
PowerShares Global Buyback Achievers UCITS ETF Schedule of Investments
As at 30 September 2016 (continued)
Security Description Nominal Fair Value USD
% of Net Assets
United States (continued) MEDNAX Inc 2,518 166,818 0.18 Meritor Inc 2,033 22,627 0.02 Mondelez International Inc 45,916 2,015,712 2.23 Monsanto Company 11,824 1,208,413 1.34 Moody's Corporation 4,892 529,706 0.59 Moog Inc 750 44,655 0.05 Mosaic Co/The 9,469 231,612 0.26 Motorola Solutions Inc 4,506 343,718 0.38 MSCI Inc 2,309 193,817 0.21 National Bank Holdings Corp 742 17,341 0.02 National Oilwell Varco Inc 9,613 353,182 0.39 Navient Corp 7,386 106,875 0.12 NetApp Inc 6,083 217,893 0.24 NETGEAR Inc 732 44,279 0.05 Nordson Corp 1,204 119,955 0.13 Northrop Grumman Corp 5,281 1,129,870 1.25 NRG Energy Inc 8,127 91,104 0.10 Oceaneering International Inc 2,205 60,660 0.07 ON Semiconductor Corp 11,358 139,931 0.16 Oshkosh Corp 1,348 75,488 0.08 Panera Bread Co 560 109,043 0.12 Parker-Hannifin Corp 3,518 441,615 0.49 PharMerica Corp 828 23,242 0.03 Piedmont Office Realty Trust Inc 3,262 71,014 0.08 Piper Jaffray Cos 429 20,721 0.02 Plantronics Inc 675 35,073 0.04 PolyOne Corp 2,262 76,478 0.08 Primerica Inc 820 43,485 0.05 ProAssurance Corp 1,432 75,151 0.08 PulteGroup Inc 8,386 168,055 0.19 QUALCOMM Inc 43,458 2,976,873 3.30 Quanex Building Products Corp 879 15,172 0.02 Quanta Services Inc 3,812 106,698 0.12 Rackspace Hosting Inc 2,268 71,873 0.08 Regions Financial Corp 32,691 322,660 0.36 Regis Corp 1,280 16,064 0.02 Reliance Steel & Aluminum Co 1,958 141,035 0.16 Resolute Forest Products Inc 1,331 6,296 0.01 ScanSource Inc 520 18,980 0.02 Scripps Networks Interactive Inc 2,753 174,788 0.19 SEACOR Holdings Inc 428 25,462 0.03 Sealed Air Corp 5,584 255,859 0.28 Sensient Technologies Corp 1,192 90,354 0.10 Service Corp International/US 4,511 119,722 0.13 Shutterfly Inc 785 35,042 0.04 Sirius XM Holdings Inc 56,177 234,258 0.26 Sonic Corp 1,277 33,432 0.04 St Joe Co/The 1,458 26,798 0.03 Tech Data Corp 815 69,039 0.08 Tenneco Inc 1,378 80,296 0.09 Teradata Corp 3,683 114,173 0.13 Teradyne Inc 4,988 107,641 0.12 Tetra Tech Inc 1,522 53,985 0.06 Timken Co/The 1,881 66,098 0.07 TiVo Corp 3,027 58,966 0.07 Travelers Cos Inc/The 8,461 969,208 1.07 Twenty-First Century Fox Inc - Class A 28,278 684,893 0.76 Ultratech Inc 643 14,840 0.02 United Rentals Inc 2,313 181,547 0.20 Universal Electronics Inc 415 30,901 0.03 Urban Outfitters Inc 2,670 92,168 0.10 Valero Energy Corp 13,752 728,856 0.81 Valmont Industries Inc 619 83,299 0.09 Vera Bradley Inc 609 9,226 0.01 VeriSign Inc 2,322 181,673 0.20 Visteon Corp 915 65,569 0.07 Vitamin Shoppe Inc 569 15,278 0.02 Voya Financial Inc 5,906 170,211 0.19
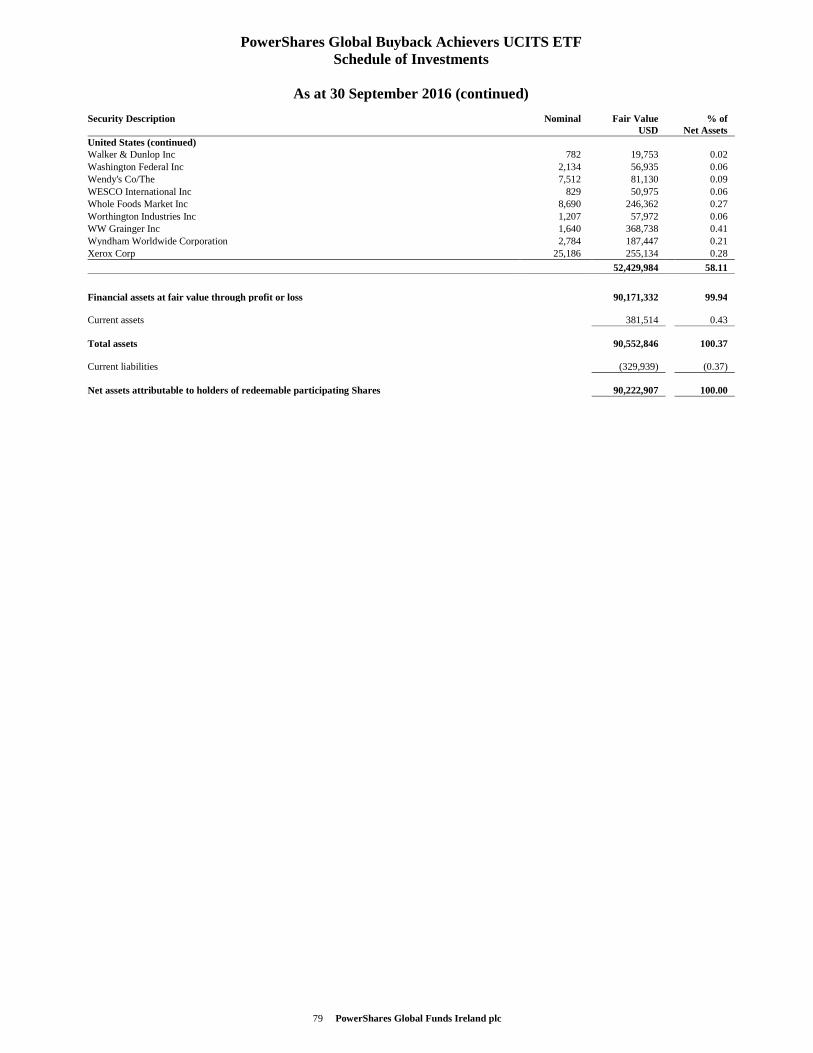
79 PowerShares Global Funds Ireland plc
PowerShares Global Buyback Achievers UCITS ETF Schedule of Investments
As at 30 September 2016 (continued)
Security Description Nominal Fair Value USD
% of Net Assets
United States (continued) Walker & Dunlop Inc 782 19,753 0.02 Washington Federal Inc 2,134 56,935 0.06 Wendy's Co/The 7,512 81,130 0.09 WESCO International Inc 829 50,975 0.06 Whole Foods Market Inc 8,690 246,362 0.27 Worthington Industries Inc 1,207 57,972 0.06 WW Grainger Inc 1,640 368,738 0.41 Wyndham Worldwide Corporation 2,784 187,447 0.21 Xerox Corp 25,186 255,134 0.28
52,429,984 58.11
Financial assets at fair value through profit or loss 90,171,332 99.94 Current assets 381,514 0.43 Total assets 90,552,846 100.37 Current liabilities (329,939) (0.37) Net assets attributable to holders of redeemable participating Shares 90,222,907 100.00
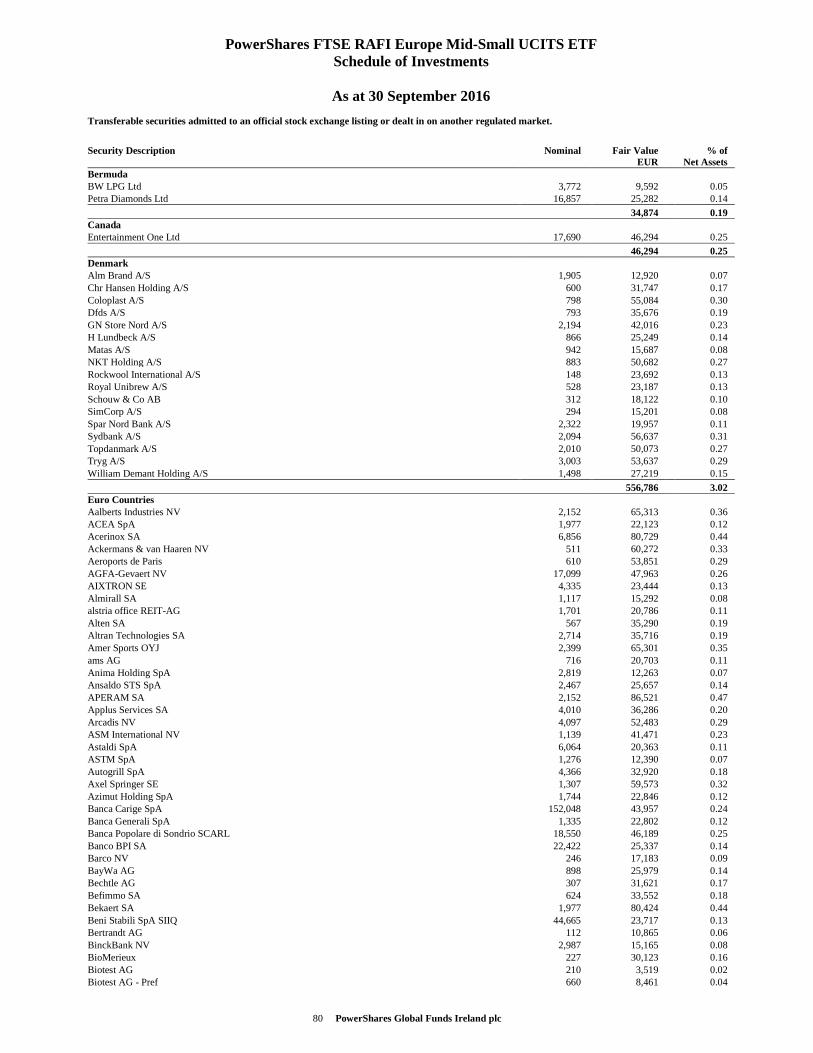
80 PowerShares Global Funds Ireland plc
PowerShares FTSE RAFI Europe Mid-Small UCITS ETF Schedule of Investments
As at 30 September 2016
Transferable securities admitted to an official stock exchange listing or dealt in on another regulated market.
Security Description Nominal Fair Value EUR
% of Net Assets
Bermuda BW LPG Ltd 3,772 9,592 0.05 Petra Diamonds Ltd 16,857 25,282 0.14
34,874 0.19 Canada Entertainment One Ltd 17,690 46,294 0.25
46,294 0.25 Denmark Alm Brand A/S 1,905 12,920 0.07 Chr Hansen Holding A/S 600 31,747 0.17 Coloplast A/S 798 55,084 0.30 Dfds A/S 793 35,676 0.19 GN Store Nord A/S 2,194 42,016 0.23 H Lundbeck A/S 866 25,249 0.14 Matas A/S 942 15,687 0.08 NKT Holding A/S 883 50,682 0.27 Rockwool International A/S 148 23,692 0.13 Royal Unibrew A/S 528 23,187 0.13 Schouw & Co AB 312 18,122 0.10 SimCorp A/S 294 15,201 0.08 Spar Nord Bank A/S 2,322 19,957 0.11 Sydbank A/S 2,094 56,637 0.31 Topdanmark A/S 2,010 50,073 0.27 Tryg A/S 3,003 53,637 0.29 William Demant Holding A/S 1,498 27,219 0.15
556,786 3.02 Euro Countries Aalberts Industries NV 2,152 65,313 0.36 ACEA SpA 1,977 22,123 0.12 Acerinox SA 6,856 80,729 0.44 Ackermans & van Haaren NV 511 60,272 0.33 Aeroports de Paris 610 53,851 0.29 AGFA-Gevaert NV 17,099 47,963 0.26 AIXTRON SE 4,335 23,444 0.13 Almirall SA 1,117 15,292 0.08 alstria office REIT-AG 1,701 20,786 0.11 Alten SA 567 35,290 0.19 Altran Technologies SA 2,714 35,716 0.19 Amer Sports OYJ 2,399 65,301 0.35 ams AG 716 20,703 0.11 Anima Holding SpA 2,819 12,263 0.07 Ansaldo STS SpA 2,467 25,657 0.14 APERAM SA 2,152 86,521 0.47 Applus Services SA 4,010 36,286 0.20 Arcadis NV 4,097 52,483 0.29 ASM International NV 1,139 41,471 0.23 Astaldi SpA 6,064 20,363 0.11 ASTM SpA 1,276 12,390 0.07 Autogrill SpA 4,366 32,920 0.18 Axel Springer SE 1,307 59,573 0.32 Azimut Holding SpA 1,744 22,846 0.12 Banca Carige SpA 152,048 43,957 0.24 Banca Generali SpA 1,335 22,802 0.12 Banca Popolare di Sondrio SCARL 18,550 46,189 0.25 Banco BPI SA 22,422 25,337 0.14 Barco NV 246 17,183 0.09 BayWa AG 898 25,979 0.14 Bechtle AG 307 31,621 0.17 Befimmo SA 624 33,552 0.18 Bekaert SA 1,977 80,424 0.44 Beni Stabili SpA SIIQ 44,665 23,717 0.13 Bertrandt AG 112 10,865 0.06 BinckBank NV 2,987 15,165 0.08 BioMerieux 227 30,123 0.16 Biotest AG 210 3,519 0.02 Biotest AG - Pref 660 8,461 0.04
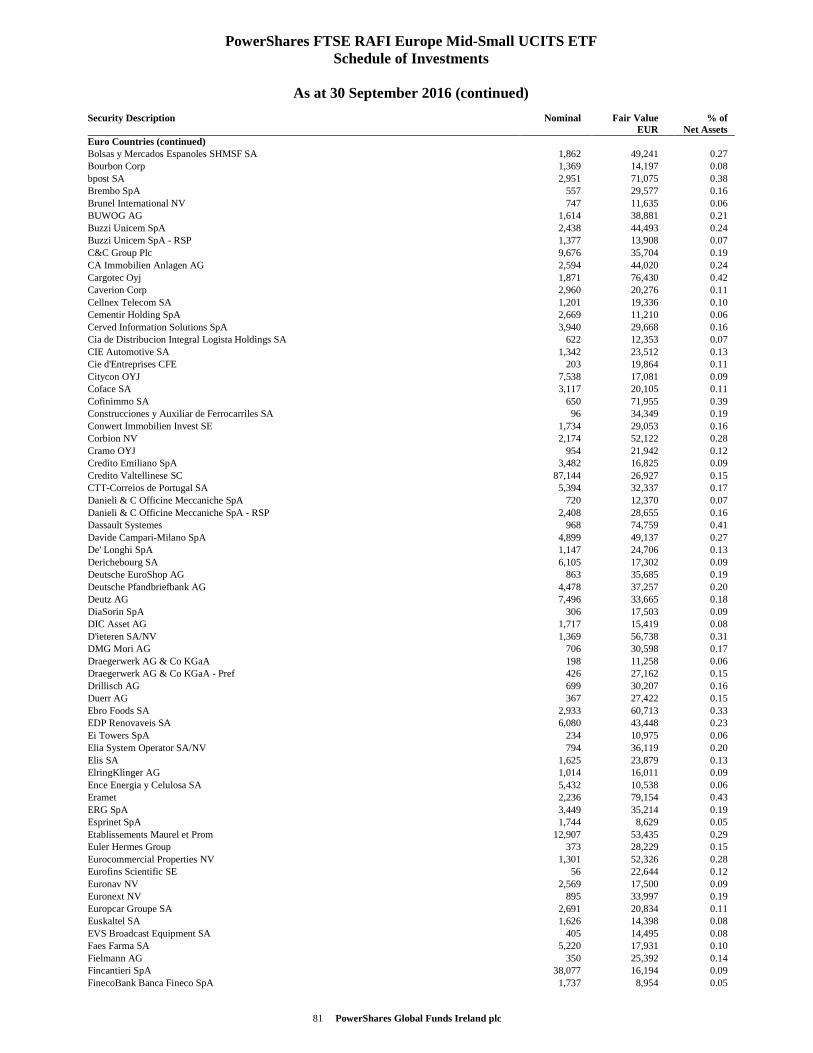
81 PowerShares Global Funds Ireland plc
PowerShares FTSE RAFI Europe Mid-Small UCITS ETF Schedule of Investments
As at 30 September 2016 (continued)
Security Description Nominal Fair Value EUR
% of Net Assets
Euro Countries (continued) Bolsas y Mercados Espanoles SHMSF SA 1,862 49,241 0.27 Bourbon Corp 1,369 14,197 0.08 bpost SA 2,951 71,075 0.38 Brembo SpA 557 29,577 0.16 Brunel International NV 747 11,635 0.06 BUWOG AG 1,614 38,881 0.21 Buzzi Unicem SpA 2,438 44,493 0.24 Buzzi Unicem SpA - RSP 1,377 13,908 0.07 C&C Group Plc 9,676 35,704 0.19 CA Immobilien Anlagen AG 2,594 44,020 0.24 Cargotec Oyj 1,871 76,430 0.42 Caverion Corp 2,960 20,276 0.11 Cellnex Telecom SA 1,201 19,336 0.10 Cementir Holding SpA 2,669 11,210 0.06 Cerved Information Solutions SpA 3,940 29,668 0.16 Cia de Distribucion Integral Logista Holdings SA 622 12,353 0.07 CIE Automotive SA 1,342 23,512 0.13 Cie d'Entreprises CFE 203 19,864 0.11 Citycon OYJ 7,538 17,081 0.09 Coface SA 3,117 20,105 0.11 Cofinimmo SA 650 71,955 0.39 Construcciones y Auxiliar de Ferrocarriles SA 96 34,349 0.19 Conwert Immobilien Invest SE 1,734 29,053 0.16 Corbion NV 2,174 52,122 0.28 Cramo OYJ 954 21,942 0.12 Credito Emiliano SpA 3,482 16,825 0.09 Credito Valtellinese SC 87,144 26,927 0.15 CTT-Correios de Portugal SA 5,394 32,337 0.17 Danieli & C Officine Meccaniche SpA 720 12,370 0.07 Danieli & C Officine Meccaniche SpA - RSP 2,408 28,655 0.16 Dassault Systemes 968 74,759 0.41 Davide Campari-Milano SpA 4,899 49,137 0.27 De' Longhi SpA 1,147 24,706 0.13 Derichebourg SA 6,105 17,302 0.09 Deutsche EuroShop AG 863 35,685 0.19 Deutsche Pfandbriefbank AG 4,478 37,257 0.20 Deutz AG 7,496 33,665 0.18 DiaSorin SpA 306 17,503 0.09 DIC Asset AG 1,717 15,419 0.08 D'ieteren SA/NV 1,369 56,738 0.31 DMG Mori AG 706 30,598 0.17 Draegerwerk AG & Co KGaA 198 11,258 0.06 Draegerwerk AG & Co KGaA - Pref 426 27,162 0.15 Drillisch AG 699 30,207 0.16 Duerr AG 367 27,422 0.15 Ebro Foods SA 2,933 60,713 0.33 EDP Renovaveis SA 6,080 43,448 0.23 Ei Towers SpA 234 10,975 0.06 Elia System Operator SA/NV 794 36,119 0.20 Elis SA 1,625 23,879 0.13 ElringKlinger AG 1,014 16,011 0.09 Ence Energia y Celulosa SA 5,432 10,538 0.06 Eramet 2,236 79,154 0.43 ERG SpA 3,449 35,214 0.19 Esprinet SpA 1,744 8,629 0.05 Etablissements Maurel et Prom 12,907 53,435 0.29 Euler Hermes Group 373 28,229 0.15 Eurocommercial Properties NV 1,301 52,326 0.28 Eurofins Scientific SE 56 22,644 0.12 Euronav NV 2,569 17,500 0.09 Euronext NV 895 33,997 0.19 Europcar Groupe SA 2,691 20,834 0.11 Euskaltel SA 1,626 14,398 0.08 EVS Broadcast Equipment SA 405 14,495 0.08 Faes Farma SA 5,220 17,931 0.10 Fielmann AG 350 25,392 0.14 Fincantieri SpA 38,077 16,194 0.09 FinecoBank Banca Fineco SpA 1,737 8,954 0.05
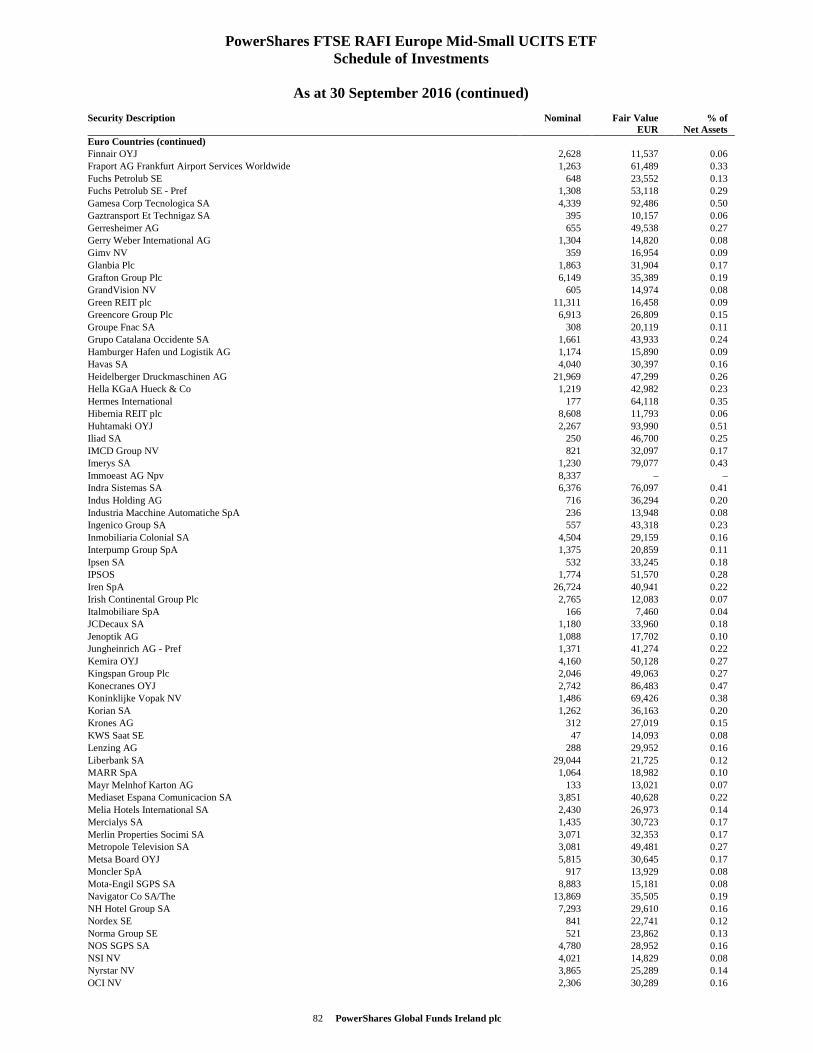
82 PowerShares Global Funds Ireland plc
PowerShares FTSE RAFI Europe Mid-Small UCITS ETF Schedule of Investments
As at 30 September 2016 (continued)
Security Description Nominal Fair Value EUR
% of Net Assets
Euro Countries (continued) Finnair OYJ 2,628 11,537 0.06 Fraport AG Frankfurt Airport Services Worldwide 1,263 61,489 0.33 Fuchs Petrolub SE 648 23,552 0.13 Fuchs Petrolub SE - Pref 1,308 53,118 0.29 Gamesa Corp Tecnologica SA 4,339 92,486 0.50 Gaztransport Et Technigaz SA 395 10,157 0.06 Gerresheimer AG 655 49,538 0.27 Gerry Weber International AG 1,304 14,820 0.08 Gimv NV 359 16,954 0.09 Glanbia Plc 1,863 31,904 0.17 Grafton Group Plc 6,149 35,389 0.19 GrandVision NV 605 14,974 0.08 Green REIT plc 11,311 16,458 0.09 Greencore Group Plc 6,913 26,809 0.15 Groupe Fnac SA 308 20,119 0.11 Grupo Catalana Occidente SA 1,661 43,933 0.24 Hamburger Hafen und Logistik AG 1,174 15,890 0.09 Havas SA 4,040 30,397 0.16 Heidelberger Druckmaschinen AG 21,969 47,299 0.26 Hella KGaA Hueck & Co 1,219 42,982 0.23 Hermes International 177 64,118 0.35 Hibernia REIT plc 8,608 11,793 0.06 Huhtamaki OYJ 2,267 93,990 0.51 Iliad SA 250 46,700 0.25 IMCD Group NV 821 32,097 0.17 Imerys SA 1,230 79,077 0.43 Immoeast AG Npv 8,337 – – Indra Sistemas SA 6,376 76,097 0.41 Indus Holding AG 716 36,294 0.20 Industria Macchine Automatiche SpA 236 13,948 0.08 Ingenico Group SA 557 43,318 0.23 Inmobiliaria Colonial SA 4,504 29,159 0.16 Interpump Group SpA 1,375 20,859 0.11 Ipsen SA 532 33,245 0.18 IPSOS 1,774 51,570 0.28 Iren SpA 26,724 40,941 0.22 Irish Continental Group Plc 2,765 12,083 0.07 Italmobiliare SpA 166 7,460 0.04 JCDecaux SA 1,180 33,960 0.18 Jenoptik AG 1,088 17,702 0.10 Jungheinrich AG - Pref 1,371 41,274 0.22 Kemira OYJ 4,160 50,128 0.27 Kingspan Group Plc 2,046 49,063 0.27 Konecranes OYJ 2,742 86,483 0.47 Koninklijke Vopak NV 1,486 69,426 0.38 Korian SA 1,262 36,163 0.20 Krones AG 312 27,019 0.15 KWS Saat SE 47 14,093 0.08 Lenzing AG 288 29,952 0.16 Liberbank SA 29,044 21,725 0.12 MARR SpA 1,064 18,982 0.10 Mayr Melnhof Karton AG 133 13,021 0.07 Mediaset Espana Comunicacion SA 3,851 40,628 0.22 Melia Hotels International SA 2,430 26,973 0.14 Mercialys SA 1,435 30,723 0.17 Merlin Properties Socimi SA 3,071 32,353 0.17 Metropole Television SA 3,081 49,481 0.27 Metsa Board OYJ 5,815 30,645 0.17 Moncler SpA 917 13,929 0.08 Mota-Engil SGPS SA 8,883 15,181 0.08 Navigator Co SA/The 13,869 35,505 0.19 NH Hotel Group SA 7,293 29,610 0.16 Nordex SE 841 22,741 0.12 Norma Group SE 521 23,862 0.13 NOS SGPS SA 4,780 28,952 0.16 NSI NV 4,021 14,829 0.08 Nyrstar NV 3,865 25,289 0.14 OCI NV 2,306 30,289 0.16
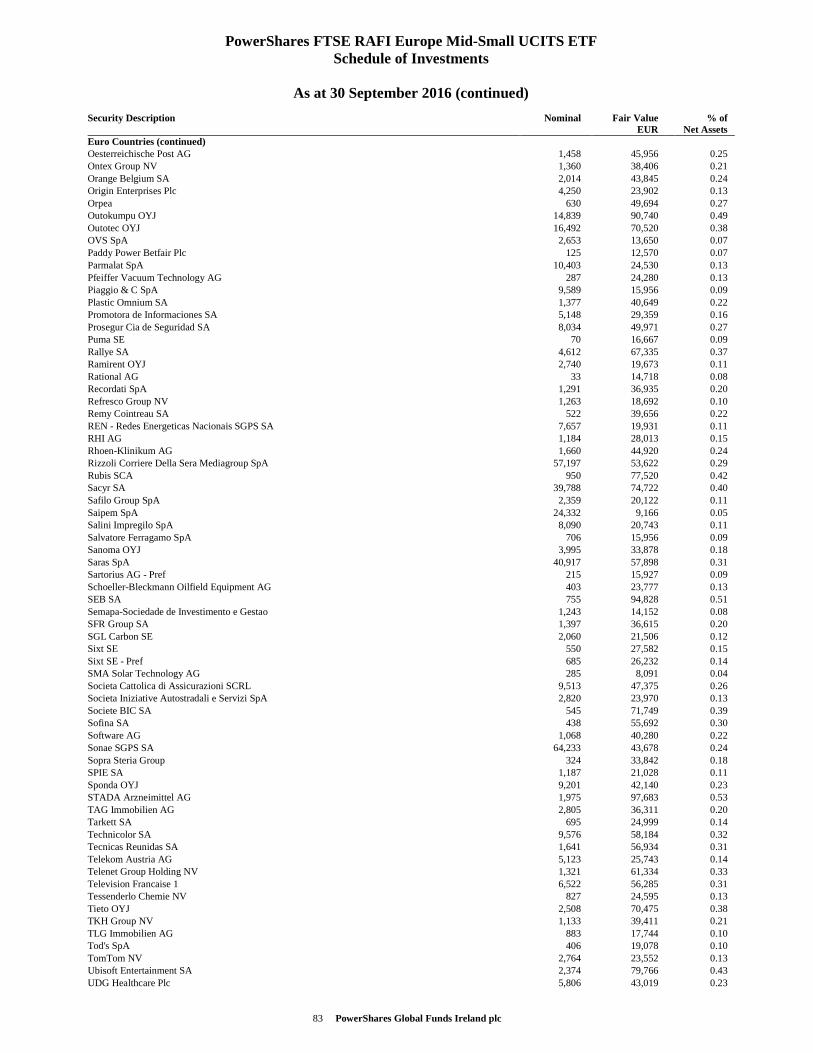
83 PowerShares Global Funds Ireland plc
PowerShares FTSE RAFI Europe Mid-Small UCITS ETF Schedule of Investments
As at 30 September 2016 (continued)
Security Description Nominal Fair Value EUR
% of Net Assets
Euro Countries (continued) Oesterreichische Post AG 1,458 45,956 0.25 Ontex Group NV 1,360 38,406 0.21 Orange Belgium SA 2,014 43,845 0.24 Origin Enterprises Plc 4,250 23,902 0.13 Orpea 630 49,694 0.27 Outokumpu OYJ 14,839 90,740 0.49 Outotec OYJ 16,492 70,520 0.38 OVS SpA 2,653 13,650 0.07 Paddy Power Betfair Plc 125 12,570 0.07 Parmalat SpA 10,403 24,530 0.13 Pfeiffer Vacuum Technology AG 287 24,280 0.13 Piaggio & C SpA 9,589 15,956 0.09 Plastic Omnium SA 1,377 40,649 0.22 Promotora de Informaciones SA 5,148 29,359 0.16 Prosegur Cia de Seguridad SA 8,034 49,971 0.27 Puma SE 70 16,667 0.09 Rallye SA 4,612 67,335 0.37 Ramirent OYJ 2,740 19,673 0.11 Rational AG 33 14,718 0.08 Recordati SpA 1,291 36,935 0.20 Refresco Group NV 1,263 18,692 0.10 Remy Cointreau SA 522 39,656 0.22 REN - Redes Energeticas Nacionais SGPS SA 7,657 19,931 0.11 RHI AG 1,184 28,013 0.15 Rhoen-Klinikum AG 1,660 44,920 0.24 Rizzoli Corriere Della Sera Mediagroup SpA 57,197 53,622 0.29 Rubis SCA 950 77,520 0.42 Sacyr SA 39,788 74,722 0.40 Safilo Group SpA 2,359 20,122 0.11 Saipem SpA 24,332 9,166 0.05 Salini Impregilo SpA 8,090 20,743 0.11 Salvatore Ferragamo SpA 706 15,956 0.09 Sanoma OYJ 3,995 33,878 0.18 Saras SpA 40,917 57,898 0.31 Sartorius AG - Pref 215 15,927 0.09 Schoeller-Bleckmann Oilfield Equipment AG 403 23,777 0.13 SEB SA 755 94,828 0.51 Semapa-Sociedade de Investimento e Gestao 1,243 14,152 0.08 SFR Group SA 1,397 36,615 0.20 SGL Carbon SE 2,060 21,506 0.12 Sixt SE 550 27,582 0.15 Sixt SE - Pref 685 26,232 0.14 SMA Solar Technology AG 285 8,091 0.04 Societa Cattolica di Assicurazioni SCRL 9,513 47,375 0.26 Societa Iniziative Autostradali e Servizi SpA 2,820 23,970 0.13 Societe BIC SA 545 71,749 0.39 Sofina SA 438 55,692 0.30 Software AG 1,068 40,280 0.22 Sonae SGPS SA 64,233 43,678 0.24 Sopra Steria Group 324 33,842 0.18 SPIE SA 1,187 21,028 0.11 Sponda OYJ 9,201 42,140 0.23 STADA Arzneimittel AG 1,975 97,683 0.53 TAG Immobilien AG 2,805 36,311 0.20 Tarkett SA 695 24,999 0.14 Technicolor SA 9,576 58,184 0.32 Tecnicas Reunidas SA 1,641 56,934 0.31 Telekom Austria AG 5,123 25,743 0.14 Telenet Group Holding NV 1,321 61,334 0.33 Television Francaise 1 6,522 56,285 0.31 Tessenderlo Chemie NV 827 24,595 0.13 Tieto OYJ 2,508 70,475 0.38 TKH Group NV 1,133 39,411 0.21 TLG Immobilien AG 883 17,744 0.10 Tod's SpA 406 19,078 0.10 TomTom NV 2,764 23,552 0.13 Ubisoft Entertainment SA 2,374 79,766 0.43 UDG Healthcare Plc 5,806 43,019 0.23
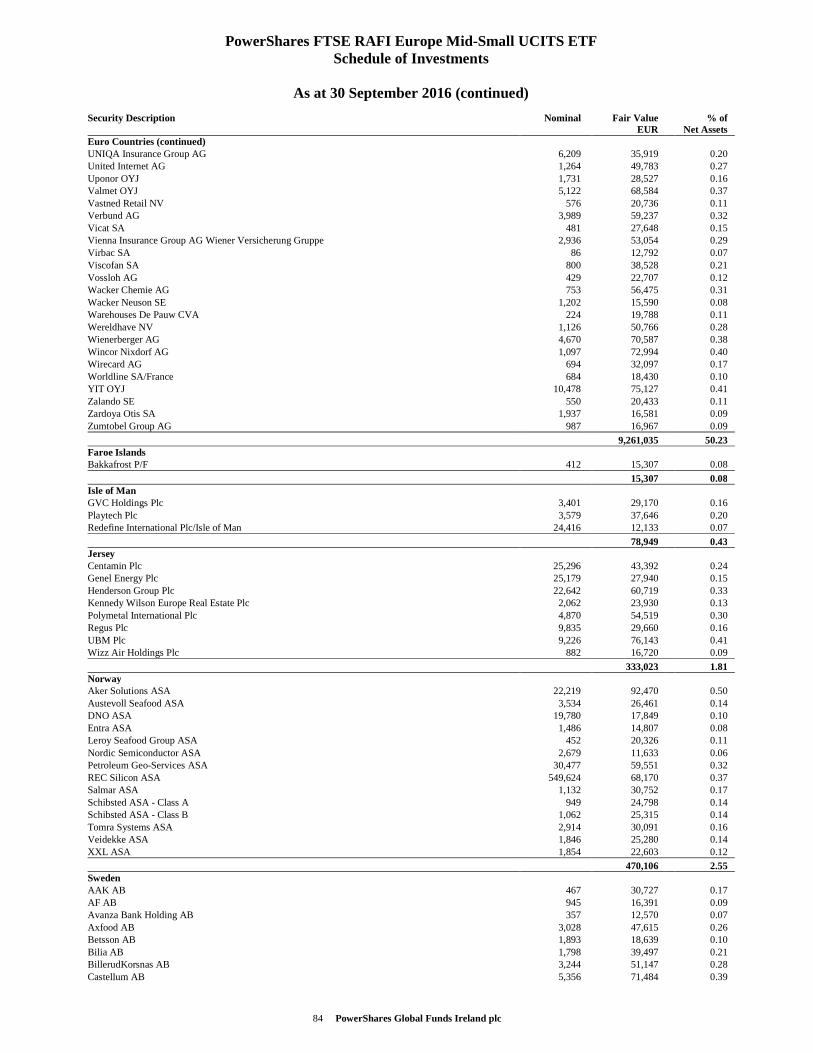
84 PowerShares Global Funds Ireland plc
PowerShares FTSE RAFI Europe Mid-Small UCITS ETF Schedule of Investments
As at 30 September 2016 (continued)
Security Description Nominal Fair Value EUR
% of Net Assets
Euro Countries (continued) UNIQA Insurance Group AG 6,209 35,919 0.20 United Internet AG 1,264 49,783 0.27 Uponor OYJ 1,731 28,527 0.16 Valmet OYJ 5,122 68,584 0.37 Vastned Retail NV 576 20,736 0.11 Verbund AG 3,989 59,237 0.32 Vicat SA 481 27,648 0.15 Vienna Insurance Group AG Wiener Versicherung Gruppe 2,936 53,054 0.29 Virbac SA 86 12,792 0.07 Viscofan SA 800 38,528 0.21 Vossloh AG 429 22,707 0.12 Wacker Chemie AG 753 56,475 0.31 Wacker Neuson SE 1,202 15,590 0.08 Warehouses De Pauw CVA 224 19,788 0.11 Wereldhave NV 1,126 50,766 0.28 Wienerberger AG 4,670 70,587 0.38 Wincor Nixdorf AG 1,097 72,994 0.40 Wirecard AG 694 32,097 0.17 Worldline SA/France 684 18,430 0.10 YIT OYJ 10,478 75,127 0.41 Zalando SE 550 20,433 0.11 Zardoya Otis SA 1,937 16,581 0.09 Zumtobel Group AG 987 16,967 0.09
9,261,035 50.23 Faroe Islands Bakkafrost P/F 412 15,307 0.08
15,307 0.08 Isle of Man GVC Holdings Plc 3,401 29,170 0.16 Playtech Plc 3,579 37,646 0.20 Redefine International Plc/Isle of Man 24,416 12,133 0.07
78,949 0.43 Jersey Centamin Plc 25,296 43,392 0.24 Genel Energy Plc 25,179 27,940 0.15 Henderson Group Plc 22,642 60,719 0.33 Kennedy Wilson Europe Real Estate Plc 2,062 23,930 0.13 Polymetal International Plc 4,870 54,519 0.30 Regus Plc 9,835 29,660 0.16 UBM Plc 9,226 76,143 0.41 Wizz Air Holdings Plc 882 16,720 0.09
333,023 1.81 Norway Aker Solutions ASA 22,219 92,470 0.50 Austevoll Seafood ASA 3,534 26,461 0.14 DNO ASA 19,780 17,849 0.10 Entra ASA 1,486 14,807 0.08 Leroy Seafood Group ASA 452 20,326 0.11 Nordic Semiconductor ASA 2,679 11,633 0.06 Petroleum Geo-Services ASA 30,477 59,551 0.32 REC Silicon ASA 549,624 68,170 0.37 Salmar ASA 1,132 30,752 0.17 Schibsted ASA - Class A 949 24,798 0.14 Schibsted ASA - Class B 1,062 25,315 0.14 Tomra Systems ASA 2,914 30,091 0.16 Veidekke ASA 1,846 25,280 0.14 XXL ASA 1,854 22,603 0.12
470,106 2.55 Sweden AAK AB 467 30,727 0.17 AF AB 945 16,391 0.09 Avanza Bank Holding AB 357 12,570 0.07 Axfood AB 3,028 47,615 0.26 Betsson AB 1,893 18,639 0.10 Bilia AB 1,798 39,497 0.21 BillerudKorsnas AB 3,244 51,147 0.28 Castellum AB 5,356 71,484 0.39
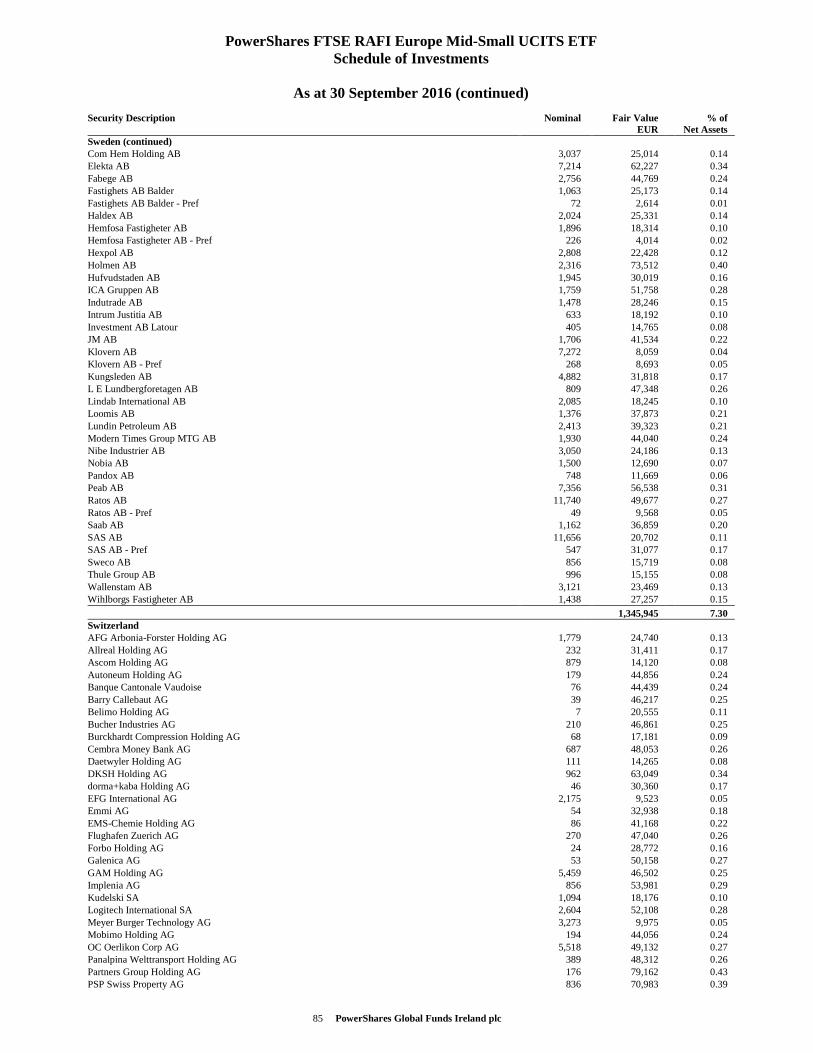
85 PowerShares Global Funds Ireland plc
PowerShares FTSE RAFI Europe Mid-Small UCITS ETF Schedule of Investments
As at 30 September 2016 (continued)
Security Description Nominal Fair Value EUR
% of Net Assets
Sweden (continued) Com Hem Holding AB 3,037 25,014 0.14 Elekta AB 7,214 62,227 0.34 Fabege AB 2,756 44,769 0.24 Fastighets AB Balder 1,063 25,173 0.14 Fastighets AB Balder - Pref 72 2,614 0.01 Haldex AB 2,024 25,331 0.14 Hemfosa Fastigheter AB 1,896 18,314 0.10 Hemfosa Fastigheter AB - Pref 226 4,014 0.02 Hexpol AB 2,808 22,428 0.12 Holmen AB 2,316 73,512 0.40 Hufvudstaden AB 1,945 30,019 0.16 ICA Gruppen AB 1,759 51,758 0.28 Indutrade AB 1,478 28,246 0.15 Intrum Justitia AB 633 18,192 0.10 Investment AB Latour 405 14,765 0.08 JM AB 1,706 41,534 0.22 Klovern AB 7,272 8,059 0.04 Klovern AB - Pref 268 8,693 0.05 Kungsleden AB 4,882 31,818 0.17 L E Lundbergforetagen AB 809 47,348 0.26 Lindab International AB 2,085 18,245 0.10 Loomis AB 1,376 37,873 0.21 Lundin Petroleum AB 2,413 39,323 0.21 Modern Times Group MTG AB 1,930 44,040 0.24 Nibe Industrier AB 3,050 24,186 0.13 Nobia AB 1,500 12,690 0.07 Pandox AB 748 11,669 0.06 Peab AB 7,356 56,538 0.31 Ratos AB 11,740 49,677 0.27 Ratos AB - Pref 49 9,568 0.05 Saab AB 1,162 36,859 0.20 SAS AB 11,656 20,702 0.11 SAS AB - Pref 547 31,077 0.17 Sweco AB 856 15,719 0.08 Thule Group AB 996 15,155 0.08 Wallenstam AB 3,121 23,469 0.13 Wihlborgs Fastigheter AB 1,438 27,257 0.15
1,345,945 7.30 Switzerland AFG Arbonia-Forster Holding AG 1,779 24,740 0.13 Allreal Holding AG 232 31,411 0.17 Ascom Holding AG 879 14,120 0.08 Autoneum Holding AG 179 44,856 0.24 Banque Cantonale Vaudoise 76 44,439 0.24 Barry Callebaut AG 39 46,217 0.25 Belimo Holding AG 7 20,555 0.11 Bucher Industries AG 210 46,861 0.25 Burckhardt Compression Holding AG 68 17,181 0.09 Cembra Money Bank AG 687 48,053 0.26 Daetwyler Holding AG 111 14,265 0.08 DKSH Holding AG 962 63,049 0.34 dorma+kaba Holding AG 46 30,360 0.17 EFG International AG 2,175 9,523 0.05 Emmi AG 54 32,938 0.18 EMS-Chemie Holding AG 86 41,168 0.22 Flughafen Zuerich AG 270 47,040 0.26 Forbo Holding AG 24 28,772 0.16 Galenica AG 53 50,158 0.27 GAM Holding AG 5,459 46,502 0.25 Implenia AG 856 53,981 0.29 Kudelski SA 1,094 18,176 0.10 Logitech International SA 2,604 52,108 0.28 Meyer Burger Technology AG 3,273 9,975 0.05 Mobimo Holding AG 194 44,056 0.24 OC Oerlikon Corp AG 5,518 49,132 0.27 Panalpina Welttransport Holding AG 389 48,312 0.26 Partners Group Holding AG 176 79,162 0.43 PSP Swiss Property AG 836 70,983 0.39
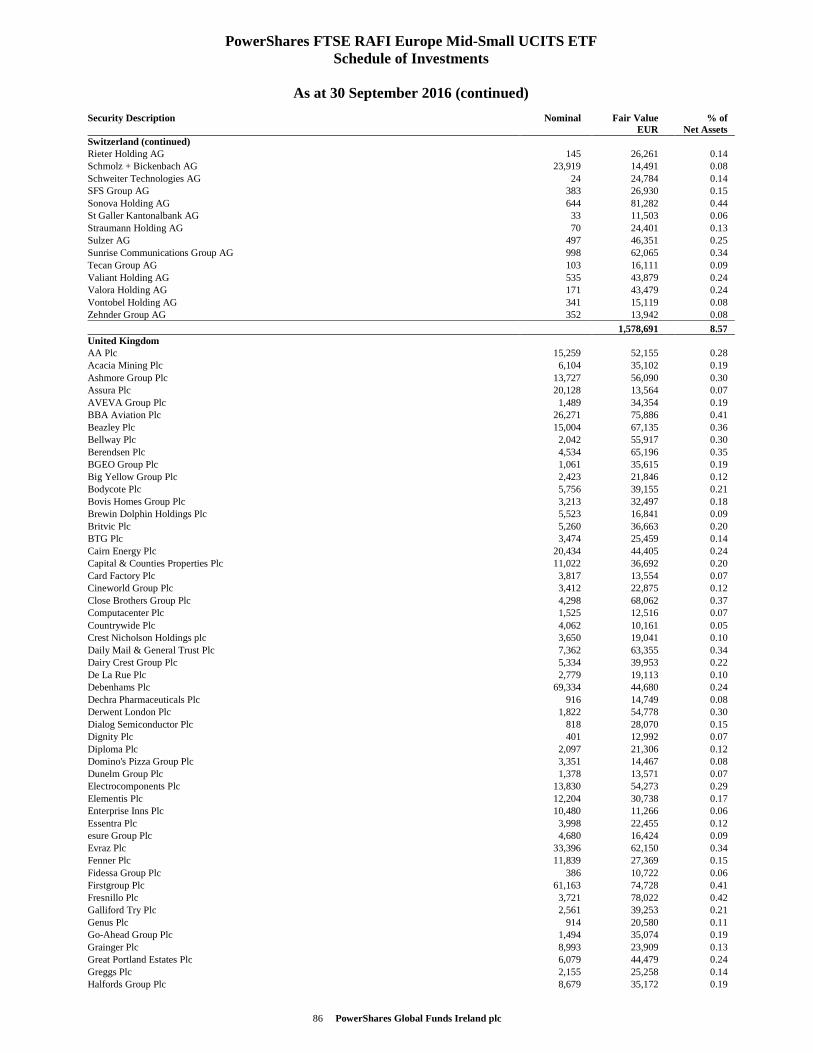
86 PowerShares Global Funds Ireland plc
PowerShares FTSE RAFI Europe Mid-Small UCITS ETF Schedule of Investments
As at 30 September 2016 (continued)
Security Description Nominal Fair Value EUR
% of Net Assets
Switzerland (continued) Rieter Holding AG 145 26,261 0.14 Schmolz + Bickenbach AG 23,919 14,491 0.08 Schweiter Technologies AG 24 24,784 0.14 SFS Group AG 383 26,930 0.15 Sonova Holding AG 644 81,282 0.44 St Galler Kantonalbank AG 33 11,503 0.06 Straumann Holding AG 70 24,401 0.13 Sulzer AG 497 46,351 0.25 Sunrise Communications Group AG 998 62,065 0.34 Tecan Group AG 103 16,111 0.09 Valiant Holding AG 535 43,879 0.24 Valora Holding AG 171 43,479 0.24 Vontobel Holding AG 341 15,119 0.08 Zehnder Group AG 352 13,942 0.08
1,578,691 8.57 United Kingdom AA Plc 15,259 52,155 0.28 Acacia Mining Plc 6,104 35,102 0.19 Ashmore Group Plc 13,727 56,090 0.30 Assura Plc 20,128 13,564 0.07 AVEVA Group Plc 1,489 34,354 0.19 BBA Aviation Plc 26,271 75,886 0.41 Beazley Plc 15,004 67,135 0.36 Bellway Plc 2,042 55,917 0.30 Berendsen Plc 4,534 65,196 0.35 BGEO Group Plc 1,061 35,615 0.19 Big Yellow Group Plc 2,423 21,846 0.12 Bodycote Plc 5,756 39,155 0.21 Bovis Homes Group Plc 3,213 32,497 0.18 Brewin Dolphin Holdings Plc 5,523 16,841 0.09 Britvic Plc 5,260 36,663 0.20 BTG Plc 3,474 25,459 0.14 Cairn Energy Plc 20,434 44,405 0.24 Capital & Counties Properties Plc 11,022 36,692 0.20 Card Factory Plc 3,817 13,554 0.07 Cineworld Group Plc 3,412 22,875 0.12 Close Brothers Group Plc 4,298 68,062 0.37 Computacenter Plc 1,525 12,516 0.07 Countrywide Plc 4,062 10,161 0.05 Crest Nicholson Holdings plc 3,650 19,041 0.10 Daily Mail & General Trust Plc 7,362 63,355 0.34 Dairy Crest Group Plc 5,334 39,953 0.22 De La Rue Plc 2,779 19,113 0.10 Debenhams Plc 69,334 44,680 0.24 Dechra Pharmaceuticals Plc 916 14,749 0.08 Derwent London Plc 1,822 54,778 0.30 Dialog Semiconductor Plc 818 28,070 0.15 Dignity Plc 401 12,992 0.07 Diploma Plc 2,097 21,306 0.12 Domino's Pizza Group Plc 3,351 14,467 0.08 Dunelm Group Plc 1,378 13,571 0.07 Electrocomponents Plc 13,830 54,273 0.29 Elementis Plc 12,204 30,738 0.17 Enterprise Inns Plc 10,480 11,266 0.06 Essentra Plc 3,998 22,455 0.12 esure Group Plc 4,680 16,424 0.09 Evraz Plc 33,396 62,150 0.34 Fenner Plc 11,839 27,369 0.15 Fidessa Group Plc 386 10,722 0.06 Firstgroup Plc 61,163 74,728 0.41 Fresnillo Plc 3,721 78,022 0.42 Galliford Try Plc 2,561 39,253 0.21 Genus Plc 914 20,580 0.11 Go-Ahead Group Plc 1,494 35,074 0.19 Grainger Plc 8,993 23,909 0.13 Great Portland Estates Plc 6,079 44,479 0.24 Greggs Plc 2,155 25,258 0.14 Halfords Group Plc 8,679 35,172 0.19
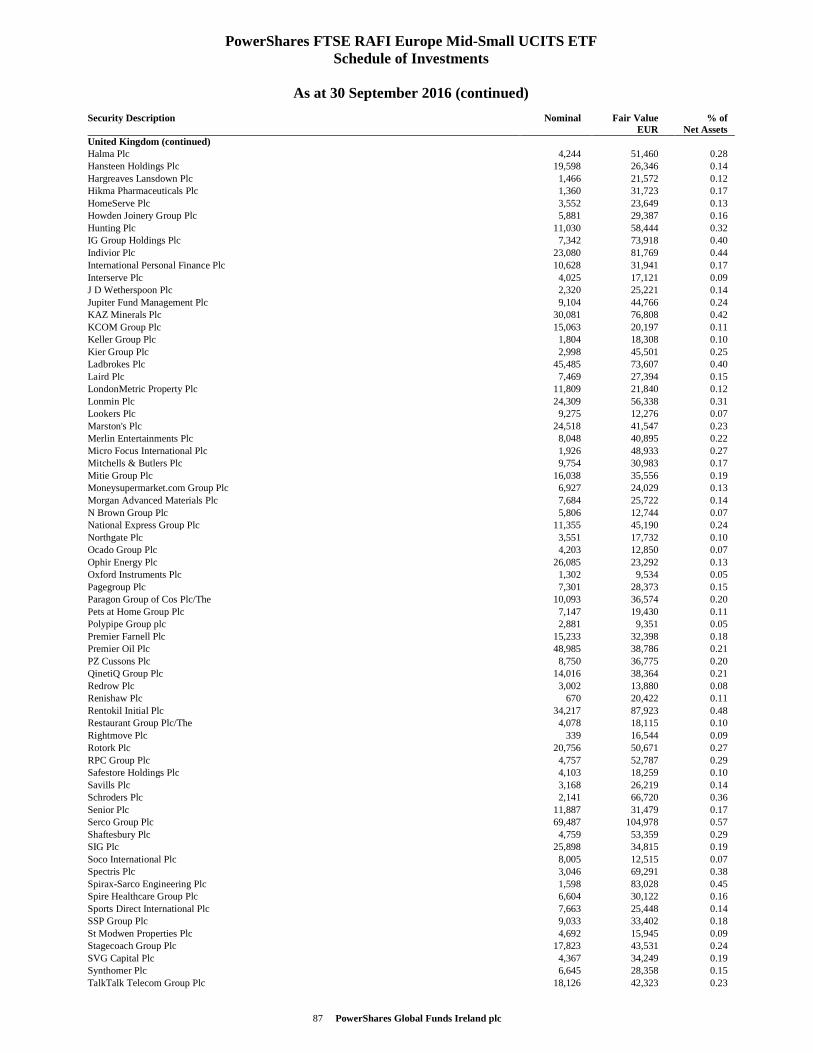
87 PowerShares Global Funds Ireland plc
PowerShares FTSE RAFI Europe Mid-Small UCITS ETF Schedule of Investments
As at 30 September 2016 (continued)
Security Description Nominal Fair Value EUR
% of Net Assets
United Kingdom (continued) Halma Plc 4,244 51,460 0.28 Hansteen Holdings Plc 19,598 26,346 0.14 Hargreaves Lansdown Plc 1,466 21,572 0.12 Hikma Pharmaceuticals Plc 1,360 31,723 0.17 HomeServe Plc 3,552 23,649 0.13 Howden Joinery Group Plc 5,881 29,387 0.16 Hunting Plc 11,030 58,444 0.32 IG Group Holdings Plc 7,342 73,918 0.40 Indivior Plc 23,080 81,769 0.44 International Personal Finance Plc 10,628 31,941 0.17 Interserve Plc 4,025 17,121 0.09 J D Wetherspoon Plc 2,320 25,221 0.14 Jupiter Fund Management Plc 9,104 44,766 0.24 KAZ Minerals Plc 30,081 76,808 0.42 KCOM Group Plc 15,063 20,197 0.11 Keller Group Plc 1,804 18,308 0.10 Kier Group Plc 2,998 45,501 0.25 Ladbrokes Plc 45,485 73,607 0.40 Laird Plc 7,469 27,394 0.15 LondonMetric Property Plc 11,809 21,840 0.12 Lonmin Plc 24,309 56,338 0.31 Lookers Plc 9,275 12,276 0.07 Marston's Plc 24,518 41,547 0.23 Merlin Entertainments Plc 8,048 40,895 0.22 Micro Focus International Plc 1,926 48,933 0.27 Mitchells & Butlers Plc 9,754 30,983 0.17 Mitie Group Plc 16,038 35,556 0.19 Moneysupermarket.com Group Plc 6,927 24,029 0.13 Morgan Advanced Materials Plc 7,684 25,722 0.14 N Brown Group Plc 5,806 12,744 0.07 National Express Group Plc 11,355 45,190 0.24 Northgate Plc 3,551 17,732 0.10 Ocado Group Plc 4,203 12,850 0.07 Ophir Energy Plc 26,085 23,292 0.13 Oxford Instruments Plc 1,302 9,534 0.05 Pagegroup Plc 7,301 28,373 0.15 Paragon Group of Cos Plc/The 10,093 36,574 0.20 Pets at Home Group Plc 7,147 19,430 0.11 Polypipe Group plc 2,881 9,351 0.05 Premier Farnell Plc 15,233 32,398 0.18 Premier Oil Plc 48,985 38,786 0.21 PZ Cussons Plc 8,750 36,775 0.20 QinetiQ Group Plc 14,016 38,364 0.21 Redrow Plc 3,002 13,880 0.08 Renishaw Plc 670 20,422 0.11 Rentokil Initial Plc 34,217 87,923 0.48 Restaurant Group Plc/The 4,078 18,115 0.10 Rightmove Plc 339 16,544 0.09 Rotork Plc 20,756 50,671 0.27 RPC Group Plc 4,757 52,787 0.29 Safestore Holdings Plc 4,103 18,259 0.10 Savills Plc 3,168 26,219 0.14 Schroders Plc 2,141 66,720 0.36 Senior Plc 11,887 31,479 0.17 Serco Group Plc 69,487 104,978 0.57 Shaftesbury Plc 4,759 53,359 0.29 SIG Plc 25,898 34,815 0.19 Soco International Plc 8,005 12,515 0.07 Spectris Plc 3,046 69,291 0.38 Spirax-Sarco Engineering Plc 1,598 83,028 0.45 Spire Healthcare Group Plc 6,604 30,122 0.16 Sports Direct International Plc 7,663 25,448 0.14 SSP Group Plc 9,033 33,402 0.18 St Modwen Properties Plc 4,692 15,945 0.09 Stagecoach Group Plc 17,823 43,531 0.24 SVG Capital Plc 4,367 34,249 0.19 Synthomer Plc 6,645 28,358 0.15 TalkTalk Telecom Group Plc 18,126 42,323 0.23
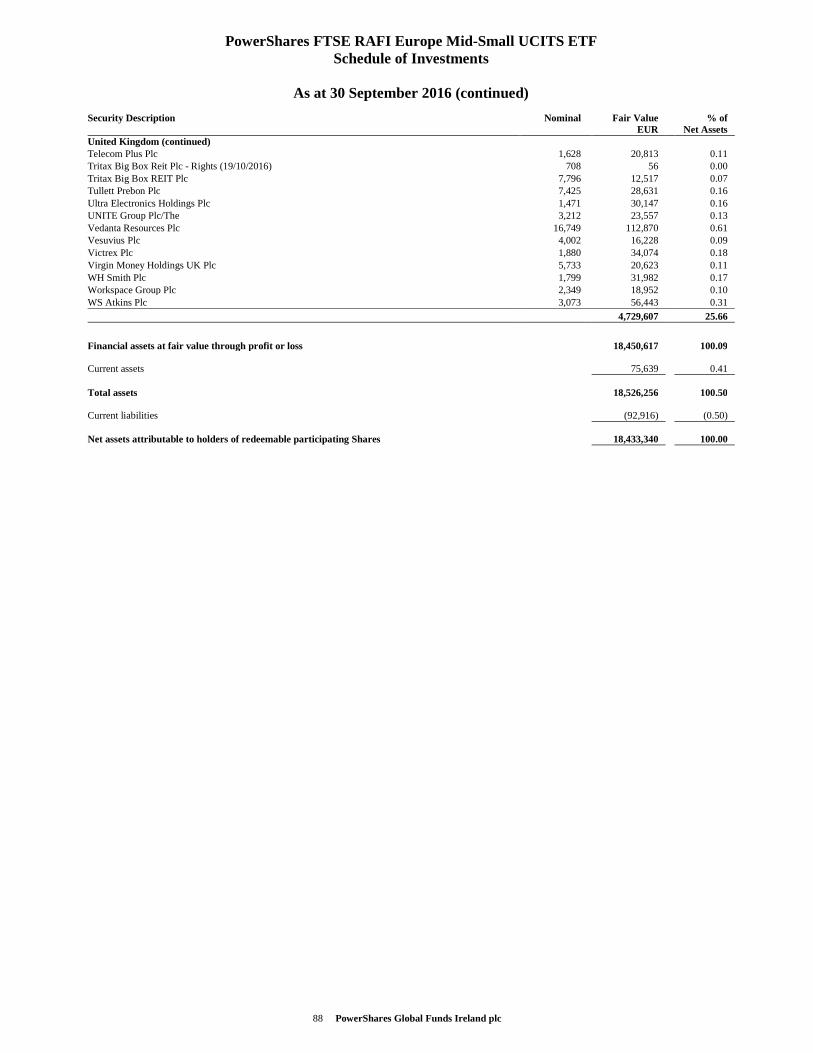
88 PowerShares Global Funds Ireland plc
PowerShares FTSE RAFI Europe Mid-Small UCITS ETF Schedule of Investments
As at 30 September 2016 (continued)
Security Description Nominal Fair Value EUR
% of Net Assets
United Kingdom (continued) Telecom Plus Plc 1,628 20,813 0.11 Tritax Big Box Reit Plc - Rights (19/10/2016) 708 56 0.00 Tritax Big Box REIT Plc 7,796 12,517 0.07 Tullett Prebon Plc 7,425 28,631 0.16 Ultra Electronics Holdings Plc 1,471 30,147 0.16 UNITE Group Plc/The 3,212 23,557 0.13 Vedanta Resources Plc 16,749 112,870 0.61 Vesuvius Plc 4,002 16,228 0.09 Victrex Plc 1,880 34,074 0.18 Virgin Money Holdings UK Plc 5,733 20,623 0.11 WH Smith Plc 1,799 31,982 0.17 Workspace Group Plc 2,349 18,952 0.10 WS Atkins Plc 3,073 56,443 0.31
4,729,607 25.66
Financial assets at fair value through profit or loss 18,450,617 100.09 Current assets 75,639 0.41 Total assets 18,526,256 100.50 Current liabilities (92,916) (0.50) Net assets attributable to holders of redeemable participating Shares 18,433,340 100.00
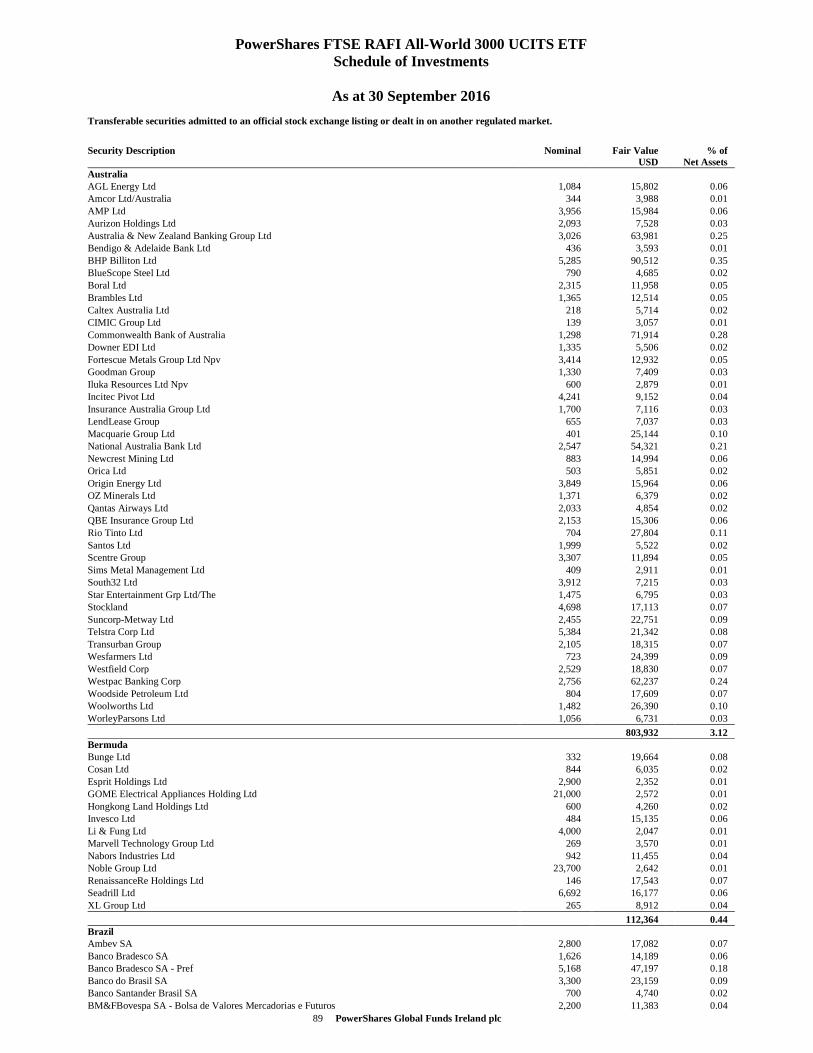
89 PowerShares Global Funds Ireland plc
PowerShares FTSE RAFI All-World 3000 UCITS ETF Schedule of Investments
As at 30 September 2016
Transferable securities admitted to an official stock exchange listing or dealt in on another regulated market.
Security Description Nominal Fair Value USD
% of Net Assets
Australia AGL Energy Ltd 1,084 15,802 0.06 Amcor Ltd/Australia 344 3,988 0.01 AMP Ltd 3,956 15,984 0.06 Aurizon Holdings Ltd 2,093 7,528 0.03 Australia & New Zealand Banking Group Ltd 3,026 63,981 0.25 Bendigo & Adelaide Bank Ltd 436 3,593 0.01 BHP Billiton Ltd 5,285 90,512 0.35 BlueScope Steel Ltd 790 4,685 0.02 Boral Ltd 2,315 11,958 0.05 Brambles Ltd 1,365 12,514 0.05 Caltex Australia Ltd 218 5,714 0.02 CIMIC Group Ltd 139 3,057 0.01 Commonwealth Bank of Australia 1,298 71,914 0.28 Downer EDI Ltd 1,335 5,506 0.02 Fortescue Metals Group Ltd Npv 3,414 12,932 0.05 Goodman Group 1,330 7,409 0.03 Iluka Resources Ltd Npv 600 2,879 0.01 Incitec Pivot Ltd 4,241 9,152 0.04 Insurance Australia Group Ltd 1,700 7,116 0.03 LendLease Group 655 7,037 0.03 Macquarie Group Ltd 401 25,144 0.10 National Australia Bank Ltd 2,547 54,321 0.21 Newcrest Mining Ltd 883 14,994 0.06 Orica Ltd 503 5,851 0.02 Origin Energy Ltd 3,849 15,964 0.06 OZ Minerals Ltd 1,371 6,379 0.02 Qantas Airways Ltd 2,033 4,854 0.02 QBE Insurance Group Ltd 2,153 15,306 0.06 Rio Tinto Ltd 704 27,804 0.11 Santos Ltd 1,999 5,522 0.02 Scentre Group 3,307 11,894 0.05 Sims Metal Management Ltd 409 2,911 0.01 South32 Ltd 3,912 7,215 0.03 Star Entertainment Grp Ltd/The 1,475 6,795 0.03 Stockland 4,698 17,113 0.07 Suncorp-Metway Ltd 2,455 22,751 0.09 Telstra Corp Ltd 5,384 21,342 0.08 Transurban Group 2,105 18,315 0.07 Wesfarmers Ltd 723 24,399 0.09 Westfield Corp 2,529 18,830 0.07 Westpac Banking Corp 2,756 62,237 0.24 Woodside Petroleum Ltd 804 17,609 0.07 Woolworths Ltd 1,482 26,390 0.10 WorleyParsons Ltd 1,056 6,731 0.03
803,932 3.12 Bermuda Bunge Ltd 332 19,664 0.08 Cosan Ltd 844 6,035 0.02 Esprit Holdings Ltd 2,900 2,352 0.01 GOME Electrical Appliances Holding Ltd 21,000 2,572 0.01 Hongkong Land Holdings Ltd 600 4,260 0.02 Invesco Ltd 484 15,135 0.06 Li & Fung Ltd 4,000 2,047 0.01 Marvell Technology Group Ltd 269 3,570 0.01 Nabors Industries Ltd 942 11,455 0.04 Noble Group Ltd 23,700 2,642 0.01 RenaissanceRe Holdings Ltd 146 17,543 0.07 Seadrill Ltd 6,692 16,177 0.06 XL Group Ltd 265 8,912 0.04
112,364 0.44 Brazil Ambev SA 2,800 17,082 0.07 Banco Bradesco SA 1,626 14,189 0.06 Banco Bradesco SA - Pref 5,168 47,197 0.18 Banco do Brasil SA 3,300 23,159 0.09 Banco Santander Brasil SA 700 4,740 0.02 BM&FBovespa SA - Bolsa de Valores Mercadorias e Futuros 2,200 11,383 0.04
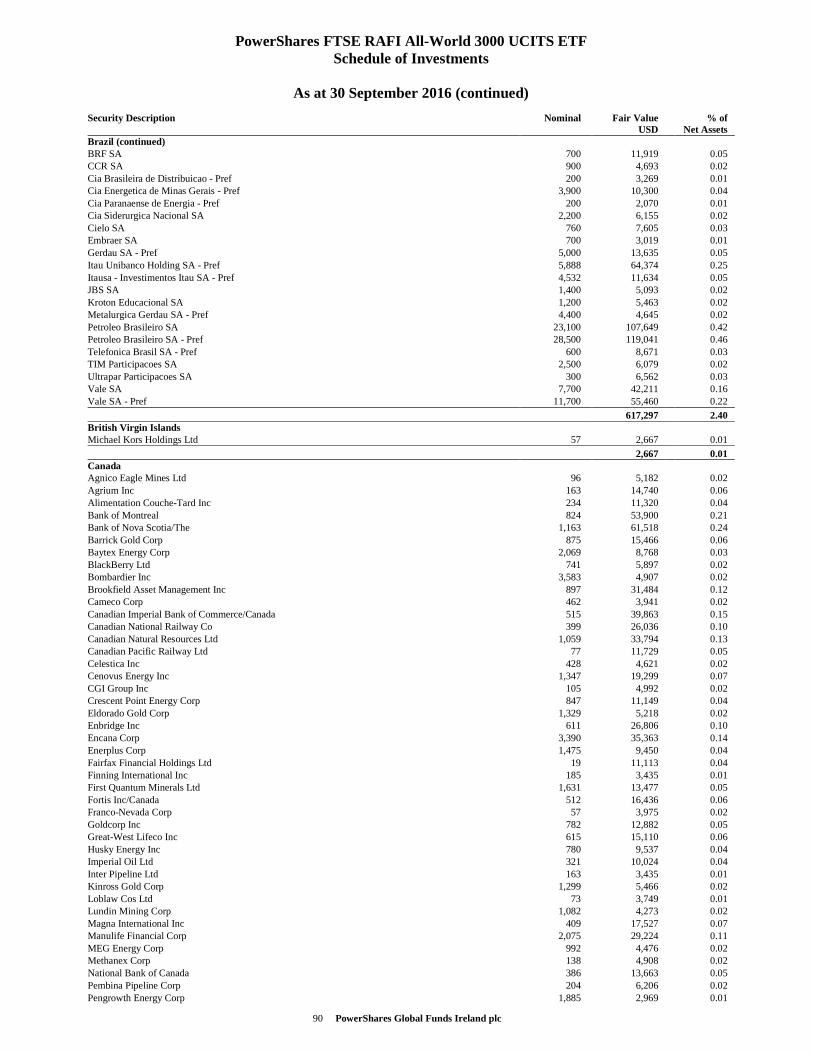
90 PowerShares Global Funds Ireland plc
PowerShares FTSE RAFI All-World 3000 UCITS ETF Schedule of Investments
As at 30 September 2016 (continued)
Security Description Nominal Fair Value USD
% of Net Assets
Brazil (continued) BRF SA 700 11,919 0.05 CCR SA 900 4,693 0.02 Cia Brasileira de Distribuicao - Pref 200 3,269 0.01 Cia Energetica de Minas Gerais - Pref 3,900 10,300 0.04 Cia Paranaense de Energia - Pref 200 2,070 0.01 Cia Siderurgica Nacional SA 2,200 6,155 0.02 Cielo SA 760 7,605 0.03 Embraer SA 700 3,019 0.01 Gerdau SA - Pref 5,000 13,635 0.05 Itau Unibanco Holding SA - Pref 5,888 64,374 0.25 Itausa - Investimentos Itau SA - Pref 4,532 11,634 0.05 JBS SA 1,400 5,093 0.02 Kroton Educacional SA 1,200 5,463 0.02 Metalurgica Gerdau SA - Pref 4,400 4,645 0.02 Petroleo Brasileiro SA 23,100 107,649 0.42 Petroleo Brasileiro SA - Pref 28,500 119,041 0.46 Telefonica Brasil SA - Pref 600 8,671 0.03 TIM Participacoes SA 2,500 6,079 0.02 Ultrapar Participacoes SA 300 6,562 0.03 Vale SA 7,700 42,211 0.16 Vale SA - Pref 11,700 55,460 0.22
617,297 2.40 British Virgin Islands Michael Kors Holdings Ltd 57 2,667 0.01
2,667 0.01 Canada Agnico Eagle Mines Ltd 96 5,182 0.02 Agrium Inc 163 14,740 0.06 Alimentation Couche-Tard Inc 234 11,320 0.04 Bank of Montreal 824 53,900 0.21 Bank of Nova Scotia/The 1,163 61,518 0.24 Barrick Gold Corp 875 15,466 0.06 Baytex Energy Corp 2,069 8,768 0.03 BlackBerry Ltd 741 5,897 0.02 Bombardier Inc 3,583 4,907 0.02 Brookfield Asset Management Inc 897 31,484 0.12 Cameco Corp 462 3,941 0.02 Canadian Imperial Bank of Commerce/Canada 515 39,863 0.15 Canadian National Railway Co 399 26,036 0.10 Canadian Natural Resources Ltd 1,059 33,794 0.13 Canadian Pacific Railway Ltd 77 11,729 0.05 Celestica Inc 428 4,621 0.02 Cenovus Energy Inc 1,347 19,299 0.07 CGI Group Inc 105 4,992 0.02 Crescent Point Energy Corp 847 11,149 0.04 Eldorado Gold Corp 1,329 5,218 0.02 Enbridge Inc 611 26,806 0.10 Encana Corp 3,390 35,363 0.14 Enerplus Corp 1,475 9,450 0.04 Fairfax Financial Holdings Ltd 19 11,113 0.04 Finning International Inc 185 3,435 0.01 First Quantum Minerals Ltd 1,631 13,477 0.05 Fortis Inc/Canada 512 16,436 0.06 Franco-Nevada Corp 57 3,975 0.02 Goldcorp Inc 782 12,882 0.05 Great-West Lifeco Inc 615 15,110 0.06 Husky Energy Inc 780 9,537 0.04 Imperial Oil Ltd 321 10,024 0.04 Inter Pipeline Ltd 163 3,435 0.01 Kinross Gold Corp 1,299 5,466 0.02 Loblaw Cos Ltd 73 3,749 0.01 Lundin Mining Corp 1,082 4,273 0.02 Magna International Inc 409 17,527 0.07 Manulife Financial Corp 2,075 29,224 0.11 MEG Energy Corp 992 4,476 0.02 Methanex Corp 138 4,908 0.02 National Bank of Canada 386 13,663 0.05 Pembina Pipeline Corp 204 6,206 0.02 Pengrowth Energy Corp 1,885 2,969 0.01
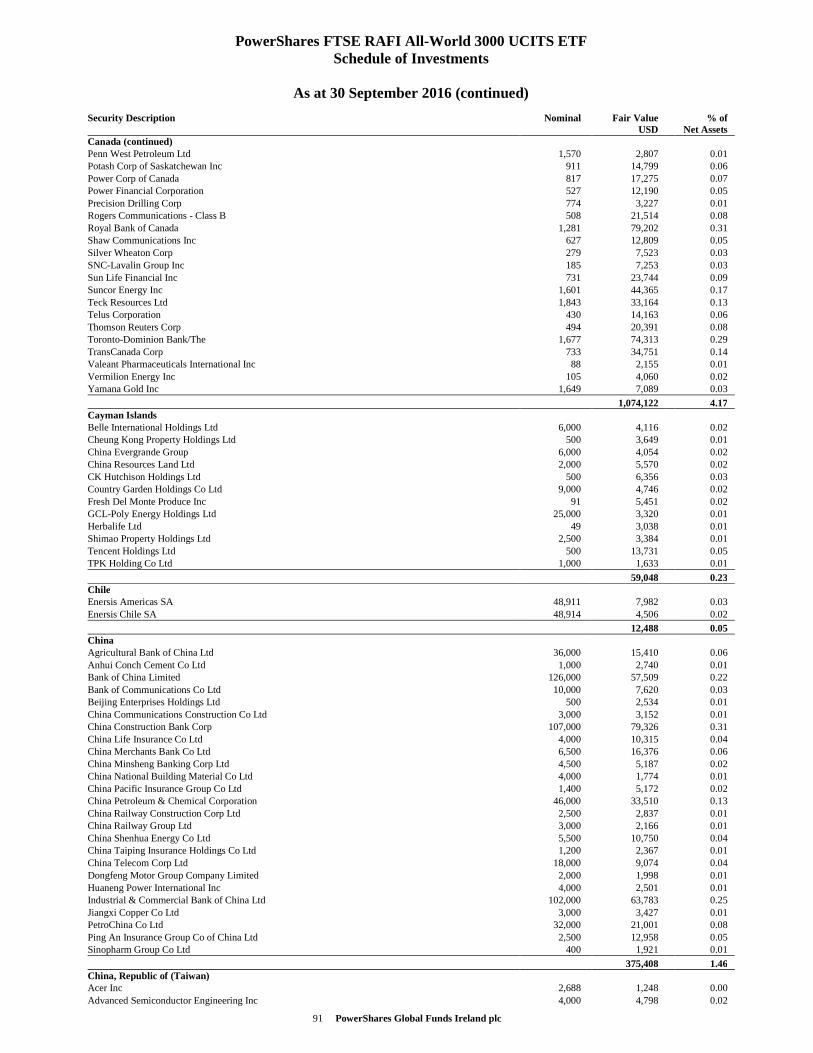
91 PowerShares Global Funds Ireland plc
PowerShares FTSE RAFI All-World 3000 UCITS ETF Schedule of Investments
As at 30 September 2016 (continued)
Security Description Nominal Fair Value USD
% of Net Assets
Canada (continued) Penn West Petroleum Ltd 1,570 2,807 0.01 Potash Corp of Saskatchewan Inc 911 14,799 0.06 Power Corp of Canada 817 17,275 0.07 Power Financial Corporation 527 12,190 0.05 Precision Drilling Corp 774 3,227 0.01 Rogers Communications - Class B 508 21,514 0.08 Royal Bank of Canada 1,281 79,202 0.31 Shaw Communications Inc 627 12,809 0.05 Silver Wheaton Corp 279 7,523 0.03 SNC-Lavalin Group Inc 185 7,253 0.03 Sun Life Financial Inc 731 23,744 0.09 Suncor Energy Inc 1,601 44,365 0.17 Teck Resources Ltd 1,843 33,164 0.13 Telus Corporation 430 14,163 0.06 Thomson Reuters Corp 494 20,391 0.08 Toronto-Dominion Bank/The 1,677 74,313 0.29 TransCanada Corp 733 34,751 0.14 Valeant Pharmaceuticals International Inc 88 2,155 0.01 Vermilion Energy Inc 105 4,060 0.02 Yamana Gold Inc 1,649 7,089 0.03
1,074,122 4.17 Cayman Islands Belle International Holdings Ltd 6,000 4,116 0.02 Cheung Kong Property Holdings Ltd 500 3,649 0.01 China Evergrande Group 6,000 4,054 0.02 China Resources Land Ltd 2,000 5,570 0.02 CK Hutchison Holdings Ltd 500 6,356 0.03 Country Garden Holdings Co Ltd 9,000 4,746 0.02 Fresh Del Monte Produce Inc 91 5,451 0.02 GCL-Poly Energy Holdings Ltd 25,000 3,320 0.01 Herbalife Ltd 49 3,038 0.01 Shimao Property Holdings Ltd 2,500 3,384 0.01 Tencent Holdings Ltd 500 13,731 0.05 TPK Holding Co Ltd 1,000 1,633 0.01
59,048 0.23 Chile Enersis Americas SA 48,911 7,982 0.03 Enersis Chile SA 48,914 4,506 0.02
12,488 0.05 China Agricultural Bank of China Ltd 36,000 15,410 0.06 Anhui Conch Cement Co Ltd 1,000 2,740 0.01 Bank of China Limited 126,000 57,509 0.22 Bank of Communications Co Ltd 10,000 7,620 0.03 Beijing Enterprises Holdings Ltd 500 2,534 0.01 China Communications Construction Co Ltd 3,000 3,152 0.01 China Construction Bank Corp 107,000 79,326 0.31 China Life Insurance Co Ltd 4,000 10,315 0.04 China Merchants Bank Co Ltd 6,500 16,376 0.06 China Minsheng Banking Corp Ltd 4,500 5,187 0.02 China National Building Material Co Ltd 4,000 1,774 0.01 China Pacific Insurance Group Co Ltd 1,400 5,172 0.02 China Petroleum & Chemical Corporation 46,000 33,510 0.13 China Railway Construction Corp Ltd 2,500 2,837 0.01 China Railway Group Ltd 3,000 2,166 0.01 China Shenhua Energy Co Ltd 5,500 10,750 0.04 China Taiping Insurance Holdings Co Ltd 1,200 2,367 0.01 China Telecom Corp Ltd 18,000 9,074 0.04 Dongfeng Motor Group Company Limited 2,000 1,998 0.01 Huaneng Power International Inc 4,000 2,501 0.01 Industrial & Commercial Bank of China Ltd 102,000 63,783 0.25 Jiangxi Copper Co Ltd 3,000 3,427 0.01 PetroChina Co Ltd 32,000 21,001 0.08 Ping An Insurance Group Co of China Ltd 2,500 12,958 0.05 Sinopharm Group Co Ltd 400 1,921 0.01
375,408 1.46 China, Republic of (Taiwan) Acer Inc 2,688 1,248 0.00 Advanced Semiconductor Engineering Inc 4,000 4,798 0.02
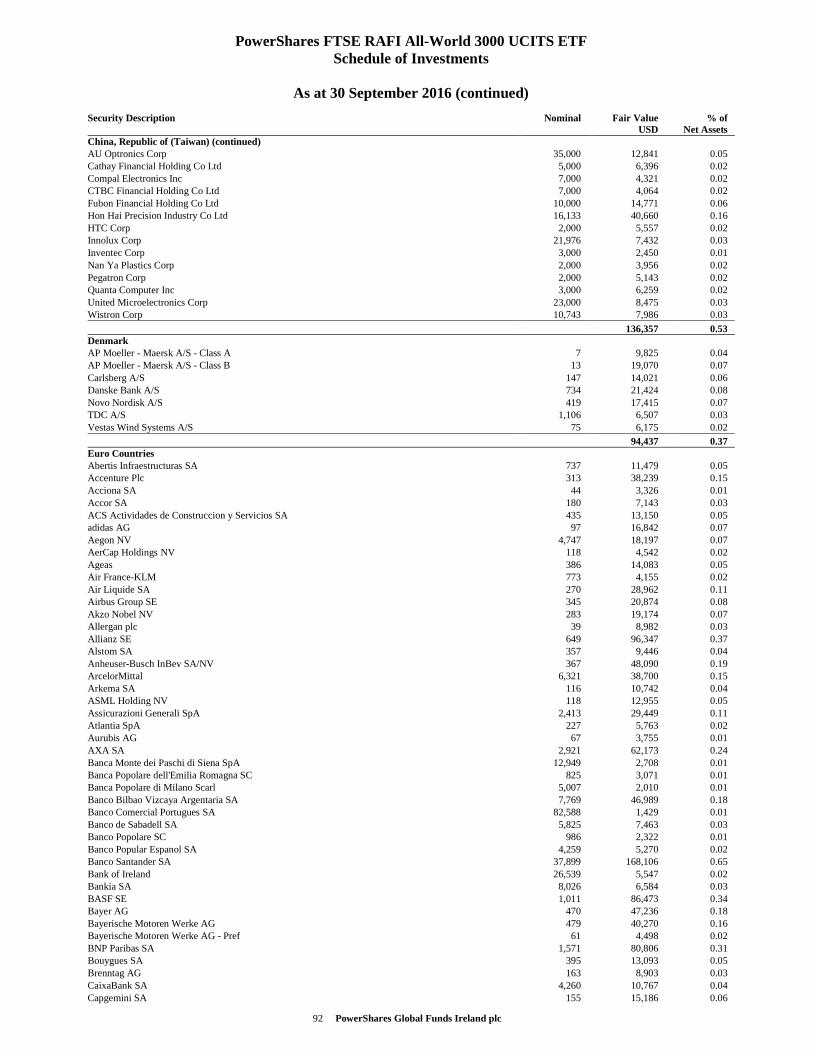
92 PowerShares Global Funds Ireland plc
PowerShares FTSE RAFI All-World 3000 UCITS ETF Schedule of Investments
As at 30 September 2016 (continued)
Security Description Nominal Fair Value USD
% of Net Assets
China, Republic of (Taiwan) (continued) AU Optronics Corp 35,000 12,841 0.05 Cathay Financial Holding Co Ltd 5,000 6,396 0.02 Compal Electronics Inc 7,000 4,321 0.02 CTBC Financial Holding Co Ltd 7,000 4,064 0.02 Fubon Financial Holding Co Ltd 10,000 14,771 0.06 Hon Hai Precision Industry Co Ltd 16,133 40,660 0.16 HTC Corp 2,000 5,557 0.02 Innolux Corp 21,976 7,432 0.03 Inventec Corp 3,000 2,450 0.01 Nan Ya Plastics Corp 2,000 3,956 0.02 Pegatron Corp 2,000 5,143 0.02 Quanta Computer Inc 3,000 6,259 0.02 United Microelectronics Corp 23,000 8,475 0.03 Wistron Corp 10,743 7,986 0.03
136,357 0.53 Denmark AP Moeller - Maersk A/S - Class A 7 9,825 0.04 AP Moeller - Maersk A/S - Class B 13 19,070 0.07 Carlsberg A/S 147 14,021 0.06 Danske Bank A/S 734 21,424 0.08 Novo Nordisk A/S 419 17,415 0.07 TDC A/S 1,106 6,507 0.03 Vestas Wind Systems A/S 75 6,175 0.02
94,437 0.37 Euro Countries Abertis Infraestructuras SA 737 11,479 0.05 Accenture Plc 313 38,239 0.15 Acciona SA 44 3,326 0.01 Accor SA 180 7,143 0.03 ACS Actividades de Construccion y Servicios SA 435 13,150 0.05 adidas AG 97 16,842 0.07 Aegon NV 4,747 18,197 0.07 AerCap Holdings NV 118 4,542 0.02 Ageas 386 14,083 0.05 Air France-KLM 773 4,155 0.02 Air Liquide SA 270 28,962 0.11 Airbus Group SE 345 20,874 0.08 Akzo Nobel NV 283 19,174 0.07 Allergan plc 39 8,982 0.03 Allianz SE 649 96,347 0.37 Alstom SA 357 9,446 0.04 Anheuser-Busch InBev SA/NV 367 48,090 0.19 ArcelorMittal 6,321 38,700 0.15 Arkema SA 116 10,742 0.04 ASML Holding NV 118 12,955 0.05 Assicurazioni Generali SpA 2,413 29,449 0.11 Atlantia SpA 227 5,763 0.02 Aurubis AG 67 3,755 0.01 AXA SA 2,921 62,173 0.24 Banca Monte dei Paschi di Siena SpA 12,949 2,708 0.01 Banca Popolare dell'Emilia Romagna SC 825 3,071 0.01 Banca Popolare di Milano Scarl 5,007 2,010 0.01 Banco Bilbao Vizcaya Argentaria SA 7,769 46,989 0.18 Banco Comercial Portugues SA 82,588 1,429 0.01 Banco de Sabadell SA 5,825 7,463 0.03 Banco Popolare SC 986 2,322 0.01 Banco Popular Espanol SA 4,259 5,270 0.02 Banco Santander SA 37,899 168,106 0.65 Bank of Ireland 26,539 5,547 0.02 Bankia SA 8,026 6,584 0.03 BASF SE 1,011 86,473 0.34 Bayer AG 470 47,236 0.18 Bayerische Motoren Werke AG 479 40,270 0.16 Bayerische Motoren Werke AG - Pref 61 4,498 0.02 BNP Paribas SA 1,571 80,806 0.31 Bouygues SA 395 13,093 0.05 Brenntag AG 163 8,903 0.03 CaixaBank SA 4,260 10,767 0.04 Capgemini SA 155 15,186 0.06
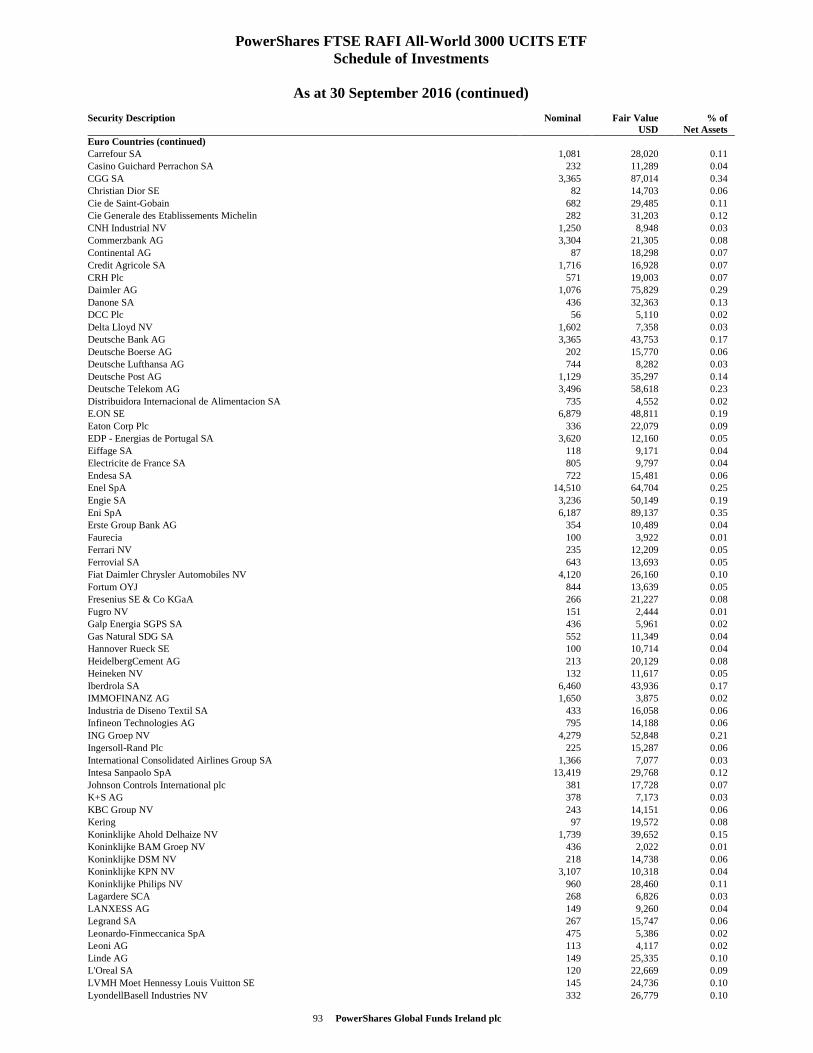
93 PowerShares Global Funds Ireland plc
PowerShares FTSE RAFI All-World 3000 UCITS ETF Schedule of Investments
As at 30 September 2016 (continued)
Security Description Nominal Fair Value USD
% of Net Assets
Euro Countries (continued) Carrefour SA 1,081 28,020 0.11 Casino Guichard Perrachon SA 232 11,289 0.04 CGG SA 3,365 87,014 0.34 Christian Dior SE 82 14,703 0.06 Cie de Saint-Gobain 682 29,485 0.11 Cie Generale des Etablissements Michelin 282 31,203 0.12 CNH Industrial NV 1,250 8,948 0.03 Commerzbank AG 3,304 21,305 0.08 Continental AG 87 18,298 0.07 Credit Agricole SA 1,716 16,928 0.07 CRH Plc 571 19,003 0.07 Daimler AG 1,076 75,829 0.29 Danone SA 436 32,363 0.13 DCC Plc 56 5,110 0.02 Delta Lloyd NV 1,602 7,358 0.03 Deutsche Bank AG 3,365 43,753 0.17 Deutsche Boerse AG 202 15,770 0.06 Deutsche Lufthansa AG 744 8,282 0.03 Deutsche Post AG 1,129 35,297 0.14 Deutsche Telekom AG 3,496 58,618 0.23 Distribuidora Internacional de Alimentacion SA 735 4,552 0.02 E.ON SE 6,879 48,811 0.19 Eaton Corp Plc 336 22,079 0.09 EDP - Energias de Portugal SA 3,620 12,160 0.05 Eiffage SA 118 9,171 0.04 Electricite de France SA 805 9,797 0.04 Endesa SA 722 15,481 0.06 Enel SpA 14,510 64,704 0.25 Engie SA 3,236 50,149 0.19 Eni SpA 6,187 89,137 0.35 Erste Group Bank AG 354 10,489 0.04 Faurecia 100 3,922 0.01 Ferrari NV 235 12,209 0.05 Ferrovial SA 643 13,693 0.05 Fiat Daimler Chrysler Automobiles NV 4,120 26,160 0.10 Fortum OYJ 844 13,639 0.05 Fresenius SE & Co KGaA 266 21,227 0.08 Fugro NV 151 2,444 0.01 Galp Energia SGPS SA 436 5,961 0.02 Gas Natural SDG SA 552 11,349 0.04 Hannover Rueck SE 100 10,714 0.04 HeidelbergCement AG 213 20,129 0.08 Heineken NV 132 11,617 0.05 Iberdrola SA 6,460 43,936 0.17 IMMOFINANZ AG 1,650 3,875 0.02 Industria de Diseno Textil SA 433 16,058 0.06 Infineon Technologies AG 795 14,188 0.06 ING Groep NV 4,279 52,848 0.21 Ingersoll-Rand Plc 225 15,287 0.06 International Consolidated Airlines Group SA 1,366 7,077 0.03 Intesa Sanpaolo SpA 13,419 29,768 0.12 Johnson Controls International plc 381 17,728 0.07 K+S AG 378 7,173 0.03 KBC Group NV 243 14,151 0.06 Kering 97 19,572 0.08 Koninklijke Ahold Delhaize NV 1,739 39,652 0.15 Koninklijke BAM Groep NV 436 2,022 0.01 Koninklijke DSM NV 218 14,738 0.06 Koninklijke KPN NV 3,107 10,318 0.04 Koninklijke Philips NV 960 28,460 0.11 Lagardere SCA 268 6,826 0.03 LANXESS AG 149 9,260 0.04 Legrand SA 267 15,747 0.06 Leonardo-Finmeccanica SpA 475 5,386 0.02 Leoni AG 113 4,117 0.02 Linde AG 149 25,335 0.10 L'Oreal SA 120 22,669 0.09 LVMH Moet Hennessy Louis Vuitton SE 145 24,736 0.10 LyondellBasell Industries NV 332 26,779 0.10
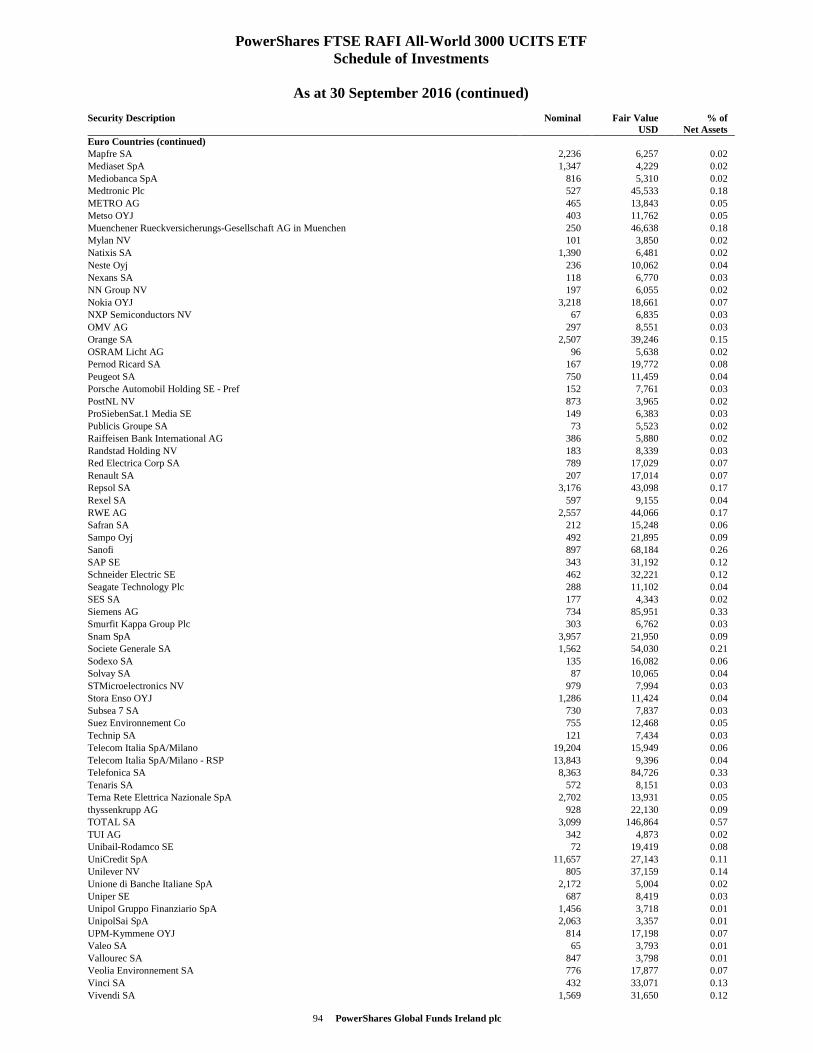
94 PowerShares Global Funds Ireland plc
PowerShares FTSE RAFI All-World 3000 UCITS ETF Schedule of Investments
As at 30 September 2016 (continued)
Security Description Nominal Fair Value USD
% of Net Assets
Euro Countries (continued) Mapfre SA 2,236 6,257 0.02 Mediaset SpA 1,347 4,229 0.02 Mediobanca SpA 816 5,310 0.02 Medtronic Plc 527 45,533 0.18 METRO AG 465 13,843 0.05 Metso OYJ 403 11,762 0.05 Muenchener Rueckversicherungs-Gesellschaft AG in Muenchen 250 46,638 0.18 Mylan NV 101 3,850 0.02 Natixis SA 1,390 6,481 0.02 Neste Oyj 236 10,062 0.04 Nexans SA 118 6,770 0.03 NN Group NV 197 6,055 0.02 Nokia OYJ 3,218 18,661 0.07 NXP Semiconductors NV 67 6,835 0.03 OMV AG 297 8,551 0.03 Orange SA 2,507 39,246 0.15 OSRAM Licht AG 96 5,638 0.02 Pernod Ricard SA 167 19,772 0.08 Peugeot SA 750 11,459 0.04 Porsche Automobil Holding SE - Pref 152 7,761 0.03 PostNL NV 873 3,965 0.02 ProSiebenSat.1 Media SE 149 6,383 0.03 Publicis Groupe SA 73 5,523 0.02 Raiffeisen Bank International AG 386 5,880 0.02 Randstad Holding NV 183 8,339 0.03 Red Electrica Corp SA 789 17,029 0.07 Renault SA 207 17,014 0.07 Repsol SA 3,176 43,098 0.17 Rexel SA 597 9,155 0.04 RWE AG 2,557 44,066 0.17 Safran SA 212 15,248 0.06 Sampo Oyj 492 21,895 0.09 Sanofi 897 68,184 0.26 SAP SE 343 31,192 0.12 Schneider Electric SE 462 32,221 0.12 Seagate Technology Plc 288 11,102 0.04 SES SA 177 4,343 0.02 Siemens AG 734 85,951 0.33 Smurfit Kappa Group Plc 303 6,762 0.03 Snam SpA 3,957 21,950 0.09 Societe Generale SA 1,562 54,030 0.21 Sodexo SA 135 16,082 0.06 Solvay SA 87 10,065 0.04 STMicroelectronics NV 979 7,994 0.03 Stora Enso OYJ 1,286 11,424 0.04 Subsea 7 SA 730 7,837 0.03 Suez Environnement Co 755 12,468 0.05 Technip SA 121 7,434 0.03 Telecom Italia SpA/Milano 19,204 15,949 0.06 Telecom Italia SpA/Milano - RSP 13,843 9,396 0.04 Telefonica SA 8,363 84,726 0.33 Tenaris SA 572 8,151 0.03 Terna Rete Elettrica Nazionale SpA 2,702 13,931 0.05 thyssenkrupp AG 928 22,130 0.09 TOTAL SA 3,099 146,864 0.57 TUI AG 342 4,873 0.02 Unibail-Rodamco SE 72 19,419 0.08 UniCredit SpA 11,657 27,143 0.11 Unilever NV 805 37,159 0.14 Unione di Banche Italiane SpA 2,172 5,004 0.02 Uniper SE 687 8,419 0.03 Unipol Gruppo Finanziario SpA 1,456 3,718 0.01 UnipolSai SpA 2,063 3,357 0.01 UPM-Kymmene OYJ 814 17,198 0.07 Valeo SA 65 3,793 0.01 Vallourec SA 847 3,798 0.01 Veolia Environnement SA 776 17,877 0.07 Vinci SA 432 33,071 0.13 Vivendi SA 1,569 31,650 0.12
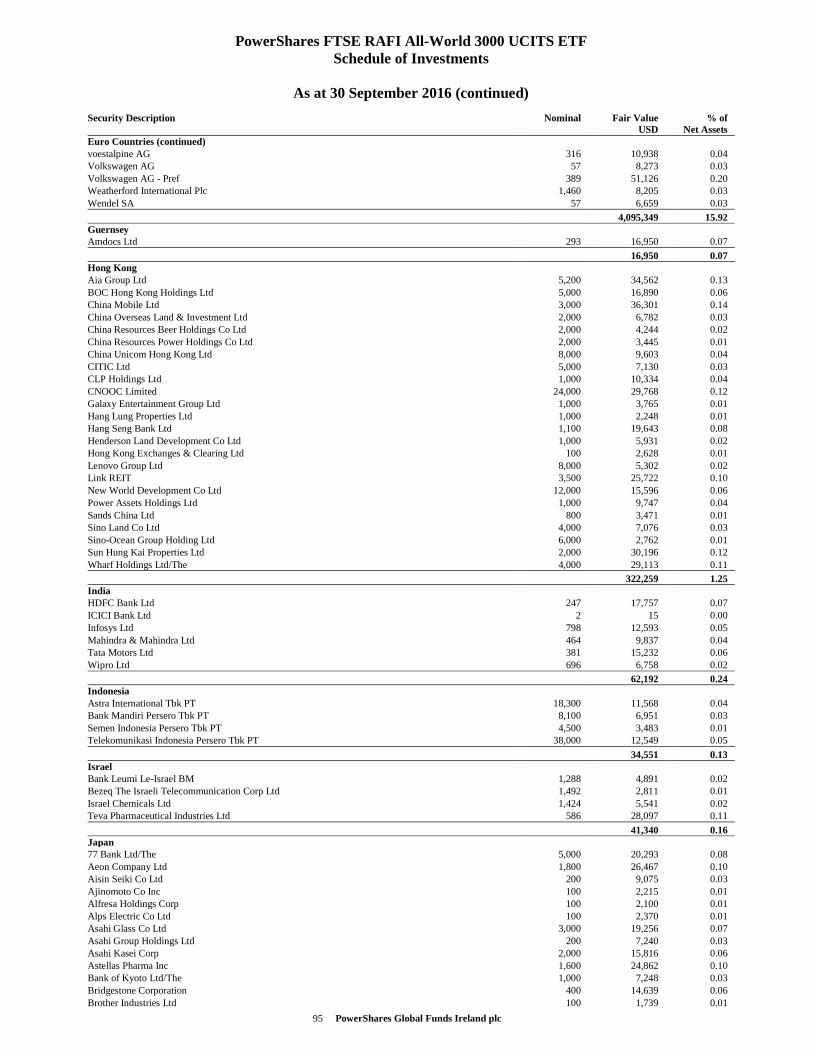
95 PowerShares Global Funds Ireland plc
PowerShares FTSE RAFI All-World 3000 UCITS ETF Schedule of Investments
As at 30 September 2016 (continued)
Security Description Nominal Fair Value USD
% of Net Assets
Euro Countries (continued) voestalpine AG 316 10,938 0.04 Volkswagen AG 57 8,273 0.03 Volkswagen AG - Pref 389 51,126 0.20 Weatherford International Plc 1,460 8,205 0.03 Wendel SA 57 6,659 0.03
4,095,349 15.92 Guernsey Amdocs Ltd 293 16,950 0.07
16,950 0.07 Hong Kong Aia Group Ltd 5,200 34,562 0.13 BOC Hong Kong Holdings Ltd 5,000 16,890 0.06 China Mobile Ltd 3,000 36,301 0.14 China Overseas Land & Investment Ltd 2,000 6,782 0.03 China Resources Beer Holdings Co Ltd 2,000 4,244 0.02 China Resources Power Holdings Co Ltd 2,000 3,445 0.01 China Unicom Hong Kong Ltd 8,000 9,603 0.04 CITIC Ltd 5,000 7,130 0.03 CLP Holdings Ltd 1,000 10,334 0.04 CNOOC Limited 24,000 29,768 0.12 Galaxy Entertainment Group Ltd 1,000 3,765 0.01 Hang Lung Properties Ltd 1,000 2,248 0.01 Hang Seng Bank Ltd 1,100 19,643 0.08 Henderson Land Development Co Ltd 1,000 5,931 0.02 Hong Kong Exchanges & Clearing Ltd 100 2,628 0.01 Lenovo Group Ltd 8,000 5,302 0.02 Link REIT 3,500 25,722 0.10 New World Development Co Ltd 12,000 15,596 0.06 Power Assets Holdings Ltd 1,000 9,747 0.04 Sands China Ltd 800 3,471 0.01 Sino Land Co Ltd 4,000 7,076 0.03 Sino-Ocean Group Holding Ltd 6,000 2,762 0.01 Sun Hung Kai Properties Ltd 2,000 30,196 0.12 Wharf Holdings Ltd/The 4,000 29,113 0.11
322,259 1.25 India HDFC Bank Ltd 247 17,757 0.07 ICICI Bank Ltd 2 15 0.00 Infosys Ltd 798 12,593 0.05 Mahindra & Mahindra Ltd 464 9,837 0.04 Tata Motors Ltd 381 15,232 0.06 Wipro Ltd 696 6,758 0.02
62,192 0.24 Indonesia Astra International Tbk PT 18,300 11,568 0.04 Bank Mandiri Persero Tbk PT 8,100 6,951 0.03 Semen Indonesia Persero Tbk PT 4,500 3,483 0.01 Telekomunikasi Indonesia Persero Tbk PT 38,000 12,549 0.05
34,551 0.13 Israel Bank Leumi Le-Israel BM 1,288 4,891 0.02 Bezeq The Israeli Telecommunication Corp Ltd 1,492 2,811 0.01 Israel Chemicals Ltd 1,424 5,541 0.02 Teva Pharmaceutical Industries Ltd 586 28,097 0.11
41,340 0.16 Japan 77 Bank Ltd/The 5,000 20,293 0.08 Aeon Company Ltd 1,800 26,467 0.10 Aisin Seiki Co Ltd 200 9,075 0.03 Ajinomoto Co Inc 100 2,215 0.01 Alfresa Holdings Corp 100 2,100 0.01 Alps Electric Co Ltd 100 2,370 0.01 Asahi Glass Co Ltd 3,000 19,256 0.07 Asahi Group Holdings Ltd 200 7,240 0.03 Asahi Kasei Corp 2,000 15,816 0.06 Astellas Pharma Inc 1,600 24,862 0.10 Bank of Kyoto Ltd/The 1,000 7,248 0.03 Bridgestone Corporation 400 14,639 0.06 Brother Industries Ltd 100 1,739 0.01
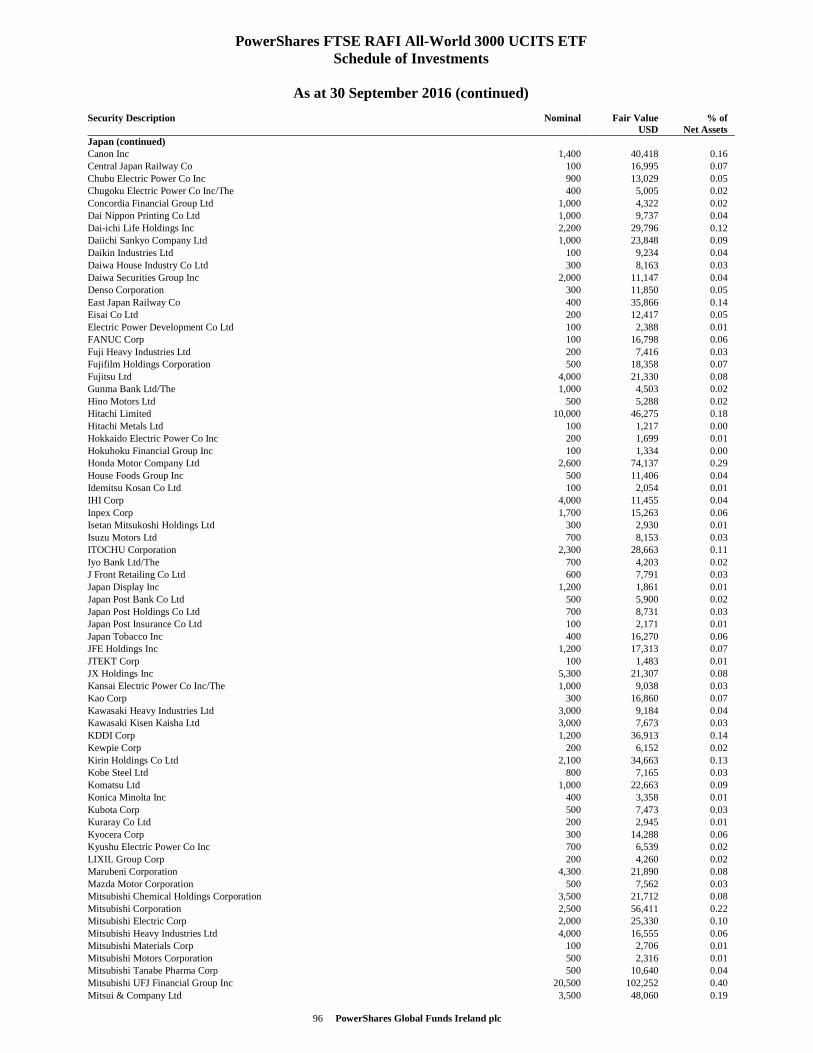
96 PowerShares Global Funds Ireland plc
PowerShares FTSE RAFI All-World 3000 UCITS ETF Schedule of Investments
As at 30 September 2016 (continued)
Security Description Nominal Fair Value USD
% of Net Assets
Japan (continued) Canon Inc 1,400 40,418 0.16 Central Japan Railway Co 100 16,995 0.07 Chubu Electric Power Co Inc 900 13,029 0.05 Chugoku Electric Power Co Inc/The 400 5,005 0.02 Concordia Financial Group Ltd 1,000 4,322 0.02 Dai Nippon Printing Co Ltd 1,000 9,737 0.04 Dai-ichi Life Holdings Inc 2,200 29,796 0.12 Daiichi Sankyo Company Ltd 1,000 23,848 0.09 Daikin Industries Ltd 100 9,234 0.04 Daiwa House Industry Co Ltd 300 8,163 0.03 Daiwa Securities Group Inc 2,000 11,147 0.04 Denso Corporation 300 11,850 0.05 East Japan Railway Co 400 35,866 0.14 Eisai Co Ltd 200 12,417 0.05 Electric Power Development Co Ltd 100 2,388 0.01 FANUC Corp 100 16,798 0.06 Fuji Heavy Industries Ltd 200 7,416 0.03 Fujifilm Holdings Corporation 500 18,358 0.07 Fujitsu Ltd 4,000 21,330 0.08 Gunma Bank Ltd/The 1,000 4,503 0.02 Hino Motors Ltd 500 5,288 0.02 Hitachi Limited 10,000 46,275 0.18 Hitachi Metals Ltd 100 1,217 0.00 Hokkaido Electric Power Co Inc 200 1,699 0.01 Hokuhoku Financial Group Inc 100 1,334 0.00 Honda Motor Company Ltd 2,600 74,137 0.29 House Foods Group Inc 500 11,406 0.04 Idemitsu Kosan Co Ltd 100 2,054 0.01 IHI Corp 4,000 11,455 0.04 Inpex Corp 1,700 15,263 0.06 Isetan Mitsukoshi Holdings Ltd 300 2,930 0.01 Isuzu Motors Ltd 700 8,153 0.03 ITOCHU Corporation 2,300 28,663 0.11 Iyo Bank Ltd/The 700 4,203 0.02 J Front Retailing Co Ltd 600 7,791 0.03 Japan Display Inc 1,200 1,861 0.01 Japan Post Bank Co Ltd 500 5,900 0.02 Japan Post Holdings Co Ltd 700 8,731 0.03 Japan Post Insurance Co Ltd 100 2,171 0.01 Japan Tobacco Inc 400 16,270 0.06 JFE Holdings Inc 1,200 17,313 0.07 JTEKT Corp 100 1,483 0.01 JX Holdings Inc 5,300 21,307 0.08 Kansai Electric Power Co Inc/The 1,000 9,038 0.03 Kao Corp 300 16,860 0.07 Kawasaki Heavy Industries Ltd 3,000 9,184 0.04 Kawasaki Kisen Kaisha Ltd 3,000 7,673 0.03 KDDI Corp 1,200 36,913 0.14 Kewpie Corp 200 6,152 0.02 Kirin Holdings Co Ltd 2,100 34,663 0.13 Kobe Steel Ltd 800 7,165 0.03 Komatsu Ltd 1,000 22,663 0.09 Konica Minolta Inc 400 3,358 0.01 Kubota Corp 500 7,473 0.03 Kuraray Co Ltd 200 2,945 0.01 Kyocera Corp 300 14,288 0.06 Kyushu Electric Power Co Inc 700 6,539 0.02 LIXIL Group Corp 200 4,260 0.02 Marubeni Corporation 4,300 21,890 0.08 Mazda Motor Corporation 500 7,562 0.03 Mitsubishi Chemical Holdings Corporation 3,500 21,712 0.08 Mitsubishi Corporation 2,500 56,411 0.22 Mitsubishi Electric Corp 2,000 25,330 0.10 Mitsubishi Heavy Industries Ltd 4,000 16,555 0.06 Mitsubishi Materials Corp 100 2,706 0.01 Mitsubishi Motors Corporation 500 2,316 0.01 Mitsubishi Tanabe Pharma Corp 500 10,640 0.04 Mitsubishi UFJ Financial Group Inc 20,500 102,252 0.40 Mitsui & Company Ltd 3,500 48,060 0.19
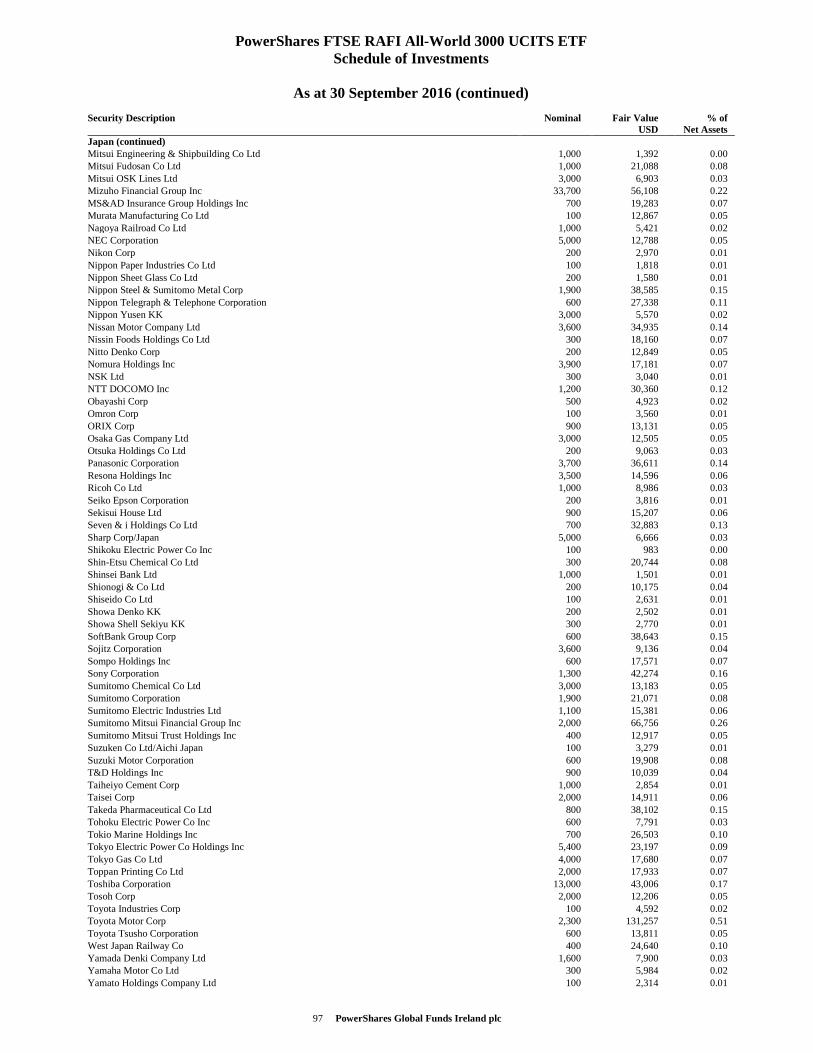
97 PowerShares Global Funds Ireland plc
PowerShares FTSE RAFI All-World 3000 UCITS ETF Schedule of Investments
As at 30 September 2016 (continued)
Security Description Nominal Fair Value USD
% of Net Assets
Japan (continued) Mitsui Engineering & Shipbuilding Co Ltd 1,000 1,392 0.00 Mitsui Fudosan Co Ltd 1,000 21,088 0.08 Mitsui OSK Lines Ltd 3,000 6,903 0.03 Mizuho Financial Group Inc 33,700 56,108 0.22 MS&AD Insurance Group Holdings Inc 700 19,283 0.07 Murata Manufacturing Co Ltd 100 12,867 0.05 Nagoya Railroad Co Ltd 1,000 5,421 0.02 NEC Corporation 5,000 12,788 0.05 Nikon Corp 200 2,970 0.01 Nippon Paper Industries Co Ltd 100 1,818 0.01 Nippon Sheet Glass Co Ltd 200 1,580 0.01 Nippon Steel & Sumitomo Metal Corp 1,900 38,585 0.15 Nippon Telegraph & Telephone Corporation 600 27,338 0.11 Nippon Yusen KK 3,000 5,570 0.02 Nissan Motor Company Ltd 3,600 34,935 0.14 Nissin Foods Holdings Co Ltd 300 18,160 0.07 Nitto Denko Corp 200 12,849 0.05 Nomura Holdings Inc 3,900 17,181 0.07 NSK Ltd 300 3,040 0.01 NTT DOCOMO Inc 1,200 30,360 0.12 Obayashi Corp 500 4,923 0.02 Omron Corp 100 3,560 0.01 ORIX Corp 900 13,131 0.05 Osaka Gas Company Ltd 3,000 12,505 0.05 Otsuka Holdings Co Ltd 200 9,063 0.03 Panasonic Corporation 3,700 36,611 0.14 Resona Holdings Inc 3,500 14,596 0.06 Ricoh Co Ltd 1,000 8,986 0.03 Seiko Epson Corporation 200 3,816 0.01 Sekisui House Ltd 900 15,207 0.06 Seven & i Holdings Co Ltd 700 32,883 0.13 Sharp Corp/Japan 5,000 6,666 0.03 Shikoku Electric Power Co Inc 100 983 0.00 Shin-Etsu Chemical Co Ltd 300 20,744 0.08 Shinsei Bank Ltd 1,000 1,501 0.01 Shionogi & Co Ltd 200 10,175 0.04 Shiseido Co Ltd 100 2,631 0.01 Showa Denko KK 200 2,502 0.01 Showa Shell Sekiyu KK 300 2,770 0.01 SoftBank Group Corp 600 38,643 0.15 Sojitz Corporation 3,600 9,136 0.04 Sompo Holdings Inc 600 17,571 0.07 Sony Corporation 1,300 42,274 0.16 Sumitomo Chemical Co Ltd 3,000 13,183 0.05 Sumitomo Corporation 1,900 21,071 0.08 Sumitomo Electric Industries Ltd 1,100 15,381 0.06 Sumitomo Mitsui Financial Group Inc 2,000 66,756 0.26 Sumitomo Mitsui Trust Holdings Inc 400 12,917 0.05 Suzuken Co Ltd/Aichi Japan 100 3,279 0.01 Suzuki Motor Corporation 600 19,908 0.08 T&D Holdings Inc 900 10,039 0.04 Taiheiyo Cement Corp 1,000 2,854 0.01 Taisei Corp 2,000 14,911 0.06 Takeda Pharmaceutical Co Ltd 800 38,102 0.15 Tohoku Electric Power Co Inc 600 7,791 0.03 Tokio Marine Holdings Inc 700 26,503 0.10 Tokyo Electric Power Co Holdings Inc 5,400 23,197 0.09 Tokyo Gas Co Ltd 4,000 17,680 0.07 Toppan Printing Co Ltd 2,000 17,933 0.07 Toshiba Corporation 13,000 43,006 0.17 Tosoh Corp 2,000 12,206 0.05 Toyota Industries Corp 100 4,592 0.02 Toyota Motor Corp 2,300 131,257 0.51 Toyota Tsusho Corporation 600 13,811 0.05 West Japan Railway Co 400 24,640 0.10 Yamada Denki Company Ltd 1,600 7,900 0.03 Yamaha Motor Co Ltd 300 5,984 0.02 Yamato Holdings Company Ltd 100 2,314 0.01
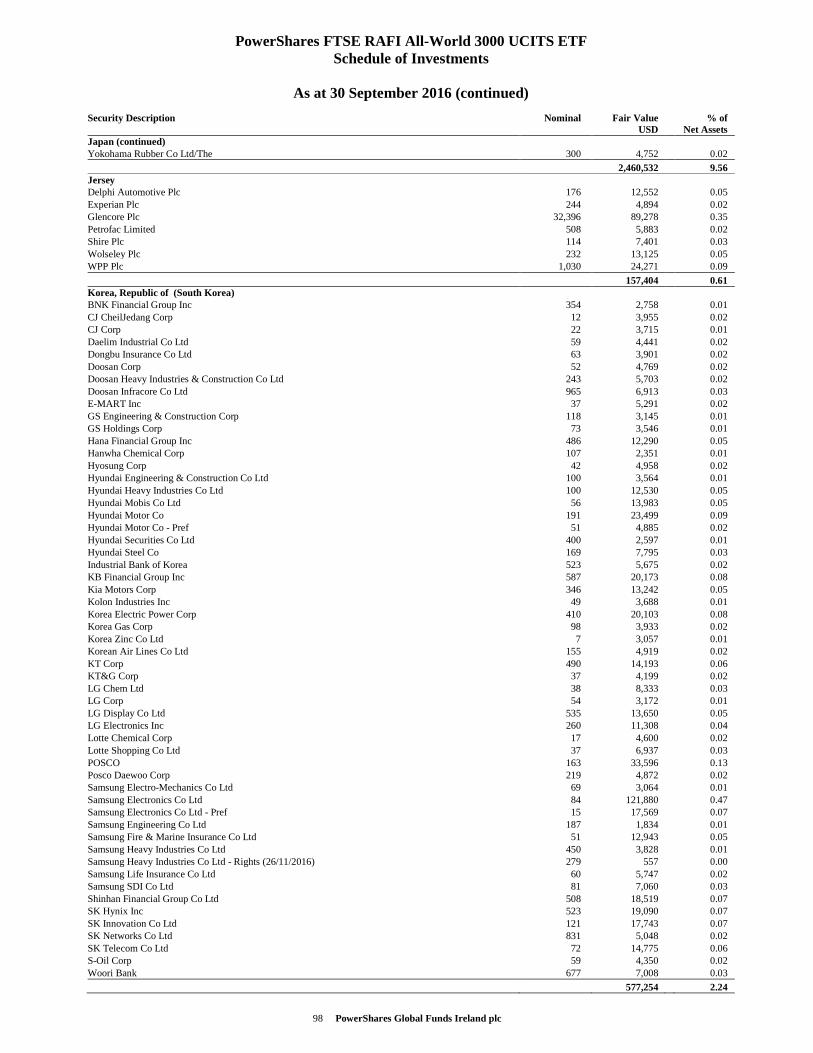
98 PowerShares Global Funds Ireland plc
PowerShares FTSE RAFI All-World 3000 UCITS ETF Schedule of Investments
As at 30 September 2016 (continued)
Security Description Nominal Fair Value USD
% of Net Assets
Japan (continued) Yokohama Rubber Co Ltd/The 300 4,752 0.02
2,460,532 9.56 Jersey Delphi Automotive Plc 176 12,552 0.05 Experian Plc 244 4,894 0.02 Glencore Plc 32,396 89,278 0.35 Petrofac Limited 508 5,883 0.02 Shire Plc 114 7,401 0.03 Wolseley Plc 232 13,125 0.05 WPP Plc 1,030 24,271 0.09
157,404 0.61 Korea, Republic of (South Korea) BNK Financial Group Inc 354 2,758 0.01 CJ CheilJedang Corp 12 3,955 0.02 CJ Corp 22 3,715 0.01 Daelim Industrial Co Ltd 59 4,441 0.02 Dongbu Insurance Co Ltd 63 3,901 0.02 Doosan Corp 52 4,769 0.02 Doosan Heavy Industries & Construction Co Ltd 243 5,703 0.02 Doosan Infracore Co Ltd 965 6,913 0.03 E-MART Inc 37 5,291 0.02 GS Engineering & Construction Corp 118 3,145 0.01 GS Holdings Corp 73 3,546 0.01 Hana Financial Group Inc 486 12,290 0.05 Hanwha Chemical Corp 107 2,351 0.01 Hyosung Corp 42 4,958 0.02 Hyundai Engineering & Construction Co Ltd 100 3,564 0.01 Hyundai Heavy Industries Co Ltd 100 12,530 0.05 Hyundai Mobis Co Ltd 56 13,983 0.05 Hyundai Motor Co 191 23,499 0.09 Hyundai Motor Co - Pref 51 4,885 0.02 Hyundai Securities Co Ltd 400 2,597 0.01 Hyundai Steel Co 169 7,795 0.03 Industrial Bank of Korea 523 5,675 0.02 KB Financial Group Inc 587 20,173 0.08 Kia Motors Corp 346 13,242 0.05 Kolon Industries Inc 49 3,688 0.01 Korea Electric Power Corp 410 20,103 0.08 Korea Gas Corp 98 3,933 0.02 Korea Zinc Co Ltd 7 3,057 0.01 Korean Air Lines Co Ltd 155 4,919 0.02 KT Corp 490 14,193 0.06 KT&G Corp 37 4,199 0.02 LG Chem Ltd 38 8,333 0.03 LG Corp 54 3,172 0.01 LG Display Co Ltd 535 13,650 0.05 LG Electronics Inc 260 11,308 0.04 Lotte Chemical Corp 17 4,600 0.02 Lotte Shopping Co Ltd 37 6,937 0.03 POSCO 163 33,596 0.13 Posco Daewoo Corp 219 4,872 0.02 Samsung Electro-Mechanics Co Ltd 69 3,064 0.01 Samsung Electronics Co Ltd 84 121,880 0.47 Samsung Electronics Co Ltd - Pref 15 17,569 0.07 Samsung Engineering Co Ltd 187 1,834 0.01 Samsung Fire & Marine Insurance Co Ltd 51 12,943 0.05 Samsung Heavy Industries Co Ltd 450 3,828 0.01 Samsung Heavy Industries Co Ltd - Rights (26/11/2016) 279 557 0.00 Samsung Life Insurance Co Ltd 60 5,747 0.02 Samsung SDI Co Ltd 81 7,060 0.03 Shinhan Financial Group Co Ltd 508 18,519 0.07 SK Hynix Inc 523 19,090 0.07 SK Innovation Co Ltd 121 17,743 0.07 SK Networks Co Ltd 831 5,048 0.02 SK Telecom Co Ltd 72 14,775 0.06 S-Oil Corp 59 4,350 0.02 Woori Bank 677 7,008 0.03
577,254 2.24
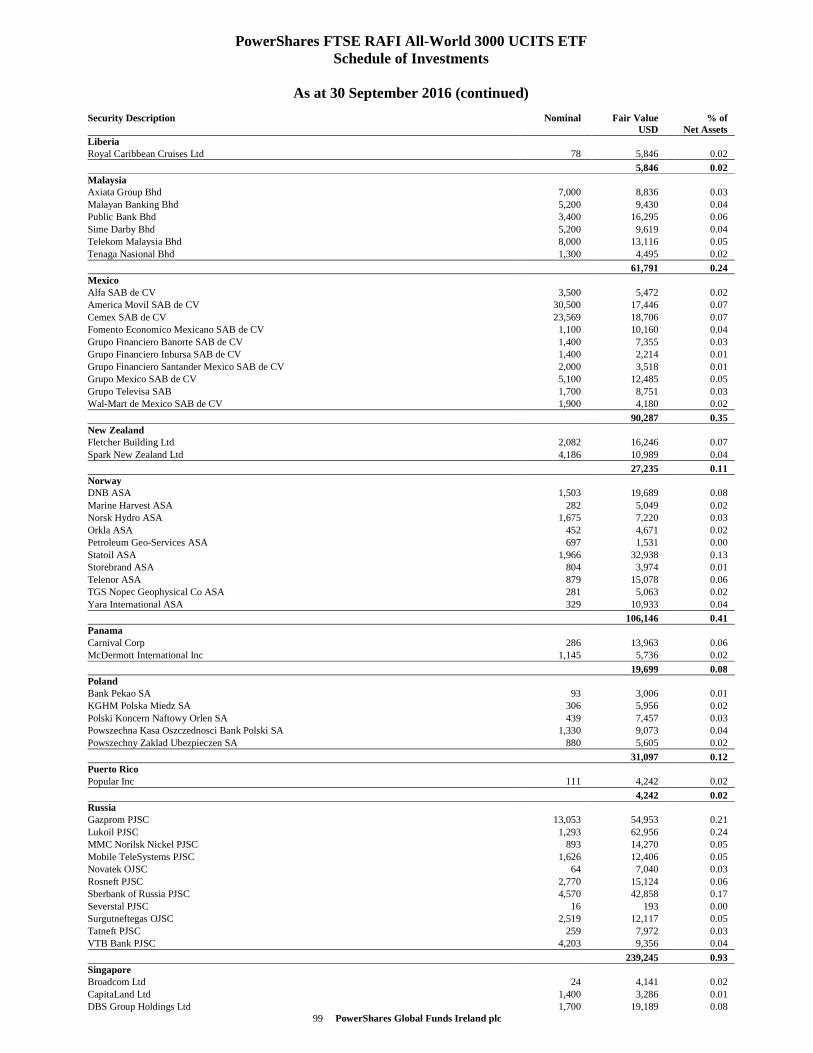
99 PowerShares Global Funds Ireland plc
PowerShares FTSE RAFI All-World 3000 UCITS ETF Schedule of Investments
As at 30 September 2016 (continued)
Security Description Nominal Fair Value USD
% of Net Assets
Liberia Royal Caribbean Cruises Ltd 78 5,846 0.02
5,846 0.02 Malaysia Axiata Group Bhd 7,000 8,836 0.03 Malayan Banking Bhd 5,200 9,430 0.04 Public Bank Bhd 3,400 16,295 0.06 Sime Darby Bhd 5,200 9,619 0.04 Telekom Malaysia Bhd 8,000 13,116 0.05 Tenaga Nasional Bhd 1,300 4,495 0.02
61,791 0.24 Mexico Alfa SAB de CV 3,500 5,472 0.02 America Movil SAB de CV 30,500 17,446 0.07 Cemex SAB de CV 23,569 18,706 0.07 Fomento Economico Mexicano SAB de CV 1,100 10,160 0.04 Grupo Financiero Banorte SAB de CV 1,400 7,355 0.03 Grupo Financiero Inbursa SAB de CV 1,400 2,214 0.01 Grupo Financiero Santander Mexico SAB de CV 2,000 3,518 0.01 Grupo Mexico SAB de CV 5,100 12,485 0.05 Grupo Televisa SAB 1,700 8,751 0.03 Wal-Mart de Mexico SAB de CV 1,900 4,180 0.02
90,287 0.35 New Zealand Fletcher Building Ltd 2,082 16,246 0.07 Spark New Zealand Ltd 4,186 10,989 0.04
27,235 0.11 Norway DNB ASA 1,503 19,689 0.08 Marine Harvest ASA 282 5,049 0.02 Norsk Hydro ASA 1,675 7,220 0.03 Orkla ASA 452 4,671 0.02 Petroleum Geo-Services ASA 697 1,531 0.00 Statoil ASA 1,966 32,938 0.13 Storebrand ASA 804 3,974 0.01 Telenor ASA 879 15,078 0.06 TGS Nopec Geophysical Co ASA 281 5,063 0.02 Yara International ASA 329 10,933 0.04
106,146 0.41 Panama Carnival Corp 286 13,963 0.06 McDermott International Inc 1,145 5,736 0.02
19,699 0.08 Poland Bank Pekao SA 93 3,006 0.01 KGHM Polska Miedz SA 306 5,956 0.02 Polski Koncern Naftowy Orlen SA 439 7,457 0.03 Powszechna Kasa Oszczednosci Bank Polski SA 1,330 9,073 0.04 Powszechny Zaklad Ubezpieczen SA 880 5,605 0.02
31,097 0.12 Puerto Rico Popular Inc 111 4,242 0.02
4,242 0.02 Russia Gazprom PJSC 13,053 54,953 0.21 Lukoil PJSC 1,293 62,956 0.24 MMC Norilsk Nickel PJSC 893 14,270 0.05 Mobile TeleSystems PJSC 1,626 12,406 0.05 Novatek OJSC 64 7,040 0.03 Rosneft PJSC 2,770 15,124 0.06 Sberbank of Russia PJSC 4,570 42,858 0.17 Severstal PJSC 16 193 0.00 Surgutneftegas OJSC 2,519 12,117 0.05 Tatneft PJSC 259 7,972 0.03 VTB Bank PJSC 4,203 9,356 0.04
239,245 0.93 Singapore Broadcom Ltd 24 4,141 0.02 CapitaLand Ltd 1,400 3,286 0.01 DBS Group Holdings Ltd 1,700 19,189 0.08
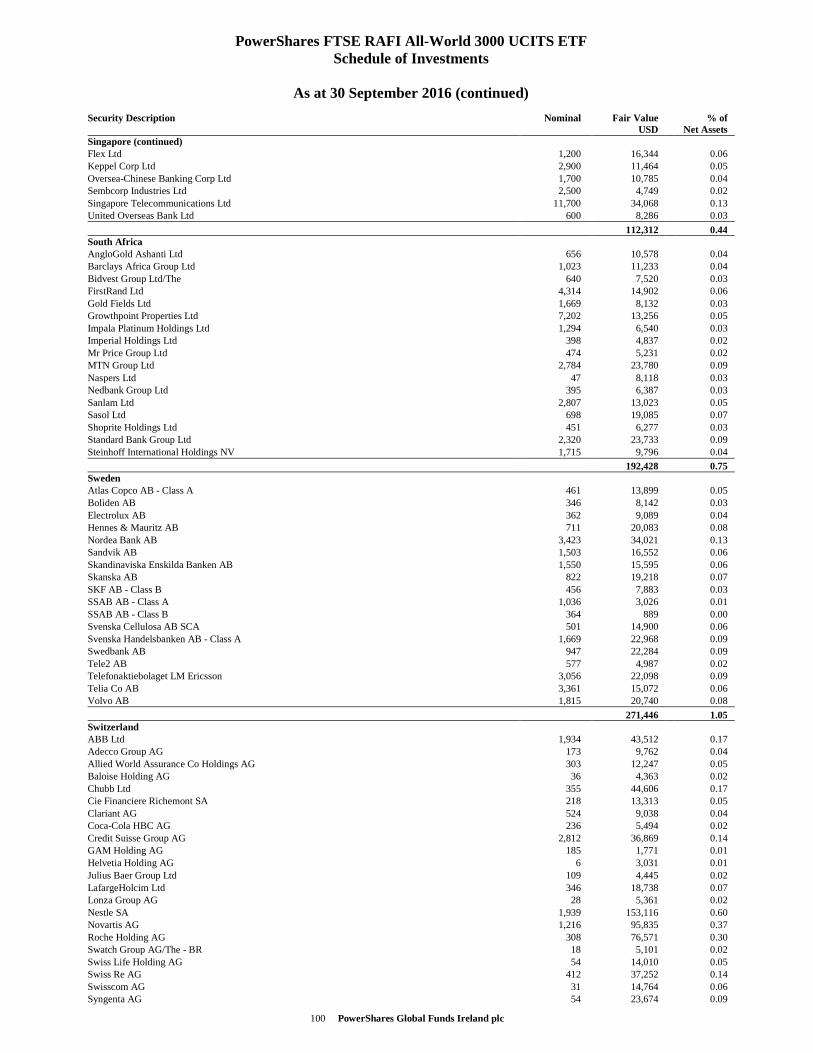
100 PowerShares Global Funds Ireland plc
PowerShares FTSE RAFI All-World 3000 UCITS ETF Schedule of Investments
As at 30 September 2016 (continued)
Security Description Nominal Fair Value USD
% of Net Assets
Singapore (continued) Flex Ltd 1,200 16,344 0.06 Keppel Corp Ltd 2,900 11,464 0.05 Oversea-Chinese Banking Corp Ltd 1,700 10,785 0.04 Sembcorp Industries Ltd 2,500 4,749 0.02 Singapore Telecommunications Ltd 11,700 34,068 0.13 United Overseas Bank Ltd 600 8,286 0.03
112,312 0.44 South Africa AngloGold Ashanti Ltd 656 10,578 0.04 Barclays Africa Group Ltd 1,023 11,233 0.04 Bidvest Group Ltd/The 640 7,520 0.03 FirstRand Ltd 4,314 14,902 0.06 Gold Fields Ltd 1,669 8,132 0.03 Growthpoint Properties Ltd 7,202 13,256 0.05 Impala Platinum Holdings Ltd 1,294 6,540 0.03 Imperial Holdings Ltd 398 4,837 0.02 Mr Price Group Ltd 474 5,231 0.02 MTN Group Ltd 2,784 23,780 0.09 Naspers Ltd 47 8,118 0.03 Nedbank Group Ltd 395 6,387 0.03 Sanlam Ltd 2,807 13,023 0.05 Sasol Ltd 698 19,085 0.07 Shoprite Holdings Ltd 451 6,277 0.03 Standard Bank Group Ltd 2,320 23,733 0.09 Steinhoff International Holdings NV 1,715 9,796 0.04
192,428 0.75 Sweden Atlas Copco AB - Class A 461 13,899 0.05 Boliden AB 346 8,142 0.03 Electrolux AB 362 9,089 0.04 Hennes & Mauritz AB 711 20,083 0.08 Nordea Bank AB 3,423 34,021 0.13 Sandvik AB 1,503 16,552 0.06 Skandinaviska Enskilda Banken AB 1,550 15,595 0.06 Skanska AB 822 19,218 0.07 SKF AB - Class B 456 7,883 0.03 SSAB AB - Class A 1,036 3,026 0.01 SSAB AB - Class B 364 889 0.00 Svenska Cellulosa AB SCA 501 14,900 0.06 Svenska Handelsbanken AB - Class A 1,669 22,968 0.09 Swedbank AB 947 22,284 0.09 Tele2 AB 577 4,987 0.02 Telefonaktiebolaget LM Ericsson 3,056 22,098 0.09 Telia Co AB 3,361 15,072 0.06 Volvo AB 1,815 20,740 0.08
271,446 1.05 Switzerland ABB Ltd 1,934 43,512 0.17 Adecco Group AG 173 9,762 0.04 Allied World Assurance Co Holdings AG 303 12,247 0.05 Baloise Holding AG 36 4,363 0.02 Chubb Ltd 355 44,606 0.17 Cie Financiere Richemont SA 218 13,313 0.05 Clariant AG 524 9,038 0.04 Coca-Cola HBC AG 236 5,494 0.02 Credit Suisse Group AG 2,812 36,869 0.14 GAM Holding AG 185 1,771 0.01 Helvetia Holding AG 6 3,031 0.01 Julius Baer Group Ltd 109 4,445 0.02 LafargeHolcim Ltd 346 18,738 0.07 Lonza Group AG 28 5,361 0.02 Nestle SA 1,939 153,116 0.60 Novartis AG 1,216 95,835 0.37 Roche Holding AG 308 76,571 0.30 Swatch Group AG/The - BR 18 5,101 0.02 Swiss Life Holding AG 54 14,010 0.05 Swiss Re AG 412 37,252 0.14 Swisscom AG 31 14,764 0.06 Syngenta AG 54 23,674 0.09
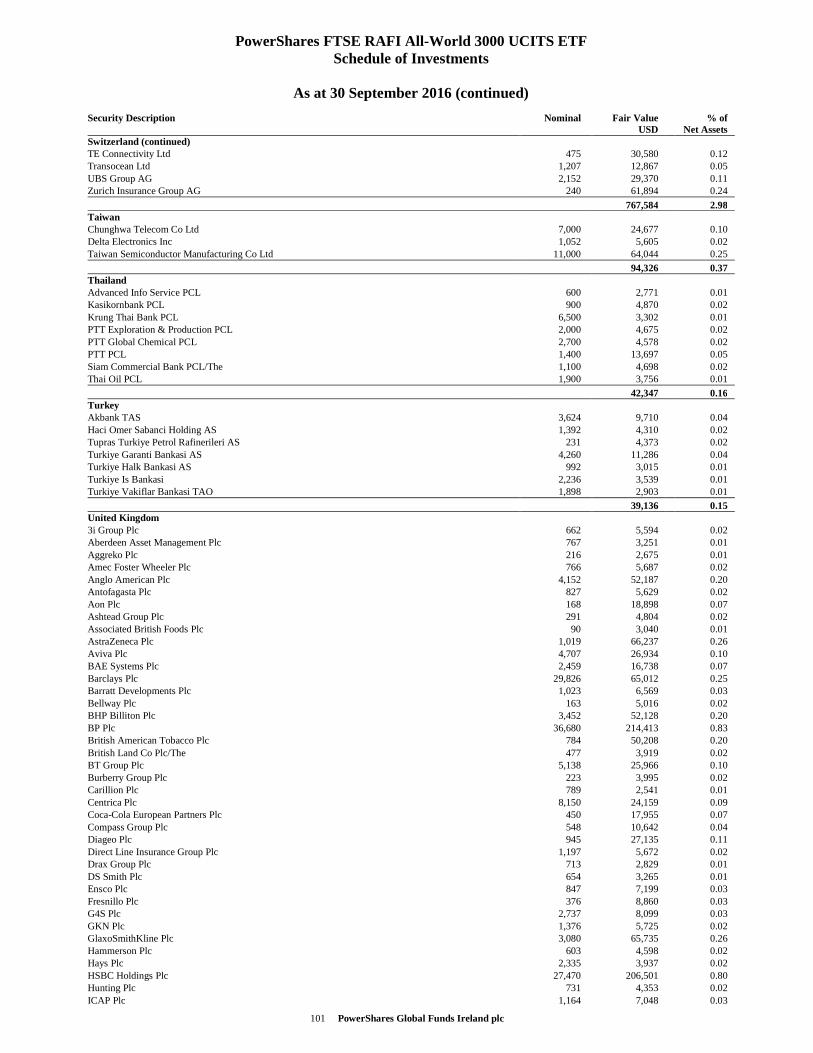
101 PowerShares Global Funds Ireland plc
PowerShares FTSE RAFI All-World 3000 UCITS ETF Schedule of Investments
As at 30 September 2016 (continued)
Security Description Nominal Fair Value USD
% of Net Assets
Switzerland (continued) TE Connectivity Ltd 475 30,580 0.12 Transocean Ltd 1,207 12,867 0.05 UBS Group AG 2,152 29,370 0.11 Zurich Insurance Group AG 240 61,894 0.24
767,584 2.98 Taiwan Chunghwa Telecom Co Ltd 7,000 24,677 0.10 Delta Electronics Inc 1,052 5,605 0.02 Taiwan Semiconductor Manufacturing Co Ltd 11,000 64,044 0.25
94,326 0.37 Thailand Advanced Info Service PCL 600 2,771 0.01 Kasikornbank PCL 900 4,870 0.02 Krung Thai Bank PCL 6,500 3,302 0.01 PTT Exploration & Production PCL 2,000 4,675 0.02 PTT Global Chemical PCL 2,700 4,578 0.02 PTT PCL 1,400 13,697 0.05 Siam Commercial Bank PCL/The 1,100 4,698 0.02 Thai Oil PCL 1,900 3,756 0.01
42,347 0.16 Turkey Akbank TAS 3,624 9,710 0.04 Haci Omer Sabanci Holding AS 1,392 4,310 0.02 Tupras Turkiye Petrol Rafinerileri AS 231 4,373 0.02 Turkiye Garanti Bankasi AS 4,260 11,286 0.04 Turkiye Halk Bankasi AS 992 3,015 0.01 Turkiye Is Bankasi 2,236 3,539 0.01 Turkiye Vakiflar Bankasi TAO 1,898 2,903 0.01
39,136 0.15 United Kingdom 3i Group Plc 662 5,594 0.02 Aberdeen Asset Management Plc 767 3,251 0.01 Aggreko Plc 216 2,675 0.01 Amec Foster Wheeler Plc 766 5,687 0.02 Anglo American Plc 4,152 52,187 0.20 Antofagasta Plc 827 5,629 0.02 Aon Plc 168 18,898 0.07 Ashtead Group Plc 291 4,804 0.02 Associated British Foods Plc 90 3,040 0.01 AstraZeneca Plc 1,019 66,237 0.26 Aviva Plc 4,707 26,934 0.10 BAE Systems Plc 2,459 16,738 0.07 Barclays Plc 29,826 65,012 0.25 Barratt Developments Plc 1,023 6,569 0.03 Bellway Plc 163 5,016 0.02 BHP Billiton Plc 3,452 52,128 0.20 BP Plc 36,680 214,413 0.83 British American Tobacco Plc 784 50,208 0.20 British Land Co Plc/The 477 3,919 0.02 BT Group Plc 5,138 25,966 0.10 Burberry Group Plc 223 3,995 0.02 Carillion Plc 789 2,541 0.01 Centrica Plc 8,150 24,159 0.09 Coca-Cola European Partners Plc 450 17,955 0.07 Compass Group Plc 548 10,642 0.04 Diageo Plc 945 27,135 0.11 Direct Line Insurance Group Plc 1,197 5,672 0.02 Drax Group Plc 713 2,829 0.01 DS Smith Plc 654 3,265 0.01 Ensco Plc 847 7,199 0.03 Fresnillo Plc 376 8,860 0.03 G4S Plc 2,737 8,099 0.03 GKN Plc 1,376 5,725 0.02 GlaxoSmithKline Plc 3,080 65,735 0.26 Hammerson Plc 603 4,598 0.02 Hays Plc 2,335 3,937 0.02 HSBC Holdings Plc 27,470 206,501 0.80 Hunting Plc 731 4,353 0.02 ICAP Plc 1,164 7,048 0.03
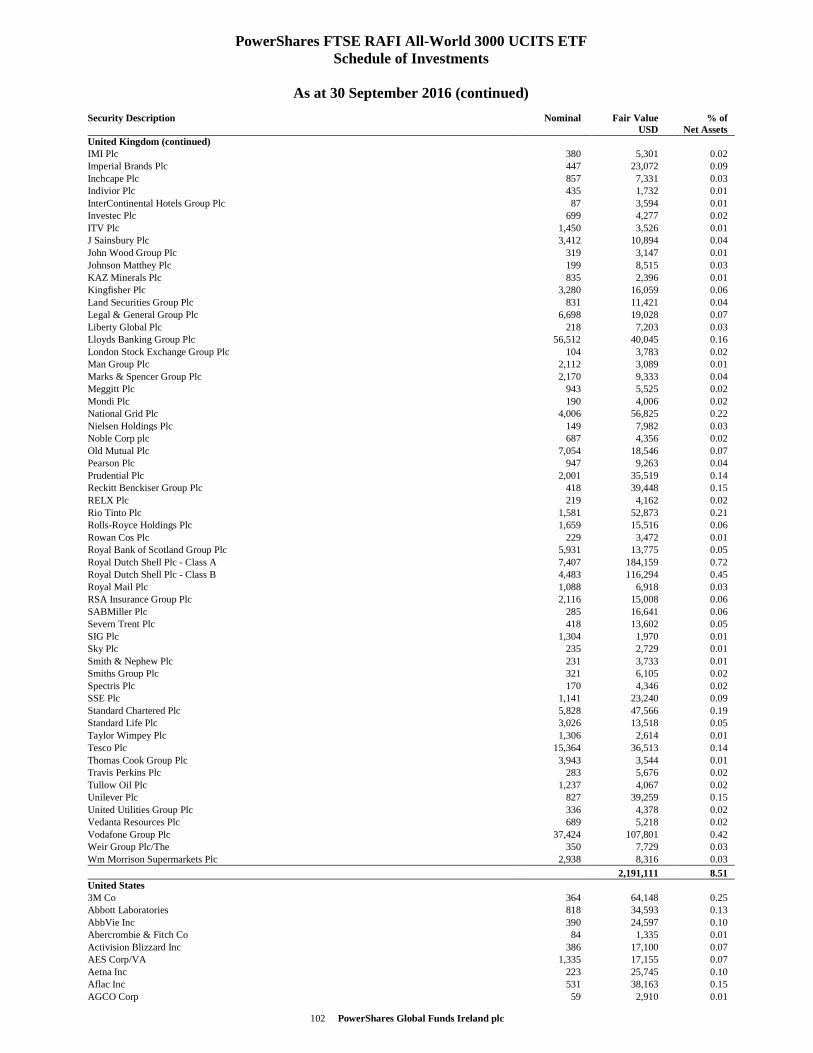
102 PowerShares Global Funds Ireland plc
PowerShares FTSE RAFI All-World 3000 UCITS ETF Schedule of Investments
As at 30 September 2016 (continued)
Security Description Nominal Fair Value USD
% of Net Assets
United Kingdom (continued) IMI Plc 380 5,301 0.02 Imperial Brands Plc 447 23,072 0.09 Inchcape Plc 857 7,331 0.03 Indivior Plc 435 1,732 0.01 InterContinental Hotels Group Plc 87 3,594 0.01 Investec Plc 699 4,277 0.02 ITV Plc 1,450 3,526 0.01 J Sainsbury Plc 3,412 10,894 0.04 John Wood Group Plc 319 3,147 0.01 Johnson Matthey Plc 199 8,515 0.03 KAZ Minerals Plc 835 2,396 0.01 Kingfisher Plc 3,280 16,059 0.06 Land Securities Group Plc 831 11,421 0.04 Legal & General Group Plc 6,698 19,028 0.07 Liberty Global Plc 218 7,203 0.03 Lloyds Banking Group Plc 56,512 40,045 0.16 London Stock Exchange Group Plc 104 3,783 0.02 Man Group Plc 2,112 3,089 0.01 Marks & Spencer Group Plc 2,170 9,333 0.04 Meggitt Plc 943 5,525 0.02 Mondi Plc 190 4,006 0.02 National Grid Plc 4,006 56,825 0.22 Nielsen Holdings Plc 149 7,982 0.03 Noble Corp plc 687 4,356 0.02 Old Mutual Plc 7,054 18,546 0.07 Pearson Plc 947 9,263 0.04 Prudential Plc 2,001 35,519 0.14 Reckitt Benckiser Group Plc 418 39,448 0.15 RELX Plc 219 4,162 0.02 Rio Tinto Plc 1,581 52,873 0.21 Rolls-Royce Holdings Plc 1,659 15,516 0.06 Rowan Cos Plc 229 3,472 0.01 Royal Bank of Scotland Group Plc 5,931 13,775 0.05 Royal Dutch Shell Plc - Class A 7,407 184,159 0.72 Royal Dutch Shell Plc - Class B 4,483 116,294 0.45 Royal Mail Plc 1,088 6,918 0.03 RSA Insurance Group Plc 2,116 15,008 0.06 SABMiller Plc 285 16,641 0.06 Severn Trent Plc 418 13,602 0.05 SIG Plc 1,304 1,970 0.01 Sky Plc 235 2,729 0.01 Smith & Nephew Plc 231 3,733 0.01 Smiths Group Plc 321 6,105 0.02 Spectris Plc 170 4,346 0.02 SSE Plc 1,141 23,240 0.09 Standard Chartered Plc 5,828 47,566 0.19 Standard Life Plc 3,026 13,518 0.05 Taylor Wimpey Plc 1,306 2,614 0.01 Tesco Plc 15,364 36,513 0.14 Thomas Cook Group Plc 3,943 3,544 0.01 Travis Perkins Plc 283 5,676 0.02 Tullow Oil Plc 1,237 4,067 0.02 Unilever Plc 827 39,259 0.15 United Utilities Group Plc 336 4,378 0.02 Vedanta Resources Plc 689 5,218 0.02 Vodafone Group Plc 37,424 107,801 0.42 Weir Group Plc/The 350 7,729 0.03 Wm Morrison Supermarkets Plc 2,938 8,316 0.03
2,191,111 8.51 United States 3M Co 364 64,148 0.25 Abbott Laboratories 818 34,593 0.13 AbbVie Inc 390 24,597 0.10 Abercrombie & Fitch Co 84 1,335 0.01 Activision Blizzard Inc 386 17,100 0.07 AES Corp/VA 1,335 17,155 0.07 Aetna Inc 223 25,745 0.10 Aflac Inc 531 38,163 0.15 AGCO Corp 59 2,910 0.01
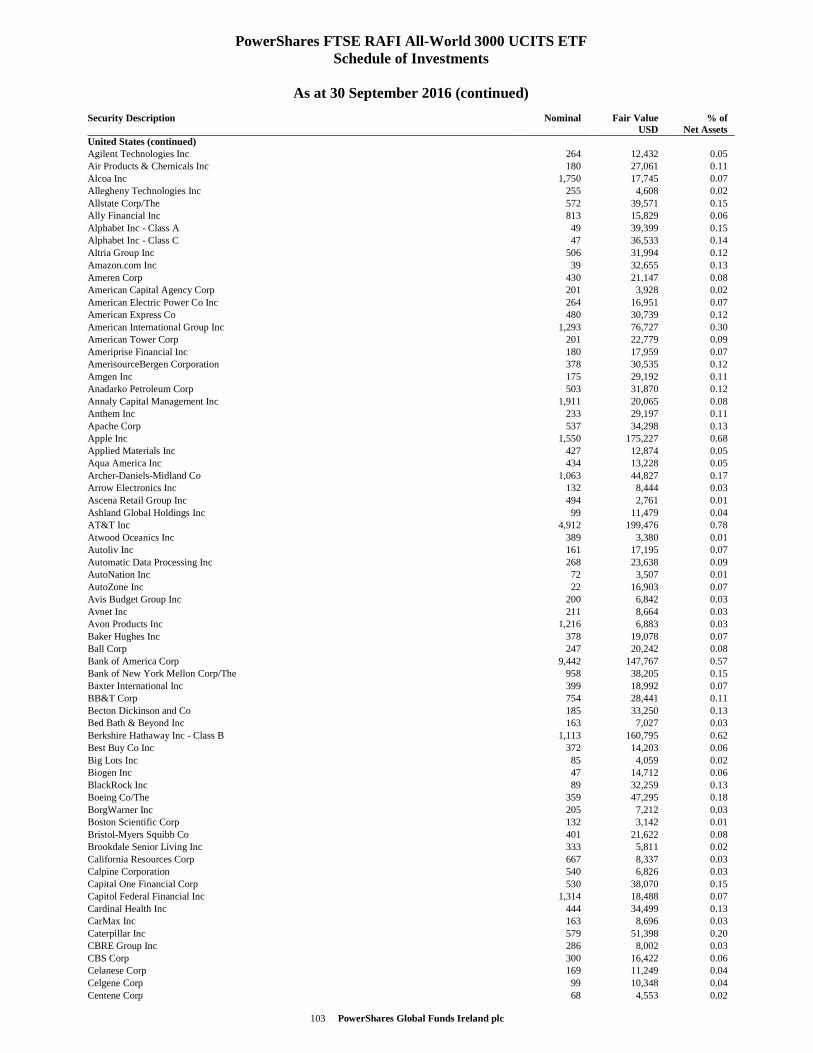
103 PowerShares Global Funds Ireland plc
PowerShares FTSE RAFI All-World 3000 UCITS ETF Schedule of Investments
As at 30 September 2016 (continued)
Security Description Nominal Fair Value USD
% of Net Assets
United States (continued) Agilent Technologies Inc 264 12,432 0.05 Air Products & Chemicals Inc 180 27,061 0.11 Alcoa Inc 1,750 17,745 0.07 Allegheny Technologies Inc 255 4,608 0.02 Allstate Corp/The 572 39,571 0.15 Ally Financial Inc 813 15,829 0.06 Alphabet Inc - Class A 49 39,399 0.15 Alphabet Inc - Class C 47 36,533 0.14 Altria Group Inc 506 31,994 0.12 Amazon.com Inc 39 32,655 0.13 Ameren Corp 430 21,147 0.08 American Capital Agency Corp 201 3,928 0.02 American Electric Power Co Inc 264 16,951 0.07 American Express Co 480 30,739 0.12 American International Group Inc 1,293 76,727 0.30 American Tower Corp 201 22,779 0.09 Ameriprise Financial Inc 180 17,959 0.07 AmerisourceBergen Corporation 378 30,535 0.12 Amgen Inc 175 29,192 0.11 Anadarko Petroleum Corp 503 31,870 0.12 Annaly Capital Management Inc 1,911 20,065 0.08 Anthem Inc 233 29,197 0.11 Apache Corp 537 34,298 0.13 Apple Inc 1,550 175,227 0.68 Applied Materials Inc 427 12,874 0.05 Aqua America Inc 434 13,228 0.05 Archer-Daniels-Midland Co 1,063 44,827 0.17 Arrow Electronics Inc 132 8,444 0.03 Ascena Retail Group Inc 494 2,761 0.01 Ashland Global Holdings Inc 99 11,479 0.04 AT&T Inc 4,912 199,476 0.78 Atwood Oceanics Inc 389 3,380 0.01 Autoliv Inc 161 17,195 0.07 Automatic Data Processing Inc 268 23,638 0.09 AutoNation Inc 72 3,507 0.01 AutoZone Inc 22 16,903 0.07 Avis Budget Group Inc 200 6,842 0.03 Avnet Inc 211 8,664 0.03 Avon Products Inc 1,216 6,883 0.03 Baker Hughes Inc 378 19,078 0.07 Ball Corp 247 20,242 0.08 Bank of America Corp 9,442 147,767 0.57 Bank of New York Mellon Corp/The 958 38,205 0.15 Baxter International Inc 399 18,992 0.07 BB&T Corp 754 28,441 0.11 Becton Dickinson and Co 185 33,250 0.13 Bed Bath & Beyond Inc 163 7,027 0.03 Berkshire Hathaway Inc - Class B 1,113 160,795 0.62 Best Buy Co Inc 372 14,203 0.06 Big Lots Inc 85 4,059 0.02 Biogen Inc 47 14,712 0.06 BlackRock Inc 89 32,259 0.13 Boeing Co/The 359 47,295 0.18 BorgWarner Inc 205 7,212 0.03 Boston Scientific Corp 132 3,142 0.01 Bristol-Myers Squibb Co 401 21,622 0.08 Brookdale Senior Living Inc 333 5,811 0.02 California Resources Corp 667 8,337 0.03 Calpine Corporation 540 6,826 0.03 Capital One Financial Corp 530 38,070 0.15 Capitol Federal Financial Inc 1,314 18,488 0.07 Cardinal Health Inc 444 34,499 0.13 CarMax Inc 163 8,696 0.03 Caterpillar Inc 579 51,398 0.20 CBRE Group Inc 286 8,002 0.03 CBS Corp 300 16,422 0.06 Celanese Corp 169 11,249 0.04 Celgene Corp 99 10,348 0.04 Centene Corp 68 4,553 0.02
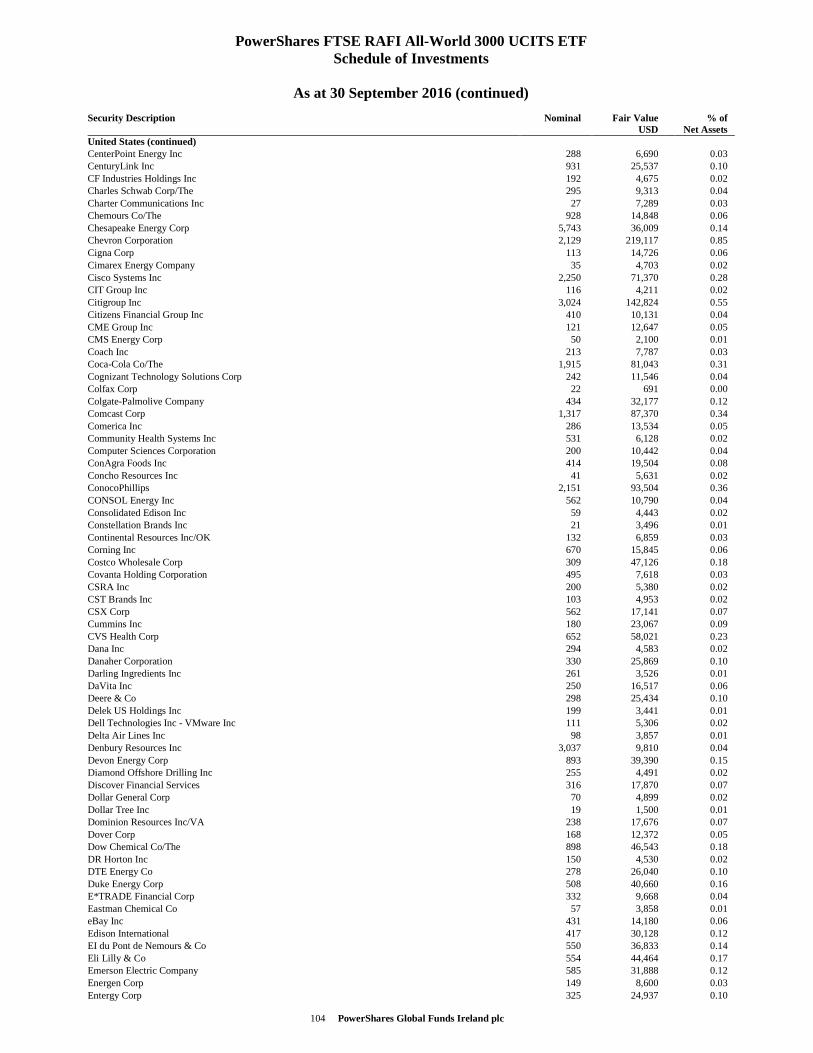
104 PowerShares Global Funds Ireland plc
PowerShares FTSE RAFI All-World 3000 UCITS ETF Schedule of Investments
As at 30 September 2016 (continued)
Security Description Nominal Fair Value USD
% of Net Assets
United States (continued) CenterPoint Energy Inc 288 6,690 0.03 CenturyLink Inc 931 25,537 0.10 CF Industries Holdings Inc 192 4,675 0.02 Charles Schwab Corp/The 295 9,313 0.04 Charter Communications Inc 27 7,289 0.03 Chemours Co/The 928 14,848 0.06 Chesapeake Energy Corp 5,743 36,009 0.14 Chevron Corporation 2,129 219,117 0.85 Cigna Corp 113 14,726 0.06 Cimarex Energy Company 35 4,703 0.02 Cisco Systems Inc 2,250 71,370 0.28 CIT Group Inc 116 4,211 0.02 Citigroup Inc 3,024 142,824 0.55 Citizens Financial Group Inc 410 10,131 0.04 CME Group Inc 121 12,647 0.05 CMS Energy Corp 50 2,100 0.01 Coach Inc 213 7,787 0.03 Coca-Cola Co/The 1,915 81,043 0.31 Cognizant Technology Solutions Corp 242 11,546 0.04 Colfax Corp 22 691 0.00 Colgate-Palmolive Company 434 32,177 0.12 Comcast Corp 1,317 87,370 0.34 Comerica Inc 286 13,534 0.05 Community Health Systems Inc 531 6,128 0.02 Computer Sciences Corporation 200 10,442 0.04 ConAgra Foods Inc 414 19,504 0.08 Concho Resources Inc 41 5,631 0.02 ConocoPhillips 2,151 93,504 0.36 CONSOL Energy Inc 562 10,790 0.04 Consolidated Edison Inc 59 4,443 0.02 Constellation Brands Inc 21 3,496 0.01 Continental Resources Inc/OK 132 6,859 0.03 Corning Inc 670 15,845 0.06 Costco Wholesale Corp 309 47,126 0.18 Covanta Holding Corporation 495 7,618 0.03 CSRA Inc 200 5,380 0.02 CST Brands Inc 103 4,953 0.02 CSX Corp 562 17,141 0.07 Cummins Inc 180 23,067 0.09 CVS Health Corp 652 58,021 0.23 Dana Inc 294 4,583 0.02 Danaher Corporation 330 25,869 0.10 Darling Ingredients Inc 261 3,526 0.01 DaVita Inc 250 16,517 0.06 Deere & Co 298 25,434 0.10 Delek US Holdings Inc 199 3,441 0.01 Dell Technologies Inc - VMware Inc 111 5,306 0.02 Delta Air Lines Inc 98 3,857 0.01 Denbury Resources Inc 3,037 9,810 0.04 Devon Energy Corp 893 39,390 0.15 Diamond Offshore Drilling Inc 255 4,491 0.02 Discover Financial Services 316 17,870 0.07 Dollar General Corp 70 4,899 0.02 Dollar Tree Inc 19 1,500 0.01 Dominion Resources Inc/VA 238 17,676 0.07 Dover Corp 168 12,372 0.05 Dow Chemical Co/The 898 46,543 0.18 DR Horton Inc 150 4,530 0.02 DTE Energy Co 278 26,040 0.10 Duke Energy Corp 508 40,660 0.16 E*TRADE Financial Corp 332 9,668 0.04 Eastman Chemical Co 57 3,858 0.01 eBay Inc 431 14,180 0.06 Edison International 417 30,128 0.12 EI du Pont de Nemours & Co 550 36,833 0.14 Eli Lilly & Co 554 44,464 0.17 Emerson Electric Company 585 31,888 0.12 Energen Corp 149 8,600 0.03 Entergy Corp 325 24,937 0.10
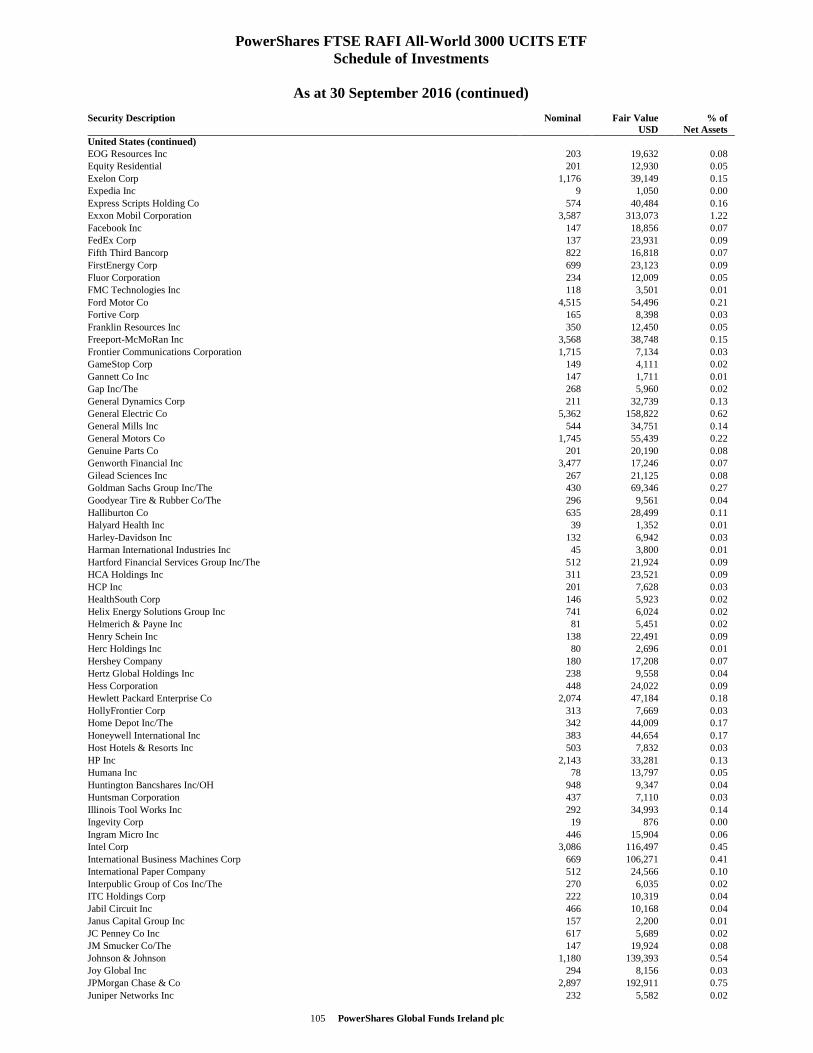
105 PowerShares Global Funds Ireland plc
PowerShares FTSE RAFI All-World 3000 UCITS ETF Schedule of Investments
As at 30 September 2016 (continued)
Security Description Nominal Fair Value USD
% of Net Assets
United States (continued) EOG Resources Inc 203 19,632 0.08 Equity Residential 201 12,930 0.05 Exelon Corp 1,176 39,149 0.15 Expedia Inc 9 1,050 0.00 Express Scripts Holding Co 574 40,484 0.16 Exxon Mobil Corporation 3,587 313,073 1.22 Facebook Inc 147 18,856 0.07 FedEx Corp 137 23,931 0.09 Fifth Third Bancorp 822 16,818 0.07 FirstEnergy Corp 699 23,123 0.09 Fluor Corporation 234 12,009 0.05 FMC Technologies Inc 118 3,501 0.01 Ford Motor Co 4,515 54,496 0.21 Fortive Corp 165 8,398 0.03 Franklin Resources Inc 350 12,450 0.05 Freeport-McMoRan Inc 3,568 38,748 0.15 Frontier Communications Corporation 1,715 7,134 0.03 GameStop Corp 149 4,111 0.02 Gannett Co Inc 147 1,711 0.01 Gap Inc/The 268 5,960 0.02 General Dynamics Corp 211 32,739 0.13 General Electric Co 5,362 158,822 0.62 General Mills Inc 544 34,751 0.14 General Motors Co 1,745 55,439 0.22 Genuine Parts Co 201 20,190 0.08 Genworth Financial Inc 3,477 17,246 0.07 Gilead Sciences Inc 267 21,125 0.08 Goldman Sachs Group Inc/The 430 69,346 0.27 Goodyear Tire & Rubber Co/The 296 9,561 0.04 Halliburton Co 635 28,499 0.11 Halyard Health Inc 39 1,352 0.01 Harley-Davidson Inc 132 6,942 0.03 Harman International Industries Inc 45 3,800 0.01 Hartford Financial Services Group Inc/The 512 21,924 0.09 HCA Holdings Inc 311 23,521 0.09 HCP Inc 201 7,628 0.03 HealthSouth Corp 146 5,923 0.02 Helix Energy Solutions Group Inc 741 6,024 0.02 Helmerich & Payne Inc 81 5,451 0.02 Henry Schein Inc 138 22,491 0.09 Herc Holdings Inc 80 2,696 0.01 Hershey Company 180 17,208 0.07 Hertz Global Holdings Inc 238 9,558 0.04 Hess Corporation 448 24,022 0.09 Hewlett Packard Enterprise Co 2,074 47,184 0.18 HollyFrontier Corp 313 7,669 0.03 Home Depot Inc/The 342 44,009 0.17 Honeywell International Inc 383 44,654 0.17 Host Hotels & Resorts Inc 503 7,832 0.03 HP Inc 2,143 33,281 0.13 Humana Inc 78 13,797 0.05 Huntington Bancshares Inc/OH 948 9,347 0.04 Huntsman Corporation 437 7,110 0.03 Illinois Tool Works Inc 292 34,993 0.14 Ingevity Corp 19 876 0.00 Ingram Micro Inc 446 15,904 0.06 Intel Corp 3,086 116,497 0.45 International Business Machines Corp 669 106,271 0.41 International Paper Company 512 24,566 0.10 Interpublic Group of Cos Inc/The 270 6,035 0.02 ITC Holdings Corp 222 10,319 0.04 Jabil Circuit Inc 466 10,168 0.04 Janus Capital Group Inc 157 2,200 0.01 JC Penney Co Inc 617 5,689 0.02 JM Smucker Co/The 147 19,924 0.08 Johnson & Johnson 1,180 139,393 0.54 Joy Global Inc 294 8,156 0.03 JPMorgan Chase & Co 2,897 192,911 0.75 Juniper Networks Inc 232 5,582 0.02
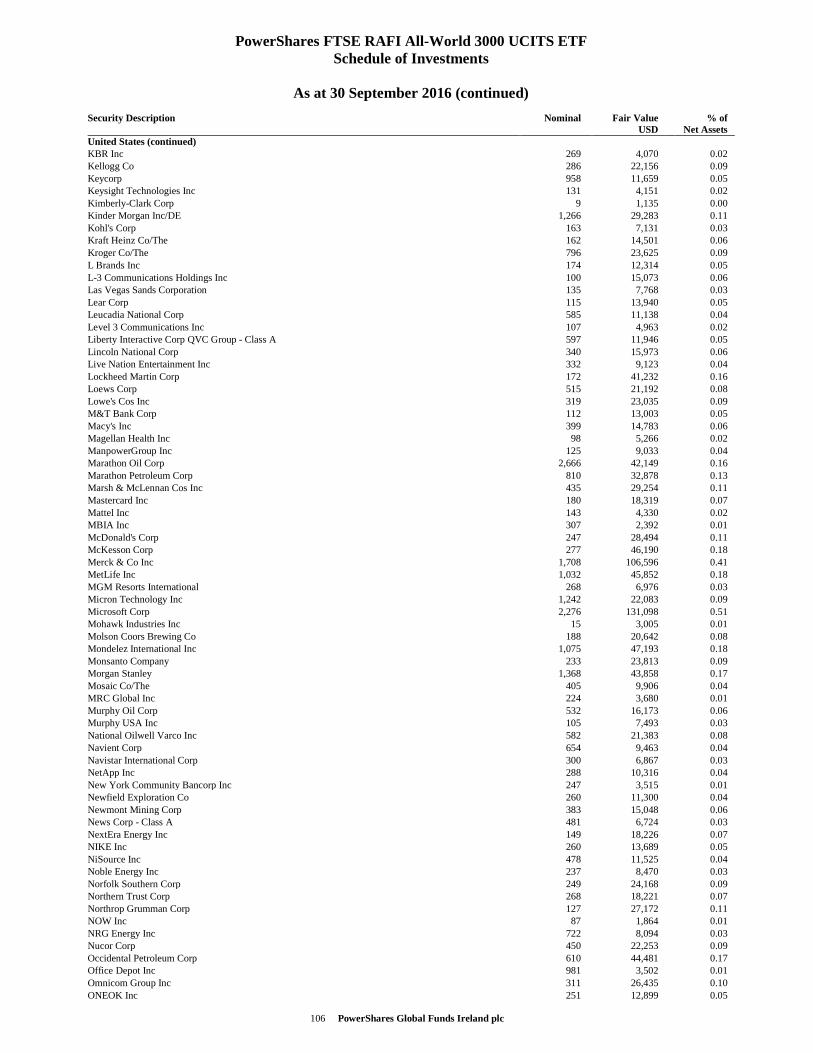
106 PowerShares Global Funds Ireland plc
PowerShares FTSE RAFI All-World 3000 UCITS ETF Schedule of Investments
As at 30 September 2016 (continued)
Security Description Nominal Fair Value USD
% of Net Assets
United States (continued) KBR Inc 269 4,070 0.02 Kellogg Co 286 22,156 0.09 Keycorp 958 11,659 0.05 Keysight Technologies Inc 131 4,151 0.02 Kimberly-Clark Corp 9 1,135 0.00 Kinder Morgan Inc/DE 1,266 29,283 0.11 Kohl's Corp 163 7,131 0.03 Kraft Heinz Co/The 162 14,501 0.06 Kroger Co/The 796 23,625 0.09 L Brands Inc 174 12,314 0.05 L-3 Communications Holdings Inc 100 15,073 0.06 Las Vegas Sands Corporation 135 7,768 0.03 Lear Corp 115 13,940 0.05 Leucadia National Corp 585 11,138 0.04 Level 3 Communications Inc 107 4,963 0.02 Liberty Interactive Corp QVC Group - Class A 597 11,946 0.05 Lincoln National Corp 340 15,973 0.06 Live Nation Entertainment Inc 332 9,123 0.04 Lockheed Martin Corp 172 41,232 0.16 Loews Corp 515 21,192 0.08 Lowe's Cos Inc 319 23,035 0.09 M&T Bank Corp 112 13,003 0.05 Macy's Inc 399 14,783 0.06 Magellan Health Inc 98 5,266 0.02 ManpowerGroup Inc 125 9,033 0.04 Marathon Oil Corp 2,666 42,149 0.16 Marathon Petroleum Corp 810 32,878 0.13 Marsh & McLennan Cos Inc 435 29,254 0.11 Mastercard Inc 180 18,319 0.07 Mattel Inc 143 4,330 0.02 MBIA Inc 307 2,392 0.01 McDonald's Corp 247 28,494 0.11 McKesson Corp 277 46,190 0.18 Merck & Co Inc 1,708 106,596 0.41 MetLife Inc 1,032 45,852 0.18 MGM Resorts International 268 6,976 0.03 Micron Technology Inc 1,242 22,083 0.09 Microsoft Corp 2,276 131,098 0.51 Mohawk Industries Inc 15 3,005 0.01 Molson Coors Brewing Co 188 20,642 0.08 Mondelez International Inc 1,075 47,193 0.18 Monsanto Company 233 23,813 0.09 Morgan Stanley 1,368 43,858 0.17 Mosaic Co/The 405 9,906 0.04 MRC Global Inc 224 3,680 0.01 Murphy Oil Corp 532 16,173 0.06 Murphy USA Inc 105 7,493 0.03 National Oilwell Varco Inc 582 21,383 0.08 Navient Corp 654 9,463 0.04 Navistar International Corp 300 6,867 0.03 NetApp Inc 288 10,316 0.04 New York Community Bancorp Inc 247 3,515 0.01 Newfield Exploration Co 260 11,300 0.04 Newmont Mining Corp 383 15,048 0.06 News Corp - Class A 481 6,724 0.03 NextEra Energy Inc 149 18,226 0.07 NIKE Inc 260 13,689 0.05 NiSource Inc 478 11,525 0.04 Noble Energy Inc 237 8,470 0.03 Norfolk Southern Corp 249 24,168 0.09 Northern Trust Corp 268 18,221 0.07 Northrop Grumman Corp 127 27,172 0.11 NOW Inc 87 1,864 0.01 NRG Energy Inc 722 8,094 0.03 Nucor Corp 450 22,253 0.09 Occidental Petroleum Corp 610 44,481 0.17 Office Depot Inc 981 3,502 0.01 Omnicom Group Inc 311 26,435 0.10 ONEOK Inc 251 12,899 0.05
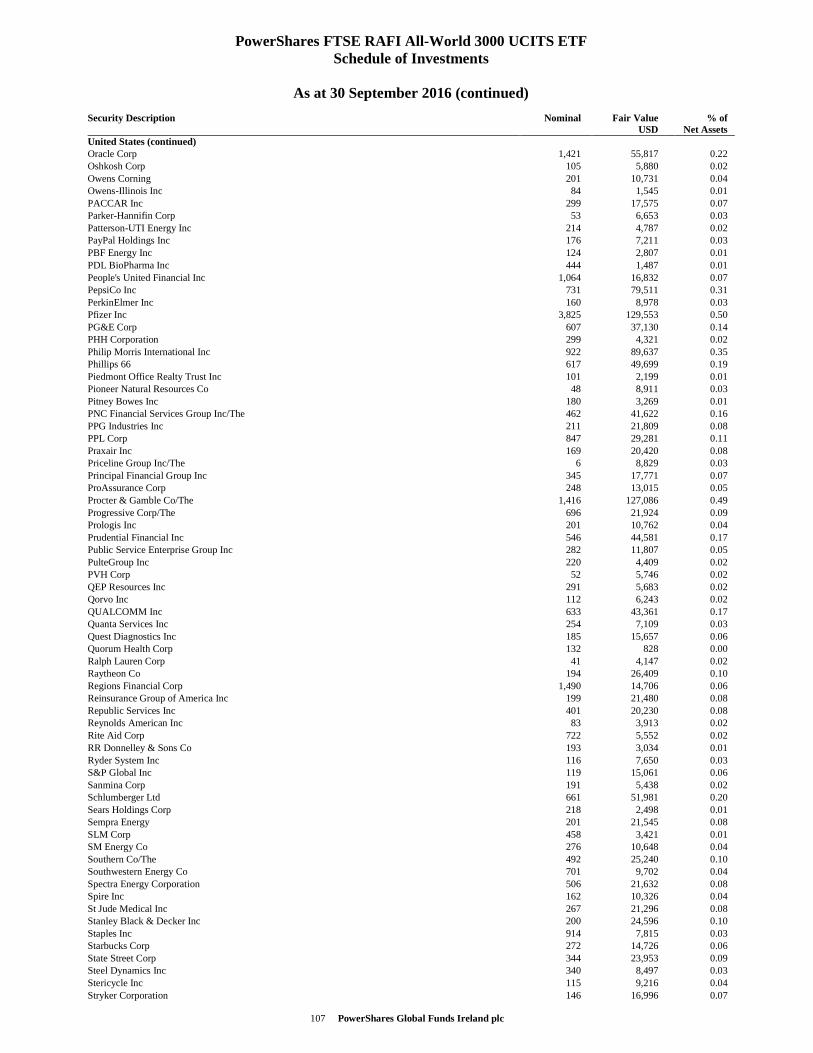
107 PowerShares Global Funds Ireland plc
PowerShares FTSE RAFI All-World 3000 UCITS ETF Schedule of Investments
As at 30 September 2016 (continued)
Security Description Nominal Fair Value USD
% of Net Assets
United States (continued) Oracle Corp 1,421 55,817 0.22 Oshkosh Corp 105 5,880 0.02 Owens Corning 201 10,731 0.04 Owens-Illinois Inc 84 1,545 0.01 PACCAR Inc 299 17,575 0.07 Parker-Hannifin Corp 53 6,653 0.03 Patterson-UTI Energy Inc 214 4,787 0.02 PayPal Holdings Inc 176 7,211 0.03 PBF Energy Inc 124 2,807 0.01 PDL BioPharma Inc 444 1,487 0.01 People's United Financial Inc 1,064 16,832 0.07 PepsiCo Inc 731 79,511 0.31 PerkinElmer Inc 160 8,978 0.03 Pfizer Inc 3,825 129,553 0.50 PG&E Corp 607 37,130 0.14 PHH Corporation 299 4,321 0.02 Philip Morris International Inc 922 89,637 0.35 Phillips 66 617 49,699 0.19 Piedmont Office Realty Trust Inc 101 2,199 0.01 Pioneer Natural Resources Co 48 8,911 0.03 Pitney Bowes Inc 180 3,269 0.01 PNC Financial Services Group Inc/The 462 41,622 0.16 PPG Industries Inc 211 21,809 0.08 PPL Corp 847 29,281 0.11 Praxair Inc 169 20,420 0.08 Priceline Group Inc/The 6 8,829 0.03 Principal Financial Group Inc 345 17,771 0.07 ProAssurance Corp 248 13,015 0.05 Procter & Gamble Co/The 1,416 127,086 0.49 Progressive Corp/The 696 21,924 0.09 Prologis Inc 201 10,762 0.04 Prudential Financial Inc 546 44,581 0.17 Public Service Enterprise Group Inc 282 11,807 0.05 PulteGroup Inc 220 4,409 0.02 PVH Corp 52 5,746 0.02 QEP Resources Inc 291 5,683 0.02 Qorvo Inc 112 6,243 0.02 QUALCOMM Inc 633 43,361 0.17 Quanta Services Inc 254 7,109 0.03 Quest Diagnostics Inc 185 15,657 0.06 Quorum Health Corp 132 828 0.00 Ralph Lauren Corp 41 4,147 0.02 Raytheon Co 194 26,409 0.10 Regions Financial Corp 1,490 14,706 0.06 Reinsurance Group of America Inc 199 21,480 0.08 Republic Services Inc 401 20,230 0.08 Reynolds American Inc 83 3,913 0.02 Rite Aid Corp 722 5,552 0.02 RR Donnelley & Sons Co 193 3,034 0.01 Ryder System Inc 116 7,650 0.03 S&P Global Inc 119 15,061 0.06 Sanmina Corp 191 5,438 0.02 Schlumberger Ltd 661 51,981 0.20 Sears Holdings Corp 218 2,498 0.01 Sempra Energy 201 21,545 0.08 SLM Corp 458 3,421 0.01 SM Energy Co 276 10,648 0.04 Southern Co/The 492 25,240 0.10 Southwestern Energy Co 701 9,702 0.04 Spectra Energy Corporation 506 21,632 0.08 Spire Inc 162 10,326 0.04 St Jude Medical Inc 267 21,296 0.08 Stanley Black & Decker Inc 200 24,596 0.10 Staples Inc 914 7,815 0.03 Starbucks Corp 272 14,726 0.06 State Street Corp 344 23,953 0.09 Steel Dynamics Inc 340 8,497 0.03 Stericycle Inc 115 9,216 0.04 Stryker Corporation 146 16,996 0.07
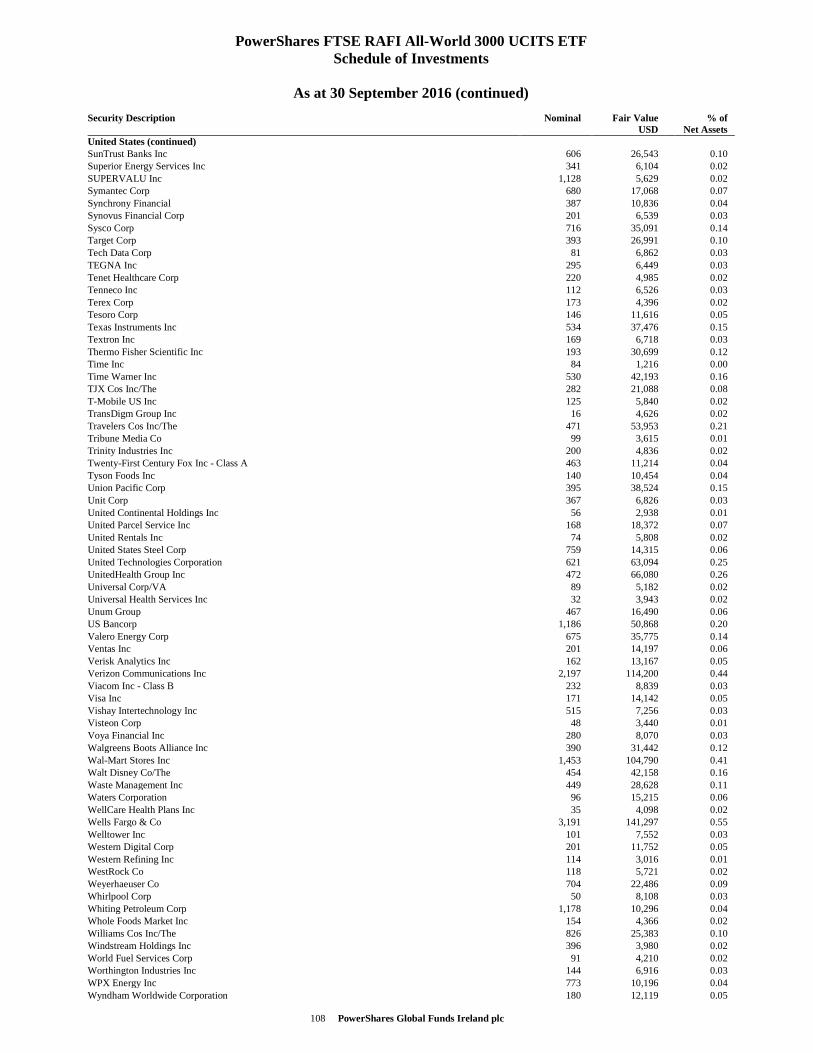
108 PowerShares Global Funds Ireland plc
PowerShares FTSE RAFI All-World 3000 UCITS ETF Schedule of Investments
As at 30 September 2016 (continued)
Security Description Nominal Fair Value USD
% of Net Assets
United States (continued) SunTrust Banks Inc 606 26,543 0.10 Superior Energy Services Inc 341 6,104 0.02 SUPERVALU Inc 1,128 5,629 0.02 Symantec Corp 680 17,068 0.07 Synchrony Financial 387 10,836 0.04 Synovus Financial Corp 201 6,539 0.03 Sysco Corp 716 35,091 0.14 Target Corp 393 26,991 0.10 Tech Data Corp 81 6,862 0.03 TEGNA Inc 295 6,449 0.03 Tenet Healthcare Corp 220 4,985 0.02 Tenneco Inc 112 6,526 0.03 Terex Corp 173 4,396 0.02 Tesoro Corp 146 11,616 0.05 Texas Instruments Inc 534 37,476 0.15 Textron Inc 169 6,718 0.03 Thermo Fisher Scientific Inc 193 30,699 0.12 Time Inc 84 1,216 0.00 Time Warner Inc 530 42,193 0.16 TJX Cos Inc/The 282 21,088 0.08 T-Mobile US Inc 125 5,840 0.02 TransDigm Group Inc 16 4,626 0.02 Travelers Cos Inc/The 471 53,953 0.21 Tribune Media Co 99 3,615 0.01 Trinity Industries Inc 200 4,836 0.02 Twenty-First Century Fox Inc - Class A 463 11,214 0.04 Tyson Foods Inc 140 10,454 0.04 Union Pacific Corp 395 38,524 0.15 Unit Corp 367 6,826 0.03 United Continental Holdings Inc 56 2,938 0.01 United Parcel Service Inc 168 18,372 0.07 United Rentals Inc 74 5,808 0.02 United States Steel Corp 759 14,315 0.06 United Technologies Corporation 621 63,094 0.25 UnitedHealth Group Inc 472 66,080 0.26 Universal Corp/VA 89 5,182 0.02 Universal Health Services Inc 32 3,943 0.02 Unum Group 467 16,490 0.06 US Bancorp 1,186 50,868 0.20 Valero Energy Corp 675 35,775 0.14 Ventas Inc 201 14,197 0.06 Verisk Analytics Inc 162 13,167 0.05 Verizon Communications Inc 2,197 114,200 0.44 Viacom Inc - Class B 232 8,839 0.03 Visa Inc 171 14,142 0.05 Vishay Intertechnology Inc 515 7,256 0.03 Visteon Corp 48 3,440 0.01 Voya Financial Inc 280 8,070 0.03 Walgreens Boots Alliance Inc 390 31,442 0.12 Wal-Mart Stores Inc 1,453 104,790 0.41 Walt Disney Co/The 454 42,158 0.16 Waste Management Inc 449 28,628 0.11 Waters Corporation 96 15,215 0.06 WellCare Health Plans Inc 35 4,098 0.02 Wells Fargo & Co 3,191 141,297 0.55 Welltower Inc 101 7,552 0.03 Western Digital Corp 201 11,752 0.05 Western Refining Inc 114 3,016 0.01 WestRock Co 118 5,721 0.02 Weyerhaeuser Co 704 22,486 0.09 Whirlpool Corp 50 8,108 0.03 Whiting Petroleum Corp 1,178 10,296 0.04 Whole Foods Market Inc 154 4,366 0.02 Williams Cos Inc/The 826 25,383 0.10 Windstream Holdings Inc 396 3,980 0.02 World Fuel Services Corp 91 4,210 0.02 Worthington Industries Inc 144 6,916 0.03 WPX Energy Inc 773 10,196 0.04 Wyndham Worldwide Corporation 180 12,119 0.05
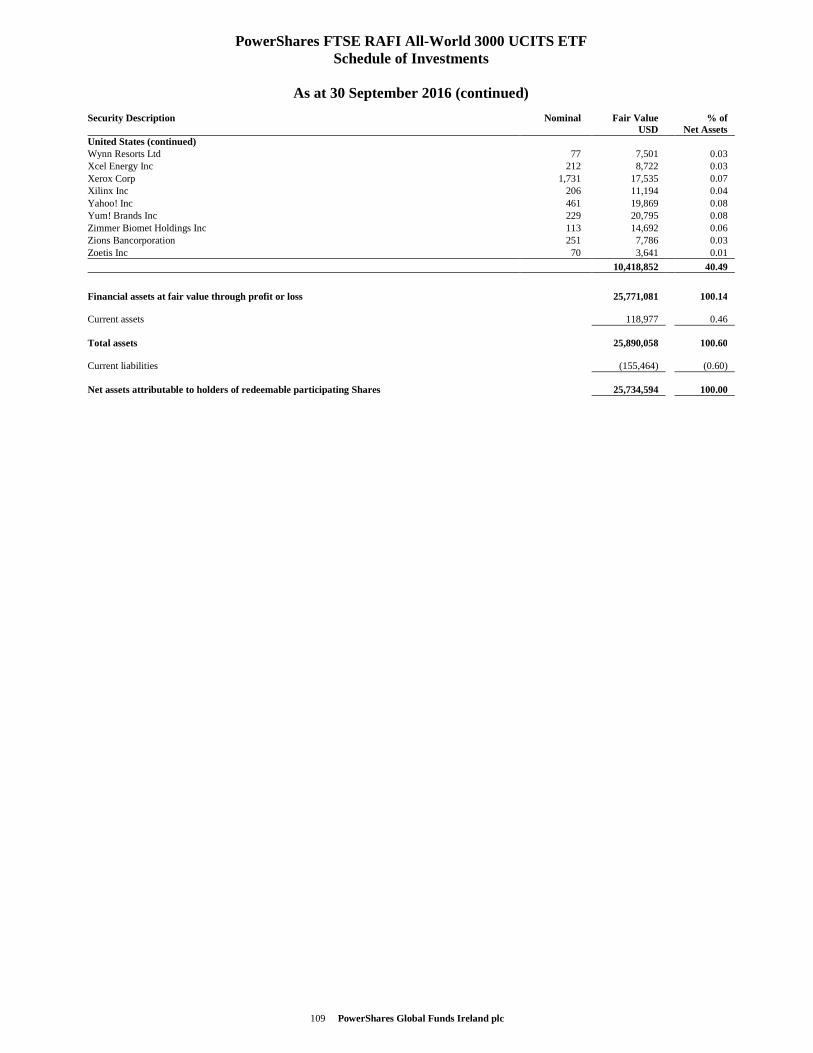
109 PowerShares Global Funds Ireland plc
PowerShares FTSE RAFI All-World 3000 UCITS ETF Schedule of Investments
As at 30 September 2016 (continued)
Security Description Nominal Fair Value USD
% of Net Assets
United States (continued) Wynn Resorts Ltd 77 7,501 0.03 Xcel Energy Inc 212 8,722 0.03 Xerox Corp 1,731 17,535 0.07 Xilinx Inc 206 11,194 0.04 Yahoo! Inc 461 19,869 0.08 Yum! Brands Inc 229 20,795 0.08 Zimmer Biomet Holdings Inc 113 14,692 0.06 Zions Bancorporation 251 7,786 0.03 Zoetis Inc 70 3,641 0.01
10,418,852 40.49
Financial assets at fair value through profit or loss 25,771,081 100.14 Current assets 118,977 0.46 Total assets 25,890,058 100.60 Current liabilities (155,464) (0.60) Net assets attributable to holders of redeemable participating Shares 25,734,594 100.00
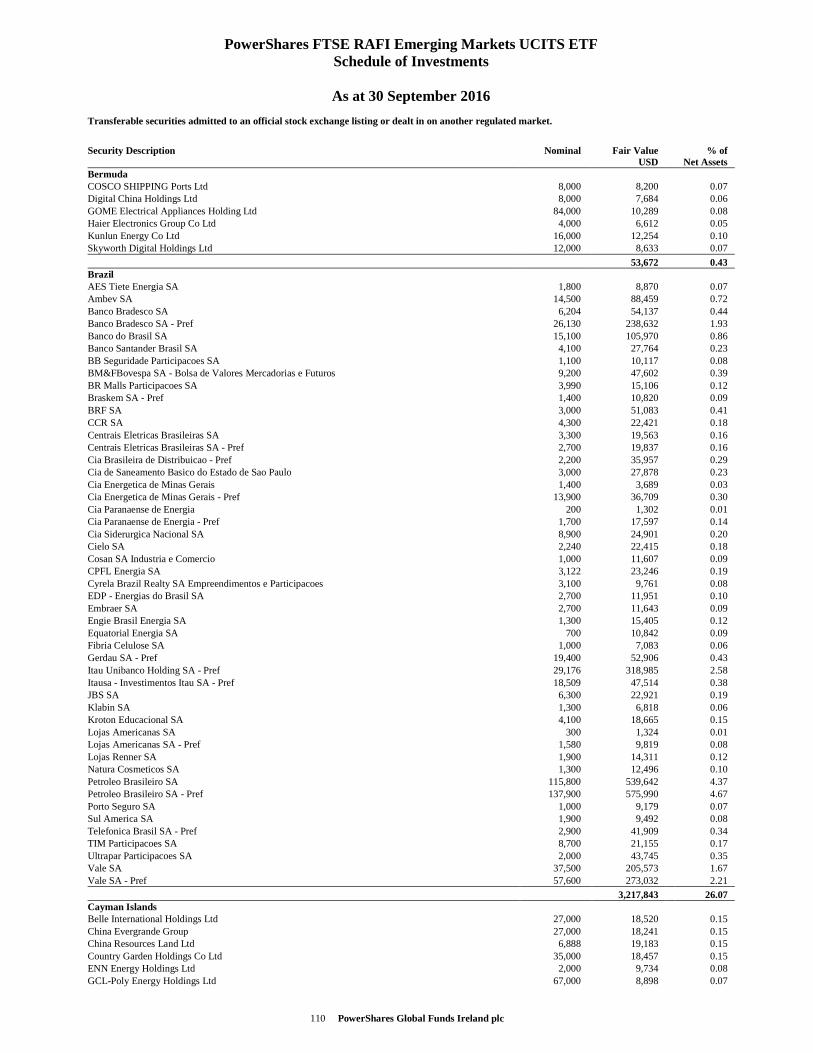
110 PowerShares Global Funds Ireland plc
PowerShares FTSE RAFI Emerging Markets UCITS ETF Schedule of Investments
As at 30 September 2016
Transferable securities admitted to an official stock exchange listing or dealt in on another regulated market.
Security Description Nominal Fair Value USD
% of Net Assets
Bermuda COSCO SHIPPING Ports Ltd 8,000 8,200 0.07 Digital China Holdings Ltd 8,000 7,684 0.06 GOME Electrical Appliances Holding Ltd 84,000 10,289 0.08 Haier Electronics Group Co Ltd 4,000 6,612 0.05 Kunlun Energy Co Ltd 16,000 12,254 0.10 Skyworth Digital Holdings Ltd 12,000 8,633 0.07
53,672 0.43 Brazil AES Tiete Energia SA 1,800 8,870 0.07 Ambev SA 14,500 88,459 0.72 Banco Bradesco SA 6,204 54,137 0.44 Banco Bradesco SA - Pref 26,130 238,632 1.93 Banco do Brasil SA 15,100 105,970 0.86 Banco Santander Brasil SA 4,100 27,764 0.23 BB Seguridade Participacoes SA 1,100 10,117 0.08 BM&FBovespa SA - Bolsa de Valores Mercadorias e Futuros 9,200 47,602 0.39 BR Malls Participacoes SA 3,990 15,106 0.12 Braskem SA - Pref 1,400 10,820 0.09 BRF SA 3,000 51,083 0.41 CCR SA 4,300 22,421 0.18 Centrais Eletricas Brasileiras SA 3,300 19,563 0.16 Centrais Eletricas Brasileiras SA - Pref 2,700 19,837 0.16 Cia Brasileira de Distribuicao - Pref 2,200 35,957 0.29 Cia de Saneamento Basico do Estado de Sao Paulo 3,000 27,878 0.23 Cia Energetica de Minas Gerais 1,400 3,689 0.03 Cia Energetica de Minas Gerais - Pref 13,900 36,709 0.30 Cia Paranaense de Energia 200 1,302 0.01 Cia Paranaense de Energia - Pref 1,700 17,597 0.14 Cia Siderurgica Nacional SA 8,900 24,901 0.20 Cielo SA 2,240 22,415 0.18 Cosan SA Industria e Comercio 1,000 11,607 0.09 CPFL Energia SA 3,122 23,246 0.19 Cyrela Brazil Realty SA Empreendimentos e Participacoes 3,100 9,761 0.08 EDP - Energias do Brasil SA 2,700 11,951 0.10 Embraer SA 2,700 11,643 0.09 Engie Brasil Energia SA 1,300 15,405 0.12 Equatorial Energia SA 700 10,842 0.09 Fibria Celulose SA 1,000 7,083 0.06 Gerdau SA - Pref 19,400 52,906 0.43 Itau Unibanco Holding SA - Pref 29,176 318,985 2.58 Itausa - Investimentos Itau SA - Pref 18,509 47,514 0.38 JBS SA 6,300 22,921 0.19 Klabin SA 1,300 6,818 0.06 Kroton Educacional SA 4,100 18,665 0.15 Lojas Americanas SA 300 1,324 0.01 Lojas Americanas SA - Pref 1,580 9,819 0.08 Lojas Renner SA 1,900 14,311 0.12 Natura Cosmeticos SA 1,300 12,496 0.10 Petroleo Brasileiro SA 115,800 539,642 4.37 Petroleo Brasileiro SA - Pref 137,900 575,990 4.67 Porto Seguro SA 1,000 9,179 0.07 Sul America SA 1,900 9,492 0.08 Telefonica Brasil SA - Pref 2,900 41,909 0.34 TIM Participacoes SA 8,700 21,155 0.17 Ultrapar Participacoes SA 2,000 43,745 0.35 Vale SA 37,500 205,573 1.67 Vale SA - Pref 57,600 273,032 2.21
3,217,843 26.07 Cayman Islands Belle International Holdings Ltd 27,000 18,520 0.15 China Evergrande Group 27,000 18,241 0.15 China Resources Land Ltd 6,888 19,183 0.15 Country Garden Holdings Co Ltd 35,000 18,457 0.15 ENN Energy Holdings Ltd 2,000 9,734 0.08 GCL-Poly Energy Holdings Ltd 67,000 8,898 0.07
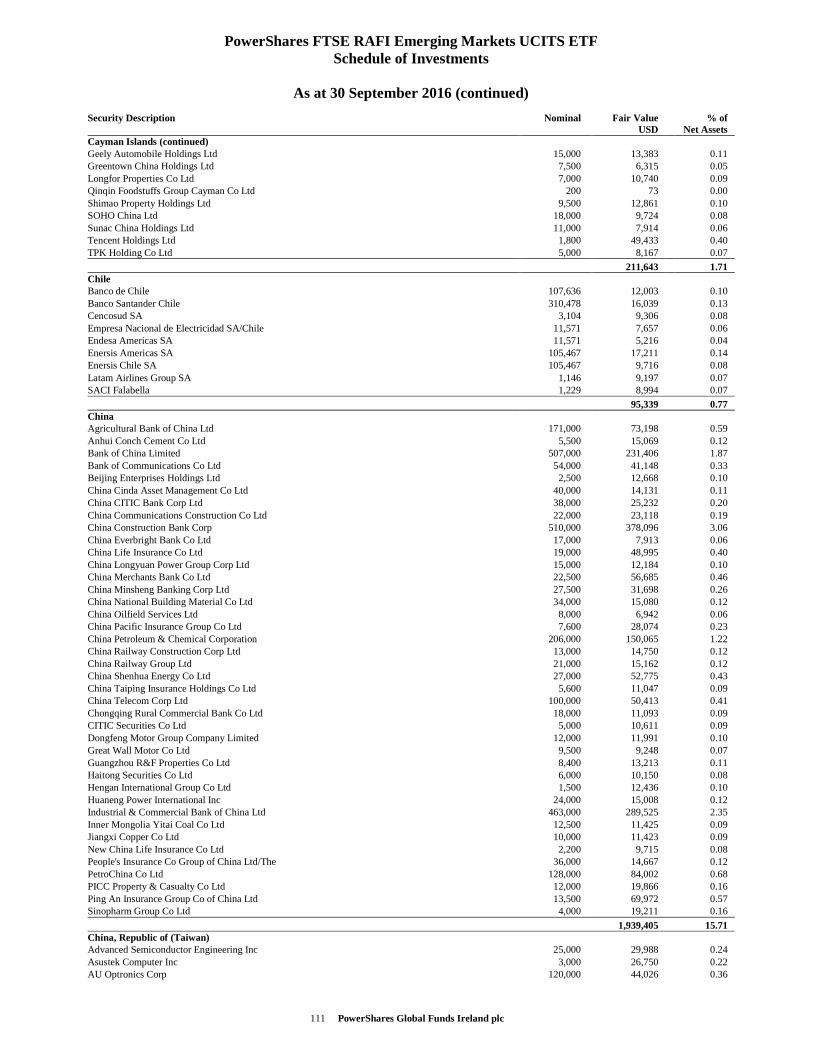
111 PowerShares Global Funds Ireland plc
PowerShares FTSE RAFI Emerging Markets UCITS ETF Schedule of Investments
As at 30 September 2016 (continued)
Security Description Nominal Fair Value USD
% of Net Assets
Cayman Islands (continued) Geely Automobile Holdings Ltd 15,000 13,383 0.11 Greentown China Holdings Ltd 7,500 6,315 0.05 Longfor Properties Co Ltd 7,000 10,740 0.09 Qinqin Foodstuffs Group Cayman Co Ltd 200 73 0.00 Shimao Property Holdings Ltd 9,500 12,861 0.10 SOHO China Ltd 18,000 9,724 0.08 Sunac China Holdings Ltd 11,000 7,914 0.06 Tencent Holdings Ltd 1,800 49,433 0.40 TPK Holding Co Ltd 5,000 8,167 0.07
211,643 1.71 Chile Banco de Chile 107,636 12,003 0.10 Banco Santander Chile 310,478 16,039 0.13 Cencosud SA 3,104 9,306 0.08 Empresa Nacional de Electricidad SA/Chile 11,571 7,657 0.06 Endesa Americas SA 11,571 5,216 0.04 Enersis Americas SA 105,467 17,211 0.14 Enersis Chile SA 105,467 9,716 0.08 Latam Airlines Group SA 1,146 9,197 0.07 SACI Falabella 1,229 8,994 0.07
95,339 0.77 China Agricultural Bank of China Ltd 171,000 73,198 0.59 Anhui Conch Cement Co Ltd 5,500 15,069 0.12 Bank of China Limited 507,000 231,406 1.87 Bank of Communications Co Ltd 54,000 41,148 0.33 Beijing Enterprises Holdings Ltd 2,500 12,668 0.10 China Cinda Asset Management Co Ltd 40,000 14,131 0.11 China CITIC Bank Corp Ltd 38,000 25,232 0.20 China Communications Construction Co Ltd 22,000 23,118 0.19 China Construction Bank Corp 510,000 378,096 3.06 China Everbright Bank Co Ltd 17,000 7,913 0.06 China Life Insurance Co Ltd 19,000 48,995 0.40 China Longyuan Power Group Corp Ltd 15,000 12,184 0.10 China Merchants Bank Co Ltd 22,500 56,685 0.46 China Minsheng Banking Corp Ltd 27,500 31,698 0.26 China National Building Material Co Ltd 34,000 15,080 0.12 China Oilfield Services Ltd 8,000 6,942 0.06 China Pacific Insurance Group Co Ltd 7,600 28,074 0.23 China Petroleum & Chemical Corporation 206,000 150,065 1.22 China Railway Construction Corp Ltd 13,000 14,750 0.12 China Railway Group Ltd 21,000 15,162 0.12 China Shenhua Energy Co Ltd 27,000 52,775 0.43 China Taiping Insurance Holdings Co Ltd 5,600 11,047 0.09 China Telecom Corp Ltd 100,000 50,413 0.41 Chongqing Rural Commercial Bank Co Ltd 18,000 11,093 0.09 CITIC Securities Co Ltd 5,000 10,611 0.09 Dongfeng Motor Group Company Limited 12,000 11,991 0.10 Great Wall Motor Co Ltd 9,500 9,248 0.07 Guangzhou R&F Properties Co Ltd 8,400 13,213 0.11 Haitong Securities Co Ltd 6,000 10,150 0.08 Hengan International Group Co Ltd 1,500 12,436 0.10 Huaneng Power International Inc 24,000 15,008 0.12 Industrial & Commercial Bank of China Ltd 463,000 289,525 2.35 Inner Mongolia Yitai Coal Co Ltd 12,500 11,425 0.09 Jiangxi Copper Co Ltd 10,000 11,423 0.09 New China Life Insurance Co Ltd 2,200 9,715 0.08 People's Insurance Co Group of China Ltd/The 36,000 14,667 0.12 PetroChina Co Ltd 128,000 84,002 0.68 PICC Property & Casualty Co Ltd 12,000 19,866 0.16 Ping An Insurance Group Co of China Ltd 13,500 69,972 0.57 Sinopharm Group Co Ltd 4,000 19,211 0.16
1,939,405 15.71 China, Republic of (Taiwan) Advanced Semiconductor Engineering Inc 25,000 29,988 0.24 Asustek Computer Inc 3,000 26,750 0.22 AU Optronics Corp 120,000 44,026 0.36
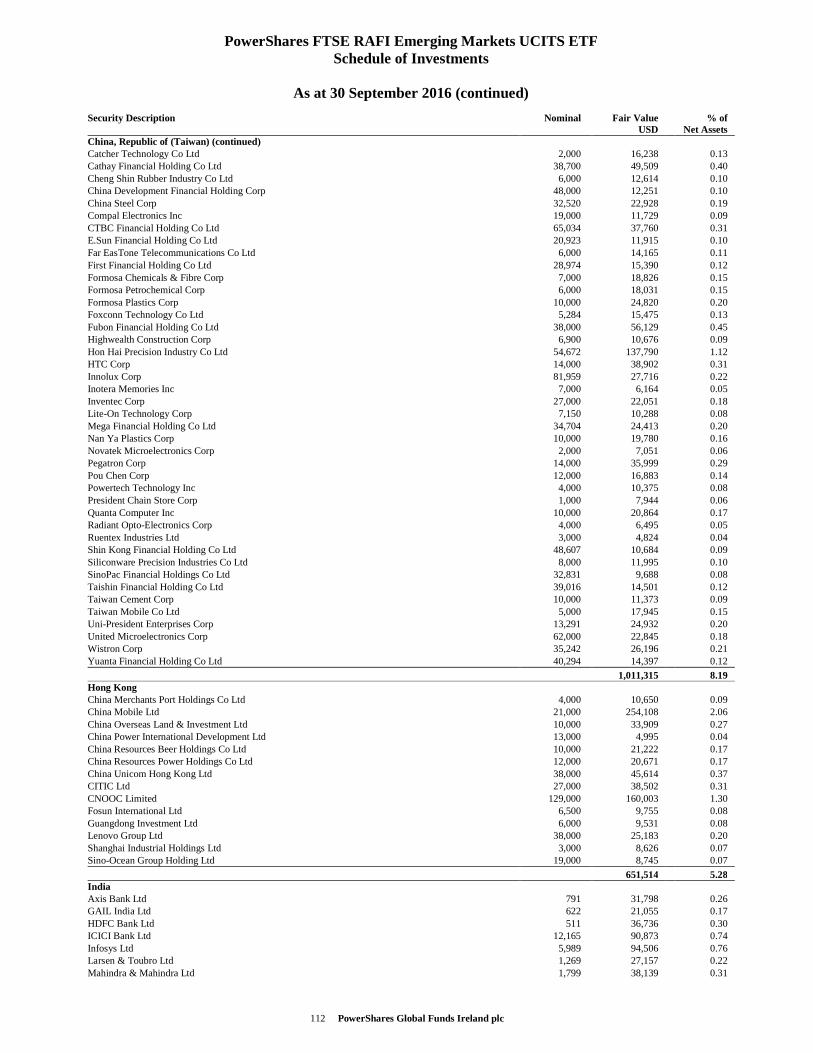
112 PowerShares Global Funds Ireland plc
PowerShares FTSE RAFI Emerging Markets UCITS ETF Schedule of Investments
As at 30 September 2016 (continued)
Security Description Nominal Fair Value USD
% of Net Assets
China, Republic of (Taiwan) (continued) Catcher Technology Co Ltd 2,000 16,238 0.13 Cathay Financial Holding Co Ltd 38,700 49,509 0.40 Cheng Shin Rubber Industry Co Ltd 6,000 12,614 0.10 China Development Financial Holding Corp 48,000 12,251 0.10 China Steel Corp 32,520 22,928 0.19 Compal Electronics Inc 19,000 11,729 0.09 CTBC Financial Holding Co Ltd 65,034 37,760 0.31 E.Sun Financial Holding Co Ltd 20,923 11,915 0.10 Far EasTone Telecommunications Co Ltd 6,000 14,165 0.11 First Financial Holding Co Ltd 28,974 15,390 0.12 Formosa Chemicals & Fibre Corp 7,000 18,826 0.15 Formosa Petrochemical Corp 6,000 18,031 0.15 Formosa Plastics Corp 10,000 24,820 0.20 Foxconn Technology Co Ltd 5,284 15,475 0.13 Fubon Financial Holding Co Ltd 38,000 56,129 0.45 Highwealth Construction Corp 6,900 10,676 0.09 Hon Hai Precision Industry Co Ltd 54,672 137,790 1.12 HTC Corp 14,000 38,902 0.31 Innolux Corp 81,959 27,716 0.22 Inotera Memories Inc 7,000 6,164 0.05 Inventec Corp 27,000 22,051 0.18 Lite-On Technology Corp 7,150 10,288 0.08 Mega Financial Holding Co Ltd 34,704 24,413 0.20 Nan Ya Plastics Corp 10,000 19,780 0.16 Novatek Microelectronics Corp 2,000 7,051 0.06 Pegatron Corp 14,000 35,999 0.29 Pou Chen Corp 12,000 16,883 0.14 Powertech Technology Inc 4,000 10,375 0.08 President Chain Store Corp 1,000 7,944 0.06 Quanta Computer Inc 10,000 20,864 0.17 Radiant Opto-Electronics Corp 4,000 6,495 0.05 Ruentex Industries Ltd 3,000 4,824 0.04 Shin Kong Financial Holding Co Ltd 48,607 10,684 0.09 Siliconware Precision Industries Co Ltd 8,000 11,995 0.10 SinoPac Financial Holdings Co Ltd 32,831 9,688 0.08 Taishin Financial Holding Co Ltd 39,016 14,501 0.12 Taiwan Cement Corp 10,000 11,373 0.09 Taiwan Mobile Co Ltd 5,000 17,945 0.15 Uni-President Enterprises Corp 13,291 24,932 0.20 United Microelectronics Corp 62,000 22,845 0.18 Wistron Corp 35,242 26,196 0.21 Yuanta Financial Holding Co Ltd 40,294 14,397 0.12
1,011,315 8.19 Hong Kong China Merchants Port Holdings Co Ltd 4,000 10,650 0.09 China Mobile Ltd 21,000 254,108 2.06 China Overseas Land & Investment Ltd 10,000 33,909 0.27 China Power International Development Ltd 13,000 4,995 0.04 China Resources Beer Holdings Co Ltd 10,000 21,222 0.17 China Resources Power Holdings Co Ltd 12,000 20,671 0.17 China Unicom Hong Kong Ltd 38,000 45,614 0.37 CITIC Ltd 27,000 38,502 0.31 CNOOC Limited 129,000 160,003 1.30 Fosun International Ltd 6,500 9,755 0.08 Guangdong Investment Ltd 6,000 9,531 0.08 Lenovo Group Ltd 38,000 25,183 0.20 Shanghai Industrial Holdings Ltd 3,000 8,626 0.07 Sino-Ocean Group Holding Ltd 19,000 8,745 0.07
651,514 5.28 India Axis Bank Ltd 791 31,798 0.26 GAIL India Ltd 622 21,055 0.17 HDFC Bank Ltd 511 36,736 0.30 ICICI Bank Ltd 12,165 90,873 0.74 Infosys Ltd 5,989 94,506 0.76 Larsen & Toubro Ltd 1,269 27,157 0.22 Mahindra & Mahindra Ltd 1,799 38,139 0.31
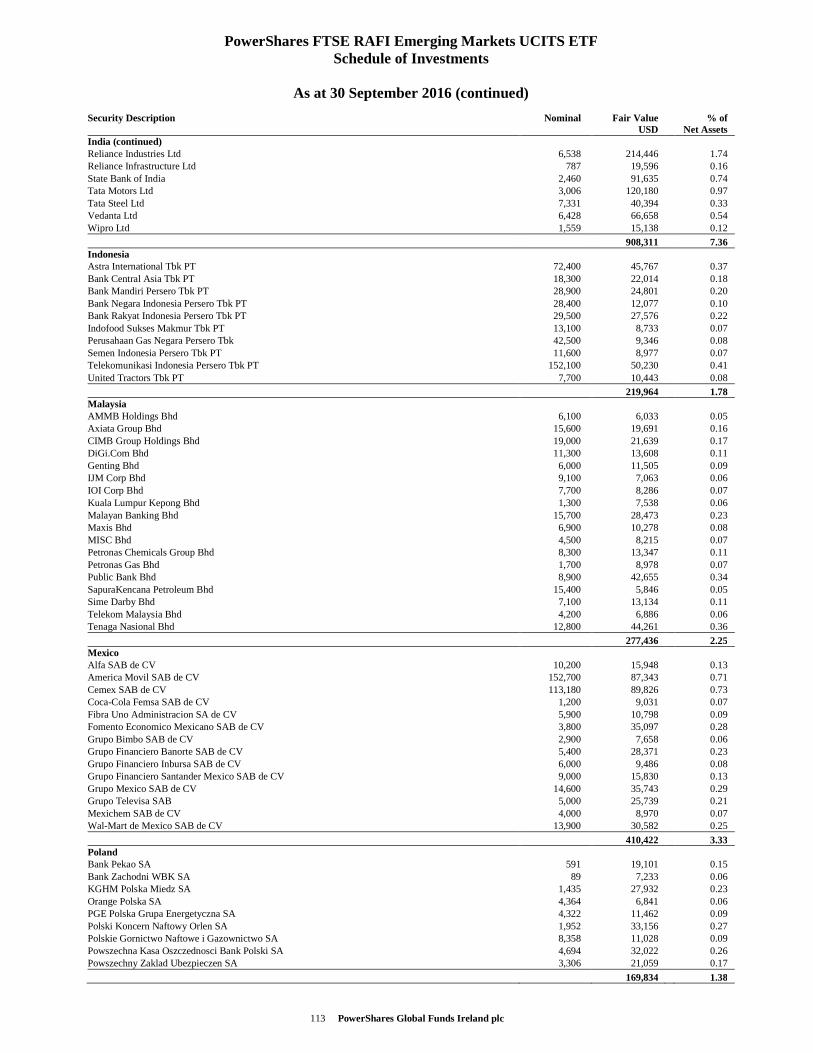
113 PowerShares Global Funds Ireland plc
PowerShares FTSE RAFI Emerging Markets UCITS ETF Schedule of Investments
As at 30 September 2016 (continued)
Security Description Nominal Fair Value USD
% of Net Assets
India (continued) Reliance Industries Ltd 6,538 214,446 1.74 Reliance Infrastructure Ltd 787 19,596 0.16 State Bank of India 2,460 91,635 0.74 Tata Motors Ltd 3,006 120,180 0.97 Tata Steel Ltd 7,331 40,394 0.33 Vedanta Ltd 6,428 66,658 0.54 Wipro Ltd 1,559 15,138 0.12
908,311 7.36 Indonesia Astra International Tbk PT 72,400 45,767 0.37 Bank Central Asia Tbk PT 18,300 22,014 0.18 Bank Mandiri Persero Tbk PT 28,900 24,801 0.20 Bank Negara Indonesia Persero Tbk PT 28,400 12,077 0.10 Bank Rakyat Indonesia Persero Tbk PT 29,500 27,576 0.22 Indofood Sukses Makmur Tbk PT 13,100 8,733 0.07 Perusahaan Gas Negara Persero Tbk 42,500 9,346 0.08 Semen Indonesia Persero Tbk PT 11,600 8,977 0.07 Telekomunikasi Indonesia Persero Tbk PT 152,100 50,230 0.41 United Tractors Tbk PT 7,700 10,443 0.08
219,964 1.78 Malaysia AMMB Holdings Bhd 6,100 6,033 0.05 Axiata Group Bhd 15,600 19,691 0.16 CIMB Group Holdings Bhd 19,000 21,639 0.17 DiGi.Com Bhd 11,300 13,608 0.11 Genting Bhd 6,000 11,505 0.09 IJM Corp Bhd 9,100 7,063 0.06 IOI Corp Bhd 7,700 8,286 0.07 Kuala Lumpur Kepong Bhd 1,300 7,538 0.06 Malayan Banking Bhd 15,700 28,473 0.23 Maxis Bhd 6,900 10,278 0.08 MISC Bhd 4,500 8,215 0.07 Petronas Chemicals Group Bhd 8,300 13,347 0.11 Petronas Gas Bhd 1,700 8,978 0.07 Public Bank Bhd 8,900 42,655 0.34 SapuraKencana Petroleum Bhd 15,400 5,846 0.05 Sime Darby Bhd 7,100 13,134 0.11 Telekom Malaysia Bhd 4,200 6,886 0.06 Tenaga Nasional Bhd 12,800 44,261 0.36
277,436 2.25 Mexico Alfa SAB de CV 10,200 15,948 0.13 America Movil SAB de CV 152,700 87,343 0.71 Cemex SAB de CV 113,180 89,826 0.73 Coca-Cola Femsa SAB de CV 1,200 9,031 0.07 Fibra Uno Administracion SA de CV 5,900 10,798 0.09 Fomento Economico Mexicano SAB de CV 3,800 35,097 0.28 Grupo Bimbo SAB de CV 2,900 7,658 0.06 Grupo Financiero Banorte SAB de CV 5,400 28,371 0.23 Grupo Financiero Inbursa SAB de CV 6,000 9,486 0.08 Grupo Financiero Santander Mexico SAB de CV 9,000 15,830 0.13 Grupo Mexico SAB de CV 14,600 35,743 0.29 Grupo Televisa SAB 5,000 25,739 0.21 Mexichem SAB de CV 4,000 8,970 0.07 Wal-Mart de Mexico SAB de CV 13,900 30,582 0.25
410,422 3.33 Poland Bank Pekao SA 591 19,101 0.15 Bank Zachodni WBK SA 89 7,233 0.06 KGHM Polska Miedz SA 1,435 27,932 0.23 Orange Polska SA 4,364 6,841 0.06 PGE Polska Grupa Energetyczna SA 4,322 11,462 0.09 Polski Koncern Naftowy Orlen SA 1,952 33,156 0.27 Polskie Gornictwo Naftowe i Gazownictwo SA 8,358 11,028 0.09 Powszechna Kasa Oszczednosci Bank Polski SA 4,694 32,022 0.26 Powszechny Zaklad Ubezpieczen SA 3,306 21,059 0.17
169,834 1.38
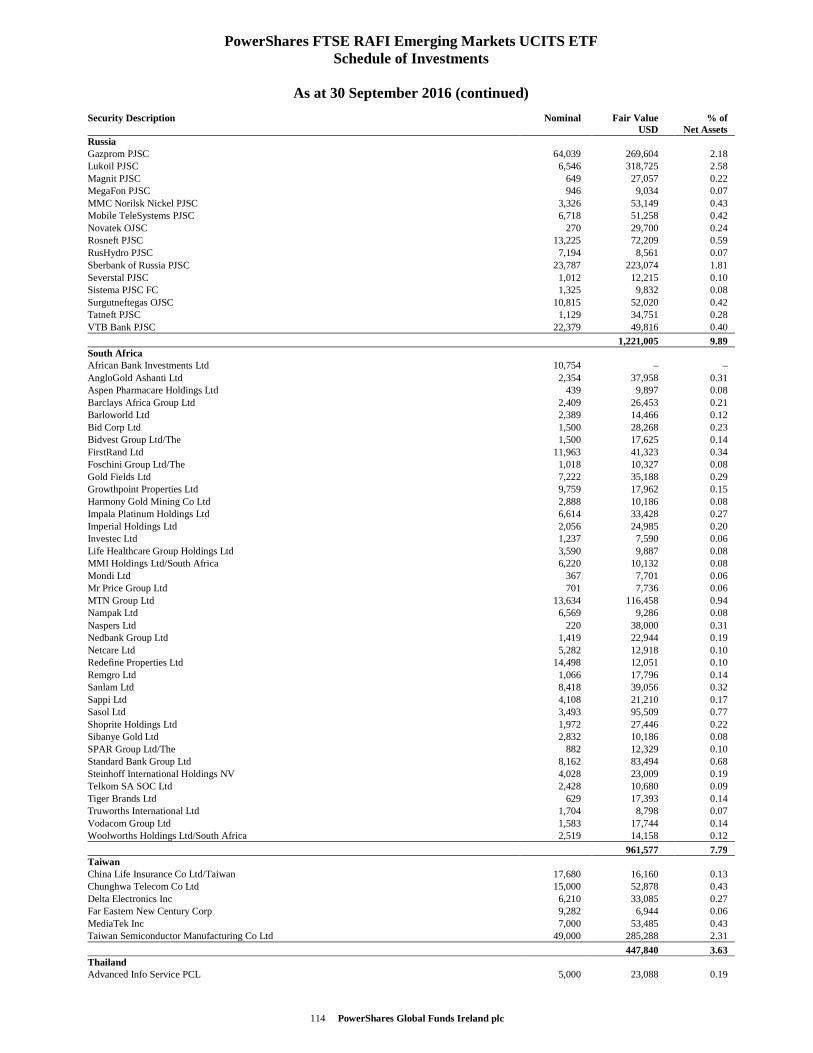
114 PowerShares Global Funds Ireland plc
PowerShares FTSE RAFI Emerging Markets UCITS ETF Schedule of Investments
As at 30 September 2016 (continued)
Security Description Nominal Fair Value USD
% of Net Assets
Russia Gazprom PJSC 64,039 269,604 2.18 Lukoil PJSC 6,546 318,725 2.58 Magnit PJSC 649 27,057 0.22 MegaFon PJSC 946 9,034 0.07 MMC Norilsk Nickel PJSC 3,326 53,149 0.43 Mobile TeleSystems PJSC 6,718 51,258 0.42 Novatek OJSC 270 29,700 0.24 Rosneft PJSC 13,225 72,209 0.59 RusHydro PJSC 7,194 8,561 0.07 Sberbank of Russia PJSC 23,787 223,074 1.81 Severstal PJSC 1,012 12,215 0.10 Sistema PJSC FC 1,325 9,832 0.08 Surgutneftegas OJSC 10,815 52,020 0.42 Tatneft PJSC 1,129 34,751 0.28 VTB Bank PJSC 22,379 49,816 0.40
1,221,005 9.89 South Africa African Bank Investments Ltd 10,754 – – AngloGold Ashanti Ltd 2,354 37,958 0.31 Aspen Pharmacare Holdings Ltd 439 9,897 0.08 Barclays Africa Group Ltd 2,409 26,453 0.21 Barloworld Ltd 2,389 14,466 0.12 Bid Corp Ltd 1,500 28,268 0.23 Bidvest Group Ltd/The 1,500 17,625 0.14 FirstRand Ltd 11,963 41,323 0.34 Foschini Group Ltd/The 1,018 10,327 0.08 Gold Fields Ltd 7,222 35,188 0.29 Growthpoint Properties Ltd 9,759 17,962 0.15 Harmony Gold Mining Co Ltd 2,888 10,186 0.08 Impala Platinum Holdings Ltd 6,614 33,428 0.27 Imperial Holdings Ltd 2,056 24,985 0.20 Investec Ltd 1,237 7,590 0.06 Life Healthcare Group Holdings Ltd 3,590 9,887 0.08 MMI Holdings Ltd/South Africa 6,220 10,132 0.08 Mondi Ltd 367 7,701 0.06 Mr Price Group Ltd 701 7,736 0.06 MTN Group Ltd 13,634 116,458 0.94 Nampak Ltd 6,569 9,286 0.08 Naspers Ltd 220 38,000 0.31 Nedbank Group Ltd 1,419 22,944 0.19 Netcare Ltd 5,282 12,918 0.10 Redefine Properties Ltd 14,498 12,051 0.10 Remgro Ltd 1,066 17,796 0.14 Sanlam Ltd 8,418 39,056 0.32 Sappi Ltd 4,108 21,210 0.17 Sasol Ltd 3,493 95,509 0.77 Shoprite Holdings Ltd 1,972 27,446 0.22 Sibanye Gold Ltd 2,832 10,186 0.08 SPAR Group Ltd/The 882 12,329 0.10 Standard Bank Group Ltd 8,162 83,494 0.68 Steinhoff International Holdings NV 4,028 23,009 0.19 Telkom SA SOC Ltd 2,428 10,680 0.09 Tiger Brands Ltd 629 17,393 0.14 Truworths International Ltd 1,704 8,798 0.07 Vodacom Group Ltd 1,583 17,744 0.14 Woolworths Holdings Ltd/South Africa 2,519 14,158 0.12
961,577 7.79 Taiwan China Life Insurance Co Ltd/Taiwan 17,680 16,160 0.13 Chunghwa Telecom Co Ltd 15,000 52,878 0.43 Delta Electronics Inc 6,210 33,085 0.27 Far Eastern New Century Corp 9,282 6,944 0.06 MediaTek Inc 7,000 53,485 0.43 Taiwan Semiconductor Manufacturing Co Ltd 49,000 285,288 2.31
447,840 3.63 Thailand Advanced Info Service PCL 5,000 23,088 0.19
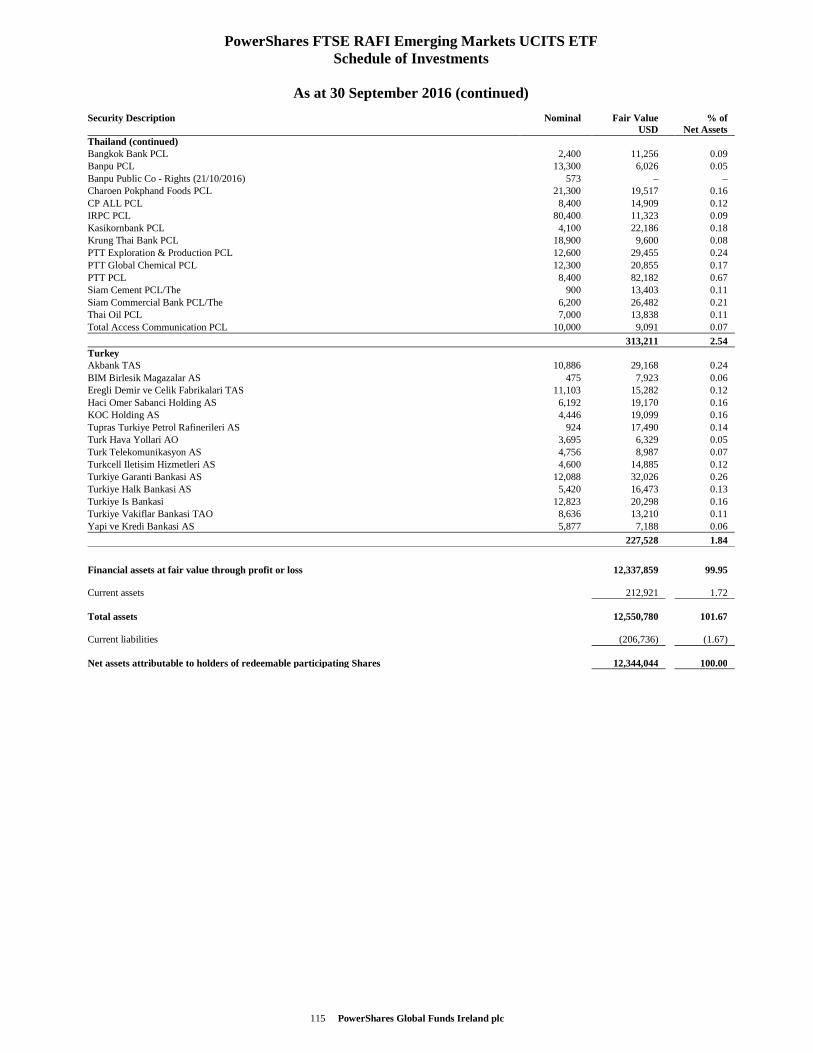
115 PowerShares Global Funds Ireland plc
PowerShares FTSE RAFI Emerging Markets UCITS ETF Schedule of Investments
As at 30 September 2016 (continued)
Security Description Nominal Fair Value USD
% of Net Assets
Thailand (continued) Bangkok Bank PCL 2,400 11,256 0.09 Banpu PCL 13,300 6,026 0.05 Banpu Public Co - Rights (21/10/2016) 573 – – Charoen Pokphand Foods PCL 21,300 19,517 0.16 CP ALL PCL 8,400 14,909 0.12 IRPC PCL 80,400 11,323 0.09 Kasikornbank PCL 4,100 22,186 0.18 Krung Thai Bank PCL 18,900 9,600 0.08 PTT Exploration & Production PCL 12,600 29,455 0.24 PTT Global Chemical PCL 12,300 20,855 0.17 PTT PCL 8,400 82,182 0.67 Siam Cement PCL/The 900 13,403 0.11 Siam Commercial Bank PCL/The 6,200 26,482 0.21 Thai Oil PCL 7,000 13,838 0.11 Total Access Communication PCL 10,000 9,091 0.07
313,211 2.54 Turkey Akbank TAS 10,886 29,168 0.24 BIM Birlesik Magazalar AS 475 7,923 0.06 Eregli Demir ve Celik Fabrikalari TAS 11,103 15,282 0.12 Haci Omer Sabanci Holding AS 6,192 19,170 0.16 KOC Holding AS 4,446 19,099 0.16 Tupras Turkiye Petrol Rafinerileri AS 924 17,490 0.14 Turk Hava Yollari AO 3,695 6,329 0.05 Turk Telekomunikasyon AS 4,756 8,987 0.07 Turkcell Iletisim Hizmetleri AS 4,600 14,885 0.12 Turkiye Garanti Bankasi AS 12,088 32,026 0.26 Turkiye Halk Bankasi AS 5,420 16,473 0.13 Turkiye Is Bankasi 12,823 20,298 0.16 Turkiye Vakiflar Bankasi TAO 8,636 13,210 0.11 Yapi ve Kredi Bankasi AS 5,877 7,188 0.06
227,528 1.84
Financial assets at fair value through profit or loss 12,337,859 99.95 Current assets 212,921 1.72 Total assets 12,550,780 101.67 Current liabilities (206,736) (1.67) Net assets attributable to holders of redeemable participating Shares 12,344,044 100.00
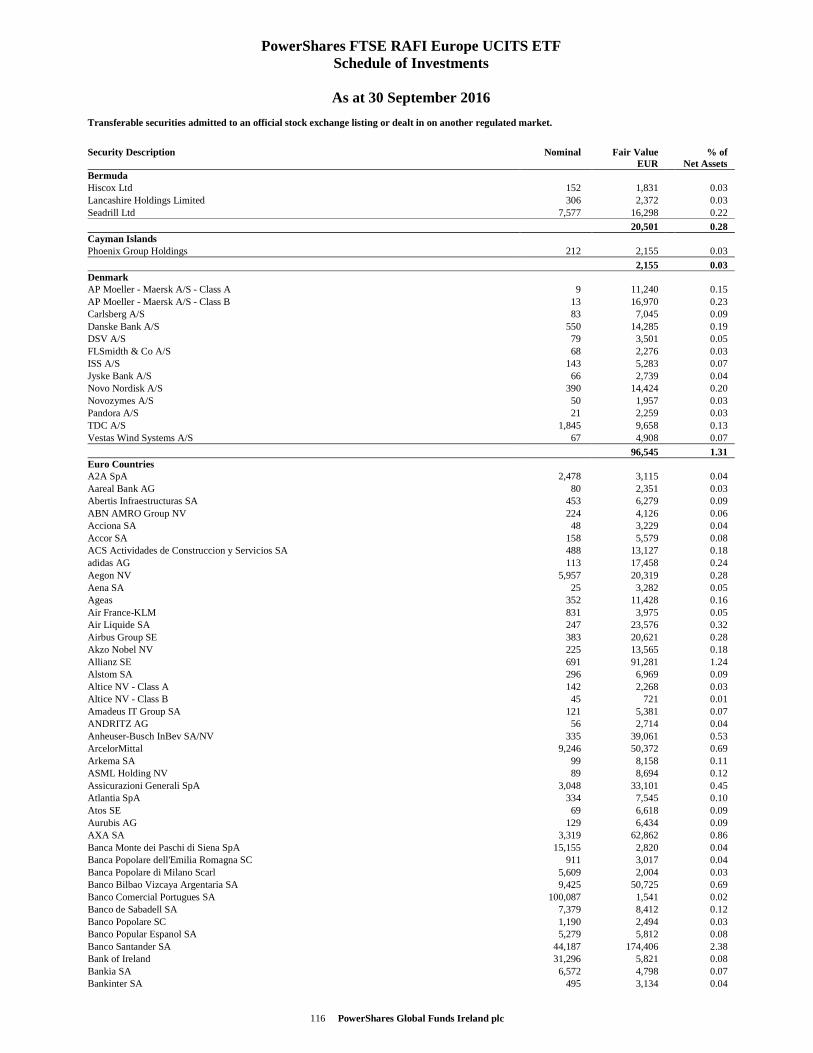
116 PowerShares Global Funds Ireland plc
PowerShares FTSE RAFI Europe UCITS ETF Schedule of Investments
As at 30 September 2016
Transferable securities admitted to an official stock exchange listing or dealt in on another regulated market.
Security Description Nominal Fair Value EUR
% of Net Assets
Bermuda Hiscox Ltd 152 1,831 0.03 Lancashire Holdings Limited 306 2,372 0.03 Seadrill Ltd 7,577 16,298 0.22
20,501 0.28 Cayman Islands Phoenix Group Holdings 212 2,155 0.03
2,155 0.03 Denmark AP Moeller - Maersk A/S - Class A 9 11,240 0.15 AP Moeller - Maersk A/S - Class B 13 16,970 0.23 Carlsberg A/S 83 7,045 0.09 Danske Bank A/S 550 14,285 0.19 DSV A/S 79 3,501 0.05 FLSmidth & Co A/S 68 2,276 0.03 ISS A/S 143 5,283 0.07 Jyske Bank A/S 66 2,739 0.04 Novo Nordisk A/S 390 14,424 0.20 Novozymes A/S 50 1,957 0.03 Pandora A/S 21 2,259 0.03 TDC A/S 1,845 9,658 0.13 Vestas Wind Systems A/S 67 4,908 0.07
96,545 1.31 Euro Countries A2A SpA 2,478 3,115 0.04 Aareal Bank AG 80 2,351 0.03 Abertis Infraestructuras SA 453 6,279 0.09 ABN AMRO Group NV 224 4,126 0.06 Acciona SA 48 3,229 0.04 Accor SA 158 5,579 0.08 ACS Actividades de Construccion y Servicios SA 488 13,127 0.18 adidas AG 113 17,458 0.24 Aegon NV 5,957 20,319 0.28 Aena SA 25 3,282 0.05 Ageas 352 11,428 0.16 Air France-KLM 831 3,975 0.05 Air Liquide SA 247 23,576 0.32 Airbus Group SE 383 20,621 0.28 Akzo Nobel NV 225 13,565 0.18 Allianz SE 691 91,281 1.24 Alstom SA 296 6,969 0.09 Altice NV - Class A 142 2,268 0.03 Altice NV - Class B 45 721 0.01 Amadeus IT Group SA 121 5,381 0.07 ANDRITZ AG 56 2,714 0.04 Anheuser-Busch InBev SA/NV 335 39,061 0.53 ArcelorMittal 9,246 50,372 0.69 Arkema SA 99 8,158 0.11 ASML Holding NV 89 8,694 0.12 Assicurazioni Generali SpA 3,048 33,101 0.45 Atlantia SpA 334 7,545 0.10 Atos SE 69 6,618 0.09 Aurubis AG 129 6,434 0.09 AXA SA 3,319 62,862 0.86 Banca Monte dei Paschi di Siena SpA 15,155 2,820 0.04 Banca Popolare dell'Emilia Romagna SC 911 3,017 0.04 Banca Popolare di Milano Scarl 5,609 2,004 0.03 Banco Bilbao Vizcaya Argentaria SA 9,425 50,725 0.69 Banco Comercial Portugues SA 100,087 1,541 0.02 Banco de Sabadell SA 7,379 8,412 0.12 Banco Popolare SC 1,190 2,494 0.03 Banco Popular Espanol SA 5,279 5,812 0.08 Banco Santander SA 44,187 174,406 2.38 Bank of Ireland 31,296 5,821 0.08 Bankia SA 6,572 4,798 0.07 Bankinter SA 495 3,134 0.04
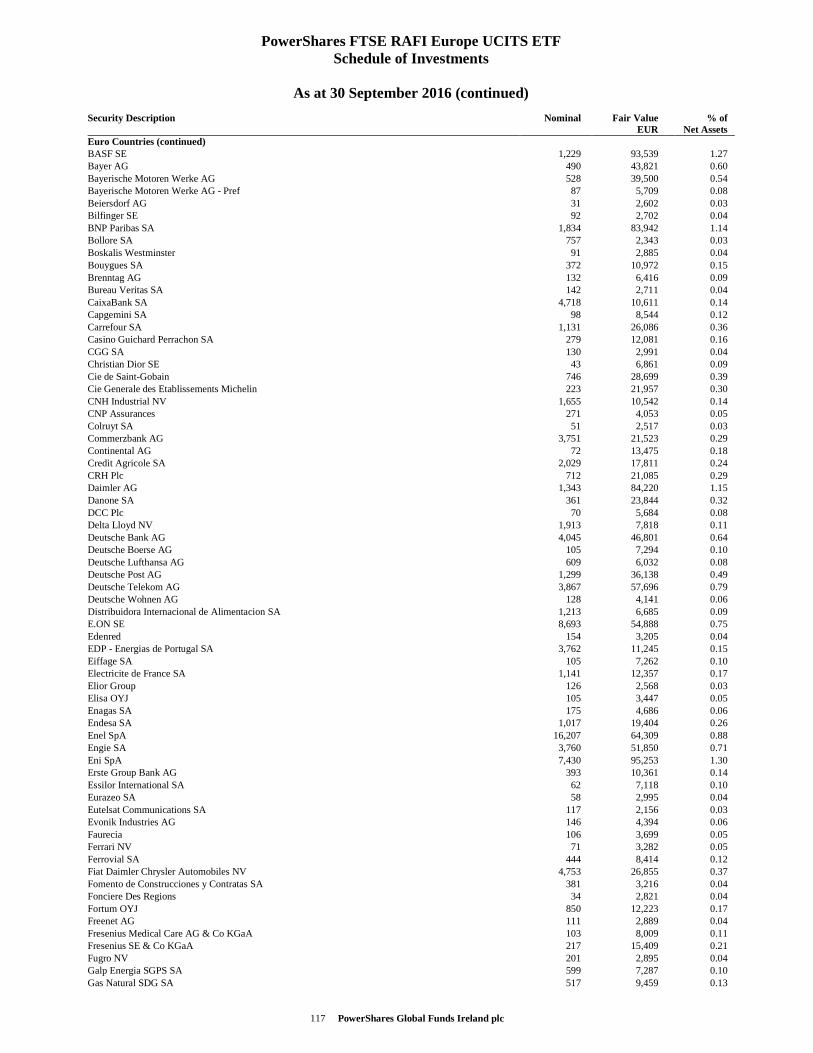
117 PowerShares Global Funds Ireland plc
PowerShares FTSE RAFI Europe UCITS ETF Schedule of Investments
As at 30 September 2016 (continued)
Security Description Nominal Fair Value EUR
% of Net Assets
Euro Countries (continued) BASF SE 1,229 93,539 1.27 Bayer AG 490 43,821 0.60 Bayerische Motoren Werke AG 528 39,500 0.54 Bayerische Motoren Werke AG - Pref 87 5,709 0.08 Beiersdorf AG 31 2,602 0.03 Bilfinger SE 92 2,702 0.04 BNP Paribas SA 1,834 83,942 1.14 Bollore SA 757 2,343 0.03 Boskalis Westminster 91 2,885 0.04 Bouygues SA 372 10,972 0.15 Brenntag AG 132 6,416 0.09 Bureau Veritas SA 142 2,711 0.04 CaixaBank SA 4,718 10,611 0.14 Capgemini SA 98 8,544 0.12 Carrefour SA 1,131 26,086 0.36 Casino Guichard Perrachon SA 279 12,081 0.16 CGG SA 130 2,991 0.04 Christian Dior SE 43 6,861 0.09 Cie de Saint-Gobain 746 28,699 0.39 Cie Generale des Etablissements Michelin 223 21,957 0.30 CNH Industrial NV 1,655 10,542 0.14 CNP Assurances 271 4,053 0.05 Colruyt SA 51 2,517 0.03 Commerzbank AG 3,751 21,523 0.29 Continental AG 72 13,475 0.18 Credit Agricole SA 2,029 17,811 0.24 CRH Plc 712 21,085 0.29 Daimler AG 1,343 84,220 1.15 Danone SA 361 23,844 0.32 DCC Plc 70 5,684 0.08 Delta Lloyd NV 1,913 7,818 0.11 Deutsche Bank AG 4,045 46,801 0.64 Deutsche Boerse AG 105 7,294 0.10 Deutsche Lufthansa AG 609 6,032 0.08 Deutsche Post AG 1,299 36,138 0.49 Deutsche Telekom AG 3,867 57,696 0.79 Deutsche Wohnen AG 128 4,141 0.06 Distribuidora Internacional de Alimentacion SA 1,213 6,685 0.09 E.ON SE 8,693 54,888 0.75 Edenred 154 3,205 0.04 EDP - Energias de Portugal SA 3,762 11,245 0.15 Eiffage SA 105 7,262 0.10 Electricite de France SA 1,141 12,357 0.17 Elior Group 126 2,568 0.03 Elisa OYJ 105 3,447 0.05 Enagas SA 175 4,686 0.06 Endesa SA 1,017 19,404 0.26 Enel SpA 16,207 64,309 0.88 Engie SA 3,760 51,850 0.71 Eni SpA 7,430 95,253 1.30 Erste Group Bank AG 393 10,361 0.14 Essilor International SA 62 7,118 0.10 Eurazeo SA 58 2,995 0.04 Eutelsat Communications SA 117 2,156 0.03 Evonik Industries AG 146 4,394 0.06 Faurecia 106 3,699 0.05 Ferrari NV 71 3,282 0.05 Ferrovial SA 444 8,414 0.12 Fiat Daimler Chrysler Automobiles NV 4,753 26,855 0.37 Fomento de Construcciones y Contratas SA 381 3,216 0.04 Fonciere Des Regions 34 2,821 0.04 Fortum OYJ 850 12,223 0.17 Freenet AG 111 2,889 0.04 Fresenius Medical Care AG & Co KGaA 103 8,009 0.11 Fresenius SE & Co KGaA 217 15,409 0.21 Fugro NV 201 2,895 0.04 Galp Energia SGPS SA 599 7,287 0.10 Gas Natural SDG SA 517 9,459 0.13
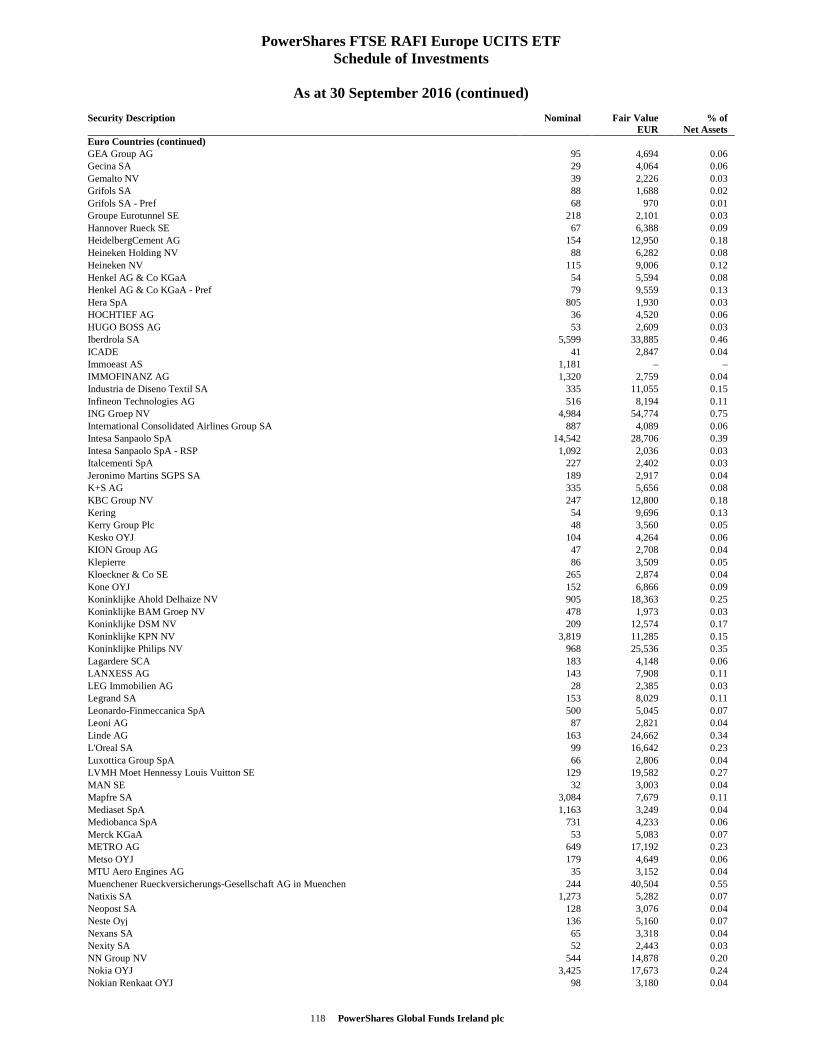
118 PowerShares Global Funds Ireland plc
PowerShares FTSE RAFI Europe UCITS ETF Schedule of Investments
As at 30 September 2016 (continued)
Security Description Nominal Fair Value EUR
% of Net Assets
Euro Countries (continued) GEA Group AG 95 4,694 0.06 Gecina SA 29 4,064 0.06 Gemalto NV 39 2,226 0.03 Grifols SA 88 1,688 0.02 Grifols SA - Pref 68 970 0.01 Groupe Eurotunnel SE 218 2,101 0.03 Hannover Rueck SE 67 6,388 0.09 HeidelbergCement AG 154 12,950 0.18 Heineken Holding NV 88 6,282 0.08 Heineken NV 115 9,006 0.12 Henkel AG & Co KGaA 54 5,594 0.08 Henkel AG & Co KGaA - Pref 79 9,559 0.13 Hera SpA 805 1,930 0.03 HOCHTIEF AG 36 4,520 0.06 HUGO BOSS AG 53 2,609 0.03 Iberdrola SA 5,599 33,885 0.46 ICADE 41 2,847 0.04 Immoeast AS 1,181 – – IMMOFINANZ AG 1,320 2,759 0.04 Industria de Diseno Textil SA 335 11,055 0.15 Infineon Technologies AG 516 8,194 0.11 ING Groep NV 4,984 54,774 0.75 International Consolidated Airlines Group SA 887 4,089 0.06 Intesa Sanpaolo SpA 14,542 28,706 0.39 Intesa Sanpaolo SpA - RSP 1,092 2,036 0.03 Italcementi SpA 227 2,402 0.03 Jeronimo Martins SGPS SA 189 2,917 0.04 K+S AG 335 5,656 0.08 KBC Group NV 247 12,800 0.18 Kering 54 9,696 0.13 Kerry Group Plc 48 3,560 0.05 Kesko OYJ 104 4,264 0.06 KION Group AG 47 2,708 0.04 Klepierre 86 3,509 0.05 Kloeckner & Co SE 265 2,874 0.04 Kone OYJ 152 6,866 0.09 Koninklijke Ahold Delhaize NV 905 18,363 0.25 Koninklijke BAM Groep NV 478 1,973 0.03 Koninklijke DSM NV 209 12,574 0.17 Koninklijke KPN NV 3,819 11,285 0.15 Koninklijke Philips NV 968 25,536 0.35 Lagardere SCA 183 4,148 0.06 LANXESS AG 143 7,908 0.11 LEG Immobilien AG 28 2,385 0.03 Legrand SA 153 8,029 0.11 Leonardo-Finmeccanica SpA 500 5,045 0.07 Leoni AG 87 2,821 0.04 Linde AG 163 24,662 0.34 L'Oreal SA 99 16,642 0.23 Luxottica Group SpA 66 2,806 0.04 LVMH Moet Hennessy Louis Vuitton SE 129 19,582 0.27 MAN SE 32 3,003 0.04 Mapfre SA 3,084 7,679 0.11 Mediaset SpA 1,163 3,249 0.04 Mediobanca SpA 731 4,233 0.06 Merck KGaA 53 5,083 0.07 METRO AG 649 17,192 0.23 Metso OYJ 179 4,649 0.06 MTU Aero Engines AG 35 3,152 0.04 Muenchener Rueckversicherungs-Gesellschaft AG in Muenchen 244 40,504 0.55 Natixis SA 1,273 5,282 0.07 Neopost SA 128 3,076 0.04 Neste Oyj 136 5,160 0.07 Nexans SA 65 3,318 0.04 Nexity SA 52 2,443 0.03 NN Group NV 544 14,878 0.20 Nokia OYJ 3,425 17,673 0.24 Nokian Renkaat OYJ 98 3,180 0.04
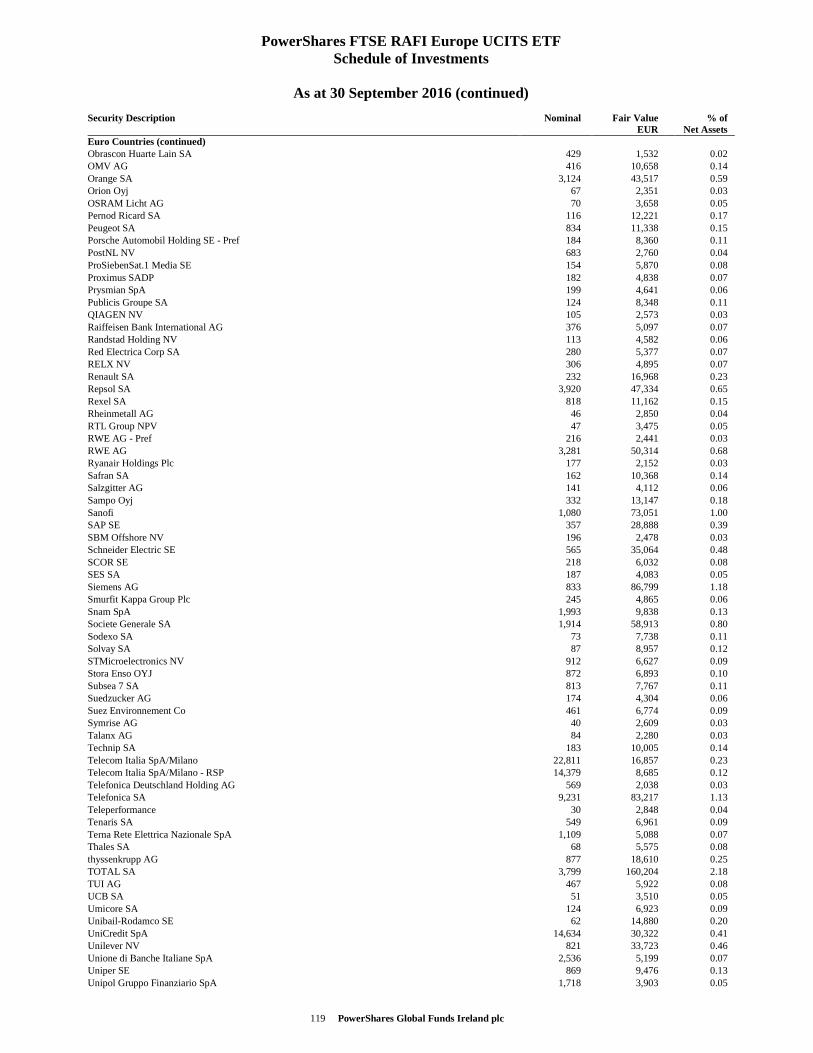
119 PowerShares Global Funds Ireland plc
PowerShares FTSE RAFI Europe UCITS ETF Schedule of Investments
As at 30 September 2016 (continued)
Security Description Nominal Fair Value EUR
% of Net Assets
Euro Countries (continued) Obrascon Huarte Lain SA 429 1,532 0.02 OMV AG 416 10,658 0.14 Orange SA 3,124 43,517 0.59 Orion Oyj 67 2,351 0.03 OSRAM Licht AG 70 3,658 0.05 Pernod Ricard SA 116 12,221 0.17 Peugeot SA 834 11,338 0.15 Porsche Automobil Holding SE - Pref 184 8,360 0.11 PostNL NV 683 2,760 0.04 ProSiebenSat.1 Media SE 154 5,870 0.08 Proximus SADP 182 4,838 0.07 Prysmian SpA 199 4,641 0.06 Publicis Groupe SA 124 8,348 0.11 QIAGEN NV 105 2,573 0.03 Raiffeisen Bank International AG 376 5,097 0.07 Randstad Holding NV 113 4,582 0.06 Red Electrica Corp SA 280 5,377 0.07 RELX NV 306 4,895 0.07 Renault SA 232 16,968 0.23 Repsol SA 3,920 47,334 0.65 Rexel SA 818 11,162 0.15 Rheinmetall AG 46 2,850 0.04 RTL Group NPV 47 3,475 0.05 RWE AG - Pref 216 2,441 0.03 RWE AG 3,281 50,314 0.68 Ryanair Holdings Plc 177 2,152 0.03 Safran SA 162 10,368 0.14 Salzgitter AG 141 4,112 0.06 Sampo Oyj 332 13,147 0.18 Sanofi 1,080 73,051 1.00 SAP SE 357 28,888 0.39 SBM Offshore NV 196 2,478 0.03 Schneider Electric SE 565 35,064 0.48 SCOR SE 218 6,032 0.08 SES SA 187 4,083 0.05 Siemens AG 833 86,799 1.18 Smurfit Kappa Group Plc 245 4,865 0.06 Snam SpA 1,993 9,838 0.13 Societe Generale SA 1,914 58,913 0.80 Sodexo SA 73 7,738 0.11 Solvay SA 87 8,957 0.12 STMicroelectronics NV 912 6,627 0.09 Stora Enso OYJ 872 6,893 0.10 Subsea 7 SA 813 7,767 0.11 Suedzucker AG 174 4,304 0.06 Suez Environnement Co 461 6,774 0.09 Symrise AG 40 2,609 0.03 Talanx AG 84 2,280 0.03 Technip SA 183 10,005 0.14 Telecom Italia SpA/Milano 22,811 16,857 0.23 Telecom Italia SpA/Milano - RSP 14,379 8,685 0.12 Telefonica Deutschland Holding AG 569 2,038 0.03 Telefonica SA 9,231 83,217 1.13 Teleperformance 30 2,848 0.04 Tenaris SA 549 6,961 0.09 Terna Rete Elettrica Nazionale SpA 1,109 5,088 0.07 Thales SA 68 5,575 0.08 thyssenkrupp AG 877 18,610 0.25 TOTAL SA 3,799 160,204 2.18 TUI AG 467 5,922 0.08 UCB SA 51 3,510 0.05 Umicore SA 124 6,923 0.09 Unibail-Rodamco SE 62 14,880 0.20 UniCredit SpA 14,634 30,322 0.41 Unilever NV 821 33,723 0.46 Unione di Banche Italiane SpA 2,536 5,199 0.07 Uniper SE 869 9,476 0.13 Unipol Gruppo Finanziario SpA 1,718 3,903 0.05
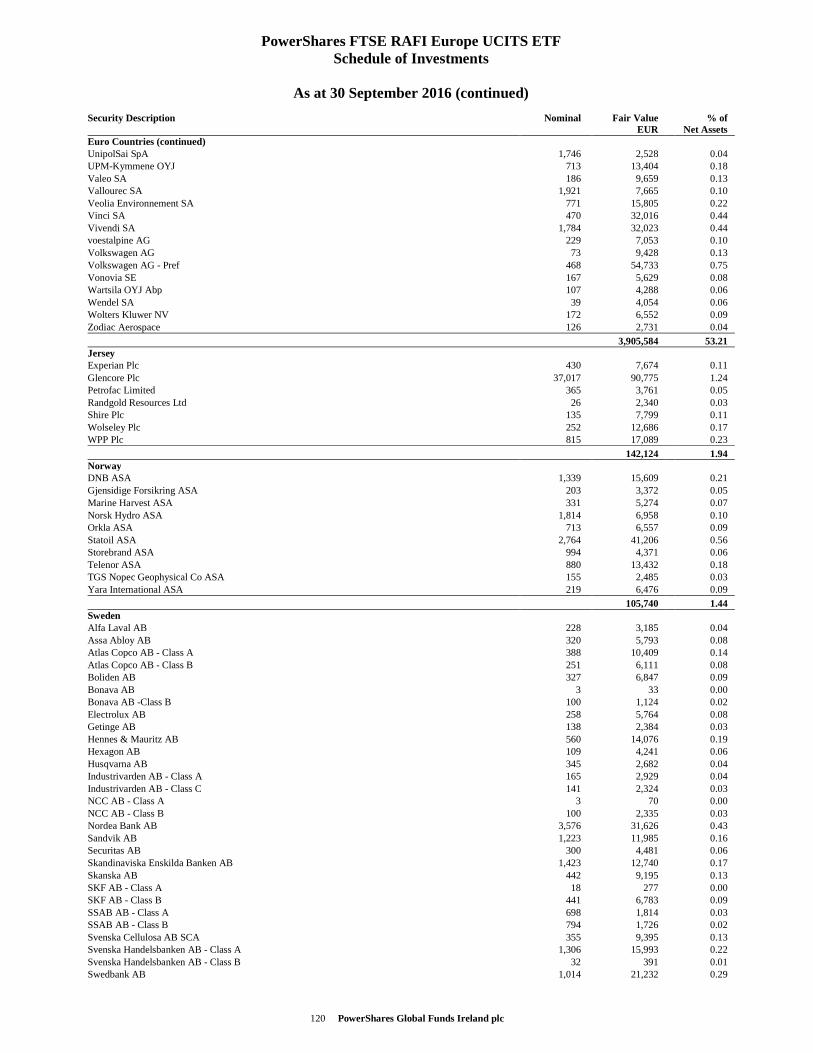
120 PowerShares Global Funds Ireland plc
PowerShares FTSE RAFI Europe UCITS ETF Schedule of Investments
As at 30 September 2016 (continued)
Security Description Nominal Fair Value EUR
% of Net Assets
Euro Countries (continued) UnipolSai SpA 1,746 2,528 0.04 UPM-Kymmene OYJ 713 13,404 0.18 Valeo SA 186 9,659 0.13 Vallourec SA 1,921 7,665 0.10 Veolia Environnement SA 771 15,805 0.22 Vinci SA 470 32,016 0.44 Vivendi SA 1,784 32,023 0.44 voestalpine AG 229 7,053 0.10 Volkswagen AG 73 9,428 0.13 Volkswagen AG - Pref 468 54,733 0.75 Vonovia SE 167 5,629 0.08 Wartsila OYJ Abp 107 4,288 0.06 Wendel SA 39 4,054 0.06 Wolters Kluwer NV 172 6,552 0.09 Zodiac Aerospace 126 2,731 0.04
3,905,584 53.21 Jersey Experian Plc 430 7,674 0.11 Glencore Plc 37,017 90,775 1.24 Petrofac Limited 365 3,761 0.05 Randgold Resources Ltd 26 2,340 0.03 Shire Plc 135 7,799 0.11 Wolseley Plc 252 12,686 0.17 WPP Plc 815 17,089 0.23
142,124 1.94 Norway DNB ASA 1,339 15,609 0.21 Gjensidige Forsikring ASA 203 3,372 0.05 Marine Harvest ASA 331 5,274 0.07 Norsk Hydro ASA 1,814 6,958 0.10 Orkla ASA 713 6,557 0.09 Statoil ASA 2,764 41,206 0.56 Storebrand ASA 994 4,371 0.06 Telenor ASA 880 13,432 0.18 TGS Nopec Geophysical Co ASA 155 2,485 0.03 Yara International ASA 219 6,476 0.09
105,740 1.44 Sweden Alfa Laval AB 228 3,185 0.04 Assa Abloy AB 320 5,793 0.08 Atlas Copco AB - Class A 388 10,409 0.14 Atlas Copco AB - Class B 251 6,111 0.08 Boliden AB 327 6,847 0.09 Bonava AB 3 33 0.00 Bonava AB -Class B 100 1,124 0.02 Electrolux AB 258 5,764 0.08 Getinge AB 138 2,384 0.03 Hennes & Mauritz AB 560 14,076 0.19 Hexagon AB 109 4,241 0.06 Husqvarna AB 345 2,682 0.04 Industrivarden AB - Class A 165 2,929 0.04 Industrivarden AB - Class C 141 2,324 0.03 NCC AB - Class A 3 70 0.00 NCC AB - Class B 100 2,335 0.03 Nordea Bank AB 3,576 31,626 0.43 Sandvik AB 1,223 11,985 0.16 Securitas AB 300 4,481 0.06 Skandinaviska Enskilda Banken AB 1,423 12,740 0.17 Skanska AB 442 9,195 0.13 SKF AB - Class A 18 277 0.00 SKF AB - Class B 441 6,783 0.09 SSAB AB - Class A 698 1,814 0.03 SSAB AB - Class B 794 1,726 0.02 Svenska Cellulosa AB SCA 355 9,395 0.13 Svenska Handelsbanken AB - Class A 1,306 15,993 0.22 Svenska Handelsbanken AB - Class B 32 391 0.01 Swedbank AB 1,014 21,232 0.29
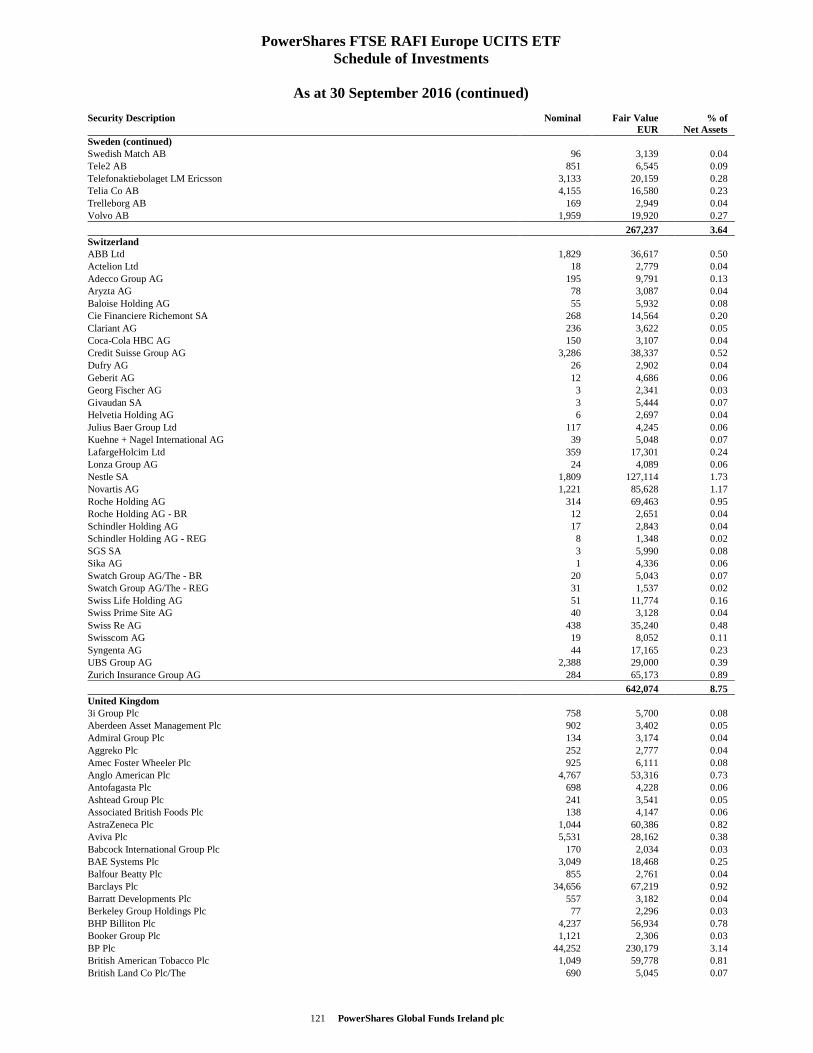
121 PowerShares Global Funds Ireland plc
PowerShares FTSE RAFI Europe UCITS ETF Schedule of Investments
As at 30 September 2016 (continued)
Security Description Nominal Fair Value EUR
% of Net Assets
Sweden (continued) Swedish Match AB 96 3,139 0.04 Tele2 AB 851 6,545 0.09 Telefonaktiebolaget LM Ericsson 3,133 20,159 0.28 Telia Co AB 4,155 16,580 0.23 Trelleborg AB 169 2,949 0.04 Volvo AB 1,959 19,920 0.27
267,237 3.64 Switzerland ABB Ltd 1,829 36,617 0.50 Actelion Ltd 18 2,779 0.04 Adecco Group AG 195 9,791 0.13 Aryzta AG 78 3,087 0.04 Baloise Holding AG 55 5,932 0.08 Cie Financiere Richemont SA 268 14,564 0.20 Clariant AG 236 3,622 0.05 Coca-Cola HBC AG 150 3,107 0.04 Credit Suisse Group AG 3,286 38,337 0.52 Dufry AG 26 2,902 0.04 Geberit AG 12 4,686 0.06 Georg Fischer AG 3 2,341 0.03 Givaudan SA 3 5,444 0.07 Helvetia Holding AG 6 2,697 0.04 Julius Baer Group Ltd 117 4,245 0.06 Kuehne + Nagel International AG 39 5,048 0.07 LafargeHolcim Ltd 359 17,301 0.24 Lonza Group AG 24 4,089 0.06 Nestle SA 1,809 127,114 1.73 Novartis AG 1,221 85,628 1.17 Roche Holding AG 314 69,463 0.95 Roche Holding AG - BR 12 2,651 0.04 Schindler Holding AG 17 2,843 0.04 Schindler Holding AG - REG 8 1,348 0.02 SGS SA 3 5,990 0.08 Sika AG 1 4,336 0.06 Swatch Group AG/The - BR 20 5,043 0.07 Swatch Group AG/The - REG 31 1,537 0.02 Swiss Life Holding AG 51 11,774 0.16 Swiss Prime Site AG 40 3,128 0.04 Swiss Re AG 438 35,240 0.48 Swisscom AG 19 8,052 0.11 Syngenta AG 44 17,165 0.23 UBS Group AG 2,388 29,000 0.39 Zurich Insurance Group AG 284 65,173 0.89
642,074 8.75 United Kingdom 3i Group Plc 758 5,700 0.08 Aberdeen Asset Management Plc 902 3,402 0.05 Admiral Group Plc 134 3,174 0.04 Aggreko Plc 252 2,777 0.04 Amec Foster Wheeler Plc 925 6,111 0.08 Anglo American Plc 4,767 53,316 0.73 Antofagasta Plc 698 4,228 0.06 Ashtead Group Plc 241 3,541 0.05 Associated British Foods Plc 138 4,147 0.06 AstraZeneca Plc 1,044 60,386 0.82 Aviva Plc 5,531 28,162 0.38 Babcock International Group Plc 170 2,034 0.03 BAE Systems Plc 3,049 18,468 0.25 Balfour Beatty Plc 855 2,761 0.04 Barclays Plc 34,656 67,219 0.92 Barratt Developments Plc 557 3,182 0.04 Berkeley Group Holdings Plc 77 2,296 0.03 BHP Billiton Plc 4,237 56,934 0.78 Booker Group Plc 1,121 2,306 0.03 BP Plc 44,252 230,179 3.14 British American Tobacco Plc 1,049 59,778 0.81 British Land Co Plc/The 690 5,045 0.07
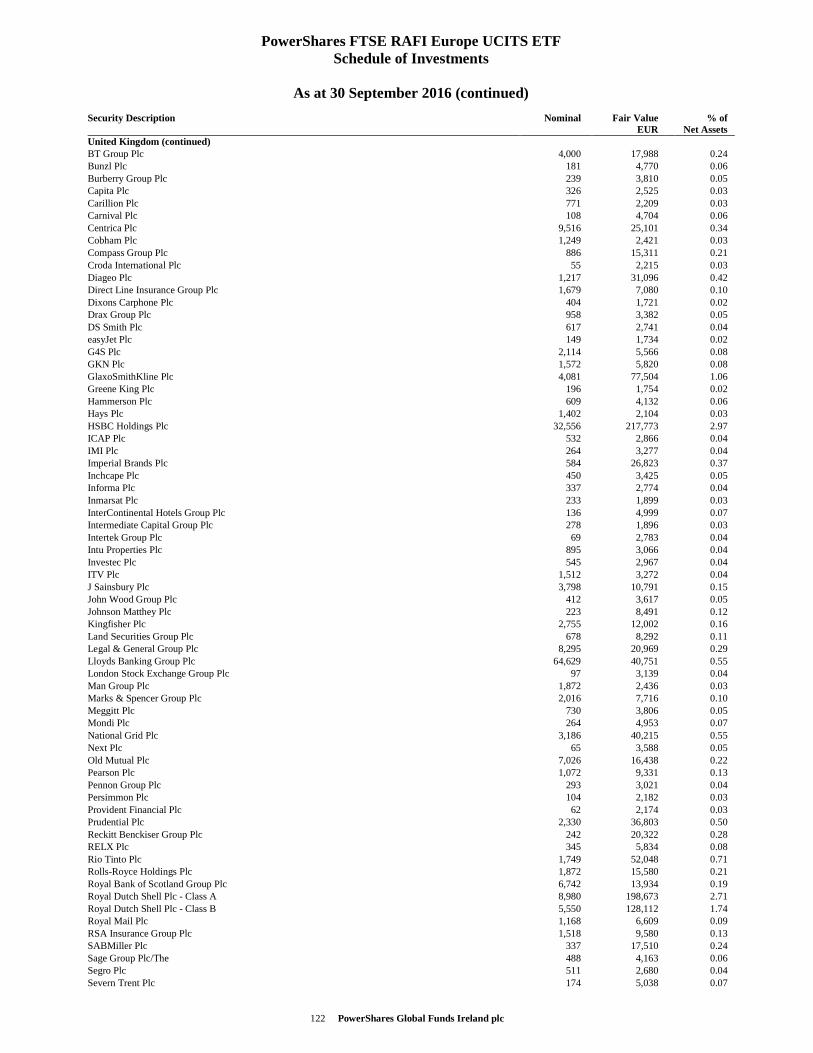
122 PowerShares Global Funds Ireland plc
PowerShares FTSE RAFI Europe UCITS ETF Schedule of Investments
As at 30 September 2016 (continued)
Security Description Nominal Fair Value EUR
% of Net Assets
United Kingdom (continued) BT Group Plc 4,000 17,988 0.24 Bunzl Plc 181 4,770 0.06 Burberry Group Plc 239 3,810 0.05 Capita Plc 326 2,525 0.03 Carillion Plc 771 2,209 0.03 Carnival Plc 108 4,704 0.06 Centrica Plc 9,516 25,101 0.34 Cobham Plc 1,249 2,421 0.03 Compass Group Plc 886 15,311 0.21 Croda International Plc 55 2,215 0.03 Diageo Plc 1,217 31,096 0.42 Direct Line Insurance Group Plc 1,679 7,080 0.10 Dixons Carphone Plc 404 1,721 0.02 Drax Group Plc 958 3,382 0.05 DS Smith Plc 617 2,741 0.04 easyJet Plc 149 1,734 0.02 G4S Plc 2,114 5,566 0.08 GKN Plc 1,572 5,820 0.08 GlaxoSmithKline Plc 4,081 77,504 1.06 Greene King Plc 196 1,754 0.02 Hammerson Plc 609 4,132 0.06 Hays Plc 1,402 2,104 0.03 HSBC Holdings Plc 32,556 217,773 2.97 ICAP Plc 532 2,866 0.04 IMI Plc 264 3,277 0.04 Imperial Brands Plc 584 26,823 0.37 Inchcape Plc 450 3,425 0.05 Informa Plc 337 2,774 0.04 Inmarsat Plc 233 1,899 0.03 InterContinental Hotels Group Plc 136 4,999 0.07 Intermediate Capital Group Plc 278 1,896 0.03 Intertek Group Plc 69 2,783 0.04 Intu Properties Plc 895 3,066 0.04 Investec Plc 545 2,967 0.04 ITV Plc 1,512 3,272 0.04 J Sainsbury Plc 3,798 10,791 0.15 John Wood Group Plc 412 3,617 0.05 Johnson Matthey Plc 223 8,491 0.12 Kingfisher Plc 2,755 12,002 0.16 Land Securities Group Plc 678 8,292 0.11 Legal & General Group Plc 8,295 20,969 0.29 Lloyds Banking Group Plc 64,629 40,751 0.55 London Stock Exchange Group Plc 97 3,139 0.04 Man Group Plc 1,872 2,436 0.03 Marks & Spencer Group Plc 2,016 7,716 0.10 Meggitt Plc 730 3,806 0.05 Mondi Plc 264 4,953 0.07 National Grid Plc 3,186 40,215 0.55 Next Plc 65 3,588 0.05 Old Mutual Plc 7,026 16,438 0.22 Pearson Plc 1,072 9,331 0.13 Pennon Group Plc 293 3,021 0.04 Persimmon Plc 104 2,182 0.03 Provident Financial Plc 62 2,174 0.03 Prudential Plc 2,330 36,803 0.50 Reckitt Benckiser Group Plc 242 20,322 0.28 RELX Plc 345 5,834 0.08 Rio Tinto Plc 1,749 52,048 0.71 Rolls-Royce Holdings Plc 1,872 15,580 0.21 Royal Bank of Scotland Group Plc 6,742 13,934 0.19 Royal Dutch Shell Plc - Class A 8,980 198,673 2.71 Royal Dutch Shell Plc - Class B 5,550 128,112 1.74 Royal Mail Plc 1,168 6,609 0.09 RSA Insurance Group Plc 1,518 9,580 0.13 SABMiller Plc 337 17,510 0.24 Sage Group Plc/The 488 4,163 0.06 Segro Plc 511 2,680 0.04 Severn Trent Plc 174 5,038 0.07
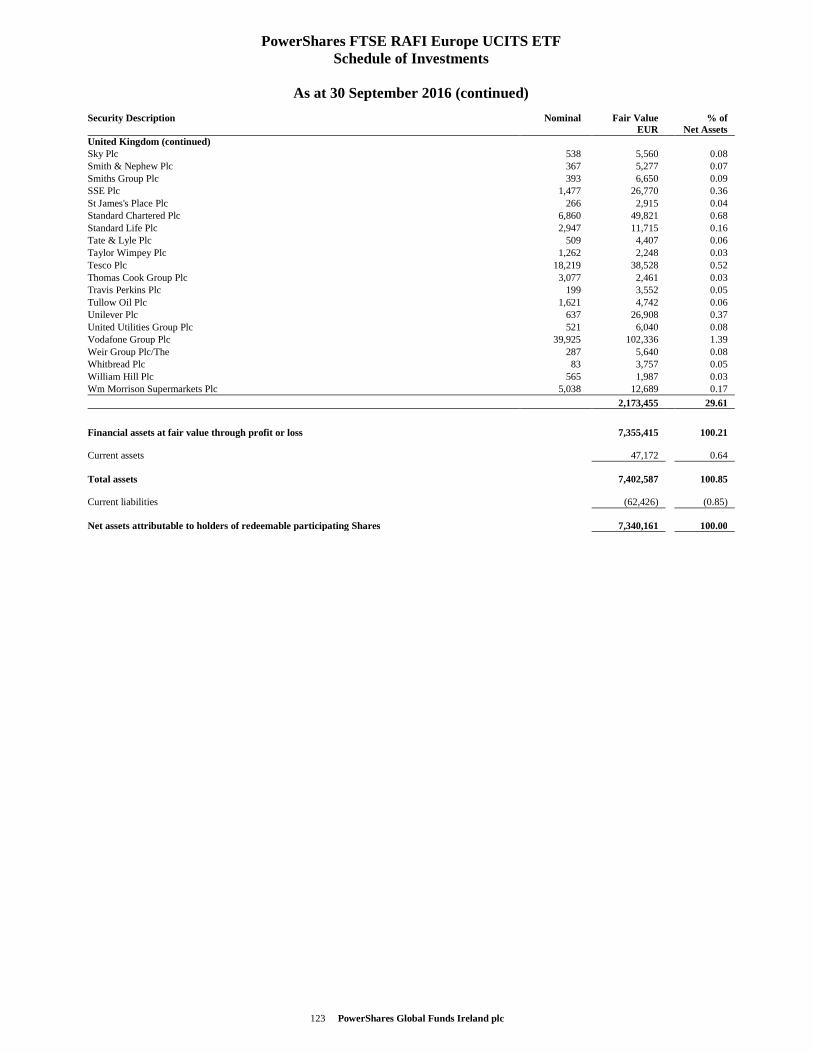
123 PowerShares Global Funds Ireland plc
PowerShares FTSE RAFI Europe UCITS ETF Schedule of Investments
As at 30 September 2016 (continued)
Security Description Nominal Fair Value EUR
% of Net Assets
United Kingdom (continued) Sky Plc 538 5,560 0.08 Smith & Nephew Plc 367 5,277 0.07 Smiths Group Plc 393 6,650 0.09 SSE Plc 1,477 26,770 0.36 St James's Place Plc 266 2,915 0.04 Standard Chartered Plc 6,860 49,821 0.68 Standard Life Plc 2,947 11,715 0.16 Tate & Lyle Plc 509 4,407 0.06 Taylor Wimpey Plc 1,262 2,248 0.03 Tesco Plc 18,219 38,528 0.52 Thomas Cook Group Plc 3,077 2,461 0.03 Travis Perkins Plc 199 3,552 0.05 Tullow Oil Plc 1,621 4,742 0.06 Unilever Plc 637 26,908 0.37 United Utilities Group Plc 521 6,040 0.08 Vodafone Group Plc 39,925 102,336 1.39 Weir Group Plc/The 287 5,640 0.08 Whitbread Plc 83 3,757 0.05 William Hill Plc 565 1,987 0.03 Wm Morrison Supermarkets Plc 5,038 12,689 0.17
2,173,455 29.61
Financial assets at fair value through profit or loss 7,355,415 100.21 Current assets 47,172 0.64 Total assets 7,402,587 100.85 Current liabilities (62,426) (0.85) Net assets attributable to holders of redeemable participating Shares 7,340,161 100.00
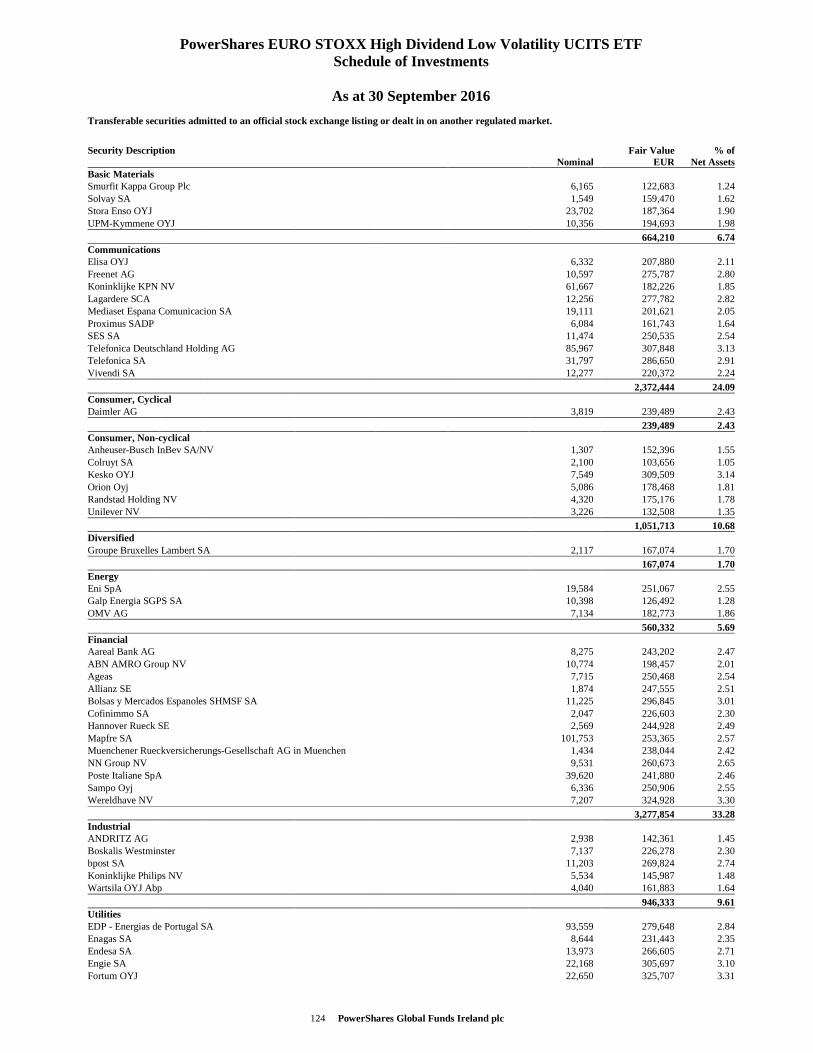
124 PowerShares Global Funds Ireland plc
PowerShares EURO STOXX High Dividend Low Volatility UCITS ETF Schedule of Investments
As at 30 September 2016
Transferable securities admitted to an official stock exchange listing or dealt in on another regulated market.
Security Description Nominal
Fair ValueEUR
% ofNet Assets
Basic Materials Smurfit Kappa Group Plc 6,165 122,683 1.24Solvay SA 1,549 159,470 1.62Stora Enso OYJ 23,702 187,364 1.90UPM-Kymmene OYJ 10,356 194,693 1.98
664,210 6.74Communications Elisa OYJ 6,332 207,880 2.11Freenet AG 10,597 275,787 2.80Koninklijke KPN NV 61,667 182,226 1.85Lagardere SCA 12,256 277,782 2.82Mediaset Espana Comunicacion SA 19,111 201,621 2.05Proximus SADP 6,084 161,743 1.64SES SA 11,474 250,535 2.54Telefonica Deutschland Holding AG 85,967 307,848 3.13Telefonica SA 31,797 286,650 2.91Vivendi SA 12,277 220,372 2.24
2,372,444 24.09Consumer, Cyclical Daimler AG 3,819 239,489 2.43
239,489 2.43Consumer, Non-cyclical Anheuser-Busch InBev SA/NV 1,307 152,396 1.55Colruyt SA 2,100 103,656 1.05Kesko OYJ 7,549 309,509 3.14Orion Oyj 5,086 178,468 1.81Randstad Holding NV 4,320 175,176 1.78Unilever NV 3,226 132,508 1.35
1,051,713 10.68Diversified Groupe Bruxelles Lambert SA 2,117 167,074 1.70
167,074 1.70Energy Eni SpA 19,584 251,067 2.55Galp Energia SGPS SA 10,398 126,492 1.28OMV AG 7,134 182,773 1.86
560,332 5.69Financial Aareal Bank AG 8,275 243,202 2.47ABN AMRO Group NV 10,774 198,457 2.01Ageas 7,715 250,468 2.54Allianz SE 1,874 247,555 2.51Bolsas y Mercados Espanoles SHMSF SA 11,225 296,845 3.01Cofinimmo SA 2,047 226,603 2.30Hannover Rueck SE 2,569 244,928 2.49Mapfre SA 101,753 253,365 2.57Muenchener Rueckversicherungs-Gesellschaft AG in Muenchen 1,434 238,044 2.42NN Group NV 9,531 260,673 2.65Poste Italiane SpA 39,620 241,880 2.46Sampo Oyj 6,336 250,906 2.55Wereldhave NV 7,207 324,928 3.30
3,277,854 33.28Industrial ANDRITZ AG 2,938 142,361 1.45Boskalis Westminster 7,137 226,278 2.30bpost SA 11,203 269,824 2.74Koninklijke Philips NV 5,534 145,987 1.48Wartsila OYJ Abp 4,040 161,883 1.64
946,333 9.61Utilities EDP - Energias de Portugal SA 93,559 279,648 2.84Enagas SA 8,644 231,443 2.35Endesa SA 13,973 266,605 2.71Engie SA 22,168 305,697 3.10Fortum OYJ 22,650 325,707 3.31

125 PowerShares Global Funds Ireland plc
PowerShares EURO STOXX High Dividend Low Volatility UCITS ETF Schedule of Investments
As at 30 September 2016 (continued)
Security Description Nominal
Fair ValueEUR
% ofNet Assets
Utilities (continued) Gas Natural SDG SA 11,869 217,143 2.21Snam SpA 46,320 228,635 2.32
1,854,878 18.84
Financial assets at fair value through profit or loss 11,134,327 113.06
Current assets 30,010 0.31
Total assets 11,164,337 113.37
Current liabilities (1,316,367) (13.37)
Net assets attributable to holders of redeemable participating Shares 9,847,970 100.00
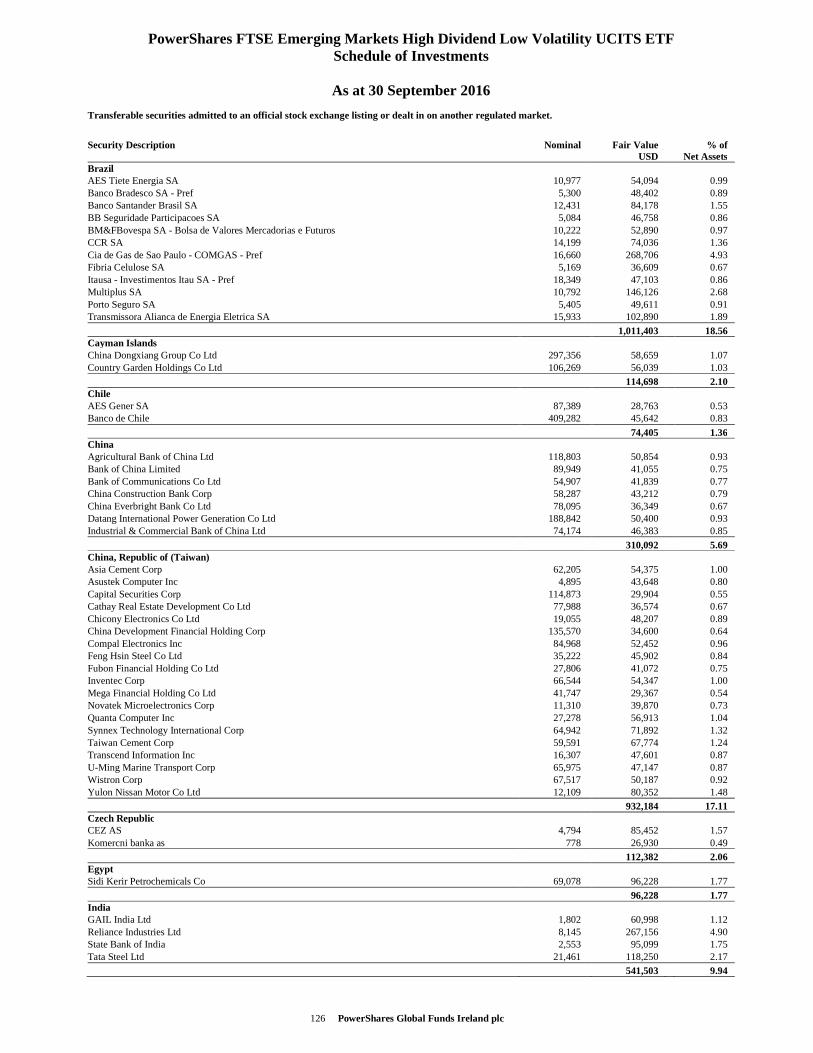
126 PowerShares Global Funds Ireland plc
PowerShares FTSE Emerging Markets High Dividend Low Volatility UCITS ETF Schedule of Investments
As at 30 September 2016
Transferable securities admitted to an official stock exchange listing or dealt in on another regulated market.
Security Description Nominal Fair Value USD
% of Net Assets
Brazil AES Tiete Energia SA 10,977 54,094 0.99 Banco Bradesco SA - Pref 5,300 48,402 0.89 Banco Santander Brasil SA 12,431 84,178 1.55 BB Seguridade Participacoes SA 5,084 46,758 0.86 BM&FBovespa SA - Bolsa de Valores Mercadorias e Futuros 10,222 52,890 0.97 CCR SA 14,199 74,036 1.36 Cia de Gas de Sao Paulo - COMGAS - Pref 16,660 268,706 4.93 Fibria Celulose SA 5,169 36,609 0.67 Itausa - Investimentos Itau SA - Pref 18,349 47,103 0.86 Multiplus SA 10,792 146,126 2.68 Porto Seguro SA 5,405 49,611 0.91 Transmissora Alianca de Energia Eletrica SA 15,933 102,890 1.89
1,011,403 18.56 Cayman Islands China Dongxiang Group Co Ltd 297,356 58,659 1.07 Country Garden Holdings Co Ltd 106,269 56,039 1.03
114,698 2.10 Chile AES Gener SA 87,389 28,763 0.53 Banco de Chile 409,282 45,642 0.83
74,405 1.36 China Agricultural Bank of China Ltd 118,803 50,854 0.93 Bank of China Limited 89,949 41,055 0.75 Bank of Communications Co Ltd 54,907 41,839 0.77 China Construction Bank Corp 58,287 43,212 0.79 China Everbright Bank Co Ltd 78,095 36,349 0.67 Datang International Power Generation Co Ltd 188,842 50,400 0.93 Industrial & Commercial Bank of China Ltd 74,174 46,383 0.85
310,092 5.69 China, Republic of (Taiwan) Asia Cement Corp 62,205 54,375 1.00 Asustek Computer Inc 4,895 43,648 0.80 Capital Securities Corp 114,873 29,904 0.55 Cathay Real Estate Development Co Ltd 77,988 36,574 0.67 Chicony Electronics Co Ltd 19,055 48,207 0.89 China Development Financial Holding Corp 135,570 34,600 0.64 Compal Electronics Inc 84,968 52,452 0.96 Feng Hsin Steel Co Ltd 35,222 45,902 0.84 Fubon Financial Holding Co Ltd 27,806 41,072 0.75 Inventec Corp 66,544 54,347 1.00 Mega Financial Holding Co Ltd 41,747 29,367 0.54 Novatek Microelectronics Corp 11,310 39,870 0.73 Quanta Computer Inc 27,278 56,913 1.04 Synnex Technology International Corp 64,942 71,892 1.32 Taiwan Cement Corp 59,591 67,774 1.24 Transcend Information Inc 16,307 47,601 0.87 U-Ming Marine Transport Corp 65,975 47,147 0.87 Wistron Corp 67,517 50,187 0.92 Yulon Nissan Motor Co Ltd 12,109 80,352 1.48
932,184 17.11 Czech Republic CEZ AS 4,794 85,452 1.57 Komercni banka as 778 26,930 0.49
112,382 2.06 Egypt Sidi Kerir Petrochemicals Co 69,078 96,228 1.77
96,228 1.77 India GAIL India Ltd 1,802 60,998 1.12 Reliance Industries Ltd 8,145 267,156 4.90 State Bank of India 2,553 95,099 1.75 Tata Steel Ltd 21,461 118,250 2.17
541,503 9.94
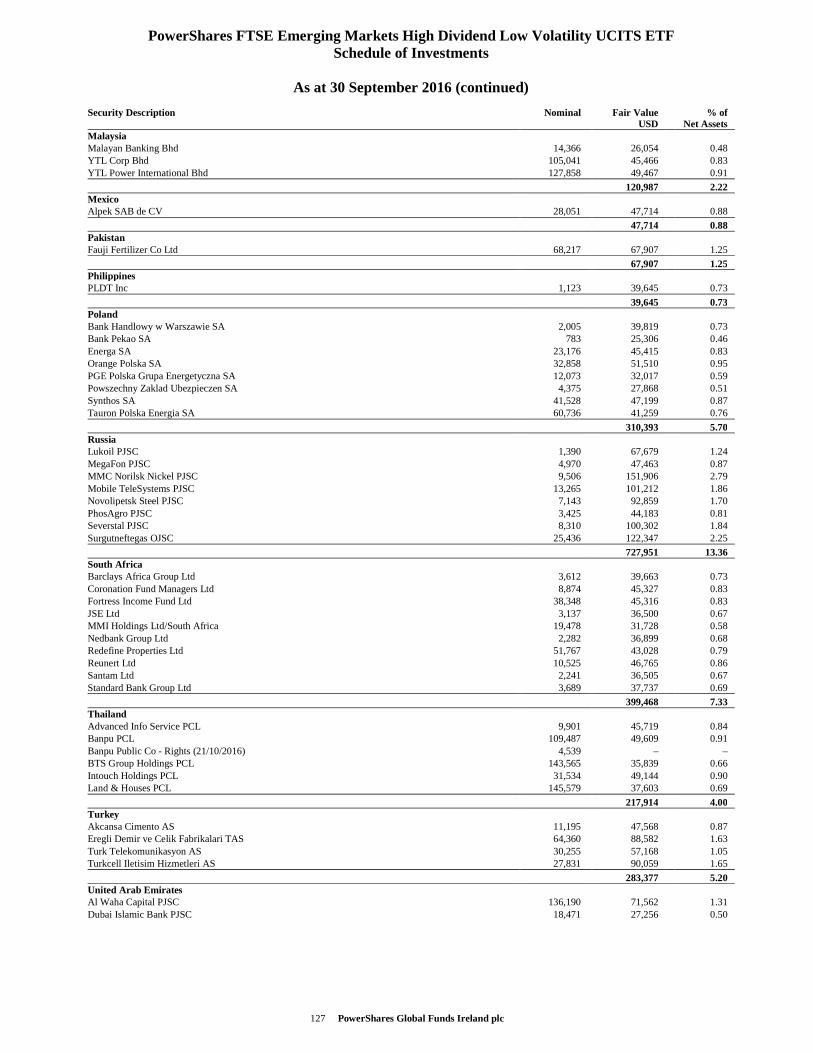
127 PowerShares Global Funds Ireland plc
PowerShares FTSE Emerging Markets High Dividend Low Volatility UCITS ETF Schedule of Investments
As at 30 September 2016 (continued)
Security Description Nominal Fair Value USD
% of Net Assets
Malaysia Malayan Banking Bhd 14,366 26,054 0.48 YTL Corp Bhd 105,041 45,466 0.83 YTL Power International Bhd 127,858 49,467 0.91
120,987 2.22 Mexico Alpek SAB de CV 28,051 47,714 0.88
47,714 0.88 Pakistan Fauji Fertilizer Co Ltd 68,217 67,907 1.25
67,907 1.25 Philippines PLDT Inc 1,123 39,645 0.73
39,645 0.73 Poland Bank Handlowy w Warszawie SA 2,005 39,819 0.73 Bank Pekao SA 783 25,306 0.46 Energa SA 23,176 45,415 0.83 Orange Polska SA 32,858 51,510 0.95 PGE Polska Grupa Energetyczna SA 12,073 32,017 0.59 Powszechny Zaklad Ubezpieczen SA 4,375 27,868 0.51 Synthos SA 41,528 47,199 0.87 Tauron Polska Energia SA 60,736 41,259 0.76
310,393 5.70 Russia Lukoil PJSC 1,390 67,679 1.24 MegaFon PJSC 4,970 47,463 0.87 MMC Norilsk Nickel PJSC 9,506 151,906 2.79 Mobile TeleSystems PJSC 13,265 101,212 1.86 Novolipetsk Steel PJSC 7,143 92,859 1.70 PhosAgro PJSC 3,425 44,183 0.81 Severstal PJSC 8,310 100,302 1.84 Surgutneftegas OJSC 25,436 122,347 2.25
727,951 13.36 South Africa Barclays Africa Group Ltd 3,612 39,663 0.73 Coronation Fund Managers Ltd 8,874 45,327 0.83 Fortress Income Fund Ltd 38,348 45,316 0.83 JSE Ltd 3,137 36,500 0.67 MMI Holdings Ltd/South Africa 19,478 31,728 0.58 Nedbank Group Ltd 2,282 36,899 0.68 Redefine Properties Ltd 51,767 43,028 0.79 Reunert Ltd 10,525 46,765 0.86 Santam Ltd 2,241 36,505 0.67 Standard Bank Group Ltd 3,689 37,737 0.69
399,468 7.33 Thailand Advanced Info Service PCL 9,901 45,719 0.84 Banpu PCL 109,487 49,609 0.91 Banpu Public Co - Rights (21/10/2016) 4,539 – – BTS Group Holdings PCL 143,565 35,839 0.66 Intouch Holdings PCL 31,534 49,144 0.90 Land & Houses PCL 145,579 37,603 0.69
217,914 4.00 Turkey Akcansa Cimento AS 11,195 47,568 0.87 Eregli Demir ve Celik Fabrikalari TAS 64,360 88,582 1.63 Turk Telekomunikasyon AS 30,255 57,168 1.05 Turkcell Iletisim Hizmetleri AS 27,831 90,059 1.65
283,377 5.20 United Arab Emirates Al Waha Capital PJSC 136,190 71,562 1.31 Dubai Islamic Bank PJSC 18,471 27,256 0.50
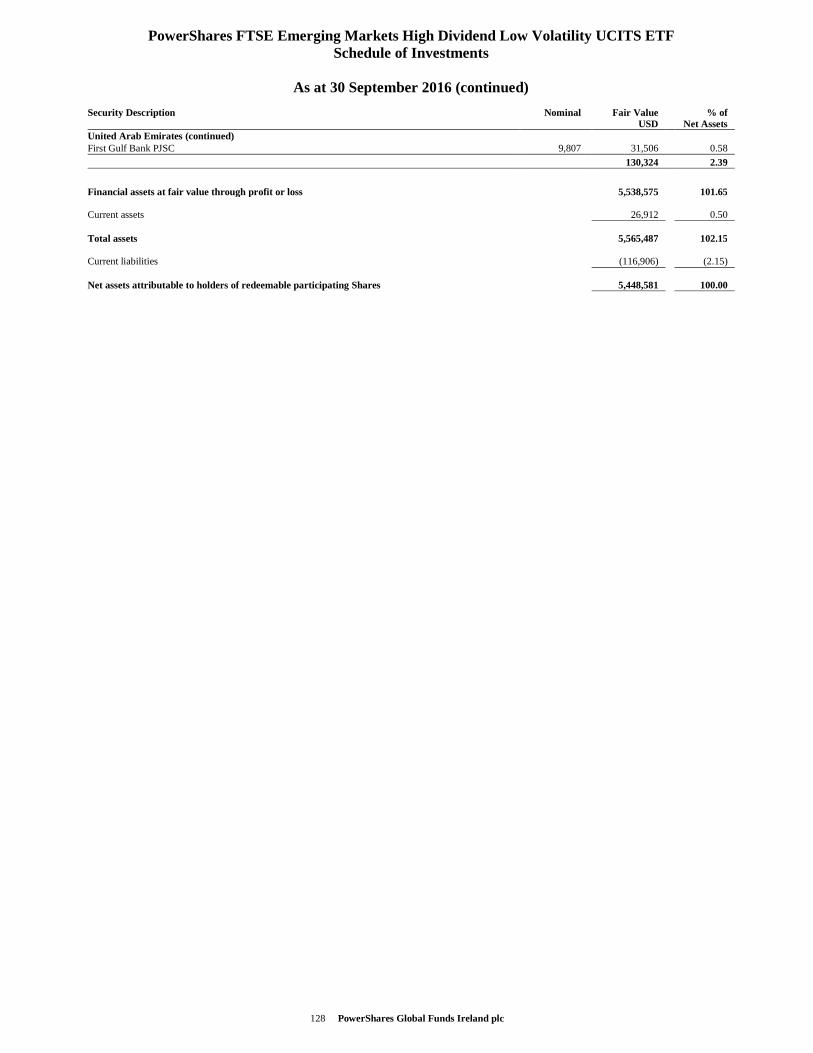
128 PowerShares Global Funds Ireland plc
PowerShares FTSE Emerging Markets High Dividend Low Volatility UCITS ETF Schedule of Investments
As at 30 September 2016 (continued)
Security Description Nominal Fair Value USD
% of Net Assets
United Arab Emirates (continued) First Gulf Bank PJSC 9,807 31,506 0.58
130,324 2.39
Financial assets at fair value through profit or loss 5,538,575 101.65 Current assets 26,912 0.50 Total assets 5,565,487 102.15 Current liabilities (116,906) (2.15) Net assets attributable to holders of redeemable participating Shares 5,448,581 100.00
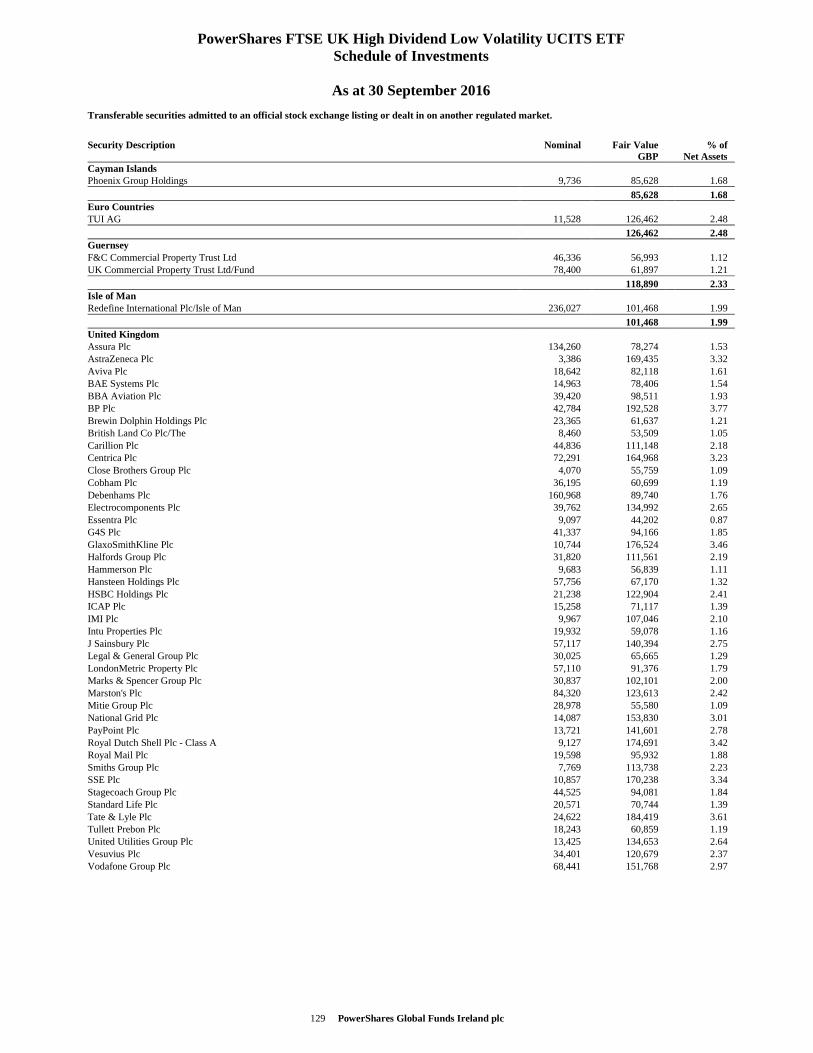
129 PowerShares Global Funds Ireland plc
PowerShares FTSE UK High Dividend Low Volatility UCITS ETF Schedule of Investments
As at 30 September 2016
Transferable securities admitted to an official stock exchange listing or dealt in on another regulated market.
Security Description Nominal Fair Value GBP
% of Net Assets
Cayman Islands Phoenix Group Holdings 9,736 85,628 1.68
85,628 1.68 Euro Countries TUI AG 11,528 126,462 2.48
126,462 2.48 Guernsey F&C Commercial Property Trust Ltd 46,336 56,993 1.12 UK Commercial Property Trust Ltd/Fund 78,400 61,897 1.21
118,890 2.33 Isle of Man Redefine International Plc/Isle of Man 236,027 101,468 1.99
101,468 1.99 United Kingdom Assura Plc 134,260 78,274 1.53 AstraZeneca Plc 3,386 169,435 3.32 Aviva Plc 18,642 82,118 1.61 BAE Systems Plc 14,963 78,406 1.54 BBA Aviation Plc 39,420 98,511 1.93 BP Plc 42,784 192,528 3.77 Brewin Dolphin Holdings Plc 23,365 61,637 1.21 British Land Co Plc/The 8,460 53,509 1.05 Carillion Plc 44,836 111,148 2.18 Centrica Plc 72,291 164,968 3.23 Close Brothers Group Plc 4,070 55,759 1.09 Cobham Plc 36,195 60,699 1.19 Debenhams Plc 160,968 89,740 1.76 Electrocomponents Plc 39,762 134,992 2.65 Essentra Plc 9,097 44,202 0.87 G4S Plc 41,337 94,166 1.85 GlaxoSmithKline Plc 10,744 176,524 3.46 Halfords Group Plc 31,820 111,561 2.19 Hammerson Plc 9,683 56,839 1.11 Hansteen Holdings Plc 57,756 67,170 1.32 HSBC Holdings Plc 21,238 122,904 2.41 ICAP Plc 15,258 71,117 1.39 IMI Plc 9,967 107,046 2.10 Intu Properties Plc 19,932 59,078 1.16 J Sainsbury Plc 57,117 140,394 2.75 Legal & General Group Plc 30,025 65,665 1.29 LondonMetric Property Plc 57,110 91,376 1.79 Marks & Spencer Group Plc 30,837 102,101 2.00 Marston's Plc 84,320 123,613 2.42 Mitie Group Plc 28,978 55,580 1.09 National Grid Plc 14,087 153,830 3.01 PayPoint Plc 13,721 141,601 2.78 Royal Dutch Shell Plc - Class A 9,127 174,691 3.42 Royal Mail Plc 19,598 95,932 1.88 Smiths Group Plc 7,769 113,738 2.23 SSE Plc 10,857 170,238 3.34 Stagecoach Group Plc 44,525 94,081 1.84 Standard Life Plc 20,571 70,744 1.39 Tate & Lyle Plc 24,622 184,419 3.61 Tullett Prebon Plc 18,243 60,859 1.19 United Utilities Group Plc 13,425 134,653 2.64 Vesuvius Plc 34,401 120,679 2.37 Vodafone Group Plc 68,441 151,768 2.97
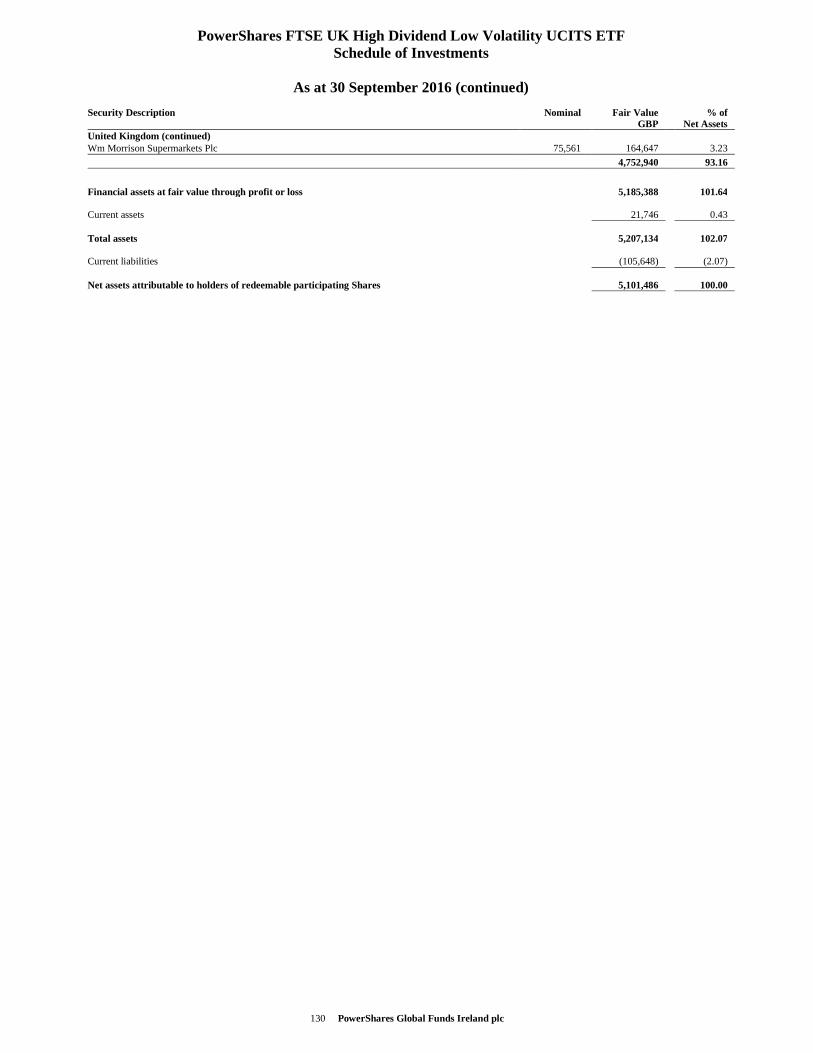
130 PowerShares Global Funds Ireland plc
PowerShares FTSE UK High Dividend Low Volatility UCITS ETF Schedule of Investments
As at 30 September 2016 (continued)
Security Description Nominal Fair Value GBP
% of Net Assets
United Kingdom (continued) Wm Morrison Supermarkets Plc 75,561 164,647 3.23
4,752,940 93.16
Financial assets at fair value through profit or loss 5,185,388 101.64 Current assets 21,746 0.43 Total assets 5,207,134 102.07 Current liabilities (105,648) (2.07) Net assets attributable to holders of redeemable participating Shares 5,101,486 100.00
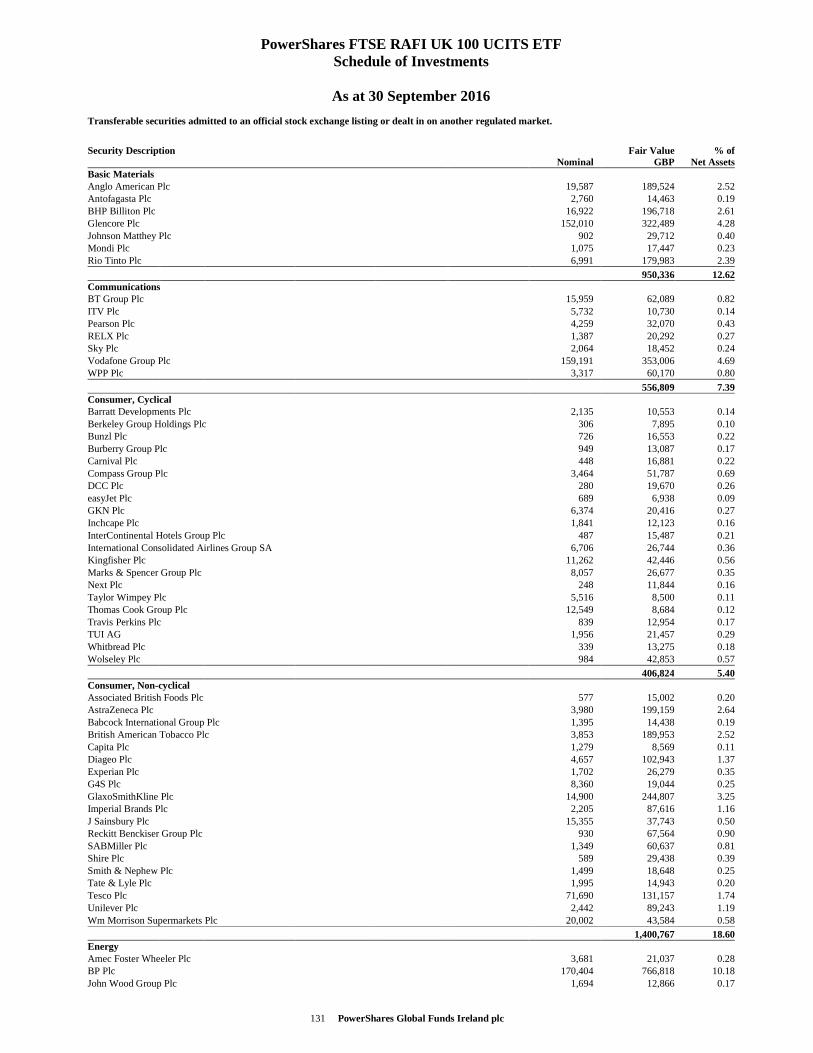
131 PowerShares Global Funds Ireland plc
PowerShares FTSE RAFI UK 100 UCITS ETF Schedule of Investments
As at 30 September 2016
Transferable securities admitted to an official stock exchange listing or dealt in on another regulated market.
Security Description Nominal
Fair ValueGBP
% ofNet Assets
Basic Materials Anglo American Plc 19,587 189,524 2.52Antofagasta Plc 2,760 14,463 0.19BHP Billiton Plc 16,922 196,718 2.61Glencore Plc 152,010 322,489 4.28Johnson Matthey Plc 902 29,712 0.40Mondi Plc 1,075 17,447 0.23Rio Tinto Plc 6,991 179,983 2.39
950,336 12.62Communications BT Group Plc 15,959 62,089 0.82ITV Plc 5,732 10,730 0.14Pearson Plc 4,259 32,070 0.43RELX Plc 1,387 20,292 0.27Sky Plc 2,064 18,452 0.24Vodafone Group Plc 159,191 353,006 4.69WPP Plc 3,317 60,170 0.80
556,809 7.39Consumer, Cyclical Barratt Developments Plc 2,135 10,553 0.14Berkeley Group Holdings Plc 306 7,895 0.10Bunzl Plc 726 16,553 0.22Burberry Group Plc 949 13,087 0.17Carnival Plc 448 16,881 0.22Compass Group Plc 3,464 51,787 0.69DCC Plc 280 19,670 0.26easyJet Plc 689 6,938 0.09GKN Plc 6,374 20,416 0.27Inchcape Plc 1,841 12,123 0.16InterContinental Hotels Group Plc 487 15,487 0.21International Consolidated Airlines Group SA 6,706 26,744 0.36Kingfisher Plc 11,262 42,446 0.56Marks & Spencer Group Plc 8,057 26,677 0.35Next Plc 248 11,844 0.16Taylor Wimpey Plc 5,516 8,500 0.11Thomas Cook Group Plc 12,549 8,684 0.12Travis Perkins Plc 839 12,954 0.17TUI AG 1,956 21,457 0.29Whitbread Plc 339 13,275 0.18Wolseley Plc 984 42,853 0.57
406,824 5.40Consumer, Non-cyclical Associated British Foods Plc 577 15,002 0.20AstraZeneca Plc 3,980 199,159 2.64Babcock International Group Plc 1,395 14,438 0.19British American Tobacco Plc 3,853 189,953 2.52Capita Plc 1,279 8,569 0.11Diageo Plc 4,657 102,943 1.37Experian Plc 1,702 26,279 0.35G4S Plc 8,360 19,044 0.25GlaxoSmithKline Plc 14,900 244,807 3.25Imperial Brands Plc 2,205 87,616 1.16J Sainsbury Plc 15,355 37,743 0.50Reckitt Benckiser Group Plc 930 67,564 0.90SABMiller Plc 1,349 60,637 0.81Shire Plc 589 29,438 0.39Smith & Nephew Plc 1,499 18,648 0.25Tate & Lyle Plc 1,995 14,943 0.20Tesco Plc 71,690 131,157 1.74Unilever Plc 2,442 89,243 1.19Wm Morrison Supermarkets Plc 20,002 43,584 0.58
1,400,767 18.60Energy Amec Foster Wheeler Plc 3,681 21,037 0.28BP Plc 170,404 766,818 10.18John Wood Group Plc 1,694 12,866 0.17
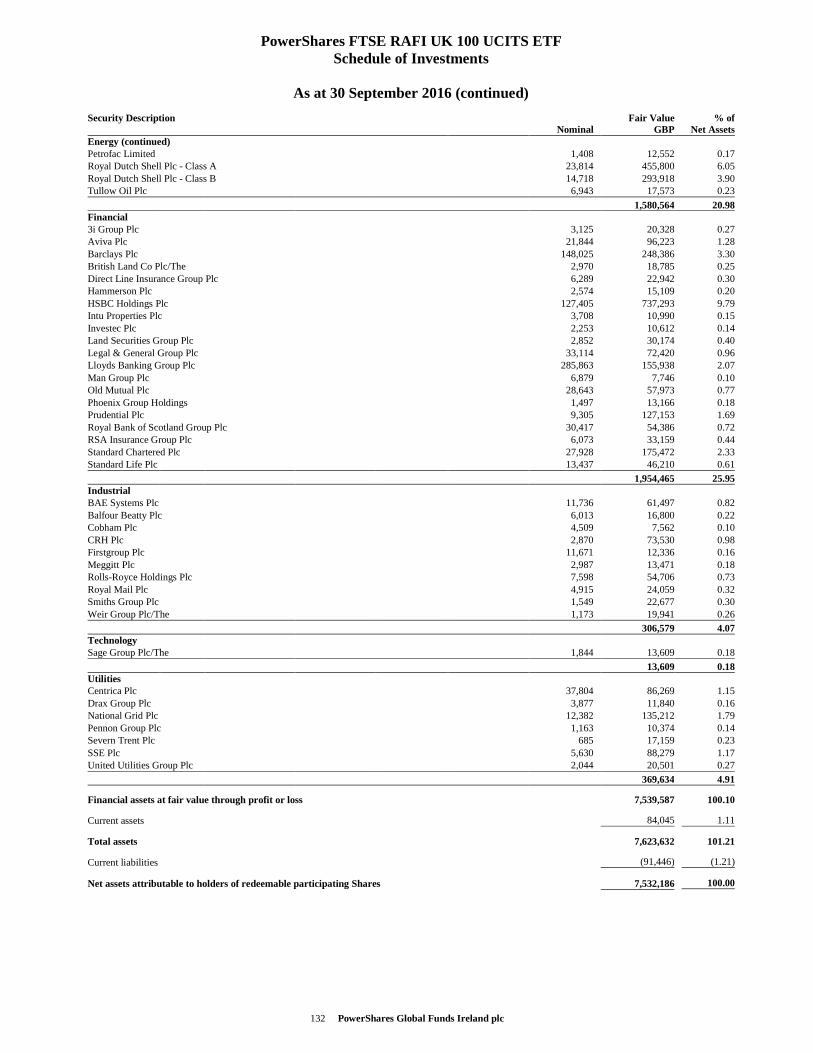
132 PowerShares Global Funds Ireland plc
PowerShares FTSE RAFI UK 100 UCITS ETF Schedule of Investments
As at 30 September 2016 (continued)
Security Description Nominal
Fair ValueGBP
% ofNet Assets
Energy (continued) Petrofac Limited 1,408 12,552 0.17Royal Dutch Shell Plc - Class A 23,814 455,800 6.05Royal Dutch Shell Plc - Class B 14,718 293,918 3.90Tullow Oil Plc 6,943 17,573 0.23
1,580,564 20.98Financial 3i Group Plc 3,125 20,328 0.27Aviva Plc 21,844 96,223 1.28Barclays Plc 148,025 248,386 3.30British Land Co Plc/The 2,970 18,785 0.25Direct Line Insurance Group Plc 6,289 22,942 0.30Hammerson Plc 2,574 15,109 0.20HSBC Holdings Plc 127,405 737,293 9.79Intu Properties Plc 3,708 10,990 0.15Investec Plc 2,253 10,612 0.14Land Securities Group Plc 2,852 30,174 0.40Legal & General Group Plc 33,114 72,420 0.96Lloyds Banking Group Plc 285,863 155,938 2.07Man Group Plc 6,879 7,746 0.10Old Mutual Plc 28,643 57,973 0.77Phoenix Group Holdings 1,497 13,166 0.18Prudential Plc 9,305 127,153 1.69Royal Bank of Scotland Group Plc 30,417 54,386 0.72RSA Insurance Group Plc 6,073 33,159 0.44Standard Chartered Plc 27,928 175,472 2.33Standard Life Plc 13,437 46,210 0.61
1,954,465 25.95Industrial BAE Systems Plc 11,736 61,497 0.82Balfour Beatty Plc 6,013 16,800 0.22Cobham Plc 4,509 7,562 0.10CRH Plc 2,870 73,530 0.98Firstgroup Plc 11,671 12,336 0.16Meggitt Plc 2,987 13,471 0.18Rolls-Royce Holdings Plc 7,598 54,706 0.73Royal Mail Plc 4,915 24,059 0.32Smiths Group Plc 1,549 22,677 0.30Weir Group Plc/The 1,173 19,941 0.26
306,579 4.07Technology Sage Group Plc/The 1,844 13,609 0.18
13,609 0.18Utilities Centrica Plc 37,804 86,269 1.15Drax Group Plc 3,877 11,840 0.16National Grid Plc 12,382 135,212 1.79Pennon Group Plc 1,163 10,374 0.14Severn Trent Plc 685 17,159 0.23SSE Plc 5,630 88,279 1.17United Utilities Group Plc 2,044 20,501 0.27
369,634 4.91
Financial assets at fair value through profit or loss 7,539,587 100.10
Current assets 84,045 1.11
Total assets 7,623,632 101.21
Current liabilities (91,446) (1.21)
Net assets attributable to holders of redeemable participating Shares 7,532,186 100.00
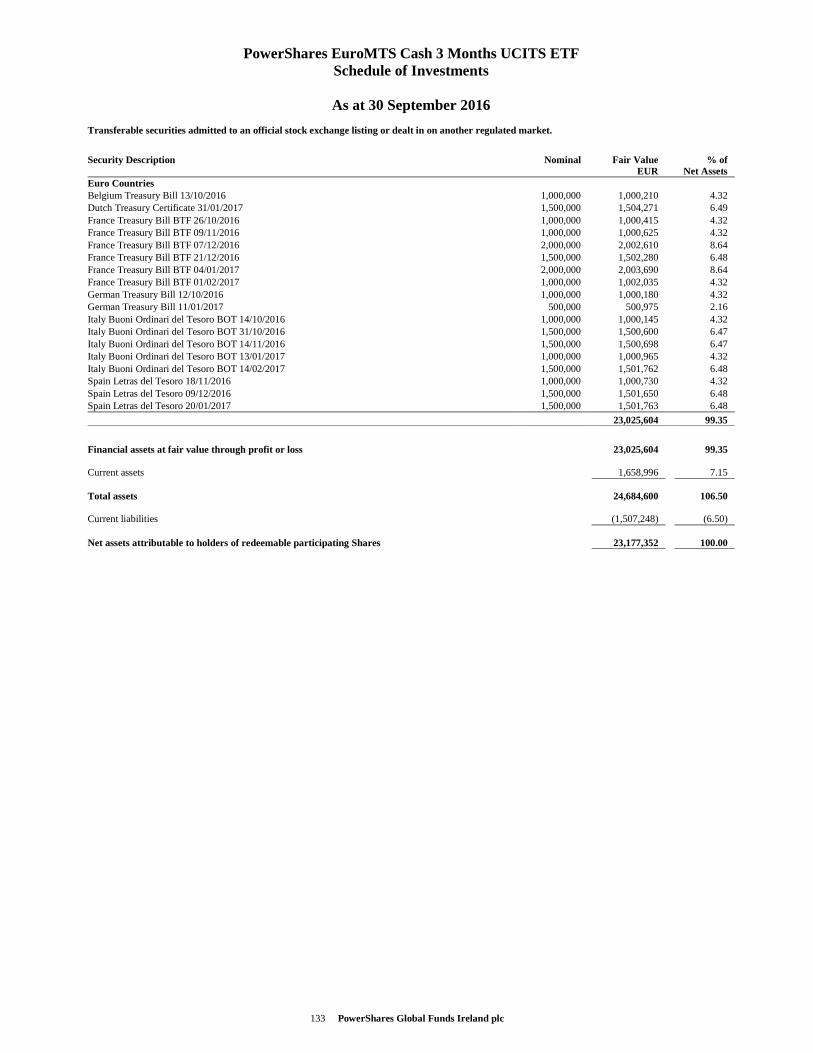
133 PowerShares Global Funds Ireland plc
PowerShares EuroMTS Cash 3 Months UCITS ETF Schedule of Investments
As at 30 September 2016
Transferable securities admitted to an official stock exchange listing or dealt in on another regulated market.
Security Description Nominal Fair Value EUR
% of Net Assets
Euro Countries Belgium Treasury Bill 13/10/2016 1,000,000 1,000,210 4.32 Dutch Treasury Certificate 31/01/2017 1,500,000 1,504,271 6.49 France Treasury Bill BTF 26/10/2016 1,000,000 1,000,415 4.32 France Treasury Bill BTF 09/11/2016 1,000,000 1,000,625 4.32 France Treasury Bill BTF 07/12/2016 2,000,000 2,002,610 8.64 France Treasury Bill BTF 21/12/2016 1,500,000 1,502,280 6.48 France Treasury Bill BTF 04/01/2017 2,000,000 2,003,690 8.64 France Treasury Bill BTF 01/02/2017 1,000,000 1,002,035 4.32 German Treasury Bill 12/10/2016 1,000,000 1,000,180 4.32 German Treasury Bill 11/01/2017 500,000 500,975 2.16 Italy Buoni Ordinari del Tesoro BOT 14/10/2016 1,000,000 1,000,145 4.32 Italy Buoni Ordinari del Tesoro BOT 31/10/2016 1,500,000 1,500,600 6.47 Italy Buoni Ordinari del Tesoro BOT 14/11/2016 1,500,000 1,500,698 6.47 Italy Buoni Ordinari del Tesoro BOT 13/01/2017 1,000,000 1,000,965 4.32 Italy Buoni Ordinari del Tesoro BOT 14/02/2017 1,500,000 1,501,762 6.48 Spain Letras del Tesoro 18/11/2016 1,000,000 1,000,730 4.32 Spain Letras del Tesoro 09/12/2016 1,500,000 1,501,650 6.48 Spain Letras del Tesoro 20/01/2017 1,500,000 1,501,763 6.48
23,025,604 99.35
Financial assets at fair value through profit or loss 23,025,604 99.35 Current assets 1,658,996 7.15 Total assets 24,684,600 106.50 Current liabilities (1,507,248) (6.50) Net assets attributable to holders of redeemable participating Shares 23,177,352 100.00
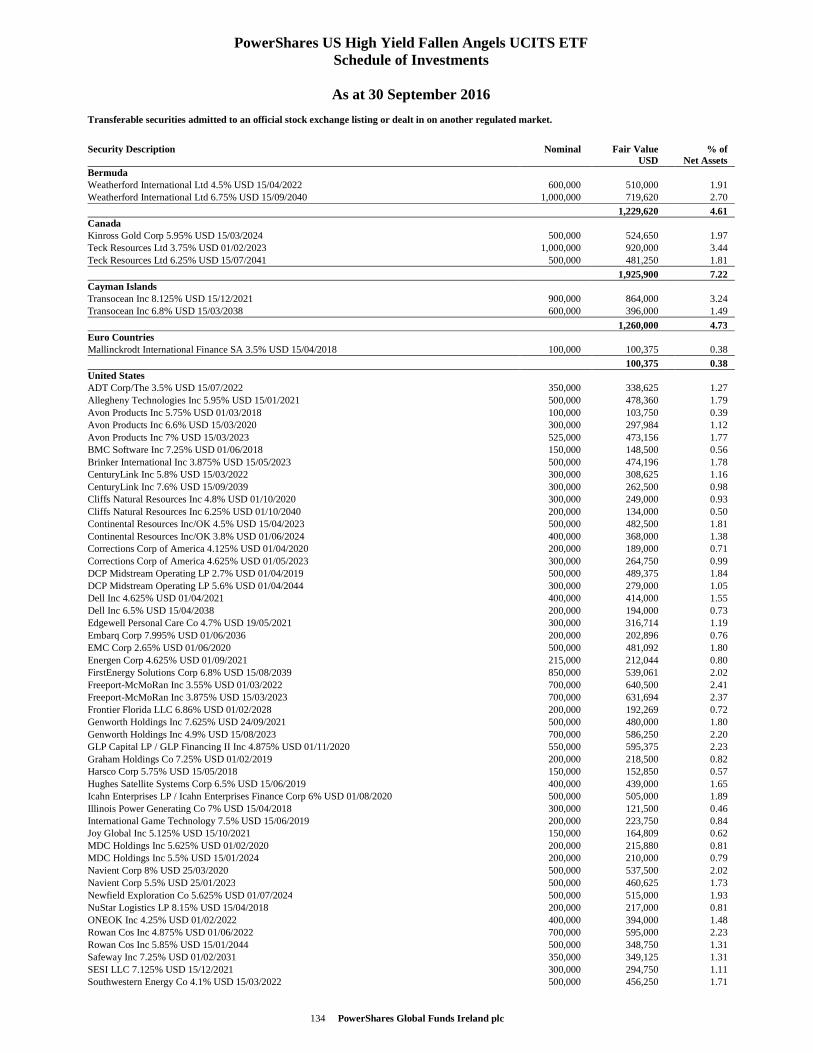
134 PowerShares Global Funds Ireland plc
PowerShares US High Yield Fallen Angels UCITS ETF Schedule of Investments
As at 30 September 2016
Transferable securities admitted to an official stock exchange listing or dealt in on another regulated market.
Security Description Nominal Fair Value USD
% of Net Assets
Bermuda Weatherford International Ltd 4.5% USD 15/04/2022 600,000 510,000 1.91 Weatherford International Ltd 6.75% USD 15/09/2040 1,000,000 719,620 2.70
1,229,620 4.61 Canada Kinross Gold Corp 5.95% USD 15/03/2024 500,000 524,650 1.97 Teck Resources Ltd 3.75% USD 01/02/2023 1,000,000 920,000 3.44 Teck Resources Ltd 6.25% USD 15/07/2041 500,000 481,250 1.81
1,925,900 7.22 Cayman Islands Transocean Inc 8.125% USD 15/12/2021 900,000 864,000 3.24 Transocean Inc 6.8% USD 15/03/2038 600,000 396,000 1.49
1,260,000 4.73 Euro Countries Mallinckrodt International Finance SA 3.5% USD 15/04/2018 100,000 100,375 0.38
100,375 0.38 United States ADT Corp/The 3.5% USD 15/07/2022 350,000 338,625 1.27 Allegheny Technologies Inc 5.95% USD 15/01/2021 500,000 478,360 1.79 Avon Products Inc 5.75% USD 01/03/2018 100,000 103,750 0.39 Avon Products Inc 6.6% USD 15/03/2020 300,000 297,984 1.12 Avon Products Inc 7% USD 15/03/2023 525,000 473,156 1.77 BMC Software Inc 7.25% USD 01/06/2018 150,000 148,500 0.56 Brinker International Inc 3.875% USD 15/05/2023 500,000 474,196 1.78 CenturyLink Inc 5.8% USD 15/03/2022 300,000 308,625 1.16 CenturyLink Inc 7.6% USD 15/09/2039 300,000 262,500 0.98 Cliffs Natural Resources Inc 4.8% USD 01/10/2020 300,000 249,000 0.93 Cliffs Natural Resources Inc 6.25% USD 01/10/2040 200,000 134,000 0.50 Continental Resources Inc/OK 4.5% USD 15/04/2023 500,000 482,500 1.81 Continental Resources Inc/OK 3.8% USD 01/06/2024 400,000 368,000 1.38 Corrections Corp of America 4.125% USD 01/04/2020 200,000 189,000 0.71 Corrections Corp of America 4.625% USD 01/05/2023 300,000 264,750 0.99 DCP Midstream Operating LP 2.7% USD 01/04/2019 500,000 489,375 1.84 DCP Midstream Operating LP 5.6% USD 01/04/2044 300,000 279,000 1.05 Dell Inc 4.625% USD 01/04/2021 400,000 414,000 1.55 Dell Inc 6.5% USD 15/04/2038 200,000 194,000 0.73 Edgewell Personal Care Co 4.7% USD 19/05/2021 300,000 316,714 1.19 Embarq Corp 7.995% USD 01/06/2036 200,000 202,896 0.76 EMC Corp 2.65% USD 01/06/2020 500,000 481,092 1.80 Energen Corp 4.625% USD 01/09/2021 215,000 212,044 0.80 FirstEnergy Solutions Corp 6.8% USD 15/08/2039 850,000 539,061 2.02 Freeport-McMoRan Inc 3.55% USD 01/03/2022 700,000 640,500 2.41 Freeport-McMoRan Inc 3.875% USD 15/03/2023 700,000 631,694 2.37 Frontier Florida LLC 6.86% USD 01/02/2028 200,000 192,269 0.72 Genworth Holdings Inc 7.625% USD 24/09/2021 500,000 480,000 1.80 Genworth Holdings Inc 4.9% USD 15/08/2023 700,000 586,250 2.20 GLP Capital LP / GLP Financing II Inc 4.875% USD 01/11/2020 550,000 595,375 2.23 Graham Holdings Co 7.25% USD 01/02/2019 200,000 218,500 0.82 Harsco Corp 5.75% USD 15/05/2018 150,000 152,850 0.57 Hughes Satellite Systems Corp 6.5% USD 15/06/2019 400,000 439,000 1.65 Icahn Enterprises LP / Icahn Enterprises Finance Corp 6% USD 01/08/2020 500,000 505,000 1.89 Illinois Power Generating Co 7% USD 15/04/2018 300,000 121,500 0.46 International Game Technology 7.5% USD 15/06/2019 200,000 223,750 0.84 Joy Global Inc 5.125% USD 15/10/2021 150,000 164,809 0.62 MDC Holdings Inc 5.625% USD 01/02/2020 200,000 215,880 0.81 MDC Holdings Inc 5.5% USD 15/01/2024 200,000 210,000 0.79 Navient Corp 8% USD 25/03/2020 500,000 537,500 2.02 Navient Corp 5.5% USD 25/01/2023 500,000 460,625 1.73 Newfield Exploration Co 5.625% USD 01/07/2024 500,000 515,000 1.93 NuStar Logistics LP 8.15% USD 15/04/2018 200,000 217,000 0.81 ONEOK Inc 4.25% USD 01/02/2022 400,000 394,000 1.48 Rowan Cos Inc 4.875% USD 01/06/2022 700,000 595,000 2.23 Rowan Cos Inc 5.85% USD 15/01/2044 500,000 348,750 1.31 Safeway Inc 7.25% USD 01/02/2031 350,000 349,125 1.31 SESI LLC 7.125% USD 15/12/2021 300,000 294,750 1.11 Southwestern Energy Co 4.1% USD 15/03/2022 500,000 456,250 1.71
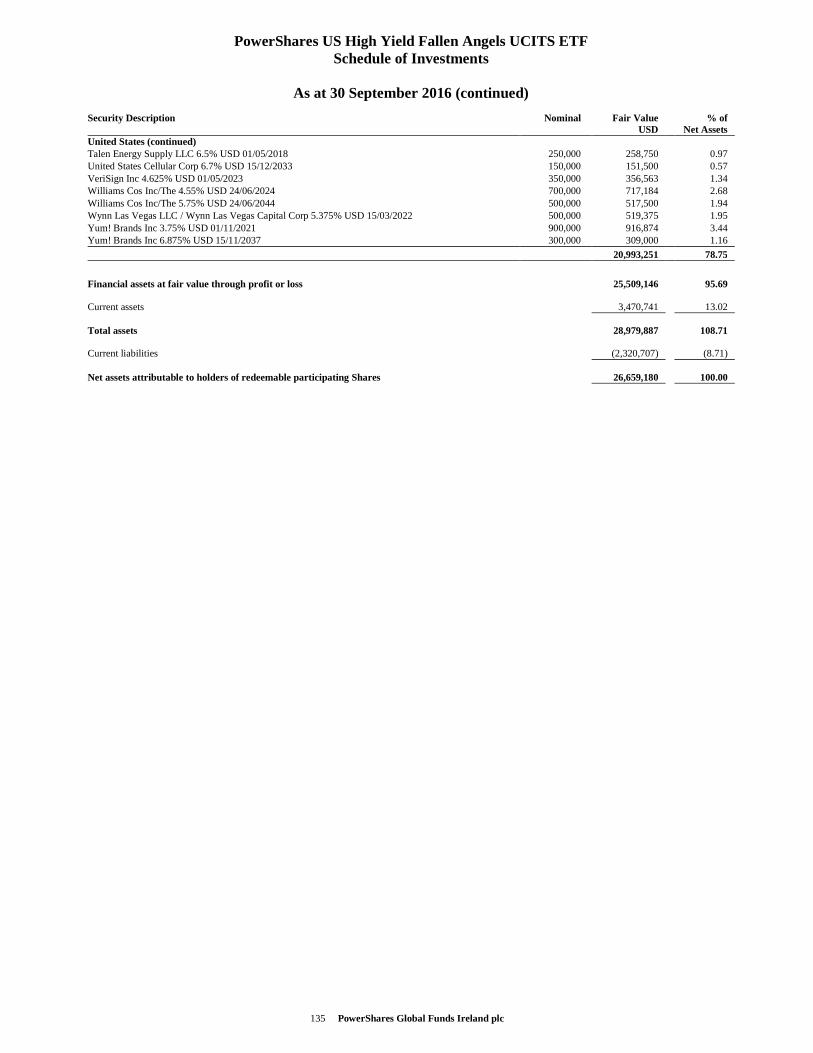
135 PowerShares Global Funds Ireland plc
PowerShares US High Yield Fallen Angels UCITS ETF Schedule of Investments
As at 30 September 2016 (continued)
Security Description Nominal Fair Value USD
% of Net Assets
United States (continued) Talen Energy Supply LLC 6.5% USD 01/05/2018 250,000 258,750 0.97 United States Cellular Corp 6.7% USD 15/12/2033 150,000 151,500 0.57 VeriSign Inc 4.625% USD 01/05/2023 350,000 356,563 1.34 Williams Cos Inc/The 4.55% USD 24/06/2024 700,000 717,184 2.68 Williams Cos Inc/The 5.75% USD 24/06/2044 500,000 517,500 1.94 Wynn Las Vegas LLC / Wynn Las Vegas Capital Corp 5.375% USD 15/03/2022 500,000 519,375 1.95 Yum! Brands Inc 3.75% USD 01/11/2021 900,000 916,874 3.44 Yum! Brands Inc 6.875% USD 15/11/2037 300,000 309,000 1.16
20,993,251 78.75
Financial assets at fair value through profit or loss 25,509,146 95.69 Current assets 3,470,741 13.02 Total assets 28,979,887 108.71 Current liabilities (2,320,707) (8.71) Net assets attributable to holders of redeemable participating Shares 26,659,180 100.00
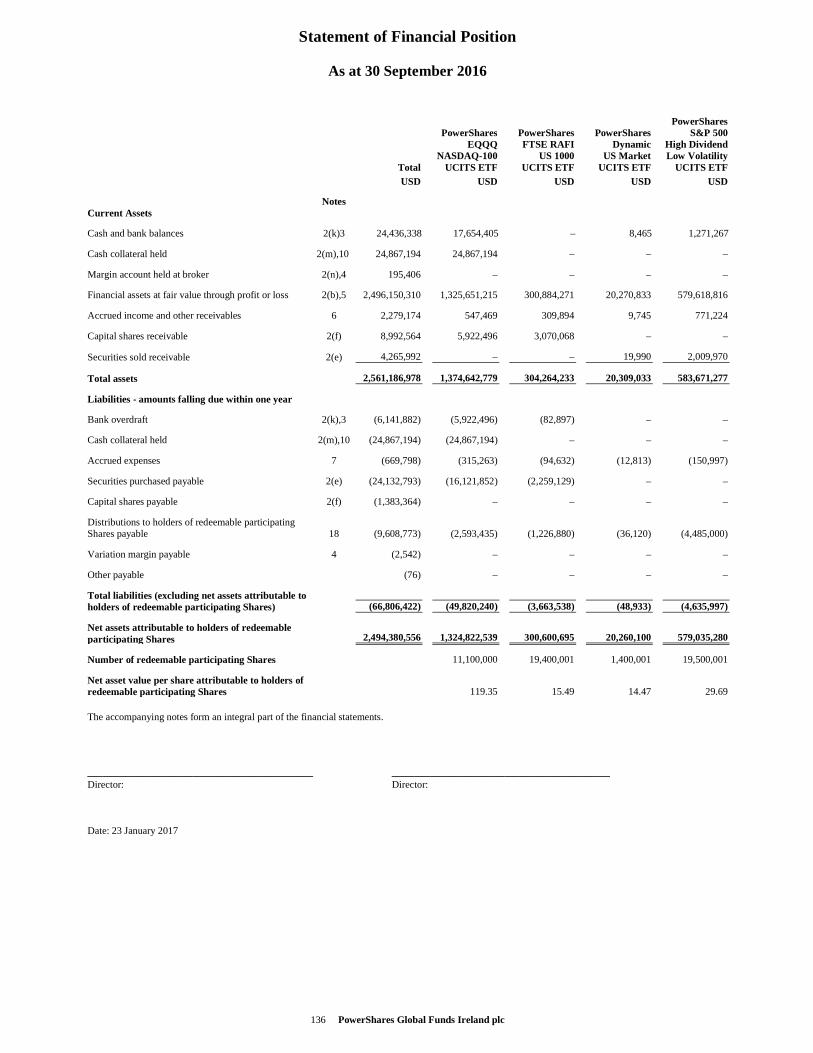
Statement of Financial Position
136 PowerShares Global Funds Ireland plc
As at 30 September 2016
PowerShares PowerShares PowerShares PowerShares S&P 500 EQQQ FTSE RAFI Dynamic High Dividend NASDAQ-100 US 1000 US Market Low Volatility Total UCITS ETF UCITS ETF UCITS ETF UCITS ETF
USD USD USD USD USD
Notes Current Assets
Cash and bank balances 2(k)3 24,436,338 17,654,405 – 8,465 1,271,267
Cash collateral held 2(m),10 24,867,194 24,867,194 – – –
Margin account held at broker 2(n),4 195,406 – – – –
Financial assets at fair value through profit or loss 2(b),5 2,496,150,310 1,325,651,215 300,884,271 20,270,833 579,618,816
Accrued income and other receivables 6 2,279,174 547,469 309,894 9,745 771,224
Capital shares receivable 2(f) 8,992,564 5,922,496 3,070,068 – –
Securities sold receivable 2(e) 4,265,992 – – 19,990 2,009,970
Total assets 2,561,186,978 1,374,642,779 304,264,233 20,309,033 583,671,277
Liabilities - amounts falling due within one year
Bank overdraft 2(k),3 (6,141,882) (5,922,496) (82,897) – –
Cash collateral held 2(m),10 (24,867,194) (24,867,194) – – –
Accrued expenses 7 (669,798) (315,263) (94,632) (12,813) (150,997)
Securities purchased payable 2(e) (24,132,793) (16,121,852) (2,259,129) – –
Capital shares payable 2(f) (1,383,364) – – – –
Distributions to holders of redeemable participating Shares payable 18 (9,608,773) (2,593,435) (1,226,880) (36,120) (4,485,000)
Variation margin payable 4 (2,542) – – – –
Other payable (76) – – – –
Total liabilities (excluding net assets attributable to holders of redeemable participating Shares) (66,806,422) (49,820,240) (3,663,538) (48,933) (4,635,997)
Net assets attributable to holders of redeemable participating Shares 2,494,380,556 1,324,822,539 300,600,695 20,260,100 579,035,280
Number of redeemable participating Shares 11,100,000 19,400,001 1,400,001 19,500,001
Net asset value per share attributable to holders of redeemable participating Shares 119.35 15.49 14.47 29.69
The accompanying notes form an integral part of the financial statements.
______________________________ _____________________________ Director: Director: Date: 23 January 2017
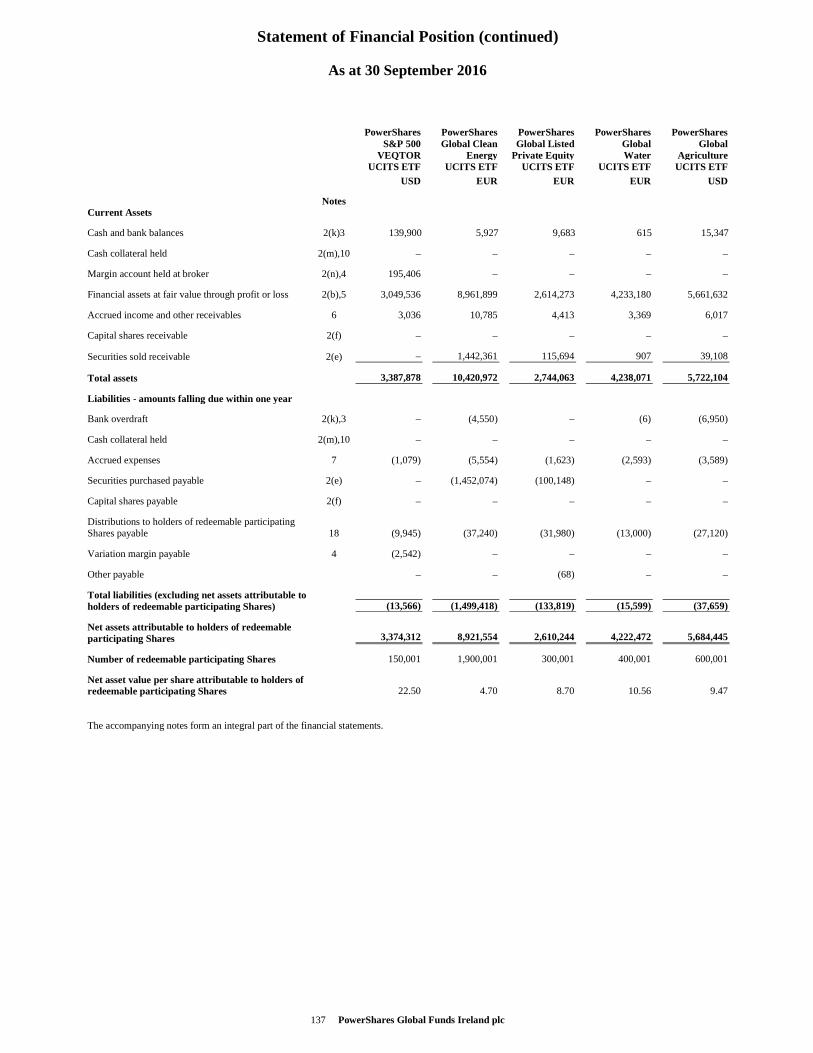
Statement of Financial Position (continued)
137 PowerShares Global Funds Ireland plc
As at 30 September 2016
PowerShares PowerShares PowerShares PowerShares PowerShares S&P 500 Global Clean Global Listed Global Global VEQTOR Energy Private Equity Water Agriculture UCITS ETF UCITS ETF UCITS ETF UCITS ETF UCITS ETF
USD EUR EUR EUR USD
Notes Current Assets
Cash and bank balances 2(k)3 139,900 5,927 9,683 615 15,347
Cash collateral held 2(m),10 – – – – –
Margin account held at broker 2(n),4 195,406 – – – –
Financial assets at fair value through profit or loss 2(b),5 3,049,536 8,961,899 2,614,273 4,233,180 5,661,632
Accrued income and other receivables 6 3,036 10,785 4,413 3,369 6,017
Capital shares receivable 2(f) – – – – –
Securities sold receivable 2(e) – 1,442,361 115,694 907 39,108
Total assets 3,387,878 10,420,972 2,744,063 4,238,071 5,722,104
Liabilities - amounts falling due within one year
Bank overdraft 2(k),3 – (4,550) – (6) (6,950)
Cash collateral held 2(m),10 – – – – –
Accrued expenses 7 (1,079) (5,554) (1,623) (2,593) (3,589)
Securities purchased payable 2(e) – (1,452,074) (100,148) – –
Capital shares payable 2(f) – – – – –
Distributions to holders of redeemable participating Shares payable 18 (9,945) (37,240) (31,980) (13,000) (27,120)
Variation margin payable 4 (2,542) – – – –
Other payable – – (68) – –
Total liabilities (excluding net assets attributable to holders of redeemable participating Shares) (13,566) (1,499,418) (133,819) (15,599) (37,659)
Net assets attributable to holders of redeemable participating Shares 3,374,312 8,921,554 2,610,244 4,222,472 5,684,445
Number of redeemable participating Shares 150,001 1,900,001 300,001 400,001 600,001
Net asset value per share attributable to holders of redeemable participating Shares 22.50 4.70 8.70 10.56 9.47
The accompanying notes form an integral part of the financial statements.
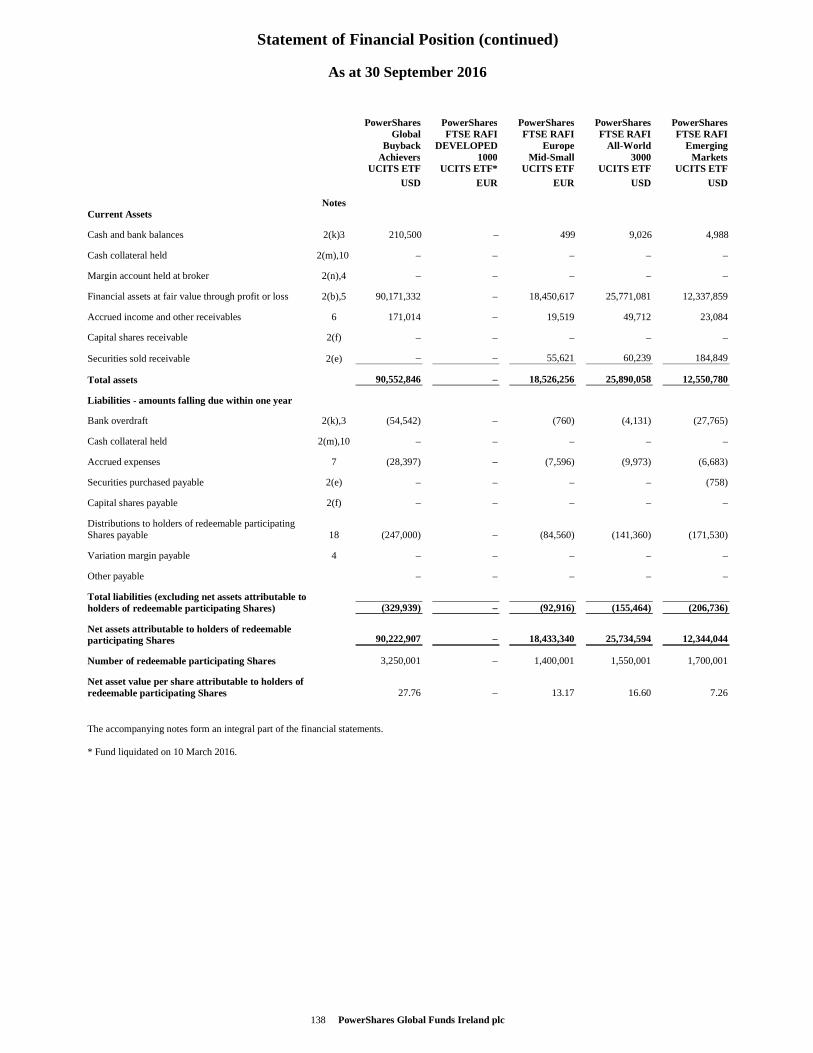
Statement of Financial Position (continued)
138 PowerShares Global Funds Ireland plc
As at 30 September 2016
PowerShares PowerShares PowerShares PowerShares PowerShares Global FTSE RAFI FTSE RAFI FTSE RAFI FTSE RAFI Buyback DEVELOPED Europe All-World Emerging Achievers 1000 Mid -Small 3000 Markets UCITS ETF UCITS ETF* UCITS ETF UCITS ETF UCITS ETF
USD EUR EUR USD USD
Notes Current Assets
Cash and bank balances 2(k)3 210,500 – 499 9,026 4,988
Cash collateral held 2(m),10 – – – – –
Margin account held at broker 2(n),4 – – – – –
Financial assets at fair value through profit or loss 2(b),5 90,171,332 – 18,450,617 25,771,081 12,337,859
Accrued income and other receivables 6 171,014 – 19,519 49,712 23,084
Capital shares receivable 2(f) – – – – –
Securities sold receivable 2(e) – – 55,621 60,239 184,849
Total assets 90,552,846 – 18,526,256 25,890,058 12,550,780
Liabilities - amounts falling due within one year
Bank overdraft 2(k),3 (54,542) – (760) (4,131) (27,765)
Cash collateral held 2(m),10 – – – – –
Accrued expenses 7 (28,397) – (7,596) (9,973) (6,683)
Securities purchased payable 2(e) – – – – (758)
Capital shares payable 2(f) – – – – –
Distributions to holders of redeemable participating Shares payable 18 (247,000) – (84,560) (141,360) (171,530)
Variation margin payable 4 – – – – –
Other payable – – – – –
Total liabilities (excluding net assets attributable to holders of redeemable participating Shares) (329,939) – (92,916) (155,464) (206,736)
Net assets attributable to holders of redeemable participating Shares 90,222,907 – 18,433,340 25,734,594 12,344,044
Number of redeemable participating Shares 3,250,001 – 1,400,001 1,550,001 1,700,001
Net asset value per share attributable to holders of redeemable participating Shares 27.76 – 13.17 16.60 7.26
The accompanying notes form an integral part of the financial statements. * Fund liquidated on 10 March 2016.
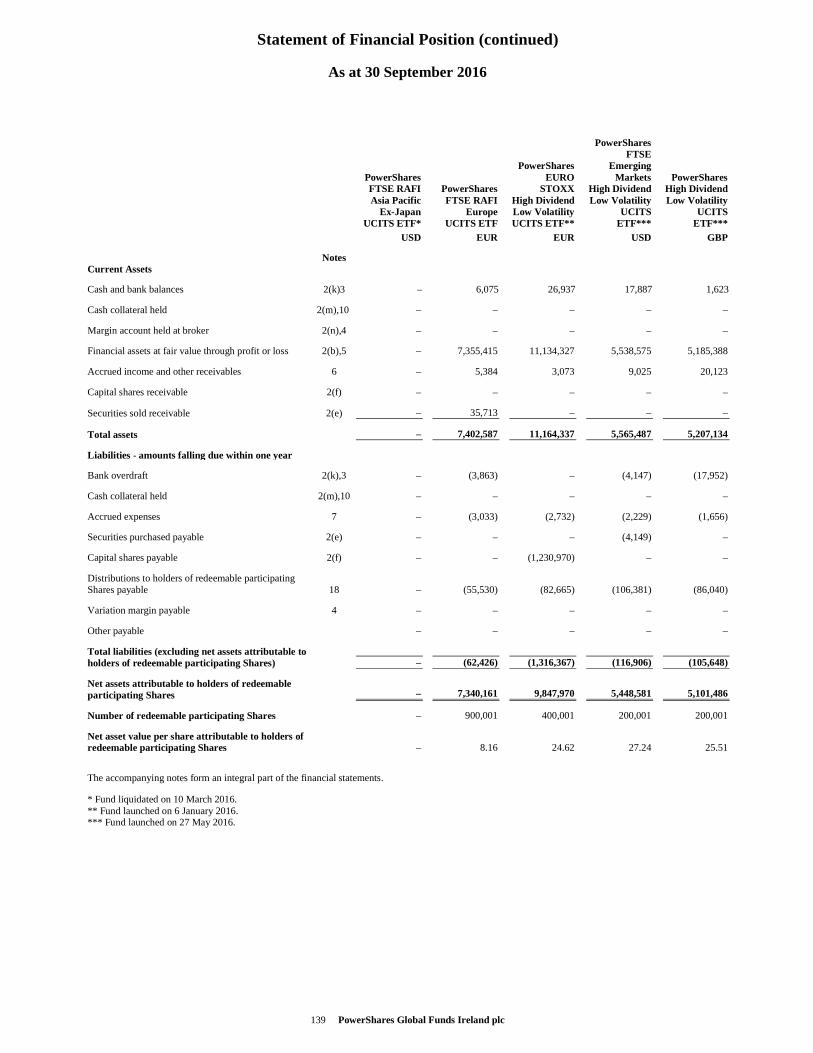
Statement of Financial Position (continued)
139 PowerShares Global Funds Ireland plc
As at 30 September 2016
PowerShares FTSE RAFI Asia Pacific
Ex-Japan UCITS ETF*
PowerShares FTSE RAFI
Europe UCITS ETF
PowerShares EURO
STOXX High Dividend Low Volatility UCITS ETF**
PowerShares FTSE
Emerging Markets
High Dividend Low Volatility
UCITS ETF***
PowerShares High Dividend Low Volatility
UCITS ETF***
USD EUR EUR USD GBP
Notes Current Assets
Cash and bank balances 2(k)3 – 6,075 26,937 17,887 1,623
Cash collateral held 2(m),10 – – – – –
Margin account held at broker 2(n),4 – – – – –
Financial assets at fair value through profit or loss 2(b),5 – 7,355,415 11,134,327 5,538,575 5,185,388
Accrued income and other receivables 6 – 5,384 3,073 9,025 20,123
Capital shares receivable 2(f) – – – – –
Securities sold receivable 2(e) – 35,713 – – –
Total assets – 7,402,587 11,164,337 5,565,487 5,207,134
Liabilities - amounts falling due within one year
Bank overdraft 2(k),3 – (3,863) – (4,147) (17,952)
Cash collateral held 2(m),10 – – – – –
Accrued expenses 7 – (3,033) (2,732) (2,229) (1,656)
Securities purchased payable 2(e) – – – (4,149) –
Capital shares payable 2(f) – – (1,230,970) – –
Distributions to holders of redeemable participating Shares payable 18 – (55,530) (82,665) (106,381) (86,040)
Variation margin payable 4 – – – – –
Other payable – – – – –
Total liabilities (excluding net assets attributable to holders of redeemable participating Shares) – (62,426) (1,316,367) (116,906) (105,648)
Net assets attributable to holders of redeemable participating Shares – 7,340,161 9,847,970 5,448,581 5,101,486
Number of redeemable participating Shares – 900,001 400,001 200,001 200,001
Net asset value per share attributable to holders of redeemable participating Shares – 8.16 24.62 27.24 25.51
The accompanying notes form an integral part of the financial statements.
* Fund liquidated on 10 March 2016. ** Fund launched on 6 January 2016. *** Fund launched on 27 May 2016.
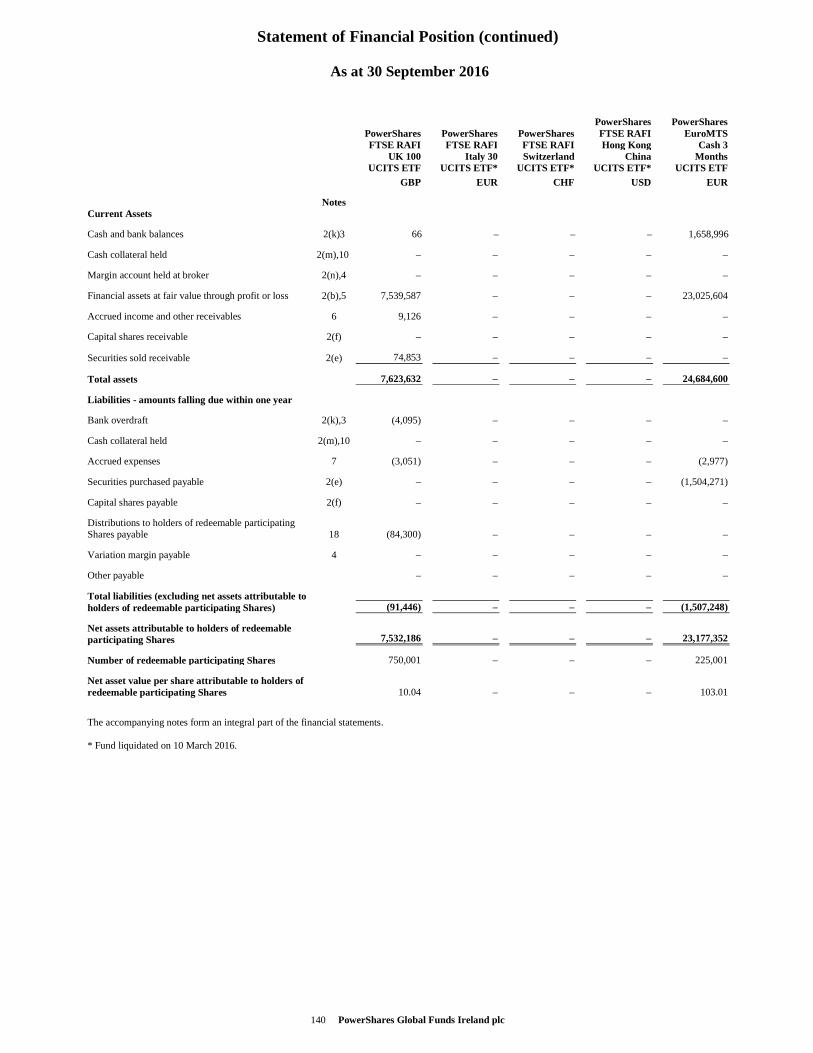
Statement of Financial Position (continued)
140 PowerShares Global Funds Ireland plc
As at 30 September 2016
PowerShares PowerShares PowerShares PowerShares PowerShares FTSE RAFI EuroMTS FTSE RAFI FTSE RAFI FTSE RAFI Hong Kong Cash 3 UK 100 Italy 30 Switzerland China Months UCITS ETF UCITS ETF* UCITS ETF* UCITS ETF* UCITS ETF
GBP EUR CHF USD EUR
Notes Current Assets
Cash and bank balances 2(k)3 66 – – – 1,658,996
Cash collateral held 2(m),10 – – – – –
Margin account held at broker 2(n),4 – – – – –
Financial assets at fair value through profit or loss 2(b),5 7,539,587 – – – 23,025,604
Accrued income and other receivables 6 9,126 – – – –
Capital shares receivable 2(f) – – – – –
Securities sold receivable 2(e) 74,853 – – – –
Total assets 7,623,632 – – – 24,684,600
Liabilities - amounts falling due within one year
Bank overdraft 2(k),3 (4,095) – – – –
Cash collateral held 2(m),10 – – – – –
Accrued expenses 7 (3,051) – – – (2,977)
Securities purchased payable 2(e) – – – – (1,504,271)
Capital shares payable 2(f) – – – – –
Distributions to holders of redeemable participating Shares payable 18 (84,300) – – – –
Variation margin payable 4 – – – – –
Other payable – – – – –
Total liabilities (excluding net assets attributable to holders of redeemable participating Shares) (91,446) – – – (1,507,248)
Net assets attributable to holders of redeemable participating Shares 7,532,186 – – – 23,177,352
Number of redeemable participating Shares 750,001 – – – 225,001
Net asset value per share attributable to holders of redeemable participating Shares 10.04 – – – 103.01
The accompanying notes form an integral part of the financial statements. * Fund liquidated on 10 March 2016.
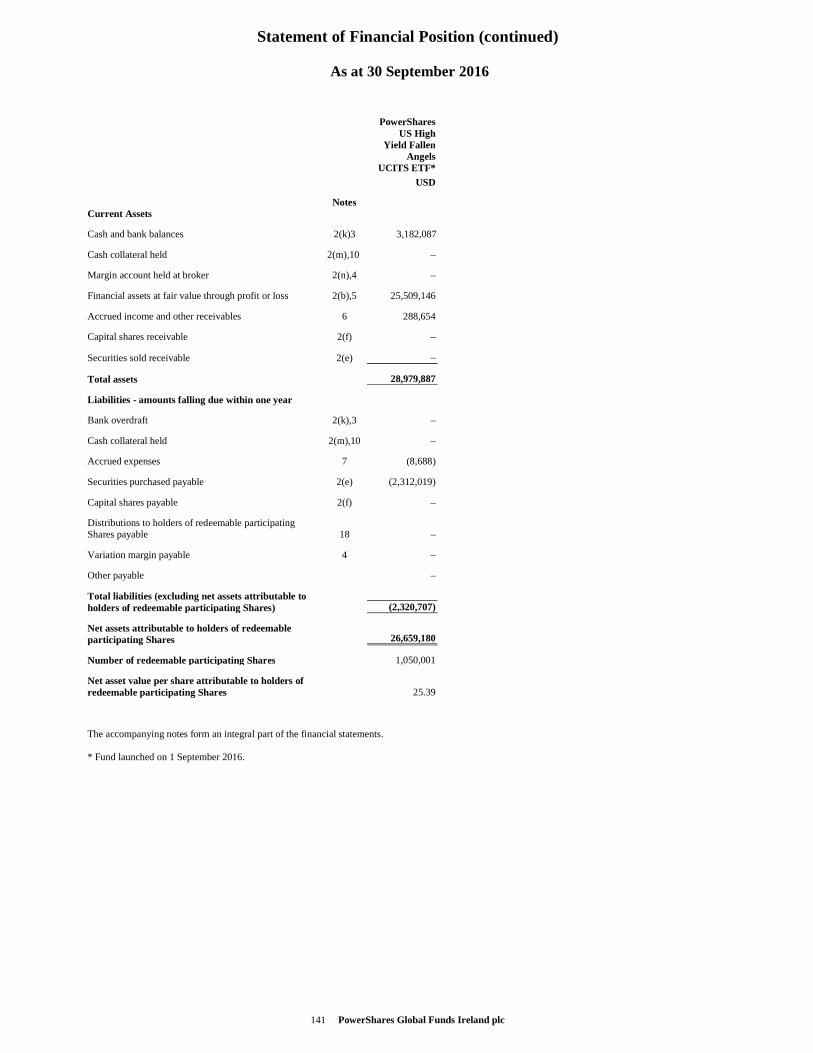
Statement of Financial Position (continued)
141 PowerShares Global Funds Ireland plc
As at 30 September 2016
PowerShares US High Yield Fallen Angels UCITS ETF*
USD
Notes Current Assets
Cash and bank balances 2(k)3 3,182,087
Cash collateral held 2(m),10 –
Margin account held at broker 2(n),4 –
Financial assets at fair value through profit or loss 2(b),5 25,509,146
Accrued income and other receivables 6 288,654
Capital shares receivable 2(f) –
Securities sold receivable 2(e) –
Total assets 28,979,887
Liabilities - amounts falling due within one year
Bank overdraft 2(k),3 –
Cash collateral held 2(m),10 –
Accrued expenses 7 (8,688)
Securities purchased payable 2(e) (2,312,019)
Capital shares payable 2(f) –
Distributions to holders of redeemable participating Shares payable 18 –
Variation margin payable 4 –
Other payable –
Total liabilities (excluding net assets attributable to holders of redeemable participating Shares) (2,320,707)
Net assets attributable to holders of redeemable participating Shares 26,659,180
Number of redeemable participating Shares 1,050,001
Net asset value per share attributable to holders of redeemable participating Shares 25.39
The accompanying notes form an integral part of the financial statements. * Fund launched on 1 September 2016.
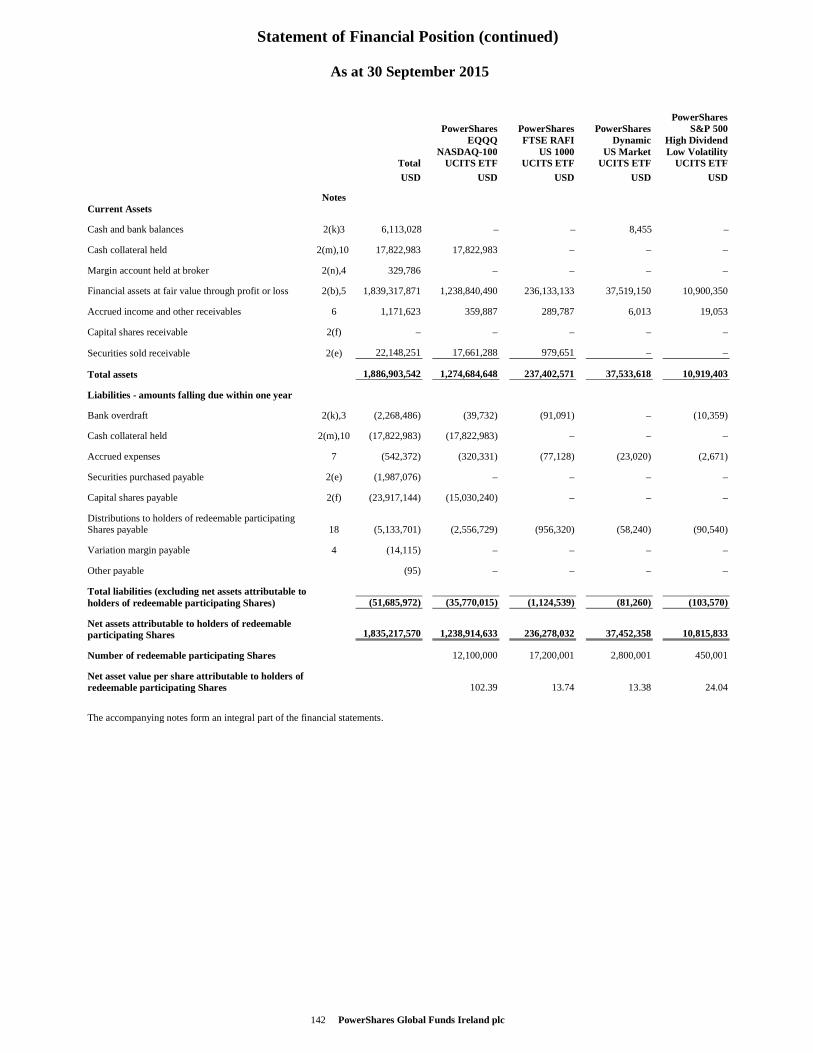
Statement of Financial Position (continued)
142 PowerShares Global Funds Ireland plc
As at 30 September 2015
PowerShares PowerShares PowerShares PowerShares S&P 500 EQQQ FTSE RAFI Dynamic High Dividend NASDAQ-100 US 1000 US Market Low Volatility Total UCITS ETF UCITS ETF UCITS ETF UCITS ETF
USD USD USD USD USD
Notes Current Assets
Cash and bank balances 2(k)3 6,113,028 – – 8,455 –
Cash collateral held 2(m),10 17,822,983 17,822,983 – – –
Margin account held at broker 2(n),4 329,786 – – – –
Financial assets at fair value through profit or loss 2(b),5 1,839,317,871 1,238,840,490 236,133,133 37,519,150 10,900,350
Accrued income and other receivables 6 1,171,623 359,887 289,787 6,013 19,053
Capital shares receivable 2(f) – – – – –
Securities sold receivable 2(e) 22,148,251 17,661,288 979,651 – –
Total assets 1,886,903,542 1,274,684,648 237,402,571 37,533,618 10,919,403
Liabilities - amounts falling due within one year
Bank overdraft 2(k),3 (2,268,486) (39,732) (91,091) – (10,359)
Cash collateral held 2(m),10 (17,822,983) (17,822,983) – – –
Accrued expenses 7 (542,372) (320,331) (77,128) (23,020) (2,671)
Securities purchased payable 2(e) (1,987,076) – – – –
Capital shares payable 2(f) (23,917,144) (15,030,240) – – –
Distributions to holders of redeemable participating Shares payable 18 (5,133,701) (2,556,729) (956,320) (58,240) (90,540)
Variation margin payable 4 (14,115) – – – –
Other payable (95) – – – –
Total liabilities (excluding net assets attributable to holders of redeemable participating Shares) (51,685,972) (35,770,015) (1,124,539) (81,260) (103,570)
Net assets attributable to holders of redeemable participating Shares 1,835,217,570 1,238,914,633 236,278,032 37,452,358 10,815,833
Number of redeemable participating Shares 12,100,000 17,200,001 2,800,001 450,001
Net asset value per share attributable to holders of redeemable participating Shares 102.39 13.74 13.38 24.04
The accompanying notes form an integral part of the financial statements.
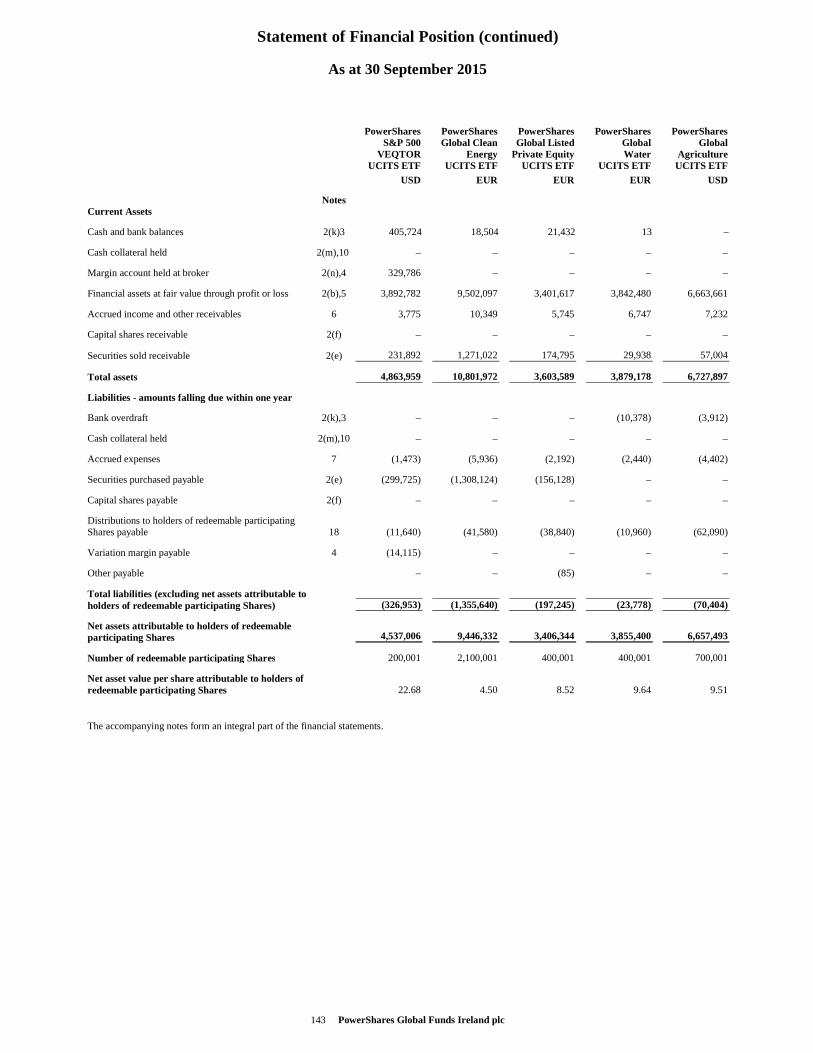
Statement of Financial Position (continued)
143 PowerShares Global Funds Ireland plc
As at 30 September 2015
PowerShares PowerShares PowerShares PowerShares PowerShares S&P 500 Global Clean Global Listed Global Global VEQTOR Energy Private Equity Water Agriculture UCITS ETF UCITS ETF UCITS ETF UCITS ETF UCITS ETF
USD EUR EUR EUR USD
Notes Current Assets
Cash and bank balances 2(k)3 405,724 18,504 21,432 13 –
Cash collateral held 2(m),10 – – – – –
Margin account held at broker 2(n),4 329,786 – – – –
Financial assets at fair value through profit or loss 2(b),5 3,892,782 9,502,097 3,401,617 3,842,480 6,663,661
Accrued income and other receivables 6 3,775 10,349 5,745 6,747 7,232
Capital shares receivable 2(f) – – – – –
Securities sold receivable 2(e) 231,892 1,271,022 174,795 29,938 57,004
Total assets 4,863,959 10,801,972 3,603,589 3,879,178 6,727,897
Liabilities - amounts falling due within one year
Bank overdraft 2(k),3 – – – (10,378) (3,912)
Cash collateral held 2(m),10 – – – – –
Accrued expenses 7 (1,473) (5,936) (2,192) (2,440) (4,402)
Securities purchased payable 2(e) (299,725) (1,308,124) (156,128) – –
Capital shares payable 2(f) – – – – –
Distributions to holders of redeemable participating Shares payable 18 (11,640) (41,580) (38,840) (10,960) (62,090)
Variation margin payable 4 (14,115) – – – –
Other payable – – (85) – –
Total liabilities (excluding net assets attributable to holders of redeemable participating Shares) (326,953) (1,355,640) (197,245) (23,778) (70,404)
Net assets attributable to holders of redeemable participating Shares 4,537,006 9,446,332 3,406,344 3,855,400 6,657,493
Number of redeemable participating Shares 200,001 2,100,001 400,001 400,001 700,001
Net asset value per share attributable to holders of redeemable participating Shares 22.68 4.50 8.52 9.64 9.51
The accompanying notes form an integral part of the financial statements.
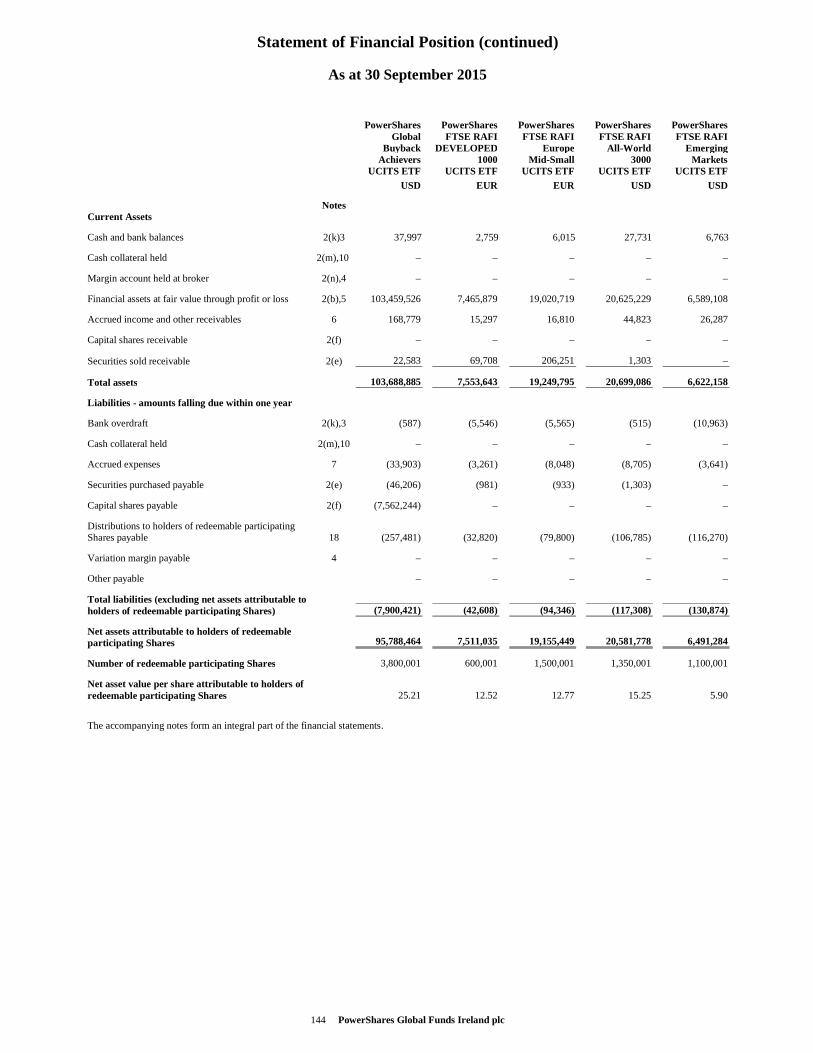
Statement of Financial Position (continued)
144 PowerShares Global Funds Ireland plc
As at 30 September 2015
PowerShares PowerShares PowerShares PowerShares PowerShares Global FTSE RAFI FTSE RAFI FTSE RAFI FTSE RAFI Buyback DEVELOPED Europe All -World Emerging Achievers 1000 Mid-Small 3000 Markets UCITS ETF UCITS ETF UCITS ETF UCITS ETF UCITS ETF
USD EUR EUR USD USD
Notes Current Assets
Cash and bank balances 2(k)3 37,997 2,759 6,015 27,731 6,763
Cash collateral held 2(m),10 – – – – –
Margin account held at broker 2(n),4 – – – – –
Financial assets at fair value through profit or loss 2(b),5 103,459,526 7,465,879 19,020,719 20,625,229 6,589,108
Accrued income and other receivables 6 168,779 15,297 16,810 44,823 26,287
Capital shares receivable 2(f) – – – – –
Securities sold receivable 2(e) 22,583 69,708 206,251 1,303 –
Total assets 103,688,885 7,553,643 19,249,795 20,699,086 6,622,158
Liabilities - amounts falling due within one year
Bank overdraft 2(k),3 (587) (5,546) (5,565) (515) (10,963)
Cash collateral held 2(m),10 – – – – –
Accrued expenses 7 (33,903) (3,261) (8,048) (8,705) (3,641)
Securities purchased payable 2(e) (46,206) (981) (933) (1,303) –
Capital shares payable 2(f) (7,562,244) – – – –
Distributions to holders of redeemable participating Shares payable 18 (257,481) (32,820) (79,800) (106,785) (116,270)
Variation margin payable 4 – – – – –
Other payable – – – – –
Total liabilities (excluding net assets attributable to holders of redeemable participating Shares) (7,900,421) (42,608) (94,346) (117,308) (130,874)
Net assets attributable to holders of redeemable participating Shares 95,788,464 7,511,035 19,155,449 20,581,778 6,491,284
Number of redeemable participating Shares 3,800,001 600,001 1,500,001 1,350,001 1,100,001
Net asset value per share attributable to holders of redeemable participating Shares 25.21 12.52 12.77 15.25 5.90
The accompanying notes form an integral part of the financial statements.
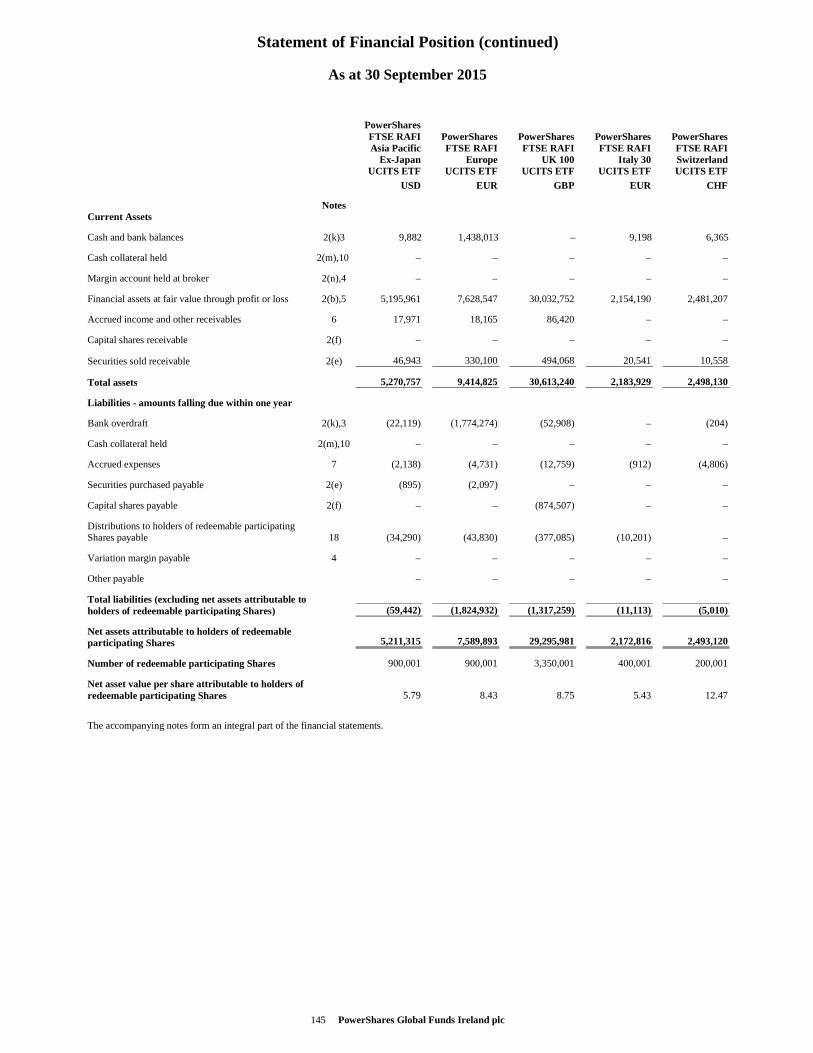
Statement of Financial Position (continued)
145 PowerShares Global Funds Ireland plc
As at 30 September 2015
PowerShares FTSE RAFI PowerShares PowerShares PowerShares PowerShares Asia Pacific FTSE RAFI FTSE RAFI FTSE RAFI FTSE RAFI Ex-Japan Europe UK 100 Italy 30 Switzerland UCITS ETF UCITS ETF UCITS ETF UCITS ETF UCITS ETF
USD EUR GBP EUR CHF
Notes Current Assets
Cash and bank balances 2(k)3 9,882 1,438,013 – 9,198 6,365
Cash collateral held 2(m),10 – – – – –
Margin account held at broker 2(n),4 – – – – –
Financial assets at fair value through profit or loss 2(b),5 5,195,961 7,628,547 30,032,752 2,154,190 2,481,207
Accrued income and other receivables 6 17,971 18,165 86,420 – –
Capital shares receivable 2(f) – – – – –
Securities sold receivable 2(e) 46,943 330,100 494,068 20,541 10,558
Total assets 5,270,757 9,414,825 30,613,240 2,183,929 2,498,130
Liabilities - amounts falling due within one year
Bank overdraft 2(k),3 (22,119) (1,774,274) (52,908) – (204)
Cash collateral held 2(m),10 – – – – –
Accrued expenses 7 (2,138) (4,731) (12,759) (912) (4,806)
Securities purchased payable 2(e) (895) (2,097) – – –
Capital shares payable 2(f) – – (874,507) – –
Distributions to holders of redeemable participating Shares payable 18 (34,290) (43,830) (377,085) (10,201) –
Variation margin payable 4 – – – – –
Other payable – – – – –
Total liabilities (excluding net assets attributable to holders of redeemable participating Shares) (59,442) (1,824,932) (1,317,259) (11,113) (5,010)
Net assets attributable to holders of redeemable participating Shares 5,211,315 7,589,893 29,295,981 2,172,816 2,493,120
Number of redeemable participating Shares 900,001 900,001 3,350,001 400,001 200,001
Net asset value per share attributable to holders of redeemable participating Shares 5.79 8.43 8.75 5.43 12.47
The accompanying notes form an integral part of the financial statements.
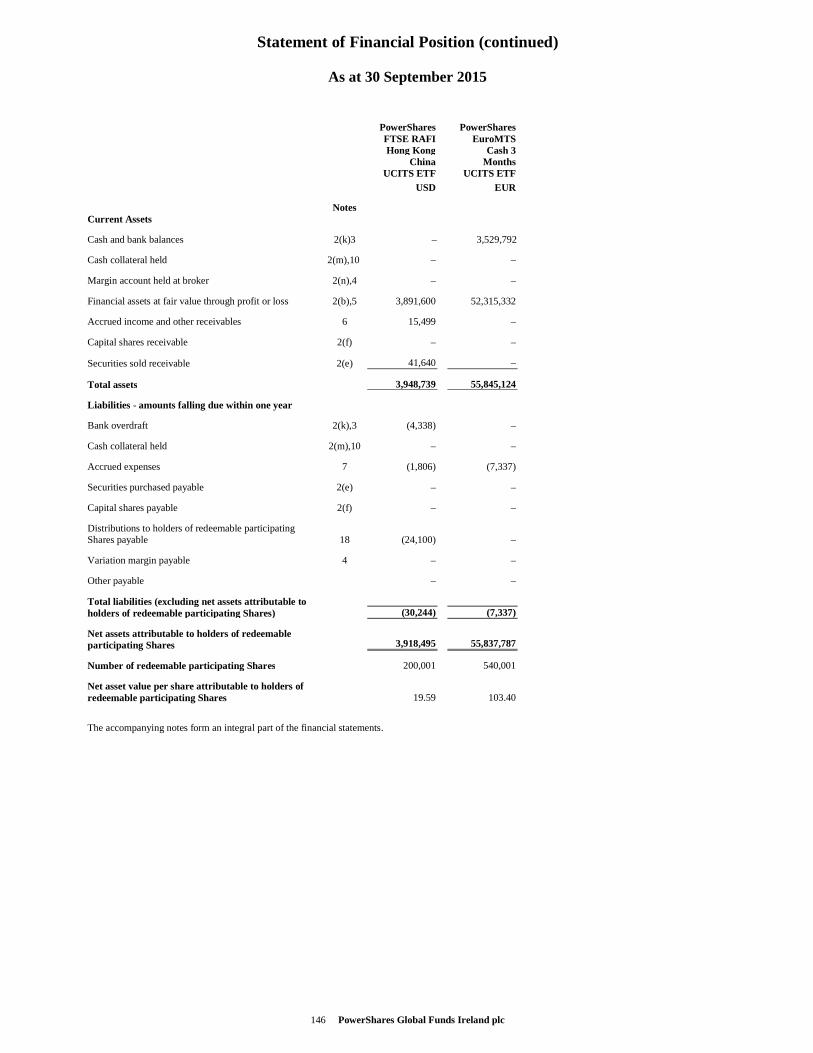
Statement of Financial Position (continued)
146 PowerShares Global Funds Ireland plc
As at 30 September 2015
PowerShares PowerShares FTSE RAFI EuroMTS Hong Kong Cash 3 China Months UCITS ETF UCITS ETF
USD EUR
Notes Current Assets
Cash and bank balances 2(k)3 – 3,529,792
Cash collateral held 2(m),10 – –
Margin account held at broker 2(n),4 – –
Financial assets at fair value through profit or loss 2(b),5 3,891,600 52,315,332
Accrued income and other receivables 6 15,499 –
Capital shares receivable 2(f) – –
Securities sold receivable 2(e) 41,640 –
Total assets 3,948,739 55,845,124
Liabilities - amounts falling due within one year
Bank overdraft 2(k),3 (4,338) –
Cash collateral held 2(m),10 – –
Accrued expenses 7 (1,806) (7,337)
Securities purchased payable 2(e) – –
Capital shares payable 2(f) – –
Distributions to holders of redeemable participating Shares payable 18 (24,100) –
Variation margin payable 4 – –
Other payable – –
Total liabilities (excluding net assets attributable to holders of redeemable participating Shares) (30,244) (7,337)
Net assets attributable to holders of redeemable participating Shares 3,918,495 55,837,787
Number of redeemable participating Shares 200,001 540,001
Net asset value per share attributable to holders of redeemable participating Shares 19.59 103.40
The accompanying notes form an integral part of the financial statements.
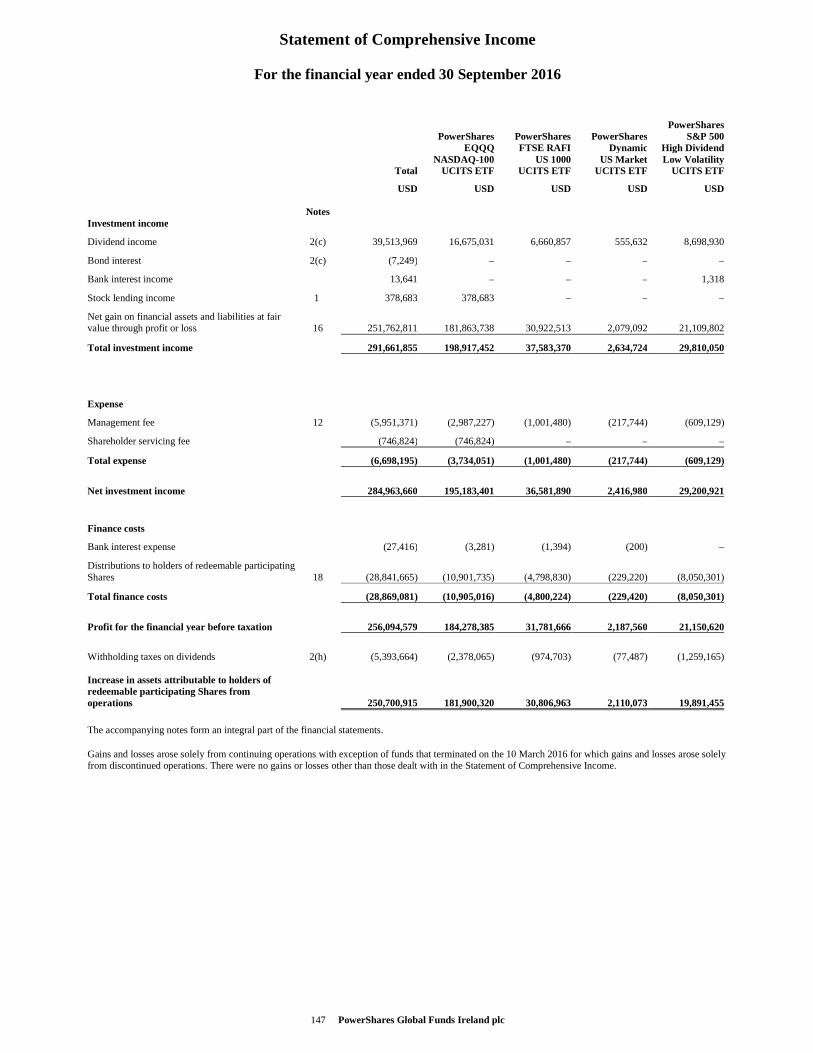
Statement of Comprehensive Income
147 PowerShares Global Funds Ireland plc
For the financial year ended 30 September 2016
PowerShares PowerShares PowerShares PowerShares S&P 500 EQQQ FTSE RAFI Dynamic High Dividend NASDAQ-100 US 1000 US Market Low Volatility Total UCITS ETF UCITS ETF UCITS ETF UCITS ETF
USD USD USD USD USD
Notes Investment income
Dividend income 2(c) 39,513,969 16,675,031 6,660,857 555,632 8,698,930
Bond interest 2(c) (7,249) – – – –
Bank interest income 13,641 – – – 1,318
Stock lending income 1 378,683 378,683 – – –
Net gain on financial assets and liabilities at fair value through profit or loss 16 251,762,811 181,863,738 30,922,513 2,079,092 21,109,802
Total investment income 291,661,855 198,917,452 37,583,370 2,634,724 29,810,050
Expense
Management fee 12 (5,951,371) (2,987,227) (1,001,480) (217,744) (609,129)
Shareholder servicing fee (746,824) (746,824) – – –
Total expense (6,698,195) (3,734,051) (1,001,480) (217,744) (609,129)
Net investment income 284,963,660 195,183,401 36,581,890 2,416,980 29,200,921
Finance costs
Bank interest expense (27,416) (3,281) (1,394) (200) –
Distributions to holders of redeemable participating Shares 18 (28,841,665) (10,901,735) (4,798,830) (229,220) (8,050,301)
Total finance costs (28,869,081) (10,905,016) (4,800,224) (229,420) (8,050,301)
Profit for the financial year before taxation 256,094,579 184,278,385 31,781,666 2,187,560 21,150,620
Withholding taxes on dividends 2(h) (5,393,664) (2,378,065) (974,703) (77,487) (1,259,165) Increase in assets attributable to holders of redeemable participating Shares from operations 250,700,915 181,900,320 30,806,963 2,110,073 19,891,455
The accompanying notes form an integral part of the financial statements.
Gains and losses arose solely from continuing operations with exception of funds that terminated on the 10 March 2016 for which gains and losses arose solely from discontinued operations. There were no gains or losses other than those dealt with in the Statement of Comprehensive Income.
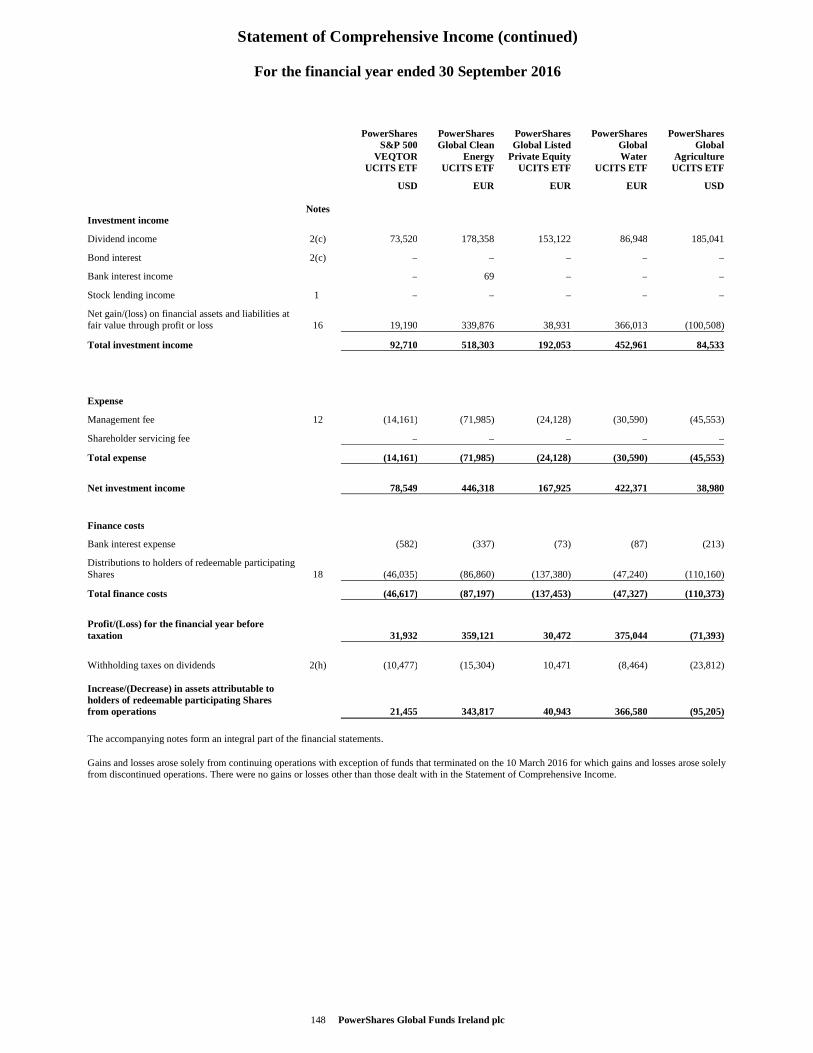
Statement of Comprehensive Income (continued)
148 PowerShares Global Funds Ireland plc
For the financial year ended 30 September 2016
PowerShares PowerShares PowerShares PowerShares PowerShares S&P 500 Global Clean Global Listed Global Global VEQTOR Energy Private Equity Water Agriculture UCITS ETF UCITS ETF UCITS ETF UCITS ETF UCITS ETF
USD EUR EUR EUR USD
Notes Investment income
Dividend income 2(c) 73,520 178,358 153,122 86,948 185,041
Bond interest 2(c) – – – – –
Bank interest income – 69 – – –
Stock lending income 1 – – – – –
Net gain/(loss) on financial assets and liabilities at fair value through profit or loss 16 19,190 339,876 38,931 366,013 (100,508)
Total investment income 92,710 518,303 192,053 452,961 84,533
Expense
Management fee 12 (14,161) (71,985) (24,128) (30,590) (45,553)
Shareholder servicing fee – – – – –
Total expense (14,161) (71,985) (24,128) (30,590) (45,553)
Net investment income 78,549 446,318 167,925 422,371 38,980
Finance costs
Bank interest expense (582) (337) (73) (87) (213)
Distributions to holders of redeemable participating Shares 18 (46,035) (86,860) (137,380) (47,240) (110,160)
Total finance costs (46,617) (87,197) (137,453) (47,327) (110,373)
Profit/(Loss) for the financial year before taxation 31,932 359,121 30,472 375,044 (71,393)
Withholding taxes on dividends 2(h) (10,477) (15,304) 10,471 (8,464) (23,812) Increase/(Decrease) in assets attributable to holders of redeemable participating Shares from operations 21,455 343,817 40,943 366,580 (95,205)
The accompanying notes form an integral part of the financial statements.
Gains and losses arose solely from continuing operations with exception of funds that terminated on the 10 March 2016 for which gains and losses arose solely from discontinued operations. There were no gains or losses other than those dealt with in the Statement of Comprehensive Income.
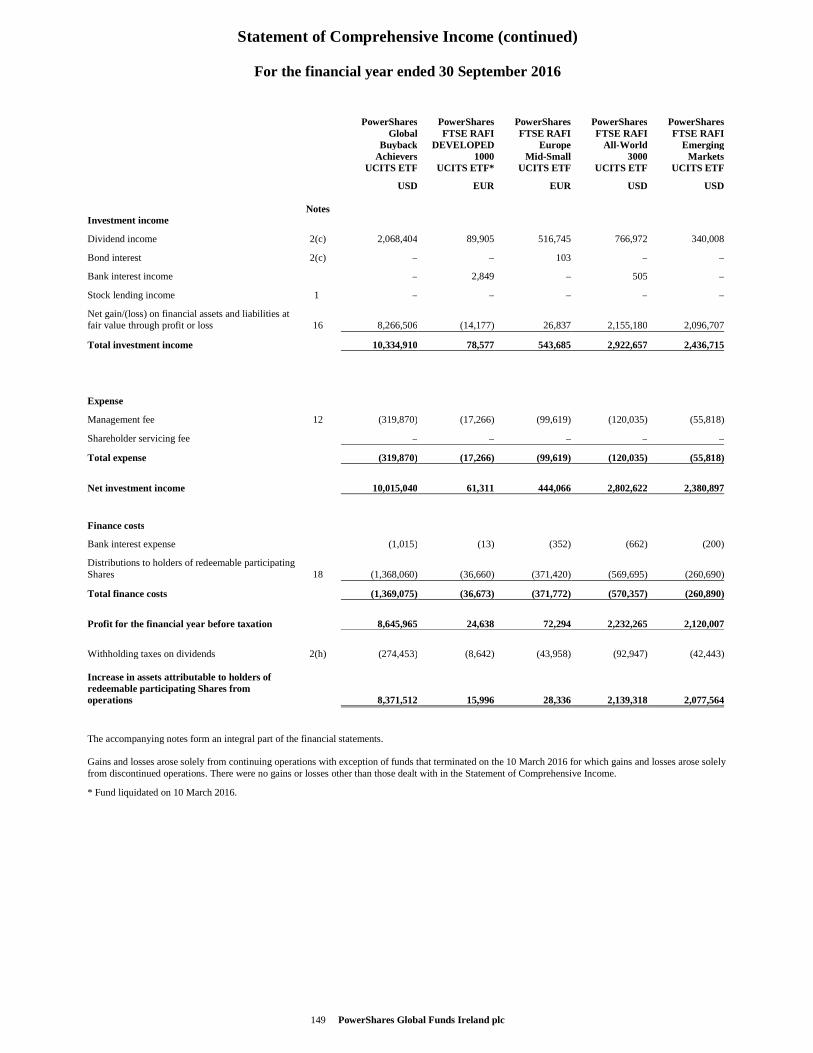
Statement of Comprehensive Income (continued)
149 PowerShares Global Funds Ireland plc
For the financial year ended 30 September 2016
PowerShares PowerShares PowerShares PowerShares PowerShares Global FTSE RAFI FTSE RAFI FTSE RAFI FTSE RAFI Buyback DEVELOPED Europe All -World Emerging Achievers 1000 Mid-Small 3000 Markets UCITS ETF UCITS ETF* UCITS ETF UCITS ETF UCITS ETF
USD EUR EUR USD USD
Notes Investment income
Dividend income 2(c) 2,068,404 89,905 516,745 766,972 340,008
Bond interest 2(c) – – 103 – –
Bank interest income – 2,849 – 505 –
Stock lending income 1 – – – – –
Net gain/(loss) on financial assets and liabilities at fair value through profit or loss 16 8,266,506 (14,177) 26,837 2,155,180 2,096,707
Total investment income 10,334,910 78,577 543,685 2,922,657 2,436,715
Expense
Management fee 12 (319,870) (17,266) (99,619) (120,035) (55,818)
Shareholder servicing fee – – – – –
Total expense (319,870) (17,266) (99,619) (120,035) (55,818)
Net investment income 10,015,040 61,311 444,066 2,802,622 2,380,897
Finance costs
Bank interest expense (1,015) (13) (352) (662) (200)
Distributions to holders of redeemable participating Shares 18 (1,368,060) (36,660) (371,420) (569,695) (260,690)
Total finance costs (1,369,075) (36,673) (371,772) (570,357) (260,890)
Profit for the financial year before taxation 8,645,965 24,638 72,294 2,232,265 2,120,007
Withholding taxes on dividends 2(h) (274,453) (8,642) (43,958) (92,947) (42,443) Increase in assets attributable to holders of redeemable participating Shares from operations 8,371,512 15,996 28,336 2,139,318 2,077,564
The accompanying notes form an integral part of the financial statements. Gains and losses arose solely from continuing operations with exception of funds that terminated on the 10 March 2016 for which gains and losses arose solely from discontinued operations. There were no gains or losses other than those dealt with in the Statement of Comprehensive Income.
* Fund liquidated on 10 March 2016.
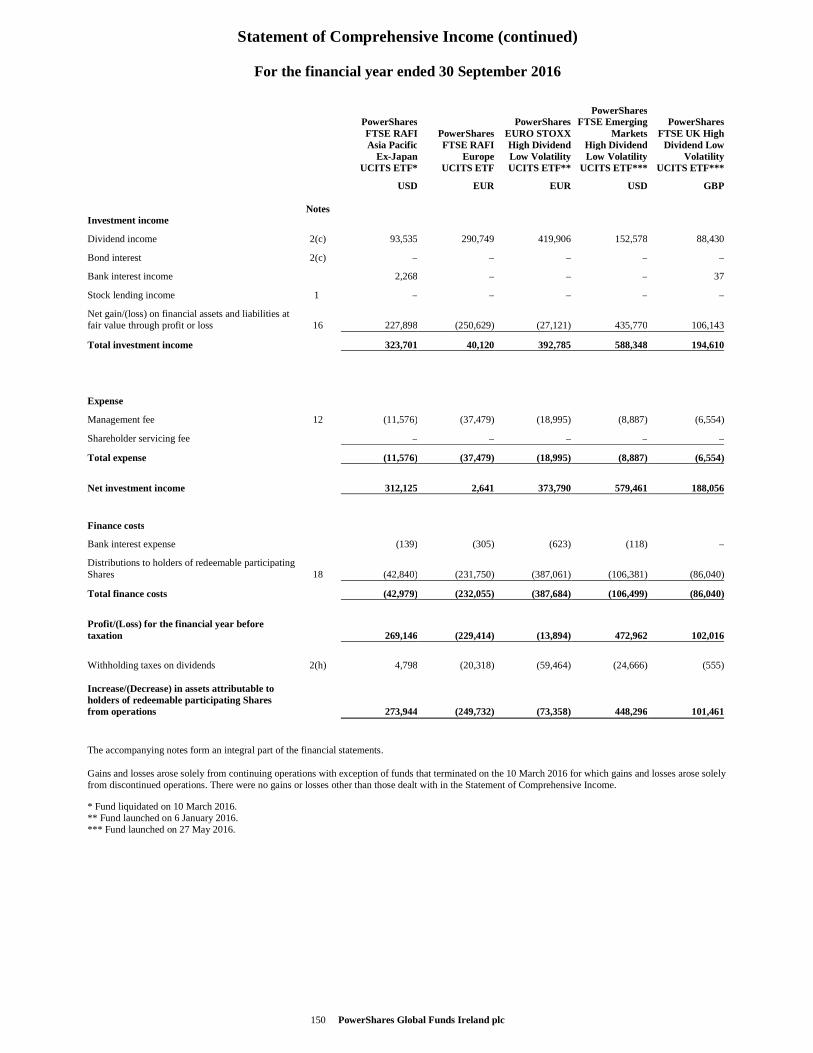
Statement of Comprehensive Income (continued)
150 PowerShares Global Funds Ireland plc
For the financial year ended 30 September 2016
PowerShares PowerShares PowerShares FTSE Emerging PowerShares FTSE RAFI PowerShares EURO STOXX Markets FTSE UK High Asia Pacific FTSE RAFI High Dividend High Dividend Dividend Low Ex-Japan Europe Low Volatility Low Volatility Volatility UCITS ETF* UCITS ETF UCITS ETF** UCITS ETF*** UCITS ETF***
USD EUR EUR USD GBP
Notes Investment income
Dividend income 2(c) 93,535 290,749 419,906 152,578 88,430
Bond interest 2(c) – – – – –
Bank interest income 2,268 – – – 37
Stock lending income 1 – – – – –
Net gain/(loss) on financial assets and liabilities at fair value through profit or loss 16 227,898 (250,629) (27,121) 435,770 106,143
Total investment income 323,701 40,120 392,785 588,348 194,610
Expense
Management fee 12 (11,576) (37,479) (18,995) (8,887) (6,554)
Shareholder servicing fee – – – – –
Total expense (11,576) (37,479) (18,995) (8,887) (6,554)
Net investment income 312,125 2,641 373,790 579,461 188,056
Finance costs
Bank interest expense (139) (305) (623) (118) –
Distributions to holders of redeemable participating Shares 18 (42,840) (231,750) (387,061) (106,381) (86,040)
Total finance costs (42,979) (232,055) (387,684) (106,499) (86,040)
Profit/(Loss) for the financial year before taxation 269,146 (229,414) (13,894) 472,962 102,016
Withholding taxes on dividends 2(h) 4,798 (20,318) (59,464) (24,666) (555) Increase/(Decrease) in assets attributable to holders of redeemable participating Shares from operations 273,944 (249,732) (73,358) 448,296 101,461
The accompanying notes form an integral part of the financial statements. Gains and losses arose solely from continuing operations with exception of funds that terminated on the 10 March 2016 for which gains and losses arose solely from discontinued operations. There were no gains or losses other than those dealt with in the Statement of Comprehensive Income.
* Fund liquidated on 10 March 2016. ** Fund launched on 6 January 2016. *** Fund launched on 27 May 2016.
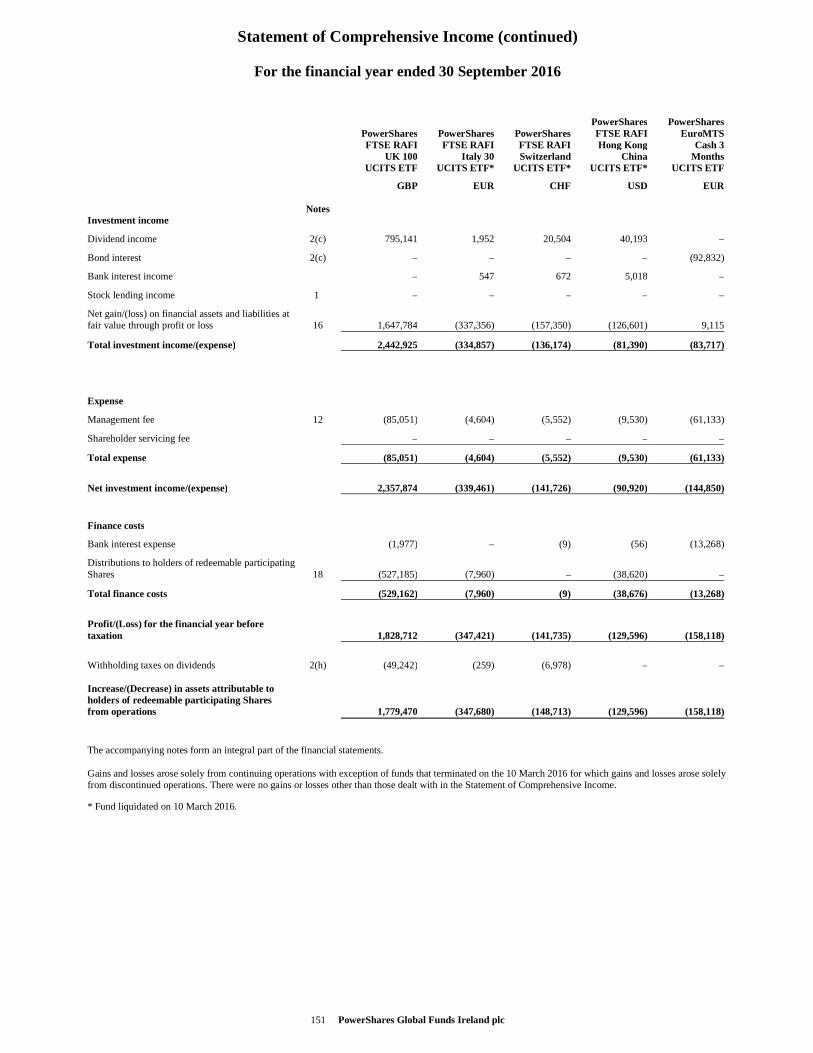
Statement of Comprehensive Income (continued)
151 PowerShares Global Funds Ireland plc
For the financial year ended 30 September 2016
PowerShares PowerShares PowerShares PowerShares PowerShares FTSE RAFI EuroMTS FTSE RAFI FTSE RAFI FTSE RAFI Hong Kong Cash 3 UK 100 Italy 30 Switzerland China Months UCITS ETF UCITS ETF* UCITS ETF* UCITS ETF* UCITS ETF
GBP EUR CHF USD EUR
Notes Investment income
Dividend income 2(c) 795,141 1,952 20,504 40,193 –
Bond interest 2(c) – – – – (92,832)
Bank interest income – 547 672 5,018 –
Stock lending income 1 – – – – –
Net gain/(loss) on financial assets and liabilities at fair value through profit or loss 16 1,647,784 (337,356) (157,350) (126,601) 9,115
Total investment income/(expense) 2,442,925 (334,857) (136,174) (81,390) (83,717)
Expense
Management fee 12 (85,051) (4,604) (5,552) (9,530) (61,133)
Shareholder servicing fee – – – – –
Total expense (85,051) (4,604) (5,552) (9,530) (61,133)
Net investment income/(expense) 2,357,874 (339,461) (141,726) (90,920) (144,850)
Finance costs
Bank interest expense (1,977) – (9) (56) (13,268)
Distributions to holders of redeemable participating Shares 18 (527,185) (7,960) – (38,620) –
Total finance costs (529,162) (7,960) (9) (38,676) (13,268)
Profit/(Loss) for the financial year before taxation 1,828,712 (347,421) (141,735) (129,596) (158,118)
Withholding taxes on dividends 2(h) (49,242) (259) (6,978) – – Increase/(Decrease) in assets attributable to holders of redeemable participating Shares from operations 1,779,470 (347,680) (148,713) (129,596) (158,118)
The accompanying notes form an integral part of the financial statements. Gains and losses arose solely from continuing operations with exception of funds that terminated on the 10 March 2016 for which gains and losses arose solely from discontinued operations. There were no gains or losses other than those dealt with in the Statement of Comprehensive Income.
* Fund liquidated on 10 March 2016.
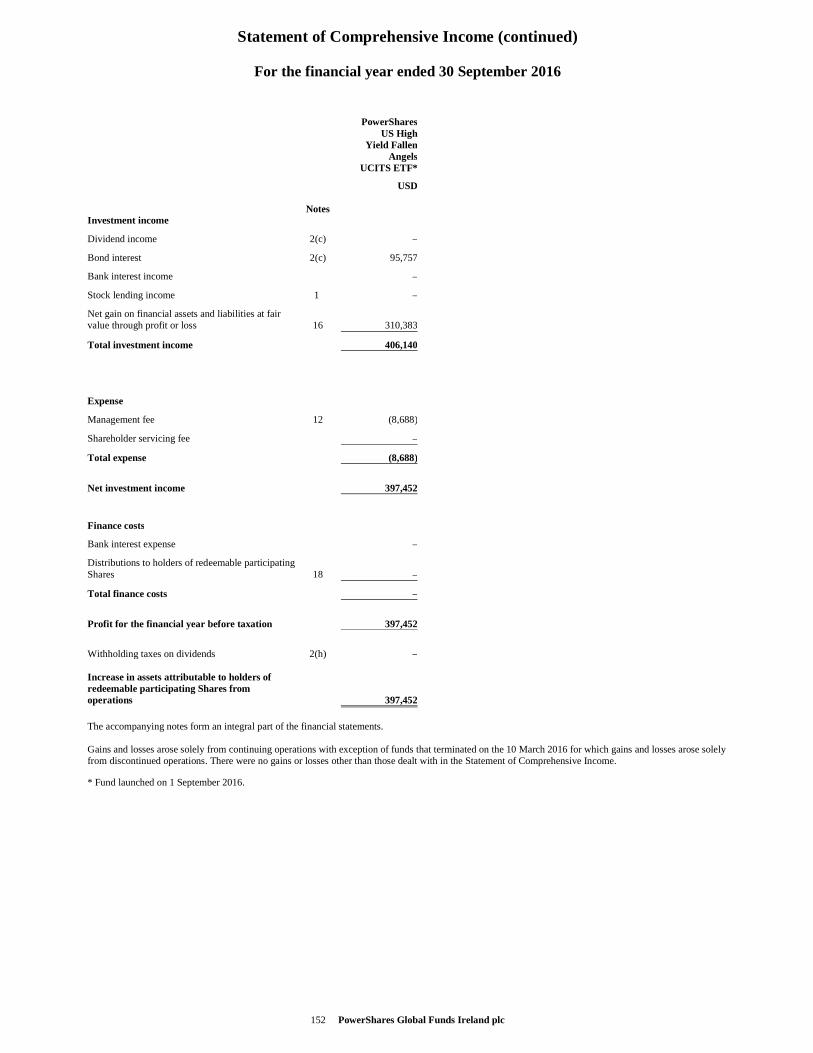
Statement of Comprehensive Income (continued)
152 PowerShares Global Funds Ireland plc
For the financial year ended 30 September 2016
PowerShares US High Yield Fallen Angels UCITS ETF*
USD
Notes Investment income
Dividend income 2(c) –
Bond interest 2(c) 95,757
Bank interest income –
Stock lending income 1 –
Net gain on financial assets and liabilities at fair value through profit or loss 16 310,383
Total investment income 406,140
Expense
Management fee 12 (8,688)
Shareholder servicing fee –
Total expense (8,688)
Net investment income 397,452
Finance costs
Bank interest expense –
Distributions to holders of redeemable participating Shares 18 –
Total finance costs –
Profit for the financial year before taxation 397,452
Withholding taxes on dividends 2(h) – Increase in assets attributable to holders of redeemable participating Shares from operations 397,452
The accompanying notes form an integral part of the financial statements. Gains and losses arose solely from continuing operations with exception of funds that terminated on the 10 March 2016 for which gains and losses arose solely from discontinued operations. There were no gains or losses other than those dealt with in the Statement of Comprehensive Income.
* Fund launched on 1 September 2016.
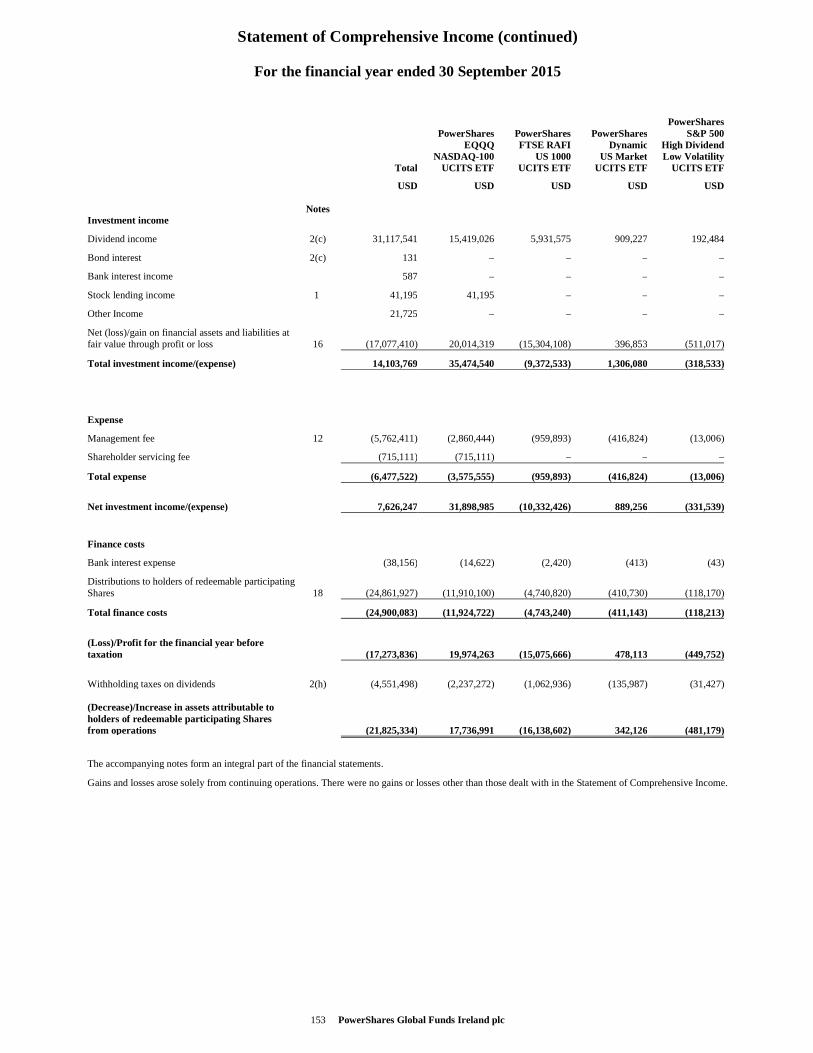
Statement of Comprehensive Income (continued)
153 PowerShares Global Funds Ireland plc
For the financial year ended 30 September 2015
PowerShares PowerShares PowerShares PowerShares S&P 500 EQQQ FTSE RAFI Dynamic High Dividend NASDAQ-100 US 1000 US Market Low Volatility Total UCITS ETF UCITS ETF UCITS ETF UCITS ETF
USD USD USD USD USD
Notes Investment income
Dividend income 2(c) 31,117,541 15,419,026 5,931,575 909,227 192,484
Bond interest 2(c) 131 – – – –
Bank interest income 587 – – – –
Stock lending income 1 41,195 41,195 – – –
Other Income 21,725 – – – –
Net (loss)/gain on financial assets and liabilities at fair value through profit or loss 16 (17,077,410) 20,014,319 (15,304,108) 396,853 (511,017)
Total investment income/(expense) 14,103,769 35,474,540 (9,372,533) 1,306,080 (318,533)
Expense
Management fee 12 (5,762,411) (2,860,444) (959,893) (416,824) (13,006)
Shareholder servicing fee (715,111) (715,111) – – –
Total expense (6,477,522) (3,575,555) (959,893) (416,824) (13,006)
Net investment income/(expense) 7,626,247 31,898,985 (10,332,426) 889,256 (331,539)
Finance costs
Bank interest expense (38,156) (14,622) (2,420) (413) (43)
Distributions to holders of redeemable participating Shares 18 (24,861,927) (11,910,100) (4,740,820) (410,730) (118,170)
Total finance costs (24,900,083) (11,924,722) (4,743,240) (411,143) (118,213)
(Loss)/Profit for the financial year before taxation (17,273,836) 19,974,263 (15,075,666) 478,113 (449,752)
Withholding taxes on dividends 2(h) (4,551,498) (2,237,272) (1,062,936) (135,987) (31,427) (Decrease)/Increase in assets attributable to holders of redeemable participating Shares from operations (21,825,334) 17,736,991 (16,138,602) 342,126 (481,179)
The accompanying notes form an integral part of the financial statements.
Gains and losses arose solely from continuing operations. There were no gains or losses other than those dealt with in the Statement of Comprehensive Income.
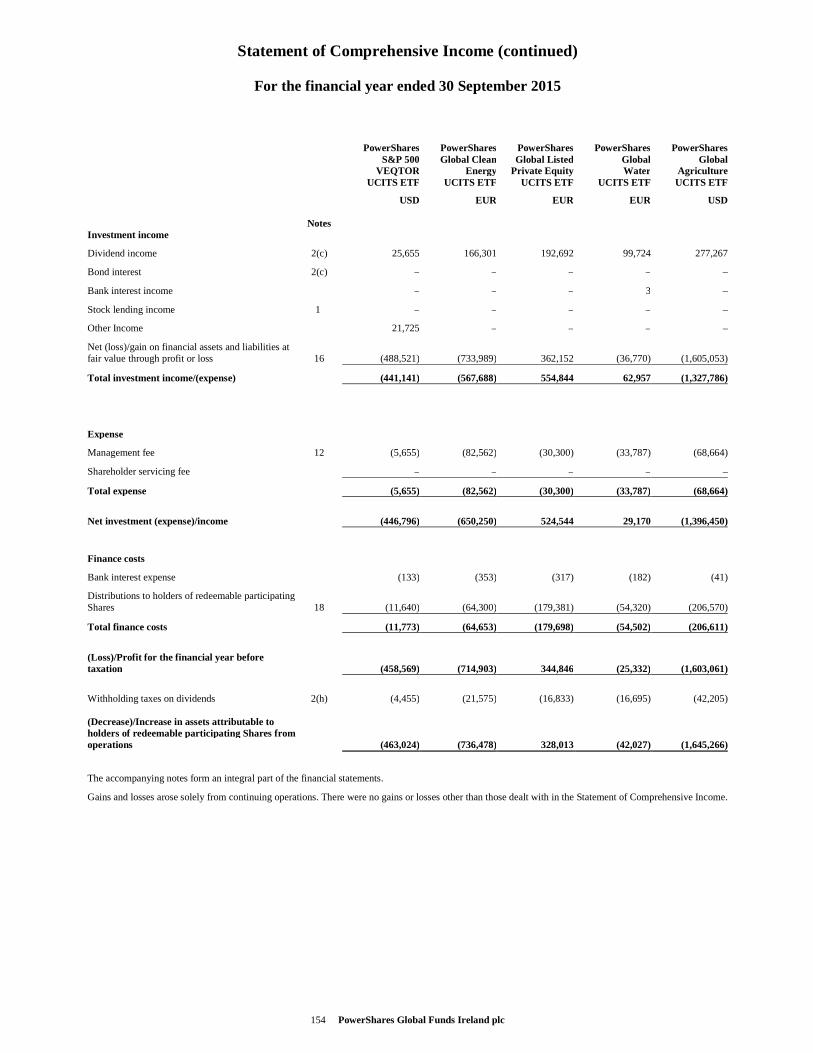
Statement of Comprehensive Income (continued)
154 PowerShares Global Funds Ireland plc
For the financial year ended 30 September 2015
PowerShares PowerShares PowerShares PowerShares PowerShares S&P 500 Global Clean Global Listed Global Global VEQTOR Energy Private Equity Water Agriculture UCITS ETF UCITS ETF UCITS ETF UCITS ETF UCITS ETF
USD EUR EUR EUR USD
Notes Investment income
Dividend income 2(c) 25,655 166,301 192,692 99,724 277,267
Bond interest 2(c) – – – – –
Bank interest income – – – 3 –
Stock lending income 1 – – – – –
Other Income 21,725 – – – –
Net (loss)/gain on financial assets and liabilities at fair value through profit or loss 16 (488,521) (733,989) 362,152 (36,770) (1,605,053)
Total investment income/(expense) (441,141) (567,688) 554,844 62,957 (1,327,786)
Expense
Management fee 12 (5,655) (82,562) (30,300) (33,787) (68,664)
Shareholder servicing fee – – – – –
Total expense (5,655) (82,562) (30,300) (33,787) (68,664)
Net investment (expense)/income (446,796) (650,250) 524,544 29,170 (1,396,450)
Finance costs
Bank interest expense (133) (353) (317) (182) (41)
Distributions to holders of redeemable participating Shares 18 (11,640) (64,300) (179,381) (54,320) (206,570)
Total finance costs (11,773) (64,653) (179,698) (54,502) (206,611)
(Loss)/Profit for the financial year before taxation (458,569) (714,903) 344,846 (25,332) (1,603,061)
Withholding taxes on dividends 2(h) (4,455) (21,575) (16,833) (16,695) (42,205) (Decrease)/Increase in assets attributable to holders of redeemable participating Shares from operations (463,024) (736,478) 328,013 (42,027) (1,645,266)
The accompanying notes form an integral part of the financial statements.
Gains and losses arose solely from continuing operations. There were no gains or losses other than those dealt with in the Statement of Comprehensive Income.
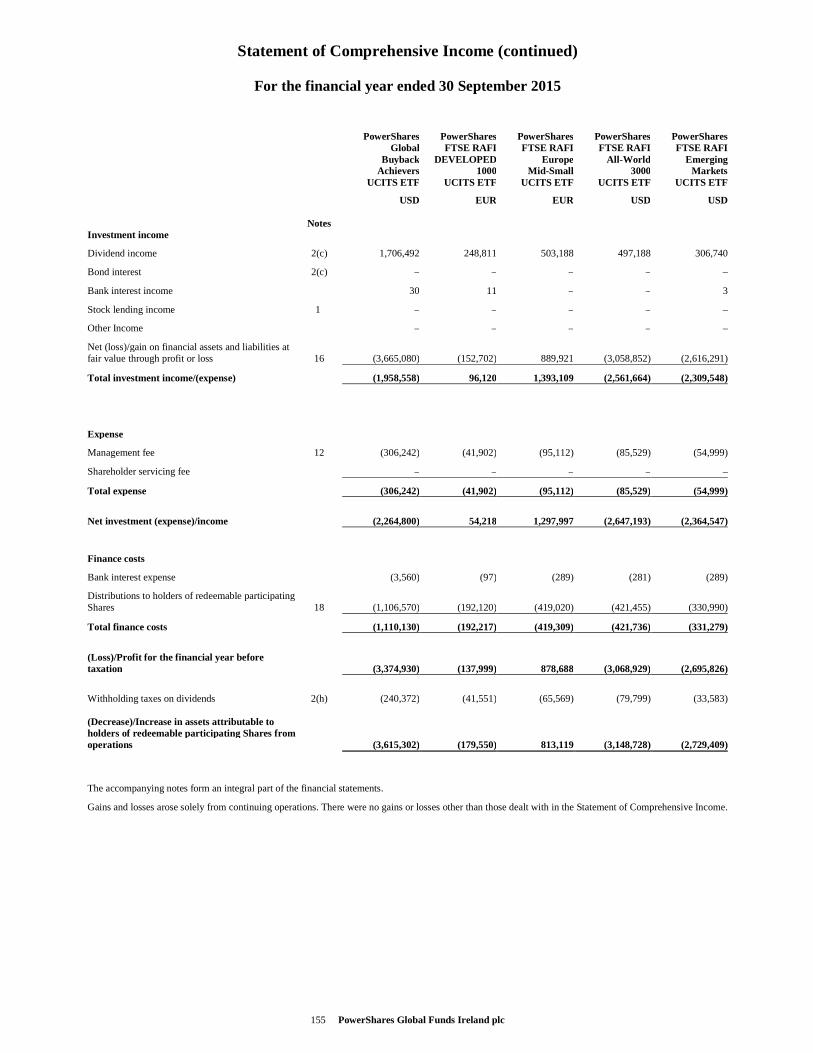
Statement of Comprehensive Income (continued)
155 PowerShares Global Funds Ireland plc
For the financial year ended 30 September 2015
PowerShares PowerShares PowerShares PowerShares PowerShares Global FTSE RAFI FTSE RAFI FTSE RAFI FTSE RAFI Buyback DEVELOPED Europe All -World Emerging Achievers 1000 Mid-Small 3000 Markets UCITS ETF UCITS ETF UCITS ETF UCITS ETF UCITS ETF
USD EUR EUR USD USD
Notes Investment income
Dividend income 2(c) 1,706,492 248,811 503,188 497,188 306,740
Bond interest 2(c) – – – – –
Bank interest income 30 11 – – 3
Stock lending income 1 – – – – –
Other Income – – – – –
Net (loss)/gain on financial assets and liabilities at fair value through profit or loss 16 (3,665,080) (152,702) 889,921 (3,058,852) (2,616,291)
Total investment income/(expense) (1,958,558) 96,120 1,393,109 (2,561,664) (2,309,548)
Expense
Management fee 12 (306,242) (41,902) (95,112) (85,529) (54,999)
Shareholder servicing fee – – – – –
Total expense (306,242) (41,902) (95,112) (85,529) (54,999)
Net investment (expense)/income (2,264,800) 54,218 1,297,997 (2,647,193) (2,364,547)
Finance costs
Bank interest expense (3,560) (97) (289) (281) (289)
Distributions to holders of redeemable participating Shares 18 (1,106,570) (192,120) (419,020) (421,455) (330,990)
Total finance costs (1,110,130) (192,217) (419,309) (421,736) (331,279)
(Loss)/Profit for the financial year before taxation (3,374,930) (137,999) 878,688 (3,068,929) (2,695,826)
Withholding taxes on dividends 2(h) (240,372) (41,551) (65,569) (79,799) (33,583) (Decrease)/Increase in assets attributable to holders of redeemable participating Shares from operations (3,615,302) (179,550) 813,119 (3,148,728) (2,729,409)
The accompanying notes form an integral part of the financial statements.
Gains and losses arose solely from continuing operations. There were no gains or losses other than those dealt with in the Statement of Comprehensive Income.
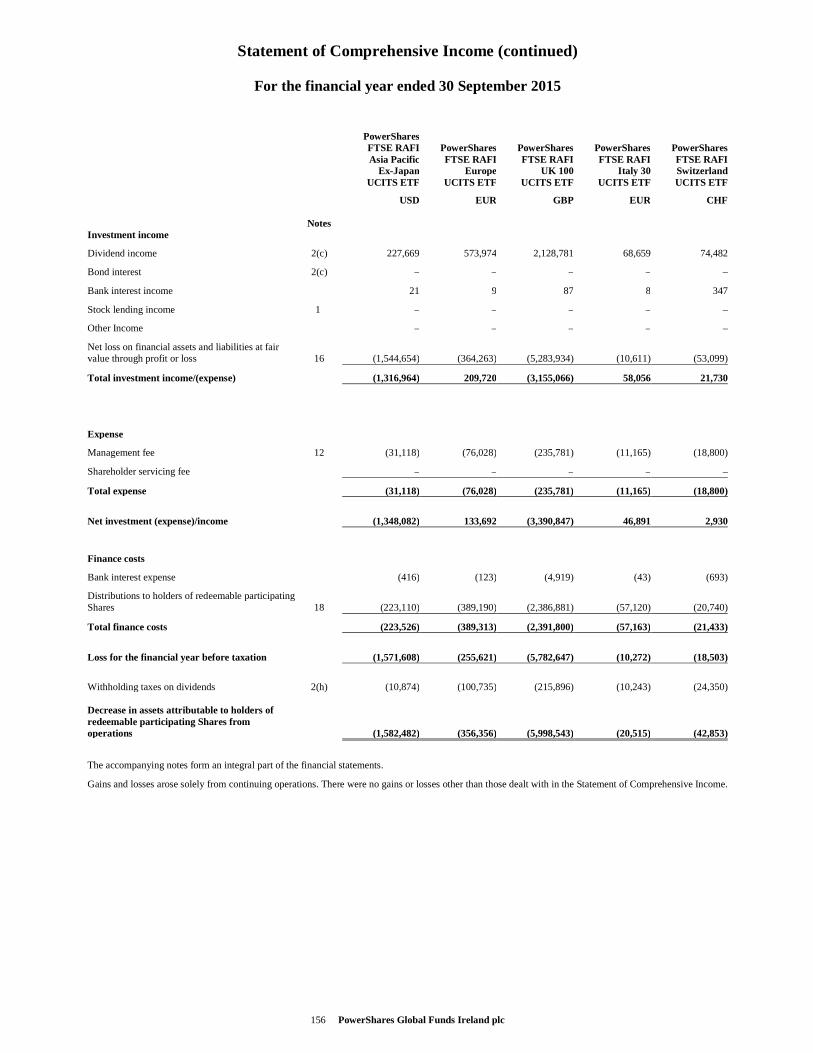
Statement of Comprehensive Income (continued)
156 PowerShares Global Funds Ireland plc
For the financial year ended 30 September 2015
PowerShares FTSE RAFI PowerShares PowerShares PowerShares PowerShares Asia Pacific FTSE RAFI FTSE RAFI FTSE RAFI FTSE RAFI Ex-Japan Europe UK 100 Italy 30 Switzerland UCITS ETF UCITS ETF UCITS ETF UCITS ETF UCITS ETF
USD EUR GBP EUR CHF
Notes Investment income
Dividend income 2(c) 227,669 573,974 2,128,781 68,659 74,482
Bond interest 2(c) – – – – –
Bank interest income 21 9 87 8 347
Stock lending income 1 – – – – –
Other Income – – – – –
Net loss on financial assets and liabilities at fair value through profit or loss 16 (1,544,654) (364,263) (5,283,934) (10,611) (53,099)
Total investment income/(expense) (1,316,964) 209,720 (3,155,066) 58,056 21,730
Expense
Management fee 12 (31,118) (76,028) (235,781) (11,165) (18,800)
Shareholder servicing fee – – – – –
Total expense (31,118) (76,028) (235,781) (11,165) (18,800)
Net investment (expense)/income (1,348,082) 133,692 (3,390,847) 46,891 2,930
Finance costs
Bank interest expense (416) (123) (4,919) (43) (693)
Distributions to holders of redeemable participating Shares 18 (223,110) (389,190) (2,386,881) (57,120) (20,740)
Total finance costs (223,526) (389,313) (2,391,800) (57,163) (21,433)
Loss for the financial year before taxation (1,571,608) (255,621) (5,782,647) (10,272) (18,503)
Withholding taxes on dividends 2(h) (10,874) (100,735) (215,896) (10,243) (24,350) Decrease in assets attributable to holders of redeemable participating Shares from operations (1,582,482) (356,356) (5,998,543) (20,515) (42,853)
The accompanying notes form an integral part of the financial statements.
Gains and losses arose solely from continuing operations. There were no gains or losses other than those dealt with in the Statement of Comprehensive Income.
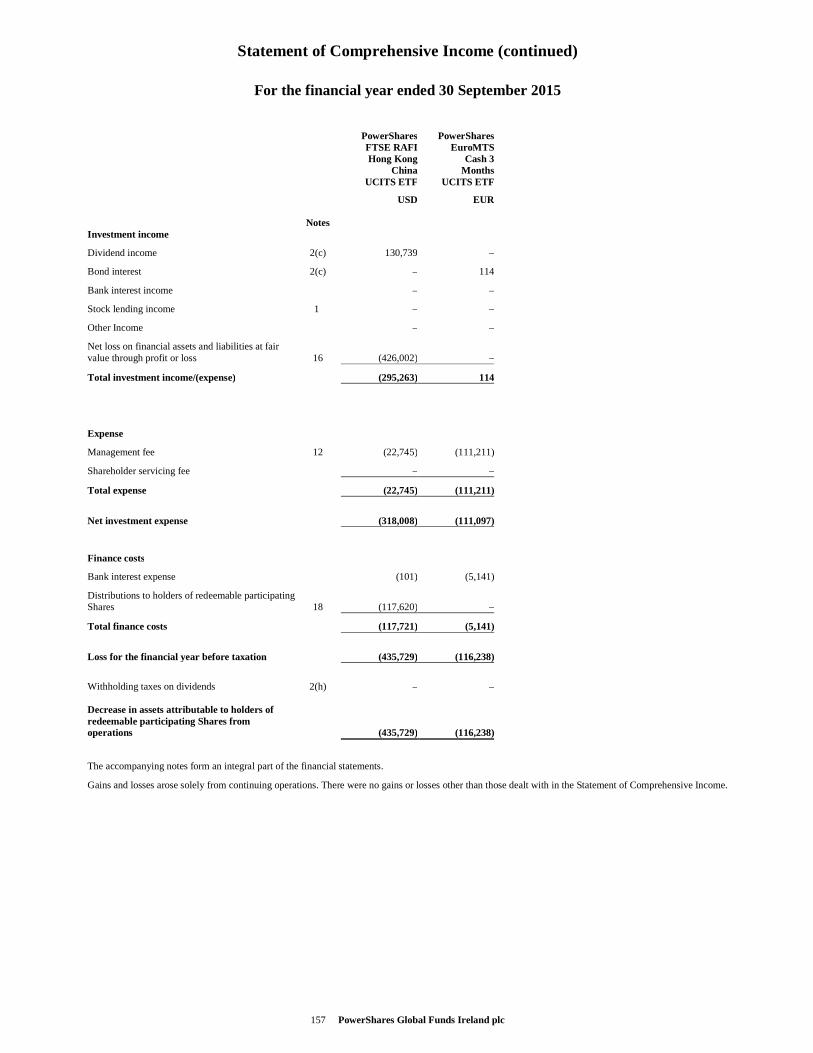
Statement of Comprehensive Income (continued)
157 PowerShares Global Funds Ireland plc
For the financial year ended 30 September 2015
PowerShares PowerShares FTSE RAFI EuroMTS Hong Kong Cash 3 China Months UCITS ETF UCITS ETF
USD EUR
Notes Investment income
Dividend income 2(c) 130,739 –
Bond interest 2(c) – 114
Bank interest income – –
Stock lending income 1 – –
Other Income – –
Net loss on financial assets and liabilities at fair value through profit or loss 16 (426,002) –
Total investment income/(expense) (295,263) 114
Expense
Management fee 12 (22,745) (111,211)
Shareholder servicing fee – –
Total expense (22,745) (111,211)
Net investment expense (318,008) (111,097)
Finance costs
Bank interest expense (101) (5,141)
Distributions to holders of redeemable participating Shares 18 (117,620) –
Total finance costs (117,721) (5,141)
Loss for the financial year before taxation (435,729) (116,238)
Withholding taxes on dividends 2(h) – – Decrease in assets attributable to holders of redeemable participating Shares from operations (435,729) (116,238)
The accompanying notes form an integral part of the financial statements.
Gains and losses arose solely from continuing operations. There were no gains or losses other than those dealt with in the Statement of Comprehensive Income.
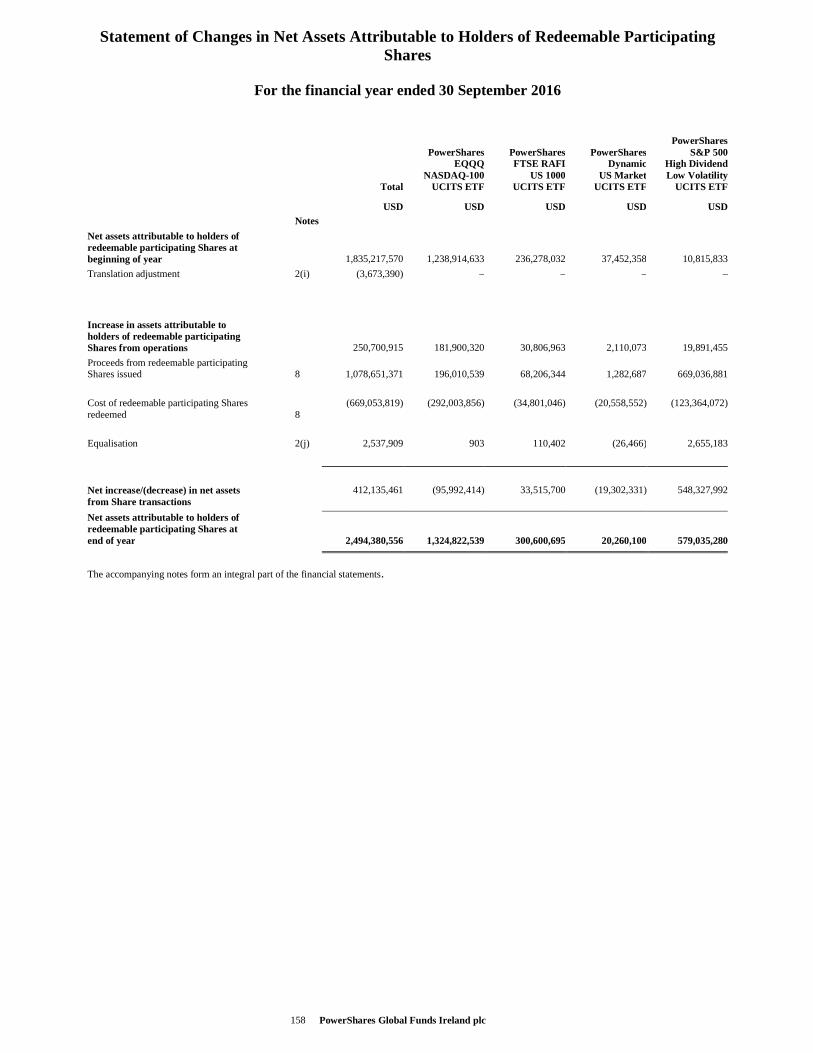
Statement of Changes in Net Assets Attributable to Holders of Redeemable Participating Shares
PowerShares Global Funds Ireland plc 158
For the financial year ended 30 September 2016
PowerShares PowerShares PowerShares PowerShares S&P 500 EQQQ FTSE RAFI Dynamic High Dividend NASDAQ-100 US 1000 US Market Low Volatility Total UCITS ETF UCITS ETF UCITS ETF UCITS ETF
USD USD USD USD USD Notes Net assets attributable to holders of redeemable participating Shares at beginning of year 1,835,217,570 1,238,914,633 236,278,032 37,452,358 10,815,833
Translation adjustment 2(i) (3,673,390) – – – –
Increase in assets attributable to holders of redeemable participating Shares from operations 250,700,915 181,900,320 30,806,963 2,110,073 19,891,455
Proceeds from redeemable participating Shares issued 8 1,078,651,371 196,010,539 68,206,344 1,282,687 669,036,881
Cost of redeemable participating Shares redeemed 8
(669,053,819) (292,003,856) (34,801,046) (20,558,552) (123,364,072)
Equalisation 2(j) 2,537,909 903 110,402 (26,466) 2,655,183
Net increase/(decrease) in net assets from Share transactions
412,135,461 (95,992,414) 33,515,700 (19,302,331) 548,327,992
Net assets attributable to holders of redeemable participating Shares at end of year 2,494,380,556 1,324,822,539 300,600,695 20,260,100 579,035,280
The accompanying notes form an integral part of the financial statements.
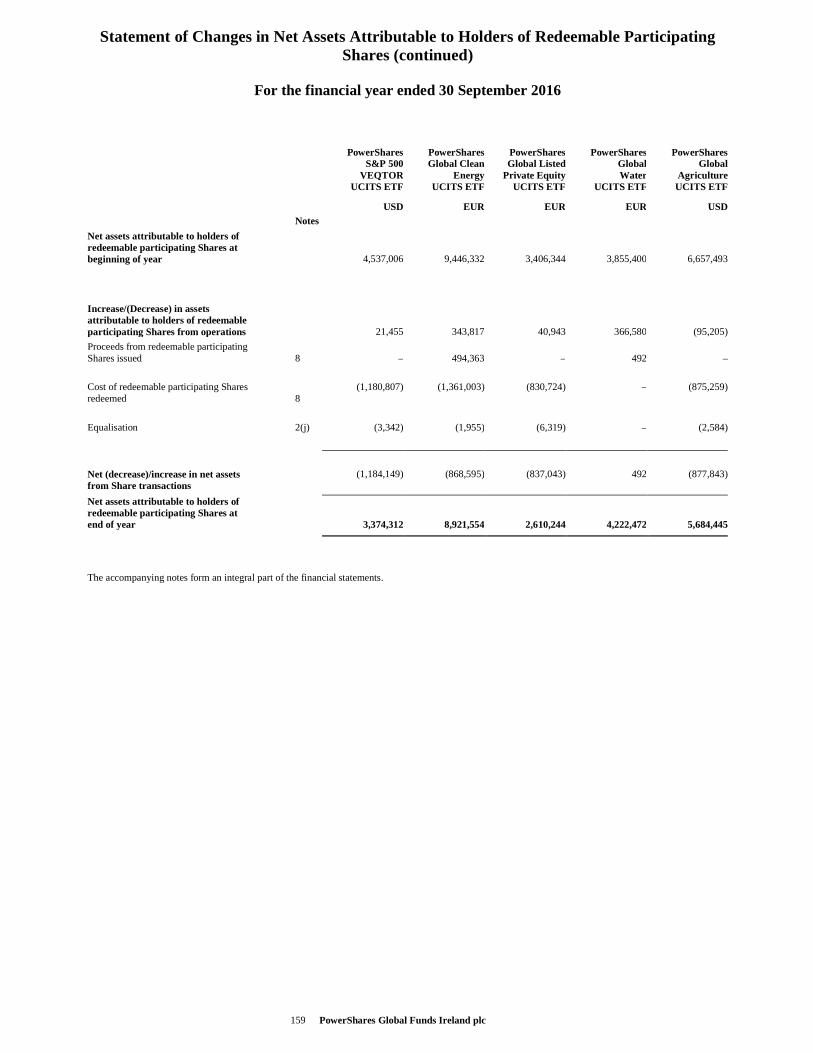
Statement of Changes in Net Assets Attributable to Holders of Redeemable Participating Shares (continued)
PowerShares Global Funds Ireland plc 159
For the financial year ended 30 September 2016
PowerShares PowerShares PowerShares PowerShares PowerShares S&P 500 Global Clean Global Listed Global Global VEQTOR Energy Private Equity Water Agriculture UCITS ETF UCITS ETF UCITS ETF UCITS ETF UCITS ETF
USD EUR EUR EUR USD Notes Net assets attributable to holders of redeemable participating Shares at beginning of year 4,537,006 9,446,332 3,406,344 3,855,400 6,657,493
Increase/(Decrease) in assets attributable to holders of redeemable participating Shares from operations 21,455 343,817 40,943 366,580 (95,205)
Proceeds from redeemable participating Shares issued 8 – 494,363 – 492 –
Cost of redeemable participating Shares redeemed 8
(1,180,807) (1,361,003) (830,724) – (875,259)
Equalisation 2(j) (3,342) (1,955) (6,319) – (2,584)
Net (decrease)/increase in net assets from Share transactions
(1,184,149) (868,595) (837,043) 492 (877,843)
Net assets attributable to holders of redeemable participating Shares at end of year 3,374,312 8,921,554 2,610,244 4,222,472 5,684,445
The accompanying notes form an integral part of the financial statements.
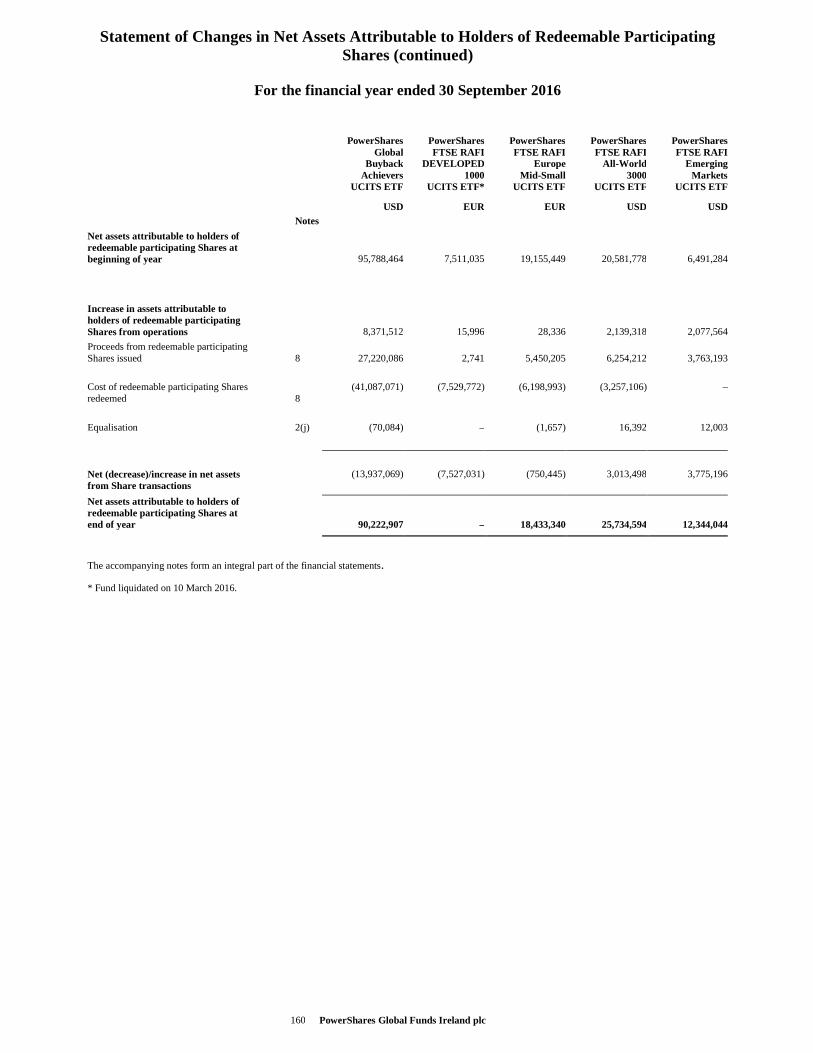
Statement of Changes in Net Assets Attributable to Holders of Redeemable Participating Shares (continued)
PowerShares Global Funds Ireland plc 160
For the financial year ended 30 September 2016
PowerShares PowerShares PowerShares PowerShares PowerShares Global FTSE RAFI FTSE RAFI FTSE RAFI FTSE RAFI Buyback DEVELOPED Europe All-World Emerging Achievers 1000 Mid-Small 3000 Markets UCITS ETF UCITS ETF* UCITS ETF UCITS ETF UCITS ETF
USD EUR EUR USD USD Notes Net assets attributable to holders of redeemable participating Shares at beginning of year 95,788,464 7,511,035 19,155,449 20,581,778 6,491,284
Increase in assets attributable to holders of redeemable participating Shares from operations 8,371,512 15,996 28,336 2,139,318 2,077,564
Proceeds from redeemable participating Shares issued 8 27,220,086 2,741 5,450,205 6,254,212 3,763,193
Cost of redeemable participating Shares redeemed 8
(41,087,071) (7,529,772) (6,198,993) (3,257,106) –
Equalisation 2(j) (70,084) – (1,657) 16,392 12,003
Net (decrease)/increase in net assets from Share transactions
(13,937,069) (7,527,031) (750,445) 3,013,498 3,775,196
Net assets attributable to holders of redeemable participating Shares at end of year 90,222,907 – 18,433,340 25,734,594 12,344,044
The accompanying notes form an integral part of the financial statements.
* Fund liquidated on 10 March 2016.
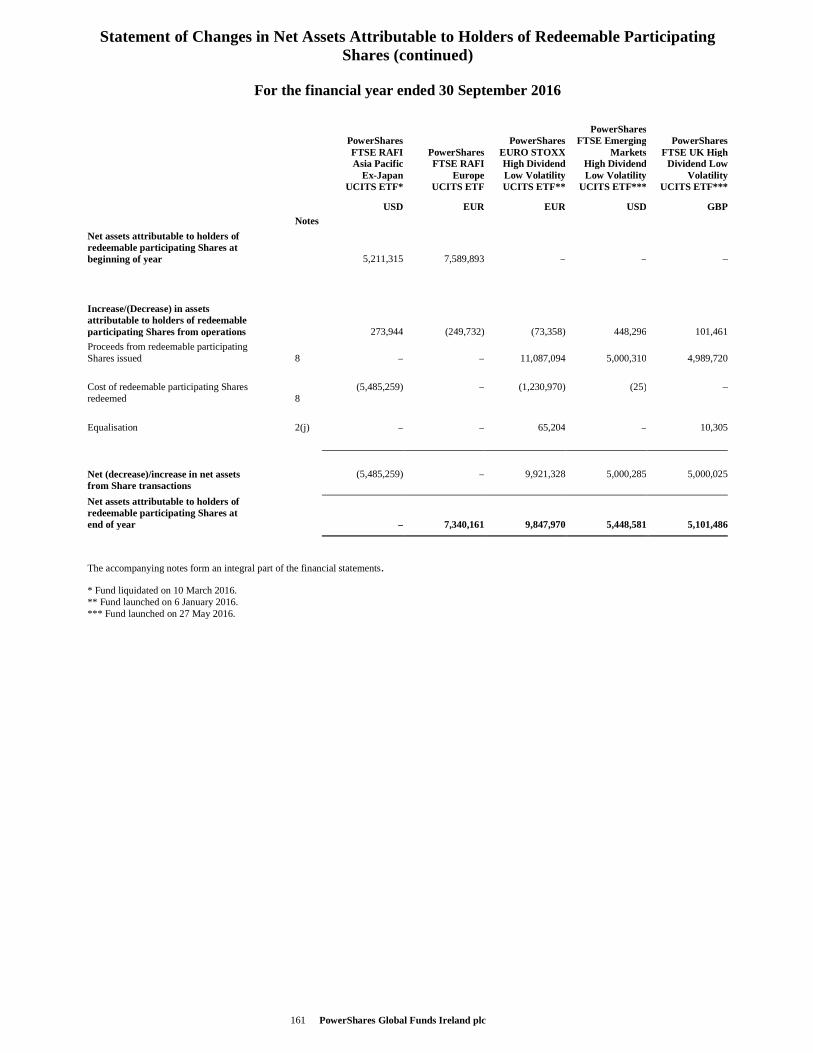
Statement of Changes in Net Assets Attributable to Holders of Redeemable Participating Shares (continued)
PowerShares Global Funds Ireland plc 161
For the financial year ended 30 September 2016
PowerShares PowerShares PowerShares FTSE Emerging PowerShares FTSE RAFI PowerShares EURO STOXX Markets FTSE UK High Asia Pacific FTSE RAFI High Dividend High Dividend Dividend Low Ex-Japan Europe Low Volatility Low Volatility Volatility UCITS ETF* UCITS ETF UCITS ETF** UCITS ETF*** UCITS ETF***
USD EUR EUR USD GBP Notes Net assets attributable to holders of redeemable participating Shares at beginning of year 5,211,315 7,589,893 – – –
Increase/(Decrease) in assets attributable to holders of redeemable participating Shares from operations 273,944 (249,732) (73,358) 448,296 101,461
Proceeds from redeemable participating Shares issued 8 – – 11,087,094 5,000,310 4,989,720
Cost of redeemable participating Shares redeemed 8
(5,485,259) – (1,230,970) (25) –
Equalisation 2(j) – – 65,204 – 10,305
Net (decrease)/increase in net assets from Share transactions
(5,485,259) – 9,921,328 5,000,285 5,000,025
Net assets attributable to holders of redeemable participating Shares at end of year – 7,340,161 9,847,970 5,448,581 5,101,486
The accompanying notes form an integral part of the financial statements.
* Fund liquidated on 10 March 2016. ** Fund launched on 6 January 2016. *** Fund launched on 27 May 2016.
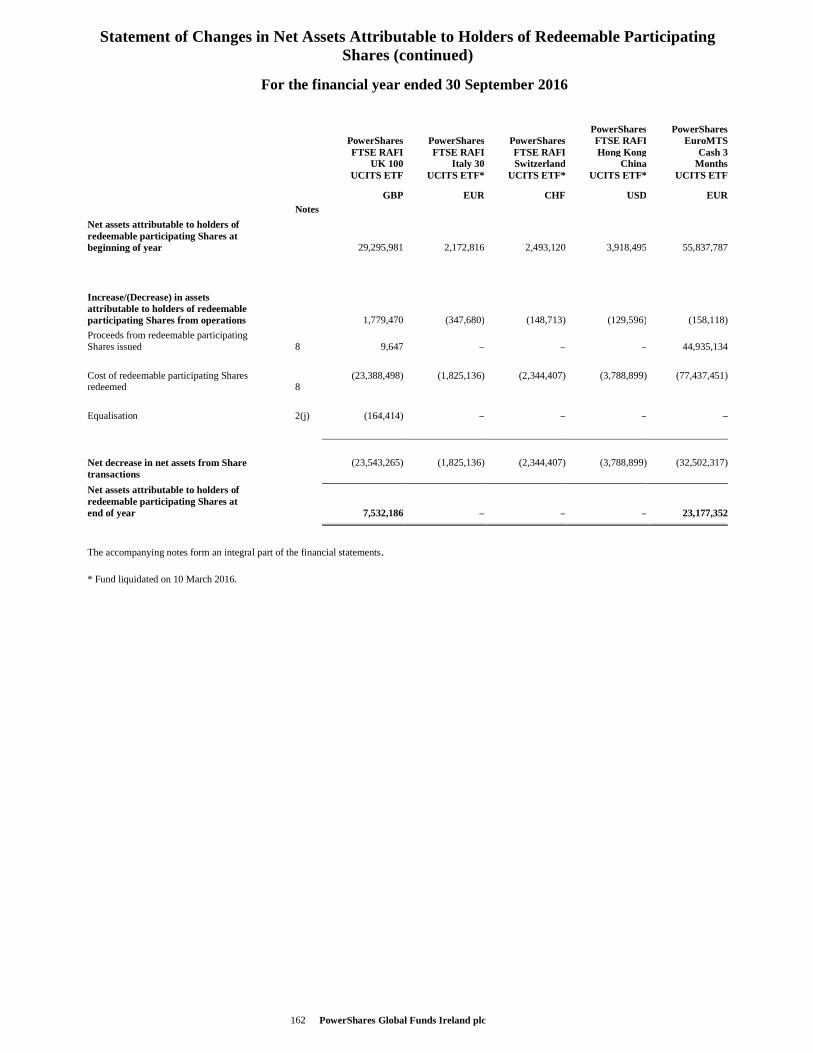
Statement of Changes in Net Assets Attributable to Holders of Redeemable Participating Shares (continued)
PowerShares Global Funds Ireland plc 162
For the financial year ended 30 September 2016
PowerShares PowerShares PowerShares PowerShares PowerShares FTSE RAFI EuroMTS FTSE RAFI FTSE RAFI FTSE RAFI Hong Kong Cash 3 UK 100 Italy 30 Switzerland China Months UCITS ETF UCITS ETF* UCITS ETF* UCITS ETF* UCITS ETF
GBP EUR CHF USD EUR Notes Net assets attributable to holders of redeemable participating Shares at beginning of year 29,295,981 2,172,816 2,493,120 3,918,495 55,837,787
Increase/(Decrease) in assets attributable to holders of redeemable participating Shares from operations 1,779,470 (347,680) (148,713) (129,596) (158,118)
Proceeds from redeemable participating Shares issued 8 9,647 – – – 44,935,134
Cost of redeemable participating Shares redeemed 8
(23,388,498) (1,825,136) (2,344,407) (3,788,899) (77,437,451)
Equalisation 2(j) (164,414) – – – –
Net decrease in net assets from Share transactions
(23,543,265) (1,825,136) (2,344,407) (3,788,899) (32,502,317)
Net assets attributable to holders of redeemable participating Shares at end of year 7,532,186 – – – 23,177,352
The accompanying notes form an integral part of the financial statements. * Fund liquidated on 10 March 2016.
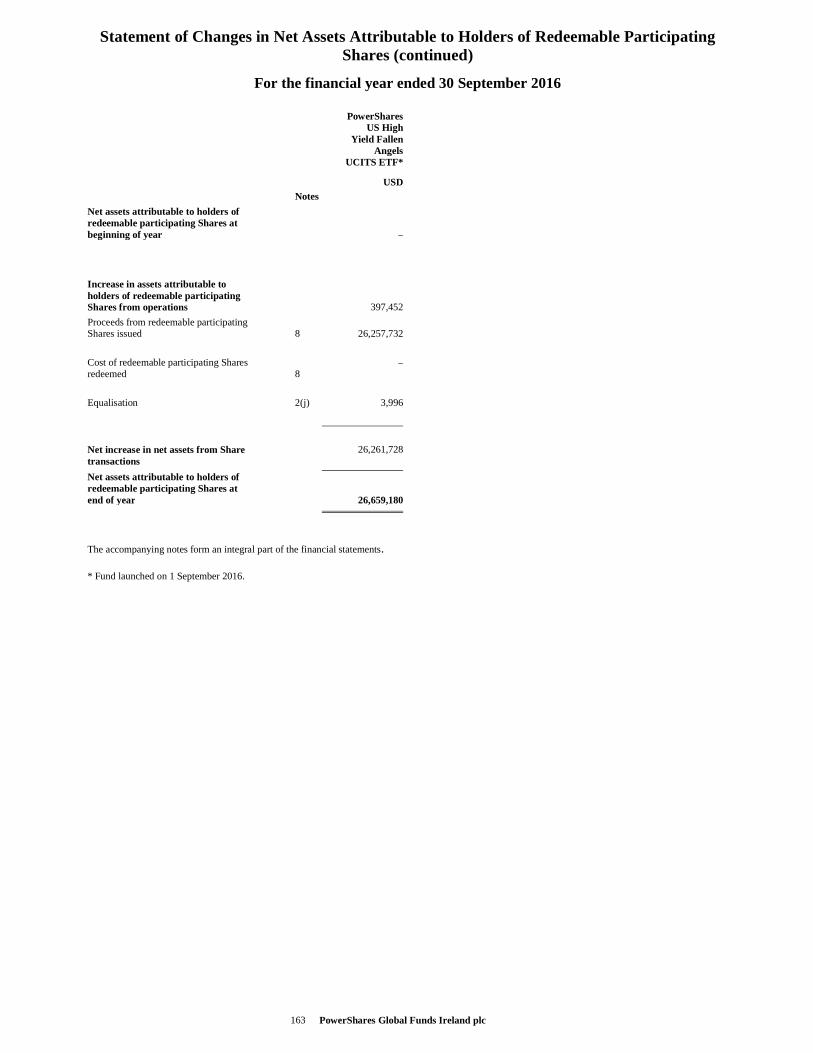
Statement of Changes in Net Assets Attributable to Holders of Redeemable Participating Shares (continued)
PowerShares Global Funds Ireland plc 163
For the financial year ended 30 September 2016
PowerShares US High Yield Fallen Angels UCITS ETF*
USD Notes Net assets attributable to holders of redeemable participating Shares at beginning of year –
Increase in assets attributable to holders of redeemable participating Shares from operations 397,452
Proceeds from redeemable participating Shares issued 8 26,257,732
Cost of redeemable participating Shares redeemed 8
–
Equalisation 2(j) 3,996
Net increase in net assets from Share transactions
26,261,728
Net assets attributable to holders of redeemable participating Shares at end of year 26,659,180
The accompanying notes form an integral part of the financial statements. * Fund launched on 1 September 2016.
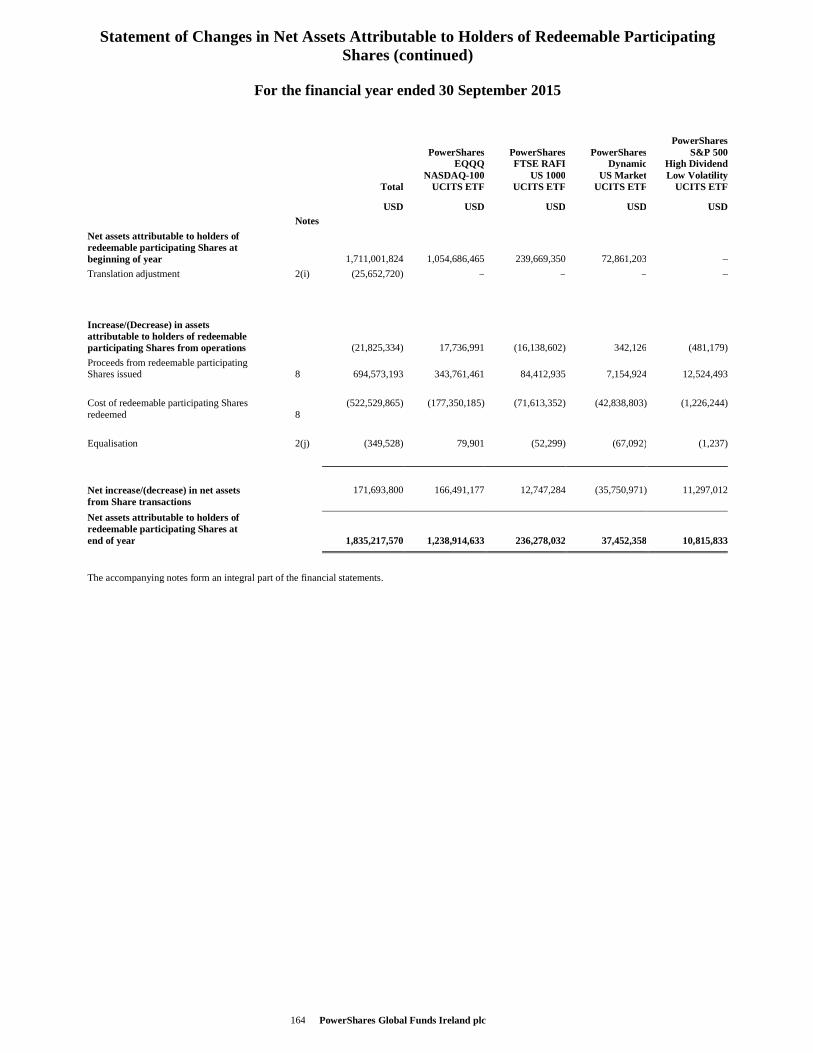
Statement of Changes in Net Assets Attributable to Holders of Redeemable Participating Shares (continued)
PowerShares Global Funds Ireland plc 164
For the financial year ended 30 September 2015
PowerShares PowerShares PowerShares PowerShares S&P 500 EQQQ FTSE RAFI Dynamic High Dividend NASDAQ-100 US 1000 US Market Low Volatility Total UCITS ETF UCITS ETF UCITS ETF UCITS ETF
USD USD USD USD USD Notes Net assets attributable to holders of redeemable participating Shares at beginning of year 1,711,001,824 1,054,686,465 239,669,350 72,861,203 –
Translation adjustment 2(i) (25,652,720) – – – –
Increase/(Decrease) in assets attributable to holders of redeemable participating Shares from operations (21,825,334) 17,736,991 (16,138,602) 342,126 (481,179)
Proceeds from redeemable participating Shares issued 8 694,573,193 343,761,461 84,412,935 7,154,924 12,524,493
Cost of redeemable participating Shares redeemed 8
(522,529,865) (177,350,185) (71,613,352) (42,838,803) (1,226,244)
Equalisation 2(j) (349,528) 79,901 (52,299) (67,092) (1,237)
Net increase/(decrease) in net assets from Share transactions
171,693,800 166,491,177 12,747,284 (35,750,971) 11,297,012
Net assets attributable to holders of redeemable participating Shares at end of year 1,835,217,570 1,238,914,633 236,278,032 37,452,358 10,815,833
The accompanying notes form an integral part of the financial statements.
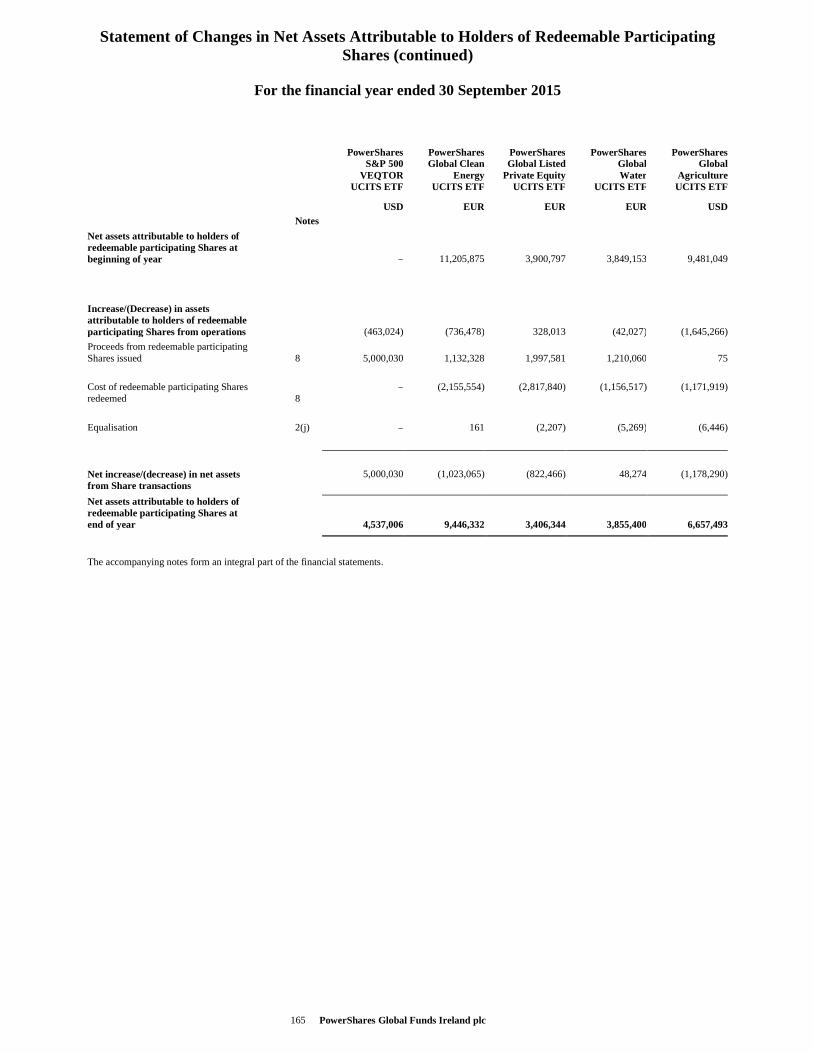
Statement of Changes in Net Assets Attributable to Holders of Redeemable Participating Shares (continued)
PowerShares Global Funds Ireland plc 165
For the financial year ended 30 September 2015
PowerShares PowerShares PowerShares PowerShares PowerShares S&P 500 Global Clean Global Listed Global Global VEQTOR Energy Private Equity Water Agriculture UCITS ETF UCITS ETF UCITS ETF UCITS ETF UCITS ETF
USD EUR EUR EUR USD Notes Net assets attributable to holders of redeemable participating Shares at beginning of year – 11,205,875 3,900,797 3,849,153 9,481,049
Increase/(Decrease) in assets attributable to holders of redeemable participating Shares from operations (463,024) (736,478) 328,013 (42,027) (1,645,266)
Proceeds from redeemable participating Shares issued 8 5,000,030 1,132,328 1,997,581 1,210,060 75
Cost of redeemable participating Shares redeemed 8
– (2,155,554) (2,817,840) (1,156,517) (1,171,919)
Equalisation 2(j) – 161 (2,207) (5,269) (6,446)
Net increase/(decrease) in net assets from Share transactions
5,000,030 (1,023,065) (822,466) 48,274 (1,178,290)
Net assets attributable to holders of redeemable participating Shares at end of year 4,537,006 9,446,332 3,406,344 3,855,400 6,657,493
The accompanying notes form an integral part of the financial statements.
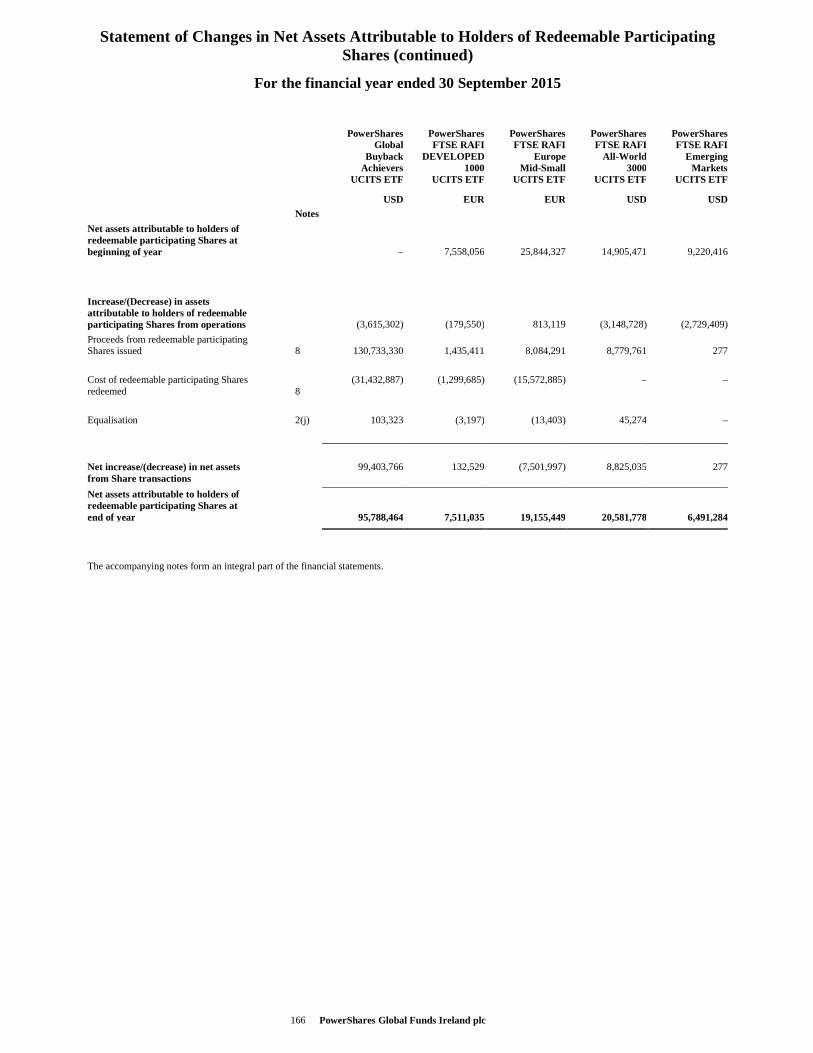
Statement of Changes in Net Assets Attributable to Holders of Redeemable Participating Shares (continued)
PowerShares Global Funds Ireland plc 166
For the financial year ended 30 September 2015
PowerShares PowerShares PowerShares PowerShares PowerShares Global FTSE RAFI FTSE RAFI FTSE RAFI FTSE RAFI Buyback DEVELOPED Europe All-World Emerging Achievers 1000 Mid-Small 3000 Markets UCITS ETF UCITS ETF UCITS ETF UCITS ETF UCITS ETF
USD EUR EUR USD USD Notes Net assets attributable to holders of redeemable participating Shares at beginning of year – 7,558,056 25,844,327 14,905,471 9,220,416
Increase/(Decrease) in assets attributable to holders of redeemable participating Shares from operations (3,615,302) (179,550) 813,119 (3,148,728) (2,729,409)
Proceeds from redeemable participating Shares issued 8 130,733,330 1,435,411 8,084,291 8,779,761 277
Cost of redeemable participating Shares redeemed 8
(31,432,887) (1,299,685) (15,572,885) – –
Equalisation 2(j) 103,323 (3,197) (13,403) 45,274 –
Net increase/(decrease) in net assets from Share transactions
99,403,766 132,529 (7,501,997) 8,825,035 277
Net assets attributable to holders of redeemable participating Shares at end of year 95,788,464 7,511,035 19,155,449 20,581,778 6,491,284
The accompanying notes form an integral part of the financial statements.
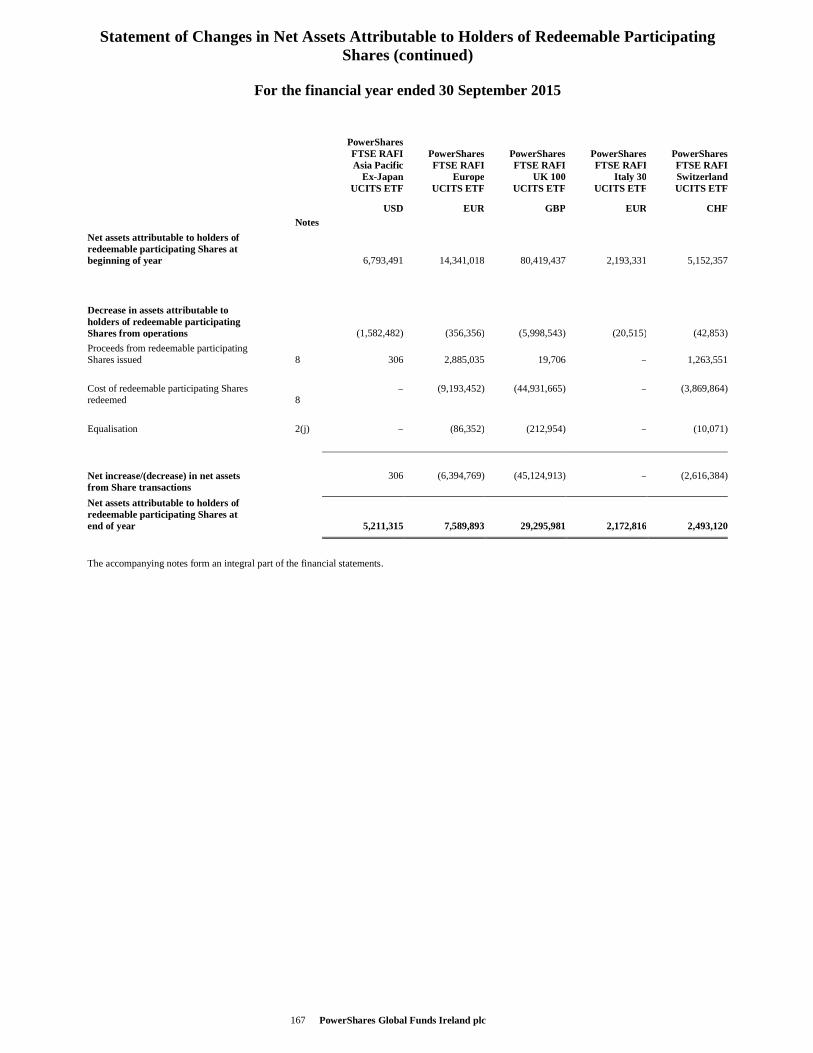
Statement of Changes in Net Assets Attributable to Holders of Redeemable Participating Shares (continued)
PowerShares Global Funds Ireland plc 167
For the financial year ended 30 September 2015
PowerShares FTSE RAFI PowerShares PowerShares PowerShares PowerShares Asia Pacific FTSE RAFI FTSE RAFI FTSE RAFI FTSE RAFI Ex-Japan Europe UK 100 Italy 30 Switzerland UCITS ETF UCITS ETF UCITS ETF UCITS ETF UCITS ETF
USD EUR GBP EUR CHF Notes Net assets attributable to holders of redeemable participating Shares at beginning of year 6,793,491 14,341,018 80,419,437 2,193,331 5,152,357
Decrease in assets attributable to holders of redeemable participating Shares from operations (1,582,482) (356,356) (5,998,543) (20,515) (42,853)
Proceeds from redeemable participating Shares issued 8 306 2,885,035 19,706 – 1,263,551
Cost of redeemable participating Shares redeemed 8
– (9,193,452) (44,931,665) – (3,869,864)
Equalisation 2(j) – (86,352) (212,954) – (10,071)
Net increase/(decrease) in net assets from Share transactions
306 (6,394,769) (45,124,913) – (2,616,384)
Net assets attributable to holders of redeemable participating Shares at end of year 5,211,315 7,589,893 29,295,981 2,172,816 2,493,120
The accompanying notes form an integral part of the financial statements.
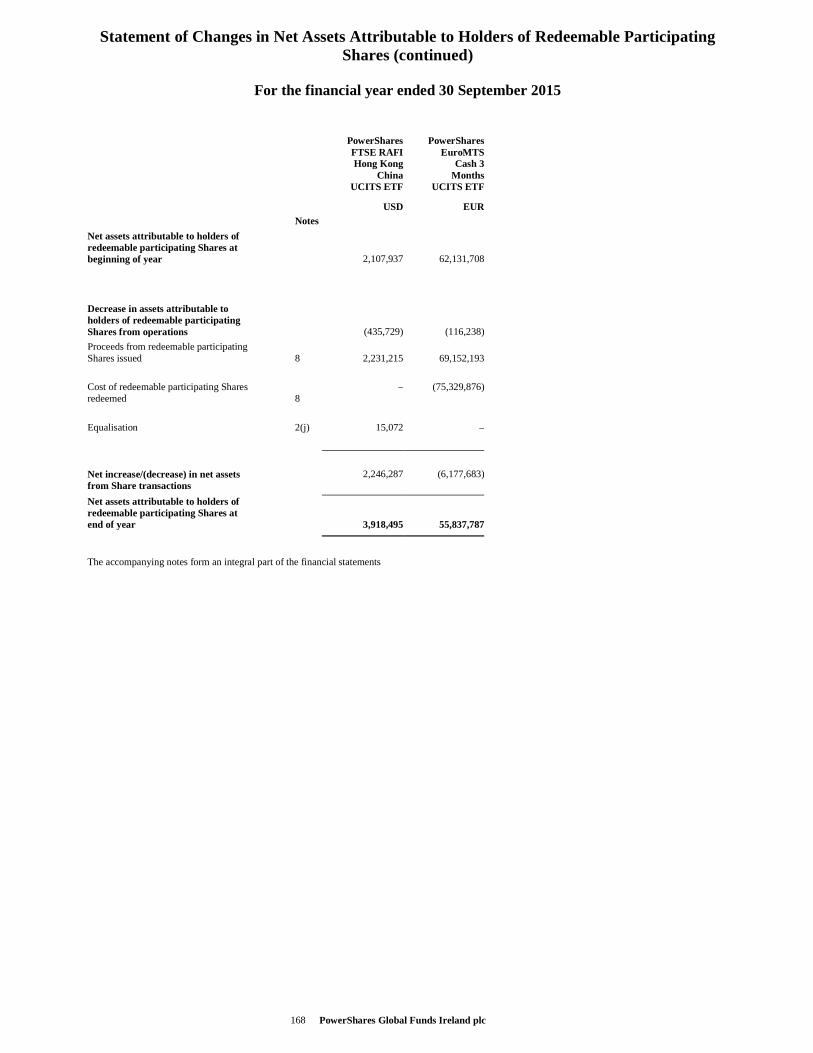
Statement of Changes in Net Assets Attributable to Holders of Redeemable Participating Shares (continued)
PowerShares Global Funds Ireland plc 168
For the financial year ended 30 September 2015
PowerShares PowerShares FTSE RAFI EuroMTS Hong Kong Cash 3 China Months UCITS ETF UCITS ETF
USD EUR Notes Net assets attributable to holders of redeemable participating Shares at beginning of year 2,107,937 62,131,708
Decrease in assets attributable to holders of redeemable participating Shares from operations (435,729) (116,238)
Proceeds from redeemable participating Shares issued 8 2,231,215 69,152,193
Cost of redeemable participating Shares redeemed 8
– (75,329,876)
Equalisation 2(j) 15,072 –
Net increase/(decrease) in net assets from Share transactions
2,246,287 (6,177,683)
Net assets attributable to holders of redeemable participating Shares at end of year 3,918,495 55,837,787
The accompanying notes form an integral part of the financial statements
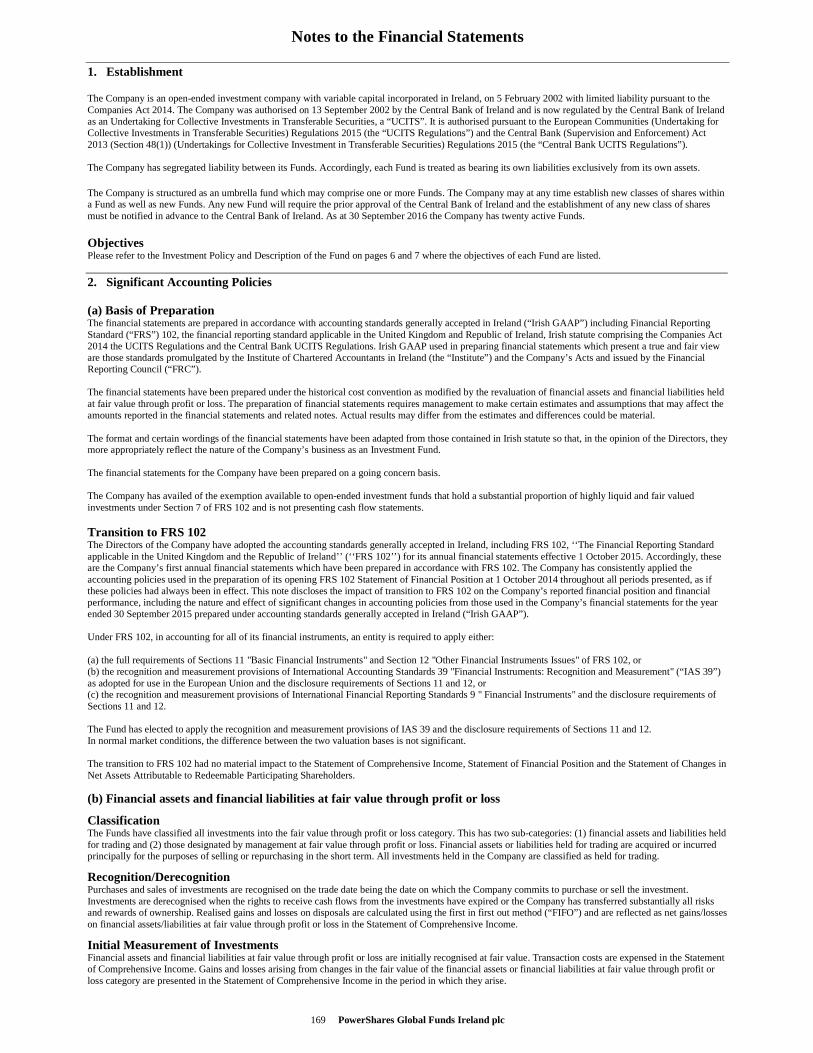
Notes to the Financial Statements
169 PowerShares Global Funds Ireland plc
1. Establishment
The Company is an open-ended investment company with variable capital incorporated in Ireland, on 5 February 2002 with limited liability pursuant to the Companies Act 2014. The Company was authorised on 13 September 2002 by the Central Bank of Ireland and is now regulated by the Central Bank of Ireland as an Undertaking for Collective Investments in Transferable Securities, a “UCITS”. It is authorised pursuant to the European Communities (Undertaking for Collective Investments in Transferable Securities) Regulations 2015 (the “UCITS Regulations”) and the Central Bank (Supervision and Enforcement) Act 2013 (Section 48(1)) (Undertakings for Collective Investment in Transferable Securities) Regulations 2015 (the “Central Bank UCITS Regulations”). The Company has segregated liability between its Funds. Accordingly, each Fund is treated as bearing its own liabilities exclusively from its own assets.
The Company is structured as an umbrella fund which may comprise one or more Funds. The Company may at any time establish new classes of shares within a Fund as well as new Funds. Any new Fund will require the prior approval of the Central Bank of Ireland and the establishment of any new class of shares must be notified in advance to the Central Bank of Ireland. As at 30 September 2016 the Company has twenty active Funds.
Objectives Please refer to the Investment Policy and Description of the Fund on pages 6 and 7 where the objectives of each Fund are listed.
2. Significant Accounting Policies
(a) Basis of Preparation The financial statements are prepared in accordance with accounting standards generally accepted in Ireland (“Irish GAAP”) including Financial Reporting Standard (“FRS”) 102, the financial reporting standard applicable in the United Kingdom and Republic of Ireland, Irish statute comprising the Companies Act 2014 the UCITS Regulations and the Central Bank UCITS Regulations. Irish GAAP used in preparing financial statements which present a true and fair view are those standards promulgated by the Institute of Chartered Accountants in Ireland (the “Institute”) and the Company’s Acts and issued by the Financial Reporting Council (“FRC”). The financial statements have been prepared under the historical cost convention as modified by the revaluation of financial assets and financial liabilities held at fair value through profit or loss. The preparation of financial statements requires management to make certain estimates and assumptions that may affect the amounts reported in the financial statements and related notes. Actual results may differ from the estimates and differences could be material. The format and certain wordings of the financial statements have been adapted from those contained in Irish statute so that, in the opinion of the Directors, they more appropriately reflect the nature of the Company’s business as an Investment Fund. The financial statements for the Company have been prepared on a going concern basis. The Company has availed of the exemption available to open-ended investment funds that hold a substantial proportion of highly liquid and fair valued investments under Section 7 of FRS 102 and is not presenting cash flow statements.
Transition to FRS 102 The Directors of the Company have adopted the accounting standards generally accepted in Ireland, including FRS 102, ‘‘The Financial Reporting Standard applicable in the United Kingdom and the Republic of Ireland’’ (‘‘FRS 102’’) for its annual financial statements effective 1 October 2015. Accordingly, these are the Company’s first annual financial statements which have been prepared in accordance with FRS 102. The Company has consistently applied the accounting policies used in the preparation of its opening FRS 102 Statement of Financial Position at 1 October 2014 throughout all periods presented, as if these policies had always been in effect. This note discloses the impact of transition to FRS 102 on the Company’s reported financial position and financial performance, including the nature and effect of significant changes in accounting policies from those used in the Company’s financial statements for the year ended 30 September 2015 prepared under accounting standards generally accepted in Ireland (“Irish GAAP”). Under FRS 102, in accounting for all of its financial instruments, an entity is required to apply either: (a) the full requirements of Sections 11 "Basic Financial Instruments" and Section 12 "Other Financial Instruments Issues" of FRS 102, or (b) the recognition and measurement provisions of International Accounting Standards 39 "Financial Instruments: Recognition and Measurement" (“IAS 39”) as adopted for use in the European Union and the disclosure requirements of Sections 11 and 12, or (c) the recognition and measurement provisions of International Financial Reporting Standards 9 " Financial Instruments" and the disclosure requirements of Sections 11 and 12. The Fund has elected to apply the recognition and measurement provisions of IAS 39 and the disclosure requirements of Sections 11 and 12. In normal market conditions, the difference between the two valuation bases is not significant. The transition to FRS 102 had no material impact to the Statement of Comprehensive Income, Statement of Financial Position and the Statement of Changes in Net Assets Attributable to Redeemable Participating Shareholders.
(b) Financial assets and financial liabilities at fair value through profit or loss
Classification The Funds have classified all investments into the fair value through profit or loss category. This has two sub-categories: (1) financial assets and liabilities held for trading and (2) those designated by management at fair value through profit or loss. Financial assets or liabilities held for trading are acquired or incurred principally for the purposes of selling or repurchasing in the short term. All investments held in the Company are classified as held for trading.
Recognition/Derecognition Purchases and sales of investments are recognised on the trade date being the date on which the Company commits to purchase or sell the investment. Investments are derecognised when the rights to receive cash flows from the investments have expired or the Company has transferred substantially all risks and rewards of ownership. Realised gains and losses on disposals are calculated using the first in first out method (“FIFO”) and are reflected as net gains/losses on financial assets/liabilities at fair value through profit or loss in the Statement of Comprehensive Income.
Initial Measurement of Investments Financial assets and financial liabilities at fair value through profit or loss are initially recognised at fair value. Transaction costs are expensed in the Statement of Comprehensive Income. Gains and losses arising from changes in the fair value of the financial assets or financial liabilities at fair value through profit or loss category are presented in the Statement of Comprehensive Income in the period in which they arise.
Notes to the Financial Statements (continued)
PowerShares Global Funds Ireland plc 170
2. Significant Accounting Policies (continued)
(b) Financial assets and financial liabilities at fair value through profit or loss (continued)
Valuation of Investments The estimation of fair value, after initial recognition, is determined as follows:
(i) Listed Investments The value of an Investment which is quoted, listed or normally dealt in on a Regulated Market shall be the closing sale price on such Regulated Market as at the Valuation Point or the last traded price when no closing sale price is available. (ii) Futures Contracts Derivative financial instruments are initially recognized at cost and subsequently are re-measured at market value. Market values are obtained from quoted market prices and exchange rates. All derivatives are carried in assets when amounts are receivable by the Fund and in liabilities when amounts are payable by the Fund. Changes in market values of future contracts are included in note 16.
(c) Income from Investments (i) Dividend Income Dividends are credited to the Statement of Comprehensive Income on the dates on which the relevant securities are listed as “ex-dividend”. Dividend income is shown gross of any non-recoverable withholding taxes, which are disclosed separately in the Statement of Comprehensive Income, and net of any tax credits. Recoverable taxes if any are accounted for on a cash receipts basis.
(ii)Bond Interest Interest income on securities is accrued on a daily basis and recognised in the Statement of Comprehensive Income. Interest income on securities includes interest and discount earned (net of premium), which is the difference between the face value and the original cost, including original issue discount.
(d) Expense Recognition All expenses are recognised in the Statement of Comprehensive Income on an accruals basis, with the exception of transaction charges relating to the acquisition and realisation of investments which are charged when incurred. Bank interest expense is accrued on a daily basis.
(e) Receivables and Payables Receivables are non-derivative financial assets with fixed or determinable payments that are not quoted in an active market. Receivables are recognised initially at fair value plus transaction costs that are directly attributable to their acquisition origination. They are subsequently measured at amortised cost using the effective interest method, less provision for impairment. The carrying amount of other receivables approximates to their fair values. Payables are recognised initially at fair value and subsequently stated at amortised cost, using the effective interest method. The difference between the proceeds and the amount payable is recognised over the period of the payable. The carrying amount of payables approximates to their fair values.
Securities sold receivable and securities purchased payable represent receivables for securities sold and payables for securities purchased that have been contracted for but not yet settled or delivered on the Statement of Financial Position date respectively.
(f) Redeemable Participating Shares The Net Asset Value per share is computed for each dealing day. The price at which shares are allotted or redeemed is calculated with reference to the Net Asset Value per share as at the close of business on the relevant dealing day in accordance with the prospectus of the Company, as amended.
Redeemable participating Shares are redeemable at the shareholder’s option and are classified as financial liabilities. The distribution on these shares is recognised in the Statement of Comprehensive Income as finance costs.
The redeemable participating Shares can be redeemed at any time for cash equal to a proportionate share of the net asset value. The redeemable participating Share is carried at the redemption amount that is payable at the Statement of Financial Position date if the shareholder exercised its right to put the share back into the Company.
The fair value of the financial liability for the redeemable participating Shares is the redemption amount per share, calculated as the Net Asset Value per share less any associated duties and charges and any redemption dividend which is payable on the Shares redeemed.
Capital shares receivable and capital shares payable represent receivables for shares sold and payables for shares purchased that have been contracted for but not yet settled or delivered on the Statement of Financial Position date respectively.
(g) Dividends to Redeemable Participating Shareholders Dividends payable to holders of redeemable participating Shares are classified as finance costs in the Statement of Comprehensive Income.
(h) Taxation Under current law and practice the Company qualifies as an investment undertaking as defined in Section 739B of the Taxes Consolidation Act, 1997, as amended. On that basis, it is not chargeable to Irish tax on its income or gains.
However, Irish tax may arise on the happening of a “chargeable event”. A chargeable event includes any distribution payments to shareholders, any encashment, redemption, cancellation or transfer of shares and the holding of shares at the end of each eight year beginning with the acquisition of such shares.
No Irish tax will arise on the Company in respect of chargeable events in respect of:
a) A Shareholder who is neither Irish resident nor ordinarily resident in Ireland for tax purposes, at the time of the chargeable event, provided appropriate valid declarations in accordance with the provisions of the Taxes Consolidation Act, 1997, as amended, are held by the Company or Company has been authorised by the Irish Revenue to make gross payments in the absence of appropriate declarations; and
b) Certain exempted Irish tax resident shareholders who have provided the Company with the necessary signed statutory declarations.
Dividends, interest and capital gains (if any) received on investments made by the Company may be subject to withholding taxes imposed by the country from which the investment income/gains are received and such taxes may not be recoverable by the Company or its shareholders.
The Finance Act 2010 provides that the Revenue Commissioners may grant approval for investment funds marketed outside of Ireland to make payments to non-resident investors without deduction of Irish tax where no relevant declaration is in place, subject to meeting the “equivalent measures”. A company wishing to receive approval must apply in writing to the Revenue Commissioners, confirming compliance with the relevant conditions.
Notes to the Financial Statements (continued)
PowerShares Global Funds Ireland plc 171
2. Significant Accounting Policies (continued)
(i) Foreign Currency Items included in the Company's financial statements are measured using the currency of the primary economic environment in which it operates ("the functional currency"). This is US Dollar, which reflects the fact that the Company's investor base is located in the United States.
(i) Functional and Presentation Currency
The Funds have US Dollar as their functional and presentation currency apart from the following:
Fund Currency Fund Currency
PowerShares Global Clean Energy UCITS ETF EUR PowerShares Euro Stoxx High Dividend Low Volatility UCITS ETF EUR
PowerShares Global Listed Private Equity UCITS ETF EUR PowerShares FTSE UK High Dividend Low Volatility UCITS ETF GBP
PowerShares Global Water UCITS ETF EUR PowerShares FTSE RAFI UK 100 UCITS ETF GBP
PowerShares FTSE RAFI Developed 1000 UCITS EFT* EUR PowerShares FTSE RAFI Italy 30 UCITS ETF* EUR
PowerShares FTSE RAFI Europe Mid-Small UCITS ETF EUR PowerShares FTSE RAFI Switzerland UCITS ETF* CHF
PowerShares FTSE RAFI Europe UCITS ETF EUR PowerShares EuroMTS Cash 3 Months UCITS ETF EUR
* Fund liquidated on 10 March 2016
For the purpose of combining the Financial Statements of the Funds to arrive at Total Company figures (required under Irish Company Law), the amounts in the Funds' Statement of Financial Position have been translated to US Dollar at the exchange rate ruling at 30 September 2016. The Statement of Comprehensive Income and proceeds from subscriptions and amounts paid on redemptions of redeemable participating Shares are translated at the average rates prevailing at the date of the transactions. For rates of exchange please see note 17. The notional foreign exchange loss of USD (3,673,390) (2015: USD(25,652,720)) is due to the use of average rates as stated above and the difference in opening and closing rates in translation of opening net assets. This notional foreign exchange adjustment has no impact on the Net Asset Value of the individual Funds.
(ii) Transactions and Balances Foreign currency transactions are translated into the functional currency using the exchange rates prevailing at the dates of the transactions. Foreign currency assets and liabilities are translated into the functional currency using the exchange rate prevailing at the Statement of Financial Position date. Foreign exchange gains and losses arising from translation are included in the Statement of Comprehensive Income. Foreign exchange gains and losses relating to cash and cash equivalents are presented in the Statement of Comprehensive Income within ‘Net gain/loss on financial assets and liabilities at fair value through profit or loss’. Foreign exchange gains and losses relating to the financial assets and liabilities carried at fair value through profit or loss are presented in the Statement of Comprehensive Income within ‘Net gain/loss on financial assets and liabilities at fair value through profit or loss’.
(j) Equalisation An equalisation account is maintained by each Fund so that the amount distributed on all classes of Shares will be the same for all shares of the same type, notwithstanding different dates of issue. A sum equal to that part of the issue price of a Share which reflects income (if any) accrued up to the date of issue will be deemed to be an equalisation payment. It will be treated as repaid to Shareholders with the first distribution or accumulation for the relevant Fund to which the Shareholder is entitled in the same accounting period as that in which the shares are issued. Equalisation will not be operated in respect of the first issue of Shares by a Fund.
(k) Cash and Cash Equivalents Cash and cash equivalents include cash in hand and other short-term highly liquid investments with original maturities of three months or less. Bank overdrafts are included in liabilities on the Statement of Financial Position.
(l) Transaction Fees Transaction fees are costs incurred to acquire financial assets or liabilities at fair value through profit or loss. They include fees and commissions paid to agents, advisers, brokers and dealers. Transaction fees, when incurred, are immediately recognised in profit or loss as an expense.
(m) Cash Collateral Held Cash collateral provided by each Fund is identified in the Statement of Financial Position as cash collateral held and is not included as a component of cash and cash equivalents. For collateral other than cash, if the party to whom the collateral is provided has the right by contract or custom to sell or repledge the collateral, the Fund classifies that asset in its Statement of Financial Position separately from other assets and identifies the asset as pledged collateral. Where the party to whom the collateral is provided does not have the right to sell or repledge, a disclosure of the collateral provided is made in the notes to the financial statements. Any obligation arising from collateral received is measured at the fair value of the amount required to settle the obligation and separately identified in the Statement of Financial Position.
(n) Margin Account Held at Broker Cash collateral provided by/payable to each Fund in relation to futures contracts is identified in the Statement of Financial Position as margin cash held at broker and is not included as a component of cash and cash equivalents.
3. Cash
The Fund’s cash balances are maintained in an interest-bearing account with the sub-custodian of the Company, The Bank of New York Mellon (Luxembourg). These cash balances are held in the name of BNY Mellon Trust Company (Ireland) Limited, the Depositary.
Cash and other liquid assets with a maturity of less than 3 months will be valued at their face value with interest accrued.
4. Margin Accounts
Margin accounts represent the exchange-traded futures contracts' margin deposits amounts held with brokers. At 30 September 2016 the PowerShares S&P 500 VEQTOR UCITS ETF held margin accounts of US$195,406 and variation margin payable of US$2,542 (2015: US$14,115) with Bank of America Merrill Lynch (2015: US$329,786).
Notes to the Financial Statements (continued)
PowerShares Global Funds Ireland plc 172
5. Financial Assets and Liabilities at Fair Value Through Profit or Loss
The following tables list the financial assets and financial liabilities at fair value through profit or loss by asset type for the financial year ended 30 September 2016 and 30 September 2015 respectively.
30 September 2016 0 PowerShares 0 PowerShares PowerShares PowerShares S&P 500 PowerShares0 EQQQ FTSE RAFI Dynamic High Dividend S&P 5000 NASDAQ-100 US 1000 US Market Low Volatility VEQTOR0 Total UCITS ETF UCITS ETF UCITS ETF UCITS ETF UCITS ETF0 USD USD USD USD USD USDEquities 2,444,764,336 1,325,651,215 300,884,271 20,270,833 579,618,816 3,048,873Bonds 51,385,311 – – – – –Futures Contracts 663 – – – – 663Total 2,496,150,310 1,325,651,215 300,884,271 20,270,833 579,618,816 3,049,536
30 September 2016 0 PowerShares PowerShares0 PowerShares PowerShares PowerShares PowerShares Global FTSE RAFI0 Global Clean Global Listed Global Global Buyback Europe0 Energy Private Equity Water Agriculture Achievers Mid -Small0 UCITS ETF UCITS ETF UCITS ETF UCITS ETF UCITS ETF UCITS ETF0 EUR EUR EUR USD USD EUREquities 8,961,899 2,614,273 4,233,180 5,661,632 90,171,332 18,450,617Total 8,961,899 2,614,273 4,233,180 5,661,632 90,171,332 18,450,617
30 September 2016 PowerShares 0 PowerShares PowerShares PowerShares FTSE Emerging PowerShares0 FTSE RAFI FTSE RAFI PowerShares EURO STOXX Markets FTSE UK High0 All- World Emerging FTSE RAFI High Dividend High Dividend Dividend Low0 3000 Markets Europe Low Volatility Low Volatility Volatility0 UCITS ETF UCITS ETF UCITS ETF UCITS ETF* UCITS ETF** UCITS ETF**0 USD USD EUR EUR USD GBPEquities 25,771,081 12,337,859 7,355,415 11,134,327 5,538,575 5,185,388Total 25,771,081 12,337,859 7,355,415 11,134,327 5,538,575 5,185,388
30 September 2016 0 PowerShares PowerShares0 PowerShares EuroMTS US High0 FTSE RAFI Cash 3 Yield Fallen0 UK 100 Months Angels0 UCITS ETF UCITS ETF UCITS ETF***0 GBP EUR USDEquities 7,539,587 – –Bonds – 23,025,604 25,509,146Total 7,539,587 23,025,604 25,509,146
* Fund launched on 6 January 2016. ** Fund launched on 27 May 2016. *** Fund launched on 1 September 2016.
30 September 2015 0 PowerShares 0 PowerShares PowerShares PowerShares S&P 500 PowerShares0 EQQQ FTSE RAFI Dynamic High Dividend S&P 5000 NASDAQ-100 US 1000 US Market Low Volatility VEQTOR0 Total UCITS ETF UCITS ETF UCITS ETF UCITS ETF UCITS ETF0 USD USD USD USD USD USDEquities 1,780,899,962 1,238,840,490 236,133,133 37,519,150 10,900,350 3,871,814Bonds 58,396,941 – – – – –Futures Contracts 20,968 – – – – 20,968Total 1,839,317,871 1,238,840,490 236,133,133 37,519,150 10,900,350 3,892,782
30 September 2015 0 PowerShares PowerShares0 PowerShares PowerShares PowerShares PowerShares Global FTSE RAFI0 Global Clean Global Listed Global Global Buyback Developed0 Energy Private Equity Water Agriculture Achievers 10000 UCITS ETF UCITS ETF UCITS ETF UCITS ETF UCITS ETF UCITS ETF0 EUR EUR EUR USD USD EUREquities 9,502,097 3,401,617 3,842,480 6,663,661 103,459,526 7,465,879Total 9,502,097 3,401,617 3,842,480 6,663,661 103,459,526 7,465,879
Notes to the Financial Statements (continued)
PowerShares Global Funds Ireland plc 173
5. Financial Assets and Liabilities at Fair Value Through Profit or Loss (continued)
30 September 2015 0 PowerShares PowerShares PowerShares PowerShares 0 FTSE RAFI FTSE RAFI FTSE RAFI FTSE RAFI PowerShares PowerShares0 Europe All-World Emerging Asia Pacific FTSE RAFI FTSE RAFI0 Mid- Small 3000 Markets Ex-Japan Europe UK 1000 UCITS ETF UCITS ETF UCITS ETF UCITS ETF UCITS ETF UCITS ETF0 EUR USD USD USD EUR GBPEquities 19,020,719 20,625,229 6,589,108 5,195,961 7,628,547 30,032,752Total 19,020,719 20,625,229 6,589,108 5,195,961 7,628,547 30,032,752
30 September 2015 0 PowerShares PowerShares0 PowerShares PowerShares FTSE RAFI EuroMTS0 FTSE RAFI FTSE RAFI Hong Kong Cash 30 Italy 30 Switzerland China Months0 UCITS ETF UCITS ETF UCITS ETF UCITS ETF0 EUR CHF USD EUREquities 2,154,190 2,481,207 3,891,600 –Bonds – – – 52,315,332Total 2,154,190 2,481,207 3,891,600 52,315,332
6. Accrued Income and Other Receivables
30 September 2016 0 PowerShares 0 PowerShares PowerShares PowerShares S&P 500 PowerShares0 EQQQ FTSE RAFI Dynamic High Dividend S&P 5000 NASDAQ-100 US 1000 US Market Low Volatility VEQTOR0 Total UCITS ETF UCITS ETF UCITS ETF UCITS ETF UCITS ETF0 USD USD USD USD USD USDDividend income receivable 1,928,032 484,982 309,894 9,745 771,224 3,036Interest income receivable 288,654 – – – – –Stock lending income receivable 62,487 62,487 – – – –Total 2,279,173 547,469 309,894 9,745 771,224 3,036
30 September 2016 0 PowerShares PowerShares0 PowerShares PowerShares PowerShares PowerShares Global FTSE RAFI0 Global Clean Global Listed Global Global Buyback Europe0 Energy Private Equity Water Agriculture Achievers Mid-Small0 UCITS ETF UCITS ETF UCITS ETF UCITS ETF UCITS ETF UCITS ETF0 EUR EUR EUR USD USD EURDividend income receivable 10,785 4,413 3,369 6,017 171,014 19,519Total 10,785 4,413 3,369 6,017 171,014 19,519
30 September 2016 PowerShares 0 PowerShares PowerShares PowerShares FTSE Emerging PowerShares0 FTSE RAFI FTSE RAFI PowerShares EURO STOXX Markets FTSE UK High0 All- World Emerging FTSE RAFI High Dividend High Dividend Dividend Low0 3000 Markets Europe Low Volatility Low Volatility Volatility0 UCITS ETF UCITS ETF UCITS ETF UCITS ETF* UCITS ETF** UCITS ETF**0 USD USD EUR EUR USD GBPDividend income receivable 49,712 23,084 5,384 3,073 9,025 20,123Total 49,712 23,084 5,384 3,073 9,025 20,123
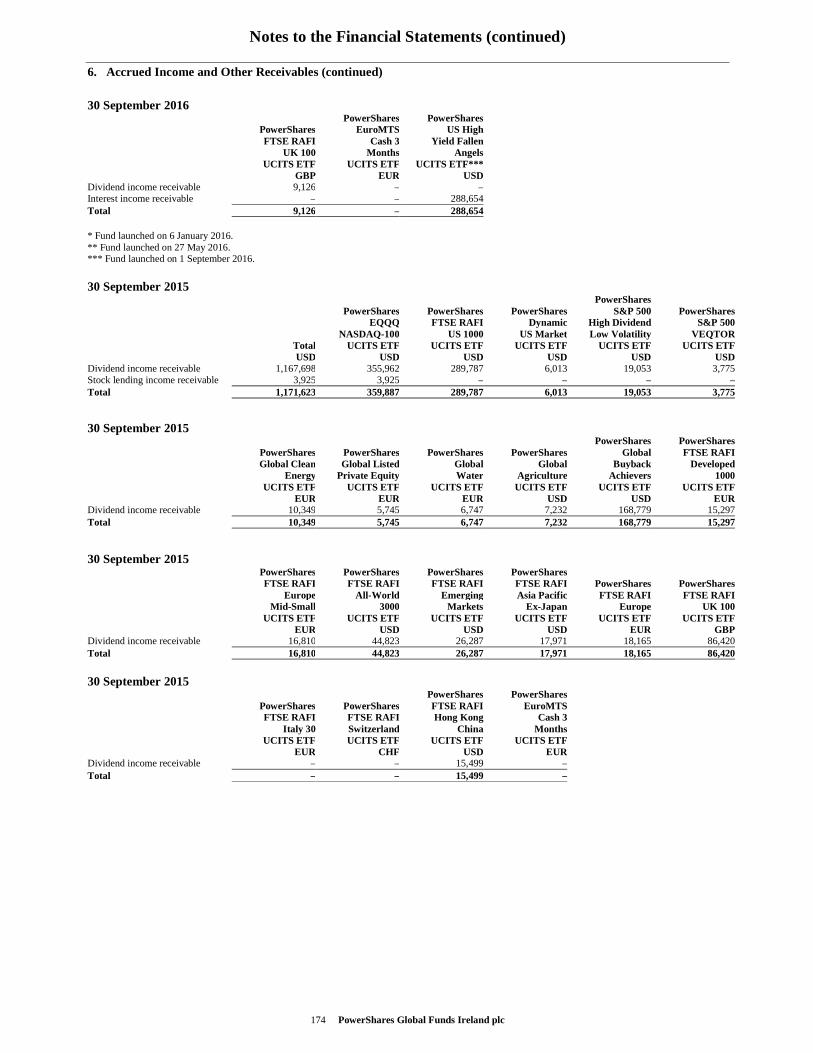
Notes to the Financial Statements (continued)
174 PowerShares Global Funds Ireland plc
6. Accrued Income and Other Receivables (continued)
30 September 2016 0 PowerShares PowerShares0 PowerShares EuroMTS US High0 FTSE RAFI Cash 3 Yield Fallen0 UK 100 Months Angels0 UCITS ETF UCITS ETF UCITS ETF***0 GBP EUR USDDividend income receivable 9,126 – –Interest income receivable – – 288,654Total 9,126 – 288,654
* Fund launched on 6 January 2016. ** Fund launched on 27 May 2016. *** Fund launched on 1 September 2016. daund
30 September 2015 0 PowerShares 0 PowerShares PowerShares PowerShares S&P 500 PowerShares0 EQQQ FTSE RAFI Dynamic High Dividend S&P 5000 NASDAQ-100 US 1000 US Market Low Volatility VEQTOR0 Total UCITS ETF UCITS ETF UCITS ETF UCITS ETF UCITS ETF0 USD USD USD USD USD USDDividend income receivable 1,167,698 355,962 289,787 6,013 19,053 3,775Stock lending income receivable 3,925 3,925 – – – –Total 1,171,623 359,887 289,787 6,013 19,053 3,775
30 September 2015 0 PowerShares PowerShares0 PowerShares PowerShares PowerShares PowerShares Global FTSE RAFI0 Global Clean Global Listed Global Global Buyback Developed0 Energy Private Equity Water Agriculture Achievers 10000 UCITS ETF UCITS ETF UCITS ETF UCITS ETF UCITS ETF UCITS ETF0 EUR EUR EUR USD USD EURDividend income receivable 10,349 5,745 6,747 7,232 168,779 15,297Total 10,349 5,745 6,747 7,232 168,779 15,297
30 September 2015 0 PowerShares PowerShares PowerShares PowerShares 0 FTSE RAFI FTSE RAFI FTSE RAFI FTSE RAFI PowerShares PowerShares0 Europe All -World Emerging Asia Pacific FTSE RAFI FTSE RAFI0 Mid- Small 3000 Markets Ex-Japan Europe UK 1000 UCITS ETF UCITS ETF UCITS ETF UCITS ETF UCITS ETF UCITS ETF0 EUR USD USD USD EUR GBPDividend income receivable 16,810 44,823 26,287 17,971 18,165 86,420Total 16,810 44,823 26,287 17,971 18,165 86,420
30 September 2015 0 PowerShares PowerShares0 PowerShares PowerShares FTSE RAFI EuroMTS0 FTSE RAFI FTSE RAFI Hong Kong Cash 30 Italy 30 Switzerland China Months0 UCITS ETF UCITS ETF UCITS ETF UCITS ETF0 EUR CHF USD EURDividend income receivable – – 15,499 –Total – – 15,499 –
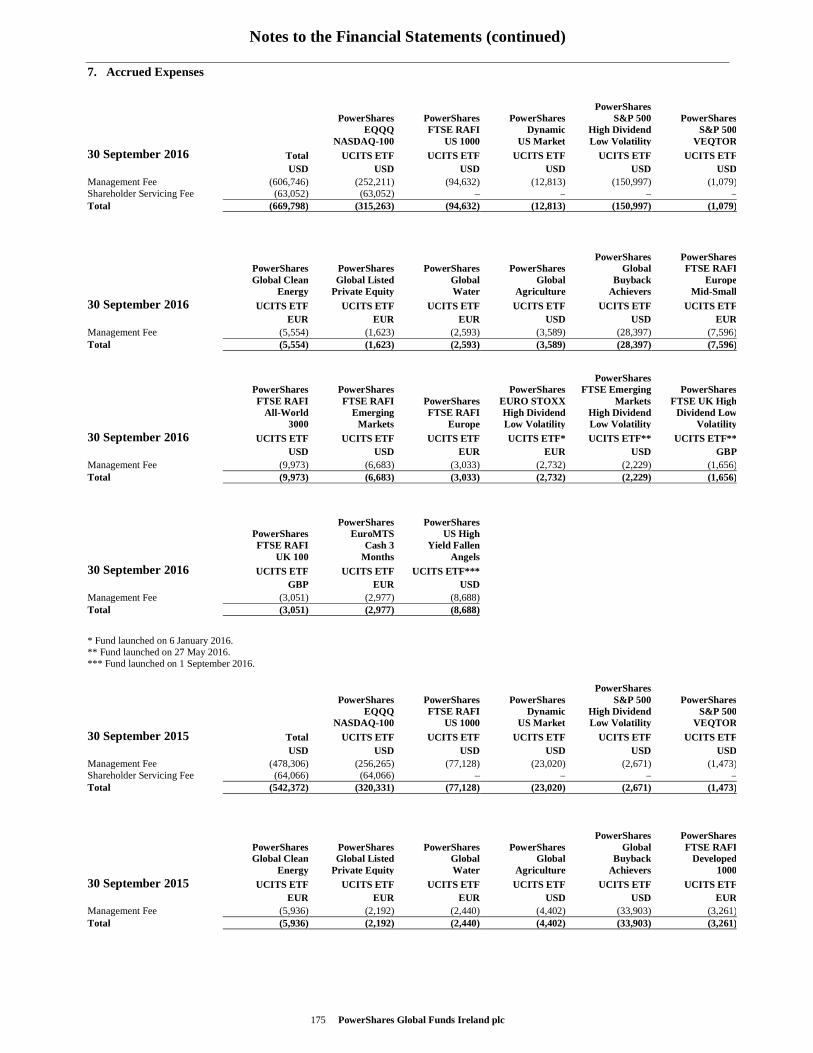
Notes to the Financial Statements (continued)
175 PowerShares Global Funds Ireland plc
7. Accrued Expenses
0 0 PowerShares 0 PowerShares PowerShares PowerShares S&P 500 PowerShares0 EQQQ FTSE RAFI Dynamic High Dividend S&P 5000 NASDAQ-100 US 1000 US Market Low Volatility VEQTOR30 September 2016 Total UCITS ETF UCITS ETF UCITS ETF UCITS ETF UCITS ETF0 USD USD USD USD USD USDManagement Fee (606,746) (252,211) (94,632) (12,813) (150,997) (1,079)Shareholder Servicing Fee (63,052) (63,052) – – – –Total (669,798) (315,263) (94,632) (12,813) (150,997) (1,079)
0 0 PowerShares PowerShares0 PowerShares PowerShares PowerShares PowerShares Global FTSE RAFI0 Global Clean Global Listed Global Global Buyback Europe0 Energy Private Equity Water Agriculture Achievers Mid- Small30 September 2016 UCITS ETF UCITS ETF UCITS ETF UCITS ETF UCITS ETF UCITS ETF0 EUR EUR EUR USD USD EURManagement Fee (5,554) (1,623) (2,593) (3,589) (28,397) (7,596)Total (5,554) (1,623) (2,593) (3,589) (28,397) (7,596)
0 PowerShares 0 PowerShares PowerShares PowerShares FTSE Emerging PowerShares0 FTSE RAFI FTSE RAFI PowerShares EURO STOXX Markets FTSE UK High0 All-World Emerging FTSE RAFI High Dividend High Dividend Dividend Low0 3000 Markets Europe Low Volatility Low Volatility Volatility30 September 2016 UCITS ETF UCITS ETF UCITS ETF UCITS ETF* UCITS ETF** UCITS ETF**0 USD USD EUR EUR USD GBPManagement Fee (9,973) (6,683) (3,033) (2,732) (2,229) (1,656)Total (9,973) (6,683) (3,033) (2,732) (2,229) (1,656)
0 0 PowerShares PowerShares0 PowerShares EuroMTS US High0 FTSE RAFI Cash 3 Yield Fallen0 UK 100 Months Angels30 September 2016 UCITS ETF UCITS ETF UCITS ETF***0 GBP EUR USDManagement Fee (3,051) (2,977) (8,688)Total (3,051) (2,977) (8,688)
* Fund launched on 6 January 2016. ** Fund launched on 27 May 2016. *** Fund launched on 1 September 2016.
0 0 PowerShares 0 PowerShares PowerShares PowerShares S&P 500 PowerShares0 EQQQ FTSE RAFI Dynamic High Dividend S&P 5000 NASDAQ-100 US 1000 US Market Low Volatility VEQTOR30 September 2015 Total UCITS ETF UCITS ETF UCITS ETF UCITS ETF UCITS ETF0 USD USD USD USD USD USDManagement Fee (478,306) (256,265) (77,128) (23,020) (2,671) (1,473)Shareholder Servicing Fee (64,066) (64,066) – – – –Total (542,372) (320,331) (77,128) (23,020) (2,671) (1,473)
0 0 PowerShares PowerShares0 PowerShares PowerShares PowerShares PowerShares Global FTSE RAFI0 Global Clean Global Listed Global Global Buyback Developed0 Energy Private Equity Water Agriculture Achievers 100030 September 2015 UCITS ETF UCITS ETF UCITS ETF UCITS ETF UCITS ETF UCITS ETF0 EUR EUR EUR USD USD EURManagement Fee (5,936) (2,192) (2,440) (4,402) (33,903) (3,261)Total (5,936) (2,192) (2,440) (4,402) (33,903) (3,261)
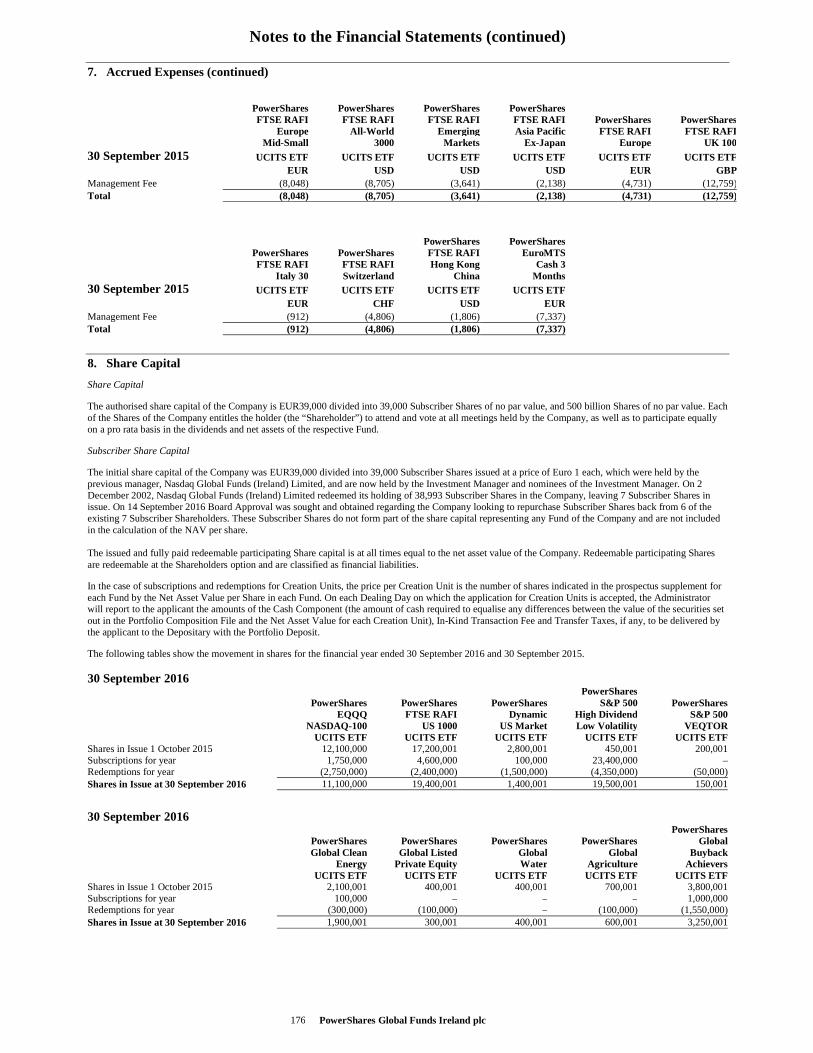
Notes to the Financial Statements (continued)
PowerShares Global Funds Ireland plc 176
7. Accrued Expenses (continued)
0 0 PowerShares PowerShares PowerShares PowerShares 0 FTSE RAFI FTSE RAFI FTSE RAFI FTSE RAFI PowerShares PowerShares0 Europe All-World Emerging Asia Pacific FTSE RAFI FTSE RAFI0 Mid-Small 3000 Markets Ex-Japan Europe UK 10030 September 2015 UCITS ETF UCITS ETF UCITS ETF UCITS ETF UCITS ETF UCITS ETF0 EUR USD USD USD EUR GBPManagement Fee (8,048) (8,705) (3,641) (2,138) (4,731) (12,759)Total (8,048) (8,705) (3,641) (2,138) (4,731) (12,759)
0 0 PowerShares PowerShares0 PowerShares PowerShares FTSE RAFI EuroMTS0 FTSE RAFI FTSE RAFI Hong Kong Cash 30 Italy 30 Switzerland China Months30 September 2015 UCITS ETF UCITS ETF UCITS ETF UCITS ETF0 EUR CHF USD EURManagement Fee (912) (4,806) (1,806) (7,337)Total (912) (4,806) (1,806) (7,337)
8. Share Capital
Share Capital
The authorised share capital of the Company is EUR39,000 divided into 39,000 Subscriber Shares of no par value, and 500 billion Shares of no par value. Each of the Shares of the Company entitles the holder (the “Shareholder”) to attend and vote at all meetings held by the Company, as well as to participate equally on a pro rata basis in the dividends and net assets of the respective Fund.
Subscriber Share Capital
The initial share capital of the Company was EUR39,000 divided into 39,000 Subscriber Shares issued at a price of Euro 1 each, which were held by the previous manager, Nasdaq Global Funds (Ireland) Limited, and are now held by the Investment Manager and nominees of the Investment Manager. On 2 December 2002, Nasdaq Global Funds (Ireland) Limited redeemed its holding of 38,993 Subscriber Shares in the Company, leaving 7 Subscriber Shares in issue. On 14 September 2016 Board Approval was sought and obtained regarding the Company looking to repurchase Subscriber Shares back from 6 of the existing 7 Subscriber Shareholders. These Subscriber Shares do not form part of the share capital representing any Fund of the Company and are not included in the calculation of the NAV per share. The issued and fully paid redeemable participating Share capital is at all times equal to the net asset value of the Company. Redeemable participating Shares are redeemable at the Shareholders option and are classified as financial liabilities.
In the case of subscriptions and redemptions for Creation Units, the price per Creation Unit is the number of shares indicated in the prospectus supplement for each Fund by the Net Asset Value per Share in each Fund. On each Dealing Day on which the application for Creation Units is accepted, the Administrator will report to the applicant the amounts of the Cash Component (the amount of cash required to equalise any differences between the value of the securities set out in the Portfolio Composition File and the Net Asset Value for each Creation Unit), In-Kind Transaction Fee and Transfer Taxes, if any, to be delivered by the applicant to the Depositary with the Portfolio Deposit.
The following tables show the movement in shares for the financial year ended 30 September 2016 and 30 September 2015.
30 September 2016 0 PowerShares 0 PowerShares PowerShares PowerShares S&P 500 PowerShares0 EQQQ FTSE RAFI Dynamic High Dividend S&P 5000 NASDAQ-100 US 1000 US Market Low Volatility VEQTOR0 UCITS ETF UCITS ETF UCITS ETF UCITS ETF UCITS ETFShares in Issue 1 October 2015 12,100,000 17,200,001 2,800,001 450,001 200,001Subscriptions for year 1,750,000 4,600,000 100,000 23,400,000 –Redemptions for year (2,750,000) (2,400,000) (1,500,000) (4,350,000) (50,000)Shares in Issue at 30 September 2016 11,100,000 19,400,001 1,400,001 19,500,001 150,001
30 September 2016 0 PowerShares0 PowerShares PowerShares PowerShares PowerShares Global0 Global Clean Global Listed Global Global Buyback0 Energy Private Equity Water Agriculture Achievers0 UCITS ETF UCITS ETF UCITS ETF UCITS ETF UCITS ETFShares in Issue 1 October 2015 2,100,001 400,001 400,001 700,001 3,800,001Subscriptions for year 100,000 – – – 1,000,000Redemptions for year (300,000) (100,000) – (100,000) (1,550,000)Shares in Issue at 30 September 2016 1,900,001 300,001 400,001 600,001 3,250,001
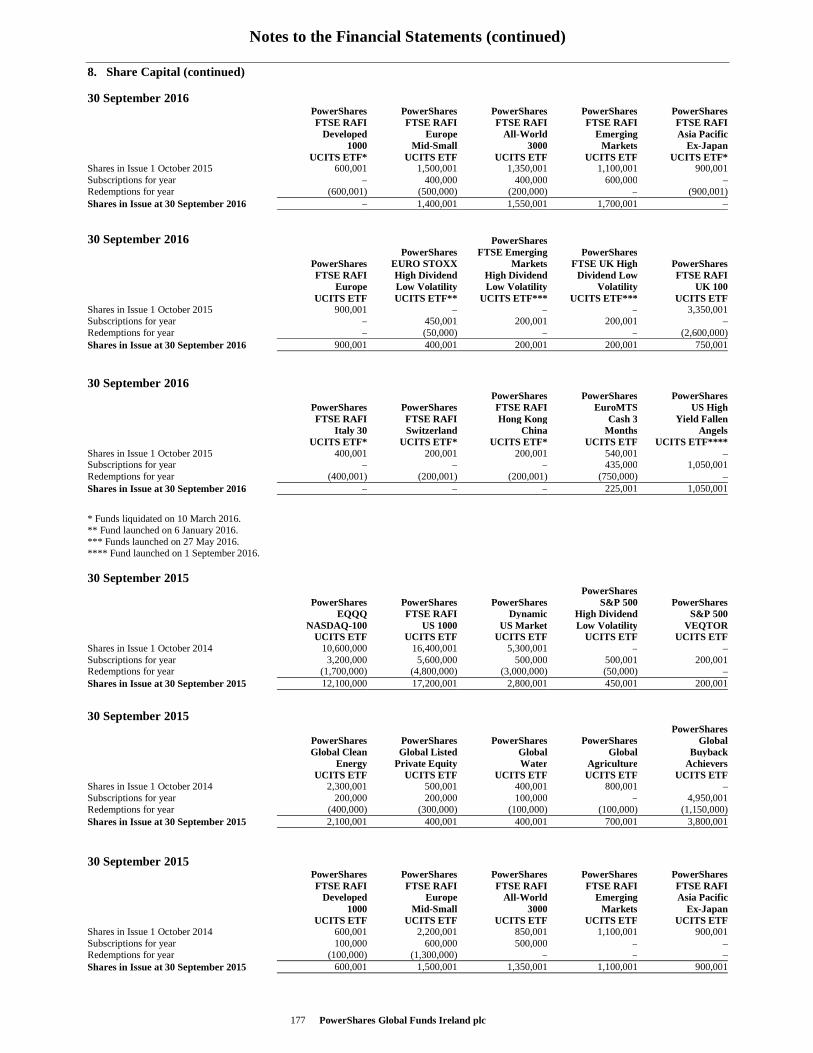
Notes to the Financial Statements (continued)
PowerShares Global Funds Ireland plc 177
8. Share Capital (continued)
30 September 2016 0 PowerShares PowerShares PowerShares PowerShares PowerShares0 FTSE RAFI FTSE RAFI FTSE RAFI FTSE RAFI FTSE RAFI0 Developed Europe All-World Emerging Asia Pacific0 1000 Mid-Small 3000 Markets Ex-Japan0 UCITS ETF* UCITS ETF UCITS ETF UCITS ETF UCITS ETF*Shares in Issue 1 October 2015 600,001 1,500,001 1,350,001 1,100,001 900,001Subscriptions for year – 400,000 400,000 600,000 –Redemptions for year (600,001) (500,000) (200,000) – (900,001)Shares in Issue at 30 September 2016 – 1,400,001 1,550,001 1,700,001 –
30 September 2016 PowerShares 0 PowerShares FTSE Emerging PowerShares 0 PowerShares EURO STOXX Markets FTSE UK High PowerShares0 FTSE RAFI High Dividend High Dividend Dividend Low FTSE RAFI0 Europe Low Volatility Low Volatility Volatility UK 1000 UCITS ETF UCITS ETF** UCITS ETF*** UCITS ETF*** UCITS ETFShares in Issue 1 October 2015 900,001 – – – 3,350,001Subscriptions for year – 450,001 200,001 200,001 –Redemptions for year – (50,000) – – (2,600,000)Shares in Issue at 30 September 2016 900,001 400,001 200,001 200,001 750,001
30 September 2016 0 PowerShares PowerShares PowerShares0 PowerShares PowerShares FTSE RAFI EuroMTS US High0 FTSE RAFI FTSE RAFI Hong Kong Cash 3 Yield Fallen0 Italy 30 Switzerland China Months Angels0 UCITS ETF* UCITS ETF* UCITS ETF* UCITS ETF UCITS ETF****Shares in Issue 1 October 2015 400,001 200,001 200,001 540,001 –Subscriptions for year – – – 435,000 1,050,001Redemptions for year (400,001) (200,001) (200,001) (750,000) –Shares in Issue at 30 September 2016 – – – 225,001 1,050,001
* Funds liquidated on 10 March 2016. ** Fund launched on 6 January 2016. *** Funds launched on 27 May 2016. **** Fund launched on 1 September 2016.
30 September 2015 0 PowerShares 0 PowerShares PowerShares PowerShares S&P 500 PowerShares0 EQQQ FTSE RAFI Dynamic High Dividend S&P 5000 NASDAQ-100 US 1000 US Market Low Volatility VEQTOR0 UCITS ETF UCITS ETF UCITS ETF UCITS ETF UCITS ETFShares in Issue 1 October 2014 10,600,000 16,400,001 5,300,001 – –Subscriptions for year 3,200,000 5,600,000 500,000 500,001 200,001Redemptions for year (1,700,000) (4,800,000) (3,000,000) (50,000) –Shares in Issue at 30 September 2015 12,100,000 17,200,001 2,800,001 450,001 200,001
30 September 2015 0 PowerShares0 PowerShares PowerShares PowerShares PowerShares Global0 Global Clean Global Listed Global Global Buyback0 Energy Private Equity Water Agriculture Achievers0 UCITS ETF UCITS ETF UCITS ETF UCITS ETF UCITS ETFShares in Issue 1 October 2014 2,300,001 500,001 400,001 800,001 –Subscriptions for year 200,000 200,000 100,000 – 4,950,001Redemptions for year (400,000) (300,000) (100,000) (100,000) (1,150,000)Shares in Issue at 30 September 2015 2,100,001 400,001 400,001 700,001 3,800,001
30 September 2015 0 PowerShares PowerShares PowerShares PowerShares PowerShares0 FTSE RAFI FTSE RAFI FTSE RAFI FTSE RAFI FTSE RAFI0 Developed Europe All-World Emerging Asia Pacific0 1000 Mid-Small 3000 Markets Ex-Japan0 UCITS ETF UCITS ETF UCITS ETF UCITS ETF UCITS ETFShares in Issue 1 October 2014 600,001 2,200,001 850,001 1,100,001 900,001Subscriptions for year 100,000 600,000 500,000 – –Redemptions for year (100,000) (1,300,000) – – –Shares in Issue at 30 September 2015 600,001 1,500,001 1,350,001 1,100,001 900,001
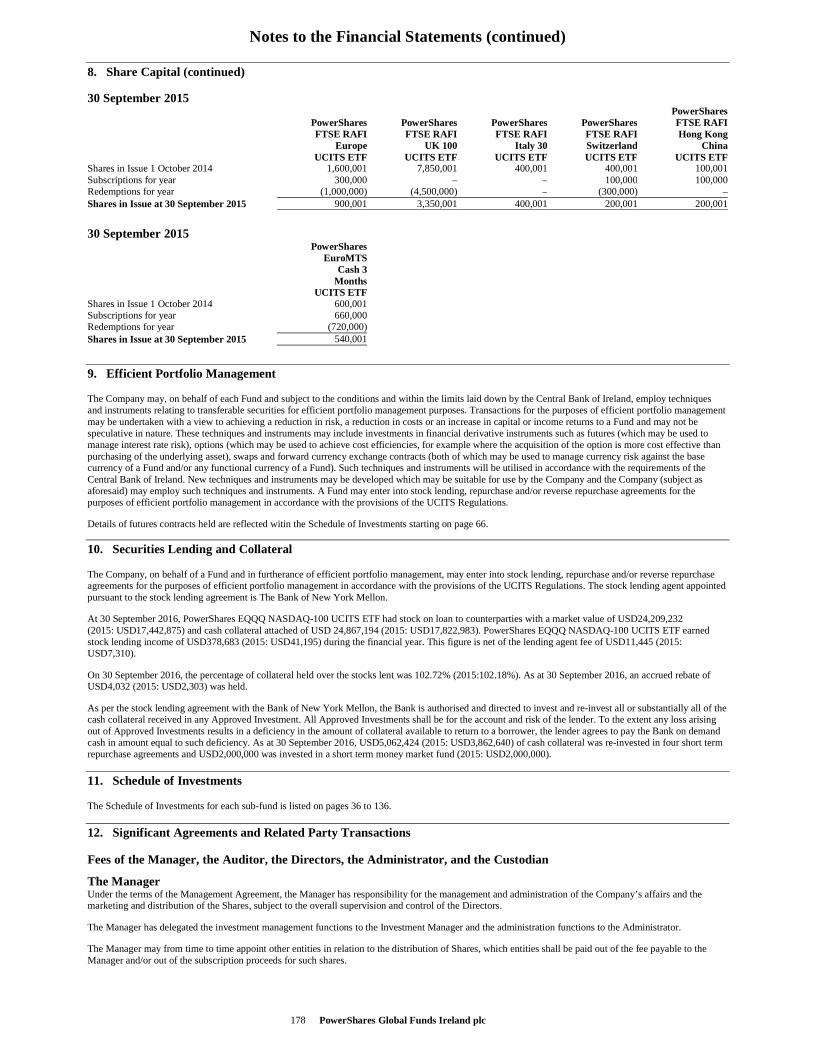
Notes to the Financial Statements (continued)
PowerShares Global Funds Ireland plc 178
8. Share Capital (continued)
30 September 2015 0 PowerShares0 PowerShares PowerShares PowerShares PowerShares FTSE RAFI0 FTSE RAFI FTSE RAFI FTSE RAFI FTSE RAFI Hong Kong0 Europe UK 100 Italy 30 Switzerland China0 UCITS ETF UCITS ETF UCITS ETF UCITS ETF UCITS ETFShares in Issue 1 October 2014 1,600,001 7,850,001 400,001 400,001 100,001Subscriptions for year 300,000 – – 100,000 100,000Redemptions for year (1,000,000) (4,500,000) – (300,000) –Shares in Issue at 30 September 2015 900,001 3,350,001 400,001 200,001 200,001
30 September 2015 0 PowerShares0 EuroMTS0 Cash 30 Months0 UCITS ETFShares in Issue 1 October 2014 600,001Subscriptions for year 660,000Redemptions for year (720,000)Shares in Issue at 30 September 2015 540,001
9. Efficient Portfolio Management
The Company may, on behalf of each Fund and subject to the conditions and within the limits laid down by the Central Bank of Ireland, employ techniques and instruments relating to transferable securities for efficient portfolio management purposes. Transactions for the purposes of efficient portfolio management may be undertaken with a view to achieving a reduction in risk, a reduction in costs or an increase in capital or income returns to a Fund and may not be speculative in nature. These techniques and instruments may include investments in financial derivative instruments such as futures (which may be used to manage interest rate risk), options (which may be used to achieve cost efficiencies, for example where the acquisition of the option is more cost effective than purchasing of the underlying asset), swaps and forward currency exchange contracts (both of which may be used to manage currency risk against the base currency of a Fund and/or any functional currency of a Fund). Such techniques and instruments will be utilised in accordance with the requirements of the Central Bank of Ireland. New techniques and instruments may be developed which may be suitable for use by the Company and the Company (subject as aforesaid) may employ such techniques and instruments. A Fund may enter into stock lending, repurchase and/or reverse repurchase agreements for the purposes of efficient portfolio management in accordance with the provisions of the UCITS Regulations.
Details of futures contracts held are reflected witin the Schedule of Investments starting on page 66.
10. Securities Lending and Collateral
The Company, on behalf of a Fund and in furtherance of efficient portfolio management, may enter into stock lending, repurchase and/or reverse repurchase agreements for the purposes of efficient portfolio management in accordance with the provisions of the UCITS Regulations. The stock lending agent appointed pursuant to the stock lending agreement is The Bank of New York Mellon.
At 30 September 2016, PowerShares EQQQ NASDAQ-100 UCITS ETF had stock on loan to counterparties with a market value of USD24,209,232 (2015: USD17,442,875) and cash collateral attached of USD 24,867,194 (2015: USD17,822,983). PowerShares EQQQ NASDAQ-100 UCITS ETF earned stock lending income of USD378,683 (2015: USD41,195) during the financial year. This figure is net of the lending agent fee of USD11,445 (2015: USD7,310).
On 30 September 2016, the percentage of collateral held over the stocks lent was 102.72% (2015:102.18%). As at 30 September 2016, an accrued rebate of USD4,032 (2015: USD2,303) was held.
As per the stock lending agreement with the Bank of New York Mellon, the Bank is authorised and directed to invest and re-invest all or substantially all of the cash collateral received in any Approved Investment. All Approved Investments shall be for the account and risk of the lender. To the extent any loss arising out of Approved Investments results in a deficiency in the amount of collateral available to return to a borrower, the lender agrees to pay the Bank on demand cash in amount equal to such deficiency. As at 30 September 2016, USD5,062,424 (2015: USD3,862,640) of cash collateral was re-invested in four short term repurchase agreements and USD2,000,000 was invested in a short term money market fund (2015: USD2,000,000).
11. Schedule of Investments
The Schedule of Investments for each sub-fund is listed on pages 36 to 136.
12. Significant Agreements and Related Party Transactions
Fees of the Manager, the Auditor, the Directors, the Administrator, and the Custodian
The Manager Under the terms of the Management Agreement, the Manager has responsibility for the management and administration of the Company’s affairs and the marketing and distribution of the Shares, subject to the overall supervision and control of the Directors.
The Manager has delegated the investment management functions to the Investment Manager and the administration functions to the Administrator.
The Manager may from time to time appoint other entities in relation to the distribution of Shares, which entities shall be paid out of the fee payable to the Manager and/or out of the subscription proceeds for such shares.
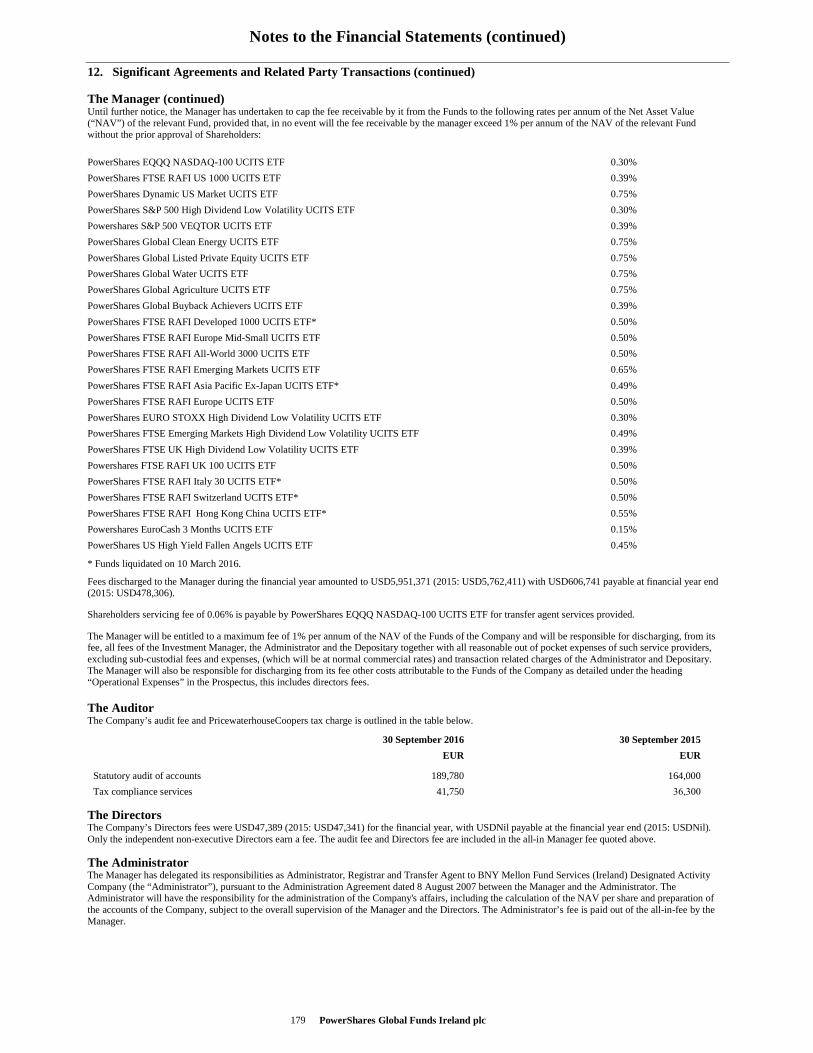
Notes to the Financial Statements (continued)
PowerShares Global Funds Ireland plc 179
12. Significant Agreements and Related Party Transactions (continued)
The Manager (continued) Until further notice, the Manager has undertaken to cap the fee receivable by it from the Funds to the following rates per annum of the Net Asset Value (“NAV”) of the relevant Fund, provided that, in no event will the fee receivable by the manager exceed 1% per annum of the NAV of the relevant Fund without the prior approval of Shareholders:
PowerShares EQQQ NASDAQ-100 UCITS ETF 0.30%
PowerShares FTSE RAFI US 1000 UCITS ETF 0.39%
PowerShares Dynamic US Market UCITS ETF 0.75%
PowerShares S&P 500 High Dividend Low Volatility UCITS ETF 0.30%
Powershares S&P 500 VEQTOR UCITS ETF 0.39%
PowerShares Global Clean Energy UCITS ETF 0.75%
PowerShares Global Listed Private Equity UCITS ETF 0.75%
PowerShares Global Water UCITS ETF 0.75%
PowerShares Global Agriculture UCITS ETF 0.75%
PowerShares Global Buyback Achievers UCITS ETF 0.39%
PowerShares FTSE RAFI Developed 1000 UCITS ETF* 0.50%
PowerShares FTSE RAFI Europe Mid-Small UCITS ETF 0.50%
PowerShares FTSE RAFI All-World 3000 UCITS ETF 0.50%
PowerShares FTSE RAFI Emerging Markets UCITS ETF 0.65%
PowerShares FTSE RAFI Asia Pacific Ex-Japan UCITS ETF* 0.49%
PowerShares FTSE RAFI Europe UCITS ETF 0.50%
PowerShares EURO STOXX High Dividend Low Volatility UCITS ETF 0.30%
PowerShares FTSE Emerging Markets High Dividend Low Volatility UCITS ETF 0.49%
PowerShares FTSE UK High Dividend Low Volatility UCITS ETF 0.39%
Powershares FTSE RAFI UK 100 UCITS ETF 0.50%
PowerShares FTSE RAFI Italy 30 UCITS ETF* 0.50%
PowerShares FTSE RAFI Switzerland UCITS ETF* 0.50%
PowerShares FTSE RAFI Hong Kong China UCITS ETF* 0.55%
Powershares EuroCash 3 Months UCITS ETF 0.15%
PowerShares US High Yield Fallen Angels UCITS ETF 0.45%
* Funds liquidated on 10 March 2016.
Fees discharged to the Manager during the financial year amounted to USD5,951,371 (2015: USD5,762,411) with USD606,741 payable at financial year end (2015: USD478,306).
Shareholders servicing fee of 0.06% is payable by PowerShares EQQQ NASDAQ-100 UCITS ETF for transfer agent services provided.
The Manager will be entitled to a maximum fee of 1% per annum of the NAV of the Funds of the Company and will be responsible for discharging, from its fee, all fees of the Investment Manager, the Administrator and the Depositary together with all reasonable out of pocket expenses of such service providers, excluding sub-custodial fees and expenses, (which will be at normal commercial rates) and transaction related charges of the Administrator and Depositary. The Manager will also be responsible for discharging from its fee other costs attributable to the Funds of the Company as detailed under the heading “Operational Expenses” in the Prospectus, this includes directors fees.
The Auditor The Company’s audit fee and PricewaterhouseCoopers tax charge is outlined in the table below.
30 September 2016 30 September 2015
EUR EUR
Statutory audit of accounts 189,780 164,000
Tax compliance services 41,750 36,300
The Directors The Company’s Directors fees were USD47,389 (2015: USD47,341) for the financial year, with USDNil payable at the financial year end (2015: USDNil). Only the independent non-executive Directors earn a fee. The audit fee and Directors fee are included in the all-in Manager fee quoted above.
The Administrator The Manager has delegated its responsibilities as Administrator, Registrar and Transfer Agent to BNY Mellon Fund Services (Ireland) Designated Activity Company (the “Administrator”), pursuant to the Administration Agreement dated 8 August 2007 between the Manager and the Administrator. The Administrator will have the responsibility for the administration of the Company's affairs, including the calculation of the NAV per share and preparation of the accounts of the Company, subject to the overall supervision of the Manager and the Directors. The Administrator’s fee is paid out of the all-in-fee by the Manager.
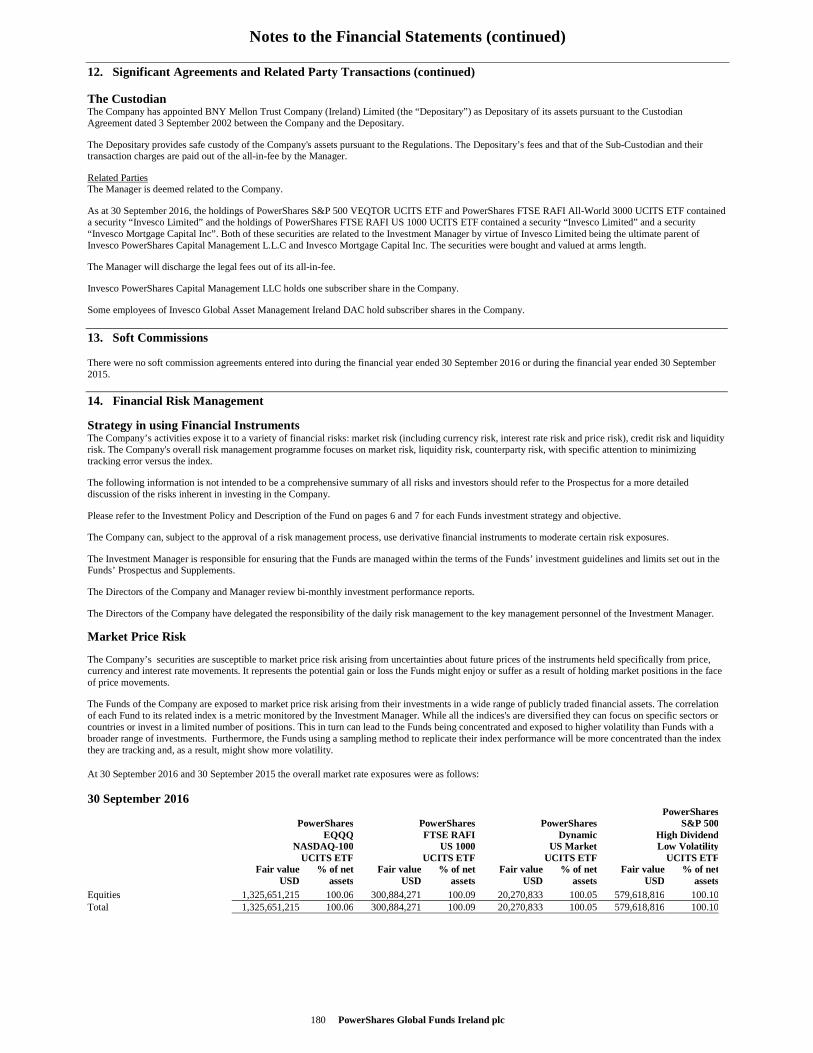
Notes to the Financial Statements (continued)
180 PowerShares Global Funds Ireland plc
12. Significant Agreements and Related Party Transactions (continued)
The Custodian The Company has appointed BNY Mellon Trust Company (Ireland) Limited (the “Depositary”) as Depositary of its assets pursuant to the Custodian Agreement dated 3 September 2002 between the Company and the Depositary.
The Depositary provides safe custody of the Company's assets pursuant to the Regulations. The Depositary’s fees and that of the Sub-Custodian and their transaction charges are paid out of the all-in-fee by the Manager.
Related Parties The Manager is deemed related to the Company.
As at 30 September 2016, the holdings of PowerShares S&P 500 VEQTOR UCITS ETF and PowerShares FTSE RAFI All-World 3000 UCITS ETF contained a security “Invesco Limited” and the holdings of PowerShares FTSE RAFI US 1000 UCITS ETF contained a security “Invesco Limited” and a security “Invesco Mortgage Capital Inc”. Both of these securities are related to the Investment Manager by virtue of Invesco Limited being the ultimate parent of Invesco PowerShares Capital Management L.L.C and Invesco Mortgage Capital Inc. The securities were bought and valued at arms length.
The Manager will discharge the legal fees out of its all-in-fee.
Invesco PowerShares Capital Management LLC holds one subscriber share in the Company.
Some employees of Invesco Global Asset Management Ireland DAC hold subscriber shares in the Company.
13. Soft Commissions
There were no soft commission agreements entered into during the financial year ended 30 September 2016 or during the financial year ended 30 September 2015.
14. Financial Risk Management
Strategy in using Financial Instruments The Company’s activities expose it to a variety of financial risks: market risk (including currency risk, interest rate risk and price risk), credit risk and liquidity risk. The Company's overall risk management programme focuses on market risk, liquidity risk, counterparty risk, with specific attention to minimizing tracking error versus the index.
The following information is not intended to be a comprehensive summary of all risks and investors should refer to the Prospectus for a more detailed discussion of the risks inherent in investing in the Company.
Please refer to the Investment Policy and Description of the Fund on pages 6 and 7 for each Funds investment strategy and objective.
The Company can, subject to the approval of a risk management process, use derivative financial instruments to moderate certain risk exposures.
The Investment Manager is responsible for ensuring that the Funds are managed within the terms of the Funds’ investment guidelines and limits set out in the Funds’ Prospectus and Supplements.
The Directors of the Company and Manager review bi-monthly investment performance reports.
The Directors of the Company have delegated the responsibility of the daily risk management to the key management personnel of the Investment Manager.
Market Price Risk
The Company’s securities are susceptible to market price risk arising from uncertainties about future prices of the instruments held specifically from price, currency and interest rate movements. It represents the potential gain or loss the Funds might enjoy or suffer as a result of holding market positions in the face of price movements.
The Funds of the Company are exposed to market price risk arising from their investments in a wide range of publicly traded financial assets. The correlation of each Fund to its related index is a metric monitored by the Investment Manager. While all the indices's are diversified they can focus on specific sectors or countries or invest in a limited number of positions. This in turn can lead to the Funds being concentrated and exposed to higher volatility than Funds with a broader range of investments. Furthermore, the Funds using a sampling method to replicate their index performance will be more concentrated than the index they are tracking and, as a result, might show more volatility.
At 30 September 2016 and 30 September 2015 the overall market rate exposures were as follows:
30 September 2016 0 PowerShares0 PowerShares PowerShares PowerShares S&P 5000 EQQQ FTSE RAFI Dynamic High Dividend0 NASDAQ-100 US 1000 US Market Low Volatility0 UCITS ETF UCITS ETF UCITS ETF UCITS ETF Fair value % of net Fair value % of net Fair value % of net Fair value % of net USD assets USD assets USD assets USD assetsEquities 1,325,651,215 100.06 300,884,271 100.09 20,270,833 100.05 579,618,816 100.10Total 1,325,651,215 100.06 300,884,271 100.09 20,270,833 100.05 579,618,816 100.10
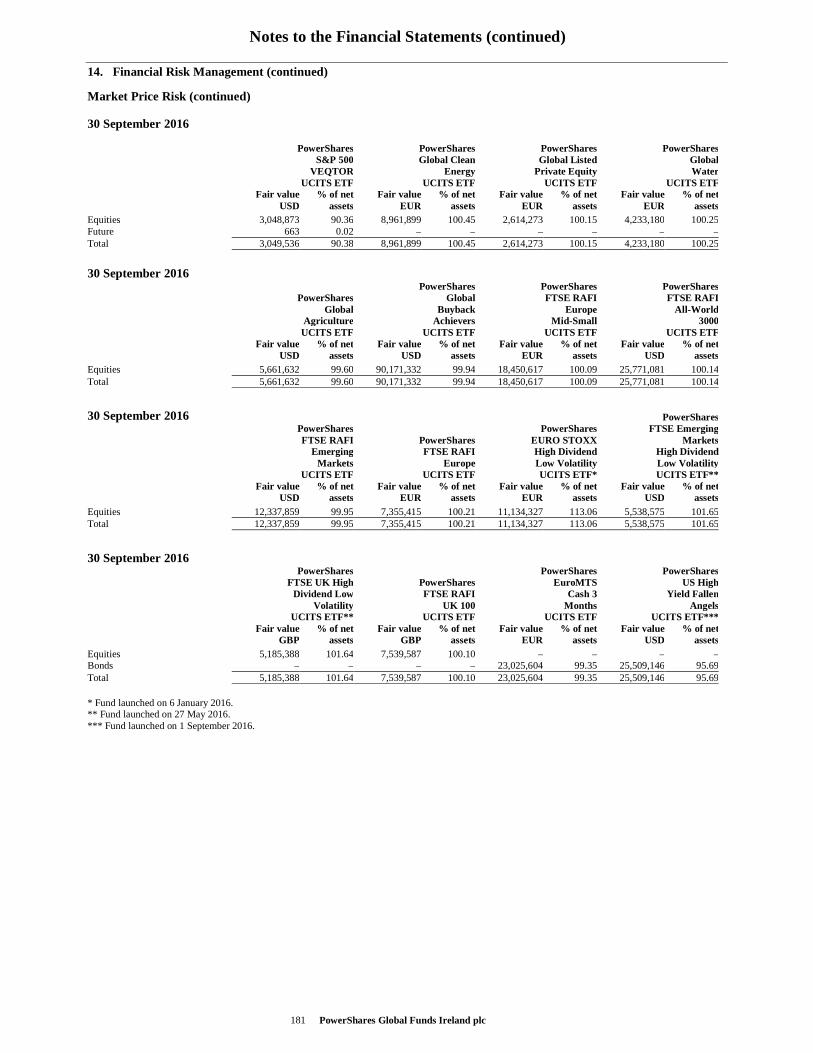
Notes to the Financial Statements (continued)
PowerShares Global Funds Ireland plc 181
14. Financial Risk Management (continued)
Market Price Risk (continued)
30 September 2016 0 0 PowerShares PowerShares PowerShares PowerShares0 S&P 500 Global Clean Global Listed Global0 VEQTOR Energy Private Equity Water0 UCITS ETF UCITS ETF UCITS ETF UCITS ETF Fair value % of net Fair value % of net Fair value % of net Fair value % of net USD assets EUR assets EUR assets EUR assetsEquities 3,048,873 90.36 8,961,899 100.45 2,614,273 100.15 4,233,180 100.25Future 663 0.02 – – – – – –Total 3,049,536 90.38 8,961,899 100.45 2,614,273 100.15 4,233,180 100.25
30 September 2016 0 PowerShares PowerShares PowerShares0 PowerShares Global FTSE RAFI FTSE RAFI0 Global Buyback Europe All -World0 Agriculture Achievers Mid-Small 30000 UCITS ETF UCITS ETF UCITS ETF UCITS ETF Fair value % of net Fair value % of net Fair value % of net Fair value % of net USD assets USD assets EUR assets USD assetsEquities 5,661,632 99.60 90,171,332 99.94 18,450,617 100.09 25,771,081 100.14Total 5,661,632 99.60 90,171,332 99.94 18,450,617 100.09 25,771,081 100.14
30 September 2016 PowerShares0 PowerShares PowerShares FTSE Emerging0 FTSE RAFI PowerShares EURO STOXX Markets0 Emerging FTSE RAFI High Dividend High Dividend0 Markets Europe Low Volatility Low Volatility 0 UCITS ETF UCITS ETF UCITS ETF* UCITS ETF** Fair value % of net Fair value % of net Fair value % of net Fair value % of net USD assets EUR assets EUR assets USD assetsEquities 12,337,859 99.95 7,355,415 100.21 11,134,327 113.06 5,538,575 101.65Total 12,337,859 99.95 7,355,415 100.21 11,134,327 113.06 5,538,575 101.65
30 September 2016 0 PowerShares PowerShares PowerShares0 FTSE UK High PowerShares EuroMTS US High0 Dividend Low FTSE RAFI Cash 3 Yield Fallen0 Volatility UK 100 Months Angels0 UCITS ETF** UCITS ETF UCITS ETF UCITS ETF*** Fair value % of net Fair value % of net Fair value % of net Fair value % of net GBP assets GBP assets EUR assets USD assetsEquities 5,185,388 101.64 7,539,587 100.10 – – – –Bonds – – – – 23,025,604 99.35 25,509,146 95.69Total 5,185,388 101.64 7,539,587 100.10 23,025,604 99.35 25,509,146 95.69
* Fund launched on 6 January 2016. ** Fund launched on 27 May 2016. *** Fund launched on 1 September 2016.
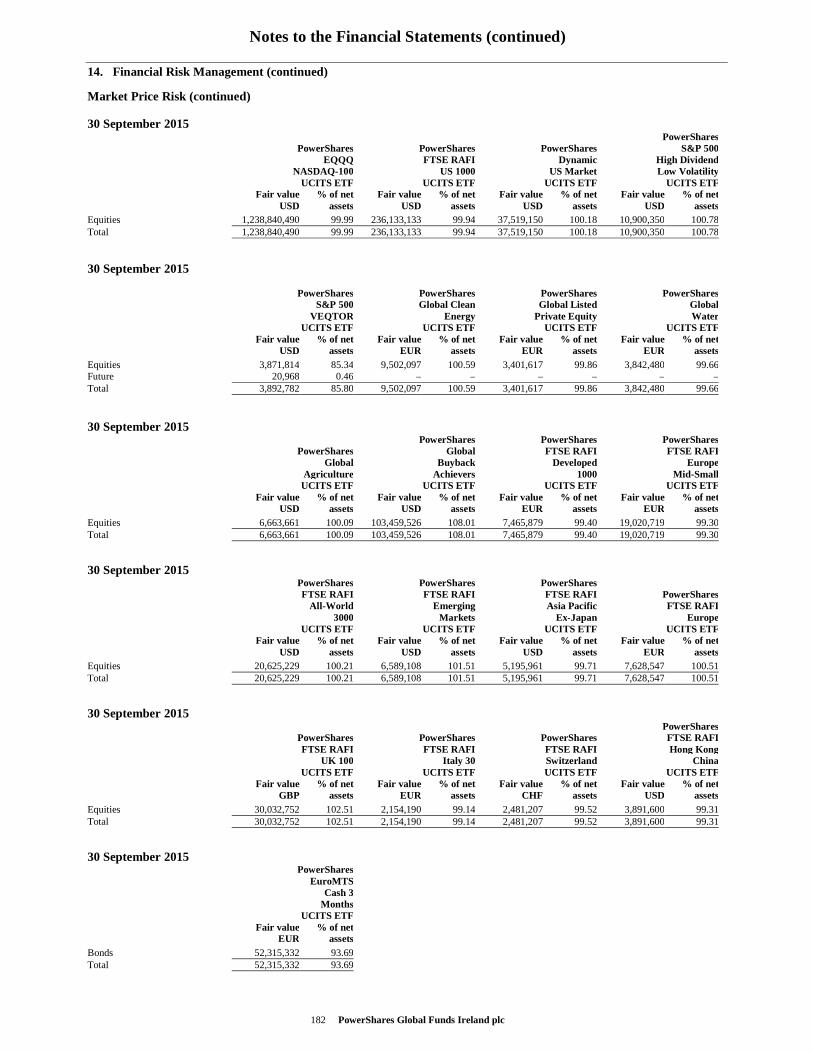
Notes to the Financial Statements (continued)
182 PowerShares Global Funds Ireland plc
14. Financial Risk Management (continued)
Market Price Risk (continued)
30 September 2015 0 PowerShares0 PowerShares PowerShares PowerShares S&P 5000 EQQQ FTSE RAFI Dynamic High Dividend0 NASDAQ-100 US 1000 US Market Low Volatility0 UCITS ETF UCITS ETF UCITS ETF UCITS ETF Fair value % of net Fair value % of net Fair value % of net Fair value % of net USD assets USD assets USD assets USD assetsEquities 1,238,840,490 99.99 236,133,133 99.94 37,519,150 100.18 10,900,350 100.78Total 1,238,840,490 99.99 236,133,133 99.94 37,519,150 100.18 10,900,350 100.78
30 September 2015 0 0 PowerShares PowerShares PowerShares PowerShares0 S&P 500 Global Clean Global Listed Global0 VEQTOR Energy Private Equity Water0 UCITS ETF UCITS ETF UCITS ETF UCITS ETF Fair value % of net Fair value % of net Fair value % of net Fair value % of net USD assets EUR assets EUR assets EUR assetsEquities 3,871,814 85.34 9,502,097 100.59 3,401,617 99.86 3,842,480 99.66Future 20,968 0.46 – – – – – –Total 3,892,782 85.80 9,502,097 100.59 3,401,617 99.86 3,842,480 99.66
30 September 2015 0 PowerShares PowerShares PowerShares0 PowerShares Global FTSE RAFI FTSE RAFI0 Global Buyback Developed Europe0 Agriculture Achievers 1000 Mid -Small0 UCITS ETF UCITS ETF UCITS ETF UCITS ETF Fair value % of net Fair value % of net Fair value % of net Fair value % of net USD assets USD assets EUR assets EUR assetsEquities 6,663,661 100.09 103,459,526 108.01 7,465,879 99.40 19,020,719 99.30Total 6,663,661 100.09 103,459,526 108.01 7,465,879 99.40 19,020,719 99.30
30 September 2015 0 PowerShares PowerShares PowerShares 0 FTSE RAFI FTSE RAFI FTSE RAFI PowerShares0 All- World Emerging Asia Pacific FTSE RAFI0 3000 Markets Ex-Japan Europe0 UCITS ETF UCITS ETF UCITS ETF UCITS ETF Fair value % of net Fair value % of net Fair value % of net Fair value % of net USD assets USD assets USD assets EUR assetsEquities 20,625,229 100.21 6,589,108 101.51 5,195,961 99.71 7,628,547 100.51Total 20,625,229 100.21 6,589,108 101.51 5,195,961 99.71 7,628,547 100.51
30 September 2015 0 PowerShares0 PowerShares PowerShares PowerShares FTSE RAFI0 FTSE RAFI FTSE RAFI FTSE RAFI Hong Kong0 UK 100 Italy 30 Switzerland China0 UCITS ETF UCITS ETF UCITS ETF UCITS ETF Fair value % of net Fair value % of net Fair value % of net Fair value % of net GBP assets EUR assets CHF assets USD assetsEquities 30,032,752 102.51 2,154,190 99.14 2,481,207 99.52 3,891,600 99.31Total 30,032,752 102.51 2,154,190 99.14 2,481,207 99.52 3,891,600 99.31
30 September 2015 0 PowerShares0 EuroMTS0 Cash 30 Months0 UCITS ETF Fair value % of net EUR assetsBonds 52,315,332 93.69Total 52,315,332 93.69
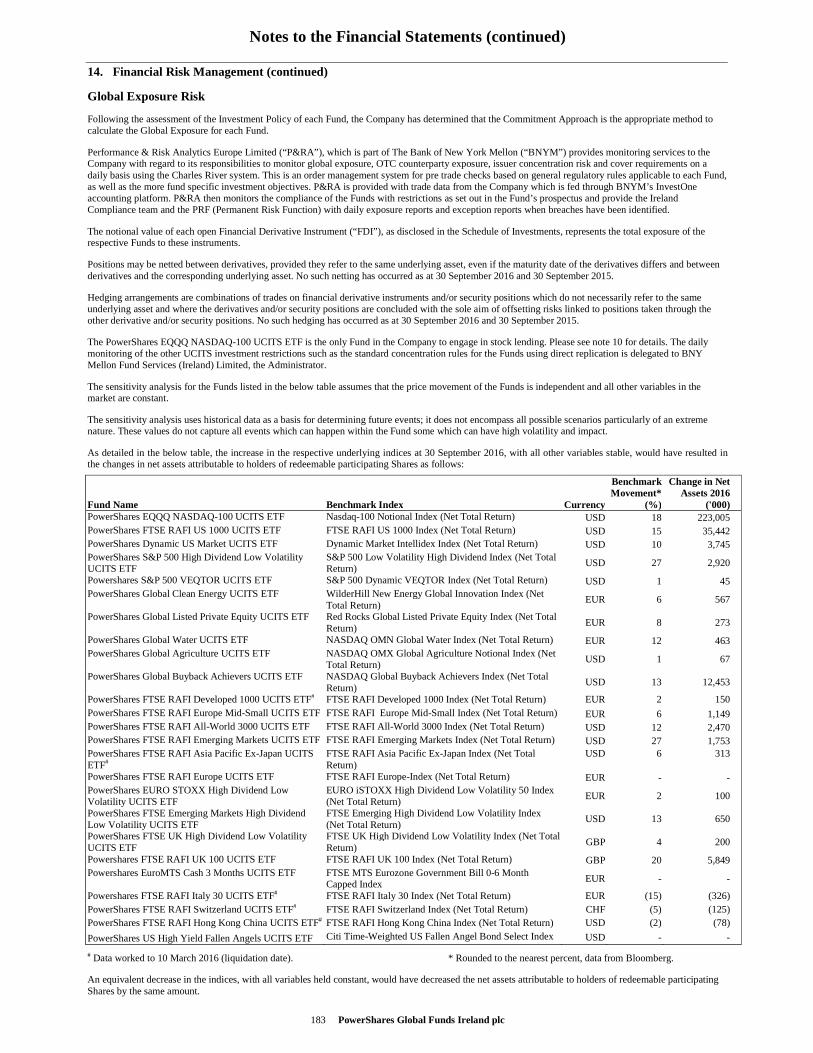
Notes to the Financial Statements (continued)
183 PowerShares Global Funds Ireland plc
14. Financial Risk Management (continued)
Global Exposure Risk
Following the assessment of the Investment Policy of each Fund, the Company has determined that the Commitment Approach is the appropriate method to calculate the Global Exposure for each Fund.
Performance & Risk Analytics Europe Limited (“P&RA”), which is part of The Bank of New York Mellon (“BNYM”) provides monitoring services to the Company with regard to its responsibilities to monitor global exposure, OTC counterparty exposure, issuer concentration risk and cover requirements on a daily basis using the Charles River system. This is an order management system for pre trade checks based on general regulatory rules applicable to each Fund, as well as the more fund specific investment objectives. P&RA is provided with trade data from the Company which is fed through BNYM’s InvestOne accounting platform. P&RA then monitors the compliance of the Funds with restrictions as set out in the Fund’s prospectus and provide the Ireland Compliance team and the PRF (Permanent Risk Function) with daily exposure reports and exception reports when breaches have been identified.
The notional value of each open Financial Derivative Instrument (“FDI”), as disclosed in the Schedule of Investments, represents the total exposure of the respective Funds to these instruments.
Positions may be netted between derivatives, provided they refer to the same underlying asset, even if the maturity date of the derivatives differs and between derivatives and the corresponding underlying asset. No such netting has occurred as at 30 September 2016 and 30 September 2015.
Hedging arrangements are combinations of trades on financial derivative instruments and/or security positions which do not necessarily refer to the same underlying asset and where the derivatives and/or security positions are concluded with the sole aim of offsetting risks linked to positions taken through the other derivative and/or security positions. No such hedging has occurred as at 30 September 2016 and 30 September 2015.
The PowerShares EQQQ NASDAQ-100 UCITS ETF is the only Fund in the Company to engage in stock lending. Please see note 10 for details. The daily monitoring of the other UCITS investment restrictions such as the standard concentration rules for the Funds using direct replication is delegated to BNY Mellon Fund Services (Ireland) Limited, the Administrator.
The sensitivity analysis for the Funds listed in the below table assumes that the price movement of the Funds is independent and all other variables in the market are constant.
The sensitivity analysis uses historical data as a basis for determining future events; it does not encompass all possible scenarios particularly of an extreme nature. These values do not capture all events which can happen within the Fund some which can have high volatility and impact.
As detailed in the below table, the increase in the respective underlying indices at 30 September 2016, with all other variables stable, would have resulted in the changes in net assets attributable to holders of redeemable participating Shares as follows:
Fund Name Benchmark Index Currency
Benchmark Movement*
(%)
Change in Net Assets 2016
('000) PowerShares EQQQ NASDAQ-100 UCITS ETF Nasdaq-100 Notional Index (Net Total Return) USD 18 223,005 PowerShares FTSE RAFI US 1000 UCITS ETF FTSE RAFI US 1000 Index (Net Total Return) USD 15 35,442 PowerShares Dynamic US Market UCITS ETF Dynamic Market Intellidex Index (Net Total Return) USD 10 3,745 PowerShares S&P 500 High Dividend Low Volatility UCITS ETF
S&P 500 Low Volatility High Dividend Index (Net Total Return)
USD 27 2,920
Powershares S&P 500 VEQTOR UCITS ETF S&P 500 Dynamic VEQTOR Index (Net Total Return) USD 1 45 PowerShares Global Clean Energy UCITS ETF WilderHill New Energy Global Innovation Index (Net
Total Return) EUR 6 567
PowerShares Global Listed Private Equity UCITS ETF Red Rocks Global Listed Private Equity Index (Net Total Return)
EUR 8 273
PowerShares Global Water UCITS ETF NASDAQ OMN Global Water Index (Net Total Return) EUR 12 463 PowerShares Global Agriculture UCITS ETF NASDAQ OMX Global Agriculture Notional Index (Net
Total Return) USD 1 67
PowerShares Global Buyback Achievers UCITS ETF NASDAQ Global Buyback Achievers Index (Net Total Return)
USD 13 12,453
PowerShares FTSE RAFI Developed 1000 UCITS ETF# FTSE RAFI Developed 1000 Index (Net Total Return) EUR 2 150 PowerShares FTSE RAFI Europe Mid-Small UCITS ETF FTSE RAFI Europe Mid-Small Index (Net Total Return) EUR 6 1,149 PowerShares FTSE RAFI All-World 3000 UCITS ETF FTSE RAFI All-World 3000 Index (Net Total Return) USD 12 2,470 PowerShares FTSE RAFI Emerging Markets UCITS ETF FTSE RAFI Emerging Markets Index (Net Total Return) USD 27 1,753 PowerShares FTSE RAFI Asia Pacific Ex-Japan UCITS ETF#
FTSE RAFI Asia Pacific Ex-Japan Index (Net Total Return)
USD 6 313
PowerShares FTSE RAFI Europe UCITS ETF FTSE RAFI Europe-Index (Net Total Return) EUR - - PowerShares EURO STOXX High Dividend Low Volatility UCITS ETF
EURO iSTOXX High Dividend Low Volatility 50 Index (Net Total Return)
EUR 2 100
PowerShares FTSE Emerging Markets High Dividend Low Volatility UCITS ETF
FTSE Emerging High Dividend Low Volatility Index (Net Total Return)
USD 13 650
PowerShares FTSE UK High Dividend Low Volatility UCITS ETF
FTSE UK High Dividend Low Volatility Index (Net Total Return)
GBP 4 200
Powershares FTSE RAFI UK 100 UCITS ETF FTSE RAFI UK 100 Index (Net Total Return) GBP 20 5,849 Powershares EuroMTS Cash 3 Months UCITS ETF FTSE MTS Eurozone Government Bill 0-6 Month
Capped Index EUR - -
Powershares FTSE RAFI Italy 30 UCITS ETF# FTSE RAFI Italy 30 Index (Net Total Return) EUR (15) (326) PowerShares FTSE RAFI Switzerland UCITS ETF# FTSE RAFI Switzerland Index (Net Total Return) CHF (5) (125) PowerShares FTSE RAFI Hong Kong China UCITS ETF# FTSE RAFI Hong Kong China Index (Net Total Return) USD (2) (78)
PowerShares US High Yield Fallen Angels UCITS ETF Citi Time-Weighted US Fallen Angel Bond Select Index USD - -
# Data worked to 10 March 2016 (liquidation date). * Rounded to the nearest percent, data from Bloomberg.
An equivalent decrease in the indices, with all variables held constant, would have decreased the net assets attributable to holders of redeemable participating Shares by the same amount.
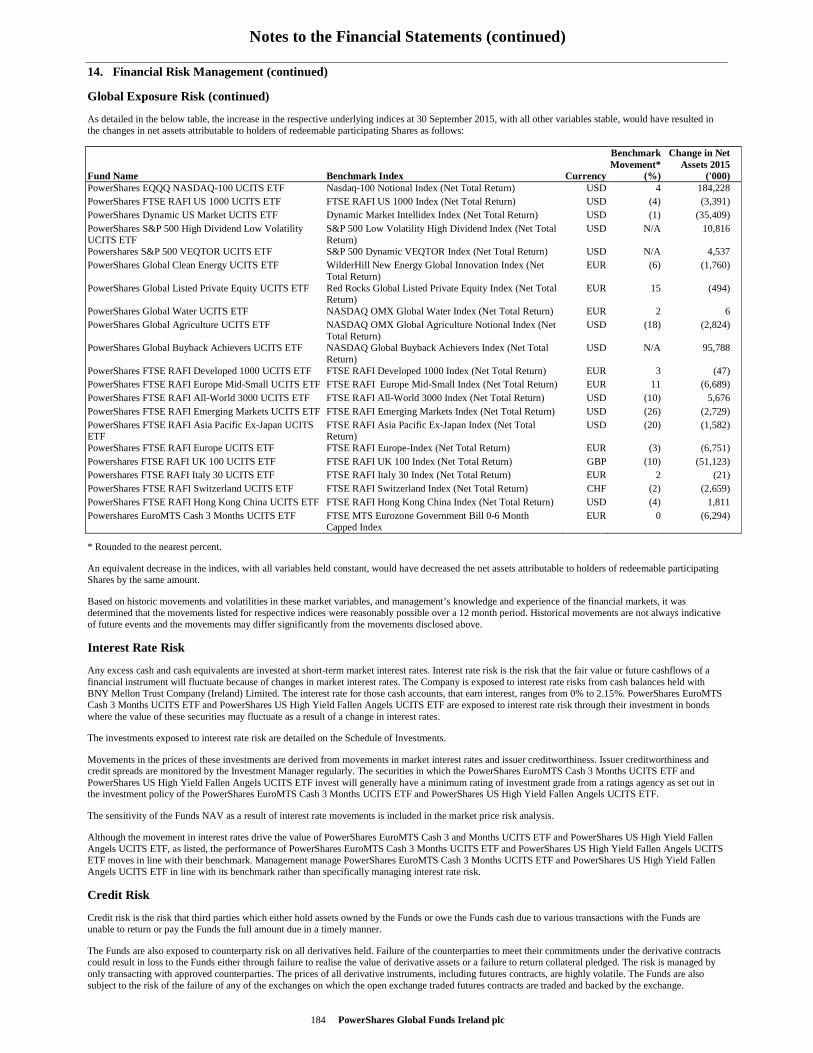
Notes to the Financial Statements (continued)
184 PowerShares Global Funds Ireland plc
14. Financial Risk Management (continued)
Global Exposure Risk (continued)
As detailed in the below table, the increase in the respective underlying indices at 30 September 2015, with all other variables stable, would have resulted in the changes in net assets attributable to holders of redeemable participating Shares as follows:
Fund Name Benchmark Index Currency
Benchmark Movement*
(%)
Change in Net Assets 2015
('000) PowerShares EQQQ NASDAQ-100 UCITS ETF Nasdaq-100 Notional Index (Net Total Return) USD 4 184,228 PowerShares FTSE RAFI US 1000 UCITS ETF FTSE RAFI US 1000 Index (Net Total Return) USD (4) (3,391) PowerShares Dynamic US Market UCITS ETF Dynamic Market Intellidex Index (Net Total Return) USD (1) (35,409) PowerShares S&P 500 High Dividend Low Volatility UCITS ETF
S&P 500 Low Volatility High Dividend Index (Net Total Return)
USD N/A 10,816
Powershares S&P 500 VEQTOR UCITS ETF S&P 500 Dynamic VEQTOR Index (Net Total Return) USD N/A 4,537 PowerShares Global Clean Energy UCITS ETF WilderHill New Energy Global Innovation Index (Net
Total Return) EUR (6) (1,760)
PowerShares Global Listed Private Equity UCITS ETF Red Rocks Global Listed Private Equity Index (Net Total Return)
EUR 15 (494)
PowerShares Global Water UCITS ETF NASDAQ OMX Global Water Index (Net Total Return) EUR 2 6 PowerShares Global Agriculture UCITS ETF NASDAQ OMX Global Agriculture Notional Index (Net
Total Return) USD (18) (2,824)
PowerShares Global Buyback Achievers UCITS ETF NASDAQ Global Buyback Achievers Index (Net Total Return)
USD N/A 95,788
PowerShares FTSE RAFI Developed 1000 UCITS ETF FTSE RAFI Developed 1000 Index (Net Total Return) EUR 3 (47) PowerShares FTSE RAFI Europe Mid-Small UCITS ETF FTSE RAFI Europe Mid-Small Index (Net Total Return) EUR 11 (6,689) PowerShares FTSE RAFI All-World 3000 UCITS ETF FTSE RAFI All-World 3000 Index (Net Total Return) USD (10) 5,676 PowerShares FTSE RAFI Emerging Markets UCITS ETF FTSE RAFI Emerging Markets Index (Net Total Return) USD (26) (2,729) PowerShares FTSE RAFI Asia Pacific Ex-Japan UCITS ETF
FTSE RAFI Asia Pacific Ex-Japan Index (Net Total Return)
USD (20) (1,582)
PowerShares FTSE RAFI Europe UCITS ETF FTSE RAFI Europe-Index (Net Total Return) EUR (3) (6,751) Powershares FTSE RAFI UK 100 UCITS ETF FTSE RAFI UK 100 Index (Net Total Return) GBP (10) (51,123) Powershares FTSE RAFI Italy 30 UCITS ETF FTSE RAFI Italy 30 Index (Net Total Return) EUR 2 (21) PowerShares FTSE RAFI Switzerland UCITS ETF FTSE RAFI Switzerland Index (Net Total Return) CHF (2) (2,659) PowerShares FTSE RAFI Hong Kong China UCITS ETF FTSE RAFI Hong Kong China Index (Net Total Return) USD (4) 1,811 Powershares EuroMTS Cash 3 Months UCITS ETF FTSE MTS Eurozone Government Bill 0-6 Month
Capped Index EUR 0 (6,294)
* Rounded to the nearest percent.
An equivalent decrease in the indices, with all variables held constant, would have decreased the net assets attributable to holders of redeemable participating Shares by the same amount.
Based on historic movements and volatilities in these market variables, and management’s knowledge and experience of the financial markets, it was determined that the movements listed for respective indices were reasonably possible over a 12 month period. Historical movements are not always indicative of future events and the movements may differ significantly from the movements disclosed above.
Interest Rate Risk
Any excess cash and cash equivalents are invested at short-term market interest rates. Interest rate risk is the risk that the fair value or future cashflows of a financial instrument will fluctuate because of changes in market interest rates. The Company is exposed to interest rate risks from cash balances held with BNY Mellon Trust Company (Ireland) Limited. The interest rate for those cash accounts, that earn interest, ranges from 0% to 2.15%. PowerShares EuroMTS Cash 3 Months UCITS ETF and PowerShares US High Yield Fallen Angels UCITS ETF are exposed to interest rate risk through their investment in bonds where the value of these securities may fluctuate as a result of a change in interest rates.
The investments exposed to interest rate risk are detailed on the Schedule of Investments.
Movements in the prices of these investments are derived from movements in market interest rates and issuer creditworthiness. Issuer creditworthiness and credit spreads are monitored by the Investment Manager regularly. The securities in which the PowerShares EuroMTS Cash 3 Months UCITS ETF and PowerShares US High Yield Fallen Angels UCITS ETF invest will generally have a minimum rating of investment grade from a ratings agency as set out in the investment policy of the PowerShares EuroMTS Cash 3 Months UCITS ETF and PowerShares US High Yield Fallen Angels UCITS ETF.
The sensitivity of the Funds NAV as a result of interest rate movements is included in the market price risk analysis.
Although the movement in interest rates drive the value of PowerShares EuroMTS Cash 3 and Months UCITS ETF and PowerShares US High Yield Fallen Angels UCITS ETF, as listed, the performance of PowerShares EuroMTS Cash 3 Months UCITS ETF and PowerShares US High Yield Fallen Angels UCITS ETF moves in line with their benchmark. Management manage PowerShares EuroMTS Cash 3 Months UCITS ETF and PowerShares US High Yield Fallen Angels UCITS ETF in line with its benchmark rather than specifically managing interest rate risk.
Credit Risk
Credit risk is the risk that third parties which either hold assets owned by the Funds or owe the Funds cash due to various transactions with the Funds are unable to return or pay the Funds the full amount due in a timely manner.
The Funds are also exposed to counterparty risk on all derivatives held. Failure of the counterparties to meet their commitments under the derivative contracts could result in loss to the Funds either through failure to realise the value of derivative assets or a failure to return collateral pledged. The risk is managed by only transacting with approved counterparties. The prices of all derivative instruments, including futures contracts, are highly volatile. The Funds are also subject to the risk of the failure of any of the exchanges on which the open exchange traded futures contracts are traded and backed by the exchange.
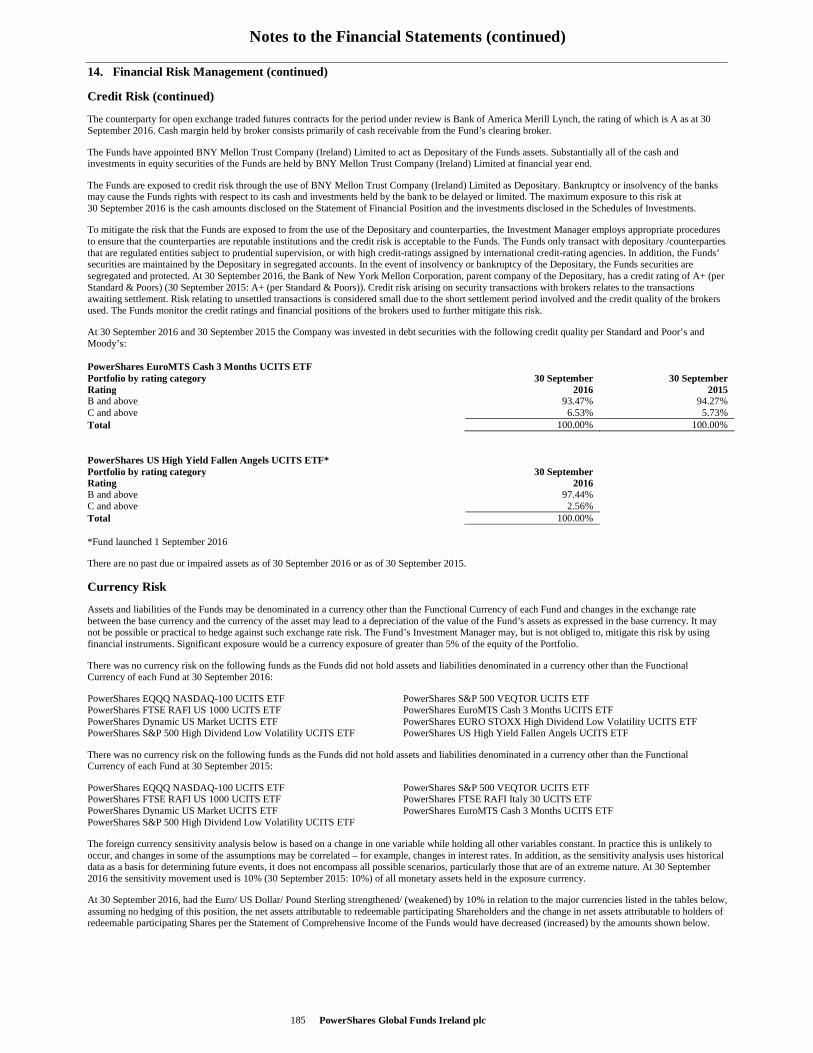
Notes to the Financial Statements (continued)
PowerShares Global Funds Ireland plc 185
14. Financial Risk Management (continued)
Credit Risk (continued)
The counterparty for open exchange traded futures contracts for the period under review is Bank of America Merill Lynch, the rating of which is A as at 30 September 2016. Cash margin held by broker consists primarily of cash receivable from the Fund’s clearing broker.
The Funds have appointed BNY Mellon Trust Company (Ireland) Limited to act as Depositary of the Funds assets. Substantially all of the cash and investments in equity securities of the Funds are held by BNY Mellon Trust Company (Ireland) Limited at financial year end.
The Funds are exposed to credit risk through the use of BNY Mellon Trust Company (Ireland) Limited as Depositary. Bankruptcy or insolvency of the banks may cause the Funds rights with respect to its cash and investments held by the bank to be delayed or limited. The maximum exposure to this risk at 30 September 2016 is the cash amounts disclosed on the Statement of Financial Position and the investments disclosed in the Schedules of Investments.
To mitigate the risk that the Funds are exposed to from the use of the Depositary and counterparties, the Investment Manager employs appropriate procedures to ensure that the counterparties are reputable institutions and the credit risk is acceptable to the Funds. The Funds only transact with depositary /counterparties that are regulated entities subject to prudential supervision, or with high credit-ratings assigned by international credit-rating agencies. In addition, the Funds’ securities are maintained by the Depositary in segregated accounts. In the event of insolvency or bankruptcy of the Depositary, the Funds securities are segregated and protected. At 30 September 2016, the Bank of New York Mellon Corporation, parent company of the Depositary, has a credit rating of A+ (per Standard & Poors) (30 September 2015: A+ (per Standard & Poors)). Credit risk arising on security transactions with brokers relates to the transactions awaiting settlement. Risk relating to unsettled transactions is considered small due to the short settlement period involved and the credit quality of the brokers used. The Funds monitor the credit ratings and financial positions of the brokers used to further mitigate this risk.
At 30 September 2016 and 30 September 2015 the Company was invested in debt securities with the following credit quality per Standard and Poor’s and Moody’s: PowerShares EuroMTS Cash 3 Months UCITS ETF Portfolio by rating category 30 September 30 September Rating 2016 2015 B and above 93.47% 94.27% C and above 6.53% 5.73% Total 100.00% 100.00% PowerShares US High Yield Fallen Angels UCITS ETF* Portfolio by rating category 30 September Rating 2016 B and above 97.44% C and above 2.56% Total 100.00% *Fund launched 1 September 2016
There are no past due or impaired assets as of 30 September 2016 or as of 30 September 2015.
Currency Risk
Assets and liabilities of the Funds may be denominated in a currency other than the Functional Currency of each Fund and changes in the exchange rate between the base currency and the currency of the asset may lead to a depreciation of the value of the Fund’s assets as expressed in the base currency. It may not be possible or practical to hedge against such exchange rate risk. The Fund’s Investment Manager may, but is not obliged to, mitigate this risk by using financial instruments. Significant exposure would be a currency exposure of greater than 5% of the equity of the Portfolio.
There was no currency risk on the following funds as the Funds did not hold assets and liabilities denominated in a currency other than the Functional Currency of each Fund at 30 September 2016:
PowerShares EQQQ NASDAQ-100 UCITS ETF PowerShares S&P 500 VEQTOR UCITS ETF PowerShares FTSE RAFI US 1000 UCITS ETF PowerShares EuroMTS Cash 3 Months UCITS ETF PowerShares Dynamic US Market UCITS ETF PowerShares EURO STOXX High Dividend Low Volatility UCITS ETF PowerShares S&P 500 High Dividend Low Volatility UCITS ETF PowerShares US High Yield Fallen Angels UCITS ETF
There was no currency risk on the following funds as the Funds did not hold assets and liabilities denominated in a currency other than the Functional Currency of each Fund at 30 September 2015:
PowerShares EQQQ NASDAQ-100 UCITS ETF PowerShares S&P 500 VEQTOR UCITS ETF PowerShares FTSE RAFI US 1000 UCITS ETF PowerShares FTSE RAFI Italy 30 UCITS ETF PowerShares Dynamic US Market UCITS ETF PowerShares EuroMTS Cash 3 Months UCITS ETF PowerShares S&P 500 High Dividend Low Volatility UCITS ETF
The foreign currency sensitivity analysis below is based on a change in one variable while holding all other variables constant. In practice this is unlikely to occur, and changes in some of the assumptions may be correlated – for example, changes in interest rates. In addition, as the sensitivity analysis uses historical data as a basis for determining future events, it does not encompass all possible scenarios, particularly those that are of an extreme nature. At 30 September 2016 the sensitivity movement used is 10% (30 September 2015: 10%) of all monetary assets held in the exposure currency.
At 30 September 2016, had the Euro/ US Dollar/ Pound Sterling strengthened/ (weakened) by 10% in relation to the major currencies listed in the tables below, assuming no hedging of this position, the net assets attributable to redeemable participating Shareholders and the change in net assets attributable to holders of redeemable participating Shares per the Statement of Comprehensive Income of the Funds would have decreased (increased) by the amounts shown below.
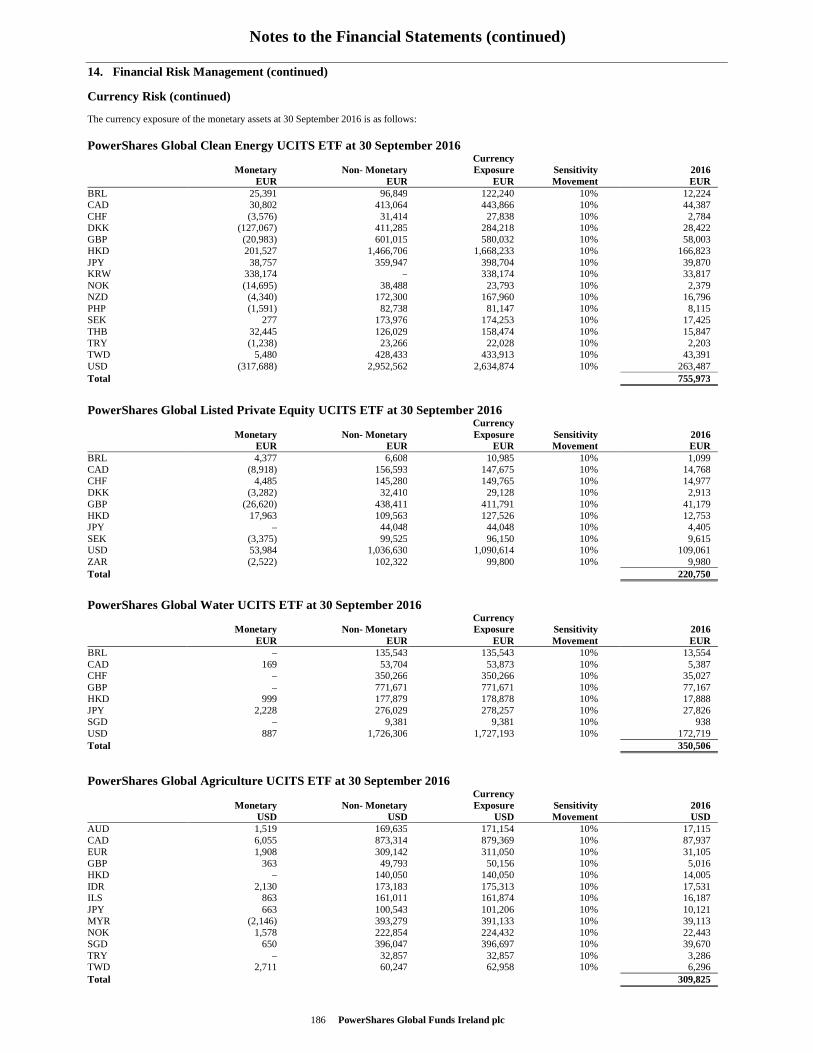
Notes to the Financial Statements (continued)
186 PowerShares Global Funds Ireland plc
14. Financial Risk Management (continued)
Currency Risk (continued)
The currency exposure of the monetary assets at 30 September 2016 is as follows:
PowerShares Global Clean Energy UCITS ETF at 30 September 2016
Monetary
EURNon- Monetary
EUR
CurrencyExposure
EURSensitivity Movement
2016 EUR
BRL 25,391 96,849 122,240 10% 12,224 CAD 30,802 413,064 443,866 10% 44,387 CHF (3,576) 31,414 27,838 10% 2,784 DKK (127,067) 411,285 284,218 10% 28,422 GBP (20,983) 601,015 580,032 10% 58,003 HKD 201,527 1,466,706 1,668,233 10% 166,823 JPY 38,757 359,947 398,704 10% 39,870 KRW 338,174 – 338,174 10% 33,817 NOK (14,695) 38,488 23,793 10% 2,379 NZD (4,340) 172,300 167,960 10% 16,796 PHP (1,591) 82,738 81,147 10% 8,115 SEK 277 173,976 174,253 10% 17,425 THB 32,445 126,029 158,474 10% 15,847 TRY (1,238) 23,266 22,028 10% 2,203 TWD 5,480 428,433 433,913 10% 43,391 USD (317,688) 2,952,562 2,634,874 10% 263,487 Total 755,973
PowerShares Global Listed Private Equity UCITS ETF at 30 September 2016
Monetary
EURNon- Monetary
EUR
CurrencyExposure
EURSensitivity Movement
2016 EUR
BRL 4,377 6,608 10,985 10% 1,099 CAD (8,918) 156,593 147,675 10% 14,768 CHF 4,485 145,280 149,765 10% 14,977 DKK (3,282) 32,410 29,128 10% 2,913 GBP (26,620) 438,411 411,791 10% 41,179 HKD 17,963 109,563 127,526 10% 12,753 JPY – 44,048 44,048 10% 4,405 SEK (3,375) 99,525 96,150 10% 9,615 USD 53,984 1,036,630 1,090,614 10% 109,061 ZAR (2,522) 102,322 99,800 10% 9,980 Total 220,750
PowerShares Global Water UCITS ETF at 30 September 2016
Monetary
EURNon- Monetary
EUR
CurrencyExposure
EURSensitivity Movement
2016 EUR
BRL – 135,543 135,543 10% 13,554 CAD 169 53,704 53,873 10% 5,387 CHF – 350,266 350,266 10% 35,027 GBP – 771,671 771,671 10% 77,167 HKD 999 177,879 178,878 10% 17,888 JPY 2,228 276,029 278,257 10% 27,826 SGD – 9,381 9,381 10% 938 USD 887 1,726,306 1,727,193 10% 172,719 Total 350,506
PowerShares Global Agriculture UCITS ETF at 30 September 2016
Monetary
USDNon- Monetary
USD
CurrencyExposure
USDSensitivity Movement
2016 USD
AUD 1,519 169,635 171,154 10% 17,115 CAD 6,055 873,314 879,369 10% 87,937 EUR 1,908 309,142 311,050 10% 31,105 GBP 363 49,793 50,156 10% 5,016 HKD – 140,050 140,050 10% 14,005 IDR 2,130 173,183 175,313 10% 17,531 ILS 863 161,011 161,874 10% 16,187 JPY 663 100,543 101,206 10% 10,121 MYR (2,146) 393,279 391,133 10% 39,113 NOK 1,578 222,854 224,432 10% 22,443 SGD 650 396,047 396,697 10% 39,670 TRY – 32,857 32,857 10% 3,286 TWD 2,711 60,247 62,958 10% 6,296 Total 309,825
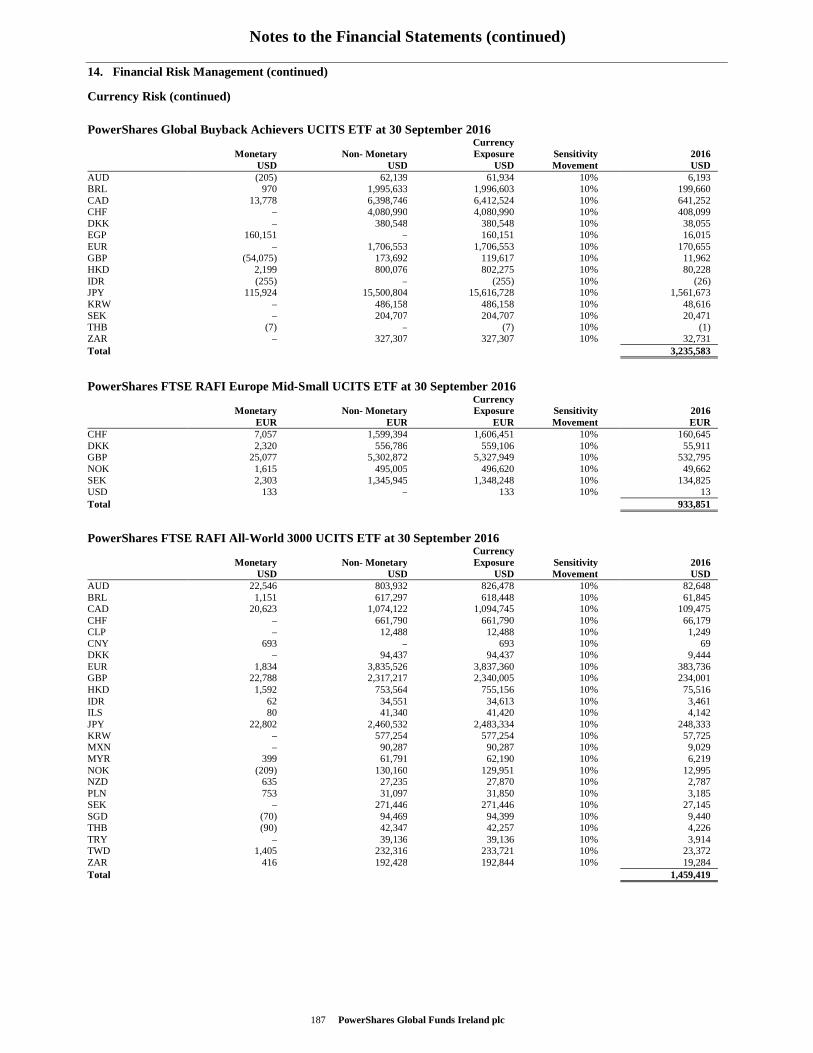
Notes to the Financial Statements (continued)
187 PowerShares Global Funds Ireland plc
14. Financial Risk Management (continued)
Currency Risk (continued)
PowerShares Global Buyback Achievers UCITS ETF at 30 September 2016
Monetary
USDNon- Monetary
USD
CurrencyExposure
USDSensitivity Movement
2016 USD
AUD (205) 62,139 61,934 10% 6,193 BRL 970 1,995,633 1,996,603 10% 199,660 CAD 13,778 6,398,746 6,412,524 10% 641,252 CHF – 4,080,990 4,080,990 10% 408,099 DKK – 380,548 380,548 10% 38,055 EGP 160,151 – 160,151 10% 16,015 EUR – 1,706,553 1,706,553 10% 170,655 GBP (54,075) 173,692 119,617 10% 11,962 HKD 2,199 800,076 802,275 10% 80,228 IDR (255) – (255) 10% (26) JPY 115,924 15,500,804 15,616,728 10% 1,561,673 KRW – 486,158 486,158 10% 48,616 SEK – 204,707 204,707 10% 20,471 THB (7) – (7) 10% (1) ZAR – 327,307 327,307 10% 32,731 Total 3,235,583
PowerShares FTSE RAFI Europe Mid-Small UCITS ETF at 30 September 2016
Monetary
EURNon- Monetary
EUR
CurrencyExposure
EURSensitivity Movement
2016 EUR
CHF 7,057 1,599,394 1,606,451 10% 160,645 DKK 2,320 556,786 559,106 10% 55,911 GBP 25,077 5,302,872 5,327,949 10% 532,795 NOK 1,615 495,005 496,620 10% 49,662 SEK 2,303 1,345,945 1,348,248 10% 134,825 USD 133 – 133 10% 13 Total 933,851
PowerShares FTSE RAFI All-World 3000 UCITS ETF at 30 September 2016
Monetary
USDNon- Monetary
USD
CurrencyExposure
USDSensitivity Movement
2016 USD
AUD 22,546 803,932 826,478 10% 82,648 BRL 1,151 617,297 618,448 10% 61,845 CAD 20,623 1,074,122 1,094,745 10% 109,475 CHF – 661,790 661,790 10% 66,179 CLP – 12,488 12,488 10% 1,249 CNY 693 – 693 10% 69 DKK – 94,437 94,437 10% 9,444 EUR 1,834 3,835,526 3,837,360 10% 383,736 GBP 22,788 2,317,217 2,340,005 10% 234,001 HKD 1,592 753,564 755,156 10% 75,516 IDR 62 34,551 34,613 10% 3,461 ILS 80 41,340 41,420 10% 4,142 JPY 22,802 2,460,532 2,483,334 10% 248,333 KRW – 577,254 577,254 10% 57,725 MXN – 90,287 90,287 10% 9,029 MYR 399 61,791 62,190 10% 6,219 NOK (209) 130,160 129,951 10% 12,995 NZD 635 27,235 27,870 10% 2,787 PLN 753 31,097 31,850 10% 3,185 SEK – 271,446 271,446 10% 27,145 SGD (70) 94,469 94,399 10% 9,440 THB (90) 42,347 42,257 10% 4,226 TRY – 39,136 39,136 10% 3,914 TWD 1,405 232,316 233,721 10% 23,372 ZAR 416 192,428 192,844 10% 19,284 Total 1,459,419
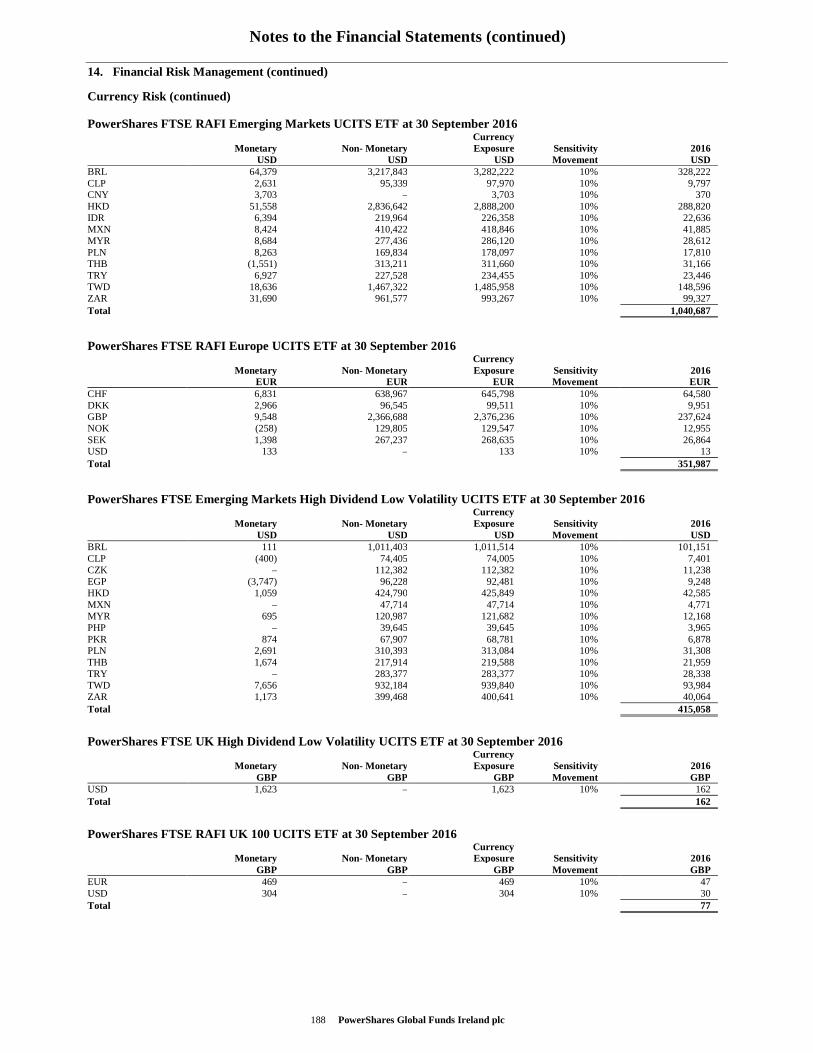
Notes to the Financial Statements (continued)
188 PowerShares Global Funds Ireland plc
14. Financial Risk Management (continued)
Currency Risk (continued)
PowerShares FTSE RAFI Emerging Markets UCITS ETF at 30 September 2016
Monetary
USDNon- Monetary
USD
CurrencyExposure
USDSensitivity Movement
2016 USD
BRL 64,379 3,217,843 3,282,222 10% 328,222 CLP 2,631 95,339 97,970 10% 9,797 CNY 3,703 – 3,703 10% 370 HKD 51,558 2,836,642 2,888,200 10% 288,820 IDR 6,394 219,964 226,358 10% 22,636 MXN 8,424 410,422 418,846 10% 41,885 MYR 8,684 277,436 286,120 10% 28,612 PLN 8,263 169,834 178,097 10% 17,810 THB (1,551) 313,211 311,660 10% 31,166 TRY 6,927 227,528 234,455 10% 23,446 TWD 18,636 1,467,322 1,485,958 10% 148,596 ZAR 31,690 961,577 993,267 10% 99,327 Total 1,040,687
PowerShares FTSE RAFI Europe UCITS ETF at 30 September 2016
Monetary
EURNon- Monetary
EUR
CurrencyExposure
EURSensitivity Movement
2016 EUR
CHF 6,831 638,967 645,798 10% 64,580 DKK 2,966 96,545 99,511 10% 9,951 GBP 9,548 2,366,688 2,376,236 10% 237,624 NOK (258) 129,805 129,547 10% 12,955 SEK 1,398 267,237 268,635 10% 26,864 USD 133 – 133 10% 13 Total 351,987
PowerShares FTSE Emerging Markets High Dividend Low Volatility UCITS ETF at 30 September 2016
Monetary
USDNon- Monetary
USD
CurrencyExposure
USDSensitivity Movement
2016 USD
BRL 111 1,011,403 1,011,514 10% 101,151 CLP (400) 74,405 74,005 10% 7,401 CZK – 112,382 112,382 10% 11,238 EGP (3,747) 96,228 92,481 10% 9,248 HKD 1,059 424,790 425,849 10% 42,585 MXN – 47,714 47,714 10% 4,771 MYR 695 120,987 121,682 10% 12,168 PHP – 39,645 39,645 10% 3,965 PKR 874 67,907 68,781 10% 6,878 PLN 2,691 310,393 313,084 10% 31,308 THB 1,674 217,914 219,588 10% 21,959 TRY – 283,377 283,377 10% 28,338 TWD 7,656 932,184 939,840 10% 93,984 ZAR 1,173 399,468 400,641 10% 40,064 Total 415,058
PowerShares FTSE UK High Dividend Low Volatility UCITS ETF at 30 September 2016
Monetary
GBPNon- Monetary
GBP
CurrencyExposure
GBPSensitivity Movement
2016 GBP
USD 1,623 – 1,623 10% 162 Total 162
PowerShares FTSE RAFI UK 100 UCITS ETF at 30 September 2016
Monetary
GBPNon- Monetary
GBP
CurrencyExposure
GBPSensitivity Movement
2016 GBP
EUR 469 – 469 10% 47 USD 304 – 304 10% 30 Total 77
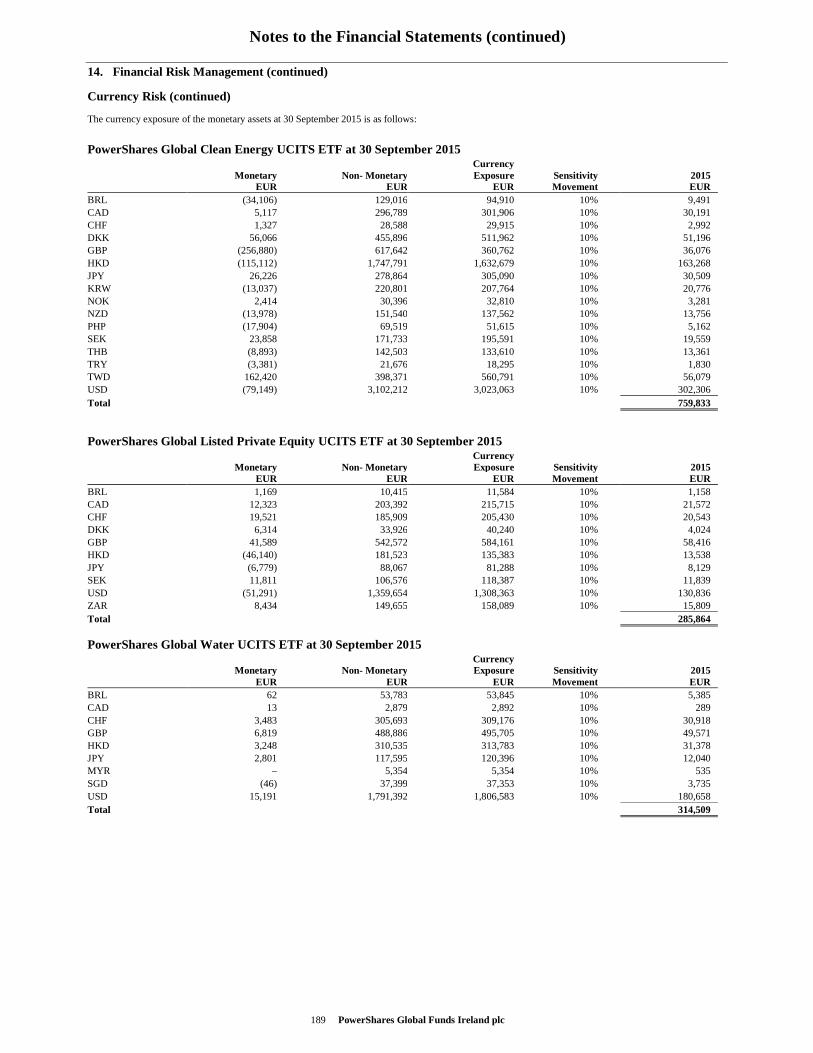
Notes to the Financial Statements (continued)
189 PowerShares Global Funds Ireland plc
14. Financial Risk Management (continued)
Currency Risk (continued)
The currency exposure of the monetary assets at 30 September 2015 is as follows:
PowerShares Global Clean Energy UCITS ETF at 30 September 2015
Monetary
EURNon- Monetary
EUR
CurrencyExposure
EURSensitivity Movement
2015 EUR
BRL (34,106) 129,016 94,910 10% 9,491 CAD 5,117 296,789 301,906 10% 30,191 CHF 1,327 28,588 29,915 10% 2,992 DKK 56,066 455,896 511,962 10% 51,196 GBP (256,880) 617,642 360,762 10% 36,076 HKD (115,112) 1,747,791 1,632,679 10% 163,268 JPY 26,226 278,864 305,090 10% 30,509 KRW (13,037) 220,801 207,764 10% 20,776 NOK 2,414 30,396 32,810 10% 3,281 NZD (13,978) 151,540 137,562 10% 13,756 PHP (17,904) 69,519 51,615 10% 5,162 SEK 23,858 171,733 195,591 10% 19,559 THB (8,893) 142,503 133,610 10% 13,361 TRY (3,381) 21,676 18,295 10% 1,830 TWD 162,420 398,371 560,791 10% 56,079 USD (79,149) 3,102,212 3,023,063 10% 302,306 Total 759,833
PowerShares Global Listed Private Equity UCITS ETF at 30 September 2015
Monetary
EURNon- Monetary
EUR
CurrencyExposure
EURSensitivity Movement
2015 EUR
BRL 1,169 10,415 11,584 10% 1,158 CAD 12,323 203,392 215,715 10% 21,572 CHF 19,521 185,909 205,430 10% 20,543 DKK 6,314 33,926 40,240 10% 4,024 GBP 41,589 542,572 584,161 10% 58,416 HKD (46,140) 181,523 135,383 10% 13,538 JPY (6,779) 88,067 81,288 10% 8,129 SEK 11,811 106,576 118,387 10% 11,839 USD (51,291) 1,359,654 1,308,363 10% 130,836 ZAR 8,434 149,655 158,089 10% 15,809 Total 285,864
PowerShares Global Water UCITS ETF at 30 September 2015
Monetary
EURNon- Monetary
EUR
CurrencyExposure
EURSensitivity Movement
2015 EUR
BRL 62 53,783 53,845 10% 5,385 CAD 13 2,879 2,892 10% 289 CHF 3,483 305,693 309,176 10% 30,918 GBP 6,819 488,886 495,705 10% 49,571 HKD 3,248 310,535 313,783 10% 31,378 JPY 2,801 117,595 120,396 10% 12,040 MYR – 5,354 5,354 10% 535 SGD (46) 37,399 37,353 10% 3,735 USD 15,191 1,791,392 1,806,583 10% 180,658 Total 314,509
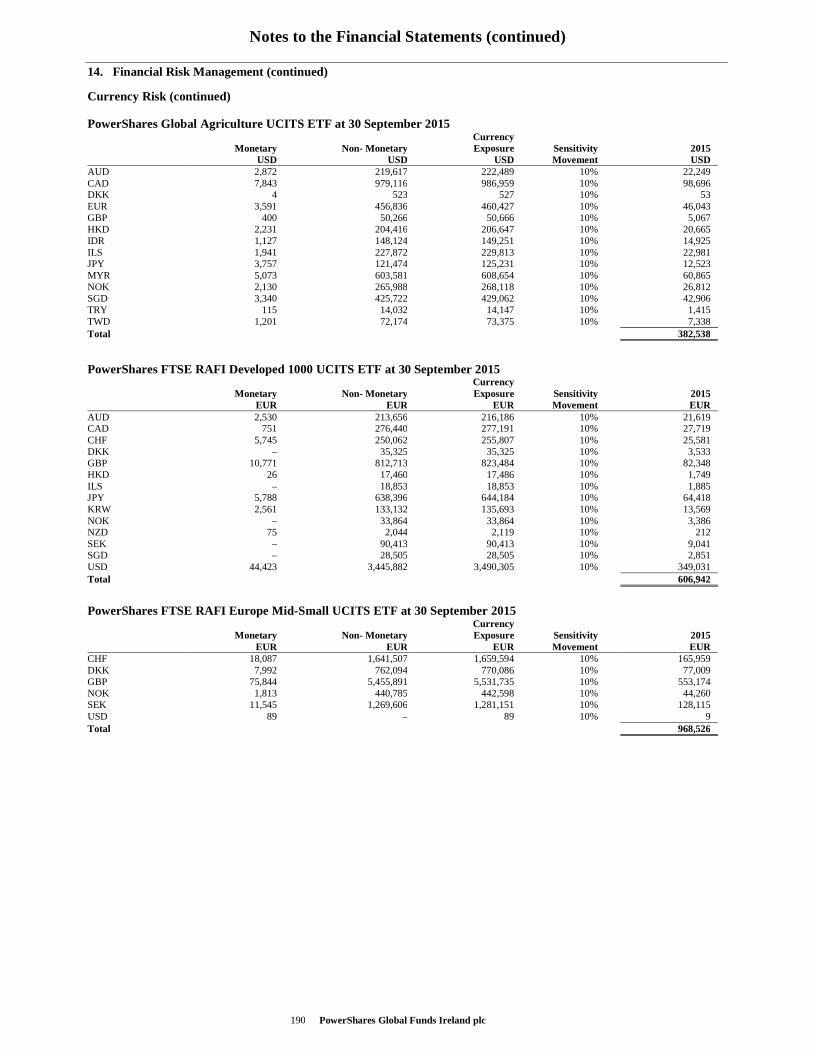
Notes to the Financial Statements (continued)
PowerShares Global Funds Ireland plc 190
14. Financial Risk Management (continued)
Currency Risk (continued)
PowerShares Global Agriculture UCITS ETF at 30 September 2015
Monetary
USDNon- Monetary
USD
CurrencyExposure
USDSensitivity Movement
2015 USD
AUD 2,872 219,617 222,489 10% 22,249 CAD 7,843 979,116 986,959 10% 98,696 DKK 4 523 527 10% 53 EUR 3,591 456,836 460,427 10% 46,043 GBP 400 50,266 50,666 10% 5,067 HKD 2,231 204,416 206,647 10% 20,665 IDR 1,127 148,124 149,251 10% 14,925 ILS 1,941 227,872 229,813 10% 22,981 JPY 3,757 121,474 125,231 10% 12,523 MYR 5,073 603,581 608,654 10% 60,865 NOK 2,130 265,988 268,118 10% 26,812 SGD 3,340 425,722 429,062 10% 42,906 TRY 115 14,032 14,147 10% 1,415 TWD 1,201 72,174 73,375 10% 7,338 Total 382,538
PowerShares FTSE RAFI Developed 1000 UCITS ETF at 30 September 2015
Monetary
EURNon- Monetary
EUR
CurrencyExposure
EURSensitivity Movement
2015 EUR
AUD 2,530 213,656 216,186 10% 21,619 CAD 751 276,440 277,191 10% 27,719 CHF 5,745 250,062 255,807 10% 25,581 DKK – 35,325 35,325 10% 3,533 GBP 10,771 812,713 823,484 10% 82,348 HKD 26 17,460 17,486 10% 1,749 ILS – 18,853 18,853 10% 1,885 JPY 5,788 638,396 644,184 10% 64,418 KRW 2,561 133,132 135,693 10% 13,569 NOK – 33,864 33,864 10% 3,386 NZD 75 2,044 2,119 10% 212 SEK – 90,413 90,413 10% 9,041 SGD – 28,505 28,505 10% 2,851 USD 44,423 3,445,882 3,490,305 10% 349,031 Total 606,942
PowerShares FTSE RAFI Europe Mid-Small UCITS ETF at 30 September 2015
Monetary
EURNon- Monetary
EUR
CurrencyExposure
EURSensitivity Movement
2015 EUR
CHF 18,087 1,641,507 1,659,594 10% 165,959 DKK 7,992 762,094 770,086 10% 77,009 GBP 75,844 5,455,891 5,531,735 10% 553,174 NOK 1,813 440,785 442,598 10% 44,260 SEK 11,545 1,269,606 1,281,151 10% 128,115 USD 89 – 89 10% 9 Total 968,526
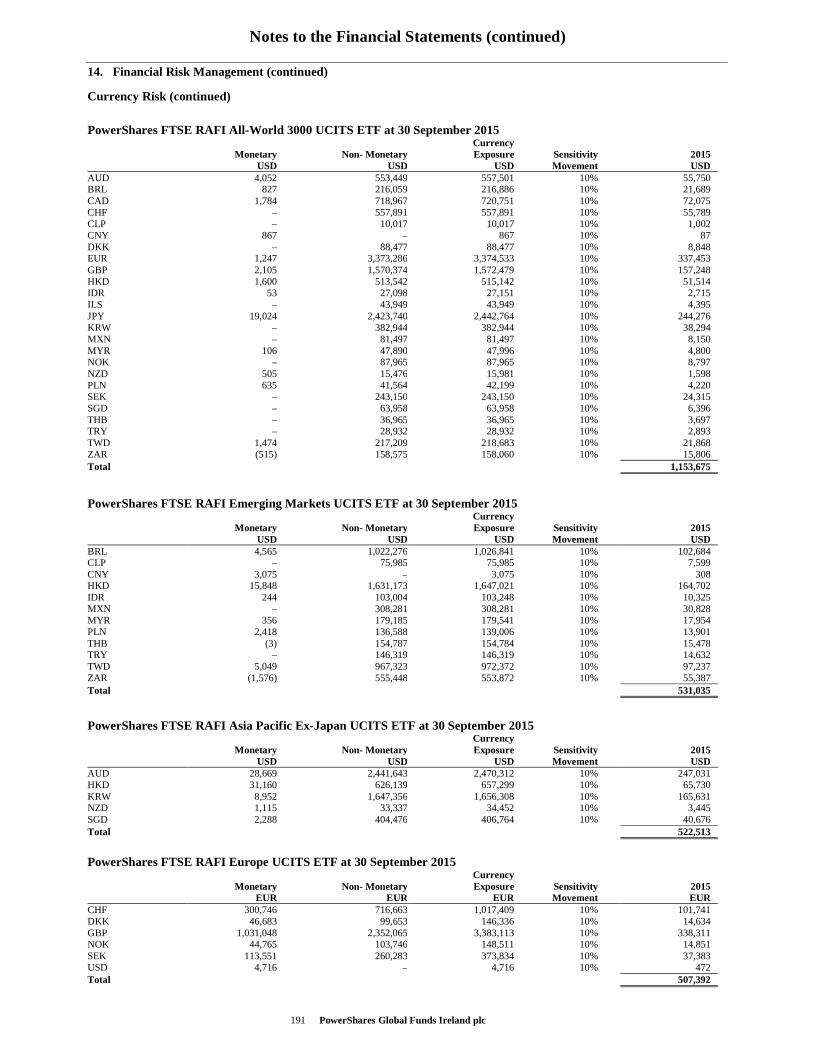
Notes to the Financial Statements (continued)
PowerShares Global Funds Ireland plc 191
14. Financial Risk Management (continued)
Currency Risk (continued)
PowerShares FTSE RAFI All-World 3000 UCITS ETF at 30 September 2015
Monetary
USDNon- Monetary
USD
CurrencyExposure
USDSensitivity Movement
2015 USD
AUD 4,052 553,449 557,501 10% 55,750 BRL 827 216,059 216,886 10% 21,689 CAD 1,784 718,967 720,751 10% 72,075 CHF – 557,891 557,891 10% 55,789 CLP – 10,017 10,017 10% 1,002 CNY 867 – 867 10% 87 DKK – 88,477 88,477 10% 8,848 EUR 1,247 3,373,286 3,374,533 10% 337,453 GBP 2,105 1,570,374 1,572,479 10% 157,248 HKD 1,600 513,542 515,142 10% 51,514 IDR 53 27,098 27,151 10% 2,715 ILS – 43,949 43,949 10% 4,395 JPY 19,024 2,423,740 2,442,764 10% 244,276 KRW – 382,944 382,944 10% 38,294 MXN – 81,497 81,497 10% 8,150 MYR 106 47,890 47,996 10% 4,800 NOK – 87,965 87,965 10% 8,797 NZD 505 15,476 15,981 10% 1,598 PLN 635 41,564 42,199 10% 4,220 SEK – 243,150 243,150 10% 24,315 SGD – 63,958 63,958 10% 6,396 THB – 36,965 36,965 10% 3,697 TRY – 28,932 28,932 10% 2,893 TWD 1,474 217,209 218,683 10% 21,868 ZAR (515) 158,575 158,060 10% 15,806 Total 1,153,675
PowerShares FTSE RAFI Emerging Markets UCITS ETF at 30 September 2015
Monetary
USDNon- Monetary
USD
CurrencyExposure
USDSensitivity Movement
2015 USD
BRL 4,565 1,022,276 1,026,841 10% 102,684 CLP – 75,985 75,985 10% 7,599 CNY 3,075 – 3,075 10% 308 HKD 15,848 1,631,173 1,647,021 10% 164,702 IDR 244 103,004 103,248 10% 10,325 MXN – 308,281 308,281 10% 30,828 MYR 356 179,185 179,541 10% 17,954 PLN 2,418 136,588 139,006 10% 13,901 THB (3) 154,787 154,784 10% 15,478 TRY – 146,319 146,319 10% 14,632 TWD 5,049 967,323 972,372 10% 97,237 ZAR (1,576) 555,448 553,872 10% 55,387 Total 531,035
PowerShares FTSE RAFI Asia Pacific Ex-Japan UCITS ETF at 30 September 2015
Monetary
USDNon- Monetary
USD
CurrencyExposure
USDSensitivity Movement
2015 USD
AUD 28,669 2,441,643 2,470,312 10% 247,031 HKD 31,160 626,139 657,299 10% 65,730 KRW 8,952 1,647,356 1,656,308 10% 165,631 NZD 1,115 33,337 34,452 10% 3,445 SGD 2,288 404,476 406,764 10% 40,676 Total 522,513
PowerShares FTSE RAFI Europe UCITS ETF at 30 September 2015
Monetary
EURNon- Monetary
EUR
CurrencyExposure
EURSensitivity Movement
2015 EUR
CHF 300,746 716,663 1,017,409 10% 101,741 DKK 46,683 99,653 146,336 10% 14,634 GBP 1,031,048 2,352,065 3,383,113 10% 338,311 NOK 44,765 103,746 148,511 10% 14,851 SEK 113,551 260,283 373,834 10% 37,383 USD 4,716 – 4,716 10% 472 Total 507,392
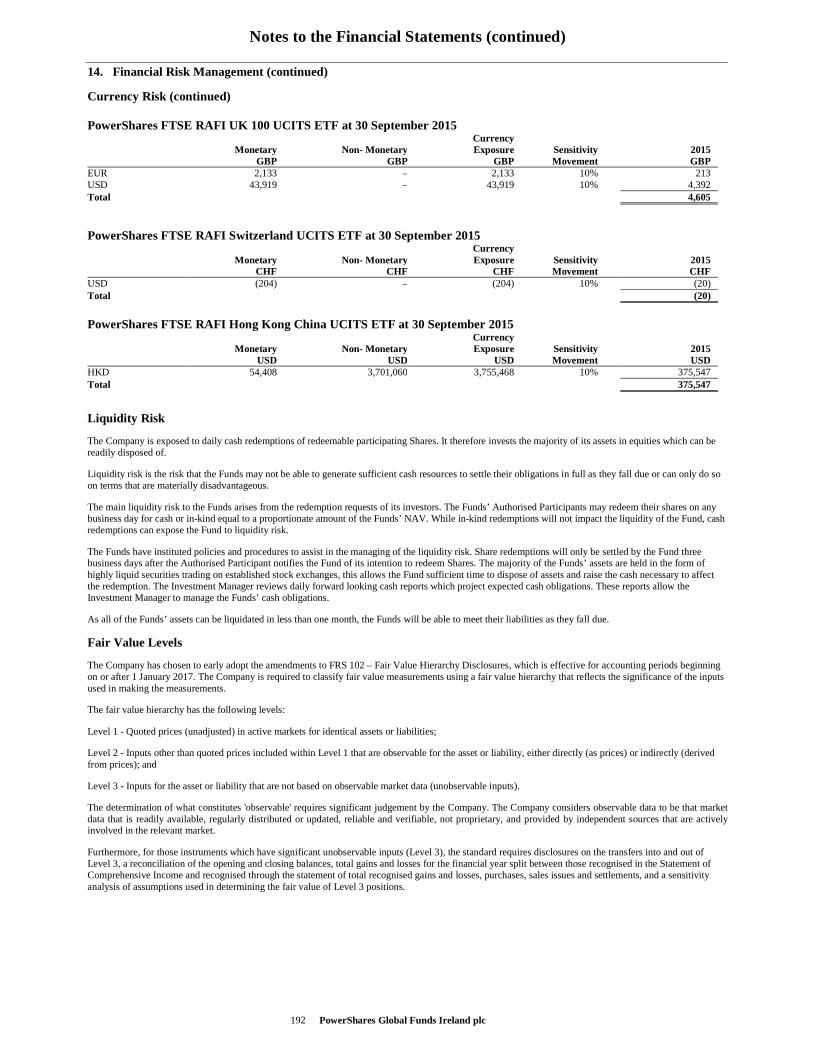
Notes to the Financial Statements (continued)
PowerShares Global Funds Ireland plc 192
14. Financial Risk Management (continued)
Currency Risk (continued)
PowerShares FTSE RAFI UK 100 UCITS ETF at 30 September 2015
Monetary
GBPNon- Monetary
GBP
CurrencyExposure
GBPSensitivity Movement
2015 GBP
EUR 2,133 – 2,133 10% 213 USD 43,919 – 43,919 10% 4,392 Total 4,605
PowerShares FTSE RAFI Switzerland UCITS ETF at 30 September 2015
Monetary
CHFNon- Monetary
CHF
CurrencyExposure
CHFSensitivity Movement
2015 CHF
USD (204) – (204) 10% (20) Total (20)
PowerShares FTSE RAFI Hong Kong China UCITS ETF at 30 September 2015
Monetary
USDNon- Monetary
USD
CurrencyExposure
USDSensitivity Movement
2015 USD
HKD 54,408 3,701,060 3,755,468 10% 375,547 Total 375,547
Liquidity Risk
The Company is exposed to daily cash redemptions of redeemable participating Shares. It therefore invests the majority of its assets in equities which can be readily disposed of.
Liquidity risk is the risk that the Funds may not be able to generate sufficient cash resources to settle their obligations in full as they fall due or can only do so on terms that are materially disadvantageous.
The main liquidity risk to the Funds arises from the redemption requests of its investors. The Funds’ Authorised Participants may redeem their shares on any business day for cash or in-kind equal to a proportionate amount of the Funds’ NAV. While in-kind redemptions will not impact the liquidity of the Fund, cash redemptions can expose the Fund to liquidity risk.
The Funds have instituted policies and procedures to assist in the managing of the liquidity risk. Share redemptions will only be settled by the Fund three business days after the Authorised Participant notifies the Fund of its intention to redeem Shares. The majority of the Funds’ assets are held in the form of highly liquid securities trading on established stock exchanges, this allows the Fund sufficient time to dispose of assets and raise the cash necessary to affect the redemption. The Investment Manager reviews daily forward looking cash reports which project expected cash obligations. These reports allow the Investment Manager to manage the Funds’ cash obligations.
As all of the Funds’ assets can be liquidated in less than one month, the Funds will be able to meet their liabilities as they fall due.
Fair Value Levels
The Company has chosen to early adopt the amendments to FRS 102 – Fair Value Hierarchy Disclosures, which is effective for accounting periods beginning on or after 1 January 2017. The Company is required to classify fair value measurements using a fair value hierarchy that reflects the significance of the inputs used in making the measurements.
The fair value hierarchy has the following levels:
Level 1 - Quoted prices (unadjusted) in active markets for identical assets or liabilities;
Level 2 - Inputs other than quoted prices included within Level 1 that are observable for the asset or liability, either directly (as prices) or indirectly (derived from prices); and
Level 3 - Inputs for the asset or liability that are not based on observable market data (unobservable inputs).
The determination of what constitutes 'observable' requires significant judgement by the Company. The Company considers observable data to be that market data that is readily available, regularly distributed or updated, reliable and verifiable, not proprietary, and provided by independent sources that are actively involved in the relevant market.
Furthermore, for those instruments which have significant unobservable inputs (Level 3), the standard requires disclosures on the transfers into and out of Level 3, a reconciliation of the opening and closing balances, total gains and losses for the financial year split between those recognised in the Statement of Comprehensive Income and recognised through the statement of total recognised gains and losses, purchases, sales issues and settlements, and a sensitivity analysis of assumptions used in determining the fair value of Level 3 positions.
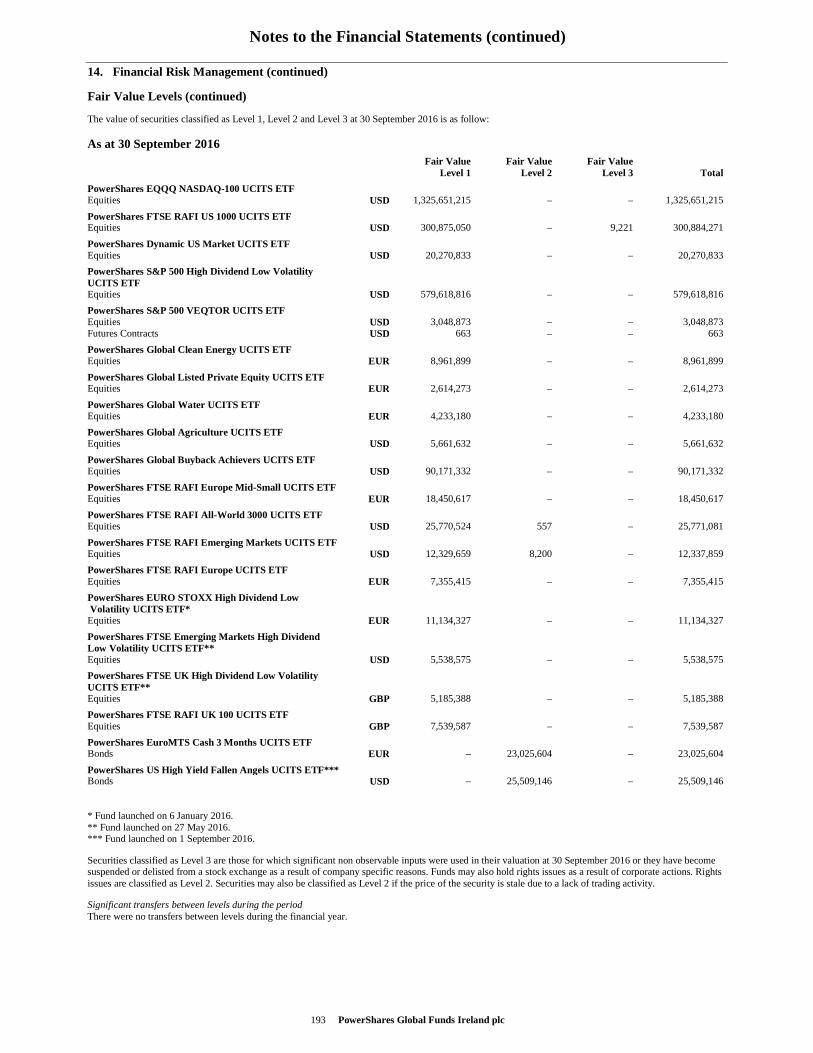
Notes to the Financial Statements (continued)
193 PowerShares Global Funds Ireland plc
14. Financial Risk Management (continued)
Fair Value Levels (continued)
The value of securities classified as Level 1, Level 2 and Level 3 at 30 September 2016 is as follow:
As at 30 September 2016
Fair Value
Level 1Fair Value
Level 2Fair Value
Level 3 Total
PowerShares EQQQ NASDAQ-100 UCITS ETF Equities USD 1,325,651,215 – – 1,325,651,215
PowerShares FTSE RAFI US 1000 UCITS ETF Equities USD 300,875,050 – 9,221 300,884,271
PowerShares Dynamic US Market UCITS ETF Equities USD 20,270,833 – – 20,270,833
PowerShares S&P 500 High Dividend Low Volatility UCITS ETF Equities USD 579,618,816 – – 579,618,816
PowerShares S&P 500 VEQTOR UCITS ETF Equities USD 3,048,873 – – 3,048,873Futures Contracts USD 663 – – 663
PowerShares Global Clean Energy UCITS ETF Equities EUR 8,961,899 – – 8,961,899
PowerShares Global Listed Private Equity UCITS ETF Equities EUR 2,614,273 – – 2,614,273
PowerShares Global Water UCITS ETF Equities EUR 4,233,180 – – 4,233,180
PowerShares Global Agriculture UCITS ETF Equities USD 5,661,632 – – 5,661,632
PowerShares Global Buyback Achievers UCITS ETF Equities USD 90,171,332 – – 90,171,332
PowerShares FTSE RAFI Europe Mid-Small UCITS ETF Equities EUR 18,450,617 – – 18,450,617
PowerShares FTSE RAFI All-World 3000 UCITS ETF Equities USD 25,770,524 557 – 25,771,081
PowerShares FTSE RAFI Emerging Markets UCITS ETF Equities USD 12,329,659 8,200 – 12,337,859
PowerShares FTSE RAFI Europe UCITS ETF Equities EUR 7,355,415 – – 7,355,415
PowerShares EURO STOXX High Dividend Low Volatility UCITS ETF* Equities EUR 11,134,327 – – 11,134,327
PowerShares FTSE Emerging Markets High Dividend Low Volatility UCITS ETF** Equities USD 5,538,575 – – 5,538,575
PowerShares FTSE UK High Dividend Low Volatility UCITS ETF** Equities GBP 5,185,388 – – 5,185,388
PowerShares FTSE RAFI UK 100 UCITS ETF Equities GBP 7,539,587 – – 7,539,587
PowerShares EuroMTS Cash 3 Months UCITS ETF Bonds EUR – 23,025,604 – 23,025,604
PowerShares US High Yield Fallen Angels UCITS ETF*** Bonds USD – 25,509,146 – 25,509,146
* Fund launched on 6 January 2016. ** Fund launched on 27 May 2016. *** Fund launched on 1 September 2016.
Securities classified as Level 3 are those for which significant non observable inputs were used in their valuation at 30 September 2016 or they have become suspended or delisted from a stock exchange as a result of company specific reasons. Funds may also hold rights issues as a result of corporate actions. Rights issues are classified as Level 2. Securities may also be classified as Level 2 if the price of the security is stale due to a lack of trading activity.
Significant transfers between levels during the period There were no transfers between levels during the financial year.
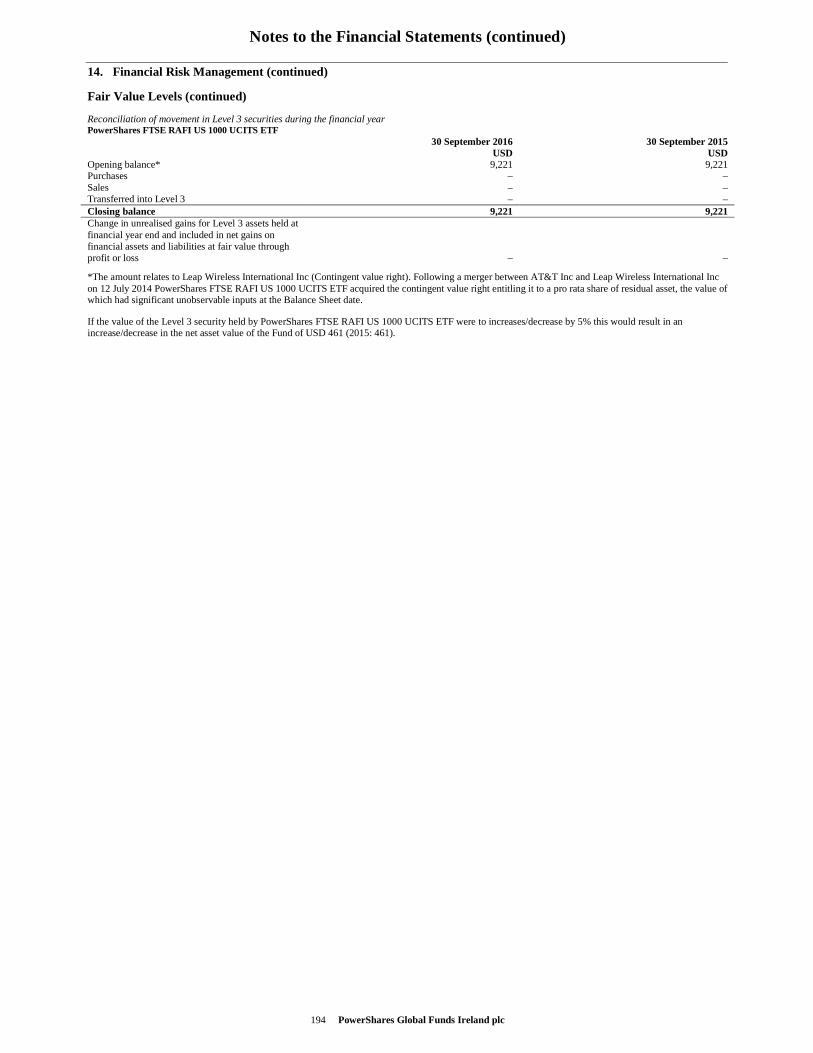
Notes to the Financial Statements (continued)
194 PowerShares Global Funds Ireland plc
14. Financial Risk Management (continued)
Fair Value Levels (continued)
Reconciliation of movement in Level 3 securities during the financial year PowerShares FTSE RAFI US 1000 UCITS ETF 30 September 2016
USD 30 September 2015
USD Opening balance* 9,221 9,221 Purchases – – Sales – – Transferred into Level 3 – – Closing balance 9,221 9,221 Change in unrealised gains for Level 3 assets held at financial year end and included in net gains on financial assets and liabilities at fair value through profit or loss – –
*The amount relates to Leap Wireless International Inc (Contingent value right). Following a merger between AT&T Inc and Leap Wireless International Inc on 12 July 2014 PowerShares FTSE RAFI US 1000 UCITS ETF acquired the contingent value right entitling it to a pro rata share of residual asset, the value of which had significant unobservable inputs at the Balance Sheet date.
If the value of the Level 3 security held by PowerShares FTSE RAFI US 1000 UCITS ETF were to increases/decrease by 5% this would result in an increase/decrease in the net asset value of the Fund of USD 461 (2015: 461).
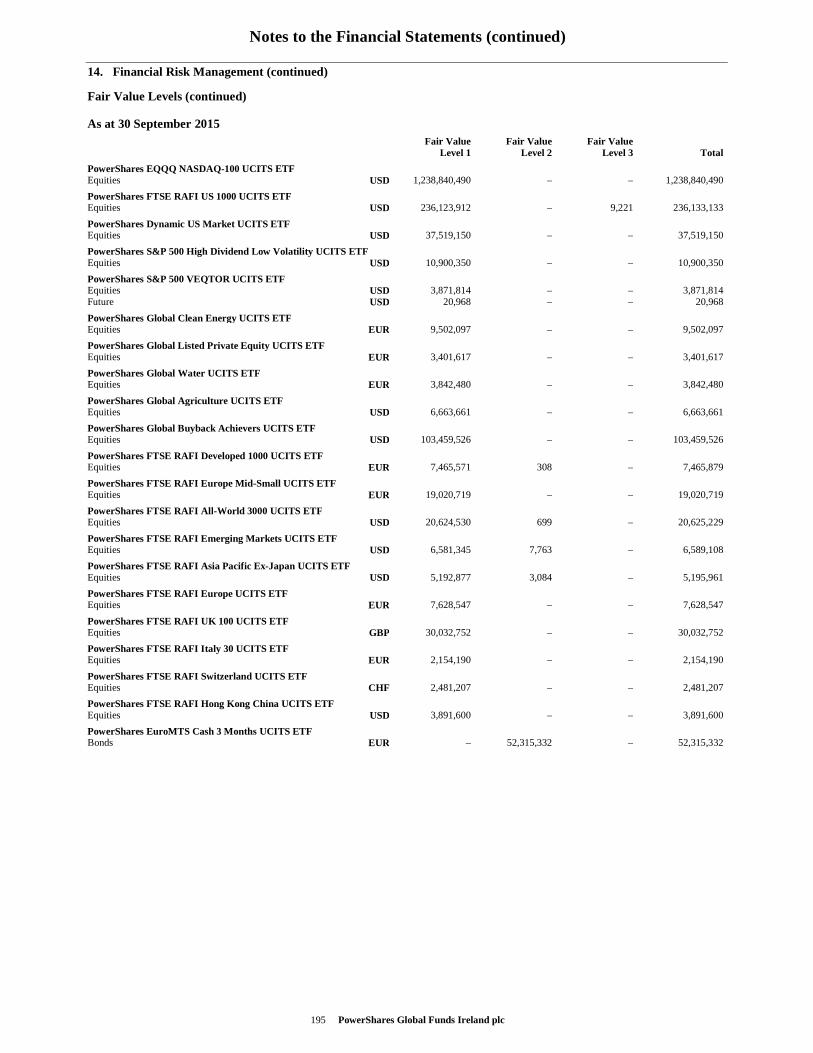
Notes to the Financial Statements (continued)
195 PowerShares Global Funds Ireland plc
14. Financial Risk Management (continued)
Fair Value Levels (continued)
As at 30 September 2015
Fair Value
Level 1Fair Value
Level 2Fair Value
Level 3 Total
PowerShares EQQQ NASDAQ-100 UCITS ETF Equities USD 1,238,840,490 – – 1,238,840,490
PowerShares FTSE RAFI US 1000 UCITS ETF Equities USD 236,123,912 – 9,221 236,133,133
PowerShares Dynamic US Market UCITS ETF Equities USD 37,519,150 – – 37,519,150
PowerShares S&P 500 High Dividend Low Volatility UCITS ETF Equities USD 10,900,350 – – 10,900,350
PowerShares S&P 500 VEQTOR UCITS ETF Equities USD 3,871,814 – – 3,871,814Future USD 20,968 – – 20,968
PowerShares Global Clean Energy UCITS ETF Equities EUR 9,502,097 – – 9,502,097
PowerShares Global Listed Private Equity UCITS ETF Equities EUR 3,401,617 – – 3,401,617
PowerShares Global Water UCITS ETF Equities EUR 3,842,480 – – 3,842,480
PowerShares Global Agriculture UCITS ETF Equities USD 6,663,661 – – 6,663,661
PowerShares Global Buyback Achievers UCITS ETF Equities USD 103,459,526 – – 103,459,526
PowerShares FTSE RAFI Developed 1000 UCITS ETF Equities EUR 7,465,571 308 – 7,465,879
PowerShares FTSE RAFI Europe Mid-Small UCITS ETF Equities EUR 19,020,719 – – 19,020,719
PowerShares FTSE RAFI All-World 3000 UCITS ETF Equities USD 20,624,530 699 – 20,625,229
PowerShares FTSE RAFI Emerging Markets UCITS ETF Equities USD 6,581,345 7,763 – 6,589,108
PowerShares FTSE RAFI Asia Pacific Ex-Japan UCITS ETF Equities USD 5,192,877 3,084 – 5,195,961
PowerShares FTSE RAFI Europe UCITS ETF Equities EUR 7,628,547 – – 7,628,547
PowerShares FTSE RAFI UK 100 UCITS ETF Equities GBP 30,032,752 – – 30,032,752
PowerShares FTSE RAFI Italy 30 UCITS ETF Equities EUR 2,154,190 – – 2,154,190
PowerShares FTSE RAFI Switzerland UCITS ETF Equities CHF 2,481,207 – – 2,481,207
PowerShares FTSE RAFI Hong Kong China UCITS ETF Equities USD 3,891,600 – – 3,891,600
PowerShares EuroMTS Cash 3 Months UCITS ETF Bonds EUR – 52,315,332 – 52,315,332
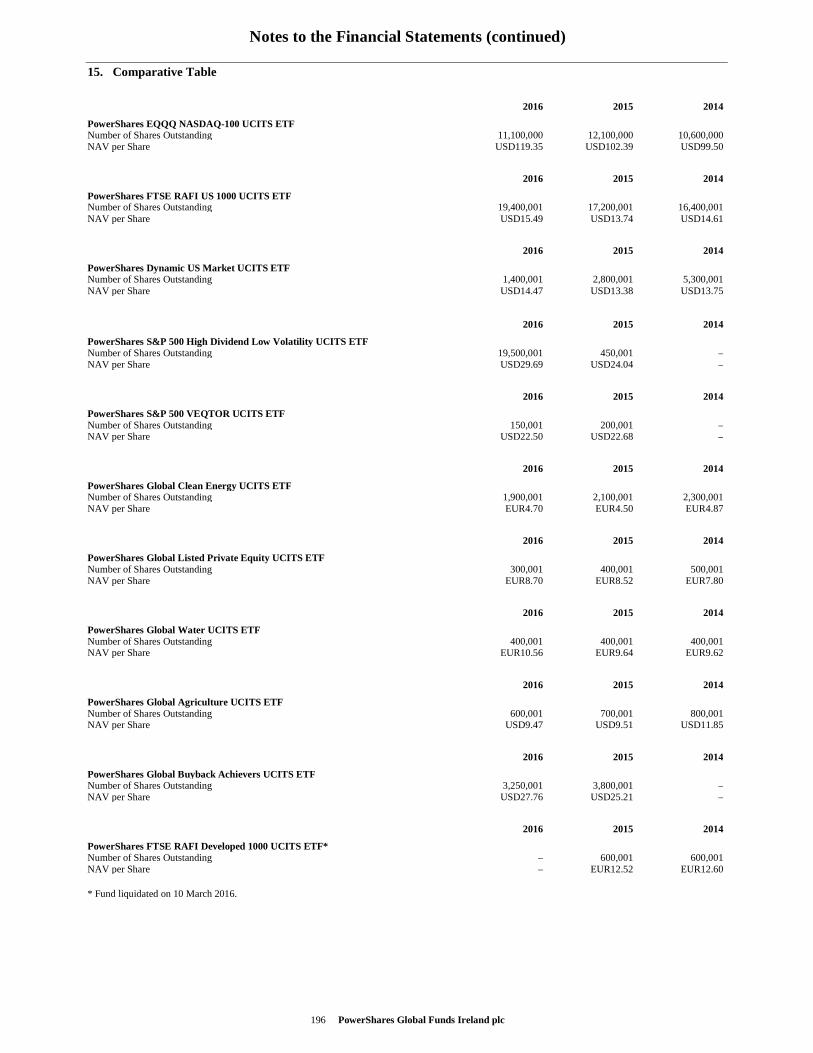
Notes to the Financial Statements (continued)
196 PowerShares Global Funds Ireland plc
15. Comparative Table
2016 2015 2014
PowerShares EQQQ NASDAQ-100 UCITS ETF Number of Shares Outstanding 11,100,000 12,100,000 10,600,000NAV per Share USD119.35 USD102.39 USD99.50
2016 2015 2014
PowerShares FTSE RAFI US 1000 UCITS ETF Number of Shares Outstanding 19,400,001 17,200,001 16,400,001NAV per Share USD15.49 USD13.74 USD14.61
2016 2015 2014
PowerShares Dynamic US Market UCITS ETF Number of Shares Outstanding 1,400,001 2,800,001 5,300,001NAV per Share USD14.47 USD13.38 USD13.75
2016 2015 2014
PowerShares S&P 500 High Dividend Low Volatility UCITS ETF Number of Shares Outstanding 19,500,001 450,001 –NAV per Share USD29.69 USD24.04 –
2016 2015 2014
PowerShares S&P 500 VEQTOR UCITS ETF Number of Shares Outstanding 150,001 200,001 –NAV per Share USD22.50 USD22.68 –
2016 2015 2014
PowerShares Global Clean Energy UCITS ETF Number of Shares Outstanding 1,900,001 2,100,001 2,300,001NAV per Share EUR4.70 EUR4.50 EUR4.87
2016 2015 2014
PowerShares Global Listed Private Equity UCITS ETF Number of Shares Outstanding 300,001 400,001 500,001NAV per Share EUR8.70 EUR8.52 EUR7.80
2016 2015 2014
PowerShares Global Water UCITS ETF Number of Shares Outstanding 400,001 400,001 400,001NAV per Share EUR10.56 EUR9.64 EUR9.62
2016 2015 2014
PowerShares Global Agriculture UCITS ETF Number of Shares Outstanding 600,001 700,001 800,001NAV per Share USD9.47 USD9.51 USD11.85
2016 2015 2014
PowerShares Global Buyback Achievers UCITS ETF Number of Shares Outstanding 3,250,001 3,800,001 –NAV per Share USD27.76 USD25.21 –
2016 2015 2014
PowerShares FTSE RAFI Developed 1000 UCITS ETF* Number of Shares Outstanding – 600,001 600,001NAV per Share – EUR12.52 EUR12.60
* Fund liquidated on 10 March 2016.
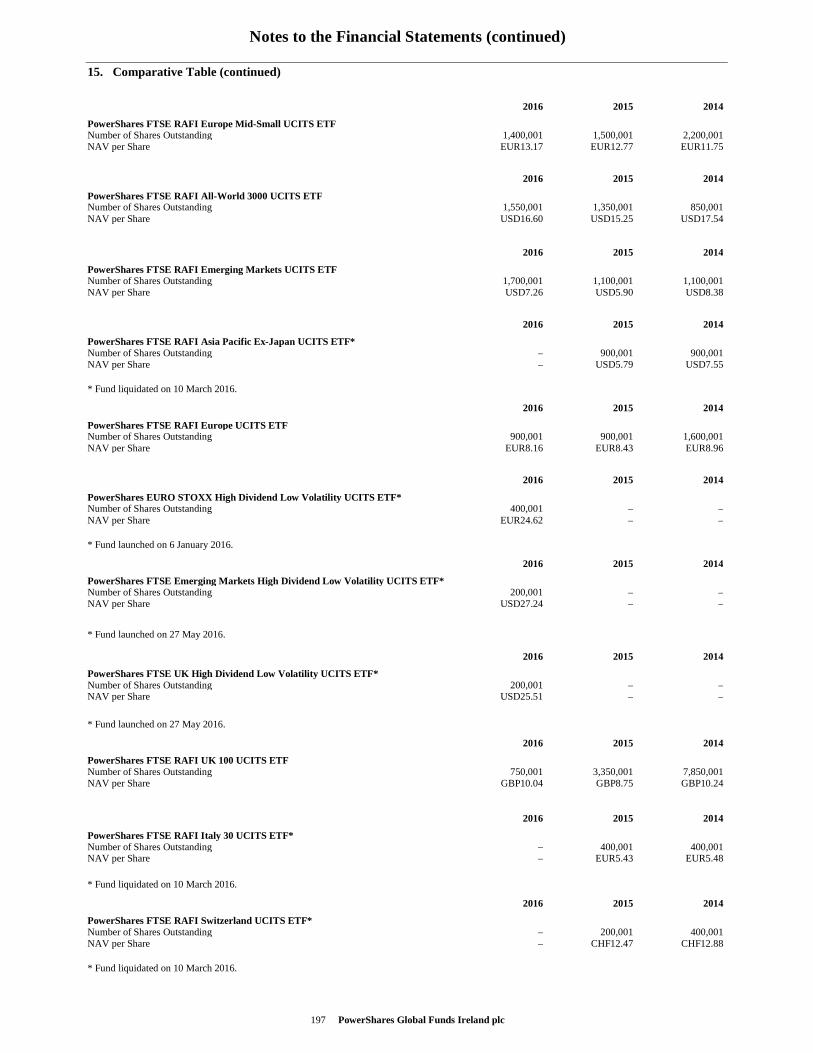
Notes to the Financial Statements (continued)
197 PowerShares Global Funds Ireland plc
15. Comparative Table (continued)
2016 2015 2014
PowerShares FTSE RAFI Europe Mid-Small UCITS ETF Number of Shares Outstanding 1,400,001 1,500,001 2,200,001NAV per Share EUR13.17 EUR12.77 EUR11.75
2016 2015 2014
PowerShares FTSE RAFI All-World 3000 UCITS ETF Number of Shares Outstanding 1,550,001 1,350,001 850,001NAV per Share USD16.60 USD15.25 USD17.54
2016 2015 2014
PowerShares FTSE RAFI Emerging Markets UCITS ETF Number of Shares Outstanding 1,700,001 1,100,001 1,100,001NAV per Share USD7.26 USD5.90 USD8.38
2016 2015 2014
PowerShares FTSE RAFI Asia Pacific Ex-Japan UCITS ETF* Number of Shares Outstanding – 900,001 900,001NAV per Share – USD5.79 USD7.55
* Fund liquidated on 10 March 2016.
2016 2015 2014
PowerShares FTSE RAFI Europe UCITS ETF Number of Shares Outstanding 900,001 900,001 1,600,001NAV per Share EUR8.16 EUR8.43 EUR8.96
2016 2015 2014
PowerShares EURO STOXX High Dividend Low Volatility UCITS ETF* Number of Shares Outstanding 400,001 – –NAV per Share EUR24.62 – –
* Fund launched on 6 January 2016.
2016 2015 2014
PowerShares FTSE Emerging Markets High Dividend Low Volatility UCITS ETF* Number of Shares Outstanding 200,001 – –NAV per Share USD27.24 – –
* Fund launched on 27 May 2016.
2016 2015 2014
PowerShares FTSE UK High Dividend Low Volatility UCITS ETF* Number of Shares Outstanding 200,001 – –NAV per Share USD25.51 – –
* Fund launched on 27 May 2016.
2016 2015 2014
PowerShares FTSE RAFI UK 100 UCITS ETF Number of Shares Outstanding 750,001 3,350,001 7,850,001NAV per Share GBP10.04 GBP8.75 GBP10.24
2016 2015 2014
PowerShares FTSE RAFI Italy 30 UCITS ETF* Number of Shares Outstanding – 400,001 400,001NAV per Share – EUR5.43 EUR5.48
* Fund liquidated on 10 March 2016.
2016 2015 2014
PowerShares FTSE RAFI Switzerland UCITS ETF* Number of Shares Outstanding – 200,001 400,001NAV per Share – CHF12.47 CHF12.88
* Fund liquidated on 10 March 2016.
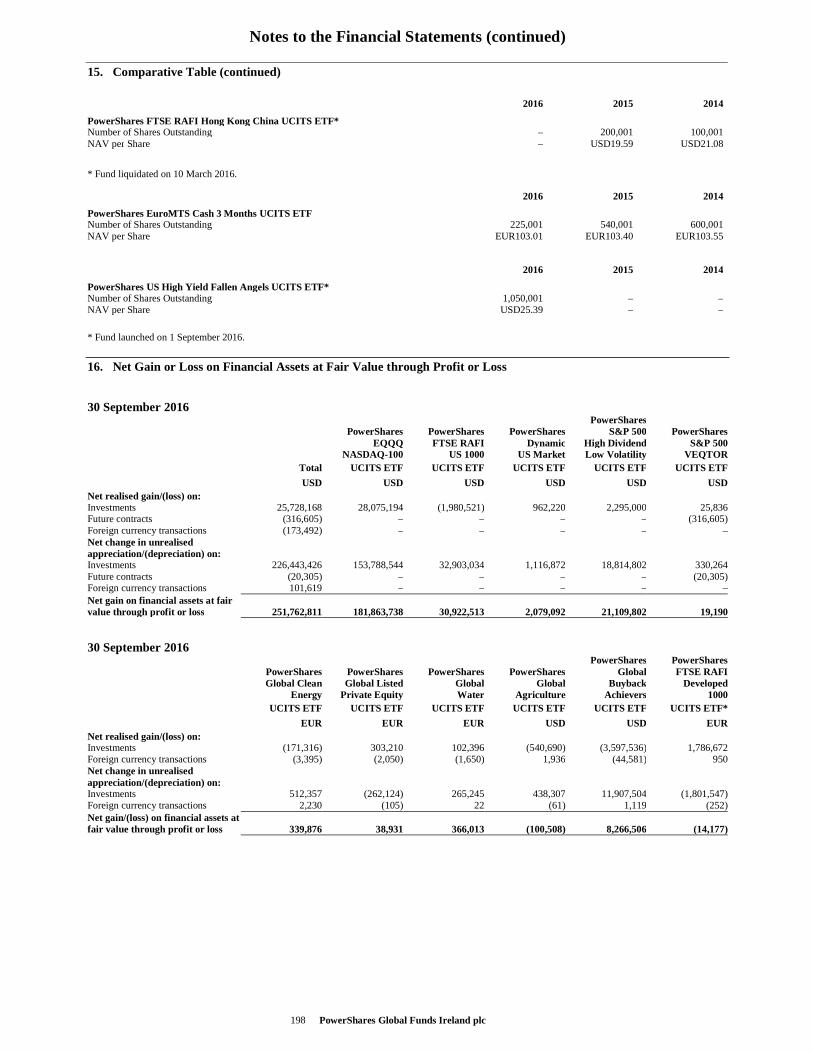
Notes to the Financial Statements (continued)
PowerShares Global Funds Ireland plc 198
15. Comparative Table (continued)
2016 2015 2014
PowerShares FTSE RAFI Hong Kong China UCITS ETF* Number of Shares Outstanding – 200,001 100,001NAV per Share – USD19.59 USD21.08
* Fund liquidated on 10 March 2016.
2016 2015 2014
PowerShares EuroMTS Cash 3 Months UCITS ETF Number of Shares Outstanding 225,001 540,001 600,001NAV per Share EUR103.01 EUR103.40 EUR103.55
2016 2015 2014
PowerShares US High Yield Fallen Angels UCITS ETF* Number of Shares Outstanding 1,050,001 – –NAV per Share USD25.39 – –
* Fund launched on 1 September 2016. 16. Net Gain or Loss on Financial Assets at Fair Value through Profit or Loss
30 September 2016 0 PowerShares 0 PowerShares PowerShares PowerShares S&P 500 PowerShares0 EQQQ FTSE RAFI Dynamic High Dividend S&P 5000 NASDAQ-100 US 1000 US Market Low Volatility VEQTOR0 Total UCITS ETF UCITS ETF UCITS ETF UCITS ETF UCITS ETF
0 USD USD USD USD USD USDNet realised gain/(loss) on: Investments 25,728,168 28,075,194 (1,980,521) 962,220 2,295,000 25,836Future contracts (316,605) – – – – (316,605)Foreign currency transactions (173,492) – – – – –Net change in unrealised appreciation/(depreciation) on: Investments 226,443,426 153,788,544 32,903,034 1,116,872 18,814,802 330,264Future contracts (20,305) – – – – (20,305)Foreign currency transactions 101,619 – – – – –Net gain on financial assets at fair value through profit or loss 251,762,811 181,863,738 30,922,513 2,079,092 21,109,802 19,190
30 September 2016 0 PowerShares PowerShares0 PowerShares PowerShares PowerShares PowerShares Global FTSE RAFI0 Global Clean Global Listed Global Global Buyback Developed0 Energy Private Equity Water Agriculture Achievers 10000 UCITS ETF UCITS ETF UCITS ETF UCITS ETF UCITS ETF UCITS ETF*
0 EUR EUR EUR USD USD EURNet realised gain/(loss) on: Investments (171,316) 303,210 102,396 (540,690) (3,597,536) 1,786,672Foreign currency transactions (3,395) (2,050) (1,650) 1,936 (44,581) 950Net change in unrealised appreciation/(depreciation) on: Investments 512,357 (262,124) 265,245 438,307 11,907,504 (1,801,547)Foreign currency transactions 2,230 (105) 22 (61) 1,119 (252)Net gain/(loss) on financial assets at fair value through profit or loss 339,876 38,931 366,013 (100,508) 8,266,506 (14,177)
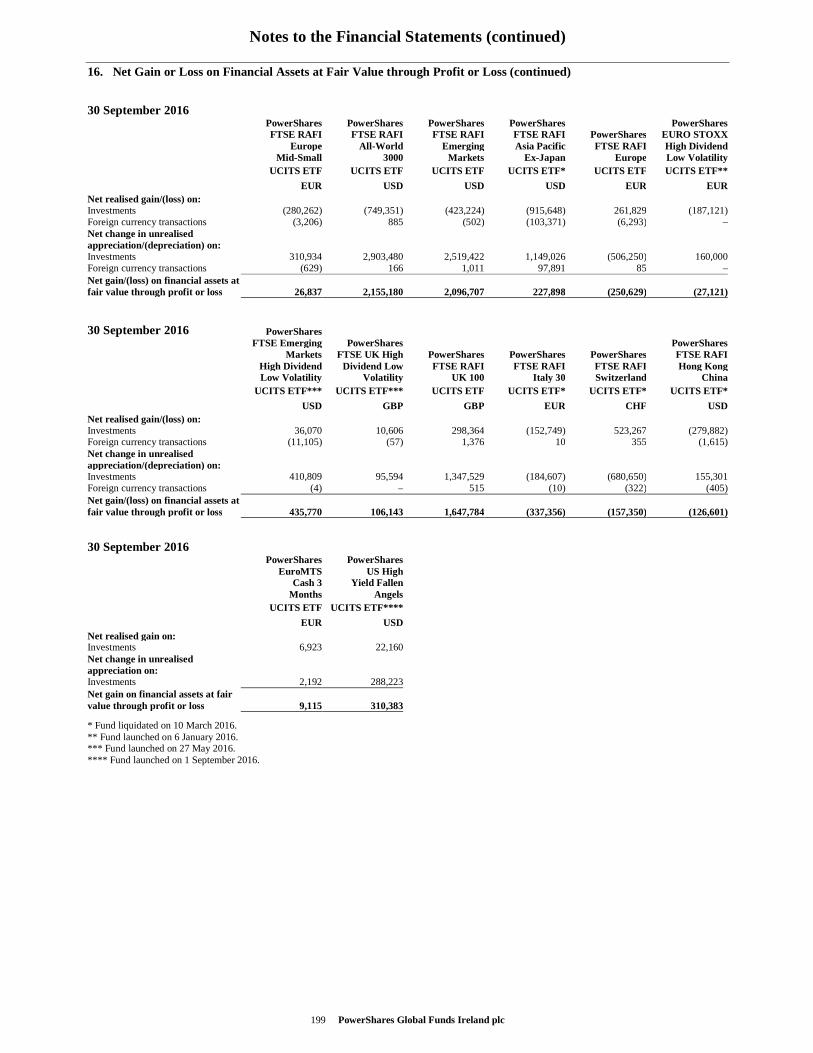
Notes to the Financial Statements (continued)
199 PowerShares Global Funds Ireland plc
16. Net Gain or Loss on Financial Assets at Fair Value through Profit or Loss (continued)
30 September 2016 0 PowerShares PowerShares PowerShares PowerShares PowerShares0 FTSE RAFI FTSE RAFI FTSE RAFI FTSE RAFI PowerShares EURO STOXX0 Europe All- World Emerging Asia Pacific FTSE RAFI High Dividend0 Mid- Small 3000 Markets Ex-Japan Europe Low Volatility0 UCITS ETF UCITS ETF UCITS ETF UCITS ETF* UCITS ETF UCITS ETF**
0 EUR USD USD USD EUR EURNet realised gain/(loss) on: Investments (280,262) (749,351) (423,224) (915,648) 261,829 (187,121)Foreign currency transactions (3,206) 885 (502) (103,371) (6,293) –Net change in unrealised appreciation/(depreciation) on: Investments 310,934 2,903,480 2,519,422 1,149,026 (506,250) 160,000Foreign currency transactions (629) 166 1,011 97,891 85 –Net gain/(loss) on financial assets at fair value through profit or loss 26,837 2,155,180 2,096,707 227,898 (250,629) (27,121)
30 September 2016 PowerShares 0 FTSE Emerging PowerShares PowerShares0 Markets FTSE UK High PowerShares PowerShares PowerShares FTSE RAFI0 High Dividend Dividend Low FTSE RAFI FTSE RAFI FTSE RAFI Hong Kong0 Low Volatility Volatility UK 100 Italy 30 Switzerland China0 UCITS ETF*** UCITS ETF*** UCITS ETF UCITS ETF* UCITS ETF* UCITS ETF*
0 USD GBP GBP EUR CHF USDNet realised gain/(loss) on: Investments 36,070 10,606 298,364 (152,749) 523,267 (279,882)Foreign currency transactions (11,105) (57) 1,376 10 355 (1,615)Net change in unrealised appreciation/(depreciation) on: Investments 410,809 95,594 1,347,529 (184,607) (680,650) 155,301Foreign currency transactions (4) – 515 (10) (322) (405)Net gain/(loss) on financial assets at fair value through profit or loss 435,770 106,143 1,647,784 (337,356) (157,350) (126,601)
30 September 2016 0 PowerShares PowerShares0 EuroMTS US High0 Cash 3 Yield Fallen0 Months Angels0 UCITS ETF UCITS ETF****
0 EUR USDNet realised gain on: Investments 6,923 22,160Net change in unrealised appreciation on: Investments 2,192 288,223Net gain on financial assets at fair value through profit or loss 9,115 310,383
* Fund liquidated on 10 March 2016. ** Fund launched on 6 January 2016. *** Fund launched on 27 May 2016. **** Fund launched on 1 September 2016.
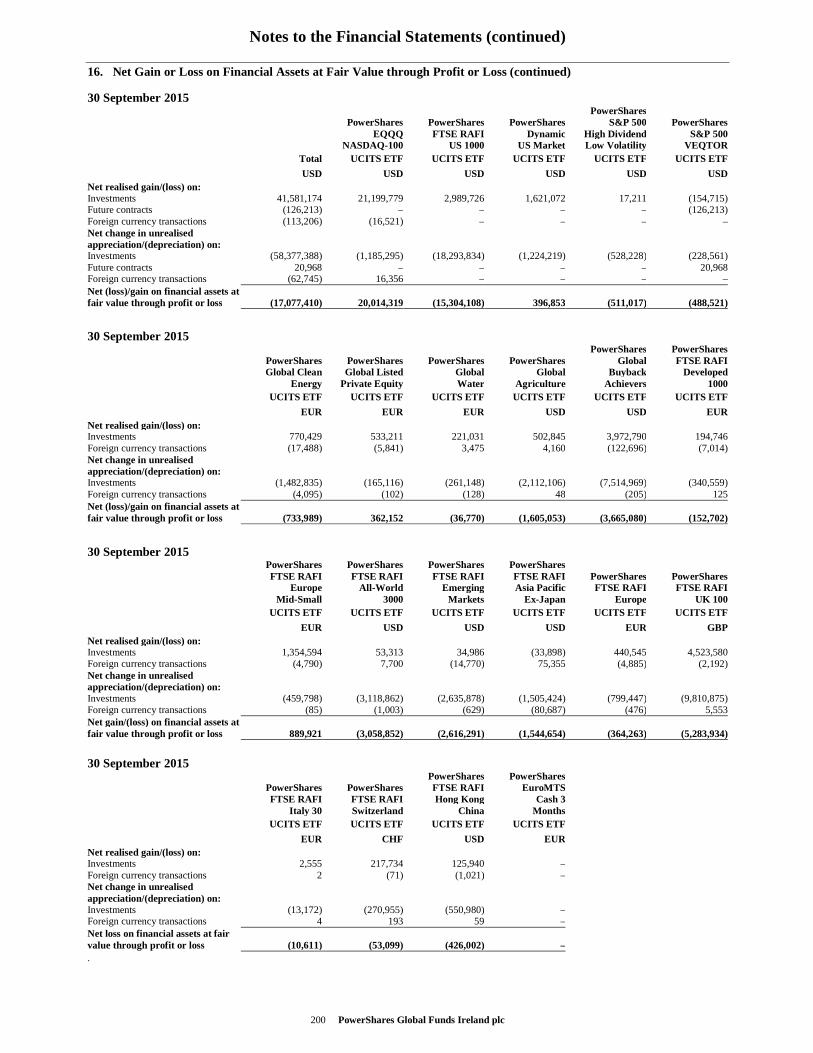
Notes to the Financial Statements (continued)
200 PowerShares Global Funds Ireland plc
16. Net Gain or Loss on Financial Assets at Fair Value through Profit or Loss (continued)
30 September 2015 0 PowerShares 0 PowerShares PowerShares PowerShares S&P 500 PowerShares0 EQQQ FTSE RAFI Dynamic High Dividend S&P 5000 NASDAQ-100 US 1000 US Market Low Volatility VEQTOR0 Total UCITS ETF UCITS ETF UCITS ETF UCITS ETF UCITS ETF
0 USD USD USD USD USD USDNet realised gain/(loss) on: Investments 41,581,174 21,199,779 2,989,726 1,621,072 17,211 (154,715)Future contracts (126,213) – – – – (126,213)Foreign currency transactions (113,206) (16,521) – – – –Net change in unrealised appreciation/(depreciation) on: Investments (58,377,388) (1,185,295) (18,293,834) (1,224,219) (528,228) (228,561)Future contracts 20,968 – – – – 20,968Foreign currency transactions (62,745) 16,356 – – – –Net (loss)/gain on financial assets at fair value through profit or loss (17,077,410) 20,014,319 (15,304,108) 396,853 (511,017) (488,521)
30 September 2015 0 PowerShares PowerShares0 PowerShares PowerShares PowerShares PowerShares Global FTSE RAFI0 Global Clean Global Listed Global Global Buyback Developed0 Energy Private Equity Water Agriculture Achievers 10000 UCITS ETF UCITS ETF UCITS ETF UCITS ETF UCITS ETF UCITS ETF
0 EUR EUR EUR USD USD EURNet realised gain/(loss) on: Investments 770,429 533,211 221,031 502,845 3,972,790 194,746Foreign currency transactions (17,488) (5,841) 3,475 4,160 (122,696) (7,014)Net change in unrealised appreciation/(depreciation) on: Investments (1,482,835) (165,116) (261,148) (2,112,106) (7,514,969) (340,559)Foreign currency transactions (4,095) (102) (128) 48 (205) 125Net (loss)/gain on financial assets at fair value through profit or loss (733,989) 362,152 (36,770) (1,605,053) (3,665,080) (152,702)
30 September 2015 0 PowerShares PowerShares PowerShares PowerShares 0 FTSE RAFI FTSE RAFI FTSE RAFI FTSE RAFI PowerShares PowerShares0 Europe All- World Emerging Asia Pacific FTSE RAFI FTSE RAFI0 Mid- Small 3000 Markets Ex-Japan Europe UK 1000 UCITS ETF UCITS ETF UCITS ETF UCITS ETF UCITS ETF UCITS ETF
0 EUR USD USD USD EUR GBPNet realised gain/(loss) on: Investments 1,354,594 53,313 34,986 (33,898) 440,545 4,523,580Foreign currency transactions (4,790) 7,700 (14,770) 75,355 (4,885) (2,192)Net change in unrealised appreciation/(depreciation) on: Investments (459,798) (3,118,862) (2,635,878) (1,505,424) (799,447) (9,810,875)Foreign currency transactions (85) (1,003) (629) (80,687) (476) 5,553Net gain/(loss) on financial assets at fair value through profit or loss 889,921 (3,058,852) (2,616,291) (1,544,654) (364,263) (5,283,934)
30 September 2015 0 PowerShares PowerShares0 PowerShares PowerShares FTSE RAFI EuroMTS0 FTSE RAFI FTSE RAFI Hong Kong Cash 30 Italy 30 Switzerland China Months0 UCITS ETF UCITS ETF UCITS ETF UCITS ETF
0 EUR CHF USD EURNet realised gain/(loss) on: Investments 2,555 217,734 125,940 –Foreign currency transactions 2 (71) (1,021) –Net change in unrealised appreciation/(depreciation) on: Investments (13,172) (270,955) (550,980) –Foreign currency transactions 4 193 59 –Net loss on financial assets at fair value through profit or loss (10,611) (53,099) (426,002) –
.
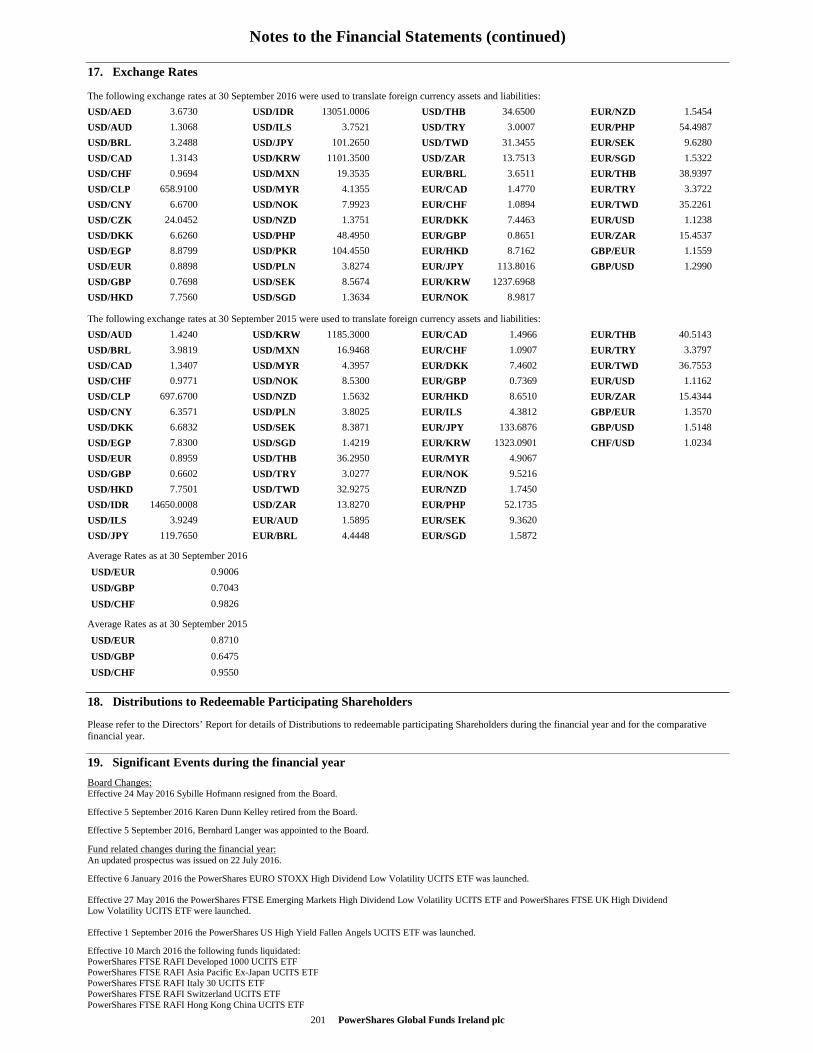
Notes to the Financial Statements (continued)
201 PowerShares Global Funds Ireland plc
17. Exchange Rates The following exchange rates at 30 September 2016 were used to translate foreign currency assets and liabilities:
USD/AED 3.6730 USD/IDR 13051.0006 USD/THB 34.6500 EUR/NZD 1.5454
USD/AUD 1.3068 USD/ILS 3.7521 USD/TRY 3.0007 EUR/PHP 54.4987
USD/BRL 3.2488 USD/JPY 101.2650 USD/TWD 31.3455 EUR/SEK 9.6280
USD/CAD 1.3143 USD/KRW 1101.3500 USD/ZAR 13.7513 EUR/SGD 1.5322
USD/CHF 0.9694 USD/MXN 19.3535 EUR/BRL 3.6511 EUR/THB 38.9397
USD/CLP 658.9100 USD/MYR 4.1355 EUR/CAD 1.4770 EUR/TRY 3.3722
USD/CNY 6.6700 USD/NOK 7.9923 EUR/CHF 1.0894 EUR/TWD 35.2261
USD/CZK 24.0452 USD/NZD 1.3751 EUR/DKK 7.4463 EUR/USD 1.1238
USD/DKK 6.6260 USD/PHP 48.4950 EUR/GBP 0.8651 EUR/ZAR 15.4537
USD/EGP 8.8799 USD/PKR 104.4550 EUR/HKD 8.7162 GBP/EUR 1.1559
USD/EUR 0.8898 USD/PLN 3.8274 EUR/JPY 113.8016 GBP/USD 1.2990
USD/GBP 0.7698 USD/SEK 8.5674 EUR/KRW 1237.6968
USD/HKD 7.7560 USD/SGD 1.3634 EUR/NOK 8.9817
The following exchange rates at 30 September 2015 were used to translate foreign currency assets and liabilities:
USD/AUD 1.4240 USD/KRW 1185.3000 EUR/CAD 1.4966 EUR/THB 40.5143
USD/BRL 3.9819 USD/MXN 16.9468 EUR/CHF 1.0907 EUR/TRY 3.3797
USD/CAD 1.3407 USD/MYR 4.3957 EUR/DKK 7.4602 EUR/TWD 36.7553
USD/CHF 0.9771 USD/NOK 8.5300 EUR/GBP 0.7369 EUR/USD 1.1162
USD/CLP 697.6700 USD/NZD 1.5632 EUR/HKD 8.6510 EUR/ZAR 15.4344
USD/CNY 6.3571 USD/PLN 3.8025 EUR/ILS 4.3812 GBP/EUR 1.3570
USD/DKK 6.6832 USD/SEK 8.3871 EUR/JPY 133.6876 GBP/USD 1.5148
USD/EGP 7.8300 USD/SGD 1.4219 EUR/KRW 1323.0901 CHF/USD 1.0234
USD/EUR 0.8959 USD/THB 36.2950 EUR/MYR 4.9067
USD/GBP 0.6602 USD/TRY 3.0277 EUR/NOK 9.5216
USD/HKD 7.7501 USD/TWD 32.9275 EUR/NZD 1.7450
USD/IDR 14650.0008 USD/ZAR 13.8270 EUR/PHP 52.1735
USD/ILS 3.9249 EUR/AUD 1.5895 EUR/SEK 9.3620
USD/JPY 119.7650 EUR/BRL 4.4448 EUR/SGD 1.5872
Average Rates as at 30 September 2016
USD/EUR 0.9006
USD/GBP 0.7043
USD/CHF 0.9826
Average Rates as at 30 September 2015
USD/EUR 0.8710
USD/GBP 0.6475
USD/CHF 0.9550 18. Distributions to Redeemable Participating Shareholders
Please refer to the Directors’ Report for details of Distributions to redeemable participating Shareholders during the financial year and for the comparative financial year.
19. Significant Events during the financial year
Board Changes: Effective 24 May 2016 Sybille Hofmann resigned from the Board.
Effective 5 September 2016 Karen Dunn Kelley retired from the Board.
Effective 5 September 2016, Bernhard Langer was appointed to the Board.
Fund related changes during the financial year: An updated prospectus was issued on 22 July 2016.
Effective 6 January 2016 the PowerShares EURO STOXX High Dividend Low Volatility UCITS ETF was launched. Effective 27 May 2016 the PowerShares FTSE Emerging Markets High Dividend Low Volatility UCITS ETF and PowerShares FTSE UK High Dividend Low Volatility UCITS ETF were launched. Effective 1 September 2016 the PowerShares US High Yield Fallen Angels UCITS ETF was launched.
Effective 10 March 2016 the following funds liquidated: PowerShares FTSE RAFI Developed 1000 UCITS ETF PowerShares FTSE RAFI Asia Pacific Ex-Japan UCITS ETF PowerShares FTSE RAFI Italy 30 UCITS ETF PowerShares FTSE RAFI Switzerland UCITS ETF PowerShares FTSE RAFI Hong Kong China UCITS ETF
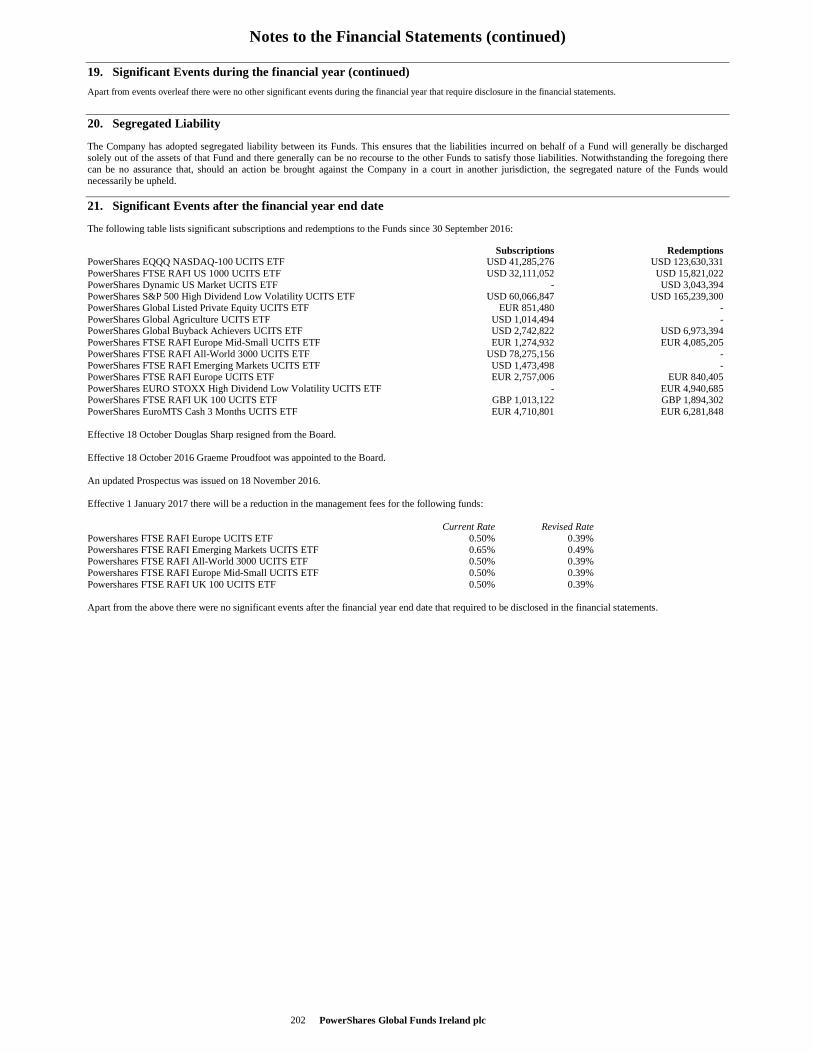
Notes to the Financial Statements (continued)
PowerShares Global Funds Ireland plc 202
19. Significant Events during the financial year (continued)
Apart from events overleaf there were no other significant events during the financial year that require disclosure in the financial statements.
20. Segregated Liability
The Company has adopted segregated liability between its Funds. This ensures that the liabilities incurred on behalf of a Fund will generally be discharged solely out of the assets of that Fund and there generally can be no recourse to the other Funds to satisfy those liabilities. Notwithstanding the foregoing there can be no assurance that, should an action be brought against the Company in a court in another jurisdiction, the segregated nature of the Funds would necessarily be upheld.
21. Significant Events after the financial year end date
The following table lists significant subscriptions and redemptions to the Funds since 30 September 2016:
Subscriptions Redemptions PowerShares EQQQ NASDAQ-100 UCITS ETF USD 41,285,276 USD 123,630,331 PowerShares FTSE RAFI US 1000 UCITS ETF USD 32,111,052 USD 15,821,022 PowerShares Dynamic US Market UCITS ETF - USD 3,043,394 PowerShares S&P 500 High Dividend Low Volatility UCITS ETF USD 60,066,847 USD 165,239,300 PowerShares Global Listed Private Equity UCITS ETF EUR 851,480 - PowerShares Global Agriculture UCITS ETF USD 1,014,494 - PowerShares Global Buyback Achievers UCITS ETF USD 2,742,822 USD 6,973,394 PowerShares FTSE RAFI Europe Mid-Small UCITS ETF EUR 1,274,932 EUR 4,085,205 PowerShares FTSE RAFI All-World 3000 UCITS ETF USD 78,275,156 - PowerShares FTSE RAFI Emerging Markets UCITS ETF USD 1,473,498 - PowerShares FTSE RAFI Europe UCITS ETF EUR 2,757,006 EUR 840,405 PowerShares EURO STOXX High Dividend Low Volatility UCITS ETF - EUR 4,940,685 PowerShares FTSE RAFI UK 100 UCITS ETF GBP 1,013,122 GBP 1,894,302 PowerShares EuroMTS Cash 3 Months UCITS ETF EUR 4,710,801 EUR 6,281,848 Effective 18 October Douglas Sharp resigned from the Board. Effective 18 October 2016 Graeme Proudfoot was appointed to the Board. An updated Prospectus was issued on 18 November 2016. Effective 1 January 2017 there will be a reduction in the management fees for the following funds: Current Rate Revised Rate Powershares FTSE RAFI Europe UCITS ETF 0.50% 0.39% Powershares FTSE RAFI Emerging Markets UCITS ETF 0.65% 0.49% Powershares FTSE RAFI All-World 3000 UCITS ETF 0.50% 0.39% Powershares FTSE RAFI Europe Mid-Small UCITS ETF 0.50% 0.39% Powershares FTSE RAFI UK 100 UCITS ETF 0.50% 0.39% Apart from the above there were no significant events after the financial year end date that required to be disclosed in the financial statements.
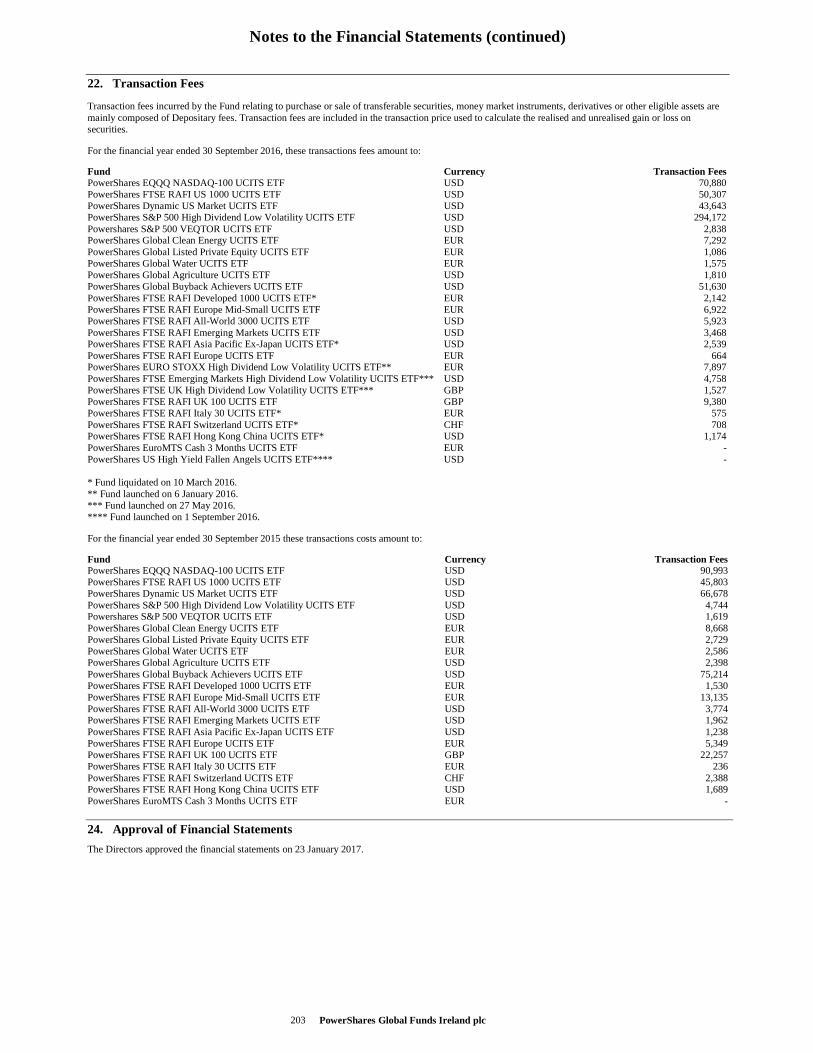
Notes to the Financial Statements (continued)
PowerShares Global Funds Ireland plc 203
22. Transaction Fees
Transaction fees incurred by the Fund relating to purchase or sale of transferable securities, money market instruments, derivatives or other eligible assets are mainly composed of Depositary fees. Transaction fees are included in the transaction price used to calculate the realised and unrealised gain or loss on securities.
For the financial year ended 30 September 2016, these transactions fees amount to:
Fund Currency Transaction Fees PowerShares EQQQ NASDAQ-100 UCITS ETF USD 70,880 PowerShares FTSE RAFI US 1000 UCITS ETF USD 50,307 PowerShares Dynamic US Market UCITS ETF USD 43,643 PowerShares S&P 500 High Dividend Low Volatility UCITS ETF USD 294,172 Powershares S&P 500 VEQTOR UCITS ETF USD 2,838 PowerShares Global Clean Energy UCITS ETF EUR 7,292 PowerShares Global Listed Private Equity UCITS ETF EUR 1,086 PowerShares Global Water UCITS ETF EUR 1,575 PowerShares Global Agriculture UCITS ETF USD 1,810 PowerShares Global Buyback Achievers UCITS ETF USD 51,630 PowerShares FTSE RAFI Developed 1000 UCITS ETF* EUR 2,142 PowerShares FTSE RAFI Europe Mid-Small UCITS ETF EUR 6,922 PowerShares FTSE RAFI All-World 3000 UCITS ETF USD 5,923 PowerShares FTSE RAFI Emerging Markets UCITS ETF USD 3,468 PowerShares FTSE RAFI Asia Pacific Ex-Japan UCITS ETF* USD 2,539 PowerShares FTSE RAFI Europe UCITS ETF EUR 664 PowerShares EURO STOXX High Dividend Low Volatility UCITS ETF** EUR 7,897 PowerShares FTSE Emerging Markets High Dividend Low Volatility UCITS ETF*** USD 4,758 PowerShares FTSE UK High Dividend Low Volatility UCITS ETF*** GBP 1,527 PowerShares FTSE RAFI UK 100 UCITS ETF GBP 9,380 PowerShares FTSE RAFI Italy 30 UCITS ETF* EUR 575 PowerShares FTSE RAFI Switzerland UCITS ETF* CHF 708 PowerShares FTSE RAFI Hong Kong China UCITS ETF* USD 1,174 PowerShares EuroMTS Cash 3 Months UCITS ETF EUR - PowerShares US High Yield Fallen Angels UCITS ETF**** USD - * Fund liquidated on 10 March 2016. ** Fund launched on 6 January 2016. *** Fund launched on 27 May 2016. **** Fund launched on 1 September 2016.
For the financial year ended 30 September 2015 these transactions costs amount to:
Fund Currency Transaction Fees PowerShares EQQQ NASDAQ-100 UCITS ETF USD 90,993 PowerShares FTSE RAFI US 1000 UCITS ETF USD 45,803 PowerShares Dynamic US Market UCITS ETF USD 66,678 PowerShares S&P 500 High Dividend Low Volatility UCITS ETF USD 4,744 Powershares S&P 500 VEQTOR UCITS ETF USD 1,619 PowerShares Global Clean Energy UCITS ETF EUR 8,668 PowerShares Global Listed Private Equity UCITS ETF EUR 2,729 PowerShares Global Water UCITS ETF EUR 2,586 PowerShares Global Agriculture UCITS ETF USD 2,398 PowerShares Global Buyback Achievers UCITS ETF USD 75,214 PowerShares FTSE RAFI Developed 1000 UCITS ETF EUR 1,530 PowerShares FTSE RAFI Europe Mid-Small UCITS ETF EUR 13,135 PowerShares FTSE RAFI All-World 3000 UCITS ETF USD 3,774 PowerShares FTSE RAFI Emerging Markets UCITS ETF USD 1,962 PowerShares FTSE RAFI Asia Pacific Ex-Japan UCITS ETF USD 1,238 PowerShares FTSE RAFI Europe UCITS ETF EUR 5,349 PowerShares FTSE RAFI UK 100 UCITS ETF GBP 22,257 PowerShares FTSE RAFI Italy 30 UCITS ETF EUR 236 PowerShares FTSE RAFI Switzerland UCITS ETF CHF 2,388 PowerShares FTSE RAFI Hong Kong China UCITS ETF USD 1,689 PowerShares EuroMTS Cash 3 Months UCITS ETF EUR -
24. Approval of Financial Statements
The Directors approved the financial statements on 23 January 2017.
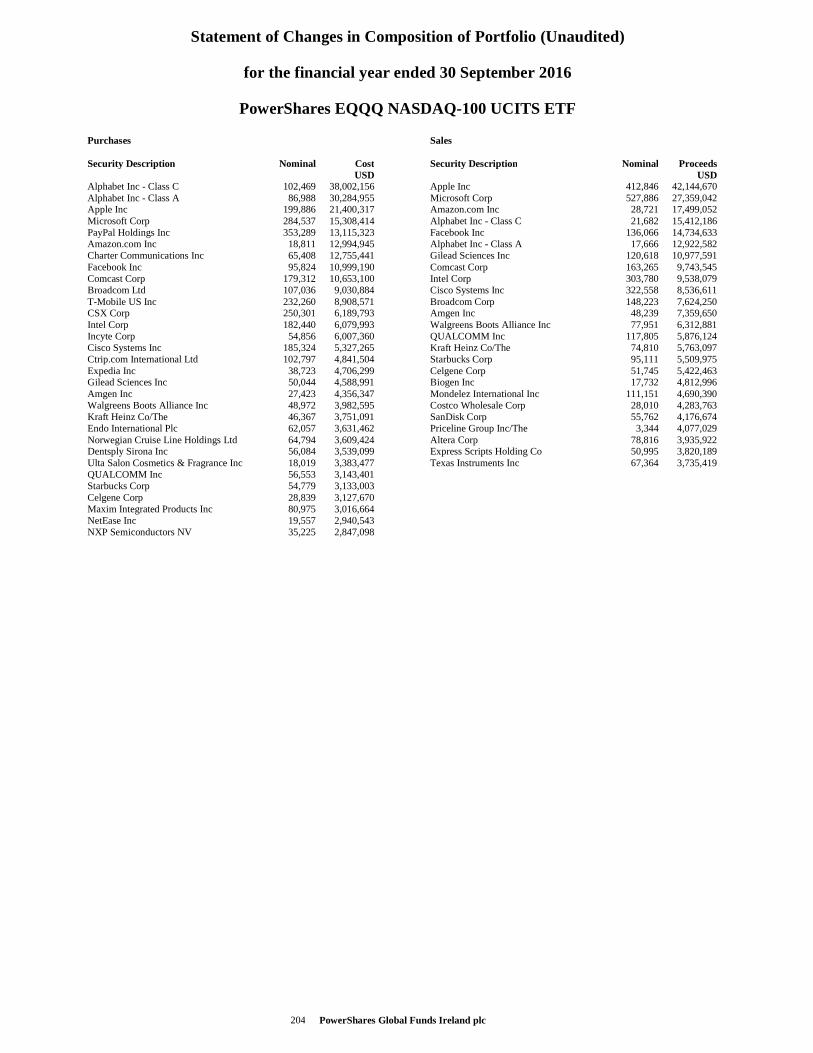
Statement of Changes in Composition of Portfolio (Unaudited)
for the financial year ended 30 September 2016
PowerShares EQQQ NASDAQ-100 UCITS ETF
PowerShares Global Funds Ireland plc 204
Purchases Security Description Nominal Cost USD Alphabet Inc - Class C 102,469 38,002,156 Alphabet Inc - Class A 86,988 30,284,955 Apple Inc 199,886 21,400,317 Microsoft Corp 284,537 15,308,414 PayPal Holdings Inc 353,289 13,115,323 Amazon.com Inc 18,811 12,994,945 Charter Communications Inc 65,408 12,755,441 Facebook Inc 95,824 10,999,190 Comcast Corp 179,312 10,653,100 Broadcom Ltd 107,036 9,030,884 T-Mobile US Inc 232,260 8,908,571 CSX Corp 250,301 6,189,793 Intel Corp 182,440 6,079,993 Incyte Corp 54,856 6,007,360 Cisco Systems Inc 185,324 5,327,265 Ctrip.com International Ltd 102,797 4,841,504 Expedia Inc 38,723 4,706,299 Gilead Sciences Inc 50,044 4,588,991 Amgen Inc 27,423 4,356,347 Walgreens Boots Alliance Inc 48,972 3,982,595 Kraft Heinz Co/The 46,367 3,751,091 Endo International Plc 62,057 3,631,462 Norwegian Cruise Line Holdings Ltd 64,794 3,609,424 Dentsply Sirona Inc 56,084 3,539,099 Ulta Salon Cosmetics & Fragrance Inc 18,019 3,383,477 QUALCOMM Inc 56,553 3,143,401 Starbucks Corp 54,779 3,133,003 Celgene Corp 28,839 3,127,670 Maxim Integrated Products Inc 80,975 3,016,664 NetEase Inc 19,557 2,940,543 NXP Semiconductors NV 35,225 2,847,098
Sales Security Description Nominal Proceeds USD Apple Inc 412,846 42,144,670 Microsoft Corp 527,886 27,359,042 Amazon.com Inc 28,721 17,499,052 Alphabet Inc - Class C 21,682 15,412,186 Facebook Inc 136,066 14,734,633 Alphabet Inc - Class A 17,666 12,922,582 Gilead Sciences Inc 120,618 10,977,591 Comcast Corp 163,265 9,743,545 Intel Corp 303,780 9,538,079 Cisco Systems Inc 322,558 8,536,611 Broadcom Corp 148,223 7,624,250 Amgen Inc 48,239 7,359,650 Walgreens Boots Alliance Inc 77,951 6,312,881 QUALCOMM Inc 117,805 5,876,124 Kraft Heinz Co/The 74,810 5,763,097 Starbucks Corp 95,111 5,509,975 Celgene Corp 51,745 5,422,463 Biogen Inc 17,732 4,812,996 Mondelez International Inc 111,151 4,690,390 Costco Wholesale Corp 28,010 4,283,763 SanDisk Corp 55,762 4,176,674 Priceline Group Inc/The 3,344 4,077,029 Altera Corp 78,816 3,935,922 Express Scripts Holding Co 50,995 3,820,189 Texas Instruments Inc 67,364 3,735,419
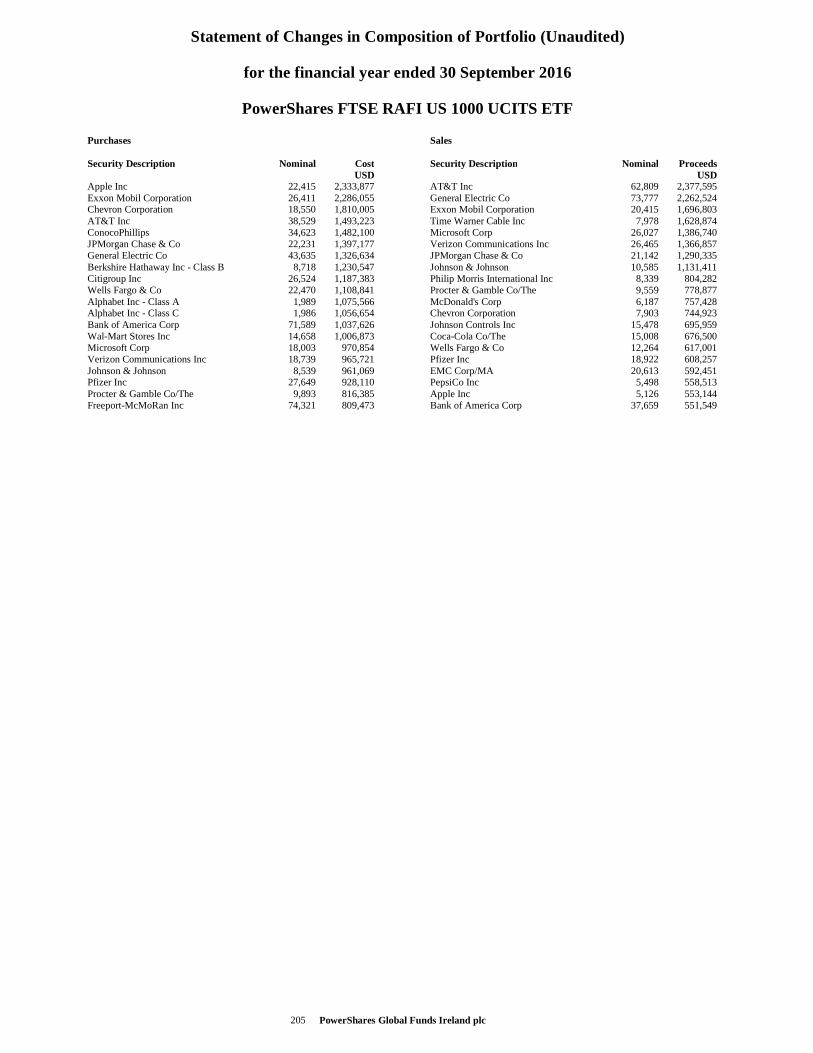
Statement of Changes in Composition of Portfolio (Unaudited)
for the financial year ended 30 September 2016
PowerShares FTSE RAFI US 1000 UCITS ETF
PowerShares Global Funds Ireland plc 205
Purchases Security Description Nominal Cost USD Apple Inc 22,415 2,333,877 Exxon Mobil Corporation 26,411 2,286,055 Chevron Corporation 18,550 1,810,005 AT&T Inc 38,529 1,493,223 ConocoPhillips 34,623 1,482,100 JPMorgan Chase & Co 22,231 1,397,177 General Electric Co 43,635 1,326,634 Berkshire Hathaway Inc - Class B 8,718 1,230,547 Citigroup Inc 26,524 1,187,383 Wells Fargo & Co 22,470 1,108,841 Alphabet Inc - Class A 1,989 1,075,566 Alphabet Inc - Class C 1,986 1,056,654 Bank of America Corp 71,589 1,037,626 Wal-Mart Stores Inc 14,658 1,006,873 Microsoft Corp 18,003 970,854 Verizon Communications Inc 18,739 965,721 Johnson & Johnson 8,539 961,069 Pfizer Inc 27,649 928,110 Procter & Gamble Co/The 9,893 816,385 Freeport-McMoRan Inc 74,321 809,473
Sales Security Description Nominal Proceeds USD AT&T Inc 62,809 2,377,595 General Electric Co 73,777 2,262,524 Exxon Mobil Corporation 20,415 1,696,803 Time Warner Cable Inc 7,978 1,628,874 Microsoft Corp 26,027 1,386,740 Verizon Communications Inc 26,465 1,366,857 JPMorgan Chase & Co 21,142 1,290,335 Johnson & Johnson 10,585 1,131,411 Philip Morris International Inc 8,339 804,282 Procter & Gamble Co/The 9,559 778,877 McDonald's Corp 6,187 757,428 Chevron Corporation 7,903 744,923 Johnson Controls Inc 15,478 695,959 Coca-Cola Co/The 15,008 676,500 Wells Fargo & Co 12,264 617,001 Pfizer Inc 18,922 608,257 EMC Corp/MA 20,613 592,451 PepsiCo Inc 5,498 558,513 Apple Inc 5,126 553,144 Bank of America Corp 37,659 551,549
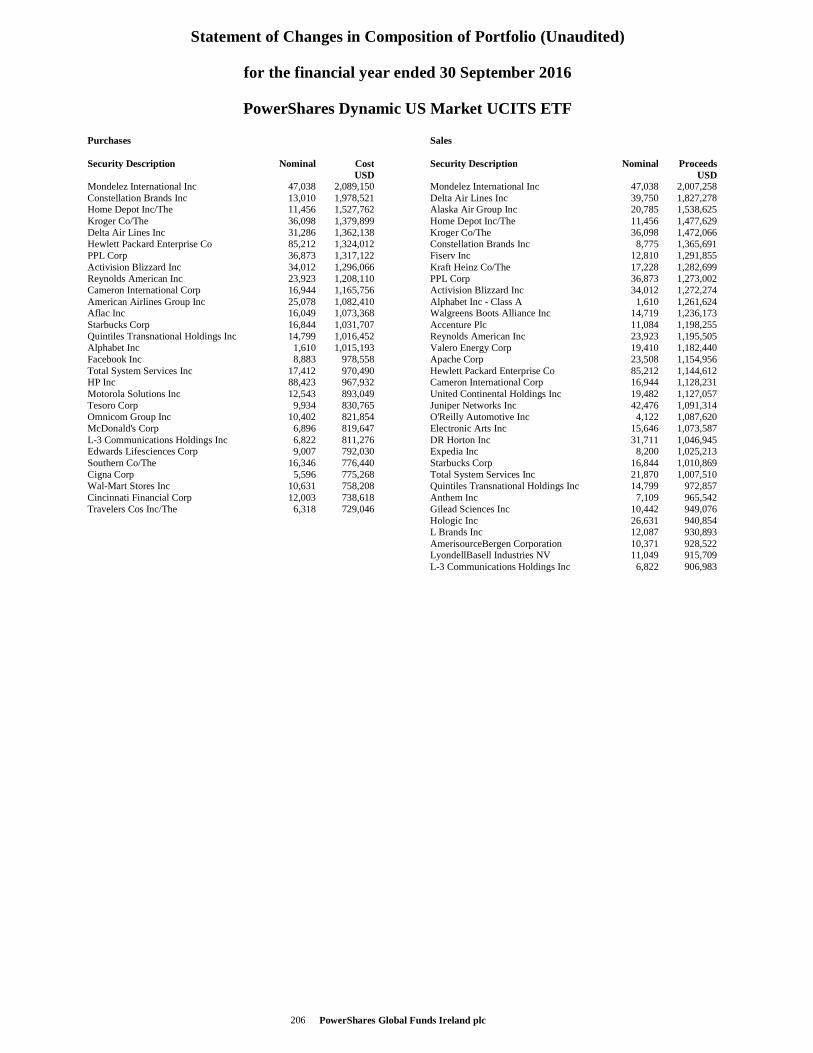
Statement of Changes in Composition of Portfolio (Unaudited)
for the financial year ended 30 September 2016
PowerShares Dynamic US Market UCITS ETF
PowerShares Global Funds Ireland plc 206
Purchases Security Description Nominal Cost USD Mondelez International Inc 47,038 2,089,150 Constellation Brands Inc 13,010 1,978,521 Home Depot Inc/The 11,456 1,527,762 Kroger Co/The 36,098 1,379,899 Delta Air Lines Inc 31,286 1,362,138 Hewlett Packard Enterprise Co 85,212 1,324,012 PPL Corp 36,873 1,317,122 Activision Blizzard Inc 34,012 1,296,066 Reynolds American Inc 23,923 1,208,110 Cameron International Corp 16,944 1,165,756 American Airlines Group Inc 25,078 1,082,410 Aflac Inc 16,049 1,073,368 Starbucks Corp 16,844 1,031,707 Quintiles Transnational Holdings Inc 14,799 1,016,452 Alphabet Inc 1,610 1,015,193 Facebook Inc 8,883 978,558 Total System Services Inc 17,412 970,490 HP Inc 88,423 967,932 Motorola Solutions Inc 12,543 893,049 Tesoro Corp 9,934 830,765 Omnicom Group Inc 10,402 821,854 McDonald's Corp 6,896 819,647 L-3 Communications Holdings Inc 6,822 811,276 Edwards Lifesciences Corp 9,007 792,030 Southern Co/The 16,346 776,440 Cigna Corp 5,596 775,268 Wal-Mart Stores Inc 10,631 758,208 Cincinnati Financial Corp 12,003 738,618 Travelers Cos Inc/The 6,318 729,046
Sales Security Description Nominal Proceeds USD Mondelez International Inc 47,038 2,007,258 Delta Air Lines Inc 39,750 1,827,278 Alaska Air Group Inc 20,785 1,538,625 Home Depot Inc/The 11,456 1,477,629 Kroger Co/The 36,098 1,472,066 Constellation Brands Inc 8,775 1,365,691 Fiserv Inc 12,810 1,291,855 Kraft Heinz Co/The 17,228 1,282,699 PPL Corp 36,873 1,273,002 Activision Blizzard Inc 34,012 1,272,274 Alphabet Inc - Class A 1,610 1,261,624 Walgreens Boots Alliance Inc 14,719 1,236,173 Accenture Plc 11,084 1,198,255 Reynolds American Inc 23,923 1,195,505 Valero Energy Corp 19,410 1,182,440 Apache Corp 23,508 1,154,956 Hewlett Packard Enterprise Co 85,212 1,144,612 Cameron International Corp 16,944 1,128,231 United Continental Holdings Inc 19,482 1,127,057 Juniper Networks Inc 42,476 1,091,314 O'Reilly Automotive Inc 4,122 1,087,620 Electronic Arts Inc 15,646 1,073,587 DR Horton Inc 31,711 1,046,945 Expedia Inc 8,200 1,025,213 Starbucks Corp 16,844 1,010,869 Total System Services Inc 21,870 1,007,510 Quintiles Transnational Holdings Inc 14,799 972,857 Anthem Inc 7,109 965,542 Gilead Sciences Inc 10,442 949,076 Hologic Inc 26,631 940,854 L Brands Inc 12,087 930,893 AmerisourceBergen Corporation 10,371 928,522 LyondellBasell Industries NV 11,049 915,709 L-3 Communications Holdings Inc 6,822 906,983
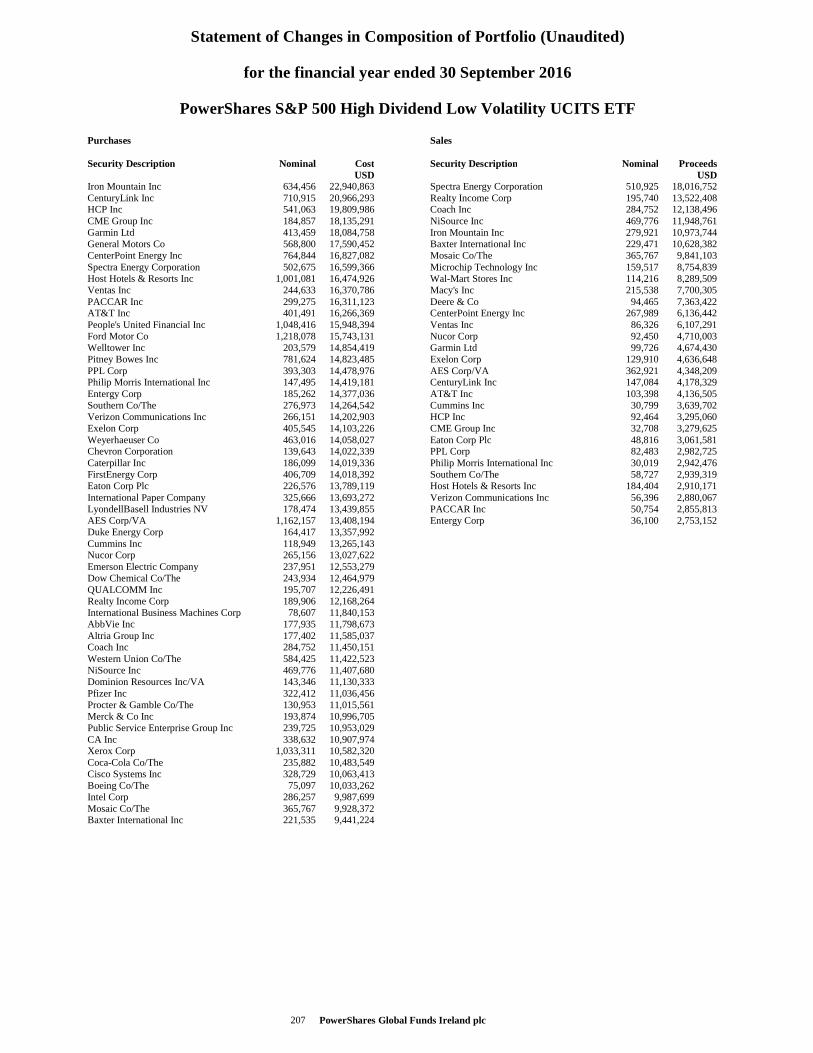
Statement of Changes in Composition of Portfolio (Unaudited)
for the financial year ended 30 September 2016
PowerShares S&P 500 High Dividend Low Volatility UCITS ETF
PowerShares Global Funds Ireland plc 207
Purchases Security Description Nominal Cost USD Iron Mountain Inc 634,456 22,940,863 CenturyLink Inc 710,915 20,966,293 HCP Inc 541,063 19,809,986 CME Group Inc 184,857 18,135,291 Garmin Ltd 413,459 18,084,758 General Motors Co 568,800 17,590,452 CenterPoint Energy Inc 764,844 16,827,082 Spectra Energy Corporation 502,675 16,599,366 Host Hotels & Resorts Inc 1,001,081 16,474,926 Ventas Inc 244,633 16,370,786 PACCAR Inc 299,275 16,311,123 AT&T Inc 401,491 16,266,369 People's United Financial Inc 1,048,416 15,948,394 Ford Motor Co 1,218,078 15,743,131 Welltower Inc 203,579 14,854,419 Pitney Bowes Inc 781,624 14,823,485 PPL Corp 393,303 14,478,976 Philip Morris International Inc 147,495 14,419,181 Entergy Corp 185,262 14,377,036 Southern Co/The 276,973 14,264,542 Verizon Communications Inc 266,151 14,202,903 Exelon Corp 405,545 14,103,226 Weyerhaeuser Co 463,016 14,058,027 Chevron Corporation 139,643 14,022,339 Caterpillar Inc 186,099 14,019,336 FirstEnergy Corp 406,709 14,018,392 Eaton Corp Plc 226,576 13,789,119 International Paper Company 325,666 13,693,272 LyondellBasell Industries NV 178,474 13,439,855 AES Corp/VA 1,162,157 13,408,194 Duke Energy Corp 164,417 13,357,992 Cummins Inc 118,949 13,265,143 Nucor Corp 265,156 13,027,622 Emerson Electric Company 237,951 12,553,279 Dow Chemical Co/The 243,934 12,464,979 QUALCOMM Inc 195,707 12,226,491 Realty Income Corp 189,906 12,168,264 International Business Machines Corp 78,607 11,840,153 AbbVie Inc 177,935 11,798,673 Altria Group Inc 177,402 11,585,037 Coach Inc 284,752 11,450,151 Western Union Co/The 584,425 11,422,523 NiSource Inc 469,776 11,407,680 Dominion Resources Inc/VA 143,346 11,130,333 Pfizer Inc 322,412 11,036,456 Procter & Gamble Co/The 130,953 11,015,561 Merck & Co Inc 193,874 10,996,705 Public Service Enterprise Group Inc 239,725 10,953,029 CA Inc 338,632 10,907,974 Xerox Corp 1,033,311 10,582,320 Coca-Cola Co/The 235,882 10,483,549 Cisco Systems Inc 328,729 10,063,413 Boeing Co/The 75,097 10,033,262 Intel Corp 286,257 9,987,699 Mosaic Co/The 365,767 9,928,372 Baxter International Inc 221,535 9,441,224
Sales Security Description Nominal Proceeds USD Spectra Energy Corporation 510,925 18,016,752 Realty Income Corp 195,740 13,522,408 Coach Inc 284,752 12,138,496 NiSource Inc 469,776 11,948,761 Iron Mountain Inc 279,921 10,973,744 Baxter International Inc 229,471 10,628,382 Mosaic Co/The 365,767 9,841,103 Microchip Technology Inc 159,517 8,754,839 Wal-Mart Stores Inc 114,216 8,289,509 Macy's Inc 215,538 7,700,305 Deere & Co 94,465 7,363,422 CenterPoint Energy Inc 267,989 6,136,442 Ventas Inc 86,326 6,107,291 Nucor Corp 92,450 4,710,003 Garmin Ltd 99,726 4,674,430 Exelon Corp 129,910 4,636,648 AES Corp/VA 362,921 4,348,209 CenturyLink Inc 147,084 4,178,329 AT&T Inc 103,398 4,136,505 Cummins Inc 30,799 3,639,702 HCP Inc 92,464 3,295,060 CME Group Inc 32,708 3,279,625 Eaton Corp Plc 48,816 3,061,581 PPL Corp 82,483 2,982,725 Philip Morris International Inc 30,019 2,942,476 Southern Co/The 58,727 2,939,319 Host Hotels & Resorts Inc 184,404 2,910,171 Verizon Communications Inc 56,396 2,880,067 PACCAR Inc 50,754 2,855,813 Entergy Corp 36,100 2,753,152
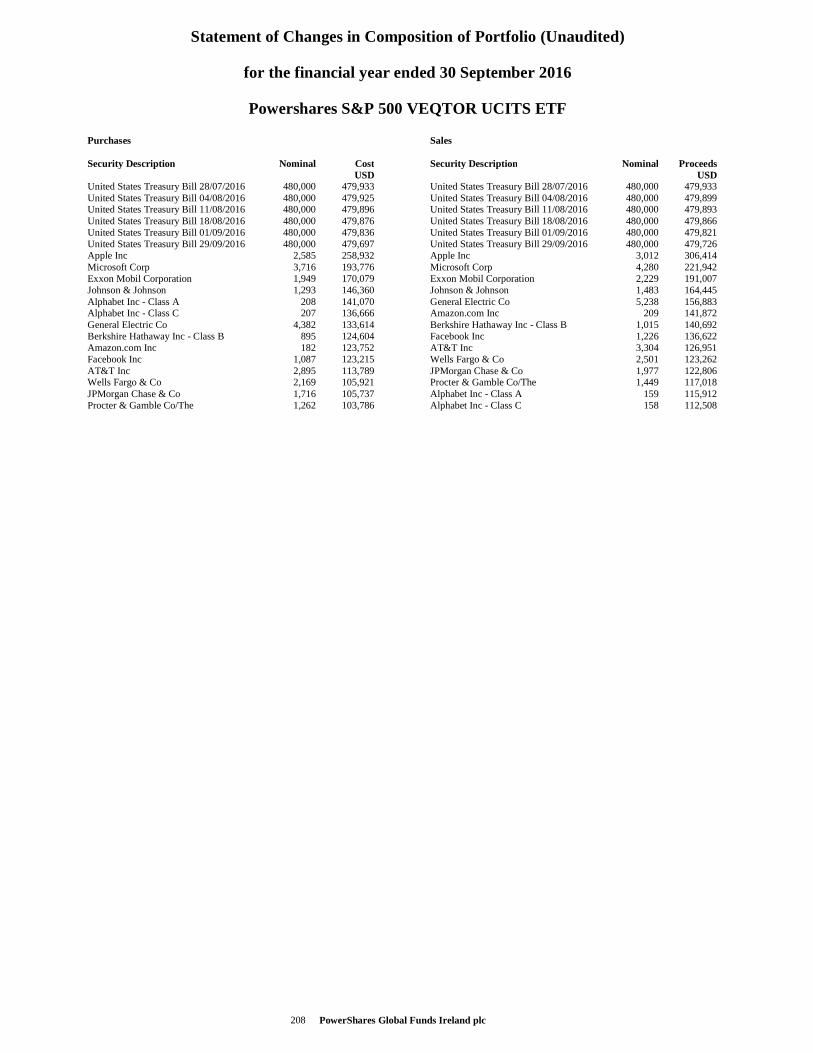
Statement of Changes in Composition of Portfolio (Unaudited)
for the financial year ended 30 September 2016
Powershares S&P 500 VEQTOR UCITS ETF
PowerShares Global Funds Ireland plc 208
Purchases Security Description Nominal Cost USD United States Treasury Bill 28/07/2016 480,000 479,933 United States Treasury Bill 04/08/2016 480,000 479,925 United States Treasury Bill 11/08/2016 480,000 479,896 United States Treasury Bill 18/08/2016 480,000 479,876 United States Treasury Bill 01/09/2016 480,000 479,836 United States Treasury Bill 29/09/2016 480,000 479,697 Apple Inc 2,585 258,932 Microsoft Corp 3,716 193,776 Exxon Mobil Corporation 1,949 170,079 Johnson & Johnson 1,293 146,360 Alphabet Inc - Class A 208 141,070 Alphabet Inc - Class C 207 136,666 General Electric Co 4,382 133,614 Berkshire Hathaway Inc - Class B 895 124,604 Amazon.com Inc 182 123,752 Facebook Inc 1,087 123,215 AT&T Inc 2,895 113,789 Wells Fargo & Co 2,169 105,921 JPMorgan Chase & Co 1,716 105,737 Procter & Gamble Co/The 1,262 103,786
Sales Security Description Nominal Proceeds USD United States Treasury Bill 28/07/2016 480,000 479,933 United States Treasury Bill 04/08/2016 480,000 479,899 United States Treasury Bill 11/08/2016 480,000 479,893 United States Treasury Bill 18/08/2016 480,000 479,866 United States Treasury Bill 01/09/2016 480,000 479,821 United States Treasury Bill 29/09/2016 480,000 479,726 Apple Inc 3,012 306,414 Microsoft Corp 4,280 221,942 Exxon Mobil Corporation 2,229 191,007 Johnson & Johnson 1,483 164,445 General Electric Co 5,238 156,883 Amazon.com Inc 209 141,872 Berkshire Hathaway Inc - Class B 1,015 140,692 Facebook Inc 1,226 136,622 AT&T Inc 3,304 126,951 Wells Fargo & Co 2,501 123,262 JPMorgan Chase & Co 1,977 122,806 Procter & Gamble Co/The 1,449 117,018 Alphabet Inc - Class A 159 115,912 Alphabet Inc - Class C 158 112,508
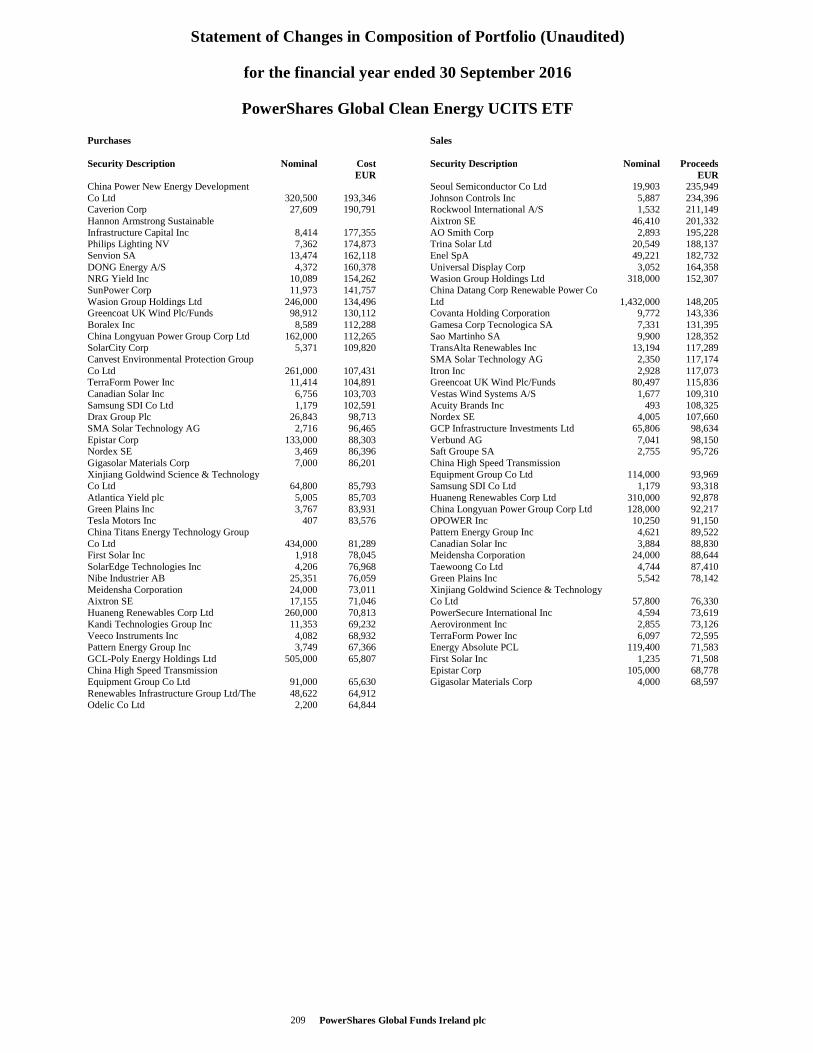
Statement of Changes in Composition of Portfolio (Unaudited)
for the financial year ended 30 September 2016
PowerShares Global Clean Energy UCITS ETF
PowerShares Global Funds Ireland plc 209
Purchases Security Description Nominal Cost EUR China Power New Energy Development Co Ltd 320,500 193,346 Caverion Corp 27,609 190,791 Hannon Armstrong Sustainable Infrastructure Capital Inc 8,414 177,355 Philips Lighting NV 7,362 174,873 Senvion SA 13,474 162,118 DONG Energy A/S 4,372 160,378 NRG Yield Inc 10,089 154,262 SunPower Corp 11,973 141,757 Wasion Group Holdings Ltd 246,000 134,496 Greencoat UK Wind Plc/Funds 98,912 130,112 Boralex Inc 8,589 112,288 China Longyuan Power Group Corp Ltd 162,000 112,265 SolarCity Corp 5,371 109,820 Canvest Environmental Protection Group Co Ltd 261,000 107,431 TerraForm Power Inc 11,414 104,891 Canadian Solar Inc 6,756 103,703 Samsung SDI Co Ltd 1,179 102,591 Drax Group Plc 26,843 98,713 SMA Solar Technology AG 2,716 96,465 Epistar Corp 133,000 88,303 Nordex SE 3,469 86,396 Gigasolar Materials Corp 7,000 86,201 Xinjiang Goldwind Science & Technology Co Ltd 64,800 85,793 Atlantica Yield plc 5,005 85,703 Green Plains Inc 3,767 83,931 Tesla Motors Inc 407 83,576 China Titans Energy Technology Group Co Ltd 434,000 81,289 First Solar Inc 1,918 78,045 SolarEdge Technologies Inc 4,206 76,968 Nibe Industrier AB 25,351 76,059 Meidensha Corporation 24,000 73,011 Aixtron SE 17,155 71,046 Huaneng Renewables Corp Ltd 260,000 70,813 Kandi Technologies Group Inc 11,353 69,232 Veeco Instruments Inc 4,082 68,932 Pattern Energy Group Inc 3,749 67,366 GCL-Poly Energy Holdings Ltd 505,000 65,807 China High Speed Transmission Equipment Group Co Ltd 91,000 65,630 Renewables Infrastructure Group Ltd/The 48,622 64,912 Odelic Co Ltd 2,200 64,844
Sales Security Description Nominal Proceeds EUR Seoul Semiconductor Co Ltd 19,903 235,949 Johnson Controls Inc 5,887 234,396 Rockwool International A/S 1,532 211,149 Aixtron SE 46,410 201,332 AO Smith Corp 2,893 195,228 Trina Solar Ltd 20,549 188,137 Enel SpA 49,221 182,732 Universal Display Corp 3,052 164,358 Wasion Group Holdings Ltd 318,000 152,307 China Datang Corp Renewable Power Co Ltd 1,432,000 148,205 Covanta Holding Corporation 9,772 143,336 Gamesa Corp Tecnologica SA 7,331 131,395 Sao Martinho SA 9,900 128,352 TransAlta Renewables Inc 13,194 117,289 SMA Solar Technology AG 2,350 117,174 Itron Inc 2,928 117,073 Greencoat UK Wind Plc/Funds 80,497 115,836 Vestas Wind Systems A/S 1,677 109,310 Acuity Brands Inc 493 108,325 Nordex SE 4,005 107,660 GCP Infrastructure Investments Ltd 65,806 98,634 Verbund AG 7,041 98,150 Saft Groupe SA 2,755 95,726 China High Speed Transmission Equipment Group Co Ltd 114,000 93,969 Samsung SDI Co Ltd 1,179 93,318 Huaneng Renewables Corp Ltd 310,000 92,878 China Longyuan Power Group Corp Ltd 128,000 92,217 OPOWER Inc 10,250 91,150 Pattern Energy Group Inc 4,621 89,522 Canadian Solar Inc 3,884 88,830 Meidensha Corporation 24,000 88,644 Taewoong Co Ltd 4,744 87,410 Green Plains Inc 5,542 78,142 Xinjiang Goldwind Science & Technology Co Ltd 57,800 76,330 PowerSecure International Inc 4,594 73,619 Aerovironment Inc 2,855 73,126 TerraForm Power Inc 6,097 72,595 Energy Absolute PCL 119,400 71,583 First Solar Inc 1,235 71,508 Epistar Corp 105,000 68,778 Gigasolar Materials Corp 4,000 68,597
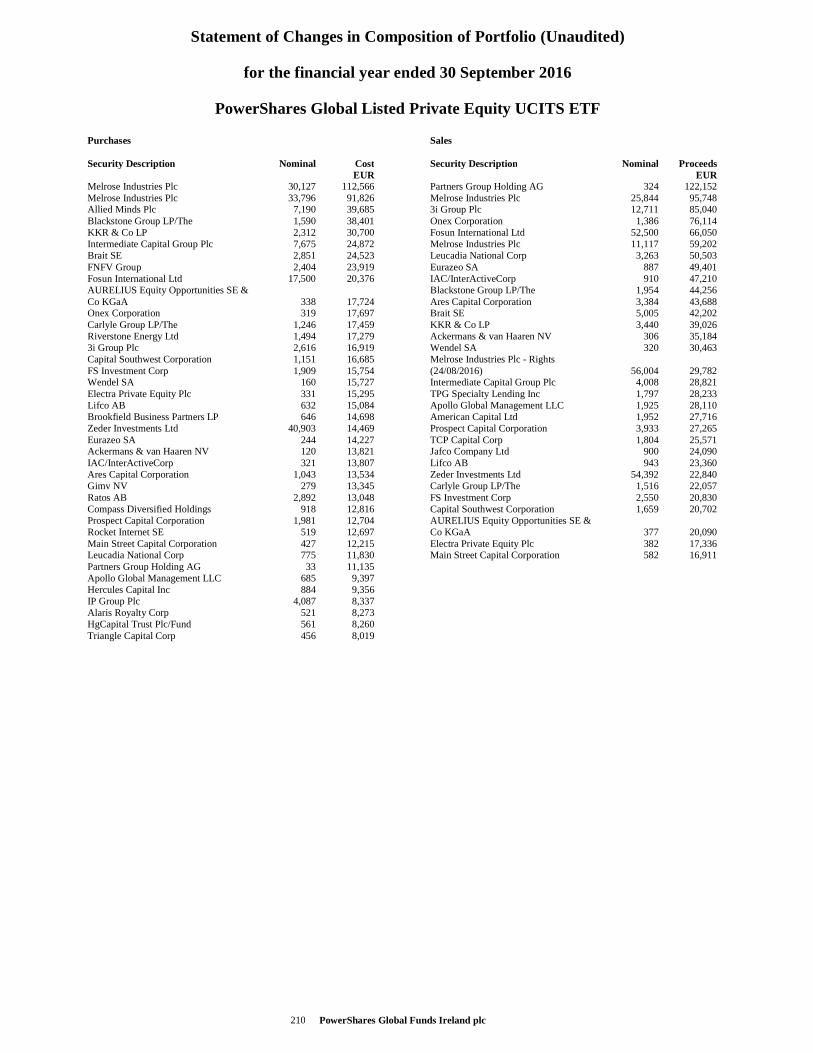
Statement of Changes in Composition of Portfolio (Unaudited)
for the financial year ended 30 September 2016
PowerShares Global Listed Private Equity UCITS ETF
PowerShares Global Funds Ireland plc 210
Purchases Security Description Nominal Cost EUR Melrose Industries Plc 30,127 112,566 Melrose Industries Plc 33,796 91,826 Allied Minds Plc 7,190 39,685 Blackstone Group LP/The 1,590 38,401 KKR & Co LP 2,312 30,700 Intermediate Capital Group Plc 7,675 24,872 Brait SE 2,851 24,523 FNFV Group 2,404 23,919 Fosun International Ltd 17,500 20,376 AURELIUS Equity Opportunities SE & Co KGaA 338 17,724 Onex Corporation 319 17,697 Carlyle Group LP/The 1,246 17,459 Riverstone Energy Ltd 1,494 17,279 3i Group Plc 2,616 16,919 Capital Southwest Corporation 1,151 16,685 FS Investment Corp 1,909 15,754 Wendel SA 160 15,727 Electra Private Equity Plc 331 15,295 Lifco AB 632 15,084 Brookfield Business Partners LP 646 14,698 Zeder Investments Ltd 40,903 14,469 Eurazeo SA 244 14,227 Ackermans & van Haaren NV 120 13,821 IAC/InterActiveCorp 321 13,807 Ares Capital Corporation 1,043 13,534 Gimv NV 279 13,345 Ratos AB 2,892 13,048 Compass Diversified Holdings 918 12,816 Prospect Capital Corporation 1,981 12,704 Rocket Internet SE 519 12,697 Main Street Capital Corporation 427 12,215 Leucadia National Corp 775 11,830 Partners Group Holding AG 33 11,135 Apollo Global Management LLC 685 9,397 Hercules Capital Inc 884 9,356 IP Group Plc 4,087 8,337 Alaris Royalty Corp 521 8,273 HgCapital Trust Plc/Fund 561 8,260 Triangle Capital Corp 456 8,019
Sales Security Description Nominal Proceeds EUR Partners Group Holding AG 324 122,152 Melrose Industries Plc 25,844 95,748 3i Group Plc 12,711 85,040 Onex Corporation 1,386 76,114 Fosun International Ltd 52,500 66,050 Melrose Industries Plc 11,117 59,202 Leucadia National Corp 3,263 50,503 Eurazeo SA 887 49,401 IAC/InterActiveCorp 910 47,210 Blackstone Group LP/The 1,954 44,256 Ares Capital Corporation 3,384 43,688 Brait SE 5,005 42,202 KKR & Co LP 3,440 39,026 Ackermans & van Haaren NV 306 35,184 Wendel SA 320 30,463 Melrose Industries Plc - Rights (24/08/2016) 56,004 29,782 Intermediate Capital Group Plc 4,008 28,821 TPG Specialty Lending Inc 1,797 28,233 Apollo Global Management LLC 1,925 28,110 American Capital Ltd 1,952 27,716 Prospect Capital Corporation 3,933 27,265 TCP Capital Corp 1,804 25,571 Jafco Company Ltd 900 24,090 Lifco AB 943 23,360 Zeder Investments Ltd 54,392 22,840 Carlyle Group LP/The 1,516 22,057 FS Investment Corp 2,550 20,830 Capital Southwest Corporation 1,659 20,702 AURELIUS Equity Opportunities SE & Co KGaA 377 20,090 Electra Private Equity Plc 382 17,336 Main Street Capital Corporation 582 16,911
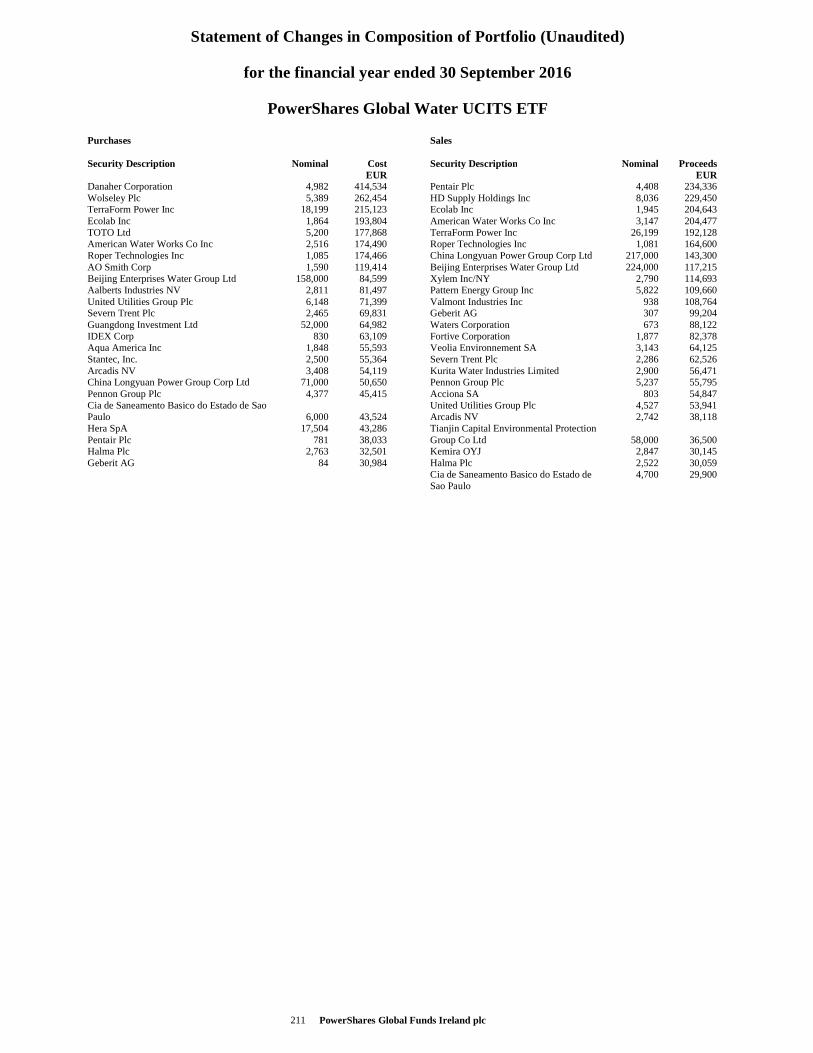
Statement of Changes in Composition of Portfolio (Unaudited)
for the financial year ended 30 September 2016
PowerShares Global Water UCITS ETF
PowerShares Global Funds Ireland plc 211
Purchases Security Description Nominal Cost EUR Danaher Corporation 4,982 414,534 Wolseley Plc 5,389 262,454 TerraForm Power Inc 18,199 215,123 Ecolab Inc 1,864 193,804 TOTO Ltd 5,200 177,868 American Water Works Co Inc 2,516 174,490 Roper Technologies Inc 1,085 174,466 AO Smith Corp 1,590 119,414 Beijing Enterprises Water Group Ltd 158,000 84,599 Aalberts Industries NV 2,811 81,497 United Utilities Group Plc 6,148 71,399 Severn Trent Plc 2,465 69,831 Guangdong Investment Ltd 52,000 64,982 IDEX Corp 830 63,109 Aqua America Inc 1,848 55,593 Stantec, Inc. 2,500 55,364 Arcadis NV 3,408 54,119 China Longyuan Power Group Corp Ltd 71,000 50,650 Pennon Group Plc 4,377 45,415 Cia de Saneamento Basico do Estado de Sao Paulo 6,000 43,524 Hera SpA 17,504 43,286 Pentair Plc 781 38,033 Halma Plc 2,763 32,501 Geberit AG 84 30,984
Sales Security Description Nominal Proceeds EUR Pentair Plc 4,408 234,336 HD Supply Holdings Inc 8,036 229,450 Ecolab Inc 1,945 204,643 American Water Works Co Inc 3,147 204,477 TerraForm Power Inc 26,199 192,128 Roper Technologies Inc 1,081 164,600 China Longyuan Power Group Corp Ltd 217,000 143,300 Beijing Enterprises Water Group Ltd 224,000 117,215 Xylem Inc/NY 2,790 114,693 Pattern Energy Group Inc 5,822 109,660 Valmont Industries Inc 938 108,764 Geberit AG 307 99,204 Waters Corporation 673 88,122 Fortive Corporation 1,877 82,378 Veolia Environnement SA 3,143 64,125 Severn Trent Plc 2,286 62,526 Kurita Water Industries Limited 2,900 56,471 Pennon Group Plc 5,237 55,795 Acciona SA 803 54,847 United Utilities Group Plc 4,527 53,941 Arcadis NV 2,742 38,118 Tianjin Capital Environmental Protection Group Co Ltd 58,000 36,500 Kemira OYJ 2,847 30,145 Halma Plc 2,522 30,059 Cia de Saneamento Basico do Estado de Sao Paulo
4,700 29,900
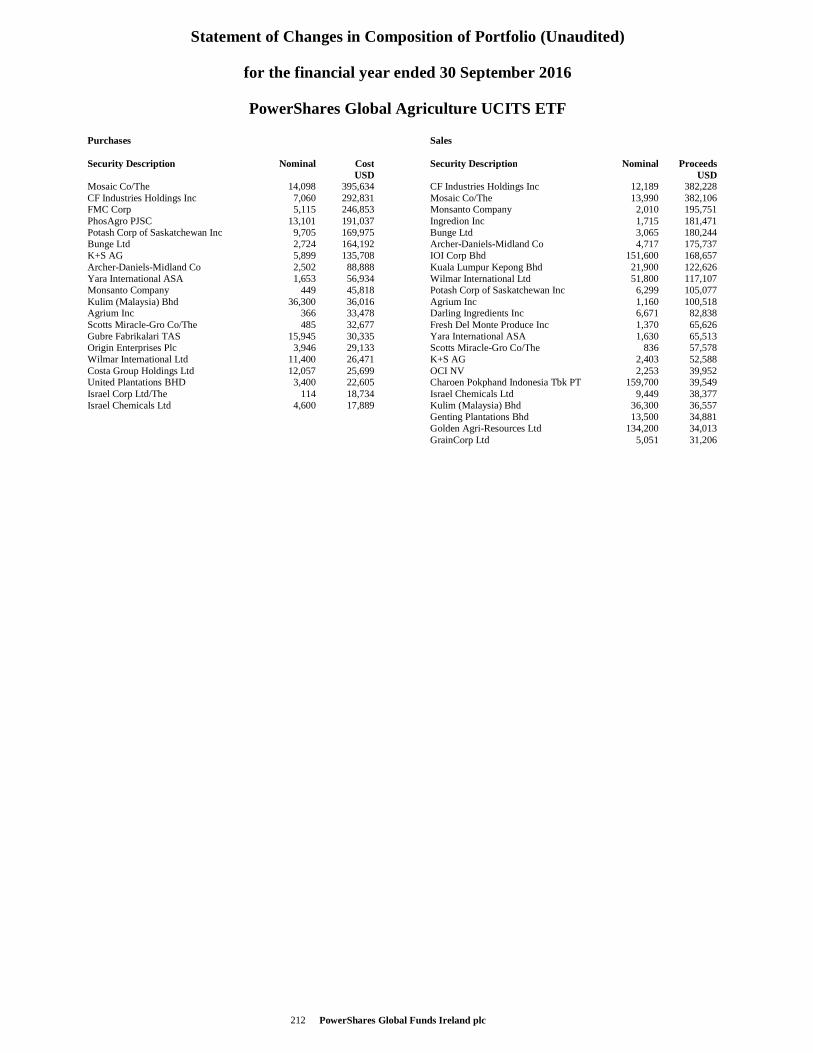
Statement of Changes in Composition of Portfolio (Unaudited)
for the financial year ended 30 September 2016
PowerShares Global Agriculture UCITS ETF
PowerShares Global Funds Ireland plc 212
Purchases Security Description Nominal Cost USD Mosaic Co/The 14,098 395,634 CF Industries Holdings Inc 7,060 292,831 FMC Corp 5,115 246,853 PhosAgro PJSC 13,101 191,037 Potash Corp of Saskatchewan Inc 9,705 169,975 Bunge Ltd 2,724 164,192 K+S AG 5,899 135,708 Archer-Daniels-Midland Co 2,502 88,888 Yara International ASA 1,653 56,934 Monsanto Company 449 45,818 Kulim (Malaysia) Bhd 36,300 36,016 Agrium Inc 366 33,478 Scotts Miracle-Gro Co/The 485 32,677 Gubre Fabrikalari TAS 15,945 30,335 Origin Enterprises Plc 3,946 29,133 Wilmar International Ltd 11,400 26,471 Costa Group Holdings Ltd 12,057 25,699 United Plantations BHD 3,400 22,605 Israel Corp Ltd/The 114 18,734 Israel Chemicals Ltd 4,600 17,889
Sales Security Description Nominal Proceeds USD CF Industries Holdings Inc 12,189 382,228 Mosaic Co/The 13,990 382,106 Monsanto Company 2,010 195,751 Ingredion Inc 1,715 181,471 Bunge Ltd 3,065 180,244 Archer-Daniels-Midland Co 4,717 175,737 IOI Corp Bhd 151,600 168,657 Kuala Lumpur Kepong Bhd 21,900 122,626 Wilmar International Ltd 51,800 117,107 Potash Corp of Saskatchewan Inc 6,299 105,077 Agrium Inc 1,160 100,518 Darling Ingredients Inc 6,671 82,838 Fresh Del Monte Produce Inc 1,370 65,626 Yara International ASA 1,630 65,513 Scotts Miracle-Gro Co/The 836 57,578 K+S AG 2,403 52,588 OCI NV 2,253 39,952 Charoen Pokphand Indonesia Tbk PT 159,700 39,549 Israel Chemicals Ltd 9,449 38,377 Kulim (Malaysia) Bhd 36,300 36,557 Genting Plantations Bhd 13,500 34,881 Golden Agri-Resources Ltd 134,200 34,013 GrainCorp Ltd 5,051 31,206
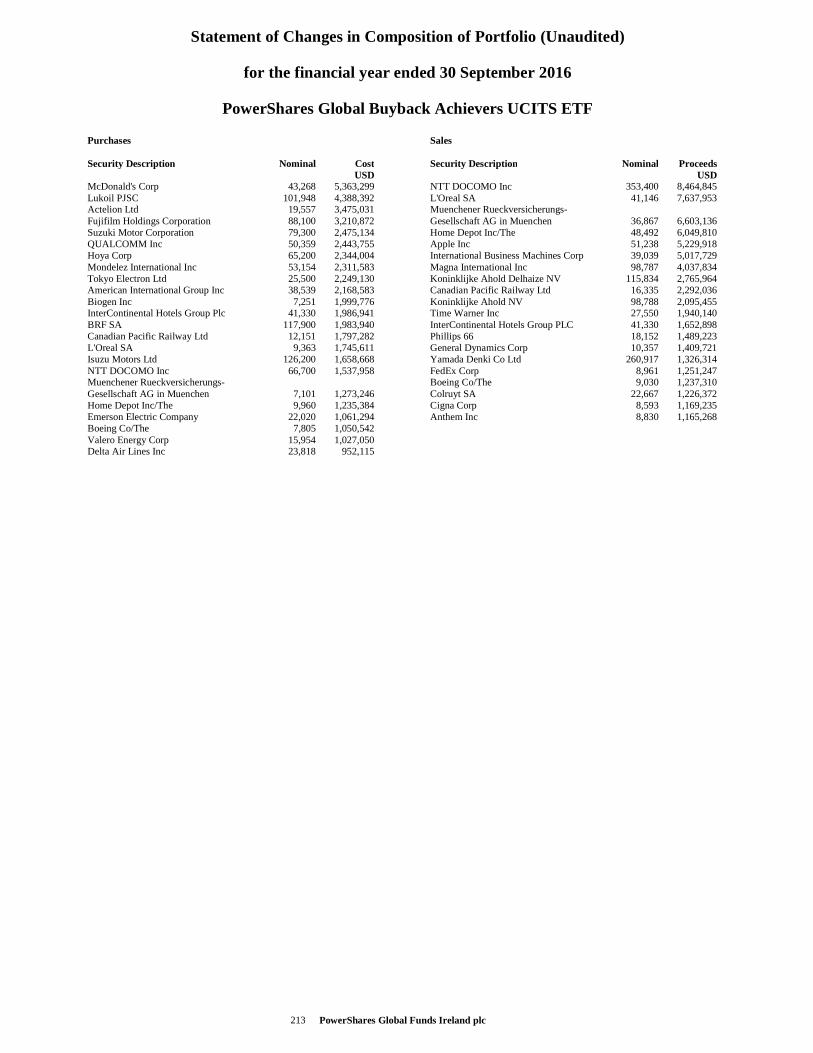
Statement of Changes in Composition of Portfolio (Unaudited)
for the financial year ended 30 September 2016
PowerShares Global Buyback Achievers UCITS ETF
PowerShares Global Funds Ireland plc 213
Purchases Security Description Nominal Cost USD McDonald's Corp 43,268 5,363,299 Lukoil PJSC 101,948 4,388,392 Actelion Ltd 19,557 3,475,031 Fujifilm Holdings Corporation 88,100 3,210,872 Suzuki Motor Corporation 79,300 2,475,134 QUALCOMM Inc 50,359 2,443,755 Hoya Corp 65,200 2,344,004 Mondelez International Inc 53,154 2,311,583 Tokyo Electron Ltd 25,500 2,249,130 American International Group Inc 38,539 2,168,583 Biogen Inc 7,251 1,999,776 InterContinental Hotels Group Plc 41,330 1,986,941 BRF SA 117,900 1,983,940 Canadian Pacific Railway Ltd 12,151 1,797,282 L'Oreal SA 9,363 1,745,611 Isuzu Motors Ltd 126,200 1,658,668 NTT DOCOMO Inc 66,700 1,537,958 Muenchener Rueckversicherungs-Gesellschaft AG in Muenchen 7,101 1,273,246 Home Depot Inc/The 9,960 1,235,384 Emerson Electric Company 22,020 1,061,294 Boeing Co/The 7,805 1,050,542 Valero Energy Corp 15,954 1,027,050 Delta Air Lines Inc 23,818 952,115
Sales Security Description Nominal Proceeds USD NTT DOCOMO Inc 353,400 8,464,845 L'Oreal SA 41,146 7,637,953 Muenchener Rueckversicherungs-Gesellschaft AG in Muenchen 36,867 6,603,136 Home Depot Inc/The 48,492 6,049,810 Apple Inc 51,238 5,229,918 International Business Machines Corp 39,039 5,017,729 Magna International Inc 98,787 4,037,834 Koninklijke Ahold Delhaize NV 115,834 2,765,964 Canadian Pacific Railway Ltd 16,335 2,292,036 Koninklijke Ahold NV 98,788 2,095,455 Time Warner Inc 27,550 1,940,140 InterContinental Hotels Group PLC 41,330 1,652,898 Phillips 66 18,152 1,489,223 General Dynamics Corp 10,357 1,409,721 Yamada Denki Co Ltd 260,917 1,326,314 FedEx Corp 8,961 1,251,247 Boeing Co/The 9,030 1,237,310 Colruyt SA 22,667 1,226,372 Cigna Corp 8,593 1,169,235 Anthem Inc 8,830 1,165,268
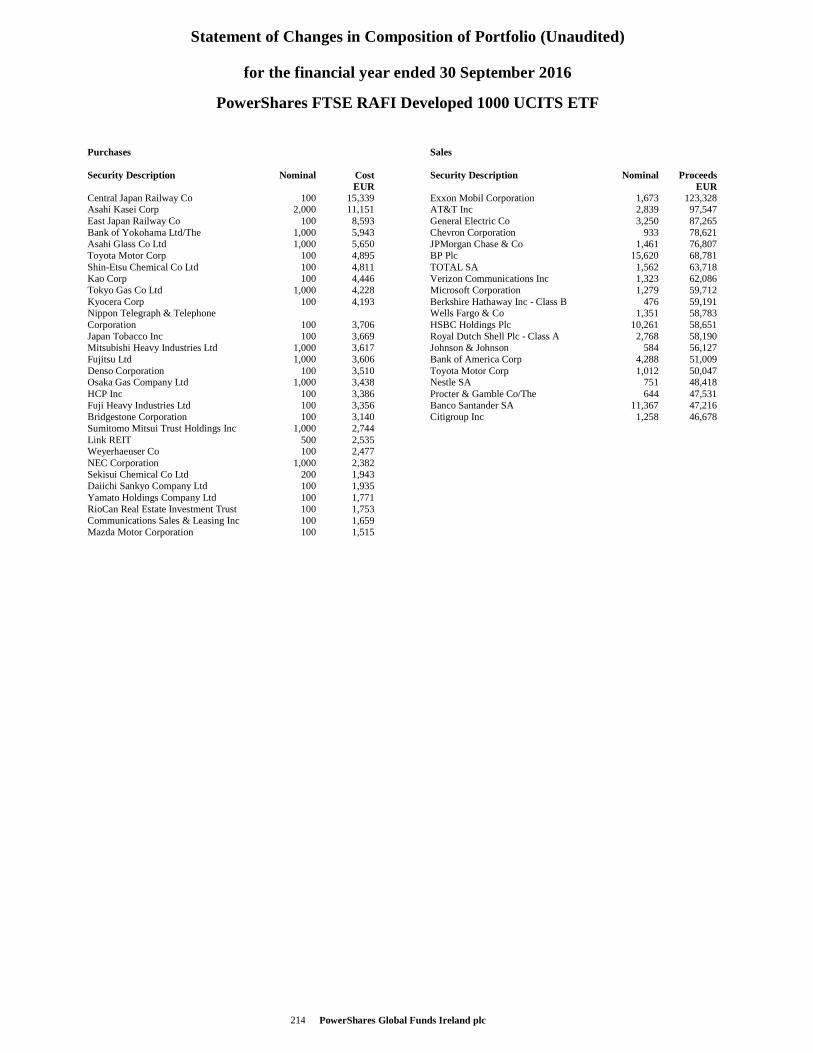
Statement of Changes in Composition of Portfolio (Unaudited)
for the financial year ended 30 September 2016
PowerShares FTSE RAFI Developed 1000 UCITS ETF
PowerShares Global Funds Ireland plc 214
Purchases Security Description Nominal Cost EUR Central Japan Railway Co 100 15,339 Asahi Kasei Corp 2,000 11,151 East Japan Railway Co 100 8,593 Bank of Yokohama Ltd/The 1,000 5,943 Asahi Glass Co Ltd 1,000 5,650 Toyota Motor Corp 100 4,895 Shin-Etsu Chemical Co Ltd 100 4,811 Kao Corp 100 4,446 Tokyo Gas Co Ltd 1,000 4,228 Kyocera Corp 100 4,193 Nippon Telegraph & Telephone Corporation 100 3,706 Japan Tobacco Inc 100 3,669 Mitsubishi Heavy Industries Ltd 1,000 3,617 Fujitsu Ltd 1,000 3,606 Denso Corporation 100 3,510 Osaka Gas Company Ltd 1,000 3,438 HCP Inc 100 3,386 Fuji Heavy Industries Ltd 100 3,356 Bridgestone Corporation 100 3,140 Sumitomo Mitsui Trust Holdings Inc 1,000 2,744 Link REIT 500 2,535 Weyerhaeuser Co 100 2,477 NEC Corporation 1,000 2,382 Sekisui Chemical Co Ltd 200 1,943 Daiichi Sankyo Company Ltd 100 1,935 Yamato Holdings Company Ltd 100 1,771 RioCan Real Estate Investment Trust 100 1,753 Communications Sales & Leasing Inc 100 1,659 Mazda Motor Corporation 100 1,515
Sales Security Description Nominal Proceeds EUR Exxon Mobil Corporation 1,673 123,328 AT&T Inc 2,839 97,547 General Electric Co 3,250 87,265 Chevron Corporation 933 78,621 JPMorgan Chase & Co 1,461 76,807 BP Plc 15,620 68,781 TOTAL SA 1,562 63,718 Verizon Communications Inc 1,323 62,086 Microsoft Corporation 1,279 59,712 Berkshire Hathaway Inc - Class B 476 59,191 Wells Fargo & Co 1,351 58,783 HSBC Holdings Plc 10,261 58,651 Royal Dutch Shell Plc - Class A 2,768 58,190 Johnson & Johnson 584 56,127 Bank of America Corp 4,288 51,009 Toyota Motor Corp 1,012 50,047 Nestle SA 751 48,418 Procter & Gamble Co/The 644 47,531 Banco Santander SA 11,367 47,216 Citigroup Inc 1,258 46,678
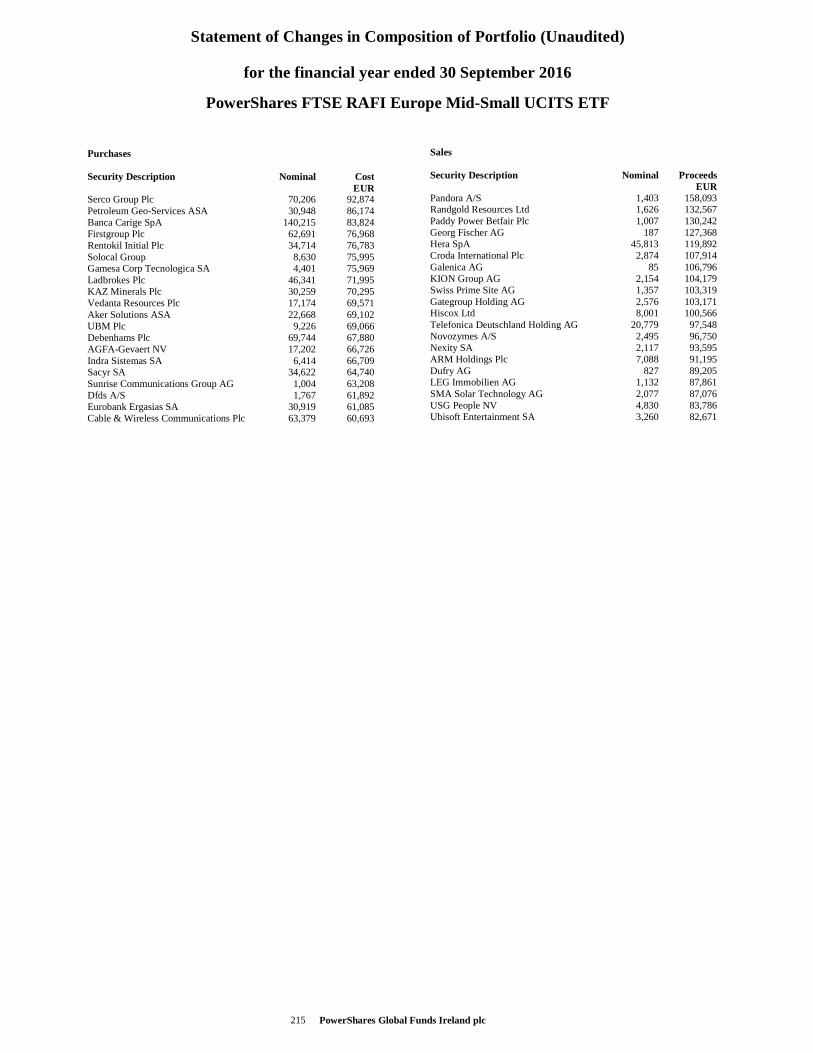
Statement of Changes in Composition of Portfolio (Unaudited)
for the financial year ended 30 September 2016
PowerShares FTSE RAFI Europe Mid-Small UCITS ETF
PowerShares Global Funds Ireland plc 215
Purchases Security Description Nominal Cost EUR Serco Group Plc 70,206 92,874 Petroleum Geo-Services ASA 30,948 86,174 Banca Carige SpA 140,215 83,824 Firstgroup Plc 62,691 76,968 Rentokil Initial Plc 34,714 76,783 Solocal Group 8,630 75,995 Gamesa Corp Tecnologica SA 4,401 75,969 Ladbrokes Plc 46,341 71,995 KAZ Minerals Plc 30,259 70,295 Vedanta Resources Plc 17,174 69,571 Aker Solutions ASA 22,668 69,102 UBM Plc 9,226 69,066 Debenhams Plc 69,744 67,880 AGFA-Gevaert NV 17,202 66,726 Indra Sistemas SA 6,414 66,709 Sacyr SA 34,622 64,740 Sunrise Communications Group AG 1,004 63,208 Dfds A/S 1,767 61,892 Eurobank Ergasias SA 30,919 61,085 Cable & Wireless Communications Plc 63,379 60,693
Sales Security Description Nominal Proceeds EUR Pandora A/S 1,403 158,093 Randgold Resources Ltd 1,626 132,567 Paddy Power Betfair Plc 1,007 130,242 Georg Fischer AG 187 127,368 Hera SpA 45,813 119,892 Croda International Plc 2,874 107,914 Galenica AG 85 106,796 KION Group AG 2,154 104,179 Swiss Prime Site AG 1,357 103,319 Gategroup Holding AG 2,576 103,171 Hiscox Ltd 8,001 100,566 Telefonica Deutschland Holding AG 20,779 97,548 Novozymes A/S 2,495 96,750 Nexity SA 2,117 93,595 ARM Holdings Plc 7,088 91,195 Dufry AG 827 89,205 LEG Immobilien AG 1,132 87,861 SMA Solar Technology AG 2,077 87,076 USG People NV 4,830 83,786 Ubisoft Entertainment SA 3,260 82,671
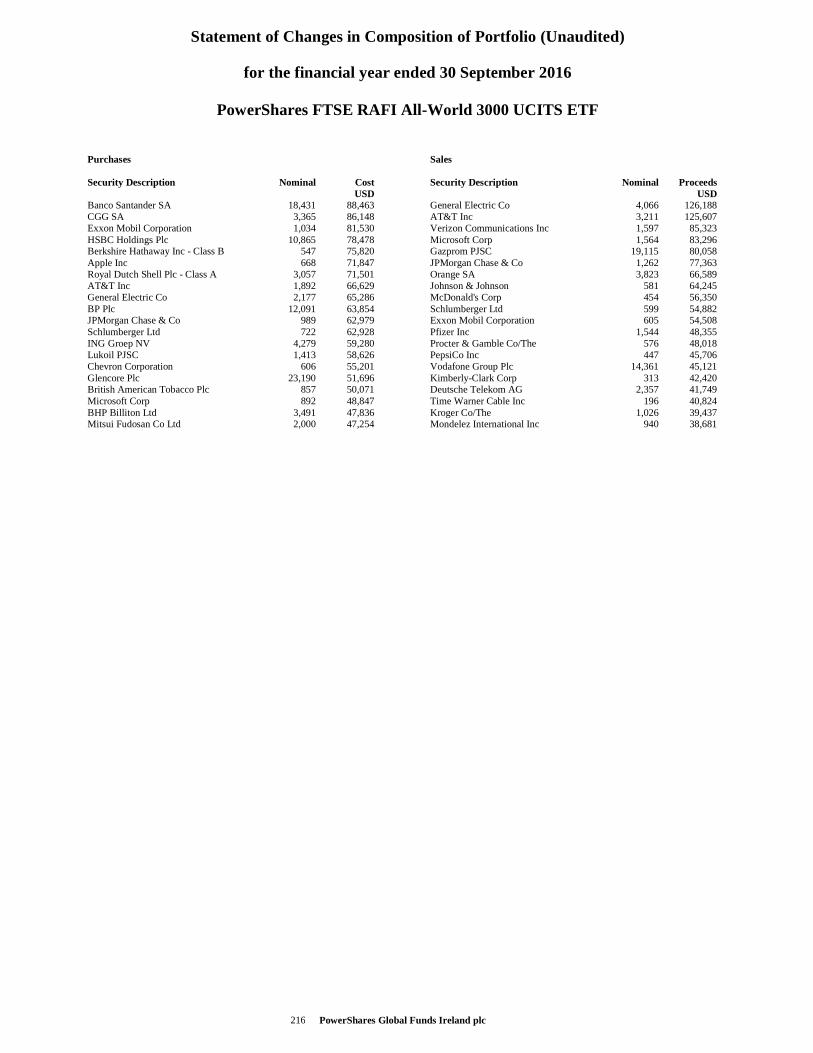
Statement of Changes in Composition of Portfolio (Unaudited)
for the financial year ended 30 September 2016
PowerShares FTSE RAFI All-World 3000 UCITS ETF
PowerShares Global Funds Ireland plc 216
Purchases Security Description Nominal Cost USD Banco Santander SA 18,431 88,463 CGG SA 3,365 86,148 Exxon Mobil Corporation 1,034 81,530 HSBC Holdings Plc 10,865 78,478 Berkshire Hathaway Inc - Class B 547 75,820 Apple Inc 668 71,847 Royal Dutch Shell Plc - Class A 3,057 71,501 AT&T Inc 1,892 66,629 General Electric Co 2,177 65,286 BP Plc 12,091 63,854 JPMorgan Chase & Co 989 62,979 Schlumberger Ltd 722 62,928 ING Groep NV 4,279 59,280 Lukoil PJSC 1,413 58,626 Chevron Corporation 606 55,201 Glencore Plc 23,190 51,696 British American Tobacco Plc 857 50,071 Microsoft Corp 892 48,847 BHP Billiton Ltd 3,491 47,836 Mitsui Fudosan Co Ltd 2,000 47,254
Sales Security Description Nominal Proceeds USD General Electric Co 4,066 126,188 AT&T Inc 3,211 125,607 Verizon Communications Inc 1,597 85,323 Microsoft Corp 1,564 83,296 Gazprom PJSC 19,115 80,058 JPMorgan Chase & Co 1,262 77,363 Orange SA 3,823 66,589 Johnson & Johnson 581 64,245 McDonald's Corp 454 56,350 Schlumberger Ltd 599 54,882 Exxon Mobil Corporation 605 54,508 Pfizer Inc 1,544 48,355 Procter & Gamble Co/The 576 48,018 PepsiCo Inc 447 45,706 Vodafone Group Plc 14,361 45,121 Kimberly-Clark Corp 313 42,420 Deutsche Telekom AG 2,357 41,749 Time Warner Cable Inc 196 40,824 Kroger Co/The 1,026 39,437 Mondelez International Inc 940 38,681
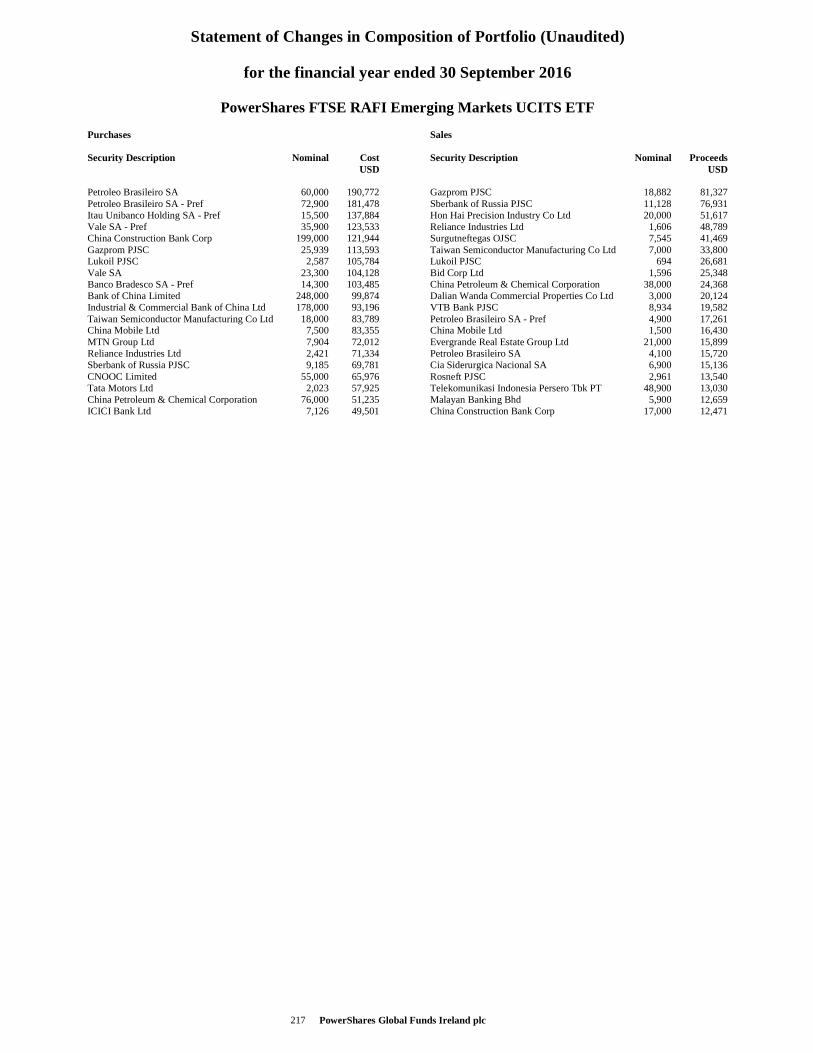
Statement of Changes in Composition of Portfolio (Unaudited)
for the financial year ended 30 September 2016
PowerShares FTSE RAFI Emerging Markets UCITS ETF
PowerShares Global Funds Ireland plc 217
Purchases Security Description Nominal Cost USD Petroleo Brasileiro SA 60,000 190,772 Petroleo Brasileiro SA - Pref 72,900 181,478 Itau Unibanco Holding SA - Pref 15,500 137,884 Vale SA - Pref 35,900 123,533 China Construction Bank Corp 199,000 121,944 Gazprom PJSC 25,939 113,593 Lukoil PJSC 2,587 105,784 Vale SA 23,300 104,128 Banco Bradesco SA - Pref 14,300 103,485 Bank of China Limited 248,000 99,874 Industrial & Commercial Bank of China Ltd 178,000 93,196 Taiwan Semiconductor Manufacturing Co Ltd 18,000 83,789 China Mobile Ltd 7,500 83,355 MTN Group Ltd 7,904 72,012 Reliance Industries Ltd 2,421 71,334 Sberbank of Russia PJSC 9,185 69,781 CNOOC Limited 55,000 65,976 Tata Motors Ltd 2,023 57,925 China Petroleum & Chemical Corporation 76,000 51,235 ICICI Bank Ltd 7,126 49,501
Sales Security Description Nominal Proceeds USD Gazprom PJSC 18,882 81,327 Sberbank of Russia PJSC 11,128 76,931 Hon Hai Precision Industry Co Ltd 20,000 51,617 Reliance Industries Ltd 1,606 48,789 Surgutneftegas OJSC 7,545 41,469 Taiwan Semiconductor Manufacturing Co Ltd 7,000 33,800 Lukoil PJSC 694 26,681 Bid Corp Ltd 1,596 25,348 China Petroleum & Chemical Corporation 38,000 24,368 Dalian Wanda Commercial Properties Co Ltd 3,000 20,124 VTB Bank PJSC 8,934 19,582 Petroleo Brasileiro SA - Pref 4,900 17,261 China Mobile Ltd 1,500 16,430 Evergrande Real Estate Group Ltd 21,000 15,899 Petroleo Brasileiro SA 4,100 15,720 Cia Siderurgica Nacional SA 6,900 15,136 Rosneft PJSC 2,961 13,540 Telekomunikasi Indonesia Persero Tbk PT 48,900 13,030 Malayan Banking Bhd 5,900 12,659 China Construction Bank Corp 17,000 12,471
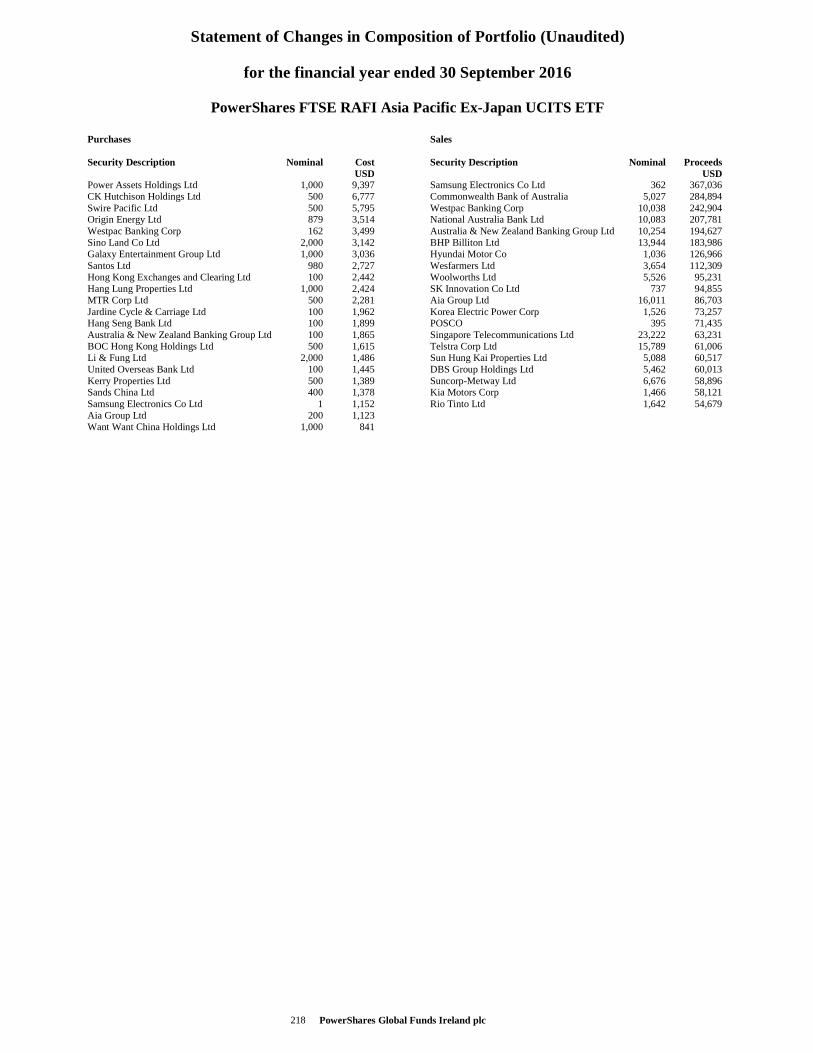
Statement of Changes in Composition of Portfolio (Unaudited)
for the financial year ended 30 September 2016
PowerShares FTSE RAFI Asia Pacific Ex-Japan UCITS ETF
PowerShares Global Funds Ireland plc 218
Purchases Security Description Nominal Cost USD Power Assets Holdings Ltd 1,000 9,397 CK Hutchison Holdings Ltd 500 6,777 Swire Pacific Ltd 500 5,795 Origin Energy Ltd 879 3,514 Westpac Banking Corp 162 3,499 Sino Land Co Ltd 2,000 3,142 Galaxy Entertainment Group Ltd 1,000 3,036 Santos Ltd 980 2,727 Hong Kong Exchanges and Clearing Ltd 100 2,442 Hang Lung Properties Ltd 1,000 2,424 MTR Corp Ltd 500 2,281 Jardine Cycle & Carriage Ltd 100 1,962 Hang Seng Bank Ltd 100 1,899 Australia & New Zealand Banking Group Ltd 100 1,865 BOC Hong Kong Holdings Ltd 500 1,615 Li & Fung Ltd 2,000 1,486 United Overseas Bank Ltd 100 1,445 Kerry Properties Ltd 500 1,389 Sands China Ltd 400 1,378 Samsung Electronics Co Ltd 1 1,152 Aia Group Ltd 200 1,123 Want Want China Holdings Ltd 1,000 841
Sales Security Description Nominal Proceeds USD Samsung Electronics Co Ltd 362 367,036 Commonwealth Bank of Australia 5,027 284,894 Westpac Banking Corp 10,038 242,904 National Australia Bank Ltd 10,083 207,781 Australia & New Zealand Banking Group Ltd 10,254 194,627 BHP Billiton Ltd 13,944 183,986 Hyundai Motor Co 1,036 126,966 Wesfarmers Ltd 3,654 112,309 Woolworths Ltd 5,526 95,231 SK Innovation Co Ltd 737 94,855 Aia Group Ltd 16,011 86,703 Korea Electric Power Corp 1,526 73,257 POSCO 395 71,435 Singapore Telecommunications Ltd 23,222 63,231 Telstra Corp Ltd 15,789 61,006 Sun Hung Kai Properties Ltd 5,088 60,517 DBS Group Holdings Ltd 5,462 60,013 Suncorp-Metway Ltd 6,676 58,896 Kia Motors Corp 1,466 58,121 Rio Tinto Ltd 1,642 54,679
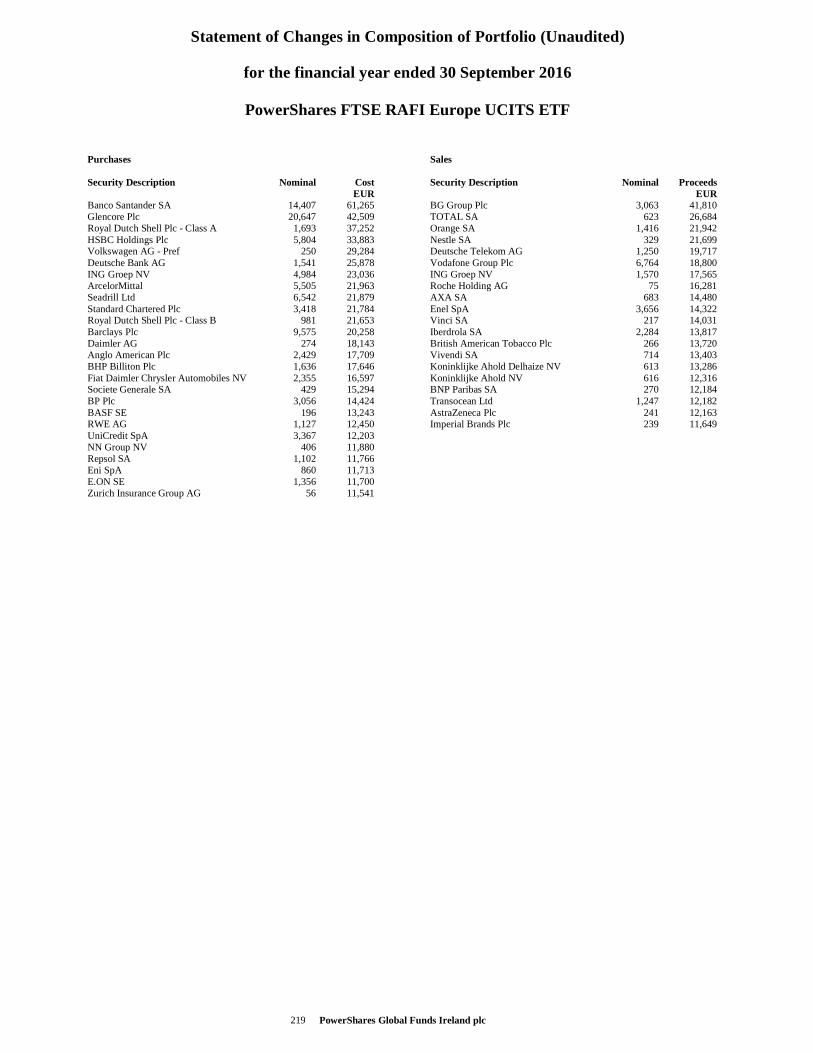
Statement of Changes in Composition of Portfolio (Unaudited)
for the financial year ended 30 September 2016
PowerShares FTSE RAFI Europe UCITS ETF
PowerShares Global Funds Ireland plc 219
Purchases Security Description Nominal Cost EUR Banco Santander SA 14,407 61,265 Glencore Plc 20,647 42,509 Royal Dutch Shell Plc - Class A 1,693 37,252 HSBC Holdings Plc 5,804 33,883 Volkswagen AG - Pref 250 29,284 Deutsche Bank AG 1,541 25,878 ING Groep NV 4,984 23,036 ArcelorMittal 5,505 21,963 Seadrill Ltd 6,542 21,879 Standard Chartered Plc 3,418 21,784 Royal Dutch Shell Plc - Class B 981 21,653 Barclays Plc 9,575 20,258 Daimler AG 274 18,143 Anglo American Plc 2,429 17,709 BHP Billiton Plc 1,636 17,646 Fiat Daimler Chrysler Automobiles NV 2,355 16,597 Societe Generale SA 429 15,294 BP Plc 3,056 14,424 BASF SE 196 13,243 RWE AG 1,127 12,450 UniCredit SpA 3,367 12,203 NN Group NV 406 11,880 Repsol SA 1,102 11,766 Eni SpA 860 11,713 E.ON SE 1,356 11,700 Zurich Insurance Group AG 56 11,541
Sales Security Description Nominal Proceeds EUR BG Group Plc 3,063 41,810 TOTAL SA 623 26,684 Orange SA 1,416 21,942 Nestle SA 329 21,699 Deutsche Telekom AG 1,250 19,717 Vodafone Group Plc 6,764 18,800 ING Groep NV 1,570 17,565 Roche Holding AG 75 16,281 AXA SA 683 14,480 Enel SpA 3,656 14,322 Vinci SA 217 14,031 Iberdrola SA 2,284 13,817 British American Tobacco Plc 266 13,720 Vivendi SA 714 13,403 Koninklijke Ahold Delhaize NV 613 13,286 Koninklijke Ahold NV 616 12,316 BNP Paribas SA 270 12,184 Transocean Ltd 1,247 12,182 AstraZeneca Plc 241 12,163 Imperial Brands Plc 239 11,649
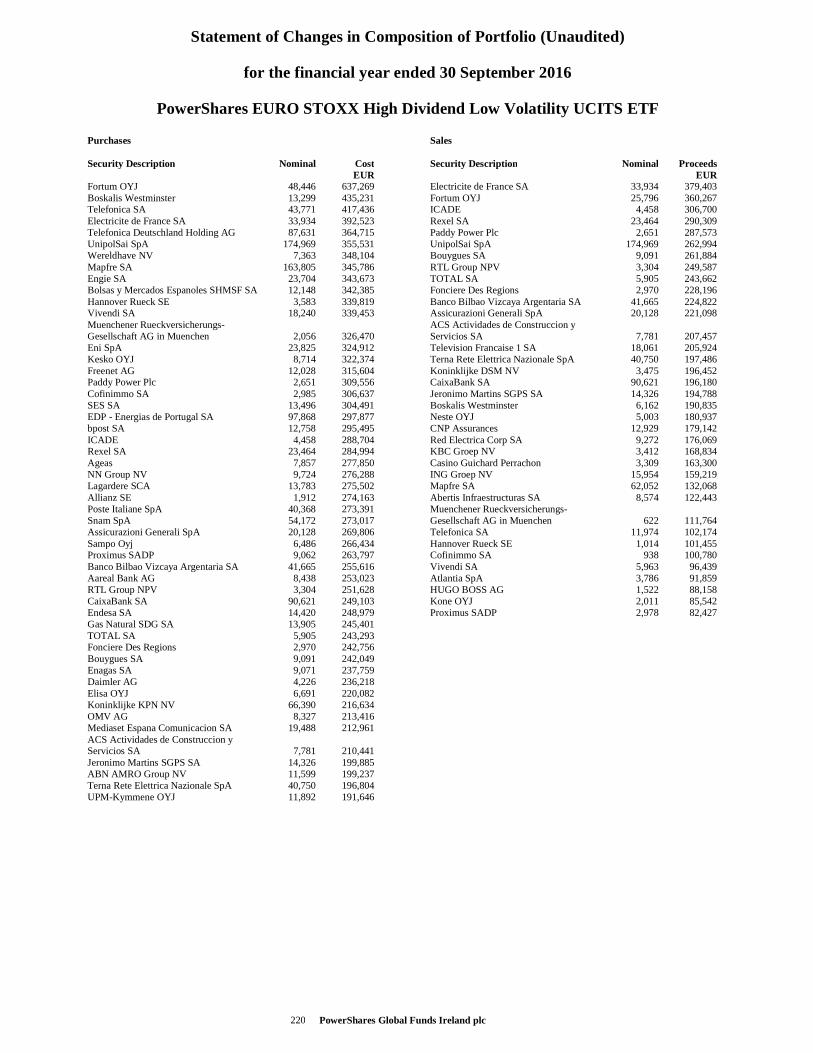
Statement of Changes in Composition of Portfolio (Unaudited)
for the financial year ended 30 September 2016
PowerShares EURO STOXX High Dividend Low Volatility UCITS ETF
PowerShares Global Funds Ireland plc 220
Purchases Security Description Nominal Cost EUR Fortum OYJ 48,446 637,269 Boskalis Westminster 13,299 435,231 Telefonica SA 43,771 417,436 Electricite de France SA 33,934 392,523 Telefonica Deutschland Holding AG 87,631 364,715 UnipolSai SpA 174,969 355,531 Wereldhave NV 7,363 348,104 Mapfre SA 163,805 345,786 Engie SA 23,704 343,673 Bolsas y Mercados Espanoles SHMSF SA 12,148 342,385 Hannover Rueck SE 3,583 339,819 Vivendi SA 18,240 339,453 Muenchener Rueckversicherungs-Gesellschaft AG in Muenchen 2,056 326,470 Eni SpA 23,825 324,912 Kesko OYJ 8,714 322,374 Freenet AG 12,028 315,604 Paddy Power Plc 2,651 309,556 Cofinimmo SA 2,985 306,637 SES SA 13,496 304,491 EDP - Energias de Portugal SA 97,868 297,877 bpost SA 12,758 295,495 ICADE 4,458 288,704 Rexel SA 23,464 284,994 Ageas 7,857 277,850 NN Group NV 9,724 276,288 Lagardere SCA 13,783 275,502 Allianz SE 1,912 274,163 Poste Italiane SpA 40,368 273,391 Snam SpA 54,172 273,017 Assicurazioni Generali SpA 20,128 269,806 Sampo Oyj 6,486 266,434 Proximus SADP 9,062 263,797 Banco Bilbao Vizcaya Argentaria SA 41,665 255,616 Aareal Bank AG 8,438 253,023 RTL Group NPV 3,304 251,628 CaixaBank SA 90,621 249,103 Endesa SA 14,420 248,979 Gas Natural SDG SA 13,905 245,401 TOTAL SA 5,905 243,293 Fonciere Des Regions 2,970 242,756 Bouygues SA 9,091 242,049 Enagas SA 9,071 237,759 Daimler AG 4,226 236,218 Elisa OYJ 6,691 220,082 Koninklijke KPN NV 66,390 216,634 OMV AG 8,327 213,416 Mediaset Espana Comunicacion SA 19,488 212,961 ACS Actividades de Construccion y Servicios SA 7,781 210,441 Jeronimo Martins SGPS SA 14,326 199,885 ABN AMRO Group NV 11,599 199,237 Terna Rete Elettrica Nazionale SpA 40,750 196,804 UPM-Kymmene OYJ 11,892 191,646
Sales Security Description Nominal Proceeds EUR Electricite de France SA 33,934 379,403 Fortum OYJ 25,796 360,267 ICADE 4,458 306,700 Rexel SA 23,464 290,309 Paddy Power Plc 2,651 287,573 UnipolSai SpA 174,969 262,994 Bouygues SA 9,091 261,884 RTL Group NPV 3,304 249,587 TOTAL SA 5,905 243,662 Fonciere Des Regions 2,970 228,196 Banco Bilbao Vizcaya Argentaria SA 41,665 224,822 Assicurazioni Generali SpA 20,128 221,098 ACS Actividades de Construccion y Servicios SA 7,781 207,457 Television Francaise 1 SA 18,061 205,924 Terna Rete Elettrica Nazionale SpA 40,750 197,486 Koninklijke DSM NV 3,475 196,452 CaixaBank SA 90,621 196,180 Jeronimo Martins SGPS SA 14,326 194,788 Boskalis Westminster 6,162 190,835 Neste OYJ 5,003 180,937 CNP Assurances 12,929 179,142 Red Electrica Corp SA 9,272 176,069 KBC Groep NV 3,412 168,834 Casino Guichard Perrachon 3,309 163,300 ING Groep NV 15,954 159,219 Mapfre SA 62,052 132,068 Abertis Infraestructuras SA 8,574 122,443 Muenchener Rueckversicherungs-Gesellschaft AG in Muenchen 622 111,764 Telefonica SA 11,974 102,174 Hannover Rueck SE 1,014 101,455 Cofinimmo SA 938 100,780 Vivendi SA 5,963 96,439 Atlantia SpA 3,786 91,859 HUGO BOSS AG 1,522 88,158 Kone OYJ 2,011 85,542 Proximus SADP 2,978 82,427
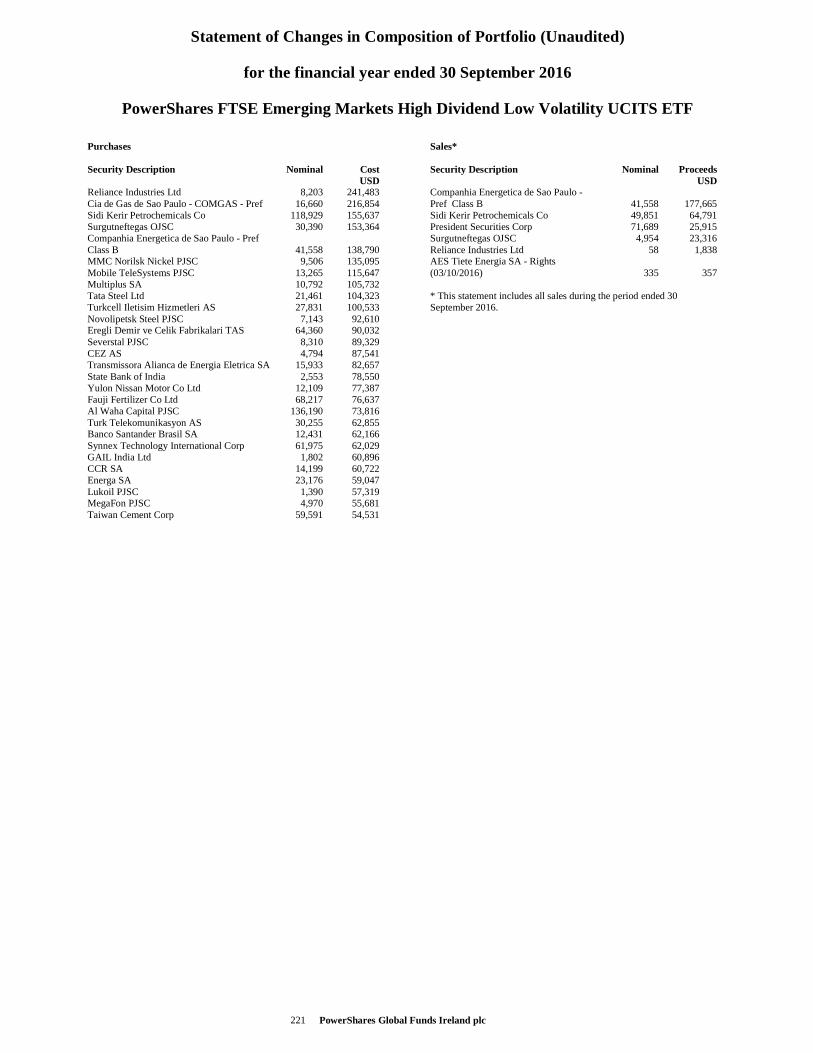
Statement of Changes in Composition of Portfolio (Unaudited)
for the financial year ended 30 September 2016
PowerShares FTSE Emerging Markets High Dividend Low Volatility UCITS ETF
PowerShares Global Funds Ireland plc 221
Purchases Security Description Nominal Cost USD Reliance Industries Ltd 8,203 241,483 Cia de Gas de Sao Paulo - COMGAS - Pref 16,660 216,854 Sidi Kerir Petrochemicals Co 118,929 155,637 Surgutneftegas OJSC 30,390 153,364 Companhia Energetica de Sao Paulo - Pref Class B 41,558 138,790 MMC Norilsk Nickel PJSC 9,506 135,095 Mobile TeleSystems PJSC 13,265 115,647 Multiplus SA 10,792 105,732 Tata Steel Ltd 21,461 104,323 Turkcell Iletisim Hizmetleri AS 27,831 100,533 Novolipetsk Steel PJSC 7,143 92,610 Eregli Demir ve Celik Fabrikalari TAS 64,360 90,032 Severstal PJSC 8,310 89,329 CEZ AS 4,794 87,541 Transmissora Alianca de Energia Eletrica SA 15,933 82,657 State Bank of India 2,553 78,550 Yulon Nissan Motor Co Ltd 12,109 77,387 Fauji Fertilizer Co Ltd 68,217 76,637 Al Waha Capital PJSC 136,190 73,816 Turk Telekomunikasyon AS 30,255 62,855 Banco Santander Brasil SA 12,431 62,166 Synnex Technology International Corp 61,975 62,029 GAIL India Ltd 1,802 60,896 CCR SA 14,199 60,722 Energa SA 23,176 59,047 Lukoil PJSC 1,390 57,319 MegaFon PJSC 4,970 55,681 Taiwan Cement Corp 59,591 54,531
Sales* Security Description Nominal Proceeds USD Companhia Energetica de Sao Paulo - Pref Class B 41,558 177,665 Sidi Kerir Petrochemicals Co 49,851 64,791 President Securities Corp 71,689 25,915 Surgutneftegas OJSC 4,954 23,316 Reliance Industries Ltd 58 1,838 AES Tiete Energia SA - Rights (03/10/2016) 335 357 * This statement includes all sales during the period ended 30 September 2016.
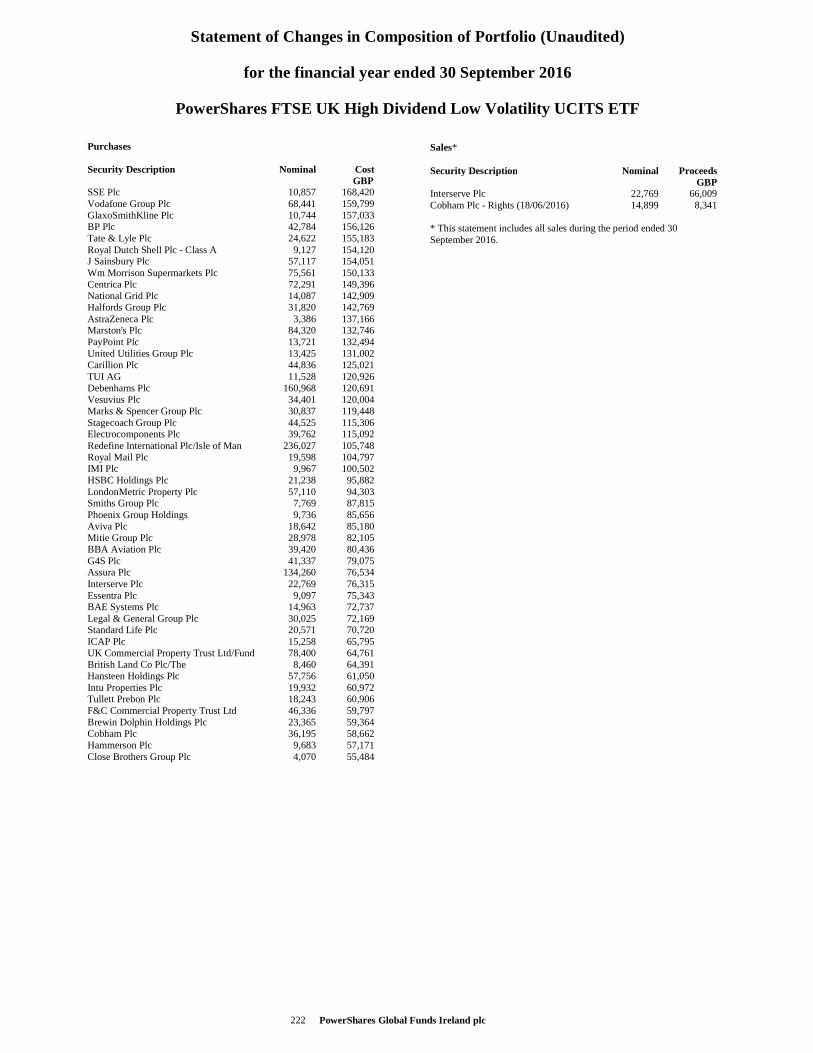
Statement of Changes in Composition of Portfolio (Unaudited)
for the financial year ended 30 September 2016
PowerShares FTSE UK High Dividend Low Volatility UCITS ETF
PowerShares Global Funds Ireland plc 222
Purchases Security Description Nominal Cost GBP SSE Plc 10,857 168,420 Vodafone Group Plc 68,441 159,799 GlaxoSmithKline Plc 10,744 157,033 BP Plc 42,784 156,126 Tate & Lyle Plc 24,622 155,183 Royal Dutch Shell Plc - Class A 9,127 154,120 J Sainsbury Plc 57,117 154,051 Wm Morrison Supermarkets Plc 75,561 150,133 Centrica Plc 72,291 149,396 National Grid Plc 14,087 142,909 Halfords Group Plc 31,820 142,769 AstraZeneca Plc 3,386 137,166 Marston's Plc 84,320 132,746 PayPoint Plc 13,721 132,494 United Utilities Group Plc 13,425 131,002 Carillion Plc 44,836 125,021 TUI AG 11,528 120,926 Debenhams Plc 160,968 120,691 Vesuvius Plc 34,401 120,004 Marks & Spencer Group Plc 30,837 119,448 Stagecoach Group Plc 44,525 115,306 Electrocomponents Plc 39,762 115,092 Redefine International Plc/Isle of Man 236,027 105,748 Royal Mail Plc 19,598 104,797 IMI Plc 9,967 100,502 HSBC Holdings Plc 21,238 95,882 LondonMetric Property Plc 57,110 94,303 Smiths Group Plc 7,769 87,815 Phoenix Group Holdings 9,736 85,656 Aviva Plc 18,642 85,180 Mitie Group Plc 28,978 82,105 BBA Aviation Plc 39,420 80,436 G4S Plc 41,337 79,075 Assura Plc 134,260 76,534 Interserve Plc 22,769 76,315 Essentra Plc 9,097 75,343 BAE Systems Plc 14,963 72,737 Legal & General Group Plc 30,025 72,169 Standard Life Plc 20,571 70,720 ICAP Plc 15,258 65,795 UK Commercial Property Trust Ltd/Fund 78,400 64,761 British Land Co Plc/The 8,460 64,391 Hansteen Holdings Plc 57,756 61,050 Intu Properties Plc 19,932 60,972 Tullett Prebon Plc 18,243 60,906 F&C Commercial Property Trust Ltd 46,336 59,797 Brewin Dolphin Holdings Plc 23,365 59,364 Cobham Plc 36,195 58,662 Hammerson Plc 9,683 57,171 Close Brothers Group Plc 4,070 55,484
Sales* Security Description Nominal Proceeds GBP Interserve Plc 22,769 66,009 Cobham Plc - Rights (18/06/2016) 14,899 8,341 * This statement includes all sales during the period ended 30 September 2016.
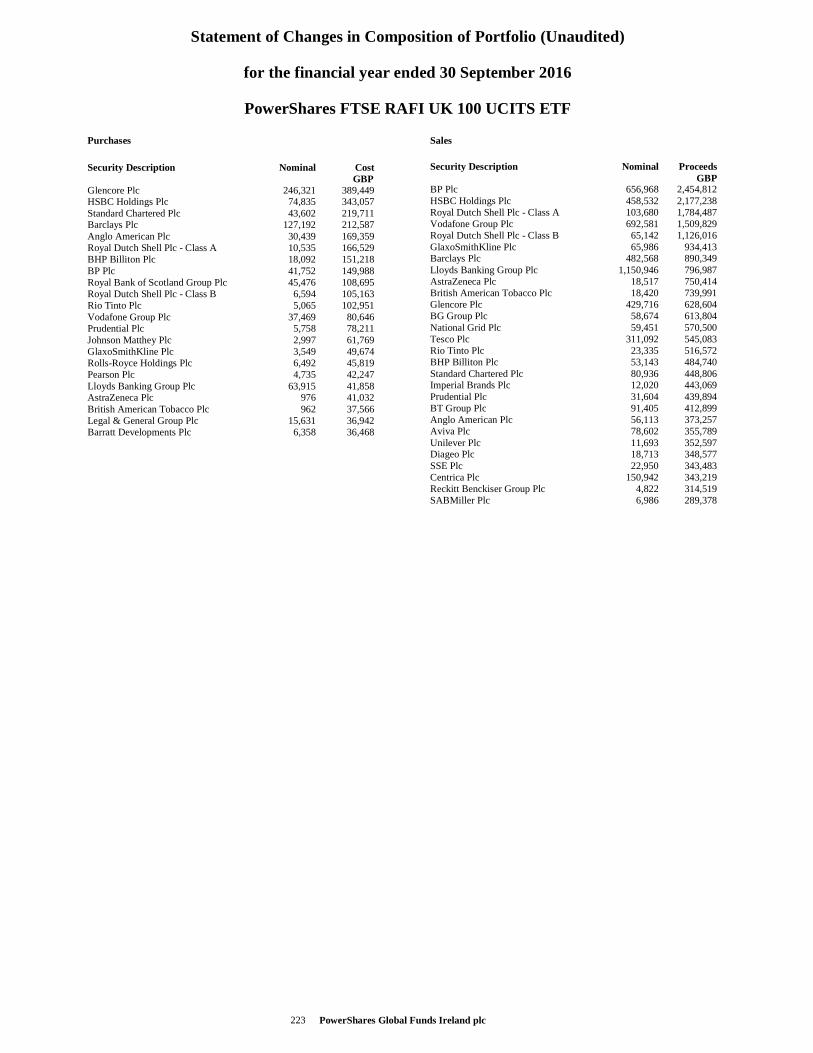
Statement of Changes in Composition of Portfolio (Unaudited)
for the financial year ended 30 September 2016
PowerShares FTSE RAFI UK 100 UCITS ETF
PowerShares Global Funds Ireland plc 223
Purchases
Security Description Nominal Cost GBP Glencore Plc 246,321 389,449 HSBC Holdings Plc 74,835 343,057 Standard Chartered Plc 43,602 219,711 Barclays Plc 127,192 212,587 Anglo American Plc 30,439 169,359 Royal Dutch Shell Plc - Class A 10,535 166,529 BHP Billiton Plc 18,092 151,218 BP Plc 41,752 149,988 Royal Bank of Scotland Group Plc 45,476 108,695 Royal Dutch Shell Plc - Class B 6,594 105,163 Rio Tinto Plc 5,065 102,951 Vodafone Group Plc 37,469 80,646 Prudential Plc 5,758 78,211 Johnson Matthey Plc 2,997 61,769 GlaxoSmithKline Plc 3,549 49,674 Rolls-Royce Holdings Plc 6,492 45,819 Pearson Plc 4,735 42,247 Lloyds Banking Group Plc 63,915 41,858 AstraZeneca Plc 976 41,032 British American Tobacco Plc 962 37,566 Legal & General Group Plc 15,631 36,942 Barratt Developments Plc 6,358 36,468
Sales
Security Description Nominal Proceeds GBP BP Plc 656,968 2,454,812 HSBC Holdings Plc 458,532 2,177,238 Royal Dutch Shell Plc - Class A 103,680 1,784,487 Vodafone Group Plc 692,581 1,509,829 Royal Dutch Shell Plc - Class B 65,142 1,126,016 GlaxoSmithKline Plc 65,986 934,413 Barclays Plc 482,568 890,349 Lloyds Banking Group Plc 1,150,946 796,987 AstraZeneca Plc 18,517 750,414 British American Tobacco Plc 18,420 739,991 Glencore Plc 429,716 628,604 BG Group Plc 58,674 613,804 National Grid Plc 59,451 570,500 Tesco Plc 311,092 545,083 Rio Tinto Plc 23,335 516,572 BHP Billiton Plc 53,143 484,740 Standard Chartered Plc 80,936 448,806 Imperial Brands Plc 12,020 443,069 Prudential Plc 31,604 439,894 BT Group Plc 91,405 412,899 Anglo American Plc 56,113 373,257 Aviva Plc 78,602 355,789 Unilever Plc 11,693 352,597 Diageo Plc 18,713 348,577 SSE Plc 22,950 343,483 Centrica Plc 150,942 343,219 Reckitt Benckiser Group Plc 4,822 314,519 SABMiller Plc 6,986 289,378
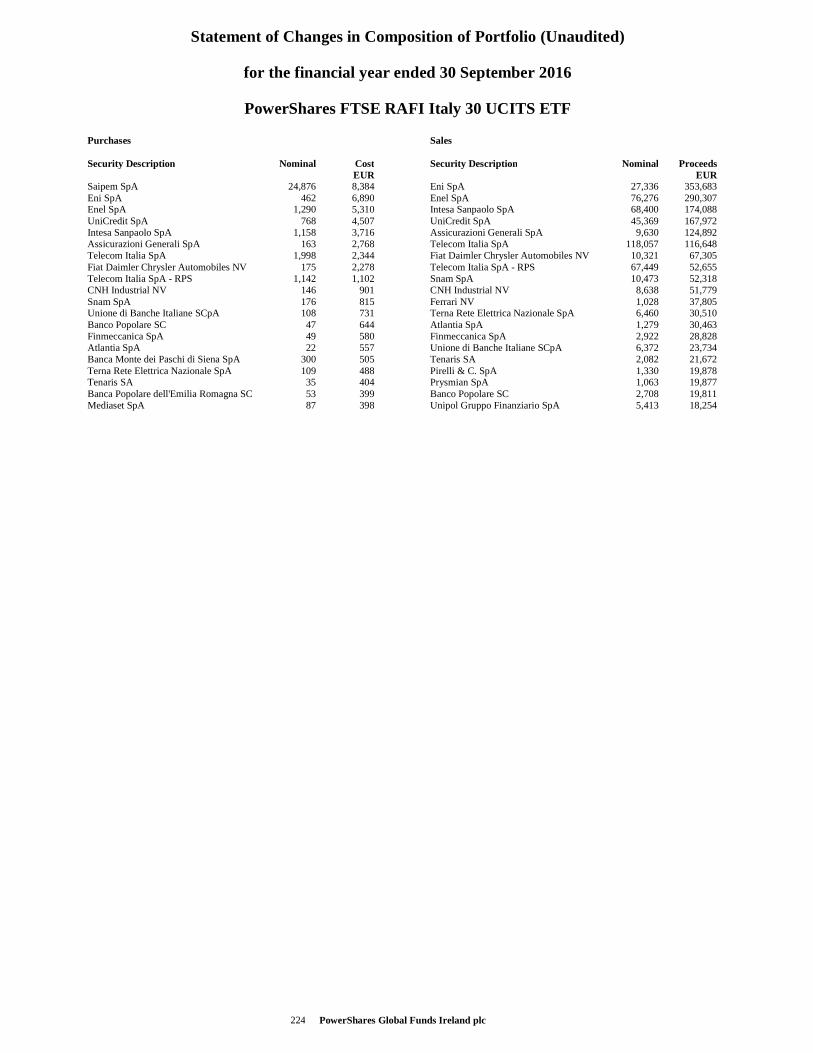
Statement of Changes in Composition of Portfolio (Unaudited)
for the financial year ended 30 September 2016
PowerShares FTSE RAFI Italy 30 UCITS ETF
PowerShares Global Funds Ireland plc 224
Purchases Security Description Nominal Cost EUR Saipem SpA 24,876 8,384 Eni SpA 462 6,890 Enel SpA 1,290 5,310 UniCredit SpA 768 4,507 Intesa Sanpaolo SpA 1,158 3,716 Assicurazioni Generali SpA 163 2,768 Telecom Italia SpA 1,998 2,344 Fiat Daimler Chrysler Automobiles NV 175 2,278 Telecom Italia SpA - RPS 1,142 1,102 CNH Industrial NV 146 901 Snam SpA 176 815 Unione di Banche Italiane SCpA 108 731 Banco Popolare SC 47 644 Finmeccanica SpA 49 580 Atlantia SpA 22 557 Banca Monte dei Paschi di Siena SpA 300 505 Terna Rete Elettrica Nazionale SpA 109 488 Tenaris SA 35 404 Banca Popolare dell'Emilia Romagna SC 53 399 Mediaset SpA 87 398
Sales Security Description Nominal Proceeds EUR Eni SpA 27,336 353,683 Enel SpA 76,276 290,307 Intesa Sanpaolo SpA 68,400 174,088 UniCredit SpA 45,369 167,972 Assicurazioni Generali SpA 9,630 124,892 Telecom Italia SpA 118,057 116,648 Fiat Daimler Chrysler Automobiles NV 10,321 67,305 Telecom Italia SpA - RPS 67,449 52,655 Snam SpA 10,473 52,318 CNH Industrial NV 8,638 51,779 Ferrari NV 1,028 37,805 Terna Rete Elettrica Nazionale SpA 6,460 30,510 Atlantia SpA 1,279 30,463 Finmeccanica SpA 2,922 28,828 Unione di Banche Italiane SCpA 6,372 23,734 Tenaris SA 2,082 21,672 Pirelli & C. SpA 1,330 19,878 Prysmian SpA 1,063 19,877 Banco Popolare SC 2,708 19,811 Unipol Gruppo Finanziario SpA 5,413 18,254
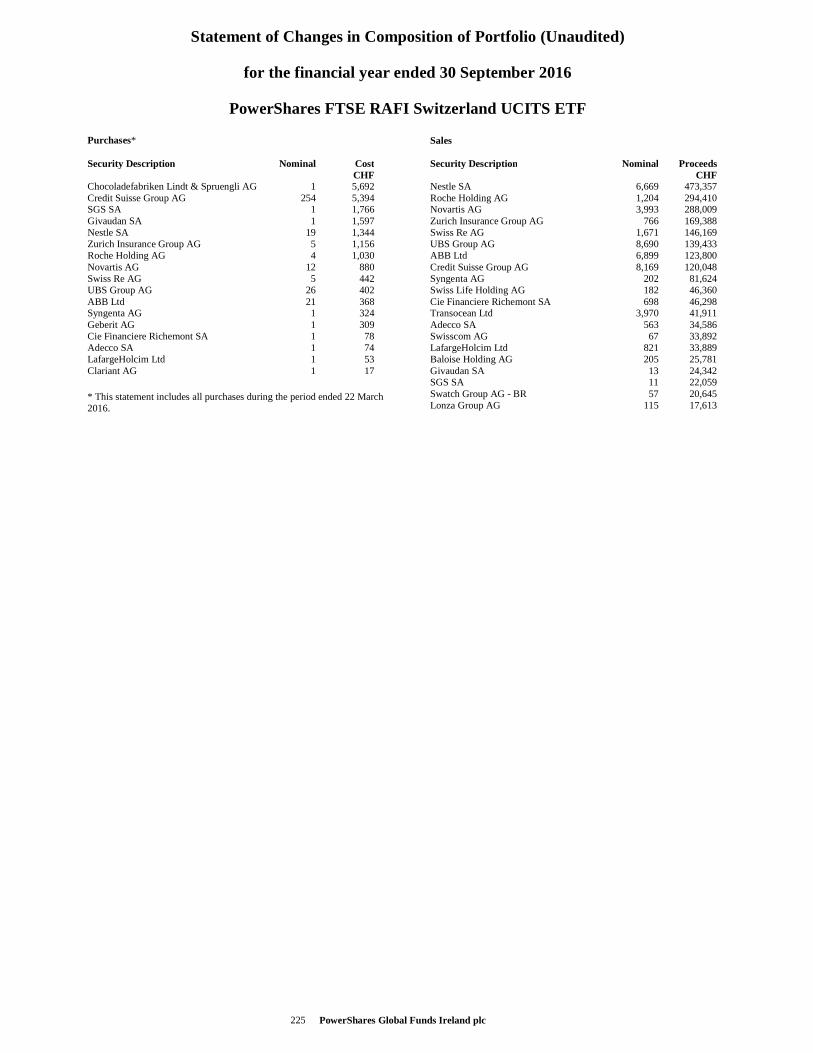
Statement of Changes in Composition of Portfolio (Unaudited)
for the financial year ended 30 September 2016
PowerShares FTSE RAFI Switzerland UCITS ETF
PowerShares Global Funds Ireland plc 225
Purchases* Security Description Nominal Cost CHF Chocoladefabriken Lindt & Spruengli AG 1 5,692 Credit Suisse Group AG 254 5,394 SGS SA 1 1,766 Givaudan SA 1 1,597 Nestle SA 19 1,344 Zurich Insurance Group AG 5 1,156 Roche Holding AG 4 1,030 Novartis AG 12 880 Swiss Re AG 5 442 UBS Group AG 26 402 ABB Ltd 21 368 Syngenta AG 1 324 Geberit AG 1 309 Cie Financiere Richemont SA 1 78 Adecco SA 1 74 LafargeHolcim Ltd 1 53 Clariant AG 1 17
* This statement includes all purchases during the period ended 22 March 2016.
Sales Security Description Nominal Proceeds CHF Nestle SA 6,669 473,357 Roche Holding AG 1,204 294,410 Novartis AG 3,993 288,009 Zurich Insurance Group AG 766 169,388 Swiss Re AG 1,671 146,169 UBS Group AG 8,690 139,433 ABB Ltd 6,899 123,800 Credit Suisse Group AG 8,169 120,048 Syngenta AG 202 81,624 Swiss Life Holding AG 182 46,360 Cie Financiere Richemont SA 698 46,298 Transocean Ltd 3,970 41,911 Adecco SA 563 34,586 Swisscom AG 67 33,892 LafargeHolcim Ltd 821 33,889 Baloise Holding AG 205 25,781 Givaudan SA 13 24,342 SGS SA 11 22,059 Swatch Group AG - BR 57 20,645 Lonza Group AG 115 17,613
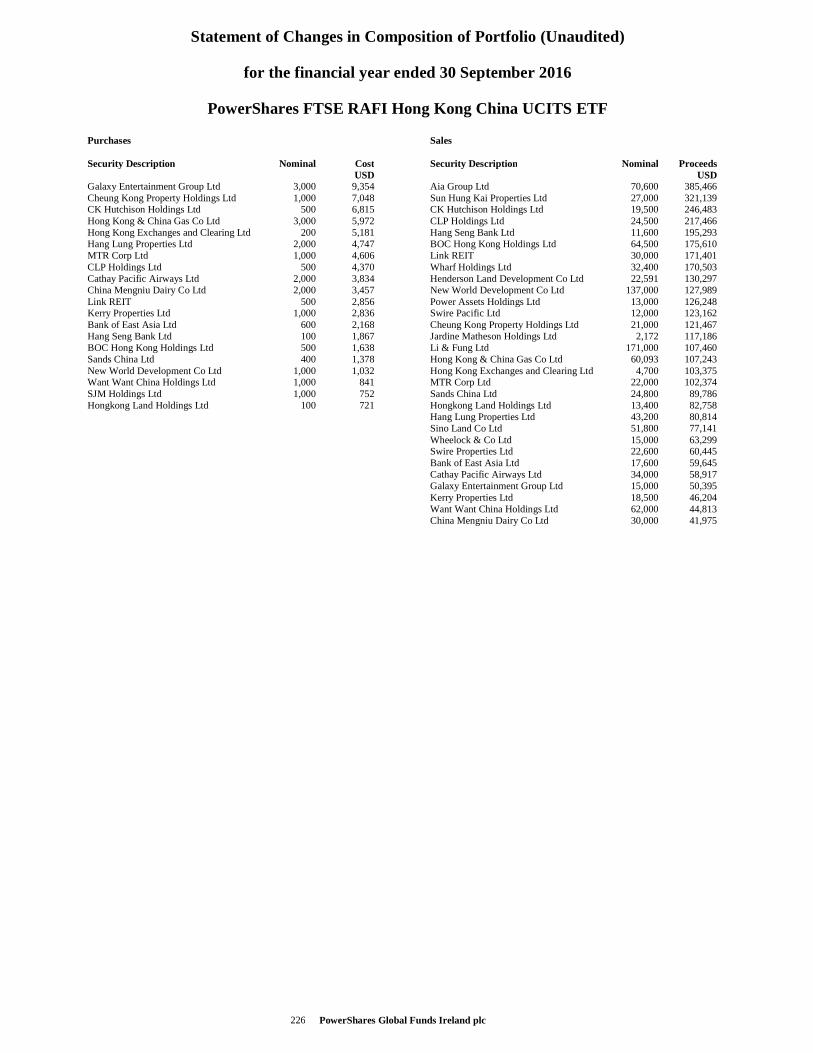
Statement of Changes in Composition of Portfolio (Unaudited)
for the financial year ended 30 September 2016
PowerShares FTSE RAFI Hong Kong China UCITS ETF
PowerShares Global Funds Ireland plc 226
Purchases Security Description Nominal Cost USD Galaxy Entertainment Group Ltd 3,000 9,354 Cheung Kong Property Holdings Ltd 1,000 7,048 CK Hutchison Holdings Ltd 500 6,815 Hong Kong & China Gas Co Ltd 3,000 5,972 Hong Kong Exchanges and Clearing Ltd 200 5,181 Hang Lung Properties Ltd 2,000 4,747 MTR Corp Ltd 1,000 4,606 CLP Holdings Ltd 500 4,370 Cathay Pacific Airways Ltd 2,000 3,834 China Mengniu Dairy Co Ltd 2,000 3,457 Link REIT 500 2,856 Kerry Properties Ltd 1,000 2,836 Bank of East Asia Ltd 600 2,168 Hang Seng Bank Ltd 100 1,867 BOC Hong Kong Holdings Ltd 500 1,638 Sands China Ltd 400 1,378 New World Development Co Ltd 1,000 1,032 Want Want China Holdings Ltd 1,000 841 SJM Holdings Ltd 1,000 752 Hongkong Land Holdings Ltd 100 721
Sales Security Description Nominal Proceeds USD Aia Group Ltd 70,600 385,466 Sun Hung Kai Properties Ltd 27,000 321,139 CK Hutchison Holdings Ltd 19,500 246,483 CLP Holdings Ltd 24,500 217,466 Hang Seng Bank Ltd 11,600 195,293 BOC Hong Kong Holdings Ltd 64,500 175,610 Link REIT 30,000 171,401 Wharf Holdings Ltd 32,400 170,503 Henderson Land Development Co Ltd 22,591 130,297 New World Development Co Ltd 137,000 127,989 Power Assets Holdings Ltd 13,000 126,248 Swire Pacific Ltd 12,000 123,162 Cheung Kong Property Holdings Ltd 21,000 121,467 Jardine Matheson Holdings Ltd 2,172 117,186 Li & Fung Ltd 171,000 107,460 Hong Kong & China Gas Co Ltd 60,093 107,243 Hong Kong Exchanges and Clearing Ltd 4,700 103,375 MTR Corp Ltd 22,000 102,374 Sands China Ltd 24,800 89,786 Hongkong Land Holdings Ltd 13,400 82,758 Hang Lung Properties Ltd 43,200 80,814 Sino Land Co Ltd 51,800 77,141 Wheelock & Co Ltd 15,000 63,299 Swire Properties Ltd 22,600 60,445 Bank of East Asia Ltd 17,600 59,645 Cathay Pacific Airways Ltd 34,000 58,917 Galaxy Entertainment Group Ltd 15,000 50,395 Kerry Properties Ltd 18,500 46,204 Want Want China Holdings Ltd 62,000 44,813 China Mengniu Dairy Co Ltd 30,000 41,975
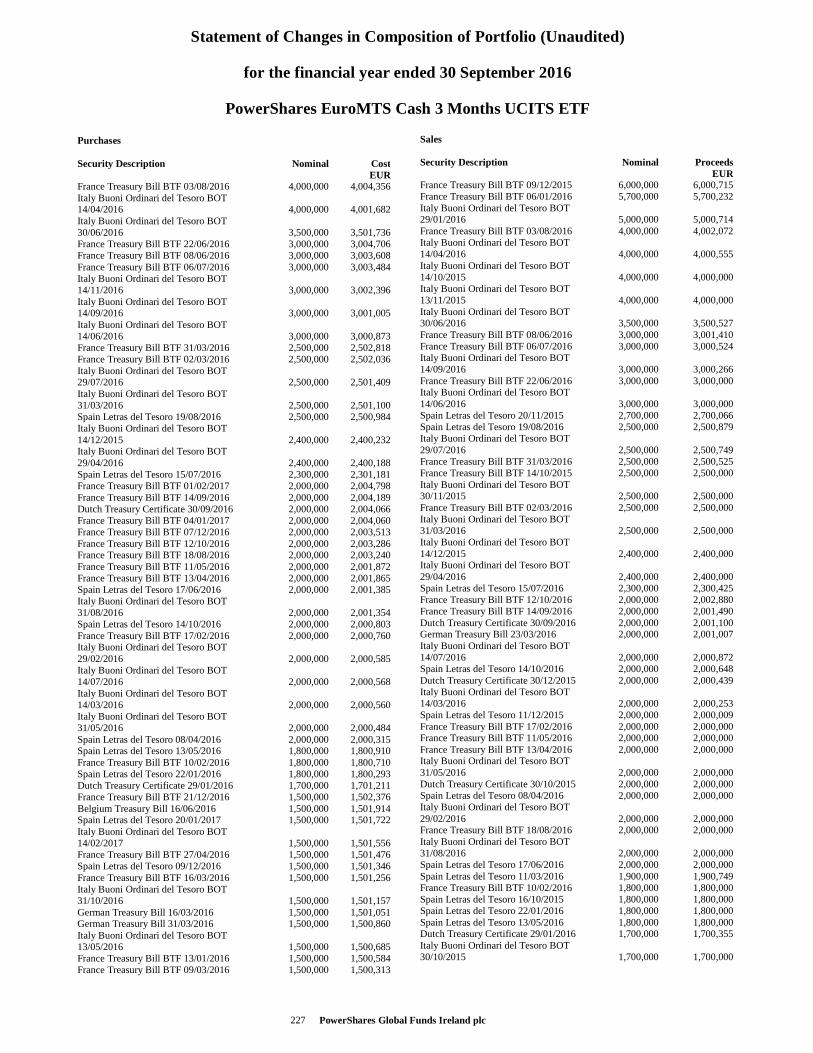
Statement of Changes in Composition of Portfolio (Unaudited)
for the financial year ended 30 September 2016
PowerShares EuroMTS Cash 3 Months UCITS ETF
PowerShares Global Funds Ireland plc 227
Purchases Security Description Nominal Cost EUR France Treasury Bill BTF 03/08/2016 4,000,000 4,004,356 Italy Buoni Ordinari del Tesoro BOT 14/04/2016 4,000,000 4,001,682 Italy Buoni Ordinari del Tesoro BOT 30/06/2016 3,500,000 3,501,736 France Treasury Bill BTF 22/06/2016 3,000,000 3,004,706 France Treasury Bill BTF 08/06/2016 3,000,000 3,003,608 France Treasury Bill BTF 06/07/2016 3,000,000 3,003,484 Italy Buoni Ordinari del Tesoro BOT 14/11/2016 3,000,000 3,002,396 Italy Buoni Ordinari del Tesoro BOT 14/09/2016 3,000,000 3,001,005 Italy Buoni Ordinari del Tesoro BOT 14/06/2016 3,000,000 3,000,873 France Treasury Bill BTF 31/03/2016 2,500,000 2,502,818 France Treasury Bill BTF 02/03/2016 2,500,000 2,502,036 Italy Buoni Ordinari del Tesoro BOT 29/07/2016 2,500,000 2,501,409 Italy Buoni Ordinari del Tesoro BOT 31/03/2016 2,500,000 2,501,100 Spain Letras del Tesoro 19/08/2016 2,500,000 2,500,984 Italy Buoni Ordinari del Tesoro BOT 14/12/2015 2,400,000 2,400,232 Italy Buoni Ordinari del Tesoro BOT 29/04/2016 2,400,000 2,400,188 Spain Letras del Tesoro 15/07/2016 2,300,000 2,301,181 France Treasury Bill BTF 01/02/2017 2,000,000 2,004,798 France Treasury Bill BTF 14/09/2016 2,000,000 2,004,189 Dutch Treasury Certificate 30/09/2016 2,000,000 2,004,066 France Treasury Bill BTF 04/01/2017 2,000,000 2,004,060 France Treasury Bill BTF 07/12/2016 2,000,000 2,003,513 France Treasury Bill BTF 12/10/2016 2,000,000 2,003,286 France Treasury Bill BTF 18/08/2016 2,000,000 2,003,240 France Treasury Bill BTF 11/05/2016 2,000,000 2,001,872 France Treasury Bill BTF 13/04/2016 2,000,000 2,001,865 Spain Letras del Tesoro 17/06/2016 2,000,000 2,001,385 Italy Buoni Ordinari del Tesoro BOT 31/08/2016 2,000,000 2,001,354 Spain Letras del Tesoro 14/10/2016 2,000,000 2,000,803 France Treasury Bill BTF 17/02/2016 2,000,000 2,000,760 Italy Buoni Ordinari del Tesoro BOT 29/02/2016 2,000,000 2,000,585 Italy Buoni Ordinari del Tesoro BOT 14/07/2016 2,000,000 2,000,568 Italy Buoni Ordinari del Tesoro BOT 14/03/2016 2,000,000 2,000,560 Italy Buoni Ordinari del Tesoro BOT 31/05/2016 2,000,000 2,000,484 Spain Letras del Tesoro 08/04/2016 2,000,000 2,000,315 Spain Letras del Tesoro 13/05/2016 1,800,000 1,800,910 France Treasury Bill BTF 10/02/2016 1,800,000 1,800,710 Spain Letras del Tesoro 22/01/2016 1,800,000 1,800,293 Dutch Treasury Certificate 29/01/2016 1,700,000 1,701,211 France Treasury Bill BTF 21/12/2016 1,500,000 1,502,376 Belgium Treasury Bill 16/06/2016 1,500,000 1,501,914 Spain Letras del Tesoro 20/01/2017 1,500,000 1,501,722 Italy Buoni Ordinari del Tesoro BOT 14/02/2017 1,500,000 1,501,556 France Treasury Bill BTF 27/04/2016 1,500,000 1,501,476 Spain Letras del Tesoro 09/12/2016 1,500,000 1,501,346 France Treasury Bill BTF 16/03/2016 1,500,000 1,501,256 Italy Buoni Ordinari del Tesoro BOT 31/10/2016 1,500,000 1,501,157 German Treasury Bill 16/03/2016 1,500,000 1,501,051 German Treasury Bill 31/03/2016 1,500,000 1,500,860 Italy Buoni Ordinari del Tesoro BOT 13/05/2016 1,500,000 1,500,685 France Treasury Bill BTF 13/01/2016 1,500,000 1,500,584 France Treasury Bill BTF 09/03/2016 1,500,000 1,500,313
Sales Security Description Nominal Proceeds EUR France Treasury Bill BTF 09/12/2015 6,000,000 6,000,715 France Treasury Bill BTF 06/01/2016 5,700,000 5,700,232 Italy Buoni Ordinari del Tesoro BOT 29/01/2016 5,000,000 5,000,714 France Treasury Bill BTF 03/08/2016 4,000,000 4,002,072 Italy Buoni Ordinari del Tesoro BOT 14/04/2016 4,000,000 4,000,555 Italy Buoni Ordinari del Tesoro BOT 14/10/2015 4,000,000 4,000,000 Italy Buoni Ordinari del Tesoro BOT 13/11/2015 4,000,000 4,000,000 Italy Buoni Ordinari del Tesoro BOT 30/06/2016 3,500,000 3,500,527 France Treasury Bill BTF 08/06/2016 3,000,000 3,001,410 France Treasury Bill BTF 06/07/2016 3,000,000 3,000,524 Italy Buoni Ordinari del Tesoro BOT 14/09/2016 3,000,000 3,000,266 France Treasury Bill BTF 22/06/2016 3,000,000 3,000,000 Italy Buoni Ordinari del Tesoro BOT 14/06/2016 3,000,000 3,000,000 Spain Letras del Tesoro 20/11/2015 2,700,000 2,700,066 Spain Letras del Tesoro 19/08/2016 2,500,000 2,500,879 Italy Buoni Ordinari del Tesoro BOT 29/07/2016 2,500,000 2,500,749 France Treasury Bill BTF 31/03/2016 2,500,000 2,500,525 France Treasury Bill BTF 14/10/2015 2,500,000 2,500,000 Italy Buoni Ordinari del Tesoro BOT 30/11/2015 2,500,000 2,500,000 France Treasury Bill BTF 02/03/2016 2,500,000 2,500,000 Italy Buoni Ordinari del Tesoro BOT 31/03/2016 2,500,000 2,500,000 Italy Buoni Ordinari del Tesoro BOT 14/12/2015 2,400,000 2,400,000 Italy Buoni Ordinari del Tesoro BOT 29/04/2016 2,400,000 2,400,000 Spain Letras del Tesoro 15/07/2016 2,300,000 2,300,425 France Treasury Bill BTF 12/10/2016 2,000,000 2,002,880 France Treasury Bill BTF 14/09/2016 2,000,000 2,001,490 Dutch Treasury Certificate 30/09/2016 2,000,000 2,001,100 German Treasury Bill 23/03/2016 2,000,000 2,001,007 Italy Buoni Ordinari del Tesoro BOT 14/07/2016 2,000,000 2,000,872 Spain Letras del Tesoro 14/10/2016 2,000,000 2,000,648 Dutch Treasury Certificate 30/12/2015 2,000,000 2,000,439 Italy Buoni Ordinari del Tesoro BOT 14/03/2016 2,000,000 2,000,253 Spain Letras del Tesoro 11/12/2015 2,000,000 2,000,009 France Treasury Bill BTF 17/02/2016 2,000,000 2,000,000 France Treasury Bill BTF 11/05/2016 2,000,000 2,000,000 France Treasury Bill BTF 13/04/2016 2,000,000 2,000,000 Italy Buoni Ordinari del Tesoro BOT 31/05/2016 2,000,000 2,000,000 Dutch Treasury Certificate 30/10/2015 2,000,000 2,000,000 Spain Letras del Tesoro 08/04/2016 2,000,000 2,000,000 Italy Buoni Ordinari del Tesoro BOT 29/02/2016 2,000,000 2,000,000 France Treasury Bill BTF 18/08/2016 2,000,000 2,000,000 Italy Buoni Ordinari del Tesoro BOT 31/08/2016 2,000,000 2,000,000 Spain Letras del Tesoro 17/06/2016 2,000,000 2,000,000 Spain Letras del Tesoro 11/03/2016 1,900,000 1,900,749 France Treasury Bill BTF 10/02/2016 1,800,000 1,800,000 Spain Letras del Tesoro 16/10/2015 1,800,000 1,800,000 Spain Letras del Tesoro 22/01/2016 1,800,000 1,800,000 Spain Letras del Tesoro 13/05/2016 1,800,000 1,800,000 Dutch Treasury Certificate 29/01/2016 1,700,000 1,700,355 Italy Buoni Ordinari del Tesoro BOT 30/10/2015 1,700,000 1,700,000
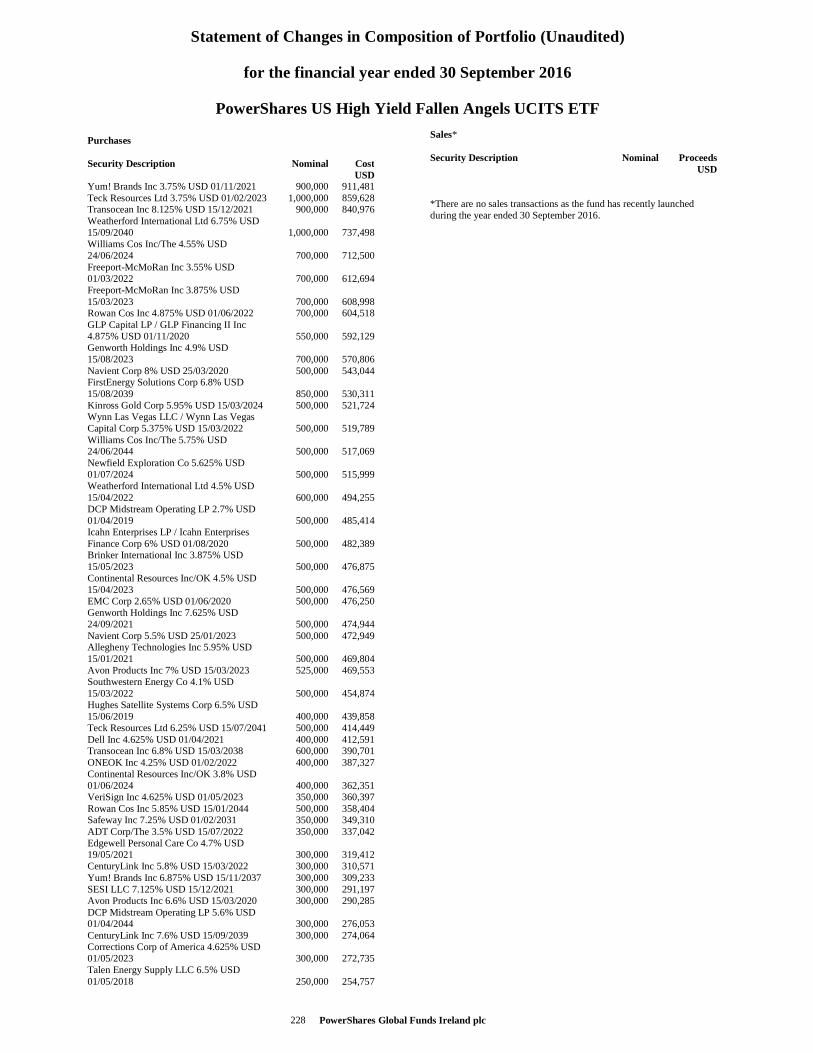
Statement of Changes in Composition of Portfolio (Unaudited)
for the financial year ended 30 September 2016
PowerShares US High Yield Fallen Angels UCITS ETF
PowerShares Global Funds Ireland plc 228
Purchases Security Description Nominal Cost USD Yum! Brands Inc 3.75% USD 01/11/2021 900,000 911,481 Teck Resources Ltd 3.75% USD 01/02/2023 1,000,000 859,628 Transocean Inc 8.125% USD 15/12/2021 900,000 840,976 Weatherford International Ltd 6.75% USD 15/09/2040 1,000,000 737,498 Williams Cos Inc/The 4.55% USD 24/06/2024 700,000 712,500 Freeport-McMoRan Inc 3.55% USD 01/03/2022 700,000 612,694 Freeport-McMoRan Inc 3.875% USD 15/03/2023 700,000 608,998 Rowan Cos Inc 4.875% USD 01/06/2022 700,000 604,518 GLP Capital LP / GLP Financing II Inc 4.875% USD 01/11/2020 550,000 592,129 Genworth Holdings Inc 4.9% USD 15/08/2023 700,000 570,806 Navient Corp 8% USD 25/03/2020 500,000 543,044 FirstEnergy Solutions Corp 6.8% USD 15/08/2039 850,000 530,311 Kinross Gold Corp 5.95% USD 15/03/2024 500,000 521,724 Wynn Las Vegas LLC / Wynn Las Vegas Capital Corp 5.375% USD 15/03/2022 500,000 519,789 Williams Cos Inc/The 5.75% USD 24/06/2044 500,000 517,069 Newfield Exploration Co 5.625% USD 01/07/2024 500,000 515,999 Weatherford International Ltd 4.5% USD 15/04/2022 600,000 494,255 DCP Midstream Operating LP 2.7% USD 01/04/2019 500,000 485,414 Icahn Enterprises LP / Icahn Enterprises Finance Corp 6% USD 01/08/2020 500,000 482,389 Brinker International Inc 3.875% USD 15/05/2023 500,000 476,875 Continental Resources Inc/OK 4.5% USD 15/04/2023 500,000 476,569 EMC Corp 2.65% USD 01/06/2020 500,000 476,250 Genworth Holdings Inc 7.625% USD 24/09/2021 500,000 474,944 Navient Corp 5.5% USD 25/01/2023 500,000 472,949 Allegheny Technologies Inc 5.95% USD 15/01/2021 500,000 469,804 Avon Products Inc 7% USD 15/03/2023 525,000 469,553 Southwestern Energy Co 4.1% USD 15/03/2022 500,000 454,874 Hughes Satellite Systems Corp 6.5% USD 15/06/2019 400,000 439,858 Teck Resources Ltd 6.25% USD 15/07/2041 500,000 414,449 Dell Inc 4.625% USD 01/04/2021 400,000 412,591 Transocean Inc 6.8% USD 15/03/2038 600,000 390,701 ONEOK Inc 4.25% USD 01/02/2022 400,000 387,327 Continental Resources Inc/OK 3.8% USD 01/06/2024 400,000 362,351 VeriSign Inc 4.625% USD 01/05/2023 350,000 360,397 Rowan Cos Inc 5.85% USD 15/01/2044 500,000 358,404 Safeway Inc 7.25% USD 01/02/2031 350,000 349,310 ADT Corp/The 3.5% USD 15/07/2022 350,000 337,042 Edgewell Personal Care Co 4.7% USD 19/05/2021 300,000 319,412 CenturyLink Inc 5.8% USD 15/03/2022 300,000 310,571 Yum! Brands Inc 6.875% USD 15/11/2037 300,000 309,233 SESI LLC 7.125% USD 15/12/2021 300,000 291,197 Avon Products Inc 6.6% USD 15/03/2020 300,000 290,285 DCP Midstream Operating LP 5.6% USD 01/04/2044 300,000 276,053 CenturyLink Inc 7.6% USD 15/09/2039 300,000 274,064 Corrections Corp of America 4.625% USD 01/05/2023 300,000 272,735 Talen Energy Supply LLC 6.5% USD 01/05/2018 250,000 254,757
Sales* Security Description Nominal Proceeds USD *There are no sales transactions as the fund has recently launched during the year ended 30 September 2016.
PowerShares Global Funds Ireland plc 229
Additional Information (Unaudited) - Remuneration Policy Following recent changes to the rules applicable to UCITS management companies (such as the Manager, Invesco Global Asset Management DAC), the Manager adopted on 18 March 2016 a revised remuneration policy which is consistent with the new remuneration principles applicable to UCITS management companies. Its purpose is to ensure that the remuneration of the staff of the Manager is consistent with and promote sound and effective risk management, does not encourage risk-taking which is inconsistent with the risk profiles, rules or instruments of incorporation of itself and the UCITS it manages (including the Company) and does not impair the Manager’s compliance with its duty to act in the best interests of the UCITS it manages. Further information is available in the Manager’s UCITS Remuneration Policy document which can be obtained from the website of the Manager (www.invescomanagementcompany.ie). A copy may be obtained, free of charge, at the registered office of the Manager.
The rules require the Manager to disclose in the Company’s annual report, certain quantitative disclosures concerning the Manager’s remuneration policy, including:
(i) the total and aggregate amount of remuneration paid by the Manager to its staff (including any amounts paid directly by the Company); (ii) the number of beneficiaries; (iii) a description of how the remuneration and benefits have been calculated; and (iv) certain information regarding the Manager’s oversight of its remuneration policy and details of any changes to the Manager’s remuneration policies since the previous annual report. However, as noted above, the revised policy has been in place for less than a full performance period. Consequently, in accordance with the relevant rules, the aforementioned disclosures are not included in this report as the available partial-year information would not provide materially relevant, reliable, comparable and clear information to investors. The Manager will disclose the quantitative UCITS remuneration data in the next annual report for the Company where information for a full performance year will be available.
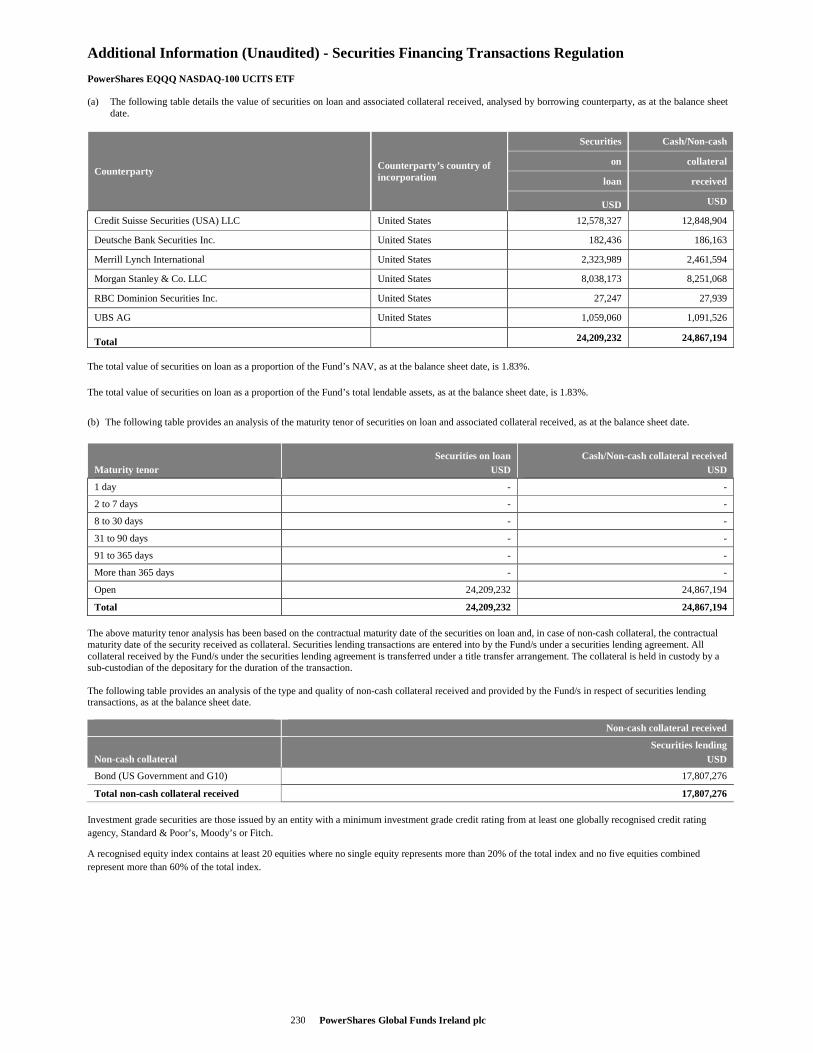
PowerShares Global Funds Ireland plc 230
Additional Information (Unaudited) - Securities Financing Transactions Regulation PowerShares EQQQ NASDAQ-100 UCITS ETF (a) The following table details the value of securities on loan and associated collateral received, analysed by borrowing counterparty, as at the balance sheet
date.
Counterparty Counterparty’s country of incorporation
Securities Cash/Non-cash
on collateral
loan received
USD USD
Credit Suisse Securities (USA) LLC United States 12,578,327 12,848,904
Deutsche Bank Securities Inc. United States 182,436 186,163
Merrill Lynch International United States 2,323,989 2,461,594
Morgan Stanley & Co. LLC United States 8,038,173 8,251,068
RBC Dominion Securities Inc. United States 27,247 27,939
UBS AG United States 1,059,060 1,091,526
Total 24,209,232 24,867,194
The total value of securities on loan as a proportion of the Fund’s NAV, as at the balance sheet date, is 1.83%.
The total value of securities on loan as a proportion of the Fund’s total lendable assets, as at the balance sheet date, is 1.83%.
(b) The following table provides an analysis of the maturity tenor of securities on loan and associated collateral received, as at the balance sheet date.
Maturity tenor Securities on loan
USD Cash/Non-cash collateral received
USD
1 day - -
2 to 7 days - -
8 to 30 days - -
31 to 90 days - -
91 to 365 days - -
More than 365 days - -
Open 24,209,232 24,867,194
Total 24,209,232 24,867,194 The above maturity tenor analysis has been based on the contractual maturity date of the securities on loan and, in case of non-cash collateral, the contractual maturity date of the security received as collateral. Securities lending transactions are entered into by the Fund/s under a securities lending agreement. All collateral received by the Fund/s under the securities lending agreement is transferred under a title transfer arrangement. The collateral is held in custody by a sub-custodian of the depositary for the duration of the transaction. The following table provides an analysis of the type and quality of non-cash collateral received and provided by the Fund/s in respect of securities lending transactions, as at the balance sheet date.
Non-cash collateral received
Non-cash collateral Securities lending
USD
Bond (US Government and G10) 17,807,276
Total non-cash collateral received 17,807,276 Investment grade securities are those issued by an entity with a minimum investment grade credit rating from at least one globally recognised credit rating agency, Standard & Poor’s, Moody’s or Fitch.
A recognised equity index contains at least 20 equities where no single equity represents more than 20% of the total index and no five equities combined represent more than 60% of the total index.
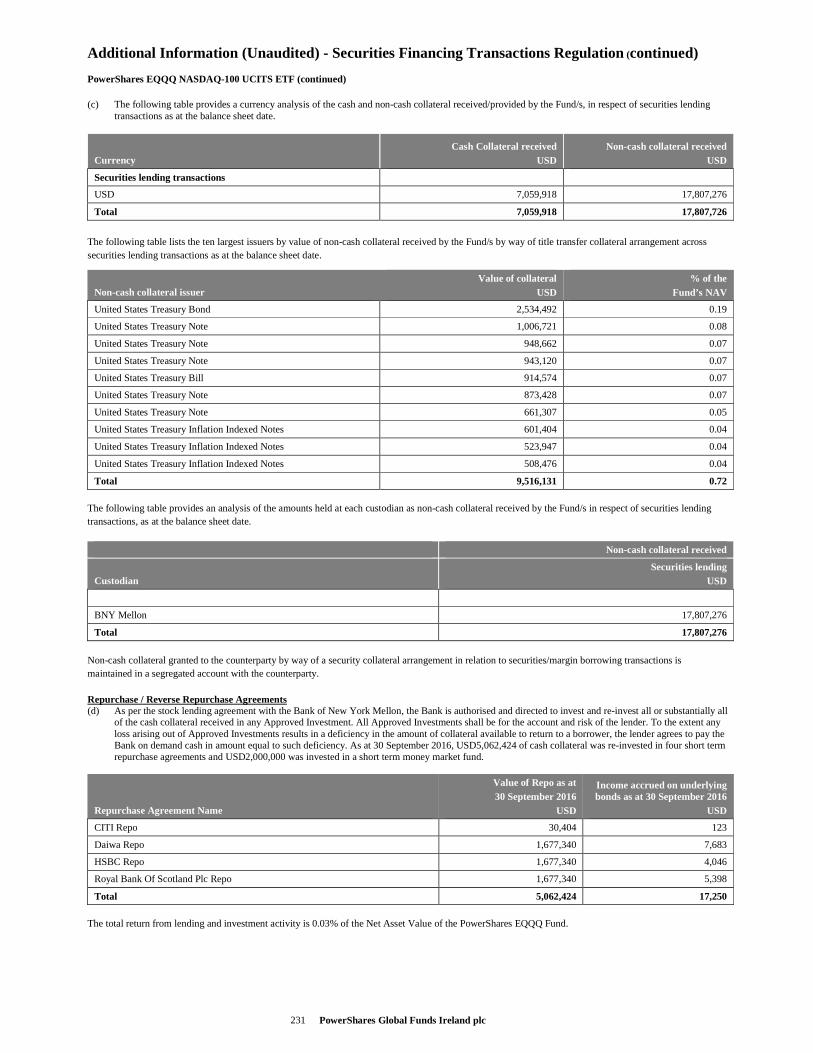
PowerShares Global Funds Ireland plc 231
Additional Information (Unaudited) - Securities Financing Transactions Regulation (continued) PowerShares EQQQ NASDAQ-100 UCITS ETF (continued)
(c) The following table provides a currency analysis of the cash and non-cash collateral received/provided by the Fund/s, in respect of securities lending transactions as at the balance sheet date.
Currency Cash Collateral received
USD Non-cash collateral received
USD
Securities lending transactions
USD 7,059,918 17,807,276
Total 7,059,918 17,807,726
The following table lists the ten largest issuers by value of non-cash collateral received by the Fund/s by way of title transfer collateral arrangement across securities lending transactions as at the balance sheet date.
Non-cash collateral issuer Value of collateral
USD % of the
Fund’s NAV
United States Treasury Bond 2,534,492 0.19
United States Treasury Note 1,006,721 0.08
United States Treasury Note 948,662 0.07
United States Treasury Note 943,120 0.07
United States Treasury Bill 914,574 0.07
United States Treasury Note 873,428 0.07
United States Treasury Note 661,307 0.05
United States Treasury Inflation Indexed Notes 601,404 0.04
United States Treasury Inflation Indexed Notes 523,947 0.04
United States Treasury Inflation Indexed Notes 508,476 0.04
Total 9,516,131 0.72
The following table provides an analysis of the amounts held at each custodian as non-cash collateral received by the Fund/s in respect of securities lending transactions, as at the balance sheet date.
Non-cash collateral received
Custodian Securities lending
USD
BNY Mellon 17,807,276
Total 17,807,276
Non-cash collateral granted to the counterparty by way of a security collateral arrangement in relation to securities/margin borrowing transactions is maintained in a segregated account with the counterparty.
Repurchase / Reverse Repurchase Agreements (d) As per the stock lending agreement with the Bank of New York Mellon, the Bank is authorised and directed to invest and re-invest all or substantially all
of the cash collateral received in any Approved Investment. All Approved Investments shall be for the account and risk of the lender. To the extent any loss arising out of Approved Investments results in a deficiency in the amount of collateral available to return to a borrower, the lender agrees to pay the Bank on demand cash in amount equal to such deficiency. As at 30 September 2016, USD5,062,424 of cash collateral was re-invested in four short term repurchase agreements and USD2,000,000 was invested in a short term money market fund.
Repurchase Agreement Name
Value of Repo as at 30 September 2016
USD
Income accrued on underlying bonds as at 30 September 2016
USD
CITI Repo 30,404 123
Daiwa Repo 1,677,340 7,683
HSBC Repo 1,677,340 4,046
Royal Bank Of Scotland Plc Repo 1,677,340 5,398
Total 5,062,424 17,250
The total return from lending and investment activity is 0.03% of the Net Asset Value of the PowerShares EQQQ Fund.
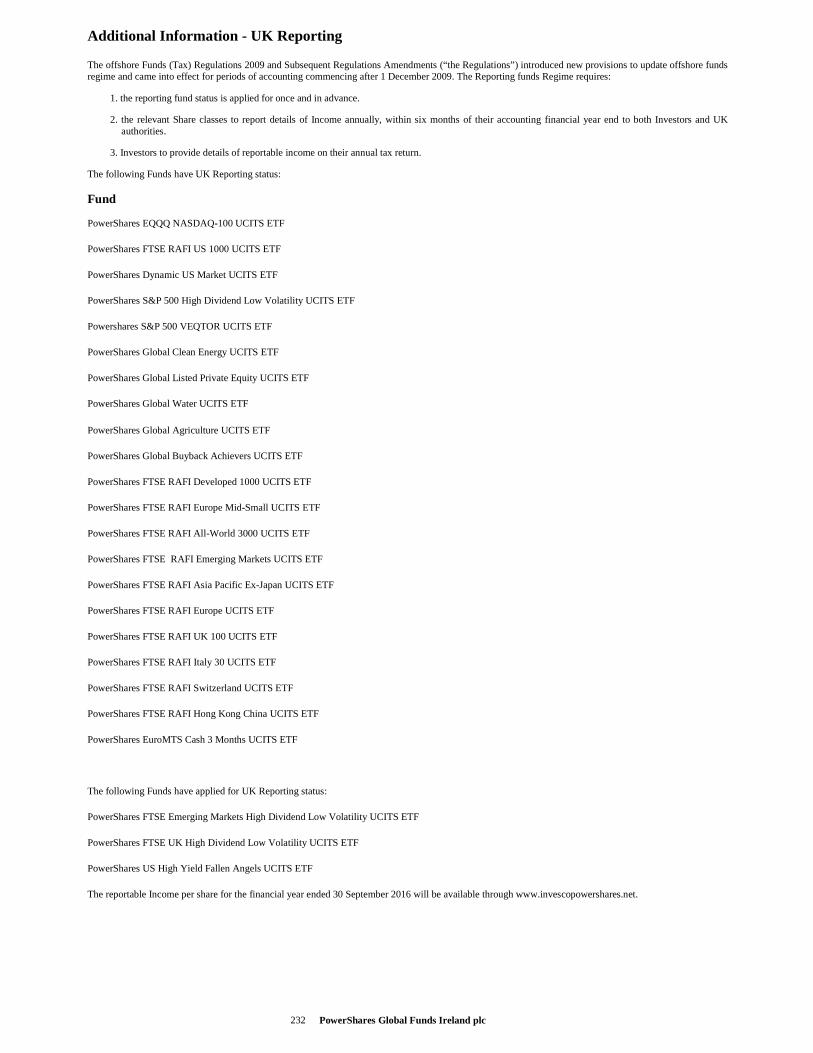
PowerShares Global Funds Ireland plc 232
Additional Information - UK Reporting
The offshore Funds (Tax) Regulations 2009 and Subsequent Regulations Amendments (“the Regulations”) introduced new provisions to update offshore funds regime and came into effect for periods of accounting commencing after 1 December 2009. The Reporting funds Regime requires:
1. the reporting fund status is applied for once and in advance.
2. the relevant Share classes to report details of Income annually, within six months of their accounting financial year end to both Investors and UK authorities.
3. Investors to provide details of reportable income on their annual tax return.
The following Funds have UK Reporting status: Fund PowerShares EQQQ NASDAQ-100 UCITS ETF
PowerShares FTSE RAFI US 1000 UCITS ETF
PowerShares Dynamic US Market UCITS ETF
PowerShares S&P 500 High Dividend Low Volatility UCITS ETF
Powershares S&P 500 VEQTOR UCITS ETF
PowerShares Global Clean Energy UCITS ETF
PowerShares Global Listed Private Equity UCITS ETF
PowerShares Global Water UCITS ETF PowerShares Global Agriculture UCITS ETF
PowerShares Global Buyback Achievers UCITS ETF
PowerShares FTSE RAFI Developed 1000 UCITS ETF
PowerShares FTSE RAFI Europe Mid-Small UCITS ETF
PowerShares FTSE RAFI All-World 3000 UCITS ETF
PowerShares FTSE RAFI Emerging Markets UCITS ETF
PowerShares FTSE RAFI Asia Pacific Ex-Japan UCITS ETF
PowerShares FTSE RAFI Europe UCITS ETF
PowerShares FTSE RAFI UK 100 UCITS ETF
PowerShares FTSE RAFI Italy 30 UCITS ETF
PowerShares FTSE RAFI Switzerland UCITS ETF
PowerShares FTSE RAFI Hong Kong China UCITS ETF
PowerShares EuroMTS Cash 3 Months UCITS ETF
The following Funds have applied for UK Reporting status:
PowerShares FTSE Emerging Markets High Dividend Low Volatility UCITS ETF
PowerShares FTSE UK High Dividend Low Volatility UCITS ETF
PowerShares US High Yield Fallen Angels UCITS ETF
The reportable Income per share for the financial year ended 30 September 2016 will be available through www.invescopowershares.net.


