Embed Size (px)
Citation preview
B.
DEPART
AND NATURA
SCHOOL OF EAR
UTTARA
(Teenpani Bypass, Behind
B.A
PRACTICAL
B.A./B.Sc. Ist Year
ARTMENT OF GEOGRAPHY
URAL RESOURCE MANAGEME
ARTH AND ENVIRONMENT SCIEN
RAKHAND OPEN UNIVERSITY
ehind Transport Nagar, Haldwani (Nainital), Uttarakhand,
A./B.Sc.GE-103
MENT
IENCES
khand, India)
BA/BSc GE-103 Uttarakhand Open University
PRACTICAL
BA/BSc GE-103
PRACTICAL
DEPARTMENT OF GEOGRAPHY
AND NATURAL RESOURCE MANAGEMENT
SCHOOL OF EARTH AND ENVIRONMENT SCIENCE
UTTARAKHAND OPEN UNIVERSITY
Phone No. 05946-261122, 261123
Toll free No. 18001804025
Fax No. 05946-264232, E. mail [email protected]
Website: https://uou.ac.in
BA/BSc GE-103 Uttarakhand Open University
PRACTICAL
BA/BSc GE-103
PRACTICAL
BA/BSc GE-103 Uttarakhand Open University
PRACTICAL
Board of Studies
Chairman Convener
Vice Chancellor Professor P.D. Pant
Uttarakhand Open University, Haldwani School of Earth and Environment Science
Uttarakhand Open University, Haldwani
Professor R.K. Pande Dr. B.R. Pant
Head, Department of Geography Head, Department of Geography
DSB Campus, Nainital MBPG College, Haldwani
Dr. D.S. Rawat Professor Anita Pande
Senior Scientist, GB Pant Institute of Department of Geography
Himalayan Environment and Development DSB Campus, Nainital
Kosi-Katarmal, Almora
Dr. H.C. Joshi Dr. Ranju J. Pandey
Department of Environmental Science Department of Geography & Nat.Res.Mgmt
School of Earth and Environment Science School of Earth and Environment Science
Uttarakhand Open University, Haldwani Uttarakhand Open University, Haldwani
Course Coordinator
Dr. Ranju J. Pandey
Department of Geography and Natural Resource Management
School of Earth and Environment Science
Uttarakhand Open University, Haldwani
Unit Writers
Unit Written By: Unit No.
1. Dr. S.C.Bansal
Retd.Professor
Meera Villa, D.S.O.Compound, Court Road, Saharanpur-247001
1, 2, 3, 7, 8, 9 &
10
2. Dr. Jyoti Joshi
Associate Professor, Department of Geography
SSJ University, Almora
4, 5 & 6
BA/BSc GE-103 Uttarakhand Open University
PRACTICAL
Editorial Board
Prof. V.C. Pandey Dr. Ranju J. Pandey
Head, Department of Geography Department of Geography and
DBS PG College, Dehradun Natural Resource Management
School of Earth and Environment Science
Uttarakhand Open University
Haldwani, Nainital
Late Mr. Mohammad Akram
Department of Geography and
Natural Resource Management
School of Earth and Environment Science
Uttarakhand Open University
Haldwani, Nainital
Title : Practical
ISBN : 978-93-857-40-63-3
Copyright : Uttarakhand Open University
Edition : First (2017), Second (2020)
Published By : Uttarakhand Open University, Haldwani, Nainital-263139
Printed By : Uttarayan Prakashan, Haldwani
BA/BSc GE-103 Uttarakhand Open University
PRACTICAL
CONTENTS Page No
BLOCK-1 SCALE AND MAPS
UNIT:1 Scale: Plain, Comparative, Diagonal Scale 1-19
UNIT:2 Elements and Types of Maps 20-31
UNIT:3 Enlargement and Reduction of Maps 32-43
BLOCK-2 REPRESANTATION OF PHYSICAL DATA
UNIT:4 Methods of Showing Relief 44-63
UNIT:5 Representation of Relief Features by Contours 64-80
UNIT:6 Representation of Climatic Data 81-99
BLOCK-3 Weather maps and Indian Topo-sheets
UNIT:7 Weather Instruments 100-118
UNIT:8 Interpretation of Indian Weather Maps 119-134
UNIT:9 Topographical Maps of India 135-145
UNIT:10 Interpretation of Topo-sheets 146-159
BA/BSC GE-103 PRACTICAL Uttarakhand Open University
UNIT 1: SCALE: PLAIN, COMPARATIVE AND DIAGONAL SCALE Page 1 of Page 159
BLOCK-1 SCALE AND MAPS
UNIT 1: SCALE: PLAIN, COMPARATIVE AND
DIAGONAL SCALE
1.1 OBJECTIVES
1.2 INTRODUCTION
1.3 DEFINITION OF SCALE
1.4 METHODS OF EXPRESSING SCALE ON A MAP
(SIMPLE STATEMENT METHODS, GRAPHICAL
METHODS, REPRESENTATIVE FRACTION METHODS)
1.5 SCALE CONVERSION
1.6 GRAPHICAL SCALE (PLAIN SCALE, COMPARATIVE
SCALE, DIAGONAL SCALE)
1.7 CONCLUSION
1.8 SUMMARY
1.9 GLOSSARY
1.10 ANSWER TO CHECK YOUR PROGRESS
1.11 REFERENCES
1.12 SUGGESTED READINGS
1.13 TERMINAL QUESTIONS
BA/BSC GE-103 PRACTICAL Uttarakhand Open University
UNIT 1: SCALE: PLAIN, COMPARATIVE AND DIAGONAL SCALE Page 2 of Page 159
1.1 OBJECTIVES
After studying this Unit, you should be able to:
Understand the meaning and definition of Scale and Map.
Explain the types of scale and its methods to show on the map.
Describe enlargement and reduction of maps.
1.2 INTRODUCTION
Scale has the meaning of a ratio. It signifies the proportion of a length on the map
which bears actual distance on the ground. To speak, the scale of one cm. to a km. means that
if we measure two cm. as the distance between two buildings shown on the map, the actual
distance would be two km. In determining the scales, it is necessary to bear in mind the
purpose, for which the map is intended, as well as the amount and the character of the detail
to be shown. Town plans require a large scale in order to show the layout of buildings and
other related aspects. An Atlas map is designed to show the main details in a brief form. So,
It is essential that on any plan or map there should be some indication of the scaleso that the
actual distances may be calculated.
1.3 DEFINITION OF SCALE
The distances on the map are smaller than the corresponding distance on actual
ground. Maps always bear a definite proportion to the area shown on that. So, the scale is the
proportion of the distance between any two points on the map, corresponding to the actual
distance between these two points on the ground. Actually, scale is a ratio of two distances
i.e. the map distance and the ground distance. Thus, the ratio between these two distances is
the scale of the map. For example, if we say that scale is one cm. to one km., we mean that a
length of one cm. on the map corresponds to a distance of one km. on the ground i.e. 1cm =
1km.
The scale we chose primarily depends on:
The size of the area to be mapped
The amount of details to be shown and
The size of the paper
According to our need-we can have ‘Small Scales’ and ‘Large Scales’
Small scales show km. to the cm. such as 5kms to 1 cm.
Large scales show cm. to the km. such as 10 cm. to 1 km.
Small scale depicts large area covered on a small size of paper. The map with such
scale shows only important features. It may have a loss of information.
Large Scale depicts small area covered on a good size of paper. The map with such
scale shows in detail the geographical features.
The choice of proper scale for a map always depends upon the purpose for which it is drawn.
BA/BSC GE-103 PRACTICAL Uttarakhand Open University
UNIT 1: SCALE: PLAIN, COMPARATIVE AND DIAGONAL SCALE Page 3 of Page 159
1.4 METHODS OF EXPRESSING SCALE ON A MAP
There are three methods, by which the scale of map is expressed: (i) by a statement
method, (ii) by a numerical fraction or (iii) by a graphical scale method :
(i) By Simple Statement Method : In this method, the scale is expressed in words, such
as one cm. to 1km. or 1 inch to 1 mile, etc. This indicates that one cm. on the map
corresponds to one km. on the ground or so on. This method is easy and is understood
well especially for those who are less educated. This method has two limitations.
Firstly, it can be understood only by those who are familiar with the unit of
measurement used. Secondly, when a map is reduced or enlarged from the original,
the scale will not be the same. This creates problems in measurement.
(ii) By a Representative Fraction Method: This expresses the proportion of the scale by
a fraction in which the numerator is one and the denominator is also in the same unit
of length. For example, if the Representative Fraction (Commonly written as R.F.) is
stated to 1/1,00,000 or 1:1,00,000 this means that one units on the map represents,
1,00,000 of the same unit on the ground. If it is an inch then 1” on the map represents
1,00,000 inch on the ground i.e. 1.578 miles. If it is in centimeter, then 1cm. on the
map represents 1,00,000 cm. on the ground i.e., 1 cm represents 1 km.
Distance on the Map
R.F. = ----------------------------
Distance on the ground
Hence, this method of stating the scale is independent of any particular unit of
measurement. It is an universal unit. It can be converted into any unit. It can be used
by any country according to its own unit of measurement. However, the R.F. will no
longer be true, when the map is enlarged or reduced photographically. In that case, the
linear method of scale will be better.
(iii) By a Graphical Scale Method: This is also known as a plain or a linear scale. This is
merely a straight line divided at certain intervals, so that the distances on the map can
easily be measured with the help of a scale in terms of distances on the ground. This
scale is expressed as a horizontal or straight line. In the construction, a convenient
length of the line should be drawn, so that the distance on the map can be easily read.
The line is usually about 10 to 15 cm. in length. The units should be shown in round
number in kms. The divisions are usually in multiples of tens so that further sub-
divisions, if necessary become possible. For convenience, the primary divisions are
shown on the right hand side of zero, while secondary divisions (sub-divisions of the
primary division) are marked off to the left of the zero mark.
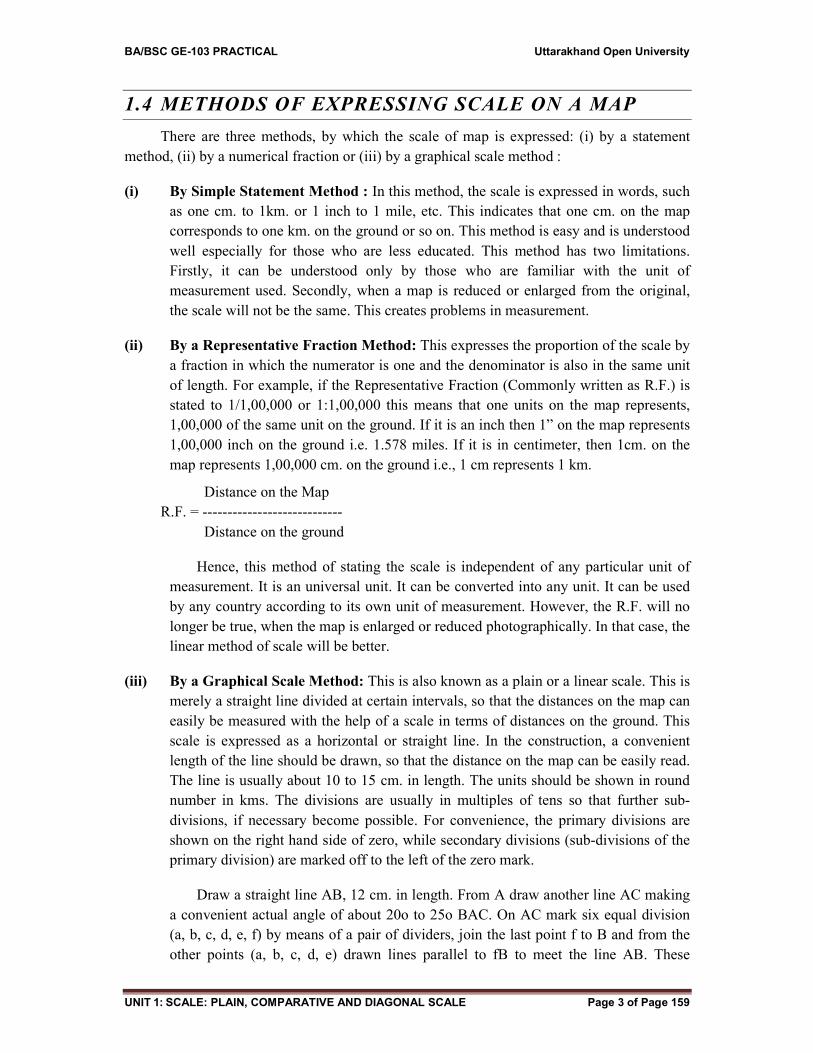
Draw a straight line AB, 12 cm. in length. From A draw another line AC making
a convenient actual angle of about 20o to 25o BAC. On AC mark six equal division
(a, b, c, d, e, f) by means of a pair of dividers, join the last point f to B and from the
other points (a, b, c, d, e) drawn lines parallel to fB to meet the line AB. These
BA/BSC GE-103 PRACTICAL Uttarakhand Open University
UNIT 1: SCALE: PLAIN, COMPARATIVE AND DIAGONAL SCALE Page 4 of Page 159
parallel lines will cut AB into six divisions, each being equal to 5km. These are the
primary division (Fig. 1.1).
Fig. 1 .1 Construction of Linear Scale
To obtain the secondary division, sub-divide the first primary division, i.e. the
division on the extreme left into five equal parts as shown in Fig. 1.1 Each of the these
secondary division will represent one km.
While numbering the scale, zero should be marked after one interval from the left, so
that the left hand end of the line can be numbered 5 and the primary divisions to the right of
zero can have numbers 5,10,15,20 and 25. This method of numbering enables us to read off
directly the whole numbers as well as the fraction from the scale.
Example 1: Construct a linear or graphical scale for a map drawn to a scale of 1:1,00,000 to
read into km. and divide it into primary and secondary division.
Solution: If we take 10 cm. lines on the paper, it will represent 10 km. It is a convenient
round number in scale because it can be divided into 10 primary divisions, and thus one
division will represent one km. The first primary division on the left side of the linear scale is
divided here in two equal parts, called as secondary division. Each secondary division will
represent 500m, while numbering the scale, zero should be marked after one primary division
from the left. This method of numbering enables us to read off directly the whole numbers as
well as the fraction from the scale.
Example 2: If the scale of a map is 1:2,50,000, construct a graphical scale with primary and
secondary divisions to read up to one km. Here 1cm. represents 2.5 km. or 2,50,000 cm.
Suppose, if we take a line of 12 cm. length, the length of the scale line will represent 12 2.5
cm. = 30 km.
This is an even number and is convenient for the construction of a scale. Now, to
construct a linear scale for 30 km to read upto 1 km firstly we will have to determine the
number of primary divisions. Here 12 cm. represents 30 km. It means that 1 cm will represent
BA/BSC GE-103 PRACTICAL Uttarakhand Open University
UNIT 1: SCALE: PLAIN, COMPARATIVE AND DIAGONAL SCALE Page 5 of Page 159
2.5 km. We may conveniently divide 12 cm line into six divisions, so that each primary
division reads 5 km. and to read secondary division, one primary division of the extreme left
of the scale, is divided into five equal divisions to represent one small division equal to 1 km.
1.5 SCALE CONVERSION
The statement scale and the representative fraction scale, both are substitutes of one
other. So, both are not shown on the map at one time. Though there is a tradition that R.F. is
shown along with the linear scale on the map. Sometimes, when the map is reduced or
enlarged then, this R.F. needs the change, as because; the length of linear scale also gets
changed. It is also to be noted that sometimes we need to change the statement scale into
representative fraction or in ratio scale. Thus, it becomes necessary for us to acquaint
ourselves with the technique of the conversion of all these methods of scale into each other.
The following examples will be able to clarify these methods of all these changes.
1. Calculate the R.F. when the scale is 5” to one mile.
5” = 1 mile or 63360”
5” = 63360 or R.F. is 1:12672
2. Calculate the scale in inches, when the scale of map is one cm. = one km.
1 cm. = 1 km. or 1,00,000 cm. or R.F. is 1:1,00,000
In inches 1 inch = 1,00,000 inch
63360 inch = 1 mile 1:100,00063360 = 0.63” the scale is 0.63” to the mile or 1” =
1.578 miles
3. The distance between Meerut and Delhi is 60 km. This distance on a map is shown by
a line of 6 cm. Find out the R.F. of the Map :
: 6 cm. represents 60 km. or (601,00,000) cm.
: 1 cm. will represent = 60/10 = 10 km.
: So the R.F. of the map is 1 : 1,00,0000
4. Find the R.F. when the scale is 1” to 3 miles
1 = 3 miles or 1 = 3 63360 = 190080
So R.F. is 1 : 1,90,080
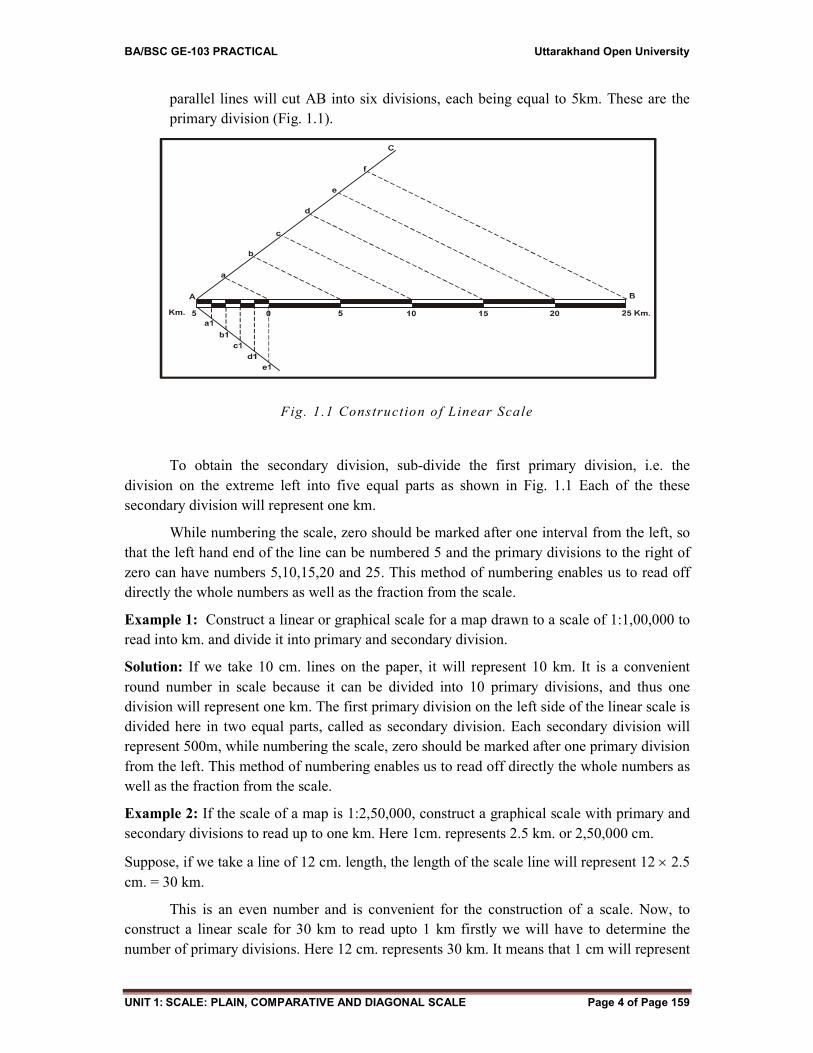
R.F. of a map is 1:50,000, Draw a simple linear scale of this map.
1 cm. = 50,000 cm. 1 cm. =100000
50000km.
1 cm. = ½ km. or 2 cm. = 1 km.
BA/BSC GE-103 PRACTICAL Uttarakhand Open University
UNIT 1: SCALE: PLAIN, COMPARATIVE AND DIAGONAL SCALE Page 6 of Page 159
Fig. 1 .2
Draw a line of 16 cm. length, and divide it into eight primary divisions, and thus one primary
division will show a distance of 1 km.
1.6 GRAPHICAL SCALE
It is also known as linear scale, as it is shown with the help of a line. The length of the line is
determined according to the size of paper. The following points should be kept in mind, at the
time of construction of linear scale:
1. Linear scale should indicate the actual distance in round figure, such as 5,10,15 and so
on.
2. The length of linear scale may not be in round or full digit. It may be in decimal,
which is obtained after the calculation.
3. The length of the graphical scale should be between 4 to 6 inch or 10 cm to 15 cm.
This length may be adjusted with an addition of half inch or 1 cm.
4. The division of linear scale into primary and secondary divisions should be made by
geometrical methods.
5. The value of each division should be mentioned on the upper side.
6. The left side of the scale has the secondary division, showing the smallest
measurement of the scale.
7. The linear scale, if it is decorated with two parallel lines in that case the lower line
should be thick. Each section of the scale may be shaded in alternate manner.
Types of Graphical Scale
This scale has so many specialized forms. These are based on various purposes:-1.Plain
Scale, 2.Pace Scale, 3.Time Scale, 4.Comparative Scale, 5.Diagonal Scale, 6.Vernier Scale.
(1) Plain Scale
This scale simply represents the measurement of distances. In one scale, the
measurement in two units can easily be shown, such as km. and metre, mile and furlong or
yard, yard and feet. This scale is generally used on the maps. This scale may be drawn as a
single or double line. Double lines scale with alternate spaces filled black, are commonly
used for good effect.
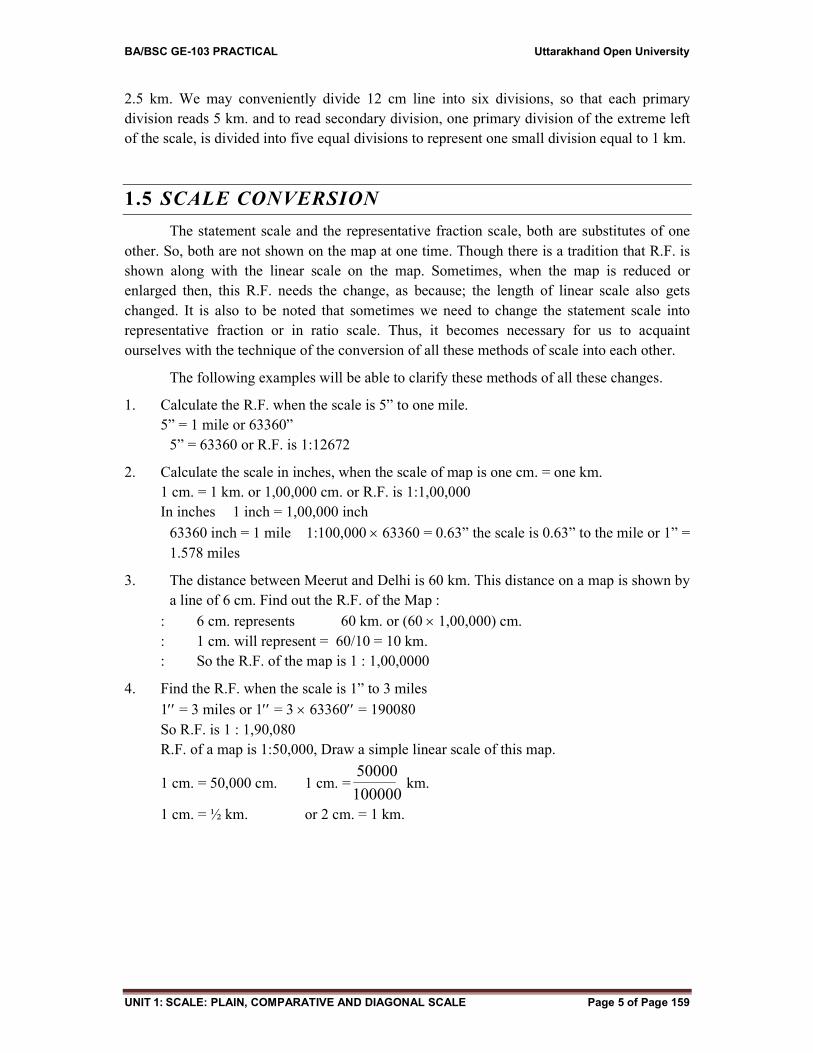
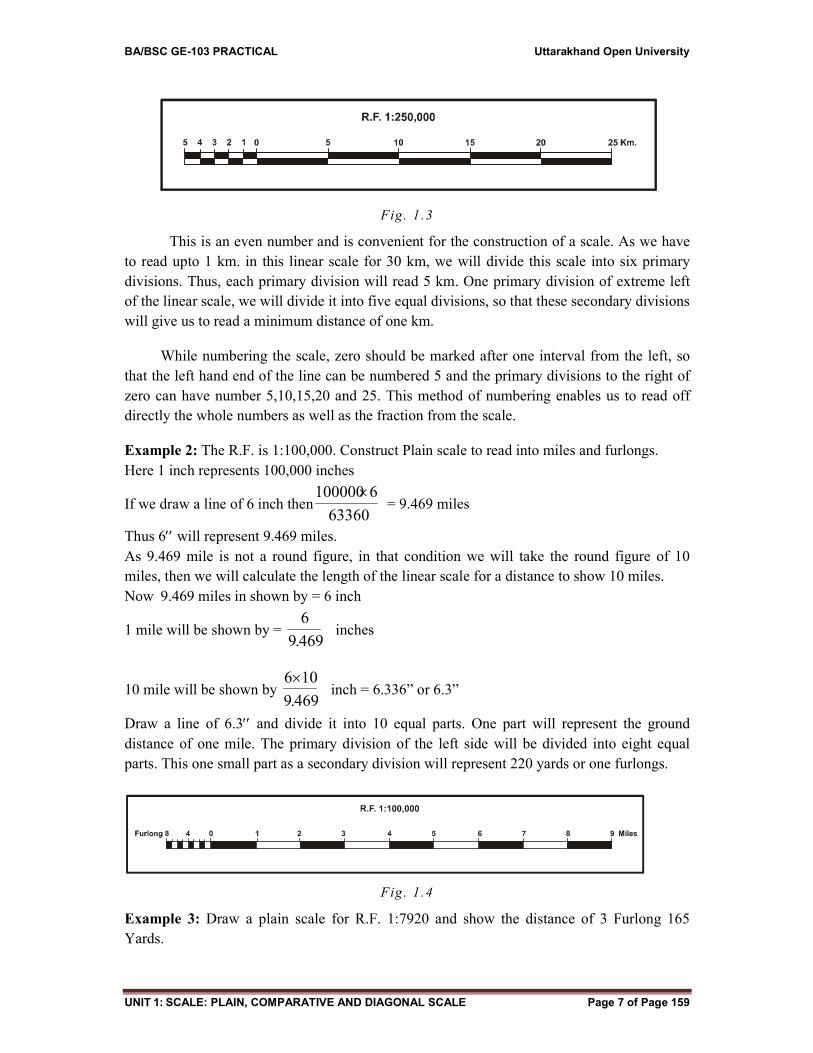
Example 1: The R.F. of a map is 1:250,000. Construct a plain scale with primary and
secondary divisions to read upto one km.
Solution: Here, one cm. represents 250,000 cm. if we draw a line of 12 cm. it will represent
the number of km. in following way:
Here, 1 cm. represents 250,000 cm or100000
250000km. = 2.5 km.
A line of 12 cm. will represent 2.5 km. 12 = 30 km.
BA/BSC GE-103 PRACTICAL Uttarakhand Open University
UNIT 1: SCALE: PLAIN, COMPARATIVE AND DIAGONAL SCALE Page 7 of Page 159
Fig. 1 .3
This is an even number and is convenient for the construction of a scale. As we have
to read upto 1 km. in this linear scale for 30 km, we will divide this scale into six primary
divisions. Thus, each primary division will read 5 km. One primary division of extreme left
of the linear scale, we will divide it into five equal divisions, so that these secondary divisions
will give us to read a minimum distance of one km.
While numbering the scale, zero should be marked after one interval from the left, so
that the left hand end of the line can be numbered 5 and the primary divisions to the right of
zero can have number 5,10,15,20 and 25. This method of numbering enables us to read off
directly the whole numbers as well as the fraction from the scale.
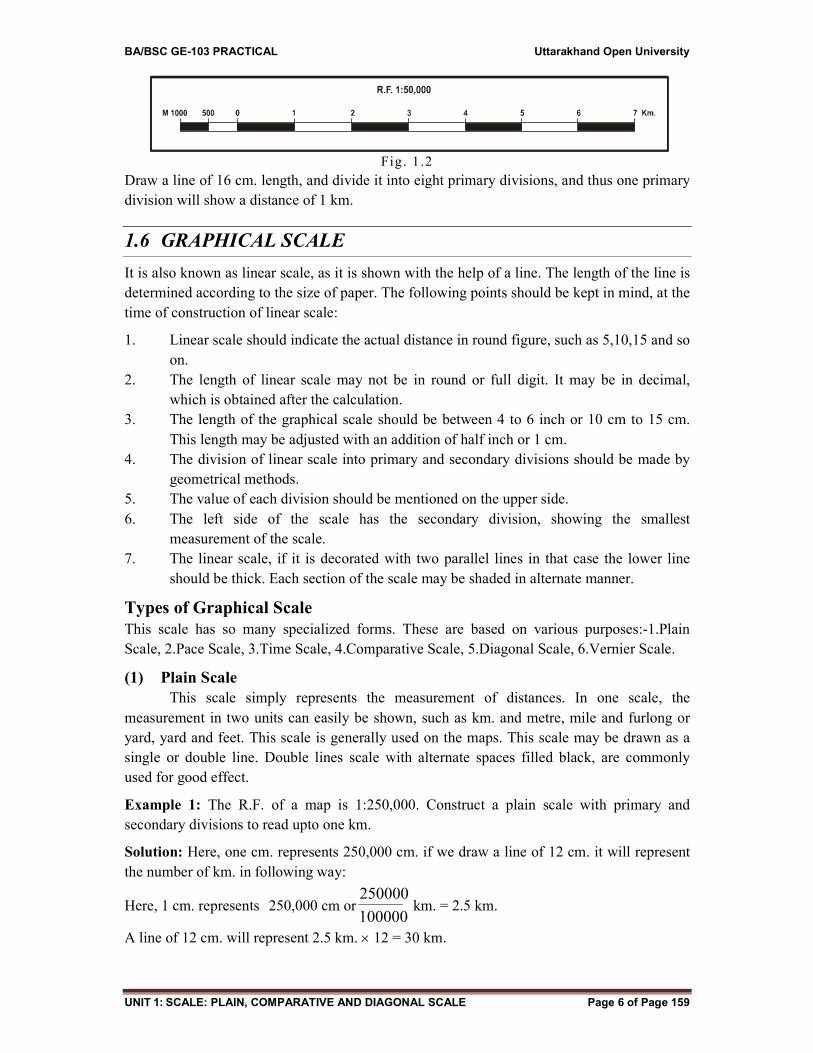
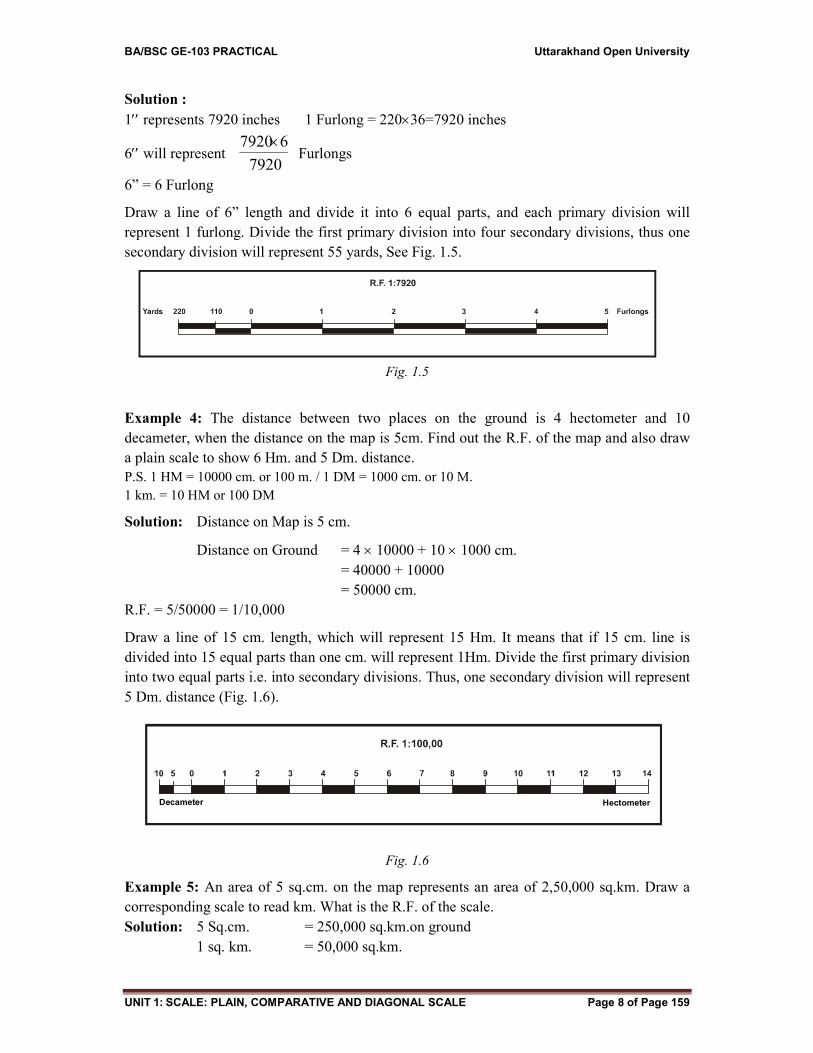
Example 2: The R.F. is 1:100,000. Construct Plain scale to read into miles and furlongs.
Here 1 inch represents 100,000 inches
If we draw a line of 6 inch then63360
6100000= 9.469 miles
Thus 6 will represent 9.469 miles.
As 9.469 mile is not a round figure, in that condition we will take the round figure of 10
miles, then we will calculate the length of the linear scale for a distance to show 10 miles.
Now 9.469 miles in shown by = 6 inch
1 mile will be shown by = 469.9
6 inches
10 mile will be shown by 469.9
106 inch = 6.336” or 6.3”
Draw a line of 6.3 and divide it into 10 equal parts. One part will represent the ground
distance of one mile. The primary division of the left side will be divided into eight equal
parts. This one small part as a secondary division will represent 220 yards or one furlongs.
Fig. 1 .4
Example 3: Draw a plain scale for R.F. 1:7920 and show the distance of 3 Furlong 165
Yards.
BA/BSC GE-103 PRACTICAL Uttarakhand Open University
UNIT 1: SCALE: PLAIN, COMPARATIVE AND DIAGONAL SCALE Page 8 of Page 159
HectometerDecameter
Solution :
1 represents 7920 inches 1 Furlong = 22036=7920 inches
6 will represent 7920
67920Furlongs
6” = 6 Furlong
Draw a line of 6” length and divide it into 6 equal parts, and each primary division will
represent 1 furlong. Divide the first primary division into four secondary divisions, thus one
secondary division will represent 55 yards, See Fig. 1.5.
Fig. 1.5
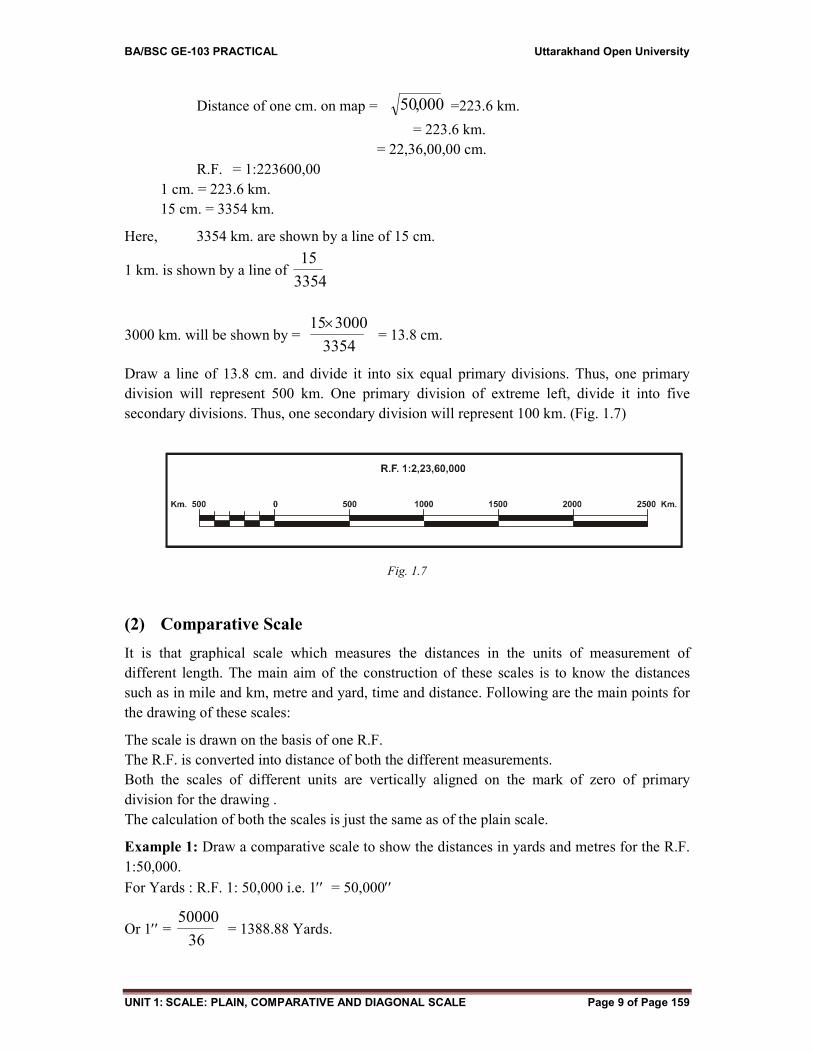
Example 4: The distance between two places on the ground is 4 hectometer and 10
decameter, when the distance on the map is 5cm. Find out the R.F. of the map and also draw
a plain scale to show 6 Hm. and 5 Dm. distance.
P.S. 1 HM = 10000 cm. or 100 m. / 1 DM = 1000 cm. or 10 M.
1 km. = 10 HM or 100 DM
Solution: Distance on Map is 5 cm.
Distance on Ground = 410000 + 101000 cm.
= 40000 + 10000
= 50000 cm.
R.F. = 5/50000 = 1/10,000
Draw a line of 15 cm. length, which will represent 15 Hm. It means that if 15 cm. line is
divided into 15 equal parts than one cm. will represent 1Hm. Divide the first primary division
into two equal parts i.e. into secondary divisions. Thus, one secondary division will represent
5 Dm. distance (Fig. 1.6).
Fig. 1.6
Example 5: An area of 5 sq.cm. on the map represents an area of 2,50,000 sq.km. Draw a
corresponding scale to read km. What is the R.F. of the scale.
Solution: 5 Sq.cm. = 250,000 sq.km.on ground
1 sq. km. = 50,000 sq.km.
BA/BSC GE-103 PRACTICAL Uttarakhand Open University
UNIT 1: SCALE: PLAIN, COMPARATIVE AND DIAGONAL SCALE Page 9 of Page 159
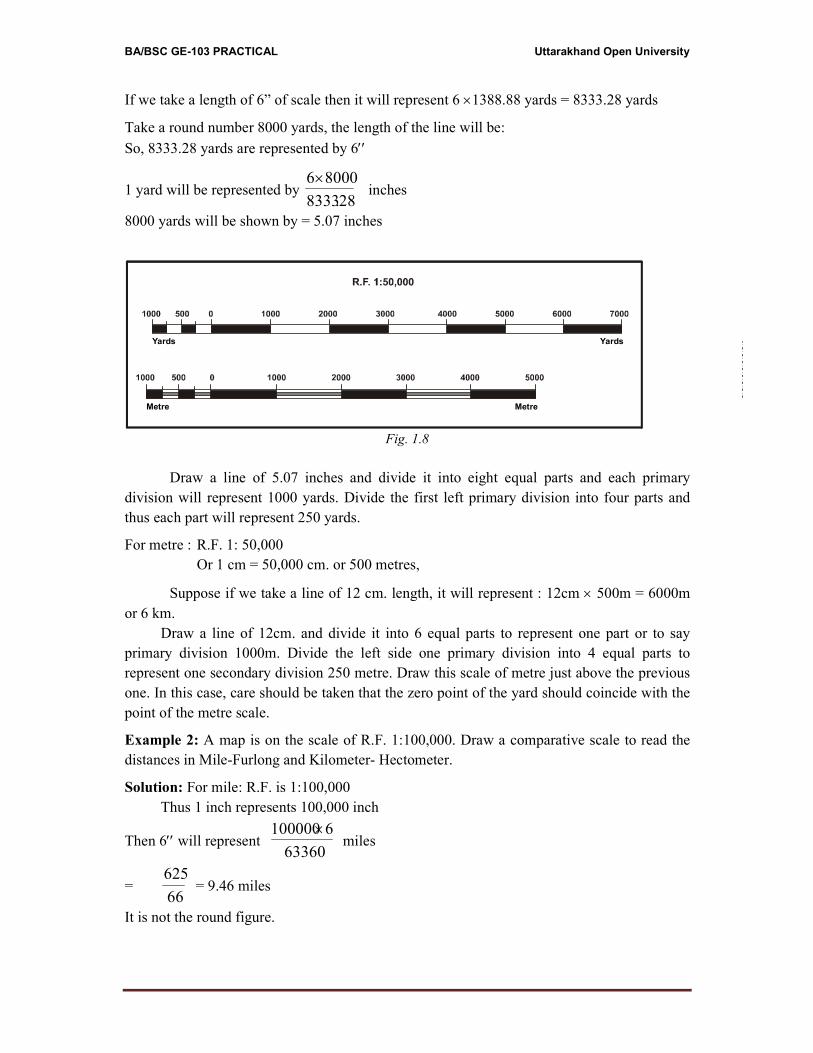
Distance of one cm. on map = 000,50 =223.6 km.
= 223.6 km.
= 22,36,00,00 cm.
R.F. = 1:223600,00
1 cm. = 223.6 km.
15 cm. = 3354 km.
Here, 3354 km. are shown by a line of 15 cm.
1 km. is shown by a line of 3354
15
3000 km. will be shown by = 3354
300015 = 13.8 cm.
Draw a line of 13.8 cm. and divide it into six equal primary divisions. Thus, one primary
division will represent 500 km. One primary division of extreme left, divide it into five
secondary divisions. Thus, one secondary division will represent 100 km. (Fig. 1.7)
Fig. 1.7
(2) Comparative Scale
It is that graphical scale which measures the distances in the units of measurement of
different length. The main aim of the construction of these scales is to know the distances
such as in mile and km, metre and yard, time and distance. Following are the main points for
the drawing of these scales:
The scale is drawn on the basis of one R.F.
The R.F. is converted into distance of both the different measurements.
Both the scales of different units are vertically aligned on the mark of zero of primary
division for the drawing .
The calculation of both the scales is just the same as of the plain scale.
Example 1: Draw a comparative scale to show the distances in yards and metres for the R.F.
1:50,000.
For Yards : R.F. 1: 50,000 i.e. 1 = 50,000
Or 1 = 36
50000 = 1388.88 Yards.
BA/BSC GE-103 PRACTICAL Uttarakhand Open University
Yards Yards
Metre Metre
If we take a length of 6” of scale then it will represent 6 1388.88 yards = 8333.28 yards
Take a round number 8000 yards, the length of the line will be:
So, 8333.28 yards are represented by 6
1 yard will be represented by 28.8333
80006 inches
8000 yards will be shown by = 5.07 inches
Fig. 1.8
Draw a line of 5.07 inches and divide it into eight equal parts and each primary
division will represent 1000 yards. Divide the first left primary division into four parts and
thus each part will represent 250 yards.
For metre : R.F. 1: 50,000
Or 1 cm = 50,000 cm. or 500 metres,
Suppose if we take a line of 12 cm. length, it will represent : 12cm 500m = 6000m
or 6 km.
Draw a line of 12cm. and divide it into 6 equal parts to represent one part or to say
primary division 1000m. Divide the left side one primary division into 4 equal parts to
represent one secondary division 250 metre. Draw this scale of metre just above the previous
one. In this case, care should be taken that the zero point of the yard should coincide with the
point of the metre scale.
Example 2: A map is on the scale of R.F. 1:100,000. Draw a comparative scale to read the
distances in Mile-Furlong and Kilometer- Hectometer.
Solution: For mile: R.F. is 1:100,000
Thus 1 inch represents 100,000 inch
Then 6 will represent 63360
6100000miles
= 66
625= 9.46 miles
It is not the round figure.
BA/BSC GE-103 PRACTICAL Uttarakhand Open University
UNIT 1: SCALE: PLAIN, COMPARATIVE AND DIAGONAL SCALE Page 11 of Page 159
Furlong Miles
Hectometer Kilometer
If we take the round figure of 10 miles, in that case the length of the scale will be determined
as follows:
625
: ------ miles are shown by a line of 6
66
666
: 1 mile will be shown by a line of -----------
625
66610
: 10 miles will be shown by --------------- = 6.3
625
For km : 1 cm. represents 100,000 cm or 1 km.
Then 15 cm. will represent 1 km.15 = 15 km.
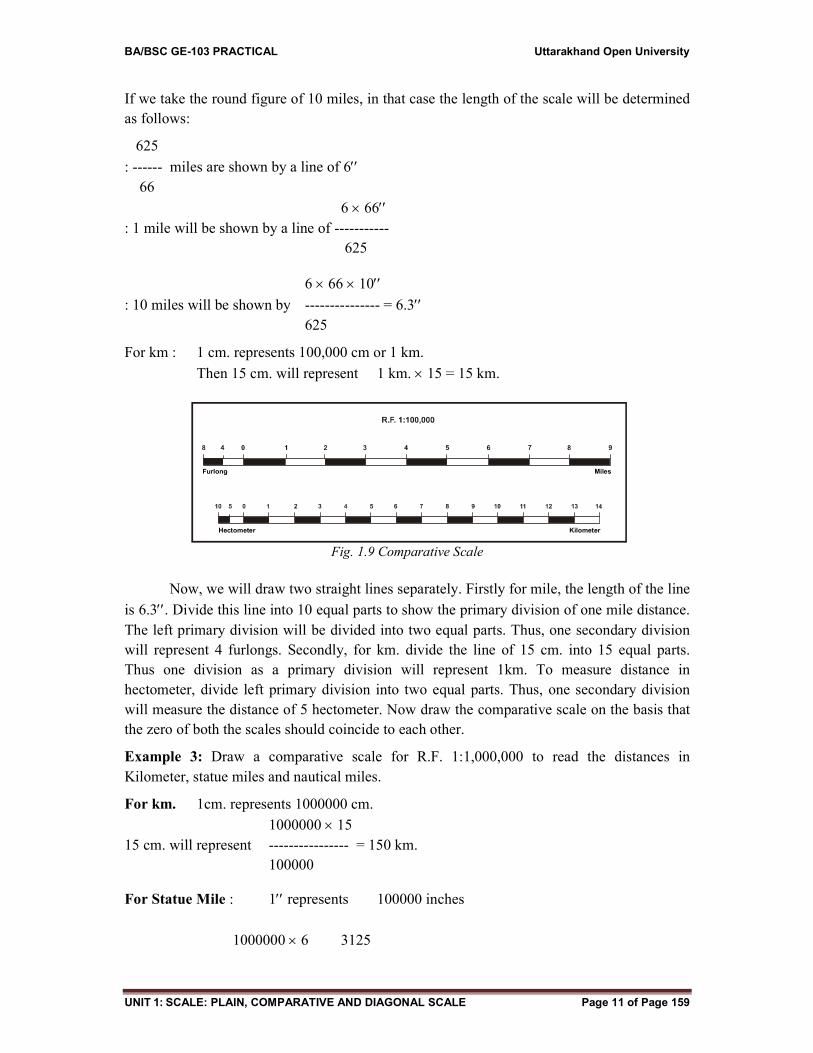
Fig. 1.9 Comparative Scale
Now, we will draw two straight lines separately. Firstly for mile, the length of the line
is 6.3. Divide this line into 10 equal parts to show the primary division of one mile distance.
The left primary division will be divided into two equal parts. Thus, one secondary division
will represent 4 furlongs. Secondly, for km. divide the line of 15 cm. into 15 equal parts.
Thus one division as a primary division will represent 1km. To measure distance in
hectometer, divide left primary division into two equal parts. Thus, one secondary division
will measure the distance of 5 hectometer. Now draw the comparative scale on the basis that
the zero of both the scales should coincide to each other.
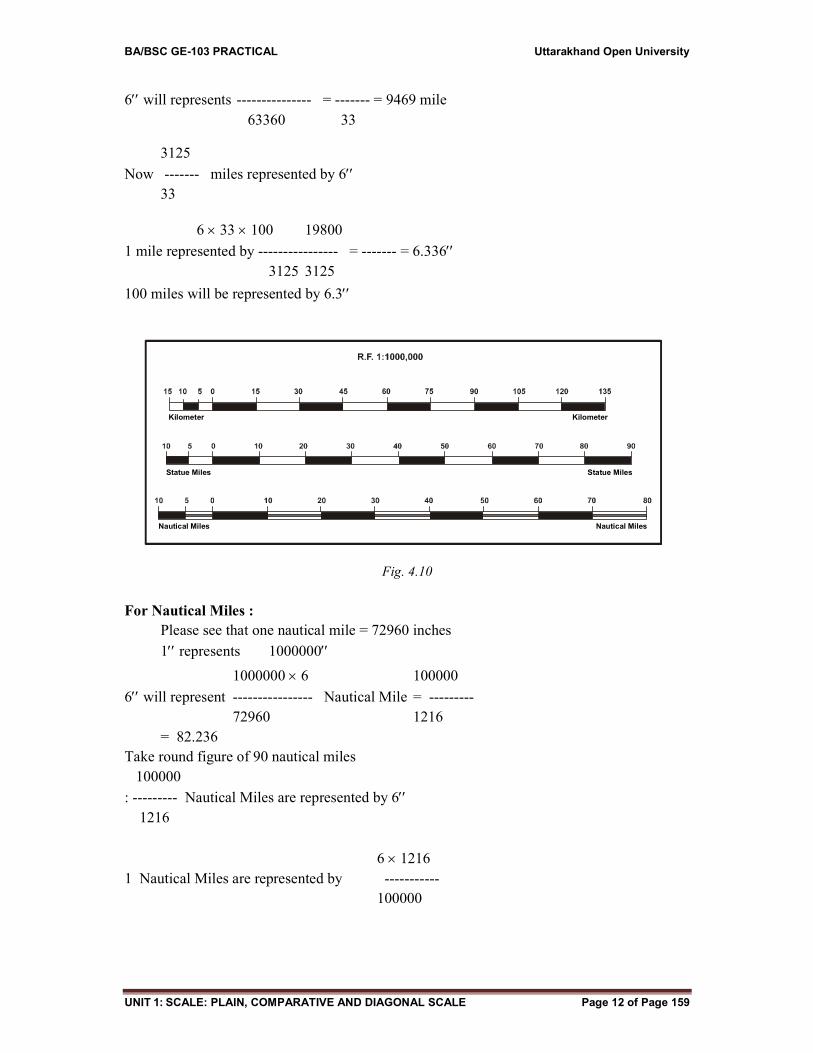
Example 3: Draw a comparative scale for R.F. 1:1,000,000 to read the distances in
Kilometer, statue miles and nautical miles.
For km. 1cm. represents 1000000 cm.
100000015
15 cm. will represent ---------------- = 150 km.
100000
For Statue Mile : 1 represents 100000 inches
10000006 3125
BA/BSC GE-103 PRACTICAL Uttarakhand Open University
UNIT 1: SCALE: PLAIN, COMPARATIVE AND DIAGONAL SCALE Page 12 of Page 159
KilometerKilometer
Statue MilesStatue Miles
Nautical Miles Nautical Miles
6 will represents --------------- = ------- = 9469 mile
63360 33
3125
Now ------- miles represented by 6
33
633100 19800
1 mile represented by ---------------- = ------- = 6.336
3125 3125
100 miles will be represented by 6.3
Fig. 4.10
For Nautical Miles :
Please see that one nautical mile = 72960 inches
1 represents 1000000
10000006 100000
6 will represent ---------------- Nautical Mile = ---------
72960 1216
= 82.236
Take round figure of 90 nautical miles
100000
: --------- Nautical Miles are represented by 6
1216
61216
1 Nautical Miles are represented by -----------
100000
BA/BSC GE-103 PRACTICAL Uttarakhand Open University
UNIT 1: SCALE: PLAIN, COMPARATIVE AND DIAGONAL SCALE Page 13 of Page 159
6121690
90 Nautical Miles will be represented by ----------------
100000
729600 656640
= --------- = ---------- = 6.56
100000 100000
90 Nautical Miles = 6.56
For km. : Draw a line of 15 cm. and divide it into 10 equal parts, thus one part of primary
division will represent 15km., divide one primary division into two secondary divisions of
500m each.
For Statue mile : Draw a line of 6.3 and divide it into 10 equal parts and thus one primary
division will represent ten miles, and divide one primary division into two equal parts and
thus one secondary division will represent 5 miles.
For Nautical Mile- Draw a line of 6.56 length and divide it into nine equal parts. Thus, one
primary division will represent 10 nautical miles. Repeat the same process and divide one
primary division into two equal parts, and it will give the measurement of one secondary
division as 5 nautical miles.
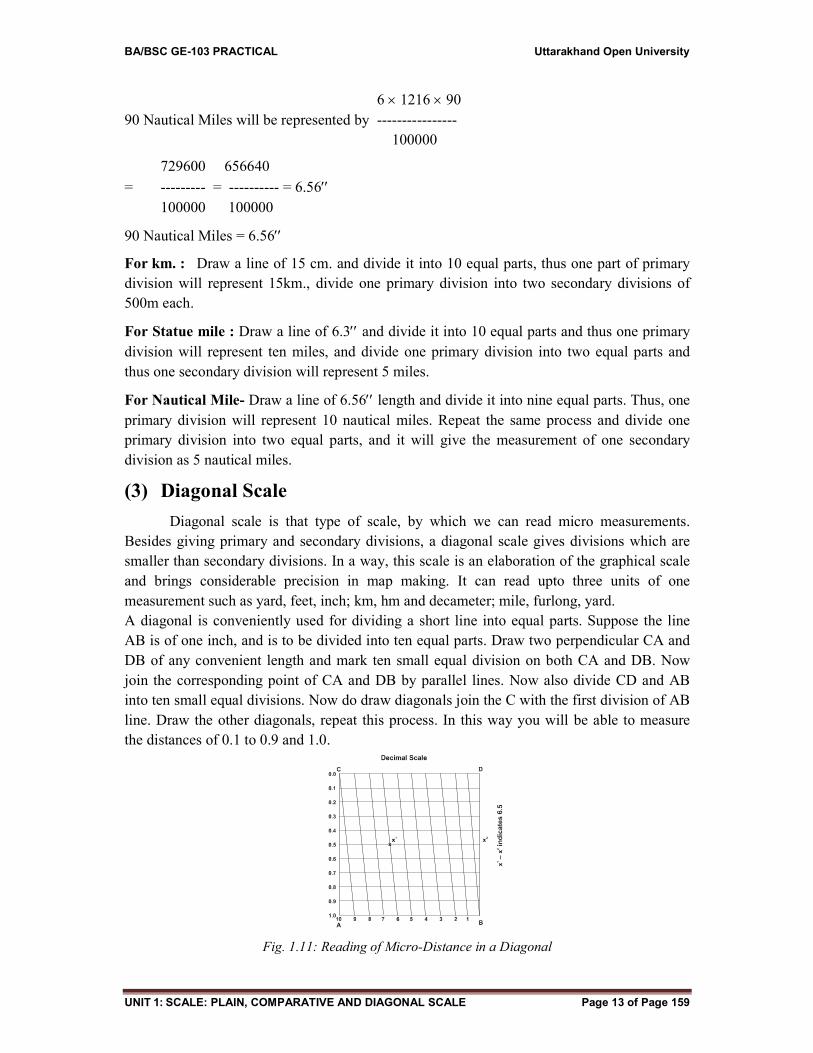
(3) Diagonal Scale
Diagonal scale is that type of scale, by which we can read micro measurements.
Besides giving primary and secondary divisions, a diagonal scale gives divisions which are
smaller than secondary divisions. In a way, this scale is an elaboration of the graphical scale
and brings considerable precision in map making. It can read upto three units of one
measurement such as yard, feet, inch; km, hm and decameter; mile, furlong, yard.
A diagonal is conveniently used for dividing a short line into equal parts. Suppose the line
AB is of one inch, and is to be divided into ten equal parts. Draw two perpendicular CA and
DB of any convenient length and mark ten small equal division on both CA and DB. Now
join the corresponding point of CA and DB by parallel lines. Now also divide CD and AB
into ten small equal divisions. Now do draw diagonals join the C with the first division of AB
line. Draw the other diagonals, repeat this process. In this way you will be able to measure
the distances of 0.1 to 0.9 and 1.0.
Fig. 1.11: Reading of Micro-Distance in a Diagonal
BA/BSC GE-103 PRACTICAL Uttarakhand Open University
UNIT 1: SCALE: PLAIN, COMPARATIVE AND DIAGONAL SCALE Page 14 of Page 159
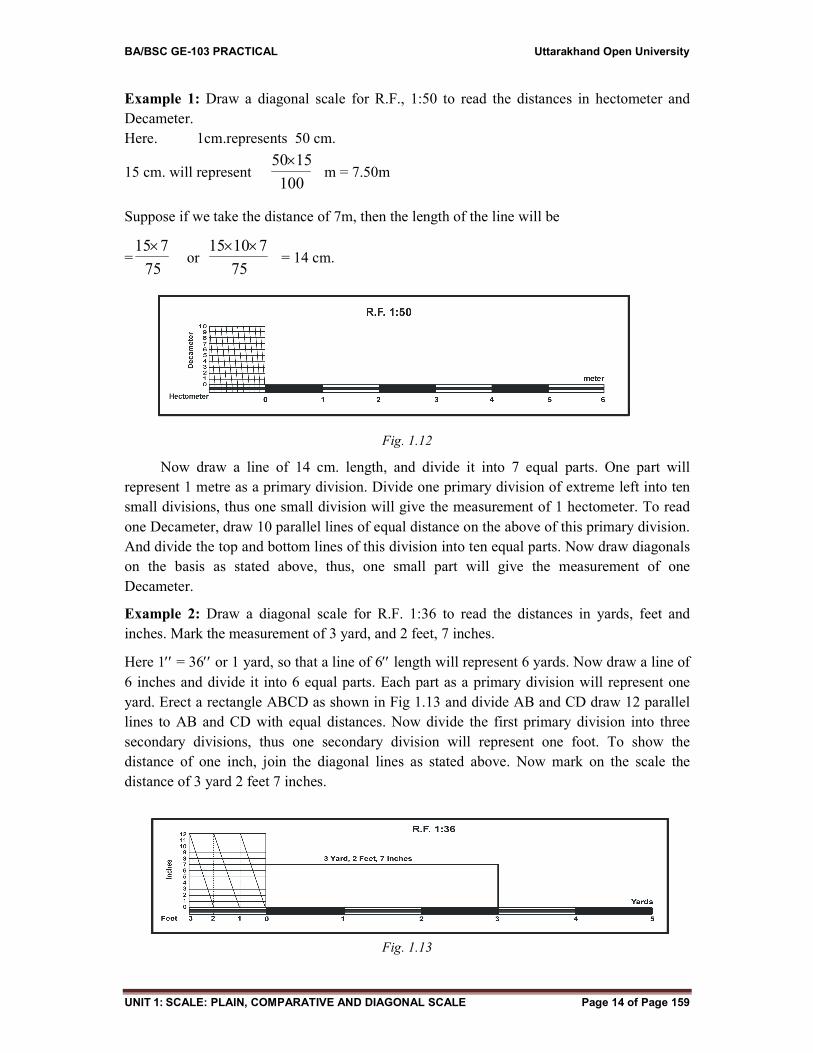
Example 1: Draw a diagonal scale for R.F., 1:50 to read the distances in hectometer and
Decameter.
Here. 1cm.represents 50 cm.
15 cm. will represent 100
1550 m = 7.50m
Suppose if we take the distance of 7m, then the length of the line will be
=75
715 or
75
71015 = 14 cm.
Fig. 1.12
Now draw a line of 14 cm. length, and divide it into 7 equal parts. One part will
represent 1 metre as a primary division. Divide one primary division of extreme left into ten
small divisions, thus one small division will give the measurement of 1 hectometer. To read
one Decameter, draw 10 parallel lines of equal distance on the above of this primary division.
And divide the top and bottom lines of this division into ten equal parts. Now draw diagonals
on the basis as stated above, thus, one small part will give the measurement of one
Decameter.
Example 2: Draw a diagonal scale for R.F. 1:36 to read the distances in yards, feet and
inches. Mark the measurement of 3 yard, and 2 feet, 7 inches.
Here 1 = 36 or 1 yard, so that a line of 6 length will represent 6 yards. Now draw a line of
6 inches and divide it into 6 equal parts. Each part as a primary division will represent one
yard. Erect a rectangle ABCD as shown in Fig 1.13 and divide AB and CD draw 12 parallel
lines to AB and CD with equal distances. Now divide the first primary division into three
secondary divisions, thus one secondary division will represent one foot. To show the
distance of one inch, join the diagonal lines as stated above. Now mark on the scale the
distance of 3 yard 2 feet 7 inches.
Fig. 1.13
BA/BSC GE-103 PRACTICAL Uttarakhand Open University
UNIT 1: SCALE: PLAIN, COMPARATIVE AND DIAGONAL SCALE Page 15 of Page 159
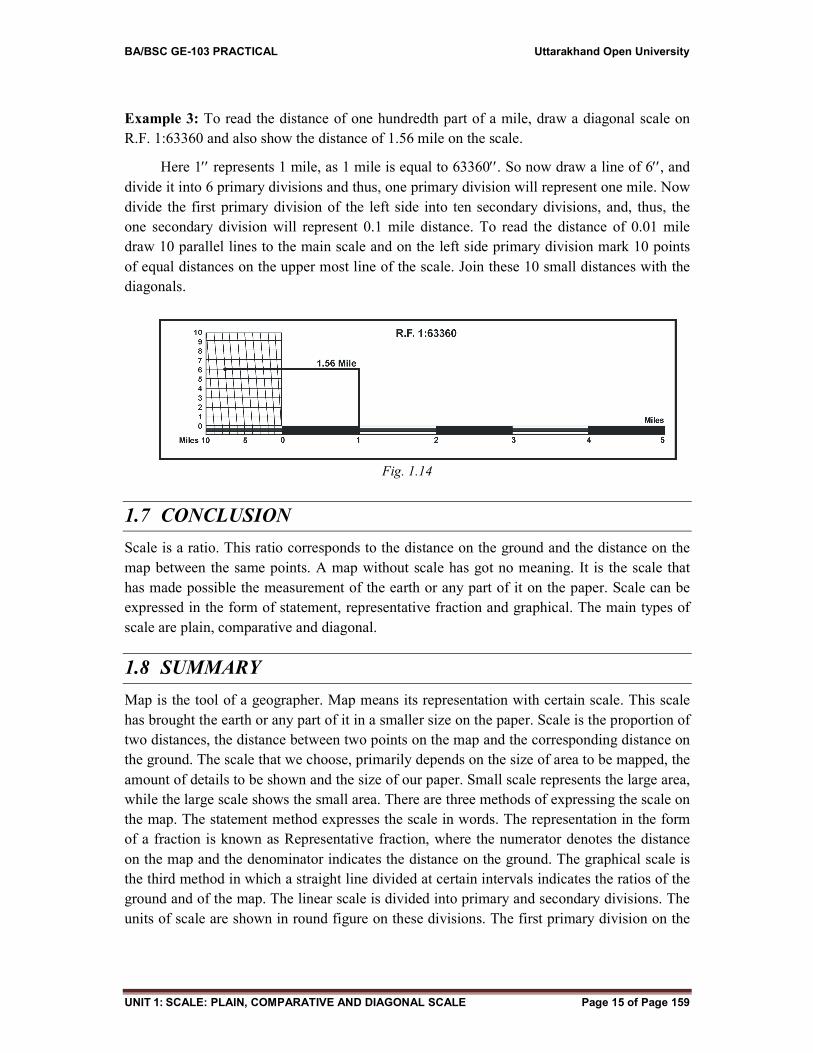
Example 3: To read the distance of one hundredth part of a mile, draw a diagonal scale on
R.F. 1:63360 and also show the distance of 1.56 mile on the scale.
Here 1 represents 1 mile, as 1 mile is equal to 63360. So now draw a line of 6, and
divide it into 6 primary divisions and thus, one primary division will represent one mile. Now
divide the first primary division of the left side into ten secondary divisions, and, thus, the
one secondary division will represent 0.1 mile distance. To read the distance of 0.01 mile
draw 10 parallel lines to the main scale and on the left side primary division mark 10 points
of equal distances on the upper most line of the scale. Join these 10 small distances with the
diagonals.
Fig. 1.14
1.7 CONCLUSION
Scale is a ratio. This ratio corresponds to the distance on the ground and the distance on the
map between the same points. A map without scale has got no meaning. It is the scale that
has made possible the measurement of the earth or any part of it on the paper. Scale can be
expressed in the form of statement, representative fraction and graphical. The main types of
scale are plain, comparative and diagonal.
1.8 SUMMARY
Map is the tool of a geographer. Map means its representation with certain scale. This scale
has brought the earth or any part of it in a smaller size on the paper. Scale is the proportion of
two distances, the distance between two points on the map and the corresponding distance on
the ground. The scale that we choose, primarily depends on the size of area to be mapped, the
amount of details to be shown and the size of our paper. Small scale represents the large area,
while the large scale shows the small area. There are three methods of expressing the scale on
the map. The statement method expresses the scale in words. The representation in the form
of a fraction is known as Representative fraction, where the numerator denotes the distance
on the map and the denominator indicates the distance on the ground. The graphical scale is
the third method in which a straight line divided at certain intervals indicates the ratios of the
ground and of the map. The linear scale is divided into primary and secondary divisions. The
units of scale are shown in round figure on these divisions. The first primary division on the
BA/BSC GE-103 PRACTICAL Uttarakhand Open University
UNIT 1: SCALE: PLAIN, COMPARATIVE AND DIAGONAL SCALE Page 16 of Page 159
left side has the value of zero. The divisions on the scale are conveniently drawn with the
help of a line of an acute angle.
The scale conversion in also necessary, as the statement scale and representative fraction
scale both are substitutes to each other. But it is also important that the scale if it is shown by
a line, in that condition, if the map is reduced or enlarged, it gives the correct measurement.
In the case of R.F., it is not possible.
Graphical scale is also known as linear scale. The length of this scale depends on the size of
paper, on which it is to be drawn. Linear scale shows the actual distances in round figure. It
has primary and secondary divisions both, which help us to measure the small distances on
the map. Linear scale has three main types-Plain, comparative and diagonal. Plain scale
simply represents the measurement of distances. It shows the distances maximum in two
units. Comparative scale measures the distances in two different units of measurement for
example it shows the distances in km. and mile, metre and yard and so on. Diagonal scale is
used to measure the micro-measurements. It gives the divisions smaller than the secondary
divisions. It can read upto three units of measurements.
1.9 GLOSSARY
Scale: The ratio between two distances i.e. distance on a map and the actual distance on the
ground between the corresponding points.
Linear Scale - A method of expressing scale with the help of a line.
One inch = 25.4mm or 2.54 cm.
One mile = 1.609347 km. or 1.61 km.
One foot = 0.304801 metre
One square inch = 6.452 sq. cm.
One square foot = 0.09290 sq.m.
One square mile = 2.59000 sq.km.
One Acre = 0.4047 hectare
2.471 hectare = one hectare
One km. = 10 Hectometer
One Hm. = 10 Decameter
One Dm. = 10 meter
One M. = 10 Decimeter
One Dcm. = 10 centimeter
One Cm. = 10 Millimeter
One Nautical mile = 72960 inches
One Statue mile = 63360 inches
One Sq.km. = 0.3861 sq.mile
One Sq.m. = 10.764 sq. feet
One Sq. cm. = 0.15500sq.inch
Small scale means = 5 km. to 1 cm. Cover large area
Large scale means = 10 cm. to 1 km. Cover small area
BA/BSC GE-103 PRACTICAL Uttarakhand Open University
UNIT 1: SCALE: PLAIN, COMPARATIVE AND DIAGONAL SCALE Page 17 of Page 159
Statement scale denotes the scale expressed in words such as
1cm to 1 km.
Representative fraction- A fraction of ratio between two distances, where numerator is one
and denominator, in same units of length.
Graphical scale Means linear scale
Primary divisions - The main divisions of the linear scale.
Secondary divisions - The sub-division of a primary division.
Scale Conversion - Denotes the conversion of scale in any method of expressing
the scale.
Plain Scale - represents the measurement of distance.
Comparative scale - Measures distances in two different units of measurement.
Diagonal scale - used to read the micro-measurements
1.10 ANSWER TO CHECK YOUR PROGRESS
Scale is a ratio between two distances: Ground and Paper.
Scale helps in true representation of the earth or part of it.
The distances on the map are shown smaller because of the scale.
Scale selection depends on size of area, details to be shown and size of paper.
Small scale helps to show large area on a small size of paper.
Large scale helps to show small area on a large size of paper.
Statement method means to explain the scale in words.
Fraction in the case of scale is called as representative fraction.
Numerator of the fraction is always one,
Denominator of the fraction is always in the same unit of length as is numerator.
Denominator represents the distance on ground.
The method of measurement of scale by R.F. is quite universal.
R.F. is not fit or useable when the map is reduced or enlarged.
Plain scale is a linear scale.
Linear scale has primary and secondary divisions both.
The divisions of linear scale are always put in round figure.
The conversion of scale denotes that all the methods are substitutes of each other.
Statement scale is conversable into representative fraction.
Graphical scale is also called as linear scale.
Graphical scale has specialized forms on the basis of various purposes.
Plain scale simply represents the measurement of distances.
Plain scale measures mainly the distances in two units of one length.
Comparative scale measures the distances in two units of different length.
Comparative scale has its drawing on one R.F.
Diagonal scale helps in the measurements of micro-units.
Diagonal scale is an elaboration of the graphical scale.
BA/BSC GE-103 PRACTICAL Uttarakhand Open University
UNIT 1: SCALE: PLAIN, COMPARATIVE AND DIAGONAL SCALE Page 18 of Page 159
Diagonal scale can read three units of one measurement length.
Pace scale is based on the distance of the pace of man which is equal to 30 inches.
Time scale shows the correlation between time or speed and distances.
1.11REFERENCES
1. Bygott, J. (1948): An introduction to map work and practical geography, London.
2. Misra, R.P. and A. Ramesh: (1969), Fundamentals of Cartography, Mysore.
3. Raisz, Erwin (1962) :Principles of cartography, Tokyo
4. Robinson, A.H. (1966) :Elements of Cartography, New York.
1.12SUGGESTED READING
1 Gaur, K.S. (1968): Manchitra Kala Ki Sameeksha, Agra Book Store, Agra.
2 Sharma, J.P. (2014): Practical Geography Rastogi Publications, Meerut.
3 Singh, R.B. (2003): Practical work in Geography Pt I NCERT, New Delhi.
4 Singh, R.L. & P.K. Dutt (1966): Elements of practical Geography, Students friends,
Allahabad.
1.13TERMINAL QUESTIONS
1. What is the meaning of scale. Explain it.
2. Discuss the methods to represent the scale with examples.
3. Discuss the importance of Scale.
4. Explain those factors, on which the scale depends.
5. What do you mean by statement, a method of scale.
6. What is representative fraction. Explain it with examples.
7. What is graphical scale. How a line of the scale is divided into primary and secondary
divisions.
8. What is scale conversion. Define the conversion of scale into all three methods.
9. What points should be kept in mind at the time of construction of linear scale.
10. Discuss the various types of scale.
11. What is Plain scale. Discuss its chief characteristics.
12. Discuss the characteristics and importance of diagonal scale.
13. A comparative scale can be used for all units of measurements. Explain it.
14. A map is on scale 1:10,000, and the distance between A and B on the map is 5 cm.
Find out the actual distance between these two points.
15. Draw a plain scale for R.F. 1:50,000 to read the distance in Km and metre.
16. An area of 81 sq. km. is shown by 9 sq.cm. on the map. Find out the R.F. of the map.
Draw a plain scale to read the distance in km. and hectometer.
17. Draw a comparative scale for R.F. 1:200,000 to read the distances in km and miles.
BA/BSC GE-103 PRACTICAL Uttarakhand Open University
UNIT 1: SCALE: PLAIN, COMPARATIVE AND DIAGONAL SCALE Page 19 of Page 159
18. Draw a comparative scale for R.F. 1:6000 to read the distances in yard and metre.
19. Draw a diagonal scale for R.F. 1:100 to read the distances in metre, cm and mm.
20. A train covers a distance of 100 km in 2 hours. This distance is shown by 5 cm. on the
map. Find out the R.F. and draw a plain scale showing time also.
21. Draw a diagonal scale for R.F. 1:25, to read the distance in metre, decimeter and cm.
22. Draw a diagonal scale for R.F. 1:50 to read the distances in cm. Also mark the
distance of 243 cm. on the scale.
23. Draw a diagonal scale for R.F. 1:36, to read the distances in yard, foot and inch. Also
mark a distance of 4 yard 2 feet and 7 inches.
24. A map is on the scale of 1:25,000. Draw a diagonal scale to read the distances of
hundred part of a km. Also mark the distance of 2.47 km. on the scale by a thick line.
BA/BSC GE-103 PRACTICAL Uttarakhand Open University
UNIT 2 : ELEMENTS AND TYPES OF MAPS Page 20 of Page 159
UNIT 2 : ELEMENTS AND TYPES OF MAPS
2.1 OBJECTIVES
2.2 INTRODUCTION
2.3 DEFINITION OF MAP
2.4 CLASSIFICATION OF MAP
2.5 ELEMENTS OF MAP
2.6 CONCLUSION
2.7 SUMMARY
2.8 GLOSSARY
2.9 ANSWER TO CHECK YOUR PROGRESS
2.10 REFERENCES
2.11 SUGGESTED READINGS
2.12 TERMINAL QUESTIONS
BA/BSC GE-103 PRACTICAL Uttarakhand Open University
UNIT 2 : ELEMENTS AND TYPES OF MAPS Page 31 of Page 159
2.1 OBJECTIVES
The description of the earth as a home of man is ‘Geography’. If we want to explain the
geography of an area then we need to present the relative description of natural and cultural
environments. Earth is so vast, that man himself cannot visualize all these features from his
own eyes. So he needs to take the help of certain tools and among these tools map is the
main. Maps are so important for a geographer as the arms and ammunitions are important for
military personnel. In a real sense, map is the symbolic script of geographers.
2.2 INTRODUCTION
The spherical earth is best represented by a three dimensional model of the earth, called
a globe. It cannot show much detail of surface features. Hence, maps are much useful tool
than globes. A map is a two dimensional diagrammatic representation of the whole or part of
the earth. It is a picture of physical and cultural features at a given scale on a flat surface.
These have unique advantage of showing objects or patterns that may be intangible or
invisible. For example, the distribution of the production of crops on the surface cannot be
easily marked on the ground, but on the map, it can be easily identified. It may help us the
pattern of crop production in a vast area.
There are various ways by which the earth can be mapped: (a) By freehand sketches and
diagrams; (b) By actual survey with the help of survey instruments; (c) By photographs-
ground and aerial both; (d) By manmade satellites. The use of computers has developed the
digital mapping through Geographic Information System and Global positioning system. The
amount of information given on the map depends on:
*Scale, *Projection, *Conventional signs and symbols, *Skill of the cartographer, *Method
of map making; and *Requirement of the user.
2.3 DEFINITION OF MAP
The word 'map' is taken from Mappa, a word of Latin origin. This term means a piece of
cloth or cloth handkerchief. This term was used for the first time by a head of the monastery
named as Micon. His world map was called as Mappa Mundi. With time, the term map got
popularity, and is defined by a number of scholars.
Finch and Trewartha : Maps are the graphic representations of the surface of the earth.
Dudley Stamp-"Map is a representation of the earth surface or a part of it, its physical
and political features, etc. or of the heavens, delineated on a flat surface of paper. Each
object on the map corresponds to a geographical position according to a definite scale or
projection.
Erwin Raisz : A map is, in its primary conception, a convention alized picture of the
earth’s pattern as seen from above, to which lettering is added for identification.
BA/BSC GE-103 PRACTICAL Uttarakhand Open University
UNIT 2 : ELEMENTS AND TYPES OF MAPS Page 22 of Page 159
R. Ogilvie Buchanan : A map is the scaled representation on a flat surface of the earth’s
surface, or a section of it, showing certain selected features- physical, political, historical
or economic.
R.P. Misra and A. Ramesh : A map is a symbolic drawing to scale of the visible as well
as conceived locational and distributional patterns of the whole or part of the earth, the
sky, or any other heavenly body.
The above definitions reveal the following characteristics of the map:
1. Map is a graphic representation of the earth or part of it.
2. It shows the physical and cultural features.
3. It is a flat piece of paper.
4. It is drawn on a definite scale.
5. It has its extension on a graticule of lines known as latitudes and longitudes.
6. The identification of objects is made either by symbols or lettering.
7. It shows selected features.
8. It is a two-dimensional representation of the earth.
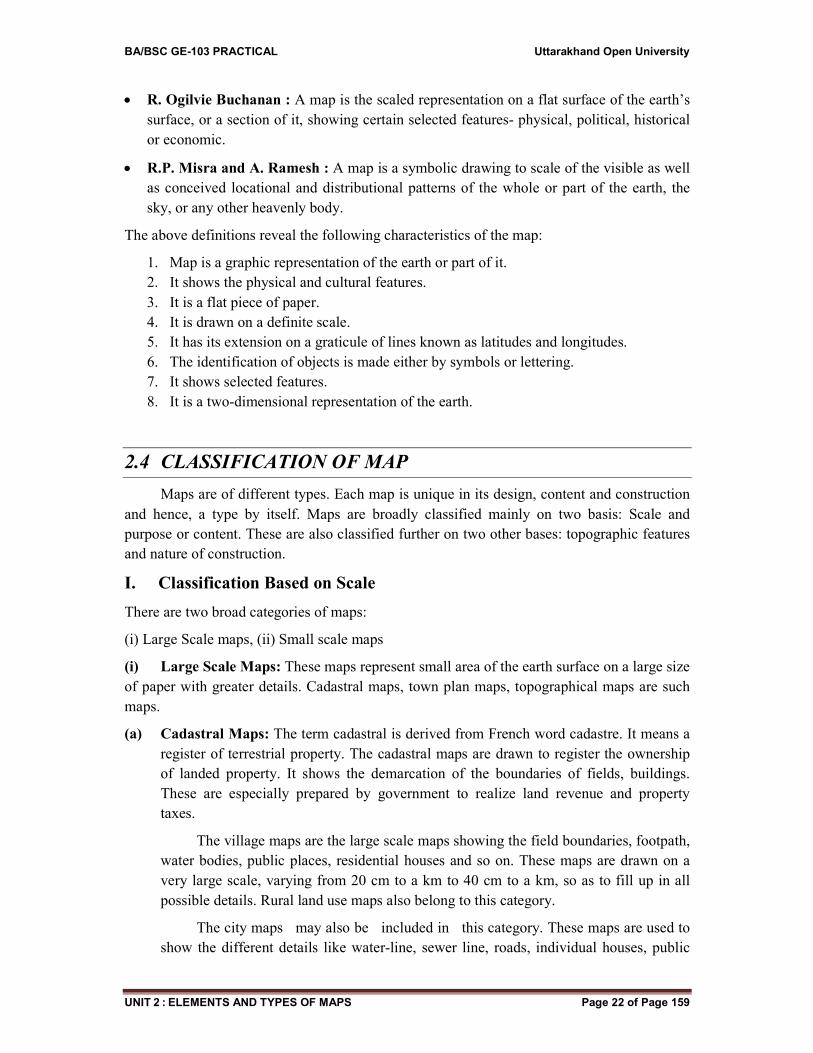
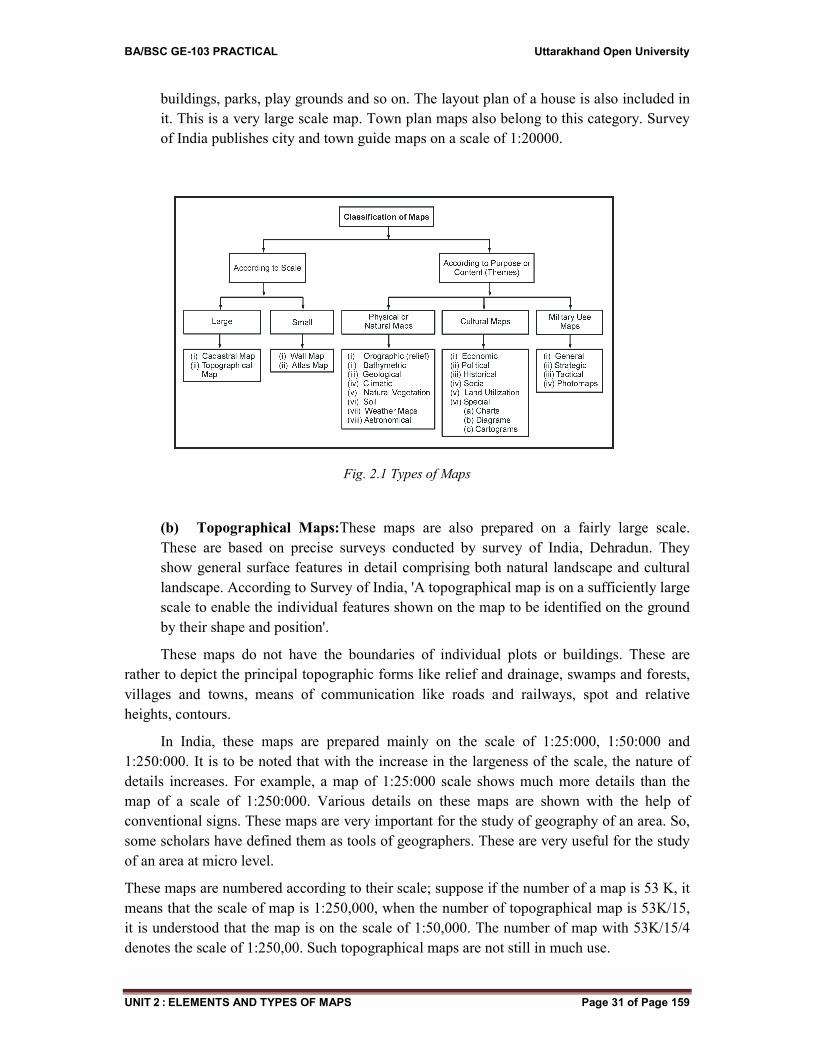
2.4 CLASSIFICATION OF MAP
Maps are of different types. Each map is unique in its design, content and construction
and hence, a type by itself. Maps are broadly classified mainly on two basis: Scale and
purpose or content. These are also classified further on two other bases: topographic features
and nature of construction.
I. Classification Based on Scale
There are two broad categories of maps:
(i) Large Scale maps, (ii) Small scale maps
(i) Large Scale Maps: These maps represent small area of the earth surface on a large size
of paper with greater details. Cadastral maps, town plan maps, topographical maps are such
maps.
(a) Cadastral Maps: The term cadastral is derived from French word cadastre. It means a
register of terrestrial property. The cadastral maps are drawn to register the ownership
of landed property. It shows the demarcation of the boundaries of fields, buildings.
These are especially prepared by government to realize land revenue and property
taxes.
The village maps are the large scale maps showing the field boundaries, footpath,
water bodies, public places, residential houses and so on. These maps are drawn on a
very large scale, varying from 20 cm to a km to 40 cm to a km, so as to fill up in all
possible details. Rural land use maps also belong to this category.
The city maps may also be included in this category. These maps are used to
show the different details like water-line, sewer line, roads, individual houses, public
BA/BSC GE-103 PRACTICAL Uttarakhand Open University
UNIT 2 : ELEMENTS AND TYPES OF MAPS Page 31 of Page 159
buildings, parks, play grounds and so on. The layout plan of a house is also included in
it. This is a very large scale map. Town plan maps also belong to this category. Survey
of India publishes city and town guide maps on a scale of 1:20000.
Fig. 2.1 Types of Maps
(b) Topographical Maps:These maps are also prepared on a fairly large scale.
These are based on precise surveys conducted by survey of India, Dehradun. They
show general surface features in detail comprising both natural landscape and cultural
landscape. According to Survey of India, 'A topographical map is on a sufficiently large
scale to enable the individual features shown on the map to be identified on the ground
by their shape and position'.
These maps do not have the boundaries of individual plots or buildings. These are
rather to depict the principal topographic forms like relief and drainage, swamps and forests,
villages and towns, means of communication like roads and railways, spot and relative
heights, contours.
In India, these maps are prepared mainly on the scale of 1:25:000, 1:50:000 and
1:250:000. It is to be noted that with the increase in the largeness of the scale, the nature of
details increases. For example, a map of 1:25:000 scale shows much more details than the
map of a scale of 1:250:000. Various details on these maps are shown with the help of
conventional signs. These maps are very important for the study of geography of an area. So,
some scholars have defined them as tools of geographers. These are very useful for the study
of an area at micro level.
These maps are numbered according to their scale; suppose if the number of a map is 53 K, it
means that the scale of map is 1:250,000, when the number of topographical map is 53K/15,
it is understood that the map is on the scale of 1:50,000. The number of map with 53K/15/4
denotes the scale of 1:250,00. Such topographical maps are not still in much use.
BA/BSC GE-103 PRACTICAL Uttarakhand Open University
UNIT 2 : ELEMENTS AND TYPES OF MAPS Page 24 of Page 159
(ii) Small Scale Maps: These maps represent large areas on a small sheet of paper. They
have fewer details. Atlas and wall maps are the best examples of small scale maps. The maps
included in any book, magazines, newspaper are also small scale maps. They give only a
general picture of the area represented.
(a) Wall maps : Though these maps have large scale than Atlas or book maps, but their
scale is comparatively smaller one. These are drawn boldly so that they can be seen
from a distance. They are used in classrooms and cater to the needs of large audience.
These are hanged on the flat surface wall, so these are called as wall maps. In real
sense, these are geographical maps. They show very large areas like world as a whole,
continents, hemispheres, countries, states, districts and tehsils. These maps are also
drawn with certain purposes like to show, climatic conditions, type of soils, type of
vegetation, distribution of minerals, population, means of transport, social, cultural,
economic and political patterns. These maps are of different size. It depends on nature
of objects, to be shown therein. Our Survey of India prepares these wall maps on a
scale of 1:15,000,000 to 1:250,000.
(b) Atlas Maps :'Atlas' is defined as 'book of maps'. These are drawn on a very small scale
and give a highly generalized picture of natural and cultural aspects, such as physical,
climate, drainage, soils, agricultural crops, industries and so on. These are mainly
prepared on 1:20,000,000 scale or less than that. In our country, National Thematic
Mapping Organisation (NATMO) is a well-known important organization. It publishes
all kinds of maps for various purposes, depicting different parts of the country and its
product is known as National Atlas of India. Other important Atlas are Oxford Atlas,
Reader’s digest Atlas, School Atlas, District Atlas, State Atlas, Census Atlas, and so
on. These maps are also called as chorographical maps.
II Classification Based on Purpose
These are mainly thematic maps usually prepared on small scale. They highlight specific
features of the area concerned. These are broadly categorized into two main divisions:
(a) Physical Maps, (b) Cultural Maps
(a) Physical or Natural Maps: The maps which depict various aspects of natural
environment are defined as physical maps. These highlight various physical aspects like
relief, climate, natural vegetation, soils. These may be categorized as follows:
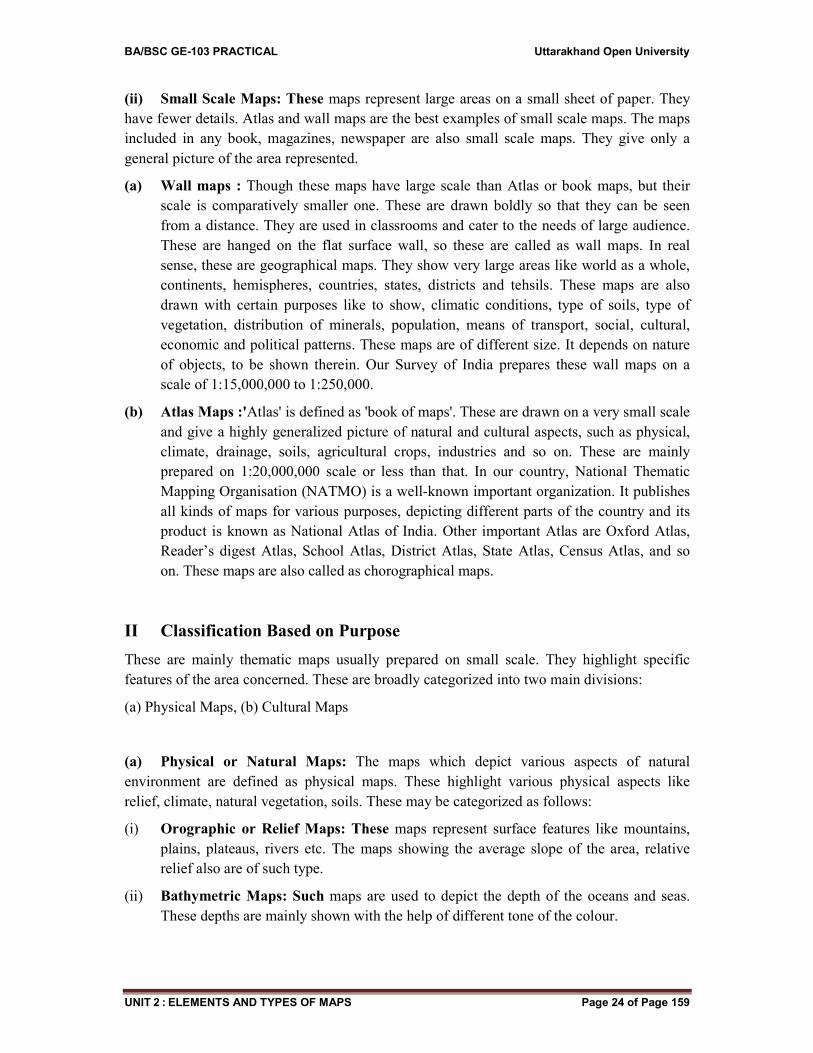
(i) Orographic or Relief Maps: These maps represent surface features like mountains,
plains, plateaus, rivers etc. The maps showing the average slope of the area, relative
relief also are of such type.
(ii) Bathymetric Maps: Such maps are used to depict the depth of the oceans and seas.
These depths are mainly shown with the help of different tone of the colour.
BA/BSC GE-103 PRACTICAL Uttarakhand Open University
UNIT 2 : ELEMENTS AND TYPES OF MAPS Page 31 of Page 159
Fig 2.2: Physical Map of India
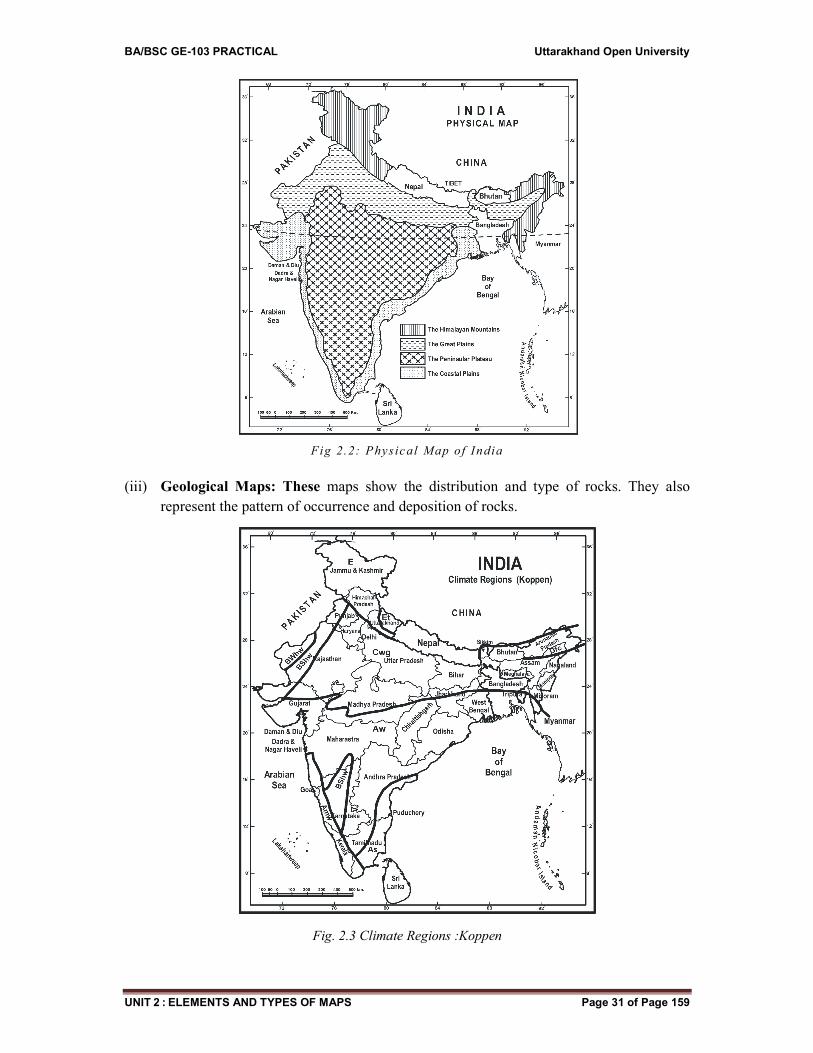
(iii) Geological Maps: These maps show the distribution and type of rocks. They also
represent the pattern of occurrence and deposition of rocks.
Fig. 2.3 Climate Regions :Koppen
BA/BSC GE-103 PRACTICAL Uttarakhand Open University
UNIT 2 : ELEMENTS AND TYPES OF MAPS Page 26 of Page 159
(iv) Climatic Maps: Maps showing climatic conditions of an area are known as climatic
maps. They show amount of rainfall. Variations in temperature according to seasons,
air pressure, climatic regions, direction and flow of winds for a long period of time.
(v) Weather Maps: These maps show the weather conditions of a particular time and day.
They show the direction and velocity of winds, sky conditions, weather conditions,
isobar, sea conditions and amount of rainfall, if it is so. They also depict the weather
forecasts.
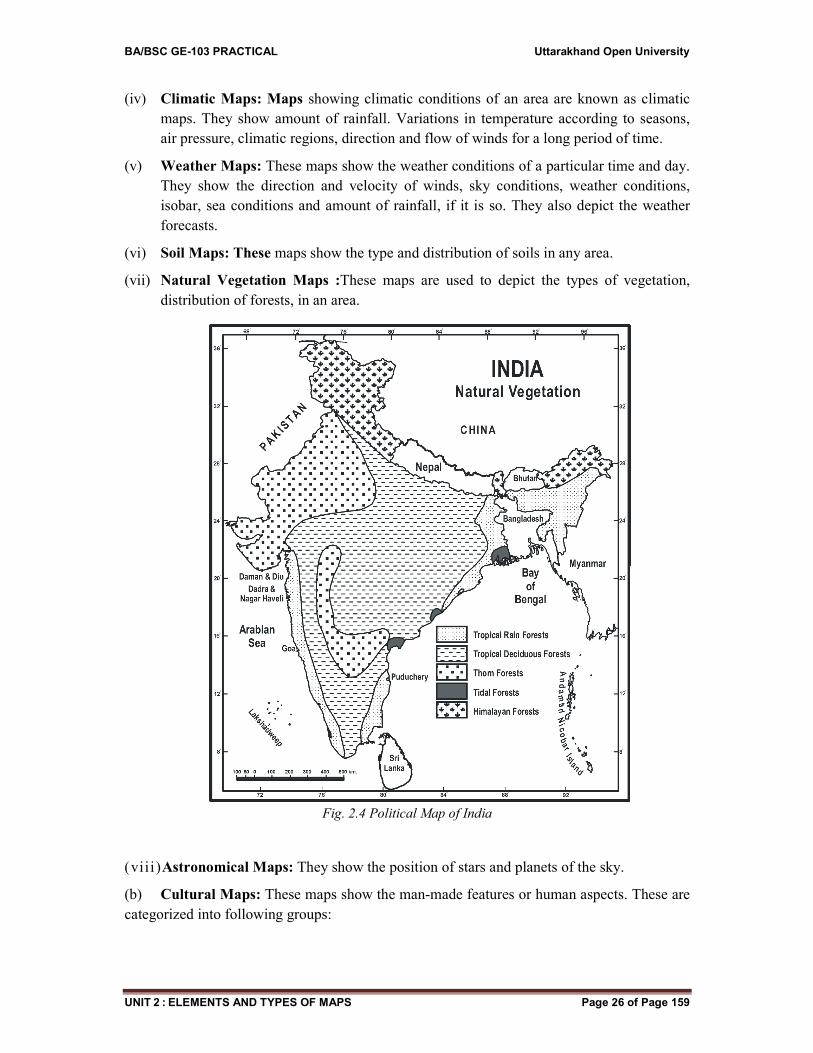
(vi) Soil Maps: These maps show the type and distribution of soils in any area.
(vii) Natural Vegetation Maps :These maps are used to depict the types of vegetation,
distribution of forests, in an area.
Fig. 2.4 Political Map of India
(viii)Astronomical Maps: They show the position of stars and planets of the sky.
(b) Cultural Maps: These maps show the man-made features or human aspects. These are
categorized into following groups:
BA/BSC GE-103 PRACTICAL Uttarakhand Open University
UNIT 2 : ELEMENTS AND TYPES OF MAPS Page 31 of Page 159
(i) Economic Maps : These maps show the distribution of minerals, agricultural crops,
types of land use, type of industries, means of transport and communication, sea ports
etc. These maps also depict the stage of economic development, economic regions,
potential regions and so on.
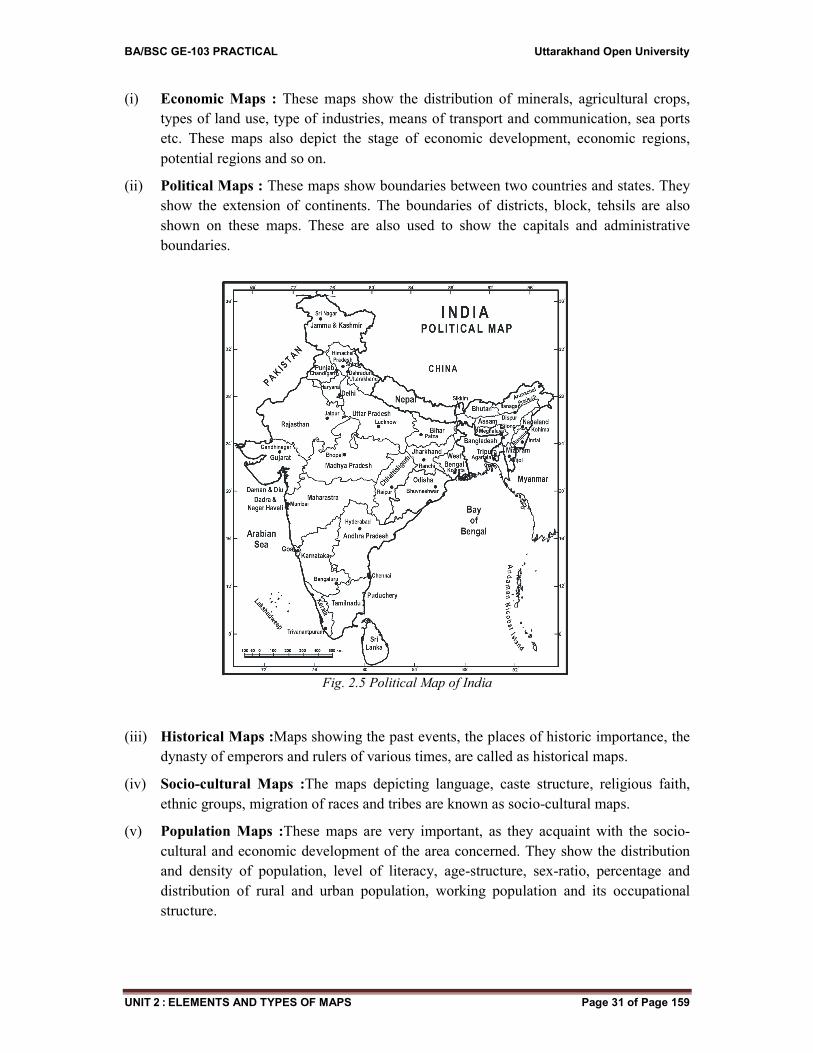
(ii) Political Maps : These maps show boundaries between two countries and states. They
show the extension of continents. The boundaries of districts, block, tehsils are also
shown on these maps. These are also used to show the capitals and administrative
boundaries.
Fig. 2.5 Political Map of India
(iii) Historical Maps :Maps showing the past events, the places of historic importance, the
dynasty of emperors and rulers of various times, are called as historical maps.
(iv) Socio-cultural Maps :The maps depicting language, caste structure, religious faith,
ethnic groups, migration of races and tribes are known as socio-cultural maps.
(v) Population Maps :These maps are very important, as they acquaint with the socio-
cultural and economic development of the area concerned. They show the distribution
and density of population, level of literacy, age-structure, sex-ratio, percentage and
distribution of rural and urban population, working population and its occupational
structure.
BA/BSC GE-103 PRACTICAL Uttarakhand Open University
UNIT 2 : ELEMENTS AND TYPES OF MAPS Page 28 of Page 159
(vi) MilitaryMaps: Maps used or prepared by defence services are called as Military
Maps. These are of different types:
(a) General maps on a scale of 1:1000,000 or more depict only the broad
topographical features. These are used by the defence services for general
planning purpose.
(b) Maps prepared as the scales ranging from 1:1000,000 to 1:500,000 are often
classified as strategic maps. These maps are used for planning concentrated
military action.
(c) Maps with a scale of 1:500,000 or less are called tactical maps. They serve as
guides to small units like battalions and patrol units prior to and during
movements anywhere near the front line.
(d) Photo map is an Aerial Photograph with strategic and tactical data superimposed
on it.
2.5 ELEMENTS OF MAP
All maps have some common elements: Location, graticule of lines of latitudes and
longitudes, direction, scale, distribution of various features and phenomena with the help of
various symbols, shades and conventional signs.
2.6 CONCLUSION
Maps are the tools of geographers. Geography cannot be studied without maps. Though
a number of disciplines are involved in the study of earth, but geography is the only
discipline which is involved in the mapping of the earth or any part of it. These are more
efficient than books. Maps are records of various facts of the earth. These maps make direct
appeal to the mind and bring before us the unknown and unseen areas in their original form.
2.7 SUMMARY
Map is two dimensional. It is true representative of three-dimensional earth. Map is a
picture of physical and cultural features of earth or any other area. There are also other ways
to represent the features of earth. Sketches, diagrams, photographs, are also used to depict
certain features of the earth.
Maps have lot of information, but it depends on the scale, projection, use of
conventional signs, skill of the cartographer, method of its making and also requirement of
the person concerned. Map is a graphic representation of the earth. It shows certain physical
and cultural features. It is a bird’s eye view. Each feature is the true representation of the
object of the earth.
Maps are classified on the basis of scale and purpose. The maps are of two categories.
On the basis of scale, large scale maps show small area on a large size of paper with much
detail, whereas small scale maps show large area on a small size of paper with selected
details. Topographical maps are large scale maps, mainly published by Survey of India on the
BA/BSC GE-103 PRACTICAL Uttarakhand Open University
UNIT 2 : ELEMENTS AND TYPES OF MAPS Page 31 of Page 159
scales of 1 cm to 250m, 1 cm to 500m and 1 cm to 2.5 km. Wall maps and Atlas maps are
main categories of small scale maps.
Maps prepared with certain purposes are known as thematic maps. These have two
broad categories- Physical and Cultural. Physical maps highlight various physical aspects like
relief, climate, soils, natural vegetation and geology. Cultural maps show the manmade
features. Economic, political, historical, socio-cultural, population and military map are such
maps. The variety and types of maps on the basis of purpose is quite unlimited.
2.8 GLOSSARY
Map: A conventional representation of any area of the earth’s surface, small or large, drawn
to scale on a flat surface.
Topographical Map : A map of small area drawn on a large scale depicting both natural and
manmade features.
Cadastral Map: A map on large scale, showing the accurate detail of the extent and
measurement of every field and plot of land.
Climatic Map : A map of the world or any part of it, showing average conditions of
climatic elements over a long period of time.
Legend : A description, explanation, table of symbols and other information
printed on a map.
Relief Map : A map showing relief of an area on a flat surface.
Large Scale Map : Represent small area of the surface on a large size of paper.
Small Scale Map : Represent large area of the surface on a small size of paper.
Topographical Map : It shows general surface features in detail. These features are natural
and cultural both.
Wall Maps : The maps hanged on the wall are called wall maps. These are
geographical maps.
Atlas Maps : These are in the form of a book of maps.
Thematic Maps : These maps are small scale maps, and are drawn with certain themes or
purposes.
Bathymetric Map : Map showing the depth of ocean and seas.
Geological Map : It represents the distribution and type of rocks.
Weather Map : A map showing weather conditions of a particular time and day.
Soil Map : Represent type and distribution of soils.
Population Map : Represent various aspects of population geography.
Political Map : Map showing political extent of different administrative units.
Military Map : This map is also known as defence map.
Economic Map : Maps showing the distribution of economic resources.
Socio-cultural Map : These represent the socio-cultural aspects of the area.
BA/BSC GE-103 PRACTICAL Uttarakhand Open University
UNIT 2 : ELEMENTS AND TYPES OF MAPS Page 30 of Page 159
2.9 ANSWER TO CHECK YOUR PROGRESS
Map is a graphic representation of the surface of the earth.
Map is originated from the Latin word mappa.
Map is defined by a number of scholars.
Map shows physical and cultural features both.
Map is a flat piece of paper.
Certain objects on the map are shown by conventional signs and symbols.
Maps are classified on the basis of scale and purpose.
Large scale maps show a very small area.
Cadastral map a large scale map shows details of land.
Village map shows the boundaries of field.
City map depicts buildings with their use.
Topographical maps are large scale maps.
In India, topographical maps are published by survey of India.
Topographical maps are prepared on two main scales 1:50,000 and 1:250,000.
Topographical maps are very useful to study the area at micro level.
A topographical map of 53K denotes the scale of 1:250,000.
The number of 53K/15 is an indication of the scale of 1:50,000.
Atlas is a book of maps.
Small scale maps represent large area on a small sheet of paper.
Wall maps are larger than Atlas maps.
Wall maps are also called as geographical maps.
In India, Atlas is published and prepared by NATMO.
NATMO denotes National Atlas Thematic Mapping Organisation.
There is a variety of Atlases.
Atlas maps are also known as chorographical maps.
Physical maps are natural map.
Relief, climate, vegetation, soil maps are physical maps.
Relief maps shows nature of surface, rivers.
Bathymetric maps- show depth of ocean bodies.
Geological maps- show type and structure of rocks.
Climatic maps- they show the climatic conditions for a long period of time.
Weather maps-show the weather conditions for a particular day and time.
Soil map- shows types of soils and their distribution.
Natural vegetation maps are forest maps showing their distribution.
Economic maps- show the distribution of economic resources.
Political maps are the maps of continents, countries and all type of administrative
units.
Historical maps- represent the old events of the area.
Socio-cultural maps- depict social and cultural aspects.
Population maps- show density, distribution of population and related aspects.
BA/BSC GE-103 PRACTICAL Uttarakhand Open University
UNIT 2 : ELEMENTS AND TYPES OF MAPS Page 31 of Page 159
Military maps- are defence service maps.
Photo map- is an air photo map.
2.10 REFERENCES
1. Bygott, J. (1948) : An introduction to map work and practical geography, London.
2. Misra, R.P. and A. Ramesh: (1969), Fundamentals of Cartography, Mysore.
3. Raisz, Erwin (1962) : Principles of cartography, Tokyo
4. Robinson, A.H. (1966) :Elements of Cartography, New York.
2.11 SUGGESTED READING
1. Gaur, K.S. (1968) :Manchitra Kala Ki Sameeksha, Agra Book Store, Agra.
2. Sharma, J.P. (2014) : Practical Geography Rastogi Publications, Meerut.
3. Singh, R.B. (2003) : Practical work in Geography Pt I NCERT, New Delhi.
4. Singh, R.L. & P.K. Dutt (1966) : Elements of practical Geography, Students friends,
Allahabad.
2.12 TERMINAL QUESTIONS
1. Define map. Also explain its main concepts.
2. Explain in detail the meaning, importance and utility of maps.
3. Discuss the main characteristics of maps.
4. Discuss the classification of maps. Justify your base of classification.
5. Write an essay on the maps based on scale.
6. Discuss the types and characteristics of small scale maps.
7. Give the main types of maps based on various purposes.
8. Explain wall maps with examples.
9. Atlas maps are very necessary for the study of geography of an area. Elaborate it.
10. Differentiate between climate maps and weather map.
11. Discuss the main type of physical maps.
12. Discuss the main type of cultural maps.
13. Discuss various types of military maps.
14. Map is a true representation of the earth. Explain it.
BA/BSC GE-103 PRACTICAL Uttarakhand Open University
UNIT 3 : ENLARGEMENT AND REDUCTION OF MAPS Page 32 of Page 159
UNIT 3 : ENLARGEMENT AND REDUCTION OF
MAPS
3.1 OBJECTIVES
3.2 INTRODUCTION
3.3 METHODS OF ENLARGEMENT AND REDUCTION OF
MAPS (PHOTOGRAPHICAL, CARTOGRAPHICAL,
INSTRUMENTAL)
3.4 CONCLUSION
3.5 SUMMARY
3.6 GLOSSARY
3.7 ANSWER TO CHECK YOUR PROGRESS
3.8 REFERENCES
3.9 SUGGESTED READINGS
3.10 TERMINAL QUESTIONS
BA/BSC GE-103 PRACTICAL Uttarakhand Open University
UNIT 3 : ENLARGEMENT AND REDUCTION OF MAPS Page 33 of Page 159
3.1 OBJECTIVES
This chapter explains the change in the scale of map or a portion of it. It is necessary when
we require to add or minus the details shown on the map. To get more space, on the map, we
try to enlarge the map and if the map is required in a small space, we try to reduce the map
with the help of scale.
3.2 INTRODUCTION
The enlargement and reduction of maps is related to the scale. It denotes the change in the
original scale of the map. It helps in the enlargement and reduction of maps. It can enlarge or
reduce the map by so many times i.e. two, three or four times. The scale of the map is also
reduced or enlarged in that ratio of the scale.
The cartographer or the researcher is always in need of the maps to get them either in
enlarged or reduced form. If the original map is so small in size, that it seems to be very
difficult for him to show much detail as per his requirement, then it becomes necessary to
enlarge the original map. This should be exercised in accordance to the scale. On the other
hand, sometimes we require the reduced size of the original map, to get them incorporated in
the book, magazines, and project or research reports.
3.3METHODS OF ENLARGEMENT AND REDUCTION OF MAP
(Photographical, cartographical and Instrumental)
There are a number of methods for the reduction and enlargement of maps. These are of two
categories:
(a) Mechanical Methods (Photographical), (b) Diagrammatic Methods (Cartographical), (c)
Instrumental methods,
(a) Mechanical Methods: Thechange in scale of maps is made by the instruments. These
are quite easy and simple, and can change the size of map within no time. These involve the
use of proportional compasses, pantograph, camera Lucida, photostat and photographic
equipments. These are of two types:
(i) Photographical Method:This method is no doubt the costliest of all the methods. At
the same time, it is capable of giving the high degree of precision. It involves the use of
standard cameras and the preparation of film negative and paper prints. It gives a little
more precision than the photostat in which there is the possibility of some distortion at
the edges. This method can enlarge the map of any size, and vice versa. It is costlier
than photostat methods. It takes very little time in the process of enlargement and
reduction of maps. It needs the good practice of handling the camera. The camera
should be of high quality, rather to say that now digital cameras are being used.
(ii) PhotostatMethod : It is based on photostat machine. This machine is a camera-like
device with a prism fixed to its front frame and a magazine to its back frame. It is
mounted on a heavy pedestal stand. The original map is placed on an adjustable subject
BA/BSC GE-103 PRACTICAL Uttarakhand Open University
UNIT 3 : ENLARGEMENT AND REDUCTION OF MAPS Page 34 of Page 159
or copy holder which lies in a horizontal position vertically below the prism. The prism
transfers the image on to a sensitized photostat paper placed in a vertical plane in the
magazine. These daysphotostat machines have highly developed techniques. These give
the prints in colour or in black. These have also such device by which the map can be
enlarged or reduced from the original one. Photostat machines are now of different
types. They have the prints not only in 911 but also in 1824. If a map is to be
enlarged, it can be done into sections. After the proper matching of these sections, a
large size of the map can be obtained. Sometimes, the difficulty in matching these
enlarge sections may arise due to unequal shrinkage of the prints in developing the
photostat copies.
However, photostat is a boon for researchers and students in as much as it gives a few
relatively inexpensive copies in the quickest possible time. Its utility encourages each
Geography Department to have a photostat machine of latest technique in its premises. This
is the cheapest method to get a number of copies of the required map both in enlarged and
reduced form.
(b) Diagrammatic Methods (Cartographical Methods): These methods are based on
geometrical figures, so these are called as diagrammatic methods. The enlargement and
reduction of maps is suitably done with the help of squares and triangles.
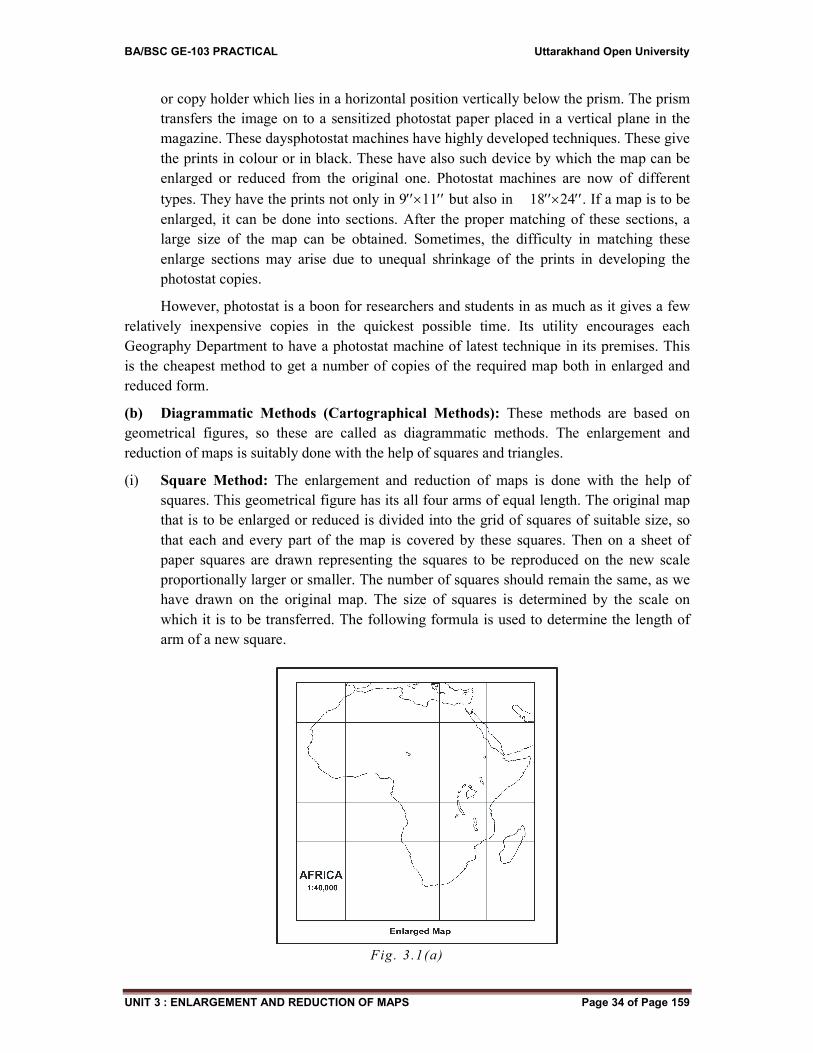
(i) Square Method: The enlargement and reduction of maps is done with the help of
squares. This geometrical figure has its all four arms of equal length. The original map
that is to be enlarged or reduced is divided into the grid of squares of suitable size, so
that each and every part of the map is covered by these squares. Then on a sheet of
paper squares are drawn representing the squares to be reproduced on the new scale
proportionally larger or smaller. The number of squares should remain the same, as we
have drawn on the original map. The size of squares is determined by the scale on
which it is to be transferred. The following formula is used to determine the length of
arm of a new square.
Fig. 3 .1(a)
BA/BSC GE-103 PRACTICAL Uttarakhand Open University
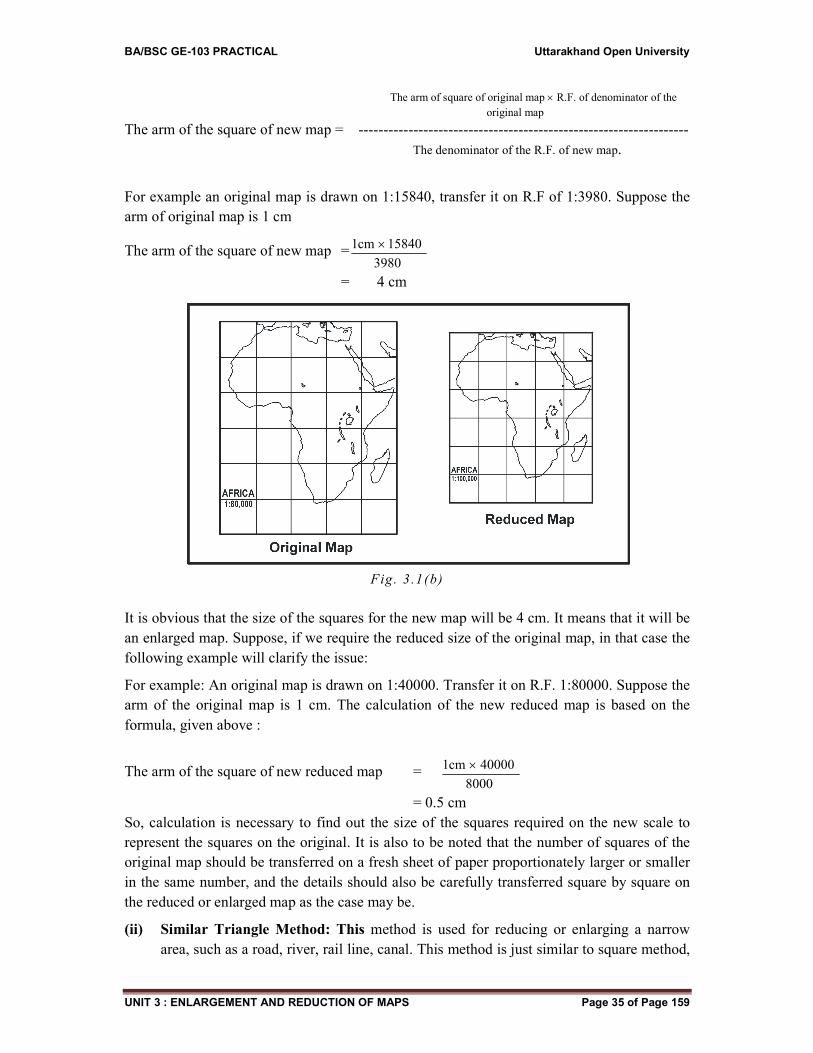
UNIT 3 : ENLARGEMENT AND REDUCTION OF MAPS Page 35 of Page 159
The arm of square of original mapR.F. of denominator of the
original map
The arm of the square of new map = ------------------------------------------------------------------
The denominator of the R.F. of new map.
For example an original map is drawn on 1:15840, transfer it on R.F of 1:3980. Suppose the
arm of original map is 1 cm
The arm of the square of new map =3980
15840cm1
= 4 cm
Fig. 3 .1(b)
It is obvious that the size of the squares for the new map will be 4 cm. It means that it will be
an enlarged map. Suppose, if we require the reduced size of the original map, in that case the
following example will clarify the issue:
For example: An original map is drawn on 1:40000. Transfer it on R.F. 1:80000. Suppose the
arm of the original map is 1 cm. The calculation of the new reduced map is based on the
formula, given above :
The arm of the square of new reduced map = 8000
40000cm1
= 0.5 cm
So, calculation is necessary to find out the size of the squares required on the new scale to
represent the squares on the original. It is also to be noted that the number of squares of the
original map should be transferred on a fresh sheet of paper proportionately larger or smaller
in the same number, and the details should also be carefully transferred square by square on
the reduced or enlarged map as the case may be.
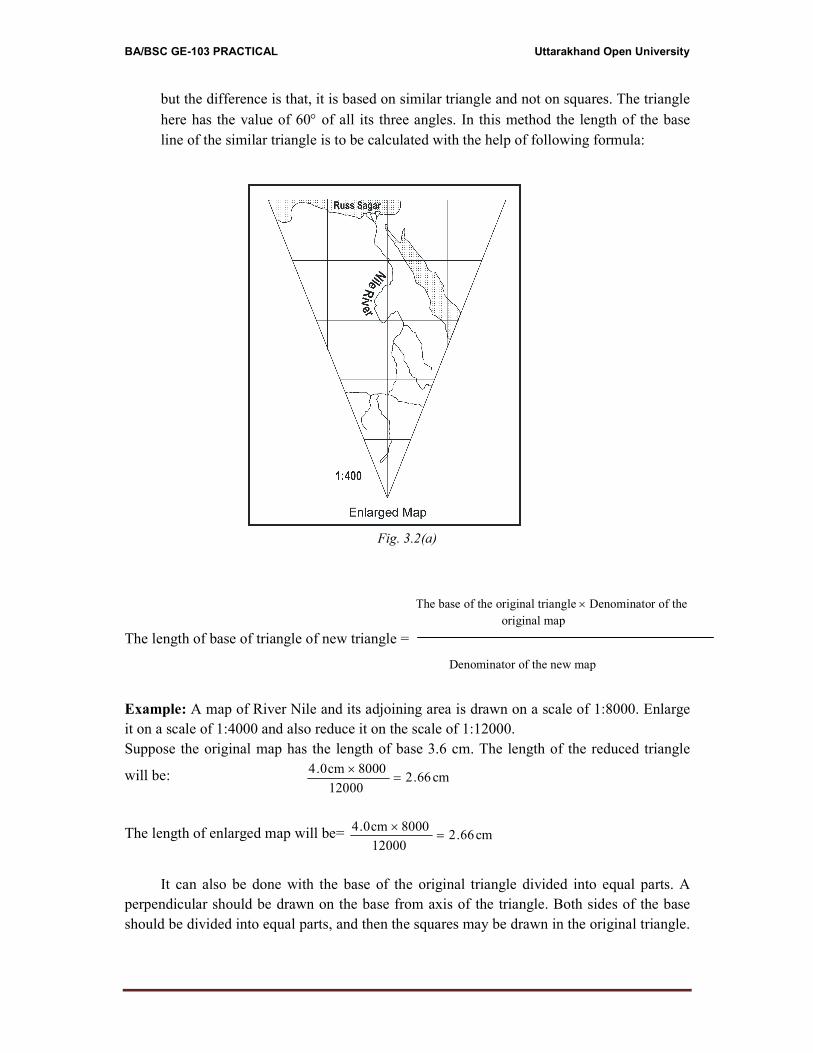
(ii) Similar Triangle Method: This method is used for reducing or enlarging a narrow
area, such as a road, river, rail line, canal. This method is just similar to square method,
BA/BSC GE-103 PRACTICAL Uttarakhand Open University
but the difference is that, it is based on similar triangle and not on squares. The triangle
here has the value of 60 of all its three angles. In this method the length of the base
line of the similar triangle is to be calculated with the help of following formula:
Fig. 3.2(a)
The base of the original triangleDenominator of the
original map
The length of base of triangle of new triangle =
Denominator of the new map
Example: A map of River Nile and its adjoining area is drawn on a scale of 1:8000. Enlarge
it on a scale of 1:4000 and also reduce it on the scale of 1:12000.
Suppose the original map has the length of base 3.6 cm. The length of the reduced triangle
will be: cm66.212000
8000cm0.4
The length of enlarged map will be= cm66.212000
8000cm0.4
It can also be done with the base of the original triangle divided into equal parts. A
perpendicular should be drawn on the base from axis of the triangle. Both sides of the base
should be divided into equal parts, and then the squares may be drawn in the original triangle.
BA/BSC GE-103 PRACTICAL Uttarakhand Open University
UNIT 3 : ENLARGEMENT AND REDUCTION OF MAPS Page 37 of Page 159
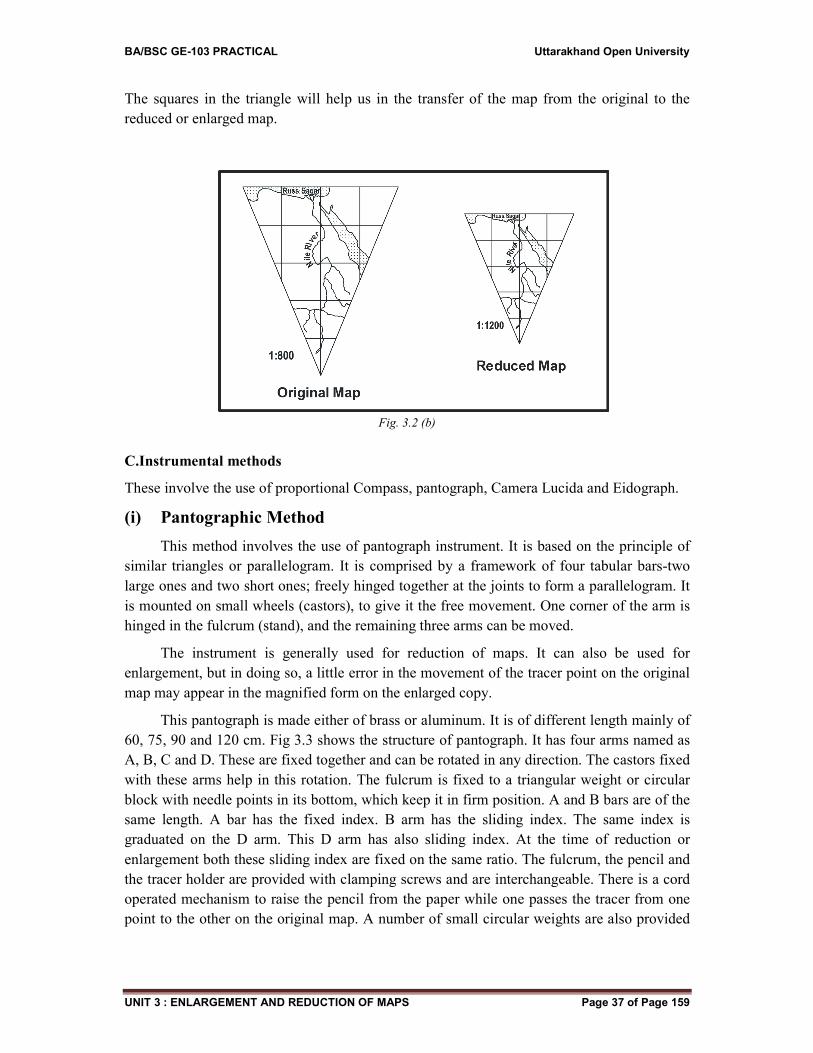
The squares in the triangle will help us in the transfer of the map from the original to the
reduced or enlarged map.
Fig. 3.2 (b)
C.Instrumental methods
These involve the use of proportional Compass, pantograph, Camera Lucida and Eidograph.
(i) Pantographic Method
This method involves the use of pantograph instrument. It is based on the principle of
similar triangles or parallelogram. It is comprised by a framework of four tabular bars-two
large ones and two short ones; freely hinged together at the joints to form a parallelogram. It
is mounted on small wheels (castors), to give it the free movement. One corner of the arm is
hinged in the fulcrum (stand), and the remaining three arms can be moved.
The instrument is generally used for reduction of maps. It can also be used for
enlargement, but in doing so, a little error in the movement of the tracer point on the original
map may appear in the magnified form on the enlarged copy.
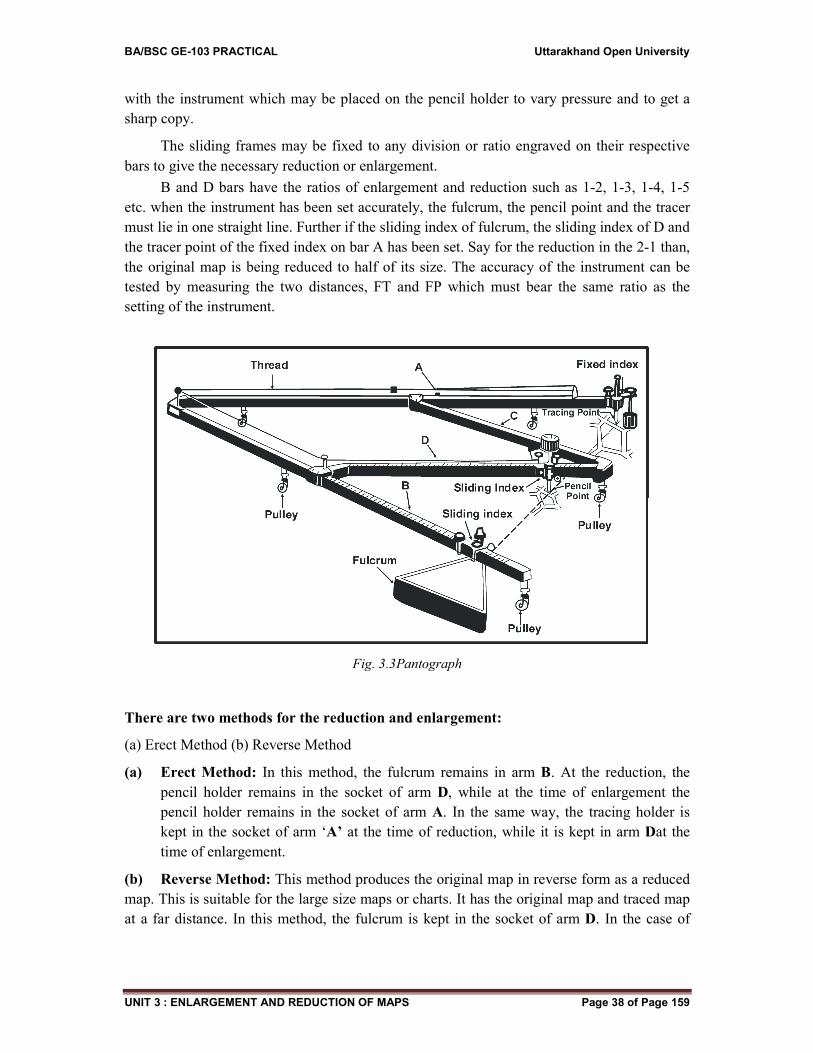
This pantograph is made either of brass or aluminum. It is of different length mainly of
60, 75, 90 and 120 cm. Fig 3.3 shows the structure of pantograph. It has four arms named as
A, B, C and D. These are fixed together and can be rotated in any direction. The castors fixed
with these arms help in this rotation. The fulcrum is fixed to a triangular weight or circular
block with needle points in its bottom, which keep it in firm position. A and B bars are of the
same length. A bar has the fixed index. B arm has the sliding index. The same index is
graduated on the D arm. This D arm has also sliding index. At the time of reduction or
enlargement both these sliding index are fixed on the same ratio. The fulcrum, the pencil and
the tracer holder are provided with clamping screws and are interchangeable. There is a cord
operated mechanism to raise the pencil from the paper while one passes the tracer from one
point to the other on the original map. A number of small circular weights are also provided
BA/BSC GE-103 PRACTICAL Uttarakhand Open University
UNIT 3 : ENLARGEMENT AND REDUCTION OF MAPS Page 38 of Page 159
with the instrument which may be placed on the pencil holder to vary pressure and to get a
sharp copy.
The sliding frames may be fixed to any division or ratio engraved on their respective
bars to give the necessary reduction or enlargement.
B and D bars have the ratios of enlargement and reduction such as 1-2, 1-3, 1-4, 1-5
etc. when the instrument has been set accurately, the fulcrum, the pencil point and the tracer
must lie in one straight line. Further if the sliding index of fulcrum, the sliding index of D and
the tracer point of the fixed index on bar A has been set. Say for the reduction in the 2-1 than,
the original map is being reduced to half of its size. The accuracy of the instrument can be
tested by measuring the two distances, FT and FP which must bear the same ratio as the
setting of the instrument.
Fig. 3.3Pantograph
There are two methods for the reduction and enlargement:
(a) Erect Method (b) Reverse Method
(a) Erect Method: In this method, the fulcrum remains in arm B. At the reduction, the
pencil holder remains in the socket of arm D, while at the time of enlargement the
pencil holder remains in the socket of arm A. In the same way, the tracing holder is
kept in the socket of arm ‘A’ at the time of reduction, while it is kept in arm Dat the
time of enlargement.
(b) Reverse Method: This method produces the original map in reverse form as a reduced
map. This is suitable for the large size maps or charts. It has the original map and traced map
at a far distance. In this method, the fulcrum is kept in the socket of arm D. In the case of
BA/BSC GE-103 PRACTICAL Uttarakhand Open University
UNIT 3 : ENLARGEMENT AND REDUCTION OF MAPS Page 39 of Page 159
reduction of map, pencil holder is fixed in arm Band the tracing holder is fixed in the socket
of arm A. In the case of enlargement, the position of both these holders is interchanged.
(ii) Eidograph
The eidograph consists of a simple framework of three graduated bars of tabular
construction-two parallel bars and one central bar. It has only one support, viz. at the fulcrum
base and three joints and hence is more precise and reliable than the pantograph. There are
two castor wheels at the two ends of the central bar, operated by an adjustable steel hand
which always keeps the other two bars in a parallel position. Below the castors, there are
attached to these two tabular slides through which pass the two parallel bars. There is also a
third tubular slide through which passes the central bar and is attached to the fulcrum fixed in
a circular weight. All the three bars are graduated into 100 divisions each way from the centre
and the vernier on the tabular slides gives a reading to one-tenth of a division.
The working of eidograph is just similar to pantograph. It is based on the principles of
similar triangles. The instrument is considered to be set when the fulcrum, pencil point and
the tracer point lie in one straight line. The distances of the pencil point and tracer point
should have the same ratio on measurement in accordance to the ratio of setting.
(iii) Camera Lucida Method
This camera is based on the principle of optics and photography. It is suitable for
reduction of large maps especially wall maps. The original map is hanged on the wall in a
vertical plane, and its reduced image is transferred through a prism on a drawing sheet of
paper placed in a horizontal position virtually below the prism. To get an uniform and sharp
copy of map in a reduced form, it is very necessary that the original map should be well
illuminated. The reduced image on the original can be viewed through the prism. The eye of
prism should be in the centre of the map. It should not have any movement while taking the
image of the map, otherwise it may be distorted. The required degree of enlargement or
reduction is got by adjusting the distances of the original and the drawing paper with respect
to the prism if the distance from the drawing paper is more than the distance from the prism
to the original map, it will lead to reduction, and if the distance is less from the prism to the
original map, it will lead to enlargement.
3.4 CONCLUSION
The enlargement and reduction of maps is related to the scale of maps. It is that
technique by which the maps are reproduced proportionately as per our requirement. The
methods, by which this procedure can be adopted are known as photographical,
cartographical and instrumental. Photographical methods depend on the use of photo camera
and photostat machines. These techniques depend on the expertise of cameramen and
handling of photostat machine. Cartographical and instrumental methods are followed by the
geography person himself. The measurement of squares and similar triangles are easily made
by the person concerned. These are the easiest and simplified methods. The instrumental
methods need the acquaintance of the person concerned to handle the pantograph, ediograph.
BA/BSC GE-103 PRACTICAL Uttarakhand Open University
UNIT 3 : ENLARGEMENT AND REDUCTION OF MAPS Page 40 of Page 159
These are quite expensive and time consuming ways to enlarge or reduce the maps and
because of that, these are not so popular.
3.5 SUMMARY
The original map may be reduced or enlarged on any size. This is possible with the
change in its scale. We intend to show more details in the map, and if the map is of small
size, it can be enlarged with the help of certain methods and vice versa. If map is of large size
and it is to be incorporated in a book or magazine, it can be reduced in the required size. The
methods can be put into three categories by which the maps may be put in the required size,
according to scale. These methods are known as mechanical, cartographical and instrumental.
Photographical methods are based on the use of certain machines, which can change the
size of map within no time. It is the simplest method. Photography is no doubt a costly affair,
as photo cameras, primarily need much investment, but such cameras can be used by a
photographer in other purposes also. The camera takes the photo image of the map. It
captures all the objects shown on the map. This photo image enlarged or reduced on the
photo paper, gives the true picture of details of the original map. This process takes less time.
It is a costlier affair. The use of digital cameras and mobile cameras has increased the utility
of this technique.
Photostat machines are also based on camera device technique. These days, it is very
popular. An original map is reduced or enlarged in no time. It is cheap also. It can enlarge a
small size map into parts, which can be joined together very easily. It is a boon to researchers
and students.
Cartographical methods are based on the geometrical figure of squares and similar
triangles. In square method, the original map is covered by the grid of squares of suitable
size. The arm of the square is measured, and this length of the arm is the base to determine
the size of the required map. The arm of the required map is ratio of denominator of original
map and denominator of R.F. of new map multiplied by the length of arm of the square of
original map. The number of squares remains the same, but their size is reduced or enlarged
according to our scale. The similar triangle method is applicable on such maps which are
mainly in linear shape such as river or transport line. This triangle has all its angles of 600,
and the size of the triangle or the base of the triangle is calculated on the same formula as is
of square method.
The instruments which are basically designed for the change in the scale of original
map are known as pantograph, eidograph and camera lucida. Pantograph is based on the
principle of similar triangles. It gives good results in the reduction of original map in
comparison of its enlargement. This instrument has four brass arms. It moves on castors and
has fulcrum in one big arm on its left side. It has needle point in one arm and tracing point in
another arm. These points are interchangeable. At the time of reduction the needle point is
put on big arm and the tracing point or pencil point on the small arm. This position is
reversed at the time of enlargement. So, it has two methods erect and reverse method.
BA/BSC GE-103 PRACTICAL Uttarakhand Open University
UNIT 3 : ENLARGEMENT AND REDUCTION OF MAPS Page 41 of Page 159
Eidograph is constructed with two parallel bars, with one support. It is also based on the
principle of similar triangles. The camera Lucida is based on the principle of optics and
photography. It is suitable for the reduction of wall maps.
3.6 GLOSSARY
Reduction Smaller than the original
Enlargement Larger than the original
Photograph A record of behavior of light with the object
Photographical Photo taken by standard or digital camera
Photostate A copy of the map with the help of photo camera machine
Square All the four arms of the equal length
Grid of square Graticule of squares
Denominator of R.F Ground distance
Similar triangle All three angles of the same value i.e 600
Pantograph Parallelogram
Pantograph A framework of four tabular bars
Castor Wheels
Erect method To reduce the map by pantograph
Reverse method To enlarge the map by pantograph
Eidograph An instrument of two parallel bars and one central bar
Fulcrum A triangular weight
Camera Lucida Reduces wall maps with the help of prism
3.7 ANSWER TO CHECK YOUR PROGRESS
1. Enlargement and reduction of maps is related to scale.
2. The size of map can be changed by so many times preferable two, three or four times.
3. Reduction of map may delete the details of certain objects.
4. Enlargement of map is helpful in addition of certain details.
5. Photographical, cartographical and instrumental are three methods to change the scale
of maps.
6. Photographical methods are of two types- photography and photostat.
7. Photography is done by standard or digital cameras.
8. Photography is capable of giving the high degree of precision.
9. Photography gives positive and negative prints both.
10. Photography takes very little time in the processing.
11. Photostatis done by photostat machine.
12. Photostat machine is a camera like device.
BA/BSC GE-103 PRACTICAL Uttarakhand Open University
UNIT 3 : ENLARGEMENT AND REDUCTION OF MAPS Page 42 of Page 159
13. The original map in the machine is placed vertically below the prism.
14. The prism transfers the image to a sensitized photostat paper.
15. The photostat machine can enlarge or reduce the original image or map.
16. Photostat can give a number of copies within no time.
17. Photostat is the cheapest method.
18. Cartographical methods are of two types – squares & triangles.
19. Cartographical methods are based on geometrical figures.
20. Square method is the most reliable and accurate method.
21. In square method, the map is covered by a grid of squares of same size.
22. The size of squares is determined by the formula, and it is proportionate to the size of
original map.
23. The number of squares remains the same, either the map is enlarged or reduced.
24. Square method is based on the length of arm as all the four arms have equal length.
25. Similar triangle method is based on triangle.
26. Similar triangle method is just similar to square method.
27. In similar triangle method the length of one arm of a triangle is calculated on the basis
of formula.
28. In this triangle method, the inside of a triangle is divided into the grid of squares.
29. The squares in the triangle are drawn by dividing the base line into equal parts.
30. The square in the triangle helps in the transfer of the object.
31. Instrumental methods are known as pantograph, eidograph and camera Lucida.
32. Pantograph is an instrument of four parallel bars.
33. It is fixed by a fulcrum on the table.
34. It is mounted on small wheels also known as castors.
35. It is more appropriate for the reduction of maps.
36. The tracer point and pencil point are inter changeable.
37. The reduction and enlargement is done according to graduated marks on the parallel
bars.
38. In erect method, the original map in erect form as a enlargement map.
39. In reverse method the original map in reverse form as a reduced map.
40. Eidograph is an instrument of two parallel bars.
41. The working of eidograph is just similar to pantograph.
42. In eidograph, the fulcrum, pencil point and tracer point are put in one straight line.
43. Camera Lucida is based on the principles of optics and photography.
44. Camera Lucida transfers the image of map on horizontal plane.
45. Camera Lucida is suitable to reduce the wall maps.
46. Camera Lucida has the original map in the vertical form and transfers its image on a
horizontal sheet of paper.
BA/BSC GE-103 PRACTICAL Uttarakhand Open University
UNIT 3 : ENLARGEMENT AND REDUCTION OF MAPS Page 43 of Page 159
3.8 REFERENCES
1 Bygott, J. (1948) : An introduction to map work and practical geography, London.
2 Misra, R.P. and A. Ramesh: (1969), Fundamentals of Car-tography, Mysore.
3 Raisz, Erwin (1962) : Principles of cartography, Tokyo
4 Robinson, A.H. (1966) Elements of Cartography, New York.
3.9 SUGGESTED READING
1 Gaur, K.S. (1968) :Manchitra Kala Ki Sameeksha, Agra Book Store, Agra.
2 Sharma, J.P. (2014) : Practical Geography Rastogi Publications, Meerut.
3 Singh, R.B. (2003) : Practical work in Geography Pt I NCERT, New Delhi.
4 Singh, R.L. & P.K. Dutt (1966): Elements of practical Geography, Students friends,
Allahabad.
3.10 TERMINAL QUESTIONS
1. What do you mean by enlargement and reduction of maps? Explain.
2. Why the enlargement and reduction of original map is necessary? Justify it.
3. Discuss the methods of enlargement and reduction of maps.
4. Discuss the photographical methods in detail.
5. Explain the process of photographical method.
6. Discuss the importance of photostat technique.
7. Explain in detail the square method.
8. Elaborate the similar triangle method. How it is useful?
9. Discuss the formula used in square method.
10. Which method is suitable for reduction and enlargement of linear maps? Give example
also.
11. A map is on the scale of 1:40 change it on R.F 1:20 and 1:80 with the help of square
method.
12. A river is drawn on a map with scale 1:1000. Enlarge it on the scale of 1:500 with the
help of similar triangle method.
13. A map of India is drawn on a scale of 1:10,00000 and the size of a square is 1 cm.
Reduce it on the scale of 1:20,00000.
14. The base of a triangle is 5 cm and a road is drawn on that base. Draw it on the triangles
of 2.5 cm and 8 cm.
BA/BSC GE-103 PRACTICAL Uttarakhand Open University
UNIT 4 : METHODS OF SHOWING RELIEF Page 44 of Page 159
BLOCK-2 REPRESANTATION OF PHYSICAL
DATA
UNIT 4 : METHODS OF SHOWING RELIEF
4.1 OBJECTIVES
4.2 INTRODUCTION
4.3 MEANING OF RELIEF
4.4 METHODS OF SHOWING RELIEF (PICTORIAL METHOD,
MATHEMATICAL METHOD, MIXED METHODS)
4.5 CONCLUSION
4.6 SUMMARY
4.7 GLOSSARY
4.8 ANSWER TO CHECK YOUR PROGRESS
4.9 REFERENCES
4.10 SUGGESTED READINGS
4.11 TERMINAL QUESTIONS
BA/BSC GE-103 PRACTICAL Uttarakhand Open University
UNIT 4 : METHODS OF SHOWING RELIEF Page 45 of Page 159
4.1 OBJECTIVES
After studying this unit, you will be able to-
Understand different methods used for representation of relief features.
Understand the development of qualitative methods landforms and landscapes on the
earth surface in recognizing typical landform patterns in the selected areas.
Understand slope and gradient of the area concerned with the help of these methods.
Understand the development of mathematical or quantitative methods based on
mathematical inputs.
Find out the advancement in the methods of studying relief features in the recent past.
In GIS environment techniques are used to prepare three-dimensional features of the
earth surface.
4.2 INTRODUCTION
To identify and map the different relief features of the earth surface has always been a
challenge for geographers especially cartographers. Every method has its merits and demerits
and there is always a scope left to find out a new method. The need to map the different
features may be made for a variety of reasons. The systematic observation of the earth
surface, interpreting of the relief features of different parts of the earth surface, their
implementation in various field areas and their representation accordingly is a significant part
of geographical studies
In this unit, you will study about relief, which has been widely studied, analyzed and
interpreted by generations of geographers. The word includes one of the most obvious
irregularities of the earth’s surface, altitude, the third dimension of geographical space.
Present day relief of any part of the earth surface is the result of the dynamic processes active
in that particular part of the earth surface. It is also necessary for you to understand that
though the word relief is much older, development of geomorphology in the nineteenth
century led towards not only the description and analysis of landforms but also showing the
landforms of different size, shape and height with more accuracy and effective manner. As a
result, different methods to show relief features or topography of different parts of the earth
surface developed faster in different parts of the globe.
The term topography originated in ancient Greece and continued in ancient Rome as
the detailed description of a place. The word comes from the Greek words as topos, which
means, “place" and graphia, which means "writing". In classical literature, this refers to
writing about a place or places. In Britain and in Europe in general, the word topography is
still sometimes used in its original sense. Here, in this unit, we are more interested in
explaining relief as well as the methods, which show relief in geographical studies. For this, it
is necessary for you to know all the possible ways to understand the relief features as not only
they are at present but also how they were in the past and how they can change in the future.
If we go through past studies, we can find a common interest starting related with the
mapping of relief or topographic surveys and mapping started for defence purposes. The
BA/BSC GE-103 PRACTICAL Uttarakhand Open University
UNIT 4 : METHODS OF SHOWING RELIEF Page 46 of Page 159
earliest detailed in the United States were made by the “Topographical Bureau of the Army,
formed during the1812 war which later on in 1938 became the Corps of topographical
Engineers. After the U. S. Geological Survey assumed the work of national mapping in 1978,
the term topographical remained as a general term for detailed surveys and mapping
programs, and adopted by most other nations as standard. In France De la Noë, a topographer
and a lieutenant colonel published his work on the "forms of terrain" and, in this way
contributed to the development of cartography for military usages. Detailed military surveys
in Britain (beginning in the late eighteenth century) were called Ordnance Surveys, and this
term was used into the 20th century as generic for topographic surveys and maps. In the 20th
century, the term topography started to describe surface description in other fields too.
Drastic changes came with the twenty first century computer cartography, GIS, and more and
more work is being done for improvement in accuracy in this field all over the globe. You
must have understood up to now that studying the different relief features is an essential part
of understanding geography. In this reference you must also know that a high plateau may
have a high altitude but a low relief while mountains in the coastal areas may have only a
modest altitude but great relief. In simpler words, in geographical studies, understanding
relief features is very important. The horizontal and vertical dimensions of the earth surface
referred as terrain have its impact on different aspects of human life. Because of this reason,
it has been a major topic of interest for geographers. Understanding the terrain of an area
enables the understanding the boundaries of drainage basins, water and sediment flow in
channels. Understanding relief also supports soil conservation in agricultural areas. Contour
farming leads towards sustainable agriculture in hill slopes. The relief of that particular area
up to a great extent determines changes in weather and determination of climatic regions.
Two areas geographically close to each other may differ radically in precipitation levels or
timing because of differences in elevation or a rain shadow effect. In aviation, precise
knowledge of differences in elevation is required. Terrain will also affect range and
performance of radars and terrestrial radio navigation systems. Not only this, a mountainous
terrain or hilly region can have its impact the implementation of a new aerodrome and the
orientation of its runways. Detailed terrain studies can provide details of surface water flow
and distribution of water bodies over the given area. Some of these examples may be helpful
for you to realize the significance of understanding and mapping relief features while
studying geography. In most of geographical studies, topographic maps are widely used for
showing relief. Over a large area, it can affect water and climatic patterns. In this way, we
can understand the significance of relief features and different methods for mapping them
from the beginning of map making up to now.
4.3 MEANING OF RELIEF
All of you know that the earth features are different in elevation. The definition of relief is
complex because it requires reference to several parameters. It is indeed at once the
expression of altitude, of slope, and of form, while at the same time reflecting the
relationships that exist between these different elements. There is a Chinese proverb that
expresses this very well: if there were no mountain, the plains would not be seen. Indeed,
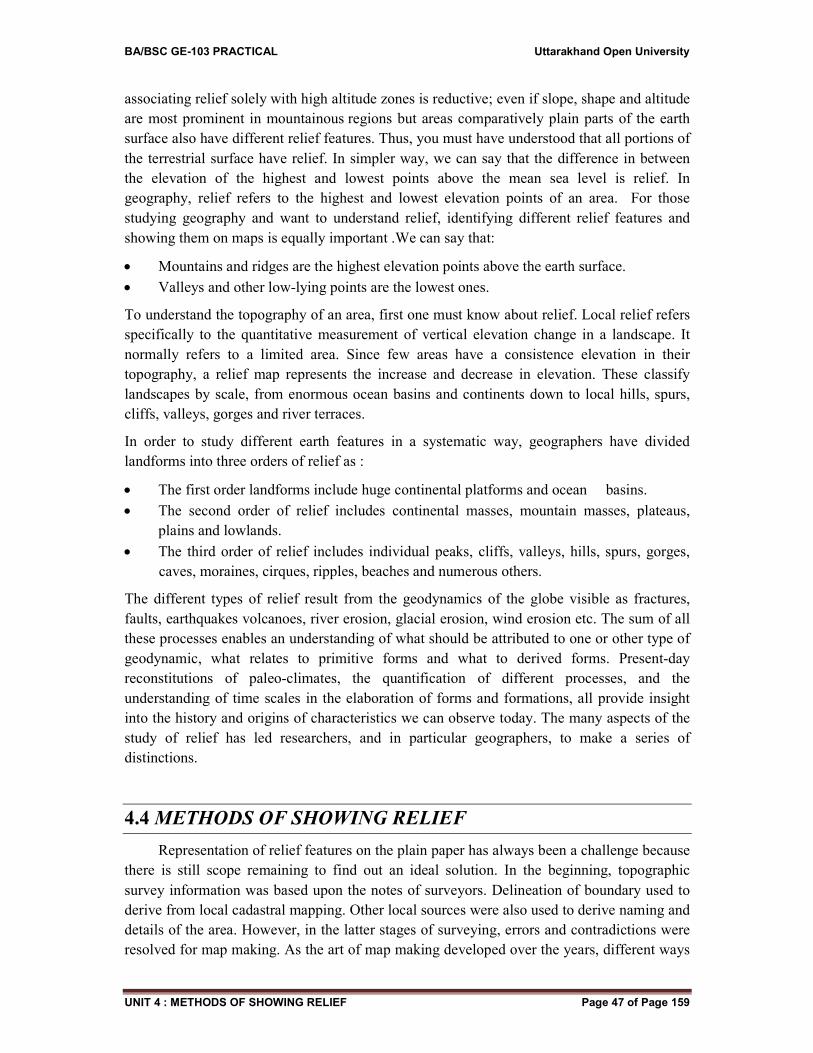
BA/BSC GE-103 PRACTICAL Uttarakhand Open University
UNIT 4 : METHODS OF SHOWING RELIEF Page 47 of Page 159
associating relief solely with high altitude zones is reductive; even if slope, shape and altitude
are most prominent in mountainous regions but areas comparatively plain parts of the earth
surface also have different relief features. Thus, you must have understood that all portions of
the terrestrial surface have relief. In simpler way, we can say that the difference in between
the elevation of the highest and lowest points above the mean sea level is relief. In
geography, relief refers to the highest and lowest elevation points of an area. For those
studying geography and want to understand relief, identifying different relief features and
showing them on maps is equally important .We can say that:
Mountains and ridges are the highest elevation points above the earth surface.
Valleys and other low-lying points are the lowest ones.
To understand the topography of an area, first one must know about relief. Local relief refers
specifically to the quantitative measurement of vertical elevation change in a landscape. It
normally refers to a limited area. Since few areas have a consistence elevation in their
topography, a relief map represents the increase and decrease in elevation. These classify
landscapes by scale, from enormous ocean basins and continents down to local hills, spurs,
cliffs, valleys, gorges and river terraces.
In order to study different earth features in a systematic way, geographers have divided
landforms into three orders of relief as :
The first order landforms include huge continental platforms and ocean basins.
The second order of relief includes continental masses, mountain masses, plateaus,
plains and lowlands.
The third order of relief includes individual peaks, cliffs, valleys, hills, spurs, gorges,
caves, moraines, cirques, ripples, beaches and numerous others.
The different types of relief result from the geodynamics of the globe visible as fractures,
faults, earthquakes volcanoes, river erosion, glacial erosion, wind erosion etc. The sum of all
these processes enables an understanding of what should be attributed to one or other type of
geodynamic, what relates to primitive forms and what to derived forms. Present-day
reconstitutions of paleo-climates, the quantification of different processes, and the
understanding of time scales in the elaboration of forms and formations, all provide insight
into the history and origins of characteristics we can observe today. The many aspects of the
study of relief has led researchers, and in particular geographers, to make a series of
distinctions.
4.4 METHODS OF SHOWING RELIEF
Representation of relief features on the plain paper has always been a challenge because
there is still scope remaining to find out an ideal solution. In the beginning, topographic
survey information was based upon the notes of surveyors. Delineation of boundary used to
derive from local cadastral mapping. Other local sources were also used to derive naming and
details of the area. However, in the latter stages of surveying, errors and contradictions were
resolved for map making. As the art of map making developed over the years, different ways
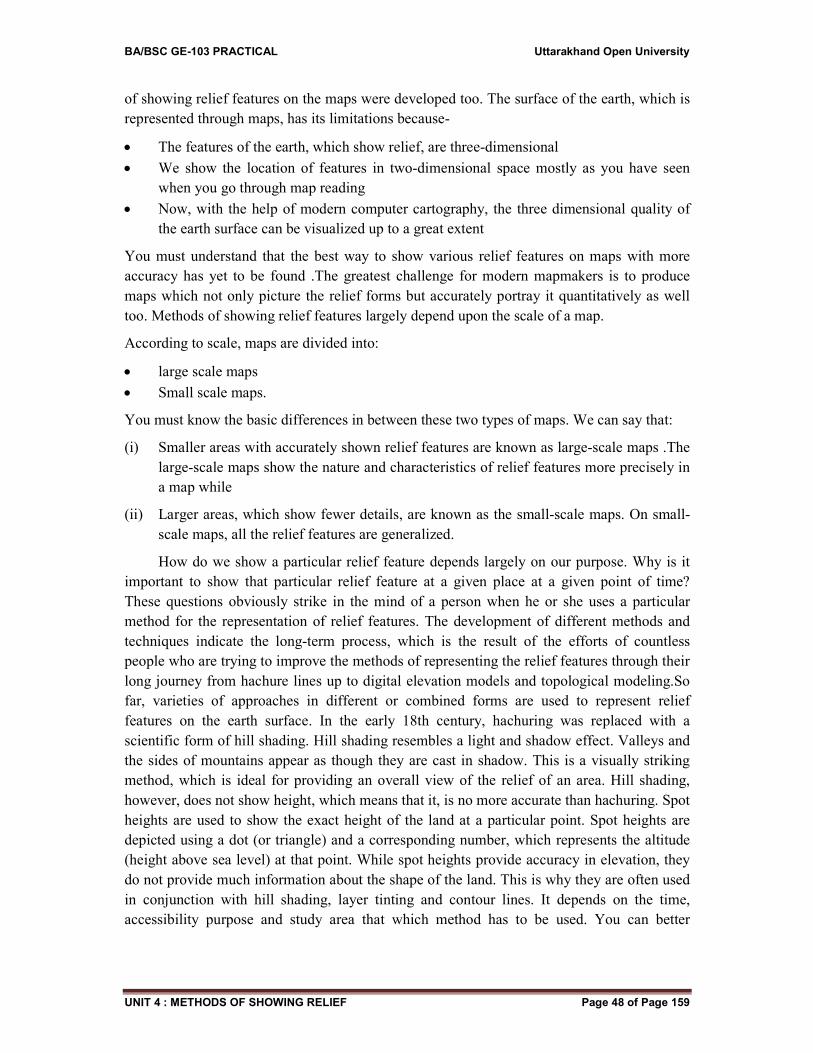
BA/BSC GE-103 PRACTICAL Uttarakhand Open University
UNIT 4 : METHODS OF SHOWING RELIEF Page 48 of Page 159
of showing relief features on the maps were developed too. The surface of the earth, which is
represented through maps, has its limitations because-
The features of the earth, which show relief, are three-dimensional
We show the location of features in two-dimensional space mostly as you have seen
when you go through map reading
Now, with the help of modern computer cartography, the three dimensional quality of
the earth surface can be visualized up to a great extent
You must understand that the best way to show various relief features on maps with more
accuracy has yet to be found .The greatest challenge for modern mapmakers is to produce
maps which not only picture the relief forms but accurately portray it quantitatively as well
too. Methods of showing relief features largely depend upon the scale of a map.
According to scale, maps are divided into:
large scale maps
Small scale maps.
You must know the basic differences in between these two types of maps. We can say that:
(i) Smaller areas with accurately shown relief features are known as large-scale maps .The
large-scale maps show the nature and characteristics of relief features more precisely in
a map while
(ii) Larger areas, which show fewer details, are known as the small-scale maps. On small-
scale maps, all the relief features are generalized.
How do we show a particular relief feature depends largely on our purpose. Why is it
important to show that particular relief feature at a given place at a given point of time?
These questions obviously strike in the mind of a person when he or she uses a particular
method for the representation of relief features. The development of different methods and
techniques indicate the long-term process, which is the result of the efforts of countless
people who are trying to improve the methods of representing the relief features through their
long journey from hachure lines up to digital elevation models and topological modeling.So
far, varieties of approaches in different or combined forms are used to represent relief
features on the earth surface. In the early 18th century, hachuring was replaced with a
scientific form of hill shading. Hill shading resembles a light and shadow effect. Valleys and
the sides of mountains appear as though they are cast in shadow. This is a visually striking
method, which is ideal for providing an overall view of the relief of an area. Hill shading,
however, does not show height, which means that it, is no more accurate than hachuring. Spot
heights are used to show the exact height of the land at a particular point. Spot heights are
depicted using a dot (or triangle) and a corresponding number, which represents the altitude
(height above sea level) at that point. While spot heights provide accuracy in elevation, they
do not provide much information about the shape of the land. This is why they are often used
in conjunction with hill shading, layer tinting and contour lines. It depends on the time,
accessibility purpose and study area that which method has to be used. You can better
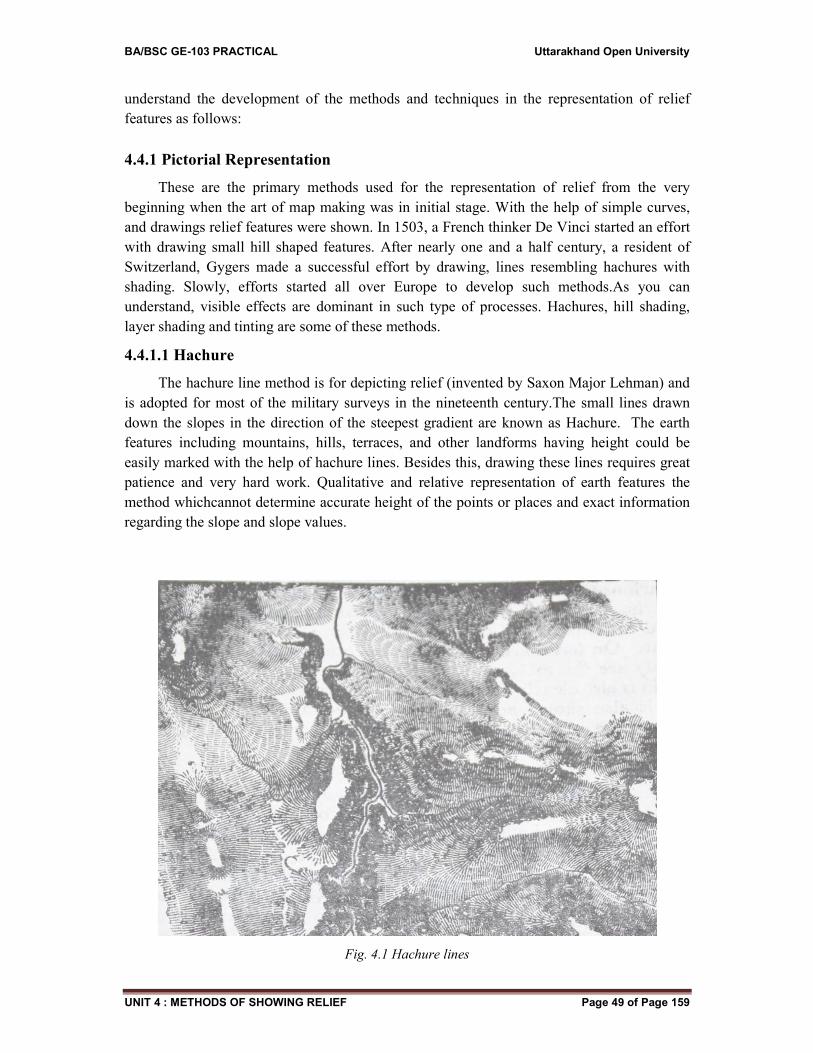
BA/BSC GE-103 PRACTICAL Uttarakhand Open University
UNIT 4 : METHODS OF SHOWING RELIEF Page 49 of Page 159
understand the development of the methods and techniques in the representation of relief
features as follows:
4.4.1 Pictorial Representation
These are the primary methods used for the representation of relief from the very
beginning when the art of map making was in initial stage. With the help of simple curves,
and drawings relief features were shown. In 1503, a French thinker De Vinci started an effort
with drawing small hill shaped features. After nearly one and a half century, a resident of
Switzerland, Gygers made a successful effort by drawing, lines resembling hachures with
shading. Slowly, efforts started all over Europe to develop such methods.As you can
understand, visible effects are dominant in such type of processes. Hachures, hill shading,
layer shading and tinting are some of these methods.
4.4.1.1 Hachure
The hachure line method is for depicting relief (invented by Saxon Major Lehman) and
is adopted for most of the military surveys in the nineteenth century.The small lines drawn
down the slopes in the direction of the steepest gradient are known as Hachure. The earth
features including mountains, hills, terraces, and other landforms having height could be
easily marked with the help of hachure lines. Besides this, drawing these lines requires great
patience and very hard work. Qualitative and relative representation of earth features the
method whichcannot determine accurate height of the points or places and exact information
regarding the slope and slope values.
Fig. 4.1 Hachure lines
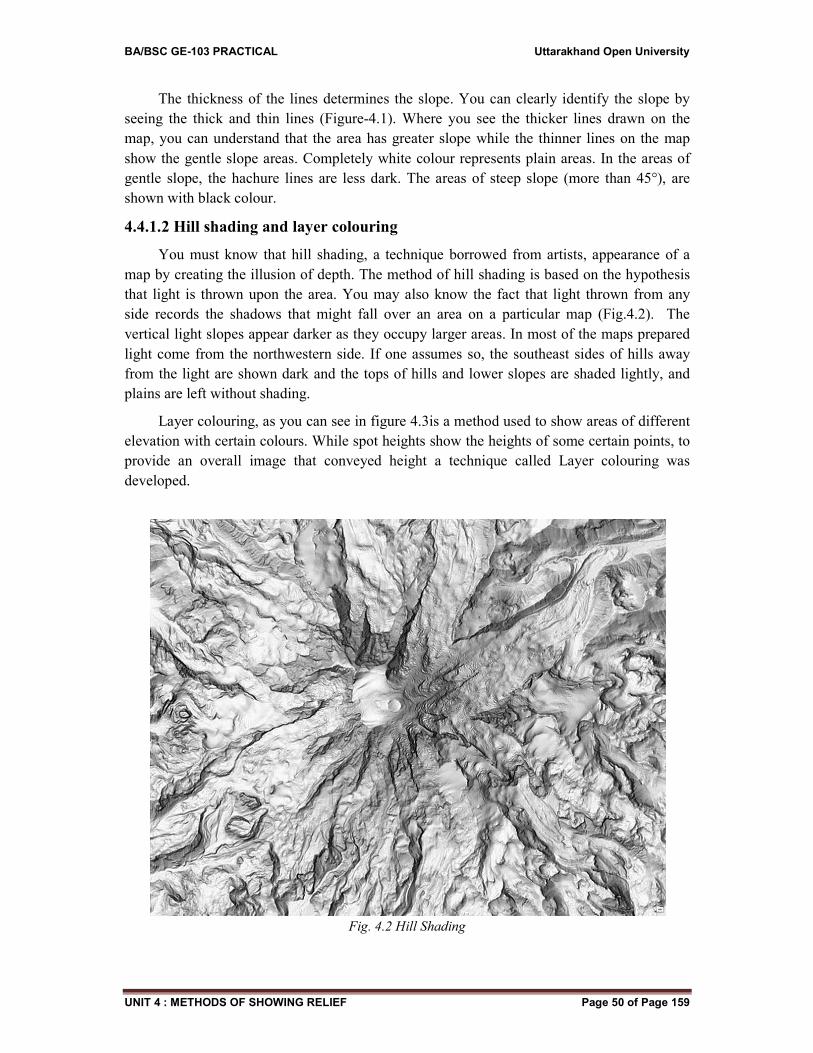
BA/BSC GE-103 PRACTICAL Uttarakhand Open University
UNIT 4 : METHODS OF SHOWING RELIEF Page 50 of Page 159
The thickness of the lines determines the slope. You can clearly identify the slope by
seeing the thick and thin lines (Figure-4.1). Where you see the thicker lines drawn on the
map, you can understand that the area has greater slope while the thinner lines on the map
show the gentle slope areas. Completely white colour represents plain areas. In the areas of
gentle slope, the hachure lines are less dark. The areas of steep slope (more than 45°), are
shown with black colour.
4.4.1.2 Hill shading and layer colouring
You must know that hill shading, a technique borrowed from artists, appearance of a
map by creating the illusion of depth. The method of hill shading is based on the hypothesis
that light is thrown upon the area. You may also know the fact that light thrown from any
side records the shadows that might fall over an area on a particular map (Fig.4.2). The
vertical light slopes appear darker as they occupy larger areas. In most of the maps prepared
light come from the northwestern side. If one assumes so, the southeast sides of hills away
from the light are shown dark and the tops of hills and lower slopes are shaded lightly, and
plains are left without shading.
Layer colouring, as you can see in figure 4.3is a method used to show areas of different
elevation with certain colours. While spot heights show the heights of some certain points, to
provide an overall image that conveyed height a technique called Layer colouring was
developed.
Fig. 4.2 Hill Shading
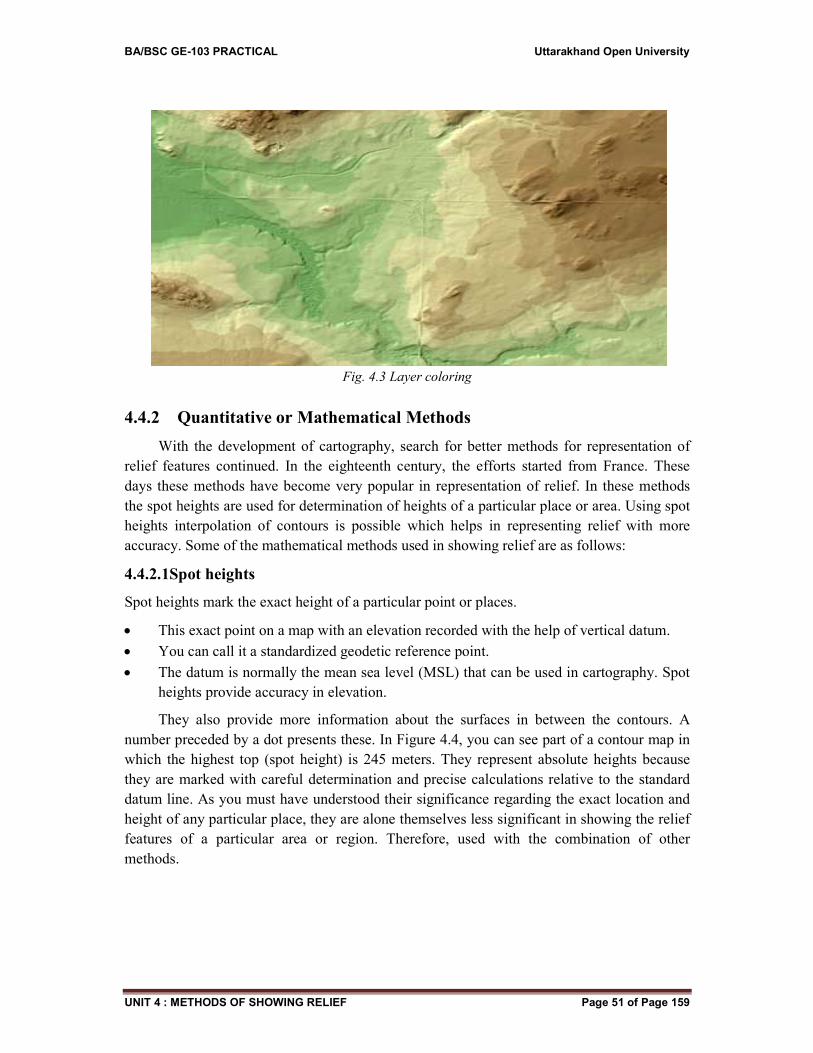
BA/BSC GE-103 PRACTICAL Uttarakhand Open University
UNIT 4 : METHODS OF SHOWING RELIEF Page 51 of Page 159
Fig. 4.3 Layer coloring
4.4.2 Quantitative or Mathematical Methods
With the development of cartography, search for better methods for representation of
relief features continued. In the eighteenth century, the efforts started from France. These
days these methods have become very popular in representation of relief. In these methods
the spot heights are used for determination of heights of a particular place or area. Using spot
heights interpolation of contours is possible which helps in representing relief with more
accuracy. Some of the mathematical methods used in showing relief are as follows:
4.4.2.1Spot heights
Spot heights mark the exact height of a particular point or places.
This exact point on a map with an elevation recorded with the help of vertical datum.
You can call it a standardized geodetic reference point.
The datum is normally the mean sea level (MSL) that can be used in cartography. Spot
heights provide accuracy in elevation.
They also provide more information about the surfaces in between the contours. A
number preceded by a dot presents these. In Figure 4.4, you can see part of a contour map in
which the highest top (spot height) is 245 meters. They represent absolute heights because
they are marked with careful determination and precise calculations relative to the standard
datum line. As you must have understood their significance regarding the exact location and
height of any particular place, they are alone themselves less significant in showing the relief
features of a particular area or region. Therefore, used with the combination of other
methods.
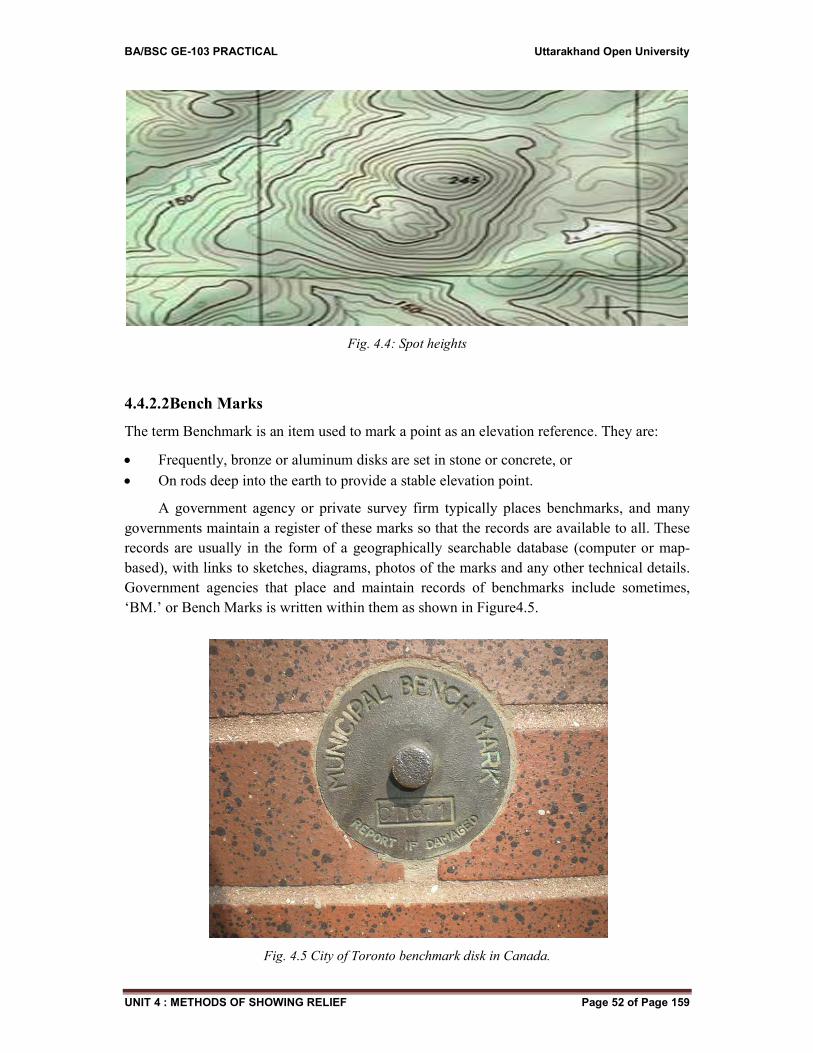
BA/BSC GE-103 PRACTICAL Uttarakhand Open University
UNIT 4 : METHODS OF SHOWING RELIEF Page 52 of Page 159
Fig. 4.4: Spot heights
4.4.2.2Bench Marks
The term Benchmark is an item used to mark a point as an elevation reference. They are:
Frequently, bronze or aluminum disks are set in stone or concrete, or
On rods deep into the earth to provide a stable elevation point.
A government agency or private survey firm typically places benchmarks, and many
governments maintain a register of these marks so that the records are available to all. These
records are usually in the form of a geographically searchable database (computer or map-
based), with links to sketches, diagrams, photos of the marks and any other technical details.
Government agencies that place and maintain records of benchmarks include sometimes,
‘BM.’ or Bench Marks is written within them as shown in Figure4.5.
Fig. 4.5 City of Toronto benchmark disk in Canada.
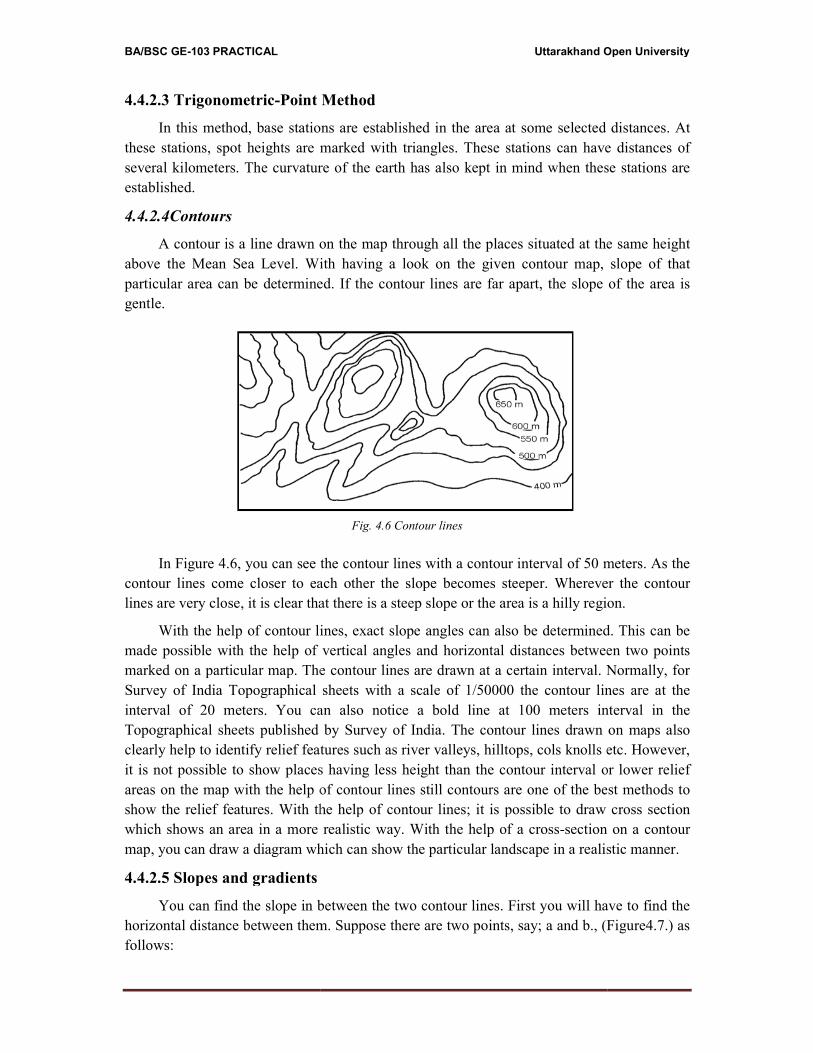
BA/BSC GE-103 PRACTICAL
4.4.2.3 Trigonometric-Point M
In this method, base stations
these stations, spot heights are m
several kilometers. The curvature
established.
4.4.2.4Contours
A contour is a line drawn on
above the Mean Sea Level. With
particular area can be determined
gentle.
In Figure 4.6, you can see th
contour lines come closer to eac
lines are very close, it is clear that
With the help of contour lin
made possible with the help of v
marked on a particular map. The
Survey of India Topographical sh
interval of 20 meters. You can
Topographical sheets published b
clearly help to identify relief featu
it is not possible to show places h
areas on the map with the help of
show the relief features. With the
which shows an area in a more re
map, you can draw a diagram whic
4.4.2.5 Slopes and gradients
You can find the slope in be
horizontal distance between them.
follows:
Uttarakhand Op
oint Method
tations are established in the area at some selected d
are marked with triangles. These stations can have
vature of the earth has also kept in mind when these
wn on the map through all the places situated at the
l. With having a look on the given contour map, s
ed. If the contour lines are far apart, the slope o
Fig. 4.6 Contour lines
see the contour lines with a contour interval of 50 me
to each other the slope becomes steeper. Wherever
ar that there is a steep slope or the area is a hilly region
our lines, exact slope angles can also be determined.
p of vertical angles and horizontal distances between
. The contour lines are drawn at a certain interval. N
ical sheets with a scale of 1/50000 the contour line
u can also notice a bold line at 100 meters inte
shed by Survey of India. The contour lines drawn on
f features such as river valleys, hilltops, cols knolls et
laces having less height than the contour interval or
elp of contour lines still contours are one of the best
ith the help of contour lines; it is possible to draw c
ore realistic way. With the help of a cross-section o
m which can show the particular landscape in a realist
ents
e in between the two contour lines. First you will hav
them. Suppose there are two points, say; a and b., (Fi
nd Open University
cted distances. At
have distances of
these stations are
at the same height
ap, slope of that
lope of the area is
50 meters. As the
rever the contour
region.
ined. This can be
etween two points
val. Normally, for
ur lines are at the
rs interval in the
awn on maps also
olls etc. However,
val or lower relief
e best methods to
raw cross section
ction on a contour
realistic manner.
ill have to find the
b., (Figure4.7.) as
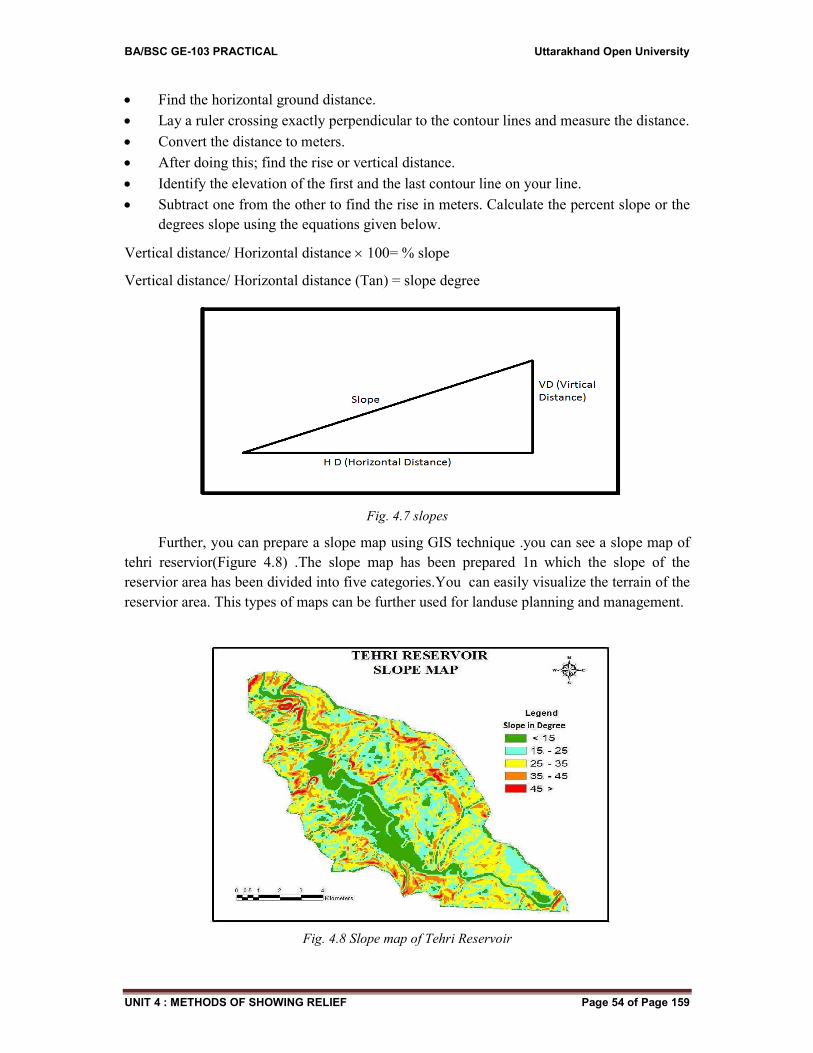
BA/BSC GE-103 PRACTICAL Uttarakhand Open University
UNIT 4 : METHODS OF SHOWING RELIEF Page 54 of Page 159
Find the horizontal ground distance.
Lay a ruler crossing exactly perpendicular to the contour lines and measure the distance.
Convert the distance to meters.
After doing this; find the rise or vertical distance.
Identify the elevation of the first and the last contour line on your line.
Subtract one from the other to find the rise in meters. Calculate the percent slope or the
degrees slope using the equations given below.
Vertical distance/ Horizontal distance 100= % slope
Vertical distance/ Horizontal distance (Tan) = slope degree
Fig. 4.7 slopes
Further, you can prepare a slope map using GIS technique .you can see a slope map of
tehri reservior(Figure 4.8) .The slope map has been prepared 1n which the slope of the
reservior area has been divided into five categories.You can easily visualize the terrain of the
reservior area. This types of maps can be further used for landuse planning and management.
Fig. 4.8 Slope map of Tehri Reservoir
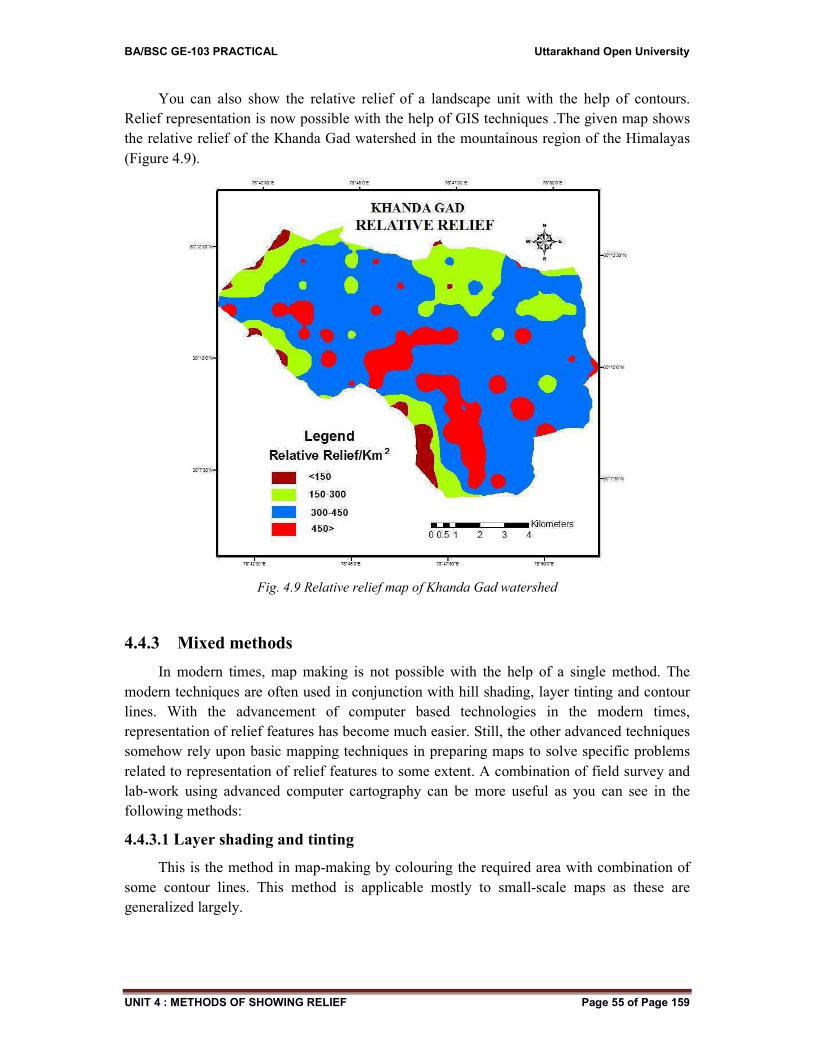
BA/BSC GE-103 PRACTICAL Uttarakhand Open University
UNIT 4 : METHODS OF SHOWING RELIEF Page 55 of Page 159
You can also show the relative relief of a landscape unit with the help of contours.
Relief representation is now possible with the help of GIS techniques .The given map shows
the relative relief of the Khanda Gad watershed in the mountainous region of the Himalayas
(Figure 4.9).
Fig. 4.9 Relative relief map of Khanda Gad watershed
4.4.3 Mixed methods
In modern times, map making is not possible with the help of a single method. The
modern techniques are often used in conjunction with hill shading, layer tinting and contour
lines. With the advancement of computer based technologies in the modern times,
representation of relief features has become much easier. Still, the other advanced techniques
somehow rely upon basic mapping techniques in preparing maps to solve specific problems
related to representation of relief features to some extent. A combination of field survey and
lab-work using advanced computer cartography can be more useful as you can see in the
following methods:
4.4.3.1 Layer shading and tinting
This is the method in map-making by colouring the required area with combination of
some contour lines. This method is applicable mostly to small-scale maps as these are
generalized largely.
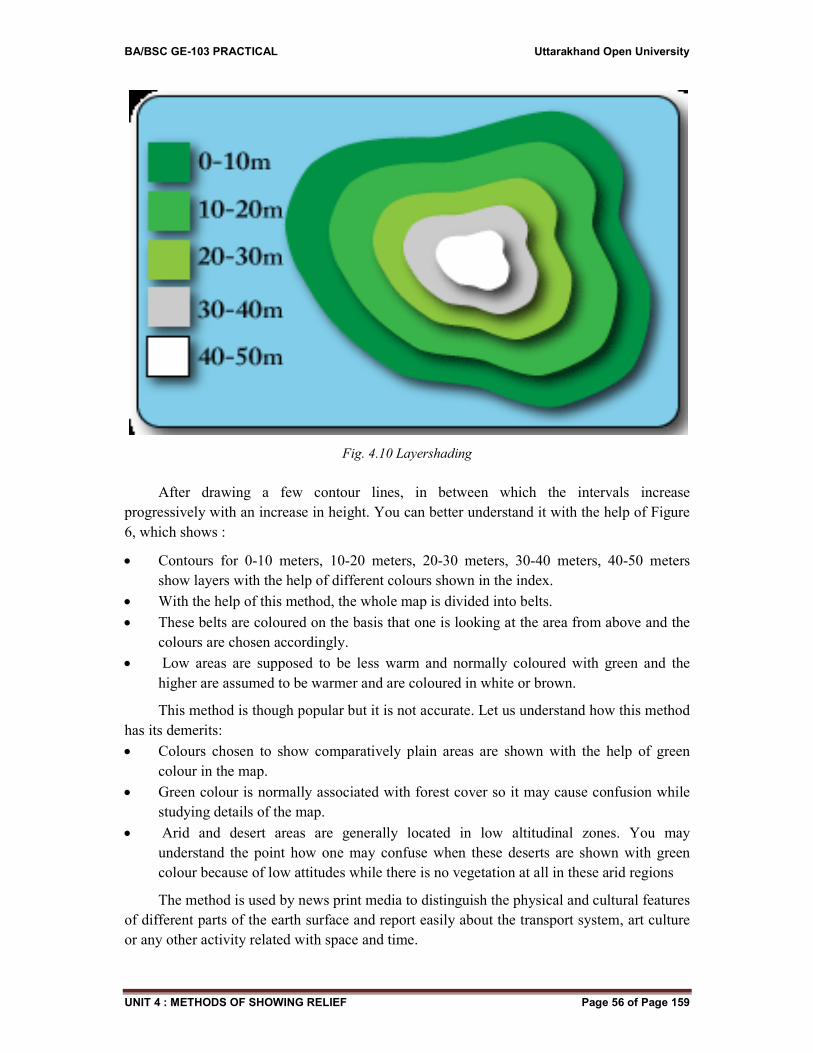
BA/BSC GE-103 PRACTICAL Uttarakhand Open University
UNIT 4 : METHODS OF SHOWING RELIEF Page 56 of Page 159
Fig. 4.10 Layershading
After drawing a few contour lines, in between which the intervals increase
progressively with an increase in height. You can better understand it with the help of Figure
6, which shows :
Contours for 0-10 meters, 10-20 meters, 20-30 meters, 30-40 meters, 40-50 meters
show layers with the help of different colours shown in the index.
With the help of this method, the whole map is divided into belts.
These belts are coloured on the basis that one is looking at the area from above and the
colours are chosen accordingly.
Low areas are supposed to be less warm and normally coloured with green and the
higher are assumed to be warmer and are coloured in white or brown.
This method is though popular but it is not accurate. Let us understand how this method
has its demerits:
Colours chosen to show comparatively plain areas are shown with the help of green
colour in the map.
Green colour is normally associated with forest cover so it may cause confusion while
studying details of the map.
Arid and desert areas are generally located in low altitudinal zones. You may
understand the point how one may confuse when these deserts are shown with green
colour because of low attitudes while there is no vegetation at all in these arid regions
The method is used by news print media to distinguish the physical and cultural features
of different parts of the earth surface and report easily about the transport system, art culture
or any other activity related with space and time.
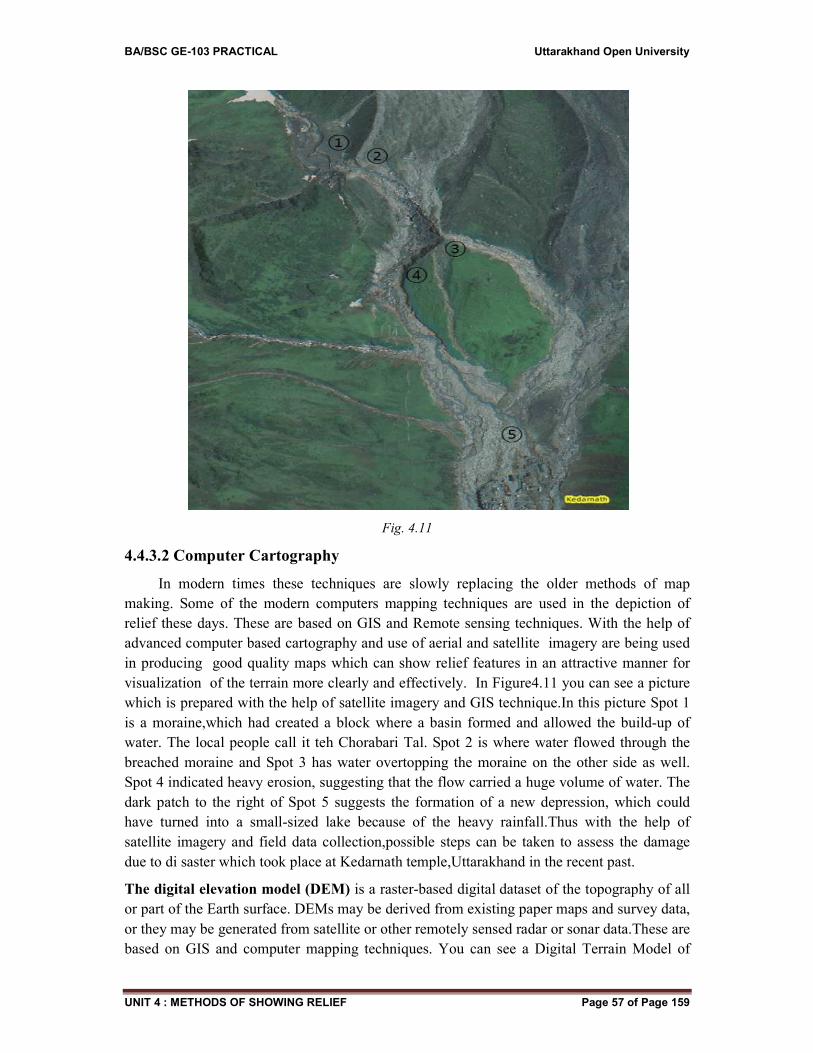
BA/BSC GE-103 PRACTICAL Uttarakhand Open University
UNIT 4 : METHODS OF SHOWING RELIEF Page 57 of Page 159
Fig. 4.11
4.4.3.2 Computer Cartography
In modern times these techniques are slowly replacing the older methods of map
making. Some of the modern computers mapping techniques are used in the depiction of
relief these days. These are based on GIS and Remote sensing techniques. With the help of
advanced computer based cartography and use of aerial and satellite imagery are being used
in producing good quality maps which can show relief features in an attractive manner for
visualization of the terrain more clearly and effectively. In Figure4.11 you can see a picture
which is prepared with the help of satellite imagery and GIS technique.In this picture Spot 1
is a moraine,which had created a block where a basin formed and allowed the build-up of
water. The local people call it teh Chorabari Tal. Spot 2 is where water flowed through the
breached moraine and Spot 3 has water overtopping the moraine on the other side as well.
Spot 4 indicated heavy erosion, suggesting that the flow carried a huge volume of water. The
dark patch to the right of Spot 5 suggests the formation of a new depression, which could
have turned into a small-sized lake because of the heavy rainfall.Thus with the help of
satellite imagery and field data collection,possible steps can be taken to assess the damage
due to di saster which took place at Kedarnath temple,Uttarakhand in the recent past.
The digital elevation model (DEM) is a raster-based digital dataset of the topography of all
or part of the Earth surface. DEMs may be derived from existing paper maps and survey data,
or they may be generated from satellite or other remotely sensed radar or sonar data.These are
based on GIS and computer mapping techniques. You can see a Digital Terrain Model of
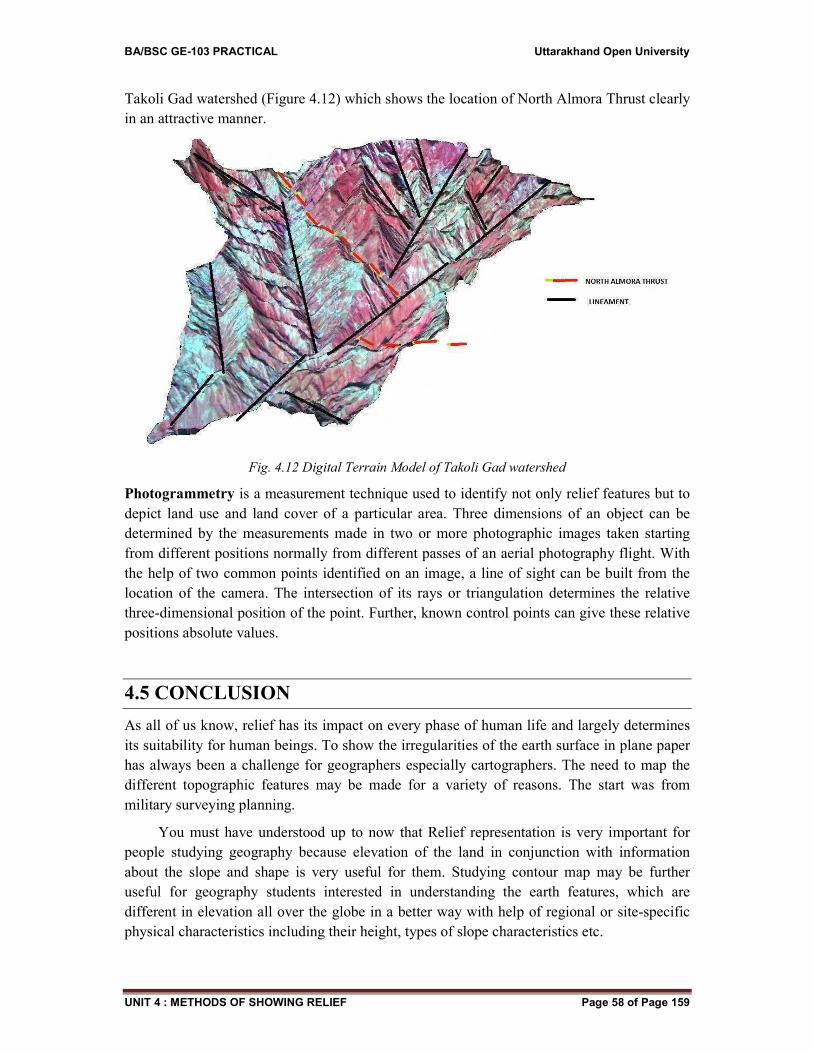
BA/BSC GE-103 PRACTICAL Uttarakhand Open University
UNIT 4 : METHODS OF SHOWING RELIEF Page 58 of Page 159
Takoli Gad watershed (Figure 4.12) which shows the location of North Almora Thrust clearly
in an attractive manner.
Fig. 4.12 Digital Terrain Model of Takoli Gad watershed
Photogrammetry is a measurement technique used to identify not only relief features but to
depict land use and land cover of a particular area. Three dimensions of an object can be
determined by the measurements made in two or more photographic images taken starting
from different positions normally from different passes of an aerial photography flight. With
the help of two common points identified on an image, a line of sight can be built from the
location of the camera. The intersection of its rays or triangulation determines the relative
three-dimensional position of the point. Further, known control points can give these relative
positions absolute values.
4.5 CONCLUSION
As all of us know, relief has its impact on every phase of human life and largely determines
its suitability for human beings. To show the irregularities of the earth surface in plane paper
has always been a challenge for geographers especially cartographers. The need to map the
different topographic features may be made for a variety of reasons. The start was from
military surveying planning.
You must have understood up to now that Relief representation is very important for
people studying geography because elevation of the land in conjunction with information
about the slope and shape is very useful for them. Studying contour map may be further
useful for geography students interested in understanding the earth features, which are
different in elevation all over the globe in a better way with help of regional or site-specific
physical characteristics including their height, types of slope characteristics etc.
BA/BSC GE-103 PRACTICAL Uttarakhand Open University
UNIT 4 : METHODS OF SHOWING RELIEF Page 59 of Page 159
The significance of representation of relief features in multiple field areas such as
mapping of hazardousness or risk zones, slope instability, flood zones, watershed
management and land use planning which may help in monitoring of the related processes
active in different landscapes and landforms is understood by researchers and scientists in
different field areas. With the application of modern tools and techniques, it has been possible
up to a great extent now to show different forms of terrain with GIS. Terrain is commonly
modeled either using vector triangulated irregular network (TIN) or raster image.
Combination of Remote sensing, aerial and satellite imagery photogrammetry, satellite
radar mapping are been employed for complex mapping needs of the present times. These
techniques are not only helpful in representation of relief features but also can help solving
many practical problems in geomorphology, hydrology, disaster management and
environmental planning.
4.6 SUMMARY
Representation of relief features on maps has always been a challenge because there is
always a scope remaining to find out an ideal solution. From the notes of surveyors and local
sources in the beginning, the art of map making developed over the years and different ways
of showing relief features on the maps were developed too. The surface of the earth, which is
represented through maps, has its limitations. Representation of relief and slope analysis
started with the small lines drawn down the slopes in the direction of the steepest gradient.
These are known as Hachure. These lines could not determine accurate height of the points or
places and exact information regarding the slope and slope values. Contour lines were
invented later to solve this problem. With the help of contour lines exact slope angles can
also be determined. This can be made possible with the help of vertical angles and horizontal
distances between two points marked on a particular map. The contours are drawn at regular
intervals. To show different relief features of the earth surface, "topographic maps are often
used as base maps to show relief features for different purposes. Different features are
marked in such maps. Spot height is an exact point on a map with an elevation recorded
above a given datum which is normally the mean sea level. Bench Marks are used to mark a
point as an elevation reference. In the map making process, pictorial presentation, hill
shading, layer shading and tinting were developed through years. With the help of advanced
computer based cartography and use of aerial and, satellite imagery, aerial photography,
photogrammetry good quality maps are being produced which can show relief features in an
attractive manner for visualization of the terrain more clearly and effectively. The digital
elevation model (DEM) is a raster-based digital dataset of the topography of all or part of the
Earth surface. DEMs may be derived from existing topographic maps and survey data, or
they may be generated from new satellite or other remotely sensed radar or sonar data. These
are based on GIS and remote sensing techniques. However, contours are one of the most
significant medium for the representation of relief features of the earth surface and all the
other advanced techniques somehow rely upon contour maps or topographic maps to solve
specific problems related to representation of relief features to some extent.
BA/BSC GE-103 PRACTICAL Uttarakhand Open University
UNIT 4 : METHODS OF SHOWING RELIEF Page 60 of Page 159
4.7 GLOSSARY
Hachure: A short line used for shading and denoting surfaces in relief (as in map
drawing) and drawn in the direction of slope.
Hill shading: A shaded relief (levels of gray) on a map, just to indicate relative slopes,
mountain ridges, not absolute height.
Layer shading:Layer shading, or layer colouring, is just a way to show elevation changes on
a map. It is used like contour lines on maps that show larger areas, like whole countries.
Photogrammetry:The use of photography in surveying and mapping to ascertain
measurements between objects.
Triangulated irregular network (TIN): A digital data structure used in a geographic
information system (GIS) for the representation of a surface.
Digital elevation model (DEM):A is a digital or 3D representation of a terrain's surface —
commonly for a planet (including Earth), moon, or asteroid — created from terrain
elevation data.
Geographic Information System (GIS): A system designed to capture, store, manipulate,
analyze, manage, and present all types of spatial or geographical data.
Relative relief: Difference between summit level, the highest altitude for a given area, and
base level, lowest altitude for a given area.
Drainage pattern: A pattern formed by the streams, rivers, and lakes in a particular
drainage basin. They are governed by the topography of the land, whether a particular region
is dominated by hard or soft rocks, and the gradient of the land.
4.8 ANSWER TO CHECK YOUR PROGRESS
4.8.1(Self check Questions)
1. What do you understand by relief?
2. In which country did the term topography originates?
3. In which type of geographical studies does study of relief helps us significantly?
4. Why mapping relief is important for geographers?
5. Why showing the irregularities of the earth surface in plane paper has always been a
challenge for geographers?
6. Which processes are responsible for the different types of relief features over the earth
surface?
7. Which are the highest relief features?
8. What is local relief?
9. Fill in the blanks with appropriate words from below.
i) Earth features are ..........in elevation
ii) Geographers have divided land forms into........ Orders of relief.
BA/BSC GE-103 PRACTICAL Uttarakhand Open University
UNIT 4 : METHODS OF SHOWING RELIEF Page 61 of Page 159
iii) Methods of showing relief largely depend upon the ..........of the map.
iv) The …………………..maps show the earth features more precisely.
v) All portions of the terrestrial surface have.............. relief, scale, different, three, large-
scale.
10. What are hachures?
11. What is a contour?
12. Define digital elevation model (DEM).
4.8.2: (Answers to self-check Questions)
1. Relief means Difference in elevation .This is one of the most obvious irregularities of the
earth’s surface, altitude, the third dimension of geographical space.
2. The term topography originated in ancient Greece and continued in ancient Rome as the
detailed description of a place.
3. Study of relief help us significantly in agricultural activities including contour farming,
which leads towards sustainable agriculture in hill slopes. The relief of that particular
area up to a great extent determines changes in weather and determination of climatic
regions. Apart from this, relief determines many activities related to development of
human society.
4. Studying relief is important for geographers because the horizontal and vertical
dimensions of the earth surface. Ithave its impact on different aspects of human life.
Over a large area, relief can affect water and climatic patterns that are part of
geographical studies. That is why it has been a major topic of interest for geographers.
5. The surface of the earth is three dimensional having length, width and height; while
maps have only two dimensions (length and width).Therefore, showing the irregularities
of the earth surface in plane paper has always been a challenge for geographers.
6. The complex combined effect of the dynamic processes active in that particular part of
the earth surface are responsible for the different types of relief features over the earth
surface
7. Mountains and ridges are typically the highest elevation points.
8. Local relief refers specifically to the quantitative measurement of vertical elevation
change in a limited area.
9. i) Earth features are different in elevation
ii) Geographers have divided landforms into three orders of relief.
iii) Methods of showing relief largely depend upon the scale of the map.
iv) The large-scale maps show the different earth features more precisely.
v) All portions of the terrestrial surface have relief.
10. Hachures are the small lines drawn down the slopes in the direction of the steepest
gradient.
11. A contour is a line drawn on the map through all the places situated at the same height
above the Mean Sea Level.
BA/BSC GE-103 PRACTICAL Uttarakhand Open University
UNIT 4 : METHODS OF SHOWING RELIEF Page 62 of Page 159
12. The digital elevation model (DEM) is a raster-based digital dataset of the topography of
all or part of the Earth surface.
4.9 REFERENCES
1. Dikinsion, G. C., (1963): Statistical mapping and the presentation of Statistical data,
London.
2. Mahmood, A., (1977): Statistical Methods in Geographical Studies, Rajesh
Publications, New Delhi.
3. Misra, R. P.and Ramesh, A., (1969): Fundamentals of Cartography, Concept
Publications, New Delhi.
4. Monkhouse, F. G. and Wilkinsion, H. R., (1956): Maps and Diagrams, Metheun, Lond
5. Robinson, A. H. and Sale, R. D., (1969): Elements of Cartography,
6. Singh L. R. and Singh, R. L., (1991): Map work and Practical geography, Indian
University Press, Allahabad. pp 165-203.
7. Singh, R. L. and Singh Rana, P. B., (1991): Elements of Practical Geography, Kalyani
Publishers, Ludhiyana.
8. Wilkinson, Harland Monkhouse, F. J., (1952): Maps and Diagrams, B. I. Publications
Pvt. Ltd. New Delhi.
9. https://en.m.wikipedia.org.org
10. https://www.google.co.in
11. https://en.wikipedia.org
12. https://en.wikipedia.org/wiki/Sea_level
4.10 SUGGESTED READING
1. Slocum, T., McMaster, R., Kessler, F. And Howard, H., (2005) : Thematic
Cartography and Geographic Visualization, 2nd edition, Pearson, ISBN 0-13-035123-7,
p. 272.
2. Woodward, David and Malcolm Lewis, G. (eds.) (1998): The History of Cartography
Volume 2, Book 3: Cartography in the Traditional African, American, Arctic,
Australian, and Pacific Societies [Full text of the Introduction by David Woodward and
G. Malcolm Lewis]. Chicago and London: University of Chicago Press. ISBN 0-226-
90728-7.
3. MacEachren, A.M. (1994) : Some Truth with Maps: A Primer on Symbolization &
Design. University Park: The Pennsylvania State University. ISBN 0-89291-214-6.
4. Monmonier, Mark (1993) : Mapping It Out. Chicago: University of Chicago Press.
ISBN 0-226-53417-0.
5. Kraak, Menno-Jan and Ormeling, Ferjan (2002) : Cartography: Visualization of
Spatial Data. Prentice Hall. ISBN 0-13-088890-7.
6. Peterson, Michael P., (1995) : Interactive and Animated Cartography. Upper Saddle
River, New Jersey: Prentice Hall. ISBN 978-0-13-079104-7.
BA/BSC GE-103 PRACTICAL Uttarakhand Open University
UNIT 4 : METHODS OF SHOWING RELIEF Page 63 of Page 159
7. Slocum, T., (2003) : Thematic Cartography and Geographic Visualization. Upper
Saddle River, New Jersey: Prentice Hall. ISBN 0-13-035123-7
4.11 TERMINAL QUESTIONS
1. Define spot heights and benchmarks.
2. What is the role of hill shading in the representation of relief?
3. What are quantitative techniques? Define their role in the representation of relief.
4. Which relief features on the earth surface do the contour lines clearly identify on maps?
5. What is Layer colouring method?
6. How this method is applicable in the representation of relief?
7. Can you find the slope of an area with contour lines? Explain.
8. What are computers mapping techniques. Define their role in relief representation.
9. Explain Photogrammetry as a technique of cartography.
10. What is the significance of relief representation for geographers?
BA/BSC GE-103 PRACTICAL Uttarakhand Open University
UNIT 5 : REPRESENTATION OF RELIEF FEATURES BY CONTOURS Page 64 of Page 159
UNIT 5 : REPRESENTATION OF RELIEF FEATURES
BY CONTOURS
5.1 OBJECTIVES
5.2 INTRODUCTION
5.3 MAJOR RELIEF FEATURE (CONICAL HILL, PLATEAU,
SADDLE, UNDULATING SLOPE, CONCAVE SLOPE,
CONVEX SLOPE, CLIFF, WATERFALL, U-SHAPED
VALLEY, HANGING VALLEY, LAKE)
5.4 CONCLUSION
5.5 SUMMARY
5.6 GLOSSARY
5.7 ANSWER TO CHECK YOUR PROGRESS
5.8 REFERENCES
5.9 SUGGESTED READINGS
5.10 TERMINAL QUESTIONS
BA/BSC GE-103 PRACTICAL Uttarakhand Open University
UNIT 5 : REPRESENTATION OF RELIEF FEATURES BY CONTOURS Page 65 of Page 159
5.1 OBJECTIVES
This chapter explains how representation of different relief features is possible with the
help of contour lines of any known surface.
After studying this chapter, learners will be able;
To understand different types of slope and their specific characteristics
To show a specific landscape in a realistic way
To understand the significance of contour lines in GIS environment where they can be
used to prepare three-dimensional model of the earth surface
5.2 INTRODUCTION
The combined effects of endogenetic and exogenetic processes are continuously
changing the earth surface. The slope of the surface also changes accordingly. The varied and
complex slopes of the earth surface are easy to represent with the help of contour lines.
Fluvial, pluvial, glacial, arid and coastal landforms are of different shapes and sizes and you
must understand that because of these differences their contours are different too. Contour li-
nes are lines drawn on a map connecting points of equal elevation. These lines are necessary
to show relief features in any type of maps. Before the invention of contour lines, the hachure
line method for depicting relief was used in representation of relief. The method invented by
Saxon Major Lehman and was adopted for most of the military surveys in the nineteenth
century .These small lines drawn down the slopes in the direction of the steepest gradient
showed the earth features including mountains, hills, terraces, and other landforms having
height. Drawing these lines required great patience and very-very hard work.
Qualitative and relative representation of earth features the method could not determine
accurate height of the points or places and exact information regarding the slope and slope
values. The invention of contour lines solved this problem, as they were able to represent
relief in a more scientific manner. These lines were first drawn on maps by a Dutch
cartographer named Krukvees. It took about seventy years to become popular. These lines
represented relief in quantitative terms and this was the major advantage of these lines. This
means that if you physically follow a contour line, elevation would remain constant. Thus,
the lines showing elevation and shape of the terrain of a particular part of the earth surface,
known as contour lines connected the places of equal elevation. Imagine yourself walking
along a contour line. You are walking along the same elevation.
To illustrate relief features of the area of interest, contour lines have significance for
students studying geography. These lines show the gradient very clearly. In order to keep
things simple, topographic maps show all the contour lines elevations only. Though contours
are significant features of a topographical map, these maps also include man-made features
such as settlements such as settlements and roads. Therefore, these lines are evenly spaced
apart. We call this spacing the contour interval. As with all types of isolines, when contour
lines are close together, they represent a steep slope, whereas when lines are far from each
other, they represent a gradual slope. Every fifth or tenth contour starting at sea level is an
index contour. This is a heavier line and labeled. Each topographic map uses a contour
BA/BSC GE-103 PRACTICAL Uttarakhand Open University
UNIT 5 : REPRESENTATION OF RELIEF FEATURES BY CONTOURS Page 66 of Page 159
interval, or equidistance, (the distance in elevation between contour lines) appropriate for that
area. While flat area maps show a 5-meter contour interval, stepped terrain may have a 20-
meter or more contour interval.
For example, if your map uses a 10 meter contour interval, you will see contour lines
for every10 meters of elevation -- lines at 0, 10, 20, 30, 40, and so on. Different maps use
different intervals, depending on the topography. If, for example, the general terrain is quite
elevated, the map might run at 20- to 30 meter intervals. This makes it easier to read the map
-- too many contour lines would be difficult to work with. Look in the margin of your map to
find out its contour interval.
Topographic maps perfectly and precisely show contour lines. If you look on them at a
distance of 1 meter, you will see crest and valleys. With the help of contour lines, exact slope
angles can also be determined. This is possible with the help of vertical angles and horizontal
distances between two points marked on a particular map. The contour lines drawn on maps
also clearly help to identify relief features such as river valleys, hilltops, cols knolls etc.
However, places having less height than the contour interval or lower relief areas are not
much clear on maps. Still contours are one of the best methods to show the relief features.
With some practice and imagination, you can easily identify the hilltops and valleys in
your study area. Unlike the simple topographic map used above, real topographic maps have
many contour lines. It is not possible to label the elevation of each contour line. The contour
lines are drawn at a certain interval. To make the map easier to read every fifth contour line
vertically is an index contour. Darker brown lines on the map show Index contours. These
contour lines are usually labelled. Normally, for Survey of India Topographical sheets with a
scale of 1/50000 the contour lines are drawn at the interval of 20 meters. You can also notice
a bold line at 100 meters interval in the Topographical sheets published by Survey of India.
The contour interval chosen for a map depends on the topography in the mapped area. In
areas with high relief the contour interval is usually larger to prevent the map from having too
many contour lines, which would make the map difficult to read. In this unit, you will learn
the different techniques used to represent relief with the help of contour lines.
The art of map making developed over the years. Different ways of showing relief
features on the maps developed through a long passage of time. The surface of the earth,
which is represented through maps, has its limitations. The features of the earth, which show
relief, are three-dimensional and our maps must depict it as such but we show the location of
features in two-dimensional space mostly as you have seen when you go through map
reading. Though with the help of modern computer cartography, the three dimensional
quality of the earth surface can be visualized up to a great extent.
The greatest challenge for modern map makers is to produce maps which not only
picture the relief forms but accurately portray it quantitatively as well too. You must
understand that the best way to show various relief features on maps with more accuracy has
yet to be found. Methods of showing relief features largely depend upon the scale of a map.
According to scale, maps can be broadly divided into large scale and small scale maps. You
must know the basic differences in between these two types of maps. The large-scale maps
play a vital role in the representation of landscapes and landforms. They determine the
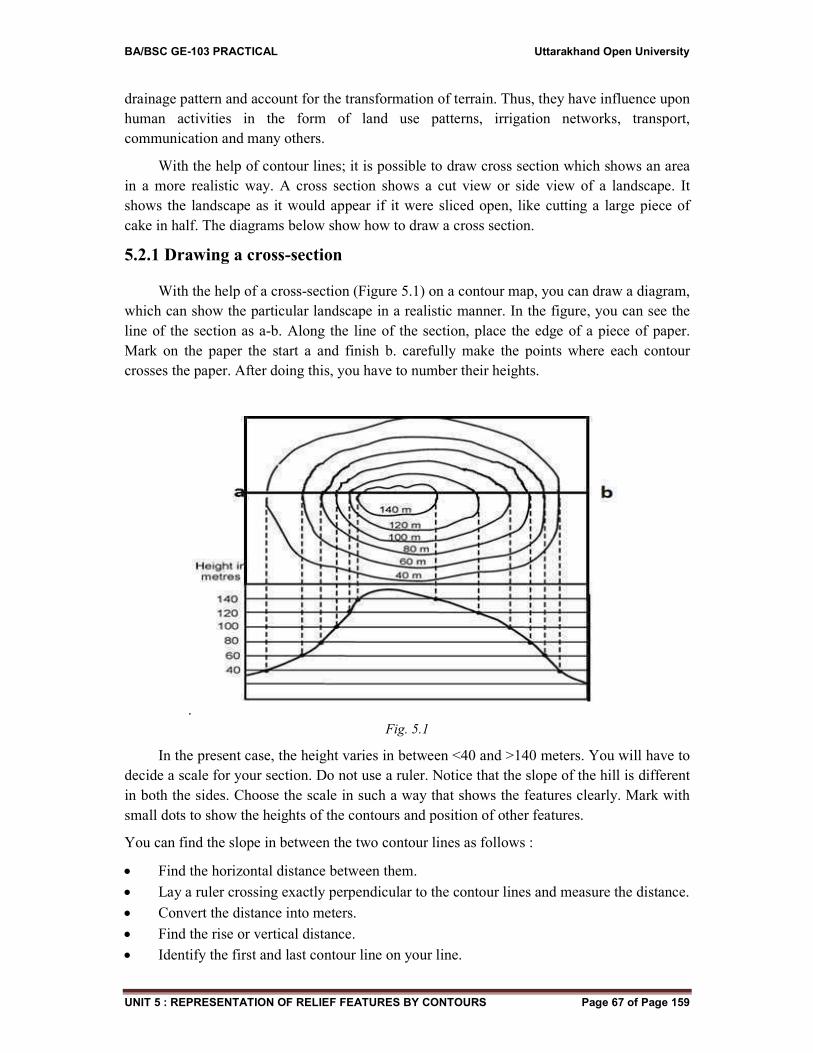
BA/BSC GE-103 PRACTICAL Uttarakhand Open University
UNIT 5 : REPRESENTATION OF RELIEF FEATURES BY CONTOURS Page 67 of Page 159
drainage pattern and account for the transformation of terrain. Thus, they have influence upon
human activities in the form of land use patterns, irrigation networks, transport,
communication and many others.
With the help of contour lines; it is possible to draw cross section which shows an area
in a more realistic way. A cross section shows a cut view or side view of a landscape. It
shows the landscape as it would appear if it were sliced open, like cutting a large piece of
cake in half. The diagrams below show how to draw a cross section.
5.2.1 Drawing a cross-section
With the help of a cross-section (Figure 5.1) on a contour map, you can draw a diagram,
which can show the particular landscape in a realistic manner. In the figure, you can see the
line of the section as a-b. Along the line of the section, place the edge of a piece of paper.
Mark on the paper the start a and finish b. carefully make the points where each contour
crosses the paper. After doing this, you have to number their heights.
.
Fig. 5.1
In the present case, the height varies in between <40 and >140 meters. You will have to
decide a scale for your section. Do not use a ruler. Notice that the slope of the hill is different
in both the sides. Choose the scale in such a way that shows the features clearly. Mark with
small dots to show the heights of the contours and position of other features.
You can find the slope in between the two contour lines as follows :
Find the horizontal distance between them.
Lay a ruler crossing exactly perpendicular to the contour lines and measure the distance.
Convert the distance into meters.
Find the rise or vertical distance.
Identify the first and last contour line on your line.
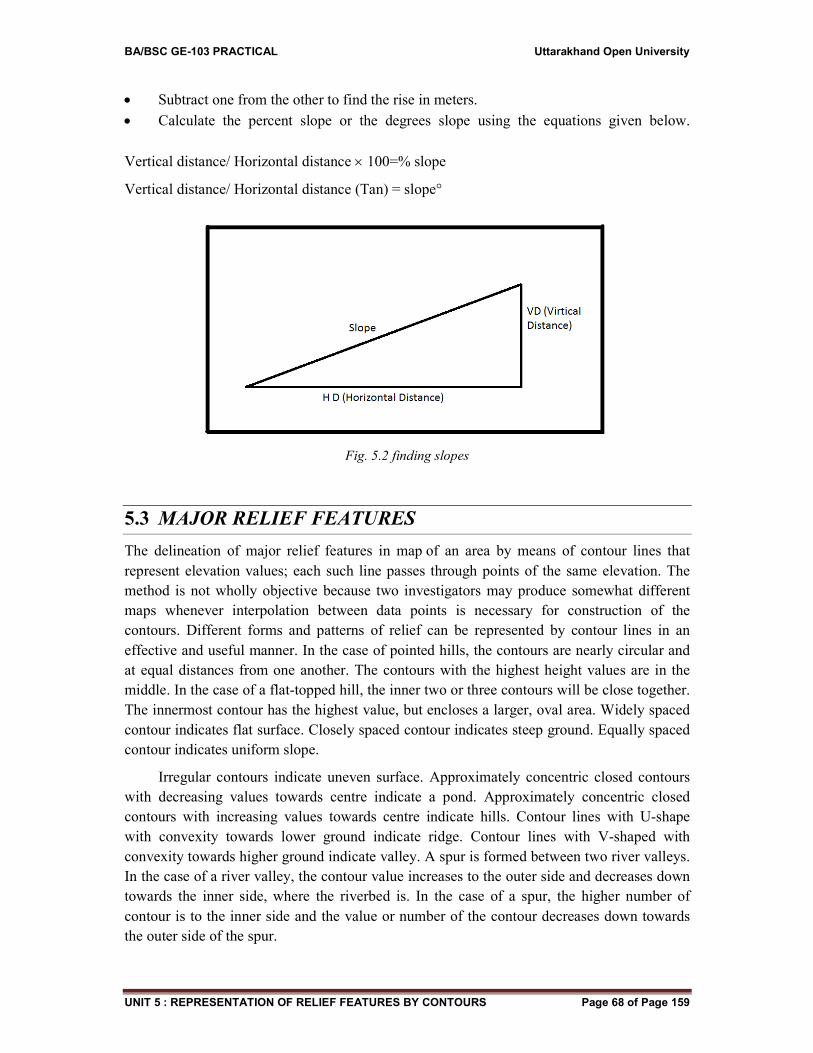
BA/BSC GE-103 PRACTICAL Uttarakhand Open University
UNIT 5 : REPRESENTATION OF RELIEF FEATURES BY CONTOURS Page 68 of Page 159
Subtract one from the other to find the rise in meters.
Calculate the percent slope or the degrees slope using the equations given below.
Vertical distance/ Horizontal distance100=% slope
Vertical distance/ Horizontal distance (Tan) = slope°
Fig. 5.2 finding slopes
5.3 MAJOR RELIEF FEATURES
The delineation of major relief features in map of an area by means of contour lines that
represent elevation values; each such line passes through points of the same elevation. The
method is not wholly objective because two investigators may produce somewhat different
maps whenever interpolation between data points is necessary for construction of the
contours. Different forms and patterns of relief can be represented by contour lines in an
effective and useful manner. In the case of pointed hills, the contours are nearly circular and
at equal distances from one another. The contours with the highest height values are in the
middle. In the case of a flat-topped hill, the inner two or three contours will be close together.
The innermost contour has the highest value, but encloses a larger, oval area. Widely spaced
contour indicates flat surface. Closely spaced contour indicates steep ground. Equally spaced
contour indicates uniform slope.
Irregular contours indicate uneven surface. Approximately concentric closed contours
with decreasing values towards centre indicate a pond. Approximately concentric closed
contours with increasing values towards centre indicate hills. Contour lines with U-shape
with convexity towards lower ground indicate ridge. Contour lines with V-shaped with
convexity towards higher ground indicate valley. A spur is formed between two river valleys.
In the case of a river valley, the contour value increases to the outer side and decreases down
towards the inner side, where the riverbed is. In the case of a spur, the higher number of
contour is to the inner side and the value or number of the contour decreases down towards
the outer side of the spur.
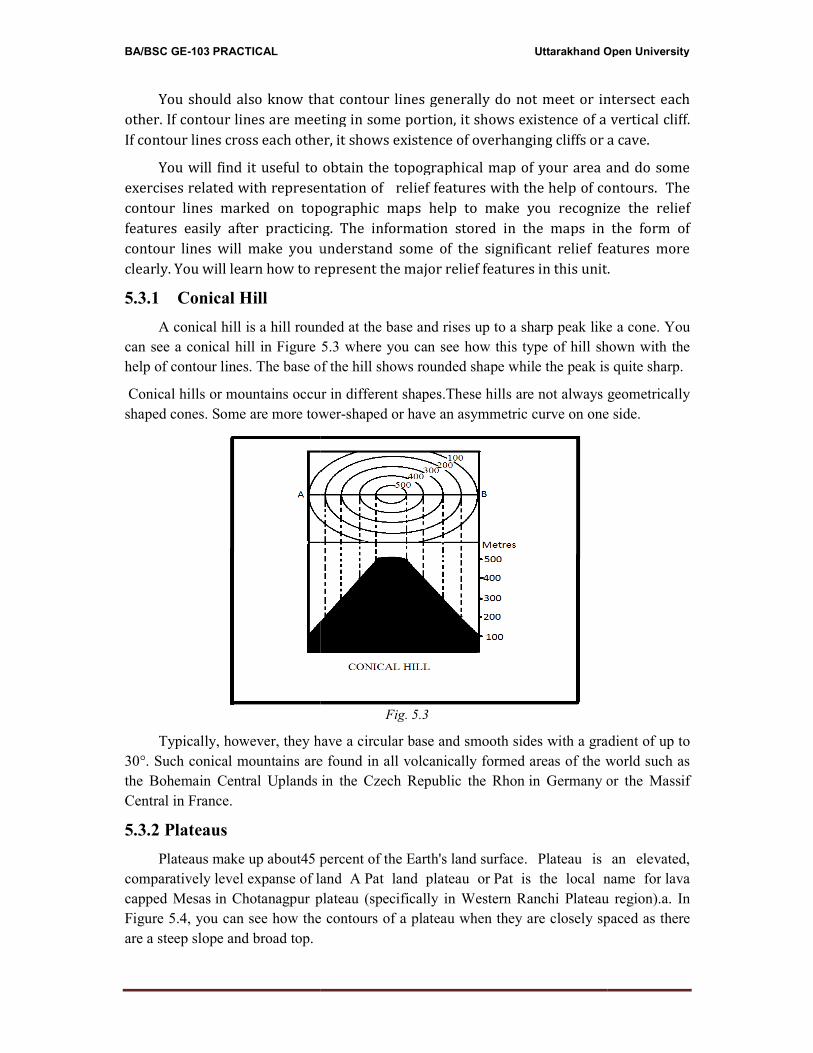
BA/BSC GE-103 PRACTICAL
You should also know that c
other. If contour lines are meeting
If contour lines cross each other, it
You will find it useful to obt
exercises related with representat
contour lines marked on topogr
features easily after practicing.
contour lines will make you und
clearly. You will learn how to repre
5.3.1 Conical Hill
A conical hill is a hill round
can see a conical hill in Figure 5.
help of contour lines. The base of
Conical hills or mountains occur
shaped cones. Some are more towe
Typically, however, they hav
30°. Such conical mountains are f
the Bohemain Central Uplands
Central in France.
5.3.2 Plateaus
Plateaus make up about45 pe
comparatively level expanse of lan
capped Mesas in Chotanagpur pla
Figure 5.4, you can see how the c
are a steep slope and broad top.
Uttarakhand Op
ow that contour lines generally do not meet or inter
e meeting in some portion, it shows existence of a ver
h other, it shows existence of overhanging cliffs or a ca
ful to obtain the topographical map of your area and
presentation of relief features with the help of conto
n topographic maps help to make you recognize t
acticing. The information stored in the maps in the
you understand some of the significant relief featu
w to represent the major relief features in this unit.
rounded at the base and rises up to a sharp peak like
ure 5.3 where you can see how this type of hill sho
ase of the hill shows rounded shape while the peak is q
occur in different shapes.These hills are not always ge
tower-shaped or have an asymmetric curve on one s
Fig. 5.3
ey have a circular base and smooth sides with a gradi
s are found in all volcanically formed areas of the w
in the Czech Republic the Rhon in Germany or
percent of the Earth's land surface. Plateau is a
land A Pat land plateau or Pat is the local na
ur plateau (specifically in Western Ranchi Plateau r
the contours of a plateau when they are closely spa
nd Open University
t or intersect each
ce of a vertical cliff.
iffs or a cave.
area and do some
p of contours. The
ecognize the relief
ps in the form of
lief features more
is unit.
k like a cone. You
ill shown with the
ak is quite sharp.
ays geometrically
one side.
a gradient of up to
the world such as
or the Massif
is an elevated,
cal name for lava
ateau region).a. In
ly spaced as there
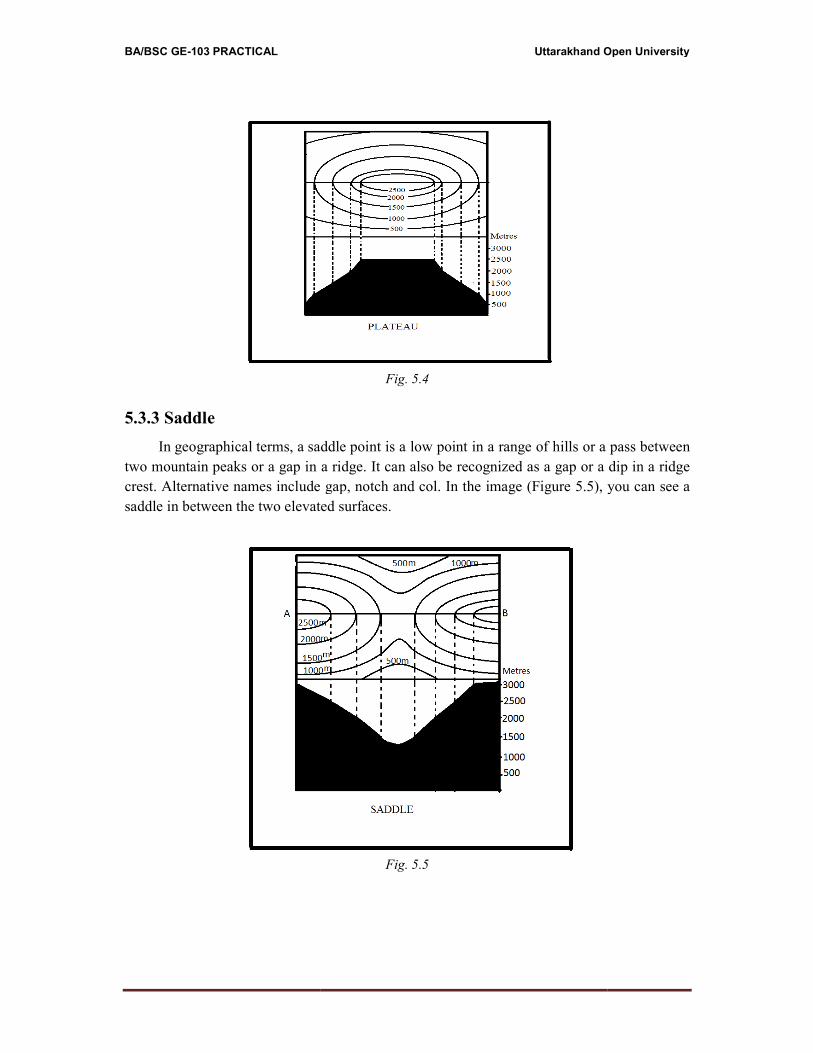
BA/BSC GE-103 PRACTICAL
5.3.3 Saddle
In geographical terms, a sadd
two mountain peaks or a gap in a
crest. Alternative names include g
saddle in between the two elevated
Uttarakhand Op
Fig. 5.4
saddle point is a low point in a range of hills or a p
p in a ridge. It can also be recognized as a gap or a d
lude gap, notch and col. In the image (Figure 5.5), yo
levated surfaces.
Fig. 5.5
nd Open University
or a pass between
or a dip in a ridge
.5), you can see a
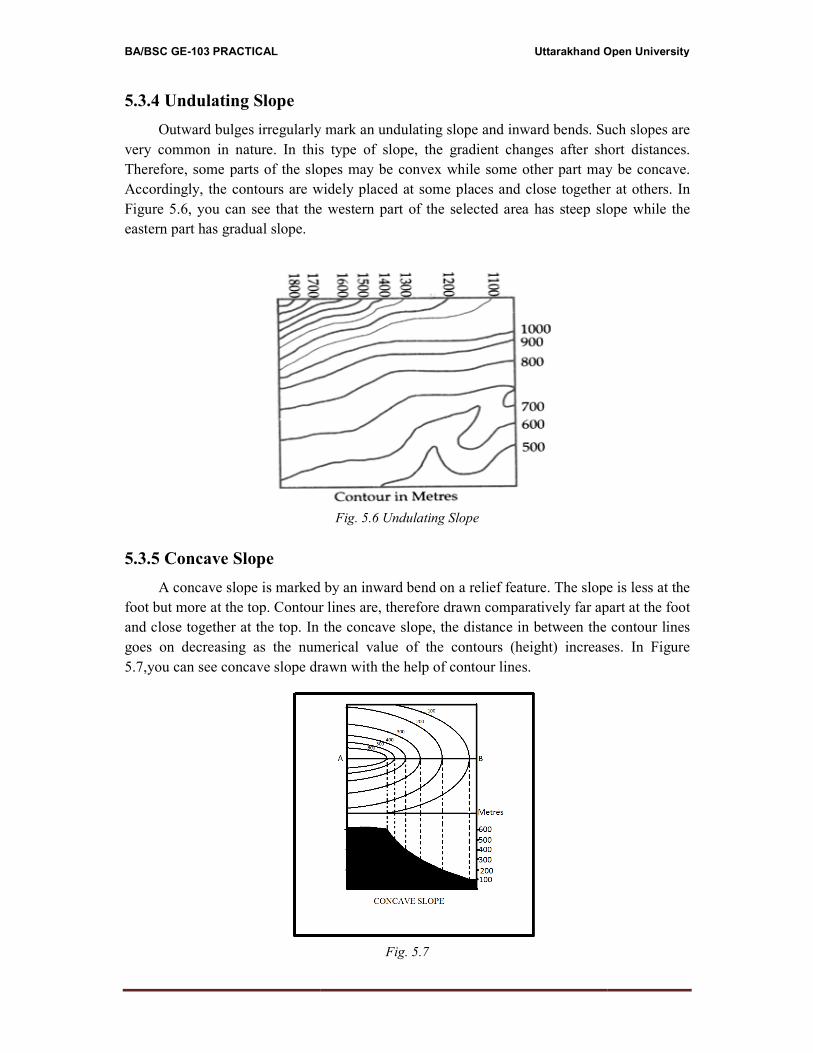
BA/BSC GE-103 PRACTICAL
5.3.4 Undulating Slope
Outward bulges irregularly m
very common in nature. In this
Therefore, some parts of the slop
Accordingly, the contours are wid
Figure 5.6, you can see that the w
eastern part has gradual slope.
5.3.5 Concave Slope
A concave slope is marked b
foot but more at the top. Contour l
and close together at the top. In th
goes on decreasing as the nume
5.7,you can see concave slope draw
Uttarakhand Op
larly mark an undulating slope and inward bends. Suc
this type of slope, the gradient changes after shor
e slopes may be convex while some other part may
re widely placed at some places and close together
t the western part of the selected area has steep slop
Fig. 5.6 Undulating Slope
rked by an inward bend on a relief feature. The slope
ntour lines are, therefore drawn comparatively far apa
p. In the concave slope, the distance in between the c
numerical value of the contours (height) increases
pe drawn with the help of contour lines.
Fig. 5.7
nd Open University
s. Such slopes are
r short distances.
t may be concave.
ether at others. In
p slope while the
slope is less at the
ar apart at the foot
the contour lines
creases. In Figure
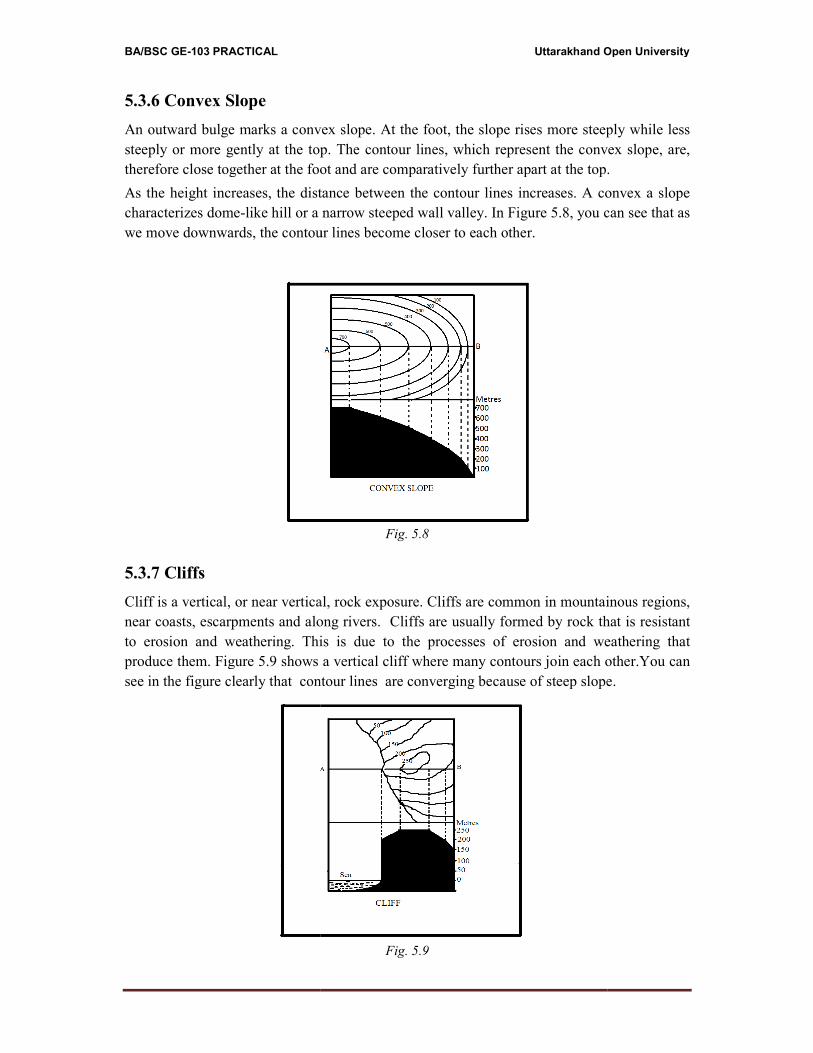
BA/BSC GE-103 PRACTICAL
5.3.6 Convex Slope
An outward bulge marks a convex
steeply or more gently at the top.
therefore close together at the foot
As the height increases, the distan
characterizes dome-like hill or a n
we move downwards, the contour
5.3.7 Cliffs
Cliff is a vertical, or near vertical,
near coasts, escarpments and alon
to erosion and weathering. This
produce them. Figure 5.9 shows a
see in the figure clearly that conto
Uttarakhand Op
convex slope. At the foot, the slope rises more steepl
e top. The contour lines, which represent the convex
e foot and are comparatively further apart at the top.
distance between the contour lines increases. A con
or a narrow steeped wall valley. In Figure 5.8, you ca
ntour lines become closer to each other.
Fig. 5.8
rtical, rock exposure. Cliffs are common in mountain
d along rivers. Cliffs are usually formed by rock tha
. This is due to the processes of erosion and wea
ows a vertical cliff where many contours join each ot
contour lines are converging because of steep slope.
Fig. 5.9
nd Open University
steeply while less
convex slope, are,
e top.
A convex a slope
you can see that as
untainous regions,
ck that is resistant
d weathering that
ach other.You can
slope.
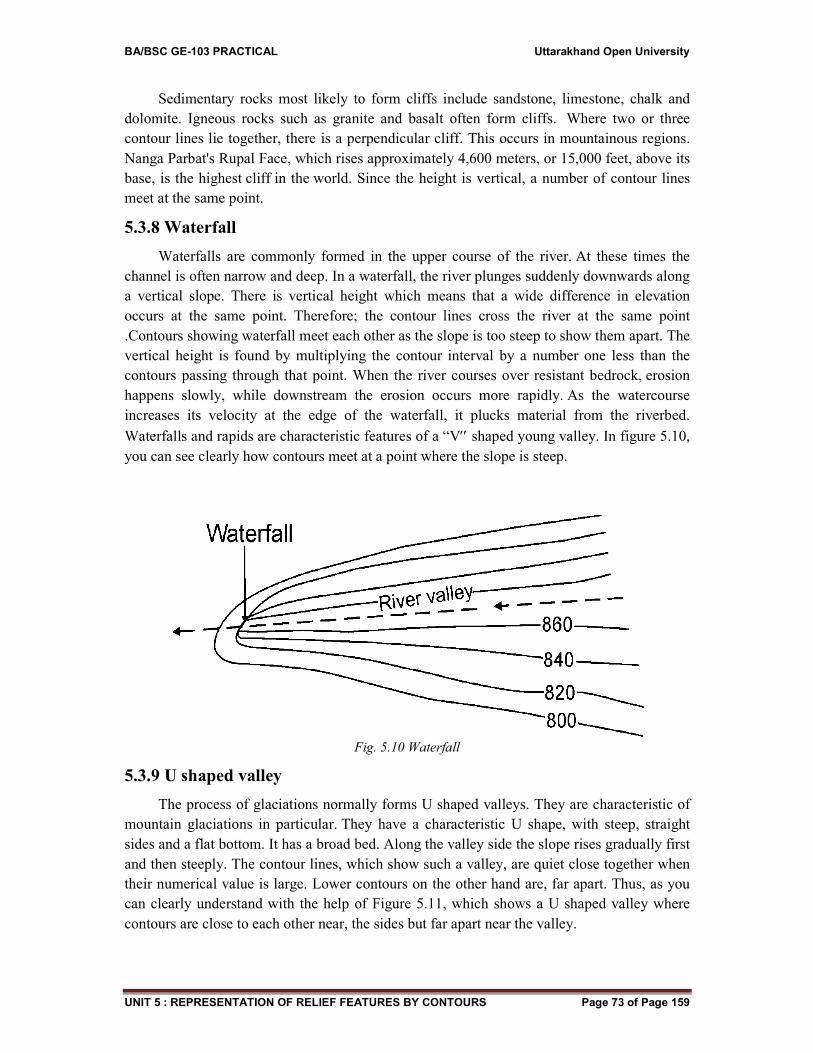
BA/BSC GE-103 PRACTICAL Uttarakhand Open University
UNIT 5 : REPRESENTATION OF RELIEF FEATURES BY CONTOURS Page 73 of Page 159
Sedimentary rocks most likely to form cliffs include sandstone, limestone, chalk and
dolomite. Igneous rocks such as granite and basalt often form cliffs. Where two or three
contour lines lie together, there is a perpendicular cliff. This occurs in mountainous regions.
Nanga Parbat's Rupal Face, which rises approximately 4,600 meters, or 15,000 feet, above its
base, is the highest cliff in the world. Since the height is vertical, a number of contour lines
meet at the same point.
5.3.8 Waterfall
Waterfalls are commonly formed in the upper course of the river. At these times the
channel is often narrow and deep. In a waterfall, the river plunges suddenly downwards along
a vertical slope. There is vertical height which means that a wide difference in elevation
occurs at the same point. Therefore; the contour lines cross the river at the same point
.Contours showing waterfall meet each other as the slope is too steep to show them apart. The
vertical height is found by multiplying the contour interval by a number one less than the
contours passing through that point. When the river courses over resistant bedrock, erosion
happens slowly, while downstream the erosion occurs more rapidly. As the watercourse
increases its velocity at the edge of the waterfall, it plucks material from the riverbed.
Waterfalls and rapids are characteristic features of a “V shaped young valley. In figure 5.10,
you can see clearly how contours meet at a point where the slope is steep.
Fig. 5.10 Waterfall
5.3.9 U shaped valley
The process of glaciations normally forms U shaped valleys. They are characteristic of
mountain glaciations in particular. They have a characteristic U shape, with steep, straight
sides and a flat bottom. It has a broad bed. Along the valley side the slope rises gradually first
and then steeply. The contour lines, which show such a valley, are quiet close together when
their numerical value is large. Lower contours on the other hand are, far apart. Thus, as you
can clearly understand with the help of Figure 5.11, which shows a U shaped valley where
contours are close to each other near, the sides but far apart near the valley.
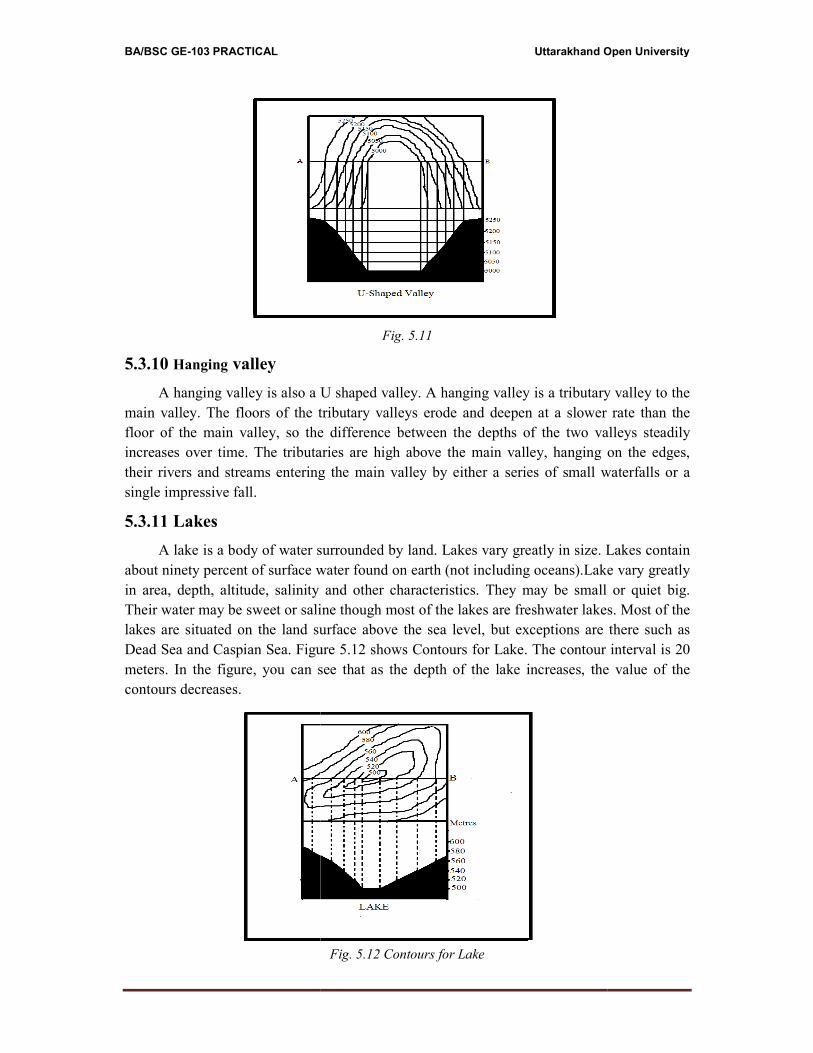
BA/BSC GE-103 PRACTICAL
5.3.10 Hanging valley
A hanging valley is also a U
main valley. The floors of the tri
floor of the main valley, so the
increases over time. The tributari
their rivers and streams entering
single impressive fall.
5.3.11 Lakes
A lake is a body of water su
about ninety percent of surface wa
in area, depth, altitude, salinity a
Their water may be sweet or salin
lakes are situated on the land sur
Dead Sea and Caspian Sea. Figure
meters. In the figure, you can se
contours decreases.
Uttarakhand Op
Fig. 5.11
so a U shaped valley. A hanging valley is a tributary v
the tributary valleys erode and deepen at a slower r
o the difference between the depths of the two vall
ibutaries are high above the main valley, hanging on
tering the main valley by either a series of small wa
ter surrounded by land. Lakes vary greatly in size. La
ace water found on earth (not including oceans).Lake
inity and other characteristics. They may be small o
r saline though most of the lakes are freshwater lakes.
nd surface above the sea level, but exceptions are th
Figure 5.12 shows Contours for Lake. The contour in
can see that as the depth of the lake increases, the v
Fig. 5.12 Contours for Lake
nd Open University
utary valley to the
ower rate than the
o valleys steadily
ing on the edges,
all waterfalls or a
ize. Lakes contain
.Lake vary greatly
mall or quiet big.
lakes. Most of the
are there such as
tour interval is 20
, the value of the
BA/BSC GE-103 PRACTICAL Uttarakhand Open University
UNIT 5 : REPRESENTATION OF RELIEF FEATURES BY CONTOURS Page 75 of Page 159
5.4 CONCLUSION
Contour lines help to understand the shape of the land surface in a quicker and easier
form. The contour lines on a topographic map are in fact the brown lines, which represent an
imaginary line on the ground along which all points are at the same elevation. Contour lines
also show the shape of features on the terrain. To identify and map the different relief
features of the earth surface has always been a challenge for geographers especially
cartographers. Every method has its merits and demerits and there is always a scope left to
find out a new method. The need to show different features in a map may be very important
for a variety of reasons.
The systematic observation of the earth surface, interpreting of the relief features of
different parts of the earth surface, their implementation in various field areas and their
representation accordingly is a significant part of geographical studies. Given a series of
surveyed data points and their elevations, one can construct a contour map of any known
surface. Contour maps are extremely useful for geography students. Contours make it
possible to measure the height of the mountains, depth of the oceans and steepness of slopes.
The numbers featured on each line, represent the exact height of the land at points along that
line. Contours give information about the slope weather it is flat, undulating or mountainous.
By reading contour lines, you can be able to measure the steepness of a hill, the height of a
mountain, and even the depth of a lake or ocean. Where the contour lines are close together,
there is steep slope.
You must have understood up to now that the close lines mean the elevation is changing
rapidly; those are steep places. In a cliff or waterfall, a number of contour lines meet at the
same point.You have studied in the unit that where the contour lines are far apart, it means
that the elevation is not changing much; those are flat places. The landforms have extremes
between steep and flat and contours are the medium that can represent the three-dimensional
surface of the earth in maps effectively. Contours help us to solve some specific purposes
such as site selection for engineering projects, finding routes for communication between
different places, to ascertain the indivisibility of stations as well as to ascertain the profile of
ground surface along any direction. They can also help mark a suitable route for a given
gradient. In addition to topography, there are scores of geophysical, geochemical,
meteorological, sociological, and other variables mapped routinely by the method. Finding
out the nature of the ground with the contours are extremely useful in civil engineering
studies. Intervisibility of any two points can be found by drawing profile of the ground along
a line can be found with the help of contours. Catchment area and hence quantity of water
flow at any point of a river can be found with the help of contour lines. From the contours, it
is possible to determine the capacity of a reservoir. Thus, study of contours and
representation of earth features with contours is not only important for geographers and
geologists but for scientists and engineers having multiple interests beneficial for the society.
Representation of landforms is a challenging problem, besides advanced computer based
cartographic techniques that are comparatively easier and time saving largely. The
availability of plotting devices in recent years has permitted mapping by computer, which
reduce the effect of human bias on the final product.
BA/BSC GE-103 PRACTICAL Uttarakhand Open University
UNIT 5 : REPRESENTATION OF RELIEF FEATURES BY CONTOURS Page 76 of Page 159
5.5 SUMMARY
In this unit, you learned the significance of contour lines, which connect points that are
the same height above sea level. Most commonly found on topographic maps, contour lines
are particularly useful, since they accurately depict the height, shape and slope of a
landscape. More generally, a contour line for a function of two variables is a curve
connecting points where the function has the same particular value. Either contour lines
curved, straight or a mixture of both lines, describe the intersection of a real or hypothetical
surface with one or more horizontal planes. The configuration of these contours allows map-
readers to infer relative gradient of a parameter and estimate that parameter at specific places.
The patterns created by the lines show the shape of the land.
By studying this unit, you may have become more familiar with the patterns used to
represent different relief features with the help of contours. You also identify different types
of landforms with these lines. In this unit, you learned the significance of contour lines which
not only represent landforms and landscapes in an effective manner but also individual relief
features as well. Most commonly found on topographic maps, contour lines are particularly
useful, since they accurately depict the height, shape and slope of a landscape. In this unit,
you have studied how to depict some major relief features with the help of contour lines.
You must have understood up to now that a conical hill is a hill rounded at the base and
rise up to a sharp peak like a cone. Contours of a plateau are closely spaced at the sides with a
broad top .Contours of a saddle show a gap in between the contours in the middle of two
elevated surfaces. In undulating slopes, the contours are widely placed at some places and
close together at others. A concave slope is marked by an inward bend on a relief feature. The
distance in between the contour lines goes on decreasing as the numerical value of the
contours increases in such slopes. The contour lines, which represent the convex slope, are,
therefore close together at the foot and are comparatively further apart at the top. The contour
lines, which show such a valley, are quiet close together when their numerical value is large.
Lower contours on the other hand are, far apart. A hanging valley is also a U shaped valley.
A lake is a water body surrounded by land. Contour lines generally do not meet or
intersect each other. If contour lines are meeting in some portion, it shows existence of a
vertical cliff .By studying this unit you may have become more familiar with the patterns
used to represent different relief features with the help of contours. You also must
immediately identify different types of landforms with these lines. Once we know how to
determine the elevation of the unmarked contour lines we should be able to determine or at
least estimate the elevation of any point on the map.
5.6 GLOSSARY
Landforms: Natural features of the landscape such as valleys, plateaus, mountains, loess,
glaciers or sand dunes.
Isolines: A line on a map, chart, or graph connecting points of equal value.
BA/BSC GE-103 PRACTICAL Uttarakhand Open University
UNIT 5 : REPRESENTATION OF RELIEF FEATURES BY CONTOURS Page 77 of Page 159
Tributary - A tributary is a freshwater stream that feeds into a larger stream or river. The
larger, or parent, river is called the mainstream.
Converging contours: A little horizontal distance on steep slopes between points greatly
different in height, contour lines indicating such terrain are close together.
Sedimentary rocks: Sedimentary rocks are types of rock that are formed by the deposition
and subsequent cementation of that material at the Earth's surface and within bodies of water.
Undulating slope: A slope of land full of ups and down is undulating.
Velocity: An important concept in kinematics that describes the motion of bodies.
Cliff: a vertical, or near vertical, rock exposure
Intervisibility: The distance at which a given standard object can be seen and identified with
the unaided eye
Perpendicular: The relationship between two lines which meet at a right angle (90 degrees).
Three-dimensional surfaces: Relief of the earth surface which has width, length and height
5.7 ANSWER TO CHECK YOUR PROGRESS
5.7.1(Self-check Questions)
1. Define contour lines.
2. What is index contour?
3. How can exact slope angles be determined with the help of contour lines?
4. Which types of slope show the contours far apart?
5. What is a saddle?
6. Describe contours along a cliff.
7. Explain contour settings of concave slopes.
8. What is undulating slope?
9. Where is a ‘U’ shaped valley formed?
10. What are the major advantages of describing relief with contours?
5.7.2 (Answers to self-check Questions)
1. Lines drawn on a map connecting points of equal elevation are called contour lines.
2. Every fifth contour line vertically shown by darker brown lines on the topographic map is
an index contour.
3. Exact slope angles can be determined with contour lines with the help of vertical angles
and horizontal distances between two points marked on a particular map.
4. When contour lines are far from each other, they represent a gradual slope.
5. A saddle is a low point in a range of hills or a pass between two mountain peaks or a gap
in a ridge. It is also called a gap, notch and col.
6. A cliff is a vertical, or near vertical, rock exposure where many contour lines lay together.
7. In the concave slope the contour lines are, therefore drawn comparatively far apart at the
foot and close together at the top.
BA/BSC GE-103 PRACTICAL Uttarakhand Open University
UNIT 5 : REPRESENTATION OF RELIEF FEATURES BY CONTOURS Page 78 of Page 159
8. In undulating slope, there is irregular gradient that changes after short distances.
Therefore, some parts of the slopes may be convex while some other part may be
concave.
9. The process of glaciations normally forms ‘U’ shaped valleys. Therefore, they are
normally found in mountainous regions where there is plenty of snow.
10. Contours make it possible to measure the height of the mountains, depth of the oceans
and steepness of slopes. Apart from this, these lines give information about the slope
weather it is flat, undulating or mountainous.
5.8 REFERENCES
1. Davis, John C., (1986), Statistics and data analysis in g
2. MacEachren, A.M. (1995). How Maps Work. New York: The Guilford Press. ISBN 1-
57230-040-X.
3. Mahmood, A., (1977): Statistical Methods in Geographical Studies, Rajesh
Publications, New Delhi.
4. Misra, R. P. and Ramesh, A. (1969): Fundamentals of Cartography, Concept
Publications, New Delhi.
5. Monkhouse, F. G. and Wilkinsion, H. R., (1956): Maps and Diagrams,
Metheun,London.
6. Robinson A. H. (1971), “The genealogy of the isopleth". Cartographic Journal Vol 8
pp. 49–53.
7. Robinson, A. H. and Sale, R. D., (1969): Elements of Cartography,
8. Robinson, A. H., (1982). Early Thematic Mapping: In the History of Cartography.
Chicago: The University of Chicago Press. ISBN 0-226-72285-6.
9. Singh, L. R. and Singh, R. L., (1991): Map work and Practical geography, Indian
University Press, Allahabad. pp 165-203.
10. Singh, R. L. and Singh Rana, P. B. (1991): Elements of Practical Geography, Kalyani
Publishers, Ludhiyana.
11. Slocum, R. McMaster, F. Kessler, and H. Howard, (2005), Thematic Cartography and
Geographic Visualization, 2nd edition, Pearson, p. 272.ISBN 0-13-035123-7.
13. Tracy, John C. (1907). Plane Surveying; A Text-Book and Pocket Manual. New York:
J. Wiley & Sons, p. 337.
14. Wilkinson, Harland Monkhouse, F. J., (1952): Maps and Diagrams, B. I. Publications
Pvt. Ltd. New Delhi.
15. https://enwikipedia.
16. Org/wiki/Contour_line
17. https://en.wikipedia.org/wiki/contour_line#cite_note-5
18. http://www.sfu.ca/~hickin/Maps
19. https://www.google.co.in/
BA/BSC GE-103 PRACTICAL Uttarakhand Open University
UNIT 5 : REPRESENTATION OF RELIEF FEATURES BY CONTOURS Page 79 of Page 159
20. https://www.google.co.in/
21. https://en.wikipedia.org/wiki/Waterfall
22. https://www.ngdc.noaa.gov/mgg/greatlakes/lakemich_cdrom/html/images.htm
23. http://www.britannica.com/science/contour-mapping
5.9 SUGGESTED READING
1. Close, C., (1969), The Early Years of the Ordnance Survey, 1926, republished by David
and Charles, ISBN 0-7153-4477-3, pp. 141-144.
2. Devlin, Keith (2002). The Millennium Problems. New York, New York: Basic Books.
pp. 162–163. ISBN 978-0-465-01730-0.
3. Edney, Matthew and Pedley, Mary S. (eds). The History of Cartography Volume 4:
Cartography in the European Enlightenment. Chicago and London: University of
Chicago Press. ISBN 0-226-31633-5.
4. Freeman, H. (1991). "Computer Name Placement," Chapter 29, in Geographical
Information Systems, 1, D.J. Maguire, M.F. Goodchild, and D.W. Rhind, John Wiley,
New York, 449-460.
5. Harley, J. B. and Woodward, David (eds) (1987). The History of Cartography Volume
1: Cartography in Prehistoric, Ancient, and Medieval Europe and the Mediterranean.
Chicago and London: University of Chicago Press. ISBN 0-226-31633-5.
6. Harley, J. B. and Woodward, David (eds) (1994). The History of Cartography Volume
2, Book 2: Cartography in the Traditional East and Southeast Asian Societies. Chicago
and London: University of Chicago Press. ISBN 0-226-31637-8.
7. Harley, J. B., and Woodward, David (eds) (1992). The History of Cartography Volume
2, Book 1: Cartography in the Traditional Islamic and South Asian Societies. Chicago
and London: University of Chicago Press. ISBN 0-226-31635-1. Mark Monmonier (ed)
(2015). The History of Cartography Volume 6: Cartography in the Twentieth Century.
Chicago and London: University of Chicago Press.
8. Monmonier, Mark (1991). How to Lie with Maps. Chicago: University of Chicago
Press. ISBN 0-226-53421-9.
9. Owen T. and Pilbeam E., Ordnance Survey: Map Makers to Britain since 1791, HMSO,
1992, ISBN 0-11-701507-5.
10. Robinson, A. H., (1971)."The genealogy of the isopleth". Cartographic Journal 8: 49–
53.
11. Roger J. P. Kain et al. (eds). The History of Cartography Volume 5: Cartography in the
Nineteenth Century. Chicago and London: University of Chicago Press.
12. Wood, Denis (1992). The Power of Maps. New York/London: The Guilford
Press. ISBN 978-0-89862-493-9.
13. Woodward, David (ed) (2007). The History of Cartography Volume 3: Cartography in
the European Renaissance. Chicago and London: University of Chicago Press. ISBN 0-
226-90733-3.
BA/BSC GE-103 PRACTICAL Uttarakhand Open University
UNIT 5 : REPRESENTATION OF RELIEF FEATURES BY CONTOURS Page 80 of Page 159
5.10 TERMINAL QUESTIONS
1. Define contour lines.
2. What are the uses of contour lines?
3. What is the best method of representing the relief features and why?
5. What is index contour?
6. How can exact slope angles be determined with the help of contour lines?
7. Which types of slope do the contours show when they are far apart?
8. What is a saddle?
9. Describe contours along a cliff.
10. Explain contour settings of concave slopes.
11. What is undulating slope?
12. Explain ‘U’ shaped valleys.
13. What are the major advantages of describing relief with contours?
14. Write down the differences in between concave and convex slopes.
15. Explain similarities between the cliff and waterfall.
16. How can you recognize a saddle in a topographic map?
17. How do contours help map-readers?
18. What does the difference in between the contour lines show?
19. What do you understand by converging contours?
20. What type of contours do you see in the hanging valleys?
21. Which type of maps commonly shows contour lines?
BA/BSC GE-103 PRACTICAL Uttarakhand Open University
UNIT 6 : REPRESENTATION OF CLIMATIC DATA Page 81 of Page 159
UNIT 6 : REPRESENTATION OF CLIMATIC DATA
6.1 OBJECTIVES
6.2 INTRODUCTION
6.3 REPRESENTATION OF WEATHER- DATA (WIND ROSE
DIAGRAM, RAINFALL DISPERSION DIAGRAM,
CLIMOGRAPH, HYTHERGRAPH)
6.4 CONCLUSION
6.5 SUMMARY
6.6 GLOSSARY
6.7 ANSWER TO CHECK YOUR PROGRESS
6.8 REFERENCES
6.9 SUGGESTED READINGS
6.10 TERMINAL QUESTIONS
BA/BSC GE-103 PRACTICAL Uttarakhand Open University
UNIT 6 : REPRESENTATION OF CLIMATIC DATA Page 82 of Page 159
6.1OBJECTIVES
After realizing the significance of climatic data, the objectives of the present chapter will
make you capable;
To identify changes in the atmosphere and represent the results through appropriate
methods of various weather phenomena.
To understand weather phenomena and resultant climate changes in a better and
effective manner
To understand, how to represent data related to temperature, wind, humidity, and
rainfall, as well as other atmospheric factors that describe the local weather and climate.
Understand the interrelationships of these elements in different parts of the earth surface
6.2 INTRODUCTION
Climate of any particular place or country is the topic of interest for geographers all over the
world. Scientific studies in the past few decades provide information that the global climate is
changing in a way that it may challenge the survival of human beings. The pattern of human
life in any particular region is largely dependent upon the type of climate of that particular
region. Because of global warming the spectrum of world geography, economy and society
will obviously change. Therefore, the changing climatic patterns all over the world are matter
of concern for scientists and researchers in different parts of the globe today. For proper
understanding of climatic conditions all over the world or a place or region within it, it is
necessary for us to understand what is meant by the term weather. Weather is simply the
current state of the atmosphere at a specific location at any given point in time. You know
very well the fact that some places are dry, some are wet, some are hot, some are cold, and
rest are different having a complex combination of different types of weather.
You can find out what the weather is like where you live by looking out the window or by
stepping outside. In your daily life, you often use this term by asking a relative or friend
about the weather conditions of his or her place. Weather refers to temperature, humidity,
cloudiness, visibility, different forms of precipitation, and the wind's direction and speed. To
understand better, you must know that the above-mentioned five factors determine the state
and condition of the atmosphere and, therefore, influence and determine the weather. Each
place on Earth has weather. However, weather typically varies in different places on the Earth
surface. Scientists who study the weather collect information from different places on Earth
and come up with averages, or typical types of weather, for a particular place. They include
day-to-day state of the atmosphere in a region and its variations. The difference between
weather and climate, which students often confuse, is, therefore very simple. Weather tells
you about the atmospheric conditions at any given moments Real-time measurements of
pressure, temperature, wind speed and direction, humidity, precipitation, cloud cover, and
other variables. Thus, you can define weather as the day-to-day state of the atmosphere, and
its short-term (minutes to weeks) variation.
BA/BSC GE-103 PRACTICAL Uttarakhand Open University
UNIT 6 : REPRESENTATION OF CLIMATIC DATA Page 83 of Page 159
You can directly feel the impact of weather in your daily lives and analyze its impact on
a wide range of subjects including the social and economic well being of human beings in the
place where they live. If you are planning for a tour or outing the first question you ask to
yourself is about the weather conditions of the place you are going to visit so that you may
carry your luggage accordingly. Now, let us know what climate is. Climate is statistical
weather information that describes the variation of weather at a given place for a specified
interval. Thus, you can say that climate includes weather conditions for a given location over
a period. Climate determines mean values of weather elements over a fairly wider territory
and a longer period. In popular usage, climate represents the synthesis of weather; more
formally, it is the weather of a locality averaged over some period (usually 30 years), plus
statistics of weather extremes. Thus, they are both used interchangeably sometimes but differ
in terms of the length of time they measure and what trends affect them. The climatic
conditions of a region are directly involved in determining the environment of that particular
area including flora and fauna. Climate also has its impact on the houses people live, the
clothes they wear and up to some extent the recreation opportunities of that particular area.
Analyzing climatic information involves seeking patterns, relationships, and connections. As
you analyze and interpret information, meaningful patterns or processes emerge. After this,
you can synthesize your observations into coherent explanations. During the process, it would
be useful for you to note associations and similarities between areas, recognize patterns, and
draw inferences from maps, graphs, diagrams, tables, and other sources. Using basic
statistics, you will be able to look for trends, relationships, and sequences. Climatic analysis
involves various processes. It is sometimes difficult to separate the processes involved in
organizing climatic information from the procedures used in analyzing it; the two processes
go on simultaneously in many cases. But in other instances, analysis follows the manipulation
of raw data into an easily understood and usable form. However, interpretations of climatic
data involve the use and development of spatial climatic data. Meteorological warnings and
forecasts are very significant for the people and should be disseminated in a proper way, if
they are to be of value to users. Different types of graphs and diagrams are used to represent
weather conditions and climatic data. Rapid developments in technology, however has its
significant impact in the area of graphics. On the one hand, developments in computer
technology enable production of a vast array of graphic material, and on the other hand, need
of formal training to produce expertise in graphics and training individuals with capabilities
which can help in the representation of climatic data with computer cartography. With the
information provided for a certain time in a certain area, trained personals can guide more
efficiently and help to develop graphics to suit the unique needs and circumstances of a
particular area. Thus, from the very beginning up to now, we will discuss some of the
important climatic diagrams in this unit.
6.3 REPRESENTATION OF WEATHER–DATA
The weather describes the atmospheric conditions at a specific place at a specific point in
time. Climatic conditions of a particular place on the earth surface or the planet as a whole is
BA/BSC GE-103 PRACTICAL Uttarakhand Open University
UNIT 6 : REPRESENTATION OF CLIMATIC DATA Page 84 of Page 159
determined by collecting meteorological data, real-time measurements of atmospheric
pressure, temperature, wind speed and direction, humidity, precipitation, cloud cover, and
other variables. After knowing weather statistics for over periods of 30 years, you can
determine the climate of your region.
Weather generally includes sunshine, rain, cloud cover, winds, hail, snow, sleet, freezing rain,
flooding, blizzards, ice storms, thunderstorms, steady rains from a cold front or warm front,
excessive heat, heat waves and more. Major weather phenomena are as follows-
The first and most significant factor that determines weather is temperature.
Temperature is measured using a thermometer in degrees Fahrenheit or Celsius.
The second factor is air pressure that includes the amount of pressure exerted by the air
in a particular air mass. Air pressure is also called barometric pressure because it is
measured using a barometer and commonly measured in inches of mercury.
The third factor that can determine the weather is if a place is experiencing humidity.
Humidity is a measure of the water content of the air mass.
Weather instruments are used to take measurements of temperature, wind, humidity,
and rainfall, as well as other atmospheric factors that describe the local weather and climate.
Different types of instruments are used to measure different parameters and there are many
types to choose from. The variables measured with these types of instruments are wind speed
and direction, pressure, humidity, temperature, and precipitation, including rain and snow.
For representation of weather- data it is necessary to view certain parameters in certain
places. The user can define the month or season and place of interest. The weather data
including past weather conditions and long term averages can be used for representation
through various methods. Some of the methods with the help of which you can represent
these data are given below:
6.3.1 Wind Rose Diagram
Wind rose is a graphic tool used by meteorologists. It was included on maps before the
development of the compass rose. You can see a medieval wind rose diagram in the picture
(Figure 6.1) which helped to let the reader know in which directions the 8 major winds (and
sometimes 8 half winds and 16 quarter winds) blew within the plan view. No differentiation
was made between cardinal directions and the winds which blew from said directions. North
was depicted with a fleur de lis, while east was shown as a Christian cross to indicate the
direction as seen in figure 1. With changing times, improvements were made to clearly show
the speed and direction of the flowing wind. Wind rose is designed to show the frequency and
direction of the wind at a weather station for a given time. The wind direction indicates the
direction the wind is coming from. The number of wind directions and wind speed classes
can change as required. For a better understanding we can say that it is a graphic tool used at
meteorological stations. It gives a succinct view of the distribution of speed and direction of
wind distributed at a particular location. Historically, wind roses were predecessors of the
compass rose (found on maps), as there was no differentiation between a
cardinal direction and the wind which blew from such a direction. At present, using a polar
coordinate system of gridding, the frequency of winds over a time plotted by wind direction,
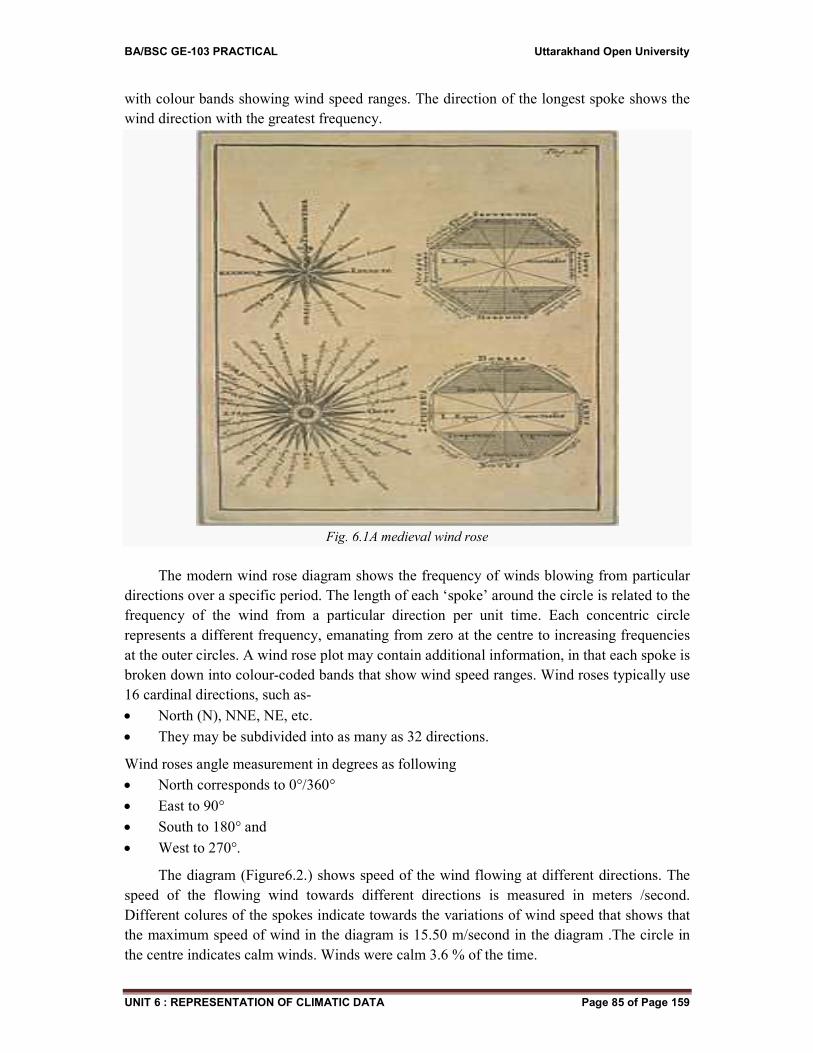
BA/BSC GE-103 PRACTICAL Uttarakhand Open University
UNIT 6 : REPRESENTATION OF CLIMATIC DATA Page 85 of Page 159
with colour bands showing wind speed ranges. The direction of the longest spoke shows the
wind direction with the greatest frequency.
Fig. 6.1A medieval wind rose
The modern wind rose diagram shows the frequency of winds blowing from particular
directions over a specific period. The length of each ‘spoke’ around the circle is related to the
frequency of the wind from a particular direction per unit time. Each concentric circle
represents a different frequency, emanating from zero at the centre to increasing frequencies
at the outer circles. A wind rose plot may contain additional information, in that each spoke is
broken down into colour-coded bands that show wind speed ranges. Wind roses typically use
16 cardinal directions, such as-
North (N), NNE, NE, etc.
They may be subdivided into as many as 32 directions.
Wind roses angle measurement in degrees as following
North corresponds to 0°/360°
East to 90°
South to 180° and
West to 270°.
The diagram (Figure6.2.) shows speed of the wind flowing at different directions. The
speed of the flowing wind towards different directions is measured in meters /second.
Different colures of the spokes indicate towards the variations of wind speed that shows that
the maximum speed of wind in the diagram is 15.50 m/second in the diagram .The circle in
the centre indicates calm winds. Winds were calm 3.6 % of the time.
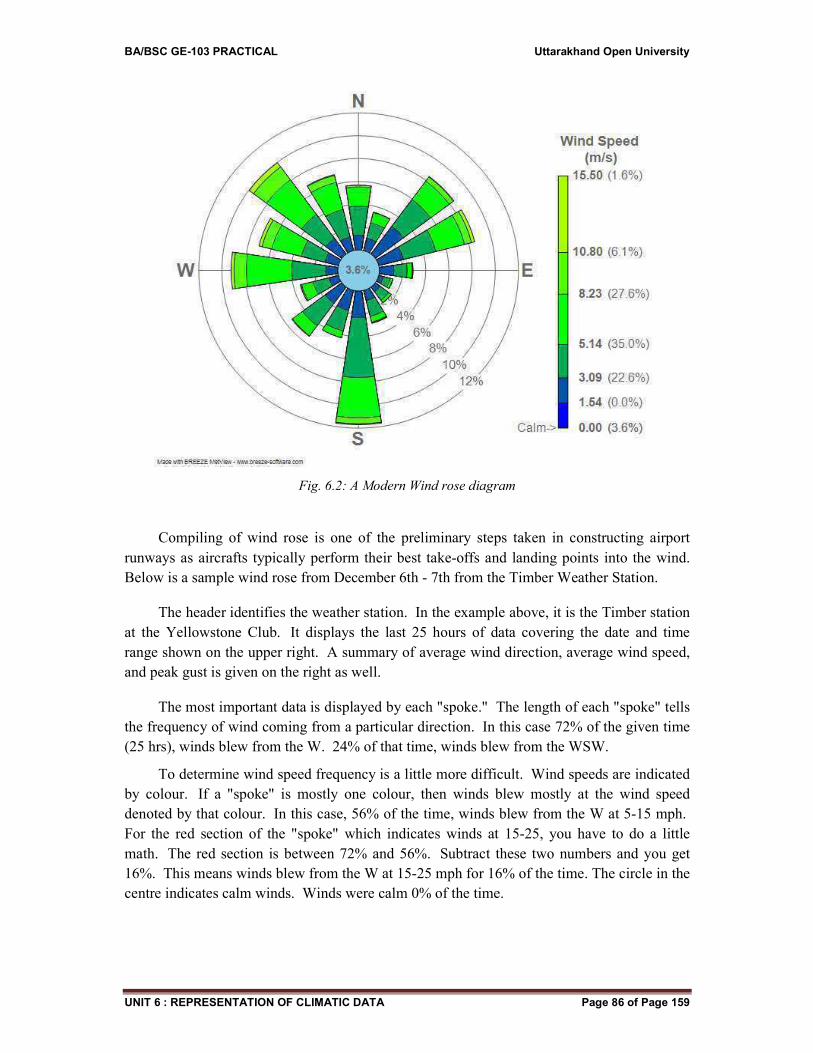
BA/BSC GE-103 PRACTICAL Uttarakhand Open University
UNIT 6 : REPRESENTATION OF CLIMATIC DATA Page 86 of Page 159
Fig. 6.2: A Modern Wind rose diagram
Compiling of wind rose is one of the preliminary steps taken in constructing airport
runways as aircrafts typically perform their best take-offs and landing points into the wind.
Below is a sample wind rose from December 6th - 7th from the Timber Weather Station.
The header identifies the weather station. In the example above, it is the Timber station
at the Yellowstone Club. It displays the last 25 hours of data covering the date and time
range shown on the upper right. A summary of average wind direction, average wind speed,
and peak gust is given on the right as well.
The most important data is displayed by each "spoke." The length of each "spoke" tells
the frequency of wind coming from a particular direction. In this case 72% of the given time
(25 hrs), winds blew from the W. 24% of that time, winds blew from the WSW.
To determine wind speed frequency is a little more difficult. Wind speeds are indicated
by colour. If a "spoke" is mostly one colour, then winds blew mostly at the wind speed
denoted by that colour. In this case, 56% of the time, winds blew from the W at 5-15 mph.
For the red section of the "spoke" which indicates winds at 15-25, you have to do a little
math. The red section is between 72% and 56%. Subtract these two numbers and you get
16%. This means winds blew from the W at 15-25 mph for 16% of the time. The circle in the
centre indicates calm winds. Winds were calm 0% of the time.
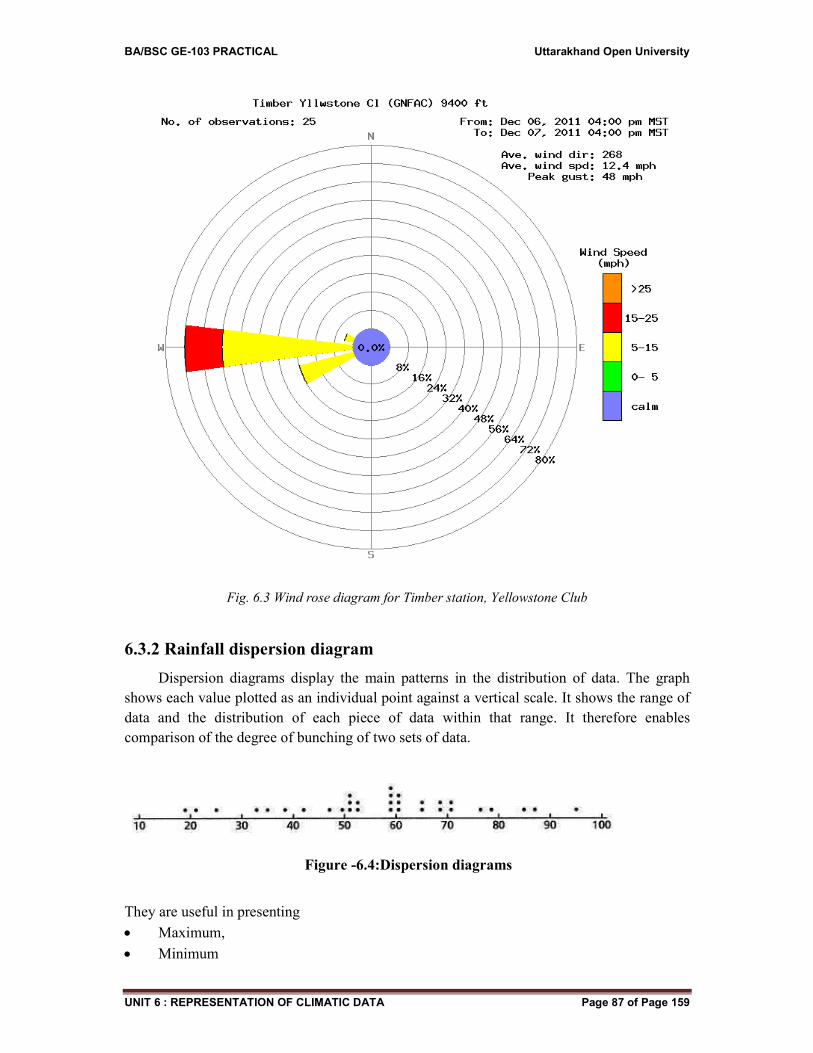
BA/BSC GE-103 PRACTICAL Uttarakhand Open University
UNIT 6 : REPRESENTATION OF CLIMATIC DATA Page 87 of Page 159
Fig. 6.3 Wind rose diagram for Timber station, Yellowstone Club
6.3.2 Rainfall dispersion diagram
Dispersion diagrams display the main patterns in the distribution of data. The graph
shows each value plotted as an individual point against a vertical scale. It shows the range of
data and the distribution of each piece of data within that range. It therefore enables
comparison of the degree of bunching of two sets of data.
Figure -6.4:Dispersion diagrams
They are useful in presenting
Maximum,
Minimum
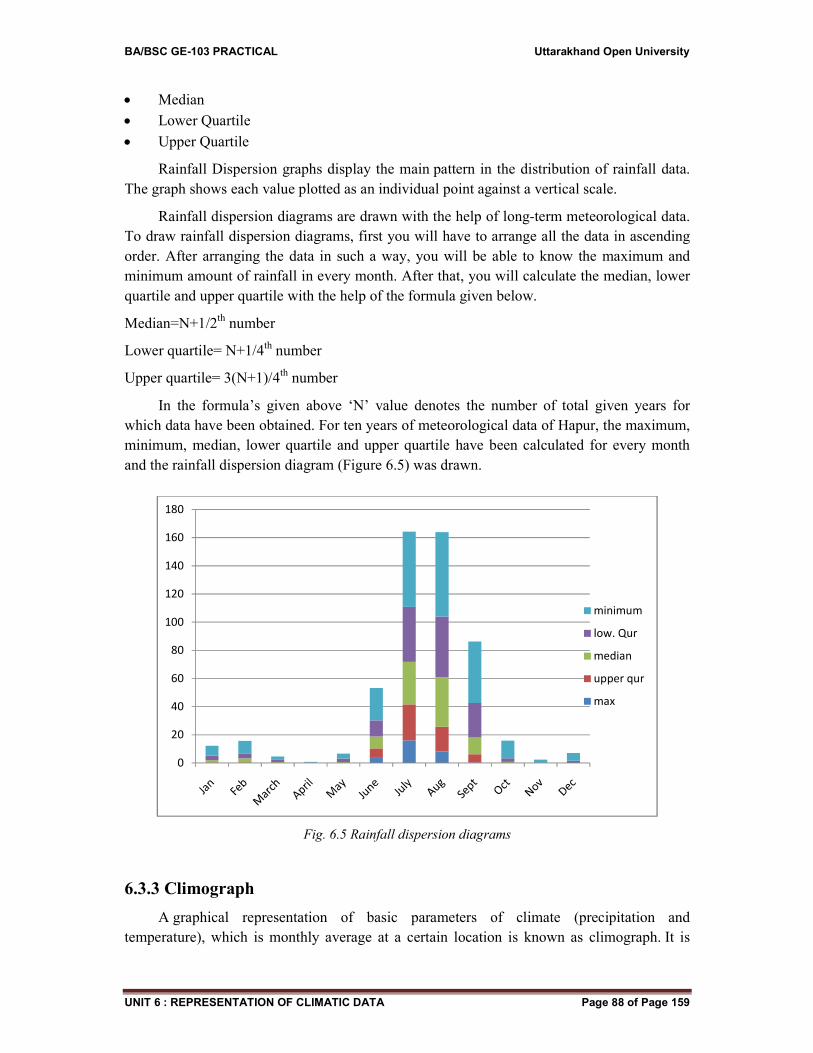
BA/BSC GE-103 PRACTICAL Uttarakhand Open University
UNIT 6 : REPRESENTATION OF CLIMATIC DATA Page 88 of Page 159
Median
Lower Quartile
Upper Quartile
Rainfall Dispersion graphs display the main pattern in the distribution of rainfall data.
The graph shows each value plotted as an individual point against a vertical scale.
Rainfall dispersion diagrams are drawn with the help of long-term meteorological data.
To draw rainfall dispersion diagrams, first you will have to arrange all the data in ascending
order. After arranging the data in such a way, you will be able to know the maximum and
minimum amount of rainfall in every month. After that, you will calculate the median, lower
quartile and upper quartile with the help of the formula given below.
Median=N+1/2th
number
Lower quartile= N+1/4th
number
Upper quartile= 3(N+1)/4th
number
In the formula’s given above ‘N’ value denotes the number of total given years for
which data have been obtained. For ten years of meteorological data of Hapur, the maximum,
minimum, median, lower quartile and upper quartile have been calculated for every month
and the rainfall dispersion diagram (Figure 6.5) was drawn.
Fig. 6.5 Rainfall dispersion diagrams
6.3.3 Climograph
A graphical representation of basic parameters of climate (precipitation and
temperature), which is monthly average at a certain location is known as climograph. It is
0
20
40
60
80
100
120
140
160
180
minimum
low. Qur
median
upper qur
max
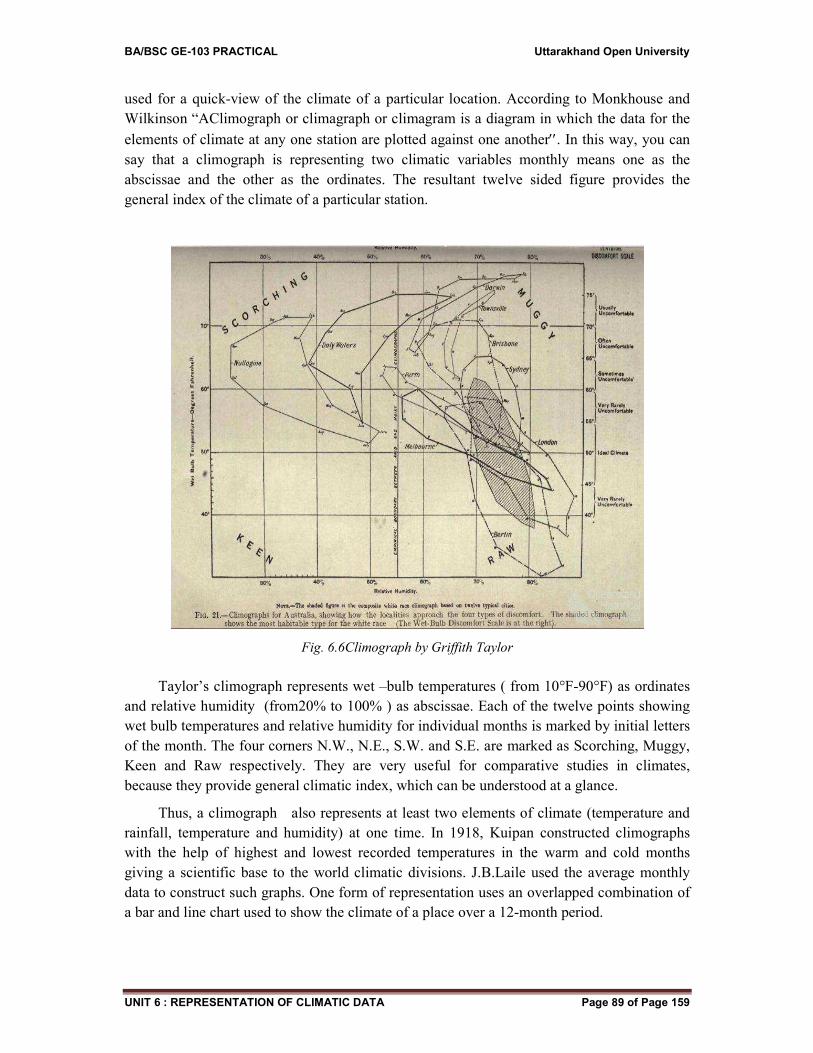
BA/BSC GE-103 PRACTICAL Uttarakhand Open University
UNIT 6 : REPRESENTATION OF CLIMATIC DATA Page 89 of Page 159
used for a quick-view of the climate of a particular location. According to Monkhouse and
Wilkinson “AClimograph or climagraph or climagram is a diagram in which the data for the
elements of climate at any one station are plotted against one another. In this way, you can
say that a climograph is representing two climatic variables monthly means one as the
abscissae and the other as the ordinates. The resultant twelve sided figure provides the
general index of the climate of a particular station.
Fig. 6.6Climograph by Griffith Taylor
Taylor’s climograph represents wet –bulb temperatures ( from 10°F-90°F) as ordinates
and relative humidity (from20% to 100% ) as abscissae. Each of the twelve points showing
wet bulb temperatures and relative humidity for individual months is marked by initial letters
of the month. The four corners N.W., N.E., S.W. and S.E. are marked as Scorching, Muggy,
Keen and Raw respectively. They are very useful for comparative studies in climates,
because they provide general climatic index, which can be understood at a glance.
Thus, a climograph also represents at least two elements of climate (temperature and
rainfall, temperature and humidity) at one time. In 1918, Kuipan constructed climographs
with the help of highest and lowest recorded temperatures in the warm and cold months
giving a scientific base to the world climatic divisions. J.B.Laile used the average monthly
data to construct such graphs. One form of representation uses an overlapped combination of
a bar and line chart used to show the climate of a place over a 12-month period.
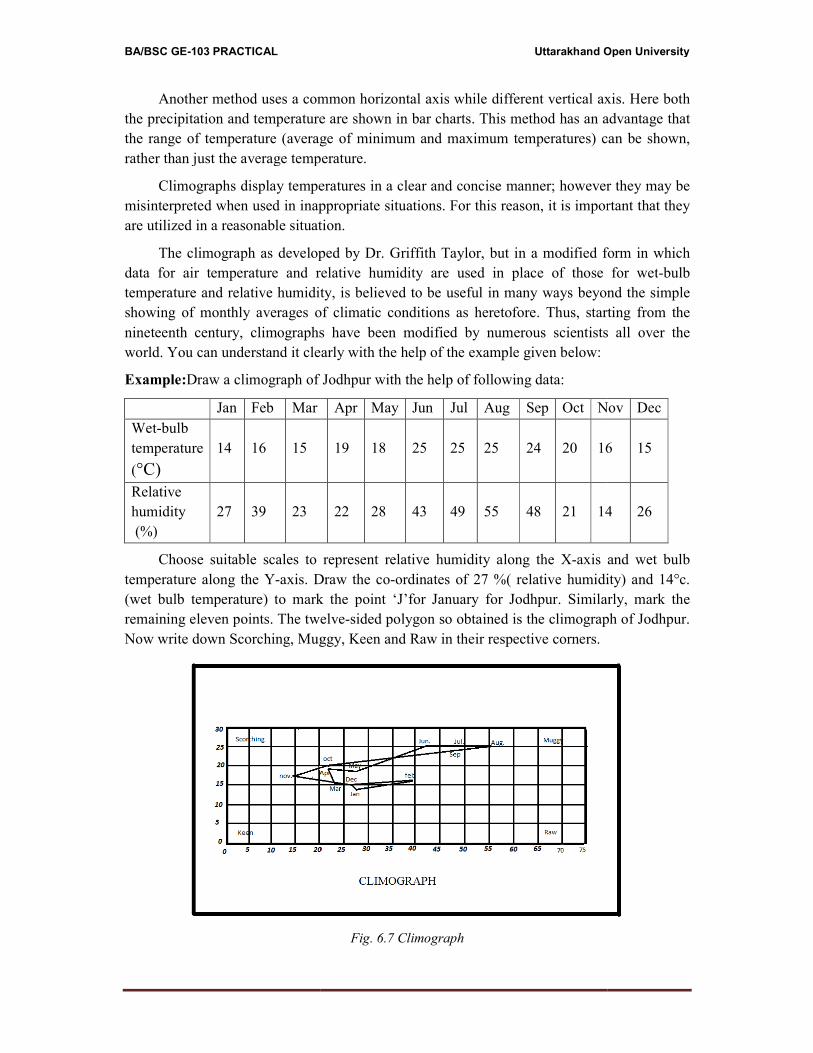
BA/BSC GE-103 PRACTICAL
Another method uses a comm
the precipitation and temperature
the range of temperature (average
rather than just the average temper
Climographs display temper
misinterpreted when used in inapp
are utilized in a reasonable situatio
The climograph as develope
data for air temperature and rel
temperature and relative humidity
showing of monthly averages of
nineteenth century, climographs
world. You can understand it cle
Example:Draw a climograph of Jo
Jan Feb Mar
Wet-bulb
temperature
(°C)
14
16
15
Relative
humidity
(%)
27
39
23
Choose suitable scales to re
temperature along the Y-axis. Dra
(wet bulb temperature) to mark
remaining eleven points. The twel
Now write down Scorching, Mugg
Uttarakhand Op
a common horizontal axis while different vertical axis
rature are shown in bar charts. This method has an ad
verage of minimum and maximum temperatures) can
temperature.
emperatures in a clear and concise manner; however t
inappropriate situations. For this reason, it is importa
ituation.
veloped by Dr. Griffith Taylor, but in a modified for
nd relative humidity are used in place of those f
midity, is believed to be useful in many ways beyond
es of climatic conditions as heretofore. Thus, startin
raphs have been modified by numerous scientists a
it clearly with the help of the example given below:
h of Jodhpur with the help of following data:
Apr May Jun Jul Aug Sep Oct No
19
18
25
25
25
24
20
16
22
28
43
49
55
48
21
14
s to represent relative humidity along the X-axis an
is. Draw the co-ordinates of 27 %( relative humidity
mark the point ‘J’for January for Jodhpur. Similarl
e twelve-sided polygon so obtained is the climograph
, Muggy, Keen and Raw in their respective corners.
Fig. 6.7 Climograph
nd Open University
al axis. Here both
an advantage that
es) can be shown,
ever they may be
mportant that they
ied form in which
ose for wet-bulb
beyond the simple
starting from the
ntists all over the
Nov Dec
16
15
14
26
axis and wet bulb
midity) and 14°c.
milarly, mark the
graph of Jodhpur.
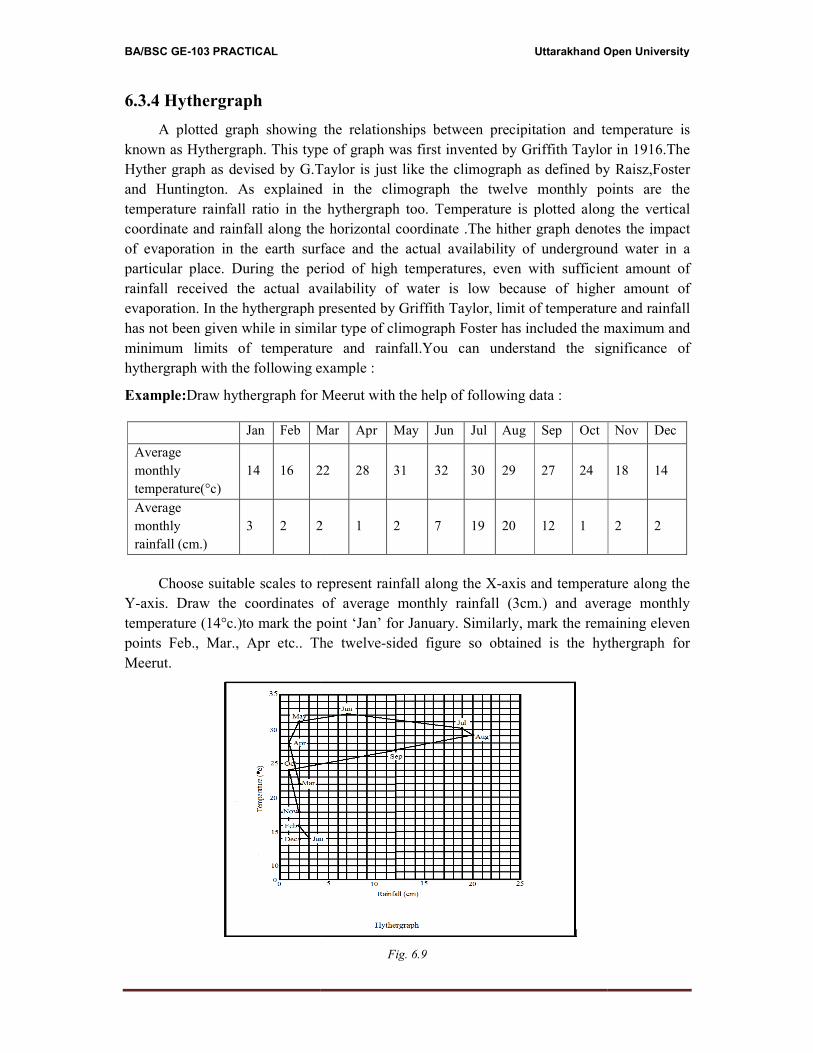
BA/BSC GE-103 PRACTICAL
6.3.4 Hythergraph
A plotted graph showing th
known as Hythergraph. This type
Hyther graph as devised by G.Ta
and Huntington. As explained
temperature rainfall ratio in the h
coordinate and rainfall along the
of evaporation in the earth surfa
particular place. During the peri
rainfall received the actual ava
evaporation. In the hythergraph pr
has not been given while in simila
minimum limits of temperature
hythergraph with the following ex
Example:Draw hythergraph for M
Choose suitable scales to rep
Y-axis. Draw the coordinates
temperature (14°c.)to mark the po
points Feb., Mar., Apr etc.. The
Meerut.
Jan Feb Ma
Average
monthly
temperature(°c)
14
16
22
Average
monthly
rainfall (cm.)
3
2
2
Uttarakhand Op
ing the relationships between precipitation and tem
s type of graph was first invented by Griffith Taylor
G.Taylor is just like the climograph as defined by R
ained in the climograph the twelve monthly poi
the hythergraph too. Temperature is plotted along
g the horizontal coordinate .The hither graph denotes
surface and the actual availability of underground
e period of high temperatures, even with sufficient
l availability of water is low because of higher
aph presented by Griffith Taylor, limit of temperature
similar type of climograph Foster has included the ma
erature and rainfall.You can understand the sign
ing example :
for Meerut with the help of following data :
to represent rainfall along the X-axis and temperatu
of average monthly rainfall (3cm.) and avera
the point ‘Jan’ for January. Similarly, mark the remai
.. The twelve-sided figure so obtained is the hyth
Fig. 6.9
Mar Apr May Jun Jul Aug Sep Oct
22
28
31
32
30
29
27
24
2
1
2
7
19
20
12
1
nd Open University
nd temperature is
aylor in 1916.The
d by Raisz,Foster
y points are the
along the vertical
enotes the impact
round water in a
ficient amount of
igher amount of
rature and rainfall
the maximum and
e significance of
perature along the
average monthly
remaining eleven
e hythergraph for
Nov Dec
18
14
2
2
BA/BSC GE-103 PRACTICAL Uttarakhand Open University
UNIT 6 : REPRESENTATION OF CLIMATIC DATA Page 92 of Page 159
Their major purpose is to provide general climatic differences, which occur in different
parts of the earth surface and effect human life in various ways. They are much superior to
the other combined rainfall and temperature graphs because they help a quick understanding
of the relationship between varying atmospheric conditions. Moreover, they are also well
suited for comparative studies.
6.4 CONCLUSION
Climate describes the average conditions of a place expected atgiven time .A region's
climate is generated by the climate system, which has fivecomponents: atmosphere,
hydrosphere, land surface, and biosphere. If you measure weather data calculate and analyze
weather statistics over a long period, you will be able to understand the climatic conditions of
that particular area. Temperature, rainfall, cloud cover, winds, hail, snow, flooding, blizzards,
ice storms, thunderstorms, steady rains from a cold front or warm front, excessive heat, heat
waves and more are the weather components that vary from place to place and time to time.
In a long period, their impact upon the earth surface is well known as climatic variations.
Representation of climatic data related to different regions such as hills, plateaus and plains
have to be determined region-to-region and place to place.
Today, as you all know, the world is facing several challenges due to global warming
and climate change. There are strong evidences, which indicate that, an increase in the mean
maximum as well as minimum air and oceanic temperature, which is leading to widespread
melting of glaciers, and rising sea levels. The increasing frequency and magnitude of
disasters occurring due to climate change are posing threat to lives and livelihood at local
level and; of course has its impact all over the earth. The Representation of these data is very
important for you to understand. This may help you in a practical way to easily recognize the
different climatic components and their changes along time at a particular place on earth or
all over the globe. This may also help the communities adapt the challenges like soil erosion,
land degradation, frequent flooding and rising sea levels. All the factors responsible for
climate change need careful observations, continuous monitoring of climatic inputs, and
research. This is only possible with data analysis and representation of the collected data
bank.
Therefore, it is the requirement of the present hour to represent the collected data bank
in a presentable manner to make it applicable in the areas concerned. With modern
technology developing rapidly, the issue is no longer how to spread the information, but how
to do it in the most efficient way. You must have understood up to now that collected data
bank through different meteorological stations if represented through specific methods can
help to compare them easily. This may help to deal with the problems related with changes
in climatic conditions in general and the extreme weather conditions at different places
around the world in particular that are matter of concern for scientists all over the world. The
changes in the climate are at such a fast pace that many plants and animal species would
vanish from the earth surface. By Identifying changes in the atmosphere and show the impact
BA/BSC GE-103 PRACTICAL Uttarakhand Open University
UNIT 6 : REPRESENTATION OF CLIMATIC DATA Page 93 of Page 159
of human caused greenhouse gas emissions and other processes that are responsible for the
same.
You must have understood up to now that the changing climatic conditions at different
places all over the world requires continuous monitoring of weather data and representing
them in a better way to make them useful for the poor people which are the most vulnerable
to changing weather and climatic conditions. To show elements and processes of climatic in
different parts of the earth surface so that they can be further used for solving multiple
problems. Illustration of climatic data may help policy makers to make appropriate decisions
immediately. Representation of weather- data accordingly may help in developing new ways
of farming that support a healthy environment to minimize climatic impacts and create a
better quality of life for farmers. Continuous monitoring and analysis of meteorological
inputs can further be used for modelling. These methods may help policy makers to make
appropriate decisions immediately.
6.5 SUMMARY
You learned in this unit that the average weather conditions at a specific place at a given time
are known as climate. A region's climate is generated by the climate system, which has five
components: atmosphere, hydrosphere, cryosphere, land surface and biosphere. Climate may
include precipitation, temperature, humidity, sunshine, and wind velocity, phenomena such as
fog, frost, and hail storms over a long period of time. Different types of instruments are used
to measure different parameters. Weather stations collect meteorological information with the
help of these instruments. These data can be analyzed and plotted through various methods
and techniques. You have learned the methods which are very significant for representations
of major components of climate .Thus; some of the methods included in this unit will help
you to understand the weather phenomena which collectively represent climate in a better
way. These are wind speed and direction, distribution of rainfall at a particular place at a
certain period, varied temperatures, their interrelationships in a clear and concise manner and
ultimately how they have their impact upon each other and on human beings in different parts
of the earth surface. Thus, you must have understood up to now that all these methods are an
initial part in understanding meteorological as well as climatic components up to a great
extent.
Wind rose, a graphic tool used by meteorologists, was included on maps before the
development of the compass rose. With the help of this diagram in order to let the reader was
able to know which directions the 8 major winds blew within the plan view. Able to give
more precise information, the modern wind rose diagram shows the frequency of winds
blowing from particular directions over a specific period. The length of each ‘spoke’ around
the circle is related to the frequency of the wind from a particular direction per unit time. In
the rainfall dispersion diagrams graphs are used to display the main patterns in the
distribution of data. The graph shows each value plotted as an individual point against a
vertical scale. Drawn with the help of long term meteorological data, these diagrams predict
BA/BSC GE-103 PRACTICAL Uttarakhand Open University
UNIT 6 : REPRESENTATION OF CLIMATIC DATA Page 94 of Page 159
the maximum, minimum, median, lower quartile and upper quartile .After arranging all the
data in ascending order, you will be able to know the maximum and minimum amount of
rainfall in every month. After that, you will be able to represent your data with the rainfall
dispersion graphs.
To view the general climatic view at a glance, including more than single climatic
parameters, a climograph represents at least two elements of climate (temperature and
rainfall, temperature and humidity) at a given point of time. In 1918, Kuipan constructed
climographs with the help of highest and lowest recorded temperatures in the warm and cold
months giving a scientific base to the world climatic divisions. A plotted graph showing
Griffith Taylor first invented the relationships between precipitation and temperature in the
early twentieth century. This type of graph is known as Hythergraph. It resembles first
invented by Griffith Taylor in 1916.
The Hythergraph as devised by G.Taylor is just like the climograph as defined by Raisz,
Foster and Huntington. However, the climographsand hythergraphs both represent the
relationship between rainfall and temperature . Moreover, hythergraphs also include the wind
speed and direction. They well suit for comparative studies.
Thus, in this unit ,you have learned to represent climatic data mainly temperature, rainfall,
direction of wind with the help of different methods which are very significant in the studies
related with climatic differences that can be noticed after a careful observation of the
available data collected from different parts of the world. Furthermore, after studying this
unit, you may be able to think of the changes humanity needs to adapt to a world where
changing climatic patterns is a matter of deep concern. All the above mentioned methods
discussed in the unit are to facilitate analysis and prediction in the field of weather and
climatic variability and changes for use, benefit and value to society.
6.6 GLOSSARY
Predecessors: A thing that has been followed or replaced by another.
Atmosphere: The atmosphere is a mixture of nitrogen (78%), oxygen (21%), and other gases
(1%) that surrounds Earth. High above the planet, the atmosphere is the home for many
plants and animals.
Cryosphere:The cryosphere is the frozen water part of the Earth system. Beaufort Sea,
north of Alaska. One part of the cryosphere is ice that is found in water. This includes frozen
parts of the ocean, such as waters surrounding Antarctica and the Arctic.
Biosphere: The biosphere is the biological component of earth systems, which also include
the lithosphere, hydrosphere, atmosphere and other "spheres" (e.g. cryosphere, anthrosphere,
etc.). The biosphere includes all living organisms on earth, together with the dead organic
matter produced by them.
Temperature: An objective comparative measure of hot or cold a quantity
BA/BSC GE-103 PRACTICAL Uttarakhand Open University
UNIT 6 : REPRESENTATION OF CLIMATIC DATA Page 95 of Page 159
Humidity: Humidity represents the amount of water vapour in the atmosphere or in a gas.
Precipitation :Rain, snow, sleet, or hail that falls to or condenses on the ground.
Meteorology :The interdisciplinary scientific study of the atmosphere.
Fog : A visible mass consisting of cloud water droplets or ice crystals suspended in the air at
or near the Earth's surface. Fog can be considered a type of low-lying cloud and is heavily
influenced by nearby bodies of water, topography, and wind conditions.
Frost : The coating or deposit of ice that may form in humid air in cold conditions, usually
overnight.
Hail storms : Any thunderstorm which produce hails that reaches the ground is known as a
hailstorm has a diameter of 5 millimetres (0.20 in) or more. Hailstones can grow to 15
centimetres (6 in) and weigh more than 0.5 kilograms (1.1 lb). Unlike ice pellets, hailstones
are layered and can be irregular and clumped together.
Greenhouse gases : The primary greenhouse gases in Earth's atmosphere are water vapour,
carbon dioxide, methane, nitrous oxide, and ozone.
Blizzards : A severe snowstorm characterized by strong sustained winds of at least 35 mph
(56 km/h) and lasting for a prolonged period of time—typically three hours or more.
Ice storms : A storm of freezing rain that leaves a coating of ice
Thunderstorms :A storm with thunder and lightning and typically also heavy rain or hail.
Cold front : The transition zone where a cold air mass is replacing a warmer air mass. Cold
fronts generally move from northwest to southeast. The air behind a cold fronts is noticeably
colder and drier than the air ahead of it.
Warm front : The transition zone where a warm air mass is replacing a cold air mass. Warm
fronts generally move from southwest to northeast and the air behind a warm front is
warmer and moister than the air ahead of it.
The median : A number that is halfway into the set. To find the median, the data should first
be arranged in order from least to greatest.
The upper quartile : The median of the upper half of a data set. This is located by dividing
the data set with the median and then dividing the upper half that remains with the median
again, this median of the upper half being the upper quartile.
The lower quartile (Q1) : is the median of the lower half of the data set of the spatial
climatic data.
Soil erosion : This is a naturally occurring process on all land. The agents of soil erosion are
water and wind, each contributing a significant amount of soil loss each year.
Land degradation : A process in which the value of the biophysical environment is affected
by a combination of human-induced processes acting upon the land. It is viewed as any
change or disturbance to the land perceived to be deleterious or undesirable.
Scorching : high temperature (70°-80°F) and low relative Humidity (below40%)
BA/BSC GE-103 PRACTICAL Uttarakhand Open University
UNIT 6 : REPRESENTATION OF CLIMATIC DATA Page 96 of Page 159
Muggy : high temperature (70°-80°F) and high relative Humidity (over70%)
Keen :low temperature (below40°F) and low relative Humidity (below40%)
Raw : low temperature (below40°F) and high relative Humidity (over70%) becomes thinner
until it gradually reaches space. It is divided into five layers. Most of the weather and clouds
are found in the first layer.
Hydrosphere : The hydrosphere is the liquid water component of the Earth. It includes the
oceans, seas, lakes, ponds, rivers and streams. The hydrospherecovers about 70% of the
surface of the Earth.
6.7 ANSWER TO CHECK YOUR PROGRESS
6.7.1(Self-check Questions)
Q.1. What is climate?
Q.2. How can climate of a particular region are understood properly?
Q.3. How can you represent climatic data?
Q.4. What helps you to look for trends, relationships, and sequences in the available climatic
data?
Q.5. Define ‘weather’.
Q.6. What is a wind rose diagram?
Q.7. What is the significance of each "spoke in the wind rose diagram?
Q.8. Where are wind roses used as one of the preliminary steps taken in modern times?
Q.9. Who used climographs scientifically to divide the world into climatic divisions?
Q.10. What is the disadvantages of climographs?
Q.11. Who was the founder of hythergraph?
12. Fill in the blanks with the appropriate words given below
(Ordinates, ascending, plotted, graphic tool)
i) Temperature is.......... along the vertical coordinate.
ii ) Wind rose is a........................... used basically by meteorologists
iii) Taylor’s climograph represents wet –bulb temperatures as .................and relative
humidity as abscissae.
iv) In the rainfall dispersion diagrams, first you will have to arrange all the data in
..........order.
6.7.2(Answers to self-check Questions)
1. Climate is detailed statistical weather information that describes the variation of
weather at a given place for a specified interval.
2. The climatic conditions all over the world or a place or region within it, can be
understood with collection, analysis and representation of weather data of that particular
place or region.
BA/BSC GE-103 PRACTICAL Uttarakhand Open University
UNIT 6 : REPRESENTATION OF CLIMATIC DATA Page 97 of Page 159
3. Climatic data can be represented with the help of different types of graphs and
diagrams.
4. With the help of basic statistical techniques you can find out trends, relationships, and
sequences in the available climatic data.
5. The atmospheric conditions at a specific place at a specific point in time are known as
weather.
6. The diagram, which shows the frequency of winds blowing from particular directions
over a specific period, is a wind rose diagram.
7. In the wind rose diagram the length of each "spoke" tells the frequency of wind coming
from a particular direction.
8. Compiling of wind rose is one of the preliminary steps taken in constructing airport
runways as aircrafts typically perform their best take-offs and landing points into the
wind.
9. In 1918, Kuipan constructed climographs giving a scientific base to the world climatic
divisions. In his division, highest and lowest recorded temperatures in the warm and
cold months were used.
10. Though climographs display temperatures in a clear and concise manner but if not used
in appropriate situations there are chances of misinterpretation. Therefore, it is
necessary that they may be used in a reasonable situation.
11. Hythergraph was first invented by Griffith Taylor in 1916.
12. Fill in the blanks with the appropriate words given below
i) Temperature isplotted along the vertical coordinate.
ii) Wind rose is a graphic tool used basically by meteorologists
iii) Taylor’s climograph represents wet –bulb temperatures as ordinates and relative
humidity as abscissae.
iv) In the rainfall dispersion diagrams, first you will have to arrange all the data in
ascending order.
6.8 REFERENCES
1. Banks, James A. (1997). United States: Adventures in time and place. Macmillan. p.
242.
2. Barnaby, C. (2011): Weather data for building performance simulation, pp: 37-55.
3. Birch, T.W.: Topographical & Statistics Maps, Clarndon Press, Oxford. Barnaby, C.
(2011). Weather data for building performance simulation, pp: 37-55.
4. Bygott, J., (1948): An Introduction to Map work and Practical Geography, London.
5. Dikinsion, G. C., (1963), Statistical mapping and the presentation of Statistical data,
London.
6. Garnett, A: Geographical Interpretation of Topographical Maps. George Harrap& Co.,
London.
BA/BSC GE-103 PRACTICAL Uttarakhand Open University
UNIT 6 : REPRESENTATION OF CLIMATIC DATA Page 98 of Page 159
7. Hensen, J.L.M., (1999), Simulation of building energy and indoor environmental
quality – some weather data issues, Proceedings of the International Workshop on
Climate data and their applications in engineering, pp. 1-15.
8. Kleindienst,S., Bodart,M. ,Anderson,M (2008) Graphical representation of climate-
based daylight performance to support architectural design.
9. Mahmood, A., (1977): Statistical Methods in Geographical Studies, Rajesh
Publications, New Delhi.
10. Mishra, R. P. and Ramesh, A.: Fundamental of Cartography, Macmillan, New Delhi.
1986
11. Misra, R. P. and Ramesh, A., (1969): Fundamentals of Cartography, Concept
Publications, New Delhi.
12. Monkhouse, F. G. and Wilkinsion, H. R., (1956): Maps and Diagrams, Metheun,
London.
13. Robinson, A. H., (1982). Early Thematic Mapping: In the History of Cartography.
Chicago: The University of Chicago Press. ISBN 0-226-72285-6.
14. Sharma.J.P,PracticalGeography,RastogiPublishers,Merut.
15. Singh, L. R.and Singh, R. L., (1991): Map work and Practical geography, Indian
University Press, Allahabad. pp 165-203.
16. Singh,R.L. and Dutt, P.K.: Elements of practical Geography, Students Friends,
Allahabad.
17. Singh,S,P. ,Singh,V.andMargaret,S.,Rapid warming in the Himalayas :Ecosystem
responses and development options,Climate and development,2010,2,1-13.
18. Singh.R.L, Elements of Practical Geography,Kalyanipublishers ,New Delhi.
19. https://www.google.co.in
20. https://sites.google.com/site/skillsa229/dispersion-
iagramshttps//en.wikipedia.org/wiki/Wind-rose#cite-note-3
21. http://www.cotf.edu/ete/modules/msese/earthsysflr/climograph.html.
22. http://www.yourdictionary.com/hythergraph.
23. https://en.wikipedia.org/wiki/Wind_rose#history.
24. http://www.mtavalanche.com/weather/windrose.
6.9 SUGGESTED READINGS
1. Namowitz, S.N.and Stone, D.B., (1960), Earth Science: The world we live in, New York.
2. National Aeronautics and space Administration (2008, May, 12) Solar variability: Striking
a balance with climate change .Science Daily.
3. Weber, E. (2006), Experience Based and Description Based Perceptions of Long-term
Risk: Why Global Warming does not scare us (Yet) Climatic Change Communication
http//www.nylines.
4. Plimer, Ian, (2009) “Heaven and Earth: Global Warming – The Missing Science, “Conner
Court Publishing pp.207-225.
5. Trewartha, G.T., (1954): An Introduction to Climate, Tokyo.
BA/BSC GE-103 PRACTICAL Uttarakhand Open University
UNIT 6 : REPRESENTATION OF CLIMATIC DATA Page 99 of Page 159
6. Brown, R. D. and Robinson, D. A. (2011): Northern Hemisphere spring snow cover
variability and change over 1922–2010 including an assessment of uncertainty, The
Cryosphere, 5, 219–229, doi:10.5194/tc-5-219-2011.
7. Cavalieri, D. J., Glowersen, P., Parkinson, C. L., Comiso, J. C., and Zwally, H. J. (1997):
Observed hemispheric asymmetry in global sea ice changes, Science, 278, 1104–1106.
8. Finch, V.C., Trewartha, G.T., Robinson, A.H. and Hammond, E.H., (1957): Elements of
Geography, Physical and Cultural, New York.
9. Kukla, G. and Robinson, D. A.: Accuracy of snow and ice monitoring, Snow Watch 1980,
Glaciological Data, Report GD-5, 91–97, 1981.
6.10 TERMINAL QUESTIONS
1. Define ‘weather’.
2. What can be the first step towards understanding the climate of a particular region?
3. What is climate?
4. What helps you to look for trends, relationships, and sequences in the available climatic
data?
5. How can you represent climatic data?.
6. Highlight the major factors that determine the state and condition of the atmosphere?
7. Explain meteorology. Tell the significance of meteorological data for the students
studying geography?
8. What is the relationship in between weather and climate?
9. What is a wind rose diagram? Are modern wind rose diagrams different from the
previous ones? Explain.
10. What is the significance of each "spoke in the wind rose diagram?
11. Where do we use wind roses as one of the preliminary steps taken in modern times?
12. Who used climographs scientifically to divide the world into climatic divisions?
13. What is the disadvantage of climographs?
14. Who was the founder of hythergraph?
15. Fill in the blanks with the appropriate words given below
(Ordinates, ascending, plotted, graphic tool)
i) Temperature is.......... along the vertical coordinate.
ii )Wind rose is a........................... used basically by meteorologists
iii)Taylor’s climograph represents wet –bulb temperatures as .................and relative
humidity as abscissae.
iv) In the rainfall dispersion diagrams, first you will have to arrange all the data in
..........order.
17. Explain the changes in the modified form of climographs after Griffith Taylor.
18. In which senseare the words Scorching, Muggy, Keen and Raw used and by whom?
19. Explain dispersion graphs. How do these graphs represent rainfall?
20. What are hythergraphs? What do these types of graphs show?
21. Why is the representation of weather data included as a part of geographical studies?
BA/BSC GE-103 PRACTICAL Uttarakhand Open University
UNIT 7 : WEAT HER INSTRUMENTS Page 100 of Page 159
BLOCK-3 WEATHER MAPS AND INDIAN TOPO-
SHEETS
UNIT 7 : WEATHER INSTRUMENTS
7.1 OBJECTIVES
7.2 INTRODUCTION
7.3 TYPES OF WEATHER INSTRUMENTS
7.3.1 TEMPERATURE MEASURING INSTRUMENTS
7.3.1.1 SIMPLE THERMOMETER
7.3.1.2 MAXIMUM AND MINIMUM THERMOMETER
7.3.2 HUMIDITY MEASURING INSTRUMENTS
7.3.2.1 WET AND DRY BULB THERMOMETER
7.3.3ATMOSPHERIC PRESSURE MEASURING INSTRUMENTS
7.3.3.1 ANEROID BAROMETER
7.3.3.2 FORTIN’S BAROMETER
7.3.4 INSTRUMENTS OF WIND OBSERVATION
7.4.4.1 WIND VANE
7.4.4.2 ANEMOMETER
7.4.5 RAIN MEASURING INSTRUMENTS
7.4.5.1 RAIN GAUGE
7.4 CONCLUSION
7.5 SUMMARY
7.6 GLOSSARY
7.7 ANSWER TO CHECK YOUR PROGRESS
7.8 REFERENCES
7.9 SUGGESTED READINGS
7.10 TERMINAL QUESTIONS
BA/BSC GE-103 PRACTICAL Uttarakhand Open University
UNIT 7 : WEAT HER INSTRUMENTS Page 101 of Page 159
7.1 OBJECTIVES
This part of the study is to note and determine the changes in weather elements like
temperature, air pressure, winds and rainfall. These elements affect the life and conditions of
the people everywhere. Weather, because of its uncertainties has been our concern for many
years. There is a necessity to have the observations of weather phenomena in a systematic
way.
7.2 INTRODUCTION
Weather denotes the atmospheric conditions of weather elements at a particular place
and time. The climate of a place is the overall conditions of temperature, pressure, winds,
humidity, cloudiness and precipitation of a large area or region over a long period of time. All
these are basic weather elements. A change in one weather element will, in turn, change some
or all the others. Hence, on the basis of predominant weather elements weather conditions can
be generalized. For instance, predicting weather a few days in advance may prove very useful
to farmers, aviators, tourists, planners. This, at any rate is not a simple task. To do it
accurately, we require a number of weather instruments devised especially for the purpose.
These help us to take safety measures in advance.
The places, where weather conditions are continuously recorded are called weather
stations. These stations are of three types – surface, upper air and space based observation
stations. These are coordinated by the world meteorological organization (WMO), a
specialized agency of the United Nation, headquarters at Geneva. We are here mainly
concerned with the meteorological instruments of surface observations.
7.3 TYPE OF WEATHER INSTRUMENTS
The prediction of weather is not a simple task. To do it accurately, we require a number
of weather instruments devised especially for the purpose. It is also necessary to know the use
of these instruments. The elements of weather need different type of instruments. The
temperature, air pressure, humidity, clouds, winds and rainfall are main elements and need
the use of specialized weather instruments for accurate recording of weather data at certain
interval.
7.3.1 Temperature Measuring Instruments
The knowledge of the temperature of freely moving air is the primary concern of
weatherman, because it is responsible for a variety of weather changes. The instruments
designed to measure accurately the changes in temperature is called a thermometer which
literally means ‘heat measurer’. These are categorized into following types:-
(i) The simple Thermometer
(ii) Maximum and Minimum Thermometer
(iii) Thermograph
BA/BSC GE-103 PRACTICAL Uttarakhand Open University
UNIT 7 : WEAT HER INSTRUMENTS Page 102 of Page 159
7.3.1.1 The Simple Thermometer
The design of a thermometer is based on the fact that any substance, whether solid,
liquid or gas expands when heated are expanded in a particular manner. Generally, liquids are
preferred. Liquid thermometers are smaller and easier to read and handle. It is a most
common type. Mercury or alcohol is used as a thermometric liquid in standard thermometers.
When the mercury heated, it expands more than the glass, and when cooled, it contracts more
than the glass.
Temperature is indicated in degrees of Celsius and Fahrenheit. These are the two type
of scales named after two scientists, who devised them. Fahrenheit scale was devised by
Danial Fahrenheit in 1714. He was German physicist. The Celsius scale was devised by
Anders Celsius in 1742. He was an Swedish Astrologist. This scale is mainly used in those
countries, which have metric system. In our country, we use mainly the Celsius scale. In
Celsius thermometer, the temperature of melting ice is marked 0oC and that of boiling water
100C, and the interval between the two is divided into 100 equal parts. On the Fahrenheit
thermometer, the freezing and boiling points of water are graduated as 32F and 212F,
respectively and the interval between them is divided into 180 equal parts. Therefore, one
Celsius degree is equivalent to 1.8 Fahrenheit degrees. The following formula is used for the
conversion from one scale to another:-
From Celsius to Fahrenheit
100
C
180
32 - For 32
5
9CF
From Fahrenheit to Celsius
180
32 - F
100
Cor
5
32-FC
Example:
The normal temperature of the human body is 40C. Convert it into Fahrenheit:-
100
C
180
32 - F
100
40
180
32 - F
32100
180 40F
F = 72 + 32 = 104
The normal Temperature of the human body is 104F, convert it into
centigrade:
180
32 - F
100
C
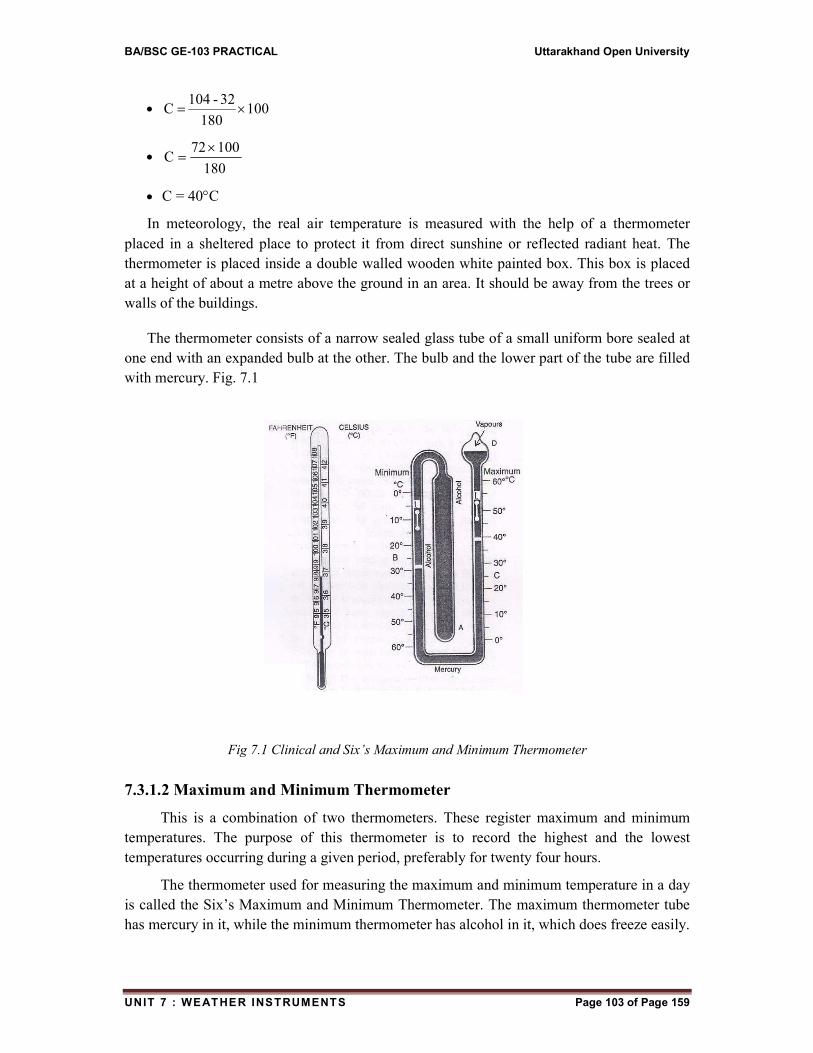
BA/BSC GE-103 PRACTICAL Uttarakhand Open University
UNIT 7 : WEAT HER INSTRUMENTS Page 103 of Page 159
100180
32 - 104 C
180
10072 C
C = 40C
In meteorology, the real air temperature is measured with the help of a thermometer
placed in a sheltered place to protect it from direct sunshine or reflected radiant heat. The
thermometer is placed inside a double walled wooden white painted box. This box is placed
at a height of about a metre above the ground in an area. It should be away from the trees or
walls of the buildings.
The thermometer consists of a narrow sealed glass tube of a small uniform bore sealed at
one end with an expanded bulb at the other. The bulb and the lower part of the tube are filled
with mercury. Fig. 7.1
Fig 7.1 Clinical and Six’s Maximum and Minimum Thermometer
7.3.1.2 Maximum and Minimum Thermometer
This is a combination of two thermometers. These register maximum and minimum
temperatures. The purpose of this thermometer is to record the highest and the lowest
temperatures occurring during a given period, preferably for twenty four hours.
The thermometer used for measuring the maximum and minimum temperature in a day
is called the Six’s Maximum and Minimum Thermometer. The maximum thermometer tube
has mercury in it, while the minimum thermometer has alcohol in it, which does freeze easily.

BA/BSC GE-103 PRACTICAL Uttarakhand Open University
UNIT 7 : WEAT HER INSTRUMENTS Page 104 of Page 159
This thermometer consists of a cylindrical glass bulb A connected to a U-shaped tube.
B.C., which terminates in another bulb D as shown in Fig. 7.1. The lower part of BC contains
mercury. The parts of the limbs B and C above the mercury surface and the bulbs A and D
contain alcohol. This alcohol is known as thermometer liquid.
Above the mercury surface in each limb, there are two steel indices I1 and I2, each
provided with a spring arrangement which keeps them pressed to the sides of the tube. To set
the thermometric, each index is moved up or down the tube by a small horse-shoe-shaped
magnet. This magnet brings I1 and I2 indices in contact with the mercury. This situation is
defined as the setting of the thermometer. This shows that the thermometer now can be used
for the reading.
Both limbs of B and C are graduated with the values of Celsius and Fahrenheit scales.
The left limb A registers the minimum temperature with the scale of graduation running
downwards from top. The right limb registers the maximum temperature with the graduations
running upwards from the bottom. It means the value of scale decreases from bottom to top in
minimum tube, while the value of scale increases from bottom to top in maximum tube.
The alcohol in the bulb ‘A’ expands with the rise in temperature, and it pushed down
the mercury surface B. Naturally mercury rises in the limb ‘C’, and it pushes up the index I2
when temperature falls the mercury level in C falls. In this situation the index I2 remains at
the same position. It doesn’t come down. This results in the rise of mercury in B limb, and
the index I1 is pushed up until the temperature ceases to fall. Hence, the readings against the
lower ends of the indices I1 and I2 give the minimum and maximum temperatures,
respectively, reached during the period of observation.
After noting the readings of maximum and minimum temperatures, for the given
period, generally for the last 24 hours, which is usually one date or day, the thermometer is
again set-up with the help of the magnet. Both the indices I1 and I2 are brought again in
contact with the mercury levels in both the limbs. It is practicised again to record both the
temperatures of the following day. The readings of both the temperatures give us with the
average and range of temperatures of the day.
Example : Suppose, a place has recorded 10C as the minimum, and 40C as the maximum
temperature in that the case the:
Average Temperature of the day is :2
Minimum Maximum
Here, C252
C50
2
C10 C40
The total of both the temperatures is divided by 2, as it has an addition or total of two
temperatures.
Range of Temperature of the day : Maximum – Minimum
Here : 40C – 10C = 30C
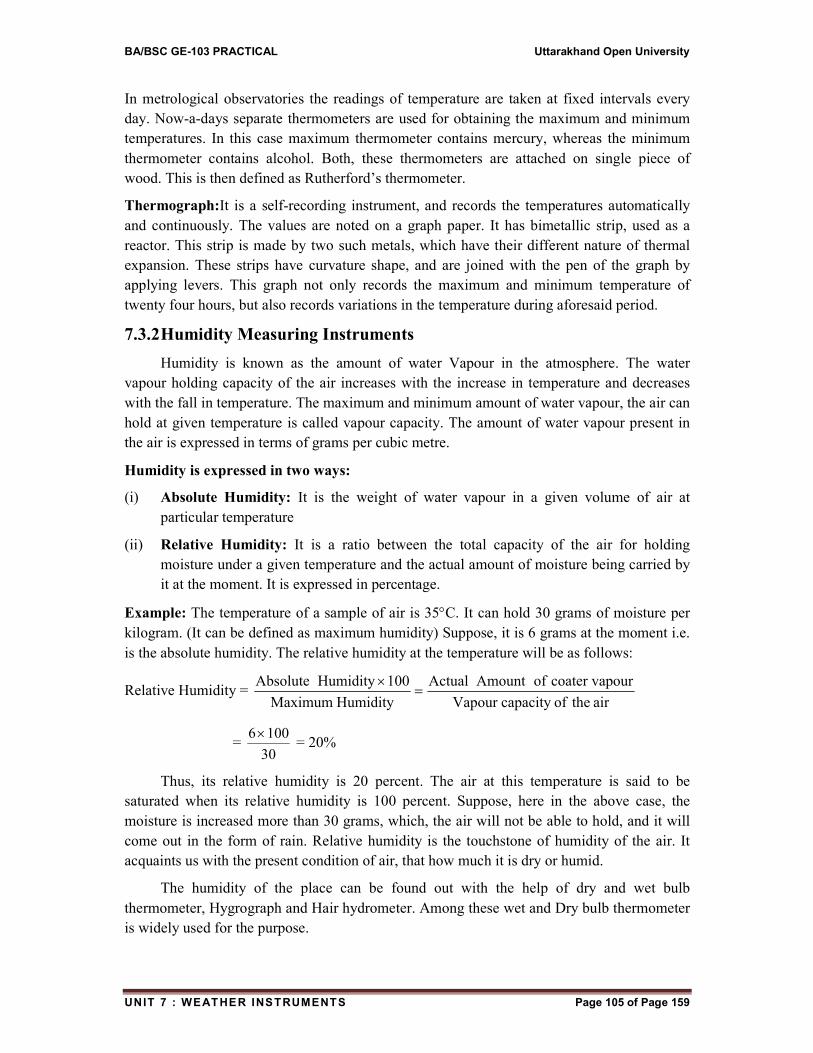
BA/BSC GE-103 PRACTICAL Uttarakhand Open University
UNIT 7 : WEAT HER INSTRUMENTS Page 105 of Page 159
In metrological observatories the readings of temperature are taken at fixed intervals every
day. Now-a-days separate thermometers are used for obtaining the maximum and minimum
temperatures. In this case maximum thermometer contains mercury, whereas the minimum
thermometer contains alcohol. Both, these thermometers are attached on single piece of
wood. This is then defined as Rutherford’s thermometer.
Thermograph:It is a self-recording instrument, and records the temperatures automatically
and continuously. The values are noted on a graph paper. It has bimetallic strip, used as a
reactor. This strip is made by two such metals, which have their different nature of thermal
expansion. These strips have curvature shape, and are joined with the pen of the graph by
applying levers. This graph not only records the maximum and minimum temperature of
twenty four hours, but also records variations in the temperature during aforesaid period.
7.3.2 Humidity Measuring Instruments
Humidity is known as the amount of water Vapour in the atmosphere. The water
vapour holding capacity of the air increases with the increase in temperature and decreases
with the fall in temperature. The maximum and minimum amount of water vapour, the air can
hold at given temperature is called vapour capacity. The amount of water vapour present in
the air is expressed in terms of grams per cubic metre.
Humidity is expressed in two ways:
(i) Absolute Humidity: It is the weight of water vapour in a given volume of air at
particular temperature
(ii) Relative Humidity: It is a ratio between the total capacity of the air for holding
moisture under a given temperature and the actual amount of moisture being carried by
it at the moment. It is expressed in percentage.
Example: The temperature of a sample of air is 35C. It can hold 30 grams of moisture per
kilogram. (It can be defined as maximum humidity) Suppose, it is 6 grams at the moment i.e.
is the absolute humidity. The relative humidity at the temperature will be as follows:
Relative Humidity = air theofcapacity Vapour
ourcoater vap ofAmount Actual
Humidity Maximum
100 Humidity Absolute
= 30
100 6 = 20%
Thus, its relative humidity is 20 percent. The air at this temperature is said to be
saturated when its relative humidity is 100 percent. Suppose, here in the above case, the
moisture is increased more than 30 grams, which, the air will not be able to hold, and it will
come out in the form of rain. Relative humidity is the touchstone of humidity of the air. It
acquaints us with the present condition of air, that how much it is dry or humid.
The humidity of the place can be found out with the help of dry and wet bulb
thermometer, Hygrograph and Hair hydrometer. Among these wet and Dry bulb thermometer
is widely used for the purpose.
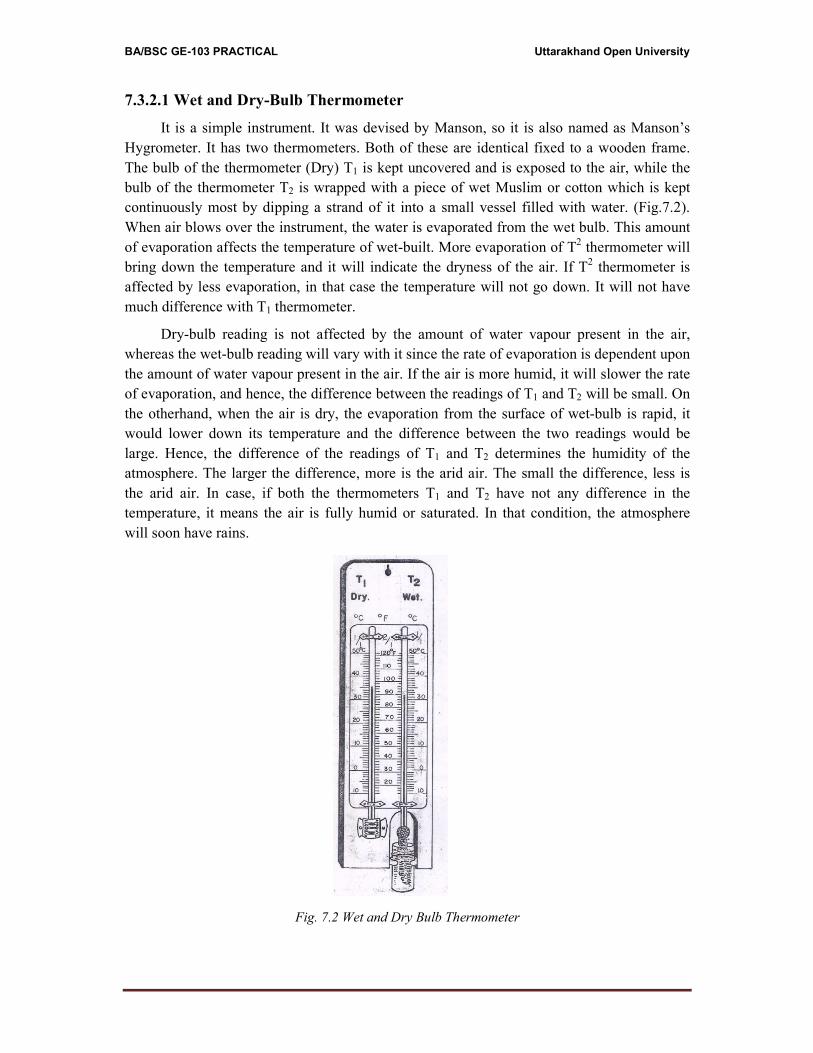
BA/BSC GE-103 PRACTICAL Uttarakhand Open University
7.3.2.1 Wet and Dry-Bulb Thermometer
It is a simple instrument. It was devised by Manson, so it is also named as Manson’s
Hygrometer. It has two thermometers. Both of these are identical fixed to a wooden frame.
The bulb of the thermometer (Dry) T1 is kept uncovered and is exposed to the air, while the
bulb of the thermometer T2 is wrapped with a piece of wet Muslim or cotton which is kept
continuously most by dipping a strand of it into a small vessel filled with water. (Fig.7.2).
When air blows over the instrument, the water is evaporated from the wet bulb. This amount
of evaporation affects the temperature of wet-built. More evaporation of T2 thermometer will
bring down the temperature and it will indicate the dryness of the air. If T2 thermometer is
affected by less evaporation, in that case the temperature will not go down. It will not have
much difference with T1 thermometer.
Dry-bulb reading is not affected by the amount of water vapour present in the air,
whereas the wet-bulb reading will vary with it since the rate of evaporation is dependent upon
the amount of water vapour present in the air. If the air is more humid, it will slower the rate
of evaporation, and hence, the difference between the readings of T1 and T2 will be small. On
the otherhand, when the air is dry, the evaporation from the surface of wet-bulb is rapid, it
would lower down its temperature and the difference between the two readings would be
large. Hence, the difference of the readings of T1 and T2 determines the humidity of the
atmosphere. The larger the difference, more is the arid air. The small the difference, less is
the arid air. In case, if both the thermometers T1 and T2 have not any difference in the
temperature, it means the air is fully humid or saturated. In that condition, the atmosphere
will soon have rains.
Fig. 7.2 Wet and Dry Bulb Thermometer
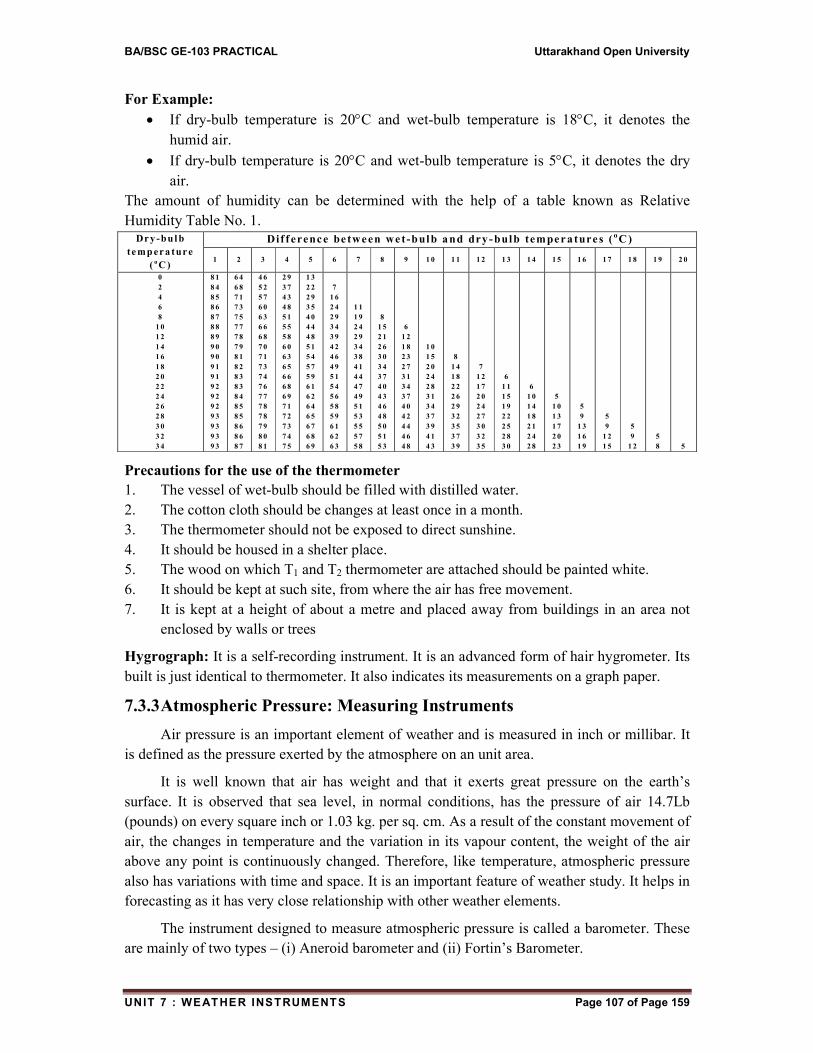
BA/BSC GE-103 PRACTICAL Uttarakhand Open University
UNIT 7 : WEAT HER INSTRUMENTS Page 107 of Page 159
For Example:
If dry-bulb temperature is 20C and wet-bulb temperature is 18C, it denotes the
humid air.
If dry-bulb temperature is 20C and wet-bulb temperature is 5C, it denotes the dry
air.
The amount of humidity can be determined with the help of a table known as Relative
Humidity Table No. 1. Dr y -bu l b
te mp er a tur e
( o C )
Dif f erence be tween wet-bulb and dry -bulb temperatures ( o C )
1 2 3 4 5 6 7 8 9 1 0 1 1 1 2 1 3 1 4 1 5 1 6 1 7 1 8 1 9 2 0
0
2
4
6
8
1 0
1 2
1 4
1 6
1 8
2 0
2 2
2 4
2 6
2 8
3 0
3 2
3 4
8 1
8 4
8 5
8 6
8 7
8 8
8 9
9 0
9 0
9 1
9 1
9 2
9 2
9 2
9 3
9 3
9 3
9 3
6 4
6 8
7 1
7 3
7 5
7 7
7 8
7 9
8 1
8 2
8 3
8 3
8 4
8 5
8 5
8 6
8 6
8 7
4 6
5 2
5 7
6 0
6 3
6 6
6 8
7 0
7 1
7 3
7 4
7 6
7 7
7 8
7 8
7 9
8 0
8 1
2 9
3 7
4 3
4 8
5 1
5 5
5 8
6 0
6 3
6 5
6 6
6 8
6 9
7 1
7 2
7 3
7 4
7 5
1 3
2 2
2 9
3 5
4 0
4 4
4 8
5 1
5 4
5 7
5 9
6 1
6 2
6 4
6 5
6 7
6 8
6 9
7
1 6
2 4
2 9
3 4
3 9
4 2
4 6
4 9
5 1
5 4
5 6
5 8
5 9
6 1
6 2
6 3
1 1
1 9
2 4
2 9
3 4
3 8
4 1
4 4
4 7
4 9
5 1
5 3
5 5
5 7
5 8
8
1 5
2 1
2 6
3 0
3 4
3 7
4 0
4 3
4 6
4 8
5 0
5 1
5 3
6
1 2
1 8
2 3
2 7
3 1
3 4
3 7
4 0
4 2
4 4
4 6
4 8
1 0
1 5
2 0
2 4
2 8
3 1
3 4
3 7
3 9
4 1
4 3
8
1 4
1 8
2 2
2 6
2 9
3 2
3 5
3 7
3 9
7
1 2
1 7
2 0
2 4
2 7
3 0
3 2
3 5
6
1 1
1 5
1 9
2 2
2 5
2 8
3 0
6
1 0
1 4
1 8
2 1
2 4
2 8
5
1 0
1 3
1 7
2 0
2 3
5
9
1 3
1 6
1 9
5
9
1 2
1 5
5
9
1 2
5
8
5
Precautions for the use of the thermometer
1. The vessel of wet-bulb should be filled with distilled water.
2. The cotton cloth should be changes at least once in a month.
3. The thermometer should not be exposed to direct sunshine.
4. It should be housed in a shelter place.
5. The wood on which T1 and T2 thermometer are attached should be painted white.
6. It should be kept at such site, from where the air has free movement.
7. It is kept at a height of about a metre and placed away from buildings in an area not
enclosed by walls or trees
Hygrograph: It is a self-recording instrument. It is an advanced form of hair hygrometer. Its
built is just identical to thermometer. It also indicates its measurements on a graph paper.
7.3.3 Atmospheric Pressure: Measuring Instruments
Air pressure is an important element of weather and is measured in inch or millibar. It
is defined as the pressure exerted by the atmosphere on an unit area.
It is well known that air has weight and that it exerts great pressure on the earth’s
surface. It is observed that sea level, in normal conditions, has the pressure of air 14.7Lb
(pounds) on every square inch or 1.03 kg. per sq. cm. As a result of the constant movement of
air, the changes in temperature and the variation in its vapour content, the weight of the air
above any point is continuously changed. Therefore, like temperature, atmospheric pressure
also has variations with time and space. It is an important feature of weather study. It helps in
forecasting as it has very close relationship with other weather elements.
The instrument designed to measure atmospheric pressure is called a barometer. These
are mainly of two types – (i) Aneroid barometer and (ii) Fortin’s Barometer.
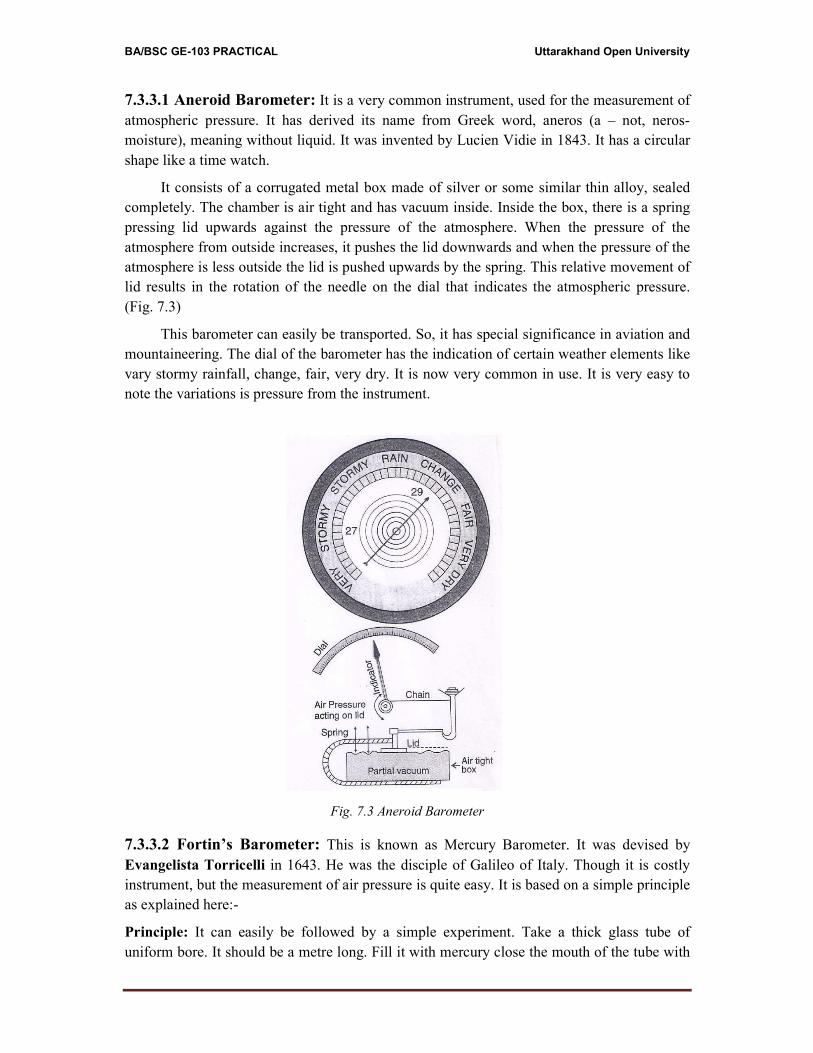
BA/BSC GE-103 PRACTICAL Uttarakhand Open University
7.3.3.1 Aneroid Barometer: It is a very common instrument, used for the measurement of
atmospheric pressure. It has derived its name from Greek word, aneros (a – not, neros-
moisture), meaning without liquid. It was invented by Lucien Vidie in 1843. It has a circular
shape like a time watch.
It consists of a corrugated metal box made of silver or some similar thin alloy, sealed
completely. The chamber is air tight and has vacuum inside. Inside the box, there is a spring
pressing lid upwards against the pressure of the atmosphere. When the pressure of the
atmosphere from outside increases, it pushes the lid downwards and when the pressure of the
atmosphere is less outside the lid is pushed upwards by the spring. This relative movement of
lid results in the rotation of the needle on the dial that indicates the atmospheric pressure.
(Fig. 7.3)
This barometer can easily be transported. So, it has special significance in aviation and
mountaineering. The dial of the barometer has the indication of certain weather elements like
vary stormy rainfall, change, fair, very dry. It is now very common in use. It is very easy to
note the variations is pressure from the instrument.
Fig. 7.3 Aneroid Barometer
7.3.3.2 Fortin’s Barometer: This is known as Mercury Barometer. It was devised by
Evangelista Torricelli in 1643. He was the disciple of Galileo of Italy. Though it is costly
instrument, but the measurement of air pressure is quite easy. It is based on a simple principle
as explained here:-
Principle: It can easily be followed by a simple experiment. Take a thick glass tube of
uniform bore. It should be a metre long. Fill it with mercury close the mouth of the tube with
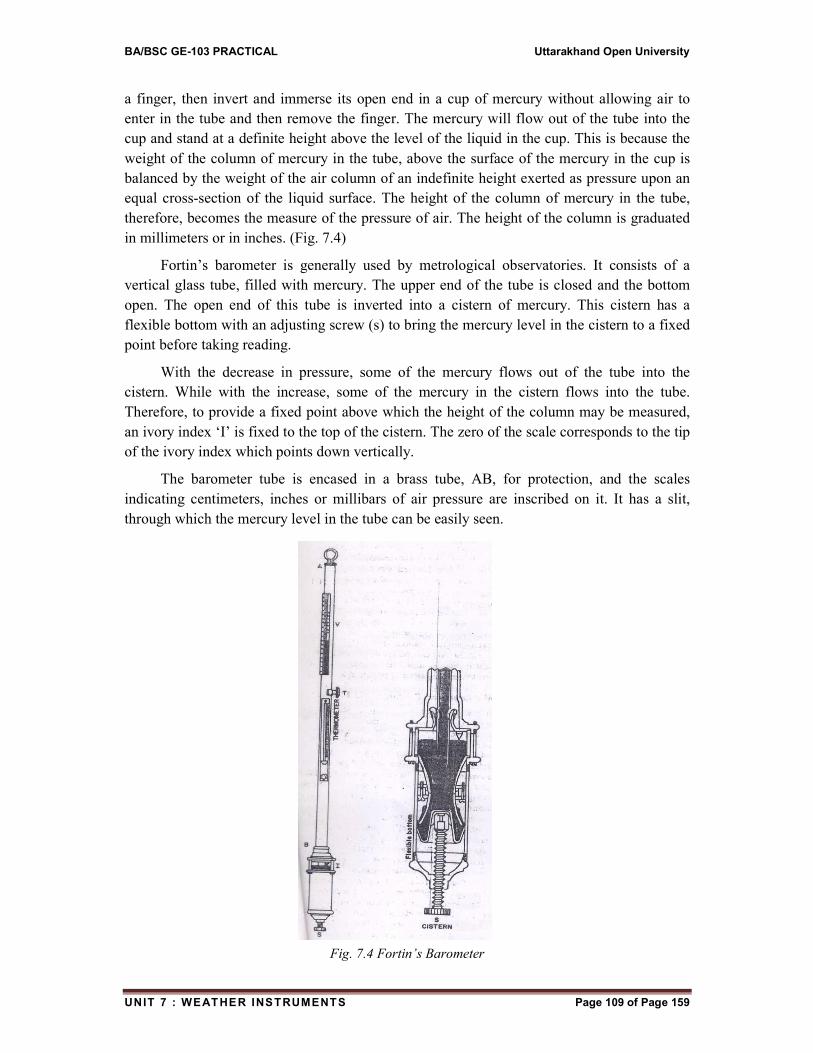
BA/BSC GE-103 PRACTICAL Uttarakhand Open University
UNIT 7 : WEAT HER INSTRUMENTS Page 109 of Page 159
a finger, then invert and immerse its open end in a cup of mercury without allowing air to
enter in the tube and then remove the finger. The mercury will flow out of the tube into the
cup and stand at a definite height above the level of the liquid in the cup. This is because the
weight of the column of mercury in the tube, above the surface of the mercury in the cup is
balanced by the weight of the air column of an indefinite height exerted as pressure upon an
equal cross-section of the liquid surface. The height of the column of mercury in the tube,
therefore, becomes the measure of the pressure of air. The height of the column is graduated
in millimeters or in inches. (Fig. 7.4)
Fortin’s barometer is generally used by metrological observatories. It consists of a
vertical glass tube, filled with mercury. The upper end of the tube is closed and the bottom
open. The open end of this tube is inverted into a cistern of mercury. This cistern has a
flexible bottom with an adjusting screw (s) to bring the mercury level in the cistern to a fixed
point before taking reading.
With the decrease in pressure, some of the mercury flows out of the tube into the
cistern. While with the increase, some of the mercury in the cistern flows into the tube.
Therefore, to provide a fixed point above which the height of the column may be measured,
an ivory index ‘I’ is fixed to the top of the cistern. The zero of the scale corresponds to the tip
of the ivory index which points down vertically.
The barometer tube is encased in a brass tube, AB, for protection, and the scales
indicating centimeters, inches or millibars of air pressure are inscribed on it. It has a slit,
through which the mercury level in the tube can be easily seen.
Fig. 7.4 Fortin’s Barometer
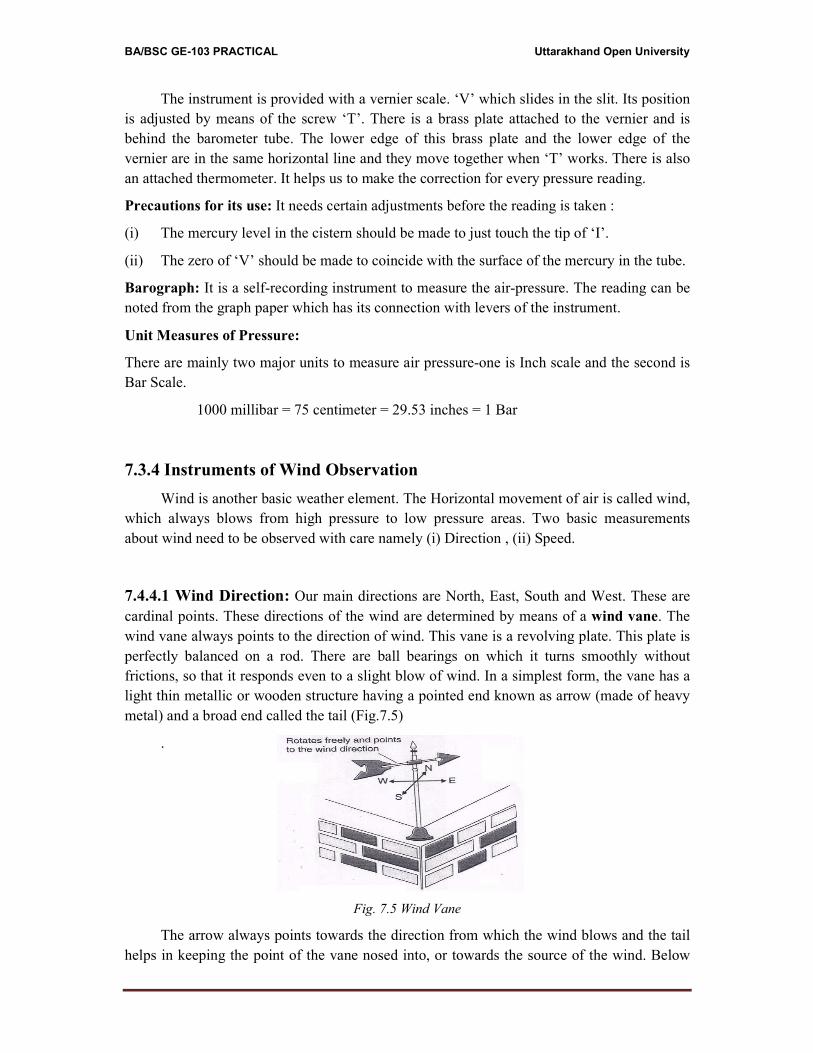
BA/BSC GE-103 PRACTICAL Uttarakhand Open University
The instrument is provided with a vernier scale. ‘V’ which slides in the slit. Its position
is adjusted by means of the screw ‘T’. There is a brass plate attached to the vernier and is
behind the barometer tube. The lower edge of this brass plate and the lower edge of the
vernier are in the same horizontal line and they move together when ‘T’ works. There is also
an attached thermometer. It helps us to make the correction for every pressure reading.
Precautions for its use: It needs certain adjustments before the reading is taken :
(i) The mercury level in the cistern should be made to just touch the tip of ‘I’.
(ii) The zero of ‘V’ should be made to coincide with the surface of the mercury in the tube.
Barograph: It is a self-recording instrument to measure the air-pressure. The reading can be
noted from the graph paper which has its connection with levers of the instrument.
Unit Measures of Pressure:
There are mainly two major units to measure air pressure-one is Inch scale and the second is
Bar Scale.
1000 millibar = 75 centimeter = 29.53 inches = 1 Bar
7.3.4 Instruments of Wind Observation
Wind is another basic weather element. The Horizontal movement of air is called wind,
which always blows from high pressure to low pressure areas. Two basic measurements
about wind need to be observed with care namely (i) Direction , (ii) Speed.
7.4.4.1 Wind Direction: Our main directions are North, East, South and West. These are
cardinal points. These directions of the wind are determined by means of a wind vane. The
wind vane always points to the direction of wind. This vane is a revolving plate. This plate is
perfectly balanced on a rod. There are ball bearings on which it turns smoothly without
frictions, so that it responds even to a slight blow of wind. In a simplest form, the vane has a
light thin metallic or wooden structure having a pointed end known as arrow (made of heavy
metal) and a broad end called the tail (Fig.7.5)
.
Fig. 7.5 Wind Vane
The arrow always points towards the direction from which the wind blows and the tail
helps in keeping the point of the vane nosed into, or towards the source of the wind. Below
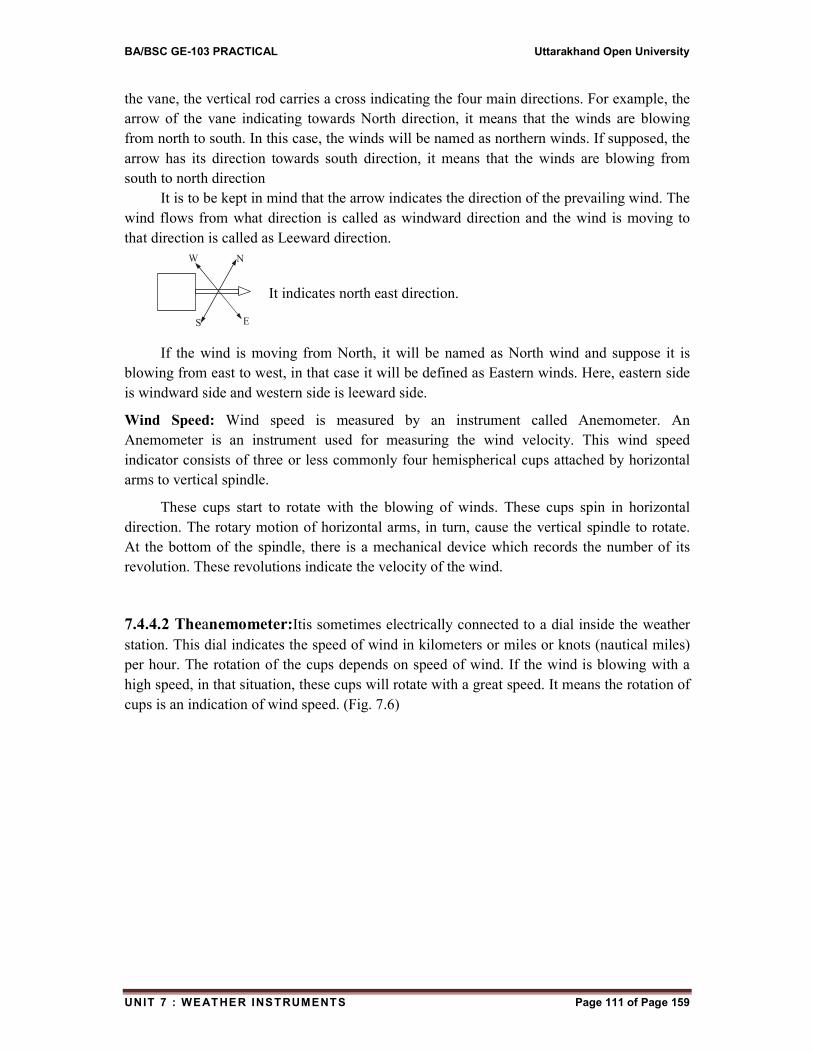
BA/BSC GE-103 PRACTICAL Uttarakhand Open University
UNIT 7 : WEAT HER INSTRUMENTS Page 111 of Page 159
the vane, the vertical rod carries a cross indicating the four main directions. For example, the
arrow of the vane indicating towards North direction, it means that the winds are blowing
from north to south. In this case, the winds will be named as northern winds. If supposed, the
arrow has its direction towards south direction, it means that the winds are blowing from
south to north direction
It is to be kept in mind that the arrow indicates the direction of the prevailing wind. The
wind flows from what direction is called as windward direction and the wind is moving to
that direction is called as Leeward direction.
It indicates north east direction.
If the wind is moving from North, it will be named as North wind and suppose it is
blowing from east to west, in that case it will be defined as Eastern winds. Here, eastern side
is windward side and western side is leeward side.
Wind Speed: Wind speed is measured by an instrument called Anemometer. An
Anemometer is an instrument used for measuring the wind velocity. This wind speed
indicator consists of three or less commonly four hemispherical cups attached by horizontal
arms to vertical spindle.
These cups start to rotate with the blowing of winds. These cups spin in horizontal
direction. The rotary motion of horizontal arms, in turn, cause the vertical spindle to rotate.
At the bottom of the spindle, there is a mechanical device which records the number of its
revolution. These revolutions indicate the velocity of the wind.
7.4.4.2 Theanemometer:Itis sometimes electrically connected to a dial inside the weather
station. This dial indicates the speed of wind in kilometers or miles or knots (nautical miles)
per hour. The rotation of the cups depends on speed of wind. If the wind is blowing with a
high speed, in that situation, these cups will rotate with a great speed. It means the rotation of
cups is an indication of wind speed. (Fig. 7.6)
W N
S E
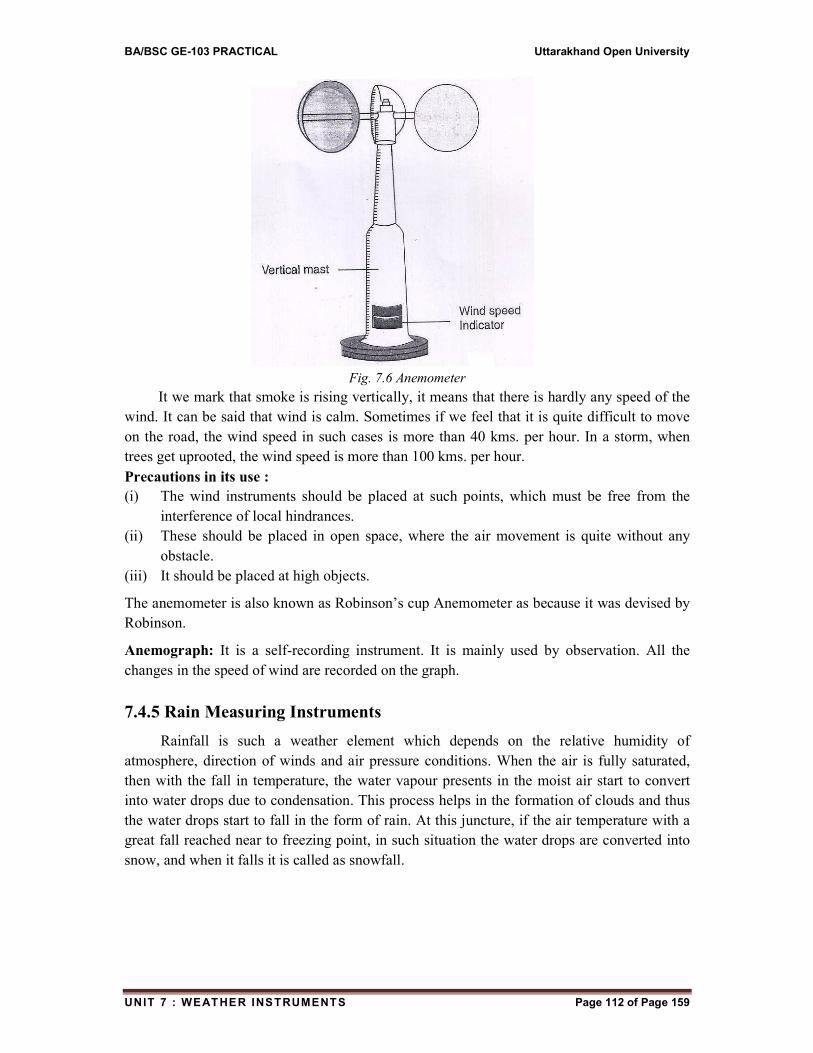
BA/BSC GE-103 PRACTICAL Uttarakhand Open University
UNIT 7 : WEAT HER INSTRUMENTS Page 112 of Page 159
Fig. 7.6 Anemometer
It we mark that smoke is rising vertically, it means that there is hardly any speed of the
wind. It can be said that wind is calm. Sometimes if we feel that it is quite difficult to move
on the road, the wind speed in such cases is more than 40 kms. per hour. In a storm, when
trees get uprooted, the wind speed is more than 100 kms. per hour.
Precautions in its use :
(i) The wind instruments should be placed at such points, which must be free from the
interference of local hindrances.
(ii) These should be placed in open space, where the air movement is quite without any
obstacle.
(iii) It should be placed at high objects.
The anemometer is also known as Robinson’s cup Anemometer as because it was devised by
Robinson.
Anemograph: It is a self-recording instrument. It is mainly used by observation. All the
changes in the speed of wind are recorded on the graph.
7.4.5 Rain Measuring Instruments
Rainfall is such a weather element which depends on the relative humidity of
atmosphere, direction of winds and air pressure conditions. When the air is fully saturated,
then with the fall in temperature, the water vapour presents in the moist air start to convert
into water drops due to condensation. This process helps in the formation of clouds and thus
the water drops start to fall in the form of rain. At this juncture, if the air temperature with a
great fall reached near to freezing point, in such situation the water drops are converted into
snow, and when it falls it is called as snowfall.
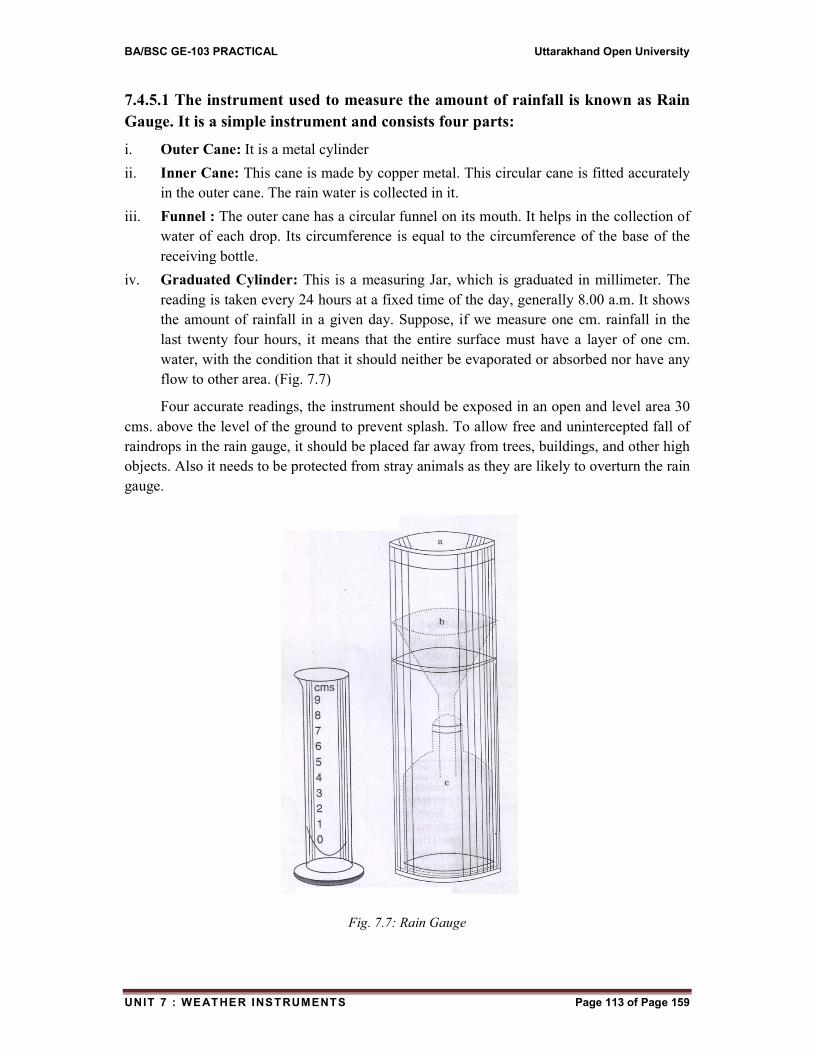
BA/BSC GE-103 PRACTICAL Uttarakhand Open University
UNIT 7 : WEAT HER INSTRUMENTS Page 113 of Page 159
7.4.5.1 The instrument used to measure the amount of rainfall is known as Rain
Gauge. It is a simple instrument and consists four parts:
i. Outer Cane: It is a metal cylinder
ii. Inner Cane: This cane is made by copper metal. This circular cane is fitted accurately
in the outer cane. The rain water is collected in it.
iii. Funnel : The outer cane has a circular funnel on its mouth. It helps in the collection of
water of each drop. Its circumference is equal to the circumference of the base of the
receiving bottle.
iv. Graduated Cylinder: This is a measuring Jar, which is graduated in millimeter. The
reading is taken every 24 hours at a fixed time of the day, generally 8.00 a.m. It shows
the amount of rainfall in a given day. Suppose, if we measure one cm. rainfall in the
last twenty four hours, it means that the entire surface must have a layer of one cm.
water, with the condition that it should neither be evaporated or absorbed nor have any
flow to other area. (Fig. 7.7)
Four accurate readings, the instrument should be exposed in an open and level area 30
cms. above the level of the ground to prevent splash. To allow free and unintercepted fall of
raindrops in the rain gauge, it should be placed far away from trees, buildings, and other high
objects. Also it needs to be protected from stray animals as they are likely to overturn the rain
gauge.
Fig. 7.7: Rain Gauge
BA/BSC GE-103 PRACTICAL Uttarakhand Open University
UNIT 7 : WEAT HER INSTRUMENTS Page 114 of Page 159
7.4 CONCLUSION
It is quite necessary to use various weather instruments for the knowledge of weather
elements. Weather is a changing phenomenon. The change is one element of weather brings
the change in another element. With the help of certain weather instruments such change can
be noted and defined. Their analysis helps us to take safety measures in advance.
7.5 SUMMARY
Temperature, air pressure, amount of rainfall, wind speed and wind direction, presence
of water vapour in air, or dryness of the air, sky conditions, form of precipitation are main
weather elements. Temperature is measured in Fahrenheit and Celsius units. Celsius is the
most common. It has 00C as freezing point and 100C as boiling point. Simple thermometer
is used to measure the temperature of human body, mainly in Fahrenheit. Maximum and
minimum thermometer is used to measure the lowest and highest temperatures of the day. It
acquaints us with the mean, range of temperature of the day. It is of U-shaped and the
temperature is indicated by lower point of steel indices. Thermograph is a self-recording
instrument used mainly by big meteorological observatories.
Humidity denotes the amount of water vapour present in the atmosphere. The air can
hold more water vapour, when it is heated more. It is expressed in the form of absolute,
maximum and relative. Absolute humidity expresses the present water vapour of the air at a
particular temperature. Maximum humidity means the water vapour holding capacity of the
air at that temperature. Relative humidity is the ratio between both the humidity i.e. absolute
and maximum. It is expressed in percentage. If it is 100, it means the air is full saturated or
fully condensed. Dry and wet bulb thermometer is the main instrument to measure this
weather element. The more difference between both the temperatures is an indication of low
humid atmosphere, on the otherhand, the low difference shows that the air is fully saturated.
Hydrograph is a self-recording instrument.
Air pressure is closely related with the temperature. Cold air has heavy weight, and
exerts high pressure. Warm air is light in weight, and reels low pressure. Aneroid Barometer
is most common instrument. It entails weather condition like storm, change, smooth, rainy,
dry and very dry. Fortin’s barometer is a mercury barometer, and is generally used by
metrological laboratories. Air pressure is measured in inches, millimeters and milibars.
Wind direction is examined by wind vane. Its arrow indicates the direction of wind. If it
indicated towards east, it means that eastern winds are blowing. Wind speed is measured by
anemometer. It measures the speed in km. per hour. Anemograph is a self-recording
instrument used by meteorological laboratories.
Rain gauge is used to measure the amount of rainfall. It is a cylindrical shaped
instrument. Rainfall is measured in inches, millimeter and cm. Certain precautions are
necessary for its use.
BA/BSC GE-103 PRACTICAL Uttarakhand Open University
UNIT 7 : WEAT HER INSTRUMENTS Page 115 of Page 159
7.6 GLOSSARY
Anemometer: An instrument meant for measuring wind speed
Aneroid Barometer: A portable instrument, commonly used for measuring
atmospheric pressure.
Barometer: An instrument for measuring atmospheric pressure.
Rain Gauge: An instrument for measuring accurately the amount of
rainfall at a given place over a fixed duration.
Wind Vane: An instrument used for determining wind direction.
Water Vapour: It is the moisture in the atmosphere. It condenses to
form clouds and precipitates in the form of rain and
snow.
Absolute Humidity: It denotes the actual amount of water vapour in the air.
Relative Humidity: It denotes the ratio between the actual amount of water
vapour and the maximum amount of water vapour, the
air can hold at that temperature. It is expressed in
percentage.
Air: Air is a mixture of gases.
Wind: Moving air is known as wind.
Aneroid: Without liquid, a portable instrument used for
measuring atmospheric pressure.
Celsius and Fahrenheit are the units to measure the temperature.
Mean Temperature: It is the average temperature of the day, month or year.
Range of Temperature: Difference between maximum and minimum
thermometer
Humidity: Presence of water vapour in the air
7.7 ANSWER TO CHECK YOUR PROGRESS
1. The direction and wind speed vary greatly because different parts of the earth rotate at
different speeds.
2. Air moves from high pressure areas towards the low pressure areas.
3. The horizontal movements of air near the earth’s surface is known as wind.
4. On a hot day, it feels cool under a fan- because of high temperature, we need cool air.
5. Fog usually disappear soon after sunrise- because of increase in temperature.
6. Dew is usually seen in the morning as because the night temperatures do not fall below
0C
7. Fill in the blanks:
(a) A ___________ is the self-recording instrument that measures air temperature.
BA/BSC GE-103 PRACTICAL Uttarakhand Open University
UNIT 7 : WEAT HER INSTRUMENTS Page 116 of Page 159
(b) Aneroid barometer is an instrument that measures air _____________
(c) Atmospheric Pressure is measured in _______________
(d) A wet and dry bulb thermometer is also known as _____________
(e) Celsius scale is the same as _______________ scale.
(f) It is the passage of air _______________ that makes the weather so variable.
(g) The small difference between dry and wet bulb thermometer readings indicate
_______________
(h) If no difference between the temperature of both the thermometer indicate.
(a) Thermograph (b) Air Pressure (c) Millibar or inch
(d) Hygrometer (e) Centigrade (f) Mass
(g) High humidity (h) Air is saturated
8. Match various elements of weather given in column a with the units in which they are
measured in column B
Column ‘A’ Column ‘B’
1. Atmospheric Pressure a. Kilometers per hour
2. Wind Speed b. Millibars
3. Relative humidity c. Degree of Celsius
4. Rainfall d. Degree of Faherenite
5. Temperature e. Percent
6. Human body temperature f. Centimeters
1 (b), 2(a), 3(e), 4(f), 5(c), 6 (d)
9. Make correct pairs of the name of instruments in columns A and their uses in Column
B.
Column ‘A’ Column ‘B’
1. Wet and Dry-bulb thermometer a. to find out wind speed
2. Rain Gauge b. to find out wind direction
3. Six thermometer c. to measure precipitation
4. Aneroid barometer d. to find out humidity
5. Wind vane e. to measure atmosphericpressure
6. Anemometer f. to find out the maximum and minimum
temperature of airfor a given period
1 (d), 2(c), 3(f), 4(e), 5(b), 6 (a)
7.8 REFERENCES
1. Bhat, L.S.: Aslam Mahmood: Field work Laboratory Techniques in Geography– A
practical Geography Text Book NCERT. New Delhi, 2009
2. D. Helen: A to Z Social Sciences: Flaming Books (Export) New Delhi, 2003
3. Gaur, KripaShanker: Manchitra Kala kiSameeksha: Agra Book Store, Agra, 1968
BA/BSC GE-103 PRACTICAL Uttarakhand Open University
UNIT 7 : WEAT HER INSTRUMENTS Page 117 of Page 159
4. Monkhouse, F.J. & H.R. Wilkinson: Maps and Diagrams, University Paper Backs,
Methuen, London, 1966.
5. Rajan, Rita: A text book of Geography-IX- General Printers & Publishers, Mumbai,
2003.
6. Singh, R.,B.: Practical work in Geography Pt. 3, NCERT, New Delhi 2002.
7. Sharma, J.P. :PrayogikBhugol : Rastogi Publication, Meerut, 2015.
8. Singh, R.L.: Elements of practical Geography, Students Friends, Allahabad 1966.
7.9 SUGGESTED READINGS
1. Bhat, L.S.: Aslam Mahmood: Field work Laboratory Techniques in Geography– A
practical Geography Text Book NCERT. New Delhi, 2009
2. D. Helen: A to Z Social Sciences: Flaming Books (Export) New Delhi, 2003.
3. Gaur, KripaShanker: Manchitra Kala kiSameeksha: Agra Book Store, Agra, 1968
4. Monkhouse, F.J. & H.R. Wilkinson: Maps and Diagrams, University Paper Backs,
Methuen, London, 1966.
5. Rajan, Rita: A text book of Geography-IX- General Printers & Publishers, Mumbai,
2003.
6. Singh, R.,B.: Practical work in Geography Pt. 3, NCERT, New Delhi 2002.
7. Sharma, J.P. :PrayogikBhugol : Rastogi Publication, Meerut, 2015.
8. Singh, R.L.: Elements of practical Geography, Students Friends, Allahabad 1966.
7.10 TERMINAL QUESTIONS
1. Define thermometer.
2. Define daily range of temperature.
3. What do you mean by atmospheric pressure? How is it measured?
4. What is the relation between temperature and pressure.
5. What is temperature? How is it measured?
6. Distinguish between-
(a) Absolute and Relative humidity
(b) Weather and climate
(c) Mist and fog
(d) Condensation and precipitation
7. What do you mean by wind vane?
8. How can humidity be expressed?
9. Define Rain- Gauge.
10. Define weather. Why should we study it?
11. Explain briefly or define the following terms-
BA/BSC GE-103 PRACTICAL Uttarakhand Open University
UNIT 7 : WEAT HER INSTRUMENTS Page 118 of Page 159
(a) Evaporation (b) Condensation (c) Precipitation
12. Give the name of six important weather instruments needed by you to record the data of
all-weather elements.
13. What are the precautions to be taken in placing a rain gauge?
14. What are the precautions to be taken for the use of dry and wet-bulb thermometer?
15. Discuss the utility of aneroid barometer. What conditions of weather are indicated by
it?
16. Explain the functioning of Fortin’s barometer.
17. Which instrument is used to determine the direction of wind? Also explain the main
directions.
18. Wind velocity is measured by which instrument? Explain.
19. How the rain is measured? Explain in detail.
20. How can you convert the Fahrenheit scale into Celsius scale? Discuss it with an
example.
BA/BSC GE-103 PRACTICAL Uttarakhand Open University
UNIT 8 : INTERPRETATION OF INDIAN WEAT HER MAPS Page 119 of Page 159
UNIT 8 : INTERPRETATION OF INDIAN
WEATHER MAPS
8.1 Objectives
8.2 Introduction
8.3 Interpretation of Indian weather maps
8.4 Conclusion
8.5 Summary
8.6 Glossary
8.7 Answer to check your progress
8.8 References
8.9 Suggested readings
8.10 Terminal Questions
BA/BSC GE-103 PRACTICAL Uttarakhand Open University
UNIT 8 : INTERPRETATION OF INDIAN WEAT HER MAPS Page 120 of Page 159
8.1 OBJECTIVES
Weather and climate are subject of universal interest and they affect the life and
conditions of people everywhere. The uncertainties of weather have been our concern for
many years. These days, the changes in climate and issues of global warming are great
concerns to us. Hence, it becomes necessary to acquaint ourselves with the changes in
weather phenomena. It is possible only to have a systematic knowledge of weather map of an
area. These maps give full information of all weather phenomena through which it is possible
to predict more accurately the conditions of weather for a day, weeks, months or season.
Forecast of monsoon, cyclonic storm, western disturbance, dust storm, snowfall are possible
with the detailed analysis of day to day weather maps.
8.2 INTRODUCTION
Weather denotes the conditions of the atmosphere at a given place and time with
respect to temperature, atmospheric pressure, humidity, precipitation, cloudiness and
direction and velocity of winds. All these factors are known as weather elements. A change in
one weather element will, in turn, change some or all the others. On the basis of predominant
weather element weather conditions can be generalized by referring to them as rainy, sultry,
cloudy, windy or sunny.
Weather forecasts help us to take safety measures in advance. The farmer can make
more advantages of such weather predictions. Prediction of weather only a few hours a head
may facilitate safe air flights. These are also very useful for navigators, fishermen, defence
personnel, horticulturists; people connected with natural disasters and also the general public.
It is for the benefit of all these people that weather bulletins are broadcast every day. This at
any rate is not a simple test. To do it accurately the weatherman requires firstly the
knowledge of weather instruments, devised especially for this purpose. The weather
information thus collected; help us in the preparation of weather map of an area.
8.3 INTERPRETATION OF INDIAN WEATHER MAP
A weather map of the world or India shows the weather conditions of a stated time
numerically or with the help of approved and listed metrological symbols. The need of
weather maps was felt most by sailors for navigation purposes. In 1688 Edmund Halley
published a weather map showing the trade winds and direction of prevailing monsoon. This
map was rather a typical weather map as it recorded the weather condition over a period of
time. Thus, it was necessary to develop such system, that within no time, the latest
meteorological changes may be recorded and collected by the meteorological observatory.
The need of starting a Meteorological Service in India was first brought to the notice to
the Government of India by the Asiatic Society of Bengal. The service was started by the
Government in 1864 with headquarters at Shimla. After the first world war of 1914-18, this
BA/BSC GE-103 PRACTICAL Uttarakhand Open University
UNIT 8 : INTERPRETATION OF INDIAN WEAT HER MAPS Page 121 of Page 159
Department was expanded and the central office was shifted to Pune. The Indian Daily
Weather Reports are published every day from this city.
In India there are more than 350 observing stations grouped into five categories:
(i) Class I: observatories are equipped with self-recording instruments and transmit data to
the central observatory at Pune twice a day.
(ii) Class II: These are equipped with eye reading instruments. These telegraph weather
messages twice daily.
(iii) Class III: These observatories send their observations to the forecasting centres only
once a day.
(iv) ClassIV: These observatories record the data of temperature and rainfall and do not
send massages daily.
(v) Class V: These observatories record the amount of rainfall once. They send the data at
8.00 a.m. daily. This amount indicates rainfall for the last twenty four hours, daily, if it
is occurred.
Meteorological Observations
There are types of observatories by three means at Global level. These are follows.
These function in coordination of WMO.
(i) Surface Observatories: These observatories are distributed all over the country and
take observations according to globally coordinated time and spacing. They record
elements like radiation, Ozone, atmospheric trace gases, pollution and atmospheric
electricity.
(ii) Upper Air Observatories- These are large in number, and are scattered around the
globe. They have balloon borne instruments for sensing different weather elements.
Rockets are also used. They have radiosonde contain sensors. They use wireless
massages and data for the analysis at the ground stations.
(iii) Space Based Platforms or Observatories- These are new powerful tool. They collect
the information from artificial satellites. These are mainly geo-stationary satellites. In
India INSAT and Meterosats are providing valuable observations of temperature, cloud
cover, winds, cyclonic storm and other elements. These platforms take observation
once a day over an area.
All the observation made by above means are used by our Central Meteorological
station of Pune. A weather map of India is daily prepared and printed to depict various
weather elements. Data is also collected on the ships playing on the India seas. We also
collect information from weather observatories in Antarctica.
On the basis of all these meteorological observatories, Indian Meteorological
Department of Pune publishes Indian Daily Weather Report two times in a day i.e. 8.30 a.m.
and 5.00 P.m. (IST). This Report contains six pages. The first page has the description of the
BA/BSC GE-103 PRACTICAL Uttarakhand Open University
UNIT 8 : INTERPRETATION OF INDIAN WEAT HER MAPS Page 122 of Page 159
data of observation, and day, time 8.30 morning, brief summary of weather observation,
forecast of weather for next two or three days and seismic Report. The lower side of this page
has those Weather information observed by various ships with their location in Bay of Bengal
and Arabian Sea.
Page No. 2, 3, 5 and 6 of this Report have a long table, which is composed in 23
columns, which give details the observation of our 210 meteorological observatories in code
language. The first column has the name of the observation station. The columns 2 to 8 have
the description of observations 5.30 p.m. of previous day. Ninth and tenth columns give the
details of the present day observations of 8.30 a.m. The remaining columns have the details
of the observation of last 24 hours, regarding to maximum temperature, minimum
temperature, departure of temperature from the normal, amount of rainfall received during
last 24 hours, total rainfall of the season. Departure from normal rainfall, normal annual
rainfall.
The page no. four has one big size map of Indiaalongwith two small maps in the lower
part of the paper. This large map has the details of isobars, and different weather conditions
with the help of symbols and codes. The small maps show the departure of maximum and
minimum temperature from the normal.
Reading a Weather Map
Before proceeding to read the Indian Daily Weather Map one should get familiar with
the various symbols used on such maps. The following points are to be described while
reading the Weather map:
(i) Introductory Information.
(ii) Air Pressure: (a) Location of high bar, (b) location of low bar, (c) trend of isobars, (d)
gradient of air-pressure.
(iii) Wind: (a) direction, (b) velocity.
(iv) Skycondition: (a) Cloud cover, (b) nature of the cloud, (c) other atmospheric
phenomena.
(v) Precipitation: (a) general distribution, (b) special area of heavy precipitation, (c)
amount of rainfall.
(vi) Sea- Conditions.
(vii) Departure of air pressure from normal.
(viii) Departure of temperature from normal.
1. Introductory Information:The preliminary information of weather report is date, day
and time. the report is of which date and day, firstly it should be noted. The weather
conditions are shown for time- (i) 830 HRS IST- 3.00 GMT (ii) 1730 HRS IST (1200
HRS GMT). The year is mentioned with Hindu SakSamvat.
2. Air Pressure:It is shown with the help of isobars. These lines join the places having
equal pressure. Their interval is of 2 millibar. The value of each isobar is given on the
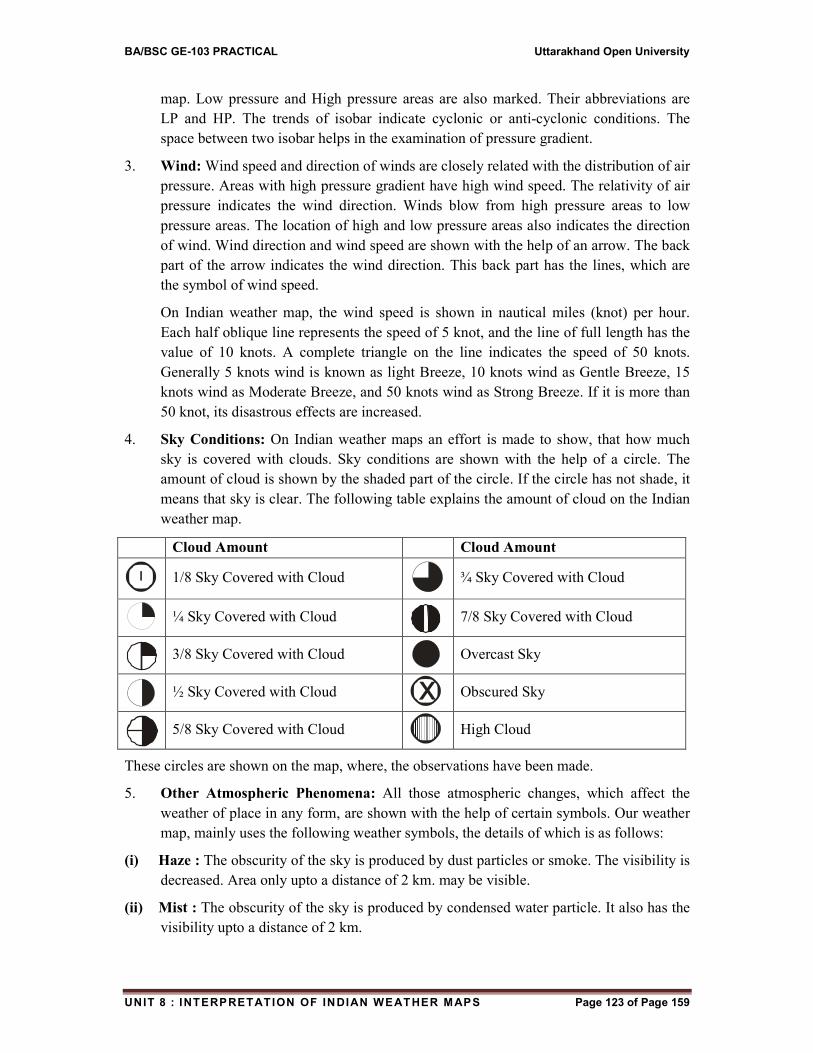
BA/BSC GE-103 PRACTICAL Uttarakhand Open University
UNIT 8 : INTERPRETATION OF INDIAN WEAT HER MAPS Page 123 of Page 159
map. Low pressure and High pressure areas are also marked. Their abbreviations are
LP and HP. The trends of isobar indicate cyclonic or anti-cyclonic conditions. The
space between two isobar helps in the examination of pressure gradient.
3. Wind: Wind speed and direction of winds are closely related with the distribution of air
pressure. Areas with high pressure gradient have high wind speed. The relativity of air
pressure indicates the wind direction. Winds blow from high pressure areas to low
pressure areas. The location of high and low pressure areas also indicates the direction
of wind. Wind direction and wind speed are shown with the help of an arrow. The back
part of the arrow indicates the wind direction. This back part has the lines, which are
the symbol of wind speed.
On Indian weather map, the wind speed is shown in nautical miles (knot) per hour.
Each half oblique line represents the speed of 5 knot, and the line of full length has the
value of 10 knots. A complete triangle on the line indicates the speed of 50 knots.
Generally 5 knots wind is known as light Breeze, 10 knots wind as Gentle Breeze, 15
knots wind as Moderate Breeze, and 50 knots wind as Strong Breeze. If it is more than
50 knot, its disastrous effects are increased.
4. Sky Conditions: On Indian weather maps an effort is made to show, that how much
sky is covered with clouds. Sky conditions are shown with the help of a circle. The
amount of cloud is shown by the shaded part of the circle. If the circle has not shade, it
means that sky is clear. The following table explains the amount of cloud on the Indian
weather map.
Cloud Amount Cloud Amount
1/8 Sky Covered with Cloud
¾ Sky Covered with Cloud
¼ Sky Covered with Cloud
7/8 Sky Covered with Cloud
3/8 Sky Covered with Cloud
Overcast Sky
½ Sky Covered with Cloud x
Obscured Sky
5/8 Sky Covered with Cloud
High Cloud
These circles are shown on the map, where, the observations have been made.
5. Other Atmospheric Phenomena: All those atmospheric changes, which affect the
weather of place in any form, are shown with the help of certain symbols. Our weather
map, mainly uses the following weather symbols, the details of which is as follows:
(i) Haze : The obscurity of the sky is produced by dust particles or smoke. The visibility is
decreased. Area only upto a distance of 2 km. may be visible.
(ii) Mist : The obscurity of the sky is produced by condensed water particle. It also has the
visibility upto a distance of 2 km.
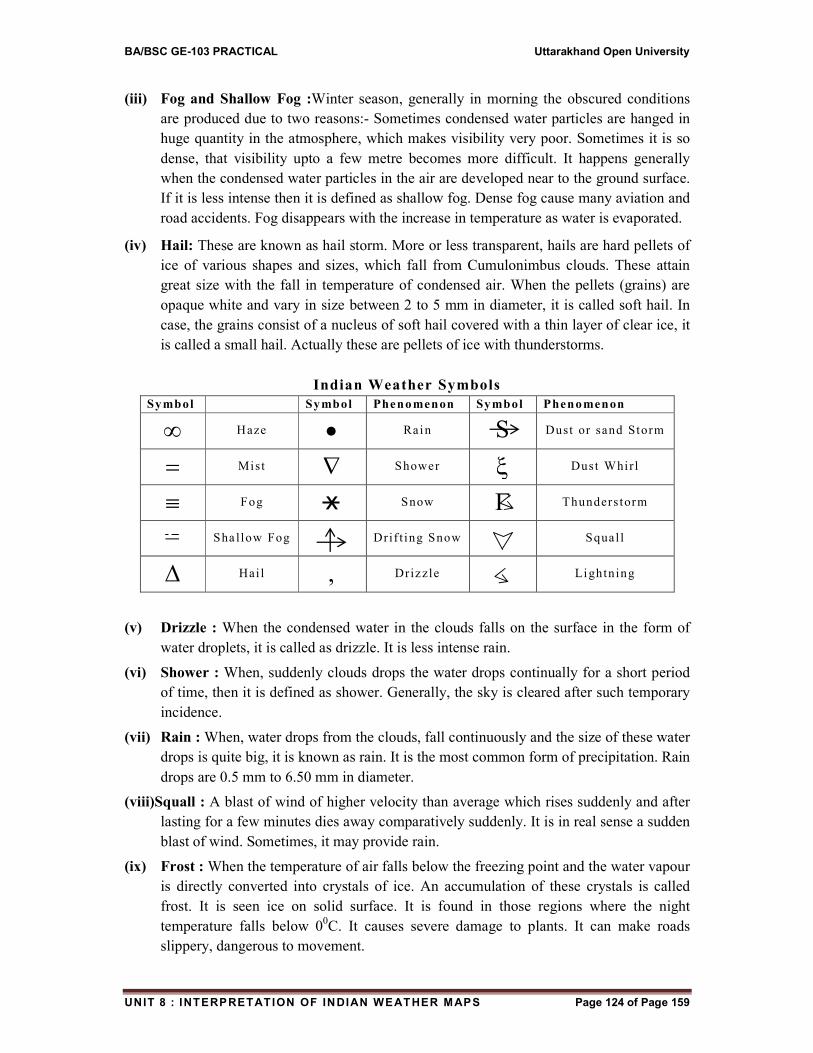
BA/BSC GE-103 PRACTICAL Uttarakhand Open University
UNIT 8 : INTERPRETATION OF INDIAN WEAT HER MAPS Page 124 of Page 159
(iii) Fog and Shallow Fog :Winter season, generally in morning the obscured conditions
are produced due to two reasons:- Sometimes condensed water particles are hanged in
huge quantity in the atmosphere, which makes visibility very poor. Sometimes it is so
dense, that visibility upto a few metre becomes more difficult. It happens generally
when the condensed water particles in the air are developed near to the ground surface.
If it is less intense then it is defined as shallow fog. Dense fog cause many aviation and
road accidents. Fog disappears with the increase in temperature as water is evaporated.
(iv) Hail: These are known as hail storm. More or less transparent, hails are hard pellets of
ice of various shapes and sizes, which fall from Cumulonimbus clouds. These attain
great size with the fall in temperature of condensed air. When the pellets (grains) are
opaque white and vary in size between 2 to 5 mm in diameter, it is called soft hail. In
case, the grains consist of a nucleus of soft hail covered with a thin layer of clear ice, it
is called a small hail. Actually these are pellets of ice with thunderstorms.
Indian Weather Symbols
Symbol Symbol Phenomenon Symbol Phenomenon
Haze Rain S Dust or sand Storm
Mist Shower
Dust Whir l
Fog x Snow
Thunders torm
– Sha llow Fog
Drif t ing Snow
Squal l
Hail Drizzle
Lightning
(v) Drizzle : When the condensed water in the clouds falls on the surface in the form of
water droplets, it is called as drizzle. It is less intense rain.
(vi) Shower : When, suddenly clouds drops the water drops continually for a short period
of time, then it is defined as shower. Generally, the sky is cleared after such temporary
incidence.
(vii) Rain : When, water drops from the clouds, fall continuously and the size of these water
drops is quite big, it is known as rain. It is the most common form of precipitation. Rain
drops are 0.5 mm to 6.50 mm in diameter.
(viii)Squall : A blast of wind of higher velocity than average which rises suddenly and after
lasting for a few minutes dies away comparatively suddenly. It is in real sense a sudden
blast of wind. Sometimes, it may provide rain.
(ix) Frost : When the temperature of air falls below the freezing point and the water vapour
is directly converted into crystals of ice. An accumulation of these crystals is called
frost. It is seen ice on solid surface. It is found in those regions where the night
temperature falls below 00C. It causes severe damage to plants. It can make roads
slippery, dangerous to movement.
BA/BSC GE-103 PRACTICAL Uttarakhand Open University
UNIT 8 : INTERPRETATION OF INDIAN WEAT HER MAPS Page 125 of Page 159
(x) Sleet: It is a mixture of rain and ice. It rains with snowfall. Such incidents are very
common in cold regions. High mountain areas also experience, sometimes such mixture
of rain.
(xi) Snow: It is a powdery mass of ice crystals. These ice crystals are spread on the surface
in a layer. The thickness of the layer depends on the intensity of ice crystals. These
crystals may fall singly or a number of them may combine to form large flakes.
(xii)Thunderstorm: When the winds move with a high speed, with lightening and
thundering or roaring clouds, and provide heavy and sudden rain, known as
thunderstorm. This is caused due to sudden change in atmospheric pressure conditions.
At some occasions, they are also accompanied with hailstorms.
(xiii)Dust Devil: When the dust particles, suddenly rise in the circular form generate the form
of dust devil. Winds go up speedily in circular form and carry dust particles upto a
great height in the atmosphere. They also move horizontally as dust bowl. After such
movement, these are automatically disappeared. Hot desert areas, experiences such
atmospheric incidents.
(xiv)Drifting Snow : It is the movement of the snow. Its speed of movement depends on the
slope of the surface and gravity of snow. The change in temperature has its impact on
it.
(xv) Dew: It is a drops of water on cool, solid surfaces. It is found in regions where the night
temperature does not fall below 0C. It is beneficial to plants. It is not confined in only
cold places. It also occurs in hot and humid regions. In deserts, the formation of dew is
an important source of water for many plants and animals. It disappears with the
increase in temperature.
6. Precipitation : Precipitation is classified according to its form in which it reaches the
ground. The temperature of the air, both inside and outside the cloud determines
whether the precipitation is rain, snow sleet, or hail.
On Indian weather map, all these phenomena are shown by certain weather symbols, as
discussed above. The amount of rainfall is gives on the map in the following form. This
amount is printed near the circles showing sky conditions:
— = 0.25 to 0.74 cms.
I = 0.75 to 1.49 cm.s
The amount of rainfall 2 cm. or more than 2 cmsis mentioned in figures near sky
condition circles. This amount of rainfall in related with the last twenty four hours.
7. Sea Conditions: On India weather map, the conditions of sea wave movement is
shown with certain abbreviations of English language. These symbols help us to assess
the movement of sea water, that whether it is calm or it is notorious or disastrous.
Following symbols are used on Indian weather map to show the sea condition of
Arabian Sea, Bay of Bengal, and adjoining Indian Ocean. Such details are very useful
to navigators, boat sailors, and fishermen, and also to coastal population.
1. Cm. – CalmSea 5. Ro. – RoughSea
2. Sm – SmoothSea 6. V.R.O. – Very Rough Sea
BA/BSC GE-103 PRACTICAL Uttarakhand Open University
UNIT 8 : INTERPRETATION OF INDIAN WEAT HER MAPS Page 126 of Page 159
3. Sl. – SlightSea 7. Hi – HighSea
4. Mod – ModerateSea 8. V. Hi. – Very HighSea
9. Ph. – Phenomenal
7. Department of Air Pressure from Normal : This feature of weather is shown on a
small map printed below the main weather map. It shows the variation of air pressure
from the normal, that it is high or less than the normal limit. This variation is shown by
the symbol of + Plus and – Minus. If it shows the variation in Minus, it denotes that the
air pressure is below the normal limit, whereas, if it is in Plus, it indicates that air
pressure is more than the expectation.
8. Departure of Temperature from normal : This is shown an two small maps, printed
with the large weather map. One map shows the departure of temperature from the
maximum limit and the another one departure of temperature from the minimum limit
of temperature.
Weather Map Interpretation
Here, two weather maps have been interpreted in detail. One for the month of July and
another for the month of January.
(A) July Weather Map
This weather map represents the weather conditions for the date 20 July, 1981, and
corresponds to the time of 8.30 morning. It also indicates weather phenomena for the last
twenty four hours. It is published by Indian Meteorological Department of Pune. This map
also shows weather conditions of adjacent countries of India, i.e. Pakistan, Nepal, Bhutan,
Bangladesh and Sri Lanka. (Fig. 8.2)
(i) Air Pressure:It is shown with the help of isobars. The main feature of air pressure is
that it is high on seas than the land. Air pressure is on increase from the central part
towards the southern part.
(a) Low Pressure Areas : Two such areas can be marked. One area is located on southern
part of Pakistan. It is surrounded by a bar of 998 mb. It has much intensity in its south
part is comparison of its north part. Another low pressure area is extended on central
east India. Its location entails that it may further proceed towards west and north-west.
It is surrounded by an isobar of 1000 mb.
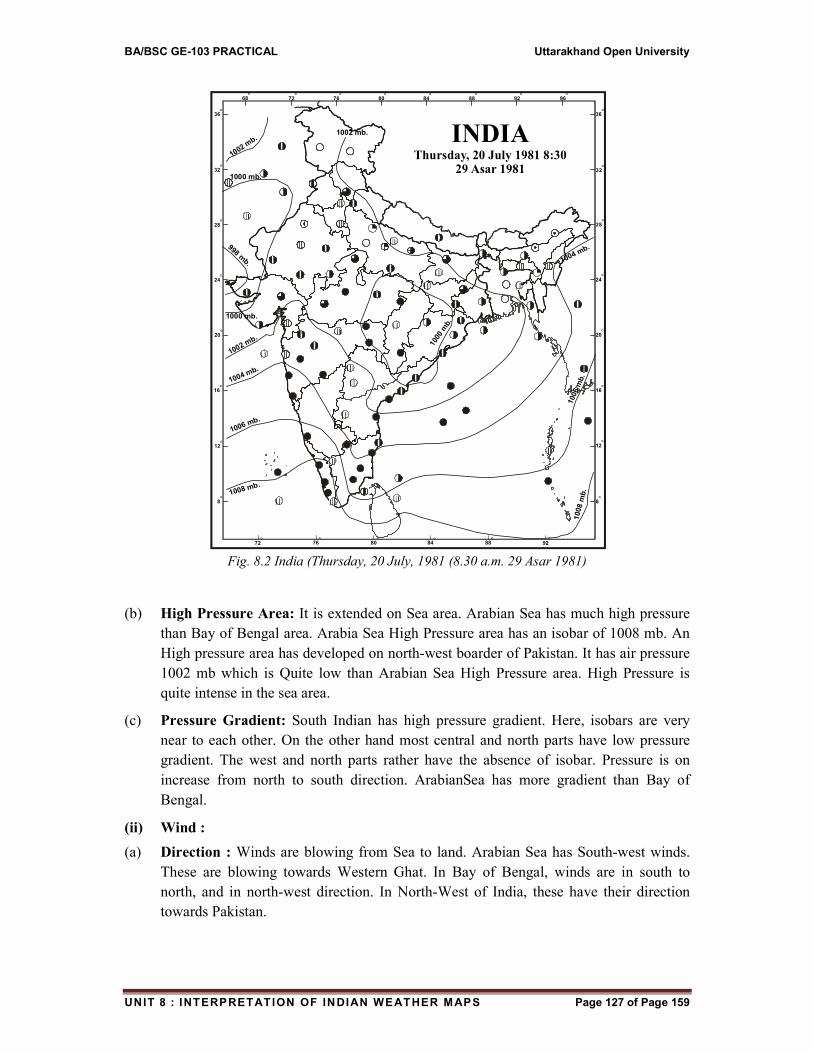
BA/BSC GE-103 PRACTICAL Uttarakhand Open University
UNIT 8 : INTERPRETATION OF INDIAN WEAT HER MAPS Page 127 of Page 159
Fig. 8.2 India (Thursday, 20 July, 1981 (8.30 a.m. 29 Asar 1981)
(b) High Pressure Area: It is extended on Sea area. Arabian Sea has much high pressure
than Bay of Bengal area. Arabia Sea High Pressure area has an isobar of 1008 mb. An
High pressure area has developed on north-west boarder of Pakistan. It has air pressure
1002 mb which is Quite low than Arabian Sea High Pressure area. High Pressure is
quite intense in the sea area.
(c) Pressure Gradient: South Indian has high pressure gradient. Here, isobars are very
near to each other. On the other hand most central and north parts have low pressure
gradient. The west and north parts rather have the absence of isobar. Pressure is on
increase from north to south direction. ArabianSea has more gradient than Bay of
Bengal.
(ii) Wind :
(a) Direction : Winds are blowing from Sea to land. Arabian Sea has South-west winds.
These are blowing towards Western Ghat. In Bay of Bengal, winds are in south to
north, and in north-west direction. In North-West of India, these have their direction
towards Pakistan.
72O
76O
80O
84O
88O
92O
8O
12O
16O
20O
24O
28O
32O
36O
96O
92O
88O
84O
80O
76O
72O
68O
8O
12O
16O
20O
24O
28O
32O
36O
INDIAThursday, 20 July 1981 8:30
29 Asar 19811000 mb.
998 mb.
1000 mb.
1002 mb.
1004 mb.
1006 mb.
1008 mb.
1008
mb
.
1000
mb.
1006 m
b.
1004 mb.
1002 mb.
1002 mb.
BA/BSC GE-103 PRACTICAL Uttarakhand Open University
UNIT 8 : INTERPRETATION OF INDIAN WEAT HER MAPS Page 128 of Page 159
(b) Velocity : The speed of the wind on the sea is much faster than the land. The high
pressure gradient has produced high speed winds in the area. The speed is between 5 to
15 knot in the sea area. The central and eastern parts of India have the wind speed less
than 10 knot per hour.
(iii) Sky Conditions : Western and Eastern coast. Eastern and Central India are covered
with clouds. The sky of north-central part is clear. South India sky is highly cloudy.
Tripura, Mizoram, West Bengal and Terai Region have cloudy atmosphere. The sky of
Odisha, and Andhra Pradesh is also covered with clouds.
(iv) Amount of Rainfall :Most Parts of India have received rainfall during the last 24
yours. Monsoon has been quite active in Kerala. The western Coasts, Lakshadweep
have received heavy rain during the period. In Arabian Sea, Andaman-Nicobar islands
are also in the grip of heavy rains. Odisha, lower Gangetic Plain, Central Madhya
Pradesh, Chhatisgarh have also moderate rainfall. Hilly regions have also rainy
atmosphere. Assam, Rajasthan, Punjab, Haryana and Western Uttar Pradesh have
scattered rainfall or are dry. In Kerala, amount of rainfall is between 8 and 10 cm.
Hyderabad has 6 cm. rainfall. In West Bengal it is 3 cm. in Birbhumi, Due to cyclonic
depression. Chhatisgarh and west Odisha have enough rains.
(v) SeaCondition :Sea is quite smooth in Bay of Bengal. It is calm in PakStrait. It is rough
on KeralaCoast. KonkanCoast has smooth and slight sea. North Arabian sea is smooth.
(vi) Departure of temperature from normal : The temperature in north-west India is
below the normal. It is 8C low than the normal in West Rajasthan. In Karnataka,
Tamil Nadu it is also less than the normal. The remaining areas of the country have the
temperature above the normal. Uttar Pradesh, Bihar, Jharkhand and West Bengal have
the temperature 2C high than the normal.
(vii) Departure of air pressure from normal : Two areas have developed of air pressure
departure. The northern parts have air pressure above the normal. It is 4 millibar more
than the normal in Himachal Pradesh, hilly areas and Pakistan. South India has air
pressure below the normal limit. It is 2 millibar less than the normal on eastern coast.
(viii) Weather Forecast : Weather Department has predicted that Monsoon will make more
progress in next few days. It will rain at all places. South Madhya Pradesh,
Chhatisgarh, Telangana, AndhraCoast, KeralaCoast will receive heavy rainfall. Hilly
areas may have heavy rainfall at few places.
(B) Winter Season Weather Map
This weather map shows weather conditions of India and its adjacent countries for the
date 4 January 1993. The time is 8.30 a.m. It is published and printed by Indian
Meteorological Department, Pune. (Fig. 8.3).
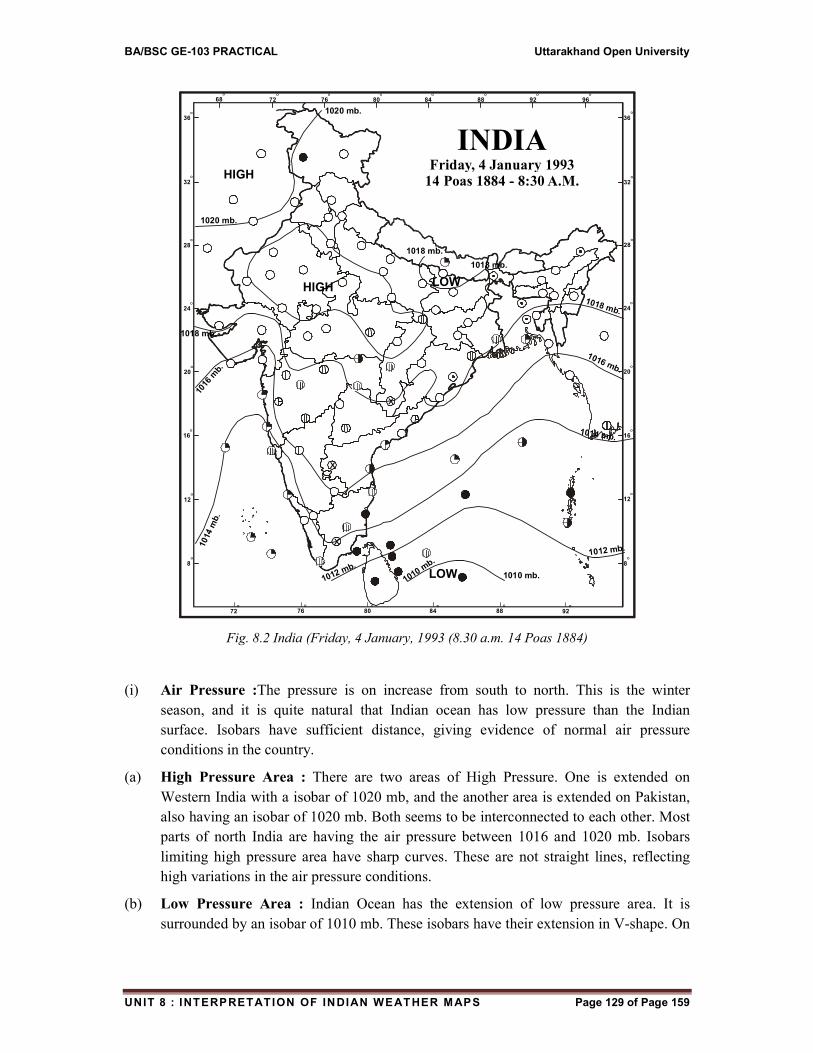
BA/BSC GE-103 PRACTICAL Uttarakhand Open University
UNIT 8 : INTERPRETATION OF INDIAN WEAT HER MAPS Page 129 of Page 159
Fig. 8.2 India (Friday, 4 January, 1993 (8.30 a.m. 14 Poas 1884)
(i) Air Pressure :The pressure is on increase from south to north. This is the winter
season, and it is quite natural that Indian ocean has low pressure than the Indian
surface. Isobars have sufficient distance, giving evidence of normal air pressure
conditions in the country.
(a) High Pressure Area : There are two areas of High Pressure. One is extended on
Western India with a isobar of 1020 mb, and the another area is extended on Pakistan,
also having an isobar of 1020 mb. Both seems to be interconnected to each other. Most
parts of north India are having the air pressure between 1016 and 1020 mb. Isobars
limiting high pressure area have sharp curves. These are not straight lines, reflecting
high variations in the air pressure conditions.
(b) Low Pressure Area : Indian Ocean has the extension of low pressure area. It is
surrounded by an isobar of 1010 mb. These isobars have their extension in V-shape. On
72O
76O
80O
84O
88O
92O
8O
12O
16O
20O
24O
28O
32O
36O
96O
92O
88O
84O
80O
76O
72O
68O
8O
12O
16O
20O
24O
28O
32O
36O
INDIAFriday, 4 January 1993
14 Poas 1884 - 8:30 A.M.
x
x
x
1020 mb.
1020 mb.
1018 mb.
1018 mb.
1018 mb.
1018 mb.
1016
mb.
1016 mb.
1014 m
b.
1014 mb.
1012 mb.
1012 mb.
1010 mb.
1010 mb.LOW
LOW
HIGH
HIGH
BA/BSC GE-103 PRACTICAL Uttarakhand Open University
UNIT 8 : INTERPRETATION OF INDIAN WEAT HER MAPS Page 130 of Page 159
land, these are more shifted towards south. Whereas, in sea area, these have north ward
trend. A low pressure area has also developed in Nepal, but Its intensity is not so low.
(c) Pressure Gradient : It is not so high. In South India, the isobar has the value of 1012
mb, whereas the North India has the extension of 1020 mb isobar. As a whole, South
India has more pressure gradient than the north India. Eastern India has not much
variation.
(ii) Wind
(a) Direction : Winds have variations in their direction in North India. These are moving
from high pressure area to towards east, and north. In south India, their direction is
from land to sea. In east, they have variation in direction.
(b) Velocity : In most part of India winds are quite calm. Their speed is more in south
India. In north India, their speed is 5 to 10 knot. The wind speed is slow, because of
low gradient in air pressure.
(iii) Sky-Conditions : Most parts of India have clear sky. Jammu Kashmir has clouds in its
western part. In central and south India. Clouds are high. Eastern coast has cloudy sky.
It has rainy conditions in Tamilnadu. ArabianIslands have also cloudy weather.
(iv) Amount of Rainfall : There is no rain in north India. Jammu-Kashmir state has
showering in few areas. Eastern coast has also enjoyed little rain in the last 24 hours.
Andaman Nicobar Islands have recorded 3.0 cm. rainfall.
(v) Sea Condition : The sea waves are smooth in Bay of Bengal. Arabian Sea, in its north
part is calm, while its south part has slight and moderate conditions. The sea is smooth
near Lakshadweep.
(vi) Departure of temperature from normal : The minimum temperature in north India is
high than the normal. In South India it is also high than the normal. The Eastern India
has recorded the temperature low than the normal. The maximum temperature is below
the normal. It is high only in the sea area.
(vii) Departure of air pressure from normal : There is an increase in the air pressure in
land area during the last 24 hours. It is more in central India. In South India air pressure
has shown reduction. Sea area has also shown the fall in air pressure.
(viii) Weather Forecast : Meteorological Department has made this forecast that. South-east
India may have more rains in the next 24 hours. Here, the rainfall may be accompanied
lightning. North India will have dry atmosphere with calm air.
8.4 CONCLUSION
The study of weather is an important and interesting, as it affects our life in various
ways. Weather denotes the conditions of atmosphere of a particular time. Its forecast makes
us aware. Weather is shown by a map. So weather map is a map of weather conditions of a
particular time of that area. Indian meteorological Department publishes Indian Daily
BA/BSC GE-103 PRACTICAL Uttarakhand Open University
UNIT 8 : INTERPRETATION OF INDIAN WEAT HER MAPS Page 131 of Page 159
Weather Report. Its Report contains six pages, along with two maps. These represent for
Indian standard time of 8.30 a.m. and 5.30 p.m. The morning weather map is very useful as it
gives certain information for the last twenty four hours. These maps show air pressure, wind
speed and wind direction, clearness of the sky, amount of cloud on the sky, amount of
rainfall, certain important weather phenomena, movement of sea water, departure of
temperature and air pressure from the normal. Weather forecasting is possible by the
observation of all these weather phenomena.
8.5 SUMMARY
Weather is a state of atmosphere of a particular time. Its explanation depends on the
observations of temperature, air pressure, sky condition, wind condition, and moisture. Such
observation helps us in the forecast of weather. Our Indian Meteorological Department has
made an attempt in this direction. It publishes daily weather maps of India, depicting weather
conditions for 8.30 mornings. It is based on the observation and information received and
collected from various laboratories, located in different parts of the country. These
observatories are known as surface, upper air and space based.
Indian Weather Report consists six pages. It has two maps : one shows the weather conditions
of the day at 8.30 a.m. gives the amount of rainfall for the last 24 hours. Another map depicts
the weather conditions of the day at 5.30 p.m. It shows the changes in the weather have taken
place during the last 9 hours. There are also given two small maps, showing the departure of
maximum and minimum temperature and air pressure from the normal.
India weather map is studied with the help of certain symbols and codes. It has introductory
information. i.e. time, day, data and year. Air pressure is shown by isobars. These are drawn
with an interval of 2 millibar. Their shape, distance between two isobars entails us with
changes in the weather. Their near location indicates much change instead of their distant
location. High and Low Pressure areas are also marked on the Map. Their location acquaints
us with the movement of winds, which are directly related to air pressure. Wind direction is
indicated by an arrow. The back part of an arrow indicates that the winds are coming from
that side. Wind speed is shown with the help of oblique lines on this arrow. Half oblique line
is an indication of 5 knot per hour. One full oblique line is equal to 10 knot.
Sky conditions are shown by a circle. The shaded part of the circle indicates the amount of
cloud. If it is full shaded, then it indicates that the sky is fully covered with the clouds. The
other atmospheric phenomena are also shown with the help of approved symbols. These
phenomena are haze, mist, fog, shallow fog, hail, drizzle, shower, rain, squall, frost, sleet,
snow, thunderstorm, dust devil, drifting snow.
Amount of rainfall is given in cm. This indicates for the last twenty four hours. Sea waves are
shown on the map. Sea is calm or it has notorious movement. The movement of sea water
affects the fishing and navigation activities.
Department of temperature and air pressure from the normal also helps us to assess the
weather conditions prevailed during the last twenty four hours. The departments of maximum
BA/BSC GE-103 PRACTICAL Uttarakhand Open University
UNIT 8 : INTERPRETATION OF INDIAN WEAT HER MAPS Page 132 of Page 159
and minimum temperature from the normal are also explained. In this chapter, July and
January weather maps have been discussed in detail as an example.
8.6 GLOSSARY
ISI - Indian Standard time
GMT - Greenwich Meridian Time
Observatory - A place of recording and maintenance of weather data.
Isobar - An imaginary line drawn on map joining places with equal
barometric pressure
Millibar - It is equal to 1 Bar or 756 millimeter
Knot - Nautical Miles per hour, wind speed
Overcast - Sky is fully covered by clouds
Obscured - Un-cleared Sky
Weather Forecast - Protection with a reasonable amount of certainly about the
conditions of weather that would prevail in the next 24 to 48 hour
in a certain area.
Isotherm - Imaginary line drawn on a map joining places with equal
temperature, reduced to seal level.
Departure - The variation of Maximum and minimum temperature from the
normal.
Mean Sea Level(MSL) - The average height of the surface of the sea for all stages of the
tide.
Variable - Any Characteristic which varies.
Cardinal Point - North, South, East and West are main Points or directions.
8.7 ANSWER TO CHECK YOUR PROGRESS
1. Weather is the statement of a particular time.
2. Climate is an assessment of a long period of weather conditions.
3. Weather map denotes the weather conditions of that area of a definite time.
4. Weather forecast help us to take safety measures in advance.
5. Indian weather maps are published by India Meteorological Department, Pune.
6. Indian weather maps are for 8.30 a.m. and 5.30 p.m.
7. Weather maps are based on three observations- surface, upper air and space based
platforms.
8. Air pressure is shown by isobars and the units of scale ismillibar.
9. India weather map shows the location of High and Low pressure area.
10. Air pressure gradient is identified by the distances between the isobars.
BA/BSC GE-103 PRACTICAL Uttarakhand Open University
UNIT 8 : INTERPRETATION OF INDIAN WEAT HER MAPS Page 133 of Page 159
11. Wind Speed is explained in nautical miles per hour.
12. Main wind directions are North, North-east, South, South-east, East, South, South-west,
North-west.
13. Sky condition denotes that how much area of the sky is covered by clouds.
14. Overcast sky is fully cloudy sky.
15. Obscured sky has low visibility.
16. The intensity of visibility is represented by dew, haze, mist, shallow fog, and fog. These
are the forms of condensation.
17. As a form of precipitation drizzle, shower, rain, sleet, snow conditions are shown on
weather map of India.
18. Squall duststorm or thunderstorm, dust devil, represent the nature of wind movement and
its velocity.
19. Drifting show indicates the movement of snow.
20. The conditions of sea helps us in fishing and navigation.
21. Make Correct Pairs of the following Weather phenomena :
Column-A Column-B
1. Haze a. High intense of condensed water vapour
2. Mist b. Water vapour fall in form of ice crystals
3. Fog c. Water droplets on the surface
4. Shallow Fog d. Obscured sky with dust particles
5. Dew e. Obscured sky by condensed water particles
6. Frost f. Less intense condensed water vapour
Answer : 1 (d), 2(e), 3(a), 4(f), 5(c), 6(b)
8.8 REFERENCES
1. Bhat, L.S.: Aslam Mahmood: Field work Laboratory Techniques in Geography– A
practical Geography Text Book NCERT. New Delhi, 2009
2. D. Helen: A to Z Social Sciences: Flaming Books (Export) New Delhi, 2003
3. Gaur, KripaShanker: Manchitra Kala kiSameeksha: Agra Book Store, Agra, 1968
4. Monkhouse, F.J. & H.R. Wilkinson: Maps and Diagrams, University Paper Backs,
Methuen, London, 1966.
5. Rajan, Rita: A text book of Geography-IX- General Printers & Publishers, Mumbai, 2003.
6. Singh, R.,B.: Practical work in Geography Pt. 3, NCERT, New Delhi 2002.
7. Sharma, J.P. :PrayogikBhugol : Rastogi Publication, Meerut, 2015.
8. Singh, R.L.: Elements of practical Geography, Students Friends, Allahabad 1966.
8.9 SUGGESTED READINGS
1. Bhat, L.S.: Aslam Mahmood: Field work Laboratory Techniques in Geography– A
practical Geography Text Book NCERT. New Delhi, 2009
BA/BSC GE-103 PRACTICAL Uttarakhand Open University
UNIT 8 : INTERPRETATION OF INDIAN WEAT HER MAPS Page 134 of Page 159
2. D. Helen: A to Z Social Sciences: Flaming Books (Export) New Delhi, 2003
3. Gaur, KripaShanker: Manchitra Kala kiSameeksha: Agra Book Store, Agra, 1968
4. Monkhouse, F.J. & H.R. Wilkinson: Maps and Diagrams, University Paper Backs,
Methuen, London, 1966.
5. Rajan, Rita: A text book of Geography-IX- General Printers & Publishers, Mumbai, 2003.
6. Singh, R.,B.: Practical work in Geography Pt. 3, NCERT, New Delhi 2002.
7. Sharma, J.P. :PrayogikBhugol : Rastogi Publication, Meerut, 2015.
8. Singh, R.L.: Elements of practical Geography, Students Friends, Allahabad 1966.
8.10 TERMINAL QUESTIONS
1. What do you mean by weather? Why should we study it.
2. What are the basic elements of weather?
3. What is a weather map?
4. Why and when the first weather map was produced?
5. Name the organization in India which records and monitors weather related data and
information.
6. When Indian Meteorological Department was established. Explain its role in Weather
forecasting.
7. Discuss how weather maps and charts are prepared and how are these useful to us?
8. Which organization in India records and monitors weather related data and information’s?
9. What are three modes of meteorological observations used globally?
10. Discuss the weather map for the months of July and January.
11. Explain is detail those weather phenomena which are used by Indian Weather Map?
12. What do you mean by air pressure? How it is represented on the weather map of India?
13. How the amount of cloud is shown on Indian weather map? Explain.
14. How the movement of sea water is shown of weather map? Discuss.
15. What do you mean by the departure of air pressure and temperature? Discuss.
BA/BSC GE-103 PRACTICAL Uttarakhand Open University
UNIT 9 : TOPOGRAPHICAL MAPS OF INDI A Page 135 of Page 159
UNIT 9 : TOPOGRAPHICAL MAPS OF INDIA
9.1 OBJECTIVES
9.2 INTRODUCTION
9.3 TOPOGRAPHICAL MAPPING IN INDIA
9.4 INDIA AND ADJACENT COUNTRY SERIES
9.5 INTERNATIONAL SERIES
9.6 CONCLUSION
9.7 SUMMARY
9.8 GLOSSARY
9.9 ANSWER TO CHECK YOUR PROGRESS
9.10 REFERENCES
9.11 SUGGESTED READINGS
9.12 TERMINAL QUESTIONS
BA/BSC GE-103 PRACTICAL Uttarakhand Open University
UNIT 9 : TOPOGRAPHICAL MAPS OF INDI A Page 136 of Page 159
9.1 OBJECTIVES
The map is the most important tool of a geographer in the analysis and interpretation of
various feature distributed on the surface of the earth. Maps are informative, analytical or
perspective. Maps can serve a variety of purposes. Maps are defined as models of real world
situations. Map reading, in actually, denotes the formation of a visual picture of the ground as
depicted on the map. It requires a good deal of practice, and only a well-trained student in
this art can visualize the correct picture of the area. Different physical and cultural features
are well expressed by different symbols. The best way to familiar with the topography of a
region, it is necessary to acquaint with the techniques of its reading. This is the main aim of
this chapter.
9.2 INTRODUCTION
Topographical maps are the maps showing the natural landscape and cultural and
elements of the area in much detail. These are primarily large scale maps and are based on the
actual survey of the land. These are made on such scale that it is very easy to show roads,
plan to settlement, contour lines and other details. They usually depict the detailed surface
features as forests, rivers, lakes, and man-made features such as roads, railways, canals, and
settlements.
Though the map is the tool of a geographer, but it is consulted by other people also. A
traveller may simply need to know about the location of his destination, and route followed;
while in military strategy one may require to detect all possible routes along which to military
has to march. But the aim of geographer is quite different. He tries to identify the exact nature
of topography depicted on the map. For this he has to study and note down carefully the main
features, classify them in some order and then draw necessary conclusions from them. It is
very necessary for him to have a comprehensive knowledge of physical geography as well as
of human responses to natural environment. Obviously, this type of study is very useful to a
student of geography in having a prosper grasp of the regional geography of an area. A good
practice in the study of topographical maps will enable him to write a systematic geography
of the area.
Topographical maps are prepared on a number of sheets since they are large scale
maps. Each sheet gives the details of a part of the whole area. When the sheets are joined
together, they form a map of the whole area. Thus, it becomes necessary to know about the
topographical mapping of an area in our country.
9.3 TOPOGRAPHICAL MAPPING IN INDIA
In our country, topographical mapping is in the hands of government of India. Here,
Survey of India Department was established by British Rule in 1767, and Major James
Rennell was the first Surveyor General of India. This Department has made significant efforts
BA/BSC GE-103 PRACTICAL Uttarakhand Open University
UNIT 9 : TOPOGRAPHICAL MAPS OF INDI A Page 137 of Page 159
in the preparation of topographical maps of India. Each and every corner of our country has
been mapped on these large scale maps. The Department has prepared the maps of those
areas also, which are highly inaccessible, and quite difficult.
In 1802, Colonel William Lambton was appointed Surveyor General of India. He
started the mapping work in India with the help of triangulation method. He was succeeded
by Sir George Everest. He made a number of improvement in the triangulation method. Thus,
the triangulation method of survey is the product of both of these two Surveyor Generals.
They covered the whole British India by a lattice of primary triangles. On the basis of one
datum plane, they got success in the survey and preparation of topographical mapping of
India and adjoining areas. Till 1905, this Department, prepared Revenue Survey Maps on the
scale 16 = 1 mile. Presently, these maps are prepared by concerned state governments of
India.
Our Survey of India has now adopted Metric system since 1957. Previously our
topographical maps were being published with the scale of 1 inch to 1 mile and 1 inch to 4
miles. At the moment, these maps are being published or have been transferred on the scale
of 1:50,000 and 1:250,000. This work has now been successfully completed, and these maps
are prepared with the help of modern and advanced techniques. Now Photographmatic
Survey of technique has been adopted, and plane table Survey technique now has been fully
discarded. This photographic technique is able to produce the details of the area concerned
within no much time. National Remote Sensing Agency Hyderabad, Air Survey Co. Kolkata,
and Directorate of Military Survey are helping in this matter of Survey of India. Aerial
Photographs, Satellite imageries have been very useful in the preparation of these
topographical maps with much details.
Nomenclature and Numbering of Topographical Maps of India
These maps of India are prepared on International Projection, as determined by
International Mapping Committee. The numbering of toposheets is also based on the extent
of India and adjacent countries. All maps of this series are prepared on the scale of
1:1,00,0000. These are called as one million map. Their index number is just like 63,64,65
and so on. Each map has the extension of an area 4 latitude and 4 longitude. The total
number of toposheets in the world is 2222. Out of which 51 sheets partially or fully belong to
our area. These maps have the number from 40 to 92. Among these 59 and 68 belong to Sri
Lanka Region. (Fig. 9.1).
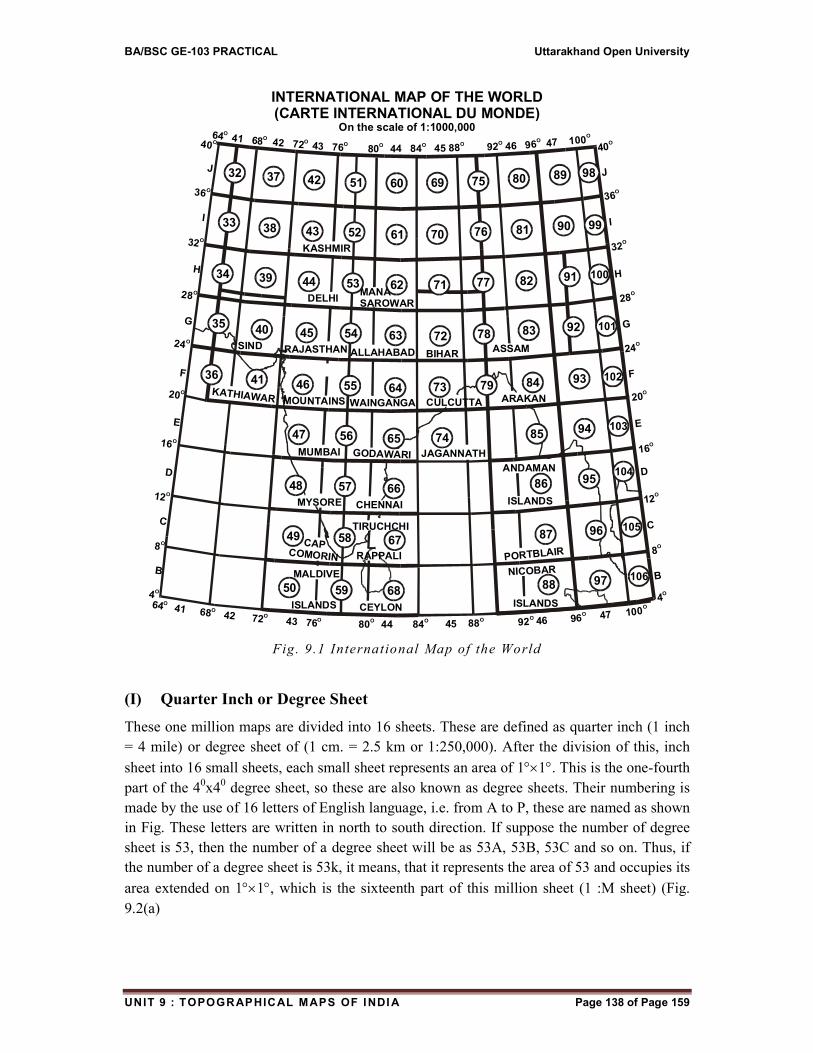
BA/BSC GE-103 PRACTICAL Uttarakhand Open University
UNIT 9 : TOPOGRAPHICAL MAPS OF INDI A Page 138 of Page 159
Fig. 9 .1 International Map of the World
(I) Quarter Inch or Degree Sheet
These one million maps are divided into 16 sheets. These are defined as quarter inch (1 inch
= 4 mile) or degree sheet of (1 cm. = 2.5 km or 1:250,000). After the division of this, inch
sheet into 16 small sheets, each small sheet represents an area of 11. This is the one-fourth
part of the 40x4
0 degree sheet, so these are also known as degree sheets. Their numbering is
made by the use of 16 letters of English language, i.e. from A to P, these are named as shown
in Fig. These letters are written in north to south direction. If suppose the number of degree
sheet is 53, then the number of a degree sheet will be as 53A, 53B, 53C and so on. Thus, if
the number of a degree sheet is 53k, it means, that it represents the area of 53 and occupies its
area extended on 11, which is the sixteenth part of this million sheet (1 :M sheet) (Fig.
9.2(a)
KASHMIR
INTERNATIONAL MAP OF THE WORLD(CARTE INTERNATIONAL DU MONDE)
On the scale of 1:1000,000
DELHI
40O
J
36O
I
32O
H
28O
G
24O
F
20O
E
16O
D
12O
C
8O
B
4O
MANA SAROWAR
SIND RAJASTHAN ALLAHABAD BIHARASSAM
KATHIAWAR MOUNTAINS WAINGANGA CULCUTTA ARAKAN
MUMBAI GODAWARI JAGANNATH
MYSORE CHENNAI
CAP COMORIN
TIRUCHCHI
RAPPALI
MALDIVE
ISLANDS CEYLON
ANDAMAN
ISLANDS
PORTBLAIR
NICOBAR
ISLANDS
40O
J
36O
I
32O
H
28O
G
24O
F
20O
E
16O
D
12O
C
8O
B
4O
64 41 O
68 42 O
72 43 7O
6 80 44 84O O O O
45 88 O
92 46 96O
O
47 100
64 41 6O
8 42 72 4O
O 3 76 8
O 0 44 84 4
O O 5 88 92 46 O O 96 47 100O
O
32
33
34
35
36
37
38
39
40
41
42
43
44
45
46
47
48
49
50
51
52
53
54
55
56
57
58
59
60
61
62
63
64
65
66
67
68
69
70
71
72
73
74
75
76
77
78
79
80
81
82
83
84
85
86
87
88
89
90
91
92
93
94
95
96
97
98
99
100
101
102
103
104
105
106
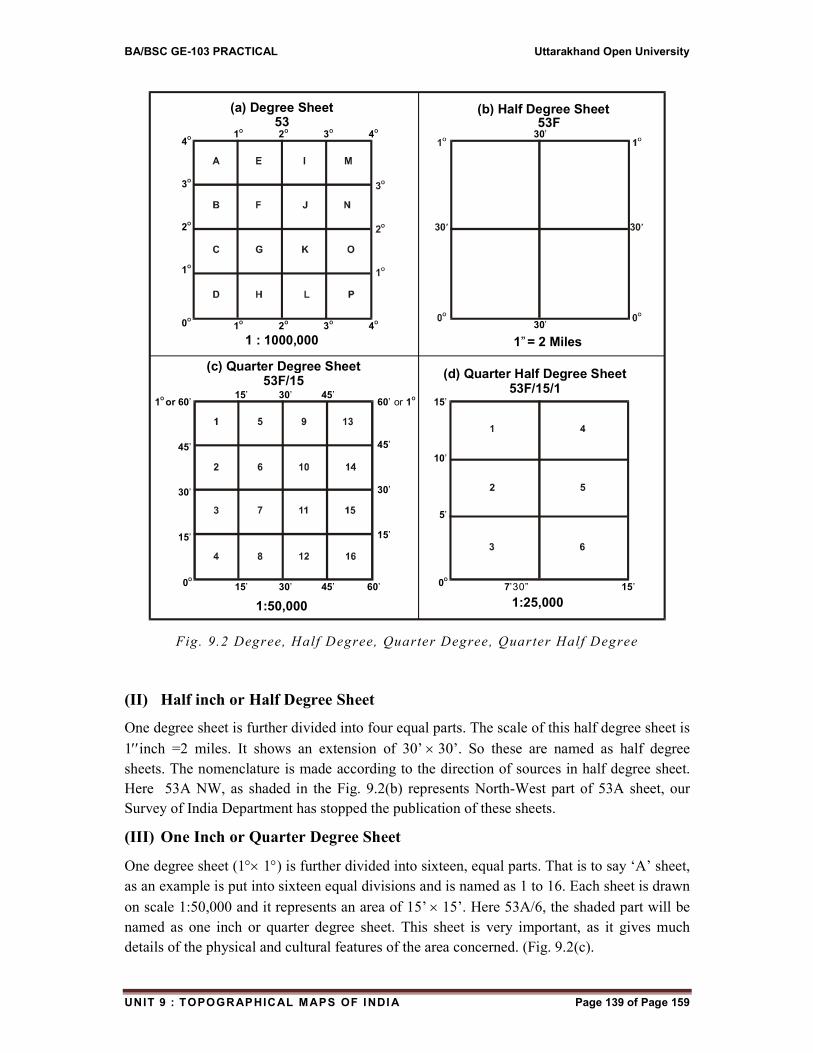
BA/BSC GE-103 PRACTICAL Uttarakhand Open University
UNIT 9 : TOPOGRAPHICAL MAPS OF INDI A Page 139 of Page 159
Fig. 9.2 Degree, Half Degree, Quarter Degree, Quarter Half Degree
(II) Half inch or Half Degree Sheet
One degree sheet is further divided into four equal parts. The scale of this half degree sheet is
1inch =2 miles. It shows an extension of 30’30’. So these are named as half degree
sheets. The nomenclature is made according to the direction of sources in half degree sheet.
Here 53A NW, as shaded in the Fig. 9.2(b) represents North-West part of 53A sheet, our
Survey of India Department has stopped the publication of these sheets.
(III) One Inch or Quarter Degree Sheet
One degree sheet (1 1) is further divided into sixteen, equal parts. That is to say ‘A’ sheet,
as an example is put into sixteen equal divisions and is named as 1 to 16. Each sheet is drawn
on scale 1:50,000 and it represents an area of 15’15’. Here 53A/6, the shaded part will be
named as one inch or quarter degree sheet. This sheet is very important, as it gives much
details of the physical and cultural features of the area concerned. (Fig. 9.2(c).
4
3
2
1
0
O
O
O
O
O
1 2 3 4O O O O
1 2 3 4O O O O
30’
30’
1
45
30
15
0
O
O
or 60’
’
’
’
15 30 45’ ’ ’
60’ or
’
’
’
1
45
30
15
O
15 30 45 60’ ’ ’ ’
15’
’
’
O
10
5
0 7 15’30” ’
(a) Degree Sheet53
1 : 1000,000
(b) Half Degree Sheet53F
1 = 2 Miles”
(c) Quarter Degree Sheet53F/15
1:50,000
(d) Quarter Half Degree Sheet53F/15/1
1:25,000
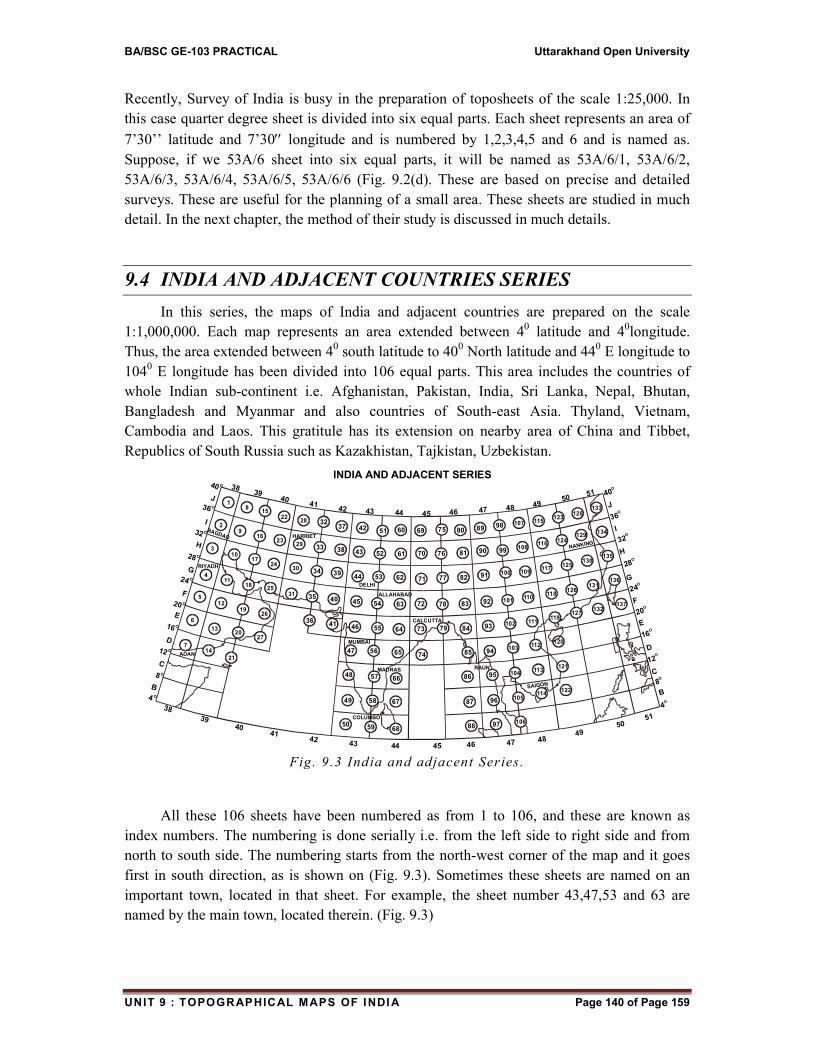
BA/BSC GE-103 PRACTICAL Uttarakhand Open University
UNIT 9 : TOPOGRAPHICAL MAPS OF INDI A Page 140 of Page 159
Recently, Survey of India is busy in the preparation of toposheets of the scale 1:25,000. In
this case quarter degree sheet is divided into six equal parts. Each sheet represents an area of
7’30’’ latitude and 7’30 longitude and is numbered by 1,2,3,4,5 and 6 and is named as.
Suppose, if we 53A/6 sheet into six equal parts, it will be named as 53A/6/1, 53A/6/2,
53A/6/3, 53A/6/4, 53A/6/5, 53A/6/6 (Fig. 9.2(d). These are based on precise and detailed
surveys. These are useful for the planning of a small area. These sheets are studied in much
detail. In the next chapter, the method of their study is discussed in much details.
9.4 INDIA AND ADJACENT COUNTRIES SERIES
In this series, the maps of India and adjacent countries are prepared on the scale
1:1,000,000. Each map represents an area extended between 40 latitude and 4
0longitude.
Thus, the area extended between 40 south latitude to 40
0 North latitude and 44
0 E longitude to
1040 E longitude has been divided into 106 equal parts. This area includes the countries of
whole Indian sub-continent i.e. Afghanistan, Pakistan, India, Sri Lanka, Nepal, Bhutan,
Bangladesh and Myanmar and also countries of South-east Asia. Thyland, Vietnam,
Cambodia and Laos. This gratitule has its extension on nearby area of China and Tibbet,
Republics of South Russia such as Kazakhistan, Tajkistan, Uzbekistan.
Fig. 9 .3 India and adjacent Series .
All these 106 sheets have been numbered as from 1 to 106, and these are known as
index numbers. The numbering is done serially i.e. from the left side to right side and from
north to south side. The numbering starts from the north-west corner of the map and it goes
first in south direction, as is shown on (Fig. 9.3). Sometimes these sheets are named on an
important town, located in that sheet. For example, the sheet number 43,47,53 and 63 are
named by the main town, located therein. (Fig. 9.3)
32
33
34
35
36
37
38
39
40
41
42
43
44
45
46
47
48
49
50
51
52
60 69 75 80 89 98
61
53
54
55
56
57
58
59 68
67
66
65 74
88 97 106
87 96 105
86 95 104
85 94103
62
63
64
70
71
72
73
76
77
78
79
81
82
83
84
90 99
91 100
92 101
93 102
107
108
109
110
111
112
113
114
115
116
117
118
119
120
121
122
123
124
125
126
127
128
129
130
131
132
133
134
135
136
137
1
2
3
4
5
6
7
8
9
10
11
12
13
14
15
16
17
20
21
22
18
19
24
26
23
25
27
28
29
30
31
40 O
J
36 O
I
32 O
H
28 O
G
24 O
F
20 O
E
16 O
D
12 O
C
8 O
B
4 O
40O
J
36O
I
32O
H
28O
G
24O
F
20O
E
16O
D
12O
C
8O
B
4O
38 39 40 41 42 43 44 45 46 47 48 49 50 5
1
38 39 40 41 42 43 44 45 46 47 48 49
50
51
BAGDAD HARRIET
RIYADH
DELHI
ALLAHABAD
CALCUTTA
MUMBAI
MADRAS
COLUMBO
ADAN
RAUN
SAIGON
NANKING
INDIA AND ADJACENT SERIES
BA/BSC GE-103 PRACTICAL Uttarakhand Open University
UNIT 9 : TOPOGRAPHICAL MAPS OF INDI A Page 141 of Page 159
These are defined as Srinagar (43), Mumbai (47), Mysore (48), Allahabad (63). All the
sheets of this series have these features. All the words and numbers are shown in black
colour, water bodies and rivers in blue colour, roads in red colour. Presently, the publication
of the maps of this series has been stopped. Our Survey Department has adopted this main
division in the publication of one inch-half inch and quarter inch topo-sheets. The sheets of
this series are also known as one million sheets.
9.5 INTERNATIONAL SERIES
This series includes the maps of whole world. A plan was prepared in the session of
International Map Committee held at London in 1909. This plan was again considered in the
conference of the committee, held Paris in 1913. It was decided that Polyconic projection
should be modified. They modified it, and prepared new projection known as International
Projection for the preparation of maps. The scale of these maps is 1:1,000,000 and thus these
maps are known as one-million maps. Each sheet represents an area of 4 latitude and
6longitude and thus, the whole world is covered by 2222 sheets, in accordance to this
scheme. These sheets are as follows:-
Eighteen hundred sheets- are prepared for an area extended between 60North to 60
South. Each sheet cover an area of 4 latitude and 6 longitude.
Four hundred twenty sheets- are prepared for an area extended between 60 to 88
latitudes in both the hemispheres. Each sheet covers an area of 4 latitude and 12longitude.
Two sheets are prepared for Polar regions. These are spherical sheets. The centre of
which is North Pole and South pole and the radius is 2 latitude. Each sheet covers an area of
from 880 latitude to 90 (pole)
Thus, the total of all the above sheets is 2222. Survey Department of India has
published all its topographical maps according to this international agreement. The maps of
International Series are drawn according to the rules prescribed by the Cartographic division
of U.N. Economic and Social Council. This series is also called as Carte International Du
Monde.
Each map represents an area extended between 4 latitude and 6longitude. As
mentioned earlier, these maps are named as one million map. Fig. 8.1 shows the layout of
maps of international series of India sub-continent. The map having an area in the north of
equator are mentioned by N word with the number such as 43N, and the area extended in the
south of equator are mentioned by ‘S’ word with the number such 43S.
9.6 CONCLUSIONS
Map is the tool of geographer. Topographical maps are large scale maps. These show
various physical and cultural features in detail. These are consulted by the scholars of other
discipline also. Survey of India prepares and publishes topographical maps of each and every
BA/BSC GE-103 PRACTICAL Uttarakhand Open University
UNIT 9 : TOPOGRAPHICAL MAPS OF INDI A Page 142 of Page 159
corner of the country in a systematic manner. These are based now on aerial photographs. In
India, one inch, half inch and quarter inch map are prepared. Quarter inch maps with
1:50,000 scale are very useful. A new scheme of maps on 1:25,000 is in process. Our
mapping system is in accordance of International Series.
9.7 SUMMARY
Map is a tool to acquaint us with the geographical features of an area. It is a reality of
the earth surface particularly of that area. A geography student is also curious to know the
techniques of the mechanization of topographical maps.
Topographical maps are large scale maps. These are prepared on the basis of detailed
survey of the area. These are very useful to geographers, planners, politicians, demographers
and persons of a number of other disciplines. Geography persons study the physical features
of the area and as well as of human response to natural environment. These maps help us to
write the systematic geography of the region.
Topographical map is a combination of number of sheets. Their mosaic presents the
complete picture of the whole area. The mapping of these topographical maps is not an easy
task.
It is done by Government of India. Our Survey Department, with its head office at
Dehradun looks after this mapping work. These maps are now prepared in matrix system.
These maps are prepared on the scale of 1:50,000 and 1:250,000 and 1:1,000,000. These are
referred as quarter inch, one inch and four inch respectively. Their extension is 15’x 15’, 1
1 and 4 4 latitudes and longitudes. A new series of 1:25,000 scale is now being published
by the department, which will cover the whole India shortly.
These maps are numbered as per directive of international series. One million maps are
given the number of such as 63,64,65 according to this series. Each map has an extension of
404
0. India and its nearby countries are covered by 51 sheets. These sheets are divided into
16 equal parts and each part has number from A to P. Suppose, the number of the sheet is 63,
and if it is numbered as 63F. It denotes that this sheet covers an area of 11 and is
developed on the scale of 1:250,000. It is the sixteenth part of a million sheet. Half degree
sheets, were previously in practice, but now, their publication has been stopped.
One degree sheet (11) is further divided into sixteen equal parts. These are
numbered from 1 to 16. Suppose the number of such sheet is 63F/15. It means that it covers
an area of 15 15, and is on the scale of 1:50,000. These sheets are very useful for the
detailed study of all type of geographical features. Survey Department also publishes now
quarter degree sheets.
India and adjacent series prepares the maps of the countries of sub-continent. It covers
an area extended between 4 south latitude to 40 North latitude and 44 E longitude to 104
E longitude. Thus, it has 106 sheets i.e. from 1 to 106. Certain Colour scheme is used on
these maps to depict geographical features.
BA/BSC GE-103 PRACTICAL Uttarakhand Open University
UNIT 9 : TOPOGRAPHICAL MAPS OF INDI A Page 143 of Page 159
International Series cover the whole world. The maps of the series are prepared on
international projection. The scale of the each map is 1:100,000 with an area of 4 latitude
and 6longitude. The whole world is covered by 2222 sheets. These are marked N and S
according to their hemisphere location.
9.8 GLOSSARY
Topographic Map : A map of small areas drawn on a large scale, depicting detailed man-
made and natural features.
9.9 ANSWER TO CHECK YOUR PROGRESS
1. Match the following:
Column –A (Map) Column-B (Scale)
i. One degree map a. 1:50,000
ii. Four degree map b. 1:250,000
iii. One-fourth degree map c. 1:25,000
iv. One-eighth degree map d. 1:100,000
Answer :i. (b), ii. (d), iii. (a), iv. (c)
Match the following pairs:
Column –A Column-B
i. 4 4 a. 1:250,000
ii. 1 1 b. 1:50,000
iii. 30 30 c. 1:1,000,000
iv. 15 15 d. 1:25,000
v. 730 730 e. 1:125,000
Answer :i. (c), ii. (a), iii. (c), iv. (b), v. (d)
3. Map showing physical and cultural features are known topographical maps.
4. Topographical maps are large scale maps.
5. What type of scholar can study topographical maps in a proper way – A skilled and
comprehensive knowledge person.
6. The headquarter of Survey of India is situated in Dehradun.
7. Present topographical maps are based on Aerial photograph and Remote sensing
techniques.
8. If the number of a topographical map is 63, then the scale is 1:1,000,000.
9. If the number of a topographical map is 63K, then the scale is 1:250,000.
10. If the number of a topographical map is 63K/7, then the scale is 1:50,000.
11. If the number of a topographical map is 63K/7/2, then the scale is 1:25,000.
12. India and adjacent series covers an area of 4 South to 40 North latitude.

BA/BSC GE-103 PRACTICAL Uttarakhand Open University
UNIT 9 : TOPOGRAPHICAL MAPS OF INDI A Page 144 of Page 159
13. India and adjacent series covers Afghanistan, Pakistan, Nepal, Bhutan, Bangladesh, Sri
Lanka, Myanmar and India.
14. India and Bhutan, Bangladesh, Sri Lanka, Myanmarhave 106 sheets.
15. International series has its maps on International Projection.
16. International series covers the whole world in 2222 sheets.
17. International series prepares 1800 sheets for an area 680 N to 68
0 south.
18. International series has 420 sheets for 60 to 88 N and S.
19. Two sheets for both the polar areas.
9.10 REFERENCES
1. Bhat, L.S.: Aslam Mahmood: Field work Laboratory Techniques in Geography– A
practical Geography Text Book NCERT. New Delhi, 2009
2. D. Helen: A to Z Social Sciences: Flaming Books (Export) New Delhi, 2003
3. Gaur, KripaShanker: Manchitra Kala kiSameeksha: Agra Book Store, Agra, 1968
4. Monkhouse, F.J. & H.R. Wilkinson: Maps and Diagrams, University Paper Backs,
Methuen, London, 1966.
5. Rajan, Rita: A text book of Geography-IX- General Printers & Publishers, Mumbai,
2003.
6. Singh, R.,B.: Practical work in Geography Pt. 3, NCERT, New Delhi 2002.
7. Sharma, J.P. :PrayogikBhugol : Rastogi Publication, Meerut, 2015.
8. Singh, R.L.: Elements of practical Geography, Students Friends, Allahabad 1966.
9.11 SUGGESTED READINGS
1. Bhat, L.S.: Aslam Mahmood: Field work Laboratory Techniques in Geography– A
practical Geography Text Book NCERT. New Delhi, 2009
2. D. Helen: A to Z Social Sciences: Flaming Books (Export) New Delhi, 2003
3. Gaur, KripaShanker: Manchitra Kala kiSameeksha: Agra Book Store, Agra, 1968
4. Monkhouse, F.J. & H.R. Wilkinson: Maps and Diagrams, University Paper Backs,
Methuen, London, 1966.
5. Rajan, Rita: A text book of Geography-IX- General Printers & Publishers, Mumbai,
2003.
6. Singh, R.,B.: Practical work in Geography Pt. 3, NCERT, New Delhi 2002.
7. Sharma, J.P. :PrayogikBhugol : Rastogi Publication, Meerut, 2015.
8. Singh, R.L.: Elements of practical Geography, Students Friends, Allahabad 1966.
BA/BSC GE-103 PRACTICAL Uttarakhand Open University
UNIT 9 : TOPOGRAPHICAL MAPS OF INDI A Page 145 of Page 159
9.12 TERMINAL QUESTIONS
1. What are topographical maps?
2. Name the organization which publishes and prepares topographical maps of India.
3. Which are the commonly used scales for mapping our country used by survey of India?
4. What is meant by one million sheet?
5. Discuss the role of Survey of India in the preparation of toposheets.
6. Discuss the nomenclature and numbering system of topographical maps of India.
7. Explain India and adjacent countries series.
8. What do you mean by International Series of maps.
BA/BSC GE-103 PRACTICAL Uttarakhand Open University
UNIT 10 : INTERPRETAT ION OF TOPOSHEETS Page 146 of Page 159
UNIT 10 :INTERPRETATION OF TOPOSHEETS
10.1 OBJECTIVES
10.2 INTRODUCTION
10.3 PHYSICAL FEATURES
10.4 CULTURAL FEATURES
10.5 CONCLUSION
10.6 SUMMARY
10.7 GLOSSARY
10.8 ANSWER TO CHECK YOUR PROGRESS
10.9 REFERENCES
10.10 SUGGESTED READINGS
10.11 TERMINAL QUESTIONS
BA/BSC GE-103 PRACTICAL Uttarakhand Open University
UNIT 10 : INTERPRETAT ION OF TOPOSHEETS Page 147 of Page 159
10.1 OBJECTIVES
Geography is the study of places and complex relationship between people and their
environment.
It is main objective here to bring out the interconnection between people, places and
things.
The interpretation of topographical maps depends upon analysis of the various physical
and cultural features, by putting them together. Their interpretation provides a wealth of
information.
Here, the main objective is to develop such skill, so that we may drive a number of useful
information of area under study. It is also important to organize this information, and then
these should be explained in association. An adequate skill is required for such
interpretation.
10.2 INTRODUCTION
The understanding of surface features-physical and cultural both depends upon the
ability to interpret topographical map. These maps are based on accurate surveys. They show
a variety of landforms with carefully chosen conventional signs and symbols. These symbols
are used to represent natural features like hills, valleys, slopes, forests, drainage, as well as
man-made features like roads, railways, settlements, canals, agricultural farms, land use and
so on.
Topographical map of an area is a combination of a number of topo-sheets, since these
are large scale maps. Each sheet shows the features in details of a part of the whole area.
These maps cannot be fully understood without the knowledge of symbols used therein to
show different features. It is also to acquaint with the fact that the presence of one feature,
indicates what type of relationship with the other feature or features. For example, if the area
has dense forests, it means that it may be hilly area, it may have heavy rains, and it will have
the presence of wild animals. In the same way, if there is a presence of a number of
settlements, it will or may denote that the area is populous. It is full of means of livelihood,
and has possible area for further development. So their study needs a practical skill that is
developed through years of experience. It is possible only when we have full knowledge of
all geographical aspects.
10.3 PHYSICAL FEATURES
It is already mentioned, the understanding or reading of topographical map needs to
acquaintance of oneself with the legend or key given in the map for identifying various
physical and cultural features. These features are shown by conventional signs. These signs
or symbols are traditional and are being used by the users based on the universally accepted
formula. Their use has become our convention. In our country following conventional signs
are being used by our Survey of India. So it becomes, necessary to acquaint with these
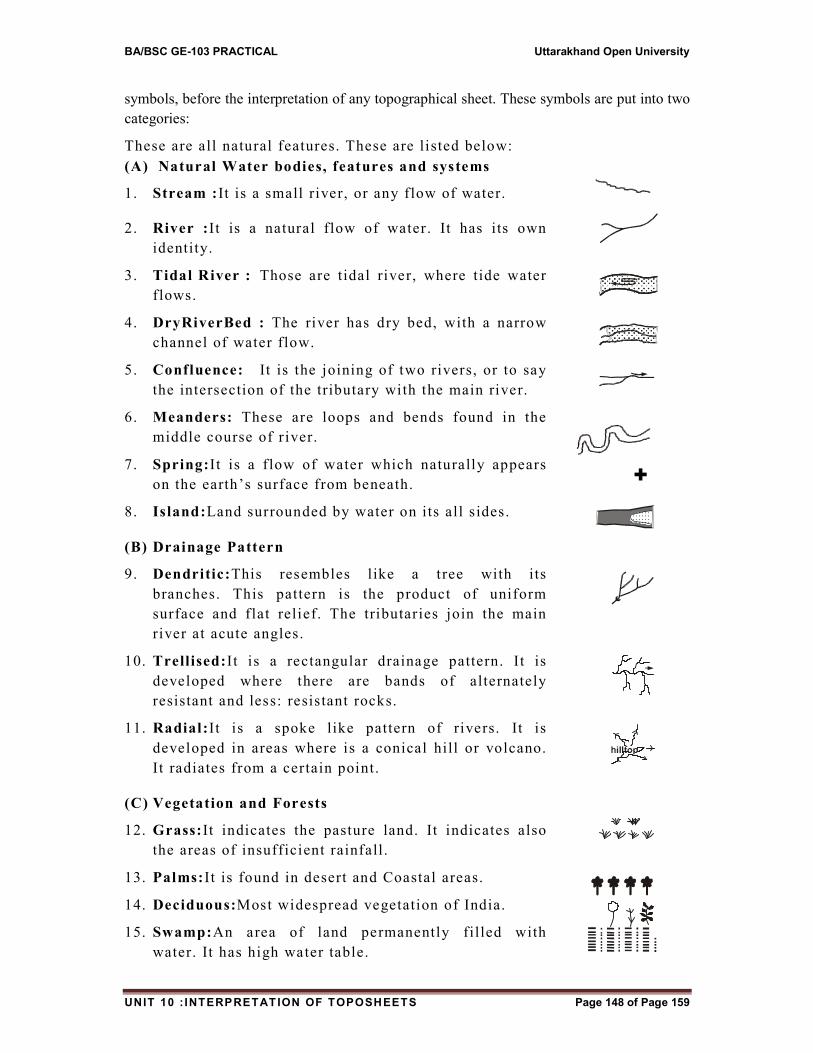
BA/BSC GE-103 PRACTICAL Uttarakhand Open University
UNIT 10 : INTERPRETAT ION OF TOPOSHEETS Page 148 of Page 159
symbols, before the interpretation of any topographical sheet. These symbols are put into two
categories:
These are all natural features. These are listed below:
(A) Natural Water bodies, features and systems
1. Stream :It is a small river, or any flow of water.
2. River :It is a natural flow of water. It has its own
identity.
3. Tidal River : Those are tidal river, where tide water
f lows.
4. DryRiverBed : The river has dry bed, with a narrow
channel of water flow.
5. Confluence: It is the joining of two rivers, or to say
the intersection of the tributary with the main river.
6. Meanders: These are loops and bends found in the
middle course of r iver.
7. Spring:It is a f low of water which naturally appears
on the earth’s surface from beneath.
8. Island:Land surrounded by water on its all sides.
(B) Drainage Pattern
9. Dendritic:This resembles like a tree with its
branches. This pattern is the product of uniform
surface and flat relief. The tributaries join the main
river at acute angles.
10. Trellised:It is a rectangular drainage pattern. It is
developed where there are bands of alternately
resistant and less: resistant rocks.
11. Radial:It is a spoke like pattern of rivers. It is
developed in areas where is a conical hill or volcano.
It radiates from a certain point.
(C) Vegetation and Forests
12. Grass:It indicates the pasture land. It indicates also
the areas of insufficient rainfall.
13. Palms:It is found in desert and Coastal areas.
14. Deciduous:Most widespread vegetation of India.
15. Swamp:An area of land permanently filled with
water. It has high water table.
+
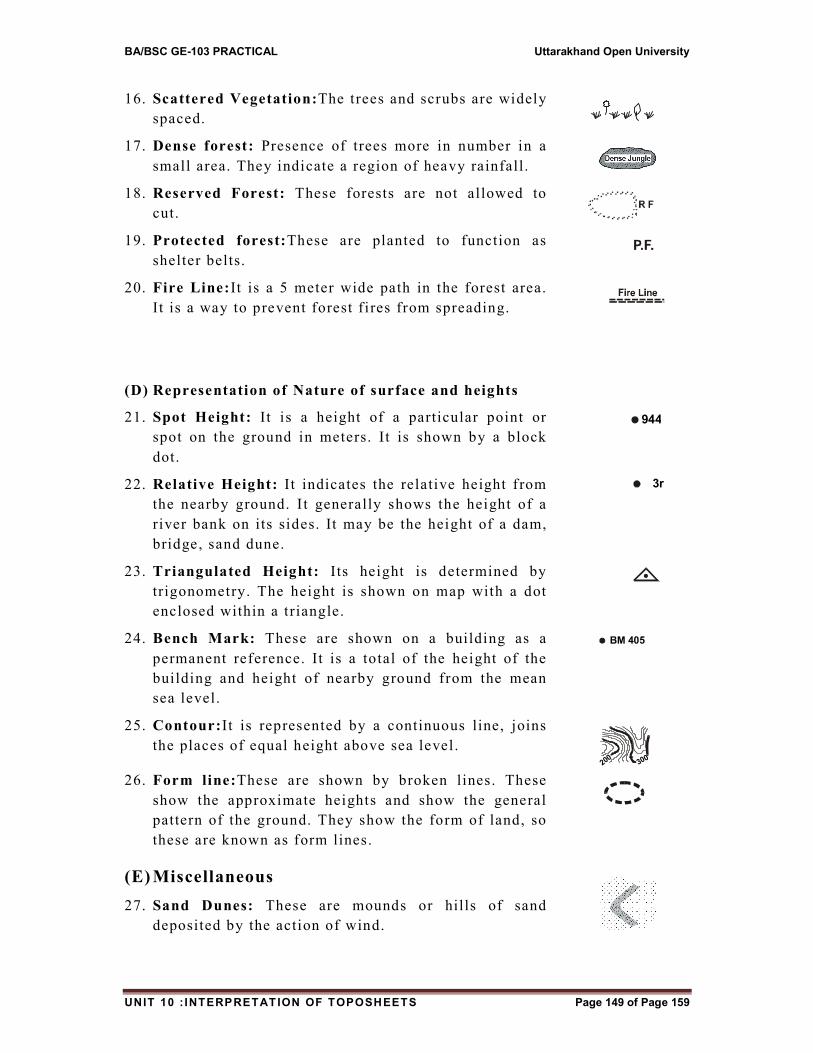
BA/BSC GE-103 PRACTICAL Uttarakhand Open University
UNIT 10 : INTERPRETAT ION OF TOPOSHEETS Page 149 of Page 159
16. Scattered Vegetation:The trees and scrubs are widely
spaced.
17. Dense forest: Presence of trees more in number in a
small area. They indicate a region of heavy rainfall.
18. Reserved Forest: These forests are not allowed to
cut.
19. Protected forest:These are planted to function as
shelter belts.
20. Fire Line:It is a 5 meter wide path in the forest area.
It is a way to prevent forest f ires from spreading.
(D) Representation of Nature of surface and heights
21. Spot Height: It is a height of a particular point or
spot on the ground in meters. It is shown by a block
dot.
22. Relative Height: It indicates the relative height f rom
the nearby ground. I t generally shows the height of a
river bank on its sides. It may be the height of a dam,
bridge, sand dune.
23. Triangulated Height: Its height is determined by
trigonometry. The height is shown on map with a dot
enclosed within a triangle.
24. Bench Mark: These are shown on a building as a
permanent reference. It is a total of the height of the
building and height of nearby ground from the mean
sea level.
25. Contour:It is represented by a continuous line, joins
the places of equal height above sea level .
26. Form line:These are shown by broken lines. These
show the approximate heights and show the general
pattern of the ground. They show the form of land, so
these are known as form lines.
(E) Miscellaneous
27. Sand Dunes: These are mounds or hills of sand
deposited by the action of wind.
944
3r
BM 405
200300
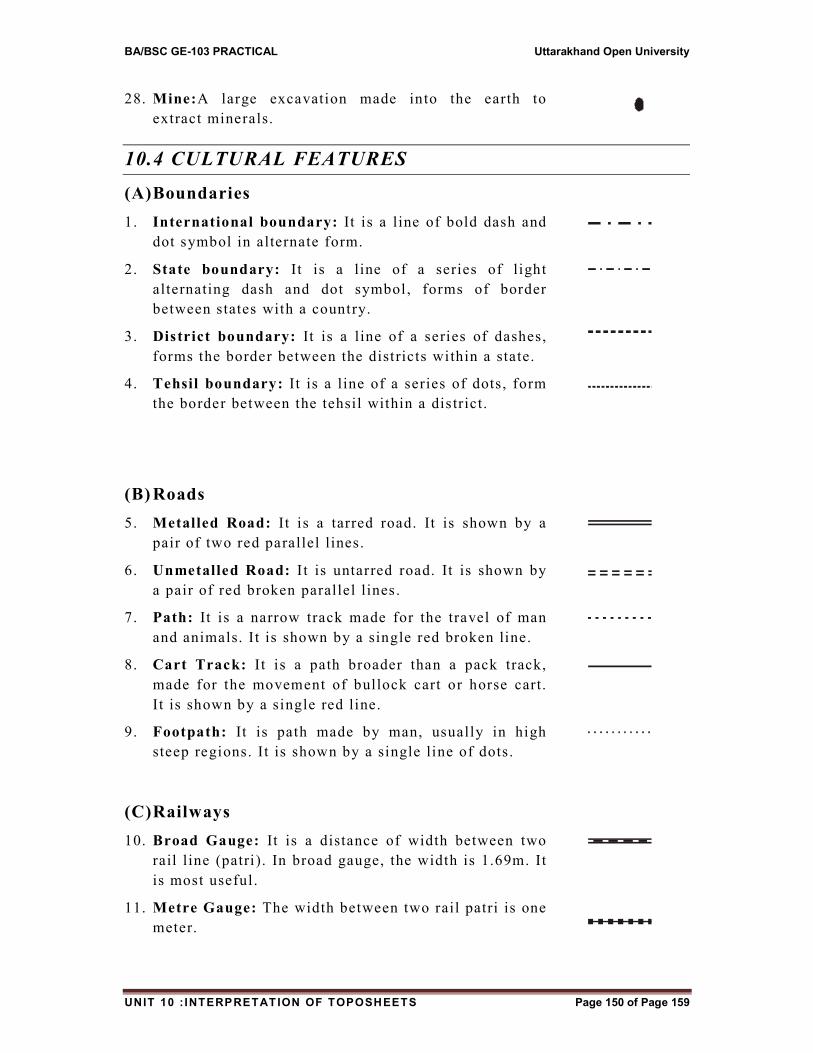
BA/BSC GE-103 PRACTICAL Uttarakhand Open University
UNIT 10 : INTERPRETAT ION OF TOPOSHEETS Page 150 of Page 159
28. Mine:A large excavation made into the earth to
extract minerals.
10.4 CULTURAL FEATURES
(A) Boundaries
1. International boundary: It is a line of bold dash and
dot symbol in alternate form.
2. State boundary: It is a line of a series of light
alternating dash and dot symbol, forms of border
between states with a country.
3. District boundary: It is a line of a series of dashes,
forms the border between the districts within a state.
4. Tehsil boundary: It is a line of a series of dots, form
the border between the tehsil within a dis trict.
(B) Roads
5. Metalled Road: It is a tarred road. It is shown by a
pair of two red parallel lines.
6. Unmetalled Road: I t is untarred road. It is shown by
a pair of red broken parallel lines .
7. Path: It is a narrow track made for the travel of man
and animals. It is shown by a single red broken line.
8. Cart Track: It is a path broader than a pack track,
made for the movement of bullock cart or horse cart.
It is shown by a single red line.
9. Footpath: It is path made by man, usually in high
steep regions. It is shown by a single line of dots.
(C) Railways
10. Broad Gauge: It is a distance of width between two
rail line (patri). In broad gauge, the width is 1.69m. It
is most useful .
11. Metre Gauge: The width between two rail patri is one
meter.
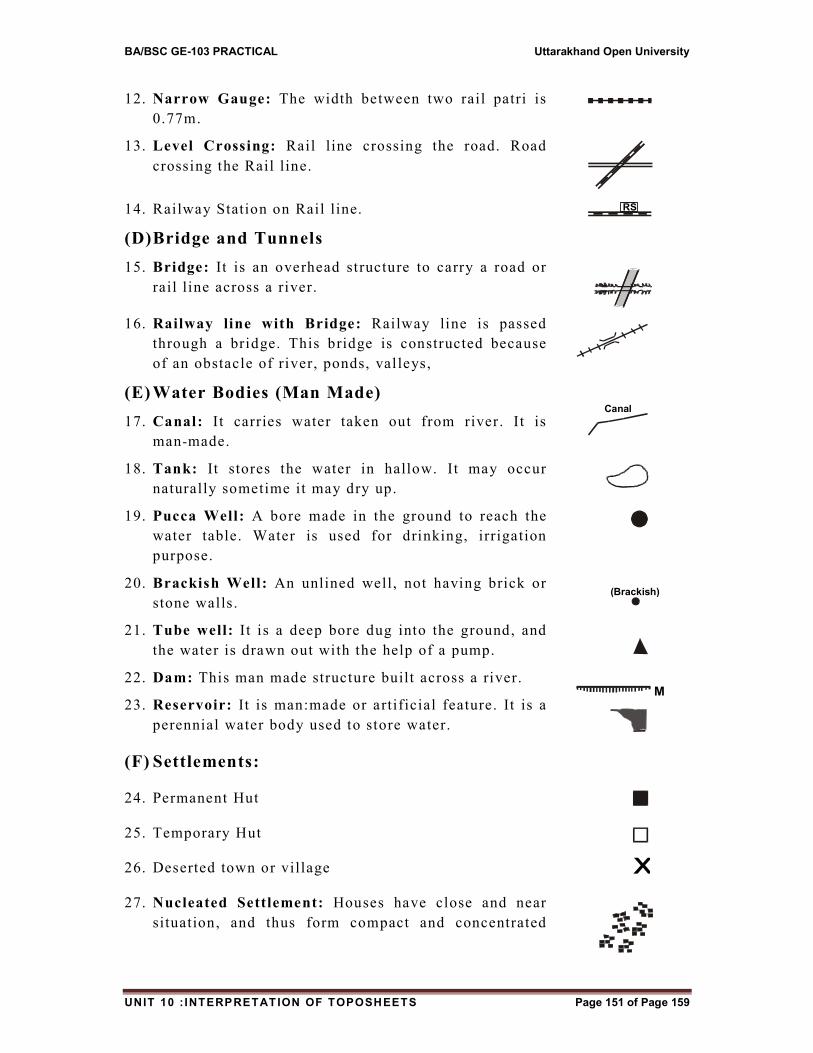
BA/BSC GE-103 PRACTICAL Uttarakhand Open University
UNIT 10 : INTERPRETAT ION OF TOPOSHEETS Page 151 of Page 159
12. Narrow Gauge: The width between two rail patri is
0.77m.
13. Level Crossing: Rail line crossing the road. Road
crossing the Rail line.
14. Railway Station on Rail line.
(D) Bridge and Tunnels
15. Bridge: It is an overhead structure to carry a road or
rail line across a river.
16. Railway line with Bridge: Railway line is passed
through a bridge. This bridge is constructed because
of an obstacle of river, ponds, valleys,
(E) Water Bodies (Man Made)
17. Canal: It carries water taken out from river. It is
man-made.
18. Tank: It stores the water in hallow. It may occur
naturally sometime it may dry up.
19. Pucca Well: A bore made in the ground to reach the
water table. Water is used for drinking, irrigation
purpose.
20. Brackish Well: An unlined well, not having brick or
stone walls.
21. Tube well: It is a deep bore dug into the ground, and
the water is drawn out with the help of a pump.
22. Dam: This man made structure built across a river.
23. Reservoir: It is man:made or artificial feature. It is a
perennial water body used to store water.
(F) Settlements:
24. Permanent Hut
25. Temporary Hut
26. Deserted town or village
27. Nucleated Settlement: Houses have close and near
situation, and thus form compact and concentrated
(Brackish)
M
x
RS
Canal
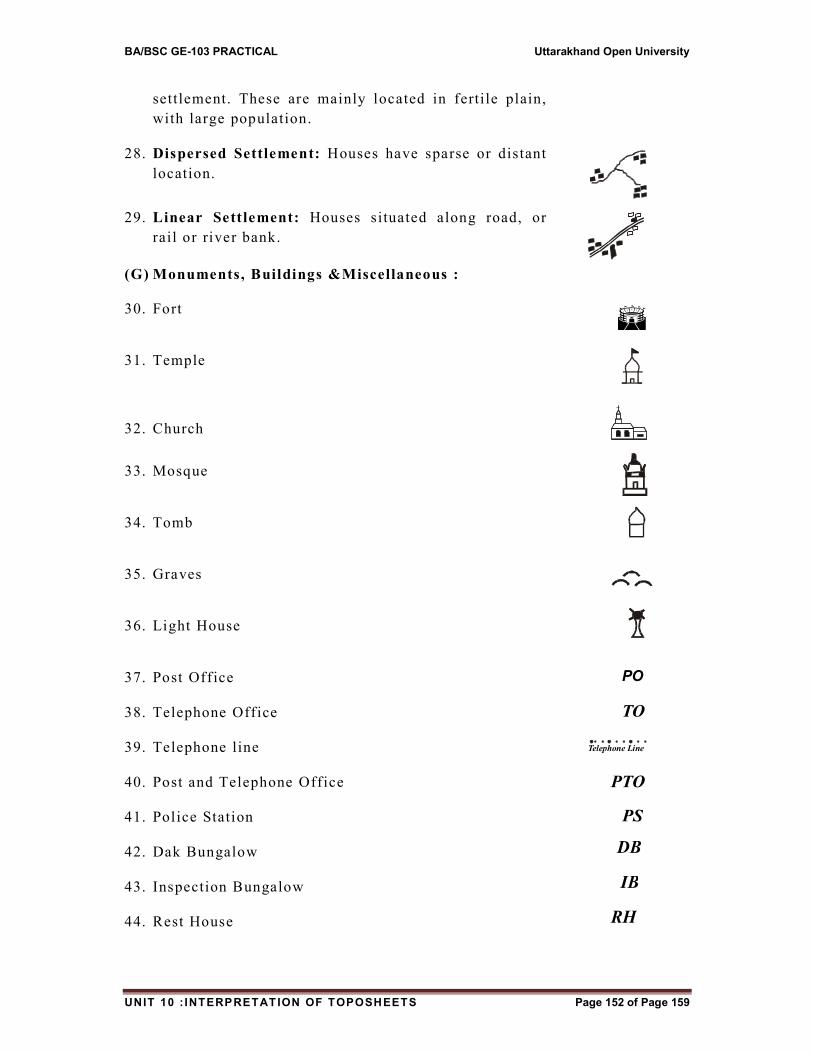
BA/BSC GE-103 PRACTICAL Uttarakhand Open University
UNIT 10 : INTERPRETAT ION OF TOPOSHEETS Page 152 of Page 159
settlement. These are mainly located in fertile plain,
with large population.
28. Dispersed Settlement: Houses have sparse or distant
location.
29. Linear Settlement: Houses situated along road, or
rail or river bank.
(G) Monuments, Buildings &Miscellaneous :
30. Fort
31. Temple
32. Church
33. Mosque
34. Tomb
35. Graves
36. Light House
37. Post Office
38. Telephone Office
39. Telephone line
40. Post and Telephone Office
41. Police Station
42. Dak Bungalow
43. Inspection Bungalow
44. Rest House
PO
TO
Telephone Line
PTO
PS
DB
IB
RH
BA/BSC GE-103 PRACTICAL Uttarakhand Open University
UNIT 10 : INTERPRETAT ION OF TOPOSHEETS Page 153 of Page 159
45. Circuit House
46. Aerodrome
47. Dispensary
48. Kiln
49. Battle f ield
50. Camping Ground
Topographical Map Reading and Interpretation
The interpretation topographical map depends on its keen and deep
observation. It depends on the skill of the person concerned and also on the
objective of the study. It is usually interpreted under the following heads:
1. Marginal information
2. Relief, drainage
3. Land use
4. Means of transport and communication
5. Human Settlements
6. Occupation
1. Marginal Information
These may be visualized in the following manner:
(i) The number of the toposheet- I t gives an idea that as to which part of
India it represents. For example toposheet number is 53G/9, 53G/10,
53F/15, 53F/16 shows part of Saharanpur and Haridwar districts .
Knowing the extent of districts, it can be said, these are the part of
western Uttar Pradesh and South Uttrakhand. It may be inferred that this
area is fertile and populous.
(ii) Latitudinal and Longitudinal Extent- These indicate that in which part
of the globe, the area is located.
On a 4 degree topographic map, suppose 53G, i t is extended in 4
latitudes and 4 longitudes.
On a 15 15 topographic map, suppose 53G/9, it is extended between
29045’ 30
0N and 7730 to 7745 E. The lines are drawn with an
interval of 15 (minutes).
(iii ) Scale: The scale is shown in representative f raction and also in linear
scale. On a 15 toposheet, the scale is 1:50,000. This means that 1 cm
on the map represents 500m on the ground.
CH
Dispensary
Brick Kiln
CG
BA/BSC GE-103 PRACTICAL Uttarakhand Open University
UNIT 10 : INTERPRETAT ION OF TOPOSHEETS Page 154 of Page 159
(iv) Eastings and Northings :Along the margins of a toposheet, the
eastings and northings values, in degrees are indicated. Each sheet has
a grid of nine rectangles. Each grid shows the extent of 5 5 area. It
helps us to define the eastern and northern location of the object in the
grid.
(v) Direction of the True North and the Magnetic North variation: The
longitude lines indicate True North. In the upper side of toposheet
magnetic variation f rom true north with year is mentioned also.
(vi) Legend : At the bottom of the topographical map, a list of commonly
used conventional signs and symbols are shown. This is the character
of sheet.
(vii) Contour Interval : It is the difference in height between two
consecutive contour lines. The sheet with scale 1:50,000 has the
contour interval of 20 metres.
(2) Relief and Drainage
Relief i .e. the nature of surface and pattern of drainage are closely
associated to each other. It is essential to note the highland areas and lowland
areas. Slope is in which direction. What is the nature of slope.Highland areas
have which type of landforms. What is the height of the area. Lowland areas
have what nature of slope? Land is f lat. What type of soils are present in the
area?
Which are main rivers? Find out the name and their t ributaries. Rivers
are straight or meandering. Is there any prominent water divide in the region.
Are there any peculiarities in the drainage system? The rivers have presence
of water, or are dry. What is the relative height of river bank? It will entail
us about the depth of river water. Discuss also the gradient of the prominent
rivers.
(3) Landuse
It is an indication of economy of the area. The presence of canals, tanks
and tube-wells is an indication of intensive use of the land for agriculture.
Silt deposition by the rivers indicates that the land is very good for
agriculture. The presence of f lat land also indicates multiuse of land. It is
also to note important ways in which the land is used. It also helps in
determining possible major occupations or sources of livelihood of the
people.
(4) Vegetation and Forests
The analysis of the types of vegetation provides possible clues about the
climate and soil. Their presence also helps in the determination of nature of
occupation. Presence of grassland is a feature of animal herding and animal
based occupation like dairy and so on. Deciduous forests are most widespread
BA/BSC GE-103 PRACTICAL Uttarakhand Open University
UNIT 10 : INTERPRETAT ION OF TOPOSHEETS Page 155 of Page 159
vegetation of our country. Scattered scrub trees are an indication of low rain,
and also an evidence of infertile land, only suitable for animal grazing.
Dense forest indicates that area receives heavy rainfall and it is least
accessible. The presence of fire line also is an evidence of dense plant trees.
If hill sides are lacking in vegetation, that it means the area is eroded by
numerous streams.
(5) Means of Transport and Communication
The sheet shows all different means of transportation developed in the
area. The presence of roads and railways is highly influenced by relief of the
land. Roads can negotiate the steeper gradients but railways not. So roads can
be marked in steeper areas.
The network of roads and railways is an indication of economic prosperity of
the area. They indicate greater movement of passengers and goods. It is to be
studied; the nature of roads, number of routes goes through the region. What
are their destinations? How many over-bridges are there. Railways are of
which gauge. They cross the tunnels, and bridges. They have embankments
along rivers.
What types of communications are developed there? Telephone lines,
Telephone office, Postal Services are to be visualized in the area.
(6) Settlements
The presence of settlements in the form of towns and vil lages reflect the
economic and social development of the area. They determine the landuse of
the area. The pattern of distribution, sites, functions of settlements are
necessary to be examined. Settlements may have nucleated, dispersed or
linear pattern. Settlements sites are of either natural or cultural importance.
They have central location. The occupancy area of the settlement is an
indication of its size and density. Congested shape indicates the inhabitance
of more population.
Occupation of the area can also be identif ied. The presence of fertile and
level land with irr igation facilities indicates the agriculture as a main
occupation. Such land is shown in yellow colour. Forests indicate lumbering.
Pastures are an evidence of cattle rearing. Fishing is inspired by the presence
of plenty of rivers, tanks, reservoirs. Mines in the area have mining
activities. Dense set tlements near roads have industrial and trade activities.
The presence of religious, natural beauty centres, hotels, indicates the
activity of tourism in the area.
BA/BSC GE-103 PRACTICAL Uttarakhand Open University
UNIT 10 : INTERPRETAT ION OF TOPOSHEETS Page 156 of Page 159
10.5 CONCLUSION
The interpretation of topographical maps is a difficult task. I ts analysis
depends on the skill of the scholar, who can derive useful infomation. These
maps entail physical and cultural features in very detail, which are useful for
the geographical knowledge of the area. These features are shown by
conventional symbols. These symbols represent each and every detail, present
in the toposheet of the area. Topographical maps are interpreted under the
heads marginal information, relief , drainage, land use, means of transport and
communication, human settlements and occupations of the people.
10.6 SUMMARY
Topographical maps are the directive of geography of an area. Their
interpretation acquaints us with such information for which we do not need to
have a visit of the area in the first instance. Topographical maps show a
variety of landforms with carefully chosen conventional signs and symbols. A
topographical map of an area is a combination of a number of toposheets.
These are large scale maps and thus, show different features in much detail.
The presence of one feature indicates its relations with the other features.
The presence of dense net-work of roads is an evidence of populous
settlements, more number of settlements, developed economy. Such
observation can be made after a careful study of the toposheet.
Conventional signs are traditional sign, which are universally used and are
acceptable by all disciplines. These can be put into two categories, physical
and cultural features. Physical features are water bodies, drainage pattern,
vegetation and forests, nature of surface and heights, and landforms. The
main cultural features are administrative boundaries, roads and railways,
bridge, tunnels, embankments, man-made water bodies, settlements,
monuments, buildings.
Topographical maps, if studied systematically can yield a lot of information.
These are interpreted in the heads of marginal information, relief , drainage,
landuse, means of transport and communication, human settlements and
occupations. Marginal information explain the number of toposheet,
latitudinal and longitudinal extent, scale of the map, eastings and northings,
direction of the true north and the magnetic north variation, legend and
contour interval .
The study of Relief acquaints with the nature of surface, nature of slope.
Drainage means the flow of main rivers and their tributaries their pattern of
f low and depth of river water. Landuse is an indication of the economy of the
area. The study of vegetation and forests give us possible clues about the
climate and soil. Means of transport and communication include the pattern
BA/BSC GE-103 PRACTICAL Uttarakhand Open University
UNIT 10 : INTERPRETAT ION OF TOPOSHEETS Page 157 of Page 159
of roads, type of roads, over- bridges, rail line with their gauge
characteristics. Their net-work indicates the economy of the area. Settlements
in the form of villages and towns reflect the economic and social pattern of
the area. Their presence affect the landuse and economy of the people of the
area. The landuse pattern determines the occupation of the people.
10.7 GLOSSARY
Bench Mark : Exact height of specific points on prominent and durable
material objects like rocks or buildings in the field. It is indicated by BM.
Contour :An imaginary line joining the places having equal elevation or
altitude above mean sea level.
Contour Interval :It is between two successive contours. It is also known as
vertical interval.
Drainage :A system of rivers or streams which drain all the rain water that
fall in a region.
Grid :The network of latitudes and longitudes on the earth’s surface.
Hachures :Small straight lines, running across the contours. These are shown
by broken lines.
Land use :The use which is made by man of the surface of the land.
Legend :A description, explanation, table of symbols, and other information
given on the map.
Magnetic North :The direction pointed to by the needle of the magnetic
compass.
Relief :The variation of elevation from one place to another place. I t is a
collectivity of the land surface.
Spot Height :The exact height of a given spot. It is expressed in meters or
feet.
True North :The direction towards which the North Pole of the earth points .
It is also known as Geographic North.
Water Shed :A narrow elevated tract of ground separating water f lowing in
opposite directions.
Elevation :It refers to the height of the earth’s surface above or below the
sea level.
Inland Drainage :in where the rivers do not reach the sea.
10.8 ANSWER TO CHECK YOUR PROGRESS
1. The extent of 1:50,000 toposheet- 15’latitude & 15’ longitude and the
scale is 1cm = 500m.
2. Topographical Map is a combination of number of toposheets.
BA/BSC GE-103 PRACTICAL Uttarakhand Open University
UNIT 10 : INTERPRETAT ION OF TOPOSHEETS Page 158 of Page 159
3. River is a natural f low of water.
4. Confluence is a meeting of two rivers.
5. Dendiritic, trellis and Radial are the patterns of drainage.
6. The presence of grassland is an indication of pastoral farming.
7. Dense forest indicates the moist and rainy climate.
8. Spot height is the exact height of a part icular point .
9. Contour lines are lines of equal height based on actual surveys.
10. Sand dunes presence denotes the sandy and infertile soils.
11. Four type of administrative boundaries are shown international, state,
tahsil and district.
12. Roads have a variety of metalled, unmetalled, footpath, Cart t rack.
13. Broad, metre and narrow are three main rail gauges.
14. Canal is a man-made river or flow of water.
15. Settlements are nucleated, dispersed and linear.
16. Sheet No. 53 G/9 inferences- 15 15 extent, 1:50,000 scale.
17. True North indicates towards North Pole.
18. Grid is a gratitule of latitudes and longitudes.
19. Magnetic variation is a deflection between magnetic north and true
north.
20. Contour interval- Difference of height between two contours .
21. Landuse- the use of land for various purposes.
22. The dense network of transport is an indication of developed economy of
the area.
10.9 REFERENCES
Bhat, L.S.: Aslam Mahmood: Field work Laboratory Techniques in
Geography– A practical Geography Text Book NCERT. New Delhi, 2009
D. Helen: A to Z Social Sciences: Flaming Books (Export) New Delhi,
2003
Gaur, KripaShanker: Manchitra Kala kiSameeksha: Agra Book Store,
Agra, 1968
Monkhouse, F.J. & H.R. Wilkinson: Maps and Diagrams, University
Paper Backs, Methuen, London, 1966.
Rajan, Rita: A text book of Geography-IX- General Printers &
Publishers, Mumbai, 2003.
Singh, R.,B.: Practical work in Geography Pt. 3, NCERT, New Delhi
2002.
Sharma, J .P. :PrayogikBhugol : Rastogi Publication, Meerut, 2015.
BA/BSC GE-103 PRACTICAL Uttarakhand Open University
UNIT 10 : INTERPRETAT ION OF TOPOSHEETS Page 159 of Page 159
Singh, R.L.: Elements of practical Geography, Students Friends,
Allahabad 1966.
10.10 SUGGESTED READINGS
Gaur, KripaShanker: Manchitra Kala kiSameeksha: Agra Book Store,
Agra, 1968
Monkhouse, F.J. & H.R. Wilkinson: Maps and Diagrams, University
Paper Backs, Methuen, London, 1966.
Sharma, J .P. :PrayogikBhugol : Rastogi Publication, Meerut, 2015.
Singh, R.L.: Elements of practical Geography, Students Friends,
Allahabad 1966.
10.11 TERMINAL QUESTIONS
1. What are contours?
2. What does the spacing of contours indicate?
3. What are conventional signs?
4. What is meant by layer contouring?
5. Write a short note on marginal information in Toposheets.
6. Explain what is meant by interpretation of toposheets. What information
would you l ike to seek and how would you derive the information?
7. Discuss the importance of physical features as shown on toposheets.
8. Discuss the importance of cultural features as shown on toposheets
9. What is meant by Drainage Pattern with regard to flow of rivers?
10. Discuss different types of pattern of settlements.
11. How can you identify the occupations of the people in a particular
topographical map?
12. Discuss the techniques for the interpretation of means of transport and
communication.


