Embed Size (px)
Citation preview
1
Predictability of drug expenditures: an application using morbidity
data
Manuel García-Goñi Pere Ibern Universidad Complutense de Madrid Universitat Pompeu Fabra
September 27, 2006
Address for correspondence: Manuel García Goñi, Universidad Complutense de Madrid, Departamento de Economía Aplicada II. Campus de Somosaguas. 28223 Pozuelo de Alarcón (Madrid). Email: [email protected] Tel +34913942455 Fax +34913942457. This research was supported by an unrestricted educational grant awarded jointly to the Universities Carlos III de Madrid and Pompeu Fabra of Barcelona by The Merck Foundation, the philanthropic arm of Merck Co. Inc., White House Station, New Jersey, USA. Manuel García-Goñi also received support from project SEJ2004-01959 (Ministry of Science and Technology, Spain). Acknowledgements: Jordi Coderch, Josep M. Inoriza and Jordi Calsina from Serveis de Salut Integrats del Baix Empordà have supported this research with data and analysis. Norbert Goldfield and Jon Eisenlander from 3M Health Information Systems have contributed to the classification. We also thank Ricardo Mora, Pedro Albarrán, participants at seminar at Universidad Carlos III de Madrid and at AES Annual Meeting, and two anonymous referees for their helpful comments. Keywords: drug expenditure, risk-adjustment, morbidity, clinical risk groups.
2
Abstract
The growth of pharmaceutical expenditure and its prediction is a major concern for
policy makers and health care managers. This paper explores different predictive
models to estimate future drug expenses, using demographic and morbidity individual
information from an integrated healthcare delivery organization in Catalonia for years
2002 and 2003. The morbidity information consists of codified health encounters
grouped through the Clinical Risk Groups (CRGs). We estimate pharmaceutical costs
using several model specifications, and CRGs as risk adjusters, providing an alternative
way of obtaining high predictive power comparable to other estimations of drug
expenditures in the literature. These results have clear implications for the use of risk
adjustment and CRGs in setting the premiums for pharmaceutical benefits.
3
Introduction
The growth of pharmaceutical expenditures is a current major concern for health policy
makers in Spain. There, drug expenditures have grown in the last decade to represent
around 23% of total health expenditures in 2004 [1]. As a consequence, the policy
agenda is focused on how these increasing expenditures should be financed and
consider issues like copayment, how to selectively finance medicines, or introducing
price competition in generic drugs [2]. This paper proposes risk adjustment as a tool for
predicting drug expenditures and for setting the premiums for pharmaceutical benefits
using individual data. We apply several specifications for the estimation beyond the
usual linear specification and compare our predictability results with others from the
literature.
The analysis of pharmaceutical consumption should start with information about what is
prescribed and for which pathology, what is consumed and how much it costs at
individual level. In order to establish a relationship between pharmaceutical
consumption and morbidity, we need two essential sources: individual information
about pharmaceutical costs and morbidity. Up to now, these sources have been difficult
to get and therefore, the debate has focused on averages and growth rates, providing
little information to take decisions at policy and management level [3].
Although several studies have used pharmacy data to predict total health care costs
[4,5,6,7,8,9], only a few have addressed the issue of predictability of drug spending. A
feasible explanation is that usually private insurers do not offer free standing drug
benefits, and public programs offering those benefits have not developed private risk-
based contracts [10]. Using only demographic information and past cost, two studies in
4
the 1990s [11,12] showed the highly persistent behavior of drug expenditures and the
low predictive power of using only demographic information (from 02.02 =R to
04.02 =R ). Adding health status (morbidity) information through the diagnosis cost
group/hierarchical condition category (DCG/HCC) risk-adjustment methodology
[10,13], different prospective models obtain higher predicting power with an R2
between 0.10 and 0.24, while adding lag expenditures raised it to 0.55 [10]. Lastly,
Pharmacy Categories (Rx-Groups) have also been used to predict pharmacy costs [13]
obtaining an 2R near 0.50, and therefore explaining almost half of the variation of the
cost in the subsequent year.
This paper fits in the literature predicting drug expenditures using a classification
system for health status that allows to understand population morbidity [14,15]. We
apply the Clinical Risk Groups (CRGs) classification system, which allows classifying
individuals in mutually exclusive categories attending to their clinical conditions. It
differs from the DCG/HCC methodology, that allows multiples categories for each
individual. The CRG methodology uses information from the encounters between the
health system and the patients, and allocates a severity level to each patient [16]. The
uniqueness of the CRGs compared to other methods is that it supports clinical
meaningfulness, the severity levels and its multiple applications.
In this paper, we link pharmaceutical consumption (outpatient, specialist, and hospital)
and the morbidity in a publicly funded healthcare system environment using CRGs as a
risk adjustment system. In our estimations we use three different specifications. Then
we test the predictive power of our different models and compare our results to others in
the literature. Finally, as a policy implication and based on our findings, we advocate
the use of risk adjustment in setting the premiums for pharmaceutical benefits.
5
Data
We utilize individual demographic (age and sex) and morbidity data in year 2002 and
pharmaceutical expenditures in 2002 and 2003 from 87,691 individuals belonging to the
Serveis de Salut Integrats Baix Empordà (SSIBE), an integrated health care delivery
organization in Catalonia, Spain. For inpatient services, population covered by the
integrated delivery system can use the only hospital in the county – Palamós Hospital –,
while for outpatient services there are five different primary care areas. In our analysis
we use primary care, specialized care, and inpatient consumption of pharmaceuticals for
all individuals belonging to four primary care areas: Palamós, Torroella, la Bisbal and
Palafrugell. In 2002 there were 52,916 individuals (60.35% of population) with non-
zero drug expenditures, consuming 1,206,008 prescriptions worth a total 15,124,842
euros, including public funding (CatSalut), out-of-pocket payment (copayment), and
hospital consumption. The fifth primary care area – Sant Feliu de Guíxols – is out of the
analysis because of incomplete data.
The database contains 1,241,127 procedures and diagnostic codes for year 2002. Every
encounter between individuals and the organization is identified, registered, and coded
using ICD-9-CM (The International Classification of Diseases, 9th Revision, Clinical
Modification), allowing the allocation of pharmacy costs by individuals. The CRG
grouping assigns one CRG category to each patient. We use the maximum level of
aggregation allowed by the CRG classification system, collecting morbidity in 9
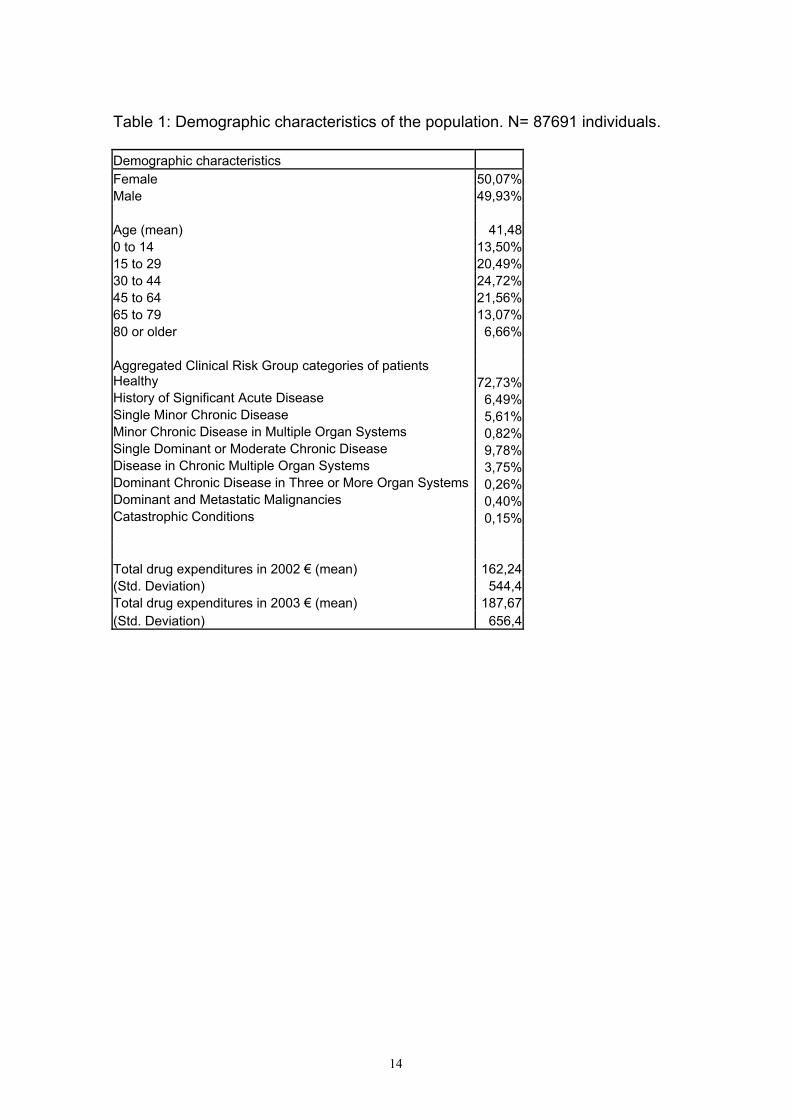
different patient groups. Table 1 shows the demographic characteristics of the
population and the composition of the 9 CRG categories. The CRG system assigns one
level of severity to each patient within the CRG category, so that in our database
6
individuals are classified in 37 different risk groups (ACRG3), while the grouper
allocates to 1081 groups at a more disaggregated level.
Estimation Methods
This paper estimates different models in order to predict drug expenditures in the
subsequent year. Our objective is to examine the predictive properties of different
models which use different information and how well they explain future cost. The
basic model is characterized by:
),,,,( ,1,,1,1,, titittiititi ituresDrugExpendusHealthStatsexagefituresDrugExpend ε−−−=
Thus, drug expenditures in year t for individual i are explained by some independent
variables or risk adjusters. Model 1 uses only demographic information (age and sex).
Model 2 considers also information on drug expenditures incurred by the individual last
year (t-1). Model 3 uses only prospective information on health status in previous year
(t-1) provided by the CRG classification system. Model 4 is a prospective model using
both demographic and health status information in previous year. Models 5 and 6 are
concurrent models analogous to models 3 and 4. Thus, model 5 uses only health status
information in year t in order to explain drug expenditures in year t, and model 6 uses
also demographic information.
The typical specification in the risk adjustment literature is a simple specification, in
which individuals are assigned to, say, age-sex cells. This specification is nonparametric
in the sense that the parameters of the expectation conditional on age and sex are of free
variation. In this paper we also consider two other specifications: a “parametric”
specification in which the sex and age of each individual enter as independent variables
7
in a nonlinear specification (sex, age, age2, age3, age4); and a more flexible parametric
specification which, for convenience, can be termed as “flexible-parametric”, in which
interactions between age and sex are explored in a nonlinear way (age, age2, age3, age4,
sex*age, sex*age2, sex*age3, sex*age4). Our dependent variable, drug expenditures, is a
censored variable ( 0≥ituresDrugExpend ) with a large number of zeros (39.65%).
Therefore, besides of using OLS, we also run a tobit estimation in our different model
specifications.
The main indicator we use in order to measure how well the different model predicts is
the 2R that measures the proportion of the variation of future costs that the model
predicts. Another indicator widely used is the Predictive Ratio ( PR ) [17,18,19], which
is the ratio of predicted cost to actual cost within a group of individuals of interest. If
the predictive ratio is very close to one, the model predicts well for that group of
individuals. If 1<PR , the model underpredicts for those individuals, and if 1>PR , it
overpredicts. We randomly divide the population in two subsets: the estimation sample
and the validation sample. We obtain the predictive models from the estimation sample
and calculate the PR for the validation sample for individuals of different demographic
cells (age and sex) and for individuals belonging to different CRG categories.
Lastly, we provide a third indicator, Validated- 2R ( 2~R ), obtained using the predicted
model from the estimation sample in the validation sample, and calculating the ratio of
the sum of squares explained by that predicted model to the ratio of total sum of squares
in the validating sample.
Results
8
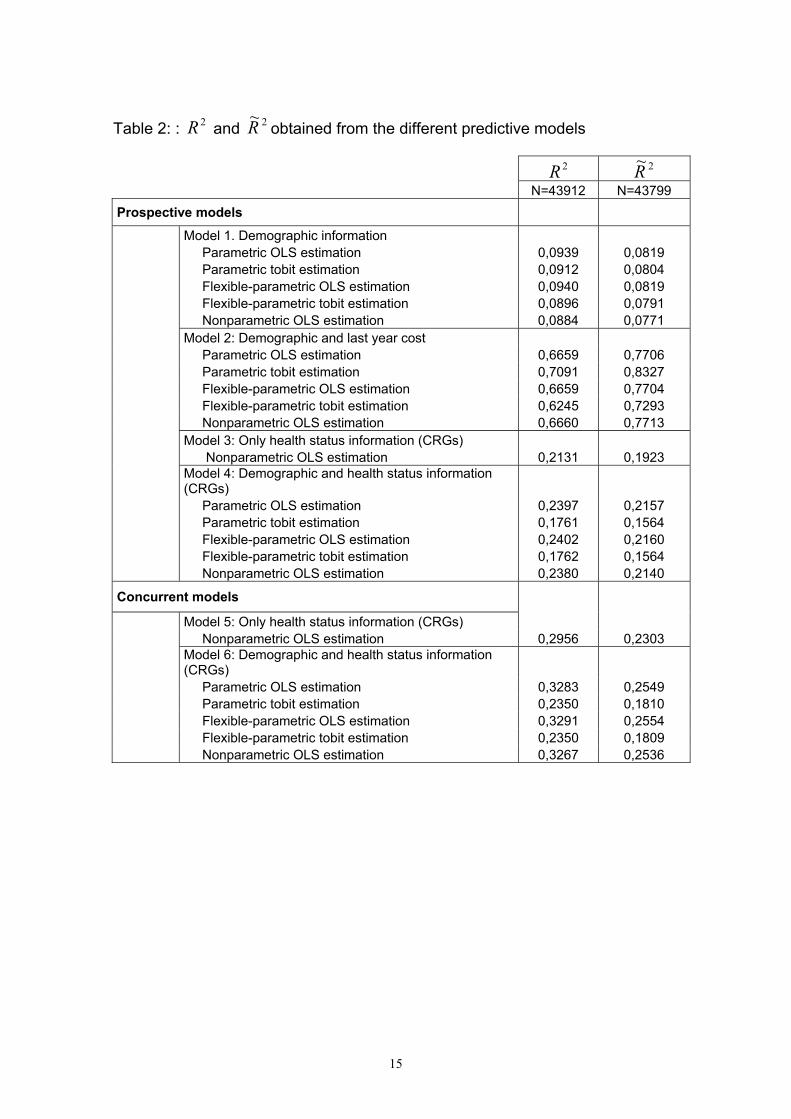
Table 2 shows the 2R and the Validated- 2R ( 2~R ) for the different predictive models
analyzed under our different model specifications for both, OLS and tobit estimations.
The proportion of explained variance increases with the quality of information used in
the model. With respect to prospective models, model 1 (only demographic
information) presents an 2R close to 9%, while in the case of model 3, with only health
status information through the CRG classification system, it is of 21%. When
demographic and CRG information are combined (model 4), the proportion of
explained variance is around 24%. In concurrent models, the same relationship is
obtained with higher predictive power, improving the 2R from around 30% using only
CRG information (model 5) to 32% when demographic information is added (model 6).
Although the normal use of risk adjustment is restricted to OLS linear nonparametric
estimations, we have considered two more flexible alternative specifications,
“parametric” and “flexible-parametric”, in order to evaluate whether the role of
demographic characteristics and its interaction and clinical conditions could be better
explored. However, we have found very similar 2R in the three specifications, meaning
that with only demographic and CRG information, “nonparametric” models work as
well as “parametric” or “flexible-parametric” models, being simpler to interpret and use.
Estimations from “nonparametric” models are very precise; and given the low
correlation between age and sex, we obtain consistent and robust estimators. We also
tried another “flexible-parametric” specification using the interaction of age and clinical
conditions (CRG) but results were not improved. The 2~R obtained for the validating
sample from predictions in the estimation sample are normally slightly lower but follow
the same pattern than the 2R reported, validating the results. Tobit estimations obtained
9
in general a lower 2R than OLS models, although they predict better drug expenditures
for non users.
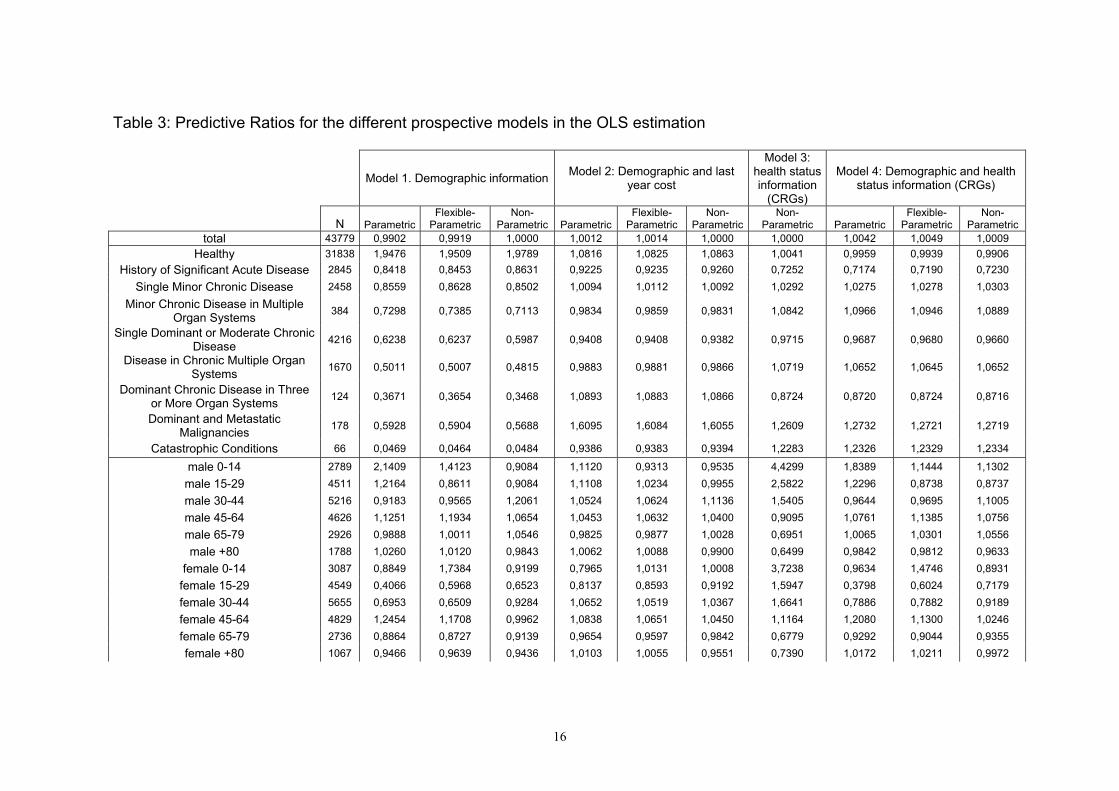
Table 3 shows the Predictive Ratio ( PR ) calculated for the different prospective models
and for different groups of individuals, by clinical conditions and by age and sex. The
demographic models overpredict drug expenditures for healthy individuals while
underpredict those expenditures for the rest. Models using CRG information obtain PR
very close to 1 for the different groups by clinical conditions, but model 4, using also
demographic information also obtains very close to 1 PR for the different demographic
groups, being specially good for predicting drug expenditure of healthy individuals
( 99.0=PR ) or for female older than 80 ( 99.0=PR ).
Thus, adding diagnostic information through the CRG classification system from only
demographic information in our sample obtains similar results than adding that
information through HCC/DCG in other samples as has been shown in the literature
until a maximum 2R of 0.24 [10,13] in prospective models and with a higher 2R of
0.66 in the case of concurrent models. Therefore, the CRG classification system has
shown in this sample of individual data to be an alternative to other classification
systems as the HCC/DCG in order to predict drug expenditures
Conclusions
The growth of pharmaceutical expenditure has created a need to improve its prediction
in order to set appropriate budgets. In this paper we present the Clinical Risk Group
classifications system (mutually exclusive categories providing individual clinical
conditions and severity level) as an alternative to other morbidity classifications
systems. Our results present CRGs as a risk adjuster with similar predicting power for
10
drug expenditures to other methods in prospective models and some higher proportion
of variance explained in concurrent models. Provided the predictive power, the use of
prospective risk adjustment is recommended in setting premiums for pharmaceutical
benefits or in setting a budget constraint of public expenditures taking into account the
characteristics or risks of the covered population. As a next step, once premiums and
budgets are set adjusted to population characteristics and risks, risk adjustment is
potentially profitable as a tool for controlling the drug expenditure and providing
incentives for efficiency in the use of pharmaceutical benefits.
11
References
1. OECD Health Data. 2006.
2. Puig-Junoy J. Incentives and pharmaceutical reimbursement reforms in Spain.
Health Policy 2004; 67:149-165.
3. García-Sempere A, Peiró S. Gasto farmacéutico en atención primaria: variables
asociadas y asignación de presupuestos de farmacia por zonas de salud. Gaceta
Sanitaria 2001; 15:32-40.
4. Sales AE, Liu CF, Sloan KL, Malkin J, Fishman PA, Rosen AK, Loveland S,
Paul Nichol W, Suzuki NT, Perrin E, Sharp ND, Todd-Stenberg J. Predicting
costs of care using a pharmacy-based measure risk adjustment in a veteran
population. Medical Care 2003; 41(6):753-60.
5. Fishman PA, Goodman MJ, Hornbrook MC, Meenan RT, Bachman DJ,
O'Keeffe Rosetti MC. Risk adjustment using automated ambulatory pharmacy
data: the RxRisk model. Medical Care 2003; 41(1):84-99.
6. Zhao Y, Ellis RP, Ash AS, Calabrese D, Ayanian JZ, Slaughter JP, Weyuker L,
Bowen B. Measuring population health risks using inpatient diagnoses and
outpatient pharmacy data. Health Services Research 2001; 36(6 Pt 2):180-93.
7. Lamers LM. Pharmacy Costs Groups: a risk-adjuster for capitation payment
based on the use of prescribed drugs. Medical Care 1999; 37:824–830.
12
8. Lamers LM, van Vliet RC. The Pharmacy-based Cost Group model: validating
and adjusting the classification of medications for chronic conditions to the
Dutch situation. Health Policy 2004; 68(1):113-21.
9. Powers CA, Meyer CM, Roebuck MC, Vaziri B. Predictive Modeling of Total
Healthcare Costs Using Pharmacy Claims Data A Comparison of Alternative
Econometric Cost Modeling Techniques. Medical Care 2005; 43(11):1065-1072.
10. Wrobel MV, Doshi J, Stuart BC, Briesacher B. Predictability of prescription
drug expenditures for Medicare beneficiaries. Health Care Financing Review
2003 Winter; 25(2):37-46.
11. Coulson N, Stuart B. Persistence in the Use of Pharmaceuticals by the Elderly:
Evidence from Annual Claims. Journal of Health Economics 1992; 11(3):315-
328.
12. Stuart B, Ahern E, Rabatin V, Johnson L. Patterns of Outpatient Prescription
drug use among the elderly: evidence from the PACE program. Health Care
Financing Review 1991 Spring; 12(3):61-72.
13. Zhao Y, Ash AS, Ellis RP, Ayanian JZ, Pope GC, Bowen B, Weyuker L.
Predicting pharmacy costs and other medical costs using diagnoses and drug
claims. Medical Care 2005; 43(1):34-43.
14. Van de Ven W, Ellis RP. Risk adjustment in competitive health plan markets.
In: Culyer AJ, and Newhouse, JP, ed. Handbook in Health Economics.
Amsterdam: Elsevier, 2000:755-845.
13
15. Rakovski C, Loveland, SA, Anderson JJ, Berlowitz DR, Ash A. Evaluation of
Diagnosis-Based Risk Adjustment Among Specific Subgroups: Can Existing
Adjusters be Improved by Simple Modifications? Health Services and Outcomes
Research Methodology 2002; 3:57-73.
16. Hughes JS, Averill RF, Eisenhandler J, Goldfield NI, Muldoon J, Neff JM, Gay
JC. Clinical Risk Groups (CRGs). A classification System for Risk-Adjusted
Capitation-Based Payment and Health Care Management. Med Care 2004;
42:81-90.
17. Ash AS, Ellis RP, Pope GC, Ayanian JZ, Bates DW, Burstin H, Iezzoni LI,
MacKay E, Yu W. Using diagnoses to describe populations and predict costs.
Health Care Financing Review 2000; 21:7–28.
18. Ash AS, Byrne-Logan S. How well do models work? Predicting health care
costs. Proceedings of the Section on Statistics in Epidemiology of the American
Statistical Association, Dallas, 1998.
19. Cumming RB, Knutson D, Cameron BA, Derrick B. A comparative analysis of
claims-based methods of health risk assessment for commercial populations.
Final report to the Society of Actuaries. 2002.
14
Table 1: Demographic characteristics of the population. N= 87691 individuals. Demographic characteristics Female 50,07%Male 49,93% Age (mean) 41,480 to 14 13,50%15 to 29 20,49%30 to 44 24,72%45 to 64 21,56%65 to 79 13,07%80 or older 6,66% Aggregated Clinical Risk Group categories of patients Healthy 72,73%History of Significant Acute Disease 6,49%Single Minor Chronic Disease 5,61%Minor Chronic Disease in Multiple Organ Systems 0,82%Single Dominant or Moderate Chronic Disease 9,78%Disease in Chronic Multiple Organ Systems 3,75%Dominant Chronic Disease in Three or More Organ Systems 0,26%Dominant and Metastatic Malignancies 0,40%Catastrophic Conditions 0,15% Total drug expenditures in 2002 € (mean) 162,24(Std. Deviation) 544,4Total drug expenditures in 2003 € (mean) 187,67(Std. Deviation) 656,4
15
Table 2: : 2R and 2~R obtained from the different predictive models 2R 2~R N=43912 N=43799 Prospective models Model 1. Demographic information Parametric OLS estimation 0,0939 0,0819 Parametric tobit estimation 0,0912 0,0804 Flexible-parametric OLS estimation 0,0940 0,0819 Flexible-parametric tobit estimation 0,0896 0,0791 Nonparametric OLS estimation 0,0884 0,0771 Model 2: Demographic and last year cost Parametric OLS estimation 0,6659 0,7706 Parametric tobit estimation 0,7091 0,8327 Flexible-parametric OLS estimation 0,6659 0,7704 Flexible-parametric tobit estimation 0,6245 0,7293 Nonparametric OLS estimation 0,6660 0,7713 Model 3: Only health status information (CRGs) Nonparametric OLS estimation 0,2131 0,1923
Model 4: Demographic and health status information (CRGs)
Parametric OLS estimation 0,2397 0,2157 Parametric tobit estimation 0,1761 0,1564 Flexible-parametric OLS estimation 0,2402 0,2160 Flexible-parametric tobit estimation 0,1762 0,1564 Nonparametric OLS estimation 0,2380 0,2140
Concurrent models Model 5: Only health status information (CRGs) Nonparametric OLS estimation 0,2956 0,2303
Model 6: Demographic and health status information (CRGs)
Parametric OLS estimation 0,3283 0,2549 Parametric tobit estimation 0,2350 0,1810 Flexible-parametric OLS estimation 0,3291 0,2554 Flexible-parametric tobit estimation 0,2350 0,1809 Nonparametric OLS estimation 0,3267 0,2536
16
Table 3: Predictive Ratios for the different prospective models in the OLS estimation
Model 1. Demographic information Model 2: Demographic and last year cost
Model 3: health status information
(CRGs)
Model 4: Demographic and health status information (CRGs)
N ParametricFlexible-
Parametric Non-
Parametric ParametricFlexible-
Parametric Non-
ParametricNon-
Parametric Parametric Flexible-
Parametric Non-
Parametric total 43779 0,9902 0,9919 1,0000 1,0012 1,0014 1,0000 1,0000 1,0042 1,0049 1,0009
Healthy 31838 1,9476 1,9509 1,9789 1,0816 1,0825 1,0863 1,0041 0,9959 0,9939 0,9906 History of Significant Acute Disease 2845 0,8418 0,8453 0,8631 0,9225 0,9235 0,9260 0,7252 0,7174 0,7190 0,7230
Single Minor Chronic Disease 2458 0,8559 0,8628 0,8502 1,0094 1,0112 1,0092 1,0292 1,0275 1,0278 1,0303
Minor Chronic Disease in Multiple Organ Systems 384 0,7298 0,7385 0,7113 0,9834 0,9859 0,9831 1,0842 1,0966 1,0946 1,0889
Single Dominant or Moderate Chronic Disease 4216 0,6238 0,6237 0,5987 0,9408 0,9408 0,9382 0,9715 0,9687 0,9680 0,9660
Disease in Chronic Multiple Organ Systems 1670 0,5011 0,5007 0,4815 0,9883 0,9881 0,9866 1,0719 1,0652 1,0645 1,0652
Dominant Chronic Disease in Three or More Organ Systems 124 0,3671 0,3654 0,3468 1,0893 1,0883 1,0866 0,8724 0,8720 0,8724 0,8716
Dominant and Metastatic Malignancies 178 0,5928 0,5904 0,5688 1,6095 1,6084 1,6055 1,2609 1,2732 1,2721 1,2719
Catastrophic Conditions 66 0,0469 0,0464 0,0484 0,9386 0,9383 0,9394 1,2283 1,2326 1,2329 1,2334
male 0-14 2789 2,1409 1,4123 0,9084 1,1120 0,9313 0,9535 4,4299 1,8389 1,1444 1,1302 male 15-29 4511 1,2164 0,8611 0,9084 1,1108 1,0234 0,9955 2,5822 1,2296 0,8738 0,8737 male 30-44 5216 0,9183 0,9565 1,2061 1,0524 1,0624 1,1136 1,5405 0,9644 0,9695 1,1005 male 45-64 4626 1,1251 1,1934 1,0654 1,0453 1,0632 1,0400 0,9095 1,0761 1,1385 1,0756 male 65-79 2926 0,9888 1,0011 1,0546 0,9825 0,9877 1,0028 0,6951 1,0065 1,0301 1,0556 male +80 1788 1,0260 1,0120 0,9843 1,0062 1,0088 0,9900 0,6499 0,9842 0,9812 0,9633
female 0-14 3087 0,8849 1,7384 0,9199 0,7965 1,0131 1,0008 3,7238 0,9634 1,4746 0,8931 female 15-29 4549 0,4066 0,5968 0,6523 0,8137 0,8593 0,9192 1,5947 0,3798 0,6024 0,7179 female 30-44 5655 0,6953 0,6509 0,9284 1,0652 1,0519 1,0367 1,6641 0,7886 0,7882 0,9189 female 45-64 4829 1,2454 1,1708 0,9962 1,0838 1,0651 1,0450 1,1164 1,2080 1,1300 1,0246 female 65-79 2736 0,8864 0,8727 0,9139 0,9654 0,9597 0,9842 0,6779 0,9292 0,9044 0,9355 female +80 1067 0,9466 0,9639 0,9436 1,0103 1,0055 0,9551 0,7390 1,0172 1,0211 0,9972


