Embed Size (px)
Citation preview

Journal of Strength and Conditioning Research Publish Ahead of PrintDOI: 10.1519/JSC.0000000000000329
ACCEPTED
Copyright � Lippincott Williams & Wilkins. All rights reserved.
Predicting Punching Acceleration from Selected Strength and Power Variables in
Elite Karate Athletes: A Multiple Regression Analysis
Irineu Loturco1, 2, 5 ( ), Guilherme Giannini Artioli2, 3, Ronaldo Kobal1, Saulo Gil1, 4,
Emerson Franchini2
1- Pão de Açúcar Group - Nucleus of High Performance in Sport, São Paulo, SP, Brazil
2- Martial Arts and Combat Sports Research Group, School of Physical Education and
Sport, University of São Paulo, SP, Brazil
3- Laboratory of Applied Nutrition and Metabolism, School of Physical Education and
Sport, University of São Paulo, SP, Brazil
4- School of Physical Education and Sport, University of São Paulo, São Paulo, SP,
Brazil
5- Brazilian Karate Confederation, Brazil
Irineu Loturco ( )
Pão de Açúcar Group, Nucleus of High Performance in Sport.
Av. Duquesa de Goiás, 571, Real Parque, 05686-001 – São Paulo, SP, Brazil.
Tel.: +55-11-3758-0918
E-mail: [email protected]
Running title: Punching acceleration in elite karate athletes

ACCEPTED
Copyright � Lippincott Williams & Wilkins. All rights reserved.
1
ABSTRACT 2
3
The present study investigated the relationship between punching acceleration 4
and selected strength and power variables in nineteen professional karate athletes from 5
the Brazilian National Team (9 men and 10 women; age: 23 ± 3 years; height: 1.71 6
±0.09 m and body mass: 67.34 ± 13.44 kg). Punching acceleration was assessed under 7
four different conditions in a randomized order: 1) fixed distance aiming to attain 8
maximum speed (FS); 2) fixed distance aiming to attain maximum impact (FI); 3) self-9
selected distance aiming to attain maximum speed (SSS) and 4) self-selected distance 10
aiming to attain maximum impact (SSI). The selected strength and power variables were 11
as follows: maximal dynamic strength in bench press and squat-machine, squat and 12
countermovement jump height, mean propulsive power in bench throw and jump squat, 13
and mean propulsive velocity in jump squat with 40% of body mass. Upper and lower-14
body power and maximal dynamic strength variables were positively correlated to 15
punch acceleration in all conditions. Multiple regression analysis also revealed 16
predictive variables: relative mean propulsive power in squat jump (W/kg), and 17
maximal dynamic strength (1RM) in both bench press and squat-machine exercises. An 18
impact-oriented instruction and a self-selected distance to start the movement seem to 19
be crucial to reach the highest acceleration during punching execution. This 20
investigation, while demonstrating strong correlations between punching acceleration 21
and strength-power variables, also provides important information for coaches, 22
especially for designing better training strategies to improve punching speed. 23
24
Key words: punching; karate; martial arts; strength training; power training; correlation 25
26
27
28
29
30
31
32
33
34

ACCEPTED
Copyright � Lippincott Williams & Wilkins. All rights reserved.
35
INTRODUCTION 36
37
Competitive karate performance is a multi-factorial phenomenon influenced by 38
technique, tactics and fitness, among other factors (5). In karate combats, offensive 39
actions are performed at very high speeds; athletes must strike before their opponents 40
are able to defend the attack or counter attack themselves (13). Indeed, studies assessing 41
the speed of high-intensity actions during simulated karate combats reported that they 42
last from 0.3 ± 0.1 s to 2.1 ± 1.0 s (1, 10). In official competitions, it has been reported 43
that punching techniques prevail over kicking techniques, probably because they are 44
faster to execute (4). Thus, punching techniques should be one of the main focuses of 45
high-level karate athletes’ training. 46
In preparation for competition, karate athletes undertake strength and 47
conditioning programs. This is an important aspect of training, as highlighted by a 48
recent study showing that both upper- and lower-body muscle power are higher in 49
winners as compared to defeated international level karate athletes (20). One can 50
speculate that upper- and lower-body muscle power might influence speed, acceleration 51
and power of karate techniques, thereby contributing to competitive performance. 52
Therefore, training strategies aiming to maximize muscle power may be of great value 53
for karate athletes. Identifying the physical capacities associated with karate techniques 54
is relevant to improve training methods, especially concerning the exercise type and 55
loads that should be applied to improve karate technique speed, power and acceleration. 56
In this regard, it has been suggested that the acceleration of a punch or kick directly 57
affects the impact; Bollander et al. (2) showed that peak force is related to the 58
acceleration of the object at each instant, multiplied by its effective mass. However, the 59
association between muscle power and the ability to perform karate-specific techniques 60
has never been investigated. 61
In addition to acceleration, the impact caused by a striking technique seems to be 62
influenced by other factors. For example, it was recently demonstrated that the palm 63
strike (a kung-fu technique), when preceded by stepping forward to the target, results in 64
a higher impact as compared to the same technique performed without stepping forward 65
(18). Moreover, athletes may intentionally execute a punch aiming for either maximum 66
speed or maximum impact, depending on whether the competition is “full-contact” or 67
not. During training and competition, athletes may have to punch at different distances 68

Copyright � Lippincott Williams & Wilkins. All rights reserved.
from the target, which may also influence the impact generated by the punch. However, 69
the influence of these variables on the acceleration generated by a punch has never been 70
investigated, and the physical capacities that best predict punch acceleration are still 71
unknown. Thus, the objective of the present study was 1) to verify whether a goal-72
oriented instruction (i.e., maximal speed or maximal impact) and the distance from the 73
target affects punching acceleration; and 2) to investigate the strength and power 74
abilities that are most associated with punching acceleration. 75
76
METHODS 77
78
Subjects 79
Nineteen professional karate athletes from the Brazilian National Team (9 men and 10 80
women; age: 23 ± 3 years; height: 1.71 ± 0.09 m and body mass: 67.34 ± 13.44 kg) 81
volunteered to participate in the study. This group was submitted to the following 82
training schedule in the period of evaluation: karate specific endurance training: two 45-83
60 minutes session per week; Power/strength training: three 45-60 minutes sessions per 84
week; Technical sessions: five 60-90 minutes per week. All procedures were approved 85
by an Institutional Review Board for use of human subjects. After being fully informed 86
of the risks and benefits associated with the study, all participants signed a written 87
informed consent form. All athletes were tested during the competitive phase of training 88
one week prior to the 2013 Pan American Championship, the major competition of the 89
season, suggesting that athletes were close to or at peak performance. In this 90
competition, the Brazilian National Team was the overall champion, winning 6 medals 91
in 12 classes (3 gold, 1 silver and 2 bronze medals). 92
93
Experimental Procedures 94
After a standardised 15-min warm-up including general (i.e., running at a 95
moderate pace for 5-min followed by 5-min of lower and upper limbs active stretching) 96
and specific exercises (i.e., karate specific punching movements at moderate intensity 97
speed for 5-min), athletes were provided with a 5-min resting interval. Individuals were 98
then required to perform a punch acceleration test under four different conditions, as 99
follows: 1) fixed distance aiming to attain maximum speed (FS); 2) fixed distance 100
aiming to attain maximum impact (FI); 3) self-selected distance aiming to attain 101
maximum speed (SSS); and 4) self-selected distance aiming to attain maximum impact 102
ACCEPTED

Copyright � Lippincott Williams & Wilkins. All rights reserved.
(SSI). A 3-min resting interval was allowed between conditions. All tests were 103
performed with athletes using karate gloves, as is standard in competition. An 104
accelerometer (DTS 3D®, Noraxon, AZ, USA) with sensors wirelessly connected to a 105
laptop was attached to the athletes’ gloves and data was recorded in real-time (Figure 106
1). The device sampled at a frequency of 1500 Hz and worked with a sensitivity equal 107
to 400mV/G. During the tests, athletes were placed in front of a “body opponent bag” 108
(BOB) and instructed to position the guard according to their individual preferences. To 109
establish the BOB height, the athlete performed their preferential guard position and 110
conducted the technique in the sternum region of the BOB, where the punch was 111
executed. After 15-min recovery, countermovement and squat jump heights were 112
assessed using a contact platform. Following a further 10-min recovery, athletes were 113
required to perform the mean propulsive power assessment. After a final minimum of 114
90-min of recovery, participants performed the maximal dynamic strength 115
determination. 116
117
118
***INSERT FIGURE 1 HERE*** 119
120
121
Punch acceleration determination 122
The athletes were instructed to perform a giaku-tsuki (i.e., a specific reverse 123
karate’s punch executed by the back arm, using the hips to push it forward) under the 124
four different conditions in a randomized order (i.e., FV, FI, SSV and SSI). In the fixed 125
distance conditions, athletes were positioned 1 meter from the BOB whereas in the self-126
selected conditions athletes freely chose their best position for starting the punch. The G 127
acceleration (G) was calculated automatically by the device and represented the peak 128
acceleration of the horizontal vector produced throughout the punch execution. Five 129
attempts of each condition were allowed. The data were not filtered. A 15-second 130
resting interval was allowed between attempts. The highest G value of each condition 131
was considered for further analysis (Figure 2). Intra-class coefficient correlations in the 132
four conditions were: FV = 0.954 (95%CI = 0.914 to 0.980); FI = 0.940 (95%CI = 133
0.888 to 0.973); SSV = 0.968 (95%CI = 0.940 to 0.986); SSI = 0.947 (95%CI = 0.900 to 134
0.976). 135
136
ACCEPTED

ACCEPTED
Copyright � Lippincott Williams & Wilkins. All rights reserved.
137
***INSERT FIGURE 2 HERE*** 138
139
140
Maximal dynamic strength determination 141
Maximal dynamic strength was determined for upper and lower body through 1 142
repetition maximum tests (1RM) for bench press and squat-machine exercises. All 143
participants performed two familiarisation sessions prior to the 1RM session. A 5-min 144
warm-up was performed on a motorised treadmill at 9 km.h-1 followed by 3-min of 145
lower limb stretching exercises. Participants then performed 2 warm-up sets: in the first 146
set, they executed 5 repetitions at 50% of 1RM and, in the second set, they performed 3 147
repetitions at 70% of 1RM, with a 3-min interval between sets. After 3 minutes, 148
participants started the test and were allowed to perform 5 attempts to obtain 1RM load, 149
which was measured to the nearest 1kg (3). 150
The squat lift 1RM tests were performed on a squat-machine (Plyo Press®, 151
Athletic Republic, Park City, Utha, USA), where displacement was controlled and the 152
participants started the concentric movement from a 90° knee flexion. Bench press 1RM 153
tests were performed on a “Smith machine” (Technogym Equipment, Cesena, Italy). 154
Correct technique involved lowering the bar in a controlled manner until the bar reaches 155
the chest and then lifting the bar back to the start position until the elbows are fully 156
extended. The head, shoulders, and buttocks remained in contact with the bench 157
throughout the entire execution. Strong verbal encouragement was provided during all 158
attempts. 159
160
Squat jump and countermovement jump heights 161
In the squat jump, a static position with a 90° knee flexion angle was maintained 162
for 2 seconds before a jump attempt without any preparatory movement. In the 163
countermovement jump, subjects were instructed to perform a downward movement 164
followed by a complete extension of the lower limb joints and freely determine the 165
amplitude of the countermovement in order to avoid changes in jumping coordination 166
pattern. Five attempts at each jump were performed interspersed by 15-sec intervals. 167
The jumps were performed on a contact platform (Smart Jump®, Fusion Sport, Coopers 168
Plains, Australia) with the obtained flight time (t) being used to estimate the height of 169
the rise of the body’s centre of gravity (h) during the vertical jump (i.e., h = gt2 / 8, 170

ACCEPTED
Copyright � Lippincott Williams & Wilkins. All rights reserved.
where g = 9.81 m/s2). A given jump would be considered valid for analysis if the take-171
off and landing positions were visually similar. The best attempt was used for data 172
analysis purposes. 173
174
175
Mean propulsive power and velocity with a load corresponding to 40% of body 176
mass in jump squat and mean propulsive power in bench throw 177
Mean propulsive power was assessed in jump squat and bench throw exercises, 178
both being performed on a Smith machine (Technogym Equipment, Cesena, Italy). 179
Participants were instructed to execute three repetitions at maximal velocity for each 180
load, starting at 40% of their body mass (BM) in jump squat and 30% of their BM in the 181
bench throw. In the jump squat, participants executed a knee flexion until the thigh was 182
parallel to the ground and, and after the command to start, jumped as fast as possible 183
without their shoulder losing contact with the bar. During the bench throw, athletes 184
were instructed to lower the bar in a controlled manner until the bar lightly touched the 185
chest and, after the command to start, threw it as high and fast as possible. A load of 186
10% of BM for jump squat and 5% of BM for bench throw was progressively added in 187
each set until a decrease in mean propulsive power was observed. A 5-min interval was 188
provided between sets. To determine mean propulsive power, a linear transducer (T-189
Force®, Dynamic Measurement System, Ergotech Consulting S.L., Murcia, Spain) was 190
attached to the Smith machine bar. The bar position data was sampled at 1000Hz using 191
a computer. Finite differentiation technique was used to calculate bar velocity and 192
acceleration. Mean propulsive power rather than peak power in both jump squat and 193
bench throw were used since Sanchez-Medina et al. (21) demonstrated that mean 194
mechanical values during the propulsive phase better reflects the differences in the 195
neuromuscular potential between two given individuals. This approach avoids 196
underestimation of true strength potential as the higher the mean velocity (and lower the 197
relative load), the greater the relative contribution of the braking phase to the entire 198
concentric time. We considered the maximum mean propulsive power value obtained in 199
each exercise and the higher velocity obtained in jump squat using a load corresponding 200
to 40% of BM for data analysis purpose. 201
202

ACCEPTED
Copyright � Lippincott Williams & Wilkins. All rights reserved.
Statistical Analysis 203
Data are presented as mean +- standard deviation. Relationship between 204
variables was tested via Pearson correlation coefficient, with 95% confidence intervals 205
(95% CI) being calculated for each group separately and for both groups together. As 206
95% CI correlation coefficients did not differ between groups, only the significant 207
correlation coefficients for all the athletes grouped were reported. Normality was 208
confirmed via the Shapiro-Wilk test. Linear regression models to predict acceleration at 209
different punch conditions were also created using the maximum of two variables due to 210
the sample size. Colinearity analysis was conducted to avoid the use of two correlated 211
independent variables. Independent Student t test was used to compare men and women 212
concerning performance in the different maximal strength and power exercises. Two-213
way (gender x punch) ANOVA with repeated measurements in the second factor was 214
used to compare gender groups and punch conditions. Compound symmetry was tested 215
through Mauchly test and the Greenhouse-Geisser correction was used when necessary. 216
Effect sizes were also calculated using eta squared (η2). Level of significance was set at 217
5%. 218
219
RESULTS 220
221
Men displayed higher performance values than women in all variables (P < 0.05; 222
Table 1), except in the relative squat-machine 1RM and relative mean propulsive power 223
in jump squat. 224
225
226
***INSERT TABLE 1 HERE*** 227
228
229
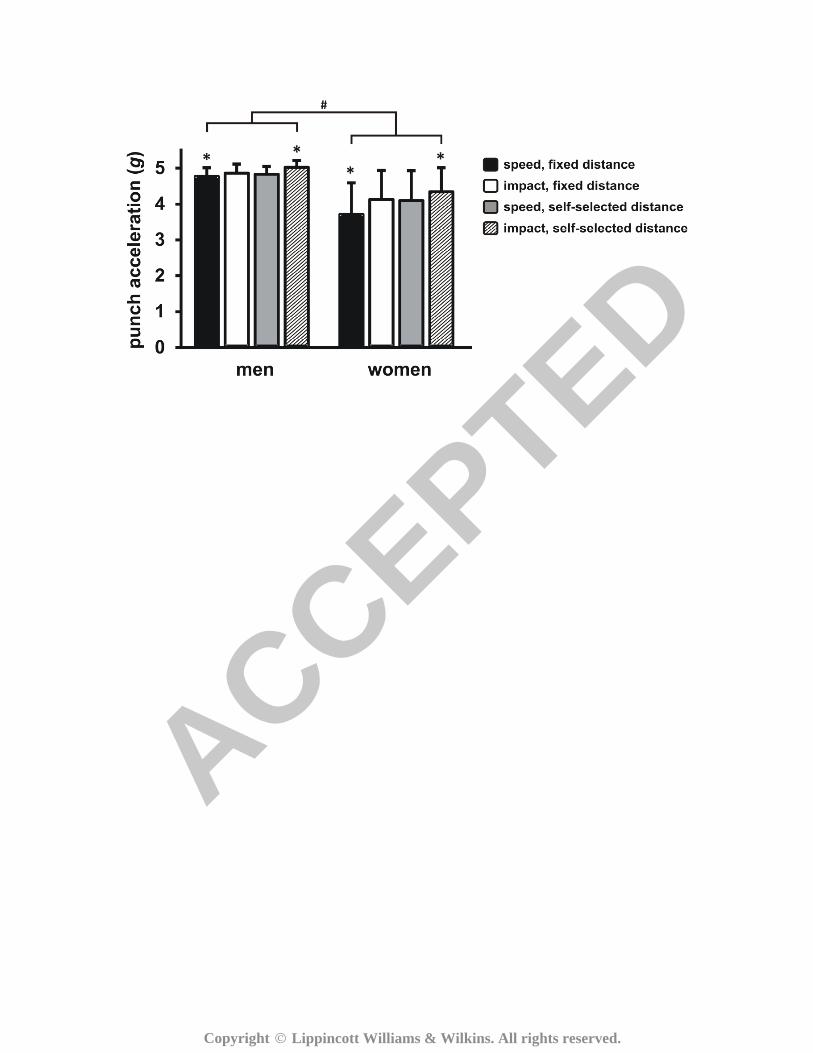
Effects of sex (F1, 17 = 7.84; P = 0.012; η2 = 0.32), condition (F3, 51 = 23.13; P < 0.001; 230
η2 = 0.58), and an interaction effect between sex and condition (F3, 51 = 5.42; P = 0.011; 231
η2 = 0.24) were found for punch acceleration (Figure 3). Men achieved higher 232
acceleration values as compared to women (P = 0.012). The intention to generate impact 233
and the self-selected distance conditions resulted in higher accelerations when compared 234
to the intention to generate speed and the fixed distance (P < 0.01 for both 235
ACCEPTED
Copyright � Lippincott Williams & Wilkins. All rights reserved.
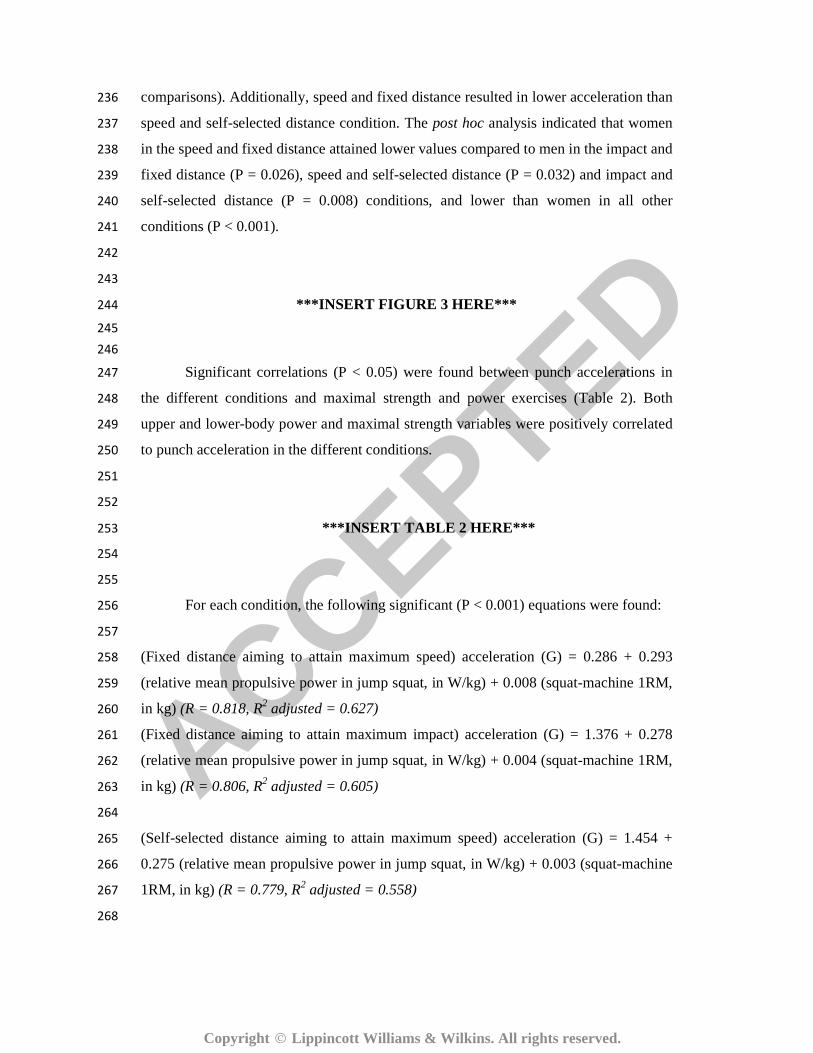
comparisons). Additionally, speed and fixed distance resulted in lower acceleration than 236
speed and self-selected distance condition. The post hoc analysis indicated that women 237
in the speed and fixed distance attained lower values compared to men in the impact and 238
fixed distance (P = 0.026), speed and self-selected distance (P = 0.032) and impact and 239
self-selected distance (P = 0.008) conditions, and lower than women in all other 240
conditions (P < 0.001). 241
242
243
***INSERT FIGURE 3 HERE*** 244
245
246
Significant correlations (P < 0.05) were found between punch accelerations in 247
the different conditions and maximal strength and power exercises (Table 2). Both 248
upper and lower-body power and maximal strength variables were positively correlated 249
to punch acceleration in the different conditions. 250
251
252
***INSERT TABLE 2 HERE*** 253
254
255
For each condition, the following significant (P < 0.001) equations were found: 256
257
(Fixed distance aiming to attain maximum speed) acceleration (G) = 0.286 + 0.293 258
(relative mean propulsive power in jump squat, in W/kg) + 0.008 (squat-machine 1RM, 259
in kg) (R = 0.818, R2 adjusted = 0.627) 260
(Fixed distance aiming to attain maximum impact) acceleration (G) = 1.376 + 0.278 261
(relative mean propulsive power in jump squat, in W/kg) + 0.004 (squat-machine 1RM, 262
in kg) (R = 0.806, R2 adjusted = 0.605) 263
264
(Self-selected distance aiming to attain maximum speed) acceleration (G) = 1.454 + 265
0.275 (relative mean propulsive power in jump squat, in W/kg) + 0.003 (squat-machine 266
1RM, in kg) (R = 0.779, R2 adjusted = 0.558) 267
268

ACCEPTED
Copyright � Lippincott Williams & Wilkins. All rights reserved.
(Self-selected distance aiming to attain maximum speed) acceleration (G) = 1.767 + 269
0.255 (relative mean propulsive power in jump squat, in W/kg) + 0.005 (bench press 270
1RM, in kg) (R = 0.783, R2 adjusted = 0.565) 271
272
(Self-selected distance aiming to attain maximum impact) acceleration (G) = 1.923 + 273
0.240 (relative mean propulsive power in jump squat, in W/kg) + 0.004 (squat-machine 274
1RM, in kg) (R = 0.825, R2 adjusted = 0.640) 275
276
(Self-selected distance aiming to attain maximum impact) acceleration (G) = 2.260 + 277
0.230 (relative mean propulsive power in jump squat, in W/kg) + 0.006 (bench press 278
1RM, in kg) (R = 0.831, R2 adjusted = 0.653) 279
280
DISCUSSION 281
282
The main finding of the present study is that punching with an impact-oriented 283
goal and from a self-selected distance produces higher accelerations compared to a 284
speed-oriented goal and fixed distance. Moreover, several upper- and lower-body power 285
and strength variables were positively correlated to acceleration in the different punch 286
conditions. According to our results, 56% to 65% of the variation in punch acceleration 287
in the various conditions could be predicted by a combination of relative mean 288
propulsive power in squat-machine, and either squat-machine 1RM or bench press 289
1RM. 290
In competitive karate, punches are the most used technique (4). Punching is a 291
highly complex technique that requires the coordinated action of arm, trunk and leg 292
muscle groups (22). Some authors consider that the lower-body is the primary 293
contributor to punch execution, because the ground reaction forces generated by legs 294
would be transferred to the upper-body, allowing for a powerful movement (12). Thus, 295
the inclusion of the relative mean propulsive power in jump squat in all punching 296
acceleration predictive equations is indicative that a higher ground reaction force would 297
result in more acceleration. In fact, Filimonov et al. (7) showed that the better the 298
competitive level, the more the legs contribute to the total impact during straight 299
punching in boxers. According to Turner et al. (22) and Lenetsky et al. (12), leg drive is 300
likely to affect pre-impact hand velocity. In World Karate Federation, athletes’ main 301
goal is to score by touching the opponent rather than knocking them out; hence, a higher 302

ACCEPTED
Copyright � Lippincott Williams & Wilkins. All rights reserved.
hand acceleration and speed would be important to land a punch prior to a response 303
from the opponent (13). Not surprisingly, relative mean propulsive power in jump squat 304
was the only variable that did not differ between men and women, which further 305
strengthens the concept that leg power is crucial for punch acceleration and, therefore, 306
karate performance. 307
Lower-body maximal strength was also predictive of punching acceleration in 308
all conditions, suggesting that karate athletes aiming at improving punch acceleration 309
should improve both relative lower-body mean propulsive power as well as lower-body 310
maximal strength. Indeed, Turner et al. (22) have recommended exercises for lower-311
body maximal strength as an important means to improving punching power, while 312
Lenetsky et al. (12) reported that the literature has not extensively explored punching in 313
relation to upper body. Furthermore, our results indicate that maximal bench press 314
strength is related to punch acceleration and, thus, increasing upper-body maximal 315
strength also appears to be important to improve punch performance. However, it is 316
worthy to note that only 56% to 65% of the variation in punch acceleration was 317
explained by power and strength parameters, suggesting that technical aspects are 318
probably responsible by the remaining variation. 319
The relationships between strength and power abilities and punching speed for 320
both upper and lower limbs can be explained by the dynamics characteristics of 321
punching. When karate athletes punch at higher velocities, the ability to transfer the 322
linear momentum of force from the lower limbs to the upper limbs is critical to hit the 323
opponent as fast as possible. Indeed, this skill is directly associated with the mechanical 324
impulse generated in a specific movement (i.e., the integral of force over a short time 325
interval). These associations have also been demonstrated in other sports actions 326
performed with the upper limbs; Morris et al. (16) described these mechanisms as 327
critical factors for performance in javelin throwing, while Chelly et al. (6) reported a 328
similar relationship in male handball players and predictors of ball throwing velocity. 329
In the current study, both maximum strength and relative mean propulsive power 330
were important predictors of punching acceleration. These findings support the 331
mechanical principle that determines the magnitude of a body’s linear momentum, 332
defined as a product of its mass multiplied by its velocity. In this regard, the athletes 333
capable of applying greater amounts of force against the ground and of moving their 334
bodies forward at higher speeds obtain the best outcomes in punching acceleration. 335

ACCEPTED
Copyright � Lippincott Williams & Wilkins. All rights reserved.
These abilities are directly correlated to maximum strength and relative power abilities 336
(8, 9, 11, 14, 15, 19). 337
Our results indicated that when athletes where asked to perform a punch with an 338
impact-oriented goal and were free to choose the distance from their target, higher 339
acceleration was achieved. This is likely due to the fact that peak force is related to the 340
acceleration of an object at each instant, multiplied by its effective mass (2). Since peak 341
hand acceleration is correlated to martial arts experience (17) and our athletes were 342
competing at the highest level, it is likely that they were able to adjust the optimal 343
distance to achieve the higher acceleration. This is confirmed by the fact that the speed-344
oriented and fixed distance condition resulted in the lowest accelerations of all 345
conditions. 346
347
PRACTICAL APPLICATIONS 348
349
The findings presented herein suggest that a training system to improve 350
punching acceleration should include exercises capable of increasing lower-body 351
muscle power and both upper- and lower-body maximal dynamic strength. However, 352
to punch at higher velocities, fighters have to develop the technical ability to transfer the 353
linear momentum of force from the lower limbs to the upper limbs as fast as possible. 354
The inclusion of punching drills, in which athletes attempt to achieve the highest 355
possible impact from a self-selected distance, ought to be considered an essential part of 356
any karate training routine. Longitudinal studies investigating the impact of improving 357
these variables on punch performance should be conducted to further confirm and 358
strengthen the associations found in the present study. Future studies should also 359
include trunk specific exercises as predictive variables for punching acceleration, 360
because a stable trunk (especially at the lumbar region) might be important to transmit 361
ground reaction forces throughout the body (12). 362
363
ACKNOWLEDGEMENTS 364
The authors are grateful to Dr. Bryan Saunders for the careful English 365
proofreading. Guilherme G Artioli is supported by FAPESP (#2011/17059-2). 366
367
REFERENCES 368
369

ACCEPTED
Copyright � Lippincott Williams & Wilkins. All rights reserved.
1. Beneke R, Beyer T, Jachner C, Erasmus J, and Hutler M. Energetics of karate 370
kumite. Eur J Appl Physiol 92: 518-523, 2004. 371
2. Bolander RP, Neto OP, and Bir CA. The effects of height and distance on the 372
force production and acceleration in martial arts strikes. Journal of Sports 373
Science and Medicine 8: 47-52, 2009. 374
3. Brown L and Weir J. ASEP procedures recommendation I: accurate assessment 375
of muscular strength and power. Journal of Exercise Physiology 4: 1-21, 2001. 376
4. Chaabene H, Franchini E, Miarka B, Selmi MA, Mkaouer B, and Chamari K. 377
Time-Motion Analysis, Physiological and Rate of Perceived Exertion Responses 378
to Karate Official Combats: Is There a Difference Between Winners and 379
Defeated Karatekas? Int J Sports Physiol Perform, 2013. 380
5. Chaabene H, Hachana Y, Franchini E, Mkaouer B, and Chamari K. Physical and 381
physiological profile of elite karate athletes. Sports Med 42: 829-843, 2012. 382
6. Chelly MS, Hermassi S, and Shephard RJ. Relationships between power and 383
strength of the upper and lower limb muscles and throwing velocity in male 384
handball players. J Strength Cond Res 24: 1480-1487, 2010. 385
7. Filimonov VI, Kopstev KN, Husyanov ZM, and Nazarov SS. Means of 386
increasing strength of the punch. NSCA Journal 7: 65-66, 1985. 387
8. Harris GR, Stone HS, O' Bryant HS, Proulx SM, and Johnson RL. Short-term 388
Performance Effects of High Power, High Force, or Combined Weight-Training 389
Methods. Journal of Strength and Conditioning Research 14: 14-20, 2000. 390
9. Hunter JP, Marshall RN, and McNair PJ. Relationships between ground reaction 391
force impulse and kinematics of sprint-running acceleration. J Appl Biomech 21: 392
31-43, 2005. 393
10. Iide K, Imamura H, Yoshimura Y, Yamashita A, Miyahara K, Miyamoto N, and 394
Moriwaki C. Physiological responses of simulated karate sparring matches in 395
young men and boys. J Strength Cond Res 22: 839-844, 2008. 396
11. Kawamori N, Nosaka K, and Newton RU. Relationships between ground 397
reaction impulse and sprint acceleration performance in team sport athletes. J 398
Strength Cond Res 27: 568-573, 2013. 399
12. Lenetsky S, Harris N, and Brughelli M. Assessment and Contributors of 400
Punching Forces in Combat Sports Athletes: Implications for Strength and 401
Conditioning. Strength and Conditioning Journal 35: 1-7, 2013. 402

ACCEPTED
Copyright � Lippincott Williams & Wilkins. All rights reserved.
13. Mori S, Ohtani Y, and Imanaka K. Reaction times and anticipatory skills of 403
karate athletes. Hum Mov Sci 21: 213-230, 2002. 404
14. Morin JB, Bourdin M, Edouard P, Peyrot N, Samozino P, and Lacour JR. 405
Mechanical determinants of 100-m sprint running performance. Eur J Appl 406
Physiol 112: 3921-3930, 2012. 407
15. Morin JB, Edouard P, and Samozino P. Technical ability of force application as 408
a determinant factor of sprint performance. Med Sci Sports Exerc 43: 1680-409
1688, 2011. 410
16. Morriss C and Bartlett R. Biomechanical factors critical for performance in the 411
men's javelin throw. Sports Med 21: 438-446, 1996. 412
17. Neto OP, Marzullo ACDM, Bolander RP, and Bir CA. Martial arts striking hand 413
peak acceleration, accuracy and consistency. European Journal of Sport 414
Science: 1-6, 2013. 415
18. Neto OP, Silva JH, Marzullo AC, Bolander RP, and Bir CA. The effect of hand 416
dominance on martial arts strikes. Hum Mov Sci 31: 824-833, 2012. 417
19. Requena B, Garcia I, Requena F, de Villarreal ES, and Cronin JB. Relationship 418
between traditional and ballistic squat exercise with vertical jumping and 419
maximal sprinting. J Strength Cond Res 25: 2193-2204, 2011. 420
20. Roschel H, Batista M, Monteiro R, Bertuzzi R, Barroso R, Loturco I, 421
Ugrinowistch C, Tricoli V, and Franchini E. Association between 422
neuromuscular tests and kumite performance on the Brazilian Karate National 423
Team. Journal of Sports Science and Medicine 8: 20-24, 2009. 424
21. Sanchez-Medina L, Perez CE, and Gonzalez-Badillo JJ. Importance of the 425
propulsive phase in strength assessment. Int J Sports Med 31: 123-129, 2010. 426
22. Turner A, Baker ED, and Stuart M. Increasing the impact force of the rear hand 427
punch. Strength and Conditioning Journal 33: 2-9, 2011. 428
429
FIGURE LEGENDS 430
431
Figure 1. Equipment for the acceleration (G) measurement. 432
433
Figure 2. Acceleration (G) measurement during giaku-tsuki execution. 434
435

ACCEPTED
Copyright � Lippincott Williams & Wilkins. All rights reserved.
Figure 3. Punch acceleration in different combination of distance and goals for men and 436
women high-level karate athletes (values are mean ± standard deviation). 437
*different from all other conditions (P < 0.05). 438
#all conditions were different between men and women (P < 0.05). 439
440
TABLE LEGENDS 441
442
Table 1. Body mass, power and strength characteristics of men and women from 443
Brazilian karate team. 444
445
Table 2. Correlation coefficients (and 95% confidence interval) between punch 446
accelerations and maximal strength and power variables. 447
448
449
450
451

ACCEPTED
Copyright � Lippincott Williams & Wilkins. All rights reserved.
Table 1: Body mass, power and strength characteristics of men and women from
Brazilian karate team.
Men (n = 9) Women (n = 10)
Body mass (kg) 76.7 ± 14.4* 59.1 ± 8.4
Bench press 1RM (kg) 89 ± 19* 44 ± 5
Squat-machine 1RM (kg) 201 ± 31* 151 ± 17
Relative bench press 1RM (kg/kg) 1.16 ± 0.17* 0.76 ± 0.14
Relative squat-machine 1RM (kg/kg) 2.65 ± 0.32 2.58 ± 0.38
Mean propulsive power in jump squat (W) 718 ± 150* 458 ± 66
Mean propulsive power in bench throw (W) 583 ± 116* 261 ± 51
Relative mean propulsive power in jump squat (W/kg) 9.49 ± 1.81 7.93 ± 1.75
Relative mean propulsive power in bench throw (W/kg) 7.68 ± 1.22* 4.48 ± 0.99
Jump squat velocity with 40% of BM (m/s) 1.23 ± 0.15* 1.10 ± 0.09
Squat jump (cm) 40.6 ± 5.6* 30.5 ± 3.2
Countermovement jump (cm) 43.2 ± 5.3* 31.9 ± 4.2
* Different from women (P < 0.05)

ACCEPTED
Copyright � Lippincott Williams & Wilkins. All rights reserved.
Table 2. Correlation coefficients (and 95% confidence interval) between punch accelerations and maximal strength and power variables.
FS FI SSS SSI
Maximal velocity during jump squat with 40% of BM 0.742
(0.433 to 0.894)
0.723
(0.400 to 0.886)
0.722
(0.398 to 0.886)
0.745
(0.440 to 0.896)
Relative mean propulsive power in jump squat 0.765
(0.476 to 0.905)
0.789
(0.521 to 0.915)
0.765
(0.477 to 0.905)
0.804
(0.551 to 0.922)
Relative squat-machine 1RM 0.664
(0.300 to 0.859)
0.672
(0.314 to 0.863)
0.657
(0.289 to 0.856)
0.636
(0.255 to 0.846)
Relative mean propulsive power in bench throw 0.729
(0.411 to 0.889)
0.656
(0.288 to 0.855)
0.652
(0.282 to 0.854)
0.736
(0.424 to 0.892)
Relative bench press 1RM 0.762
(0.470 to 0.903)
0.707
(0.373 to 0.879)
0.708
(0.374 to 0.879)
0.747
(0.443 to 0.897)
Squat jump height 0.687
(0.338 to o.870)
0.669
(0.309 to 0.862)
0.653
(0.282 to 0.854)
0.676
(0.320 to 0.865)
Countermovement jump height 0.729
(0.411 to o.889)
0.707
(0.373 to 0.879)
0.690
(0.344 to o.871)
0.727
(0.406 to 0.888)
*(FS) = fixed distance aiming to attain maximum speed; (FI) = fixed distance aiming to attain maximum impact; (SSS) = self-selected distance
aiming to attain maximum speed; (SSI) = self-selected distance aiming to attain maximum impact.

Copyright � Lippincott Williams & Wilkins. All rights reserved.
ACCEPTED

Copyright � Lippincott Williams & Wilkins. All rights reserved.
ACCEPTED
Copyright � Lippincott Williams & Wilkins. All rights reserved.
ACCEPTED


