Embed Size (px)
Citation preview

Predicting Visual Consciousness Electrophysiologicallyfrom Intermittent Binocular RivalryRobert P. O’Shea1,2,3,4*, Jurgen Kornmeier5,6, Urte Roeber1,2,7
1 Institute for Psychology, University of Leipzig, Leipzig, Germany, 2Discipline of Psychology, School of Health and Human Sciences, Southern Cross University, Coffs
Harbour, Australia, 3Department of Psychology, University of Otago, Dunedin, New Zealand, 4Cognitive Neuroscience Research Cluster, School of Health and Human
Sciences, Southern Cross University, Coffs Harbour, Australia, 5 Institute for Frontier Areas of Psychology and Mental Health, Freiburg, Germany, 6Department of
Ophthalmology, University Eye Hospital, Freiburg, Germany, 7 Biomedical Sciences, School of Medical Sciences, The University of Sydney, Sydney, Australia
Abstract
Purpose: We sought brain activity that predicts visual consciousness.
Methods: We used electroencephalography (EEG) to measure brain activity to a 1000-ms display of sine-wave gratings,oriented vertically in one eye and horizontally in the other. This display yields binocular rivalry: irregular alternations in visualconsciousness between the images viewed by the eyes. We replaced both gratings with 200 ms of darkness, the gap, beforeshowing a second display of the same rival gratings for another 1000 ms. We followed this by a 1000-ms mask then a 2000-ms inter-trial interval (ITI). Eleven participants pressed keys after the second display in numerous trials to say whether theorientation of the visible grating changed from before to after the gap or not. Each participant also responded to numerousnon-rivalry trials in which the gratings had identical orientations for the two eyes and for which the orientation of botheither changed physically after the gap or did not.
Results: We found that greater activity from lateral occipital-parietal-temporal areas about 180 ms after initial onset of rivalstimuli predicted a change in visual consciousness more than 1000 ms later, on re-presentation of the rival stimuli. We alsofound that less activity from parietal, central, and frontal electrodes about 400 ms after initial onset of rival stimuli predicteda change in visual consciousness about 800 ms later, on re-presentation of the rival stimuli. There was no such predictiveactivity when the change in visual consciousness occurred because the stimuli changed physically.
Conclusion: We found early EEG activity that predicted later visual consciousness. Predictive activity 180 ms after onset ofthe first display may reflect adaption of the neurons mediating visual consciousness in our displays. Predictive activity400 ms after onset of the first display may reflect a less-reliable brain state mediating visual consciousness.
Citation: O’Shea RP, Kornmeier J, Roeber U (2013) Predicting Visual Consciousness Electrophysiologically from Intermittent Binocular Rivalry. PLoS ONE 8(10):e76134. doi:10.1371/journal.pone.0076134
Editor: Lawrence M. Ward, University of British Columbia, Canada
Received December 4, 2012; Accepted August 26, 2013; Published October 4, 2013
Copyright: � 2013 O’Shea et al. This is an open-access article distributed under the terms of the Creative Commons Attribution License, which permitsunrestricted use, distribution, and reproduction in any medium, provided the original author and source are credited.
Funding: Financial support came from the German Research Foundation (DFG grant no. RO 3061/1–2 awarded to Urte Roeber, and DFG grant no. BA 877/16-2).The funders had no role in study design, data collection and analysis, decision to publish, or preparation of the manuscript.
Competing Interests: The authors have declared that no competing interests exist.
* E-mail: [email protected]
Introduction
A key quest for modern neuroscience is to determine whether
patterns of activity in people’s brains can predict what they will see
or do [1,2,3,4,5,6]. We went on that quest, specifically to find early
neural activity that predicts visual consciousness.
By visual consciousness we mean whether we see something, in
which case we are conscious of it, or not, in which case we are not
conscious of it, as happens in the phenomenon of binocular rivalry
(see below).
By prediction, we mean whether specific patterns of brain
activity, generalised over people, correlate with later instances or
content of visual consciousness. (We are not attempting to predict
from specific patterns of brain activity of one individual his or her
later instances or content of visual consciousness.).
We searched for predictive patterns of brain activity by
measuring the electrical activity of the brain non-invasively with
scalp electrodes–electroencephalography (EEG). From the EEG
data we calculated event-related potentials (ERPs) and their
sources (using VARETA). ERPs are well-established and powerful
techniques to study brain activity with high temporal resolution
[7]. They are used in clinical diagnosis [8] and in basic research on
phenomena such as visual search [9], attention [10], multistable
perception [11], and consciousness [12]. VARETA is a powerful
technique for locating sources of EEG activity that has some
advantages over others [13].
We began our quest to find ERP/source activity that predicts
visual consciousness on some paths made by others, which we
review now.
Intermittent Binocular RivalryThose studying the neural correlates of visual consciousness
[14,15,16,17,18,19,20,21] have typically simplified it using the
fascinating bistable phenomenon of binocular rivalry [22,23,24].
This happens when one views different images continuously with
each eye, such as the letter S to one eye and the letter A to the
PLOS ONE | www.plosone.org 1 October 2013 | Volume 8 | Issue 10 | e76134

other [23], or a face to one eye and a house to the other [17], or a
grating (e.g., vertical) to one eye and an orthogonal (i.e.,
horizontal) grating the other [25] (see Figure 1a). Immediately
after onset of the images, one sees some combination of them for
about 150 ms [26,27], then one sees an S, or a house, or vertical,
or whatever, with no trace of the other rival image for a second or
so and then, sometimes after a brief period during which one does
see some unstable composite of the two images, one sees the other
image with no trace of first, again for a second or so, and then one
sees the first image, and then the second image, and so on. That is,
visual consciousness alternates randomly between two rival
images, with no change in input to the two eyes, for as long as
one cares to look. This property of rivalry makes it invaluable for
investigating the neural correlates of consciousness [12,28].
One problem for ERP research with using binocular rivalry to
investigate the timing of neural processes predicting visual
consciousness is the latency and variability of people’s reports of
changes in visual consciousness. Reports lag by a mean of about
450 ms behind the change in visual consciousness [29] with a
standard deviation of at least 10% [30], making reports unsuitable
as the event for an ERP. Noest, van Ee, Nijs, and van Wezel (2007)
[31], using a property of ambiguous figures discovered by Orbach,
Ehrlich, and Heath (1963) [32], showed that if they interrupted a
display of rival stimuli briefly with a dark field, this tended to
prompt an alternation, thereby solving this problem. The
interruption provides a clear event for the change in visual
consciousness. This form of interrupted rivalry has become known
as intermittent binocular rivalry [33].
Binocular rivalry is just one example of a range of perceptually
bistable phenomena that can be destabilized (and stabilized) by
interrupting displays for various times [32,34]. Examples include
the kinetic depth effect [35], quartet apparent motion [36], and
the Necker cube [37]. It was with these latter two phenomena that
the initial research was conducted into predicting, from brain
activity, changes in visual perception with no change in the
stimulus, reviewed next.
Predicting Perceptual changes with Bistable PhenomenaAs far as we are aware, research into predicting visual
consciousness from brain activity began with quartet apparent
motion. In this form of apparent motion, a ‘‘movie’’ repeatedly
showing two frames is shown: one frame comprises two dark dots
on the upper left and lower right corners of an imaginary rectangle
and two light dots on the other corners; the other frame is the
mirror image of the first. Apparent motion is bistable–sometimes
the dots appear to move vertically and sometimes horizontally
[36]. The event for EEG research is the onset of a frame. Muller,
Federspiel, Fallgatter, and Strik (1999) repeatedly showed these
two frames for one second each and asked participants to report
the change in apparent motion [38]. They found an increase in
EEG delta activity in the frame before that in which participants
reported a perceptual alternation (i.e., about 550 ms before the
alternation), interpreting this as an effect of decreased vigilance on
visual consciousness–high vigilance, or sustained attention, tending
to stabilise perception, presumably from top-down influences, low
vigilance tending to allow perception to alternate.
The most popular phenomenon for researching EEG correlates
of perceptual changes has been the Necker cube [39]. Kornmeier
and Bach (2004, 2005, 2006) [40,41,42] measured EEG while
repeatedly showing a lattice of ambiguous Necker cubes for
800 ms, followed by a dark field for 400 ms; participants reported
when the 3D appearance of the cubes changed. They also had
conditions in which the cubes were non-ambiguous by the
addition of pictorial information, allowing them to compare the
electrical activity of the brain after a change in an ambiguous
display with that after a non-ambiguous display. They found ERPs
that showed an occipital negativity about 250 ms after the onset of
the cubes and a parietal positivity about 340 ms after onset that
were larger when the 3D appearance changed than when it stayed
the same; these were similar for ambiguous and non-ambiguous
stimuli.
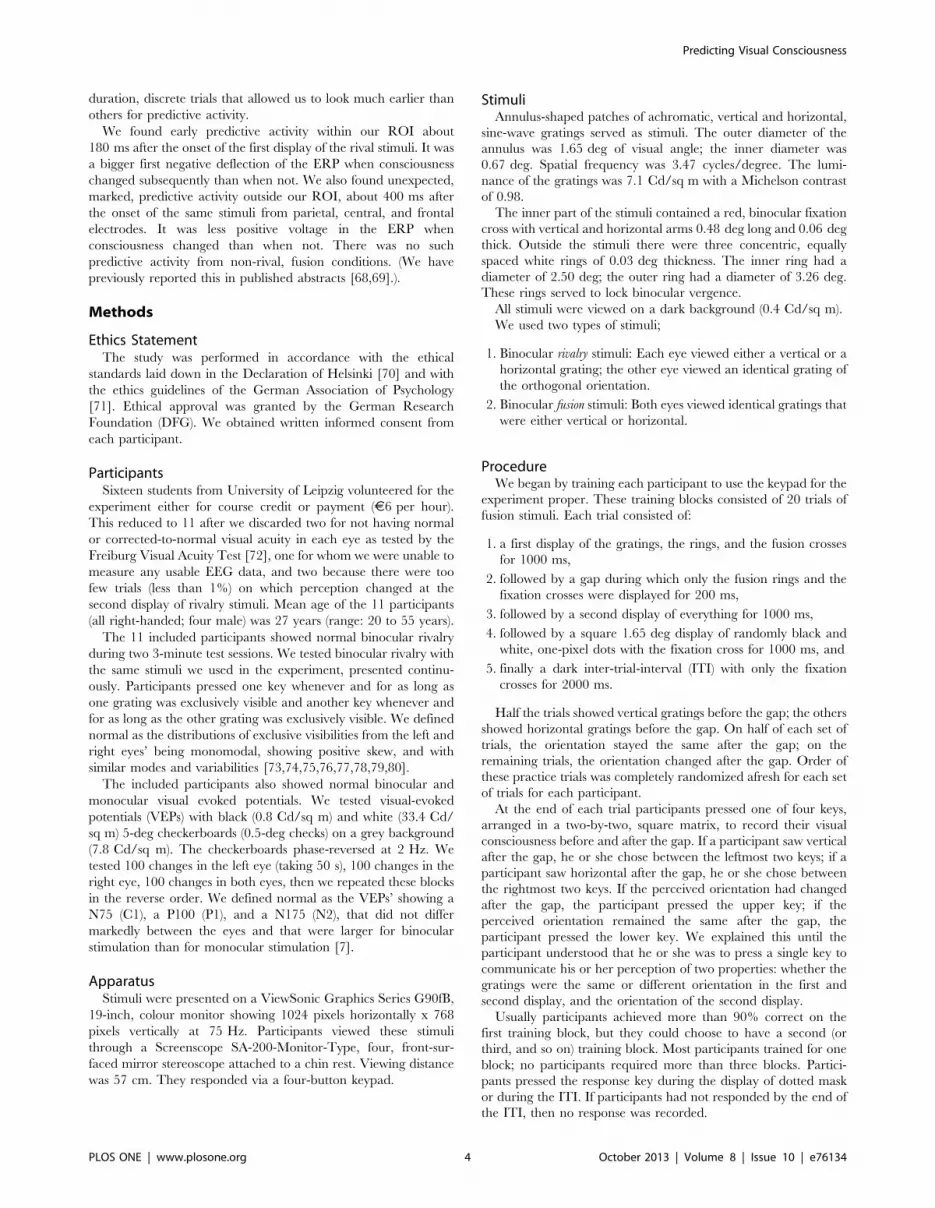
Figure 1. Illustrations of the sequence of events of some of thetrials of the experiment along with the percepts, the visualconsciousness, that might have accompanied those trials. Timeruns from left to right in milliseconds. Note that this is not an exhaustivelist of stimuli (whose orientations were counterbalanced over eyes forrivalry trials and displays for fusion trials) or of percepts. (a) A trial inwhich rival stimuli are presented and the percept is the same before thegap to after it. In this case, in the Stimuli panel, a horizontal grating ispresented to the left eye, and a vertical grating is presented to the righteye for a first display of 1000 ms (S1), then there is a dark gap for200 ms, then identical rival stimuli are presented for a second display of1000 ms (S2), then there is a binocular, dotted mask for 1000 ms, then adark, blank field for an inter-trial interval (ITI) for 2000 ms. Participantsresponded after the end of S2. In the Percept panel, in this case theparticipant sees the horizontal grating just before the gap, seesdarkness (along with the vergence rings) during the gap, and sees thesame horizontal grating after the gap (and then sees the mask and theblank field). (b) An identical rivalry trial to (a), except that the percept isdifferent after the gap: from horizontal to vertical. (c) A trial in whichfusion stimuli are presented and the percept is the same before the gapto after it. In this case, in the Stimuli panel, horizontal gratings arepresented to both eyes, both in the first display before the gap and inthe second display after the gap. The percept too is the same beforeand after the gap: in this case horizontal. (d) A fusion trial in which achange in the percept at the gap, from horizontal to vertical, occursbecause the orientation of the fused gratings changes from horizontalbefore the gap to vertical after.doi:10.1371/journal.pone.0076134.g001
Predicting Visual Consciousness
PLOS ONE | www.plosone.org 2 October 2013 | Volume 8 | Issue 10 | e76134

Britz, Landis, and Michel (2009) [43] looked before the onset of
a Necker cube display for EEG activity that would predict changes
in the 3D appearance. They conducted a complex topographical
analysis showing greater activity in the right parietal region of the
brain within 50 ms prior to the onset of the cube display that
predicted a change in 3D orientation. They also compared ERPs
for each electrode that discriminated between whether the 3D
appearance of the cubes changed or stayed the same. Apart from
finding similar patterns of differences after stimulus onset to those
reported by Kornmeier and Bach, they showed two clusters of
electrodes that predicted change, one about 75 ms before stimulus
onset from left and frontal electrodes and the other about 25 ms
before stimulus onset from left and parietal/occipital electrodes.
There was no such predictive activity when the cubes were
unambiguous.
Ehm, Bach, and Kornmeier (2011) [44] searched for EEG
activity during the 200-ms gap prior to an intermittent display of
Necker cubes. They found that modulation of gamma activity
200 ms before onset of the cubes predicted a change in the
perceived 3D orientation. They explained this as reflecting a
transient brain state of maximal instability preceding a perceptual
reversal.
Predicting Perceptual changes with IntermittentBinocular Rivalry
As far as we are aware, the first to predict a forthcoming
binocular-rivalry alternation from brain activity were Britz, Pitts,
and Michel (2011) [45]. They used similar methods and analyses
to their research into the Necker cube [43], but with 600-ms
displays of rival gratings differing between the eyes in orientation,
colour, and spatial frequency, and separated by a dark gap of
between 500 and 700 ms. During each dark gap, participants
signalled with a key press the colour of the preceding percept. Britz
et al. also included conditions in which a single stimulus was
shown only to one eye for 600 ms, then changed after the gap to
the other stimulus to the other eye. As in their study of the Necker
cube [43] they found greater activity in the right parietal region of
the brain within 50 ms prior to the onset of the rival stimuli that
predicted a change in visual consciousness. In the same time
range, they also found decreased activity in the occipital and
temporal regions that predicted a change in visual consciousness.
They found no predictive activity when visual consciousness
changed because of a physical change in the stimuli. Britz et al.
concluded that the right parietal region is causal in generating
changes of visual consciousness, representing a top-down influence
on sensory regions of the brain.
Hsieh, Colasb, and Kanwisher (2011) [46] looked for predictive
activity with functional magnetic resonance imaging in a 2000-ms
dark interval preceding discrete trials showing a 500-ms display of
a face to one eye and a house to the other, a 1500-ms gap, and
then a second display of the same rival stimuli. They asked
participants to press keys during each presentation to report what
they were seeing. Hsieh et al. also had otherwise identical trials in
which the stimuli changed physically from the first to the second
display (i.e., from both eyes’ viewing a face to both viewing a house
or vice versa). Hsieh et al. defined regions of interest in the brain:
the fusiform face area (FFA) and the parahippocampal place area.
They found greater activity in the FFA that predicted a change in
visual consciousness during rivalry by two seconds, concluding that
this greater activity primed that area to win in a later rivalry
competition.
We decided to use a similar procedure to Hsieh et al., of using
discrete trials, rather than continually repeating displays of
intermittent binocular rivalry as done by others. On each trial,
we showed rival gratings for 1000 ms, then a dark gap for 200 ms,
then a second display of identical rival gratings, then a dotted mask
for 1000 ms, then an inter-trial interval of darkness for 2000 ms
(Figure 1a,b). Discrete trials allowed us to collect participants’
reports on whether visual consciousness changed from the first to
the second display after the second display had concluded. We
included an equal number of trials in which the displays of the
gratings were non-rival, fused (e.g., horizontal to both eyes) and
either where the same in the second display (Figure 1c) or changed
(i.e., vertical to both eyes; Figure 1d). We defined a region of
interest, but also looked for marked activity outside that region of
interest.
Defining a Region of Interest (ROI)In defining a region of interest (ROI), we were guided by two
lines of research into binocular rivalry. One is a popular theory of
binocular rivalry originated by McDougall in 1901 [47] involving
reciprocal inhibition of neurons processing the rival images,
adaptation of neurons processing the dominant image, and
concurrent recovery of the previously adapted neurons of the
suppressed image. The principles of this explanation exist in most
models of rivalry [31,48,49,50,51,52,53,54,55,56,57,58,59,60,61].
There is now psychophysical evidence for the decline in the
activity of the neurons processing the dominant rivalry stimulus
after the onset of an episode of rivalry dominance and for an
increase in the activity of neurons processing the suppressed
stimulus. Alais, Cass, O’Shea, and Blake (2010) [29] found that
sensitivity to contrast increments of the dominant rival stimulus is
high immediately after onset of an episode of suppression and
declines until the end of that episode of suppression whereas it is
the opposite for sensitivity to contrast increments of the suppressed
stimulus.
McDougall’s theory is that rivalry alternations are mediated by
changes in activity accompanying adaptation of low-level neurons
processing the basic visual features of the dominant, visible
stimulus. Hence, we focused on early, adaptation-related modu-
lations of ERPs to grating stimuli from occipito-parietal electrodes.
The other line of research that guided our search for a ROI was
into ERPs during binocular rivalry when the event is a change in
the orientation of one of the rival gratings to be the same as the
other grating [20,62,63,64,65]. This approach yields physically
identical stimuli (i.e., a change in the orientation of one grating)
that differ in visual consciousness: when the change happens in the
dominant eye, the change is visible; when the change happens in
the suppressed eye, the change is harder to see, if not invisible.
This research has shown that the earliest differences in the ERPs
happen about 80–250 ms after the physical change, such that
voltages are larger (either more positive or more negative
depending on the time) when the change is seen than when not.
The location of sources of this difference is in the parietal-
temporal-occipital region [20]. This research, along with McDou-
gall’s theory, allowed us to define a spatiotemporal ROI among
parieto-occipital electrodes from 80–250 ms.
Murray, Brunet, and Michel (2008) [66] warned that defining a
ROI can mean that researchers miss other, theoretically important
activity. Hence, we also looked outside our ROI for marked
predictive activity.
In our initial analyses, we opted to stay as close as possible to the
raw EEG data by using simple treatment such as averaging and
subtraction to produce ERPs [40,41,42,44,46], rather than
complex treatment [43,67]. (We are happy to share our data with
any researchers who request them.) Apart from this, the main
difference in our approach from most others is that we used long-
Predicting Visual Consciousness
PLOS ONE | www.plosone.org 3 October 2013 | Volume 8 | Issue 10 | e76134
duration, discrete trials that allowed us to look much earlier than
others for predictive activity.
We found early predictive activity within our ROI about
180 ms after the onset of the first display of the rival stimuli. It was
a bigger first negative deflection of the ERP when consciousness
changed subsequently than when not. We also found unexpected,
marked, predictive activity outside our ROI, about 400 ms after
the onset of the same stimuli from parietal, central, and frontal
electrodes. It was less positive voltage in the ERP when
consciousness changed than when not. There was no such
predictive activity from non-rival, fusion conditions. (We have
previously reported this in published abstracts [68,69].).
Methods
Ethics StatementThe study was performed in accordance with the ethical
standards laid down in the Declaration of Helsinki [70] and with
the ethics guidelines of the German Association of Psychology
[71]. Ethical approval was granted by the German Research
Foundation (DFG). We obtained written informed consent from
each participant.
ParticipantsSixteen students from University of Leipzig volunteered for the
experiment either for course credit or payment (J6 per hour).
This reduced to 11 after we discarded two for not having normal
or corrected-to-normal visual acuity in each eye as tested by the
Freiburg Visual Acuity Test [72], one for whom we were unable to
measure any usable EEG data, and two because there were too
few trials (less than 1%) on which perception changed at the
second display of rivalry stimuli. Mean age of the 11 participants
(all right-handed; four male) was 27 years (range: 20 to 55 years).
The 11 included participants showed normal binocular rivalry
during two 3-minute test sessions. We tested binocular rivalry with
the same stimuli we used in the experiment, presented continu-
ously. Participants pressed one key whenever and for as long as
one grating was exclusively visible and another key whenever and
for as long as the other grating was exclusively visible. We defined
normal as the distributions of exclusive visibilities from the left and
right eyes’ being monomodal, showing positive skew, and with
similar modes and variabilities [73,74,75,76,77,78,79,80].
The included participants also showed normal binocular and
monocular visual evoked potentials. We tested visual-evoked
potentials (VEPs) with black (0.8 Cd/sq m) and white (33.4 Cd/
sq m) 5-deg checkerboards (0.5-deg checks) on a grey background
(7.8 Cd/sq m). The checkerboards phase-reversed at 2 Hz. We
tested 100 changes in the left eye (taking 50 s), 100 changes in the
right eye, 100 changes in both eyes, then we repeated these blocks
in the reverse order. We defined normal as the VEPs’ showing a
N75 (C1), a P100 (P1), and a N175 (N2), that did not differ
markedly between the eyes and that were larger for binocular
stimulation than for monocular stimulation [7].
ApparatusStimuli were presented on a ViewSonic Graphics Series G90fB,
19-inch, colour monitor showing 1024 pixels horizontally x 768
pixels vertically at 75 Hz. Participants viewed these stimuli
through a Screenscope SA-200-Monitor-Type, four, front-sur-
faced mirror stereoscope attached to a chin rest. Viewing distance
was 57 cm. They responded via a four-button keypad.
StimuliAnnulus-shaped patches of achromatic, vertical and horizontal,
sine-wave gratings served as stimuli. The outer diameter of the
annulus was 1.65 deg of visual angle; the inner diameter was
0.67 deg. Spatial frequency was 3.47 cycles/degree. The lumi-
nance of the gratings was 7.1 Cd/sq m with a Michelson contrast
of 0.98.
The inner part of the stimuli contained a red, binocular fixation
cross with vertical and horizontal arms 0.48 deg long and 0.06 deg
thick. Outside the stimuli there were three concentric, equally
spaced white rings of 0.03 deg thickness. The inner ring had a
diameter of 2.50 deg; the outer ring had a diameter of 3.26 deg.
These rings served to lock binocular vergence.
All stimuli were viewed on a dark background (0.4 Cd/sq m).
We used two types of stimuli;
1. Binocular rivalry stimuli: Each eye viewed either a vertical or a
horizontal grating; the other eye viewed an identical grating of
the orthogonal orientation.
2. Binocular fusion stimuli: Both eyes viewed identical gratings that
were either vertical or horizontal.
ProcedureWe began by training each participant to use the keypad for the
experiment proper. These training blocks consisted of 20 trials of
fusion stimuli. Each trial consisted of:
1. a first display of the gratings, the rings, and the fusion crosses
for 1000 ms,
2. followed by a gap during which only the fusion rings and the
fixation crosses were displayed for 200 ms,
3. followed by a second display of everything for 1000 ms,
4. followed by a square 1.65 deg display of randomly black and
white, one-pixel dots with the fixation cross for 1000 ms, and
5. finally a dark inter-trial-interval (ITI) with only the fixation
crosses for 2000 ms.
Half the trials showed vertical gratings before the gap; the others
showed horizontal gratings before the gap. On half of each set of
trials, the orientation stayed the same after the gap; on the
remaining trials, the orientation changed after the gap. Order of
these practice trials was completely randomized afresh for each set
of trials for each participant.
At the end of each trial participants pressed one of four keys,
arranged in a two-by-two, square matrix, to record their visual
consciousness before and after the gap. If a participant saw vertical
after the gap, he or she chose between the leftmost two keys; if a
participant saw horizontal after the gap, he or she chose between
the rightmost two keys. If the perceived orientation had changed
after the gap, the participant pressed the upper key; if the
perceived orientation remained the same after the gap, the
participant pressed the lower key. We explained this until the
participant understood that he or she was to press a single key to
communicate his or her perception of two properties: whether the
gratings were the same or different orientation in the first and
second display, and the orientation of the second display.
Usually participants achieved more than 90% correct on the
first training block, but they could choose to have a second (or
third, and so on) training block. Most participants trained for one
block; no participants required more than three blocks. Partici-
pants pressed the response key during the display of dotted mask
or during the ITI. If participants had not responded by the end of
the ITI, then no response was recorded.
Predicting Visual Consciousness
PLOS ONE | www.plosone.org 4 October 2013 | Volume 8 | Issue 10 | e76134

After completing the training participants went onto the
experimental blocks, each comprising 40 trials. Half the trials
were the same as the practice trials, involving fusion stimuli. The
remaining trials were rivalry trials. In half of these, we presented
vertical to the right eye and horizontal to the left eye; in the
remainder it was the opposite. We alternated whether the first trial
in each block was fusion or rivalry for each participant. We
counterbalanced this over participants. Other than that, order of
experimental trials was completely randomized afresh, without
replacement, for each block for each participant.
One block of experimental trials took 3 minutes 30 s. The
instructions were the same as for the practice trials except we
warned participants that they might see some displays (i.e., the
rivalry stimuli) that looked like a mixture of orientations. We asked
them to pay attention to the predominant orientation before and
after the gap in making their responses but not to press any key if
both orientations were equally visible. We give schematic versions
of rivalry and fusion trials in Figure 1.
Participants performed 16 blocks. We visited the participant
after the first, fourth, and then every fourth block. No participant
had any problems with the task, all getting more than 90% correct
in the fusion trials of the first block.
Electrophysiological DataWe recorded EEG continuously with a BrainAmp system (Brain
Products GmbH, Munich) using 66 active Ag/AgCl electrodes
(actiCap). Four of them were for horizontal and vertical
electrooculograms (EOGs), two were on the ear lobes. The
remaining electrodes were mounted in an elastic cap in positions
based on the modified 10–20 system [81] (Figure 2 depicts a
schematic head with the electrode positions used). We used
electrode FCz for a reference and electrode AFz for ground. The
sample rate of EEG and EOGs was 500 Hz. We re-referenced the
EEG data offline to the linked earlobes. We did this to allow
comparison with earlier work on multistable visual phenomena
that also used linked ears [40,41,42,43,64,65,82,83]. We applied a
0.3–35 Hz bandpass filter (Kaiser windowed sinc FIR filter, 1857
points, Kaiser window beta 5.65326) to the data before analysis.
We calculated event-related potentials (ERPs) by averaging
voltages separately for the four different events representing the
factorial combination of stimuli (rivalry vs fusion) and whether
visual consciousness changed after the gap, or stayed the same. We
used a 2100-ms window, time-locked to the onset of the first
display of gratings, including a baseline from minus 100 to 0 ms.
For fusion trials, we included only trials with a correct response.
Prior to averaging, we rejected any epoch containing a signal
change of more than 60 mV at any EOG electrode and more than
150 mV at any EEG electrode by using an automatic peak-to-peak
voltage artefact detection method.
To analyse neural generators, we used VARETA [20,84,85].
VARETA reconstructs sources by finding a discrete spline-
interpolated solution to the EEG inverse problem: estimating the
spatially smoothest intracranial primary current density (PCD)
distribution compatible with the observed scalp voltages. This
allows for point-to-point variation in the amount of spatial
smoothness and restricts the allowable solutions to the grey matter
(based on the probabilistic brain tissue maps available from the
Montreal Neurological Institute [86]). VARETA constructs a 3D
grid of 3,244 voxels, each of 7 mm per side, representing possible
sources of the scalp potential, and registers the 59 informative
scalp electrodes to the average probabilistic brain atlas. Then it
constructs statistical parametric maps (SPMs) of the PCD estimates
using a voxel-by-voxel Hotelling T2 test against zero. We tested for
predictive activity with a repeated-measures ANOVA comparing
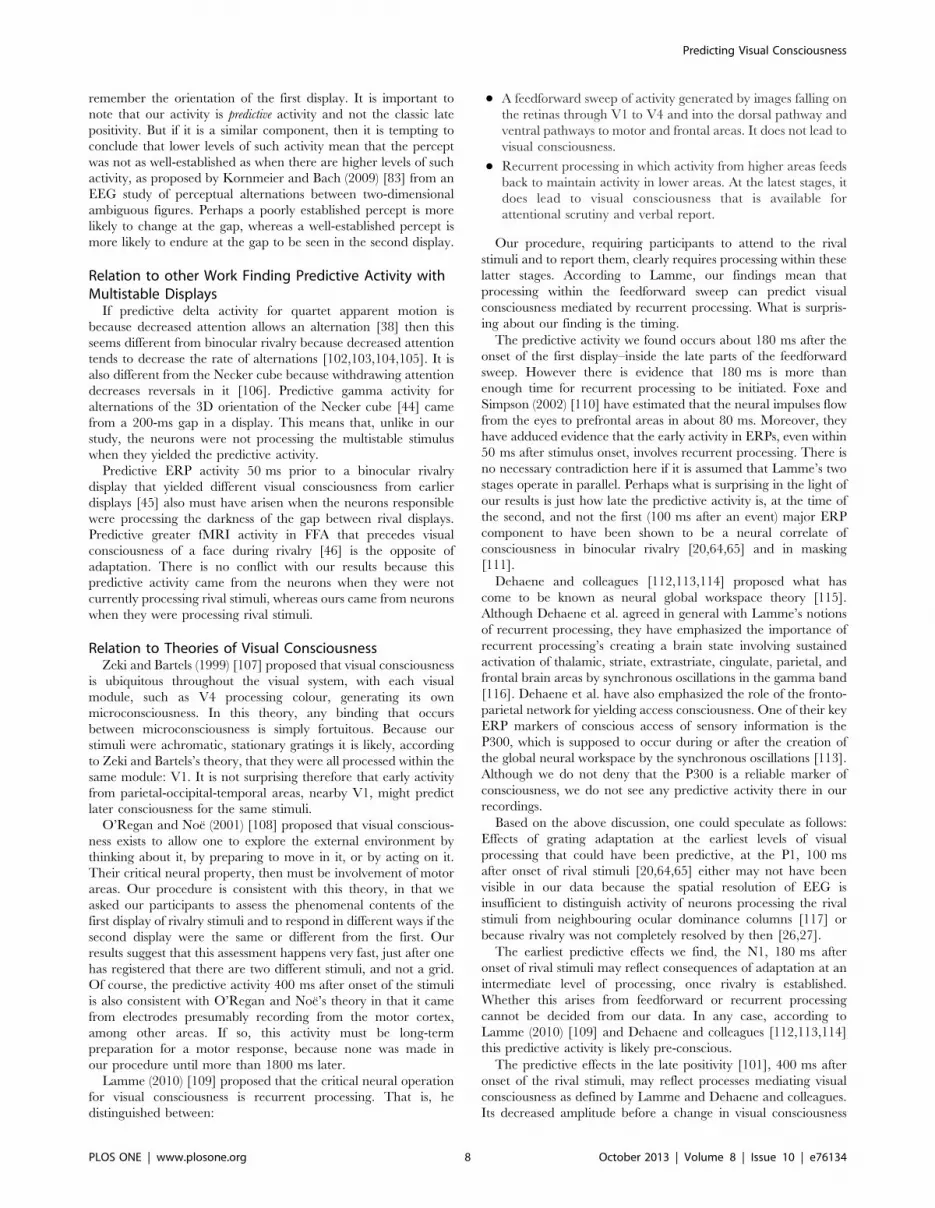
Figure 2. Illustration of events and event-related potentials(ERPs). (a) Top panel: schematic representation of the rivalry stimuli asa function of time for the first 1200 ms of a trial. Middle panel: t valuesfor the difference in the voltage in the first display (S1) between trialswhen consciousness changed at the second display (S2) with thosewhen it did not change, from 11 participants. t values, plotted as pointswhose density is proportional to t thresholded at p= .01, are from allelectrodes (arrayed on the y axis from frontal, F, at the top to occipital,O, at the bottom) as a function of time (on the x axis). The region ofinterest (ROI) is the blue rectangle; the critical differences are enclosedby a blue oval. A cluster of electrodes shows predictive activity 180 msafter the onset of the stimuli. There is also noticeable predictive activity400 ms after onset of the rival stimuli from clusters of parietal, central,and frontal electrodes. Lower panel: Event related potentials (ERPs),from a cluster of six parieto-occipital and occipital electrodes. ERPs arered for when consciousness changed and green for when it stayed thesame. The ERPs show that the predictive activity within the ROI is in thefirst main, negative deflection, the N1 (arrowed). Its amplitude is greaterwhen consciousness changed later, after the gap. There is also anenduring positivity from about 300 ms to 800 ms after onset that
Predicting Visual Consciousness
PLOS ONE | www.plosone.org 5 October 2013 | Volume 8 | Issue 10 | e76134

solutions for when visual consciousness changed with when it did
not. We constructed corresponding SPMs based on the ANOVA’s
output. For all SPMs, we used random field theory [87] to correct
activation threshold for spatial dependencies between voxels. We
show results in average, glass brains.
Results and Discussion
Behavioural DataIn the fusion trials, we had real, physical changes in the
orientation of the stimuli from the first to the second interval.
These allow us to assess response accuracy. Mean accuracy in the
fusion trials was 94% with a standard deviation of 7%–high
accuracy.
In the rivalry trials, the mean percentage of trials (standard
deviation) in which perception changed was 37% (14%).
Perception stayed the same in 57% (19%) of trials; there was no
response in 6 (10%) of the rivalry trials.
Electrophysiological Data within the ROIAfter artifact rejection, the behavioural responses yielded a
mean of 107 trials per participant for the rivalry/changed-
consciousness events (standard deviation of 47), 148 (47) trials for
the rivalry/same-consciousness events, 127 (29) trials for the
fusion/changed-consciousness events, and 125 (28) trials for the
fusion/same-consciousness events.
We show ERPs in two ways. One is by calculating, for each
electrode at the sampling rate of 500 Hz, uncorrected t-tests on the
difference in average voltage between trials in which visual
consciousness changed and those when it did not change, as done
by Britz et al. (2009, 2011) [43,67]. The other is to average
voltages over clusters of electrodes.
We show the results of the t-tests for rivalry stimuli in the middle
panels of Figure 2a and 1b, where the electrodes are arranged
from frontal (F; at the top) through fronto-central (FC), central (C),
centro-parietal (CP), parietal (P), parieto-occipital (PO), to
occipital (O; at the bottom). The density of the dots is determined
by the value of t, thresholded at p= .01. We give a longer time
sample, to 2000 ms after onset of the first display, in Figure S1 for
rival stimuli and in Figure S2 for fusion stimuli (we discuss these in
Item S1). The earliest neural correlates occurred within our ROI–
the parieto-occipital and occipital electrodes about 180 ms after
the onset of the first gratings. These represent 34 t-tests at p,.01.
Because activity on one electrode at one time is neither
independent of that on neighbouring electrodes or of earlier
activity on the same electrode, we took four steps to assure
ourselves that this activity is more than Type-I error:
1. We compared the number of significant t-tests, 34, in the ROI
with the theoretical Type-I error rate assuming independence.
With 10 electrodes and 85 samples between 80 and 250 ms, the
expected number under the null hypothesis is 8.5. The
obtained number is significantly greater than expected,
x2(1) = 77.27, p,.0001.
2. We looked at the number of significant t-tests from the fusion
condition in the ROI. Any such significant tests must represent
Type-1 error, otherwise it would mean we can predict from
participants’ brain activity what the computer later chose to
display, which is impossible! There were zero such significant
tests within the ROI.
3. We performed running permutation tests. These yielded 46
significant tests (at p,.01) with the ROI in the rivalry
conditions and none in the fusion conditions.
4. We took the advice of Lieberman and Cunningham (2009) [88]
and replicated our finding in another project in which we
tested McDougall’s theory by manipulating adaptation with
flash suppression. We found the same difference in voltages
after onset of a monocular, flash-suppression stimulus that
predicted a rivalry alternation about one second later in a gap
between two short displays of identical rivalry stimuli [89,90].
In the bottom panel of Figure 2, we show mean ERP traces
when visual consciousness changed after the gap (red line) and for
when visual consciousness stayed the same after the gap (green
line) (averaged across six parieto-occipital electrodes as shown on
the schematic head). We see a trough of activity at 180 ms in the
rivalry condition but not in the fusion condition: the well-known
N1 component. We analysed the ERP data with an analysis of
variance on average voltage for each participant between 170 ms
and 190 ms; we give the ANOVA summary in Table S1. Critically
the average deflection from baseline in voltage at 180 ms during
rivalry is bigger–more negative–when there was a change in visual
consciousness from the first to the second display than when there
was no change, F(1, 10) = 7.38, p= .022, partial g2 = .42. There is
no such predictive activity from fusion conditions, F(1, 10) = 0.42,
p= .53, partial g2 = .04 (Figure 2b, Figure S2, Table S1). The
absence of predictive activity from fusion conditions suggests that
the predictive activity during rivalry arises from processing of the
rival stimuli and not from the changes in perception. As far as we
are aware, the enhanced negativity 180 ms after the onset of
rivalry stimuli is the earliest ERP activity that predicts visual
consciousness.
We used VARETA to search for neural generators of activity
from 170 to 190 ms. In Figure 3 we show the voxels whose activity
differs significantly (thresholded to p,.01, Bonferroni corrected)
between trials in which visual consciousness stayed the same from
the first to the second displays and trials in which visual
consciousness changed from the first to the second displays.
Figure 3 shows a significant source only in the left lateral occipio-
temporal gyrus and the inferior temporal gyrus for rivalry
conditions. This agrees with other resesarch into the source of
the visual N1 [91] and with other research into the sources of early
EEG activity in binocular rivalry [20,64].
Electrophysiological Data Outside the ROILooking outside the ROI, we could not help but see a major
difference in clusters of parietal, central, and frontal electrodes
about 400 ms after the onset of the first rivalry display (middle
panel of Figure 2a). The ERP traces (bottom panel of Figure 2a)
show a prolonged positivity from about 300 ms to about 800 ms
that is smaller when consciousness subsequently changed than
when not. Although this difference is not significant in the parieto-
occipital electrodes from which the traces in Figure 2 are averaged,
it is significant in a cluster of central electrodes (Figure S1, Table
S2), F(1, 10) = 11.02, p= .008, partial g2 = .52 (for data from
380 ms to 420 ms). There is no such activity in fusion conditions,
F(1, 10) = 0.47 p= .508, partial g2 = .05. As far as we are aware no
one else has reported this sort of predictive activity either.
shows predictive activity. Its amplitude is less when consciousnesschanged later, after the gap. (b) Similar panels for fusion stimulishowing no predictive activity (middle panel) and essentially identicalERPs (lower panel).doi:10.1371/journal.pone.0076134.g002
Predicting Visual Consciousness
PLOS ONE | www.plosone.org 6 October 2013 | Volume 8 | Issue 10 | e76134

General Discussion
We found two main clusters of activity predicting an upcoming
change in conscious perception of an unchanged binocular rivalry
stimulus. The earlier one occurred in our ROI–occipital and
parieto-occipital electrodes about 180 ms after the onset of the first
display. Greater activity in the brain recorded from those
electrodes was more likely to result in a change in visual
consciousness 1020 ms later, at onset of the second display of
identical rival stimuli. The source of this activity is the left,
parietal-occipital-temporal region of the brain.
The later cluster of predictive activity occurred in parietal,
central, and frontal electrodes about 400 ms after onset of the first
display in which less activity predicted the later change in
consciousness. We concede that, because this predictive activity is
outside our ROI, we need to be cautious about its reliability.
We are not sure why the source we found for the early activity
was confined to the left hemisphere; this is rather different from
other studies finding consciousness-related activity predominantly
in the right hemisphere [14,20,21,45]. It is possible our source was
significant only in the left hemisphere because we asked our
participants to remember the visible orientation in both displays
for more than two seconds; this may have set up some form of
recurrent processing with the language areas of the brain in the left
hemisphere to enable verbal encoding of the orientations. On the
other hand, the absence of activity in the right hemisphere might
represent a Type-II error from the heavy discounting by
Bonferroni correction [92]. We note that the isolated left and
right hemispheres can yield the experience of binocular rivalry
[93,94,95] and that others have found bilateral occipital activity
that predicts rivalry content [45].
Proposed Explanation of the Predictive ActivityGreater initial activity might seem at first to be similar to greater
fMRI activity found by Hsieh, Colasb, and Kanwisher (2011) [46]
in the FFA that predicts by two seconds visual consciousness
during binocular rivalry between an image of a face and an image
of a house. However the activity found by Hsieh et al. was from
non-rival conditions, while participants were looking at a dark
field. Hsieh suggested that random increases in existing activity in
the FFA predispose it to win the competition between later rivalry
stimuli. Our activity, on the other hand, is from a first display of
rivalry stimuli, during which the neurons are processing the same
stimuli as in the second, to-be-predicted display of rival stimuli. So
greater activity in our ROI predispose the neurons producing that
activity to lose the rivalry competition in the second display.
Alais et al. (2010) [29] found psychophysical evidence they
argued shows that low activity in the neurons processing the
dominant stimulus presages a reversal of activity. At first blush, this
might imply that any early predictive activity we found would be
lower voltages just before the gap, but our predictive activity is
higher voltages that are much, much earlier, just after the onset of
the first display of rival stimuli at a time at which rivalry would just
have been resolved [26,27].
Critically, one property of neural adaptation is that when
activity is high, decline of neural responsiveness is rather rapid,
whereas when activity is low, decline of neural responsiveness is
rather slow, if it is not even an increase [96,97]. This explains why
initial high activity predicts later visual consciousness: vigorous
activity leads to substantial adaptation that would prompt an
alternation at the gap. It is also consistent with long-term
suppressive activity from similar orientations found psychophys-
ically from other techniques [98].
It is possible that the predictive activity we found 400 ms after
onset of the rival stimuli in other electrodes reveals the decline of
activity from adaptation that would prompt a later change in
visual consciousness at the gap. But we concede that this is rather
speculative for two reasons.
1. That predictive activity is not from the parieto-occipital
electrodes. It is these that show the earlier predictive activity
and these that the theory would hold responsible for initial
processing the stimuli at onset of the second display.
2. The activity recorded from parietal, central, and frontal
electrodes is likely to be very complicated to explain, being
contributed to by feed-forward and feedback connections from
many other neurons [99].
Nevertheless, there is brain-imaging evidence of the involve-
ment of parietal, central, and frontal brain areas in binocular
rivalry [14,21] and in alternations of the Necker cube [11].
Moreover the predictive ERP activity around 400 ms could be the
peak of a long positivity found by Niedeggen, Wichmann, and
Stoerig (2001) [100] from an ERP study of change blindness. They
found this component when participants noticed a change in one
of two complicated pictures–there was a greater positive deflection
of the ERP between 300 and 700 ms after stimulus onset than
when participants did not notice the change. This has become
known as the ‘‘late positivity’’ [101], and is most pronounced from
parietal and temporal electrodes.
Railo et al. [101] have attributed the late positivity to the
application of attention and working memory to the stimulus. This
is certainly consistent with our task that required participants to
Figure 3. Source localisation by VARETA. Significant voxels (thresholded to p,.01, Bonferroni corrected) are shown in glass brains for thedifference in sources between when visual consciousness changed from the first to the second displays and when visual consciousness stayed thesame from the first to the second displays. The left panel shows rivalry conditions; the right panel shows fusion conditions. There is a significantdifference only in the left lateral occipito-temporal/inferior temporal gyrus region for rivalry conditions.doi:10.1371/journal.pone.0076134.g003
Predicting Visual Consciousness
PLOS ONE | www.plosone.org 7 October 2013 | Volume 8 | Issue 10 | e76134
remember the orientation of the first display. It is important to
note that our activity is predictive activity and not the classic late
positivity. But if it is a similar component, then it is tempting to
conclude that lower levels of such activity mean that the percept
was not as well-established as when there are higher levels of such
activity, as proposed by Kornmeier and Bach (2009) [83] from an
EEG study of perceptual alternations between two-dimensional
ambiguous figures. Perhaps a poorly established percept is more
likely to change at the gap, whereas a well-established percept is
more likely to endure at the gap to be seen in the second display.
Relation to other Work Finding Predictive Activity withMultistable Displays
If predictive delta activity for quartet apparent motion is
because decreased attention allows an alternation [38] then this
seems different from binocular rivalry because decreased attention
tends to decrease the rate of alternations [102,103,104,105]. It is
also different from the Necker cube because withdrawing attention
decreases reversals in it [106]. Predictive gamma activity for
alternations of the 3D orientation of the Necker cube [44] came
from a 200-ms gap in a display. This means that, unlike in our
study, the neurons were not processing the multistable stimulus
when they yielded the predictive activity.
Predictive ERP activity 50 ms prior to a binocular rivalry
display that yielded different visual consciousness from earlier
displays [45] also must have arisen when the neurons responsible
were processing the darkness of the gap between rival displays.
Predictive greater fMRI activity in FFA that precedes visual
consciousness of a face during rivalry [46] is the opposite of
adaptation. There is no conflict with our results because this
predictive activity came from the neurons when they were not
currently processing rival stimuli, whereas ours came from neurons
when they were processing rival stimuli.
Relation to Theories of Visual ConsciousnessZeki and Bartels (1999) [107] proposed that visual consciousness
is ubiquitous throughout the visual system, with each visual
module, such as V4 processing colour, generating its own
microconsciousness. In this theory, any binding that occurs
between microconsciousness is simply fortuitous. Because our
stimuli were achromatic, stationary gratings it is likely, according
to Zeki and Bartels’s theory, that they were all processed within the
same module: V1. It is not surprising therefore that early activity
from parietal-occipital-temporal areas, nearby V1, might predict
later consciousness for the same stimuli.
O’Regan and Noe (2001) [108] proposed that visual conscious-
ness exists to allow one to explore the external environment by
thinking about it, by preparing to move in it, or by acting on it.
Their critical neural property, then must be involvement of motor
areas. Our procedure is consistent with this theory, in that we
asked our participants to assess the phenomenal contents of the
first display of rivalry stimuli and to respond in different ways if the
second display were the same or different from the first. Our
results suggest that this assessment happens very fast, just after one
has registered that there are two different stimuli, and not a grid.
Of course, the predictive activity 400 ms after onset of the stimuli
is also consistent with O’Regan and Noe’s theory in that it came
from electrodes presumably recording from the motor cortex,
among other areas. If so, this activity must be long-term
preparation for a motor response, because none was made in
our procedure until more than 1800 ms later.
Lamme (2010) [109] proposed that the critical neural operation
for visual consciousness is recurrent processing. That is, he
distinguished between:
N A feedforward sweep of activity generated by images falling on
the retinas through V1 to V4 and into the dorsal pathway and
ventral pathways to motor and frontal areas. It does not lead to
visual consciousness.
N Recurrent processing in which activity from higher areas feeds
back to maintain activity in lower areas. At the latest stages, it
does lead to visual consciousness that is available for
attentional scrutiny and verbal report.
Our procedure, requiring participants to attend to the rival
stimuli and to report them, clearly requires processing within these
latter stages. According to Lamme, our findings mean that
processing within the feedforward sweep can predict visual
consciousness mediated by recurrent processing. What is surpris-
ing about our finding is the timing.
The predictive activity we found occurs about 180 ms after the
onset of the first display–inside the late parts of the feedforward
sweep. However there is evidence that 180 ms is more than
enough time for recurrent processing to be initiated. Foxe and
Simpson (2002) [110] have estimated that the neural impulses flow
from the eyes to prefrontal areas in about 80 ms. Moreover, they
have adduced evidence that the early activity in ERPs, even within
50 ms after stimulus onset, involves recurrent processing. There is
no necessary contradiction here if it is assumed that Lamme’s two
stages operate in parallel. Perhaps what is surprising in the light of
our results is just how late the predictive activity is, at the time of
the second, and not the first (100 ms after an event) major ERP
component to have been shown to be a neural correlate of
consciousness in binocular rivalry [20,64,65] and in masking
[111].
Dehaene and colleagues [112,113,114] proposed what has
come to be known as neural global workspace theory [115].
Although Dehaene et al. agreed in general with Lamme’s notions
of recurrent processing, they have emphasized the importance of
recurrent processing’s creating a brain state involving sustained
activation of thalamic, striate, extrastriate, cingulate, parietal, and
frontal brain areas by synchronous oscillations in the gamma band
[116]. Dehaene et al. have also emphasized the role of the fronto-
parietal network for yielding access consciousness. One of their key
ERP markers of conscious access of sensory information is the
P300, which is supposed to occur during or after the creation of
the global neural workspace by the synchronous oscillations [113].
Although we do not deny that the P300 is a reliable marker of
consciousness, we do not see any predictive activity there in our
recordings.
Based on the above discussion, one could speculate as follows:
Effects of grating adaptation at the earliest levels of visual
processing that could have been predictive, at the P1, 100 ms
after onset of rival stimuli [20,64,65] either may not have been
visible in our data because the spatial resolution of EEG is
insufficient to distinguish activity of neurons processing the rival
stimuli from neighbouring ocular dominance columns [117] or
because rivalry was not completely resolved by then [26,27].
The earliest predictive effects we find, the N1, 180 ms after
onset of rival stimuli may reflect consequences of adaptation at an
intermediate level of processing, once rivalry is established.
Whether this arises from feedforward or recurrent processing
cannot be decided from our data. In any case, according to
Lamme (2010) [109] and Dehaene and colleagues [112,113,114]
this predictive activity is likely pre-conscious.
The predictive effects in the late positivity [101], 400 ms after
onset of the rival stimuli, may reflect processes mediating visual
consciousness as defined by Lamme and Dehaene and colleagues.
Its decreased amplitude before a change in visual consciousness
Predicting Visual Consciousness
PLOS ONE | www.plosone.org 8 October 2013 | Volume 8 | Issue 10 | e76134

compared to no change, may reflect reduced reliability of the
processes mediating that consciousness [83].
Conclusion
We set out to predict visual consciousness electrophysiologically
using EEG. We found that greater activity in parietal-occipital-
temporal areas about 180 ms after the onset of a first display of
rivalry stimuli predicted a change in visual consciousness in a
second display of the same stimuli by about one second. We also
found that less activity in the neurons recorded from parietal,
central, and frontal electrodes predicted a change in visual
consciousness by about 800 ms. We propose that the predictive
activity 180 ms after onset of the first display arises from high
activity, leading to high adaptation, of the low-level neurons
processing the initially visible rival stimulus. We propose that the
predictive activity 400 ms after onset of the first display arises from
low activity of a network of higher-level neurons mediating
consciousness of the initially visible rival stimulus.
Supporting Information
Figure S1 Version of Figure 1a showing an additional800 ms of the second display of rival stimuli and asecond set of ERPs from a cluster of six centralelectrodes. Top panel: schematic representation of the stimuli
as a function of time. Middle panel: t values for the difference in
the voltage between trials when consciousness changed at the
second display with those when it did not change. These are from
all electrodes (arrayed on the y axis from frontal, F, at the top to
occipital, O, at the bottom) as a function of time (on the x axis).
When the change in consciousness was from rivalry (a), there was a
cluster of electrodes showing predictive activity 180 ms after the
onset of the stimuli. About 400 ms after the onset of the first
display of stimuli, there is other, widespread predictive activity.
There is also other activity about 450 ms after the onset of the
second display. It is more negative when consciousness changed
after the gap. Lower panels: Average voltages, ERPs, from clusters
of six parieto-occipital and occipital (OP) electrodes (see upper
schematic head), and from six central electrodes (see lower
schematic head), red for when consciousness changed and green
for when it stayed the same. The upper ERPs, for parieto-occipital
and occipital electrodes, show that the first predictive activity, in
the first display of rival stimuli, was in the first main, negative
deflection (the N1). They also show a prolonged positivity from
300 ms to 800 ms that is less when consciousness changed after
the gap than when not. There is also a large difference between
the two traces between about 300 ms and 800 ms after onset of the
second display, with greater negativity when consciousness had
changed after the gap. We discuss this in Item S1. The lower
ERPs, for central electrodes, show that the predictive activity is
only in the positivity in the first display, between 300 ms and
800 ms, maximal at 400 ms. There are also differences in the
second display presumably arising from response preparation.
(PDF)
Figure S2 Version of Figure 1b showing an additional800 ms of the second display of fused stimuli. Top panel:
schematic representation of the stimuli as a function of time.
Middle panel: t values for the difference in the voltage between
trials when consciousness changed at the second display with those
when it did not change. These are from all electrodes (arrayed on
the y axis from frontal, F, at the top to occipital, O, at the bottom)
as a function of time (on the x axis). There is no predictive activity
in the first display. There are differences in the second display:
higher voltages 100 ms and 450 ms after onset of different stimuli.
Lower panel: Average voltages, ERPs, from clusters of six parieto-
occipital and occipital (OP) electrodes, red for when consciousness
changed and green for when it stayed the same. ERPs are
essentially the same in the first display. In the second display, there
are a bigger P1 and a bigger N1 when stimuli differed from the
first display. There is also a late positivity from 300 ms to about
800 ms that is much bigger for different stimuli about 450 ms. We
discuss these differences in Item S1.
(PDF)
Table S1 Two-factor ANOVAs of average voltage fromparieo-occipital (PO, O) electrodes for Rivalry andFusion conditions from 170 to 190 ms after onset of therival stimuli.
(DOCX)
Table S2 Two-factor ANOVAs of average voltage fromcentral electrodes (fronto-central, FC, central, C, andcentro-parietal, CP) for Rivalry and Fusion conditionsfrom 380 to 420 ms after onset of the rival stimuli.
(DOCX)
Item S1 Discussion of activity in the second display.
(DOCX)
Acknowledgments
We are grateful to Erich Schroger who supported this research and who
commented helpfully on previous drafts of the paper, to Michael Bach who
encouraged the research, and to Inka Bretschneider who assisted with data
collection. The experiment was realised using Cogent 2000 developed by
the Cogent 2000 team at the FIL and the ICN and Cogent Graphics
developed by John Romaya at the LON at the Wellcome Department of
Imaging Neuroscience. The data were analysed using EEProbe (Advanced
Neuro Technology, ANT) and EEGLab.
Author Contributions
Conceived and designed the experiments: UR RPO JK. Performed the
experiments: UR RPO. Analyzed the data: UR RPO JK. Wrote the paper:
RPO UR JK.
References
1. Kimura M, Schroger E, Czigler I (2011) Visual mismatch negativity and its
importance in visual cognitive sciences. NeuroReport 22: 669–673.
2. Genc E, Bergmann J, Tong F, Blake R, Singer W, et al. (2011) Callosal
connections of primary visual cortex predict the spatial spreading of binocular
rivalry across the visual hemifields. Frontiers in Human Neuroscience 5: 1–12.
3. Bode S, He AH, Soon CS, Trampel R, Turner R, et al. (2011) Tracking the
unconscious generation of free decisions using ultra-high field fMRI. PLoS
ONE 6: e21612.
4. Stanford TR, Shankar S, Massoglia DP, Costello MG, Salinas E (2010)
Perceptual decision making in less than 30 milliseconds. Nature Neuroscience
13: 379–386.
5. Kanai R, Bahrami B, Rees G (2010) Human parietal cortex structure predicts
individual differences in perceptual rivalry. Current Biology 20: 1626–1630.
6. Soon CS, Brass M, Heinze HJ, Haynes JD (2008) Unconscious determinants of
free decisions in the human brain. Nature Neuroscience 11: 543–545.
7. O’Shea RP, Roeber U, Bach M (2010) Evoked potentials: Vision. In: Goldstein
EB, editor. Encyclopedia of Perception. Los Angeles: Sage. 399–400, xli.
8. Odom JV, Bach M, Brigell M, Holder GE, McCulloch DL, et al. (2010)
ISCEV standard for clinical visual evoked potentials (2009 update). Documenta
Ophthalmologica 120: 111–119.
9. Luck SJ, Hillyard SA (1994) Electrophysiological correlates of feature analysis
during visual search. Psychophysiology 31: 291–308.
10. Zhang W, Luck SJ (2008) Feature-based attention modulates feedforward
visual processing. Nature Neuroscience 12: 24–25.
Predicting Visual Consciousness
PLOS ONE | www.plosone.org 9 October 2013 | Volume 8 | Issue 10 | e76134

11. Kornmeier J, Bach M (2012) Ambiguous figures: What happens in the brainwhen perception changes but not the stimulus. Frontiers in Human
Neuroscience 6: 51.
12. Dehaene S, Changeux JP (2011) Experimental and theoretical approaches to
conscious processing. Neuron 70: 200–227.
13. Pizzagalli D (2007) Electroencephalography and high density electrophysio-
logical source localization. In: Cacioppo JT, Tassinary LG, Berntson G,editors. Handbook of psychophysiology. 3rd ed. Cambridge: Cambridge
University Press.
14. Lumer ED, Friston KJ, Rees G (1998) Neural correlates of perceptual rivalry in
the human brain. Science 280: 1930–1934.
15. Polonsky A, Blake R, Braun J, Heeger DJ (2000) Neuronal activity in human
primary visual cortex correlates with perception during binocular rivalry.Nature Neuroscience 3: 1153–1159.
16. Leopold DA, Logothetis NK (1996) Activity changes in early visual cortexreflect monkeys’ percepts during binocular rivalry. Nature 379: 549–553.
17. Tong F, Nakayama K, Vaughan JT, Kanwisher N (1998) Binocular rivalry andvisual awareness in human extrastriate cortex. Neuron 21: 753–759.
18. Haynes J-D, Deichmann R, Rees G (2005) Eye-specific effects of binocularrivalry in the human lateral geniculate nucleus. Nature 438: 496–499.
19. Wunderlich K, Schneider KA, Kastner S (2005) Neural correlates of binocularrivalry in the human lateral geniculate nucleus. Nature Neuroscience 8: 1595–
1602.
20. Roeber U, Widmann A, Trujillo-Barreto NJ, Herrmann CS, O’Shea RP, et al.
(2008) Early correlates of visual awareness in the human brain: Time and place
from event-related brain potentials. Journal of Vision 8: 1–12.
21. Wilcke JC, O’Shea RP, Watts R (2009) Frontoparietal activity and its structural
connectivity in binocular rivalry. Brain Research 1305: 96–107.
22. Porta JB (1593) De refractione. Optices parte. Libri novem. Naples: Salviani.
23. Wheatstone C (1838) Contributions to the physiology of vision.–Part the First.
On some remarkable, and hitherto unobserved, phænomena of binocular
vision. Philosophical Transactions of the Royal Society of London 128: 371–394.
24. Blake R, O’Shea RP (2009) Binocular rivalry. In: Squire LR, editor.
Encyclopedia of Neuroscience. Oxford: Academic Press. 179–187.
25. Breese BB (1899) On inhibition. Psychological Monographs 3: 1–65.
26. Wolfe JM (1983) Influence of spatial frequency, luminance and duration onbinocular rivalry and abnormal fusion of briefly presented dichoptic stimuli.
Perception 12: 447–456.
27. O’Shea RP, Crassini B (1984) Binocular rivalry occurs without simultaneous
presentation of rival stimuli. Perception & Psychophysics 36: 266–276.
28. Crick F, Koch C (1990) Towards a neurobiological theory of consciousness.
Seminars in the Neurosciences 2: 263–275.
29. Alais D, Cass J, O’Shea RP, Blake R (2010) Visual sensitivity underlying
changes in visual consciousness. Current Biology 20: 1362–1367.
30. Jaskowski P (1983) Distribution of the human reaction time measurements.
Acta Neurobiologiae Experimentalis 43: 221–225.
31. Noest AJ, van Ee R, Nijs MM, van Wezel RJ (2007) Percept-choice sequences
driven by interrupted ambiguous stimuli: A low-level neural model. Journal of
Vision 7: 1–14.
32. Orbach J, Ehrlich D, Heath HA (1963) Reversibility of the Necker cube: I. Anexamination of the concept of ‘‘satiation of orientation’’. Perceptual and Motor
Skills 17: 439–458.
33. Sterzer P, Kleinschmidt A, Rees G (2009) The neural bases of multistable
perception. Trends in Cognitive Sciences 13: 310–318.
34. Leopold DA, Wilke M, Maier A, Logothetis NK (2002) Stable perception of
visually ambiguous patterns. Nature Neuroscience 5: 605–609.
35. Wallach H, O’Connell DN (1953) The kinetic depth effect. Journal of
Experimental Psychology 45: 205–217.
36. Schiller PV (1933) Stroboskopische Alternativversuche. Psychologische For-
schung 17: 179–214.
37. Necker LA (1832) Observations on some remarkable Optical Phenomena seen
in Switzerland; and on an Optical Phenomenon which occurs on viewing a
Figure of a Crystal or geometrical Solid. The London and EdinburghPhilosophical Magazine and Journal of Science 1: 329–337.
38. Muller TJ, Federspiel A, Fallgatter AJ, Strik WK (1999) EEG signs of vigilancefluctuations preceding perceptual flips in multistable illusionary motion.
NeuroReport 10: 3423–3427.
39. O’Donnell BF, Hendler T, Squires NK (1988) Visual evoked potentials to
illusory reversals of the necker cube. Psychophysiology 25: 137–143.
40. Kornmeier J, Bach M (2006) Bistable perception–along the processing chain
from ambiguous visual input to a stable percept. International Journal ofPsychophysiology 62: 345–349.
41. Kornmeier J, Bach M (2005) The Necker cube–an ambiguous figuredisambiguated in early visual processing. Vision Research 45: 955–960.
42. Kornmeier J, Bach M (2004) Early neural activity in Necker-cube reversal:Evidence for low-level processing of a gestalt phenomenon. Psychophysiology
41: 1–8.
43. Britz J, Landis T, Michel CM (2009) Right parietal brain activity precedes
perceptual alternation of bistable stimuli. Cerebral Cortex 19: 55–65.
44. Ehm W, Bach M, Kornmeier J (2011) Ambiguous figures and binding: EEG
frequency modulations during multistable perception. Psychophysiology 48:547–558.
45. Britz J, Pitts MA, Michel CM (2011) Right parietal brain activity precedes
perceptual alternation during binocular rivalry. Human Brain Mapping 32:
1432–1442.
46. Hsieh P-J, Colasb JT, Kanwisher NG (2011) Pre-stimulus pattern of activity in
the fusiform face area predicts face percepts during binocular rivalry.
Neuropsychologia 50: 522–529.
47. McDougall W (1901) On the seat of the psycho-physical processes. Brain 24:
579–630.
48. Klink PC, van Ee R, Nijs MM, Brouwer GJ, Noest AJ, et al. (2008) Early
interactions between neuronal adaptation and voluntary control determine
perceptual choices in bistable vision. Journal of Vision 8: 1–18.
49. Grossberg S, Yazdanbakhsh A, Cao Y, Swaminathan G (2008) How does
binocular rivalry emerge from cortical mechanisms of 3-D vision? Vision
Research 48: 2232–2250.
50. Blake R (1989) A neural theory of binocular rivalry. Psychological Review 96:
145–167.
51. Brascamp JW, Knapen THJ, Kanai R, Noest AJ, van Ee R, et al. (2008) Multi-
timescale perceptual history resolves visual ambiguity. PLoS ONE 3: e1497.
52. Cogan AI (1987) Human binocular interaction: Towards a neural model.
Vision Research 27: 2125–2139.
53. Hayashi R, Maeda T, Shimojo S, Tachi S (2004) An integrative model of
binocular vision: A stereo model utilizing interocularly unpaired points
produces both depth and binocular rivalry. Vision Research 44: 2367–2380.
54. Kalarickal GJ, Marshall JA (2000) Neural model of temporal and stochastic
properties of binocular rivalry. Neurocomputing 32–33: 843–853.
55. Laing C, Chow CC (2002) A spiking neuron model for binocular rivalry.
Journal of Computational Neuroscience 12: 39–53.
56. Lankheet MJM (2006) Unraveling adaptation and mutual inhibition in
perceptual rivalry. Journal of Vision 6: 304–310.
57. Lehky SR (1988) An astable multivibrator model of binocular rivalry.
Perception 17: 215–228.
58. Matsuoka K (1984) The dynamic model of binocular rivalry. Biological
Cybernetics 49: 201–208.
59. Mueller TJ (1990) A physiological model of binocular rivalry. Visual
Neuroscience 4: 63–73.
60. Stollenwerk L, Bode M (2003) Lateral neural model of binocular rivalry.
Neural Computation 15: 2863–2882.
61. Wilson HR (2003) Computational evidence for a rivalry hierarchy in vision.
Proceedings of the National Academy of Sciences, USA 100: 14499–14503.
62. Kaernbach C, Schroger E, Jacobsen T, Roeber U (1999) Effects of
consciousness on human brain waves following binocular rivalry. NeuroReport
10: 713–716.
63. Roeber U, Schroger E (2004) Binocular rivalry is partly resolved at early
processing stages with steady and with flickering presentation: A human event-
related brain potential study. Neuroscience Letters 371: 51–55.
64. Veser S, O’Shea RP, Schroger E, Trujillo-Barreto NJ, Roeber U (2008) Early
correlates of visual awareness following orientation and colour rivalry. Vision
Research 48: 2359–2369.
65. Roeber U, Veser S, Schroger E, O’Shea RP (2011) On the role of attention in
binocular rivalry: Electrophysiological evidence. PLoS ONE 6: e22612.
66. Murray MM, Brunet D, Michel CM (2008) Topographic ERP analyses: A step-
by-step tutorial review. Brain Topography 20: 249–264.
67. Britz J, Pitts MA (2011) Perceptual reversals during binocular rivalry: ERP
components and their concomitant source differences. Psychophysiology 48:
1490–1499.
68. O’Shea RP, Kornmeier J, Roeber U (2009) Predicting binocular-rivalry
alternations electrophysiologically [Abstract]. Perception 38: 110.
69. O’Shea RP, Kornmeier J, Roeber U (2010) Predicting visual consciousness
electrophysiologically [Abstract]. Clinical EEG and Neuroscience 41: 114.
70. World Medical Association (2004) Declaration of Helsinki: Ethical principles
for medical research involving human subjects.
71. Deutsche Gesellschaft fur Psychologie (2004) Revision der auf die Forschung
bezogenen ethischen Richtlinien. Author.
72. Bach M (1996) The Freiburg Visual Acuity Test: Automatic measurement of
visual acuity. Optometry & Vision Science 73: 49–53.
73. Zhou YH, Gao JB, White KD, Merk I, Yao K (2004) Perceptual dominance
time distributions in multistable visual perception. Biological Cybernetics 90:
256–263.
74. van Ee R, Noest AJ, Brascamp JW, van den Berg AV (2006) Attentional control
over either of the two competing percepts of ambiguous stimuli revealed by a
two-parameter analysis: Means do not make the difference. Vision Research
46: 3129–3141.
75. van Boxtel JJA, van Ee R, Erkelens CJ (2007) Dichoptic masking and binocular
rivalry share common perceptual dynamics. Journal of Vision 7: 1–11.
76. Murata T, Matsui N, Miyauchi S, Kakita Y, Yanagida T (2003) Discrete
stochastic process underlying perceptual rivalry. Neuroreport 14: 1347–1352.
77. Levelt WJM (1967) Note on the distribution of dominance times in binocular
rivalry. British Journal of Psychology 58: 143–145.
78. Fox R, Herrmann J (1967) Stochastic properties of binocular rivalry
alternations. Perception & Psychophysics 2: 432–436.
79. Cogan R (1973) Distribution of durations of perception in the binocular rivalry
of contours. Journal of General Psychology 89: 297–304.
Predicting Visual Consciousness
PLOS ONE | www.plosone.org 10 October 2013 | Volume 8 | Issue 10 | e76134

80. Brascamp JW, van Ee R, Pestman WR, van den Berg AV (2005) Distributions
of alternation rates in various forms of bistable perception. Journal of Vision 5:287–298.
81. American Electroencephalographic Society (1994) Guideline thirteen: Guide-
lines for standard electrode position nomenclature. Journal of ClinicalNeurophysiology 11: 111–113.
82. Kornmeier J, Ehm W, Bigalke H, Bach M (2007) Discontinuous presentation ofambiguous figures: How interstimulus-interval durations affect reversal
dynamics and ERPs. Psychophysiology 44: 552–560.
83. Kornmeier J, Bach M (2009) Object perception: When our brain is impressedbut we do not notice it. Journal of Vision 9: 1–10.
84. Bosch-Bayard J, Valdes-Sosa P, Virues-Alba T, Aubert-Vazquez E, John ER,et al. (2001) 3D statistical parametric mapping of EEG source spectra by means
of variable resolution electromagnetic tomography (VARETA). ClinicalElectroencephalography 32: 47–61.
85. Picton TW, Alain C, Woods DL, John MS, Scherg M, et al. (1999)
Intracerebral sources of human auditory-evoked potentials. Audiology &Neuro-otology 4: 64–79.
86. Evans AC, Collins DL, Mills SR, Brown ED, Kelly RL, et al. (1993) 3Dstatistical neuroanatomical models from 305 MRI volumes. IEEE Conference
Record–Nuclear Science Symposium & Medical Imaging Conference 3: 1813–
1817.87. Worsley KJ, Marrett S, Neelin P, Evans AC (1996) Searching scale space for
activation in PET images. Human Brain Mapping 4: 74–90.88. Lieberman MD, Cunningham WA (2009) Type I and Type II error concerns
in fMRI research: Re-balancing the scale. Social Cognitive and AffectiveNeuroscience 4: 423–428.
89. Durrant E-L (2011) Predicting visual consciousness [Thesis]: Southern Cross
University.90. Hawes ML (2011) Binocular rivalry and the neural correlates of visual
consciousness [Thesis]: Southern Cross University.91. Di Russo F, Martınez A, Sereno MI, Pitzalis S, Hillyard SA (2001) Cortical
sources of the early components of the visual evoked potential. Human Brain
Mapping 15: 95–111.92. Perneger TV (1998) What’s wrong with Bonferroni adjustments. BMJ 316:
1236–1238.93. O’Shea RP, Corballis PM (2003) Binocular rivalry in split-brain observers.
Journal of Vision 3: 610–615.94. O’Shea RP, Corballis PM (2005) Binocular rivalry in the divided brain. In:
Alais D, Blake R, editors. Binocular rivalry. Cambridge MA: MIT Press. 301–
315.95. O’Shea RP, Corballis PM (2005) Visual grouping on binocular rivalry in a
split-brain observer. Vision Research 45: 247–261.96. Vautin RG, Berkley MA (1977) Responses of single cells in cat visual cortex to
prolonged stimulus movement: Neural correlates of visual aftereffects. Journal
of Neurophysiology 40: 1051–1065.97. Ohzawa I, Sclar G, Freeman RD (1985) Contrast gain control in the cat’s
visual system. Journal of Neurophysiology 54: 651–667.
98. Wong EMY, Roeber U, Freeman AW (2010) Lengthy suppression from similar
stimuli during rapid serial visual presentation. Journal of Vision 10: 1–12.
99. Tong F, Meng M, Blake R (2006) Neural bases of binocular rivalry. Trends in
Cognitive Sciences 10: 502–511.
100. Niedeggen M, Wichmann P, Stoerig P (2001) Change blindness and time to
consciousness. European Journal of Neuroscience 14: 1719–1726.
101. Railo H, Koivisto M, Revonsuo A (2011) Tracking the processes behind
conscious perception: A review of event-related potential correlates of visual
consciousness. Consciousness and Cognition 20: 972–983.
102. Paffen CLE, Alais D, Verstraten FAJ (2006) Attention speeds binocular rivalry.
Psychological Science 17: 752–756.
103. Paffen CLE, Alais D (2011) Attentional modulation of binocular rivalry.
Frontiers in Human Neuroscience 5: 1–10.
104. Zhang P, Jamison K, Engel S, He B, He S (2011) Binocular rivalry requires
visual attention. Neuron 71: 362–369.
105. Brascamp JW, Blake R (2012) Inattention abolishes binocular rivalry:
Perceptual evidence. Psychological Science 23: 1159–1167.
106. Reisberg D, O’Shaughnessy M (1984) Diverting subjects’ concentration slows
figural reversals. Perception 13: 461–468.
107. Zeki S, Bartels A (1999) Toward a theory of visual consciousness.
Consciousness and Cognition 8: 225–259.
108. O’Regan JK, Noe A (2001) A sensorimotor account of vision and visual
consciousness. Behavioral and Brain Sciences 24: 939–973; discussion 973–
1031.
109. Lamme VAF (2010) How neuroscience will change our view on consciousness.
Cognitive Neuroscience 1: 204–220.
110. Foxe JJ, Simpson G (2002) Flow of activation from V1 to frontal cortex in
humans. Experimental Brain Research 142: 139–150.
111. Fahrenfort JJ, Scholte HS, Lamme VAF (2008) The spatiotemporal profile of
cortical processing leading up to visual perception. Journal of Vision 8: 1–12.
112. Dehaene S, Changeux JP, Naccache L, Sackur J, Sergent C (2006) Conscious,
preconscious, and subliminal processing: A testable taxonomy. Trends in
Cognitive Sciences 10: 204–211.
113. Dehaene S, Sergent C, Changeux JP (2003) A neuronal network model linking
subjective reports and objective physiological data during conscious perception.
Proceedings of the National Academy of Sciences of the United States of
America 100: 8520–8525.
114. Gaillard R, Dehaene S, Adam C, Clemenceau S, Hasboun D, et al. (2009)
Converging intracranial markers of conscious access. PLoS Biology 7: e61.
115. Lamme VAF (2006) Towards a true neural stance on consciousness. Trends in
Cognitive Sciences 10: 494–501.
116. Fries P, Roelfsema PR, Engel AK, Konig P, Singer W (1997) Synchronization
of oscillatory responses in visual cortex correlates with perception in interocular
rivalry. Proceedings of the National Academy of Sciences of the United States
of America 94: 12699–12704.
117. Calabrese A (2008) Ocular dominance column. Scholarpedia 4: 2668.
Predicting Visual Consciousness
PLOS ONE | www.plosone.org 11 October 2013 | Volume 8 | Issue 10 | e76134


