Embed Size (px)
Citation preview
PREDICTION OF CRUSHING BEHAVIOUR OF HONEYCOMBSTRUCTURES
A Chawla1 , S Mukherjee1, Dileep Kumar2, T. Nakatani3 and M. Ueno3
1 Dept of Mechanical EngineeringIndian Institute of Technology
New Delhi 110 0162 Terminal Ballistics Research Laboratory
Chandigarh, India3 Japan Automobile Research Institute
Tsukuba, Japan
ABSTRACT A finite element methodology has been developed for predicting the behaviour of honeycomb structures.
Dynamic analysis of hexagonal aluminium honeycomb structures is carried out using PAM-CRASHTM, an explicit FE
analysis code, and the result are verified against experimental data. Relationship between the crushing behaviour of
honeycomb and simulation parameters has been established. The simulation results are also compared with theoretically
predicted values.
Keywords: Finite Element Modelling, Impact, Dynamic modelling, Honeycomb structures, CrushingBehaviour.
Nomenclature:Fn Normal ForceFs Shear forceUn Ultimate tensile strength in the failure modelUs Ultimate shear strength in failure modelsA1, A2 Constant used in rupture modelE’ Elastic modulus of the base materialE Equivalent elastic modulus in the axial
directiont Foil thicknessθ Cell angleSo Flow stressD Cell size
σ0.2 0.2% proof stressσu Ultimate stressScrushCrush strengthScomp Compressive strengthH Fold thicknessEs Young’s modulus obtained from SimulationsEa Young’s modulus obtained from analysisScr_a Crush strength obtained from analysisScr_s Crush strength obtained from simulationsSco_a Compressive strength obtained from analysisSco_s Compressive strength obtained from
simulations
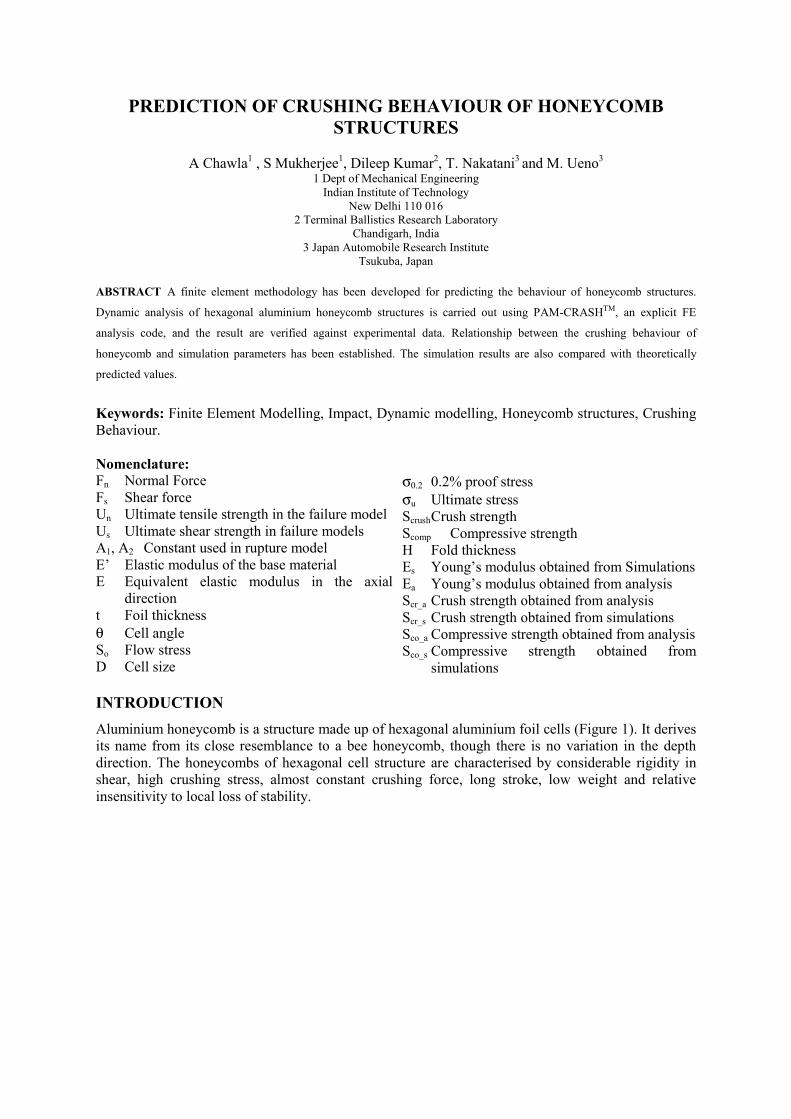
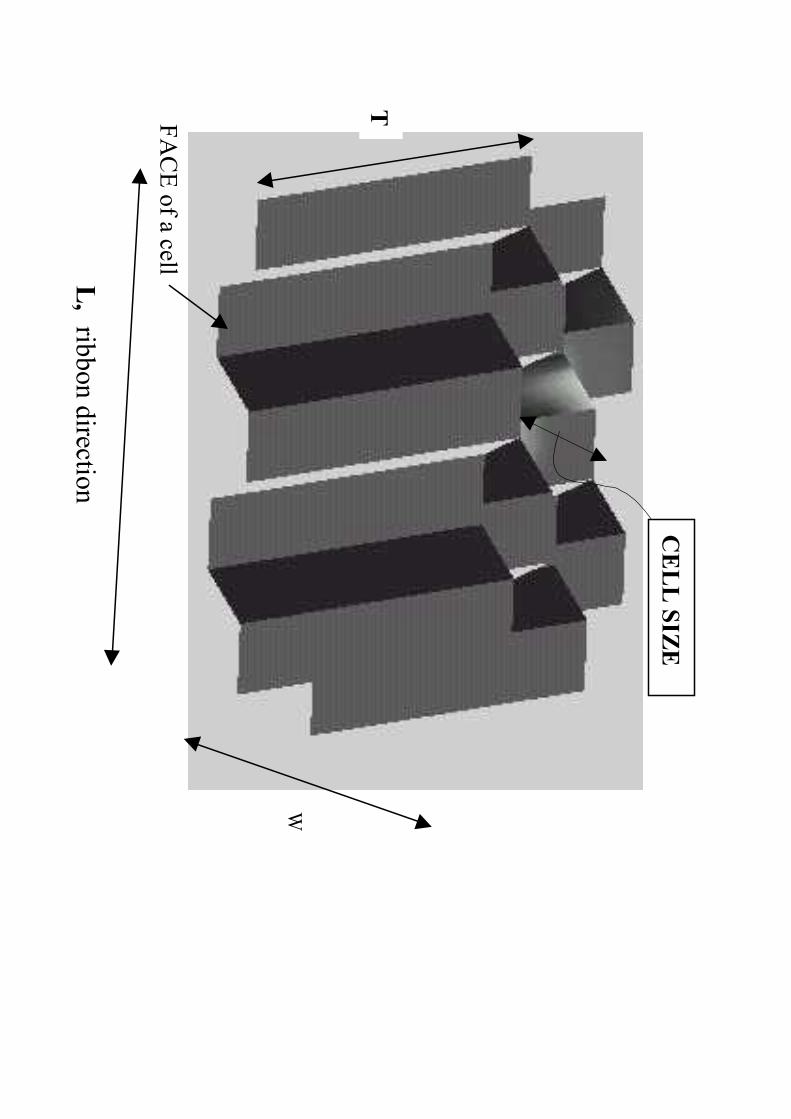
INTRODUCTIONAluminium honeycomb is a structure made up of hexagonal aluminium foil cells (Figure 1). It derivesits name from its close resemblance to a bee honeycomb, though there is no variation in the depthdirection. The honeycombs of hexagonal cell structure are characterised by considerable rigidity inshear, high crushing stress, almost constant crushing force, long stroke, low weight and relativeinsensitivity to local loss of stability.
FACE of a cell
W
L, ribbon direction
CELL SIZE
T
Figure 1, The nomenclature of the honeycomb.
Initial models developed to predict the approximate crushing stress of hexagonal cell structuressubjected to axial loading were semi-emperical [1]. Energy based analytical method, in conjunctionwith a plastic flow minimum principle for determining the crushing strength are more accurate [2].
Typical force - time curve
0
100
200
300
400
500
600
0.00 5.00 10.00 15.00 20.00
Time (msecs)
stre
ss (k
N/m
^2)
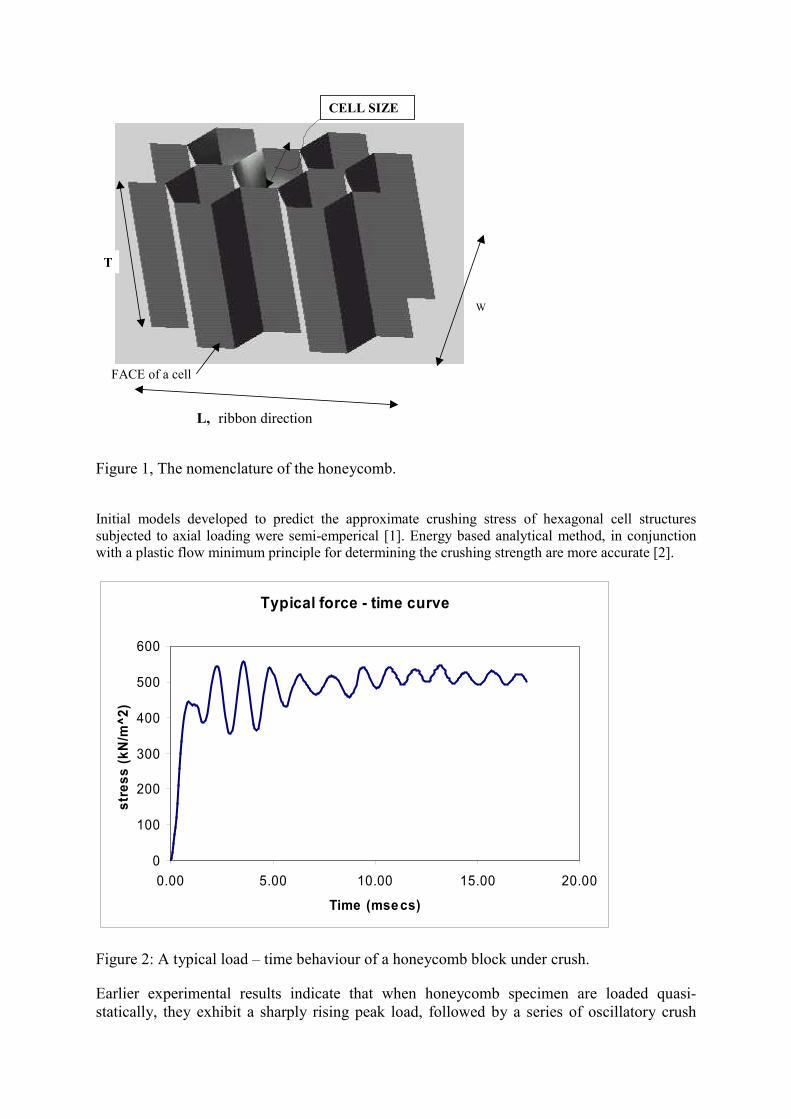
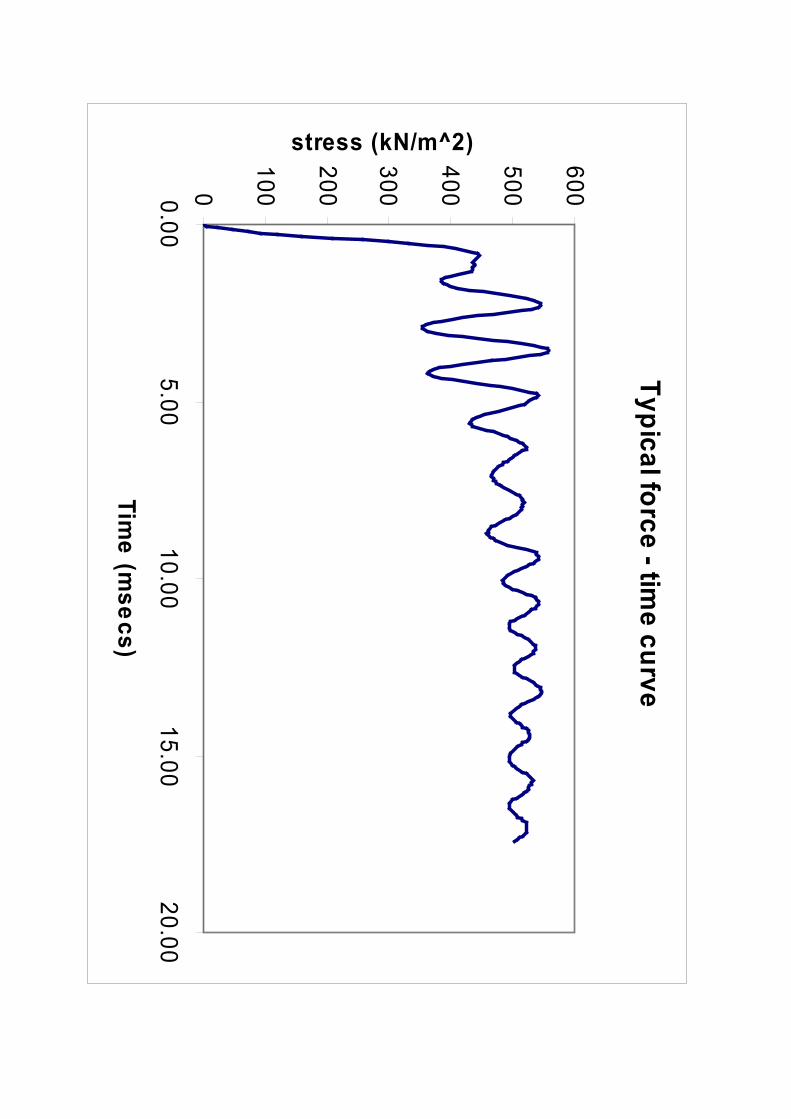
Figure 2: A typical load – time behaviour of a honeycomb block under crush.
Earlier experimental results indicate that when honeycomb specimen are loaded quasi-statically, they exhibit a sharply rising peak load, followed by a series of oscillatory crush
loads with a nearly constant mean value [3]. In the dynamic experimental curve we obtained,shown in Figure 2, the initial peak load is not seen because the data was not sampled at fastenough rates. The oscillations correspond to the onset of the progressive plastic buckling andsubsequent plastic folding of the cellular structures. Manufacturer specifications ofhoneycombs label the overshoot peak as the ‘bare compressive strength’ and the plateauregion as the ‘crush strength’ on the stress-strain curve. The crush strength of a honeycombstructure is directly related to its energy absorbing capability. The average dynamic crushstrength is in the range of 1.33 to1.74 times that obtained under quasi-static loadingconditions [3]. This increase can be attributed to more complicated and compacted plasticfolding mechanisms during dynamic loading, the inertial effect and the strain–rate effect. Thecrush strength was also found to vary with the striking velocity of the impactor. Experimentaldemonstration of strain-rate dependence through stress-deformation curves and the energy–absorption characteristics of metal honeycombs at varying initial strain rates upto 2000/secare available [4]. The collapse for the aluminium honeycomb is seen to initiate at only one ofthe surfaces, and then propagates uniformly along the length.
Analytical results are available for quasi-static loading. The behaviour of honeycombstructures under dynamic loading had only been studied experimentally. In this paper, resultsof FE simulation of the dynamic crush of honeycomb structures are presented. The results areconsistent with experimental measurements. This method hence could be a useful tool fordesign of honeycomb structures to meet specific design requirements.
To generate the FE model, aluminium honeycomb structures have been modelled usingIDEASTM , and the dynamic analysis has been carried out using PAMCRASHTM. The largestelement size that yields reasonable accuracy has been established to economise on computerrun time. Two alternate approaches to model the adhesive bonding between shell faces havebeen studied. The observed effects of varying the impactor velocity and material properties inthe FE simulations are consistent with experimental results. A comparison of the simulationresults with available experimental results and analytical models is presented.
FINITE ELEMENT MODELLING
Aluminium honeycomb structures made from ¾-Al-5052-0.003N and ¾-Al-5052-0.002Nhave been studied. The geometrical model was developed using I-DEASTM master modellerand meshed using thin shell elements. The finite element mesh was then ported to PAM-GENERISTM to set boundary conditions. The numerical solutions are carried out using theexplicit finite element code PAM-CRASHTM. The post-processor PAM-VIEWTM was usedfor visualisation. The honeycomb structure had a length of 109.7 mm (along ribbondirection), width of 76.7 mm and thickness 100 mm to mimic the specimens used forexperimentation. The density of ¾ -Al-5052-0.003N honeycomb was 27.77 kg / m3 and for ¾-Al-5052-0.002N, 18.51 kg / m3
The resulting structure had 18 complete hexagonal cells. A rigid wall was defined at thebottom of the honeycomb structure. The impactor, modelled as a rigid body, as it issignificantly stiffer than the honeycomb, strikes the honeycomb at the top end.
Post impact, due to deformation, segments not originally proximal may interact with eachother. Three types of contact interface are used to model this phenomenon in the simulations.Conventional master-slave contact is used between impactor and honeycomb. Defining self-
contact over the honeycomb walls inhibits interpenetration between the folds in thehoneycomb cells during progressive formation of plastic folds. To model the adhesive bond,tied contact between nodes on adjacent faces on different honeycomb cells are used. Tiedcontacts allow elements to move apart after force limits are exceeded, but inhibit penetration.
The honeycomb was fabricated from 5052-H39 grade Aluminium, for which relevantmaterial properties could not be found in literature. It is however known that their ultimatetensile strengths are generally higher than those of H38 materials by at least 10 MPa [5]. Thematerial properties used in our simulations are Young’s modulus = 70GPa, initial Yield stress= 265 MPa, Poisson’s ratio = 0.33, Density = 2680 kg/m3. The constitutive behaviour of thethin shell element is assumed to be elastic-plastic with Von-Mises’s isotropic plasticityalgorithm being applicable. The transverse shear effect and plastic hardening is included inthe material model. This type of material model is referred to as material type 103 in PAM-CRASHTM [6]. The tangent modulus was taken to be 0.5718GPa at 300MPa stress.
PARAMETRIC STUDIES IN SIMULATION
Effect of element size
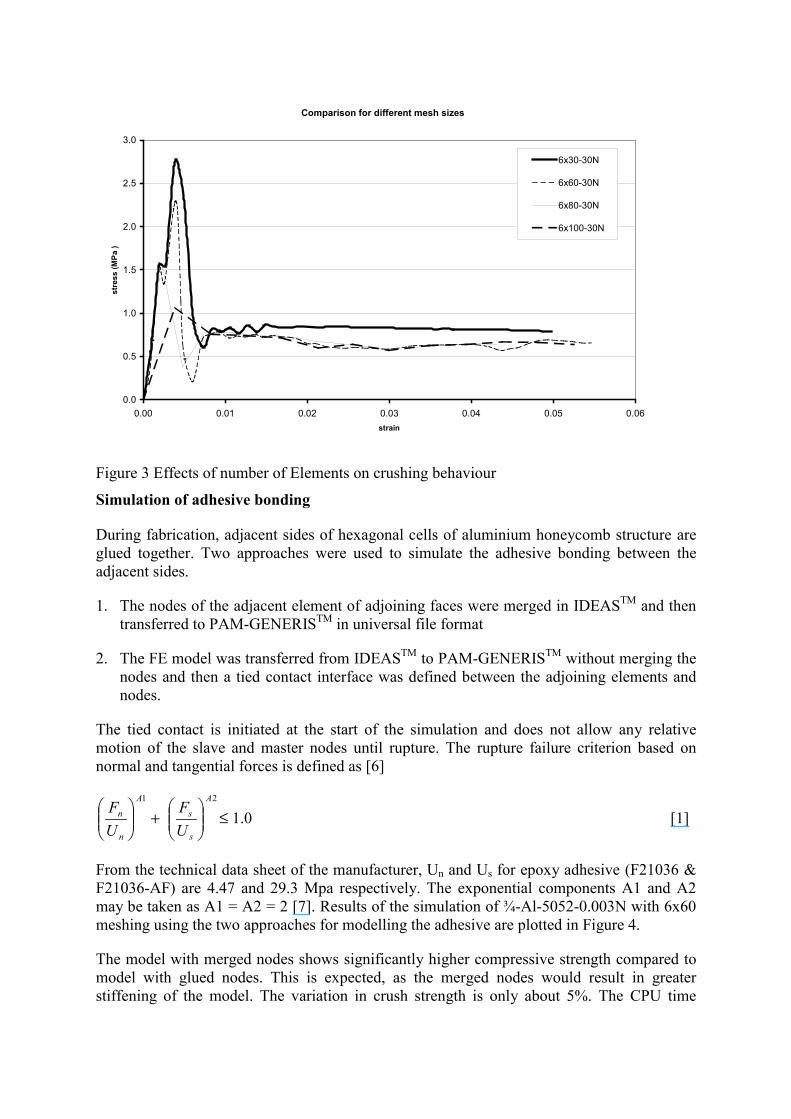
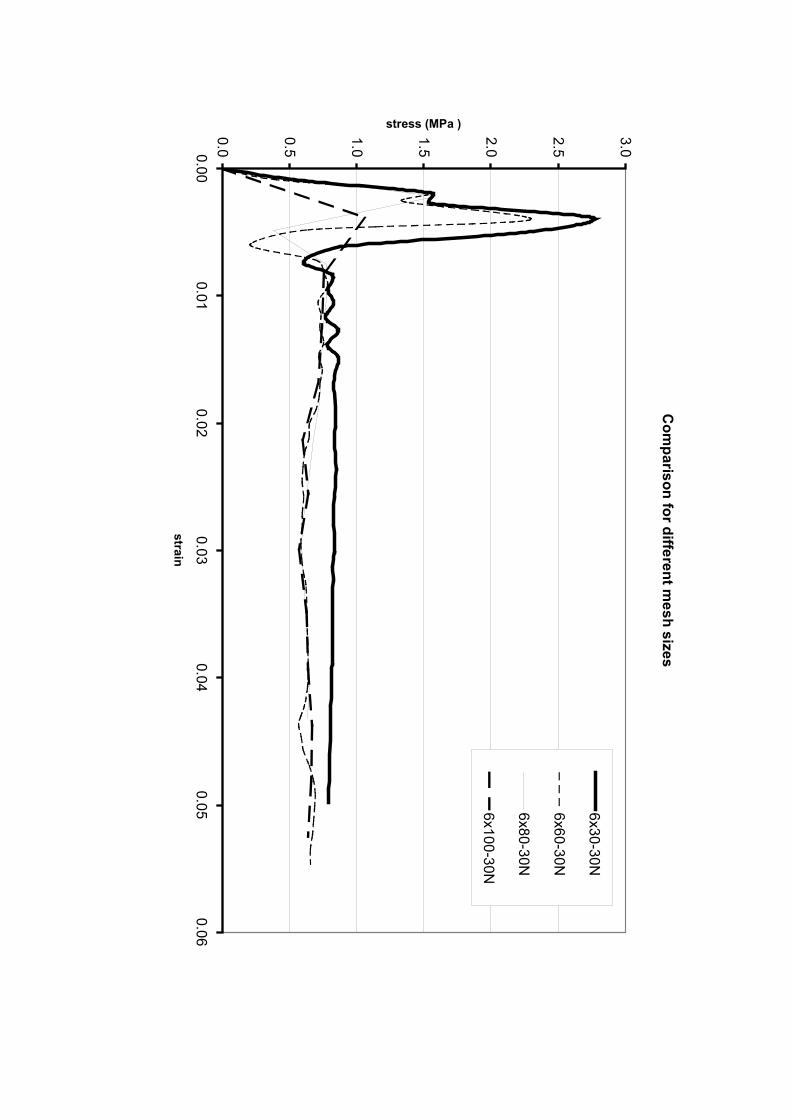
Varying the number of elements for a fixed geometry leads to variation in element size. It isimportant to establish the mesh size that optimises simulation time without significant penaltyon accuracy. The ¾-Al-5052-0.003N model was selected for this study. Simulations were runwith variation in the number of elements in ribbon as well as cell width directions. From thesimulation, rigid-wall forces vs. time and impactor displacement vs. time, plots wereextracted. Effective stress is calculated as force divided by total crossection area of thestructure and effective strain as displacement of C.G. of impactor divided by honeycombthickness. The stress vs strain diagram is plotted for each mesh type.
The nomenclature used to describe the models is that 3x30 is to be interpreted as 3 elementsalong thickness direction and 30 elements along ribbon direction for each face of honeycombcell. It was concluded that for small geometric size of structure, FE model of 6x80 elementsper cell gives good result whereas for large size of problem 6x60 elements may be usedwithout introducing large errors. Figure 3 below shows the variation in stresses with differentmesh sizes for a typical case.
Comparison for different mesh sizes
0.0
0.5
1.0
1.5
2.0
2.5
3.0
0.00 0.01 0.02 0.03 0.04 0.05 0.06strain
stre
ss (M
Pa )
6x30-30N
6x60-30N
6x80-30N
6x100-30N
Figure 3 Effects of number of Elements on crushing behaviour
Simulation of adhesive bonding
During fabrication, adjacent sides of hexagonal cells of aluminium honeycomb structure areglued together. Two approaches were used to simulate the adhesive bonding between theadjacent sides.
1. The nodes of the adjacent element of adjoining faces were merged in IDEASTM and thentransferred to PAM-GENERISTM in universal file format
2. The FE model was transferred from IDEASTM to PAM-GENERISTM without merging thenodes and then a tied contact interface was defined between the adjoining elements andnodes.
The tied contact is initiated at the start of the simulation and does not allow any relativemotion of the slave and master nodes until rupture. The rupture failure criterion based onnormal and tangential forces is defined as [6]
+
1A
n
n
UF
2A
s
s
UF
≤ 1.0 [1]
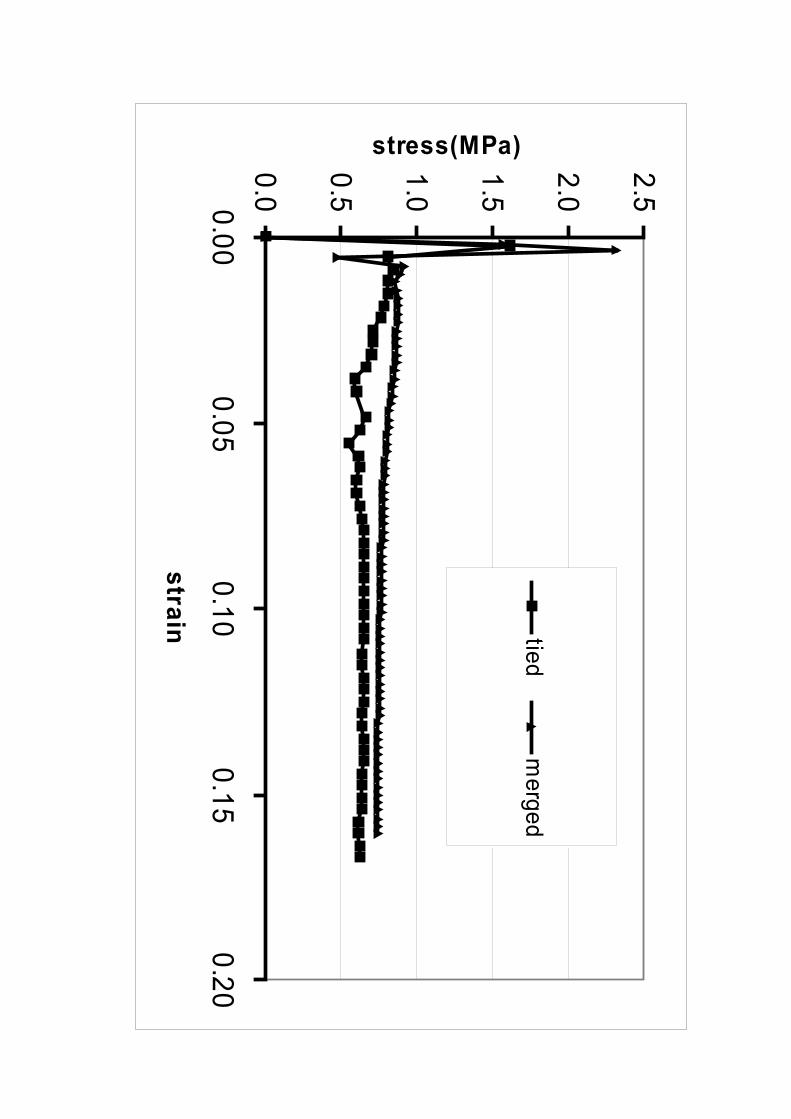
From the technical data sheet of the manufacturer, Un and Us for epoxy adhesive (F21036 &F21036-AF) are 4.47 and 29.3 Mpa respectively. The exponential components A1 and A2may be taken as A1 = A2 = 2 [7]. Results of the simulation of ¾-Al-5052-0.003N with 6x60meshing using the two approaches for modelling the adhesive are plotted in Figure 4.
The model with merged nodes shows significantly higher compressive strength compared tomodel with glued nodes. This is expected, as the merged nodes would result in greaterstiffening of the model. The variation in crush strength is only about 5%. The CPU time
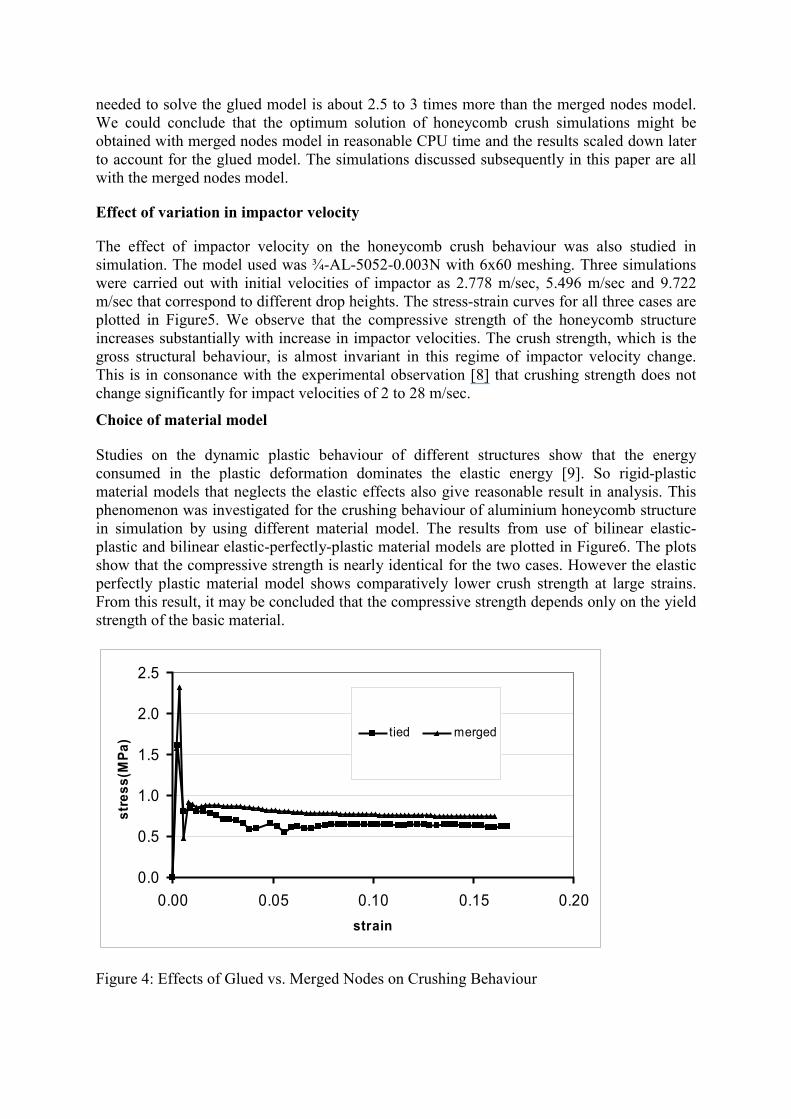
needed to solve the glued model is about 2.5 to 3 times more than the merged nodes model.We could conclude that the optimum solution of honeycomb crush simulations might beobtained with merged nodes model in reasonable CPU time and the results scaled down laterto account for the glued model. The simulations discussed subsequently in this paper are allwith the merged nodes model.
Effect of variation in impactor velocity
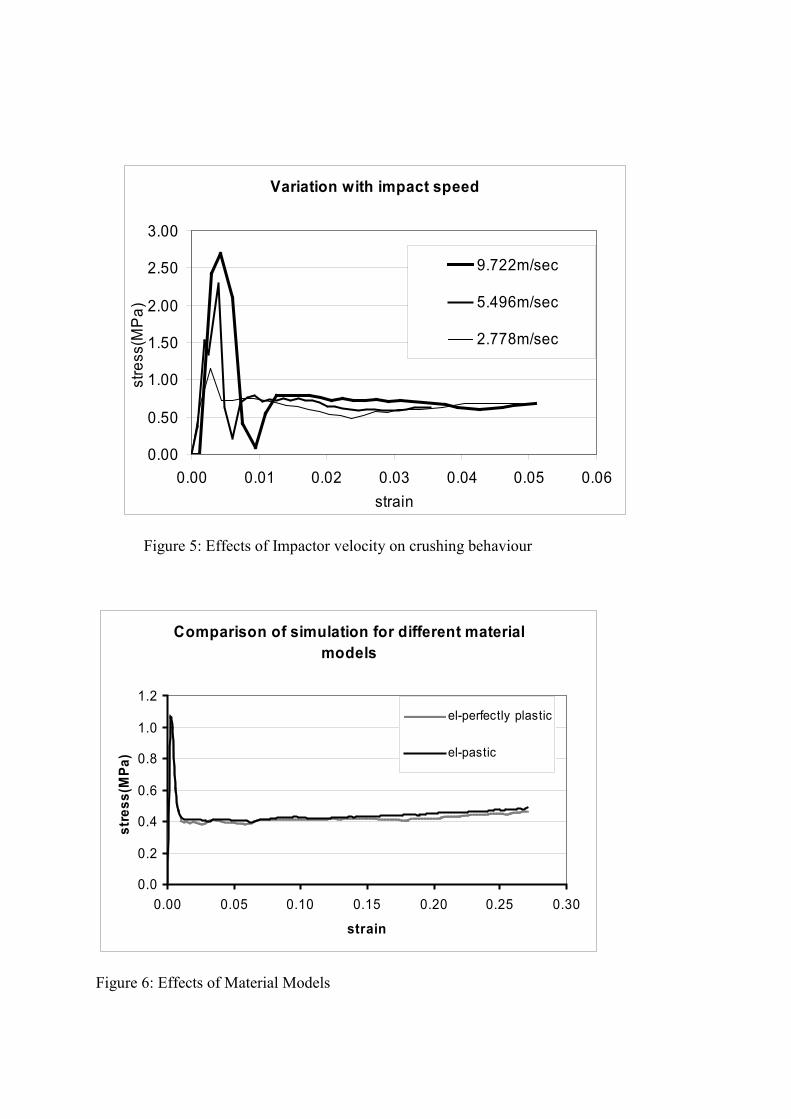
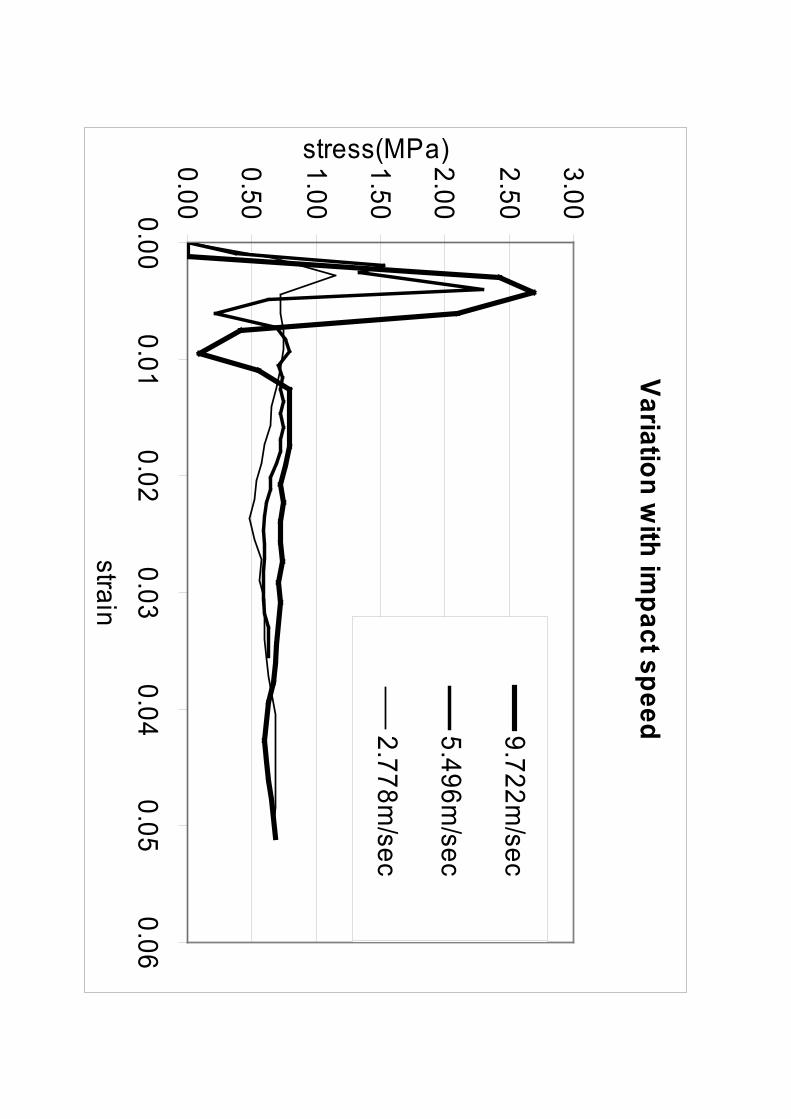
The effect of impactor velocity on the honeycomb crush behaviour was also studied insimulation. The model used was ¾-AL-5052-0.003N with 6x60 meshing. Three simulationswere carried out with initial velocities of impactor as 2.778 m/sec, 5.496 m/sec and 9.722m/sec that correspond to different drop heights. The stress-strain curves for all three cases areplotted in Figure5. We observe that the compressive strength of the honeycomb structureincreases substantially with increase in impactor velocities. The crush strength, which is thegross structural behaviour, is almost invariant in this regime of impactor velocity change.This is in consonance with the experimental observation [8] that crushing strength does notchange significantly for impact velocities of 2 to 28 m/sec.
Choice of material model
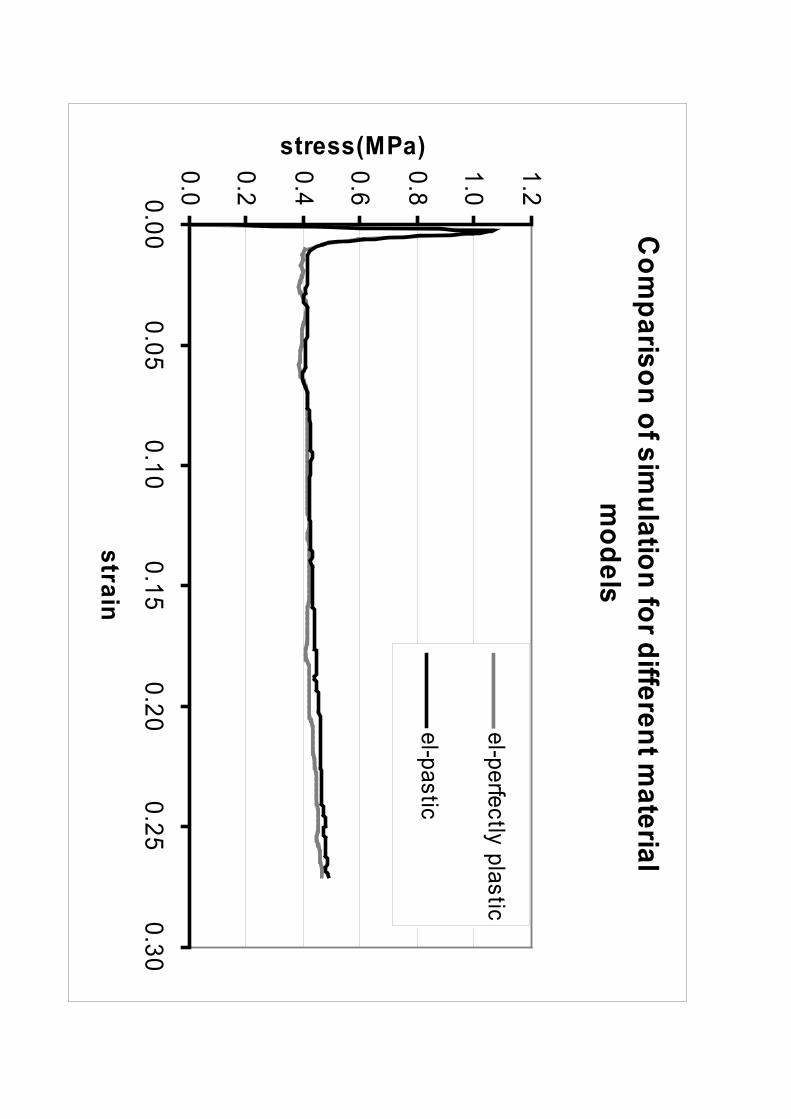
Studies on the dynamic plastic behaviour of different structures show that the energyconsumed in the plastic deformation dominates the elastic energy [9]. So rigid-plasticmaterial models that neglects the elastic effects also give reasonable result in analysis. Thisphenomenon was investigated for the crushing behaviour of aluminium honeycomb structurein simulation by using different material model. The results from use of bilinear elastic-plastic and bilinear elastic-perfectly-plastic material models are plotted in Figure6. The plotsshow that the compressive strength is nearly identical for the two cases. However the elasticperfectly plastic material model shows comparatively lower crush strength at large strains.From this result, it may be concluded that the compressive strength depends only on the yieldstrength of the basic material.
0.0
0.5
1.0
1.5
2.0
2.5
0.00 0.05 0.10 0.15 0.20strain
stre
ss(M
Pa) tied merged
Figure 4: Effects of Glued vs. Merged Nodes on Crushing Behaviour
Variation with impact speed
0.00
0.50
1.00
1.50
2.00
2.50
3.00
0.00 0.01 0.02 0.03 0.04 0.05 0.06strain
stre
ss(M
Pa)
9.722m/sec
5.496m/sec
2.778m/sec
Figure 5: Effects of Impactor velocity on crushing behaviour
Comparison of simulation for different material models
0.0
0.2
0.4
0.6
0.8
1.0
1.2
0.00 0.05 0.10 0.15 0.20 0.25 0.30
strain
stre
ss(M
Pa)
el-perfectly plastic
el-pastic
Figure 6: Effects of Material Models
EXPERIMENTAL VALIDATION
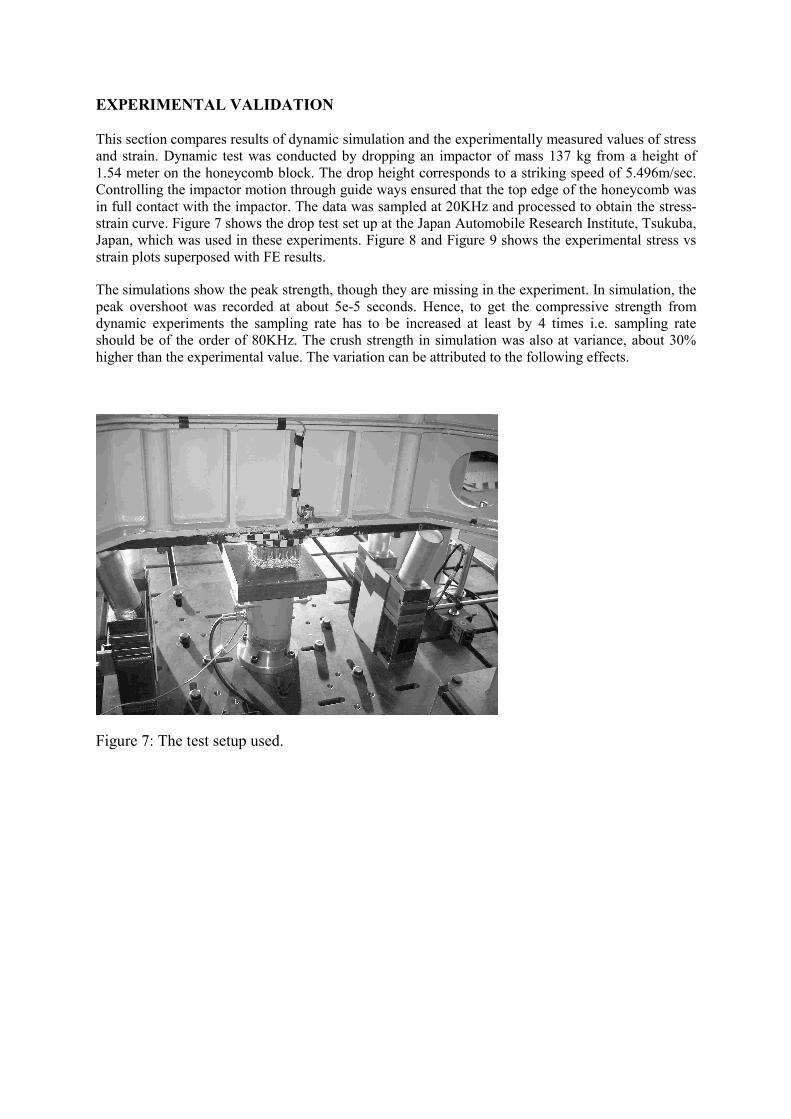
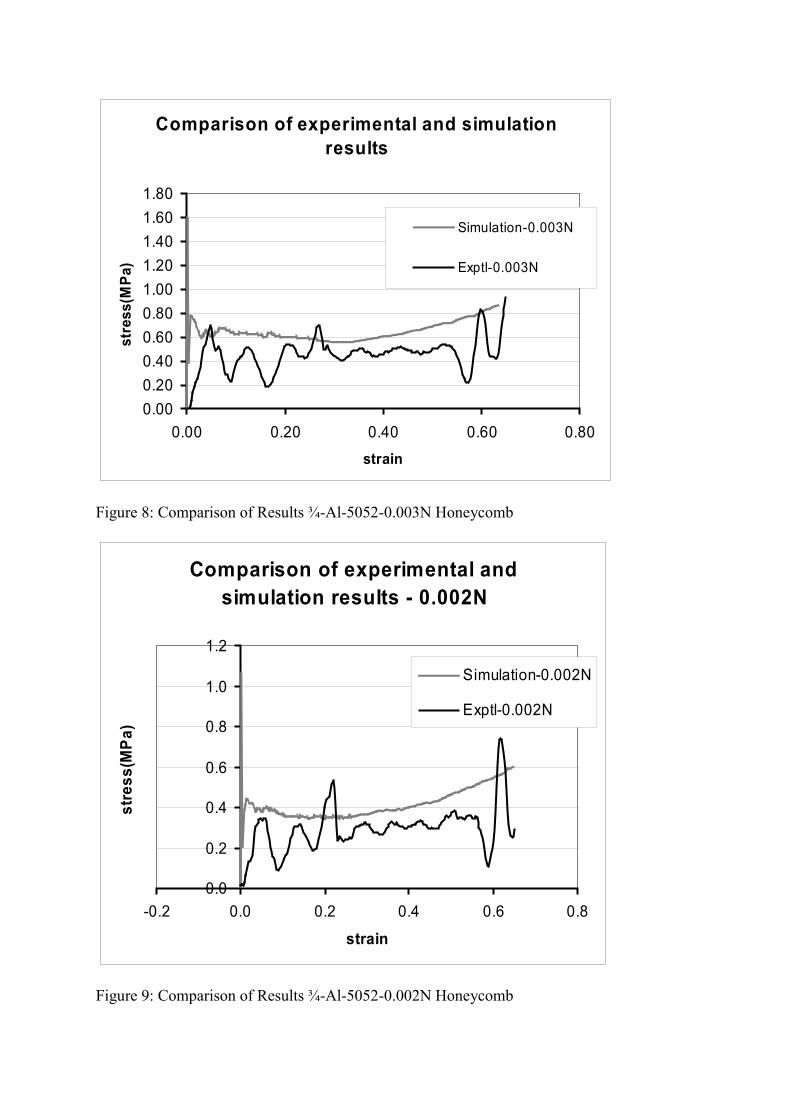
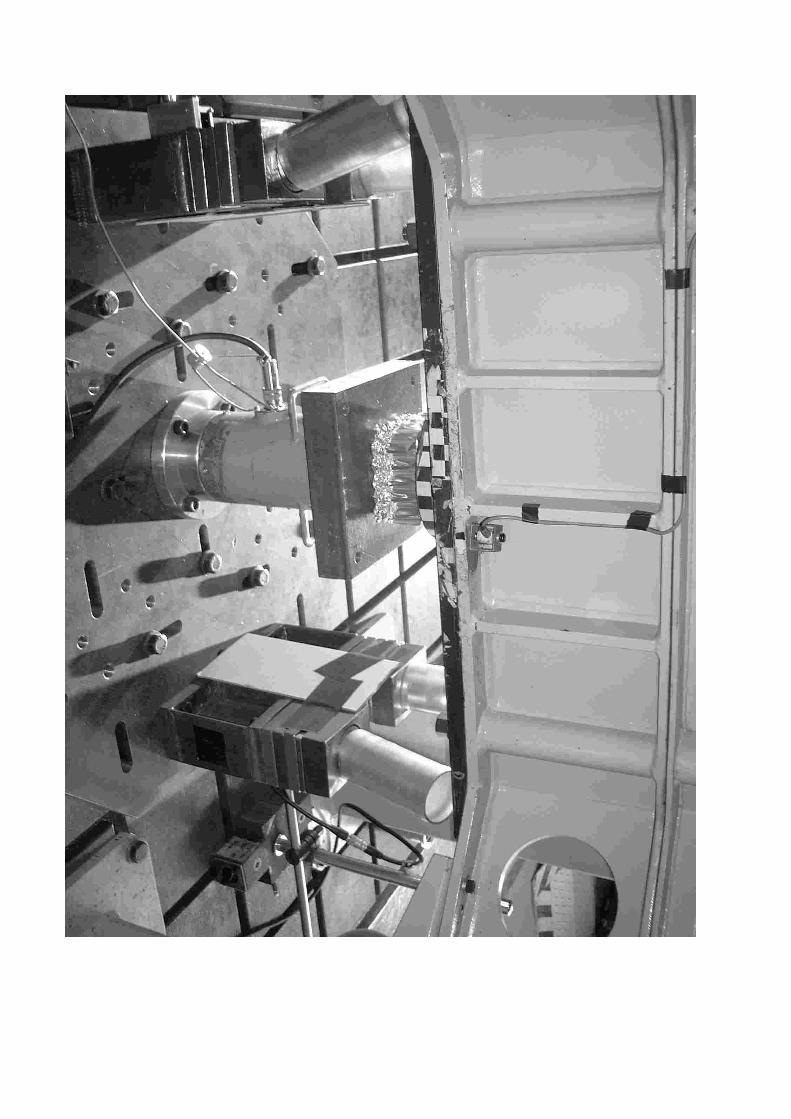
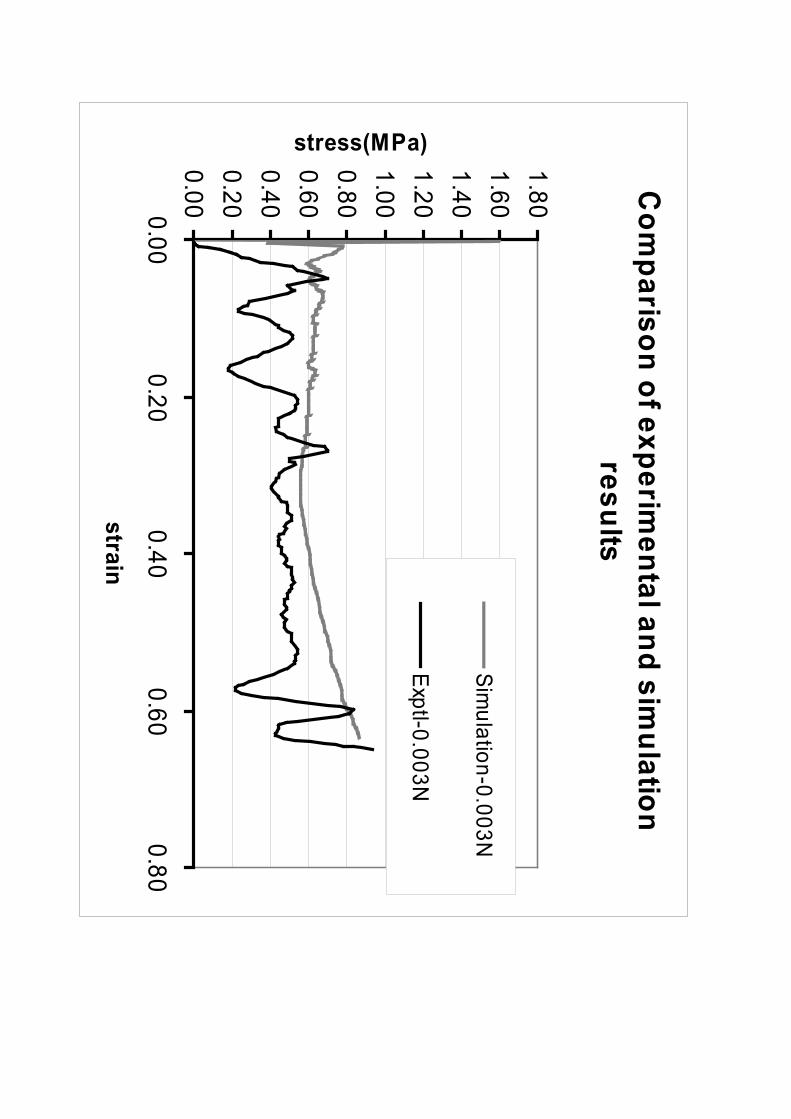
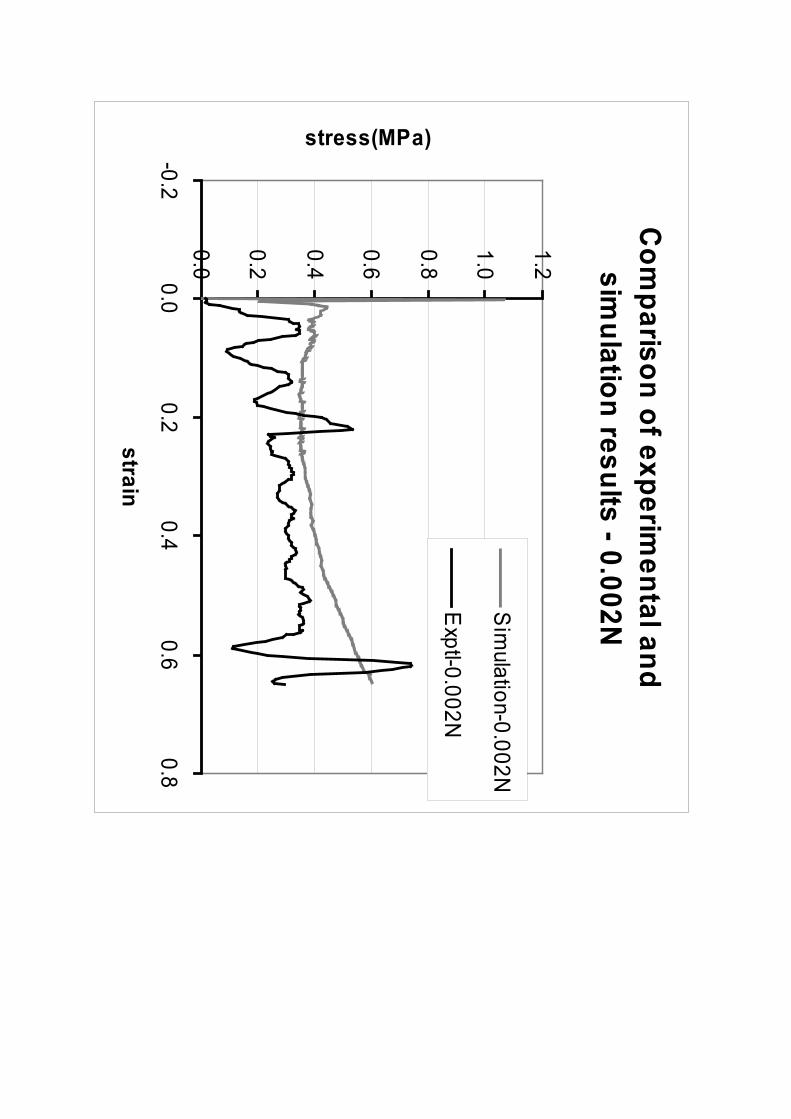
This section compares results of dynamic simulation and the experimentally measured values of stressand strain. Dynamic test was conducted by dropping an impactor of mass 137 kg from a height of1.54 meter on the honeycomb block. The drop height corresponds to a striking speed of 5.496m/sec.Controlling the impactor motion through guide ways ensured that the top edge of the honeycomb wasin full contact with the impactor. The data was sampled at 20KHz and processed to obtain the stress-strain curve. Figure 7 shows the drop test set up at the Japan Automobile Research Institute, Tsukuba,Japan, which was used in these experiments. Figure 8 and Figure 9 shows the experimental stress vsstrain plots superposed with FE results.
The simulations show the peak strength, though they are missing in the experiment. In simulation, thepeak overshoot was recorded at about 5e-5 seconds. Hence, to get the compressive strength fromdynamic experiments the sampling rate has to be increased at least by 4 times i.e. sampling rateshould be of the order of 80KHz. The crush strength in simulation was also at variance, about 30%higher than the experimental value. The variation can be attributed to the following effects.
Figure 7: The test setup used.
Comparison of experimental and simulation results
0.000.200.400.600.801.001.201.401.601.80
0.00 0.20 0.40 0.60 0.80strain
stre
ss(M
Pa)
Simulation-0.003N
Exptl-0.003N
Figure 8: Comparison of Results ¾-Al-5052-0.003N Honeycomb
Comparison of experimental and simulation results - 0.002N
0.0
0.2
0.4
0.6
0.8
1.0
1.2
-0.2 0.0 0.2 0.4 0.6 0.8
strain
stre
ss(M
Pa)
Simulation-0.002N
Exptl-0.002N
Figure 9: Comparison of Results ¾-Al-5052-0.002N Honeycomb
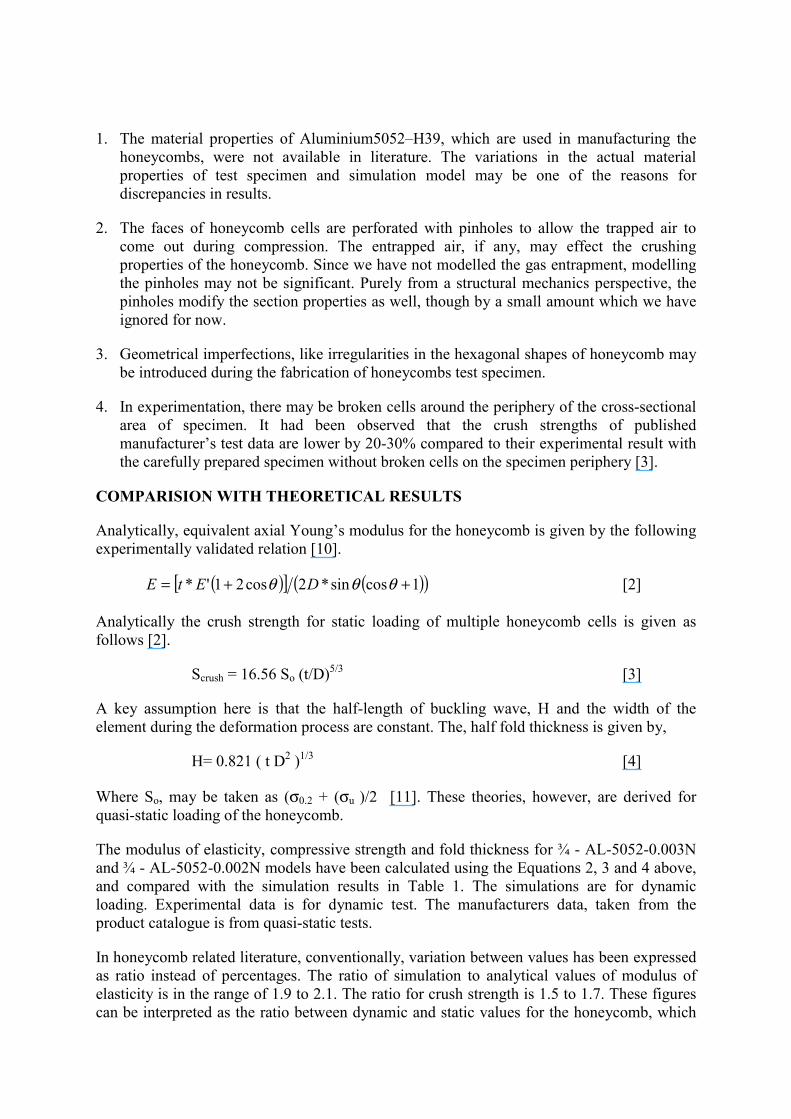
1. The material properties of Aluminium5052–H39, which are used in manufacturing thehoneycombs, were not available in literature. The variations in the actual materialproperties of test specimen and simulation model may be one of the reasons fordiscrepancies in results.
2. The faces of honeycomb cells are perforated with pinholes to allow the trapped air tocome out during compression. The entrapped air, if any, may effect the crushingproperties of the honeycomb. Since we have not modelled the gas entrapment, modellingthe pinholes may not be significant. Purely from a structural mechanics perspective, thepinholes modify the section properties as well, though by a small amount which we haveignored for now.
3. Geometrical imperfections, like irregularities in the hexagonal shapes of honeycomb maybe introduced during the fabrication of honeycombs test specimen.
4. In experimentation, there may be broken cells around the periphery of the cross-sectionalarea of specimen. It had been observed that the crush strengths of publishedmanufacturer’s test data are lower by 20-30% compared to their experimental result withthe carefully prepared specimen without broken cells on the specimen periphery [3].
COMPARISION WITH THEORETICAL RESULTS
Analytically, equivalent axial Young’s modulus for the honeycomb is given by the followingexperimentally validated relation [10].
( )[ ] ( )( )1cossin*2cos21'* ++= θθθ DEtE [2]
Analytically the crush strength for static loading of multiple honeycomb cells is given asfollows [2].
Scrush = 16.56 So (t/D)5/3 [3]
A key assumption here is that the half-length of buckling wave, H and the width of theelement during the deformation process are constant. The, half fold thickness is given by,
H= 0.821 ( t D2 )1/3 [4]
Where So, may be taken as (σ0.2 + (σu )/2 [11]. These theories, however, are derived forquasi-static loading of the honeycomb.
The modulus of elasticity, compressive strength and fold thickness for ¾ - AL-5052-0.003Nand ¾ - AL-5052-0.002N models have been calculated using the Equations 2, 3 and 4 above,and compared with the simulation results in Table 1. The simulations are for dynamicloading. Experimental data is for dynamic test. The manufacturers data, taken from theproduct catalogue is from quasi-static tests.
In honeycomb related literature, conventionally, variation between values has been expressedas ratio instead of percentages. The ratio of simulation to analytical values of modulus ofelasticity is in the range of 1.9 to 2.1. The ratio for crush strength is 1.5 to 1.7. These figurescan be interpreted as the ratio between dynamic and static values for the honeycomb, which
match with the range reported in literature [4]. The average dynamic crush strength has beenreported to be about 1.33-1.74 times that under quasi-static loading condition [3]. The FEsimulation is seen to be a better estimator of the crush strength than analytical formulationcurrently available.
The ratio of compressive strength to crush strength is found in the range of 2.5 –3.1 insimulation. This matches with the range of 2.3 to 2.8 reported in previous work [3].
In progressive plastic buckling range, the peaks in the stress-strain curve obtained insimulation, corresponding to the lobe formation, are not very prominent and are of smallersize. The quasi-static loading tests give more distinct peaks as the energy required is morecompared to dynamic tests. This is reflected in the simulation carried out by us.
TABLE 1 Comparison of Results from simulation, analysis, experiment and catalog
Model Analytical(static)
[a]
Simulation(dynamic)
[s]
ExperimentData[e]
ManufacturerData (static)
[m]
Ratio
E=0.37Gpa
Scrush= 0.47MPa
2H= 4.96mm
Es/Ea = 1.94
Scrush_s/Scrush_a = 1.29
Scrush_e/Scrush_a= 1.06
Hs/Ha=0.664
SHOWA
¾ - AL-5052-0.003N
E=0.726GPa
Scrush=0.607Mpa
Scomp=1.59 MPa
2H= 3.30mm
Scrush= 0.5 MPa Scomp= 0.69 MPa
(From Showa datasheet )
Scomp_s/Scomp_m=2.30
SHOWA
¾ - AL-5052-0.002N
E=0.25Gpa
Scrush=0.24Mpa
2H= 4.33mm
E=0.48 GPa
Scrush=0.36Mpa
Scomp= 1.06MPa
2H= 3.28mm
Scrush= 0.3 MPa Es/Ea= 1.94
Scrush_s/Scrush_a=1.5
Scrush_e/Scrush_a= 1.25
Hs/Ha = 0.756
CONCLUSIONS:
FE simulations of dynamic crushing of honeycomb structures have been presented. The crushingstrength of a honeycomb structure is known to depend on its geometry and on the material property.In FE simulations, the size of the FE mesh is also seen to affect the results substantially. The optimalFE mesh size has been established by refining the mesh till convergence is observed.
The FE models reproduce the experimentally observed effect of the foil thickness and the cell size onthe crushing strength of honeycomb structures. The adhesive bonding between cell faces weresimulated by two different approaches, using glued nodes and using merged nodes. The merged-nodesmodel gives reasonably good results with substantially lower simulation time. FE models also predictthat an increase in impactor velocity increases the compressive strength of honeycomb but does notsignificantly alter the crushing strength.
The simulation results are compared with analytical results of quasi-static loading and with data fromthe manufacturer. The ratio between simulated and analytical strength values is almost constant fordifferent honeycombs considered. This corresponds to the ratio of the strengths between dynamic andstatic loading conditions and is within the range reported earlier. The simulation results were alsocompared with experimental results. The probable causes of discrepancies have been enumerated.
The methodology demonstrated to model the honeycomb can be used to study the effect of otherparameters like overall size, cell size, foil thickness, thickness of honeycomb, number of completecells and material properties. Manufacturers can carry out such sensitivity analysis to designhoneycombs to fit specific performance corridors, reducing trials.
REFERENCES1. McFarland R. K. Jr., “Hexagonal Cell Structures Under Post-Buckling Axial Load”, AIAA Journal, 1963, 1(6),. 1380-
1385.2. Wierzbicki Tomasz, “Crushing Analysis Of Metal Honeycombs”, Int. J. Impact Engg, 1983 1(2), 155-174.3. Wu Enboa and Jiang Wu-Shung, “Axial Crush Of Metal Honeycombs”, Int. J. Impact Engng, 1997, 19(5-6), 439-456.4. Baker W. E., Togami T. C. and Weydert J. C. [1998] “ Static And Dynamic Properties Of High-Density Metal
Honeycombs”, Int. J. Impact Engg, 1998, 21(3), 149-1635. Corden John, Honeycomb Structure - Engineering Materials Handbook, ASM International, 1990 721-728.6. ESI Group, PAM-CRASH User Manual, ESI Group Software Product Co. Paris, 2000.7. Santosa S. and Wierzbicki T. “Crash Behavior Of Box Columns Filled with Aluminium Honeycomb or Foam”,
Computers And Structures, 1998, 68, 343-367.8. Zhao Han and Gary G, “Crushing Behaviour of Aluminium Honeycombs Under Impact Loading”, Int. J. Impact Engg,
21(10), 827-836.9. Jones Norman [1989] Structural Impact, Cambridge University Press, Cambridge, 1989.10. Meraghni F., Desrumaux F. and Benzeggagh M. L., “Mech Behaviour Of Cellular Core For Structural Sandwich
Panels”– Composites: Part A 30, 767-779.11. Langseth M. and Hopperstad O. S., Static and Dynamic Axial Crushing Of Square Thin-Walled Aluminum Extusions,
Int. J. Impact Engg,, 1996, 18(7-8), 949-968.
FAC
E of a cell
W
L,ribbon direction
CELL SIZE
T
Typical force - time curve
0
100
200
300
400
500
6000.005.00
10.0015.00
20.00
Time (m
secs)
stress (kN/m^2)
Com
parison for different mesh sizes
0.0
0.5
1.0
1.5
2.0
2.5
3.00.000.01
0.020.03
0.040.05
0.06strain
stress (MPa )
6x30-30N
6x60-30N
6x80-30N
6x100-30N
0.0
0.5
1.0
1.5
2.0
2.50.000.05
0.100.15
0.20strain
stress(MPa)
tiedm
erged
Variation with im
pact speed
0.00
0.50
1.00
1.50
2.00
2.50
3.000.000.01
0.020.03
0.040.05
0.06strain
stress(MPa)
9.722m/sec
5.496m/sec
2.778m/sec
Com
parison of simulation for different m
aterial m
odels
0.0
0.2
0.4
0.6
0.8
1.0
1.20.000.05
0.100.15
0.200.25
0.30
strain
stress(MPa)
el-perfectly plastic
el-pastic
Com
parison of experimental and sim
ulation results
0.000.200.400.600.801.001.201.401.601.800.00
0.200.40
0.600.80
strain
stress(MPa)
Simulation-0.003N
Exptl-0.003N
Com
parison of experimental and
simulation results - 0.002N
0.0
0.2
0.4
0.6
0.8
1.0
1.2
-0.20.0
0.20.4
0.60.8
strain
stress(MPa)
Sim
ulation-0.002N
Exptl-0.002N
Dr Clive Chirwa, December 7, 2002Editor IJ CrashAutomotive Engineering Faculty of Technology,Bolton Institute, Deanne Road,Bolton, BL3 5AB, UK.
Sub: Paper “Prediction of crushing behaviour of honeycomb structures”
Dear Dr Chirwa,
We had submitted the above paper to IJ Crash and have received reviewers comments on thesame from you. We have modified the paper accordingly and the modified version isenclosed. I am sending the following as desired by you:
1. Three copies of the modified paper.2. A copy of each figure on a separate A4 size page.3. A letter in response to the reviewers comments.4. A CD containing the paper in MSWORD format (it includes all the pictures in a jpeg
format).
There has been a short delay in responding to the paper. This is primarily because thecomments were addressed to Dr Dileep Kumar but the address on the communication wasmine. Please note that for all further correspondence I will be the communicating author.Kindly accept this revised submission.
With warm regards
Yours truly,
(A Chawla)


