Embed Size (px)
Citation preview
Prediction of CYP3A4 enzyme activity using haplotype tag SNPsin African Americans
MA Perera1,2, RK Thirumaran3, NJ Cox1,2,4, S Hanauer1,4, S Das1,2, C Brimer-Cline3, VLamba3, EG Schuetz3, MJ Ratain1,4, and A Di Rienzo1,21Committee on Clinical Pharmacology and Pharmacogenomics, Division of Biological Sciences,University of Chicago, Chicago, IL, USA2Department of Human Genetics, University of Chicago, Chicago, IL, USA3Department of Pharmaceutical Sciences, St. Jude’s Research Hospital, Memphis, TN, USA4Department of Medicine, University of Chicago, Chicago, IL, USA
AbstractThe CYP3A locus encodes hepatic enzymes that metabolize many clinically used drugs. However,there is marked interindividual variability in enzyme expression and clearance of drugs metabolizedby these enzymes. We utilized comparative genomics and computational prediction of transcriptionalfactor binding sites to evaluate regions within CYP3A that were most likely to contribute to thisvariation. We then used a haplotype tagging single-nucleotide polymorphisms (htSNPs) approach toevaluate the entire locus with the fewest number of maximally informative SNPs. We investigatedthe association between these htSNPs and in vivo CYP3A enzyme activity using a single-point IVmidazolam clearance assay. We found associations between the midazolam phenotype and age,diagnosis of hypertension and one htSNP (141689) located upstream of CYP3A4. 141689 lies nearthe xenobiotic responsive enhancer module (XREM) regulatory region of CYP3A4. Cell-basedstudies show increased transcriptional activation with the minor allele at 141689, in agreement withthe in vivo association study findings. This study marks the first systematic evaluation of coding andnoncoding variation that may contribute to CYP3A phenotypic variability.
Keywordspharmacogenetics; CYP3A; midazolam; African Americans
IntroductionThe genes encoding the CYP3A subfamily are located on chromosome 7 and span 200kilobases (kb). This gene family consists of four members, CYP3A4, CYP3A5, CYP3A7 andCYP3A43, which encode enzymes responsible for the metabolism of approximately 50% ofcurrent drugs, as well as many endogenous substances.1,2 CYP3A4 is the major isoform inadult humans, and is expressed mainly in the liver and intestinal epithelium. It can metabolizea wide range of substrates and thus variability in its expression or activity may have significantclinical consequences. CYP3A5 is expressed in the liver, intestine3 and kidney,4 and has similarsubstrate specificity to CYP3A4. CYP3A5 has large interindividual variability in expression
© 2009 Nature Publishing Group All rights reservedCorrespondence: Dr MA Perera, 5841 South Maryland Avenue, MC 6091, Chicago, IL 60637, USA. E-mail:[email protected].
NIH Public AccessAuthor ManuscriptPharmacogenomics J. Author manuscript; available in PMC 2009 September 30.
Published in final edited form as:Pharmacogenomics J. 2009 February ; 9(1): 49–60. doi:10.1038/tpj.2008.13.
NIH
-PA Author Manuscript
NIH
-PA Author Manuscript
NIH
-PA Author Manuscript
due to an intronic single-nucleotide polymorphism (SNP), which results in a truncatednonfunctional protein. This SNP has dramatic differences in allele frequency acrosspopulations,5 with the most common nonfunctional allele, CYP3A5*3, occurring at highfrequency in non-African populations. CYP3A7 is the fetal CYP3A enzyme that is rapidlydownregulated after birth. Although CYP3A43 is ubiquitously expressed at low levelsthroughout the body, its role in drug metabolism is not well understood.
These enzymes have clear interindividual differences in activity. Several studies have shownthat microsomal CYP3A4 content can vary anywhere from 10- to 100-fold,6–8 though thedistribution of this variation is unimodal.9 This unimodal distribution suggests that simplemonogenic control of CYP3A4 expression is unlikely.10,11 In a study of healthy volunteers,the heritability of the observed enzyme variability of CYP3A4 has been estimated at 90%,12
suggesting an important role of genetic variation at the CYP3A locus or in genes coding for thetranscription factors regulating CYP3A expression. Several coding SNPs have been identifiedin the CYP3A locus, but they explain only a minor portion of the variation seen in levels ofexpression or in activity as measured by probe drugs.13,14 However, these association studiesfocused on a limited number of common CYP3A SNPs, usually in the coding region oruntranslated regions, and were not based on SNPs detected through a systematic andcomprehensive survey of sequence variation at the CYP3A gene cluster.
Sequence variation at the CYP3A gene cluster was recently surveyed in ethnically diversepopulation samples. This survey aimed at uncovering sequence variation in both coding andnoncoding regions that are likely to harbor sequence elements regulating CYP3A expression.The identification of such elements was achieved by a combination of comparative genomicsand computational analysis. More specifically, the sequence of the entire CYP3A gene clusterwas compared across five mammalian species, spanning over 300 million years of evolutionarytime, which revealed many strongly conserved sequences.15 The comparative genomicsapproach was combined with computational prediction of clusters of liver-enrichedtranscription factor (LETF) binding sites within the CYP3A noncoding sequence; such clustersmay signal a true regulatory region, as opposed to computationally predicted single sites, whichoccur at high frequency throughout the genome and are likely to be false positives. Althoughnot all the sequence elements detected by these two approaches are expected to affectexpression, combining these approaches greatly increases the probability of identifyingregulatory elements; as a consequence, sequence variants within such elements may underliesome of the observed variation in CYP3A expression. By resequencing these elements insamples of African Americans, European Americans and Chinese Americans, it was shownthat there are unusually large differences in the haplotype structure and allele frequenciesbetween African-American and non-African population samples. Importantly, the amount ofvariation was much greater in the African-American sample compared to the samples of non-African ancestry.
This study aims to determine whether the variability in CYP3A expression and activity is dueto genetic variation at the CYP3A locus. Because of greater genetic variation in AfricanAmericans compared to non-Africans, we decided to focus on African Americans as our targetpopulation. In order to capture a large amount of CYP3A sequence variation, we selectedhaplotype tagging SNPs (htSNPs) among those detected in the above resequencing study.These htSNPs represent the minimal set of maximally informative SNPs required to capturethe haplotype diversity at the CYP3A locus in any given population. As a marker of CYP3Aactivity, we used a single-point plasma measurement of the ratio of the primary metabolite ofmidazolam (1′-OH midazolam) to midazolam. This phenotype has been used extensively asboth a probe for CYP3A activity as well as specifically for CYP3A4 activity.16–18 As invitro studies have shown that both CYP3A4 and CYP3A5 play a role in midazolamhydroxylation, this is the ideal probe for CYP3A activity.9 Importantly, it was shown that this
Perera et al. Page 2
Pharmacogenomics J. Author manuscript; available in PMC 2009 September 30.
NIH
-PA Author Manuscript
NIH
-PA Author Manuscript
NIH
-PA Author Manuscript
ratio is strongly correlated with CYP3A4 content (r2=0.87)19 and with midazolam clearance(r2=0.89).20 Moreover, the midazolam hydroxylation ratio has been used in several otherphenotype/genotype association studies for CYP3A4,16,21–23 the results of which can becompared to the results obtained in our study. In vitro cell-based assays and liver mRNA studieswere conducted to confirm the regulatory role of the htSNPs found to be significant in thisstudy.
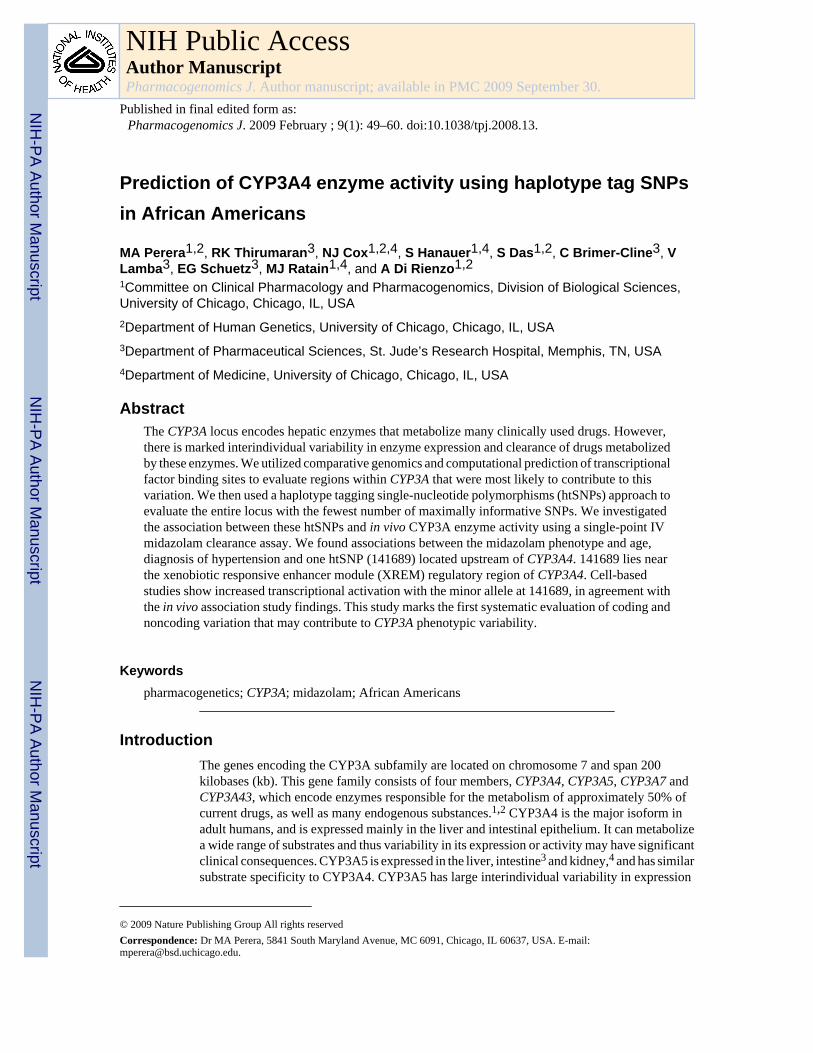
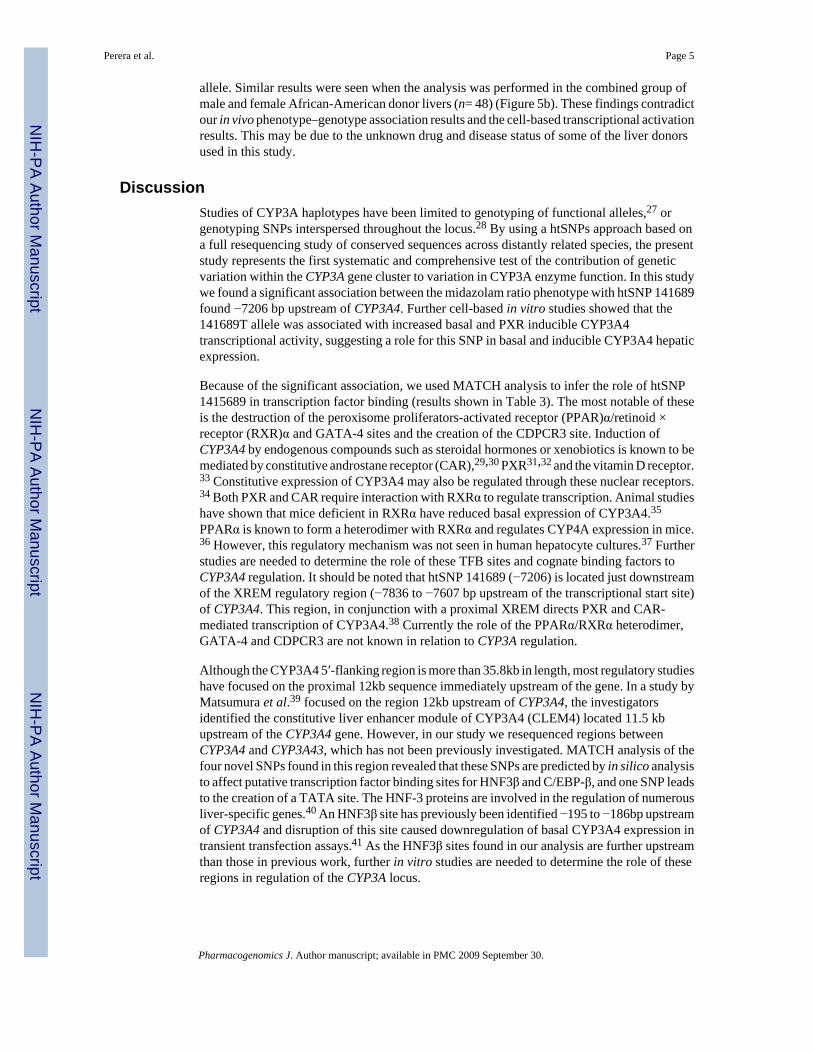
ResultsWe recruited 135 African-American outpatients to determine the effect of CYP3A variation onthe midazolam metabolite ratio using the liquid chromatography/mass spectrometry/massspectrometry (LC/MS/MS) procedure described in the Methods Section. Figure 1 shows thedistribution of this phenotype, with a mean of 0.075 and a standard deviation of 0.062. Weobserved a 20-fold range in the midazolam phenotype, which is consistent with other studieson CYP3A4 activity.24–26 Most of these studies found that variation in CYP3A activity rangedbetween 10- and 30-fold. Because of the non-normal distribution of the phenotype, the datawere transformed using a natural log in all statistical analysis.
The median age of the study population was 61 years, and ranged from 21 to 88 years of age.There were also a higher number of women in this study than men (86 vs 49, respectively).However, the midazolam phenotype showed no correlation with sex (P=0.24). A total of 60%of the study population had a diagnosis of hypertension upon entry into the study (as assessedby chart review, medication review and patient interview) which was significantly related (byanalysis of variance (ANOVA) analysis) to the midazolam phenotype (P=0.007). In additionthere was a correlation between age and midazolam phenotype (P=0.0003). Both of thesevariables were used as covariates in subsequent analyses. No other statistically significantcorrelations were found with any of the other demographic information.
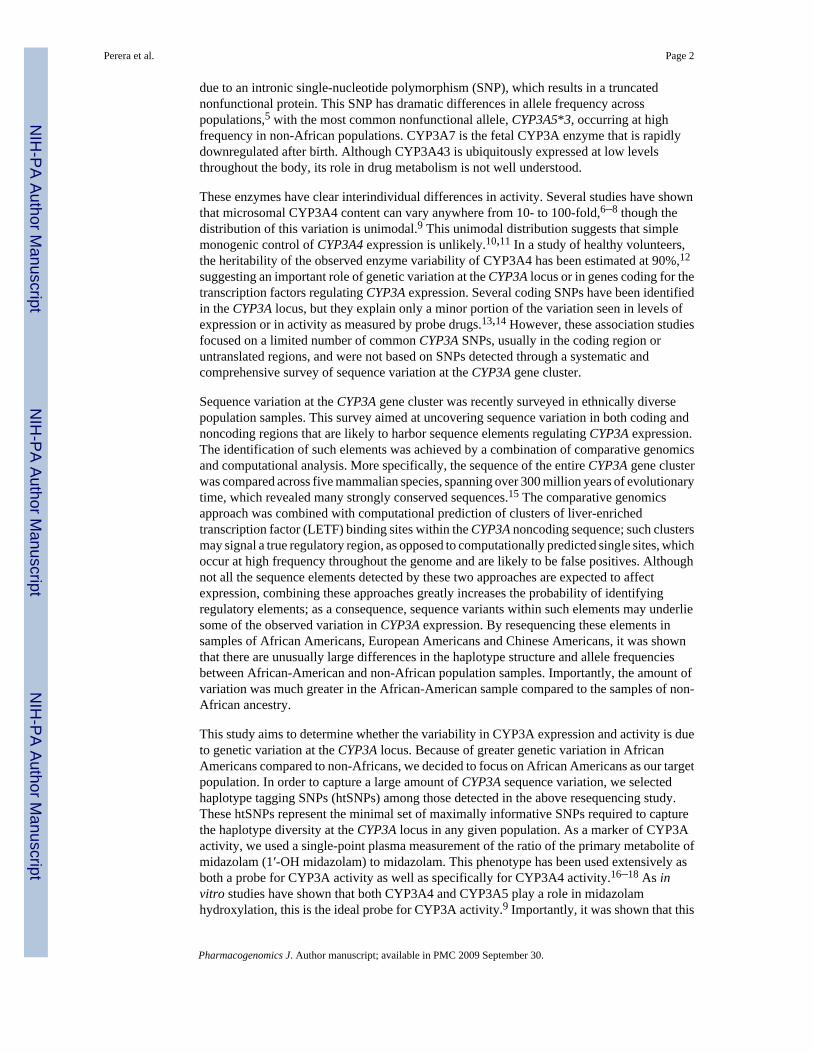
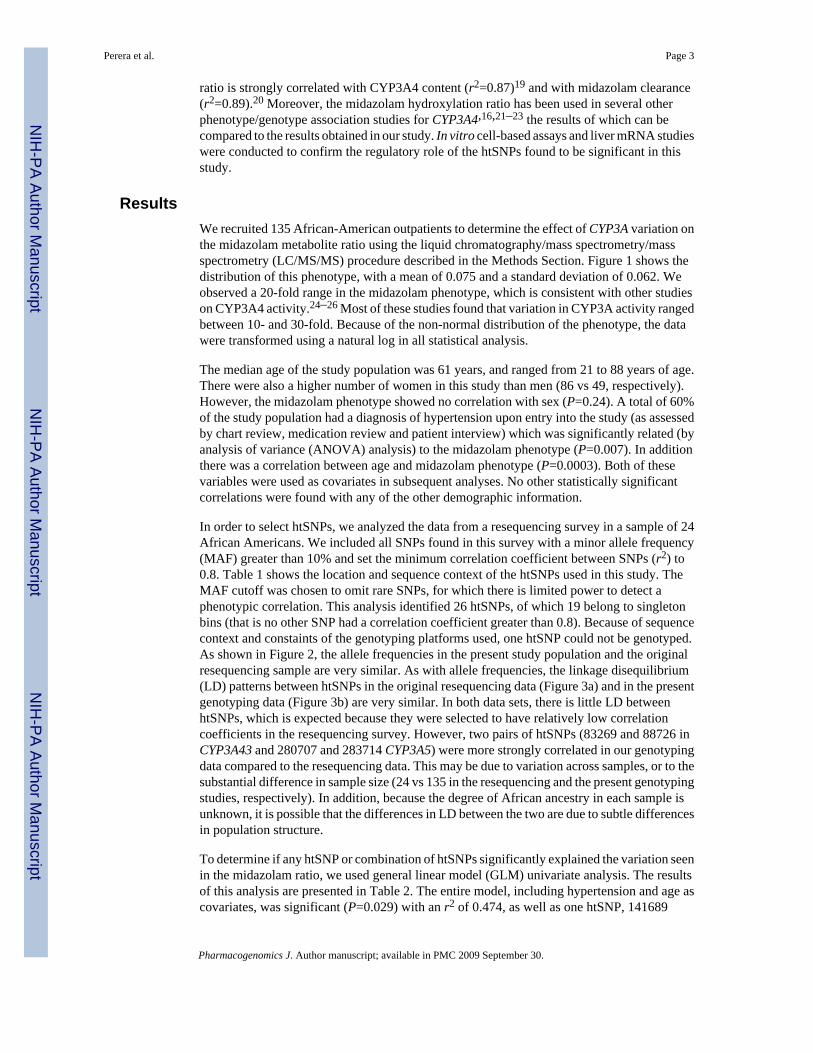
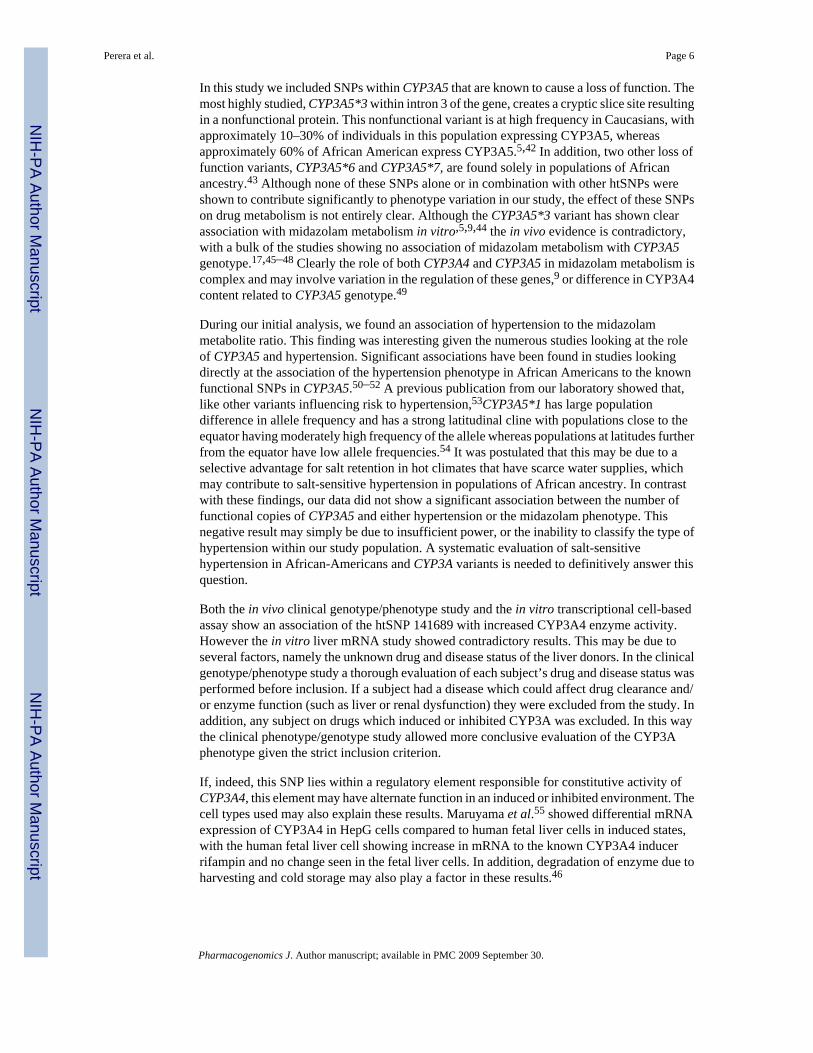
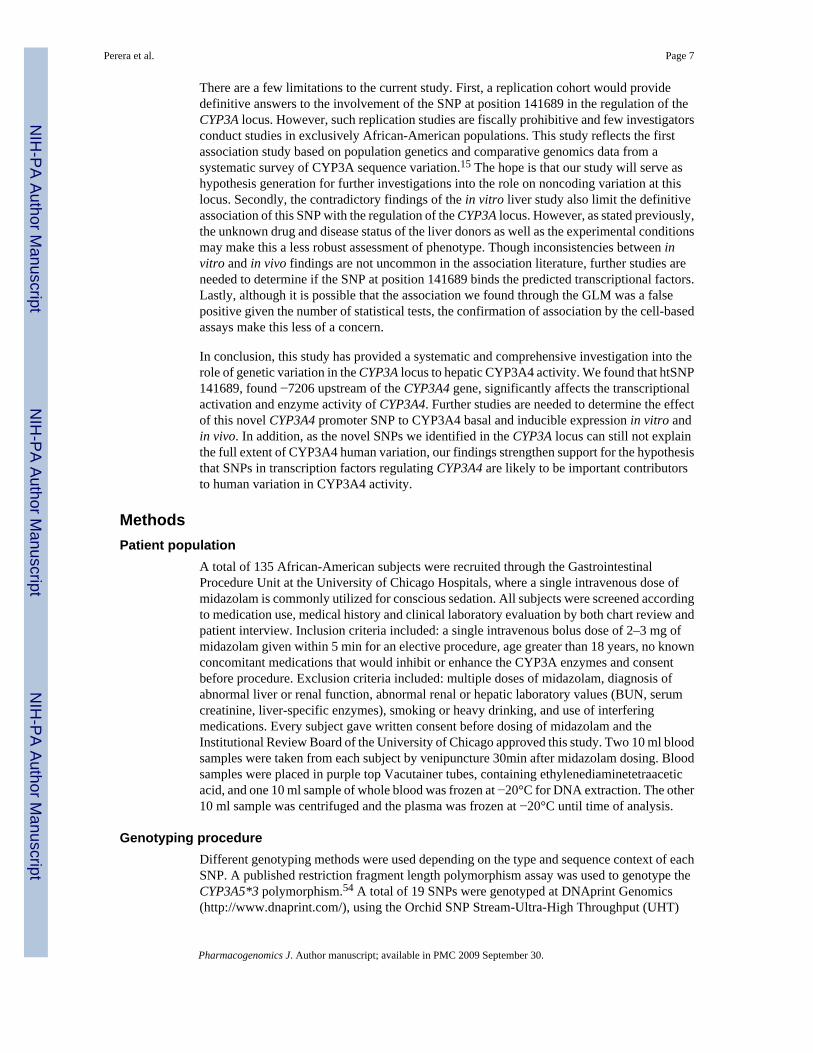
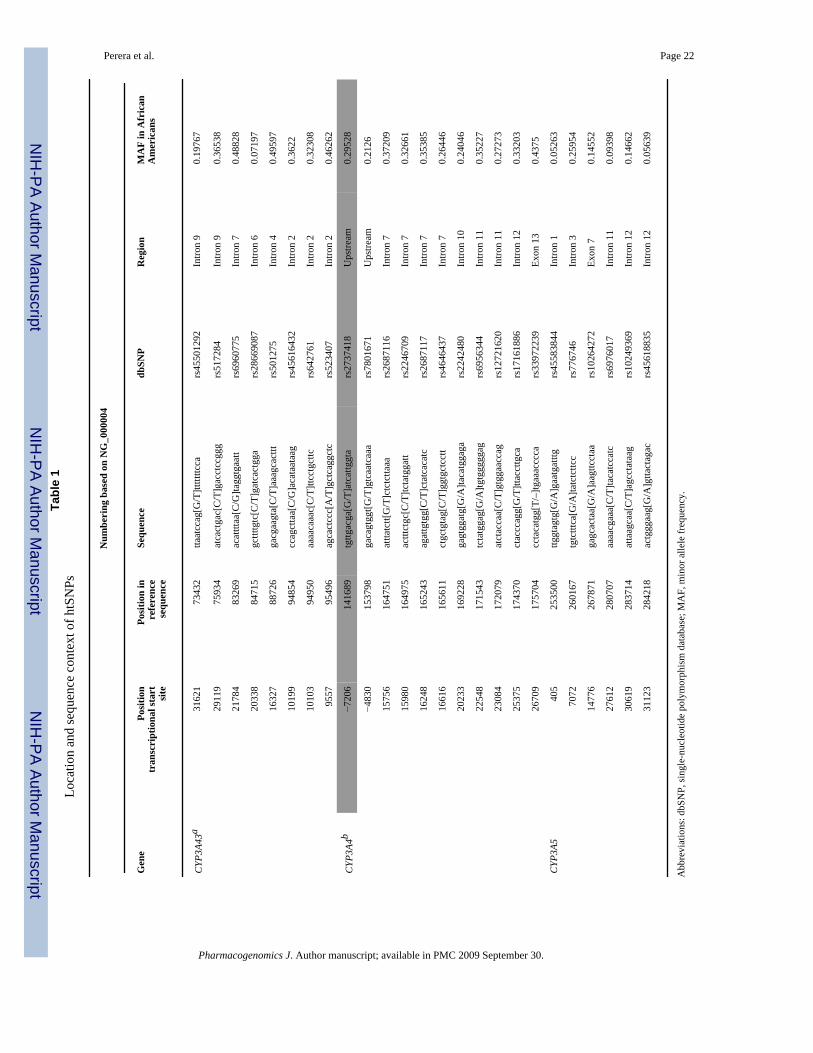
In order to select htSNPs, we analyzed the data from a resequencing survey in a sample of 24African Americans. We included all SNPs found in this survey with a minor allele frequency(MAF) greater than 10% and set the minimum correlation coefficient between SNPs (r2) to0.8. Table 1 shows the location and sequence context of the htSNPs used in this study. TheMAF cutoff was chosen to omit rare SNPs, for which there is limited power to detect aphenotypic correlation. This analysis identified 26 htSNPs, of which 19 belong to singletonbins (that is no other SNP had a correlation coefficient greater than 0.8). Because of sequencecontext and constaints of the genotyping platforms used, one htSNP could not be genotyped.As shown in Figure 2, the allele frequencies in the present study population and the originalresequencing sample are very similar. As with allele frequencies, the linkage disequilibrium(LD) patterns between htSNPs in the original resequencing data (Figure 3a) and in the presentgenotyping data (Figure 3b) are very similar. In both data sets, there is little LD betweenhtSNPs, which is expected because they were selected to have relatively low correlationcoefficients in the resequencing survey. However, two pairs of htSNPs (83269 and 88726 inCYP3A43 and 280707 and 283714 CYP3A5) were more strongly correlated in our genotypingdata compared to the resequencing data. This may be due to variation across samples, or to thesubstantial difference in sample size (24 vs 135 in the resequencing and the present genotypingstudies, respectively). In addition, because the degree of African ancestry in each sample isunknown, it is possible that the differences in LD between the two are due to subtle differencesin population structure.
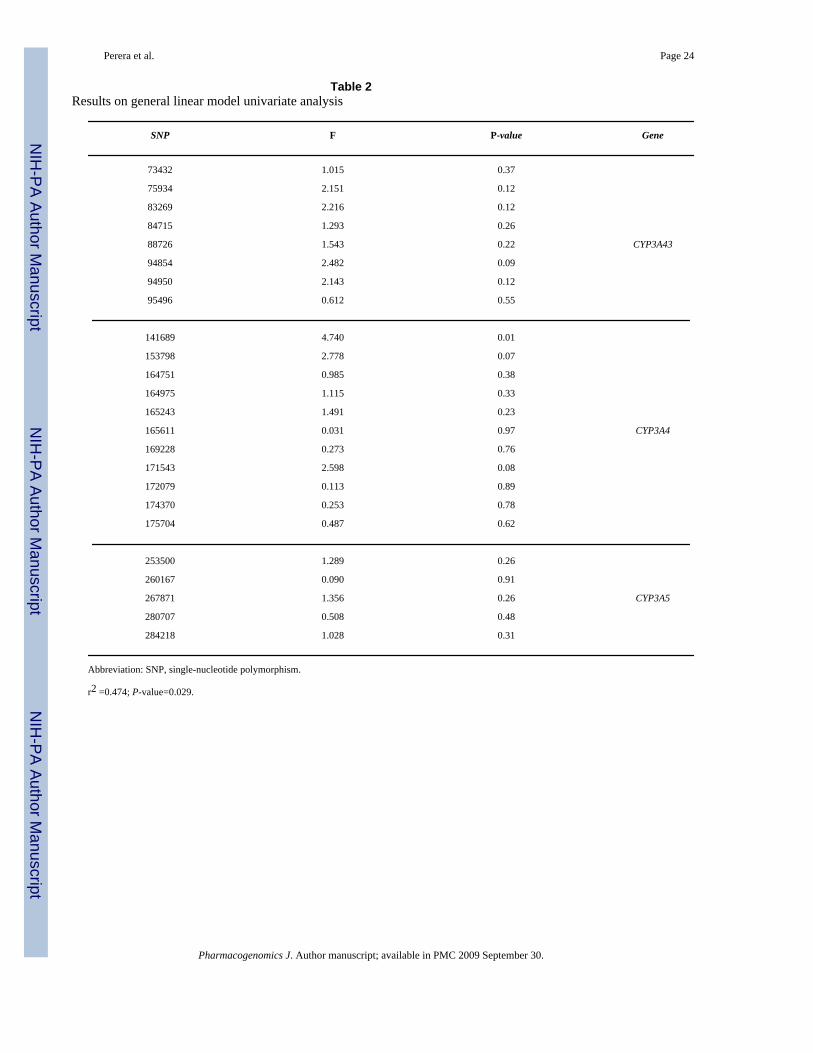
To determine if any htSNP or combination of htSNPs significantly explained the variation seenin the midazolam ratio, we used general linear model (GLM) univariate analysis. The resultsof this analysis are presented in Table 2. The entire model, including hypertension and age ascovariates, was significant (P=0.029) with an r2 of 0.474, as well as one htSNP, 141689
Perera et al. Page 3
Pharmacogenomics J. Author manuscript; available in PMC 2009 September 30.
NIH
-PA Author Manuscript
NIH
-PA Author Manuscript
NIH
-PA Author Manuscript
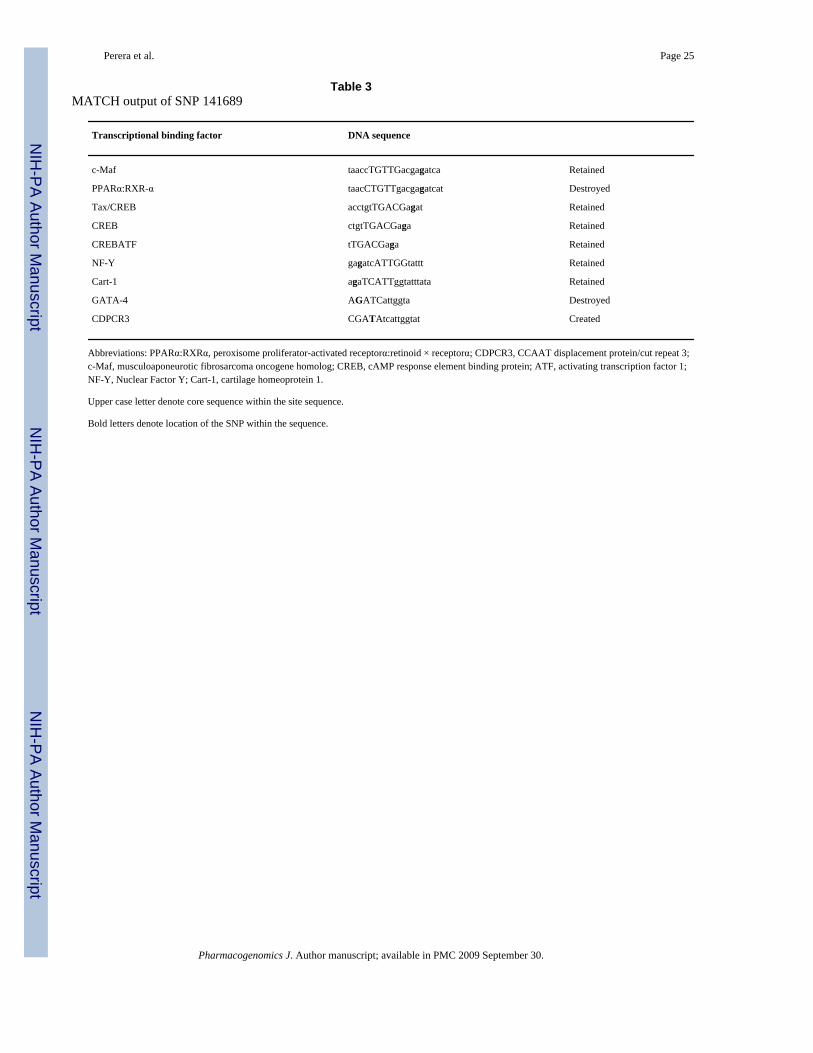
(P=0.011). Interestingly, when hypertension and age are removed from the analysis the modelis no longer significant; however the htSNP 141689 is still significant. This SNP is located 7kbupstream of the CYP3A4 transcription start site, therefore, it stands as a plausible candidate forvariation in CYP3A4 expression levels. ANOVA analysis of this SNP shows that the minor Tallele is associated with a higher midazolam ratio (that is high CYP3A activity). MATCHanalysis at this SNP was conducted and the results are presented in Table 3, along with theeffect of the derived allele to the retention destruction and/or creation at each site. From thisanalysis we see that the derived allele (T allele) results in the destruction of two of the eightputative transcriptional binding sites as well as the creation of a new CCAAT displacementprotein/cut repeat 3 (CDPCR3) site.
We also tested whether variants known to affect CYP3A5 expression (CYP3A5*3, *6 and*7) as a group are correlated with hypertension or midazolam ratio. The ANOVA analysislooking at the association between hypertension and the number of functional copies ofCYP3A5 was not significant.
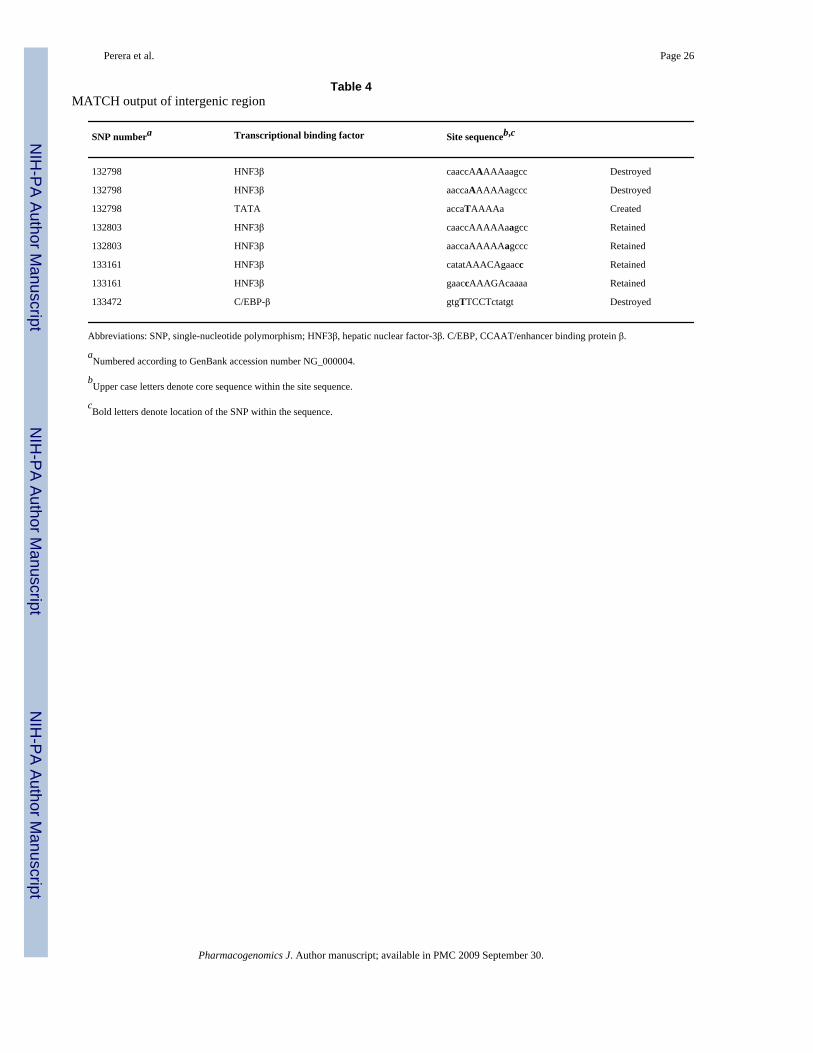
We analyzed the intergenic sequence between CYP3A4 and CYP3A43 genes. The sequence forthis genomic region was not included in the original resequencing, hence, we had noinformation about whether the variation in this region was tagged by htSNPs we genotyped inthis study. In this region, we identified two high-probability clusters of predicted binding sitesfor LETFs. These two peaks were located at nucleotide positions 132736–133806 and 136085–136601 respectively (that is approximately 13 and 16 kb upstream of the CYP3A4transcriptional start site). These clusters may reflect the presence of a sequence elementregulating CYP3A expression, but they have not been surveyed for sequence variation.Therefore, we selected 16 individuals with the lowest midazolam ratio and 16 individuals withthe highest midazolam ratio; these samples identify the top and bottom 12% of the phenotypicdistribution. The two segments containing the clusters of predicted TF binding sites wereresequenced in each of the 32 individuals to assess differences in allele frequency andhaplotypes between the extremes of the phenotypic distribution. We compared the allelefrequency distributions of these novel SNPs between the upper and lower tails of the phenotypedistribution. No significant allele frequency differences were found. We also used PHASE(version 2.0) to infer haplotypes and determine haplotype association with phenotype for theseSNPs using the case–control test to assess association. The test compares haplotypedistributions between two groups to determine if any difference in distribution exists. Nosignificant association was detected. In addition, we used MATCH to determine the locationand core sequence of putative transcriptional binding sites and identified four novel SNPs inthis region. Table 4 shows the position of each of these SNPs and the predicted effect ontranscriptional binding sites. From this analysis we found that three sites were destroyed (twohepatic nuclear factor-3β (HNF3β) sites and one C/EBP-β site) and one site created (TATAsite) by the minor alleles at these locations.
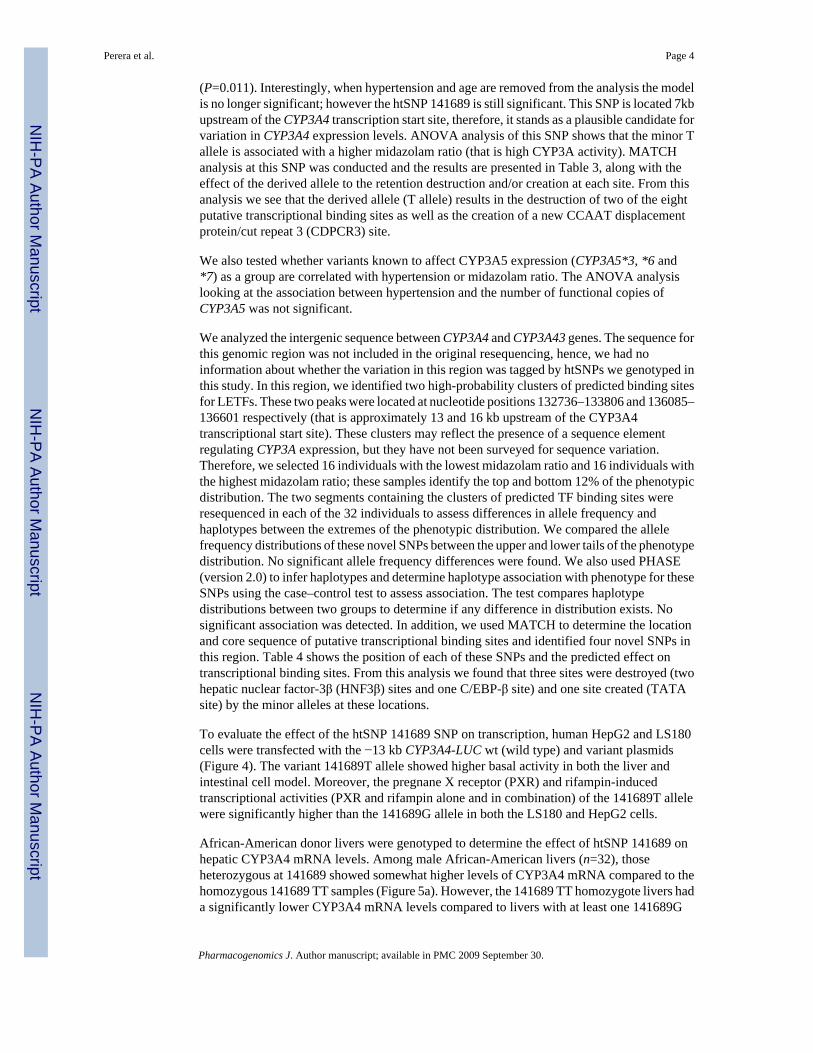
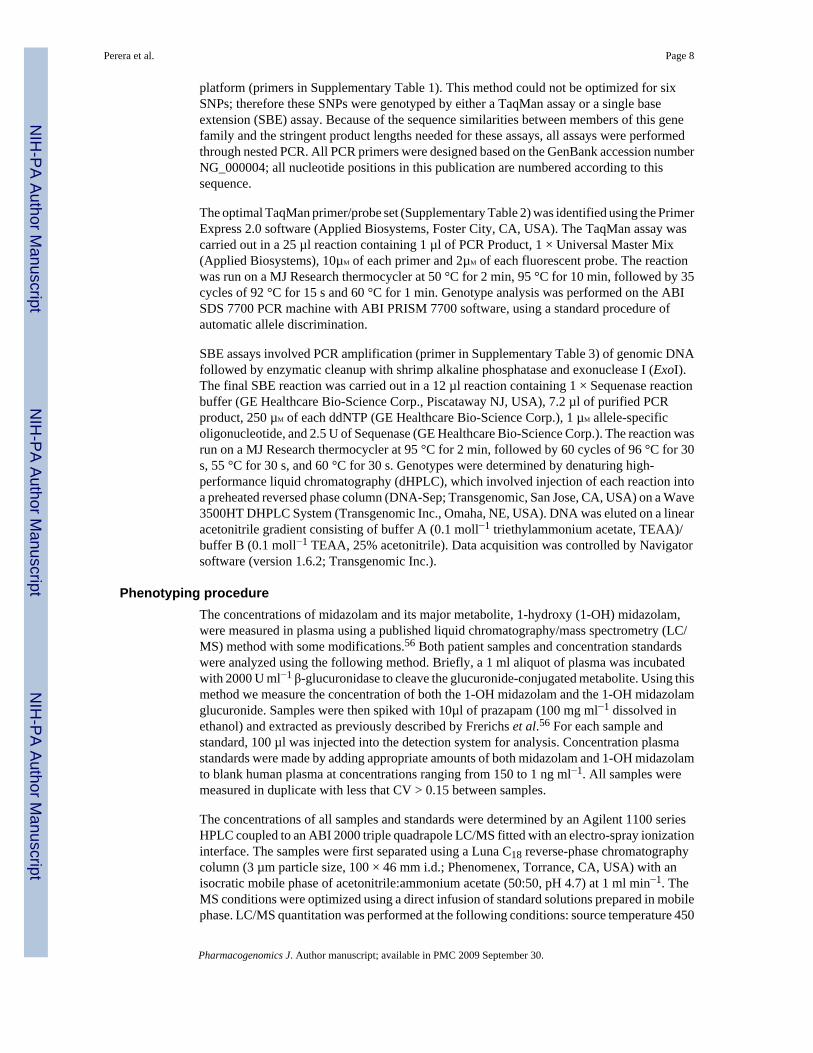
To evaluate the effect of the htSNP 141689 SNP on transcription, human HepG2 and LS180cells were transfected with the −13 kb CYP3A4-LUC wt (wild type) and variant plasmids(Figure 4). The variant 141689T allele showed higher basal activity in both the liver andintestinal cell model. Moreover, the pregnane X receptor (PXR) and rifampin-inducedtranscriptional activities (PXR and rifampin alone and in combination) of the 141689T allelewere significantly higher than the 141689G allele in both the LS180 and HepG2 cells.
African-American donor livers were genotyped to determine the effect of htSNP 141689 onhepatic CYP3A4 mRNA levels. Among male African-American livers (n=32), thoseheterozygous at 141689 showed somewhat higher levels of CYP3A4 mRNA compared to thehomozygous 141689 TT samples (Figure 5a). However, the 141689 TT homozygote livers hada significantly lower CYP3A4 mRNA levels compared to livers with at least one 141689G
Perera et al. Page 4
Pharmacogenomics J. Author manuscript; available in PMC 2009 September 30.
NIH
-PA Author Manuscript
NIH
-PA Author Manuscript
NIH
-PA Author Manuscript
allele. Similar results were seen when the analysis was performed in the combined group ofmale and female African-American donor livers (n= 48) (Figure 5b). These findings contradictour in vivo phenotype–genotype association results and the cell-based transcriptional activationresults. This may be due to the unknown drug and disease status of some of the liver donorsused in this study.
DiscussionStudies of CYP3A haplotypes have been limited to genotyping of functional alleles,27 orgenotyping SNPs interspersed throughout the locus.28 By using a htSNPs approach based ona full resequencing study of conserved sequences across distantly related species, the presentstudy represents the first systematic and comprehensive test of the contribution of geneticvariation within the CYP3A gene cluster to variation in CYP3A enzyme function. In this studywe found a significant association between the midazolam ratio phenotype with htSNP 141689found −7206 bp upstream of CYP3A4. Further cell-based in vitro studies showed that the141689T allele was associated with increased basal and PXR inducible CYP3A4transcriptional activity, suggesting a role for this SNP in basal and inducible CYP3A4 hepaticexpression.
Because of the significant association, we used MATCH analysis to infer the role of htSNP1415689 in transcription factor binding (results shown in Table 3). The most notable of theseis the destruction of the peroxisome proliferators-activated receptor (PPAR)α/retinoid ×receptor (RXR)α and GATA-4 sites and the creation of the CDPCR3 site. Induction ofCYP3A4 by endogenous compounds such as steroidal hormones or xenobiotics is known to bemediated by constitutive androstane receptor (CAR),29,30 PXR31,32 and the vitamin D receptor.33 Constitutive expression of CYP3A4 may also be regulated through these nuclear receptors.34 Both PXR and CAR require interaction with RXRα to regulate transcription. Animal studieshave shown that mice deficient in RXRα have reduced basal expression of CYP3A4.35
PPARα is known to form a heterodimer with RXRα and regulates CYP4A expression in mice.36 However, this regulatory mechanism was not seen in human hepatocyte cultures.37 Furtherstudies are needed to determine the role of these TFB sites and cognate binding factors toCYP3A4 regulation. It should be noted that htSNP 141689 (−7206) is located just downstreamof the XREM regulatory region (−7836 to −7607 bp upstream of the transcriptional start site)of CYP3A4. This region, in conjunction with a proximal XREM directs PXR and CAR-mediated transcription of CYP3A4.38 Currently the role of the PPARα/RXRα heterodimer,GATA-4 and CDPCR3 are not known in relation to CYP3A regulation.
Although the CYP3A4 5′-flanking region is more than 35.8kb in length, most regulatory studieshave focused on the proximal 12kb sequence immediately upstream of the gene. In a study byMatsumura et al.39 focused on the region 12kb upstream of CYP3A4, the investigatorsidentified the constitutive liver enhancer module of CYP3A4 (CLEM4) located 11.5 kbupstream of the CYP3A4 gene. However, in our study we resequenced regions betweenCYP3A4 and CYP3A43, which has not been previously investigated. MATCH analysis of thefour novel SNPs found in this region revealed that these SNPs are predicted by in silico analysisto affect putative transcription factor binding sites for HNF3β and C/EBP-β, and one SNP leadsto the creation of a TATA site. The HNF-3 proteins are involved in the regulation of numerousliver-specific genes.40 An HNF3β site has previously been identified −195 to −186bp upstreamof CYP3A4 and disruption of this site caused downregulation of basal CYP3A4 expression intransient transfection assays.41 As the HNF3β sites found in our analysis are further upstreamthan those in previous work, further in vitro studies are needed to determine the role of theseregions in regulation of the CYP3A locus.
Perera et al. Page 5
Pharmacogenomics J. Author manuscript; available in PMC 2009 September 30.
NIH
-PA Author Manuscript
NIH
-PA Author Manuscript
NIH
-PA Author Manuscript
In this study we included SNPs within CYP3A5 that are known to cause a loss of function. Themost highly studied, CYP3A5*3 within intron 3 of the gene, creates a cryptic slice site resultingin a nonfunctional protein. This nonfunctional variant is at high frequency in Caucasians, withapproximately 10–30% of individuals in this population expressing CYP3A5, whereasapproximately 60% of African American express CYP3A5.5,42 In addition, two other loss offunction variants, CYP3A5*6 and CYP3A5*7, are found solely in populations of Africanancestry.43 Although none of these SNPs alone or in combination with other htSNPs wereshown to contribute significantly to phenotype variation in our study, the effect of these SNPson drug metabolism is not entirely clear. Although the CYP3A5*3 variant has shown clearassociation with midazolam metabolism in vitro,5,9,44 the in vivo evidence is contradictory,with a bulk of the studies showing no association of midazolam metabolism with CYP3A5genotype.17,45–48 Clearly the role of both CYP3A4 and CYP3A5 in midazolam metabolism iscomplex and may involve variation in the regulation of these genes,9 or difference in CYP3A4content related to CYP3A5 genotype.49
During our initial analysis, we found an association of hypertension to the midazolammetabolite ratio. This finding was interesting given the numerous studies looking at the roleof CYP3A5 and hypertension. Significant associations have been found in studies lookingdirectly at the association of the hypertension phenotype in African Americans to the knownfunctional SNPs in CYP3A5.50–52 A previous publication from our laboratory showed that,like other variants influencing risk to hypertension,53CYP3A5*1 has large populationdifference in allele frequency and has a strong latitudinal cline with populations close to theequator having moderately high frequency of the allele whereas populations at latitudes furtherfrom the equator have low allele frequencies.54 It was postulated that this may be due to aselective advantage for salt retention in hot climates that have scarce water supplies, whichmay contribute to salt-sensitive hypertension in populations of African ancestry. In contrastwith these findings, our data did not show a significant association between the number offunctional copies of CYP3A5 and either hypertension or the midazolam phenotype. Thisnegative result may simply be due to insufficient power, or the inability to classify the type ofhypertension within our study population. A systematic evaluation of salt-sensitivehypertension in African-Americans and CYP3A variants is needed to definitively answer thisquestion.
Both the in vivo clinical genotype/phenotype study and the in vitro transcriptional cell-basedassay show an association of the htSNP 141689 with increased CYP3A4 enzyme activity.However the in vitro liver mRNA study showed contradictory results. This may be due toseveral factors, namely the unknown drug and disease status of the liver donors. In the clinicalgenotype/phenotype study a thorough evaluation of each subject’s drug and disease status wasperformed before inclusion. If a subject had a disease which could affect drug clearance and/or enzyme function (such as liver or renal dysfunction) they were excluded from the study. Inaddition, any subject on drugs which induced or inhibited CYP3A was excluded. In this waythe clinical phenotype/genotype study allowed more conclusive evaluation of the CYP3Aphenotype given the strict inclusion criterion.
If, indeed, this SNP lies within a regulatory element responsible for constitutive activity ofCYP3A4, this element may have alternate function in an induced or inhibited environment. Thecell types used may also explain these results. Maruyama et al.55 showed differential mRNAexpression of CYP3A4 in HepG cells compared to human fetal liver cells in induced states,with the human fetal liver cell showing increase in mRNA to the known CYP3A4 inducerrifampin and no change seen in the fetal liver cells. In addition, degradation of enzyme due toharvesting and cold storage may also play a factor in these results.46
Perera et al. Page 6
Pharmacogenomics J. Author manuscript; available in PMC 2009 September 30.
NIH
-PA Author Manuscript
NIH
-PA Author Manuscript
NIH
-PA Author Manuscript
There are a few limitations to the current study. First, a replication cohort would providedefinitive answers to the involvement of the SNP at position 141689 in the regulation of theCYP3A locus. However, such replication studies are fiscally prohibitive and few investigatorsconduct studies in exclusively African-American populations. This study reflects the firstassociation study based on population genetics and comparative genomics data from asystematic survey of CYP3A sequence variation.15 The hope is that our study will serve ashypothesis generation for further investigations into the role on noncoding variation at thislocus. Secondly, the contradictory findings of the in vitro liver study also limit the definitiveassociation of this SNP with the regulation of the CYP3A locus. However, as stated previously,the unknown drug and disease status of the liver donors as well as the experimental conditionsmay make this a less robust assessment of phenotype. Though inconsistencies between invitro and in vivo findings are not uncommon in the association literature, further studies areneeded to determine if the SNP at position 141689 binds the predicted transcriptional factors.Lastly, although it is possible that the association we found through the GLM was a falsepositive given the number of statistical tests, the confirmation of association by the cell-basedassays make this less of a concern.
In conclusion, this study has provided a systematic and comprehensive investigation into therole of genetic variation in the CYP3A locus to hepatic CYP3A4 activity. We found that htSNP141689, found −7206 upstream of the CYP3A4 gene, significantly affects the transcriptionalactivation and enzyme activity of CYP3A4. Further studies are needed to determine the effectof this novel CYP3A4 promoter SNP to CYP3A4 basal and inducible expression in vitro andin vivo. In addition, as the novel SNPs we identified in the CYP3A locus can still not explainthe full extent of CYP3A4 human variation, our findings strengthen support for the hypothesisthat SNPs in transcription factors regulating CYP3A4 are likely to be important contributorsto human variation in CYP3A4 activity.
MethodsPatient population
A total of 135 African-American subjects were recruited through the GastrointestinalProcedure Unit at the University of Chicago Hospitals, where a single intravenous dose ofmidazolam is commonly utilized for conscious sedation. All subjects were screened accordingto medication use, medical history and clinical laboratory evaluation by both chart review andpatient interview. Inclusion criteria included: a single intravenous bolus dose of 2–3 mg ofmidazolam given within 5 min for an elective procedure, age greater than 18 years, no knownconcomitant medications that would inhibit or enhance the CYP3A enzymes and consentbefore procedure. Exclusion criteria included: multiple doses of midazolam, diagnosis ofabnormal liver or renal function, abnormal renal or hepatic laboratory values (BUN, serumcreatinine, liver-specific enzymes), smoking or heavy drinking, and use of interferingmedications. Every subject gave written consent before dosing of midazolam and theInstitutional Review Board of the University of Chicago approved this study. Two 10 ml bloodsamples were taken from each subject by venipuncture 30min after midazolam dosing. Bloodsamples were placed in purple top Vacutainer tubes, containing ethylenediaminetetraaceticacid, and one 10 ml sample of whole blood was frozen at −20°C for DNA extraction. The other10 ml sample was centrifuged and the plasma was frozen at −20°C until time of analysis.
Genotyping procedureDifferent genotyping methods were used depending on the type and sequence context of eachSNP. A published restriction fragment length polymorphism assay was used to genotype theCYP3A5*3 polymorphism.54 A total of 19 SNPs were genotyped at DNAprint Genomics(http://www.dnaprint.com/), using the Orchid SNP Stream-Ultra-High Throughput (UHT)
Perera et al. Page 7
Pharmacogenomics J. Author manuscript; available in PMC 2009 September 30.
NIH
-PA Author Manuscript
NIH
-PA Author Manuscript
NIH
-PA Author Manuscript
platform (primers in Supplementary Table 1). This method could not be optimized for sixSNPs; therefore these SNPs were genotyped by either a TaqMan assay or a single baseextension (SBE) assay. Because of the sequence similarities between members of this genefamily and the stringent product lengths needed for these assays, all assays were performedthrough nested PCR. All PCR primers were designed based on the GenBank accession numberNG_000004; all nucleotide positions in this publication are numbered according to thissequence.
The optimal TaqMan primer/probe set (Supplementary Table 2) was identified using the PrimerExpress 2.0 software (Applied Biosystems, Foster City, CA, USA). The TaqMan assay wascarried out in a 25 µl reaction containing 1 µl of PCR Product, 1 × Universal Master Mix(Applied Biosystems), 10µM of each primer and 2µM of each fluorescent probe. The reactionwas run on a MJ Research thermocycler at 50 °C for 2 min, 95 °C for 10 min, followed by 35cycles of 92 °C for 15 s and 60 °C for 1 min. Genotype analysis was performed on the ABISDS 7700 PCR machine with ABI PRISM 7700 software, using a standard procedure ofautomatic allele discrimination.
SBE assays involved PCR amplification (primer in Supplementary Table 3) of genomic DNAfollowed by enzymatic cleanup with shrimp alkaline phosphatase and exonuclease I (ExoI).The final SBE reaction was carried out in a 12 µl reaction containing 1 × Sequenase reactionbuffer (GE Healthcare Bio-Science Corp., Piscataway NJ, USA), 7.2 µl of purified PCRproduct, 250 µM of each ddNTP (GE Healthcare Bio-Science Corp.), 1 µM allele-specificoligonucleotide, and 2.5 U of Sequenase (GE Healthcare Bio-Science Corp.). The reaction wasrun on a MJ Research thermocycler at 95 °C for 2 min, followed by 60 cycles of 96 °C for 30s, 55 °C for 30 s, and 60 °C for 30 s. Genotypes were determined by denaturing high-performance liquid chromatography (dHPLC), which involved injection of each reaction intoa preheated reversed phase column (DNA-Sep; Transgenomic, San Jose, CA, USA) on a Wave3500HT DHPLC System (Transgenomic Inc., Omaha, NE, USA). DNA was eluted on a linearacetonitrile gradient consisting of buffer A (0.1 moll−1 triethylammonium acetate, TEAA)/buffer B (0.1 moll−1 TEAA, 25% acetonitrile). Data acquisition was controlled by Navigatorsoftware (version 1.6.2; Transgenomic Inc.).
Phenotyping procedureThe concentrations of midazolam and its major metabolite, 1-hydroxy (1-OH) midazolam,were measured in plasma using a published liquid chromatography/mass spectrometry (LC/MS) method with some modifications.56 Both patient samples and concentration standardswere analyzed using the following method. Briefly, a 1 ml aliquot of plasma was incubatedwith 2000 U ml−1 β-glucuronidase to cleave the glucuronide-conjugated metabolite. Using thismethod we measure the concentration of both the 1-OH midazolam and the 1-OH midazolamglucuronide. Samples were then spiked with 10µl of prazapam (100 mg ml−1 dissolved inethanol) and extracted as previously described by Frerichs et al.56 For each sample andstandard, 100 µl was injected into the detection system for analysis. Concentration plasmastandards were made by adding appropriate amounts of both midazolam and 1-OH midazolamto blank human plasma at concentrations ranging from 150 to 1 ng ml−1. All samples weremeasured in duplicate with less that CV > 0.15 between samples.
The concentrations of all samples and standards were determined by an Agilent 1100 seriesHPLC coupled to an ABI 2000 triple quadrapole LC/MS fitted with an electro-spray ionizationinterface. The samples were first separated using a Luna C18 reverse-phase chromatographycolumn (3 µm particle size, 100 × 46 mm i.d.; Phenomenex, Torrance, CA, USA) with anisocratic mobile phase of acetonitrile:ammonium acetate (50:50, pH 4.7) at 1 ml min−1. TheMS conditions were optimized using a direct infusion of standard solutions prepared in mobilephase. LC/MS quantitation was performed at the following conditions: source temperature 450
Perera et al. Page 8
Pharmacogenomics J. Author manuscript; available in PMC 2009 September 30.
NIH
-PA Author Manuscript
NIH
-PA Author Manuscript
NIH
-PA Author Manuscript
°C, curtain gas 40ml min−1, collision gas 6 ml min−1, nebulizer voltage 6 V, ion source 1 gas50 ml min−1, ion source 2 gas 50 ml min−1, declustering potential 51 V, focusing potential 370V, entrance potential 11 V, collision energy 29 V and collision cell exit potential 8 V. Nitrogenand argon were used as the nebulizer and collision gases, respectively. Cone voltage andcollision energies were optimized for each analyte by full scan acquisitions. All analyses wereperformed in positive ion mode. Data acquisition and quantitative analysis were performed byAnalyst software (version 1.4.1; Applied Biosystems).
Resequencing of the CYP3A43-CYP3A4 intergenic regionAnalysis of the intergenic region between the CYP3A43 and CYP3A4 genes revealed newclusters of predicted transcriptional factor binding sites (Figure 6). The two regions closest toCYP3A4, located 13 and 16 kb upstream of the gene, were resequenced in the upper and lowerends of the phenotypic distribution (total of 32 individuals) to assess genomic differencesbetween these two groups. PCR products were cleaned using SAP and ExoI. Dye terminatorsequencing was performed with the ABI Big Dye Terminator Cycle sequencing kit and theproducts were analyzed with an ABI 3730 automated sequencer (Applied Biosystems). ThePhred-Phrap-Consed package (version 5.03) was used to assemble and analyze the sequences.
Statistical analysisWe identified LD patterns and picked htSNPs using the program LDSelect,57 which uses r2 (ameasure of LD between pairs of SNPs), to group SNPs that are highly correlated with eachother. This method reduces the number of SNPs that need to be typed while still capturing themajority of the variation present in the population. Figure 7 shows the SNPs that were binnedtogether and the htSNP chosen to tag each bin across the CYP3A locus. Seven haplotype taggingbins were identified, each spanning only one of the CYP3A genes. In addition, 19 singletonbins were found (shown as red dots); singleton bins contain SNPs that are not highly correlatedto any other SNPs in the locus, but which may still explain phenotypic variation alone or incombination with other htSNPs.
We initially assessed the correlation of each demographic factor with the midazolam phenotypeusing ANOVA and simple regression. The demographic factors that showed a significantcorrelation were then used as covariates in the subsequent analyses. We then performed GLMunivariate analysis to determine which htSNP best predicted the midazolam phenotype.
Because of the previously reported association between CYP3A5 variants and hypertension,52,58 we also looked at the correlation between hypertension and midazolam phenotype,respectively, with the nonfunctional CYP3A5 alleles, CYP3A5*3, *6 and *7, as a group. Weused PHASE to infer the haplotype phase in our sample.59 We then determined the number offunctional copies of CYP3A5 for each individual. For example, if two nonfunctional alleleswere found on the same chromosome, as determined by PHASE, and only the CYP3A*1 allelewas found on the second chromosome, this individual would be scored as having one functionalcopy of CYP3A5. If, however, an individual was homozygous for any of the nonfunctionalalleles or if different nonfunctional alleles were found on the two chromosomes, the individualwas scored as having no functional copies of CYP3A5. Of the 270 chromosomes investigatedin this study, only 3 chromosomes were found that contained two nonfunctional alleles of thesame chromosome. A total of 23 individuals were heterozygous for two of these functionalSNPs with the nonfunctional SNPs occurring on different chromosomes. We then usedANOVA and χ2-analysis to look at association of the number of functional copies to themidazolam ratio and hypertension. All analyses were performed using the SPSS softwarepackage (version 15.0.0). A P-value of less than 0.05 was deemed significant, and there wasno correction for the multiplicity of statistical testing.
Perera et al. Page 9
Pharmacogenomics J. Author manuscript; available in PMC 2009 September 30.
NIH
-PA Author Manuscript
NIH
-PA Author Manuscript
NIH
-PA Author Manuscript
As the human liver mRNA levels were not normally distributed, group differences wereanalyzed nonparametrically using the Wilcoxon’s rank sum test (W) to compare binary groups(for example, GG + GT vs TT). The Kruskal–Wallis (KW) test was used to compare the threegenotypes for each polymorphism (for example, GG vs GT vs TT). All statistical calculationswere performed using statistical program R: A Language and Environment for StatisticalAnalysis (http://www.R-project.org).
MATCH analysisThe MATCH version 11.1 tool (TRANSFAC Professional suite, version 11.1) was used tosearch for potential TFB sites in the 50 bp region surrounding htSNP 141689. MATCH usesa library of nucleotide distribution matrices of aligned TF binding sequences that are obtainedby in vitro selection studies to predict TF binding sites in this sequence. Our search wasrestricted to the use of high-quality matrices only (that is to exclude highly abundant matrices).We used the vertebrate nonredundant profile with the minSUM cutoff function. The minSUMcutoff minimizes both false positive and false negative matches. Cutoffs are based on matrixsimilarity scores which describe the quality of a match between a matrix and a part of the inputsequence. Analogously, the core similarity denotes the quality of a match between the coresequence of a matrix (that is the five most conserved positions within a matrix) and a part ofthe input sequence. The core similarity and matrix similarity scores for the predicted TF bindingsites are calculated using the MATCH algorithm described by Kel et al.60
PlasmidsThe −13 kbCYP3A4-LUC (wt) plasmid containing the entire CYP3A4 promoter, including theproximal and distal PXR response elements, inserted in pGL3 Basic (Promega, Madison, WI,USA) was kindly provided by Dr Christopher Liddle.38 This plasmid contained the wild-type141689G allele. The CYP3A4 141689T variant (var) allele was created directly from −13kbCYP3A4-Luc (wt) by site-directed mutagenesis (QuickChange; Stratagene, La Jolla, CA,USA) using a variant primer (sense primer, 5′-CCATTCTCCTTTAACCTGTTGACGATATCATTGGTATTTATAC-3′, htSNP 141689 bolded). The ∓13 kbCYP3A4-Luc var plasmid was sequenced to confirm base changes.
Transient transfection studiesHuman hepatoblastoma cells, HepG2 (American Type Culture Collection), were grown inminimal essential medium (Alpha-MEM; Biowhittaker, Waltersville, MO, USA) containing10% fetal bovine serum, penicillin and streptomycin. On day 1, HepG2 cells were seeded into24-well plates at a density of 0.6 × 10⁶ cells per well. After 24 h, cells were transfected with200 ng per well of the wild-type or variant −13kb CYP3A4-Luc reporter plasmid by calciumphosphate method. LS180 colon carcinoma cells were seeded into 24-well plates at a densityof 0.5 × 10⁶ cells per well on day 1. They were then transfected on day 2 by dissolving plasmidin OptiMEM (Life Technologies, Carlsbad, CA, USA) and transfecting using GenJet DNA invitro transfection reagent (SignaGen, Gaithersburg, MD, USA). After 16 h, the cells werewashed with OptiMEM then incubated for 24 h. Luciferase activities were measured with theLuciferase Reporter Assay Kit (Promega) on an OPTO-COMP I luminometer and normalizedto total cell protein. The experiments were repeated in triplicate. Differences in transcriptionalactivation were assessed by a Student’s t-test.
Human liversInstitutional review boards and clinical research advisory committees at St. Jude Children’sResearch Hospital and the University of Pittsburgh approved the use of tissue samples fromorgan donors. Human liver tissue was processed through Dr Relling’s laboratory at St. JudeChildren’s Research Hospital and was provided by the Liver Tissue Procurement and
Perera et al. Page 10
Pharmacogenomics J. Author manuscript; available in PMC 2009 September 30.
NIH
-PA Author Manuscript
NIH
-PA Author Manuscript
NIH
-PA Author Manuscript
Distribution System (NIH Contract no. N01-DK-9-2310) and by the Cooperative HumanTissue Network. Total RNA was isolated from the liver tissue from organ donors (48 African-American livers (men, n=32, women, n=16) using Trizol (Invitrogen, Carlsbad, CA, USA).First, strand cDNA was prepared from 3 µg total RNA using oligo dT primers and theInvitrogen Superscript II kit. Before real-time PCR, 20 µl of cDNA was diluted to 50 µl withDEPC-treated water.
Relative quantitation of CYP3A4 mRNA by the standard curve methodAn ABI gene expression assay (Hs00430021_m1) was used for real-time PCR (rtPCR)quantitation of CYP3A4 mRNA levels. Human PPIA (cyclophilin A, VIC/MGB Probe, PrimerLimited) was used to normalize the relative CYP3A4 mRNA expression according to themanufacturer’s instructions. cDNA (2 µl) from each sample was analyzed in duplicate byrtPCR on an ABI PRISM 7900HT Sequence Detection System (PE Applied Biosystems, FosterCity, CA, USA). The reaction was run using 1 µl of the 20 × Gene Expression Assay mix alongwith 7 µl of DEPC-treated water and 10 µl of 2 × Taqman Universal PCR Master mix (withAmperase UNG; TaqMan Universal PCR Master Mix) in 20 µl final volume. Standardamplification conditions consisting of 2 min (UNG activation) at 50 °C, 10 min at 95 °Cfollowed by 40 cycles of: 15 s (denaturing) at 95 °C and 1 min (annealing/extension) at 60 °C. Standard curves (in triplicate) were prepared for each gene using cDNA from a highexpression sample serially diluted over a 3125-fold range and the amounts of CYP3A4 andcyclophilin mRNA determined by interpolation. The average CYP3A4 amount was dividedby the average cyclophilin amount to obtain a normalized CYP3A4 value. One of theexperimental samples was then chosen as the calibrator, and each of the normalized CYP3A4values was divided by the normalized calibrator value to get the relative CYP3A4 mRNAexpression levels for the study samples.
Supplementary MaterialRefer to Web version on PubMed Central for supplementary material.
AcknowledgmentsThis work was made possible with the assistance in statistical and computational analysis by David Witonski andCheryl Roe, LC/MS/MS assistance by Larry House, and genotyping via dHPLC by Pei Xian Chen. Special thanks goto Dr Emma Thompson for her instruction in population genetics and enlightening conversations and theories. Thisstudy was supported by NIH grants GM60346, GM61393 and GM07019.
References1. Guengerich FP. Cytochrome P-450 3A4: regulation and role in drug metabolism. Annu Rev Pharmacol
Toxicol 1999;39:1–17. [PubMed: 10331074]2. Wrighton SA, Stevens JC. The human hepatic cytochromes P450 involved in drug metabolism. Crit
Rev Toxicol 1992;22:1–21. [PubMed: 1616599]3. Wrighton SA, Brian WR, Sari MA, Iwasaki M, Guengerich FP, Raucy JL, et al. Studies on the
expression and metabolic capabilities of human liver cytochrome P450IIIA5 (HLp3). Mol Pharmacol1990;38:207–213. [PubMed: 2385232]
4. Haehner BD, Gorski JC, Vandenbranden M, Wrighton SA, Janardan SK, Watkins PB, et al. Bimodaldistribution of renal cytochrome P450 3A activity in humans. Mol Pharmacol 1996;50:52–59.[PubMed: 8700118]
5. Kuehl P, Zhang J, Lin Y, Lamba J, Assem M, Schuetz J, et al. Sequence diversity in CYP3A promotersand characterization of the genetic basis of polymorphic CYP3A5 expression. Nat Genet 2001;27:383–391. [PubMed: 11279519]
Perera et al. Page 11
Pharmacogenomics J. Author manuscript; available in PMC 2009 September 30.
NIH
-PA Author Manuscript
NIH
-PA Author Manuscript
NIH
-PA Author Manuscript
6. Westlind-Johnsson A, Malmebo S, Johansson A, Otter C, Andersson TB, Johansson I, et al.Comparative analysis of CYP3A expression in human liver suggests only a minor role for CYP3A5in drug metabolism. Drug Metab Dispos 2003;31:755–761. [PubMed: 12756208]
7. Shimada T, Yamazaki H, Mimura M, Inui Y, Guengerich FP. Interindividual variations in human livercytochrome P-450 enzymes involved in the oxidation of drugs, carcinogens and toxic chemicals:studies with liver microsomes of 30 Japanese and 30 Caucasians. J Pharmacol Exp Ther 1994;270:414–423. [PubMed: 8035341]
8. Westlind A, Lofberg L, Tindberg N, Andersson TB, Ingelman-Sundberg M. Interindividual differencesin hepatic expression of CYP3A4: relationship to genetic polymorphism in the 5′-upstream regulatoryregion. Biochem Biophys Res Commun 1999;259:201–205. [PubMed: 10334940]
9. Lin YS, Dowling AL, Quigley SD, Farin FM, Zhang J, Lamba J, et al. Coregulation of CYP3A4 andCYP3A5 and contribution to hepatic and intestinal midazolam metabolism. Mol Pharmacol2002;62:162–172. [PubMed: 12065767]
10. Schellens JH, Soons PA, Breimer DD. Lack of bimodality in nifedipine plasma kinetics in a largepopulation of healthy subjects. Biochem Pharmacol 1988;37:2507–2510. [PubMed: 3390213]
11. Wilkinson GR. Cytochrome P4503A (CYP3A) metabolism: prediction of in vivo activity in humans.J Pharmacokinet Biopharm 1996;24:475–490. [PubMed: 9131486]
12. Ozdemir V, Kalowa W, Tang BK, Paterson AD, Walker SE, Endrenyi L, et al. Evaluation of thegenetic component of variability in CYP3A4 activity: a repeated drug administration method.Pharmacogenetics 2000;10:373–388. [PubMed: 10898107]
13. Chung E, Nafziger AN, Kazierad DJ, Bertino JS Jr. Comparison of midazolam and simvastatin ascytochrome P450 3A probes. Clin Pharmacol Ther 2006;79:350–361. [PubMed: 16580903]
14. Prueksaritanont T, Vega JM, Rogers JD, Gagliano K, Greenberg HE, Gillen L, et al. Simvastatin doesnot affect CYP3A activity, quantified by the erythromycin breath test and oral midazolampharmacokinetics, in healthy male subjects. J Clin Pharmacol 2000;40:1274–1279. [PubMed:11075313]
15. Thompson EE, Kuttab-Boulos H, Yang L, Roe BA, Di Rienzo A. Sequence diversity and haplotypestructure at the human CYP3A cluster. Pharmacogenomics J 2006;6:105–114. [PubMed: 16314882]
16. Krupka E, Venisse N, Lafay C, Gendre D, Diquet B, Bouquet S, et al. Probe of CYP3A by a single-point blood measurement after oral administration of midazolam in healthy elderly volunteers. EurJ Clin Pharmacol 2006;62:653–659. [PubMed: 16832678]
17. Lepper ER, Baker SD, Permenter M, Ries N, van Schaik RH, Schenk PW, et al. Effect of commonCYP3A4 and CYP3A5 variants on the pharmacokinetics of the cytochrome P450 3A phenotypingprobe midazolam in cancer patients. Clin Cancer Res 2005;11:7398–7404. [PubMed: 16243813]
18. Chaobal HN, Kharasch ED. Single-point sampling for assessment of constitutive, induced, andinhibited cytochrome P450 3A activity with alfentanil or midazolam. Clin Pharmacol Ther2005;78:529–539. [PubMed: 16321619]
19. Thummel KE, Shen DD, Podoll TD, Kunze KL, Trager WF, Bacchi CE, et al. Use of midazolam asa human cytochrome P450 3A probe: II. Characterization of inter- and intraindividual hepatic CYP3Avariability after liver transplantation. J Pharmacol Exp Ther 1994;271:557–566. [PubMed: 7965756]
20. Carrillo JA, Ramos SI, Agundez JA, Martinez C, Benitez J. Analysis of midazolam and metabolitesin plasma by high-performance liquid chromatography: probe of CYP3A. Ther Drug Monit1998;20:319–324. [PubMed: 9631930]
21. Fellay J, Marzolini C, Decosterd L, Golay KP, Baumann P, Buclin T, et al. Variations of CYP3Aactivity induced by antiretroviral treatment in HIV-1 infected patients. Eur J Clin Pharmacol2005;60:865–873. [PubMed: 15657782]
22. Gurley BJ, Gardner SF, Hubbard MA, Williams DK, Gentry WB, Khan IA, et al. In vivo effects ofgoldenseal, kava kava, black cohosh, and valerian on human cytochrome P450 1A2, 2D6, 2E1, and3A4/5 phenotypes. Clin Pharmacol Ther 2005;77:415–426. [PubMed: 15900287]
23. Eap CB, Fellay J, Buclin T, Bleiber G, Golay KP, Brocard M, et al. CYP3A activity measured by themidazolam test is not related to 3435 C >T polymorphism in the multiple drug resistance transportergene. Pharmacogenetics 2004;14:255–260. [PubMed: 15083070]
Perera et al. Page 12
Pharmacogenomics J. Author manuscript; available in PMC 2009 September 30.
NIH
-PA Author Manuscript
NIH
-PA Author Manuscript
NIH
-PA Author Manuscript
24. Huang P, Zhu B, Wang LS, Ouyang DS, Huang SL, Chen XP, et al. Relationship between CYP3Aactivity and breast cancer susceptibility in Chinese Han women. Eur J Clin Pharmacol 2003;59:471–476. [PubMed: 12937874]
25. Zhu B, Liu ZQ, Chen GL, Chen XP, Ou-Yang DS, Wang LS, et al. The distribution and genderdifference of CYP3A activity in Chinese subjects. Br J Clin Pharmacol 2003;55:264–269. [PubMed:12630976]
26. Villeneuve JP, L'Ecuyer L, De Maeght S, Bannon P. Prediction of cyclosporine clearance in livertransplant recipients by the use of midazolam as a cytochrome P450 3A probe. Clin Pharmacol Ther2000;67:242–248. [PubMed: 10741627]
27. Zeigler-Johnson C, Friebel T, Walker AH, Wang Y, Spangler E, Panossian S, et al. CYP3A4,CYP3A5, and CYP3A43 genotypes and haplotypes in the etiology and severity of prostate cancer.Cancer Res 2004;64:8461–8467. [PubMed: 15548719]
28. Schirmer M, Toliat MR, Haberl M, Suk A, Kamdem LK, Klein K, et al. Genetic signature consistentwith selection against the CYP3A4*1B allele in non-African populations. Pharmacogenet Genomics2006;16:59–71. [PubMed: 16344723]
29. Goodwin B, Hodgson E, D'Costa DJ, Robertson GR, Liddle C. Transcriptional regulation of thehuman CYP3A4 gene by the constitutive androstane receptor. Mol Pharmacol 2002;62:359–365.[PubMed: 12130689]
30. Xie W, Barwick JL, Simon CM, Pierce AM, Safe S, Blumberg B, et al. Reciprocal activation ofxenobiotic response genes by nuclear receptors SXR/PXR and CAR. Genes Dev 2000;14:3014–3023.[PubMed: 11114890]
31. Lehmann JM, McKee DD, Watson MA, Willson TM, Moore JT, Kliewer SA. The human orphannuclear receptor PXR is activated by compounds that regulate CYP3A4 gene expression and causedrug interactions. J Clin Invest 1998;102:1016–1023. [PubMed: 9727070]
32. Bertilsson G, Heidrich J, Svensson K, Asman M, Jendeberg L, Sydow-Backman M, et al.Identification of a human nuclear receptor defines a new signaling pathway for CYP3A induction.Proc Natl Acad Sci USA 1998;95:12208–12213. [PubMed: 9770465]
33. Thummel KE, Brimer C, Yasuda K, Thottassery J, Senn T, Lin Y, et al. Transcriptional control ofintestinal cytochrome P-4503A by 1 alpha, 25-dihydroxy vitamin D3. Mol Pharmacol 2001;60:1399–1406. [PubMed: 11723248]
34. Pascussi JM, Drocourt L, Gerbal-Chaloin S, Fabre JM, Maurel P, Vilarem MJ. Dual effect ofdexamethasone on CYP3A4 gene expression in human hepatocytes. Sequential role of glucocorticoidreceptor and pregnane X receptor. Eur J Biochem 2001;268:6346–6358. [PubMed: 11737189]
35. Cai Y, Konishi T, Han G, Campwala KH, French SW, Wan YJ. The role of hepatocyte RXR alphain xenobiotic-sensing nuclear receptor-mediated pathways. Eur J Pharm Sci 2002;15:89–96.[PubMed: 11803135]
36. Lee SS, Pineau T, Drago J, Lee EJ, Owens JW, Kroetz DL, et al. Targeted disruption of the alphaisoform of the peroxisome prolixferator-activated receptor gene in mice results in abolishment of thepleiotropic effects of peroxisome proliferators. Mol Cell Biol 1995;15:3012–3022. [PubMed:7539101]
37. Johnson EF, Hsu MH, Savas U, Griffin KJ. Regulation of P450 4A expression by peroxisomeproliferator activated receptors. Toxicology 2002:181–182. [PubMed: 11893417]203–206
38. Goodwin B, Hodgson E, Liddle C. The orphan human pregnane X receptor mediates thetranscriptional activation of CYP3A4 by rifampicin through a distal enhancer module. MolPharmacol 1999;56:1329–1339. [PubMed: 10570062]
39. Matsumura K, Saito T, Takahashi Y, Ozeki T, Kiyotani K, Fujieda M, et al. Identification of a novelpolymorphic enhancer of the human CYP3A4 gene. Mol Pharmacol 2004;65:326–334. [PubMed:14742674]
40. Wang JC, Stafford JM, Scott DK, Sutherland C, Granner DK. The molecular physiology of hepaticnuclear factor 3 in the regulation of gluconeogenesis. J Biol Chem 2000;275:14717–14721. [PubMed:10799560]
41. Bombail V, Taylor K, Gibson GG, Plant N. Role of Sp1, C/EBP alpha, HNF3, and PXR in the basal-and xenobiotic-mediated regulation of the CYP3A4 gene. Drug Metab Dispos 2004;32:525–535.[PubMed: 15100175]
Perera et al. Page 13
Pharmacogenomics J. Author manuscript; available in PMC 2009 September 30.
NIH
-PA Author Manuscript
NIH
-PA Author Manuscript
NIH
-PA Author Manuscript
42. Lamba JK, Lin YS, Thummel K, Daly A, Watkins PB, Strom S, et al. Common allelic variants ofcytochrome P4503A4 and their prevalence in different populations. Pharmacogenetics 2002;12:121–132. [PubMed: 11875366]
43. Roy JN, Lajoie J, Zijenah LS, Barama A, Poirier C, Ward BJ, et al. CYP3A5 genetic polymorphismsin different ethnic populations. Drug Metab Dispos 2005;33:884–887. [PubMed: 15833928]
44. Yamaori S, Yamazaki H, Iwano S, Kiyotani K, Matsumura K, Honda G, et al. CYP3A5 Contributessignificantly to CYP3A-mediated drug oxidations in liver microsomes from Japanese subjects. DrugMetab Pharmacokinet 2004;19:120–129. [PubMed: 15499178]
45. Shih PS, Huang JD. Pharmacokinetics of midazolam and 1′-hydroxymidazolam in Chinese withdifferent CYP3A5 genotypes. Drug Metab Dispos 2002;30:1491–1496. [PubMed: 12433824]
46. Floyd MD, Gervasini G, Masica AL, Mayo G, George AL Jr, Bhat K, et al. Genotype-phenotypeassociations for common CYP3A4 and CYP3A5 variants in the basal and induced metabolism ofmidazolam in European- and African-American men and women. Pharmacogenetics 2003;13:595–606. [PubMed: 14515058]
47. He P, Court MH, Greenblatt DJ, Von Moltke LL. Genotype-phenotype associations of cytochromeP450 3A4 and 3A5 polymorphism with midazolam clearance in vivo. Clin Pharmacol Ther2005;77:373–387. [PubMed: 15900284]
48. Kharasch ED. Every breath you take, we’ll be watching you. Anesthesiology 2007;106:652–654.[PubMed: 17413899]
49. Thummel KE. Does the CYP3A5*3 polymorphism affect in vivo drug elimination? Pharmacogenetics2003;13:585–587. [PubMed: 14515056]
50. Givens RC, Lin YS, Dowling AL, Thummel KE, Lamba JK, Schuetz EG, et al. CYP3A5 genotypepredicts renal CYP3A activity and blood pressure in healthy adults. J Appl Physiol 2003;95:1297–1300. [PubMed: 12754175]
51. Ho H, Pinto A, Hall SD, Flockhart DA, Li L, Skaar TC, et al. Association between the CYP3A5genotype and blood pressure. Hypertension 2005;45:294–298. [PubMed: 15596575]
52. Bochud M, Eap CB, Elston RC, Bovet P, Maillard M, Schild L, et al. Association of CYP3A5genotypes with blood pressure and renal function in African families. J Hypertens 2006;24:923–929.[PubMed: 16612255]
53. Young JH, Chang YP, Kim JD, Chretien JP, Klag MJ, Levine MA, et al. Differential susceptibilityto hypertension is due to selection during the out-of-Africa expansion. PLoS Genet 2005;1:e82.[PubMed: 16429165]
54. Thompson EE, Kuttab-Boulos H, Witonsky D, Yang L, Roe BA, Di Rienzo A. CYP3A variation andthe evolution of salt-sensitivity variants. Am J Hum Genet 2004;75:1059–1069. [PubMed: 15492926]
55. Maruyama M, Matsunaga T, Harada E, Ohmori S. Comparison of basal gene expression and inductionof CYP3As in HepG2 and human fetal liver cells. Biol Pharm Bull 2007;30:2091–2097. [PubMed:17978482]
56. Frerichs VA, Zaranek C, Haas CE. Analysis of omeprazole, midazolam and hydroxy-metabolites inplasma using liquid chromatography coupled to tandem mass spectrometry. J Chromatogr B AnalytTechnol Biomed Life Sci 2005;824:71–80.
57. Carlson CS, Eberle MA, Rieder MJ, Yi Q, Kruglyak L, Nickerson DA. Selecting a maximallyinformative set of single-nucleotide polymorphisms for association analyses using linkagedisequilibrium. Am J Hum Genet 2004;74:106–120. [PubMed: 14681826]
58. Eap CB, Bochud M, Elston RC, Bovet P, Maillard MP, Nussberger J, et al. CYP3A5 and ABCB1genes influence blood pressure and response to treatment, and their effect is modified by salt.Hypertension 2007;49:1007–1014. [PubMed: 17372036]
59. Stephens M, Smith NJ, Donnelly P. A new statistical method for haplotype reconstruction frompopulation data. Am J Hum Genet 2001;68:978–989. [PubMed: 11254454]
60. Kel AE, Gossling E, Reuter I, Cheremushkin E, Kel-Margoulis OV, Wingender E. MATCH: A toolfor searching transcription factor binding sites in DNA sequences. Nucleic Acids Res 2003;31:3576–3579. [PubMed: 12824369]
Perera et al. Page 14
Pharmacogenomics J. Author manuscript; available in PMC 2009 September 30.
NIH
-PA Author Manuscript
NIH
-PA Author Manuscript
NIH
-PA Author Manuscript
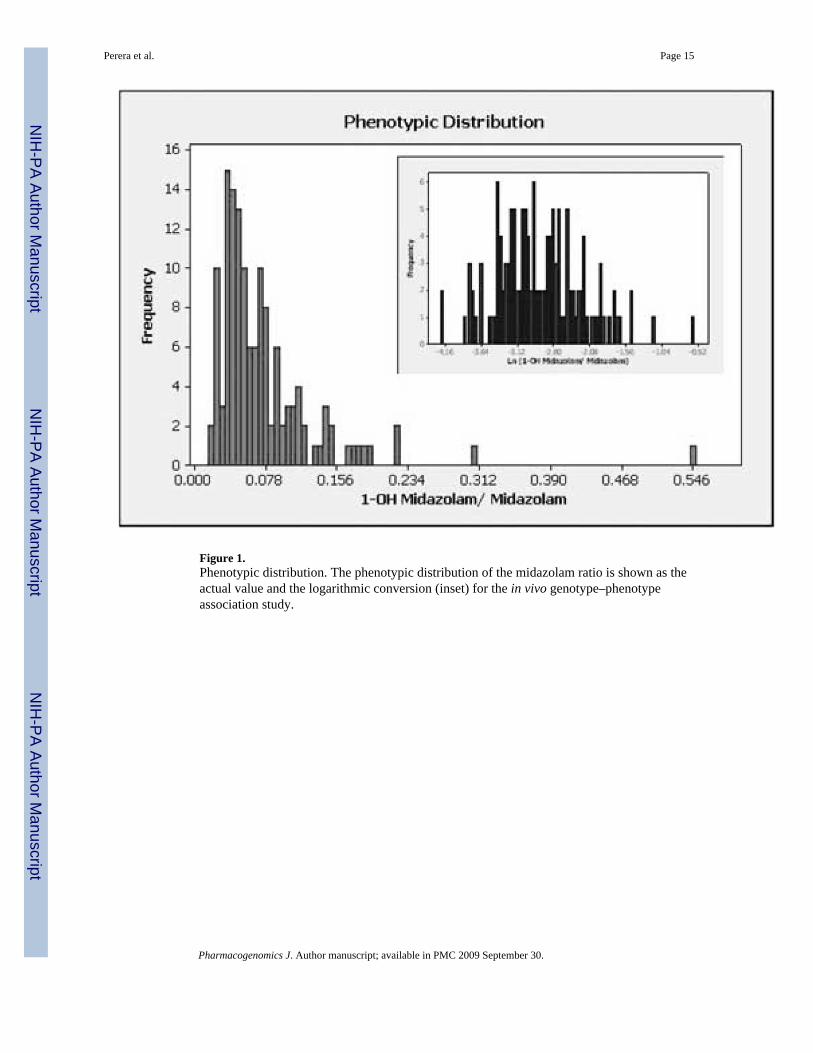
Figure 1.Phenotypic distribution. The phenotypic distribution of the midazolam ratio is shown as theactual value and the logarithmic conversion (inset) for the in vivo genotype–phenotypeassociation study.
Perera et al. Page 15
Pharmacogenomics J. Author manuscript; available in PMC 2009 September 30.
NIH
-PA Author Manuscript
NIH
-PA Author Manuscript
NIH
-PA Author Manuscript
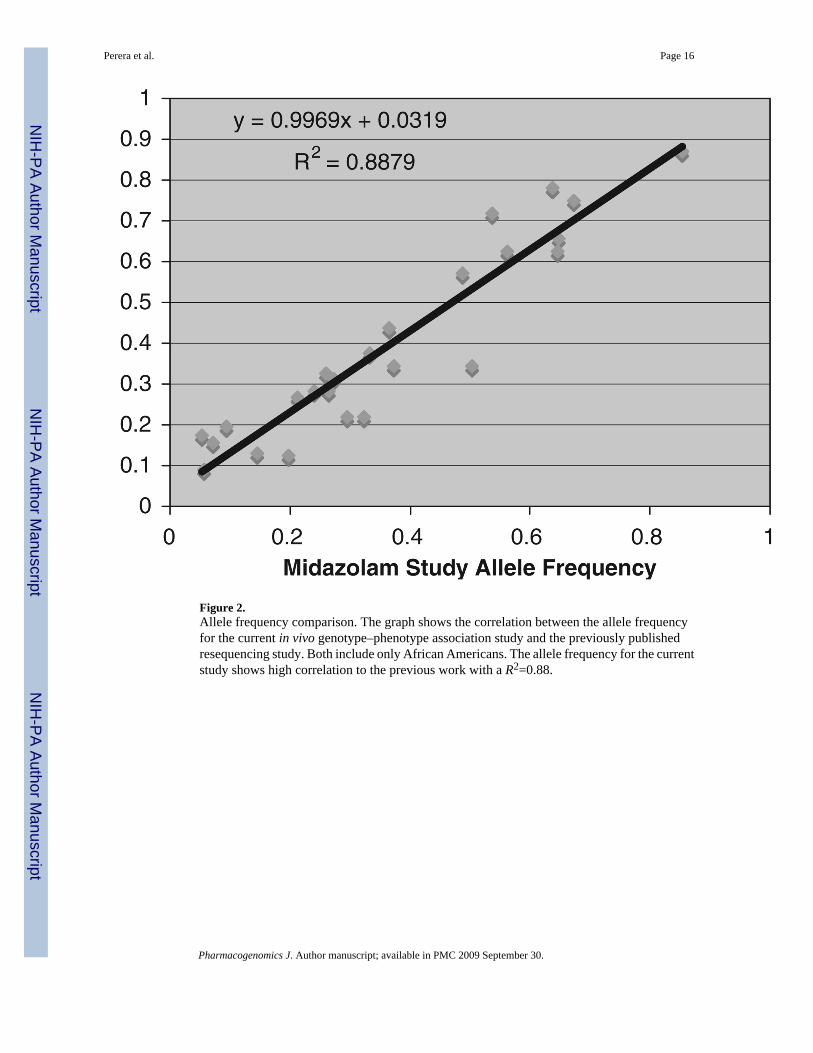
Figure 2.Allele frequency comparison. The graph shows the correlation between the allele frequencyfor the current in vivo genotype–phenotype association study and the previously publishedresequencing study. Both include only African Americans. The allele frequency for the currentstudy shows high correlation to the previous work with a R2=0.88.
Perera et al. Page 16
Pharmacogenomics J. Author manuscript; available in PMC 2009 September 30.
NIH
-PA Author Manuscript
NIH
-PA Author Manuscript
NIH
-PA Author Manuscript
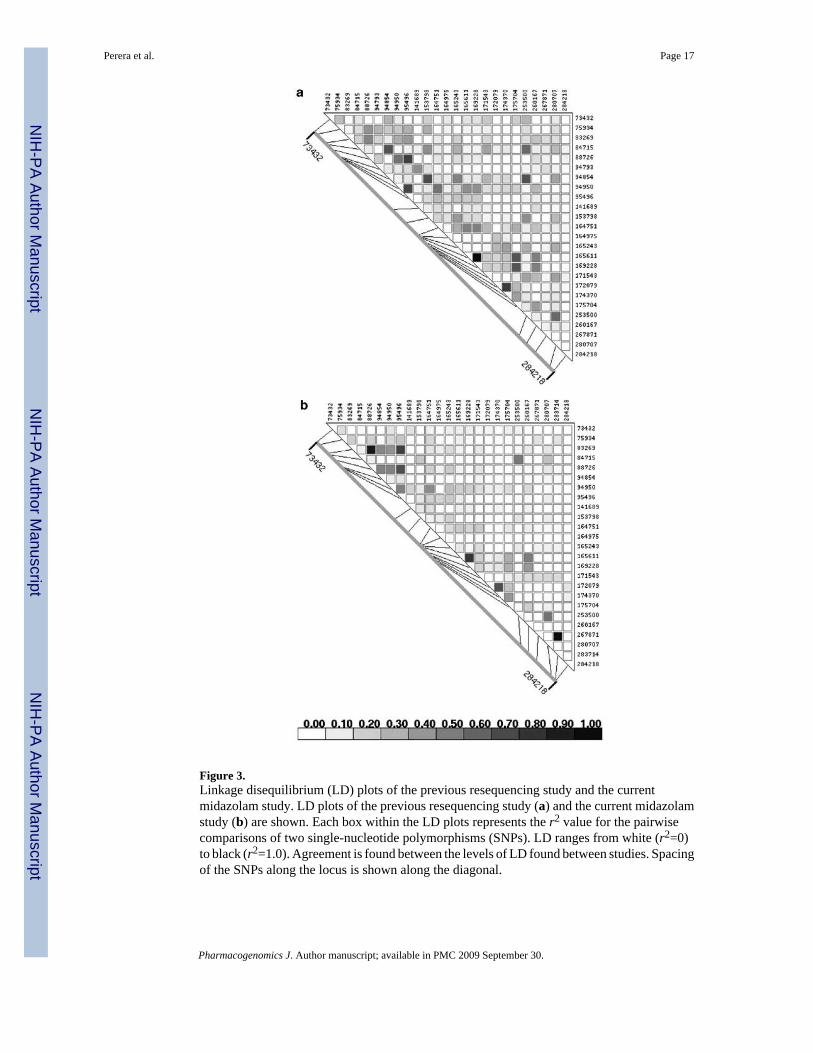
Figure 3.Linkage disequilibrium (LD) plots of the previous resequencing study and the currentmidazolam study. LD plots of the previous resequencing study (a) and the current midazolamstudy (b) are shown. Each box within the LD plots represents the r2 value for the pairwisecomparisons of two single-nucleotide polymorphisms (SNPs). LD ranges from white (r2=0)to black (r2=1.0). Agreement is found between the levels of LD found between studies. Spacingof the SNPs along the locus is shown along the diagonal.
Perera et al. Page 17
Pharmacogenomics J. Author manuscript; available in PMC 2009 September 30.
NIH
-PA Author Manuscript
NIH
-PA Author Manuscript
NIH
-PA Author Manuscript
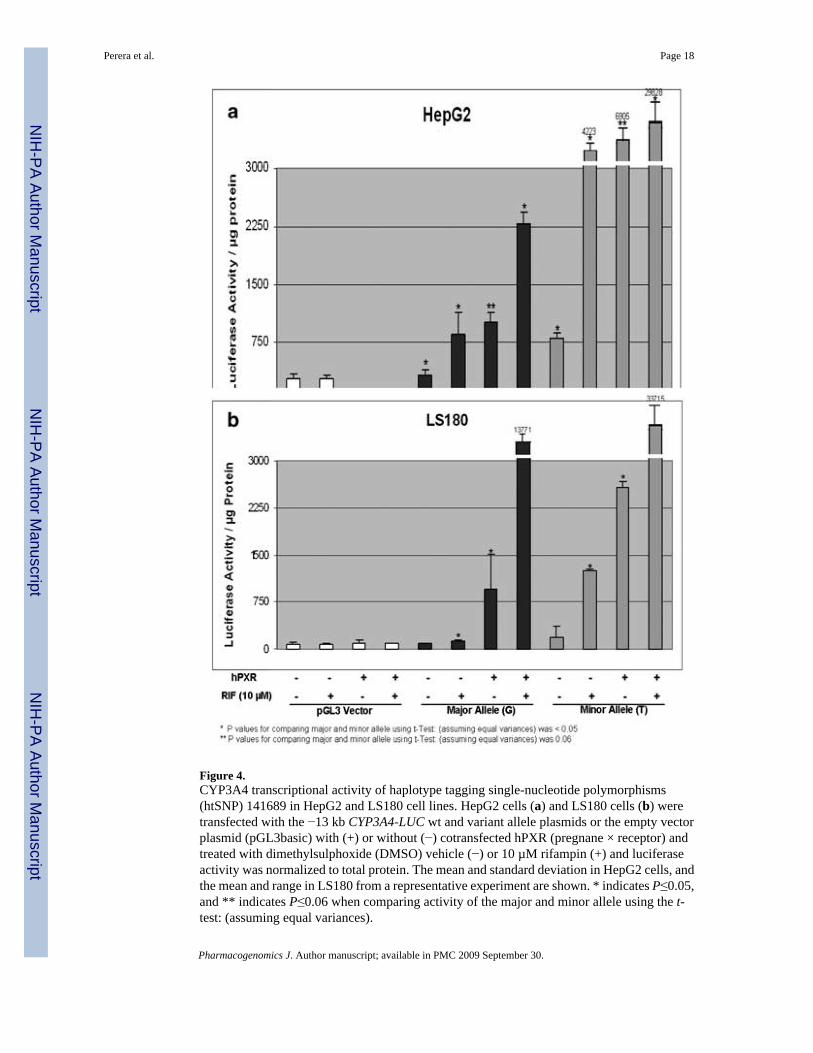
Figure 4.CYP3A4 transcriptional activity of haplotype tagging single-nucleotide polymorphisms(htSNP) 141689 in HepG2 and LS180 cell lines. HepG2 cells (a) and LS180 cells (b) weretransfected with the −13 kb CYP3A4-LUC wt and variant allele plasmids or the empty vectorplasmid (pGL3basic) with (+) or without (−) cotransfected hPXR (pregnane × receptor) andtreated with dimethylsulphoxide (DMSO) vehicle (−) or 10 µM rifampin (+) and luciferaseactivity was normalized to total protein. The mean and standard deviation in HepG2 cells, andthe mean and range in LS180 from a representative experiment are shown. * indicates P≤0.05,and ** indicates P≤0.06 when comparing activity of the major and minor allele using the t-test: (assuming equal variances).
Perera et al. Page 18
Pharmacogenomics J. Author manuscript; available in PMC 2009 September 30.
NIH
-PA Author Manuscript
NIH
-PA Author Manuscript
NIH
-PA Author Manuscript
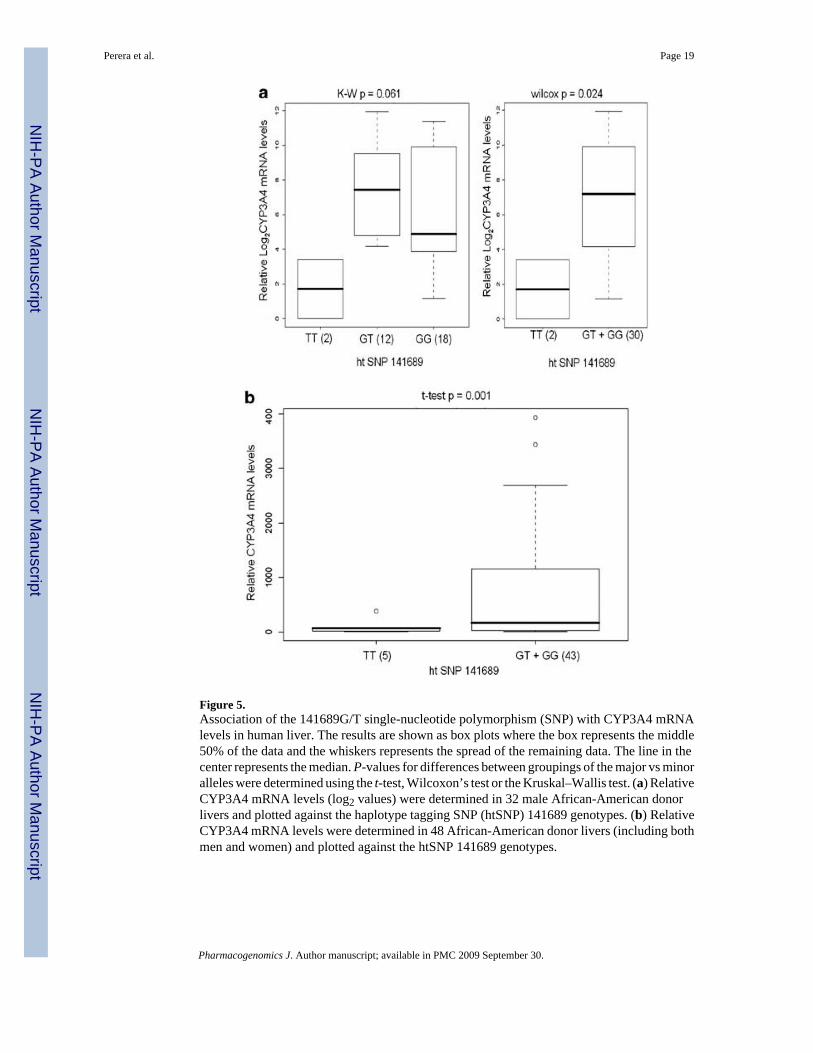
Figure 5.Association of the 141689G/T single-nucleotide polymorphism (SNP) with CYP3A4 mRNAlevels in human liver. The results are shown as box plots where the box represents the middle50% of the data and the whiskers represents the spread of the remaining data. The line in thecenter represents the median. P-values for differences between groupings of the major vs minoralleles were determined using the t-test, Wilcoxon’s test or the Kruskal–Wallis test. (a) RelativeCYP3A4 mRNA levels (log2 values) were determined in 32 male African-American donorlivers and plotted against the haplotype tagging SNP (htSNP) 141689 genotypes. (b) RelativeCYP3A4 mRNA levels were determined in 48 African-American donor livers (including bothmen and women) and plotted against the htSNP 141689 genotypes.
Perera et al. Page 19
Pharmacogenomics J. Author manuscript; available in PMC 2009 September 30.
NIH
-PA Author Manuscript
NIH
-PA Author Manuscript
NIH
-PA Author Manuscript
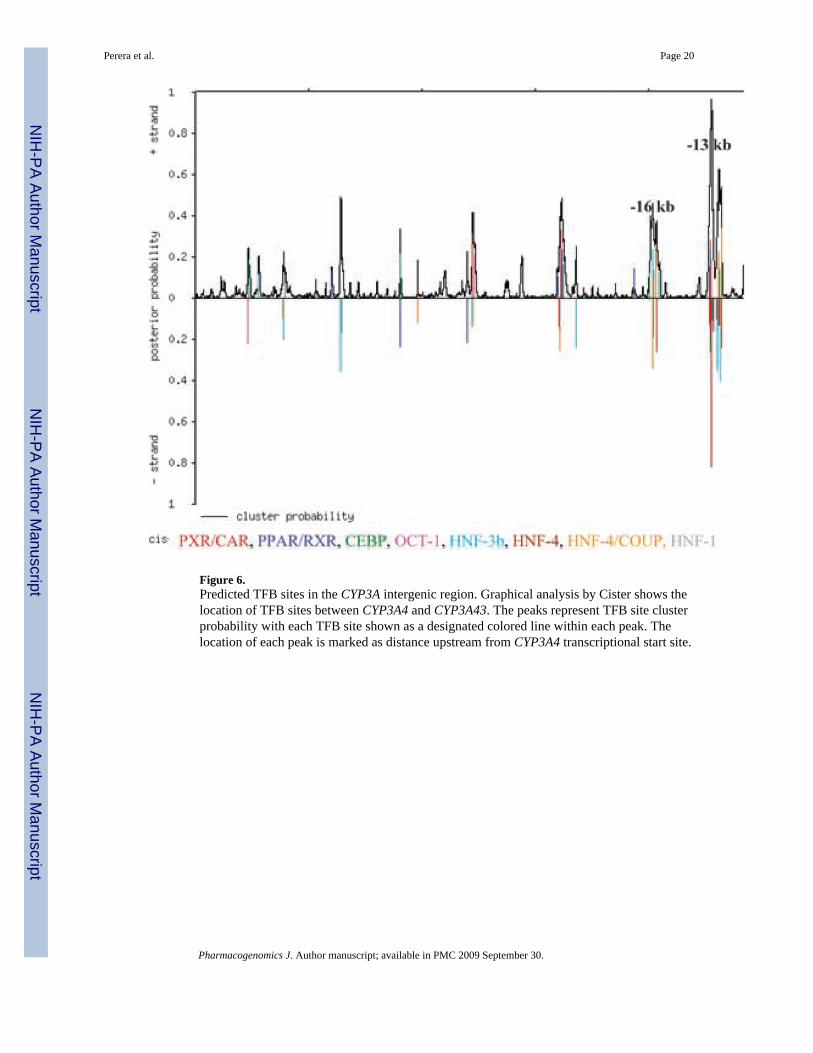
Figure 6.Predicted TFB sites in the CYP3A intergenic region. Graphical analysis by Cister shows thelocation of TFB sites between CYP3A4 and CYP3A43. The peaks represent TFB site clusterprobability with each TFB site shown as a designated colored line within each peak. Thelocation of each peak is marked as distance upstream from CYP3A4 transcriptional start site.
Perera et al. Page 20
Pharmacogenomics J. Author manuscript; available in PMC 2009 September 30.
NIH
-PA Author Manuscript
NIH
-PA Author Manuscript
NIH
-PA Author Manuscript
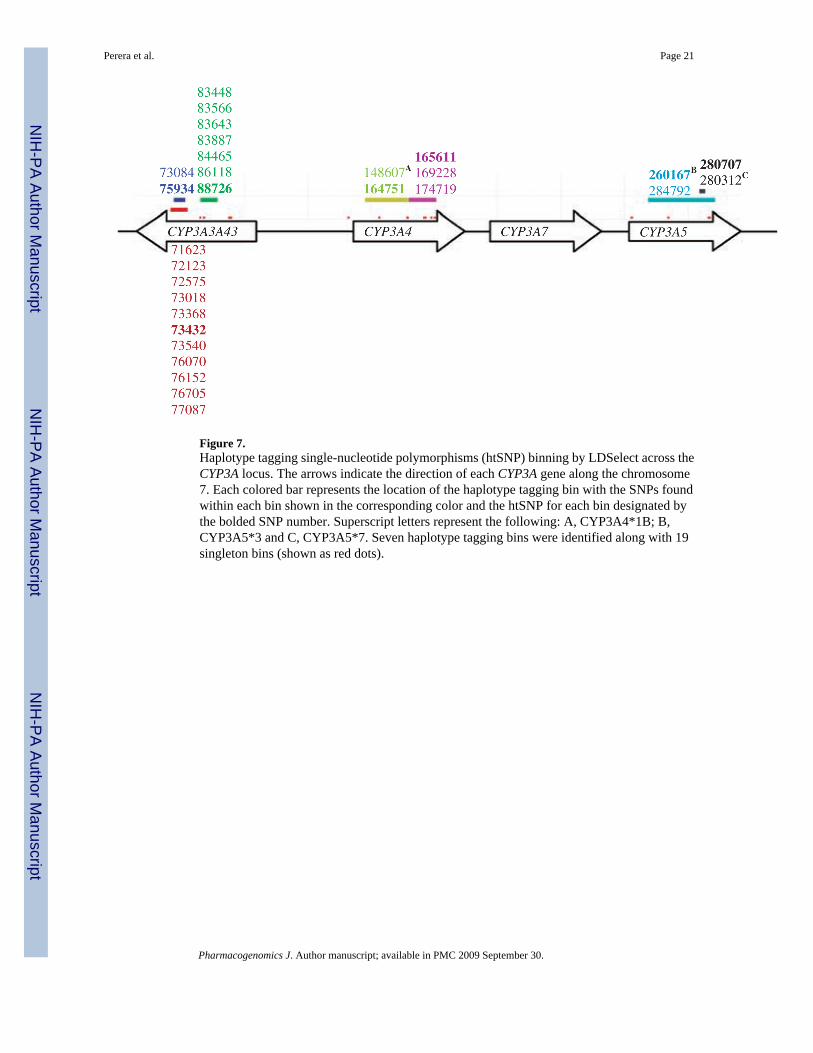
Figure 7.Haplotype tagging single-nucleotide polymorphisms (htSNP) binning by LDSelect across theCYP3A locus. The arrows indicate the direction of each CYP3A gene along the chromosome7. Each colored bar represents the location of the haplotype tagging bin with the SNPs foundwithin each bin shown in the corresponding color and the htSNP for each bin designated bythe bolded SNP number. Superscript letters represent the following: A, CYP3A4*1B; B,CYP3A5*3 and C, CYP3A5*7. Seven haplotype tagging bins were identified along with 19singleton bins (shown as red dots).
Perera et al. Page 21
Pharmacogenomics J. Author manuscript; available in PMC 2009 September 30.
NIH
-PA Author Manuscript
NIH
-PA Author Manuscript
NIH
-PA Author Manuscript
NIH
-PA Author Manuscript
NIH
-PA Author Manuscript
NIH
-PA Author Manuscript
Perera et al. Page 22Ta
ble
1Lo
catio
n an
d se
quen
ce c
onte
xt o
f htS
NPs
Num
beri
ng b
ased
on
NG
_000
004
Gen
ePo
sitio
ntr
ansc
ript
iona
l sta
rtsi
te
Posi
tion
inre
fere
nce
sequ
ence
Sequ
ence
dbSN
PR
egio
nM
AF
in A
fric
anA
mer
ican
s
CYP
3A43
a31
621
7343
2tta
atcc
ag[G
/T]tt
tttttc
cars
4550
1292
Intro
n 9
0.19
767
2911
975
934
atca
ctga
c[C
/T]g
acct
ccgg
grs
5172
84In
tron
90.
3653
8
2178
483
269
acat
tttaa
[C/G
]tagg
tgaa
ttrs
6960
775
Intro
n 7
0.48
828
2033
884
715
gcttt
tgtc
[C/T
]gat
cact
gga
rs28
6690
87In
tron
60.
0719
7
1632
788
726
gacg
aagt
a[C
/T]a
aagc
acttt
rs50
1275
Intro
n 4
0.49
597
1019
994
854
ccag
ctta
a[C
/G]a
cata
ataa
grs
4561
6432
Intro
n 2
0.36
22
1010
394
950
aaaa
caaa
c[C
/T]tt
cctg
cttc
rs64
2761
Intro
n 2
0.32
308
9557
9549
6ag
cact
ccc[
A/T
]gct
cagg
ctc
rs52
3407
Intro
n 2
0.46
262
CYP
3A4b
−720
614
1689
tgttg
acga
[G/T
]atc
attg
gta
rs27
3741
8U
pstre
am0.
2952
8
−483
015
3798
gaca
gtgg
t[G/T
]gtc
aatc
aaa
rs78
0167
1U
pstre
am0.
2126
1575
616
4751
attta
tctt[
G/T
]ctc
tctta
aars
2687
116
Intro
n 7
0.37
209
1598
016
4975
acttt
ctgc
[C/T
]tcta
tgga
ttrs
2246
709
Intro
n 7
0.32
661
1624
816
5243
agat
tgtg
g[C
/T]c
tatc
acat
crs
2687
117
Intro
n 7
0.35
385
1661
616
5611
ctgc
tgta
g[C
/T]g
gtgc
tcct
trs
4646
437
Intro
n 7
0.26
446
2023
316
9228
gagt
ggat
g[G
/A]ta
catg
gaga
rs22
4248
0In
tron
100.
2404
6
2254
817
1543
tcta
tgga
g[G
/A]tg
tggg
ggag
rs69
5634
4In
tron
110.
3522
7
2308
417
2079
atct
acca
a[C
/T]g
tgga
acca
grs
1272
1620
Intro
n 11
0.27
273
2537
517
4370
ctac
ccag
g[G
/T]tt
acct
tgca
rs17
1618
86In
tron
120.
3320
3
2670
917
5704
ccta
catg
g[T/
–]tg
aaac
ccca
rs33
9722
39Ex
on 1
30.
4375
CYP
3A5
405
2535
00ttg
gtag
tg[G
/A]g
aatg
atttg
rs45
5838
44In
tron
10.
0526
3
7072
2601
67tg
tcttt
ca[G
/A]ta
tctc
ttcc
rs77
6746
Intro
n 3
0.25
954
1477
626
7871
gagc
acta
a[G
/A]a
agttc
ctaa
rs10
2642
72Ex
on 7
0.14
552
2761
228
0707
aaaa
cgaa
a[C
/T]ta
catc
catc
rs69
7601
7In
tron
110.
0939
8
3061
928
3714
atta
agca
a[C
/T]a
gcct
ataa
grs
1024
9369
Intro
n 12
0.14
662
3112
328
4218
actg
ggaa
g[G
/A]g
ttact
agac
rs45
6188
35In
tron
120.
0563
9
Abb
revi
atio
ns: d
bSN
P, si
ngle
-nuc
leot
ide
poly
mor
phis
m d
atab
ase;
MA
F, m
inor
alle
le fr
eque
ncy.
Pharmacogenomics J. Author manuscript; available in PMC 2009 September 30.
NIH
-PA Author Manuscript
NIH
-PA Author Manuscript
NIH
-PA Author Manuscript
Perera et al. Page 23a C
YP3A
43 is
in th
e re
vers
e di
rect
ion
in th
is re
fere
nce
sequ
ence
.
b Shad
ed ro
w in
dica
tes s
igni
fican
t SN
P in
uni
varia
te a
naly
sis.
Pharmacogenomics J. Author manuscript; available in PMC 2009 September 30.
NIH
-PA Author Manuscript
NIH
-PA Author Manuscript
NIH
-PA Author Manuscript
Perera et al. Page 24
Table 2Results on general linear model univariate analysis
SNP F P-value Gene
73432 1.015 0.37
75934 2.151 0.12
83269 2.216 0.12
84715 1.293 0.26
88726 1.543 0.22 CYP3A43
94854 2.482 0.09
94950 2.143 0.12
95496 0.612 0.55
141689 4.740 0.01
153798 2.778 0.07
164751 0.985 0.38
164975 1.115 0.33
165243 1.491 0.23
165611 0.031 0.97 CYP3A4
169228 0.273 0.76
171543 2.598 0.08
172079 0.113 0.89
174370 0.253 0.78
175704 0.487 0.62
253500 1.289 0.26
260167 0.090 0.91
267871 1.356 0.26 CYP3A5
280707 0.508 0.48
284218 1.028 0.31
Abbreviation: SNP, single-nucleotide polymorphism.
r2 =0.474; P-value=0.029.
Pharmacogenomics J. Author manuscript; available in PMC 2009 September 30.
NIH
-PA Author Manuscript
NIH
-PA Author Manuscript
NIH
-PA Author Manuscript
Perera et al. Page 25
Table 3MATCH output of SNP 141689
Transcriptional binding factor DNA sequence
c-Maf taaccTGTTGacgagatca Retained
PPARα:RXR-α taacCTGTTgacgagatcat Destroyed
Tax/CREB acctgtTGACGagat Retained
CREB ctgtTGACGaga Retained
CREBATF tTGACGaga Retained
NF-Y gagatcATTGGtattt Retained
Cart-1 agaTCATTggtatttata Retained
GATA-4 AGATCattggta Destroyed
CDPCR3 CGATAtcattggtat Created
Abbreviations: PPARα:RXRα, peroxisome proliferator-activated receptorα:retinoid × receptorα; CDPCR3, CCAAT displacement protein/cut repeat 3;c-Maf, musculoaponeurotic fibrosarcoma oncogene homolog; CREB, cAMP response element binding protein; ATF, activating transcription factor 1;NF-Y, Nuclear Factor Y; Cart-1, cartilage homeoprotein 1.
Upper case letter denote core sequence within the site sequence.
Bold letters denote location of the SNP within the sequence.
Pharmacogenomics J. Author manuscript; available in PMC 2009 September 30.
NIH
-PA Author Manuscript
NIH
-PA Author Manuscript
NIH
-PA Author Manuscript
Perera et al. Page 26
Table 4MATCH output of intergenic region
SNP numbera Transcriptional binding factor Site sequenceb,c
132798 HNF3β caaccAAAAAaagcc Destroyed
132798 HNF3β aaccaAAAAAagccc Destroyed
132798 TATA accaTAAAAa Created
132803 HNF3β caaccAAAAAaagcc Retained
132803 HNF3β aaccaAAAAAagccc Retained
133161 HNF3β catatAAACAgaacc Retained
133161 HNF3β gaaccAAAGAcaaaa Retained
133472 C/EBP-β gtgTTCCTctatgt Destroyed
Abbreviations: SNP, single-nucleotide polymorphism; HNF3β, hepatic nuclear factor-3β. C/EBP, CCAAT/enhancer binding protein β.
aNumbered according to GenBank accession number NG_000004.
bUpper case letters denote core sequence within the site sequence.
cBold letters denote location of the SNP within the sequence.
Pharmacogenomics J. Author manuscript; available in PMC 2009 September 30.


