Embed Size (px)
Citation preview
J. Dairy Sci. 89:1830–1841 American Dairy Science Association, 2006.
Prediction of Nitrogen Excretion in Dairy Farms Locatedin North Florida: A Comparison of Three Models1
V. E. Cabrera,*2,3 A. de Vries,† and P. E. Hildebrand‡*School of Natural Resources and Environment,†Department of Animal Sciences, and‡Department of Food and Resource Economics, University of Florida, Gainesville 32611
ABSTRACT
The increasing N concentrations in surface andgroundwater in north Florida emphasize the need toidentify sources of N loss and ways to reduce them. Theamount of N excretion produced by dairy farms anddeposited into the Suwannee River agro-ecosystem isbeing heavily scrutinized by regulatory agencies be-cause it is believed to contribute significantly to thehigh N concentrations in water. Models developed byVan Horn and the USDA-Natural Resource and Conser-vation Service are used to estimate N balances on dairyfarms. This study explores ways to improve these esti-mates by using dynamic simulation of N excretion overtime. The Livestock Dynamic North Florida Dairy Farmmodel (LiDyNoFlo), which was created for this purpose,is described. The amount of N excretion on a dairy farmdepends on crude protein in the diet, milk production,the presence of mature bulls and heifers, and seasonal-ity of production. The LiDyNoFlo considered more vari-ables than earlier models, and estimates of N excretiondiffered from those of other models. Comparisons con-sistently showed the LiDyNoFlo predictions of N excre-tion were between those predicted by the Van Hornmodel (upper end) and the Natural Resource and Con-servation Service model (lower end). The LiDyNoFlopredicted that a 1,000-cow operation produced 324 kgof N excretion/d in February and 307 kg of N excretion/d in August because of seasonal milk production andherd dynamics. Seasonal differences in N excretion areimportant because they determine the opportunity forN recycling in the crop fields such that total N lossesinto the Suwannee River agro-ecosystem may be min-imized.
Received July 27, 2005.Accepted November 17, 2005.1This research was supported by the Florida Agricultural Experi-
ment Station and approved for publication as Journal Series No.R-11060.
2Current affiliation: Agricultural Science Center at Clovis, NewMexico State Univ., Clovis 88101.
3Corresponding author: [email protected]
1830
Key words: environment, simulation, modeling, ni-trogen
INTRODUCTION
The presence of high concentrations of N in wateris an environmental hazard because it affects humanhealth and ecosystem welfare (Fraisse et al., 1996). TheSuwannee River Basin located in north Florida hasreceived much attention since the late 1990s becauseof increased N concentrations in water bodies (Pitmanet al., 1997; Katz et al., 1999; Albert, 2002). Dairy farmshave been identified as an important source of N in theSuwannee River Basin (Andrew, 1994; Katz and deHan, 1996; Berndt et al., 1998). Therefore, reduction ofN deposition from these dairy farms into the SuwanneeRiver Basin is important.
It is important to estimate accurately the amount ofN excretion produced on dairy farms because it directlyimpacts their environmental accountability and costsof complying with regulations. It is also important toestimate N excretion throughout the year because thisdetermines the potential for N recycling and use bycrop fields. It also is important to include N excretedby young stock and mature bulls because they are partof many dairy farm production systems (Cabrera, 2004).About 24% of the dairy farms in north Florida use bulls,varying between 3 and 10% of the total number of cows.Most of them (80%) use AI in addition to natural mating(de Vries and Risco, 2005). Also, 57% of the farmers innorth Florida raise 100% of their heifers, 14% of themdo not keep any heifers, and the rest (29%) raise someproportion in between. The overall average in the areais 55% of heifers raised on farm (Cabrera, 2004).
In Florida, 2 models are currently widely used toestimate the N excreted by dairy cows. One model, pro-posed in several publications by Van Horn et al. (1991,1994, 1998, 2001), consists of a nutrient balancemethod. The Van Horn model estimates the amount ofN excreted by the difference between the quantities ofN consumed and N utilized in milk production, BWgain, and body maintenance. This relatively simple ap-proach bases its predictions of N excretion from only 2
OUR INDUSTRY TODAY 1831
cow categories: milking cows and dry cows. This ap-proach estimates the amount of N entering the dairyfarm as the mass of DM feed consumed multiplied byan average N content factor, and the amount leavingthe dairy farm as the amount of milk producedmultiplied by an N content factor. Differences betweenfeed N input and milk N output provide an estimate ofexcreted N. Van Horn’s nutrient balance approach doesnot account for seasonality of production present onmost north Florida dairy farms.
The other model is presented by the USDA-NaturalResources Conservation Service (NRCS) through aspreadsheet called Water Budget and Nutrient Balancefor Florida (WATNUTFL Version 2.0; Natural Researchand Conservation Service, 2001). This model is basedon BW of ruminants and standard N excretion factors.The application created by the NRCS, the WATNUTFL(Natural Research and Conservation Service, 2001),uses standardized estimates of N excretion based onBW of animals according to the agricultural waste man-agement field handbook (USDA, 1992a, b, c). The NRCSapproach disregards the amount of milk production andthe seasonality of production on dairy farms in northFlorida. This methodology predicts N excretion by usingaverages of only 3 cow categories (milking cows, drycows, and heifers).
Van Horn’s nutrient balance model is used widely bydairy farmers and dairy farm consultants in the studyarea to assist them in the process of obtaining permits.Official agencies, such as the Florida Department ofEnvironmental Protection and NRCS, have the author-ity to approve or reject these permits. The WATNUTFLis the officially approved engineering software of theNRCS (http://www.fl.nrcs.usda.gov/technical/program.html) and is to be used in the design of wastestorage facilities, in the development of nutrient man-agement budgets, and in the certification of conserva-tion practices by dairy farmers in Florida. Conse-quently, the WATNUTFL has official consequences inthe process of authorizing dairy farm permits inFlorida.
Seasonality of cow performance and herd dynamicsaffects N excretion. Reproductive efficiency and milkproduction are typically greater during cooler seasonsof the year (West et al., 2003; de Vries, 2004). Excretionof N is directly impacted by the amount of milk produc-tion because milk production drives feed intake and,therefore, N intake and excretion (Jonker et al., 2002;Nennich et al., 2003). Consequently, a much greaterrate of N excretion is expected during winter months,not only because milking cows are producing more milk,but also because more cows are near their peak milkproduction. Excretion of N produced in mid springwould have more opportunity to be used by rapidly
Journal of Dairy Science Vol. 89 No. 5, 2006
growing crops than that produced in winter when lessN is used by crops. Our study describes the creationof a total N excretion model by expanding previousapproaches. The model presented here is a more refinedmodel that accounts for seasonal cow flows, seasonalpregnancy rates, seasonal culling probabilities, andseasonal milk production to predict N excretion.
The objectives of the present study were 1) to developa model that accurately predicts monthly N excretionfor dairy farm operations and 2) to compare the newmodel with 2 existing models that are widely used fordairy farms located in north Florida.
MATERIALS AND METHODS
Development of the Livestock DynamicNorth Florida Model
General Characteristics. The Livestock DynamicNorth Florida model (LiDyNoFlo) is a dynamic, proba-bilistic Markov-chain simulation model of a herd of cowsthat estimates the N excretion on a whole farm. TheLiDyNoFlo first simulates the herd over time and then,from the herd dynamics, derives total herd N excretion.The default inputs for milk production, culling, andpregnancy rates are based on historical data for Florida(de Vries, 2004). These rates can be adjusted, however,for any dairy farm by inputting user-defined data. Themodel starts in September following north Florida dairyfarm practices and simulates N excretion in monthlysteps for as many years as desired.
Details concerning the most relevant variables usedto estimate N excretion are discussed in the followingsections.
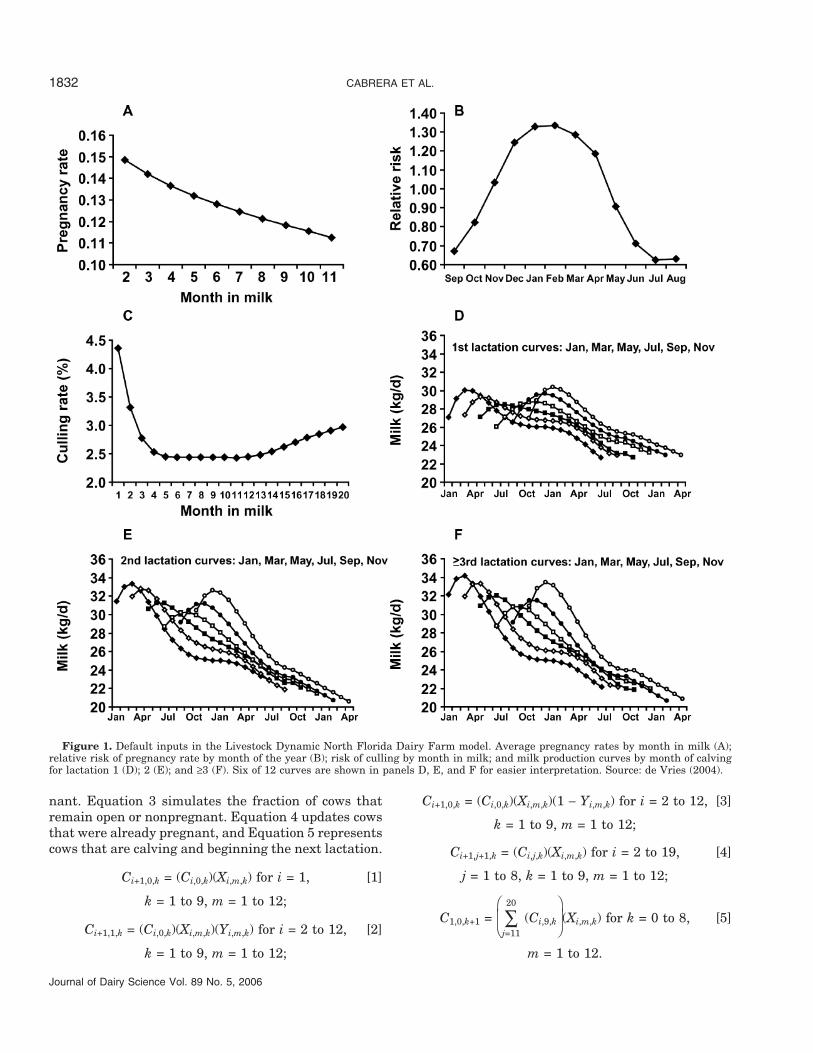
Cow Flow. The LiDyNoFlo simulates cow flow overtime (Ci,j,k) through Markov chains similar to St-Pierreand Jones (2001) and Jalvingh et al. (1994). Animalsare assigned to homogeneous production states in 3-Darrays with coordinates determined by months in milkfor cows or age after birth for heifers (i), month of preg-nancy (j), and lactation number (k). The number of po-tential states is estimated by the product of the individ-ual states: (i = 1 to 32; 1 to 20 for cows and 1 to 32 forheifers) × (j = 0 to 9; 0 for nonpregnant cows) × (k = 0to 9; 0 for heifers) = 3,200. Some nonpossible combina-tions are excluded; for example, a group of cows cannotbe 4 mo in milk and 6 mo pregnant. The variablesXi,m,k and Yi,m,k represent 3-D matrices that include themonthly probability of survival and pregnancy, respec-tively, under north Florida dairy farm conditions (Fig-ure 1, A, B, and C) for cows in a state i, k, m, where mis month of the year (1 to 12), starting in September.
In a given month, Equation 1 simulates the numberof cows during the second month in milk, whereas Equa-tion 2 represents the number of cows that become preg-
CABRERA ET AL.1832
Figure 1. Default inputs in the Livestock Dynamic North Florida Dairy Farm model. Average pregnancy rates by month in milk (A);relative risk of pregnancy rate by month of the year (B); risk of culling by month in milk; and milk production curves by month of calvingfor lactation 1 (D); 2 (E); and ≥3 (F). Six of 12 curves are shown in panels D, E, and F for easier interpretation. Source: de Vries (2004).
nant. Equation 3 simulates the fraction of cows thatremain open or nonpregnant. Equation 4 updates cowsthat were already pregnant, and Equation 5 representscows that are calving and beginning the next lactation.
Ci+1,0,k = (Ci,0,k)(Xi,m,k) for i = 1, [1]
k = 1 to 9, m = 1 to 12;
Ci+1,1,k = (Ci,0,k)(Xi,m,k)(Yi,m,k) for i = 2 to 12, [2]
k = 1 to 9, m = 1 to 12;
Journal of Dairy Science Vol. 89 No. 5, 2006
Ci+1,0,k = (Ci,0,k)(Xi,m,k)(1 − Yi,m,k) for i = 2 to 12, [3]
k = 1 to 9, m = 1 to 12;
Ci+1,j+1,k = (Ci,j,k)(Xi,m,k) for i = 2 to 19, [4]
j = 1 to 8, k = 1 to 9, m = 1 to 12;
C1,0,k+1 =∑20
j=11
(Ci,9,k
(Xi,m,k) for k = 0 to 8, [5]
m = 1 to 12.
OUR INDUSTRY TODAY 1833
Heifers start their reproduction program when theyare 12 mo old. Therefore, Equation 6, which simulatesheifers from 1 to 11 mo of age, does not include a proba-bility of pregnancy. Heifers can become pregnant be-tween 12 and 24 mo (Equation 7) or they can remainopen (Equation 8). Equation 9 simulates the aging ofpregnant heifers.
Ci+1,0,0 = (Ci,0,0)(Xi,m,0) for i = 1 to 11, [6]
m = 1 to 12;
Ci+1,1,0 = (Ci,0,0)(Xi,m,0)(Yi,m,0) for i = 12 to 24, [7]
m =1 to 12;
Ci+1,0,0 = (Ci,0,0)(Xi,m,0)(1 − Yi,m,0) for i = 12 to 24, [8]
m = 1 to 12;
Ci+1,j+1,0 = (Ci,j,0)(Xi,m,0) for i = 12 to 31, [9]
j = 1 to 8, m = 1 to 12.
Cows are culled if they are not pregnant after 12 moin milk. Heifers are culled if they are not pregnantwhen 24 mo of age.
The number of milking cows is calculated by Equation10. The number of dry cows is calculated by Equation11. Cows are assumed to be dry during the last 2 moof their pregnancy. The number of heifers is assumedto be one-half of all births (Equation 12). Depending onfarm management, none, part, or all heifers are kepton the farm. Therefore, the number of heifers is ad-justed by the percentage of heifers raised on the farm(PHR).
MILKINGm = [10]
∑9
k=1∑7
j=0∑18
i=1
Ci,j,k,m for m = 1 to 12;
DRYm = ∑9
k=1∑9
j=8∑18
i=1
Ci,j,k,m for m = 1 to 12; [11]
HEIFERSm =
∑9
j=0∑32
i=1
Ci,j,0
(PHR) +
∑32
j=11
(Ci,9,k)(Xi,m,k)
2 [12]
for k = 1 to 9, m = 1 to 12.
Milk Production. Milk production, Mi,m,k, is takenfrom de Vries (2004) and adjusted by adding a constant
Journal of Dairy Science Vol. 89 No. 5, 2006
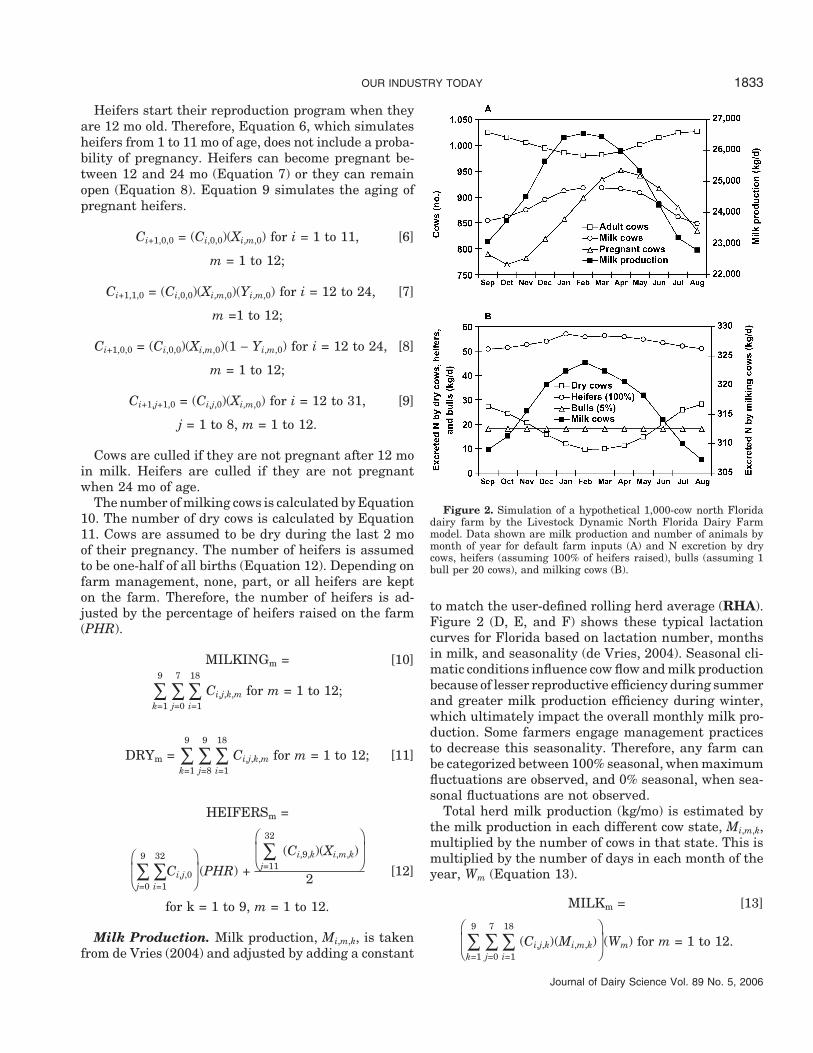
Figure 2. Simulation of a hypothetical 1,000-cow north Floridadairy farm by the Livestock Dynamic North Florida Dairy Farmmodel. Data shown are milk production and number of animals bymonth of year for default farm inputs (A) and N excretion by drycows, heifers (assuming 100% of heifers raised), bulls (assuming 1bull per 20 cows), and milking cows (B).
to match the user-defined rolling herd average (RHA).Figure 2 (D, E, and F) shows these typical lactationcurves for Florida based on lactation number, monthsin milk, and seasonality (de Vries, 2004). Seasonal cli-matic conditions influence cow flow and milk productionbecause of lesser reproductive efficiency during summerand greater milk production efficiency during winter,which ultimately impact the overall monthly milk pro-duction. Some farmers engage management practicesto decrease this seasonality. Therefore, any farm canbe categorized between 100% seasonal, when maximumfluctuations are observed, and 0% seasonal, when sea-sonal fluctuations are not observed.
Total herd milk production (kg/mo) is estimated bythe milk production in each different cow state, Mi,m,k,multiplied by the number of cows in that state. This ismultiplied by the number of days in each month of theyear, Wm (Equation 13).
MILKm = [13]
∑9
k=1∑7
j=0∑18
i=1
(Ci,j,k)(Mi,m,k)(Wm) for m = 1 to 12.
CABRERA ET AL.1834
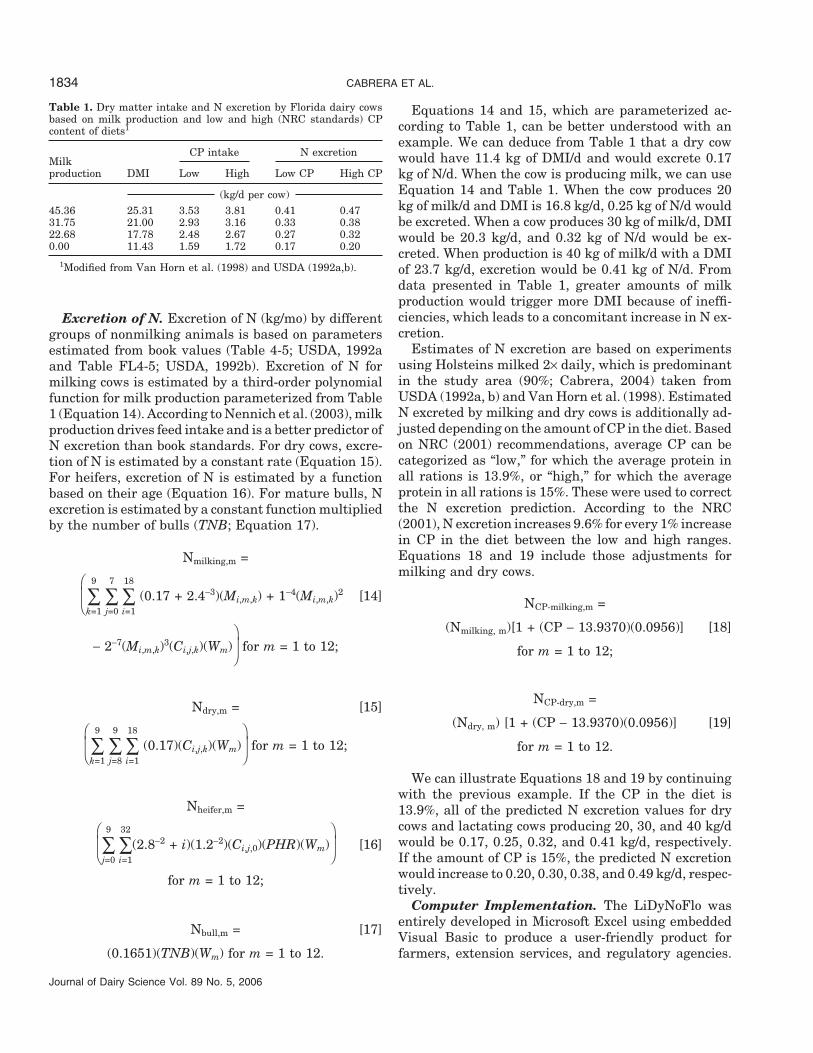
Table 1. Dry matter intake and N excretion by Florida dairy cowsbased on milk production and low and high (NRC standards) CPcontent of diets1
CP intake N excretionMilkproduction DMI Low High Low CP High CP
(kg/d per cow)45.36 25.31 3.53 3.81 0.41 0.4731.75 21.00 2.93 3.16 0.33 0.3822.68 17.78 2.48 2.67 0.27 0.320.00 11.43 1.59 1.72 0.17 0.20
1Modified from Van Horn et al. (1998) and USDA (1992a,b).
Excretion of N. Excretion of N (kg/mo) by differentgroups of nonmilking animals is based on parametersestimated from book values (Table 4-5; USDA, 1992aand Table FL4-5; USDA, 1992b). Excretion of N formilking cows is estimated by a third-order polynomialfunction for milk production parameterized from Table1 (Equation 14). According to Nennich et al. (2003), milkproduction drives feed intake and is a better predictor ofN excretion than book standards. For dry cows, excre-tion of N is estimated by a constant rate (Equation 15).For heifers, excretion of N is estimated by a functionbased on their age (Equation 16). For mature bulls, Nexcretion is estimated by a constant function multipliedby the number of bulls (TNB; Equation 17).
Nmilking,m =
∑9
k=1∑7
j=0∑18
i=1
(0.17 + 2.4−3)(Mi,m,k) + 1−4(Mi,m,k)2 [14]
− 2−7(Mi,m,k)3(Ci,j,k)(Wm)
for m = 1 to 12;
Ndry,m = [15]
∑9
k=1∑9
j=8∑18
i=1
(0.17)(Ci,j,k)(Wm)
for m = 1 to 12;
Nheifer,m =
∑9
j=0∑32
i=1
(2.8−2 + i)(1.2−2)(Ci,j,0)(PHR)(Wm)
[16]
for m = 1 to 12;
Nbull,m = [17]
(0.1651)(TNB)(Wm) for m = 1 to 12.
Journal of Dairy Science Vol. 89 No. 5, 2006
Equations 14 and 15, which are parameterized ac-cording to Table 1, can be better understood with anexample. We can deduce from Table 1 that a dry cowwould have 11.4 kg of DMI/d and would excrete 0.17kg of N/d. When the cow is producing milk, we can useEquation 14 and Table 1. When the cow produces 20kg of milk/d and DMI is 16.8 kg/d, 0.25 kg of N/d wouldbe excreted. When a cow produces 30 kg of milk/d, DMIwould be 20.3 kg/d, and 0.32 kg of N/d would be ex-creted. When production is 40 kg of milk/d with a DMIof 23.7 kg/d, excretion would be 0.41 kg of N/d. Fromdata presented in Table 1, greater amounts of milkproduction would trigger more DMI because of ineffi-ciencies, which leads to a concomitant increase in N ex-cretion.
Estimates of N excretion are based on experimentsusing Holsteins milked 2× daily, which is predominantin the study area (90%; Cabrera, 2004) taken fromUSDA (1992a, b) and Van Horn et al. (1998). EstimatedN excreted by milking and dry cows is additionally ad-justed depending on the amount of CP in the diet. Basedon NRC (2001) recommendations, average CP can becategorized as “low,” for which the average protein inall rations is 13.9%, or “high,” for which the averageprotein in all rations is 15%. These were used to correctthe N excretion prediction. According to the NRC(2001), N excretion increases 9.6% for every 1% increasein CP in the diet between the low and high ranges.Equations 18 and 19 include those adjustments formilking and dry cows.
NCP-milking,m =
(Nmilking, m)[1 + (CP − 13.9370)(0.0956)] [18]
for m = 1 to 12;
NCP-dry,m =
(Ndry, m) [1 + (CP − 13.9370)(0.0956)] [19]
for m = 1 to 12.
We can illustrate Equations 18 and 19 by continuingwith the previous example. If the CP in the diet is13.9%, all of the predicted N excretion values for drycows and lactating cows producing 20, 30, and 40 kg/dwould be 0.17, 0.25, 0.32, and 0.41 kg/d, respectively.If the amount of CP is 15%, the predicted N excretionwould increase to 0.20, 0.30, 0.38, and 0.49 kg/d, respec-tively.
Computer Implementation. The LiDyNoFlo wasentirely developed in Microsoft Excel using embeddedVisual Basic to produce a user-friendly product forfarmers, extension services, and regulatory agencies.
OUR INDUSTRY TODAY 1835
The LiDyNoFlo runs interactively and presents dataand graphic results on the same screen in which it ismanipulated and run.
Characteristics of the Van Horn and NRCS Models
Van Horn Model. The Van Horn model (Van Hornet al., 2001) predicts yearly N excreted (kg of N/yr perherd) by subtracting the amount of N contained in themilk produced and the N used in maintenance from thetotal N input from the feed (Equations 20 and 21).
Nexcreted, milking = Nfeed, milking [20]
− (Nmilk + Nmaintenance, milking);
Nexcreted, dry = Nfeed, dry − Nmaintenance, dry. [21]
The amount of N in feed is calculated by multiplyingDMI (kg/yr per group) by the percentage of CP and bythe percentage of N in the CP (Equation 22). The Nmilk(kg/yr) was calculated as 15.5% of the milk protein con-tent, which is assumed to be 3.25% (Equation 23). TheN for maintenance is a constant factor of 0.0012 kg ofN per cow (Equation 24).
Nfeed, group = (DMIgroup) (%CPgroup) (16%) [22]
for group = milking, dry;
Nmilk = (MILK) (3.25%) (15.5%); [23]
Nmaintenance = 0.0012. [24]
Default DMI values are 19.2 and 11.5 kg/d per cowfor milking and dry cows, respectively. The amount ofmilk produced and CP are user-defined, whereas allother measures are embedded in the model.
NRCS Model. The USDA-NRCS, WATNUTFL ap-plication Version 2.0 (Natural Research and Conserva-tion Service, 2001) predicts yearly N excretion (kg/yrper herd) by multiplying BW of cows by a standard Nexcretion factor (Equations 25, 26, and 27).
Nexcreted, milking = [25]
(WEIGHTmilking)(Nexmilking, CP) for CP = low, high;
Nexcreted, dry = [26]
(WEIGHTdry)(Nexdry, CP) for CP = low, high;
Nexcreted, heifer = (WEIGHTheifer)(Nexheifer) [27]
where weightgroup (kg) is the assumed average weightof all animals in a particular category and Nexgroup is
Journal of Dairy Science Vol. 89 No. 5, 2006
the standard book value (USDA, 1992b) of N excretedby the cow category. For heifers, the N excretion (Nex-heifer) is assumed to be 0.031% of their BW. The N excre-tion of milking and dry cows also depends on theirprotein diet formulation (Nexmilking, CP and Nexdry, CP).For low- and high-protein diets, this is 0.04 and 0.05%for milking cows and 0.03 and 0.03% for dry cows. Thelow- and high-protein diets are based on NRC (2001)standards.
Initial Data
Detailed parameters relative to milk production(Mi,m,k), culling (Xi,m,k), and pregnancy rates (Yi,m,k) wereobtained from de Vries (2004) and are summarized inFigure 1. They were confirmed by a survey of dairyfarms performed in north Florida (Cabrera, 2004).
Experiment: LiDyNoFlo Comparisonwith Van Horn and NRCS Predictions
A hypothetical 1,000-cow north Florida dairy farmwas created using contemporary and local informationfrom a survey (Cabrera, 2004) to compare systemati-cally predicted N excretion by NRCS and Van Hornmodels and by LiDyNoFlo. The 3 models were usedto calculate overall farm N excretion under differentscenarios of CP, milk RHA, confined time, presence ofmature bulls, percentage of heifers raised, seasonalityof operation, and weight of cows. Levels of comparisonand default values for each one of these factors aresummarized in Table 2. All comparisons were per-formed with respect to the overall farm amount of Nexcreted (kg per farm) with the assumption of no losses.
Levels of the factors involved in a comparison werechanged one at a time, and default values were heldfor all of the other factors. A combination of all defaultlevels of factors in Table 2 describes the hypotheticalfarm: high-CP, RHA = 9,000 kg of milk, 0% heifersraised on farm, 0% mature bulls, 100% seasonal opera-tion, and BW = 635 kg per cow.
RESULTS
Simulation of Individual Cow States by LiDyNoFlo
Table 3 presents N excretion per cow per day usingLiDyNoFlo for specific cow states. Excretion of N isdirectly impacted by milk production, protein contentin diet, and age. Dry cows excrete less N than lactatingcows, an amount slightly greater than those of bulls.
Simulation of the Hypothetical Farm by LiDyNoFlo
The LiDyNoFlo begins by assigning all 1,000 cows tothe same state, C1,0,1 (first month in milk, nonpregnant,
CABRERA ET AL.1836
Table 2. Default values and compared levels in a hypothetical 1,000-cow north Florida dairy farm
Farm factor Default Compared levels
CP (% of DMI) 15.0 (high) 13.9 (low); 15.0 (high)Rolling herd average (kg/yr) 9,000 8,000, 9,000, 10,000Percentage of heifers raised (% of born) 0 0, 50, 100Percentage of mature bulls (% of total cows) 0 0, 5, 10Seasonality of operation (%) 100 0, 50, 100BW of cows (kg) 635 550, 635, 700
first lactation) and then populating all cow and heiferstates. The LiDyNoFlo reaches steady state of cow flowafter 132 mo. This steady state implies that the averagenumber of cows per year is 1,000, although small varia-tions in cow numbers exist over time. The model re-places culled cows and sells excess animals to maintainherd size; however, independent seasonal pregnancy(Yi,m,k) and culling (Xi,m,k) rates, together with a lag timebetween replacement (heifer) and culled animal (cow),cause small variations. These seasonal changes in cowflow are presented in Figure 2 for a 100% seasonal farm.Figure 2A shows slight variation in the total numberof cows through the year: 980 in February to 1,026in August for the 1,000-cow herd. Milking cows andpregnant cows had more seasonal variations; both in-creased in number toward winter and spring monthsand decreased toward summer and fall months. Num-ber of milking cows reached its peak during Februaryand March (920 cows); more pregnant cows were ob-served in April (950 cows). In addition to seasonalityof milking cow numbers, milk production is also directlyimpacted by seasonal milk production patterns. Figure2A also shows seasonal milk production for the herdthat reached its maximum during February (26,800 kgof milk/d) and its minimum in August (22,790 kg ofmilk/d).
Figure 2B presents the N excreted by dry cows, heif-ers (assuming 100% of heifers raised), bulls (assuming5% of bulls raised), and milking cows. The N excreted
Table 3. Excretion of N per cow as predicted by the Livestock Dy-namic North Florida Dairy farm model
Low High AverageAnimal category CP CP CP DMI
(kg/d per cow)Lactating at 40 kg of milk/d 0.41 0.49 0.45 23.68Lactating at 30 kg of milk/d 0.32 0.38 0.35 20.34Lactating at 20 kg of milk/d 0.25 0.30 0.28 16.83All lactating cows 0.33 0.39 0.36 20.28Dry cows 0.17 0.20 0.18 11.43Heifers (20 mo) NA1 NA 0.12 7.62Heifers (15 mo) NA NA 0.09 6.02Calves (5 mo) NA NA 0.04 2.83Bulls NA NA 0.17 11.43
1NA = not applicable.
Journal of Dairy Science Vol. 89 No. 5, 2006
by heifers was substantially greater than the N ex-creted by dry cows (19,590 vs. 6,680 kg of N/yr). The Nexcreted by dry cows had more seasonal variation, andit had an inverse pattern to the N excreted by heifersbecause the number of dry cows varied inversely withthe number of heifers (Figure 2A). The N excreted bydry cows had its peak in August (28 kg/d) and its mini-mum in February and March (10 kg/d). The N excretedby heifers reached its maximum in January (57 kg/d)and its minimum in August and September (51 kg/d).The N excreted by milking cows alone was substantiallygreater than the N excreted by all other combinedgroups. In February, this was 324 kg/d compared with84 kg/d for all other groups; in August, this was 307kg/d compared with 97 kg/d for all other groups.
LiDyNoFlo Comparison with NRCSand Van Horn Models
A major difference and a major consistency amongmodels were noticed in the following comparisons. Themajor difference and advantage was that only LiDy-NoFlo predicted seasonality or monthly variations inN excreted. The major consistency was that overall pre-dictions from LiDyNoFlo were close and varied simi-larly with the other 2 models.
Comparisons Regarding CP. As expected, N ex-creted varied in direct relationship with the amount ofCP in the diet. The proportion of this change, however,varied among models. Compared with the default val-ues with high CP, the amount of N excreted decreased12.7% in the Van Horn model, 9.6% in LiDyNoFlo, and16.3% in the NRCS model, when the CP was assumedto be low. The annual totals by the 3 models with highCP were relatively closer (120.6, 116.0, and 111.5 tonne/yr) than with low CP (108.8, 105.9, and 95.7 tonne/yr;Figure 3). With both CP amounts, LiDyNoFlo estimateswere between the predictions of the other 2 models. TheVan Horn model predicted the greatest amounts of Nexcretion: 330 and 298 kg/d for high- and low-proteindiets, whereas the NRCS predicted the least amounts:305 and 262 kg/d for high- and low-protein diets, respec-tively.
The LiDyNoFlo estimates were closer to the VanHorn model with low CP and closer to the NRCS model
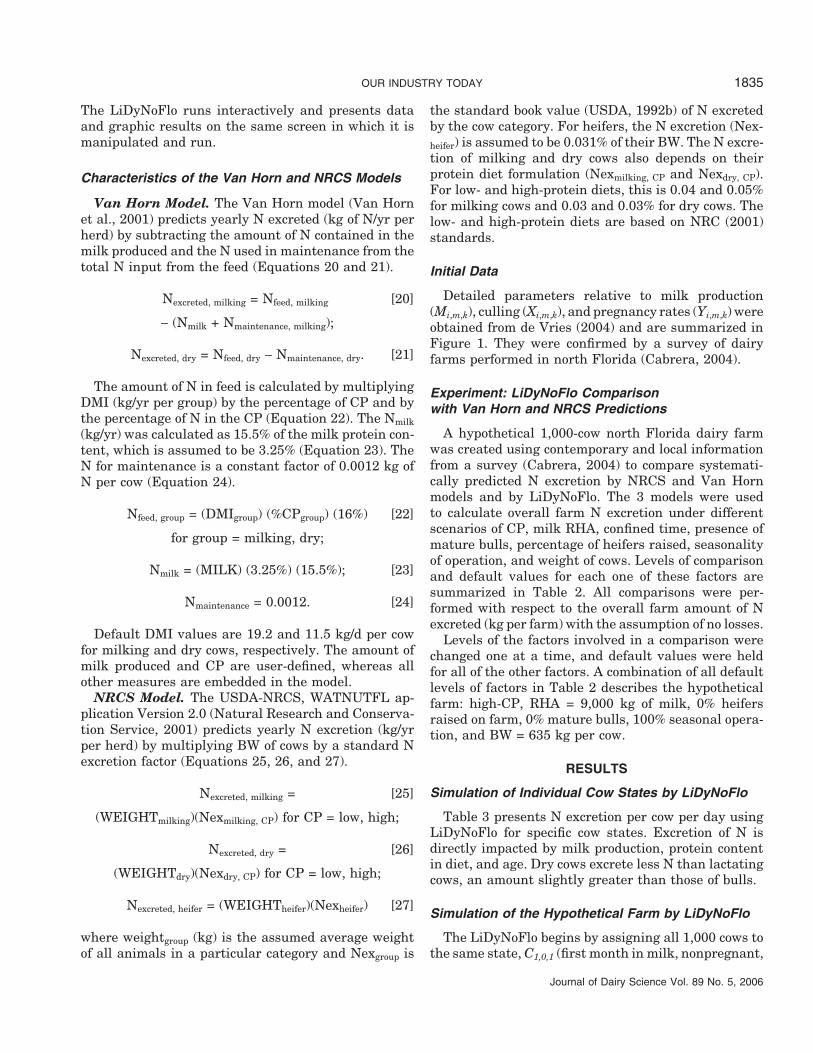
OUR INDUSTRY TODAY 1837
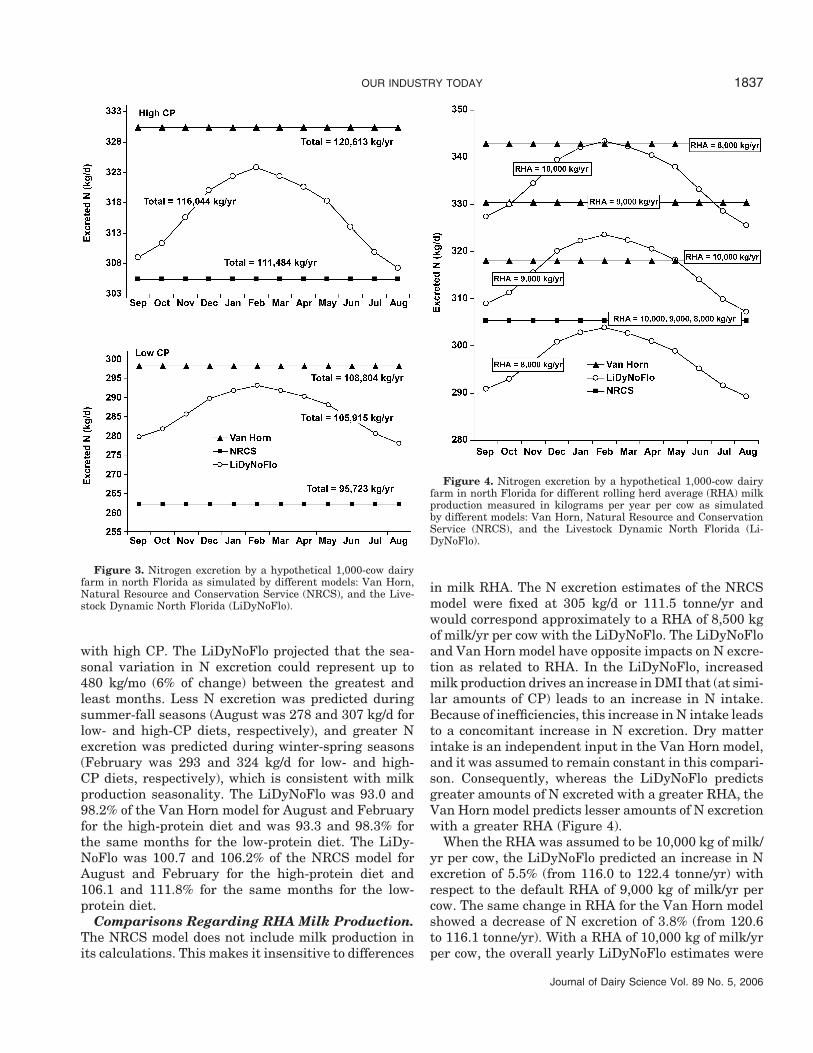
Figure 3. Nitrogen excretion by a hypothetical 1,000-cow dairyfarm in north Florida as simulated by different models: Van Horn,Natural Resource and Conservation Service (NRCS), and the Live-stock Dynamic North Florida (LiDyNoFlo).
with high CP. The LiDyNoFlo projected that the sea-sonal variation in N excretion could represent up to480 kg/mo (6% of change) between the greatest andleast months. Less N excretion was predicted duringsummer-fall seasons (August was 278 and 307 kg/d forlow- and high-CP diets, respectively), and greater Nexcretion was predicted during winter-spring seasons(February was 293 and 324 kg/d for low- and high-CP diets, respectively), which is consistent with milkproduction seasonality. The LiDyNoFlo was 93.0 and98.2% of the Van Horn model for August and Februaryfor the high-protein diet and was 93.3 and 98.3% forthe same months for the low-protein diet. The LiDy-NoFlo was 100.7 and 106.2% of the NRCS model forAugust and February for the high-protein diet and106.1 and 111.8% for the same months for the low-protein diet.
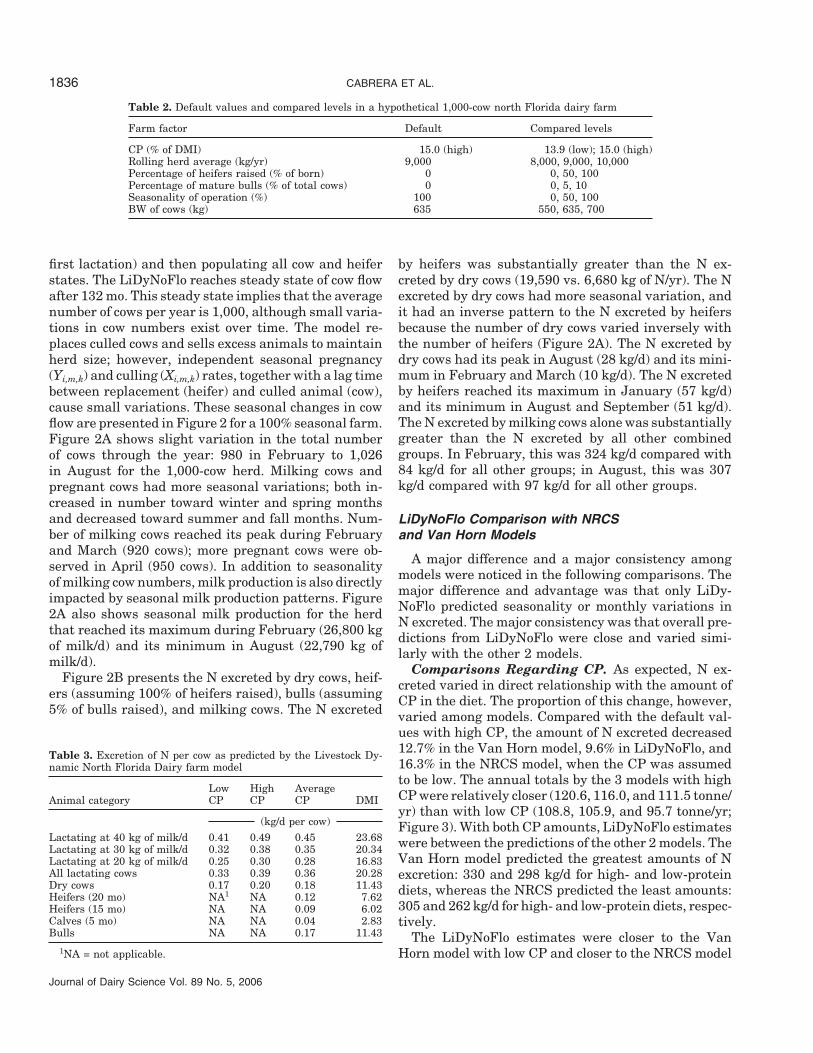
Comparisons Regarding RHA Milk Production.The NRCS model does not include milk production inits calculations. This makes it insensitive to differences
Journal of Dairy Science Vol. 89 No. 5, 2006
Figure 4. Nitrogen excretion by a hypothetical 1,000-cow dairyfarm in north Florida for different rolling herd average (RHA) milkproduction measured in kilograms per year per cow as simulatedby different models: Van Horn, Natural Resource and ConservationService (NRCS), and the Livestock Dynamic North Florida (Li-DyNoFlo).
in milk RHA. The N excretion estimates of the NRCSmodel were fixed at 305 kg/d or 111.5 tonne/yr andwould correspond approximately to a RHA of 8,500 kgof milk/yr per cow with the LiDyNoFlo. The LiDyNoFloand Van Horn model have opposite impacts on N excre-tion as related to RHA. In the LiDyNoFlo, increasedmilk production drives an increase in DMI that (at simi-lar amounts of CP) leads to an increase in N intake.Because of inefficiencies, this increase in N intake leadsto a concomitant increase in N excretion. Dry matterintake is an independent input in the Van Horn model,and it was assumed to remain constant in this compari-son. Consequently, whereas the LiDyNoFlo predictsgreater amounts of N excreted with a greater RHA, theVan Horn model predicts lesser amounts of N excretionwith a greater RHA (Figure 4).
When the RHA was assumed to be 10,000 kg of milk/yr per cow, the LiDyNoFlo predicted an increase in Nexcretion of 5.5% (from 116.0 to 122.4 tonne/yr) withrespect to the default RHA of 9,000 kg of milk/yr percow. The same change in RHA for the Van Horn modelshowed a decrease of N excretion of 3.8% (from 120.6to 116.1 tonne/yr). With a RHA of 10,000 kg of milk/yrper cow, the overall yearly LiDyNoFlo estimates were
CABRERA ET AL.1838
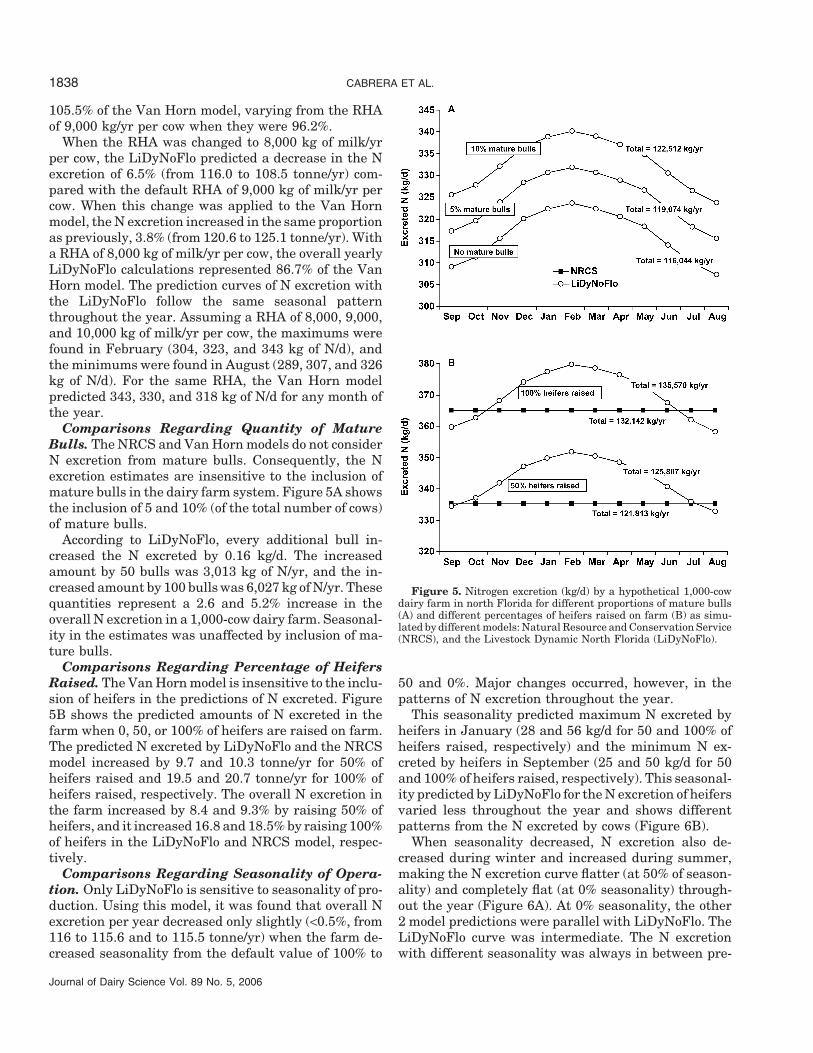
105.5% of the Van Horn model, varying from the RHAof 9,000 kg/yr per cow when they were 96.2%.
When the RHA was changed to 8,000 kg of milk/yrper cow, the LiDyNoFlo predicted a decrease in the Nexcretion of 6.5% (from 116.0 to 108.5 tonne/yr) com-pared with the default RHA of 9,000 kg of milk/yr percow. When this change was applied to the Van Hornmodel, the N excretion increased in the same proportionas previously, 3.8% (from 120.6 to 125.1 tonne/yr). Witha RHA of 8,000 kg of milk/yr per cow, the overall yearlyLiDyNoFlo calculations represented 86.7% of the VanHorn model. The prediction curves of N excretion withthe LiDyNoFlo follow the same seasonal patternthroughout the year. Assuming a RHA of 8,000, 9,000,and 10,000 kg of milk/yr per cow, the maximums werefound in February (304, 323, and 343 kg of N/d), andthe minimums were found in August (289, 307, and 326kg of N/d). For the same RHA, the Van Horn modelpredicted 343, 330, and 318 kg of N/d for any month ofthe year.
Comparisons Regarding Quantity of MatureBulls. The NRCS and Van Horn models do not considerN excretion from mature bulls. Consequently, the Nexcretion estimates are insensitive to the inclusion ofmature bulls in the dairy farm system. Figure 5A showsthe inclusion of 5 and 10% (of the total number of cows)of mature bulls.
According to LiDyNoFlo, every additional bull in-creased the N excreted by 0.16 kg/d. The increasedamount by 50 bulls was 3,013 kg of N/yr, and the in-creased amount by 100 bulls was 6,027 kg of N/yr. Thesequantities represent a 2.6 and 5.2% increase in theoverall N excretion in a 1,000-cow dairy farm. Seasonal-ity in the estimates was unaffected by inclusion of ma-ture bulls.
Comparisons Regarding Percentage of HeifersRaised. The Van Horn model is insensitive to the inclu-sion of heifers in the predictions of N excreted. Figure5B shows the predicted amounts of N excreted in thefarm when 0, 50, or 100% of heifers are raised on farm.The predicted N excreted by LiDyNoFlo and the NRCSmodel increased by 9.7 and 10.3 tonne/yr for 50% ofheifers raised and 19.5 and 20.7 tonne/yr for 100% ofheifers raised, respectively. The overall N excretion inthe farm increased by 8.4 and 9.3% by raising 50% ofheifers, and it increased 16.8 and 18.5% by raising 100%of heifers in the LiDyNoFlo and NRCS model, respec-tively.
Comparisons Regarding Seasonality of Opera-tion. Only LiDyNoFlo is sensitive to seasonality of pro-duction. Using this model, it was found that overall Nexcretion per year decreased only slightly (<0.5%, from116 to 115.6 and to 115.5 tonne/yr) when the farm de-creased seasonality from the default value of 100% to
Journal of Dairy Science Vol. 89 No. 5, 2006
Figure 5. Nitrogen excretion (kg/d) by a hypothetical 1,000-cowdairy farm in north Florida for different proportions of mature bulls(A) and different percentages of heifers raised on farm (B) as simu-lated by different models: Natural Resource and Conservation Service(NRCS), and the Livestock Dynamic North Florida (LiDyNoFlo).
50 and 0%. Major changes occurred, however, in thepatterns of N excretion throughout the year.
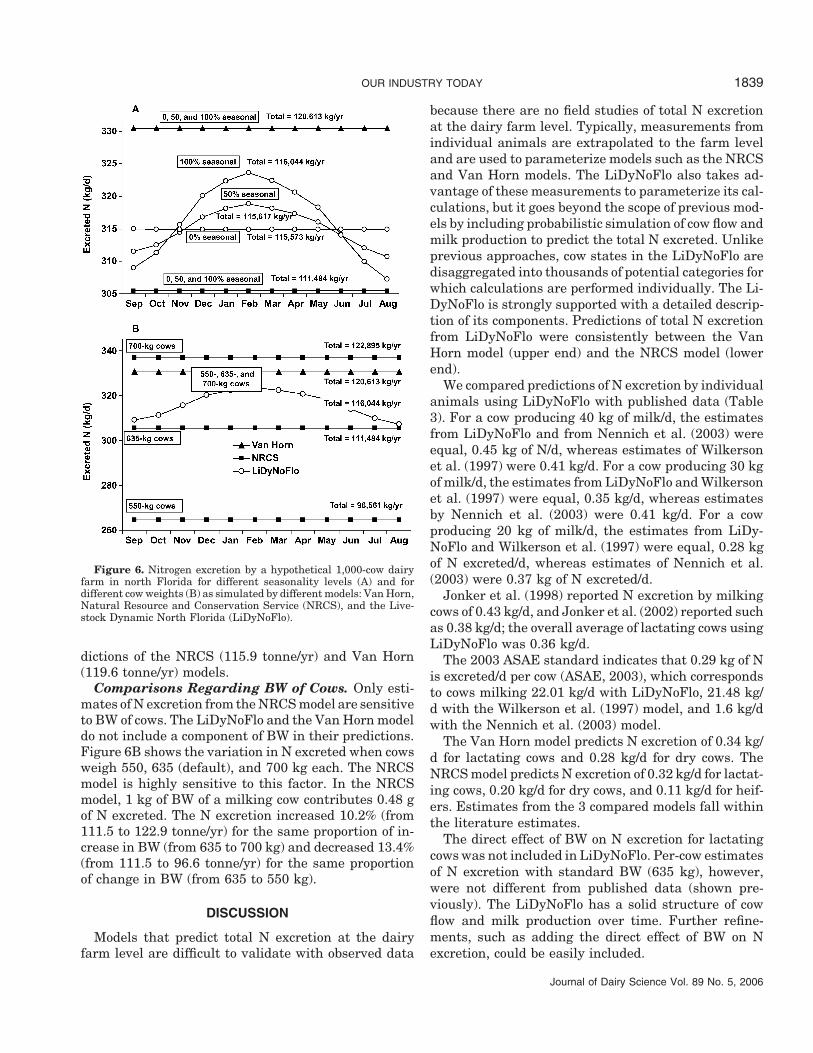
This seasonality predicted maximum N excreted byheifers in January (28 and 56 kg/d for 50 and 100% ofheifers raised, respectively) and the minimum N ex-creted by heifers in September (25 and 50 kg/d for 50and 100% of heifers raised, respectively). This seasonal-ity predicted by LiDyNoFlo for the N excretion of heifersvaried less throughout the year and shows differentpatterns from the N excreted by cows (Figure 6B).
When seasonality decreased, N excretion also de-creased during winter and increased during summer,making the N excretion curve flatter (at 50% of season-ality) and completely flat (at 0% seasonality) through-out the year (Figure 6A). At 0% seasonality, the other2 model predictions were parallel with LiDyNoFlo. TheLiDyNoFlo curve was intermediate. The N excretionwith different seasonality was always in between pre-
OUR INDUSTRY TODAY 1839
Figure 6. Nitrogen excretion by a hypothetical 1,000-cow dairyfarm in north Florida for different seasonality levels (A) and fordifferent cow weights (B) as simulated by different models: Van Horn,Natural Resource and Conservation Service (NRCS), and the Live-stock Dynamic North Florida (LiDyNoFlo).
dictions of the NRCS (115.9 tonne/yr) and Van Horn(119.6 tonne/yr) models.
Comparisons Regarding BW of Cows. Only esti-mates of N excretion from the NRCS model are sensitiveto BW of cows. The LiDyNoFlo and the Van Horn modeldo not include a component of BW in their predictions.Figure 6B shows the variation in N excreted when cowsweigh 550, 635 (default), and 700 kg each. The NRCSmodel is highly sensitive to this factor. In the NRCSmodel, 1 kg of BW of a milking cow contributes 0.48 gof N excreted. The N excretion increased 10.2% (from111.5 to 122.9 tonne/yr) for the same proportion of in-crease in BW (from 635 to 700 kg) and decreased 13.4%(from 111.5 to 96.6 tonne/yr) for the same proportionof change in BW (from 635 to 550 kg).
DISCUSSION
Models that predict total N excretion at the dairyfarm level are difficult to validate with observed data
Journal of Dairy Science Vol. 89 No. 5, 2006
because there are no field studies of total N excretionat the dairy farm level. Typically, measurements fromindividual animals are extrapolated to the farm leveland are used to parameterize models such as the NRCSand Van Horn models. The LiDyNoFlo also takes ad-vantage of these measurements to parameterize its cal-culations, but it goes beyond the scope of previous mod-els by including probabilistic simulation of cow flow andmilk production to predict the total N excreted. Unlikeprevious approaches, cow states in the LiDyNoFlo aredisaggregated into thousands of potential categories forwhich calculations are performed individually. The Li-DyNoFlo is strongly supported with a detailed descrip-tion of its components. Predictions of total N excretionfrom LiDyNoFlo were consistently between the VanHorn model (upper end) and the NRCS model (lowerend).
We compared predictions of N excretion by individualanimals using LiDyNoFlo with published data (Table3). For a cow producing 40 kg of milk/d, the estimatesfrom LiDyNoFlo and from Nennich et al. (2003) wereequal, 0.45 kg of N/d, whereas estimates of Wilkersonet al. (1997) were 0.41 kg/d. For a cow producing 30 kgof milk/d, the estimates from LiDyNoFlo and Wilkersonet al. (1997) were equal, 0.35 kg/d, whereas estimatesby Nennich et al. (2003) were 0.41 kg/d. For a cowproducing 20 kg of milk/d, the estimates from LiDy-NoFlo and Wilkerson et al. (1997) were equal, 0.28 kgof N excreted/d, whereas estimates of Nennich et al.(2003) were 0.37 kg of N excreted/d.
Jonker et al. (1998) reported N excretion by milkingcows of 0.43 kg/d, and Jonker et al. (2002) reported suchas 0.38 kg/d; the overall average of lactating cows usingLiDyNoFlo was 0.36 kg/d.
The 2003 ASAE standard indicates that 0.29 kg of Nis excreted/d per cow (ASAE, 2003), which correspondsto cows milking 22.01 kg/d with LiDyNoFlo, 21.48 kg/d with the Wilkerson et al. (1997) model, and 1.6 kg/dwith the Nennich et al. (2003) model.
The Van Horn model predicts N excretion of 0.34 kg/d for lactating cows and 0.28 kg/d for dry cows. TheNRCS model predicts N excretion of 0.32 kg/d for lactat-ing cows, 0.20 kg/d for dry cows, and 0.11 kg/d for heif-ers. Estimates from the 3 compared models fall withinthe literature estimates.
The direct effect of BW on N excretion for lactatingcows was not included in LiDyNoFlo. Per-cow estimatesof N excretion with standard BW (635 kg), however,were not different from published data (shown pre-viously). The LiDyNoFlo has a solid structure of cowflow and milk production over time. Further refine-ments, such as adding the direct effect of BW on Nexcretion, could be easily included.
CABRERA ET AL.1840
Different ways exist for milk production to impact Nexcretion among the 3 models. According to the VanHorn model, the greater the milk production, thegreater the amount of N exported with that milk, andtherefore, the less N excreted (DMI is assumed to re-main constant). Using LiDyNoFlo, increased milk pro-duction is associated with increased DMI and, there-fore, increased CP and N intake. Because of inefficienc-ies, this increase in N intake leads to a concomitantincrease in N excretion (Wilkerson et al., 1997; Nennichet al., 2003). Jonker et al. (1998) integrated N intakeand milk N to predict N excretion in a nutrient balance:N excreted = N intake − N in milk produced (assumingbody maintenance is negligible). Consequently, at a con-stant DMI, the effect of increased milk production willdecrease the N excreted. This is not a very realisticsituation because increased milk production will usu-ally be achieved via increased DMI. The LiDyNoFlo hasanother approach: DMI and N excretion are functionsof milk production in each cow state (Nennich et al.,2005). Consequently, the effect of increased milk pro-duction will be increased DMI, which because of ineffi-ciencies, will lead to greater amounts of N excretion.
Amounts of N excretion by mature bulls and heifersare important in whole dairy farm accountability of N,and they should not be disregarded. The LiDyNoFloallows for including both mature bulls and heifers. Theeffect of 10% (of total cows) of bulls increased theamount of N excretion by 18 kg of N/d or 6,570 kg ofN/yr. The effect of raising heifers, using LiDyNoFlo,increased the amount of N excretion by 55 kg of N/d or20,075 kg of N/yr. Exclusion of heifers and bulls mayunderestimate total farm N excretion by 18%.
Because of seasonal climatic changes, seasonality inproduction occurs naturally and should be accountedfor because it impacts N excretion over time. The LiDy-NoFlo is the only model that accounts for this seasonal-ity in N excretion. A case of 100% seasonality is theclosest to real conditions, when peak milk production(Figure 2) and peak N excretion occur in February (Fig-ure 3).
The LiDyNoFlo is a combination of complexity andfunctionality in a model that reflects major critical char-acteristics of farms such as dynamic cow flow and milkproduction with end-user friendliness. It is a practicaltool for producers, consultants, and policy makers. TheLiDyNoFlo takes advantage of the simplicity of previ-ous approaches (Van Horn and NRCS) and a new bodyof literature that demonstrates that milk production isthe major predictor of N excretion (Nennich et al., 2003).
Total N excretion on dairy farms impacts total Nlosses from the farm, and consequently, this affectsground and surface water quality. Predictions of N ex-
Journal of Dairy Science Vol. 89 No. 5, 2006
cretion at the farm scale are the first step to understandand evaluate environmental impacts.
The LiDyNoFlo has been integrated with crop growthand decision models to propose management strategiesthat would be economically feasible and environmen-tally sustainable, as shown in Cabrera et al. (2005).The innovative seasonality component of LiDyNoFlomakes that integration possible. The main means ofrecycling excreted N is through fertilization of crops.Opportunity to use this excreted N is highly dependenton field crops, which are seasonal. For example, greaterrisks of N loss exist during winter because, during thisseason, there is greater N excretion and less crop Ndemand. In addition, the seasonal structure of the LiDy-NoFlo allows accounting for interannual seasonal cli-mate variability for anticipating management strate-gies according to climate forecasts as in the case ofEl Nino, Neutral, or La Nina years (Cabrera et al.,accepted). In addition, by using the structure of theLiDyNoFlo, it is possible to simulate changes in herdsize over time and evaluate their environmental conse-quences.
CONCLUSIONS
A user-friendly model that accurately estimates sea-sonal N excretion on north Florida dairy farms wasdeveloped, the LiDyNoFlo. The LiDyNoFlo estimatestotal farm N excretion per month of year. In contrastto the other 2 N excretion models widely used in Florida(NRCS, 2001; Van Horn et al., 2001), the LiDyNoFloaccounts for dynamic cow flow and seasonality of opera-tion. On a per-cow basis, predictions of the LiDyNoFlowere very close to others (Wilkerson et al., 1997; Nen-nich et al., 2003). Comparisons of the LiDyNoFlo predic-tions with the other 2 models showed differences be-tween 3 and 10%. The LiDyNoFlo consistently pre-dicted in between the Van Horn (upper end) and theNRCS (lower end) models. Further research should beundertaken to verify LiDyNoFlo predictions with fielddata. Additional refinements of the LiDyNoFlo shouldinclude additional variables such as BW and indepen-dent amounts of CP by cow states.
REFERENCES
Albert, M. 2002. Monitoring and modeling the fate and transportof nitrate in the vadose zone beneath a Suwannee River basinvegetable farm. M.S. Thesis, Univ. Florida, Gainesville.
American Society of Agriculture Engineers. 2003. Manure productionand characteristics. ASAE Standards D384.1. ASAE, St. Jo-seph, MI.
Andrew, W. J. 1994. Nitrate in ground water and spring water nearfour dairy farms in North Florida 1990–1993. Water-ResourcesInvestigations Rep. 94-4162. U.S. Geological Survey, Tallahas-see, FL.
OUR INDUSTRY TODAY 1841
Berndt, M. P., H. H. Hatzell, C. A. Crabdall, M. Turtora, J. R. Pitman,and E. T. Oaksbord. 1998. Water quality in the Georgia-Floridacoastal plain, Georgia and Florida, 1992–1996. Circ. 1151. U.S.Geological Survey, Reston, VA.
Cabrera, V. E. 2004. Modeling North Florida dairy farm managementstrategies to alleviate ecological impacts under varying climaticconditions: An interdisciplinary approach. Ph.D. Diss., Univ. Flor-ida, Gainesville.
Cabrera, V. E., N. E. Breuer, P. E. Hildebrand, and D. Letson. 2005.The dynamic north-Florida dairy farm model: A user-friendlycomputerized tool for increasing profits while minimizing envi-ronmental impacts. Comput. Electron. Agric. 49:286–308.
Cabrera, V. E., P. E. Hildebrand, J. W. Jones, D. Letson, and A. deVries. 2006. An integrated North Florida dairy farm model toreduce environmental impacts under seasonal climate variability.Agric. Ecosyst. Environ. 113:82–97.
de Vries, A. 2004. Economic value of delayed replacement when cowperformance is seasonal. J. Dairy Sci. 87:2947–2958.
de Vries, A., and C. A. Risco. 2005. Trends and seasonality of reproduc-tive performance in Florida and Georgia herds from 1976 to 2002.J. Dairy Sci. 88:3155–3165.
Fraisse, C. W., K. L. Campbell, and J. W. Jones, and W G. Boggess.1996. GIDM: A GIS-based model for dairy waste managementanalysis. Proc. Am. Water Resource Assoc. Symp. on GIS andWater Resources, Ft. Lauderdale, FL. Available: http://awra.org/proceedings/gis32/fraisse/ Accessed June 18, 2004.
Jalvingh, A. W., A. A. Dijkhuizen, and J. A. M. Van Arendonk. 1994.Optimizing the herd calving pattern with linear programmingand dynamic probabilistic simulation. J. Dairy Sci. 77:1719–1730.
Jonker, J. S., R. A. Kohn, and R. A. Erdman. 1998. Using milk ureanitrogen to predict nitrogen excretion and utilization efficiencyin lactating dairy cows. J. Dairy Sci. 81:2681–2692.
Jonker, J. S., R. A. Kohn, and J. High. 2002. Dairy herd managementpractices that impact nitrogen utilization efficiency. J. Dairy Sci.85:1218–1226.
Katz, B. G., and R. S. de Han. 1996. The Suwannee River basin pilotstudy: Issues for watershed management in Florida. Fact SheetFS-080-96. U.S. Geological Survey, Reston, VA.
Katz, B., D. Hornsby, F. Bohlke, and M. Mokray. 1999. Sources andchronology of nitrate contamination in spring waters, SuwanneeRiver Basin, Florida. Water-Resources Investigations Rep. 99-4252. U.S. Geological Survey, Tallahassee, FL.
NRC. 2001. Nutrient Requirement of Dairy Cattle. 7th ed. Natl. Acad.Sci., Washington, DC.
Natural Research and Conservation Service. 2001. Water Budget andNutrient Balance Worksheet, WATNUTFL Version 2.0. Part 650.Engineering Field Handbook. 210-VI-EFH. NRCS, Gainesville,FL.
Journal of Dairy Science Vol. 89 No. 5, 2006
Nennich, T., J. H. Harrison, D. Meyer, W. P. Weiss, A. J. Heinrichs,R. L. Kincaid, W. J. Powers, R. K. Koelsch, and P. E. Wright. 2003.Development of standard methods of estimate manure productionand nutrient characteristics from dairy cattle. Pages 263–268in Proc. 9th Int. Symp. Anim., Agric. Food Processing Wastes,Raleigh, NC.
Nennich, T., J. H. Harrison, L. M. VanWieringen, D. Meyer, A. J.Heinrichs, W. P. Weiss, N. R. St-Pierre, R. L. Kincaid, D. L.Davidson, and P. E. Wright. 2005. Prediction of manure andnutrient excretion from dairy cattle. J. Dairy Sci. 88:3721–3733.
Pitman, J. R., H. H. Hatzell, and E. T. Oaksford. 1997. Spring contri-butions to water quantity and nitrate loads in the SuwanneeRiver during base flow in July 1995. Water-Resources Investiga-tions Rep. 97-4152. U.S. Geological Survey, Tallahassee, FL.
St-Pierre, N. R., and L. R. Jones. 2001. Forecasting herd structureand milk production for production risk management. J. DairySci. 84:1805–1813.
USDA. 1992a. Agricultural Waste Management Field Handbook,Chapter 4: Agricultural Waste Characteristics. 210-VI-NEH-651.04. Soil Conservation Service, Washington, DC.
USDA. 1992b. Agricultural Waste Management Field Handbook,Chapter 4: Agricultural Waste Characteristics. 210-VI-NEH-651.04. Amendment FL-9, FL651.1004(f). Soil Conservation Ser-vice, Tallahassee, FL.
USDA. 1992c. Agricultural Waste Management Field Handbook,Chapter 6: Role of Plants in Waste Management. 210-VI-NEH-651.06. Soil Conservation Service, Washington, DC.
Van Horn, H. H., G. L. Newton, G. Kidder, E. C. French, and R. A.Nordstedt. 2001. Managing dairy manure accountability: Work-sheets for nutrient budgeting. Coop. Ext. Serv. Circ. 1196. Univ.Florida, Gainesville.
Van Horn, H. H., G. L. Newton, R. A. Nordstedt, E. C. French, G.Kidder, D. A. Graetz, and C. F. Chambliss. 1998. Dairy manuremanagement: Strategies for recycling nutrients for recover fertil-izer value and avoid environmental pollution. Coop. Ext. Serv.Circ. 1091. Univ. Florida, Gainesville.
Van Horn. H. H., R. A. Nordstedt, A. V. Bottcher, E. A. Hanlon, D. A.Graetz, and C. F. Chambliss. 1991. Dairy manure management:Strategies for recycling nutrients to recover fertilizer value andavoid environmental pollution. Coop. Ext. Serv. Circ. 1016. Univ.Florida, Gainesville, FL.
Van Horn, H. H., A. C. Wilkie, W. J. Powers, and R. A. Nordstedt.1994. Components of dairy manure management systems. J.Dairy Sci. 77:2008–2030.
West, J. W., B. G. Mullinix, and J. K. Bernard. 2003. Effects of hot,humid weather on milk temperature, dry matter intake, and milkyield of lactating dairy cows. J. Dairy Sci. 86:232–242.
Wilkerson, V. A., D. R. Mertens, and D. P. Casper. 1997. Predictionof excretion of manure and nitrogen by Holstein dairy cattle. J.Dairy Sci. 80:3193–3204.


