Embed Size (px)
Citation preview

147Soldagem Insp. São Paulo, Vol. 14, No. 2, p.002-010, Abr/Jun 2008
Prediction of Percentage of Ferrite as a Function of Heat Input in Gas Metal Arc Welding of Duplex Stainless Steel SAF2205 Weldments
(Predicción del Porcentaje de Ferrita en función de la variación del Calor Aportado utilizando el proceso de Gas Arco Metal en las soldaduras de acero inoxidable Dúplex SAF 2205)
María Carolina Payares-Asprino1, R.W. Evans2, Stephen Liu3
1 Universidad Simón Bolívar, Mechanical Department, Caracas, Edo. Miranda, Venezuela, [email protected] University of Wales, Swansea, Materials Engineering Department, Swansea, Wales, UK, [email protected]
3 Colorado School of Mines, Metallurgical & Materials Engineering Department, Golden U.S.A., [email protected]
Abstract
Generally the quality of a weld joint is strongly influenced by parameters during welding process. To achieve high quality welds mathematical models that can predict the bead geometry for obtaining the desired mechanical properties of the weldment has been developed. This paper focuses on determining the percentage of ferrite in GMAW welds of duplex stainless steel SAF 2205. Previously established models for the prediction of weld bead geometry were applied. The values of weld penetration and reinforcement were calculated using statistical approach and applying the rule of mixture, and using the Schaeffler diagram. The amounts of ferrite in the duplex stainless steel welds were determined and compared with experimentally-determined ones. The results show that the developed models for predicting weld bead geometry can also be applied to estimate the percentage of ferrite in the duplex stainless steel weldments.
Key-words: Duplex Stainless Steel Welding. GMAW Welding. Weld penetration. Weld reinforcement. Fused Base Material. Bead Morphology. Statistical Model, Dilution. Rule of Mixture.
Resumen: Generalmente, los parámetros de soldadura tienen una gran influencia en la calidad de una junta soldada. Para lograr una eficiencia elevada en la soldadura, se han desarrollado modelos matemáticos que puedan predecir la geometría del cordón para obtener en forma apropiada las propiedades mecánicas del cordón de soldadura. Esta investigación se enfoca en determinar el porcentaje de ferrita en soldaduras de acero inoxidable dúplex SAF 2205 utilizando el proceso de soldadura GMAW, aplicando los modelos matemáticos establecidos para la predicción de la geometría del cordón. Los valores de penetración y altura del cordón calculados a través de los modelos utilizados y mediante la aplicación de la regla de las mezclas y el Diagrama de Schaeffler, se determino la cantidad de ferrita presente en las soldaduras y se compararon con los valores de porcentaje de ferrita obtenidos experimentalmente. Los resultados evidenciaron que los modelos utilizados para predecir la geometría del cordón, también pueden ser aplicados para estimar el porcentaje de ferrita el las soldaduras de DSS.
Palabras-Claves: Soldaduras de Acero Inoxidable Dúplex. Proceso GMAW. Zona de Fusión. Zona de Penetración. Morfología de Cordón. Modelo Estatístico. Dilución. Regla de la Mezcla.
1. Introduction
Effective weld design can produce physical and mechanical properties within the weld metal that approach those of the base metal. The mechanical properties of a welded material depend on the microstructure, which in turn, depends on the phase transformation characteristics as governed by the continuous-cooling transformation (CCT) behavior. The heating and cooling rate, determined by the welding conditions (welding process, arc current, arc voltage, welding speed, and heat input), control the temperature-time cycle at every point of a weldment. Hence, it is extremely important to study the effect of welding variables on the microstructures of the fusion zone and heat-affected zone in order to optimize the weld mechanical properties. Duplex stainless steels (DSS) are used in many engineering applications such as those found in the petrochemical, pulp and paper, oil and gas industries because they exhibit both good mechanical properties and high corrosion resistance. These
properties result from the almost equal amount of ferrite (α) phase and austenite (γ) phase present in the steel. However, solidification of duplex stainless steel welds does not always produce near equal amounts of α phase and γ phase as in the parent metal, thus deteriorating the mechanical properties and corrosion resistance of the weld joint. The microstructures developed in the weld metal and the heat-affected zone (HAZ) have a significant influence on the mechanical properties and corrosion resistance of duplex stainless steels [1,2]. The α/γ phase balance, partitioning of alloying elements and morphology of phases are shown to be major parameters that control the above-mentioned properties.
Mathematical models of the gas metal arc (GMA) process can be used to study the influence of welding parameters on weld dimensions and to assist in the development of welding procedures and process control algorithms for automated applications. Some research has attempted to investigate the effects of welding parameters on weld geometry such as penetration. Pardo and Weckman [3] in 1989 formulated a three dimensional (3-D) thermal model of the GMA welding process for a moving coordinate framework using the finite element method. Weld bead width and reinforcement height were predicted for structural steels using a unique iterative technique.
Research developed by Manufacturing Thermal Co. [4] analyzed the influence of welding speed and arc current on weld bead (Received in 01/09/2007; Final Text in 04/11/2008).

148 Soldagem Insp. São Paulo, Vol. 14, No. 2, p.002-010, Abr/Jun 2008
geometry for austenitic stainless steels. Ushio et al [5] also carried out research in austenitic stainless steels studying the influence of arc current and welding processes (gas tungsten arc welding, GMA welding) on weld penetration and the surface tension of the welding pool.
Researchers like Rosenthal, Grong and Christensen [6,7,8] developed mathematical models that calculated weld pool dimensions. Other researchers formulated empirical models that predicted approximate weld bead contours of duplex stainless steel welds from established ranges of welding parameters [9,10]. Hemmer and Grong [11] in 1999 developed a process model to describe the evolution of heat affected zone microstructure during both thick-plate and thin-plate welding of three commercial duplex stainless steel grades, 2205, 2304 and 2507.
This present work focused on the influence of heat input on the percentage of ferrite in duplex stainless steel welds. The volume (as represented by the cross-sectional area) of fused base metal and deposited weld metal, and bead penetration were calculated using mathematical models and also experimentally-determined values using the rule of mixture and Schaeffler Diagram [12].
2. Analytical Approach
Several approaches used to predict the amounts of ferrite and austenite in a weld, the thermal experience, and weld characteristic dimensions are described below.
2.1 Austenite-Ferrite Phase Prediction
The amount of austenite and ferrite present in DSS weld microstructure can be predicted using the Schaeffler diagram, which is an empirical description of the microstructures of steel weld metals as function of their chemical composition. This type of diagram has been used for many years to predict the microstructures of weld metals of conventional austenitic and other stainless steels. In many instances, Schaeffler diagram was used to formulate and optimize base metal and filler metal compositions. However, its applicability is limited when less-conventional stainless steel compositions are in consideration and when a high level of nitrogen is present.
2.2 Weld Pool Shape and Columnar Grain Structures
Growth of the columnar grains always proceeds closely to the direction of the maximum thermal gradient in the weld pool,
i.e. normal to the fusion boundary. Consequently, columnar grain morphology is dependent on weld pool geometry. By establishing relationships between welding parameters and weld pool geometry, weld metal microstructures can be predicted as described in the next paragraph.
According to Figure 1, the general thick plate model consists of an isotropic, semi-infinite body at an initial temperature To limited in one direction by a plane that is impermeable to heat. At time t=0, a point heat source of constant power qo starts on the surface at position O and moves in the positive x-direction at a constant speed v. The temperature rise T-To in point P at time t will determine the thermal history as well as the microstructural evolution at that location. The governing equation of the system [6] is:
[ ]
−
−−−
−=
a
tv
at
R
a
vx
atc
dtqdT
4
''2
''4
2
2exp
23
''4
''0
2
πρ
(1)
where " 't t t= − , x x vto= − , oy y= , z zo= , ,
and a is the thermal diffusivity. The quantities ' "vt and vt are defined in Figure 1.
The total temperature rise at P is obtained by integrating Equation 1. Hence, the general thick plate solution can be written as [8]:
(2)
where 2
4 "
Ru
at= ,
a
vRm
4= , and λ is the thermal conductivity.
If u is small enough, i.e. when welding has been performed over a sufficient period, the quasi-steady state temperature distribution is obtained:
( )1exp
2 2
v R xqoT ToR aπλ
+− = −
(3)
This equation is often referred to as the Rosenthal thick plate solution [6,7].
The Rosenthal Equation gives, with the limitations inherent in the assumptions, full information on the thermal conditions for the point sources on heavy slabs. Accordingly, to obtain a general survey of the pseudo-steady state temperature distribution, it is convenient to present the different solutions in a dimensionless form. The following parameters are defined for this purpose [7]:
Dimensionless operating parameter ( η ):
( ) ( )0 0
3 2 24 40 0
q v q v
a c T T a H Hc c
η ππ ρ π
= =− −
(4)
Dimensionless x-coordinate ( ξ ):
a
vx
2=ξ
(5)
Figure 1. Moving point source on a semi-infinite slab [7].
“Asprino, M. C. P.; Evans, R. W.; Liu, S.”
222zyxR ++=
220
0 20
1 2exp exp exp
2 2 2
uq vx vR mT T u du
R a a uπλ π − = − − − − −
∫

149Soldagem Insp. São Paulo, Vol. 14, No. 2, p.002-010, Abr/Jun 2008
0
3
3ln
=∂
∂
σ
θn
( )13
23..,031
3
1
3
3
ln
+
−==−−−=
∂
∂
m
mmei
m
mn
σ
σξ
ξ
σ
σσ
θ
+
−=
13
3exp
3
1
3 m
m
mn
p
σ
σ
σ
θ
( )mm
m321
2
13
3
21 σ
σ
σπ+
+=Λ
Dimensionless y-coordinate (ψ ):
a
vy
2=ψ
(6)
Dimensionless z-coordinate ( ζ ):
a
vz
2=ζ
(7)
Dimensionless time ( τ ):
a
tv
2
2
=τ
(8)
Dimensionless radius vector ( 3σ ):
a
vR
23= σ
(9)
Dimensionless temperature( θ ):
( )( )0
0
TcT
TT
−
−=θ
(10)
with Tc as the reference temperature.
By substituting these parameters into Equation 3, the following equation that describes the thermal experience of a weld is obtained:
( )ξσσ
θ−−= 3exp
3
1
3n
(11)
Isothermal Zone widths
The maximum widths of an isothermal enclosure are
obtained by setting . Partial differentiation of the
Rosenthal Equation gives:
(12)
and
(13)
where pθ is the dimensionless peak temperature and m3σ is locus of peak temperature in the 3σθ − space.
Equation 13 can be used for calculating the isothermal zone widths mψ and cross sectional areas 1Λ from Figure 2:
mm
mm 321
13
3 σσ
σψ +
+=
(14)
and
(15)
where:
)( oHcH −• , change of enthalpy of a point “c” until the room temperature.E• is arc voltage, I is arc current, η is the process efficiency and v is the welding speed.HI• is the Heat Input . • a is the thermal diffusivity,
2.3 Calculation of Deposit and Fused Metal using a Theoretical Model
The heat conduction theory presented earlier does not allow
for the presence of deposited metal. An alternate model must be
proposed for its calculation. The rate of deposition,
, also
known as the coefficient of deposition, is roughly proportional to
the welding current I and can be defined as:
'
w
gk
As I
dMdt=
(16)
The average rates of volume deposition in GMAW welding process is between 0.6-0.7 mm3/A.s, data obtained by N. Christensen for steels [13].
Figure 2. Three-dimensional graphical representation of Rosenthal’s thick plate solution [7].
“Prediction of Percentage of Ferrite as a Function of Heat Input in Gas Metal Arc Welding of Duplex Stainless Steel SAF2205 Weldments”
150 Soldagem Insp. São Paulo, Vol. 14, No. 2, p.002-010, Abr/Jun 2008
Figure 3. Experimental model for the prediction of weld bead geometry [7].
Since the area of deposited metal D is frequently required, Equation 17 can be used for its calculation:
()Iv
k
dt
w dM
vmm
rD
ρ ρ
' 1 2= =
(17)
The area of penetration, B, can be obtained from Equations 14 and 15:
(18)
where:
is the average rate of deposition volume during arc welding
[8].
3. Prediction of Deposited Material and Fused Metal using the Experimental Model for GMAW Welds
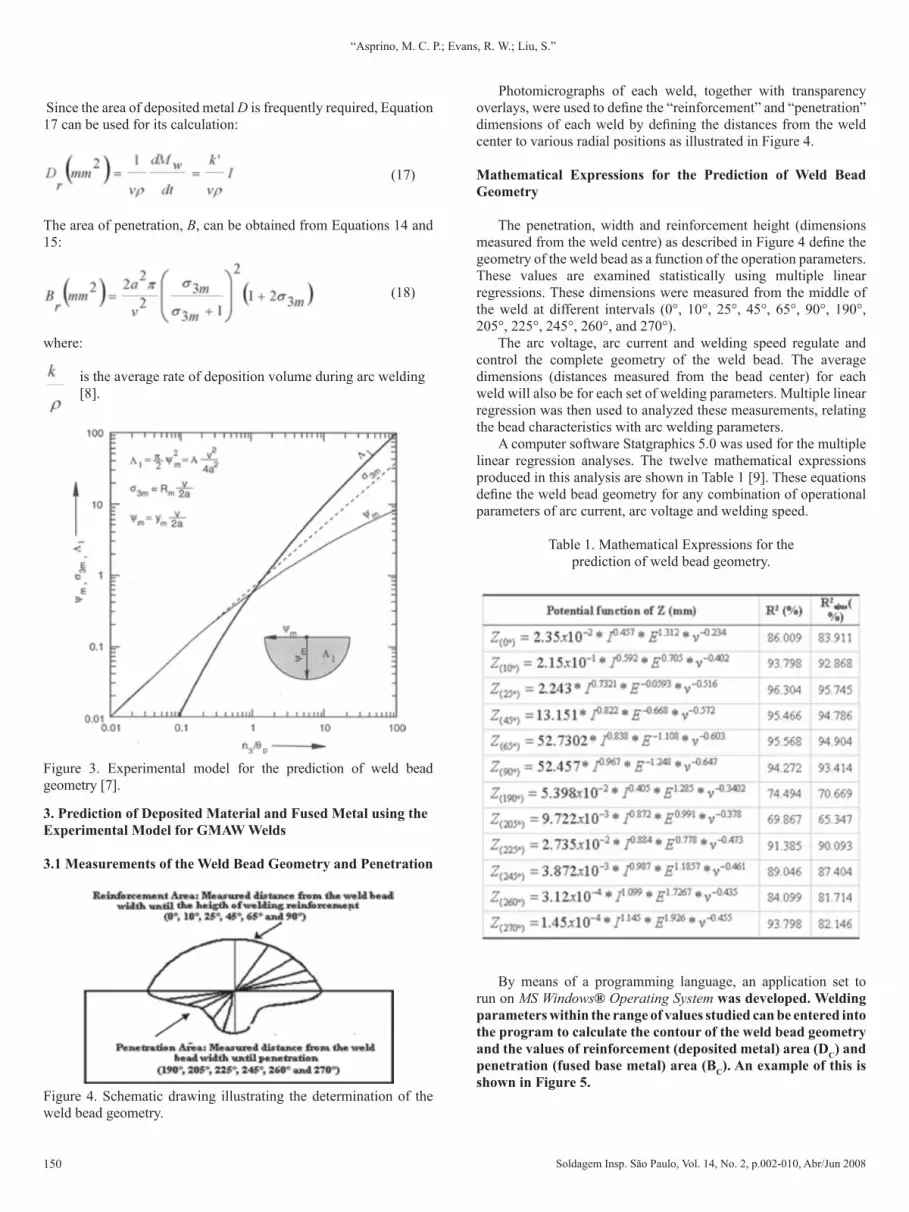
3.1 Measurements of the Weld Bead Geometry and Penetration
Figure 4. Schematic drawing illustrating the determination of the weld bead geometry.
Photomicrographs of each weld, together with transparency overlays, were used to define the “reinforcement” and “penetration” dimensions of each weld by defining the distances from the weld center to various radial positions as illustrated in Figure 4.
Mathematical Expressions for the Prediction of Weld Bead Geometry
The penetration, width and reinforcement height (dimensions measured from the weld centre) as described in Figure 4 define the geometry of the weld bead as a function of the operation parameters. These values are examined statistically using multiple linear regressions. These dimensions were measured from the middle of the weld at different intervals (0°, 10°, 25°, 45°, 65°, 90°, 190°, 205°, 225°, 245°, 260°, and 270°).
The arc voltage, arc current and welding speed regulate and control the complete geometry of the weld bead. The average dimensions (distances measured from the bead center) for each weld will also be for each set of welding parameters. Multiple linear regression was then used to analyzed these measurements, relating the bead characteristics with arc welding parameters.
A computer software Statgraphics 5.0 was used for the multiple linear regression analyses. The twelve mathematical expressions produced in this analysis are shown in Table 1 [9]. These equations define the weld bead geometry for any combination of operational parameters of arc current, arc voltage and welding speed.
Table 1. Mathematical Expressions for the prediction of weld bead geometry.
By means of a programming language, an application set to run on MS Windows® Operating System was developed. Welding parameters within the range of values studied can be entered into the program to calculate the contour of the weld bead geometry and the values of reinforcement (deposited metal) area (DC) and penetration (fused base metal) area (BC). An example of this is shown in Figure 5.
“Asprino, M. C. P.; Evans, R. W.; Liu, S.”

151Soldagem Insp. São Paulo, Vol. 14, No. 2, p.002-010, Abr/Jun 2008
Figure 5. Example of the contour of the weld bead geometry [9].
3. Methodology of the Prediction of Percentage of Ferrite Content in DSS Weldments
3.1. Theoretical Model and the Rule of Mixture
The percentage of ferrite content in the fusion zone of GMAW welds was obtained using the theoretical model described in the Analytical Approach Section.
. The rule of mixture is given by the following equation [7] :
(19)
where:
weldX%•
is element percentage content in the fusion zone.
is element percentage content in the base metal.•
is element percentage content in the filler metal.•
B• is the area of penetration or fused base metal.
D• is the area of deposited material.
3. 2. Dilution for GMAW Welds
Weld dilution was determined using metallographic methods by measuring the individual cross-sectional areas of the deposited filler metal and melted substrate. The ratio of the melted substrate (B) to the total melted cross-sectional area from the filler metal and substrate (B+D) describes the level of dilution:
(20)
Note that the area of the melted substrate (on a transverse cross-section), B, represents the penetration of the weld and the area of the deposited material, D, represents the reinforcement of the weld.
3.3. Experimental Model for GMAW The experimental model obtained for the prediction of weld
bead geometry [9] was used to calculate the percentage of ferrite of GMAW welds and they were compared for the dilution and
DB
BDilution
+=
theoretical results.
4. Experimental Procedure
Several bead-on-plate welds were deposited using GMA welding on DSS plates of 6.35 mm thickness under different welding conditions. As recommended by the ASTM 4815 and A789 procedures for GMA welding process, an ER 2209 electrode wire of 1.00-mm diameter was used [14]. The microstructure of the weld metal was examined using optical microscopy (OM). The Kalling # 2 etchant (5g CuCl2, 100ml H2O, 100ml HCl, and 100ml ethanol) was used to produce contrast between the primary phases (ferrite and austenite). Table 2 gives the chemical composition of the steel and filler metal used.
Table 2. Chemical composition of the DSS SAF 2205 plate and the ER 2209 electrode.
El C Si Mn P S Cr Ni Mo N
SAF 2205 0.045 0.32 1.41 0.030 0.020 22.32 5.31 3.34 0.08
ER 2209 0.015 0.54 1.87 0.023 0.006 23.31 9.81 3.77 0.14
The bead-on-plate (BOP) welds were produced using the conditions shown in Table 3. The calculated heat input values were based on set current and voltage values dialed onto the power source. The actual heat input values were computed using the recorded arc current and voltage values during welding. Figure 6 is a schematic drawing of the BOP welds.
Table 3. Welding parameters using to produce the experimental DSS GMAW welds.
Shielding gas was 99.95% Argon. Welding position: Flat.
Calculated Heat Input [kJ/mm]
Arc Current
[A]
Arc Voltage
[V]
Welding speed
[mm/min]
Actual Heat Input
[kJ/mm]
0.7230 27 532 0.69240 27 555 0.71250 27 578 0.70
0.9210 26.5 371 0.9220 26.5 388 0.89230 26.5 406 0.91
1.6250 27.7 258 1.58260 27.5 273 1.60270 27.5 288 1.61
Figure 6 Schematic drawing of the test plate. (Measurements in mm.)
“Prediction of Percentage of Ferrite as a Function of Heat Input in Gas Metal Arc Welding of Duplex Stainless Steel SAF2205 Weldments”

152 Soldagem Insp. São Paulo, Vol. 14, No. 2, p.002-010, Abr/Jun 2008
5. Results and Discussion
5.1 Microstructures of Welds
Photomicrographs were taken using a LECO Olympus PMG3 field microscope, coupled to a PaxCAM camera. Area fractions of austenite and ferrite were measured using point counting technique.
“Asprino, M. C. P.; Evans, R. W.; Liu, S.”
Figure 7. Optical microstructure of as-received SAF 2205 plate.
The optical microstructure of as-received 2205 DSS consists of elongated α and γ grains, as shown in Figure 7, and the α/γ grain boundary appeared relatively flat and smooth. The measured volume fractions of α and γ are about 51% and 49%, respectively.
The microstructures of the weld metals are shown in Figure 8. Austenite is observed to form at the prior-ferrite grain boundaries, Figures 8a and 8b, growing as Widmanstätten plates into the grains. Austenite is also observed in the form of intragranular laths. Ferrite fraction in the weldments varied from 39% (1.6 kJ/mm) to 50% ( 0.9 kJ/mm) because the ferrite – austenite ratio depends on the energy input in welding, as the latter controls the cooling rates and hence the extent of the diffusion-based ferrite-austenite transformation. Thus, nucleation of austenite is easier with slow cooling (high heat input). Slow cooling also affects the partitioning of alloying elements, shifting towards the equilibrium values. Thermodynamic calculations reveal that chromium and molybdenum concentrations in the ferrite increase as the temperature decreases. This observation is significant since high Cr and Mo levels in the ferrite are necessary to provide good pitting and general corrosion resistance [16,17]. Volume fraction of austenite in weld metal can be controlled successfully with additions of alloying elements such as nickel and nitrogen [18].
a) DSS weld Metal at HI: 0.72kJ/mm; %Ferrite: 50
b) DSS Weld Metal at HI: 0.92kJ/mm; %Ferrite: 45
c) DSS Weld Metal at HI:1.6kJ/mm; %Ferrite: 39
Figure 8. Representative micrographs of GMA DSS weld metal.
5.2 Prediction of Ferrite Content
5.2.1. Dilution and Ferrite Content of DSS welds
The chemical composition of the steel and filler metal were used to calculate the chromium and nickel equivalent of the weldments, which when plotted on the Schaeffler diagram predicted the parent and filler metal microstructures as shown in Figure 9.
Nieq=%Ni+30%C+0.5%Mn
Creq= %Cr+%Mo+1.5%Si+0.5%Nb

153Soldagem Insp. São Paulo, Vol. 14, No. 2, p.002-010, Abr/Jun 2008
Figure 9. Schaeffler diagram showing microstructures for base and filler metal.
Weld dilution was calculated for each condition using the formula given in Section 3.2. Values of the area of penetration (fused base metal) (B) and reinforcement (deposited material) (D) were estimated by approximation of the sums of the two areas. The percentage of ferrite were obtained by the rule of mixture (Equation 19) using the dilution values and the percentage of ferrite of parent and filler metal, 39% and 84%, respectively.
Table 4 shows the average dilution value for each welding condition used.
Table 4. Weld dilution and ferrite content for the bead-on-plate welds.
HI (kJ/mm) Average Dilution (%) %Ferrite
0.7 0.35 680.9 0.40 661.6 0.41 65
. 5.2.2 Determination of B and D areas through Theoretical Model
There are other solutions for the thick and thin plate heat conduction models, but they are thickness dependent, therefore dimensionless thickness dependent (δ). Figure 10 [7] allows for the validation of the models as a function of plate geometry and operation parameters conditions.
Figure 10. Heat flow mechanism map showing calculated field boundaries in transverse direction for lowest, intermediate and high values of HI [7].
Figure 10 shows the three different HI conditions. These values are shown as point 3: 0.7 kJ/mm, point 2: 0.91 kJ/mm and point 1: 1.6 kJ/mm. Higher values of the quotient δ and lower valuesof
the quotient 3npθ were obtained for all welding conditions used.
Therefore, the heat transfer conditions experienced by the welds approach those described by the thick plate solution and the heat flow is in 2-D condition. In this case, the theoretical model employed is valid for these welding conditions. Table 5 shows the values of B and D obtained by both theoretical and experimental model for each welding condition used.
Table 5. Values of fused base metal (penetration), B, and deposited material (reinforcement), D, obtained by theoretical and
experimental model at different heat input used.
HI (kJ/mm) Br(mm2)
BC(mm2)
Dr(mm2)
DC(mm2)
0.7 18.18 13.16 18.85 17.910.9 23.15 16.04 24.48 25.011.6 39.44 25.3 42.33 46.65
To ensure the accuracy of the experimental model based on multiple regression method and to survey the spread of the values, the experimental and theoretical results using the developed equations were compared in Figure 11.
“Prediction of Percentage of Ferrite as a Function of Heat Input in Gas Metal Arc Welding of Duplex Stainless Steel SAF2205 Weldments”

154 Soldagem Insp. São Paulo, Vol. 14, No. 2, p.002-010, Abr/Jun 2008
Figure 11. Comparison of fused base metal and deposited metal using experimental and theoretical model. D represents deposited metal (reinforcement) and B represents fused base metal (penetration).
It is evident from these results that good agreement exists between experimental and theoretical model for the deposited material (reinforcement) and fused metal (base metal dilution). In the case of penetration, much larger scatter was observed.
Figure 12 is a comparison of the weld bead contour geometry calculated by both theoretical model [15,7] and by experimental model [9] for the welding condition of 250 A, 20 V, and 667 mm/min. The micrograph of this weld is shown in Figure 12. In this diagram, Dc and Bc represent the deposited material and fused material obtained by the experimental model. The weld bead calculated by Rykalin and Grong is represented by the semi-circular trace with information labeled as WI and BR.
Figure 12. Example of the contours of the weld bead geometry [19].
Table 6. Percentages of element contents in the weld metal for each welding condition used.
HI (kJ/mm) Method %C %Si %Mn %Cr %Mo %Ni %Nb
0.71
Chemical Analysis 0.043 0.449 1.690 21.96 3.486 7.03 0.008Theoretical Model 0.027 0.415 1.677 22.31 3.566 7.96 0.062
Experimental Model 0.030 0.427 1.634 22.36 3.527 7.53 0.010
0.92
Chemical Analysis. 0.046 0.446 1.709 21.84 3.466 7.32 0.008
Theoretical Model 0.030 0.428 1.634 22.36 3.527 7.50 0.011
Experimental Model 0.041 0.465 1.684 22.06 3.412 7.50 0.012
1.6
Chemical Analysis. 0.043 0.431 1.698 21.99 3.482 7.77 0.008
Theoretical Model 0.029 0.433 1.646 22.31 3.539 7.67 0.011Experimental Model 0.025 0.047 1.711 22.31 3.594 8.29 0.008
In this figure, it can be seen that the weld bead penetration contour given by the experimental model is similar to the shape of a “hat” as shown by its macrophotograph in Figure 13. However, the weld bead penetration contour given by the theoretical model is semi-circular as expected in conventional weld bead penetration. Therefore, the experimental model is more accurate than the theoretical model in predicting the DSS weld bead penetration geometry.
Figure 13. Macrophotograph of a weld made with 250 A, 29.3 V, 667 mm/min.
5.3 Comparison of Calculated and Measured Percentage of Ferrite Content of DSS Welds5.3.1. Percentages of Element Contents in the Weld Metal
The results of the percentages of element contents from the spectrographic chemical analysis and calculated compositions using the rule of mixture are shown in Table 6. Most of the percentage of element results obtained by theoretical and experimental model is similar to chemistry analysis results, except the slight difference for the carbon content.
The results in Table 6 were used to calculate the chromium and the nickel equivalents, which when plotted on the Schaeffler diagram, predicted the percentage of ferrite in the welds. The ferrite contents are plotted in Figure 14 as function of HI.
“Asprino, M. C. P.; Evans, R. W.; Liu, S.”

155Soldagem Insp. São Paulo, Vol. 14, No. 2, p.002-010, Abr/Jun 2008
As can be seen in Figure 14, the results of percentage of ferrite predicted by experimental model and obtained by dilution and chemical analysis are similar. However, the percentage of ferrite obtained by the theoretical model is approximately 10% higher than that determined by these methods. This difference can be attributed to the semi-circular weld bead geometry predicted by the theoretical model (Figure 11).
Figure 14. Comparison between the predicted of percentage of ferrite in fusion zone obtained by experimental and theoretical model and measured values obtained by dilution, chemical analysis, and experimental measurement as function of heat input.
However, the experimental ferrite fraction obtained using point counting technique is lower than the reported from all method used. This discrepancy can be attributed mainly to errors incurred from this technique and the presence of a small amount of nitrogen in the weld metal. GMA welds typically contain a small amount of nitrogen, at the order of tens of ppm. Additionally, the effect of nitrogen is not considered in the Schaeffler Diagram.
6. Conclusions
The major conclusions of this research are summarized below.
The rule of mixture gave very reliable results in obtaining 1) the percentage content of elements in DSS weld fusion.The experimental model described in this work is capable 2) of predicting more accurate weld bead penetration than the theoretical model for DSS welds. The experimental model developed in this research better 3) predicts the percentage of ferrite content of DSS welds than the classical Thick Plate Solution Model.The ferrite content in the fusion zone decreased with 4) increasing heat input for DSS GMA welds for all the methods studied.
7. Acknowledgments
The authors would like to thanks the Venezuelan Science and Technology Research Foundation (FONACIT) for funding and the Universidad Simón Bolívar, University of Wales Swansea and Colorado School of Mines for the provision
of laboratory facilities.
8. References
[1] N. SRIHAR, L.H. FLASHE and J. KOLTS, in New Developments in Stainless Steel Technology, Symp. Proc., pp. 341-350. ASM, Metal Park, Ohio, 1985.
[2] J. NOWACKI and A. LUKOJĆ, Structure and Properties of the Heat-Affected Zone of Duplex Steels Welded Joints. Journal of Materials Processing Technology, v. 164-165, pp. 1074-1081, 2005.
[3] E. PARDO and WECKMAN, Prediction of Weld Pool and Reinforcement Dimensions of GMA Welds Using a Finite Element Model, Metall. Trans. B, v. 20B, pp. 937-947, 1989.
[4] Manufacturing Thermal Co, “Preparing for an Experimental Study of Welding Austenitic Stainless Steels”, U.S.A., 2000.
[5] M. USHIO, K. NAKATA, M. TANAKA, H. TERASAKI, and J. LOWKE, “Observations of Arc Plasma in GTA Welding with Flux”, Osaka University, Japan, 1999.
[6] D. ROSENTHAL, “Mathematical Theory of Heat Distribution during Weld and Cutting”, Welding Journal, v. 20, pp. 220s-234s, 1941.
[7] Ø. GRONG, “Metallurgical of Welding,” The Institute of Materials, U.K., 1997.
[8] N. CHRISTENSEN, L. DAVIS, and K. GJERMUNDSEN, “Distribution of Temperatures in Arc Welding,” British Welding Journal, v. 12, pp. 54-75, 1965.
[9] M.C. PAYARES and M. DORTA ALMENARA, “Mathematical Expression for the Prediction in Butt Joints for Duplex Stainless Steel SAF 2205,”.ASME International Mechanical Engineering Congress and R&D Expo, Washington, D.C., 2003.
[10] V. GURARAJ and N. MURUGAN, “Application of Response Surface Methodology for Predicting Weld Bead Quality in Submerged Arc Welding of Pipes,” Journal of Materials Processing Technology, v. 95, pp. 246-261, 1999.[11] H. HEMMER and Ø. GRONG, “A Process Model for the Heat-Affected Zone Microstructure Evolution in Duplex Stainless Steel Weldments: Part I. The Model,” Metall. Mater. Trans. A, 30A, pp. 2915-2929, 1999.
[12] A. SCHAEFFLER, “A Diagram is given for Estimating Microstructures of Weld Deposits in Types 308, 309, 309 Cb, 310, 312, 316, 317, and 318 Stainless Steels,” Metal Progress, v. 56, n.11, pp.680-680B, 1949.
[13] N. CHRISTENSEN, “Welding Metallurgy Compendium,” University of Trondheim, The Norwegian Institute of Technology. 1975.
[14] ASME Boiler and Pressure Vessel Code, Edition, Section III, Division 1, Figure NB-2433.1-1.ASME, N.Y., 1995.
[15] N. RYKALIN, “Berechnung der Wärmevorgänge beim
“Prediction of Percentage of Ferrite as a Function of Heat Input in Gas Metal Arc Welding of Duplex Stainless Steel SAF2205 Weldments”

156 Soldagem Insp. São Paulo, Vol. 14, No. 2, p.002-010, Abr/Jun 2008
Schweissen,“ VEB Verlag Technik, Berlin, 1953.
[16] R. SRIRAM and D. TROMANS, “Pitting Corrosion of Duplex Stainless Steels,” Corrosion, v. 45, pp. 804, 1989.
[17] R.A. WALKER, Materials Science and Technology , v. 4, pp. 78–80, 1988.
[18] S. ATAMERT and J.E. KING, “Elemental Partitioning and Microstructural Development in Duplex Stainless Steel Weld Metal,” Acta Metall. Mater., v. 39, n.3, pp. 273-285, 1990.
[19] M.C. PAYARES and H. GALEZO, “Mathematical Modeling for the Prediction of the Geometry and the Entire Stress-Strain Curve from the Ramberg-Osgood Parameter (E0,σ 0.2, n) for DSS welds,” Software designed at USB, Venezuela 2005.


