Embed Size (px)
Citation preview
Mbochi et al. BMC Public Health 2012, 12:823http://www.biomedcentral.com/1471-2458/12/823
RESEARCH ARTICLE Open Access
Predictors of overweight and obesity in adultwomen in Nairobi Province, KenyaRegina W Mbochi1, Elizabeth Kuria1, Judith Kimiywe1, Sophie Ochola1 and Nelia P Steyn2*
Abstract
Background: Since obesity in urban women is prevalent in Kenya the study aimed to determine predictors ofoverweight and obesity in urban Kenyan women.
Methods: A cross-sectional study was undertaken in Nairobi Province. The province was purposively selectedbecause it has the highest prevalence of overweight and obesity in Kenya.A total of 365 women aged 25–54 years old were randomly selected to participate in the study.
Results: Higher age, higher socio-economic (SE) group, increased parity, greater number of rooms in the house,and increased expenditure showed greater mean body mass index (BMI),% body fat and waist circumference (WC)at highly significant levels (p <0.001). Most of the variance in BMI was explained by age, total physical activity,percentage of fat consumed, parity and SE group in that order, together accounting for 18% of the variance in BMI.The results suggest that age was the most significant predictor of all the dependent variables appearing first in allthe models, while parity was a significant predictor of BMI and WC. The upper two SE groups had significantlyhigher mean protein (p <0.05), cholesterol (p <0.05) and alcohol (p <0.001) intakes than the lower SE groups; whilethe lower SE groups had significantly higher mean fibre (p <0.001) and carbohydrate (p <0.05) intakes. A fat intakegreater than 100% of the DRI dietary reference intake (DRI) had a significantly greater mean BMI (p <0.05) than a fatintake less than the DRI.
Conclusions: The predictors of overweight and obesity showed that urbanization and the nutrition transition werewell established in the sample of women studied in the high SE groups. They exhibited a sedentary lifestyle andconsumed a diet high in energy, protein, fat, cholesterol, and alcohol and lower in fibre and carbohydratecompared with those in the low SE groups.
Keywords: Overweight, Obesity, Women, Kenya, Diet, Physical activity
BackgroundOverweight and obesity are modifiable risk factors forthe development of non-communicable diseases (NCDs).Recent evidence indicates that overweight and obesityare increasing in sub-Saharan Africa, including Kenya, ata rate of 5% per year on average [1]. Hence it is pre-dicted that there will be an accompanying surge inNCDs such as cardiovascular diseases and type 2 dia-betes. Overweight and obesity in SSA are most commonin women and specifically in the 25 to 44 year old agegroup. This is most probably due to the retention of
* Correspondence: [email protected] for the Study of Social and Environmental Determinants of Nutrition;Population Health, Health Systems, and Innovation, Human SciencesResearch Council, P Bag X9182, Cape Town 8000, South AfricaFull list of author information is available at the end of the article
© 2012 Mbochi et al.; licensee BioMed CentraCommons Attribution License (http://creativecreproduction in any medium, provided the or
gestational weight gain [2]; but may also be the outcomeof numerous lifestyle factors, including poor diet andphysical inactivity [3]. Urbanization also plays a signifi-cant role when people are exposed to a diet which veersfrom that of their traditional one by containing a highintake of saturated fat, sodium, and added sugar and alow intake of dietary fibre [4].The Kenya Demographic and Health Survey (KDHS)
of 2009 showed that the national prevalence of over-weight and obesity for women (15–49 years old) inKenya was 23%. The proportion of overweight and obesewomen was higher in urban areas than in rural areas,with Nairobi having the highest prevalence of 41% [5].Obesity plays a significant role in causing poor health
in women, negatively affecting quality of life and
l Ltd. This is an Open Access article distributed under the terms of the Creativeommons.org/licenses/by/2.0), which permits unrestricted use, distribution, andiginal work is properly cited.
Mbochi et al. BMC Public Health 2012, 12:823 Page 2 of 9http://www.biomedcentral.com/1471-2458/12/823
shortening quantity of life [6]. There are many obesity-related conditions, which uniquely or mostly affectwomen. These include: osteoarthritis, birth defects, breastand endometrial cancers, cardiovascular and gall bladderdiseases, infertility and gynaecological complications,urinary stress incontinence, and stigma/discrimination[7]. Women who are overweight or obese are at a higherrisk of developing these conditions compared to thosewho are not. A direct association has been found betweenbody weight and deaths from all-causes in women, ages30 to 55. According to the American Obesity Association,when BMI exceeds 30 kg/m2, the relative risk of deathrelated to obesity increases by 50 percent. Obesity, espe-cially abdominal obesity, is central to the metabolic syn-drome and is strongly related to polycystic ovarysyndrome (PCOS) in women. Obese women are particu-larly susceptible to diabetes, and diabetes, in turn, putswomen at dramatically increased risk of cardiovasculardiseases [8].Overweight and obesity in developing countries, has
been neglected as most attention is concentrated onfamine and under-nutrition or malnutrition of children[9-11]. If preventive measures are not put in place, theproblem will escalate and overburden the health caresystem in these areas. Hence there is need to put mea-sures in place to arrest the problem of overweight andobesity and to prevent the negative consequences, espe-cially among women. However, in order to do this it isnecessary to examine the problem and to fully under-stand the aetiology of obesity and the factors which giverise to excess weight gain in women. Hence the aim ofthe present study was to determine which factors arepredictors of overweight in women in an urban settingof Kenya.
MethodsStudy setting and participantsThe study was undertaken in Kibera Division of NairobiProvince, an urban area. The Province was purposivelyselected because it was found to have the highest preva-lence of overweight and obesity, namely 39%, in the2003 KDHS and 41% in the KDHS of 2009 [5]. Kiberahad a total adult female population of 127 656 in themost recent census. A sample of 365 adult women aged25–54 years were required to meet sample size require-ments [12]. Stratified random sampling was used accord-ing to five socio-economic strata (lower, upper lower,middle, lower upper, and upper) based on proportions ofadult women living in each stratum. This resulted infour strata with 75 women and one (upper) with 36women. One sub-location was selected at random fromthe division to represent each socio-economic group. Allhouseholds in each sub-location were counted andhouseholds were randomly selected from these.
Research toolsTwo research assistants having a bachelor’s degree weretrained to collect data on: socio-demographic status,physical activity, dietary intake and anthropometry. Themain instrument of data collection was an interviewer-administered, structured questionnaire. The question-naire was divided into four parts. The first part was usedto collect socio-demographic and socio-economic statusdata. The second part was used to collect data on phys-ical activity during work, transportation and leisure timein a typical week. The third part was used to collect in-formation on dietary intake and eating habits. This wasdone using a food frequency questionnaire and a 24-hour dietary recall. The final part of the questionnairewas used to collect anthropometric data (weight, height,waist circumference, and body fat percentage).
Socio-demographic statusThe socio-demographic questionnaire (SDQ) involvedasking the respondents about their age, marital statusand parity, while the socio-economic status questionselicited the following information: Area of residence, in-come status, main occupation, type of dwelling, fuelused for cooking, sources of income and monthly ex-penditure on selected items, water source and owner-ship/possession of various household items. Thesehousehold items included a television, radio, refrigerator,cooker (with oven), sofa set, microwave, home computer,mobile phone, landline, land/plot, and a vehicle.
Physical activityThe Global Physical Activity Questionnaire (GPAQ) wasused to collect data on type, frequency, duration and in-tensity of physical activity during work, transportationand leisure time in a typical week [13]. This is a tool thatwas developed by the World Health Organization(WHO) for physical activity surveillance in countries, in-cluding developing countries. The GPAQ has been vali-dated in nine countries [13].
Dietary intakeIn this study the food frequency questionnaire (FFQ)was used to obtain information on the type and fre-quency of foods consumed by the respondents in thepreceding 7 days. Various foods from different foodgroups were read out to the respondent, who in returnwas required to state the number of times she had con-sumed this food in the preceding 7 days. Portion sizeswere not calculated since only food intake and not nutri-ents were required.A 24-hour recall (24 HR) was used to determine nutri-
ent intakes and portion sizes were calculated. Thismethod has been used in numerous studies in Africa[14-16]. One such study in Kenya used a repeated 24HR
Mbochi et al. BMC Public Health 2012, 12:823 Page 3 of 9http://www.biomedcentral.com/1471-2458/12/823
and found that there were no specific differences betweenthe two recalls [16], hence negating the expense and timeof doing a second recall. The reason for this is thought tobe due to the low variety of foods eaten. Furthermore,using both the FFQ and 24 HR ensured that a check wasprovided for food taken in by the 24HR recall.The 24 HR involved asking the participants to report
on all foods and drinks consumed in the previous24 hours (the previous day), in direct chronologicalorder from the first foods in the morning to the lastfoods before going to bed. Probing allowed the inter-viewer to obtain information on forgotten foods. A rangeof local household utensils: glasses, spoons, cups andplates were used for estimating the amount of foods andbeverages actually consumed by the respondents. Theuse of these local utensils acted as visual aids to increasethe accuracy of portion size estimations. In someinstances the respondent was asked to supply her ownutensils for the recall. Seasonal fruits and vegetableswere also purchased to help in estimation of the portionsizes. Rulers and tape measures were used to obtainquantities of some foods such as sugarcane and maize[17]. To obtain the weight/ gram equivalents of foods,the South African Food Photo Manual [18] was used,which converts food items of different sizes and com-position to gram equivalents. In addition, the respon-dents were asked to provide information on thefollowing: type of fat/oil used for cooking, preferredcooking method, meal consumption patterns in the pre-ceding three months and the number of times food waseaten away from home.
AnthropometryAnthropometric measurements of height, weight, waistcircumference (WC) and percent body fat were taken todetermine nutritional status [11]. Height (in metres) wasmeasured using a steel tape which was anchored to a flatwall, and the respondent was asked to stand on a flatsurface. A wooden head rest was placed on the head,which allowed the measurement to be taken at the pointperpendicular to the top of the head. Weight was mea-sured to the nearest 100 grams (0.1 kg) using a Soehnlebathroom scale, after calibrating it to zero, and after re-moval of shoes and excess clothing. Both weight andheight were taken twice. In order to ensure quality data,the weighing scale was calibrated before measuring ofweight began everyday and after every five measure-ments during the measuring exercise. Percentage bodyfat (% BF) was measured using a Soehnle scale whichestimates the body fat percentage by the bioelectricalimpedance analysis (BIA) method. Data on height,weight, sex and age of the participant was fed to theunit. Weight and body fat percentage values were readfrom the display unit of the device. Waist circumference
(WC) was measured using a non-stretchable tape half-way between the lower border of ribs and the iliac creston a horizontal plane, while ensuring that the tape waslevel around the body and parallel to the floor. The tapewas tightened around the body without depressing theskin. Two measurements to the nearest 0.5 cm weretaken and the mean recorded [11].
Validity and reliabilityContent validity of the SDQ questionnaire was tested bythree experts in the field of overweight and obesity re-search, who were requested to assess the relevance ofthe content used in the questionnaire [19]. They exam-ined the questionnaire individually and provided feed-back to the researcher. Their recommendations andsuggestions were integrated and incorporated in the finalquestionnaire.The test re-test method [20] was used to test consis-
tency (reliability) of the questionnaires in producing thesame results. The pre-test sample comprised of 10 womenwho were randomly sampled outside the study area. Thesame questionnaire was administered to the same groupof respondents after a period of one week in order to es-tablish the extent to which the contents of the question-naire were consistent in eliciting the same responses everytime the instrument was administered. Areas of the ques-tionnaire that were found to be deficient were revised andthe questionnaire adapted accordingly.
Pilot studyThe questionnaires were pre-tested for accuracy andclarity prior to the main study on a sample of 37 women(10% of the sample size) with similar characteristics tothe actual sample, but who were not included in thefinal study.
Data analysesCompleted questionnaires were checked on a daily basisfor accuracy and completeness in recording of responses.They were edited and coded before data entry. Beforeanalysis, all the data were cleaned. A dietary softwareprogramme [21] was used to calculate energy andmacronutrient content of the diet while SPSS was usedfor other data analyses. Chi-square tests were performedto establish the association between categorical variableslike age group, marital status, and expenditure, whileANOVA was used to compare the means for age, in-come, expenditure, anthropometric measurements andthe mean nutrient consumption between the five socio-economic groups. Multiple regression analysis using thestepwise method was done to determine the independ-ent variables that were significant predictors of over-weight and obesity in the study. A p value of less than0.05 was considered to be significant.
Mbochi et al. BMC Public Health 2012, 12:823 Page 4 of 9http://www.biomedcentral.com/1471-2458/12/823
Ethical approvalPermission for the study was obtained from the researchcommittee of the Ministry of Education. Ethical approvalwas obtained from the Kenyatta National Hospital Ethicsand Research Committee. Interviews and measurementsof the participants were done upon obtaining theirinformed and voluntary consent after the purpose of thestudy had been explained to them.
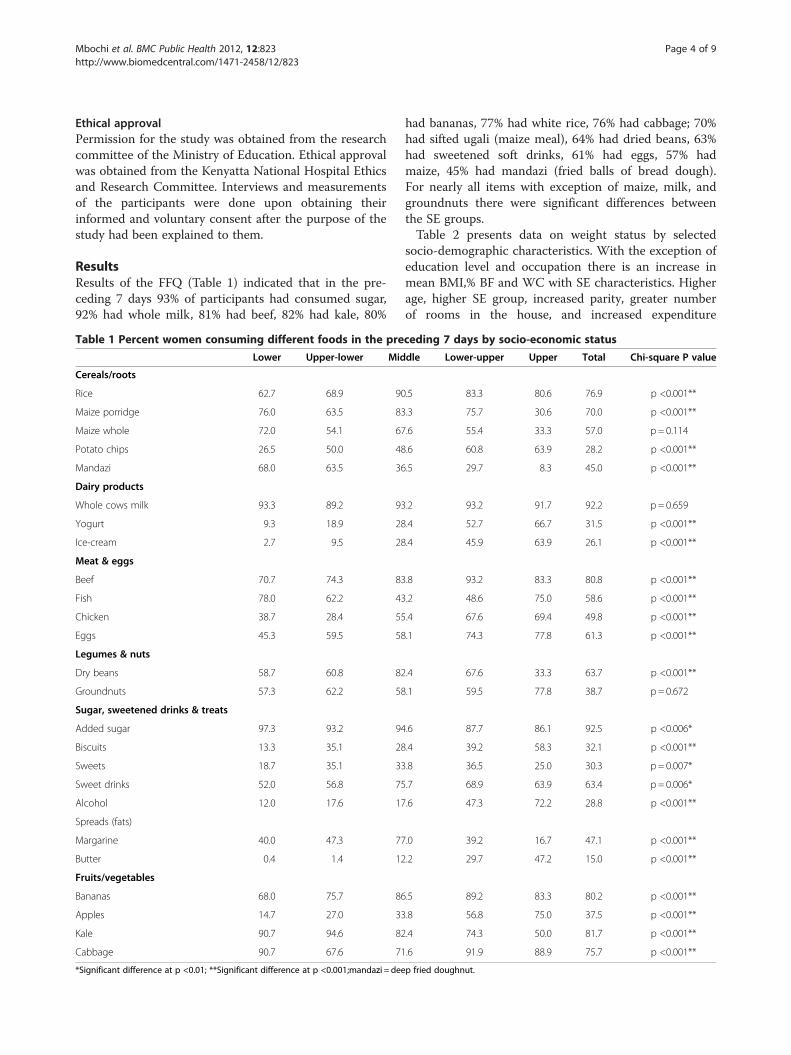
ResultsResults of the FFQ (Table 1) indicated that in the pre-ceding 7 days 93% of participants had consumed sugar,92% had whole milk, 81% had beef, 82% had kale, 80%
Table 1 Percent women consuming different foods in the pre
Lower Upper-lower Mid
Cereals/roots
Rice 62.7 68.9 90
Maize porridge 76.0 63.5 83
Maize whole 72.0 54.1 67
Potato chips 26.5 50.0 48
Mandazi 68.0 63.5 36
Dairy products
Whole cows milk 93.3 89.2 93
Yogurt 9.3 18.9 28
Ice-cream 2.7 9.5 28
Meat & eggs
Beef 70.7 74.3 83
Fish 78.0 62.2 43
Chicken 38.7 28.4 55
Eggs 45.3 59.5 58
Legumes & nuts
Dry beans 58.7 60.8 82
Groundnuts 57.3 62.2 58
Sugar, sweetened drinks & treats
Added sugar 97.3 93.2 94
Biscuits 13.3 35.1 28
Sweets 18.7 35.1 33
Sweet drinks 52.0 56.8 75
Alcohol 12.0 17.6 17
Spreads (fats)
Margarine 40.0 47.3 77
Butter 0.4 1.4 12
Fruits/vegetables
Bananas 68.0 75.7 86
Apples 14.7 27.0 33
Kale 90.7 94.6 82
Cabbage 90.7 67.6 71
*Significant difference at p <0.01; **Significant difference at p <0.001;mandazi = dee
had bananas, 77% had white rice, 76% had cabbage; 70%had sifted ugali (maize meal), 64% had dried beans, 63%had sweetened soft drinks, 61% had eggs, 57% hadmaize, 45% had mandazi (fried balls of bread dough).For nearly all items with exception of maize, milk, andgroundnuts there were significant differences betweenthe SE groups.Table 2 presents data on weight status by selected
socio-demographic characteristics. With the exception ofeducation level and occupation there is an increase inmean BMI,% BF and WC with SE characteristics. Higherage, higher SE group, increased parity, greater numberof rooms in the house, and increased expenditure
ceding 7 days by socio-economic status
dle Lower-upper Upper Total Chi-square P value
.5 83.3 80.6 76.9 p <0.001**
.3 75.7 30.6 70.0 p <0.001**
.6 55.4 33.3 57.0 p = 0.114
.6 60.8 63.9 28.2 p <0.001**
.5 29.7 8.3 45.0 p <0.001**
.2 93.2 91.7 92.2 p = 0.659
.4 52.7 66.7 31.5 p <0.001**
.4 45.9 63.9 26.1 p <0.001**
.8 93.2 83.3 80.8 p <0.001**
.2 48.6 75.0 58.6 p <0.001**
.4 67.6 69.4 49.8 p <0.001**
.1 74.3 77.8 61.3 p <0.001**
.4 67.6 33.3 63.7 p <0.001**
.1 59.5 77.8 38.7 p = 0.672
.6 87.7 86.1 92.5 p <0.006*
.4 39.2 58.3 32.1 p <0.001**
.8 36.5 25.0 30.3 p = 0.007*
.7 68.9 63.9 63.4 p = 0.006*
.6 47.3 72.2 28.8 p <0.001**
.0 39.2 16.7 47.1 p <0.001**
.2 29.7 47.2 15.0 p <0.001**
.5 89.2 83.3 80.2 p <0.001**
.8 56.8 75.0 37.5 p <0.001**
.4 74.3 50.0 81.7 p <0.001**
.6 91.9 88.9 75.7 p <0.001**
p fried doughnut.
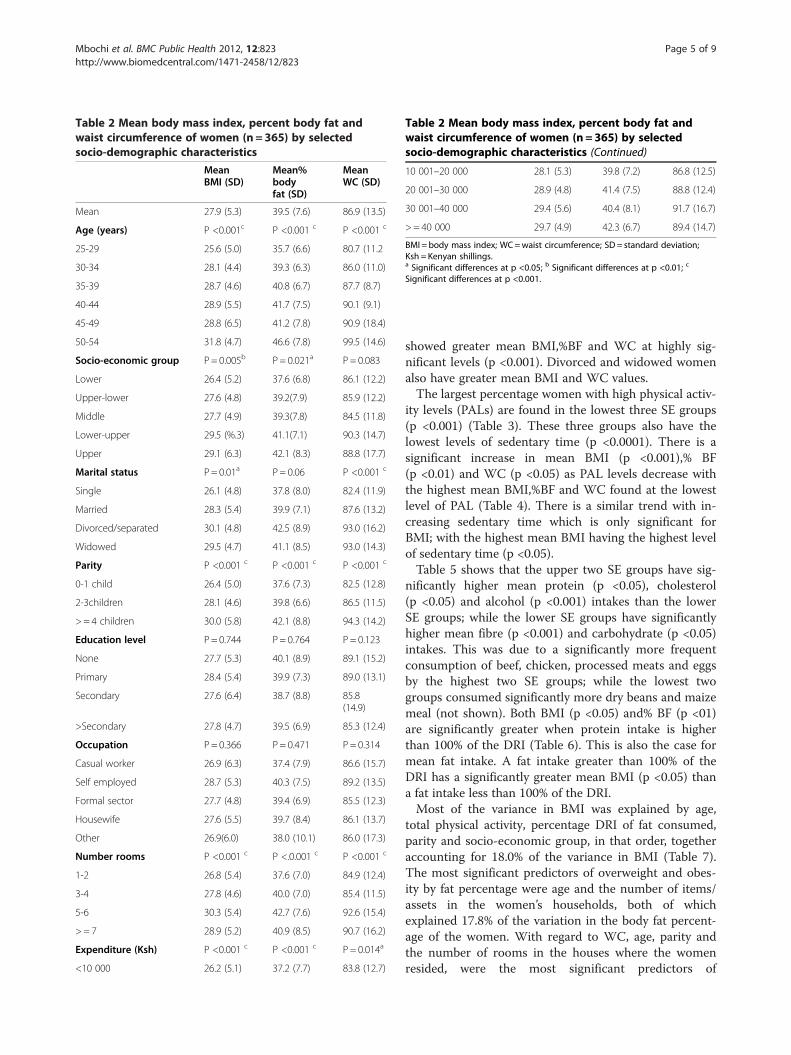
Table 2 Mean body mass index, percent body fat andwaist circumference of women (n = 365) by selectedsocio-demographic characteristics
MeanBMI (SD)
Mean%bodyfat (SD)
MeanWC (SD)
Mean 27.9 (5.3) 39.5 (7.6) 86.9 (13.5)
Age (years) P <0.001c P <0.001 c P <0.001 c
25-29 25.6 (5.0) 35.7 (6.6) 80.7 (11.2
30-34 28.1 (4.4) 39.3 (6.3) 86.0 (11.0)
35-39 28.7 (4.6) 40.8 (6.7) 87.7 (8.7)
40-44 28.9 (5.5) 41.7 (7.5) 90.1 (9.1)
45-49 28.8 (6.5) 41.2 (7.8) 90.9 (18.4)
50-54 31.8 (4.7) 46.6 (7.8) 99.5 (14.6)
Socio-economic group P= 0.005b P = 0.021a P = 0.083
Lower 26.4 (5.2) 37.6 (6.8) 86.1 (12.2)
Upper-lower 27.6 (4.8) 39.2(7.9) 85.9 (12.2)
Middle 27.7 (4.9) 39.3(7.8) 84.5 (11.8)
Lower-upper 29.5 (%.3) 41.1(7.1) 90.3 (14.7)
Upper 29.1 (6.3) 42.1 (8.3) 88.8 (17.7)
Marital status P= 0.01a P = 0.06 P <0.001 c
Single 26.1 (4.8) 37.8 (8.0) 82.4 (11.9)
Married 28.3 (5.4) 39.9 (7.1) 87.6 (13.2)
Divorced/separated 30.1 (4.8) 42.5 (8.9) 93.0 (16.2)
Widowed 29.5 (4.7) 41.1 (8.5) 93.0 (14.3)
Parity P <0.001 c P <0.001 c P <0.001 c
0-1 child 26.4 (5.0) 37.6 (7.3) 82.5 (12.8)
2-3children 28.1 (4.6) 39.8 (6.6) 86.5 (11.5)
> = 4 children 30.0 (5.8) 42.1 (8.8) 94.3 (14.2)
Education level P= 0.744 P= 0.764 P = 0.123
None 27.7 (5.3) 40.1 (8.9) 89.1 (15.2)
Primary 28.4 (5.4) 39.9 (7.3) 89.0 (13.1)
Secondary 27.6 (6.4) 38.7 (8.8) 85.8(14.9)
>Secondary 27.8 (4.7) 39.5 (6.9) 85.3 (12.4)
Occupation P= 0.366 P= 0.471 P = 0.314
Casual worker 26.9 (6.3) 37.4 (7.9) 86.6 (15.7)
Self employed 28.7 (5.3) 40.3 (7.5) 89.2 (13.5)
Formal sector 27.7 (4.8) 39.4 (6.9) 85.5 (12.3)
Housewife 27.6 (5.5) 39.7 (8.4) 86.1 (13.7)
Other 26.9(6.0) 38.0 (10.1) 86.0 (17.3)
Number rooms P <0.001 c P <.0.001 c P <0.001 c
1-2 26.8 (5.4) 37.6 (7.0) 84.9 (12.4)
3-4 27.8 (4.6) 40.0 (7.0) 85.4 (11.5)
5-6 30.3 (5.4) 42.7 (7.6) 92.6 (15.4)
> = 7 28.9 (5.2) 40.9 (8.5) 90.7 (16.2)
Expenditure (Ksh) P <0.001 c P <0.001 c P = 0.014a
<10 000 26.2 (5.1) 37.2 (7.7) 83.8 (12.7)
Table 2 Mean body mass index, percent body fat andwaist circumference of women (n = 365) by selectedsocio-demographic characteristics (Continued)
10 001–20 000 28.1 (5.3) 39.8 (7.2) 86.8 (12.5)
20 001–30 000 28.9 (4.8) 41.4 (7.5) 88.8 (12.4)
30 001–40 000 29.4 (5.6) 40.4 (8.1) 91.7 (16.7)
> = 40 000 29.7 (4.9) 42.3 (6.7) 89.4 (14.7)
BMI = body mass index; WC=waist circumference; SD = standard deviation;Ksh = Kenyan shillings.a Significant differences at p <0.05; b Significant differences at p <0.01; c
Significant differences at p <0.001.
Mbochi et al. BMC Public Health 2012, 12:823 Page 5 of 9http://www.biomedcentral.com/1471-2458/12/823
showed greater mean BMI,%BF and WC at highly sig-nificant levels (p <0.001). Divorced and widowed womenalso have greater mean BMI and WC values.The largest percentage women with high physical activ-
ity levels (PALs) are found in the lowest three SE groups(p <0.001) (Table 3). These three groups also have thelowest levels of sedentary time (p <0.0001). There is asignificant increase in mean BMI (p <0.001),% BF(p <0.01) and WC (p <0.05) as PAL levels decrease withthe highest mean BMI,%BF and WC found at the lowestlevel of PAL (Table 4). There is a similar trend with in-creasing sedentary time which is only significant forBMI; with the highest mean BMI having the highest levelof sedentary time (p <0.05).Table 5 shows that the upper two SE groups have sig-
nificantly higher mean protein (p <0.05), cholesterol(p <0.05) and alcohol (p <0.001) intakes than the lowerSE groups; while the lower SE groups have significantlyhigher mean fibre (p <0.001) and carbohydrate (p <0.05)intakes. This was due to a significantly more frequentconsumption of beef, chicken, processed meats and eggsby the highest two SE groups; while the lowest twogroups consumed significantly more dry beans and maizemeal (not shown). Both BMI (p <0.05) and% BF (p <01)are significantly greater when protein intake is higherthan 100% of the DRI (Table 6). This is also the case formean fat intake. A fat intake greater than 100% of theDRI has a significantly greater mean BMI (p <0.05) thana fat intake less than 100% of the DRI.Most of the variance in BMI was explained by age,
total physical activity, percentage DRI of fat consumed,parity and socio-economic group, in that order, togetheraccounting for 18.0% of the variance in BMI (Table 7).The most significant predictors of overweight and obes-ity by fat percentage were age and the number of items/assets in the women’s households, both of whichexplained 17.8% of the variation in the body fat percent-age of the women. With regard to WC, age, parity andthe number of rooms in the houses where the womenresided, were the most significant predictors of
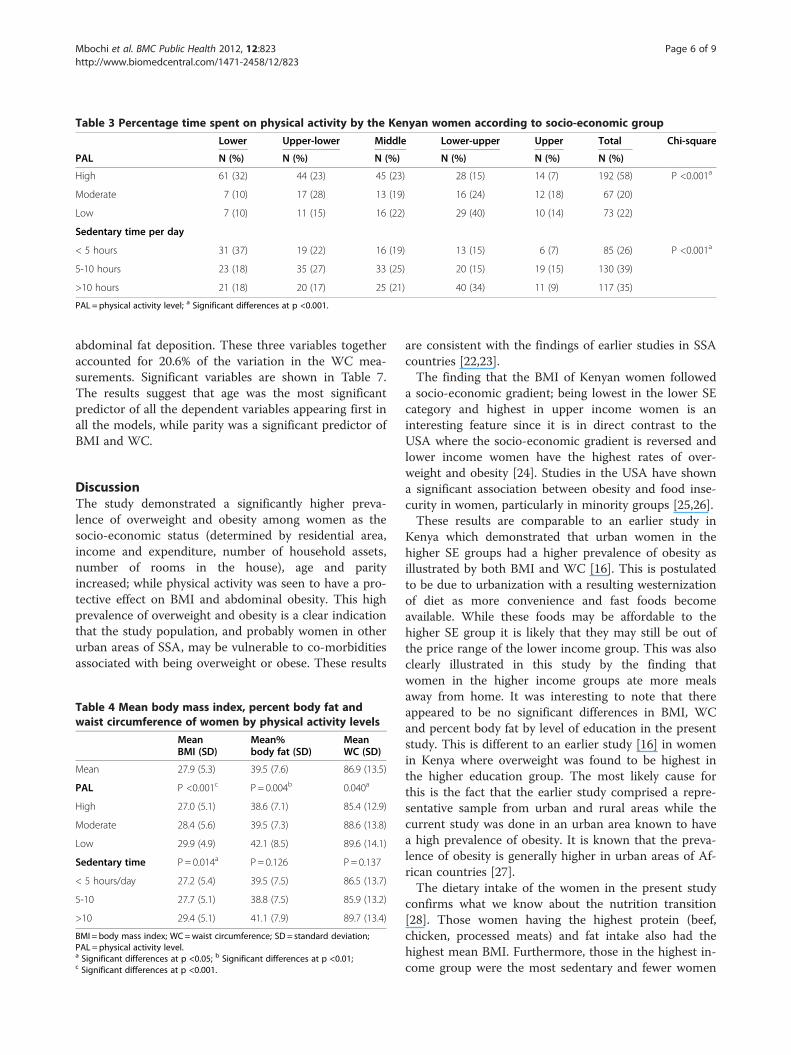
Table 3 Percentage time spent on physical activity by the Kenyan women according to socio-economic group
Lower Upper-lower Middle Lower-upper Upper Total Chi-square
PAL N (%) N (%) N (%) N (%) N (%) N (%)
High 61 (32) 44 (23) 45 (23) 28 (15) 14 (7) 192 (58) P <0.001a
Moderate 7 (10) 17 (28) 13 (19) 16 (24) 12 (18) 67 (20)
Low 7 (10) 11 (15) 16 (22) 29 (40) 10 (14) 73 (22)
Sedentary time per day
< 5 hours 31 (37) 19 (22) 16 (19) 13 (15) 6 (7) 85 (26) P <0.001a
5-10 hours 23 (18) 35 (27) 33 (25) 20 (15) 19 (15) 130 (39)
>10 hours 21 (18) 20 (17) 25 (21) 40 (34) 11 (9) 117 (35)
PAL = physical activity level; a Significant differences at p <0.001.
Mbochi et al. BMC Public Health 2012, 12:823 Page 6 of 9http://www.biomedcentral.com/1471-2458/12/823
abdominal fat deposition. These three variables togetheraccounted for 20.6% of the variation in the WC mea-surements. Significant variables are shown in Table 7.The results suggest that age was the most significantpredictor of all the dependent variables appearing first inall the models, while parity was a significant predictor ofBMI and WC.
DiscussionThe study demonstrated a significantly higher preva-lence of overweight and obesity among women as thesocio-economic status (determined by residential area,income and expenditure, number of household assets,number of rooms in the house), age and parityincreased; while physical activity was seen to have a pro-tective effect on BMI and abdominal obesity. This highprevalence of overweight and obesity is a clear indicationthat the study population, and probably women in otherurban areas of SSA, may be vulnerable to co-morbiditiesassociated with being overweight or obese. These results
Table 4 Mean body mass index, percent body fat andwaist circumference of women by physical activity levels
MeanBMI (SD)
Mean%body fat (SD)
MeanWC (SD)
Mean 27.9 (5.3) 39.5 (7.6) 86.9 (13.5)
PAL P <0.001c P = 0.004b 0.040a
High 27.0 (5.1) 38.6 (7.1) 85.4 (12.9)
Moderate 28.4 (5.6) 39.5 (7.3) 88.6 (13.8)
Low 29.9 (4.9) 42.1 (8.5) 89.6 (14.1)
Sedentary time P = 0.014a P = 0.126 P = 0.137
< 5 hours/day 27.2 (5.4) 39.5 (7.5) 86.5 (13.7)
5-10 27.7 (5.1) 38.8 (7.5) 85.9 (13.2)
>10 29.4 (5.1) 41.1 (7.9) 89.7 (13.4)
BMI = body mass index; WC=waist circumference; SD = standard deviation;PAL = physical activity level.a Significant differences at p <0.05; b Significant differences at p <0.01;c Significant differences at p <0.001.
are consistent with the findings of earlier studies in SSAcountries [22,23].The finding that the BMI of Kenyan women followed
a socio-economic gradient; being lowest in the lower SEcategory and highest in upper income women is aninteresting feature since it is in direct contrast to theUSA where the socio-economic gradient is reversed andlower income women have the highest rates of over-weight and obesity [24]. Studies in the USA have showna significant association between obesity and food inse-curity in women, particularly in minority groups [25,26].These results are comparable to an earlier study in
Kenya which demonstrated that urban women in thehigher SE groups had a higher prevalence of obesity asillustrated by both BMI and WC [16]. This is postulatedto be due to urbanization with a resulting westernizationof diet as more convenience and fast foods becomeavailable. While these foods may be affordable to thehigher SE group it is likely that they may still be out ofthe price range of the lower income group. This was alsoclearly illustrated in this study by the finding thatwomen in the higher income groups ate more mealsaway from home. It was interesting to note that thereappeared to be no significant differences in BMI, WCand percent body fat by level of education in the presentstudy. This is different to an earlier study [16] in womenin Kenya where overweight was found to be highest inthe higher education group. The most likely cause forthis is the fact that the earlier study comprised a repre-sentative sample from urban and rural areas while thecurrent study was done in an urban area known to havea high prevalence of obesity. It is known that the preva-lence of obesity is generally higher in urban areas of Af-rican countries [27].The dietary intake of the women in the present study
confirms what we know about the nutrition transition[28]. Those women having the highest protein (beef,chicken, processed meats) and fat intake also had thehighest mean BMI. Furthermore, those in the highest in-come group were the most sedentary and fewer women
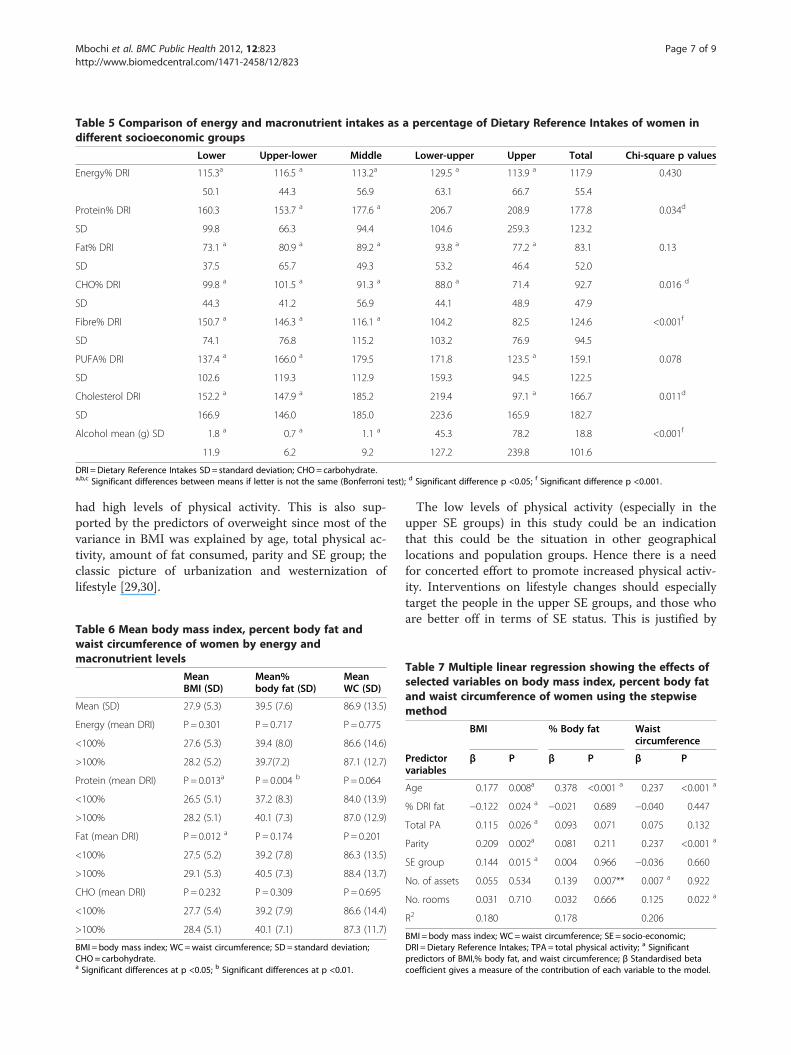
Table 5 Comparison of energy and macronutrient intakes as a percentage of Dietary Reference Intakes of women indifferent socioeconomic groups
Lower Upper-lower Middle Lower-upper Upper Total Chi-square p values
Energy% DRI 115.3a 116.5 a 113.2a 129.5 a 113.9 a 117.9 0.430
50.1 44.3 56.9 63.1 66.7 55.4
Protein% DRI 160.3 153.7 a 177.6 a 206.7 208.9 177.8 0.034d
SD 99.8 66.3 94.4 104.6 259.3 123.2
Fat% DRI 73.1 a 80.9 a 89.2 a 93.8 a 77.2 a 83.1 0.13
SD 37.5 65.7 49.3 53.2 46.4 52.0
CHO% DRI 99.8 a 101.5 a 91.3 a 88.0 a 71.4 92.7 0.016 d
SD 44.3 41.2 56.9 44.1 48.9 47.9
Fibre% DRI 150.7 a 146.3 a 116.1 a 104.2 82.5 124.6 <0.001f
SD 74.1 76.8 115.2 103.2 76.9 94.5
PUFA% DRI 137.4 a 166.0 a 179.5 171.8 123.5 a 159.1 0.078
SD 102.6 119.3 112.9 159.3 94.5 122.5
Cholesterol DRI 152.2 a 147.9 a 185.2 219.4 97.1 a 166.7 0.011d
SD 166.9 146.0 185.0 223.6 165.9 182.7
Alcohol mean (g) SD 1.8 a 0.7 a 1.1 a 45.3 78.2 18.8 <0.001f
11.9 6.2 9.2 127.2 239.8 101.6
DRI =Dietary Reference Intakes SD= standard deviation; CHO= carbohydrate.a,b,c Significant differences between means if letter is not the same (Bonferroni test); d Significant difference p <0.05; f Significant difference p <0.001.
Mbochi et al. BMC Public Health 2012, 12:823 Page 7 of 9http://www.biomedcentral.com/1471-2458/12/823
had high levels of physical activity. This is also sup-ported by the predictors of overweight since most of thevariance in BMI was explained by age, total physical ac-tivity, amount of fat consumed, parity and SE group; theclassic picture of urbanization and westernization oflifestyle [29,30].
Table 6 Mean body mass index, percent body fat andwaist circumference of women by energy andmacronutrient levels
MeanBMI (SD)
Mean%body fat (SD)
MeanWC (SD)
Mean (SD) 27.9 (5.3) 39.5 (7.6) 86.9 (13.5)
Energy (mean DRI) P = 0.301 P= 0.717 P = 0.775
<100% 27.6 (5.3) 39.4 (8.0) 86.6 (14.6)
>100% 28.2 (5.2) 39.7(7.2) 87.1 (12.7)
Protein (mean DRI) P = 0.013a P = 0.004 b P = 0.064
<100% 26.5 (5.1) 37.2 (8.3) 84.0 (13.9)
>100% 28.2 (5.1) 40.1 (7.3) 87.0 (12.9)
Fat (mean DRI) P = 0.012 a P = 0.174 P = 0.201
<100% 27.5 (5.2) 39.2 (7.8) 86.3 (13.5)
>100% 29.1 (5.3) 40.5 (7.3) 88.4 (13.7)
CHO (mean DRI) P = 0.232 P= 0.309 P = 0.695
<100% 27.7 (5.4) 39.2 (7.9) 86.6 (14.4)
>100% 28.4 (5.1) 40.1 (7.1) 87.3 (11.7)
BMI = body mass index; WC=waist circumference; SD = standard deviation;CHO= carbohydrate.a Significant differences at p <0.05; b Significant differences at p <0.01.
The low levels of physical activity (especially in theupper SE groups) in this study could be an indicationthat this could be the situation in other geographicallocations and population groups. Hence there is a needfor concerted effort to promote increased physical activ-ity. Interventions on lifestyle changes should especiallytarget the people in the upper SE groups, and those whoare better off in terms of SE status. This is justified by
Table 7 Multiple linear regression showing the effects ofselected variables on body mass index, percent body fatand waist circumference of women using the stepwisemethod
BMI % Body fat Waistcircumference
Predictorvariables
β P β P β P
Age 0.177 0.008a 0.378 <0.001 a 0.237 <0.001 a
% DRI fat −0.122 0.024 a −0.021 0.689 −0.040 0.447
Total PA 0.115 0.026 a 0.093 0.071 0.075 0.132
Parity 0.209 0.002a 0.081 0.211 0.237 <0.001 a
SE group 0.144 0.015 a 0.004 0.966 −0.036 0.660
No. of assets 0.055 0.534 0.139 0.007** 0.007 a 0.922
No. rooms 0.031 0.710 0.032 0.666 0.125 0.022 a
R2 0.180 0.178 0.206
BMI = body mass index; WC=waist circumference; SE = socio-economic;DRI =Dietary Reference Intakes; TPA = total physical activity; a Significantpredictors of BMI,% body fat, and waist circumference; β Standardised betacoefficient gives a measure of the contribution of each variable to the model.
Mbochi et al. BMC Public Health 2012, 12:823 Page 8 of 9http://www.biomedcentral.com/1471-2458/12/823
the rising levels of overweight and obesity up the SE lad-der, and the low levels of physical activity relative to theother SE groups.The high prevalence of overweight and obesity in all
three indicators calls for public health interventions toreduce the prevalence of overweight and obesity amongurban women in Kenya . Awareness programs about theconsequences of overall and abdominal obesity includingprevention activities should be made available in theworkplace and in the community to act as referencepoints for the women in these areas. Even as the govern-ment of Kenya, non-governmental organizations andother stakeholders grapple with the problem of hungerand food insecurity, some effort should be directed to-wards overweight and obesity because of the associatedhealth risks. This problem needs to be emphasized asthe prevalence of obesity keeps increasing, and may con-tinue to worsen unless appropriate preventive measuresare taken.
ConclusionsThe predictors of overweight and obesity showed thaturbanization and the nutrition transition were wellestablished in the sample of women studied in the highSE groups. They exhibited a sedentary lifestyle and con-sumed a diet high in energy, protein, fat, cholesterol,and alcohol and lower in fibre and carbohydrate com-pared with those in the low SE groups.
RecommendationsIn terms of practice, the high rates of overweight andobesity among the women point to a need for behaviourchange related to improved lifestyle through increasedphysical activity and improved dietary practices. Thiscould be through increasing their physical activity, bothplanned and unplanned, for instance by walking or en-rolling in facilities that offer planned physical activity.For women who are in lower socio-economic groups,and who cannot afford these facilities, walking or joggingcould be recommended. In terms of policy, the studyfound that overweight and obesity is not a problem onlylimited to the high socio-economic groups; hence afford-able interventions targeting all socio-economic groupsshould be put in place.With regard to further research, studies to determine
nutrition knowledge and attitudes of Kenyan womenand the determinants of different behaviours that maylead to overweight and obesity (e.g. why people makethe food choices they do; and perceived barriers tohealthy eating and engaging in physical activity) shouldbe done in order to understand the problem and to de-velop relevant, practical solutions.
Competing interestsThe authors declare that they have no competing interest.
Authors’ contributionsEK, JK and SO were involved in planning of the study and design. RM wasinvolved in planning, field work, data analyses and writing. NPS was involvedconceptually and in writing the manuscript. All authors read and approvedthe final manuscript.
Author details1Department of Foods, Nutrition and Dietetics, Kenyatta University, Nairobi,Kenya. 2Centre for the Study of Social and Environmental Determinants ofNutrition; Population Health, Health Systems, and Innovation, HumanSciences Research Council, P Bag X9182, Cape Town 8000, South Africa.
Received: 21 February 2012 Accepted: 14 September 2012Published: 25 September 2012
References1. Ziraba AK, Fortso JC, Ochako R: Overweight and obesity in urban Africa: a
problem of the rich or the poor? BMC Publ Health 2009, 9:465. AccessedDecember 30th 2009, http://www.biomedcentral.com/content/pdf/1471-24.
2. Siega-Riz AM, Evenson KR, Dole N: Pregnancy-related weight gain- a linkto obesity? Nutr Rev 2004, 62(7):S105–S111.
3. Popkin BM: An overview on the nutrition transition and its healthimplications: the Bellagio meeting. Public Health Nutr 2002, 5:93–103.
4. WHO: Global Strategy on Diet. Geneva: Physical Activity and Health; 2004.Accessed November 18th 2009, www.who.int/dietphysicalactivity.org.
5. Kenya National Bureau of Statistics (KNBS) and ICF Macro: KenyaDemographic and Health Survey 2008–09. Calverton, Maryland: KNBS and ICFMacro; 2010.
6. Schlenker ED, Long S: Essentials of Nutrition and Diet Therapy. 9th edition. St.Louis, Mo: Mosby Elsevier; 2007.
7. American Obesity Association: AOA Fact Sheets. 2005. Accessed http://obesity1.tempdomainname.com/subs.
8. Hu FB: Overweight and obesity in women: Health risks andconsequences. J Womens Health 2003, 12(2):163–172. Accessed January15th 2008 http://www.ncbi.nlm.nih.gov/pubmed/12737715.
9. Riley JC: Rising Life Expectancy: A Global History. New York: CambridgeUniversity Press; 2001.
10. Philip W, James T: The challenges of obesity and its associated chronicdiseases. Nutrition Transition, Obesity and Non-communicable Diseases: Drivers,Outlook and Concerns. Rome: FAO United Nations System StandingCommittee on Nutrition; 2005.
11. WHO: Preventing and managing the global epidemic. Report of a WHOconsultation. WHO technical report series, no. 894. Geneva: WHO; 2000.
12. Mugenda OM, Mugenda AG: Research methods: quantitative and qualitativeapproaches. Nairobi: Acts Press; 1999.
13. Armstrong T, Bull F: Development of the World Health OrganizationGlobal Physical Activity Questionnaire (GPAQ) J. Public Health 2006,14(2):66–70.
14. Labadarios D, Steyn NP, Maunder E, Gericke G, Swart R, Huskisson J,Dannhauser A, Vorster HH, Nesamvuni AE, Nel JH: The National FoodConsumption Survey (NFCS): South Africa, 1999. Public Health Nutr 2005,8(5):533–543. http://www.ncbi.nlm.nih.gov/pubmed/16153334.
15. Steyn NP, Burger S, Monyeki KD, Alberts M, Nthangeni G: Seasonalvariation in dietary intake of the adult population of Dikgale. S Afr J C N2001, 14(4):140–145.
16. Steyn NP, Nel JH, Parker W, Ayah R, Mbithe D: Dietary, social, andenvironmental determinants of obesity in Kenyan women. Scand J PublicHealth 2011, 39:88–97. http://www.ncbi.nlm.nih.gov/pubmed/20851847.
17. Gibson RS, Fegusson EL: An interactive 24-Hour recall for assessing theadequacy of iron and zinc intakes in developing countries. Washington D.C:ILSI Press; 1999.
18. Steyn NP, Senekal M: Dietary Assessment and Education Kit (DAEK). CapeTown: Chronic Diseases of Lifestyle Unit, Medical Research Council; http://www.mrc.ac.za/chronic/cdlbrochure.pdf. Accessed 12/12/2011.
19. Sapp SG, Jensen H: Reliability and validity of nutrition knowledge, anddiet-health awareness tests developed from the 1989–1991 diet andhealth knowledge surveys. J Nutr Educ 1997, 29:63–72.
Mbochi et al. BMC Public Health 2012, 12:823 Page 9 of 9http://www.biomedcentral.com/1471-2458/12/823
20. Talmage H, Rasher SP: Validity and reliability issues in measurementinstrumentation. J Nutr Educ 1981, 13:83–85.
21. NutritSurvey program (EBISpro): Nutrition Surveys and Calculations.: ;Accessed 12/12/2011 http://www.nutrisurvey.de/.
22. Duda RB, Darko R, Seffah J, Adanu RMK, Anarfi JK, Hill AG: Prevalence ofobesity in women of Accra, Ghana. Afr J Health Sci 2007, 14(3–4). AccessedNovember 21st 2009, http://www.bioline.org.br/pdf?jh07023.
23. Fezeu L, Minkoulou E, Balkau B, Kengne A, Awah P, Unwin N, Alberti G,Mbanya J: Association between socio-economic status and adiposity inurban Cameroon. Int J Epidemiol 2005, Accessed 16th 2009, www.ncbi.nlm.nih.gov/pubmed/.
24. Flegal KM, Carroll MD, Ogden CL, Jonson CI: Prevalence and trends inobesity among US adults 1999–2000. JAMA 2002, 288(14):1723–1727.
25. Adams EJ, Grummer-Strawn L, Chavez G: Food insecurity is associatedwith increased risk of obesity in California women. J Nutr 2003,133(4):1070–1074.
26. Townsend MS, Peerson J, Love B, Achterberg C, Murphy SP: Food insecurityis positively related to overweight in women. J Nutr 2001,131(6):1738–1745.
27. Demographic and Health Surveys: Country Reports. 2011. Accessed 28August 2012. [http://www.measuredhs.com/countries/].
28. Popkin BM: Global Nutrition Dynamics: The world is shifting rapidlytoward a diet linked with non communicable diseases. Am J Clin Nutr2006, 84(2):289–298.
29. Awah PK, Kengne AP, Fezeu LL, Mbanya J-C: Perceived risk factors ofcardiovascular diseases and diabetes in Cameroon. Health Educ Res 2008,23(4):612–620.
30. Hossain P, Katar B, Nahas M: Obesity and diabetes in the developingworld-A growing challenge. New Eng J Med 2007, 356(3):213–215.
doi:10.1186/1471-2458-12-823Cite this article as: Mbochi et al.: Predictors of overweight and obesityin adult women in Nairobi Province, Kenya. BMC Public Health 201212:823.
Submit your next manuscript to BioMed Centraland take full advantage of:
• Convenient online submission
• Thorough peer review
• No space constraints or color figure charges
• Immediate publication on acceptance
• Inclusion in PubMed, CAS, Scopus and Google Scholar
• Research which is freely available for redistribution
Submit your manuscript at www.biomedcentral.com/submit


