Embed Size (px)
Citation preview
J. Serb. Chem. Soc. 75 (10) 1421–1434 (2010) UDC 542.97+544.6.076.32–033.5: JSCS–4064 665.7.035.7.000.57 Original scientific paper
1421
Preparation and electrochemical application of rutin biosensor for differential pulse voltammetric determination of NADH
in the presence of acetaminophen HAMID R. ZARE*, REZA SAMIMI, NAVID NASIRIZADEH
and MOHAMMAD MAZLOUM-ARDAKANI
Department of Chemistry, Yazd University, Yazd, 89195-741, Iran
(Received 9 February, revised 14 May 2010)
Abstract: The electrocatalytic behavior of reduced nicotinamide adenine dinuc-leotide (NADH) was studied at the surface of a rutin biosensor, using various electrochemical methods. According to the results, the rutin biosensor had a strongly electrocatalytic effect on the oxidation of NADH with the overpoten-tial being decreased by about 450 mV as compared to the process at a bare glassy carbon electrode, GCE. This value is significantly greater than the value of 220 mV that was reported for rutin embedded in a lipid-cast film. The ki-netic parameters of the electron transfer coefficient, α, and the heterogeneous charge transfer rate constant, kh, for the electrocatalytic oxidation of NADH at the rutin biosensor were estimated. Furthermore, the linear dynamic range; sen-sitivity and limit of detection for NADH were evaluated using the differential pulse voltammetry method. The advantages of this biosensor for the determi-nation of NADH are excellent catalytic activity and reproducibility, good de-tection limit and high exchange current density. The rutin biosensor could se-parate the oxidation peak potentials of NADH and acetaminophen present in the same solution while at a bare GCE, the peak potentials were indistin-guishable.
Keywords: electrocatalytic behavior; rutin; NADH; biosensor, acetaminophen.
INTRODUCTION
The electrochemical oxidation of dihydronicotinamide adenine dinucleotide (NADH) to the corresponding oxidized form (NAD+) in aqueous solution has re-ceived considerable attention. This is due to its significance both as a cofactor for dehydrogenase enzymes and its role in the NAD+/NADH redox couple of the electron transfer chain. A great number of NADH-dependent dehydrogenases are often used in biochemical analysis, mostly in enzymatic assays.1,2 However, the
* Corresponding author. E-mail: [email protected] doi: 10.2298/JSC100209111Z
_________________________________________________________________________________________________________________________Available online at www.shd.org.rs/JSCS/
2010 Copyright (CC) SCS
1422 ZARE et al.
direct oxidation of NADH at an unmodified electrode surface is highly irrever-sible and occurs at a considerable overpotential.3 Moreover, possible side-pro-ducts formed during the NADH redox process can be adsorbed on the electrode surface, leading to electrode fouling.4 A decrease occurs in the overpotential of the oxidation of NADH through immobilization of some redox compounds on an electrode surface.5–18 The compounds are able to mediate the electron transfer between NADH and the electrode. The strategy of electrode modification is to decrease the overvoltage for NADH and have good catalytic properties. Various inorganic and organic materials, such as transition metal hexacyanoferrates,5–7 phenazines,8,9 phenoxazines,10–12 thionine derivatives,13 hydroquinone derivati-ves14–20 and carbon nanotubes,21 showed interesting catalytic properties for the electro-oxidation of NADH.
Acetaminophen (N-acetyl-p-aminophenol or parcetamol) is used widely all over the world as a pharmaceutical analgesic and antipyretic agent. Hence, it is necessary to develop a rapid, precise and reliable method for the determination of acetaminophen. Recently, multiwall carbon nanotubes,22 hematoxylin,23 cobalt hydroxide nanoparticles24 and nano-TiO225 modified electrodes were fabricated and applied to the electrochemical determination of acetaminophen.
The electrochemical behavior of rutin,26,27 the preparation of a few rutin modified electrodes and the investigation of their electrocatalytic effect for some important species28–31 were reported. Rutin, as a biological important molecule, is a derivative of catechol and has the basic structure of many natural products with physiological activities. Thus, it seems that the use of rutin as a modifier could be important and could yield some new information concerning the catalysis of slow reactions. In continuation of studies into the preparation of biosensors for the determination of NADH,14–18 the present study focuses on the fabrication of a rutin biosensor and its electrocatalytic effect on the oxidation of NADH. Cyclic voltammetry was used to characterize the electrocatalytic behavior of the rutin biosensor toward NADH oxidation. To evaluate the utility of the rutin biosensor for analytical application, it was used for the differential pulse voltammetric de-tection of NADH. The findings indicate that the rutin biosensor had several dis-tinct advantages, including excellent catalytic activity and reproducibility, good detection limit, and high exchange current density for NADH. Differential pulse voltammetry was also used to evaluate the analytical performance of the biosen-sor in the quantification of NADH in the presence of acetaminophen.
EXPERIMENTAL
All the electrochemical experiments were realized using a potentiostat PGSTAT 30 model from Autolab (Netherland) equipped with GPES 4.9 software. The geometric area of the glassy carbon-working electrode (Azar Electrode, Iran), was 0.031 cm2. A platinum ele-ctrode and a saturated calomel electrode (SCE) were used as the counter and reference elec-trodes, respectively. All the potentials are reported with respect to this reference electrode.
_________________________________________________________________________________________________________________________Available online at www.shd.org.rs/JSCS/
2010 Copyright (CC) SCS
RUTIN BIOSENSOR FOR DETERMINATION OF NADH 1423
NADH-Na2 (92 % purity), acetaminophen and the chemicals required for the preparation of the buffer solution were obtained from Merck and used as received. Rutin was purchased from Fluka and used without further purification. All the employed chemical reagents were of analytical grade. All the solutions were prepared with doubly distilled water. The NADH and the rutin solutions were prepared immediately prior to use.
For the preparation of the rutin biosensor, a glassy carbon electrode, GCE, was first polished mechanically with 0.05 µm alumina in a water slurry using a polishing cloth. Then, the electrode was rinsed with doubly distillated water. The electrochemical activation of the GCE was performed by continuous potential cycling from –1.1 to 1.6 V at a sweep rate of 100 mV s-1 in a sodium bicarbonate (0.10 M) solution until a stable voltammogram was obtained. For the construction of the biosensor, an activated electrode was placed in a 1.0 mM solution of rutin in 0.10 M phosphoric acid (pH 2.0). Then it was modified by 6 potential sweep cycles between 300 and 650 mV at 25 mV s-1. Subsequently, the modified electrode was rinsed with water and placed in a buffer solution (pH 7.0) to test its electrocatalytic behavior.
RESULTS AND DISCUSSION
Properties of the electrodeposited rutin layer at the activated glassy carbon electrode
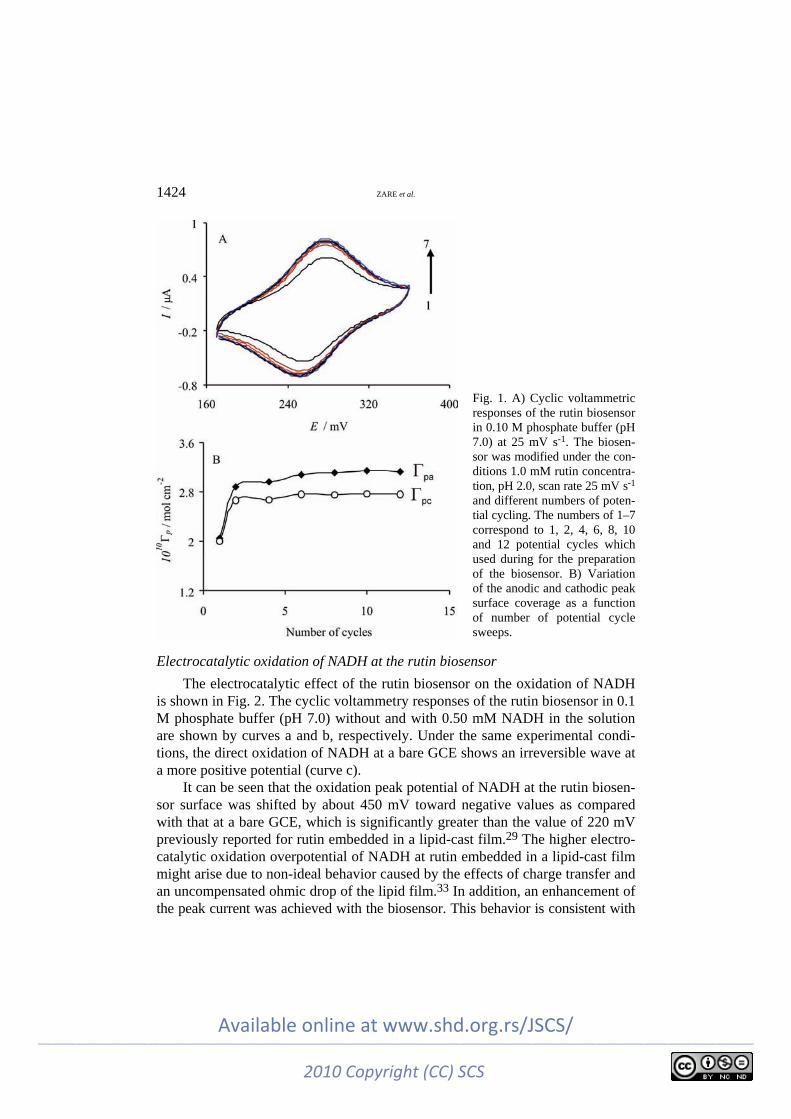
To investigate the possible mechanism of rutin electrodeposition on the acti-vated glassy carbon electrode (AGCE), the effect of the number of potential re-cycling during the preparation of the biosensor on its cyclic voltammetric res-ponses was studied. For this propose, electrodeposited rutin layers were prepared from a 1.0 mM solution of rutin at pH 2.0 using a different number of potential cycles. The effect of the number of potential cycles used for surface modification on the voltammetric response of the modified electrode is illustrated in Fig. 1A. The resulting surface coverage of rutin on the AGCE surface was then monitored as function of number of potential cycles. The surface coverage was evaluated from the cyclic voltammograms recorded at 100 mV s–1 in 0.1 M phosphate buf-fer (pH 7.0), using the equation Γ = Q/nFA, where Q is the charge obtained by integrating the anodic peak under the background correction and other symbols have their usual meanings. Figure 1B shows that both the anodic and cathodic surface coverage increased with increasing the number of potential cycles in the range of 1–6 cycles and then started to level off for more than six potential cycles.
Studies of the mechanism of electrodeposition of o- and p-quinone derivati-ves onto AGCE indicated that the immobilization of such compounds is based on a nucleophilic attack of the quinones resulting from the oxidation of the parent hydroquinone.18,19 When AGCE is used as the platform for the electro-oxidation of rutin, carboxyl and hydroxyl groups on the activated surface of the GCE18 behave as nucleophiles against the o-quinone formed from rutin oxidation. In-deed, the surface active functional groups, as nucleophiles, attack the position 6’ of the oxidized form of rutin30 that plays the role of a Michael acceptor.32 Such a process leads to chemical bond formation between the oxidized form of rutin and the surface active groups and, hence, to the deposition of rutin on the AGCE surface.
_________________________________________________________________________________________________________________________Available online at www.shd.org.rs/JSCS/
2010 Copyright (CC) SCS
1424 ZARE et al.
Fig. 1. A) Cyclic voltammetric responses of the rutin biosensor in 0.10 M phosphate buffer (pH 7.0) at 25 mV s-1. The biosen-sor was modified under the con-ditions 1.0 mM rutin concentra-tion, pH 2.0, scan rate 25 mV s-1 and different numbers of poten-tial cycling. The numbers of 1–7 correspond to 1, 2, 4, 6, 8, 10 and 12 potential cycles which used during for the preparation of the biosensor. B) Variation of the anodic and cathodic peak surface coverage as a function of number of potential cycle sweeps.
Electrocatalytic oxidation of NADH at the rutin biosensor
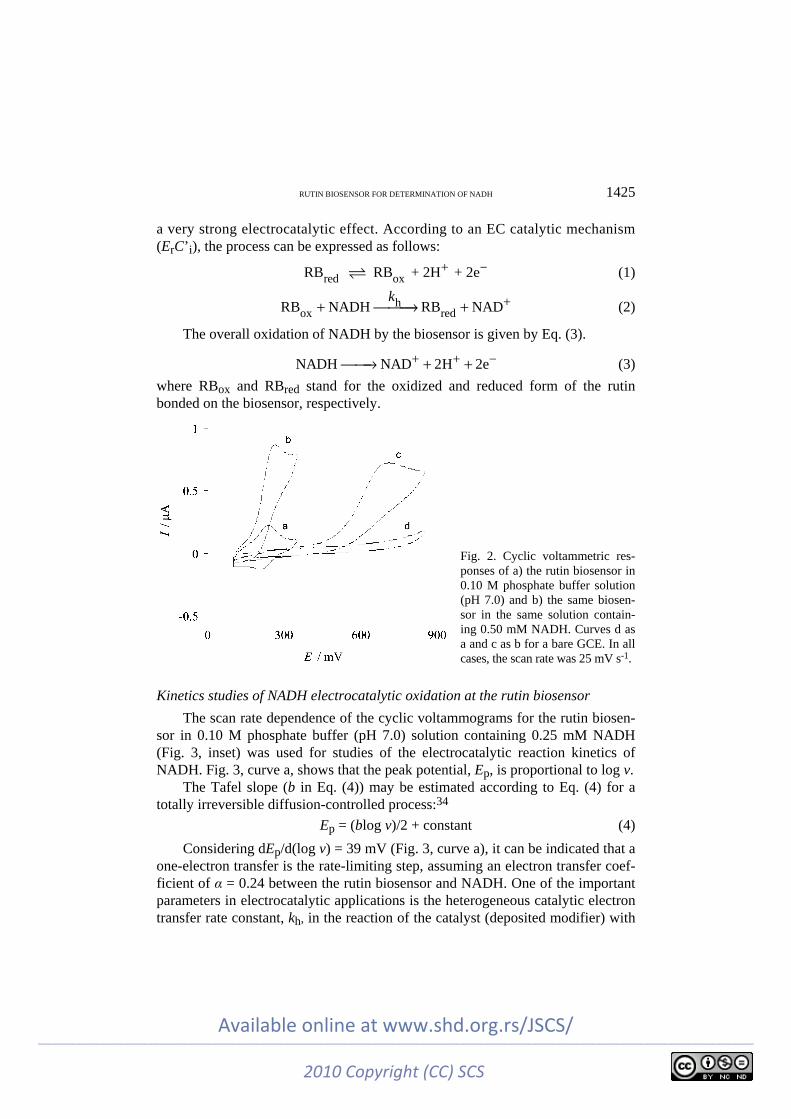
The electrocatalytic effect of the rutin biosensor on the oxidation of NADH is shown in Fig. 2. The cyclic voltammetry responses of the rutin biosensor in 0.1 M phosphate buffer (pH 7.0) without and with 0.50 mM NADH in the solution are shown by curves a and b, respectively. Under the same experimental condi-tions, the direct oxidation of NADH at a bare GCE shows an irreversible wave at a more positive potential (curve c).
It can be seen that the oxidation peak potential of NADH at the rutin biosen-sor surface was shifted by about 450 mV toward negative values as compared with that at a bare GCE, which is significantly greater than the value of 220 mV previously reported for rutin embedded in a lipid-cast film.29 The higher electro-catalytic oxidation overpotential of NADH at rutin embedded in a lipid-cast film might arise due to non-ideal behavior caused by the effects of charge transfer and an uncompensated ohmic drop of the lipid film.33 In addition, an enhancement of the peak current was achieved with the biosensor. This behavior is consistent with
_________________________________________________________________________________________________________________________Available online at www.shd.org.rs/JSCS/
2010 Copyright (CC) SCS
RUTIN BIOSENSOR FOR DETERMINATION OF NADH 1425
a very strong electrocatalytic effect. According to an EC catalytic mechanism (ErC’i), the process can be expressed as follows:
red oxRB RB + 2H + 2e+ − (1)
hox redRB NADH RB NAD
k ++ ⎯⎯⎯→ + (2)
The overall oxidation of NADH by the biosensor is given by Eq. (3).
NADH NAD 2H 2e+ + −⎯⎯→ + + (3)
where RBox and RBred stand for the oxidized and reduced form of the rutin bonded on the biosensor, respectively.
Fig. 2. Cyclic voltammetric res-ponses of a) the rutin biosensor in 0.10 M phosphate buffer solution (pH 7.0) and b) the same biosen-sor in the same solution contain-ing 0.50 mM NADH. Curves d as a and c as b for a bare GCE. In all cases, the scan rate was 25 mV s-1.
Kinetics studies of NADH electrocatalytic oxidation at the rutin biosensor
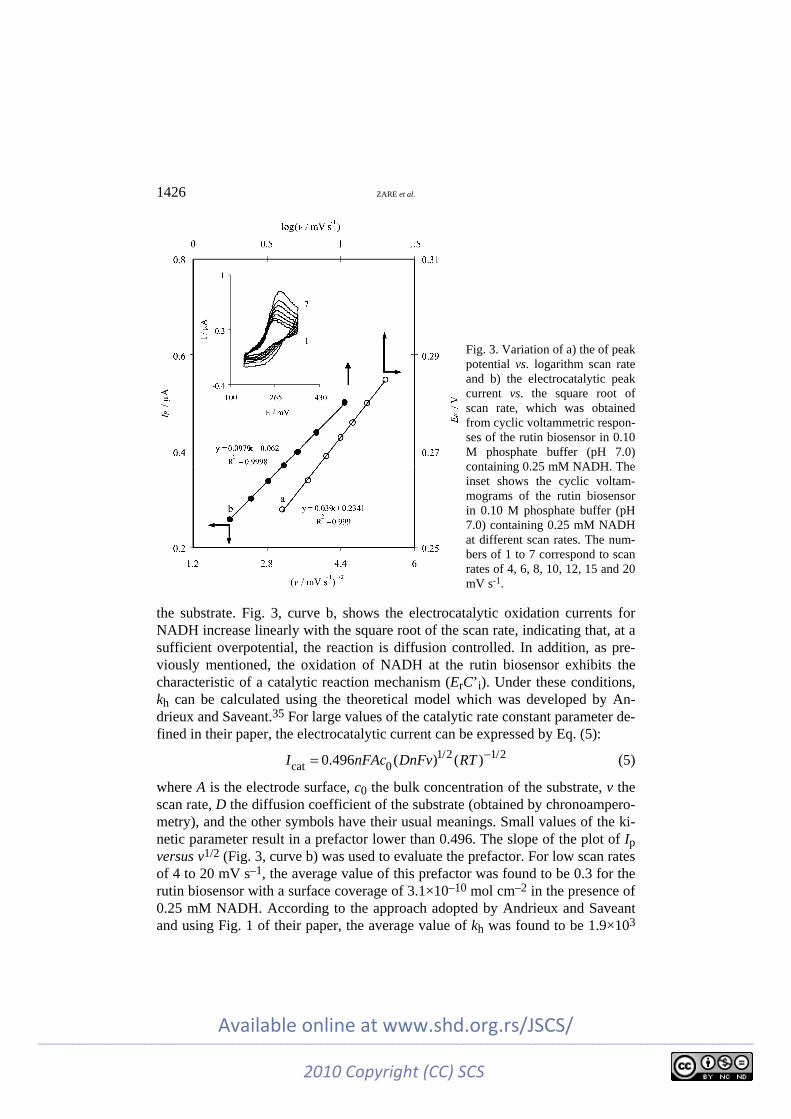
The scan rate dependence of the cyclic voltammograms for the rutin biosen-sor in 0.10 M phosphate buffer (pH 7.0) solution containing 0.25 mM NADH (Fig. 3, inset) was used for studies of the electrocatalytic reaction kinetics of NADH. Fig. 3, curve a, shows that the peak potential, Ep, is proportional to log v.
The Tafel slope (b in Eq. (4)) may be estimated according to Eq. (4) for a totally irreversible diffusion-controlled process:34
Ep = (blog v)/2 + constant (4)
Considering dEp/d(log v) = 39 mV (Fig. 3, curve a), it can be indicated that a one-electron transfer is the rate-limiting step, assuming an electron transfer coef-ficient of α = 0.24 between the rutin biosensor and NADH. One of the important parameters in electrocatalytic applications is the heterogeneous catalytic electron transfer rate constant, kh, in the reaction of the catalyst (deposited modifier) with
_________________________________________________________________________________________________________________________Available online at www.shd.org.rs/JSCS/
2010 Copyright (CC) SCS
1426 ZARE et al.
the substrate. Fig. 3, curve b, shows the electrocatalytic oxidation currents for NADH increase linearly with the square root of the scan rate, indicating that, at a sufficient overpotential, the reaction is diffusion controlled. In addition, as pre-viously mentioned, the oxidation of NADH at the rutin biosensor exhibits the characteristic of a catalytic reaction mechanism (ErC’i). Under these conditions, kh can be calculated using the theoretical model which was developed by An-drieux and Saveant.35 For large values of the catalytic rate constant parameter de-fined in their paper, the electrocatalytic current can be expressed by Eq. (5):
1/2 1/2cat 00.496 ( ) ( )I nFAc DnFv RT −= (5)
where A is the electrode surface, c0 the bulk concentration of the substrate, v the scan rate, D the diffusion coefficient of the substrate (obtained by chronoampero-metry), and the other symbols have their usual meanings. Small values of the ki-netic parameter result in a prefactor lower than 0.496. The slope of the plot of Ip versus v1/2 (Fig. 3, curve b) was used to evaluate the prefactor. For low scan rates of 4 to 20 mV s–1, the average value of this prefactor was found to be 0.3 for the rutin biosensor with a surface coverage of 3.1×10⁻¹⁰ mol cm–2 in the presence of 0.25 mM NADH. According to the approach adopted by Andrieux and Saveant and using Fig. 1 of their paper, the average value of kh was found to be 1.9×10³
Fig. 3. Variation of a) the of peak potential vs. logarithm scan rate and b) the electrocatalytic peak current vs. the square root of scan rate, which was obtained from cyclic voltammetric respon-ses of the rutin biosensor in 0.10 M phosphate buffer (pH 7.0) containing 0.25 mM NADH. The inset shows the cyclic voltam-mograms of the rutin biosensor in 0.10 M phosphate buffer (pH 7.0) containing 0.25 mM NADH at different scan rates. The num-bers of 1 to 7 correspond to scan rates of 4, 6, 8, 10, 12, 15 and 20 mV s-1.
_________________________________________________________________________________________________________________________Available online at www.shd.org.rs/JSCS/
2010 Copyright (CC) SCS
RUTIN BIOSENSOR FOR DETERMINATION OF NADH 1427
M–1 s–1. In addition, the slope of curve b of Fig. 3 was used to estimate the total number of electrons involved in the electrocatalytic oxidation of NADH at the biosensor. According to the following equation for a totally irreversible process:36
5 1/2 1/2 1/2P α 03.01 10 [(1 ) ]I n α n Ac D v= × − (6)
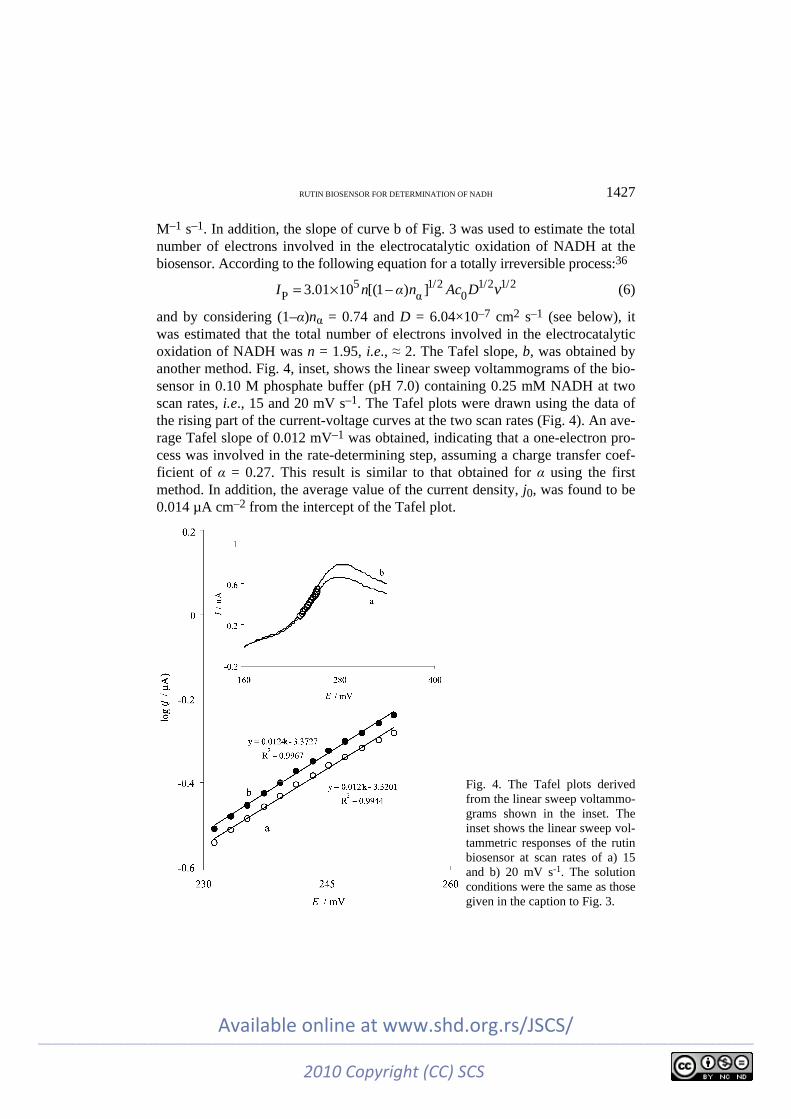
and by considering (1–α)nα = 0.74 and D = 6.04×10⁻⁷ cm2 s–1 (see below), it was estimated that the total number of electrons involved in the electrocatalytic oxidation of NADH was n = 1.95, i.e., ≈ 2. The Tafel slope, b, was obtained by another method. Fig. 4, inset, shows the linear sweep voltammograms of the bio-sensor in 0.10 M phosphate buffer (pH 7.0) containing 0.25 mM NADH at two scan rates, i.e., 15 and 20 mV s–1. The Tafel plots were drawn using the data of the rising part of the current-voltage curves at the two scan rates (Fig. 4). An ave-rage Tafel slope of 0.012 mV–1 was obtained, indicating that a one-electron pro-cess was involved in the rate-determining step, assuming a charge transfer coef-ficient of α = 0.27. This result is similar to that obtained for α using the first method. In addition, the average value of the current density, j0, was found to be 0.014 µA cm–2 from the intercept of the Tafel plot.
Fig. 4. The Tafel plots derived from the linear sweep voltammo-grams shown in the inset. The inset shows the linear sweep vol-tammetric responses of the rutin biosensor at scan rates of a) 15 and b) 20 mV s-1. The solution conditions were the same as those given in the caption to Fig. 3.
_________________________________________________________________________________________________________________________Available online at www.shd.org.rs/JSCS/
2010 Copyright (CC) SCS
1428 ZARE et al.
Chronoamperometric and amperometric studies
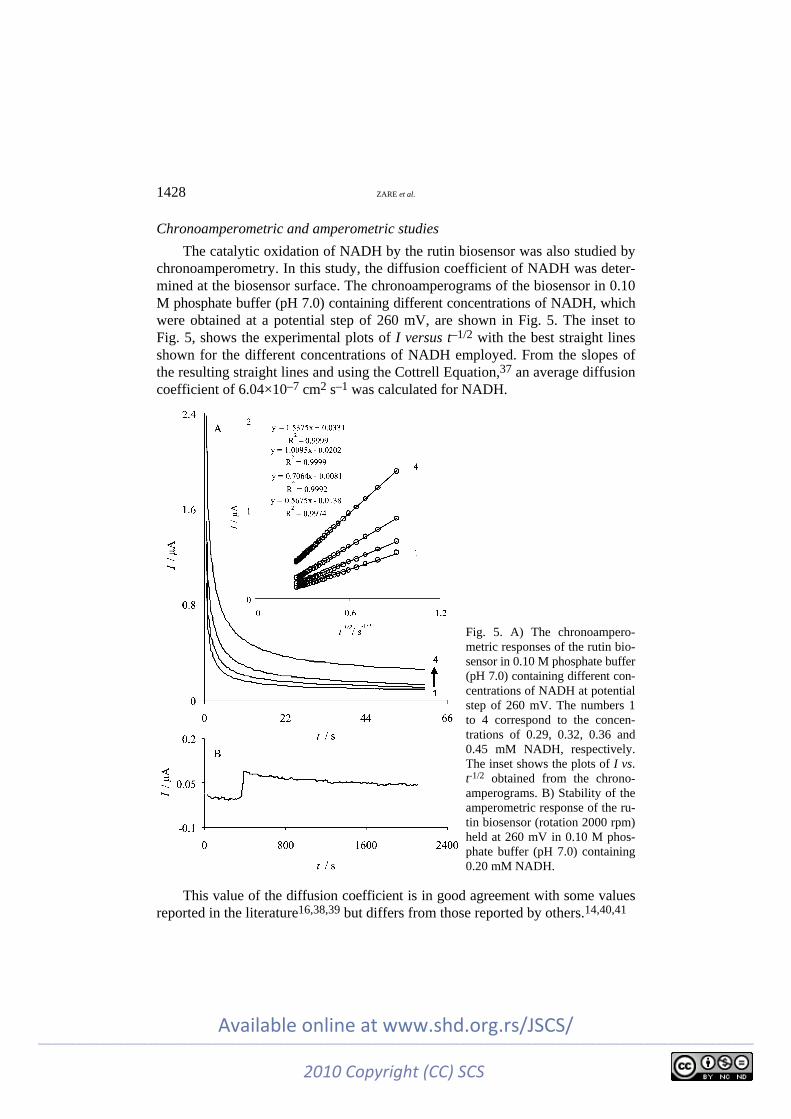
The catalytic oxidation of NADH by the rutin biosensor was also studied by chronoamperometry. In this study, the diffusion coefficient of NADH was deter-mined at the biosensor surface. The chronoamperograms of the biosensor in 0.10 M phosphate buffer (pH 7.0) containing different concentrations of NADH, which were obtained at a potential step of 260 mV, are shown in Fig. 5. The inset to Fig. 5, shows the experimental plots of I versus t–1/2 with the best straight lines shown for the different concentrations of NADH employed. From the slopes of the resulting straight lines and using the Cottrell Equation,37 an average diffusion coefficient of 6.04×10⁻⁷ cm2 s–1 was calculated for NADH.
Fig. 5. A) The chronoampero-metric responses of the rutin bio-sensor in 0.10 M phosphate buffer (pH 7.0) containing different con-centrations of NADH at potential step of 260 mV. The numbers 1 to 4 correspond to the concen-trations of 0.29, 0.32, 0.36 and 0.45 mM NADH, respectively. The inset shows the plots of I vs. t-1/2 obtained from the chrono-amperograms. B) Stability of the amperometric response of the ru-tin biosensor (rotation 2000 rpm) held at 260 mV in 0.10 M phos-phate buffer (pH 7.0) containing 0.20 mM NADH.
This value of the diffusion coefficient is in good agreement with some values reported in the literature16,38,39 but differs from those reported by others.14,40,41
_________________________________________________________________________________________________________________________Available online at www.shd.org.rs/JSCS/
2010 Copyright (CC) SCS
RUTIN BIOSENSOR FOR DETERMINATION OF NADH 1429
In addition, amperometry under stirring conditions was employed to estimate the long-term stability of the biosensor. The amperometric response of 0.20 mM NADH as recorded over a continuous 2110 s period is shown in Fig. 5B. As can be seen, the response of the biosensor after an initial decrease remained almost stable throughout the experiment. This fact indicates that there was no inhibition effect of NADH and its oxidation products on the rutin biosensor.
Differential pulse voltammetric detection of NADH at the rutin biosensor
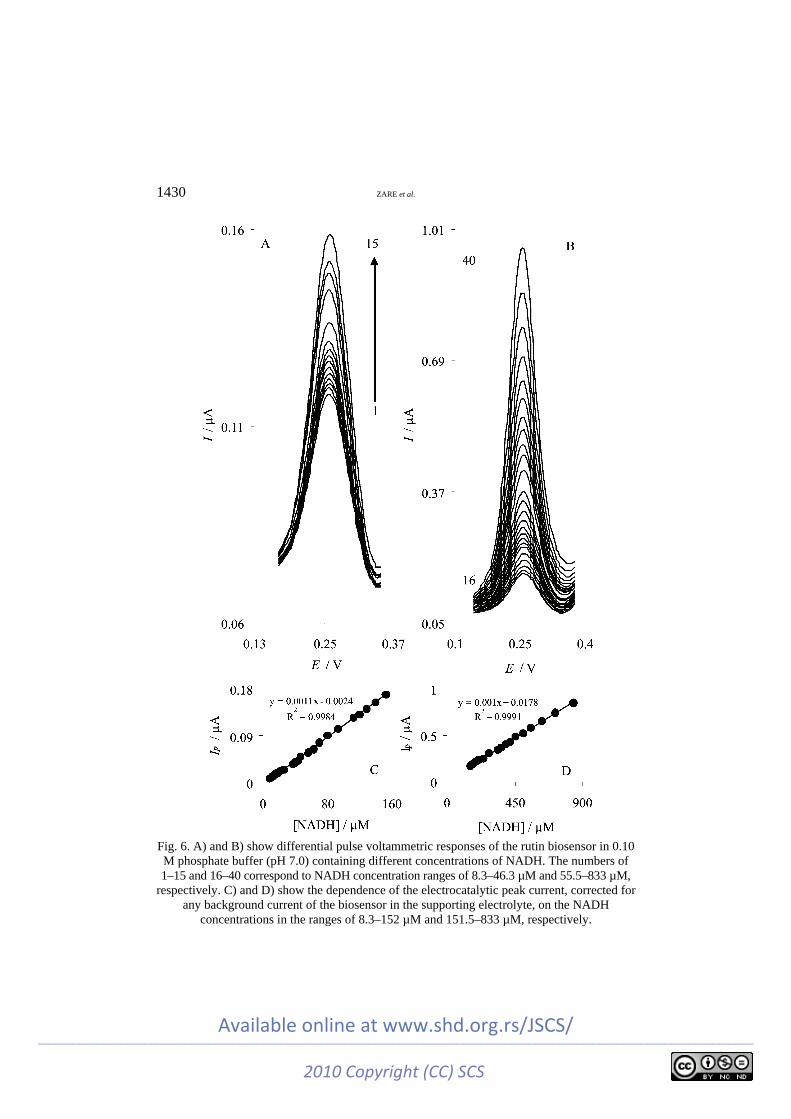
Differential pulse voltammetric, DPV, measurements were used to determine the linear range and to estimate the detection limit of NADH at the rutin bio-sensor. The voltammograms obtained for different concentrations of NADH are depicted in Figs. 6A and 6B. These figures show voltammograms in the NADH concentration ranges of 8.3–46.3 µM (Fig. 6A) and 55.5–833 µM (Fig. 6B). As shown in Fig. 6A, during the addition of even 1.7 µM NADH, a well-defined res-ponse was observed. The dependence of the electrocatalytic peak current, correc-ted for any background current of the biosensor in the supporting electrolyte, on the NADH concentration is shown in Figs. 6C and 6D.
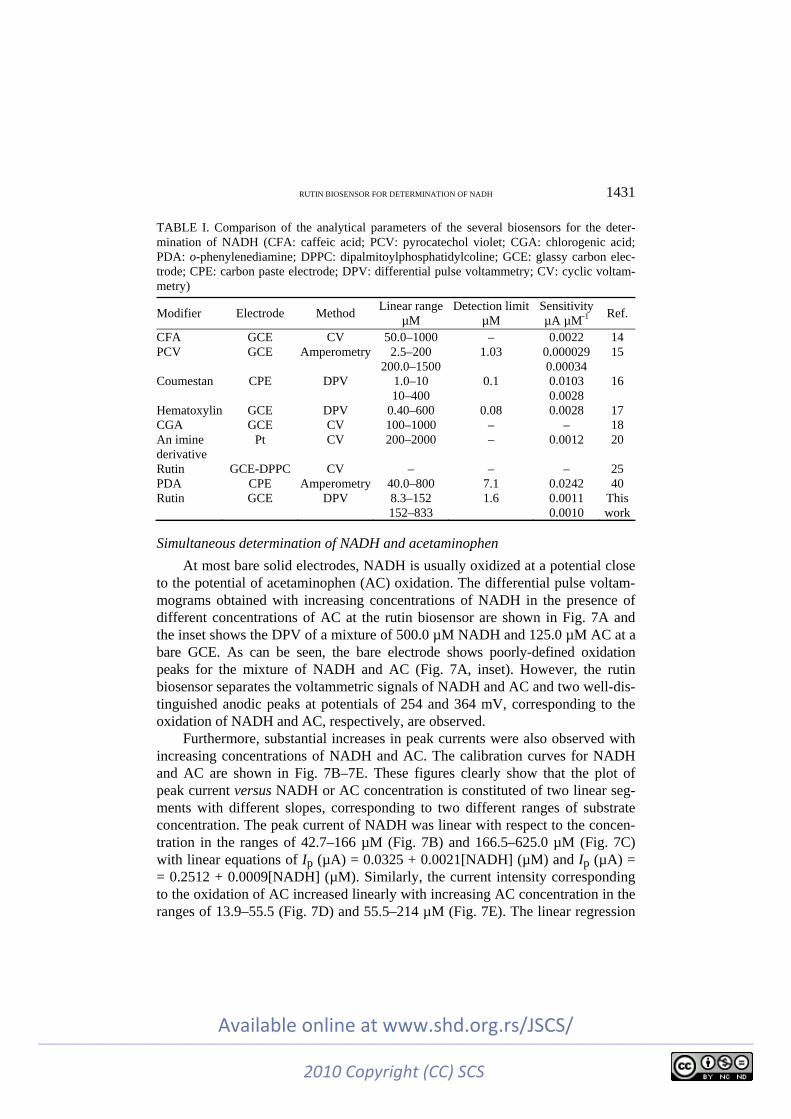
These figures clearly show that the plot of the peak current versus NADH concentration is constituted of two linear segments with different slopes, corres-ponding to two different NADH concentration ranges of 8.3–151.5 µM (Fig. 6C) and 151.5–833.3 µM (Fig. 6D). The linear least square calibration curves over the two linear ranges indicate that the regression lines fit very well with the expe-rimental data and the regression equations can be applied for the determination of NADH in unknown samples. Since DPV method has a much higher current sensitivity than the cyclic voltammetry method, the slope (m) of the calibration plot in the first linear range (Fig. 6C) was used to estimate the detection limit of NADH at the rutin biosensor. According to the method mentioned in reference,42 the lower detection limit, cm, was obtained using the equation cm = 3sbl/m, where sbl is the standard deviation of the blank response (µA). From an analysis of these data, the limit of detection of NADH was estimated to be 1.6 µM. The anal-ytical parameters of the electrocatalytic determination of NADH in this work are compared in Table I with the corresponding values previously reported for some biosensors.14–18,20,29,43 As can be seen, the responses of the proposed biosensor are comparable and even better than those obtained using several modified elec-trodes. In addition, a small variation in the sensitivity was observed when the concentration of NADH was changed in the two calibration ranges. The average voltammetric peak current for 18 repeated measurements (n = 18) of 55.5 µM NADH at the biosensor was 0.055±0.001 µA, which indicate that the biosensor is stable and also the results obtained are reproducible.
_________________________________________________________________________________________________________________________Available online at www.shd.org.rs/JSCS/
2010 Copyright (CC) SCS
1430 ZARE et al.
Fig. 6. A) and B) show differential pulse voltammetric responses of the rutin biosensor in 0.10 M phosphate buffer (pH 7.0) containing different concentrations of NADH. The numbers of 1–15 and 16–40 correspond to NADH concentration ranges of 8.3–46.3 µM and 55.5–833 µM,
respectively. C) and D) show the dependence of the electrocatalytic peak current, corrected for any background current of the biosensor in the supporting electrolyte, on the NADH
concentrations in the ranges of 8.3–152 µM and 151.5–833 µM, respectively.
_________________________________________________________________________________________________________________________Available online at www.shd.org.rs/JSCS/
2010 Copyright (CC) SCS
RUTIN BIOSENSOR FOR DETERMINATION OF NADH 1431
TABLE I. Comparison of the analytical parameters of the several biosensors for the deter-mination of NADH (CFA: caffeic acid; PCV: pyrocatechol violet; CGA: chlorogenic acid; PDA: o-phenylenediamine; DPPC: dipalmitoylphosphatidylcoline; GCE: glassy carbon elec-trode; CPE: carbon paste electrode; DPV: differential pulse voltammetry; CV: cyclic voltam-metry)
Modifier Electrode Method Linear range
µM Detection limit
µM Sensitivity µA µM-1
Ref.
CFA GCE CV 50.0–1000 – 0.0022 14 PCV GCE Amperometry 2.5–200
200.0–1500 1.03 0.000029
0.00034 15
Coumestan CPE DPV 1.0–10 10–400
0.1 0.0103 0.0028
16
Hematoxylin GCE DPV 0.40–600 0.08 0.0028 17 CGA GCE CV 100–1000 – – 18 An imine derivative
Pt CV 200–2000 – 0.0012 20
Rutin GCE-DPPC CV – – – 25 PDA CPE Amperometry 40.0–800 7.1 0.0242 40 Rutin GCE DPV 8.3–152
152–833 1.6 0.0011
0.0010 This work
Simultaneous determination of NADH and acetaminophen
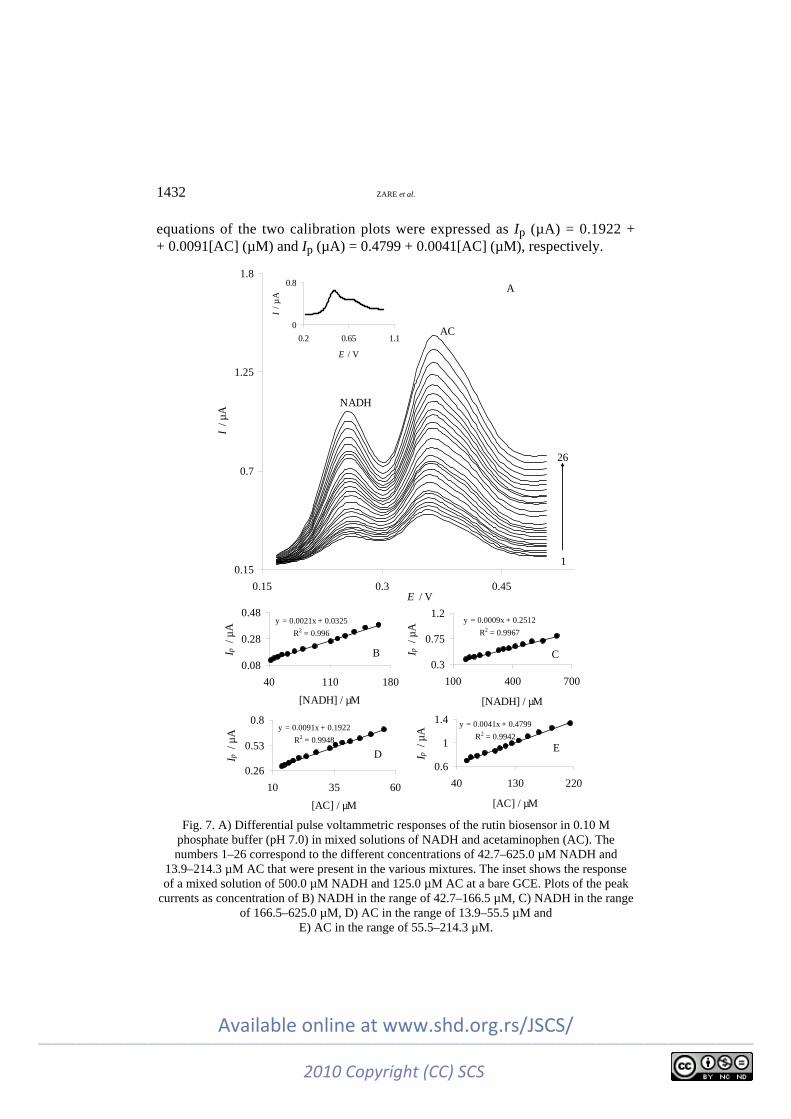
At most bare solid electrodes, NADH is usually oxidized at a potential close to the potential of acetaminophen (AC) oxidation. The differential pulse voltam-mograms obtained with increasing concentrations of NADH in the presence of different concentrations of AC at the rutin biosensor are shown in Fig. 7A and the inset shows the DPV of a mixture of 500.0 µM NADH and 125.0 µM AC at a bare GCE. As can be seen, the bare electrode shows poorly-defined oxidation peaks for the mixture of NADH and AC (Fig. 7A, inset). However, the rutin biosensor separates the voltammetric signals of NADH and AC and two well-dis-tinguished anodic peaks at potentials of 254 and 364 mV, corresponding to the oxidation of NADH and AC, respectively, are observed.
Furthermore, substantial increases in peak currents were also observed with increasing concentrations of NADH and AC. The calibration curves for NADH and AC are shown in Fig. 7B–7E. These figures clearly show that the plot of peak current versus NADH or AC concentration is constituted of two linear seg-ments with different slopes, corresponding to two different ranges of substrate concentration. The peak current of NADH was linear with respect to the concen-tration in the ranges of 42.7–166 µM (Fig. 7B) and 166.5–625.0 µM (Fig. 7C) with linear equations of Ip (µA) = 0.0325 + 0.0021[NADH] (µM) and Ip (µA) = = 0.2512 + 0.0009[NADH] (µM). Similarly, the current intensity corresponding to the oxidation of AC increased linearly with increasing AC concentration in the ranges of 13.9–55.5 (Fig. 7D) and 55.5–214 µM (Fig. 7E). The linear regression
_________________________________________________________________________________________________________________________Available online at www.shd.org.rs/JSCS/
2010 Copyright (CC) SCS
1432 ZARE et al.
equations of the two calibration plots were expressed as Ip (µA) = 0.1922 + + 0.0091[AC] (µM) and Ip (µA) = 0.4799 + 0.0041[AC] (µM), respectively.
0.15
0.7
1.25
1.8
0.15 0.3 0.45E / V
I / µ
A
1
26
A
NADH
AC0
0.8
0.2 0.65 1.1
E / V
I / µ
A
y = 0.0009x + 0.2512
R2 = 0.9967
0.3
0.75
1.2
100 400 700
[NADH] / µM
I p /
µA
C
y = 0.0021x + 0.0325
R2 = 0.996
0.08
0.28
0.48
40 110 180
[NADH] / µM
I p /
µA
B
y = 0.0041x + 0.4799
R2 = 0.9942
0.6
1
1.4
40 130 220
[AC] / µM
I p /
µA
E
y = 0.0091x + 0.1922
R2 = 0.9948
0.26
0.53
0.8
10 35 60
[AC] / µM
I p /
µA
D
Fig. 7. A) Differential pulse voltammetric responses of the rutin biosensor in 0.10 M
phosphate buffer (pH 7.0) in mixed solutions of NADH and acetaminophen (AC). The numbers 1–26 correspond to the different concentrations of 42.7–625.0 µM NADH and
13.9–214.3 µM AC that were present in the various mixtures. The inset shows the response of a mixed solution of 500.0 µM NADH and 125.0 µM AC at a bare GCE. Plots of the peak
currents as concentration of B) NADH in the range of 42.7–166.5 µM, C) NADH in the range of 166.5–625.0 µM, D) AC in the range of 13.9–55.5 µM and
E) AC in the range of 55.5–214.3 µM.
_________________________________________________________________________________________________________________________Available online at www.shd.org.rs/JSCS/
2010 Copyright (CC) SCS
RUTIN BIOSENSOR FOR DETERMINATION OF NADH 1433
CONCLUSIONS
The obtained results show that a rutin biosensor exhibits excellent electroca-talytic activity and reproducibility for NADH oxidation. The diffusion coefficient of NADH was calculated using chronoamperometric results as 6.04×10⁻⁷ cm2 s–1 under the employed experimental conditions. For the oxidation of NADH at the rutin biosensor, average values for the electron transfer coefficient, α, current density, j0, and the heterogeneous charge transfer rate constant, kh, of 0.27, 0.014 µA cm–2 and 1.9×10³ M–1 s–1 were obtained, respectively. Linear sweep and cyclic voltammetric methods were used for this purpose. The differential pulse voltammetric method was used for the determination of the detection limit, sensi-tivity and the linear range of NADH at the rutin biosensor. The most important advantages of the rutin biosensor for NADH determination are excellent catalytic activity and reproducibility, good detection limit, and high exchange current den-sity. Unlike bare GCE, the rutin biosensor could separate the oxidation peaks of NADH and acetaminophen when present in the same solution.
И З В О Д
ПРИПРЕМА И ПРИМЕНА БИОСЕНЗОРА НА БАЗИ РУТИНА ЗА ЕЛЕКТРОХЕМИЈСКО ОДРЕЂИВАЊЕ NADH У ПРИСУСТВУ АЦЕТАМИНОФЕНА ДИФЕРЕНЦИЈАЛНОМ
ПУЛСНОМ ВОЛТАМЕТРИЈОМ
HAMID R. ZARE, REZA SAMIMI, NAVID NASIRIZADEH и MOHAMMAD MAZLOUM-ARDAKANI
Department of Chemistry, Yazd University, Yazd, 89195-741, Iran
Коришћењем различитих електрохемијских метода испитивано је електрокаталитичко понашање редукованог никотинамид аденин динуклеотида (NADH) на површини биосензо-ра на бази рутина. Резултати су показали да биосензор на бази рутина испољава јак катали-тички ефекат на оксидацију NADH уз смањење пренапетости за око 450 mV у односу на ре-акцију на стакластом угљенику. Ово смањење пренапетости је знатно веће од 220 mV, што је вредност објављена за случај рутина који је био уграђен у липидни филм. У раду су одре-ђени кинетички параметри електрокаталитичке оксидације NADH – коефицијент прелаза, α, и константа брзине хетерогеног преноса наелектрисања, kh. Дифeренцијалном пулсном вол-таметријом је одређен линеарни динамички опсег, затим осетљивост и граница детекције NADH. Предности биосензора на бази рутина за одређивање NADH су одлична каталитичка активност и репродуктивност, ниска граница детекције и висока густина струје измене. Био-сензор на бази рутина може да раздвоји пикове оксидације NADH и ацетаминофена из истог раствора, док се на чистом стакластом угљенику поменути пикови преклапају.
(Примљено 9. фебруара, ревидирано 14. маја 2010)
REFERENCES
1. R. D. Braun, J. Electrochem. Soc. 124 (1977) 1342 2. R. Blonder, E. Katz, I. Willner, V. Wray, A. F. Buckmann, J. Am. Chem. Soc. 119 (1997)
11747 3. C.-X. Cai, K.-H. Xue, Microchem. J. 64 (2000) 131 4. M. Aizawa, R. W. Coughlin, M. Charles, Biochim. Biophys. Acta 385 (1975) 362 5. C. X. Cai, H. X. Ju, H. Y. Chen, J. Electroanal. Chem. 397 (1995) 185
_________________________________________________________________________________________________________________________Available online at www.shd.org.rs/JSCS/
2010 Copyright (CC) SCS
1434 ZARE et al.
6. C. X. Cai, H. X. Ju, H. Y. Chen, Anal. Chim. Acta 310 (1995) 145 7. M. Somasundrun, J. Hall, J. V. Bannister, Anal. Chim. Acta 295 (1994) 47 8. J. J. Kulys, Anal. Lett. 14 (1981) 377 9. A. Torstensson, L. Gorton, J. Electroanal. Chem. 130 (1981) 199
10. B. Persson, L. Gorton, J. Electroanal. Chem. 292 (1990) 115 11. F. Ni, H. Feng, L. Gorton, T. M. Cotton, Langmuir 6 (1990) 66 12. L. Gorton, A. Torestensson, H. Jaegfeldt, G. Johansson, J. Electroanal. Chem. 161 (1984) 103 13. K. Hajizadeh, H. T. Tang, H. B. Halsall, W. R. Heinemann, Anal. Lett. 24 (1991) 1453 14. H. R. Zare, S. M. Golabi, J. Solid. State Electrochem. 4 (2000) 87 15. S. M. Golabi, H. R. Zare, M. Hamzehloo, Electroanalysis 14 (2002) 611 16. H. R. Zare, N. Nasirizadeh, S. M. Golabi, M. Namazian, M. Mazloum-Ardekani, D.
Nematollahi, Sens. Actuators B 114 (2006) 610 17. H. R. Zare, N. Nasirizadeh, M. Mazloum-Ardakani, M. Namazian, Sens. Actuators B 120
(2006) 288 18. H. R. Zare, S. M. Golabi, J. Electroanal. Chem. 464 (1999) 14 19. F. Pariente, E. Lorenzo, H. D. Abruna, Anal. Chem. 66 (1994) 4337 20. E. Lorenzo, L. Sanchez, F. Pariente, J. Tirado, H. D. Abruna, Anal. Chim. Acta 309
(1995) 79 21. M. Musameh, J. Wang, A. Merkoci, Y. Lin, Electrochem. Commun. 4 (2002) 743 22. Z. A. Alothman, N. Bukhari, S. M. Wabaidur, S. Haider, Sens. Actuators B 146 (2010) 314 23. N. Nasirizadeh, H. R. Zare, Talanta 80 (2009) 656 24. M. Houshmand, A. Jabbari, H. Heli, M. Hajizadeh, A. A. Moosavi-Movahedi, J. Solid
State Electrochem. 12 (2008) 1117 25. S. A. Kumar, C.-F. Tang, S.-C. Chen, Talanta 76 (2008) 997 26. H. R. Zare, R. Samimi, M. Mazloum-Ardakani, Int. J. Electrochem. Sci. 4 (2009) 730 27. M. E. Ghica, A. M. O. Brett, Electroanalysis 17 (2005) 313 28. J. Tang, Z. Wu, J. Wang, E. Wang, Electroanalysis 13 (2001) 1315 29. J. Tang, Z. Wu, J. Wang, E. Wang, Electrochem. Commun. 2 (2000) 796 30. H. R. Zare, Z. Sobhani, M. Mazloum-Ardakani, Sens. Actuators B 126 (2007) 641 31. H. R. Zare, Z. Sobhani, M. Mazloum-Ardakani, J. Solid. State Electrochem. 11 (2007)
971 32. S. M. Golabi, D. Nematollahi, J. Electroanal. Chem. 430 (1997) 141 33. H. Jaegfeldt, A. B. C. Torstensson, L. G. O. Gorton, G. Johansson, Anal. Chem. 53 (1981)
1979 34. J. A. Harrison, Z. A. Khan, J. Electroanal. Chem. 28 (1970) 131 35. C. P. Andrieux, J. M. Saveant, J. Electroanal. Chem. 93 (1978) 163 36. S. Antoniadou, A. D. Jannakoudakis, E. Theodoridou, Synth. Met. 30 (1989) 295 37. A. J. Bard, L. R. Faulkner, Electrochemical methods: Fundamentals and Applications,
Wiley, New York, 2001. 38. Z. Y. Wu, W. G. Jing, E. Wang, Electrochem. Commun. 1 (1999) 545 39. S. M. Golabi, L. Irannejad, Electroanalysis 17 (2005) 985 40. J. Moiroux, P. J. Elving, J. Am. Chem. Soc. 102 (1980) 6533 41. F. Pariente, E. Lorenzo, F. Tobalina, H. D. Abruna, Anal. Chem. 67 (1995) 3936 42. D. A. Skoog, F. J. Holler, T. A. Nieman, Principles of Instrumental Analysis, 5th ed.,
Saunders College Publishing, London, 1998 43. A. C. Pereira, A. S. Santos, L. T. Kubota, Electrochim. Acta 48 (2003) 3541.
_________________________________________________________________________________________________________________________Available online at www.shd.org.rs/JSCS/
2010 Copyright (CC) SCS


