Embed Size (px)
Citation preview

Preparative chromatography
for modified oligonucleotides Method development for modified oligonucleotides, from
analytical to preparative chromatography
Preparativ kromatografi för modifierade oligonukleotider
Metodutveckling för modifierade oligonukleotider, från analytisk till
preparativ kromatografi
Rebecka Jasinski
Fakulteten för hälsa, natur- och teknikvetenskap
Examensarbete, civilingenjör kemiteknik
30 hp Handledare: Torgny Fornstedt (Karlstads Universitet) / Olof Stålberg (SGS DNA)
Examinator: Magnus Lestelius
2021-06-13

Abstract
Synthetic oligonucleotides, which are short strings of DNA or RNA, are a grooving area of
importance for the pharmaceutical industry and for companies that manufacture diagnostic
components. The manufacturing process of synthetic oligonucleotides involves many
complex processes that use separation and purification techniques like ion-exchange
chromatography, ion-pair reversed phase chromatography and ultra-performance liquid
chromatography. In this study, the focus lies on the purification process, where the main aim
is to develop a separation and purification method for modified oligonucleotides that can be
applied on different scales, from an analytical to a preparative scale.
Three modified oligonucleotides, and one unmodified with 44 bases, provided by
Scandinavian Gene Synthesis (Västerås, Sweden), were analysed and purified on an ultra-
performance liquid chromatography and on a preparative-system. Several parameters were
investigated, e.g. mobile phase composition, gradients and concentration. Practical analysis
and purification were made in two scales; analytical and semi-preparative.
The results showed that the samples contained impurities that were hard to separate from the
main sample. The scaling-up tests showed that, with increasing concentration, the impurities
become more aggregated with the main product. Fraction analysis showed that several pure
fractions were collected from the semi-preparative purification, and therefore some amount of
pure sample were collected from the semi-preparative run.
In conclusion, the method developed in this master thesis worked well as a significant amount
of samples were purified in the semi-preparative purification, and the method worked on
modified and unmodified oligonucleotides, containing different amount of modifications.
Keywords: oligonucleotides, preparative chromatography, scaling-up, ion-pair
chromatography, dibutylamine

Sammanfattning
Syntetiska oligonukleotider, vilket är korta strängar av DNA eller RNA, är ett framväxande
område i läkemedelsindustrin och för företag som tillverkar diagnostiska komponenter.
Tillverkningsprocessen för syntetiska oligonukleotider involverar många komplexa processer
som använder separation- och reningstekniker som jonbyteskromatografi,
jonparskromatografi och ultra-performance kromatografi. I denna studie ligger fokus på
reningsprocessen där det huvudsakliga syftet är att utveckla en separation- och reningsmetod
för modifierade oligonukleotider som kan appliceras på olika skalor – från analytisk till
preparativ skala.
Tre modifierade oligonukleotider, samt en omodifierad med 44 baser, tillhandahållet av
Scandinavian Gene Synthesis (Västerås, Sverige), analyserades och renades på ett ultra-
performance kromatografi system och ett preparativt reningssystem. Flertal parametrar
undersöktes, bland annat mobilfasens komposition, gradienter och koncentration. Analys och
rening utfördes i två skalor; analytisk och semi-preparativ skala.
Resultatet visade att proverna innehöll föroreningar som var svåra att separera från
huvudkomponenten. Uppskalningstesterna visade att föroreningarna blandade sig mer med
huvudkomponenten då koncentrationen ökade. Fraktionsanalyser visade att flera rena
fraktioner blev ihopsamlade från den semi-preparativa reningen, som därav visade att en
betydelsefull mängd rent prov blev renat i den semi-preparativa reningen.
Sammanfattningsvis, den metod som utvecklats i denna uppsats fungerade bra då
betydelsefulla mängder oligonukleotider kunde renas till olika grad vid den semi-preparativa
reningen, samt att metoden fungerade för både modifierade och icke-modifierade
oligonukleotider som innehöll olika mängder modifikationer.
Nyckelord: oligonukleotider, preparativ kromatografi, uppskalning, jonparskromatografi,
dibutylamin

List of abbreviations
Abbreviation
A
ACN
C
DBA
DNA
HCl
HFIP
IEX
IP-RPLC
LC
MeOH
MS
ON
RNA
RPLC
SGS DNA
T
TEA
Tris
U
UPLC
UV
Description
Adenosine
Acetonitrile
Cytidine
Dibutylamine
Deoxyribonucleic acid
Hydrochloric acid
Hexafluoro-2-propanol
Ion-exchange liquid chromatography
Ion-pair reversed phase liquid chromatography
Liquid chromatography
Methanol
Mass spectroscopy
Oligonucleotide
Ribonucleic acid
Reversed-phase liquid chromatography
Scandinavian Gene Synthesis
Thymine
Triethylamine
Trisaminomethane
Uridine
Ultra-performance liquid chromatography
Ultraviolet

Table of Contents
1. Introduction ............................................................................................................................ 1
1.1 Aim ................................................................................................................................... 2
1.2 Sustainability .................................................................................................................... 3
1.2.1 Environment .............................................................................................................. 3
1.2.2 Economic ................................................................................................................... 3
1.2.3 Social ......................................................................................................................... 3
2. Background and theory .......................................................................................................... 4
2.1 Oligonucleotides ............................................................................................................... 4
2.1.2 Modifications ............................................................................................................ 5
2.1.3 (n - 1) shortmer .......................................................................................................... 5
2.2 Chromatographic Theory and Definitions ........................................................................ 6
2.2.1 Isocratic and gradient elution .................................................................................... 6
2.2.2 Analytical Chromatography ...................................................................................... 7
2.2.2.1 Gaussian and Asymmetrical Peaks ........................................................................ 7
2.2.2.2 Retention and retention factor ................................................................................ 8
2.2.2.3 Resolution ............................................................................................................... 8
2.2.2.4 Plate Height and Theoretical Plates ...................................................................... 9
2.2.2.5 van Deemter Equation ............................................................................................ 9
2.2.2.6 Efficiency .............................................................................................................. 10
2.2.3 Preparative Chromatography ................................................................................... 11
2.2.3.1 Scaling up ............................................................................................................. 12
2.2.3.2 Langmuir Isotherm ............................................................................................... 12
2.2.3.3 Overloading .......................................................................................................... 13
2.2.4 Ion Pair Chromatography ........................................................................................ 14
2.3 Parameters Affecting Separation .................................................................................... 15
2.3.1 Mobile Phase ........................................................................................................... 15
2.3.2 Ion-pairing reagent .................................................................................................. 15
2.3.3 Column .................................................................................................................... 16
2.3.4 Detector ................................................................................................................... 16
2.3.5 Flow Rate ................................................................................................................ 16
2.3.7 Elution Mode ........................................................................................................... 16
2.4 Mass Spectroscopy ......................................................................................................... 17
3. Method and material ............................................................................................................. 18

3.1 Literature Survey ............................................................................................................ 18
3.2 Experimental .................................................................................................................. 18
3.2.2 ONs samples ............................................................................................................ 19
3.2.3 Instrumental ............................................................................................................. 19
3.2.3.1 Analytical system .................................................................................................. 19
3.2.3.2 Preparative system ............................................................................................... 20
3.2.4 Software .................................................................................................................. 21
3.2.5 Method (sample 162) .............................................................................................. 21
3.2.6 Method (sample 0206 and 2161) ............................................................................. 21
4. Results and discussion .......................................................................................................... 23
4.1 Linear and modified gradient ..................................................................................... 23
4.2 Comparison of separation capability of different mobile phases for sample 0206 .... 24
4.3 Bandwidth of zones with increasing amount of sample 162 ...................................... 25
4.4 Altering sample concentration (sample 0206)............................................................ 27
4.5 Semi-preparative purification ..................................................................................... 29
4.6 Fraction collection and analysis ................................................................................. 30
4.7 Application on unmodified ONs (sample 44) ............................................................ 33
5. Conclusion ............................................................................................................................ 34
6. References ............................................................................................................................ 35
Appendix 1 – Oligonucleotides and modifications .................................................................. 39
Appendix 2 – Gradients ............................................................................................................ 41
Appendix 3 – Chromatograms and MS spectra ....................................................................... 42
Appendix 4 – Other figures ...................................................................................................... 45

1
1. Introduction
The first dinucleotide was synthesized 65 years ago, and commercialized synthetization of
oligonucleotides (ONs) began in the 1980s when the development of useful chemical methods
was developed [1]. Even though ONs have been synthesized and analysed for years, new
methods for the purification and determination of ON sequences with modifications are
needed. ONs have many uses today; they are being used in the pharmaceutical industry in
research and as potential treatments for several diseases like cancer, AIDS and Alzheimer’s
[2]. Another grooving area for ONs are companies that manufacture diagnostic components,
like SGS DNA.
Synthesized ONs usually consists of 19-27 nucleotides [3], but can range from seven to more
than 100 bases long, with a molecular mass ranging from 2 – 20 kDa and they are
characterized by their highly negative charge on their backbone. The manufacturing process
can be divided into four main processes; synthesis, cleavage and deprotection, purification
and isolation [4]. In this master thesis, the main focus will be on purification process, which is
often performed on preparative scale. ONs are often modified to prevent nuclease digestion
and increase their stability. These modifications can be located on the backbone, the sugar
and/or the nucleobases of the ON [5].
ONs can be analysed with many different methods, where ion-exchange liquid
chromatography (IEX) and ion-pair reversed phase liquid chromatography (IP-RPLC) are the
most common methods, where the separation is based on charge and hydrophobicity [6]. In
this study, the ONs will be separated and analysed using IP-RPLC on analytical and semi-
preparative scale. The ONs used in this study are focused on probes, which may contain two
or more modifications, and scorpions, that contains i.e. three modifications. Additional
purification tests were also made on an unmodified 44-bases primer. This master thesis has
been carried out in association with Scandinavian Gene Synthesis (SGS DNA, Västerås,
Sweden) and Karlstads Universitet (Karlstad, Sweden).

2
1.1 Aim
The aim of this study is to develop a separation and purification method for unmodified and
modified ONs on different scales, ranging from analytical scale to preparative scale. This
study is performed together with SGS DNA, who manufactures synthetic ONs. Different ONs
that were analysed and purified were provided by SGS DNA; the first one called “162” was a
probe, containing the modifications FAM and BHQ1. The other two, called “2161” and
“0206” were “scorpions”, containing the modifications Amine, BHQ2 and Spacer 18. Sample
2161 and 0206 were the same product but came from two different batches, which means that
they had similar properties and could be considered to be equivalent to each other. A final test
of the developed separation system was also made where the unmodified, 44 bases long
primer were purified.
When developing a purification method for ONs, it is required to begin in analytical scale.
Different parameters like buffer, concentration, column properties, gradient, sample quantity
etc. were tested until optimal conditions were achieved. Thereafter, scaling up was performed
to semi-preparative scale, using systematic methods. Two different instruments were used in
this study; an ultra-performance liquid chromatography (UPLC) instrument and a preparative
system.

3
1.2 Sustainability
1.2.1 Environment
The general manufacturing process for ONs are able to achieve a yield of about 50% and
purity of 90%. The process is flexible and can produce a variety of ONs with different
lengths, modifications and can be scaled from grams to kilograms. The negative
environmental impact of this includes chemical hazards, waste and energy supply. Particularly
waste is a big factor for the negative environmental impact due to extensive starting material,
reagents and wash solvents used. Purification with preparative methods results in large
volumes of mobile phase that are wasted [4].
One method that can be used to reduce unnecessary waste is using a PMI (process mass
intensity) calculator, that is a measurement of the quantity of raw materials required to
produce a product [4]. It is also important to have a good manufacturing process, that uses as
little material as possible.
1.2.2 Economic
Economically, it is desirable to keep the instruments and columns as long as possible, as they
are expensive. By operating the analysis and purification methods at appropriate pH, low
concentrations of salts and low column temperature, it prevents wear on the instruments.
Another important factor is to develop and use good methods that obtain good yield. Pressure
is also an important factor; when using a longer column, high pressure is required. However,
the pressure has its limits as the pump, injection devices and other parts of the system must be
able to withstand the pressure and not wear out to quickly [7].
1.2.3 Social
Synthesized ONs are used for several medical purposes, including prevention and potential
treatments for diseases like cancer, AIDS and Alzheimer’s [2]. This will increase the well-
being and health for the society overall. More recently, ONs have been used in the research
involving Covid-19, where test kits contacting ON has had a huge impact on the development
of vaccine and testing of the virus.

4
2. Background and theory
2.1 Oligonucleotides
ONs are short strings of deoxyribonucleic acid (DNA) or ribonucleic acid (RNA), whose
backbone consists of nucleotides. There are three components to each nucleotide; a base
containing nitrogen, a five-carbon sugar and a phosphate group. The five bases in ONs are
adenosine (A), guanosine (G), cytidine (C), thymine (T) and uridine (U), where DNA consists
of A, G, C and T and RNA consists of A, G, C and U. The nucleotides are connected to each
other by 3´-, 5´-phosphodiester bonds. Synthetized ONs are generally 19-27 nucleotides long,
but can range from seven to 100 bases long. Its molecular mass usually ranges between 2 – 20
kDa. The backbone is negatively charged and hydrophilic and can exist in a single-stranded
form, that is considered more flexible. It can also exist as a double-stranded form, which is
considered more rigid [3, 8, 9].
2.1.1 Manufacturing process
The manufacturing process can be divided into four different processes; synthesis, cleavage
and deprotection, purification and isolation. In the synthetic process, the ON are synthesized
with a solid-supported phosphoramidite method in four steps; detritylation, coupling,
oxidation / sulfurization and capping [4]. Once the synthesis is complete, the full-length ON is
cleaved from the solid support in the cleavage and deprotection process. In the purification
process, preparative LC is used to purify the ON, where it is most common to use IP-RPLC or
IEX. Impurities are washed out by using an eluent with an increasing strength. In the isolation
process, the obtained ON sample is desalted to remove elution buffer components [4]. In this
master thesis, the main focus lays on the purification process. The overall manufacturing
process is longer and more complex than described, and is outside the scope of this study.

5
2.1.2 Modifications
ONs are often modified to prevent nuclease digestion and increase their stability, specificity
and potency. The modifications can be located on the backbone, the sugar and/or the
nucleobases [5]. Modifications on the backbone are the foremost important area on the ON to
modify, as it is highly sensitive to nucleases. The most commonly used modification on the
backbone is phosphorothioate linkage [5].
Modifications can be divided into two categories; reporters and quenchers. The reporters are
attached to the 5´- end of the ON and the quencher is located on the 3´- end. The reporter and
quencher used in an ON should overlap in the same spectrum, where the reporter emits light
that the quencher absorbs [10]. A reporter is a fluorescent dye which contains aromatic rings.
When synthesizing ONs, the most stabile reporters absorbs around 490 nm to 515 nm. When
it absorbs, the energy emits which causes light and the absorption usually takes place at
wavelengths shorter than the remainder of the ON [11]. The fluorescent dyes effect the
retention of ONs due to their hydrophobicity [12].
ONs can contain different amount of modifications. An ON that doesn’t contain any
modifications, called primers, is often easier to purify than those containing modifications.
ONs containing two modifications are called probes [13]. An ON that contains three
modifications is called a “scorpion”.
2.1.3 (n - 1) shortmer
The amount of impurities increases as the length of the ONs increases, because longer ONs
require more synthetic steps. A common type of impurity is shortmer molecules (n - 1, n - 2,
…), where one or more nucleotides are absent in the final product. Shortmer molecules are
often formed due to failure sequences, which is a result from inefficiency in the coupling,
incomplete capping or detritylation. The n – 2, or longer shortmer, are relative easy to remove
by purification. The n – 1 however tends to remain until the final product due to lack of
selectivity in relationship to the full-length ON. These shortmers have the same activity as the
full-length ON but lower affinity and specificity [14].

6
2.2 Chromatographic Theory and Definitions
In liquid chromatography there are two phases; a mobile phase and a stationary phase. The
solute that is to be analysed enters the chromatographic system in the mobile phase, and
partitions on to the stationary phase, most commonly by adsorption. The different components
in the solute have different ability to stick on the stationary phase and therefore separation can
be made. In liquid chromatography, the stationary phase is a column that is packed with
highly porous material [15, 16].
There are several different chromatographic techniques for analysis and purification of ONs,
for example reversed-phase liquid chromatography (RPLC), IP-RPLC, IEX and UPLC [17].
In IP-RPLC, the stationary phase is non-polar, hydrophobic and the mobile phase is polar,
hydrophilic and the separation depends on the hydrophobicity of the components in the solute.
It is common to add an organic modifier when using RPLC and the effect is that the mobile
phase becomes more hydrophobic [18].
2.2.1 Isocratic and gradient elution
In isocratic elution, the composition in the mobile phase remains constant throughout the
separation. In gradient elution, the ratio of polar and non-polar compounds in the mobile
phase changes overtime during the separation. Gradient elution is preferable when the sample
that is to be separated contains components with different polarities and hydrophobicity [19].
Typically, a gradient elution starts with low percentage organic modifier. During this initial
part of the elution, hydrophobic compounds bind to the hydrophobic stationary phase whilst
the more hydrophilic compounds elutes. When the signal goes back to baseline it indicates
that most of the hydrophilic compounds has eluted, and then the %-age organic modifier is
increased. When the %-age organic modifier is increased, the hydrophobic compounds that
are bound to the stationary phase start to elute in order of increasing hydrophobicity. At the
end of the run, a wash with a high concentration of organic modifier is performed in order to
elute more hydrophobic compounds that may be retained on the column (Figure 1) [18].
Figure 1. In gradient elution, the least hydrophobic compounds elute first at low %-age organic modifier (first
blue line). Thereafter, as % organic modifier increases, compounds elute in order of increasing hydrophobicity
(green, yellow and red line). Lastly, at high %-age organic modifier, very hydrophobic compounds elute (last
blue line) [18].

7
2.2.2 Analytical Chromatography
2.2.2.1 Gaussian and Asymmetrical Peaks
Quantitative information about the solute can be obtained from areas and height of the eluted
peak. In ideal cases, the peak has the shape as a Gaussian Peak (figure 2), which means that
the peak is symmetric [15].
Figure 2. A Gaussian shaped peak [15].
However, in almost all cases the peak obtained is asymmetrical with a small tail at the end.
When using preparative LC, where the concentrations are much higher, the peaks become
asymmetric, elongated and are strongly dependent on the adsorption isotherm, as can be seen
in figure 3 below [16].
Figure 3. Shape of asymmetrical peaks that is obtained when using preparative LC [16].

8
2.2.2.2 Retention and retention factor
The retention time is the time it takes for the sample to travel through the column, from
injection to detection. The retention factor k (1) is defined as the ratio between solute in the
stationary phase and solute in the mobile phase. tR is the retention time for the solute and t0 is
the time for the mobile phase [15]. Retention factor should lay between 2 and 9, if it is lower
the compounds are not retained and if it is higher the peaks will elute in the purge phase and
peak broadening will be observed [24].
𝑘 = 𝑡𝑅− 𝑡0
𝑡0 (1)
2.2.2.3 Resolution
When a sample move through the column it results in either a Gaussian shaped peak or an
asymmetrical peak. The longer the solute is in the column; the broader the peaks become. It is
desirable to obtain a narrow peak. The resolution describes the degree of separation between
two peaks and can be defined as the distance between two peak maxima with the average base
width. The resolution can be determined from a chromatogram, as shown in figure 4. For
quantitative analysis, a resolution value of ≥ 1,5 (baseline resolution) is desirable, as the peak
purity is 100% at this value and a full separation of two adjacent peaks has been accomplished
[20, 25]. Selectivity is the degree of separation between the peaks [18].
Figure 4. Determination of the resolution between two peaks [18].

9
2.2.2.4 Plate Height and Theoretical Plates
Theoretical plates are hypothetical divisions of columns, where each plate represents an
equilibrated partitioning of the compounds in a sample between the column and mobile phase.
The plate height H (2) is quantity that is related to the variance, which increases with the
number of steps, and the distance the solute has travelled through the column.
𝐻 = 𝜎2
𝐿 (2)
The number of theoretical plates, N (3), for a certain column length is a measurement of the
efficiency of the column [15]. tR is the retention time for the component and wh is the width at
the half of the height of the peak [26].
𝑁 = 𝐿
𝐻 = 5.545 (
𝑡𝑅
𝑤ℎ)
2
(3)
2.2.2.5 van Deemter Equation
The van Deemter equation (4) describes the three main parameters that contributes to a
broader peak; the eddy diffusion (A-term), the longitudinal diffusion (B-term) and the
resistance to mass transfer coefficient (C-term). The u describes the linear flow rate [1].
𝐻 = 𝐴 + 𝐵
𝑢+ 𝐶𝑢 (4)
It is desirable to have a small value on H, as smaller plate height results in narrower peaks.
The eddy diffusion; when molecules enter the column, they can flow through different paths
that have uneven lengths, which results in that they elute at different times because they have
different speeds depending on which path they take.
The longitudinal diffusion; longitudinal diffusion occurs when solute in the column diffuse
from high concentration to lower concentration. If the linear flow is faster, the solute spends
less time in the column and therefore less longitudinal diffusion occurs.
The resistance to mass transfer coefficient; to create equilibrium for the solute between the
mobile phase and the stationary phase, the solute must diffuse from one phase to the other.
Mass transfer describes this movement. The time is dependent on how far the solute must
travel to diffuse on the stationary phase and how fast it diffuses. The faster the linear velocity
is, the less time is available for the solute to diffuse [15, 20].
The relationship between these three coefficients can be represented as in figure 5. As can be
seen in the figure, there is an optimal flow rate which gives a minimum plate height. By using
this flow rate the maximum number of theoretical plates N is obtained [15].

10
Figure 5. There exists an optimal flow rate which obtains maximum number of theoretical plates N [15].
2.2.2.6 Efficiency
The efficiency of the column is related to the number of theoretical plates and zone
broadening, and describes the ability to elute narrow and symmetrical peaks. Good efficiency
can be obtained by minimizing the distance the compounds have to travel to diffuse. To
accomplish this, a well packed column and small particles is desirable [18].
To achieve high efficiency, small particles have been developed which require that the
separation takes place under high pressures. The pressure increases proportionally to the
square of the particle diameter and an increase in the linear velocity of the mobile phase
increases the pressure and the efficiency of the column (5). Today, a UPLC can separate
particles as small as 2 μm. Figure 6 shows how smaller particles decreases the values of the
A-term and C-term in the van Deemter curve, because the length of the irregular paths
decreases and the diffusion distance decreases. The advantages of using UPLC is that faster
separations are obtained and less solvent components are used, compared to high-performance
liquid chromatography (HPLC) [15].

11
Figure 6. Plate height decreases when using smaller particles [15].
2.2.3 Preparative Chromatography
In analytical chromatography the aim is to obtain quantitative and/or qualitative information
about several components in the solute, while the aim in preparative chromatography is to
isolate and obtain as much pure compound as possible from a mixture [15, 16]. There are two
possible ways to achieve this; by mass overloading, where the volume is kept constant and the
concentration increased, or by volume overload, where the concentration is kept constant and
the volume is increased [27]. Because the stationary phase has limited space, overloading is
often occurring and a result of this is that the eluted peak becomes distorted and
unsymmetrical [15, 16].
The chromatographic methods used in preparative LC must first be optimized for productivity
and yield. Optimizing a preparative LC system is often more difficult than analytical scale,
due to overloading, which causes non-linearity [28]. To obtain maximum efficiency in
preparative LC, the column needs to be maximized with sample and the run time must be
minimized. When increasing the load on the column it decreases the resolution, as a
consequence of peak broadening [24].
Preparative and analytical LC essentially has the same flow path, with the difference that
preparative LC has added a fraction collector. The fractions can be collected manually, based
on time or based on ultraviolet (UV) detection, where UV detection is preferable because it
decreases the number of fractions and therefore increases efficiency [24].
The void volume is the volume of the mobile phase in the column [23]. When switching from
an analytical column to a preparative or semi-preparative column, the void volume should be
approximated as it can have some effect on the retention.

12
2.2.3.1 Scaling up
When scaling up from an analytical column to a preparative column it is important to
maintain chemistries, pH conditions, particle sizes and/or column length. The first step of
scaling up is to perform analytical analyses, to confirm the presence of the target compound
and how it can be separated from the other compounds in the sample. When scaling up to
semi-preparative and preparative scale, changes in flow rates, modified gradient slopes,
injection volumes and run times require alteration, but should look similar to the analytical
gradient profile. When scaling up, equation (5) can be used to determine the flow rate in the
preparative system [24].
𝑓𝑃 = 𝑓𝐴 𝑑𝑃
2
𝑑𝐴2
𝑝𝐴
𝑝𝑃 (5)
𝑓𝑃 and 𝑓𝐴 is the flow in the preparative resp. analytical system, 𝑑𝑃 and 𝑑𝐴 is the diameter of
the preparative resp. analytical column and 𝑝𝐴 and 𝑝𝑃 is the particle sizes of the preparative
resp. analytical column [24].
Equation (6) is used when determining the injection volume in preparative system. 𝑣𝑖𝑛𝑗,𝑃 and
𝑣𝑖𝑛𝑗,𝐴 is the injection volume for preparative resp. analytical system, 𝑑𝑃 and 𝑑𝐴 is the
diameter of the preparative resp. analytical column and 𝐿𝑃 and 𝐿𝐴is the length of respective
column [24].
𝑣𝑖𝑛𝑗,𝑃 = 𝑣𝑖𝑛𝑗,𝐴 𝑑𝑃
2
𝑑𝐴2
𝐿𝑃
𝐿𝐴 (6)
2.2.3.2 Langmuir Isotherm
The Langmuir adsorption isotherm (7) is a model that describes the relationship between the
concentration of the mobile phase and stationary phase under isothermal conditions. The
subscript “e” imply equilibrium state, KL is the Langmuir equilibrium constant, qm are
adsorbed amount of solute per unit mass adsorbent, qi is the absorbed amount per unit mass of
adsorbent at equilibrium and p is the pressure [29].
𝑞𝑖 =𝑞𝑚𝐾𝐿𝑝𝑒
1+𝐾𝐿𝑝𝑒 (7)
In analytical chromatography, the concentration used is low and therefore a linear adsorption
isotherm is obtained, which means that the adsorbed concentration is proportional to the
concentration of the mobile phase and a Gaussian shaped peak is obtained. However, in
preparative LC, the high concentration affects the peak shape because the molecules in the
high concentration area tend to diffuse more as it is more difficult to find free adsorption sites.
This causes overload which results in asymmetry and bandbroadening of the obtained peak
[16].

13
2.2.3.3 Overloading
In preparative chromatography, large amounts of sample are injected, and as the column has a
finite amount of surface area it leads to overloading. As the concentration of the sample
increases, the amount of solute adsorbed at equilibrium decreases. A consequence of
overloading is tailing of the peaks, where it is most common that the front is sharp and the
rear is diffused. The retention time for the front decreases with increasing sample amount
whilst the rear has a constant retention time [30].

14
2.2.4 Ion Pair Chromatography
IP-RPLC is used to separate polar or ionic compounds. An ion-pairing reagent is added to the
mobile phase, which lodges to the hydrophobic stationary phase. The result of this is that the
stationary phase can be used as an ion-exchanger, where the cations are attracted to the ion-
pairing reagent attached on the stationary phase. A results of using ion-pairing reagents in the
mobile phase is that the equilibrium of the stationary phase is slow and that the separation
becomes more sensitive to temperature, pH and concentration [20, 21].
IP-RPLC is the most common method to use when analysing ONs, and is often coupled with
MS-detection. The mobile phase usually consists of a combination of alkylamines and
fluoroalcohols. Fluoroalcholos have a pKa value around 8, which causes it to ionize at high
pH and is therefore a good counter ion to alkylamines. Fluoroalcohols is a relatively new
substance to use in the mobile phase and it has improved separation, gives higher signal
intensity, higher selectivity and better resolution [14, 22].
IP-RPLC uses a reversed-phase column, where it is most common to use a C18 modified
column. A challenge when using IP-RPLC is the stability of the mobile phase. When using
alkylamines and fluoroalcholos in the mobile phase, the alkylamines act as an ion pairing
reagent, which shields the negatively charged backbone of the ON, which makes it more
hydrophobic. The fluoroalcohols improves the distribution constant between the ONs on the
stationary phase and the mobile phase. A factor that influences the retention is the
concentration alkylamine. Another factor that affects the retention is the pH value, where
higher pH gives lower retention. Therefore, it is important to find a way to easily adjust the
pH value [14, 22].
The influence of pH, temperature and content of organic modifier in eluents were studied by
evaluation of resolution, peak shape and bandbroadening effects. The ONs used in this study
have a high complexity with hydrophobic modifications or longer ONs with at least 40 bases.
The complex molecules are eluted at organic modifier concentration of 40-70% in
combination with an elevated temperature at 60˚C. The temperature and organic modifier
were used for unfolding or minimize dimerization of the ONs chains, which has been studied
by Nylander [23]. More efficient separations were obtained in this study by using the
unfolding strategy.

15
2.3 Parameters Affecting Separation
When developing new methods for liquid chromatography, there are some key parameters to
consider, for example mobile phase composition, stationary phase, detector, temperature, flow
rate, injection volume, elution mode, etc.
2.3.1 Mobile Phase
The stationary phase in RPLC is hydrophobic and for good separations, an organic, apolar,
solvent is often used. The most common organic solvent used is acetonitrile or methanol. The
effect of using organic solvents is that the mobile phase becomes more hydrophobic, which
means that the solute will eluate earlier. This occurs because when the hydrophobicity of the
mobile phase increases, the hydrophobic parts of the solute will not bind as strongly to the
stationary phase [18].
2.3.2 Ion-pairing reagent
By adding an ion-pairing reagent to the mobile phase the hydrophobicity of the charged
components can be increased. The ion-pairing reagents interacts with the charged groups in
the ON and suppresses their influence on the overall hydrophobicity. Which type and the
concentration of the ion-pairing reagent affects the behaviour of the retention and selectivity
[18].
The most common ion-pairing reagent that are used in ON manufacturing is TEA
(triethylamine). TEA has proven to achieve good results and can be combined with different
buffers [31], most commonly HFIP (hexafluoro-2-propanol) [32]. Other ion-pairing reagents
that can be used are hexylamine, N,N-dimethylbutylamine, N,N-diisopropylethylamine and
tripropylamine [31]. In this study, dibuthylamine (DBA) was chosen as ion-pairing reagent
for development purposes, and the choice was made based on the work of Goyon et al [32],
who obtained better ion-pairing efficiency with DBA.
DBA is much more hydrophobic than the commonly used TEA counter ion. Its cLogP, which
is a distribution coefficient that measures a compound’s hydrophobicity, is 2.8, compared to
1.4 for TEA. A higher value of cLogP will increase the distribution to the C18 chains on the
stationary phase. This will cause that the particle surfaces will be covered with DBA
molecules in a more pronounced degree compared with TEA. The effect of using ion-pair
reagents, also called amphipiles with different hydrophobicity was studied in capillary
electrophoresis where the capillaries were coated with C8 alkane chains. Adsorption of an
amphiphile to the surface alters the net charge of the capillary and therefore also the
electroosmotic flow [33]. The separations of the ONs are performed in a pseudo ion-exchange
mode. An electrostatic approach [33, 34] may be more useful when the understanding of ONs
interaction with the charged particle surfaces. ONs are large molecules with a length of 2 – 50
nm, containing an equal number of negatively charges as number of bases. The column
particles are covered with positively charged DBA molecules and can be treated as a charged
surface. The interaction between negatively charged ONs molecules are strong and the ONs
elutes at higher contents of organic modifier [35].

16
This is a huge advantage when the modified ONs are run in the purification systems. Analyte
with hydrophobic modifications will have a different chemical potential at higher
concentration of organic modifier. This may explain the substantial improved
chromatographic appearance with more selective interaction (charge) and improved mass
transfer or faster equilibrium interaction with the column particles. This is a possible
explanation of the observed high peak capacity of the separation and purification method
developed in this master thesis [35].
2.3.3 Column
The separation in liquid chromatography is highly dependent on the column used. The
parameters to consider when choosing a column is its length and diameter, packing material,
shape and size of particles and percent of carbon loading. The most common material for
column packing is silica [36, 37]. In preparative LC, the amount of pure substance wanted
within a given time determines which dimensions to choose on the column. If the separation
doesn’t come out well, the amount of injected ON needs to be decreased. Firstly, decrease in
the injection volume should be tested, and thereafter decrease in the concentration [24].
2.3.4 Detector
The detector that is most commonly used when analysing drug molecules is a UV/VIS
detector, because most drug molecules are aromatic or unsaturated, which absorbs in the
UV/VIS region [36].
2.3.5 Flow Rate
The flow rate is an important parameter that affects how well the peaks are separated. An
optimal flow rate gives low retention time, good shape and symmetry of the peaks and least
backpressure in the column. A risk when using too high flow rate is that the quality of the
chromatography is affected negatively, because the particles in the solute will not have
enough time to bind to the particles in the stationary phase. The optimal flow rate is related to
the van Deemter equation (4) [36].
2.3.6 Temperature
The flow rate and rate of adsorption is related to the temperature, and changes in the
temperature may affect the pressure of the column and the elution and resolution. Increasing
temperature generally improves the resolution, but it is preferable to choose ambient
temperature, as it usually minimizes the degradation the solute. In LC, the temperature usually
lies between 25˚C and 60˚C [36].
2.3.7 Elution Mode
There are two types of elution modes; isocratic elution, where all the components in the
mobile phase are mixed and pumped together as one eluent, or gradient elution, where the
ratio of components in the mobile phase changes over the course of the separation. Isocratic
elution is often easier to use but gradient elution results in better separations, as the polarity
and ionic strength changes during the run [36]. By having a shallow gradient profile focused
on the target peak, better separation and resolution can be achieved [24].

17
2.4 Mass Spectroscopy
Mass spectroscopy (MS) is an analytical method that is used to detect, quantitate and identify
molecules based on their mass-to-charge ratio in simple or complex mixtures [38]. All mass
spectrometers have three main components; an ion source, a mass separator and a detector.
These components differ from spectrometer to spectrometer, but fulfil the same purpose. In
MS, a mixture is applied in the ion source where it is ionized. Thereafter, the ions are
accelerated by an electric field and are separated based on their mass-to-charge ratio before
reaching the detector. The results are shown in a mass spectrum that displays the number of
ions detected at each value of mass-to-charge [20]. In this work, MS is used on the fractions
collected to confirm what molecular species the various peaks contained.
18
3. Method and material
3.1 Literature Survey
The background and theory, facts and data were collected through an initial literature survey,
using articles, books and fact sheets. The article Analytical and preparative separation of
phosphorothioated oligonucleotides: columns and ion-pair reagents by Enmark et al [28] was
used as basis for continued literature survey and studies. The article was closely related to the
work of this master thesis, including mass-overloading studies, fractioning and scaling up
theory. Further articles were found by using the citations in the Enmark article and searching
on search engines on the internet, e.g. Google Scholar.
3.2 Experimental
3.2.1 Mobile phase
A 0.50 M DBA (Sigma-Aldrich, USA) stock solution was prepared by mixing 100 ml Milli-Q
water and 100 ml ACN (Fisher Scientific, UK), resp. MeOH (Fisher Scientific, UK) in a
measuring glass. The pH of the solution was measured to be 8.2. 17 ml DBA was added and
37% HCl (Merck KGaA, Germany) was added dropwise until pH reached 7.9. A 50 mM Tris-
HCl buffer was prepared by weighing 30 g Trizma base powder (Sigma-Aldrich, USA) and
mixing it with 5 L Milli-Q water. 37% HCl was added until the solution reached a pH of 8.0
resp. 8.3.
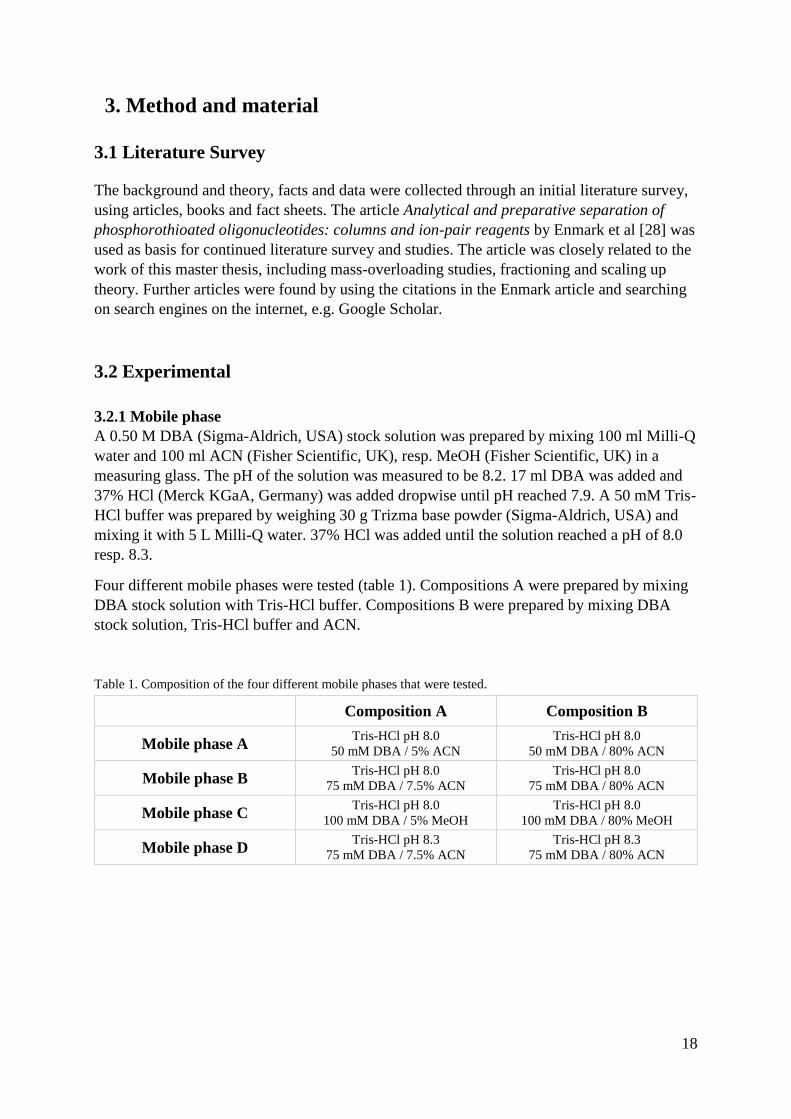
Four different mobile phases were tested (table 1). Compositions A were prepared by mixing
DBA stock solution with Tris-HCl buffer. Compositions B were prepared by mixing DBA
stock solution, Tris-HCl buffer and ACN.
Table 1. Composition of the four different mobile phases that were tested.
Composition A Composition B
Mobile phase A Tris-HCl pH 8.0
50 mM DBA / 5% ACN
Tris-HCl pH 8.0
50 mM DBA / 80% ACN
Mobile phase B Tris-HCl pH 8.0
75 mM DBA / 7.5% ACN
Tris-HCl pH 8.0
75 mM DBA / 80% ACN
Mobile phase C Tris-HCl pH 8.0
100 mM DBA / 5% MeOH
Tris-HCl pH 8.0
100 mM DBA / 80% MeOH
Mobile phase D Tris-HCl pH 8.3
75 mM DBA / 7.5% ACN
Tris-HCl pH 8.3
75 mM DBA / 80% ACN

19
3.2.2 ONs samples
The ONs samples 126, 0206 and 2161, that were similar to each other, were provided by the
synthetic department of SGS DNA. The samples that were provided were “crashed batches”,
which means they were too impure for the company’s standards. Both sample 0206 and 2161
had the same three modifications and similar length. Sample 2161 had a concentration of 192
μM and its molecular weight was 14510 g/mol. Sample 0206 had a concentration of 186 μM
and its molecular weight was also 14510 g/mol. Sample 126 contained two modifications and
had a concentration of 100 μM. Also, an unmodified primer containing 44 bases was used to
investigate if the methods developed could be used on an unmodified ON. The sequences of
the ONs are shown in table 2 below.
Table 2. Sequences of the four ONs used.
3.2.3 Instrumental
The mass spectrometer used was a XEVO G2-XS QTof Quadrupole Time of Flight mass
spectrometer from Waters.
3.2.3.1 Analytical system
An ACQUITY UPLC system from Waters was used for analytical studies of sample 2161 and
fraction analysis. The system was equipped with an ACQUITY UPLC H-Class Binary pump,
a sample manager-fixed loop, a column manager and an ACQUITY UPLC PDA eλ Detector,
which can detect and quantify low concentrations of samples and compare spectra over a
broad wavelength range. The system was coupled with the software Empower. The column
temperature was set to 60˚C and the detector was set to detect at 260 nm for all tests.
The columns used in the UPLC system was an ACQUITY UPLC BEH C18, 1.7 μm, 2.1 x
100 mm and ACQUITY PREMIER Oligonucleotide BEH C18, 1.7 μm, 2.1 x 50 mm.
Sample Sequence
162 FAM – 28 mer – BHQ1
0206 Amine – 26 mer – BHQ2 - Spacer 18 – 17 mer
2161 Amine – 26 mer – BHQ2 – Spacer 18 – 17 mer
44 44 mer

20
Figure 7. An ACQUITY UPLC system from Waters was used for analytical studies.
3.2.3.2 Preparative system
A preparative system, which consisted of different parts from Waters, was used for analytical
and semi-preparative studies on sample 0206. The pump was a 2535 low pressure mixing
gradient pump and the detector was a 2998 PDA detector. The system also had a fraction
collector, and had the opportunity to use columns in different sizes; analytical columns to
preparative columns.
Two different silica based columns were used in the preparative system; an analytical column
and a semi-preparative column. The analytical column was an XBridge C18, 3.5 μm, 4.6 x
100 mm and the semi-preparative column was an XBridge C18, 5 μm, 19 x 100 mm.
Figure 8. Preparative system used for analytical and semi-preparative studies.

21
The void volume of the two columns used in the preparative system were calculated by using
the following formula [24]:
𝑉0 = 𝑡𝑉 × 𝑓 (8)
where V0 is the void volume, tV is the void time and f is the flow rate. The void time when
using XBridge C18, 3.5 μm, 4.6 x 100 mm was 0.86 minutes and the flow rate was 1.5
ml/min, which resulted in a void volume of 1.29 ml. The void time when using XBridge C18,
5 μm, 19 x 100 mm was 1.33 minutes and the flow rate was 18 ml/min, which resulted in a
void volume of 23.94 ml.
3.2.4 Software
The software used to control the systems and process data in both the analytical and
preparative system was Empower Chromatography Data System 3, feature release 5, from
Waters.
To achieve an equivalent, optimal gradient when scaling up to bigger columns, a preparative
HPLC column method transfer tool from Thermo Fisher was used (figure 36, appendix 4). In
this tool, the properties of the analytical column and gradient are entered in the columns to the
left, and the properties of the semi-preparative column are entered in the columns to the right,
and an appropriate gradient is calculated.
3.2.5 Method (sample 162)
Sample 162 was analysed on the UPLC system, firstly analytically and then overloading
testing was carried out. Overloading testing with concentration and volume was analysed on
the UPLC system with mobile phase A (table 1), column XBridge C18, 3.5 μm, 4.6 x 100 mm
and gradient shown in table 6 (appendix 2). For the test with concentration, these parameters
and volume, were kept constant. The concentrations that were tested were 2, 4, 6 and 8 mM
and were obtained by diluting the sample with different amount of mobile phase A. For the
test with volume, the concentration was kept constant. The volumes that were tested were 20,
40, 60 and 80 μl. Investigation of the absorption spectra was used to confirm if the peaks
contained impurities or pure sample.
3.2.6 Method (sample 0206 and 2161)
Sample 2161 was diluted with mobile phase A to achieve concentration 96 μM and a volume
of 200 μl. The sample was analysed in the UPLC system with a linear gradient (table 7,
Appendix 2) to get an overview of its retention behaviour. The injection volume was 4 μl. The
result from this injection are shown in figure 9.
Sample 0206 was analysed with a linear gradient (table 8, appendix 2) in the preparative
system to get an overview of its retention behaviour. The injection volume was 20 μl, as it
was the smallest injection loop that was available.

22
By applying a linear gradient, it could be calculated at which %-mobile phase the main peak
and impurities eluted. The gradient was adjusted to achieve optimal separation of the
impurities and main peak by changing the flow rate and ratio % A och % B overtime. The
results of the modified gradient are shown in table 3 below.
Table 3. Modified gradient for sample 0206 in the preparative system, using mobile phase D.
When the gradient was set, four different mobile phases were tested (table 1) for sample 0206
on the preparative system.
Overloading attempts were made in the preparative system with sample 0206 and the
analytical XBridge column. As the injection loop was more difficult to change, the volume
was kept constant at 20 μl and the concentration was altered. The concentrations of the
samples were altered by diluting them with different ratio mobile phase A. Eight different
concentrations were tested; 0.1, 0.2, 0.5, 1, 2, 3, 5 and 7 mM.
Semi-preparative studies were made in the preparative system, with the semi-preparative
XBridge column on sample 2161, which had a concentration of 192 μM, and sample 0206,
which had a concentration of 1 mM. The injection volume of 1.7 ml and flow rate of 18
ml/min were calculated using equation (5) and (6). An equivalent gradient was produced by
using the preparative transfer tool from Thermo Fischer.
The fraction collector was set to collect 1.5 ml fractions between 7 and 12 minutes, at a
threshold of 4% and a slope of 2 V/min. A total of 30 fractions were collected for sample
2161 and 46 fractions were collected for sample 0206. Selected fractions around the main
peak and impurity peaks were analysed in the UPLC, using the gradient shown in table 9
(appendix 2), column ACQUITY PREMIER Oligonucleotide BEH C18, 1.7 μm, 2.1 x 50 mm
and an injection volume of 4 μl. Selected fractions around the main peak were collected and
were analysed on MS to confirm what the peaks contained.
Time (min) Flow (ml/min) % A % B
initial 1.5 95 5
7.00 1.5 39 61
15.00 1.5 37 63
19.00 1.5 20 80

23
4. Results and discussion
The result of sample 2161 when it was analysed on the UPLC system to get an overview over
the retention behaviour are shown in figure 9 below. The chromatogram showed that the
sample contained several impurity peaks that eluted close to the main peak. The UPLC system
gave quite good separation between the peaks, but as the sample was meant to be used in
preparative chromatography, it was expected that it would become difficult to get a good
separation in the preparative system.
Figure 9. Chromatogram of sample 2161, with concentration 96 μM, injection volume of 4 μl and mobile phase
D (table 1), when analysed in the UPLC system to get an overview of its retention behaviour. The gradient used
are shown in table 7, Appendix 2. The column used was ACQUITY UPLC BEH C18, 1.7 μm, 2.1 x 100 mm.
4.1 Linear and modified gradient
The linear gradient used on sample 0206 in the preparative system showed that the main peak
and impurity peaks eluted between 13 and 17 minutes, which was equivalent to 58% B to
70% B (figure 10). The gradient was altered several times before a modified gradient (table 3)
was constructed, where the slope was decreased between 7 and 15 minutes (figure 11). The
results showed that the impurities had similar characteristics as the main peak, as it was
difficult to get a good separation between the main peak and the impurities. It was assumed
that the main peak was the highest peak, i.e. the peak eluting at 15 minutes in figure 10 and
just before 10 minutes in figure 11, and the other peaks were impurities. This was confirmed
with fraction analysis.
Theoretically, a decreasing slope of % B should make the peaks elute further apart from each
other, but as can be seen in the chromatograms below that is not true in this case. In the linear
gradient, the difference in retention time between the first and last peak are 1.570 minutes,
while in the modified gradient the difference in retention time is 0.876 minutes. This is most
likely due to a delay time in the preparative system due to a dead volume that was not taken
into account. This causes the gradient to elute later than what it is set to do, which causes the
peaks to elute closer to each other. However, it was decided to keep the modified gradient
because faster elution was desirable. As samples 0206 and 2161 had similar properties, the
modified gradient were used for both samples.

24
Figure 10. Linear gradient for sample 0206, with concentration 186 μM, injection volume 20 μl and mobile
phase D (table 1), in the preparative system with the main peak eluting at 15 minutes. The gradient used are
shown in table 8, Appendix 2. The column used was XBridge C18, 3.5 μm, 4.6 x 100 mm.
Figure 11. Modified gradient for sample 0206, with concentration 186 μM, injection volume 20 μl and mobile
phase D (table 1), in the preparative system, with the main peak eluting just before 10 minutes. The gradient
used are shown in table 3. The column used was XBridge C18, 3.5 μm, 4.6 x 100 mm.
4.2 Comparison of separation capability of different mobile phases for sample 0206
Four different mobile phases were tested for sample 0206 in the preparative system, using the
modified gradient (table 3) and column XBridge C18, 3.5 μm, 4.6 x 100 mm. The mobile
phases differed in that they had different concentrations of DBA, mobile phase C contained
MeOH instead of ACN and mobile phase D had a pH of 8.3 instead of 8.0. The results
showed that difference between the tested mobile phases had a limited effect on separation of
the complex sample 0206. The results of the separations with different mobile phases are
shown in figure 29, 30, 31 and 32 in appendix 3. It was decided to keep mobile phase D for
further analyses, as it had somewhat better separation and for developing purpose, based on
the work from Anacleto et al [13].

25
4.3 Bandwidth of zones with increasing amount of sample 162
The result of the analytical testing for sample 162 on the UPLC system are shown in figure 12
below. It showed that there were two large peaks eluting quite close to each other. The peak to
the right contained the main product and the peak to the left was an impurity peak, that was
confirmed with the study of absorption spectra.
Figure 12. Analytical chromatogram of sample 162, with concentration 1 mM, injection volume 4 μl and mobile
phase A (table 1) in the UPLC system. The column used was XBridge C18, 3.5 μm, 4.6 x 100 mm.
The result of altering concentrations and injection volume for sample 162 are shown in figure
13 resp. 14 below, where the complex sample 162 had an impurity peak before the main
sample. The sample came from a test run on a new synthesis system where the amount of the
fluorophore FAM was low in the synthesis. This resulted in a substantial amount of the
sample without FAM, but still containing the quencher BHQ at the 5´-end. This sample was
used to study the effect when the same sample amount was added at different concentrations
or with increasing sample volume. The overloading of the particle surface is dependent of the
area that each molecule occupies and its amount as describes in the Langmuir isotherm. The
number of moles injected are the same for 2 mM and 20 μl, 4 mM and 40 μl, 6 mM and 60 μl
and for 8 mM and 80 μl. It is shown that an increase in the concentration of the sample gives
broader zones, where the rear zone is kept stable and the front zone is pushed forward. It also
shows that the impurity peak, that elutes before the main peak, becomes more focused with
increasing sample concentration. However, when a larger volume is injected there will cause a
bandspread due to that the injected volume will move molecules longer into the column. This
will contribute to a spread of the sample zone and this will contribute to a wider zone at
detection. This is shown in figure 14 below. The conclusion of these experiments is that there
may be a substantial decrease in bandwidth of sample zones if the sample concentration is
increased compared to an increase in sample volume.

26
Figure 13. Injection with 2, 4, 6 resp. 8 mM of sample 162, with injection volume 10 μl and mobile phase A
(table 1), when testing overloading with concentration in the UPLC system. The column used was XBridge C18,
3.5 μm, 4.6 x 100 mm.
Figure 14. Injection with 20, 40, 60 and 80 μl of sample 162, with concentration 1 mM and mobile phase A
(table 1), when testing overloading with the volume in the UPLC system. The column used was XBridge C18,
3.5 μm, 4.6 x 100 mm.
Absorption spectra was used to confirm which peak contained main product and which peak
contained impurities. The absorption spectra of the first eluting peak are shown in figure 15,
and the absorption spectra of the second eluting peak are shown in figure 16. The main
product contained the modifications FAM and BHQ1. FAM is a fluorescent that is attached to
the 5´-end of the ON [39] and absorbs at 495 nm. As can be seen in the absorptions spectra,
the first peak is missing the FAM modification, whilst the second peak contains FAM and is
therefore the main product.
Figure 15. Absorption spectra of the first eluting peak of sample 162, showing that the peak did not contain the
modification FAM.

27
Figure 16. Absorption spectra of the second eluting peak of sample 162, showing that the peak contained the
modification FAM.
4.4 Altering sample concentration (sample 0206)
Alteration of the concentration for sample 0206 in the preparative system showed that the
main peak and the closest impurity peak ensembles towards each other as the concentration
increases. The experimental conditions for this test was the same as when developing the
modified gradient (section 4.1 Linear and modified gradient), where all parameters except
concentration was kept constant. From the chromatogram shown in figure 17, its appears as a
maximum of the detector is reached at 3 mM and therefore it appears that all concentrations
above that have the same area.
Figure 17. Overlay plot of different concentrations of sample 0206, ranging from 0.1 – 7 mM, when testing
overloading with concentration in the preparative system. The volume was kept constant at 20 μl; mobile phase
D (table 1) and the gradient shown in table 7 were used. The column used was XBridge C18, 3.5 μm, 4.6 x 100
mm.

28
The concentrations were plotted against the number of theoretical plates to illustrate how the
column efficiency decreases as the concentration increases (figure 18) [40]. The number of
theoretical plates were calculated using equation (3). The retention time and width were
obtained from Empower. The plot shows a relative large decrease in number of theoretical
plates between 1 and 3 mM. The flattening of the curve between 3 and 7 mM could be due to
the overload of the detector signal.
Figure 18. A plot showing decreasing number of theoretical plates as concentration of sample 0206 increases,
when testing overloading by concentration in the preparative system. The corresponding chromatogram of the
test are shown in figure 17 above.

29
4.5 Semi-preparative purification
Semi-preparative purifications were made on sample 0206 and 2161 on the preparative
system. The injection volume and flow rate were calculated for hand whilst the gradient was
produced with the help from Thermo Fisher Scientific preparative calculation tool. The reason
for this is that the calculation tool gave a different result when calculating the injection
volume and therefore the hand-calculated results were used. The scaling-up, for both sample
0206 and 2161, was based on the analytical separation that were made for sample 0206
(figure 11).
The semi-preparative purification gave rather good results, as shown in figure 19 and 20
below. The samples were very impure to begin with, but with the purification on sample
0206, several pure fractions were isolated and obtained.
Figure 19. Semi-preparative purification of sample 2161 with a concentration of 192 μM, injection volume 1.7
ml and flow rate of 18 ml/min. Mobile phase D (table 1) was used and the XBridge C18, 5 μm, 19 x 100 mm
column.
Figure 20. Semi-preparative purification of sample 0206 with a concentration of 1 mM, injection volume 1.7 ml
and flow rate of 18 ml/min. Mobile phase D (table 1) was used and the XBridge C18, 5 μm, 19 x 100 mm
column. The analytical equivalently chromatogram can be seen in figure 11.

30
4.6 Fraction collection and analysis
Fraction collection on the semi-preparative purification on sample 0206 were made, where 46
fractions were collected (figure 21). Fraction collection were also made for sample 0206 when
the concentration was 7 mM (figure 22), where 22 fractions were collected.
Figure 21. Fraction collection around the main peak and impurities for sample 0206, with concentration 1 mM,
injection volume 1.7 ml and flow rate 18 ml/min, in the semi-preparative purification, on the preparative system.
Mobile phase D (table 1) was used and the XBridge C18, 5 μm, 19 x 100 mm column. Fractions 24 – 33, that
were analysed in the UPLC system, lies within the thick lines.
Figure 22. Fraction collection around the main peak and impurities for sample 0206, concentration 7 mM, in the
preparative system. The volume was kept constant at 20 μl; mobile phase D (table 1) and the gradient shown in
table 7 were used. The column used was XBridge C18, 3.5 μm, 4.6 x 100 mm. Fraction 19, that lies within the
thick lines, were analysed on the UPLC system.

31
Fractions 24 – 33 from the semi-preparative purification were selected to be analysed on the
UPLC system to decide their purities. The results of the analysis are shown in figure 24 and
table 4. Percentage area is equivalent to the purity of the fraction. A purity of 90% is
considered acceptable and therefore fractions 28, 29, 30 and 31 are considered pure. This
result is consistent with what is shown in figure 21, that the pure fractions are taken from the
main peak. Fraction 25 also has an area over 90%, but as can be seen in figure 21, the fraction
is not taken from the main product peak. Fraction 19 were collected from the 7 mM
purification and analysed on the UPLC. The results showed an area of 68.5% and are shown
in picture 23 below.
Figure 23. Fraction 19 from sample 0206, concentration 7 mM, was analysed in the UPLC system using the
ACQUITY PREMIER Oligonucleotide BEH C18, 1.7 μm, 2.1 x 50 mm column, injection volume 4 μl and
mobile phase D (table 1).
Figure 24. Analysis of fractions 24 – 33, analysed in the UPLC system, using the ACQUITY PREMIER
Oligonucleotide BEH C18, 1.7 μm, 2.1 x 50 mm column, injection volume 4 μl and mobile phase D (table 1).

32
Table 4. Summary of results from the fraction analysis for the semi-preparative purification, showing the purity
of each fraction.
Fractions 24 and 29 from the semi-preparative purification and fraction 19 from the 7 mM
purification were analysed on MS. The results from the MS analysis confirmed that fraction
24 was taken from an impurity peak that did not contain any main product (figure 33,
Appendix 3). The MS analysis showed that fraction 29, that was taken from the main peak,
contained main product as it showed a peak at 14511 Da (figure 34, appendix 3). It also
showed a peak at 14466 Da, which was due to a fault in the synthesis and the sample was
therefore discarded. The peaks appearing after 14511 Da comes from the MS system, and
does not come from the sample. It was desirable that fraction 19 would show a combination of
fractions 24 och 29, to show that the impurities were pushed further in the main peak as the
concentration increased (figure 35, appendix 3). However, MS analysis of fraction 19 was
similar to that of fraction 29, i.e. it contained main product with a peak at 14511 Da and
14466 Da.
RT (min) SampleName Inj. ID Vial Height (μV) % Area
1 3.826 0206 1mM frac.24 4031 2:A,2 540680 89.65
2 3.801 0206 1mM frac.25 4034 2:A,3 299567 93.64
3 3.852 0206 1mM frac.26 4039 2:A,4 204748 53.91
4 3.883 0206 1mM frac.27 4042 2:A,5 2161297 86.99
5 3.877 0206 1mM frac.28 4045 2:A,6 2794974 90.86
6 3.879 0206 1mM frac.29 4048 2:A,7 2738977 95.20
7 3.885 0206 1mM frac.30 4051 2:A,8 2498000 96.43
8 3.895 0206 1mM frac.31 4054 2:B,1 1660067 96.47
9 3.903 0206 1mM frac.32 4057 2:B,2 732617 63.31
10 3.951 0206 1mM frac.33 4060 2:B,3 520177 74.70
Mean 3.875
% RSD 1.07
Min 204748
33
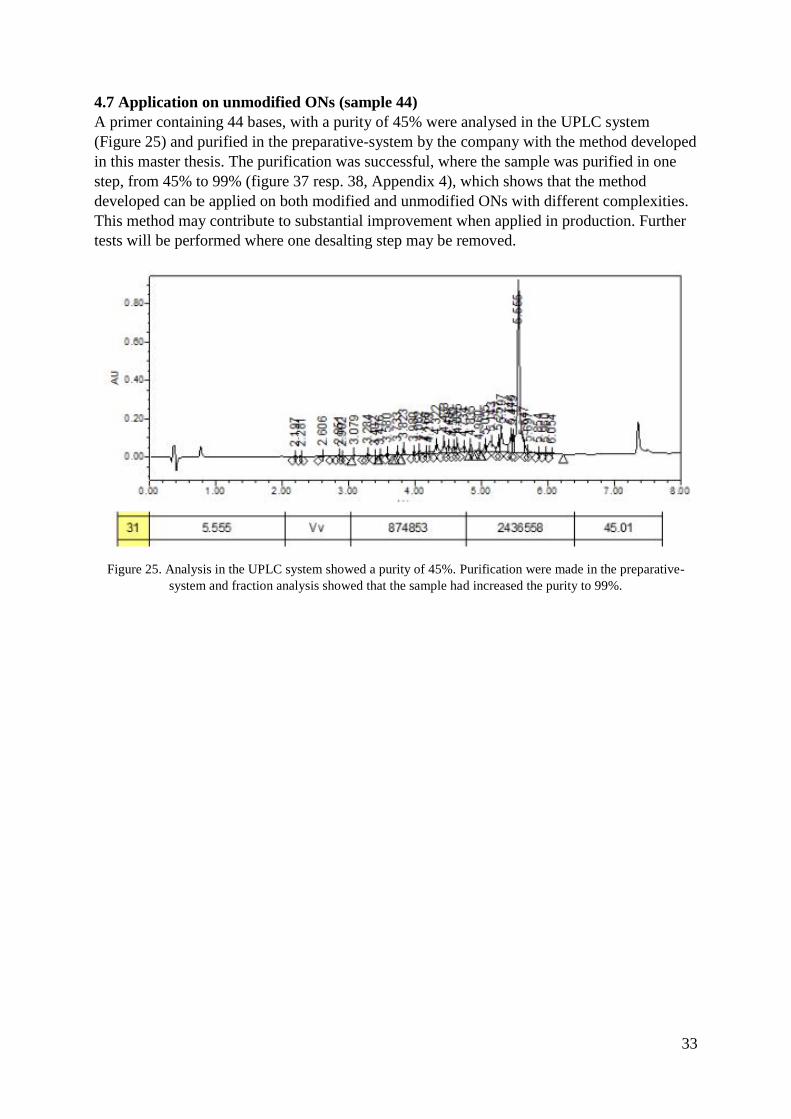
4.7 Application on unmodified ONs (sample 44)
A primer containing 44 bases, with a purity of 45% were analysed in the UPLC system
(Figure 25) and purified in the preparative-system by the company with the method developed
in this master thesis. The purification was successful, where the sample was purified in one
step, from 45% to 99% (figure 37 resp. 38, Appendix 4), which shows that the method
developed can be applied on both modified and unmodified ONs with different complexities.
This method may contribute to substantial improvement when applied in production. Further
tests will be performed where one desalting step may be removed.
Figure 25. Analysis in the UPLC system showed a purity of 45%. Purification were made in the preparative-
system and fraction analysis showed that the sample had increased the purity to 99%.

34
5. Conclusion
The main aim for this master thesis was to develop a method that would improve the
separation and purification of modified ONs. The method developed in this master thesis
includes the choice of instruments, gradient, flow rate, fraction collection and analysis and
concentration of sample and mobile phase composition, where the choice of the ion-pairing
reagent DBA was of most importance. The method was developed using two different
systems; a UPLC system and a preparative-system and analyses were made in both analytical
and semi-preparative scales. By investigating different parameters, a general method was
developed that worked for the purification of modified and unmodified primers, probes and
scorpions. The results of using DBA for the separation and purification of primers is very
promising. The inherent properties of DBA contribute to a higher surface charge of the
stationary phase, as it is a more hydrophobic ion-pairing agent than the more commonly used
TEA. This will result to a change in percentage of organic modifier at elution for the different
ONs. It is believed that the company will save a significant amount of money and resources
by using the method developed in this master thesis. Continued work includes validation of
the method developed so that it can be used in production. Also further investigation
regarding mobile phase and how DBA contributes to better purification is desirable.

35
6. References
[1] Bonilla J.V, Srivatsa G.S. Handbook of Analysis of Oligonucleotides and Related
Products. Taylor and Francis Group, LLC; 2011
[2] Studzinska S. Review on investigations of antisense oligonucleotides with the use of mass
spectrometry. Talanta. Volume 176, 1 January 2018, Pages 329-343
[3] McGinnis A.C, Chen B, Bartlett M.G. Chromatographic methods for the determination of
therapeutic oligonucleotides. Journal of Chromatography B. Volumes 883–884, 1 February
2012, Pages 76-94
[4] Andrews B.I, Antia F.D, Brueggemeier S.B, Diorazio L.J, Koenig S.G, Kopach M.E, et al.
Sustainability Challenges and Opportunities in Oligonucleotide Manufacturing. J. Org. Chem.
2021; 86(1): 49-61
[5] Sharma V.K, Watts J.K. Oligonucleotide therapeutics: chemistry, delivery and clinical
progress. Future Medicinal Chemistry. 2015; 7(16). https://doi.org/10.4155/fmc.15.144
[6] Biba M, Welch C.J, Mao B, Foley J.P. Liquid Chromatography Methods for the
Separation of Short RNA Oligonucleotides. J. Chromatogr. A 2013, vol. 1304, p. 69-77
[7] Guiochon G. The limits of the separation power of unidimensional column liquid
chromatography. Journal of Chromatography A, 1126 (2006) 6–49.
https://doi.org/10.1016/j.chroma.2006.07.032
[8] Noll B, Roehl I, authors of Chapter 3 “Separation of Oligonucleotides and Related
Substances” in the book “Analysis of Oligonucleotides and their Related Substances”, editors:
Okafo G, Elder D, Webb M
[9] Tymoczko J.L, Berg J.M, Stryer L. Biochemistry: A Short Course. New York, NY: W.H.
Freeman & Company, 2015
[10] Butler J.M. Advanced Topics in Forensic DNA Typing: Methodology. Chapter 3 - DNA
Quantitation. Academic Press, 2012, Pages 49-67. https://doi.org/10.1016/B978-0-12-374513-
2.00003-8
[11] Müller-Taubenberger A, Ishikawa-Ankerhold H.C. Fluorescent Reporters and Methods
to Analyze Fluorescent Signals. Methods Mol. Biol., 983 (2013), pp. 93-112.
[12] Oefner P.J, Huber C.G, Umlauft F, Berti G.N, Stimpf E, Bonn G.K. High-Resolution
Liquid Chromatography of Fluorescent Dye-Labeled Nucleic Acids. Anal. Biochem., 223
(1994), p. 39
[13] Anacleto C, Ouye R, Schoenbrunner N. Orthogonal ion pairing reversed phase liquid
chromatography purification of oligonucleotides with bulky fluorophores. 2014; 1329: 78-82.
https://doi.org/10.1016/j.chroma.2013.12.072
[14] El Zahar N.M., Magdy N., El-Kosasy A.M., Bartlett M.G. Chromatographic approaches
for the characterization andquality control of therapeutic oligonucleotide impurities.
Biomedical Chromatography 2018, vol. 32(1). https://doi.org/10.1002/bmc.4088

36
[15] Fornstedt T, Forssén P, Westerlund D, Basic HPLC Theory and Definitions: Retention,
Thermodynamics, Selectivity, Zone Spreading, Kinetics, and Resolution, in: V. Pino, J.L.
Anderson, A. Berthod, A.M. Stalcup (Eds.), Anal. Sep. Sci., Wiley-VCH Verlag GmbH &
Co. KGaA, Weinheim, Germany, 2015: pp. 1–24.
http://doi.wiley.com/10.1002/9783527678129.assep001 (accessed January 23, 2017).
[16] Fornstedt T, Forssén P and Samuelsson J, authors of Chapter 18 “Modeling of
Preparative Liquid Chromatography of Small Molecules” in the book “Liquid
Chromatography: Fundamentals and Instrumentation” (Handbooks in Separation Science
series 2013, 9780124158078; pages 407-425), editors: Salvatore Fanali, Paul R. Haddad,
Colin Poole, Peter Schoenmakers, David K. Lloyd
[17] Q. Zhang, H. Lv, L. Wang, M. Chen, F. Li, C. Liang, Y. Yu, F. Jiang, A. Lu, G. Zhang
Recent methods for purification and structure determination of oligonucleotides Int. J. Mol.
Sci., 17 (2016), p. 2134
[18] GE Healthcare Bio-Sciences AB. Hydrophobic Interaction and Reversed Phase
Chromatography, Principles and Methods [Handbook].
[19] LibreTexts. High Performance Liquid Chromatography [Internet]. [updated 2020-08-16;
cited 2021-05-19]. Available from:
https://chem.libretexts.org/Bookshelves/Analytical_Chemistry/Supplemental_Modules_(Anal
ytical_Chemistry)/Instrumental_Analysis/Chromatography/High_Performance_Liquid_Chro
matography
[20] Harris D.C. Quantitative chemical analysis. Ninth edition. New York, NY: W.H.
Freeman and Company, [2016]
[21] Tilly-Melin A, Askemark Y, Wahlund K.G, Schill G. Retention Behavior of Carboxylic
Acids and Their Quaternary Ammonium Ion Pairs in Reversed Phase Chromatography with
Acetonitrile as Organic Modifier in the Mobile Phase. Analytical Chemistry. 1979; 51(7):
976-983
[22] Sutton JM, Guimaraes GJ, Annavarapu V, van Dongen WD, Bartlett MG. Current State
of Oligonucleotide Characterization Using Liquid Chromatography−Mass Spectrometry:
Insight into Critical Issues. J. Am. Soc. Mass Spectrom. 2020, 31, 9, 1775–1782.
https://doi.org/10.1021/jasms.0c00179
[23] Nylander J. The dependence of chromatographic conditions for separation of
oligonucleotides in different AEX-HPLC columns [master’s thesis in the Internet].
Stockholm: Kungliga Tekniska högskolan (KTH); 2020 [cited 2021-05-26]. Available from:
https://www.diva-portal.org/smash/get/diva2:1456097/FULLTEXT01.pdf
[24] Agilent InfinityLab. Principles and practical aspects of preparative liquid
chromatography. © Agilent Technologies, Inc. 2019 [cited 2021-05-27]. Available from:
https://www.agilent.com/cs/library/primers/public/primer-preparative-liquid-chromatography-
5994-1016EN-agilent.pdf
[25] GE Healthcare Bio-Sciences AB. Ion Exchange Chromatography & Chromatofocusing,
Principles and Methods [2010]. Available from:

37
https://www.sigmaaldrich.com/content/dam/sigma-aldrich/docs/Sigma-
Aldrich/General_Information/1/ge-ion-exchange-chromatography.pdf
[26] Stauffer E, Dolan J.A, Newman R. Fire Debris Analysis. 1 ed. © Academic Press 2007.
Chapter 8, Gas Chromatography and Gas Chromatography—Mass Spectrometry.
https://doi.org/10.1016/B978-012663971-1.50012-9
[27] Cretier G, Rocca J.L. Mass Overload in Preparative Liquid Chromatography: Band
Broadening and Maximum Sample Load. Chromatographia. 1985; 20: 461-465.
https://doi.org/10.1007/BF02344786
[28] Enmark M, Bagge J, Samuelsson J, Thunberg L, Örnskov E, Leek H, Limé F, Fornstedt.
Analytical and preparative separation of phosphorothioated oligonucleotides: columns and
ion-pair reagents. Analytical and Bioanalytical Chemistry (2020) 412:299–309.
https://doi.org/10.1007/s00216-019-02236-9
[29] Azizian S, Eris S, Wilson L.D. Re-evaluation of the century-old Langmuir isotherm for
modeling adsorption phenomena in solution. Chemical Physics. 2018; 513: 99-104.
https://doi.org/10.1016/j.chemphys.2018.06.022
[30] Fornstedt T, Guiochon G. Nonlinear Effects in LC and Chiral LC. Anal. Chem. 2001, 73,
21, 608 A–617 A. https://doi.org/10.1021/ac012533b
[31] Gong L, McCullagh J.S.O. Comparing ion‐pairing reagents and sample dissolution
solvents for ion‐pairing reversed‐phase liquid chromatography/electrospray ionization mass
spectrometry analysis of oligonucleotides. Rapid Communications in Mass Spectrometry.
2013; 28(4): 339-350. https://doi.org/10.1002/rcm.6773
[32] Goyon A, Zhang K. Characterization of Antisense Oligonucleotide Impurities by Ion-
Pairing Reversed-Phase and Anion Exchange Chromatography Coupled to Hydrophilic
Interaction Liquid Chromatography/Mass Spectrometry Using a Versatile Two-Dimensional
Liquid Chromatography Setup. Anal. Chem. 2020, 92, 8, 5944–5951.
https://doi.org/10.1021/acs.analchem.0c00114
[33] Ståhlberg J. Retention models for ions in chromatography. Journal of Chromatography
A. 1999; 855(1): 3-55. https://doi.org/10.1016/S0021-9673(99)00176-4
[34] Stålberg O*, Ståhlberg J. Theoretical aspects on the regulation of electroosmotic flow in
1 capillary electrophoresis by adding charged amphiphiles. Journal of Chromatography A,
776 (1997) 311–318. https://doi.org/10.1016/S0021-9673(97)00243-4
[35] Israelachvili J. Intermolecular & Surface Forces. 2nd ed. New York: Academic Press;
1991
[36] N. S. Lakka and C Kuppan (October 26th 2019). Principles of Chromatography Method
Development, Biochemical Analysis Tools - Methods for Bio-Molecules Studies, Oana-Maria
Boldura, Cornel Baltă and Nasser Sayed Awwad, IntechOpen, DOI: 10.5772/intechopen.89501.
Available from: https://www.intechopen.com/books/biochemical-analysis-tools-methods-for-bio-
molecules-studies/principles-of-chromatography-method-development

38
[37] Guiochon G. The limits of the separation power of unidimensional column liquid
chromatography. Journal of Chromatography A. Volume 1126, Issues 1–2, 8 September 2006,
Pages 6-49. https://doi.org/10.1016/j.chroma.2006.07.032
[38] ThermoFisher Scientific. Overview of Mass Spectrometry for Protein Analysis [Internet].
[cited 2021-05-19]. Available from: https://www.thermofisher.com/de/de/home/life-
science/protein-biology/protein-biology-learning-center/protein-biology-resource-
library/pierce-protein-methods/overview-mass-spectrometry.html
[39] LGC Biosearch Technologies. FAM; 5' Modification [Internet]. [cited 2021-05-20].
Available from: https://www.biosearchtech.com/support/resources/oligo-modifications/fam-5-
modification
[40] McCalley D.V. Overload for Ionized Solutes in Reversed-Phase High-Performance
Liquid Chromatography. Anal. Chem. 2006, 78, 2532-2538.
https://doi.org/10.1021/ac052098b
[41] LGC Biosearch Technologies. BHQ-1 CPG; Glycolate, 1000 Å [Internet]. [cited 2021-
05-20]. Available from: https://www.biosearchtech.com/products/synthesis-
reagents/cpg/bhq1-cpg-glycolate44-1000-
[42] LGC Biosearch Technologies. BHQ-2 CPG; Glycolate, 1000 Å [Internet]. [cited 2021-
05-20]. Available from: https://www.biosearchtech.com/products/synthesis-
reagents/cpg/bhq2-cpg-glycolate44-1000-
[43] LGC Biosearch Technologies. Spacer 18 Amidite (DMT-Hexa(ethylene glycol))
[Internet]. [cited 2021-05-20]. Available from:
https://www.biosearchtech.com/products/synthesis-reagents/amidites/spacer-18-amidite-
dmthexaethylene-glycol

39
Appendix 1 – Oligonucleotides and modifications
Table 5. Oligonucleotides used in this master thesis.
Amine
An amine is located at the 5´-end of samples 0206 and 2161. In the final product, the
modification “Quasar 670” would have been attached to the amine, but as the product failed
during manufacturing, the quasar modification was never attached.
BHQ1
BHQ1 is a modification that is attached to the 3´-end of ONs and absorbs between 480 and
580 nm [41].
Figure 26. Structure of the modification BHQ1. Figure provided by SGS DNA.
BHQ2
BHQ2 is a modification that is attached to the 3´-end of ONs and absorbs between 560 to 670
nm. [42].
Sample Sequence Molecular weight (g/mol)
162 FAM – 28 mer – BHQ1 9629
0206 Amine – 26 mer – BHQ2 - Spacer 18 – 17 mer 14510
2161 Amine – 26 mer – BHQ2 – Spacer 18 – 17 mer 14510
44 44 mer -

40
Figure 27. Structure of the modification BHQ2. Figure provided by SGS DNA.
FAM
FAM is a modification at is attached to the 5´-end of ONs and fluoresces in the green region
of the visible spectrum. It is common to use FAM in the combination with BHQ1 [39].
Figure 28. Structure of the modification FAM. Figure provided by SGS DNA
Spacer 18
The spacer 18 modification is used to incorporate spacer arms into ONs and is added to create
longer spacer arms and increase stability [43].
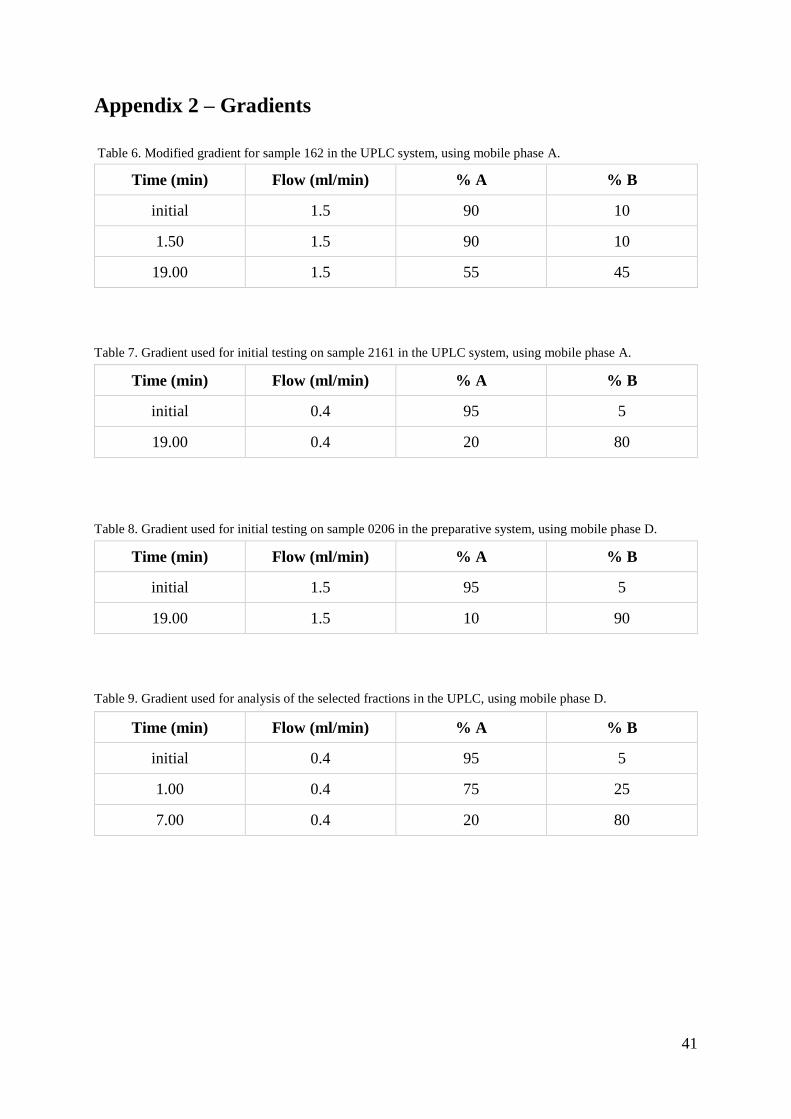
41
Appendix 2 – Gradients
Table 6. Modified gradient for sample 162 in the UPLC system, using mobile phase A.
Table 7. Gradient used for initial testing on sample 2161 in the UPLC system, using mobile phase A.
Table 8. Gradient used for initial testing on sample 0206 in the preparative system, using mobile phase D.
Table 9. Gradient used for analysis of the selected fractions in the UPLC, using mobile phase D.
Time (min) Flow (ml/min) % A % B
initial 1.5 90 10
1.50 1.5 90 10
19.00 1.5 55 45
Time (min) Flow (ml/min) % A % B
initial 0.4 95 5
19.00 0.4 20 80
Time (min) Flow (ml/min) % A % B
initial 1.5 95 5
19.00 1.5 10 90
Time (min) Flow (ml/min) % A % B
initial 0.4 95 5
1.00 0.4 75 25
7.00 0.4 20 80

42
Appendix 3 – Chromatograms and MS spectra
Figure 29. Separation of sample 0206 with mobile phase A.
Figure 30. Separation of sample 0206 with mobile phase B.

43
Figure 31. Separation of sample 0206 with mobile phase C.
Figure 32. Separation of sample 0206 with mobile phase D.
Figure 33. MS spectrum of fraction 24, sample 0206, semi-preparative purification.

44
Figure 34. MS spectrum of fraction 29, sample 0206, semi-preparative purification.
Figure 35. MS spectrum of fraction 19, sample 0206, 7 mM purification.

45
Appendix 4 – Other figures
Figure 36. A preparative HPLC column method transfer tool from ThermoFisher was used to calculate an
equivalent gradient for the semi-preparative column.

46
Figure 37. Fraction collection of sample 44 made in the semi-preparative system.
Figure 38. Fraction collection of sample 44 in the preparative system showed that several fractions had a purity
of 99%.


