Embed Size (px)
Citation preview
Annual Report 2012
CST Mining Group Limited
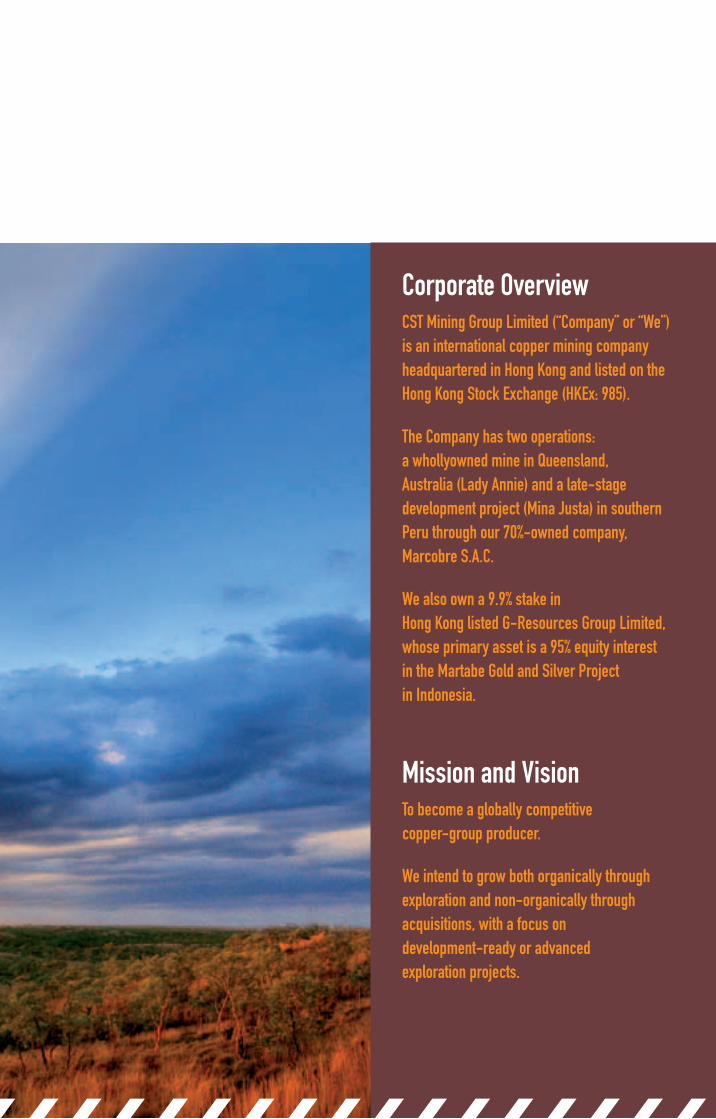
NEW ERA Corporate OverviewCST Mining Group Limited (“Company” or “We”) is an international copper mining company headquartered in Hong Kong and listed on the Hong Kong Stock Exchange (HKEx: 985).
At present, the Company has two operations: a whollyowned mine in Queensland, Australia (Lady Annie) and a late-stage development project (Mina Justa) in southernPeru through our 70%-owned company, Marcobre S.A.C.
We also own a 9.9% stake in Hong Kong listed G-Resources Group Limited, whose primary asset is a 95% equity interestin the Martabe Gold and Silver Project in Indonesia.
Mission and VisionTo become a globally competitive copper-group producer.
We intend to grow both organically through exploration and non-organically through acquisitions, with a focus on development-ready or advanced exploration projects.
CST M
inin
g G
rou
p Lim
ited
An
nu
al Rep
ort 2012CST Mining Group Limited
(Incorporated in Cayman Islands with limited liability)
Stock code: 985
REGISTERED OFFICE
First Floor
Caledonian House
69 Dr. Roy’s Drive
P.O. Box 1043
George Town
Grand Cayman KY1-1102
Cayman Islands
HONG KONG OFFICE
Rooms 4503-05, 45th Floor
China Resources Building
26 Harbour Road
Wanchai
Hong Kong
www.cstmining.com
Prepare to enter into a
Annual Report 2012
CST Mining Group Limited
A NEW ERA Corporate OverviewCST Mining Group Limited (“Company” or “We”) is an international copper mining company headquartered in Hong Kong and listed on the Hong Kong Stock Exchange (HKEx: 985).
The Company has two operations: a whollyowned mine in Queensland, Australia (Lady Annie) and a late-stage development project (Mina Justa) in southernPeru through our 70%-owned company, Marcobre S.A.C.
We also own a 9.9% stake in Hong Kong listed G-Resources Group Limited, whose primary asset is a 95% equity interestin the Martabe Gold and Silver Project in Indonesia.
Mission and VisionTo become a globally competitive copper-group producer.
We intend to grow both organically through exploration and non-organically through acquisitions, with a focus on development-ready or advanced exploration projects.
CST Mining Group Limited(Incorporated in Cayman Islands with limited liability)
Stock code: 985
REGISTERED OFFICE
First Floor
Caledonian House
69 Dr. Roy’s Drive
P.O. Box 1043
George Town
Grand Cayman KY1-1102
Cayman Islands
HONG KONG OFFICE
Rooms 4503-05, 45th Floor
China Resources Building
26 Harbour Road
Wanchai
Hong Kong
www.cstmining.com
Prepared to enter
CST M
inin
g G
rou
p Lim
ited
An
nu
al Rep
ort 2012
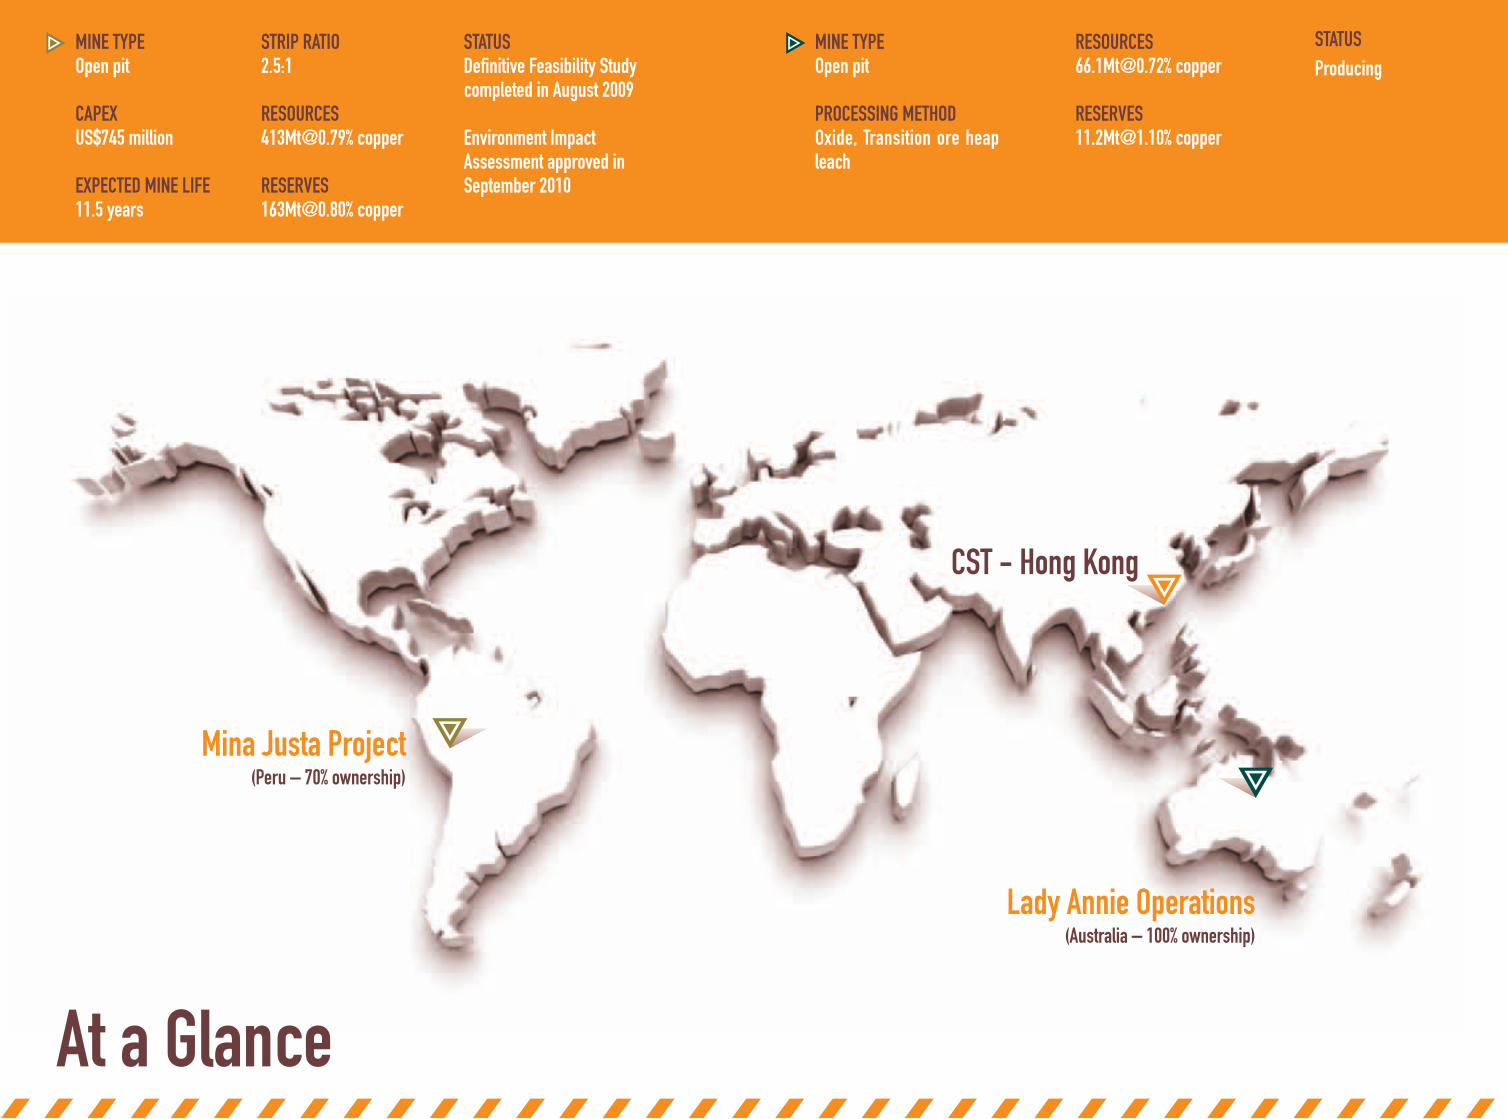
MINE TYPEOpen pit
CAPEXUS$745 million
EXPECTED MINE LIFE11.5 years
STRIP RATIO2.5:1
[email protected]% copper
[email protected]% copper
STATUSDefinitive Feasibility Study completed in August 2009
Environment Impact Assessment approved in September 2010
MINE TYPEOpen pit
PROCESSING METHODOxide, Transition ore heap leach
[email protected]% copper
[email protected]% copper
CST - Hong Kong
At a Glance
Mina Justa Project(Peru – 70% ownership)
Lady Annie Operations(Australia – 100% ownership)
STATUSProducing
Contents
We are extremely proud that our theme “Prepared to Enter a New Era” reflects the transformational accomplishments achieved by the Company over the year to 31 March 2012. The successful sale of the Mina Justa copper mine in Peru and the stabilisation of high-grade copper production and extension of mine life at the Lady Annie mine in Australia together define our strategic objectives — to create shareholder value and become a global-scale copper-group producer.
2Growth Strategy
4Chairman’s Statement
6Chief Executive Officer’s Review
10Project Overview
22Corporate Sustainability Report
25Management Report26 Biographical Details of Directors29 Management Discussion and Analysis34 Directors’ Report
43Corporate Governance Report
48Financial Overview49 Independent Auditor’s Report51 Consolidated Statement of Comprehensive Income52 Consolidated Statement of Financial Position53 Consolidated Statement of Changes in Equity54 Consolidated Statement of Cash Flows55 Notes to the Consolidated Financial Statements
110Financial Summary
111Particulars of Properties Held by the Group
112Corporate Information

OUR TWO STEP GROWTH STRATEGY Our long-term strategy is to develop the Company
into a world-class Asia-Pacific copper-group miner.
1. Organic Growth at Lady Annie We have successfully stabilised production of high-grade
copper. Now we aim to extend mine life further, starting at Anthill.
Meanwhile, regional exploration programmes are underway on surrounding licences to identify new resources that will expand our mine life further.
2. Growth Through Acquisition With our Lady Annie success and the sale of Mina Justa, we
are seeking new acquisitions to strengthen our asset base and boost our cash flow.
We are continually reviewing potentially suitable advanced exploration or operating mine projects across the Asia-Pacific region, and aim to benefit from geographic focus.
Chairman’s Statement
4 Annual Report 2012
IT PROVED TO BE A YEAR OFSIGNIFICANT ACHIEVEMENT ANDCONTINUED INCREASES IN SHAREHOLDER VALUE
Dear Shareholders,
I am pleased to report that the 12 months to 31
March 2012 proved to be for CST Mining Group
Limited (“CST”, “the Company”) a year of
significant achievement and continued increases in
shareholder value.
Our management team has worked hard during the
year on the disposal of the Company’s 70%
interest in the Mina Justa copper project in Peru,
and I am particularly delighted that shortly after the
year-end these efforts came to fruition with an
agreed US$505 million sale to Cumbres Andinas
S.A. (“Cumbres”) and the sale has been completed
on 13 June 2012.
I believe this significant outcome is evident to the
Company’s consistent strategy to realise high
returns for our shareholders.
I am equally pleased to report that, at the Lady
Annie copper mine in Queensland, Australia, our
success during the year in stabilising mining
operations and optimising copper production levels
means we are now reliably meeting steady monthly
production budgets, on or ahead of target. I would
like to take this opportunity to thank CST Lady
Annie team for working closely with the head
office in the past year and reaching such great
result.

5CST Mining Group Limited
Our exploration results have also provided data for
an important resource and reserve update that will
enable us to extend the Lady Annie mine life,
which is as we promised to do as when we
acquired the project. Update on resource and
reserve is underway and shall be released later this
year.
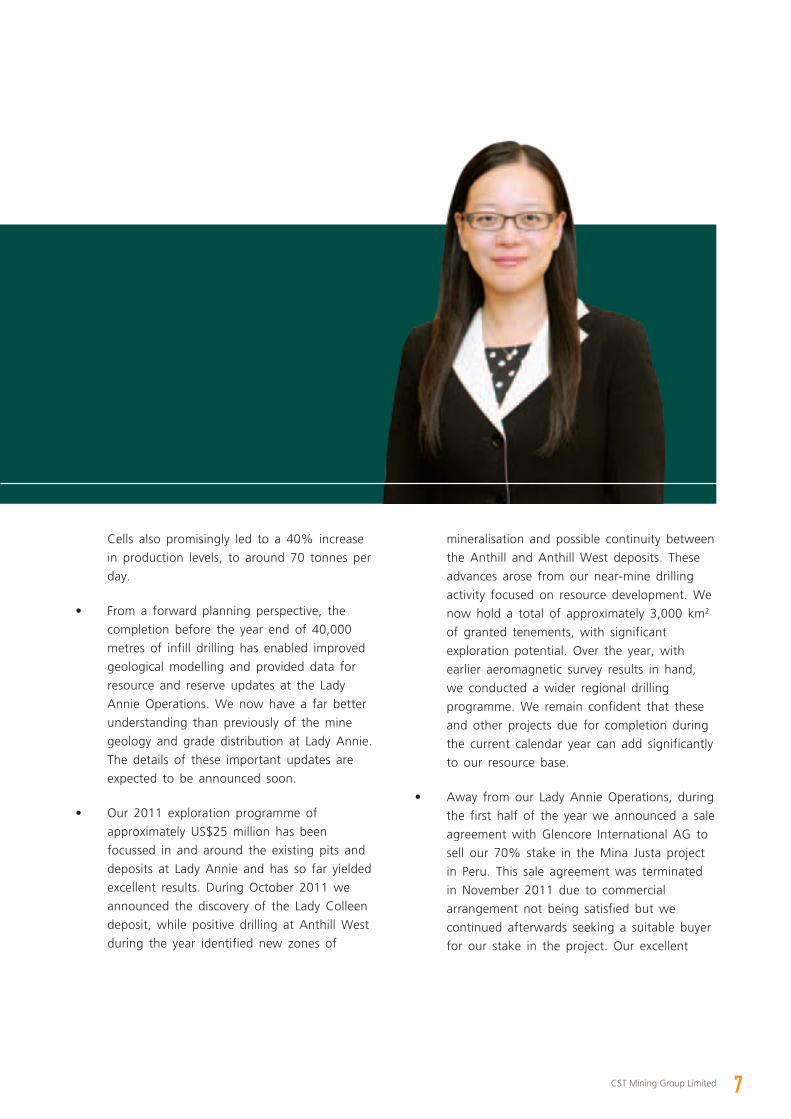
It is against this extremely positive backdrop that I
am delighted to thank Ms Lydia Yifang Yang, who
became our new CEO during the year for leading
the dedicated expert teams at our Hong Kong
headquarters and in Queensland and Peru.
Their achievements ensure that we remain steadily
on track to meet our long-term strategic objective
of becoming an Asia-based, globally competitive
copper-group mining company.
I am sure we shall all benefit further from the
enhanced value created.
Sincerely yours
Chiu TaoChairman
Hong Kong, 26 June 2012
Chief Executive Officer’s Review
6 Annual Report 2012
Dear Shareholders,
I am pleased to report during the year to 31 March
2012 we have seen the achievement of several
important new milestones for CST.
At Lady Annie we have been successful in
implementing a number of improvements to ensure
our mining and processing operations are now
more efficiently integrated. This enables better
forward planning and allows us to stabilize and
optimise current and future production of quality
copper cathode.
We also continue seeking new opportunities to
fulfill our strategic objective of becoming a mid-tier
mining company. I feel confident that our
measurable success at Lady Annie during the year
and the completion of Mina Justa sale shortly after
the year end underscore our ability to build a
strong future.
Details of our progress are provided in the Project
Overviews of this report for both Lady Annie in
Australia and the Mina Justa project in Peru. But
among the year’s highlights I would include:
• In the interim report we promised to conduct
an operational review to address our
administrative, accounting and governance
procedures, as well as implementing and
upgrading safety policies. The review has been
completed and has successfully introduced
new planning, report and operating
procedures to enable efficiencies at the Lady
Annie mine.
• Operational streamlining and upgrades at Lady
Annie culminated in a record final quarter
production of 4,838 tonnes of copper
cathode. This significant record output was
achieved ahead of budget and below planned
expenditure. During the year, the processing
team also commenced industrial scale trials to
process transition ores, including a blend with
oxide ore which resulted in better than
normal production rates at no increased cost.
And shortly before the year end during
March, the commencement of SX-EW Series 2
OUR SUCCESS AT LADY ANNIEUNDERSCORES OUR ABILITY TOBUILD A STRONG FUTURE
7CST Mining Group Limited
Cells also promisingly led to a 40% increase
in production levels, to around 70 tonnes per
day.
• From a forward planning perspective, the
completion before the year end of 40,000
metres of infill drilling has enabled improved
geological modelling and provided data for
resource and reserve updates at the Lady
Annie Operations. We now have a far better
understanding than previously of the mine
geology and grade distribution at Lady Annie.
The details of these important updates are
expected to be announced soon.
• Our 2011 exploration programme of
approximately US$25 million has been
focussed in and around the existing pits and
deposits at Lady Annie and has so far yielded
excellent results. During October 2011 we
announced the discovery of the Lady Colleen
deposit, while positive drilling at Anthill West
during the year identified new zones of
mineralisation and possible continuity between
the Anthill and Anthill West deposits. These
advances arose from our near-mine drilling
activity focused on resource development. We
now hold a total of approximately 3,000 km2
of granted tenements, with significant
exploration potential. Over the year, with
earlier aeromagnetic survey results in hand,
we conducted a wider regional drilling
programme. We remain confident that these
and other projects due for completion during
the current calendar year can add significantly
to our resource base.
• Away from our Lady Annie Operations, during
the first half of the year we announced a sale
agreement with Glencore International AG to
sell our 70% stake in the Mina Justa project
in Peru. This sale agreement was terminated
in November 2011 due to commercial
arrangement not being satisfied but we
continued afterwards seeking a suitable buyer
for our stake in the project. Our excellent
8 Annual Report 2012
Chief Executive Officer’s Review
THIS 12 MONTHS TO THE END OF MARCHSAW DRAMATIC PROGRESS. WE ARESTRONGLY POSITIONED TO TAKEFURTHER STRIDES FORWARD
team in Peru continued working to maintain
daily operations and sustain its full commercial
value. Their efforts contributed to our recent
$505 million sale agreement with Cumbres
Andinas S.A., announced shortly after the year
end and successfully completed on 13 June
2012. The company is now in a financially
strengthened position to grow. We will
continue to identify new operating
improvements, resource opportunities, and
growth potential to create value for
shareholders. This includes an ongoing
assessment of opportunities for the acquisition
of suitable production or near-production
copper-group assets to add to our resource
portfolio. Further information on such
opportunities will be reviewed carefully by the
Board and disclosed to shareholders on a
timely basis.
In summary, the 12-months to the end of March
2012 saw dramatic progress that positions CST to
build on the solid revenue base and potential now
established at Lady Annie. With streamlined
operational and reporting procedures also now in
place between our Hong Kong headquarters and
our field operations, I am confident that we are
strongly positioned to take further strides forward
during the current year.
None of these achievements would have been
possible without the support of our Chairman,
Mr Chiu Tao, and the expertise, dedication and
hard work of our operational and administrative
teams, and I thank them all for their significant
contributions to a year of successes.
9CST Mining Group Limited
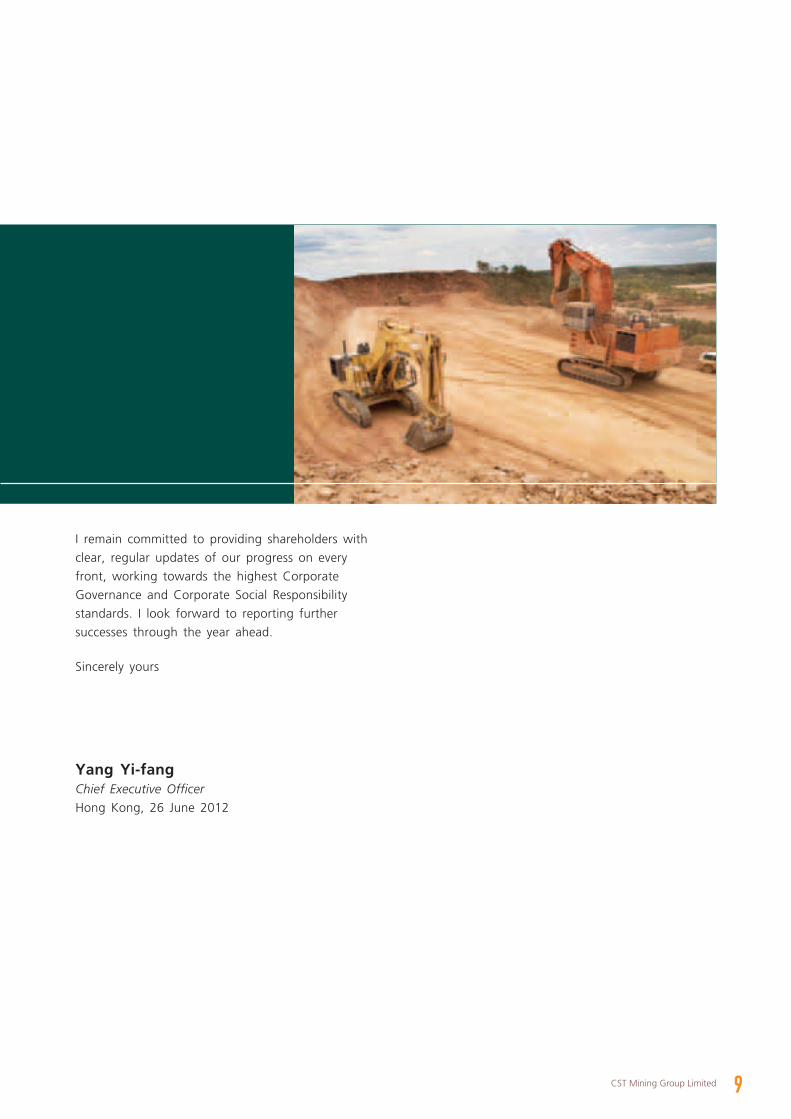
I remain committed to providing shareholders with
clear, regular updates of our progress on every
front, working towards the highest Corporate
Governance and Corporate Social Responsibility
standards. I look forward to reporting further
successes through the year ahead.
Sincerely yours
Yang Yi-fangChief Executive Officer
Hong Kong, 26 June 2012
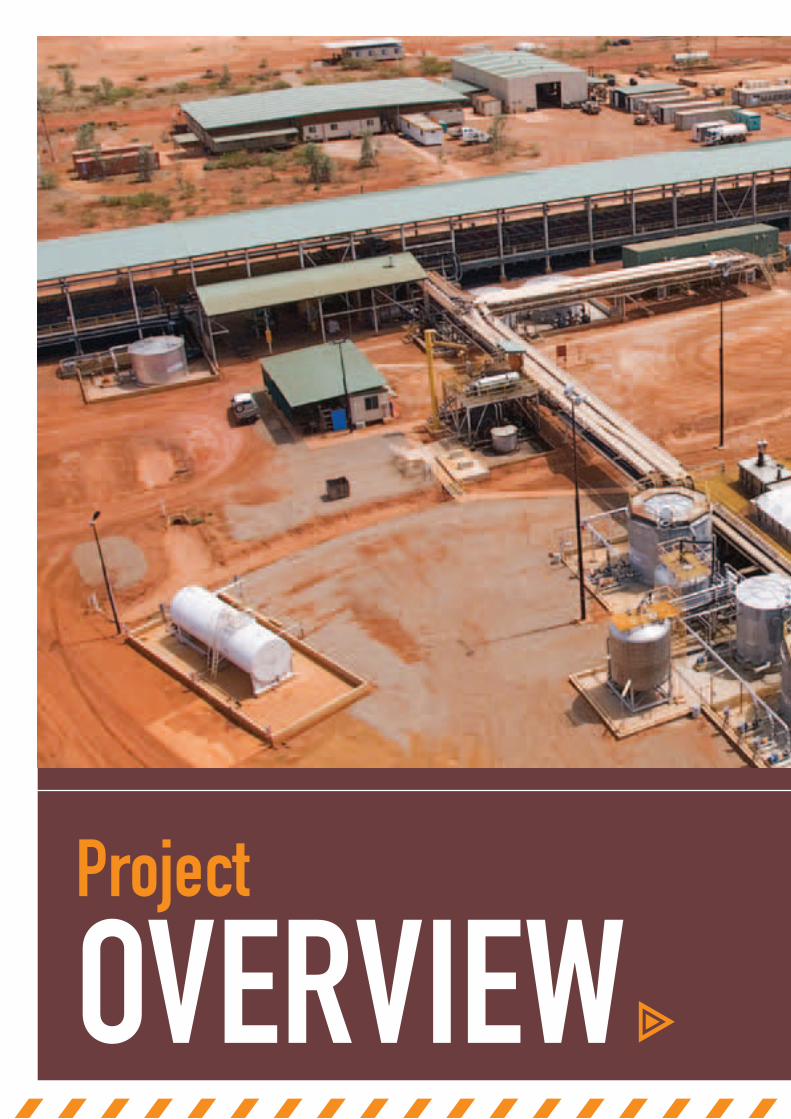
Project
OVERVIEW
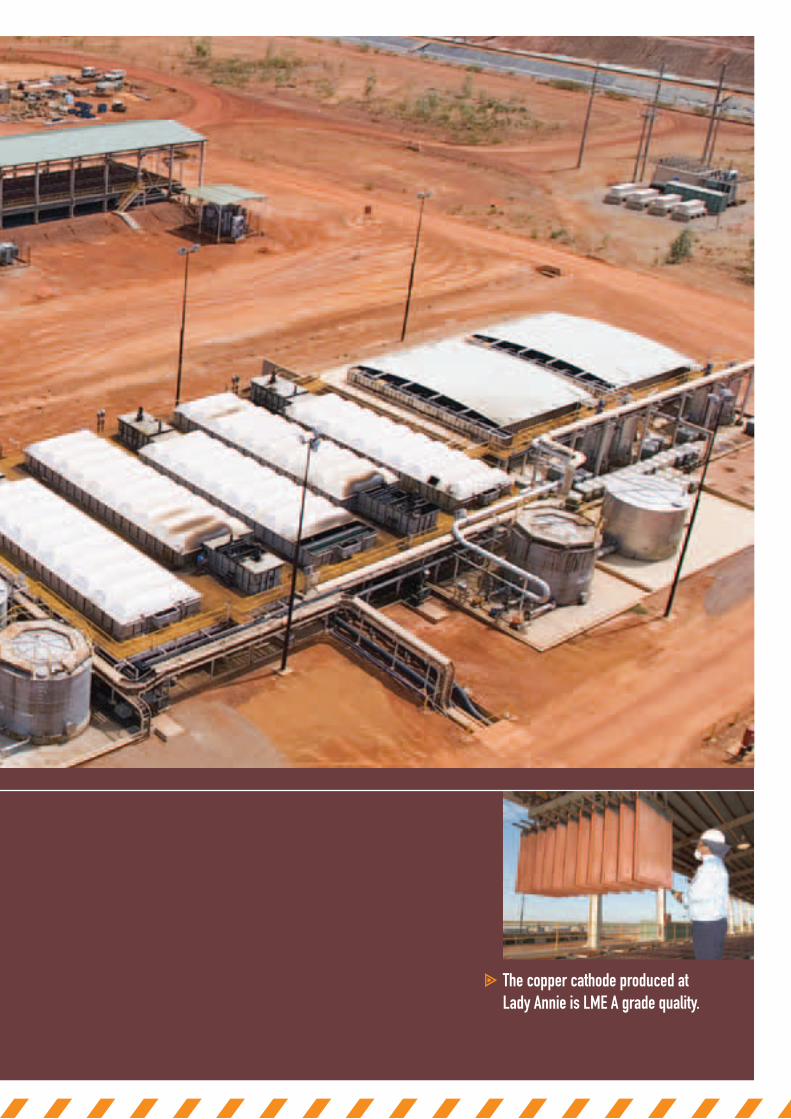
The copper cathode produced atLady Annie is LME A grade quality.
12 Annual Report 2012
Project Overview
Ore Mined (Tonnes) Production (Tonnes) Revenue (US$)
3.51 millionapproximately approximately
million18,402 $147
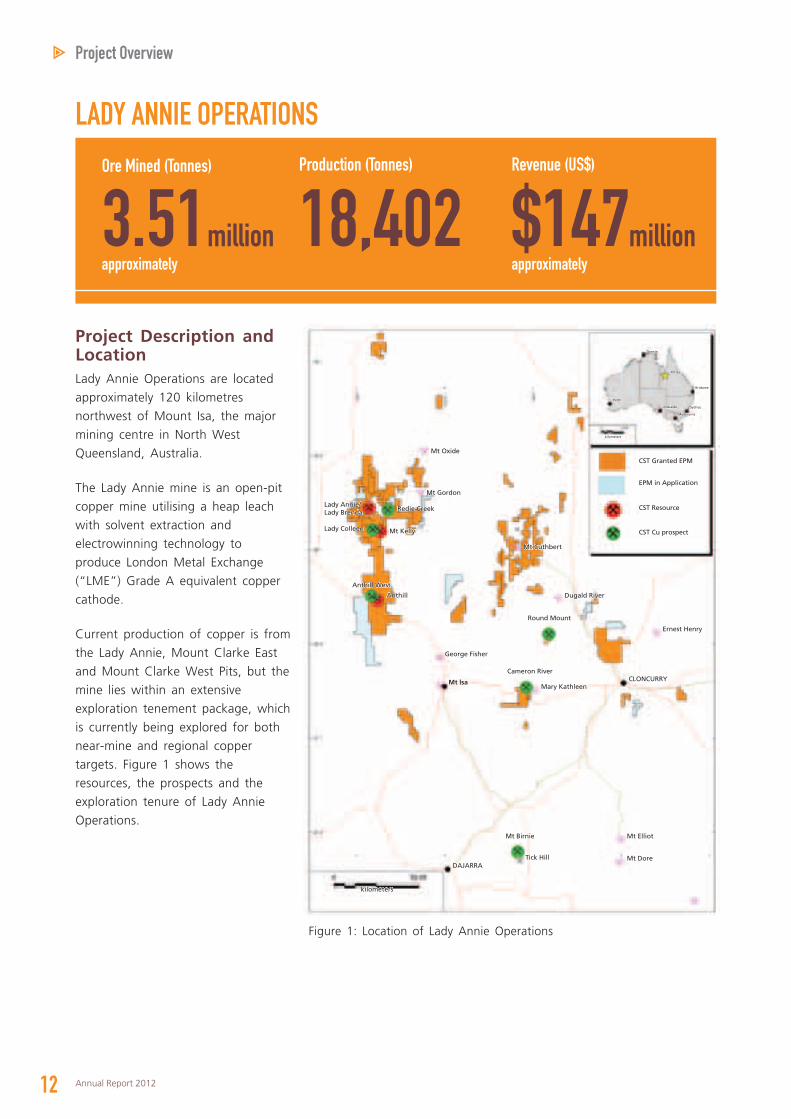
LADY ANNIE OPERATIONS
Project Description and LocationLady Annie Operations are located
approximately 120 kilometres
northwest of Mount Isa, the major
mining centre in North West
Queensland, Australia.
The Lady Annie mine is an open-pit
copper mine utilising a heap leach
with solvent extraction and
electrowinning technology to
produce London Metal Exchange
(“LME”) Grade A equivalent copper
cathode.
Current production of copper is from
the Lady Annie, Mount Clarke East
and Mount Clarke West Pits, but the
mine lies within an extensive
exploration tenement package, which
is currently being explored for both
near-mine and regional copper
targets. Figure 1 shows the
resources, the prospects and the
exploration tenure of Lady Annie
Operations.Mt Elliot
Mt DoreTick HillDAJARRA
kilometers
Mt Birnie
Mt lsa
George Fisher
Anthill West
Mt KellyLady Colleen
Lady Annie/ Lady Brenda
Anthill
Mary Kathleen
Cameron River
Round Mount
Mt Cuthbert
CST Granted EPM
kilometers
Perth
Adelaide
Melbourne
Sydney
Brisbane
Mt Isa
Darwin
EPM in Application
CST Resource
CST Cu prospect
Mt Gordon
Redie Creek
Mt Oxide
Dugald River
Ernest Henry
CLONCURRY
Figure 1: Location of Lady Annie Operations
13CST Mining Group Limited
1. Operating Results
Key operational information for the year ended 31 March 2012 and 2011
2012 2011
Mined Total material (tonnes) 16,586,652 8,791,530Ore (tonnes) 3,514,585 1,130,730Ore grade (Cu%) 1.06 0.96Contained Cu (tonnes) 37,197 10,903
Stacked Ore (tonnes) 2,893,502 1,157,773Ore grade (Cu%) 0.98 0.88Contained Cu (tonnes) 28,322 10,187
Production Cu cathode (tonnes) 18,402 5,906
Sales Cu cathode (tonnes) 17,382 5,087Average price (US$/tonne) 8,446 8,827Revenue (US$’000) 146,803 44,903
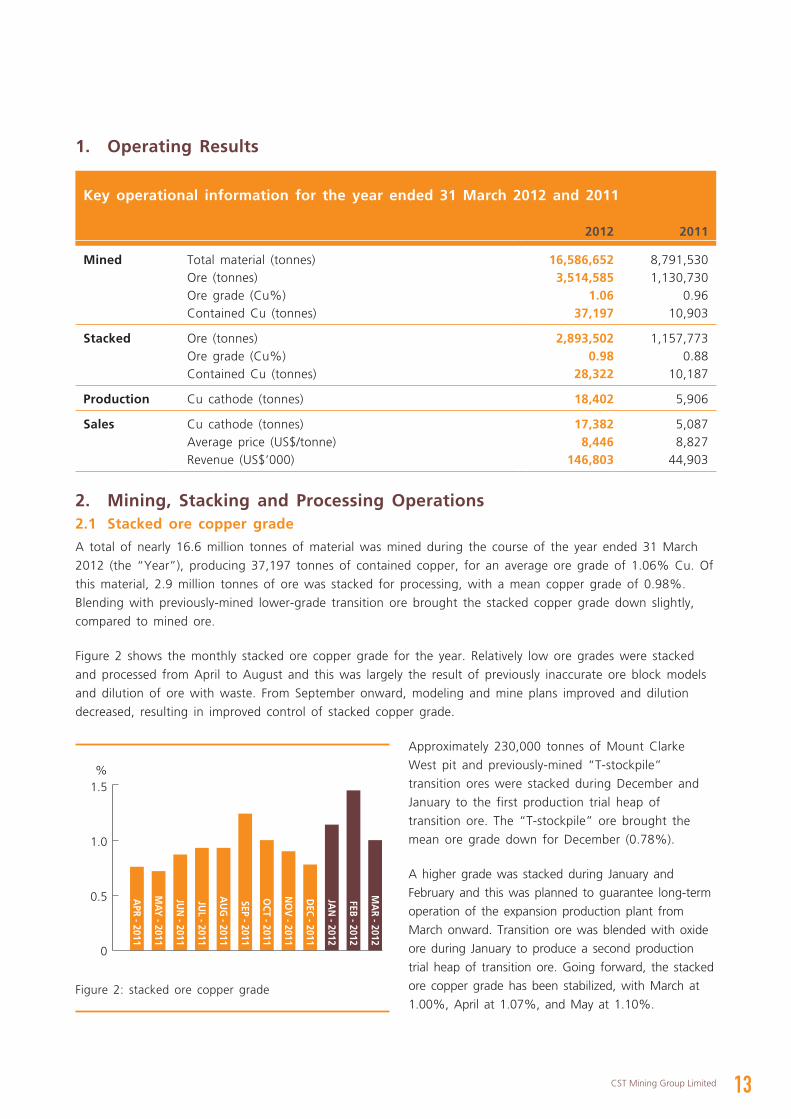
2. Mining, Stacking and Processing Operations2.1 Stacked ore copper grade
A total of nearly 16.6 million tonnes of material was mined during the course of the year ended 31 March
2012 (the “Year”), producing 37,197 tonnes of contained copper, for an average ore grade of 1.06% Cu. Of
this material, 2.9 million tonnes of ore was stacked for processing, with a mean copper grade of 0.98%.
Blending with previously-mined lower-grade transition ore brought the stacked copper grade down slightly,
compared to mined ore.
Figure 2 shows the monthly stacked ore copper grade for the year. Relatively low ore grades were stacked
and processed from April to August and this was largely the result of previously inaccurate ore block models
and dilution of ore with waste. From September onward, modeling and mine plans improved and dilution
decreased, resulting in improved control of stacked copper grade.
Approximately 230,000 tonnes of Mount Clarke
West pit and previously-mined “T-stockpile”
transition ores were stacked during December and
January to the first production trial heap of
transition ore. The “T-stockpile” ore brought the
mean ore grade down for December (0.78%).
A higher grade was stacked during January and
February and this was planned to guarantee long-term
operation of the expansion production plant from
March onward. Transition ore was blended with oxide
ore during January to produce a second production
trial heap of transition ore. Going forward, the stacked
ore copper grade has been stabilized, with March at
1.00%, April at 1.07%, and May at 1.10%.Figure 2: stacked ore copper grade
1.5
1.0
0.5
0
APR - 2011
MAY
- 2011
JUN
- 2011
JUL - 2011
AU
G - 2011
SEP - 2011
OCT - 2011
NO
V - 2011
DEC - 2011
JAN
- 2012
FEB - 2012
MA
R - 2012
%
14 Annual Report 2012
Project Overview
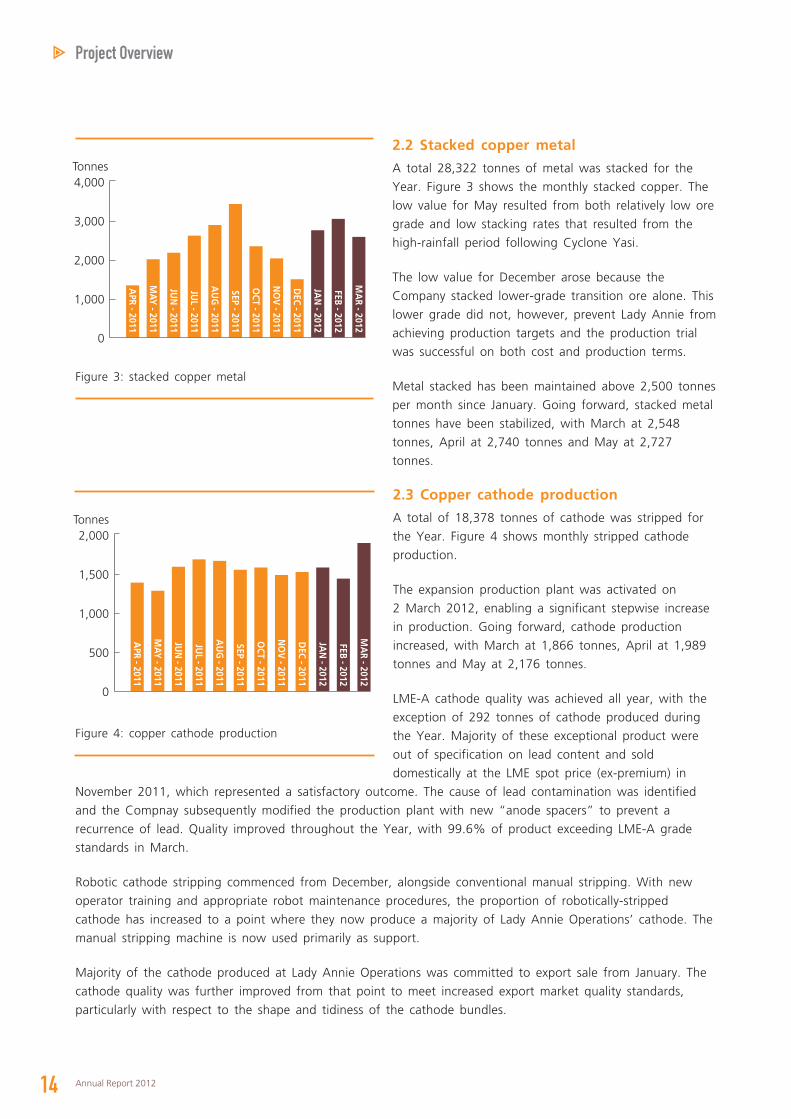
2.2 Stacked copper metal
A total 28,322 tonnes of metal was stacked for the
Year. Figure 3 shows the monthly stacked copper. The
low value for May resulted from both relatively low ore
grade and low stacking rates that resulted from the
high-rainfall period following Cyclone Yasi.
The low value for December arose because the
Company stacked lower-grade transition ore alone. This
lower grade did not, however, prevent Lady Annie from
achieving production targets and the production trial
was successful on both cost and production terms.
Metal stacked has been maintained above 2,500 tonnes
per month since January. Going forward, stacked metal
tonnes have been stabilized, with March at 2,548
tonnes, April at 2,740 tonnes and May at 2,727
tonnes.
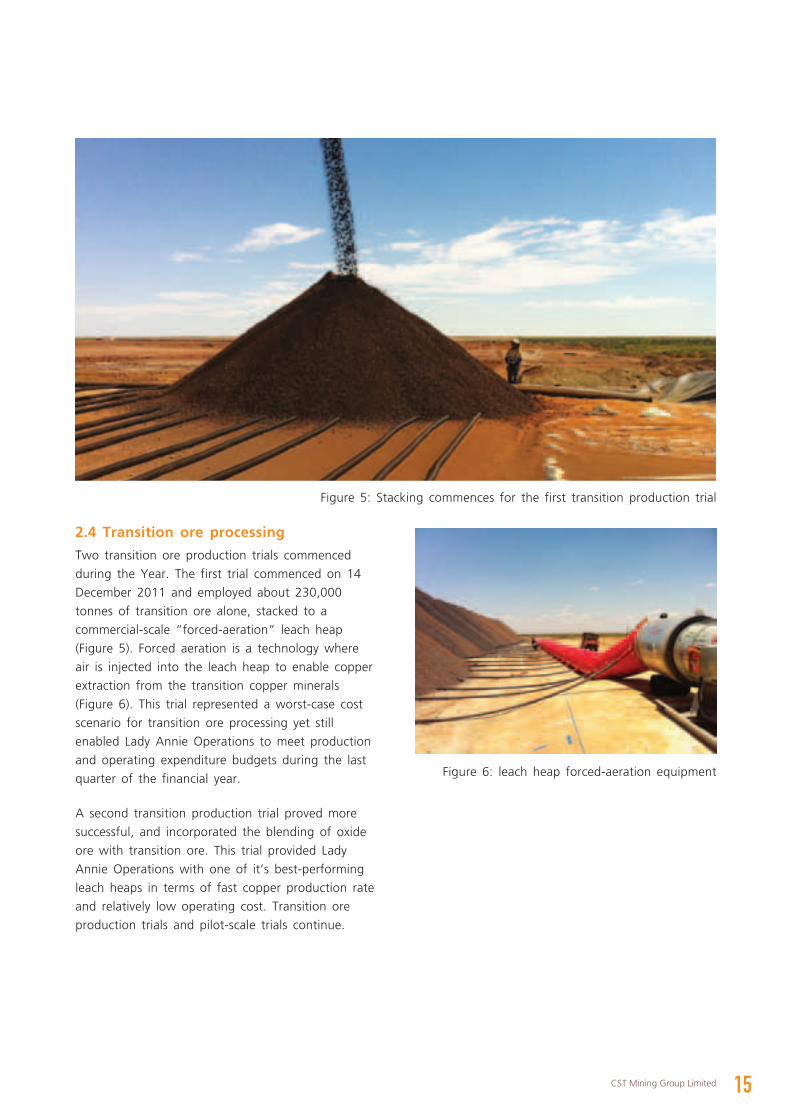
2.3 Copper cathode production
A total of 18,378 tonnes of cathode was stripped for
the Year. Figure 4 shows monthly stripped cathode
production.
The expansion production plant was activated on
2 March 2012, enabling a significant stepwise increase
in production. Going forward, cathode production
increased, with March at 1,866 tonnes, April at 1,989
tonnes and May at 2,176 tonnes.
LME-A cathode quality was achieved all year, with the
exception of 292 tonnes of cathode produced during
the Year. Majority of these exceptional product were
out of specification on lead content and sold
domestically at the LME spot price (ex-premium) in
November 2011, which represented a satisfactory outcome. The cause of lead contamination was identified
and the Compnay subsequently modified the production plant with new “anode spacers” to prevent a
recurrence of lead. Quality improved throughout the Year, with 99.6% of product exceeding LME-A grade
standards in March.
Robotic cathode stripping commenced from December, alongside conventional manual stripping. With new
operator training and appropriate robot maintenance procedures, the proportion of robotically-stripped
cathode has increased to a point where they now produce a majority of Lady Annie Operations’ cathode. The
manual stripping machine is now used primarily as support.
Majority of the cathode produced at Lady Annie Operations was committed to export sale from January. The
cathode quality was further improved from that point to meet increased export market quality standards,
particularly with respect to the shape and tidiness of the cathode bundles.
Figure 3: stacked copper metal
4,000Tonnes
3,000
2,000
1,000
0
APR - 2011
MAY
- 2011
JUN
- 2011
JUL - 2011
AU
G - 2011
SEP - 2011
OCT - 2011
NO
V - 2011
DEC - 2011
JAN
- 2012
FEB - 2012
MA
R - 2012
Figure 4: copper cathode production
2,000Tonnes
1,500
1,000
500
0
APR - 2011
MAY
- 2011
JUN
- 2011
JUL - 2011
AU
G - 2011
SEP - 2011
OCT - 2011
NO
V - 2011
DEC - 2011
JAN
- 2012
FEB - 2012
MA
R - 2012
15CST Mining Group Limited
Figure 5: Stacking commences for the first transition production trial
Figure 6: leach heap forced-aeration equipment
2.4 Transition ore processing
Two transition ore production trials commenced
during the Year. The first trial commenced on 14
December 2011 and employed about 230,000
tonnes of transition ore alone, stacked to a
commercial-scale “forced-aeration” leach heap
(Figure 5). Forced aeration is a technology where
air is injected into the leach heap to enable copper
extraction from the transition copper minerals
(Figure 6). This trial represented a worst-case cost
scenario for transition ore processing yet still
enabled Lady Annie Operations to meet production
and operating expenditure budgets during the last
quarter of the financial year.
A second transition production trial proved more
successful, and incorporated the blending of oxide
ore with transition ore. This trial provided Lady
Annie Operations with one of it’s best-performing
leach heaps in terms of fast copper production rate
and relatively low operating cost. Transition ore
production trials and pilot-scale trials continue.
16 Annual Report 2012
Project Overview
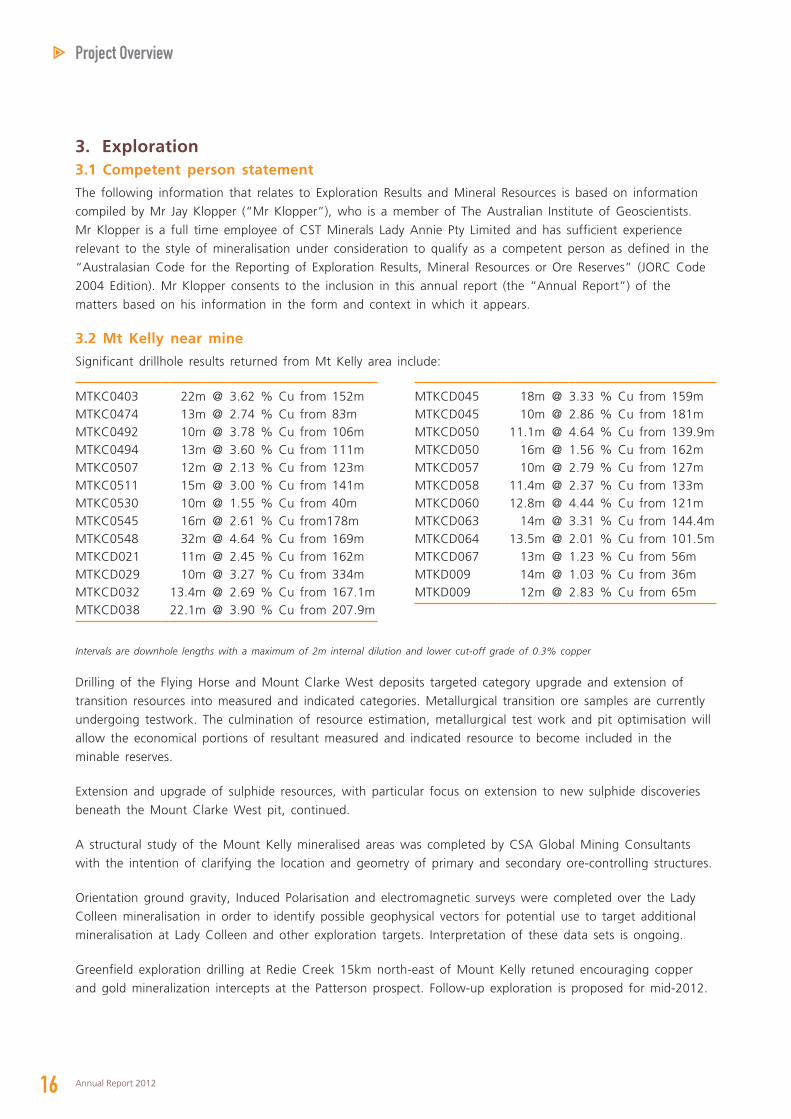
3. Exploration3.1 Competent person statement
The following information that relates to Exploration Results and Mineral Resources is based on information
compiled by Mr Jay Klopper (“Mr Klopper”), who is a member of The Australian Institute of Geoscientists.
Mr Klopper is a full time employee of CST Minerals Lady Annie Pty Limited and has sufficient experience
relevant to the style of mineralisation under consideration to qualify as a competent person as defined in the
“Australasian Code for the Reporting of Exploration Results, Mineral Resources or Ore Reserves” (JORC Code
2004 Edition). Mr Klopper consents to the inclusion in this annual report (the “Annual Report”) of the
matters based on his information in the form and context in which it appears.
3.2 Mt Kelly near mine
Significant drillhole results returned from Mt Kelly area include:
MTKC0403 22m @ 3.62 % Cu from 152mMTKC0474 13m @ 2.74 % Cu from 83mMTKC0492 10m @ 3.78 % Cu from 106mMTKC0494 13m @ 3.60 % Cu from 111mMTKC0507 12m @ 2.13 % Cu from 123mMTKC0511 15m @ 3.00 % Cu from 141mMTKC0530 10m @ 1.55 % Cu from 40mMTKC0545 16m @ 2.61 % Cu from178mMTKC0548 32m @ 4.64 % Cu from 169mMTKCD021 11m @ 2.45 % Cu from 162mMTKCD029 10m @ 3.27 % Cu from 334mMTKCD032 13.4m @ 2.69 % Cu from 167.1mMTKCD038 22.1m @ 3.90 % Cu from 207.9m
MTKCD045 18m @ 3.33 % Cu from 159mMTKCD045 10m @ 2.86 % Cu from 181mMTKCD050 11.1m @ 4.64 % Cu from 139.9mMTKCD050 16m @ 1.56 % Cu from 162mMTKCD057 10m @ 2.79 % Cu from 127mMTKCD058 11.4m @ 2.37 % Cu from 133mMTKCD060 12.8m @ 4.44 % Cu from 121mMTKCD063 14m @ 3.31 % Cu from 144.4mMTKCD064 13.5m @ 2.01 % Cu from 101.5mMTKCD067 13m @ 1.23 % Cu from 56mMTKD009 14m @ 1.03 % Cu from 36mMTKD009 12m @ 2.83 % Cu from 65m
Intervals are downhole lengths with a maximum of 2m internal dilution and lower cut-off grade of 0.3% copper
Drilling of the Flying Horse and Mount Clarke West deposits targeted category upgrade and extension of
transition resources into measured and indicated categories. Metallurgical transition ore samples are currently
undergoing testwork. The culmination of resource estimation, metallurgical test work and pit optimisation will
allow the economical portions of resultant measured and indicated resource to become included in the
minable reserves.
Extension and upgrade of sulphide resources, with particular focus on extension to new sulphide discoveries
beneath the Mount Clarke West pit, continued.
A structural study of the Mount Kelly mineralised areas was completed by CSA Global Mining Consultants
with the intention of clarifying the location and geometry of primary and secondary ore-controlling structures.
Orientation ground gravity, Induced Polarisation and electromagnetic surveys were completed over the Lady
Colleen mineralisation in order to identify possible geophysical vectors for potential use to target additional
mineralisation at Lady Colleen and other exploration targets. Interpretation of these data sets is ongoing.
Greenfield exploration drilling at Redie Creek 15km north-east of Mount Kelly retuned encouraging copper
and gold mineralization intercepts at the Patterson prospect. Follow-up exploration is proposed for mid-2012.
17CST Mining Group Limited
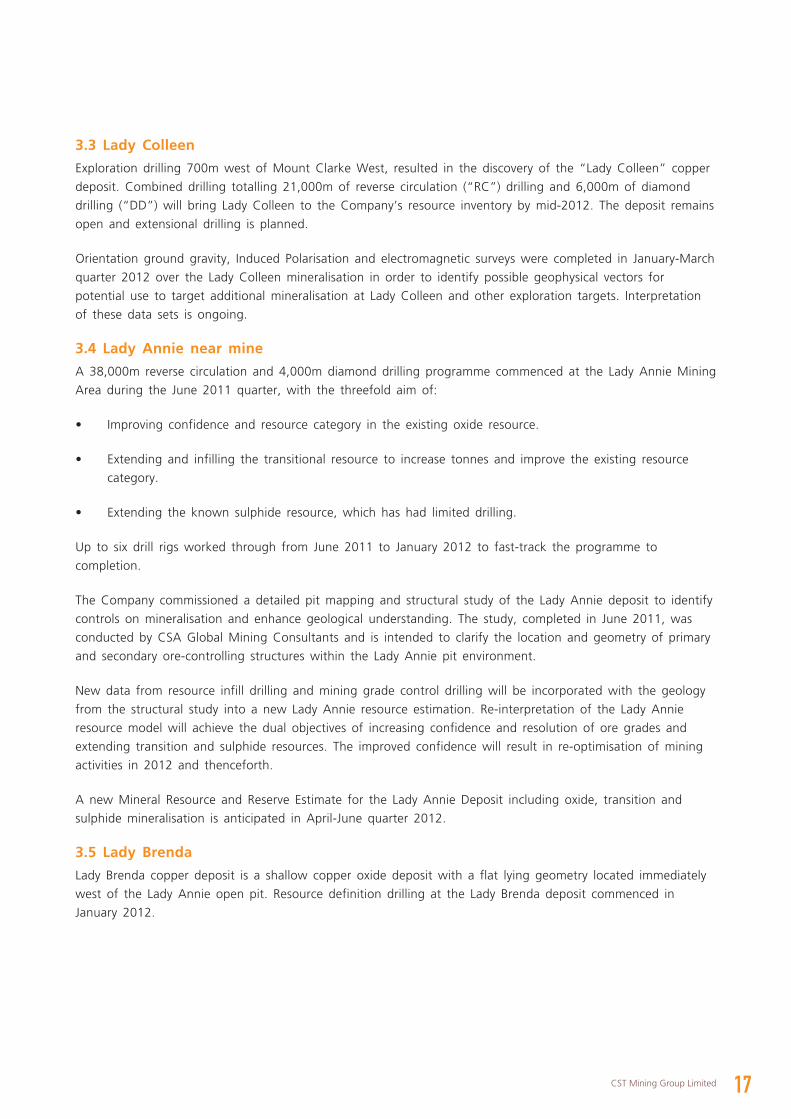
3.3 Lady Colleen
Exploration drilling 700m west of Mount Clarke West, resulted in the discovery of the “Lady Colleen” copper
deposit. Combined drilling totalling 21,000m of reverse circulation (“RC”) drilling and 6,000m of diamond
drilling (“DD”) will bring Lady Colleen to the Company’s resource inventory by mid-2012. The deposit remains
open and extensional drilling is planned.
Orientation ground gravity, Induced Polarisation and electromagnetic surveys were completed in January-March
quarter 2012 over the Lady Colleen mineralisation in order to identify possible geophysical vectors for
potential use to target additional mineralisation at Lady Colleen and other exploration targets. Interpretation
of these data sets is ongoing.
3.4 Lady Annie near mine
A 38,000m reverse circulation and 4,000m diamond drilling programme commenced at the Lady Annie Mining
Area during the June 2011 quarter, with the threefold aim of:
• Improving confidence and resource category in the existing oxide resource.
• Extending and infilling the transitional resource to increase tonnes and improve the existing resource
category.
• Extending the known sulphide resource, which has had limited drilling.
Up to six drill rigs worked through from June 2011 to January 2012 to fast-track the programme to
completion.
The Company commissioned a detailed pit mapping and structural study of the Lady Annie deposit to identify
controls on mineralisation and enhance geological understanding. The study, completed in June 2011, was
conducted by CSA Global Mining Consultants and is intended to clarify the location and geometry of primary
and secondary ore-controlling structures within the Lady Annie pit environment.
New data from resource infill drilling and mining grade control drilling will be incorporated with the geology
from the structural study into a new Lady Annie resource estimation. Re-interpretation of the Lady Annie
resource model will achieve the dual objectives of increasing confidence and resolution of ore grades and
extending transition and sulphide resources. The improved confidence will result in re-optimisation of mining
activities in 2012 and thenceforth.
A new Mineral Resource and Reserve Estimate for the Lady Annie Deposit including oxide, transition and
sulphide mineralisation is anticipated in April-June quarter 2012.
3.5 Lady Brenda
Lady Brenda copper deposit is a shallow copper oxide deposit with a flat lying geometry located immediately
west of the Lady Annie open pit. Resource definition drilling at the Lady Brenda deposit commenced in
January 2012.

18 Annual Report 2012
Project Overview
The aims of the drilling were:
• To infill and upgrade Mineral Resource Category in the existing Lady Brenda oxide mineral resource.
• To extend and infill the transitional resource so as to increase total resource tonnes and improve the
Mineral Resource Category.
• Provide material for metallurgical testing of Lady Brenda ores.
Exploration drilling, targeting surface copper anomalism in soils, was conducted at the Lady Treska prospect
approximately 1km southwest of the Lady Annie Pit.
3.6 Anthill
Significant drillhole results returned from the Anthill Project include:
BURC0184 11m @ 1.85 % Cu from 34mBURC0184 12m @ 2.29 % Cu from 63mBURC0185 11m @ 2.15 % Cu from 57mBURC0199 10m @ 14.29 % Cu from 80mBURC0205 11m @ 1.32 % Cu from 48m
BURCD009 14.1m @ 3.05 % Cu from 95.2mBURCD009 11.6m @ 6.28 % Cu from 114.4mBURCD016 21m @ 4.40 % Cu from 102.5mBURD015 11.2m @ 2.27 % Cu from 98mBURD028 19m @ 3.49 % Cu from 88m
Intervals are downhole lengths with a maximum of 2m internal dilution and lower cut-off grade of 0.3% copper
Resource upgrade and extension drilling was conducted at the Anthill prospect throughout 2011. The current
Mineral Resource Estimate at 31 March 2012 for Anthill is 6.5Mt @ 0.86% copper for 55,900 tonnes
contained copper metal.
Drilling has increased the geological understanding of the deposit, and encouraging results from the north-
east of the deposit have extended mineralisation along a new strike direction, with an improvement in grade
and thickness of near surface oxide mineralisation.
An upgraded Mineral Resource Estimate and a Mineral Reserve Estimate is expected to be completed for the
Anthill deposit during April-June 2012.
3.7 Anthill West
The Anthill West Prospect is a significant discovery for the Company. Broad-spaced exploration drilling
identified strong oxide and transition copper mineralisation over a strike length of over 750m to the west of
the Anthill deposit in mid-2011. A multi-purpose drilling rig (RC/DD) was mobilised to Anthill West in early
January 2012 to continue strike extension and infill drilling. To date the Company has completed over 8,000m
RC drilling and 5,000m DD at Anthill West. An initial Mineral Resource Estimate for Anthill West is anticipated
to be completed during July-September quarter 2012. Drilling is ongoing with scope to add additional
resource tonnes and increase confidence and understanding of the mineralised system. Metallurgical drilling is
planned to be commenced in July-September quarter 2012.
3.8 Regional Exploration
Regional exploration comprising field reconnaissance prospecting, mapping and geochemical soil sampling
were carried out at Gun Creek, Eastern Creek, Redie Creek, Judenham Creek and Lady Annie North
throughout the year across the Company’s extensive exploration tenure.
Regional exploration drilling was carried out at Cameron River, Mount Birnie and Round Mount.
19CST Mining Group Limited
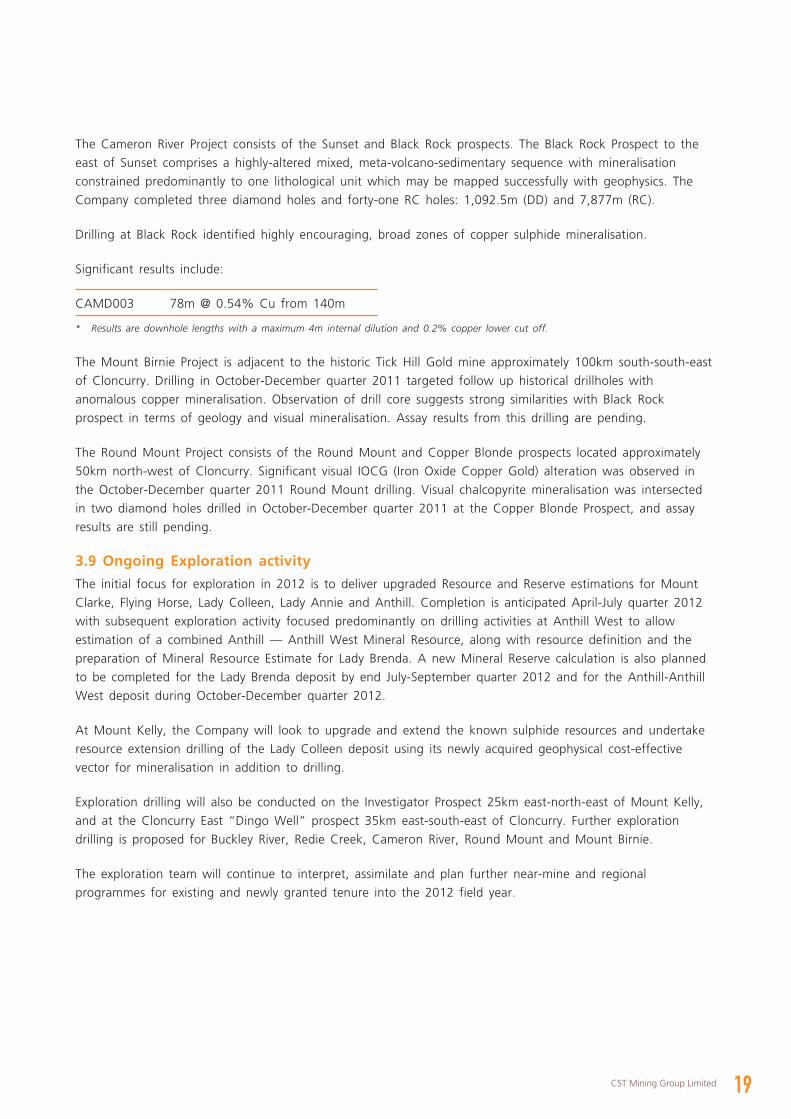
The Cameron River Project consists of the Sunset and Black Rock prospects. The Black Rock Prospect to the
east of Sunset comprises a highly-altered mixed, meta-volcano-sedimentary sequence with mineralisation
constrained predominantly to one lithological unit which may be mapped successfully with geophysics. The
Company completed three diamond holes and forty-one RC holes: 1,092.5m (DD) and 7,877m (RC).
Drilling at Black Rock identified highly encouraging, broad zones of copper sulphide mineralisation.
Significant results include:
CAMD003 78m @ 0.54% Cu from 140m
* Results are downhole lengths with a maximum 4m internal dilution and 0.2% copper lower cut off.
The Mount Birnie Project is adjacent to the historic Tick Hill Gold mine approximately 100km south-south-east
of Cloncurry. Drilling in October-December quarter 2011 targeted follow up historical drillholes with
anomalous copper mineralisation. Observation of drill core suggests strong similarities with Black Rock
prospect in terms of geology and visual mineralisation. Assay results from this drilling are pending.
The Round Mount Project consists of the Round Mount and Copper Blonde prospects located approximately
50km north-west of Cloncurry. Significant visual IOCG (Iron Oxide Copper Gold) alteration was observed in
the October-December quarter 2011 Round Mount drilling. Visual chalcopyrite mineralisation was intersected
in two diamond holes drilled in October-December quarter 2011 at the Copper Blonde Prospect, and assay
results are still pending.
3.9 Ongoing Exploration activity
The initial focus for exploration in 2012 is to deliver upgraded Resource and Reserve estimations for Mount
Clarke, Flying Horse, Lady Colleen, Lady Annie and Anthill. Completion is anticipated April-July quarter 2012
with subsequent exploration activity focused predominantly on drilling activities at Anthill West to allow
estimation of a combined Anthill — Anthill West Mineral Resource, along with resource definition and the
preparation of Mineral Resource Estimate for Lady Brenda. A new Mineral Reserve calculation is also planned
to be completed for the Lady Brenda deposit by end July-September quarter 2012 and for the Anthill-Anthill
West deposit during October-December quarter 2012.
At Mount Kelly, the Company will look to upgrade and extend the known sulphide resources and undertake
resource extension drilling of the Lady Colleen deposit using its newly acquired geophysical cost-effective
vector for mineralisation in addition to drilling.
Exploration drilling will also be conducted on the Investigator Prospect 25km east-north-east of Mount Kelly,
and at the Cloncurry East “Dingo Well” prospect 35km east-south-east of Cloncurry. Further exploration
drilling is proposed for Buckley River, Redie Creek, Cameron River, Round Mount and Mount Birnie.
The exploration team will continue to interpret, assimilate and plan further near-mine and regional
programmes for existing and newly granted tenure into the 2012 field year.
20 Annual Report 2012
Project Overview
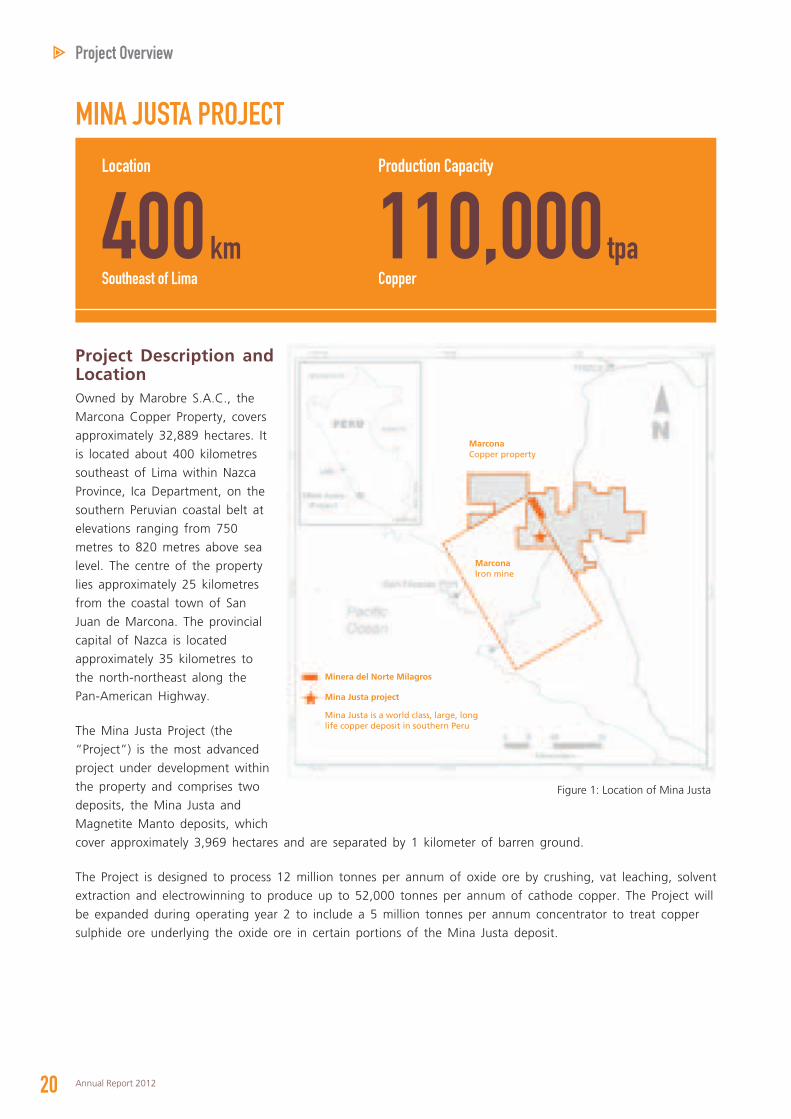
Project Description and LocationOwned by Marobre S.A.C., the
Marcona Copper Property, covers
approximately 32,889 hectares. It
is located about 400 kilometres
southeast of Lima within Nazca
Province, Ica Department, on the
southern Peruvian coastal belt at
elevations ranging from 750
metres to 820 metres above sea
level. The centre of the property
lies approximately 25 kilometres
from the coastal town of San
Juan de Marcona. The provincial
capital of Nazca is located
approximately 35 kilometres to
the north-northeast along the
Pan-American Highway.
The Mina Justa Project (the
“Project”) is the most advanced
project under development within
the property and comprises two
deposits, the Mina Justa and
Magnetite Manto deposits, which
cover approximately 3,969 hectares and are separated by 1 kilometer of barren ground.
The Project is designed to process 12 million tonnes per annum of oxide ore by crushing, vat leaching, solvent
extraction and electrowinning to produce up to 52,000 tonnes per annum of cathode copper. The Project will
be expanded during operating year 2 to include a 5 million tonnes per annum concentrator to treat copper
sulphide ore underlying the oxide ore in certain portions of the Mina Justa deposit.
MINA JUSTA PROJECT
Figure 1: Location of Mina Justa
MarconaCopper property
Minera del Norte Milagros
Mina Justa project
Mina Justa is a world class, large, long life copper deposit in southern Peru
MarconaIron mine
Location
Southeast of Lima
400 km
Production Capacity
Copper
110,000 tpa
21CST Mining Group Limited
SALE OF INTEREST IN MARCOBRE S.A.C.AGREED A SALE PRICE OF US$505 MILLION
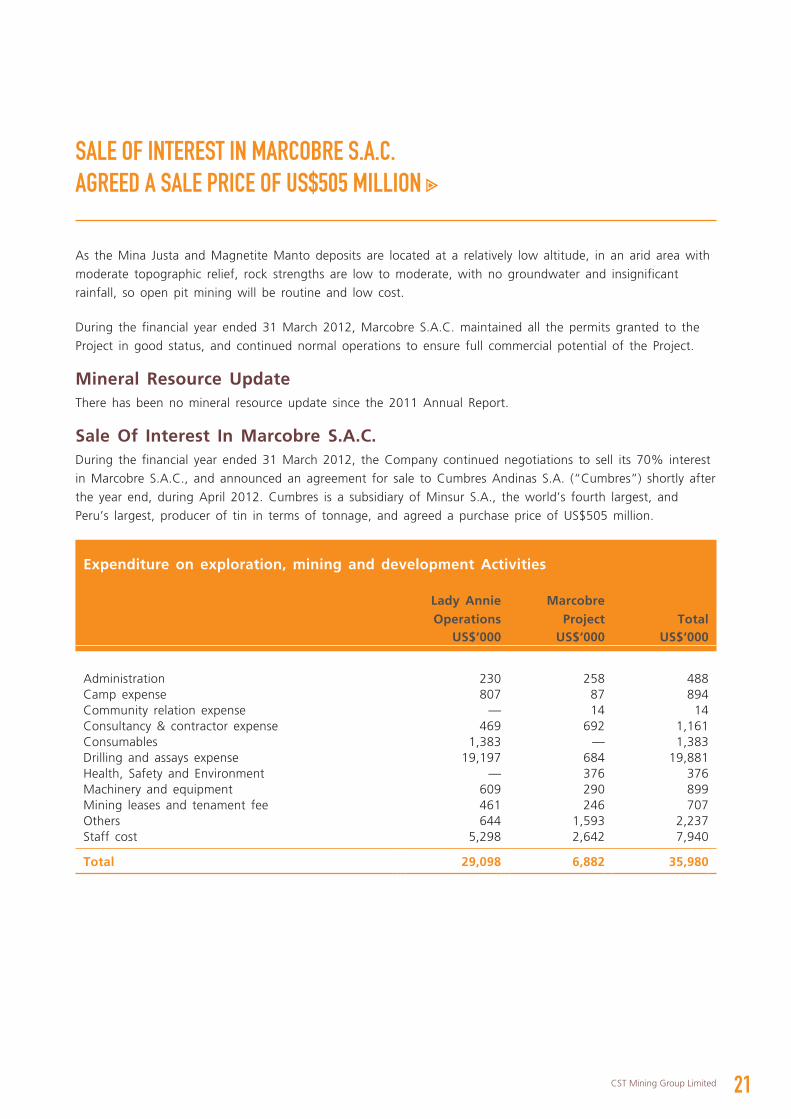
As the Mina Justa and Magnetite Manto deposits are located at a relatively low altitude, in an arid area with
moderate topographic relief, rock strengths are low to moderate, with no groundwater and insignificant
rainfall, so open pit mining will be routine and low cost.
During the financial year ended 31 March 2012, Marcobre S.A.C. maintained all the permits granted to the
Project in good status, and continued normal operations to ensure full commercial potential of the Project.
Mineral Resource UpdateThere has been no mineral resource update since the 2011 Annual Report.
Sale Of Interest In Marcobre S.A.C.During the financial year ended 31 March 2012, the Company continued negotiations to sell its 70% interest
in Marcobre S.A.C., and announced an agreement for sale to Cumbres Andinas S.A. (“Cumbres”) shortly after
the year end, during April 2012. Cumbres is a subsidiary of Minsur S.A., the world’s fourth largest, and
Peru’s largest, producer of tin in terms of tonnage, and agreed a purchase price of US$505 million.
Expenditure on exploration, mining and development Activities
Lady Annie Operations
Marcobre Project Total
US$‘000 US$‘000 US$‘000
Administration 230 258 488Camp expense 807 87 894Community relation expense — 14 14Consultancy & contractor expense 469 692 1,161Consumables 1,383 — 1,383Drilling and assays expense 19,197 684 19,881Health, Safety and Environment — 376 376Machinery and equipment 609 290 899Mining leases and tenament fee 461 246 707Others 644 1,593 2,237Staff cost 5,298 2,642 7,940
Total 29,098 6,882 35,980
SustainabilityReport
CORPORATE
Corporate Sustainability Report
23CST Mining Group Limited
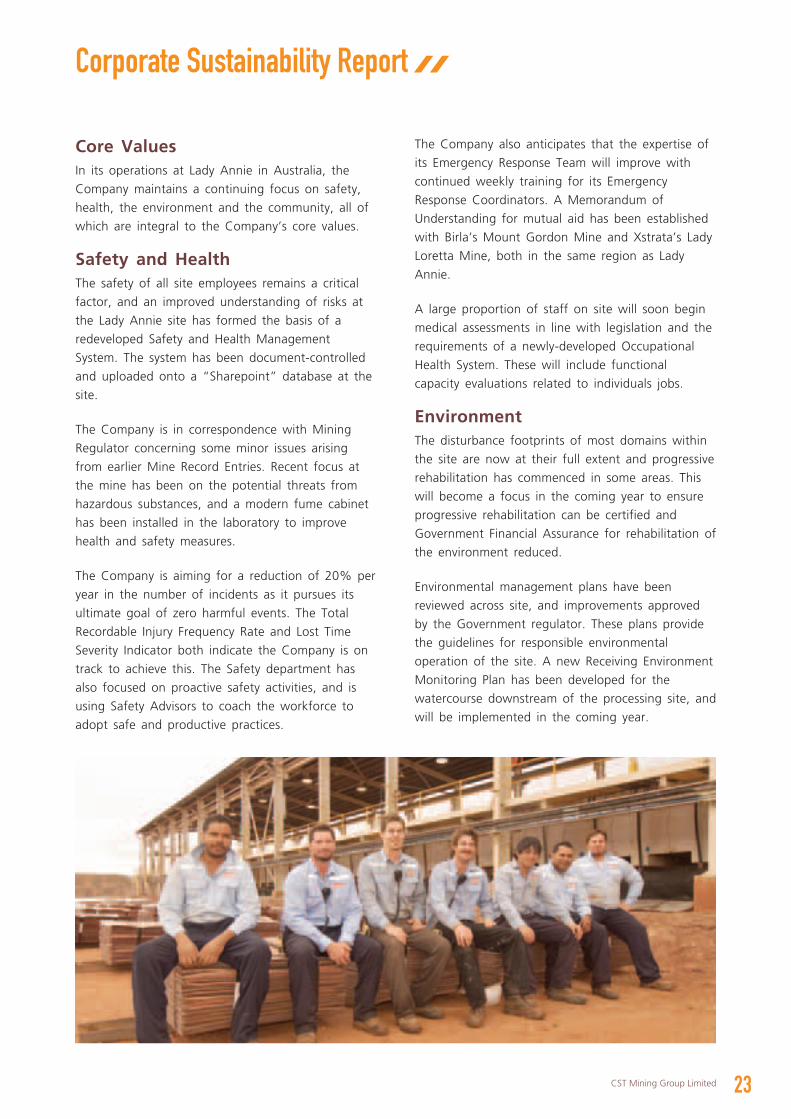
Core ValuesIn its operations at Lady Annie in Australia, the
Company maintains a continuing focus on safety,
health, the environment and the community, all of
which are integral to the Company’s core values.
Safety and HealthThe safety of all site employees remains a critical
factor, and an improved understanding of risks at
the Lady Annie site has formed the basis of a
redeveloped Safety and Health Management
System. The system has been document-controlled
and uploaded onto a “Sharepoint” database at the
site.
The Company is in correspondence with Mining
Regulator concerning some minor issues arising
from earlier Mine Record Entries. Recent focus at
the mine has been on the potential threats from
hazardous substances, and a modern fume cabinet
has been installed in the laboratory to improve
health and safety measures.
The Company is aiming for a reduction of 20% per
year in the number of incidents as it pursues its
ultimate goal of zero harmful events. The Total
Recordable Injury Frequency Rate and Lost Time
Severity Indicator both indicate the Company is on
track to achieve this. The Safety department has
also focused on proactive safety activities, and is
using Safety Advisors to coach the workforce to
adopt safe and productive practices.
The Company also anticipates that the expertise of
its Emergency Response Team will improve with
continued weekly training for its Emergency
Response Coordinators. A Memorandum of
Understanding for mutual aid has been established
with Birla’s Mount Gordon Mine and Xstrata’s Lady
Loretta Mine, both in the same region as Lady
Annie.
A large proportion of staff on site will soon begin
medical assessments in line with legislation and the
requirements of a newly-developed Occupational
Health System. These will include functional
capacity evaluations related to individuals jobs.
EnvironmentThe disturbance footprints of most domains within
the site are now at their full extent and progressive
rehabilitation has commenced in some areas. This
will become a focus in the coming year to ensure
progressive rehabilitation can be certified and
Government Financial Assurance for rehabilitation of
the environment reduced.
Environmental management plans have been
reviewed across site, and improvements approved
by the Government regulator. These plans provide
the guidelines for responsible environmental
operation of the site. A new Receiving Environment
Monitoring Plan has been developed for the
watercourse downstream of the processing site, and
will be implemented in the coming year.
24 Annual Report 2012
Corporate Sustainability Report
Unprecedented preparation resulted in a trouble-
free 2011/2012 wet season despite above average
rainfall, and work is already well underway on
further improvements for the 2012/2013 wet
season. This includes a comprehensive drilling
campaign to establish more than 10 new
monitoring bores to supplement the existing bore
network for monitoring groundwater.
The Lady Annie site continues to progress towards
an ISO 14000 compliant Environmental
Management System which will provide a
framework for further continual improvement of
environmental performance. Data warehousing and
analysis software is in the final stages of selection,
and once implemented the Company anticipates
response times to exceedances will improve
dramatically, leading to better environmental
outcomes.
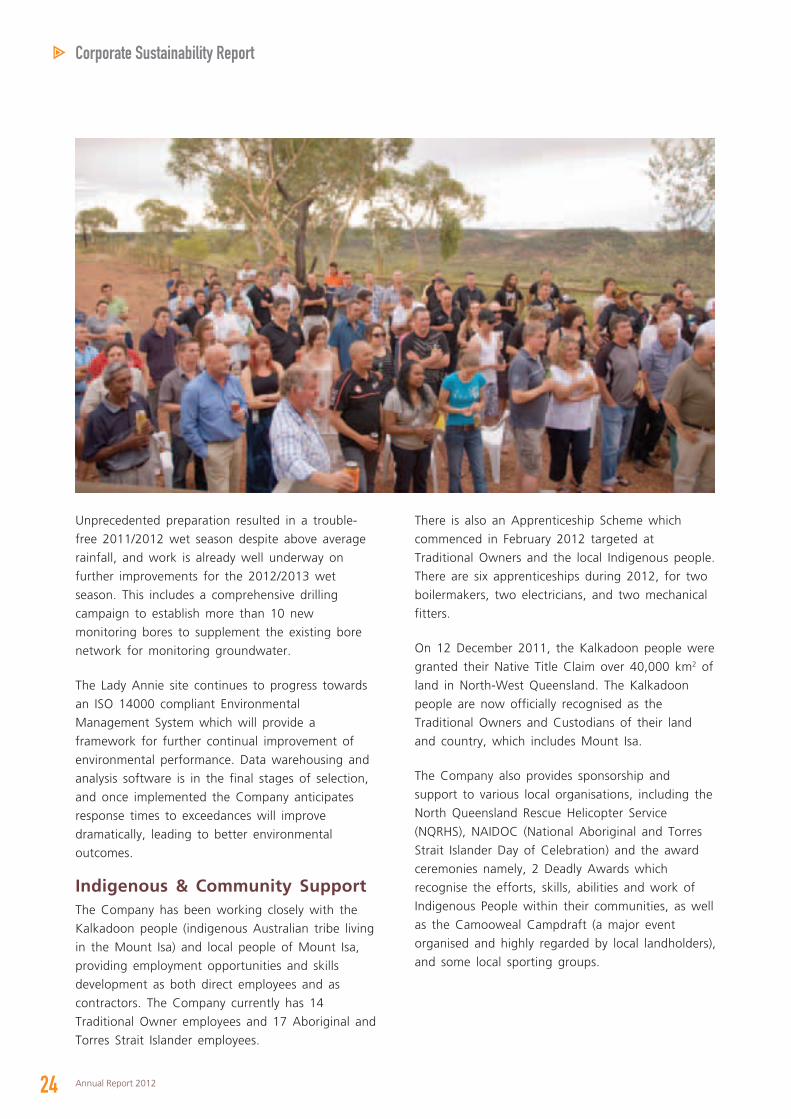
Indigenous & Community SupportThe Company has been working closely with the
Kalkadoon people (indigenous Australian tribe living
in the Mount Isa) and local people of Mount Isa,
providing employment opportunities and skills
development as both direct employees and as
contractors. The Company currently has 14
Traditional Owner employees and 17 Aboriginal and
Torres Strait Islander employees.
There is also an Apprenticeship Scheme which
commenced in February 2012 targeted at
Traditional Owners and the local Indigenous people.
There are six apprenticeships during 2012, for two
boilermakers, two electricians, and two mechanical
fitters.
On 12 December 2011, the Kalkadoon people were
granted their Native Title Claim over 40,000 km2 of
land in North-West Queensland. The Kalkadoon
people are now officially recognised as the
Traditional Owners and Custodians of their land
and country, which includes Mount Isa.
The Company also provides sponsorship and
support to various local organisations, including the
North Queensland Rescue Helicopter Service
(NQRHS), NAIDOC (National Aboriginal and Torres
Strait Islander Day of Celebration) and the award
ceremonies namely, 2 Deadly Awards which
recognise the efforts, skills, abilities and work of
Indigenous People within their communities, as well
as the Camooweal Campdraft (a major event
organised and highly regarded by local landholders),
and some local sporting groups.
ReportMANAGEMENT
Biographical Details of Directors
26 Annual Report 2012
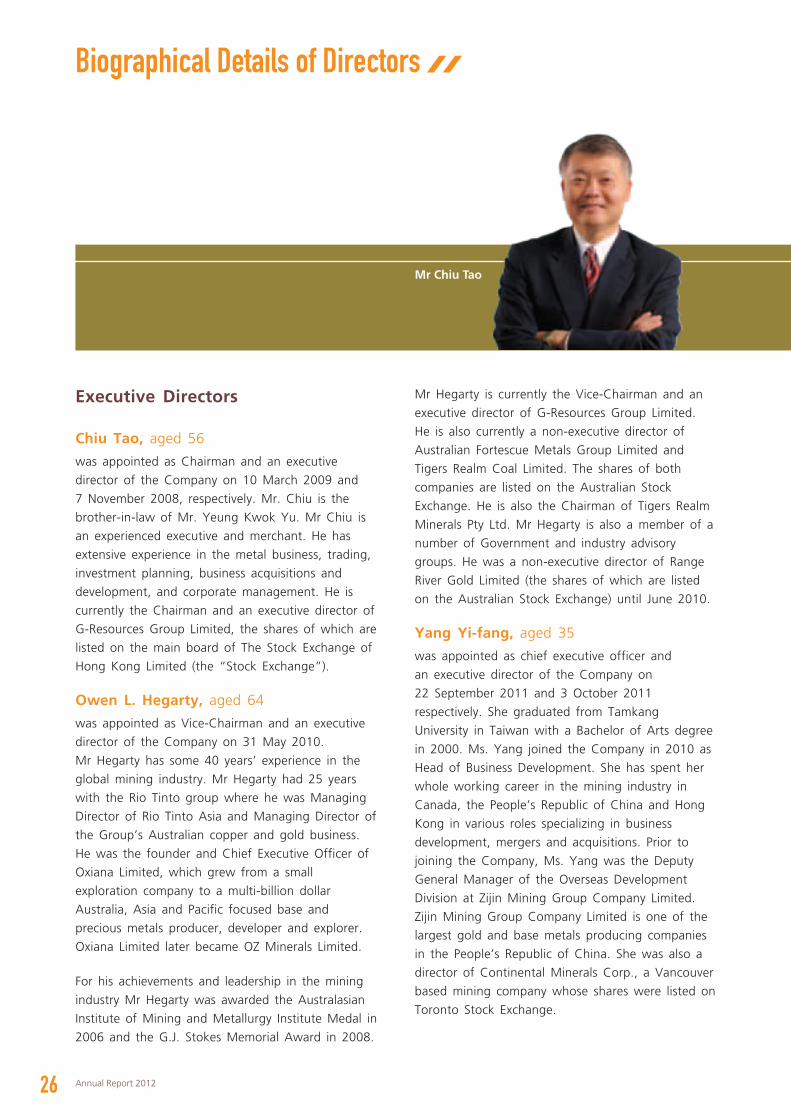
Mr Chiu Tao
Executive Directors
Chiu Tao, aged 56
was appointed as Chairman and an executive
director of the Company on 10 March 2009 and
7 November 2008, respectively. Mr. Chiu is the
brother-in-law of Mr. Yeung Kwok Yu. Mr Chiu is
an experienced executive and merchant. He has
extensive experience in the metal business, trading,
investment planning, business acquisitions and
development, and corporate management. He is
currently the Chairman and an executive director of
G-Resources Group Limited, the shares of which are
listed on the main board of The Stock Exchange of
Hong Kong Limited (the “Stock Exchange”).
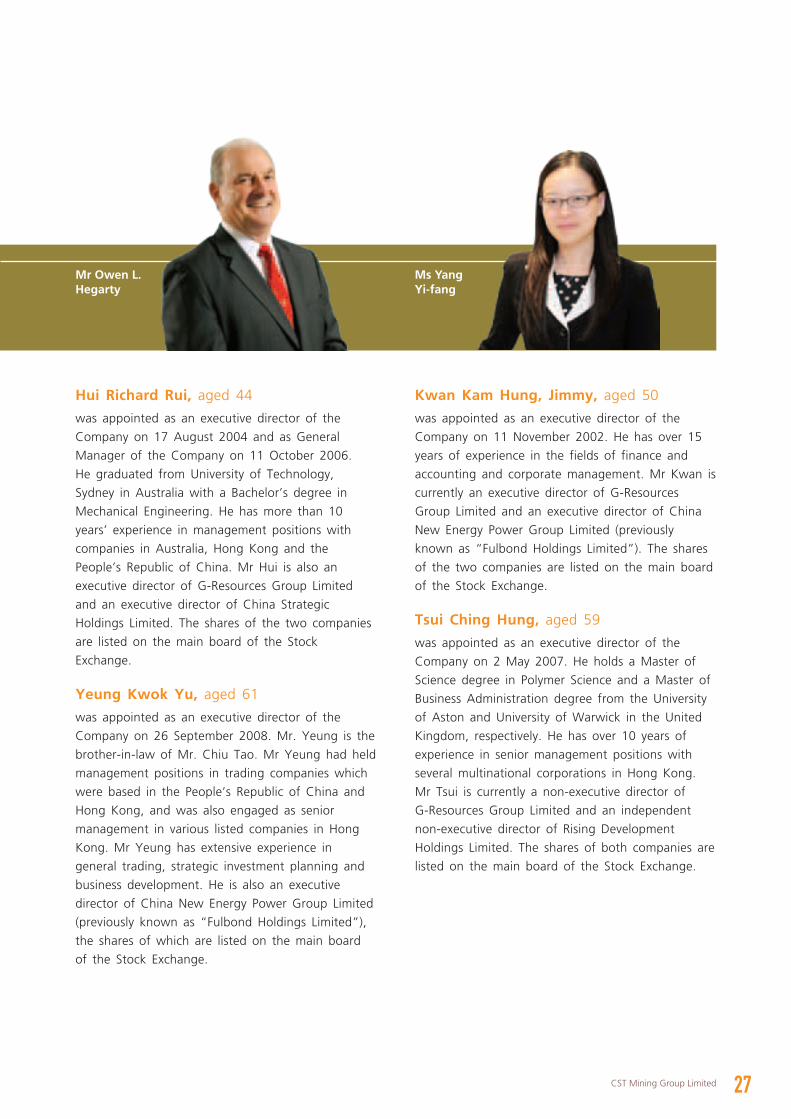
Owen L. Hegarty, aged 64
was appointed as Vice-Chairman and an executive
director of the Company on 31 May 2010.
Mr Hegarty has some 40 years’ experience in the
global mining industry. Mr Hegarty had 25 years
with the Rio Tinto group where he was Managing
Director of Rio Tinto Asia and Managing Director of
the Group’s Australian copper and gold business.
He was the founder and Chief Executive Officer of
Oxiana Limited, which grew from a small
exploration company to a multi-billion dollar
Australia, Asia and Pacific focused base and
precious metals producer, developer and explorer.
Oxiana Limited later became OZ Minerals Limited.
For his achievements and leadership in the mining
industry Mr Hegarty was awarded the Australasian
Institute of Mining and Metallurgy Institute Medal in
2006 and the G.J. Stokes Memorial Award in 2008.
Mr Hegarty is currently the Vice-Chairman and an
executive director of G-Resources Group Limited.
He is also currently a non-executive director of
Australian Fortescue Metals Group Limited and
Tigers Realm Coal Limited. The shares of both
companies are listed on the Australian Stock
Exchange. He is also the Chairman of Tigers Realm
Minerals Pty Ltd. Mr Hegarty is also a member of a
number of Government and industry advisory
groups. He was a non-executive director of Range
River Gold Limited (the shares of which are listed
on the Australian Stock Exchange) until June 2010.
Yang Yi-fang, aged 35
was appointed as chief executive officer and
an executive director of the Company on
22 September 2011 and 3 October 2011
respectively. She graduated from Tamkang
University in Taiwan with a Bachelor of Arts degree
in 2000. Ms. Yang joined the Company in 2010 as
Head of Business Development. She has spent her
whole working career in the mining industry in
Canada, the People’s Republic of China and Hong
Kong in various roles specializing in business
development, mergers and acquisitions. Prior to
joining the Company, Ms. Yang was the Deputy
General Manager of the Overseas Development
Division at Zijin Mining Group Company Limited.
Zijin Mining Group Company Limited is one of the
largest gold and base metals producing companies
in the People’s Republic of China. She was also a
director of Continental Minerals Corp., a Vancouver
based mining company whose shares were listed on
Toronto Stock Exchange.
27CST Mining Group Limited
Ms Yang Yi-fang
Mr Owen L. Hegarty
Hui Richard Rui, aged 44
was appointed as an executive director of the
Company on 17 August 2004 and as General
Manager of the Company on 11 October 2006.
He graduated from University of Technology,
Sydney in Australia with a Bachelor’s degree in
Mechanical Engineering. He has more than 10
years’ experience in management positions with
companies in Australia, Hong Kong and the
People’s Republic of China. Mr Hui is also an
executive director of G-Resources Group Limited
and an executive director of China Strategic
Holdings Limited. The shares of the two companies
are listed on the main board of the Stock
Exchange.
Yeung Kwok Yu, aged 61
was appointed as an executive director of the
Company on 26 September 2008. Mr. Yeung is the
brother-in-law of Mr. Chiu Tao. Mr Yeung had held
management positions in trading companies which
were based in the People’s Republic of China and
Hong Kong, and was also engaged as senior
management in various listed companies in Hong
Kong. Mr Yeung has extensive experience in
general trading, strategic investment planning and
business development. He is also an executive
director of China New Energy Power Group Limited
(previously known as “Fulbond Holdings Limited”),
the shares of which are listed on the main board
of the Stock Exchange.
Kwan Kam Hung, Jimmy, aged 50
was appointed as an executive director of the
Company on 11 November 2002. He has over 15
years of experience in the fields of finance and
accounting and corporate management. Mr Kwan is
currently an executive director of G-Resources
Group Limited and an executive director of China
New Energy Power Group Limited (previously
known as “Fulbond Holdings Limited”). The shares
of the two companies are listed on the main board
of the Stock Exchange.
Tsui Ching Hung, aged 59
was appointed as an executive director of the
Company on 2 May 2007. He holds a Master of
Science degree in Polymer Science and a Master of
Business Administration degree from the University
of Aston and University of Warwick in the United
Kingdom, respectively. He has over 10 years of
experience in senior management positions with
several multinational corporations in Hong Kong.
Mr Tsui is currently a non-executive director of
G-Resources Group Limited and an independent
non-executive director of Rising Development
Holdings Limited. The shares of both companies are
listed on the main board of the Stock Exchange.
28 Annual Report 2012
Biographical Details of Directors
Chung Nai Ting, aged 56
was appointed as an executive director of the
Company on 2 May 2007. He has over 20 years of
experience in the trading business.
Lee Ming Tung, aged 50
was appointed as an executive director of the
Company on 28 September 2007. He is also the
Chief Financial Officer of the Company. He holds a
Bachelor of Science degree in accounting from
Brigham Young University in U.S.A., a Master of
Accountancy degree from Virginia Polytechnic
Institute and State University of U.S.A., a Master of
Financial Engineering degree from City University of
Hong Kong and a Postgraduate Diploma in
Corporate Administration from Hong Kong
Polytechnic University. Mr Lee is an associate
member of The Hong Kong Institute of Chartered
Secretaries and The Institute of Chartered
Secretaries and Administrators. He has over 20
years’ experience in the field of accounting and
finance.
Wah Wang Kei, Jackie, aged 45
was appointed as an executive director of the
Company on 25 June 2010. Mr Wah graduated
from The University of Hong Kong in 1990 and
was qualified as a solicitor in 1992. Up until 1997,
Mr Wah was a partner of a Hong Kong law firm.
Mr Wah is currently an executive director of
G-Resources Group Limited and China New Energy
Power Group Limited (previously known as
“Fulbond Holdings Limited”). The shares of the two
companies are listed on the main board of the
Stock Exchange.
Independent Non-Executive Directors
Yu Pan, aged 57
was appointed as independent non-executive
director on 28 September 2004. He has over 20
years of experience in management positions of
multinational trading companies in Hong Kong and
the People’s Republic of China. Mr Yu is currently
an independent non-executive director of China
New Energy Power Group Limited (previously
known as “Fulbond Holdings Limited”), whose
shares are listed on the main board of the Stock
Exchange.
Tong So Yuet, aged 40
was appointed as independent non-executive
director on 24 February 2005. She graduated from
Hong Kong Polytechnic University with a bachelor
degree in accountancy. She is a fellow member of
the Association of Chartered Certified Accountants,
an associate member of the Hong Kong Institute of
Certified Public Accountants, The Hong Kong
Institute of Company Secretaries, The Institute of
Chartered Secretaries and Administrator and a
Certified Public Accountant (Practising). She has
over 15 years of experience in auditing and
accounting sector.
Chan Shek Wah, aged 48
was appointed as independent non-executive
director on 1 June 2007. He has almost 25 years of
professional experiences in the financial services
industry. He was engaged in the sales, proprietary
trading, structuring of equity derivatives and equity
capital market products as well as the provision of
corporate finance advisory services to listed issuers.
He was the senior management and the executive
directors in several international financial
institutions. Mr Chan is currently an executive
director of Emperor Capital Group Limited and was
an independent non-executive director of Future
Bright Holdings Limited until 7 May 2012. The
shares of both companies are listed on the main
board of the Stock Exchange.
Management Discussion and Analysis
29CST Mining Group Limited
Business ReviewCopper production from the Company’s Lady Annie mine in Queensland, Australia has been ramping up
steadily since mining operations resumed in November 2010, and during the year ended 31 March 2012
(the “Year”) succeeded in its objective of stabilising output. Business of copper cathode production
contributed more than US$146 million to the revenue of the Company and its subsidiaries (collectively
referred to the “Group”) for the Year. Detailed financial information can be found in the consolidated
financial statements and notes in our 2012 Annual Report. During the Year, the Group invested more than
US$35 million in exploration, mining and development activities, and a detailed summary of those activities
will be included in the “Project Overview” section of our 2012 Annual Report.
Financial ResultsThe revenue of the Group for the Year rose to approximately US$149.74 million, representing an increase of
approximately US$100.09 million over the corresponding period for the previous year. The scale of the
increase reflects the fact that during the financial year ended 31 March 2011 Lady Annie Operations
contributed revenues for only four months following the resumption of mining activities there. Dividend
income and rental income represented approximately 1.59% and 0.37%, respectively, of the total revenue for
the Year.
Compared with the previous year, the revenue contribution from property investments increased approximately
3.72% reflecting stable occupancy rates. Rental income provided steady cash flow to the Group for the Year
and this is expected to continue into the future. Investments in financial instruments on the other hand,
decreased approximately 43.57% as the gloomy global economic environment affected the performance of
the Group’s investment portfolio and decreased dividend income accordingly. Other income rose by
approximately 48.45% mainly due to increased interest income for the Year. Other administrative expenses for
the Year were approximately US$34.52 million, representing a year-on-year increase of approximately 40.32%.
That increase was mainly due to costs arising following the resumption of operations at the Lady Annie
Operations. During the Year, the Company recognised non-cash share-based expenses of approximately
US$16.20 million in respect of share options granted to staffs and management of the Group.
Adverse financial market sentiment during the Year were driven by factors such as the economic difficulties
confronting European Union countries and the financial policies of the People’s Republic of China, and are
expected to continue creating volatile market conditions. This impacted the performance of the Group’s held
for trading investments during the Year. A loss of approximately US$57.60 million arising from fair value
changes of investments held for trading was recorded. Overall, the loss for the Year was approximately
US$70.07 million. The loss for the preceding year was approximately US$27.17 million.
Net Asset valueAs at 31 March 2012, the Group had bank balances and cash of approximately US$119.91 million (excluding
cash balance included in assets classified as held for sale). In addition, the Group also had bank deposits in
total of approximately US$65.37 million which were pledged to banks mainly for the mine rehabilitation cost
required by the government of Queensland, Australia to allow the Group to operate in Queensland, Australia
and as a guarantee to the electric power supplier for the Lady Annie mine site. The fair value of available-for-
sale investments and of financial assets at fair value through profit and loss were approximately US$15.68
million and US$189.76 million, respectively. As at 31 March 2012, the Group had no outstanding loans or
borrowings from banks or financial institutions. Hence, based on the balance of all outstanding loans and
borrowings from financial institutions and total equity, the gearing ratio as at 31 March 2012 was zero.
An one-year US$75 million revolving loan facility with an interest rate of 1% per annum over LIBOR/ HIBOR
granted by a bank to a subsidiary of the Company expired and was renewed for the same amount with an
30 Annual Report 2012
Management Discussion and Analysis
interest rate of 1.5% per annum over LIBOR/HIBOR. The Company has provided a guarantee to the bank for
the facility. As at 31 March 2012, the facility was not utilised. As at 31 March 2012, the net asset value of
the Group amounted to approximately US$889.40 million.
Human ResourcesAs at 31 March 2012, the Group employed 40 staff (including directors of the Company) in Hong Kong, 241
staff in Australia and 9 staff in Peru. Staff costs (excluding Directors’ emoluments) were around US$40.54
million for the Year. Staff remuneration packages are normally reviewed annually. The Group also participated
in the Mandatory Provident Fund Scheme in Hong Kong. In addition, the Group provided other staff benefits,
which include medical benefits.
The Group has a share option scheme. Details and the movement of the share options will be disclosed under
the heading “Directors’ Report” in this Annual Report.
Exposure to Fluctuations in Exchange RatesThe Group conducts most of its business in United States Dollars, Australian Dollars, Renminbi, Peruvian
Nuevo Soles and Hong Kong Dollars. Foreign currency exposure to United States Dollars is minimal as the
Hong Kong Dollar is pegged to the United States Dollar. The exposure to Renminbi is also minimal as
business conducted in Renminbi represents a very small portion of the Group’s total business in terms of
revenue. The Group is exposed to foreign currency risk denominated in Peruvian Nuevo Soles and Australian
Dollars.
During the Year, the Company entered into a forward currency contract to sell United States Dollars and
purchase Australian Dollars at a fixed rate in the normal course of business in order to limit its exposure to
adverse exchange rate fluctuations. This instrument is executed with a creditworthy international financial
institution. The management will continue to monitor the Group’s foreign currency exposure and will consider
further hedging of its exchange rate exposure should the need arise.
MarcobreMarcobre S.A.C. (“Marcobre”) is a Peruvian company, which is 70% owned by the Company. Marcobre in
turn owns 100% of the Mina Justa copper project in coastal southern Peru. The project has a resource base
of more than three million tonnes of contained copper and reserves of more than one million tonnes of
contained copper.
On 9 June 2011, the Company entered into a memorandum of understanding (the “MOU”) with Glencore
International AG (“Glencore”) in connection with the proposed disposal of the Company’s 100% interest in
CST Resources Limited (“CST Resources”), a wholly-owned subsidiary of the Company, which in turn indirectly
owns 70% of the Mina Justa Project. On 17 July 2011, the Company and Glencore entered into a share
purchase agreement (the “SPA”) pursuant to which Glencore conditionally agreed to acquire CST Resources
from the Company for a cash consideration of approximately US$475 million. On 29 November 2011, as one
of the condition precedents was not satisfied, the SPA was terminated. More details are provided in the
“Significant Events” section below.
On 23 April 2012, the Company entered into another share purchase agreement (the “new SPA“) with
Cumbres Andinas S.A. (“Cumbres”) to dispose 100% interest in CST Resources with total cash consideration
of US$505 million and cash payment made directly or indirectly by the Company to Marcobre between
31 March 2012 and the closing of the transaction (the “Transaction”). The Transaction was completed on
13 June 2012. More details of the Transaction are provided in “Significant Events” section below.
31CST Mining Group Limited
Lady AnnieThe Lady Annie Operations, which comprise principally the Lady Annie mining area, the Mount Kelly mining
area, and the Mount Kelly process plant and tenements, is located in the Mount Isa district of north-western
Queensland, Australia. The Mount Isa inlier hosts several known copper oxide and sulphide resources and
several notable copper and lead-zinc silver mines.
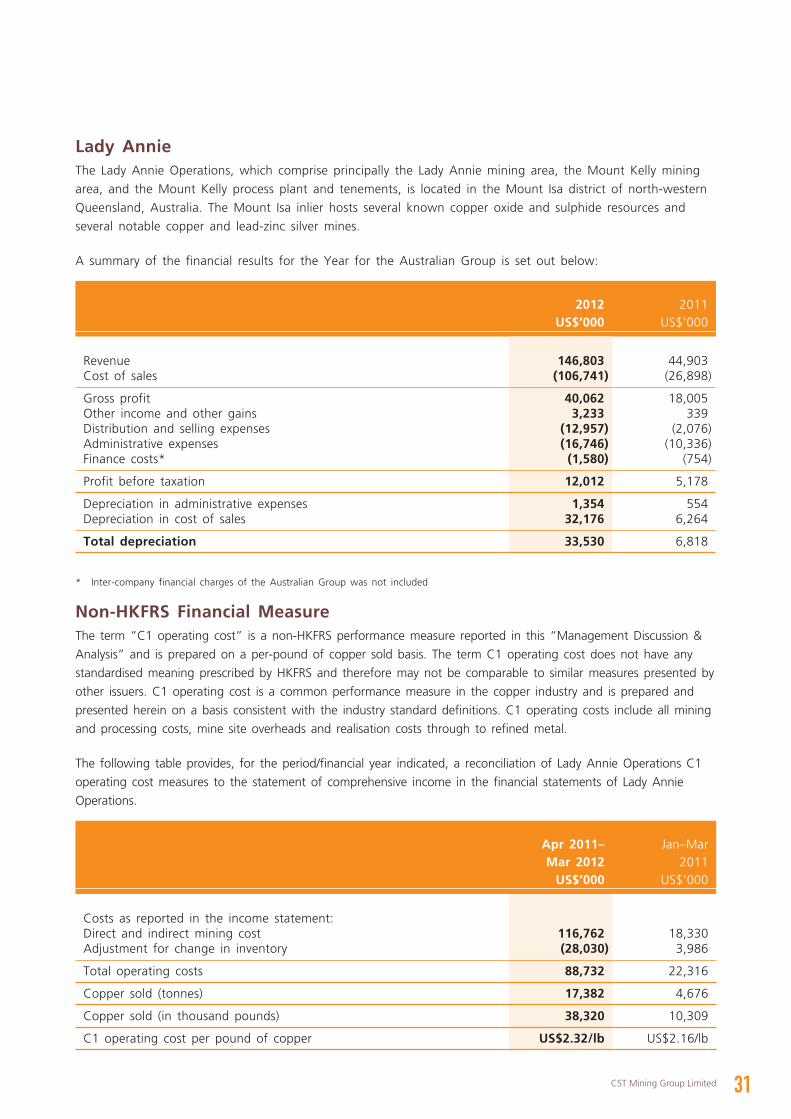
A summary of the financial results for the Year for the Australian Group is set out below:
2012 2011US$’000 US$’000
Revenue 146,803 44,903Cost of sales (106,741) (26,898)
Gross profit 40,062 18,005Other income and other gains 3,233 339Distribution and selling expenses (12,957) (2,076)Administrative expenses (16,746) (10,336)Finance costs* (1,580) (754)
Profit before taxation 12,012 5,178
Depreciation in administrative expenses 1,354 554Depreciation in cost of sales 32,176 6,264
Total depreciation 33,530 6,818
* Inter-company financial charges of the Australian Group was not included
Non-HKFRS Financial MeasureThe term “C1 operating cost” is a non-HKFRS performance measure reported in this “Management Discussion &
Analysis” and is prepared on a per-pound of copper sold basis. The term C1 operating cost does not have any
standardised meaning prescribed by HKFRS and therefore may not be comparable to similar measures presented by
other issuers. C1 operating cost is a common performance measure in the copper industry and is prepared and
presented herein on a basis consistent with the industry standard definitions. C1 operating costs include all mining
and processing costs, mine site overheads and realisation costs through to refined metal.
The following table provides, for the period/financial year indicated, a reconciliation of Lady Annie Operations C1
operating cost measures to the statement of comprehensive income in the financial statements of Lady Annie
Operations.
Apr 2011– Jan–MarMar 2012 2011
US$’000 US$’000
Costs as reported in the income statement:Direct and indirect mining cost 116,762 18,330Adjustment for change in inventory (28,030) 3,986
Total operating costs 88,732 22,316
Copper sold (tonnes) 17,382 4,676
Copper sold (in thousand pounds) 38,320 10,309
C1 operating cost per pound of copper US$2.32/lb US$2.16/lb
32 Annual Report 2012
Management Discussion and Analysis
The Company believes that, in addition to conventional measures prepared in accordance with HKFRS, certain
investors use the above term and information to evaluate the Company. It is intended to provide additional
information and should not be considered in isolation or as a substitute for measures of performance prepared in
accordance with HKFRS.
Significant EventsOn 9 June 2011, the Company entered into the MOU with Glencore pursuant to which the Company agreed
to sell or procure to sell to Glencore or its wholly-owned subsidiary the Company’s 100% interest in CST
Resources. CST Resources is a wholly-owned subsidiary of the Company, which indirectly owns 70% of the
interest of Macrobre, which in turn owns 100% of the Mina Justa copper project in coastal southern Peru.
The price agreed was a total consideration of US$475 million in readily available funds. The parties agreed to
use their best efforts to formalise the SPA and all other necessary legal documents by 15 July 2011 with a
view to complete the transaction on or before 5 October 2011. It was also agreed that the MOU might be
terminated: (a) by mutual written agreement of the Company and Glencore; (b) by Glencore, upon written
notice to the Company, if the results of the due diligence review conducted by Glencore were not reasonably
satisfactory to Glencore; or (c) if by 15 July 2011, no definitive SPA was signed by the Company and
Glencore. Details of the MOU were disclosed in the Company’s announcement dated 14 June 2011.
On 17 July 2011, the Company and Glencore entered into a SPA pursuant to which Glencore conditionally
agreed to acquire CST Resources from the Company for a cash consideration of approximately US$475
million. Closing to the SPA was conditional upon the fulfilment or waiver of certain conditions (the
“Conditions Precedent”). Details of the SPA were disclosed in the Company’s announcement and circular
dated 18 July 2011 and 2 September 2011 respectively.
On 2 October 2011, the Company received from Glencore a Notice of Satisfaction with respect to its
technical due diligence enquiries in respect of the Mina Justa Project. The Company and Glencore further
agreed to extend the satisfaction date for the remaining Conditions Precedent to 30 November 2011 with
anticipated closing in December 2011. Details were disclosed in the Company’s announcement dated 2
October 2011.
On 29 November 2011, the Company was informed by Glencore of its intention to terminate the SPA as the
Conditions Precedent relating to reaching a satisfactory commercial arrangement with our joint venture
partner of Marcobre had not been satisfied. Details were disclosed in the Company’s announcement dated
29 November 2011.
Following the end of the Year, on 23 April 2012, the Company and Cumbres entered into the new SPA
pursuant to which Cumbres agreed to acquire all of the shares of CST Resources from the Company for a
total cash consideration of US$505 million and the aggregate amount of cash payments made directly or
indirectly by the Company to Marcobre during the period between 31 March 2012 and the closing of the
Transaction, subject to Cumbres’ withholding of an estimate amount of Peruvian capital gains tax at the
closing of the Transaction. Cumbres agreed to pay an amount of US$50.5 million in cash into an escrow
account as deposit which was received on 27 April 2012. The Transaction constituted a very substantial
disposal for the Company under the Rules Governing the Listing of Securities on The Stock Exchange of Hong
Kong Limited (the “Listing Rules”) and was therefore subject to the approval of the Shareholders of the
Company. The Transaction was completed on 13 June 2012. Details of the Transaction were disclosed in the
Company’s announcements dated 26 April 2012, 27 April 2012 and 13 June 2012, and circular dated 21 May
2012.
33CST Mining Group Limited
OutlookThe success of the Company’s work to stabilise monthly production and improve mining and processing
efficiencies at Lady Annie became clearly evident during the final quarter of the Year when operations
exceeded budget targets for the first time. It means operating results for this calendar year are firmly on
track to improve further.
Using data from the recently-revised Lady Annie geological block model, and working with a newly-introduced
programme of campaign mining, the Company expects to achieve production during this calendar year of
23,000 tonnes of copper cathode. Production costs are budgeted at approximately US$2.21 per pound of
copper and at an exchange rate of 1.0107 US dollars to one Australian dollar.
Resource and reserve updates are almost completed and will be announced in the month of July followed the
conclusion of the Lady Annie infill and near mine exploration drilling programmes during the Year have
extended mine life of Lady Annie Operations. A mining lease application for Anthill Project has been lodged,
and anticipates a further extension of mine life from that deposit. Further resource and reserve updates are
now planned during the second half of this calendar year to include new results from Lady Brenda and the
recently-discovered Anthill West.
Trial production-processing of relatively low-grade transition ores produced encouraging results during the final
quarter of the Year, with particular success blending oxide ores with transition ores. Further assessment of the
potential of transition resources is now planned.
These steady, incremental and continuing accomplishments have placed Lady Annie Operations in an excellent
position to produce efficiently through the year ahead. They have also created breathing space for the
Company to conduct a thorough review of its wider regional exploration programme around Lady Annie, to
identify potential opportunities arising from work over the past two years on greenfields prospects.
A regional exploration programme will be reviewed in the second half of this calendar year. The Group now
holds tenements of approximately 3,000 square kilometers, and another approximately 450 square kilometers
under application.
After the completion of the sale of Mina Justa project on 13 June 2012, the Company is now in a financially
strengthened position to grow. The Company will start actively looking for acquisition opportunities to expand
its business and continue to create value for its shareholders. Further information on such opportunities and
use of proceeds including working capital, repurchase of shares and special dividend will be reviewed carefully
by the Board and disclosed to its shareholders on a timely basis.
Directors' Report
34 Annual Report 2012
The board of directors (the “Board“) has pleasure in presenting its report together with the audited
consolidated financial statements of the Group for the Year.
Principal ActivitiesThe principal activities of the Company are investment holding and the principal activities of the Group are (i)
acquisition, exploration, development and mining of copper and other mineral resources minerals; (ii) property
investment and (iii) investments in financial instruments. The particulars of the Company’s principal subsidiaries
are set out in note 40 to the consolidated financial statements.
Results and DividendsResults of the Group for the Year are set out in the consolidated statement of comprehensive income on
page 51.
The Board does not recommend the payment of a dividend during the Year.
Property, Plant and EquipmentMovement in the property, plant and equipment of the Group during the Year are set out in note 16 to the
consolidated financial statements.
Investment PropertiesMovement in the investment properties of the Group are set out in note 17 to the consolidated financial
statements.
Share CapitalDetails of the share capital of the Company set out in note 29 to the consolidated financial statements.
DirectorsThe directors of the Company (the “Directors“) during the Year and up to the date of this report are:
Executive Directors:Mr Chiu Tao (Chairman)Mr Owen L. Hegarty (Vice Chairman)Ms Yang Yi-fang (Chief Executive Officer)
(appointed as Chief Executive Officer and Director on 22 September 2011 and 3 October 2011 respectively)Mr Hui Richard Rui (General Manager)Mr Yeung Kwok YuMr Kwan Kam Hung, JimmyMr Tsui Ching HungMr Chung Nai TingMr Lee Ming Tung (Chief Financial Officer)Mr Wah Wang Kei, JackieMr Damon G. Barber (Chief Executive Officer)
(resigned as Director and Chief Executive Officer on 20 September 2011)
Independent Non-executive Directors:
Mr Yu Pan
Ms Tong So Yuet
Mr Chan Shek Wah
35CST Mining Group Limited
The Directors (including independent non-executive directors) are subject to retirement by rotation and re-
election at the annual general meeting of the Company in accordance with the provisions of the Company’s
articles of association. Accordingly, the Directors, Mr Chiu Tao, Mr Kwan Kam Hung, Jimmy, Mr Tsui Ching
Hung, Mr Wah Wang Kei, Jackie and Mr Chan Shek Wah will retire from office and, being eligible, offer
themselves for re-election at the forthcoming annual general meeting.
None of the Directors who are proposed for re-election at the forthcoming annual general meeting has a
service contract with the Company which is not determinable within one year without payment of
compensation, other than statutory compensation.
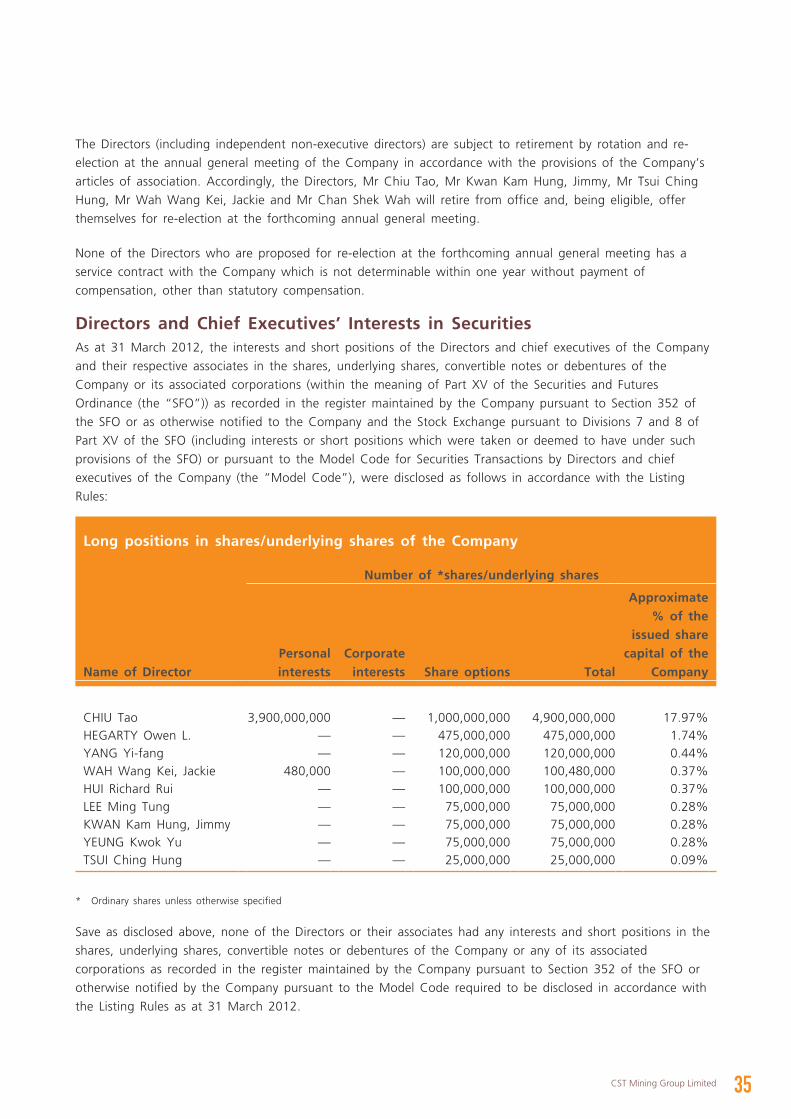
Directors and Chief Executives’ Interests in SecuritiesAs at 31 March 2012, the interests and short positions of the Directors and chief executives of the Company
and their respective associates in the shares, underlying shares, convertible notes or debentures of the
Company or its associated corporations (within the meaning of Part XV of the Securities and Futures
Ordinance (the “SFO”)) as recorded in the register maintained by the Company pursuant to Section 352 of
the SFO or as otherwise notified to the Company and the Stock Exchange pursuant to Divisions 7 and 8 of
Part XV of the SFO (including interests or short positions which were taken or deemed to have under such
provisions of the SFO) or pursuant to the Model Code for Securities Transactions by Directors and chief
executives of the Company (the “Model Code”), were disclosed as follows in accordance with the Listing
Rules:
Long positions in shares/underlying shares of the Company
Number of *shares/underlying shares
Name of DirectorPersonal interests
Corporate interests Share options Total
Approximate % of the
issued share capital of the
Company
CHIU Tao 3,900,000,000 — 1,000,000,000 4,900,000,000 17.97%HEGARTY Owen L. — — 475,000,000 475,000,000 1.74%YANG Yi-fang — — 120,000,000 120,000,000 0.44%WAH Wang Kei, Jackie 480,000 — 100,000,000 100,480,000 0.37%HUI Richard Rui — — 100,000,000 100,000,000 0.37%LEE Ming Tung — — 75,000,000 75,000,000 0.28%KWAN Kam Hung, Jimmy — — 75,000,000 75,000,000 0.28%YEUNG Kwok Yu — — 75,000,000 75,000,000 0.28%TSUI Ching Hung — — 25,000,000 25,000,000 0.09%
* Ordinary shares unless otherwise specified
Save as disclosed above, none of the Directors or their associates had any interests and short positions in the
shares, underlying shares, convertible notes or debentures of the Company or any of its associated
corporations as recorded in the register maintained by the Company pursuant to Section 352 of the SFO or
otherwise notified by the Company pursuant to the Model Code required to be disclosed in accordance with
the Listing Rules as at 31 March 2012.
36 Annual Report 2012
Directors' Report
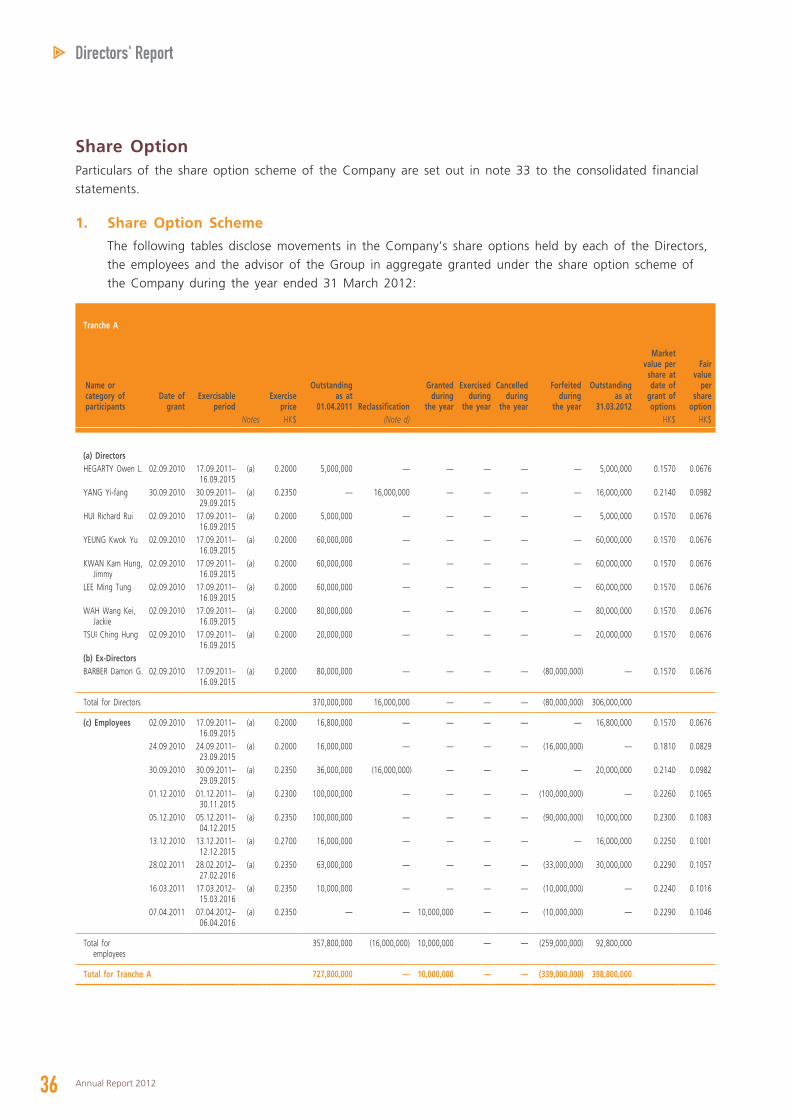
Share OptionParticulars of the share option scheme of the Company are set out in note 33 to the consolidated financial
statements.
1. Share Option Scheme
The following tables disclose movements in the Company’s share options held by each of the Directors,
the employees and the advisor of the Group in aggregate granted under the share option scheme of
the Company during the year ended 31 March 2012:
Tranche A
Name or category of participants
Date of grant
Exercisable period
Exercise price
Outstanding as at
01.04.2011 Reclassification
Granted during
the year
Exercised during
the year
Cancelled during
the year
Forfeited during
the year
Outstanding as at
31.03.2012
Market value per
share at date of
grant of options
Fair value
per share
optionNotes HK$ (Note d) HK$ HK$
(a) DirectorsHEGARTY Owen L. 02.09.2010 17.09.2011–
16.09.2015(a) 0.2000 5,000,000 — — — — — 5,000,000 0.1570 0.0676
YANG Yi-fang 30.09.2010 30.09.2011–29.09.2015
(a) 0.2350 — 16,000,000 — — — — 16,000,000 0.2140 0.0982
HUI Richard Rui 02.09.2010 17.09.2011–16.09.2015
(a) 0.2000 5,000,000 — — — — — 5,000,000 0.1570 0.0676
YEUNG Kwok Yu 02.09.2010 17.09.2011–16.09.2015
(a) 0.2000 60,000,000 — — — — — 60,000,000 0.1570 0.0676
KWAN Kam Hung, Jimmy
02.09.2010 17.09.2011–16.09.2015
(a) 0.2000 60,000,000 — — — — — 60,000,000 0.1570 0.0676
LEE Ming Tung 02.09.2010 17.09.2011–16.09.2015
(a) 0.2000 60,000,000 — — — — — 60,000,000 0.1570 0.0676
WAH Wang Kei, Jackie
02.09.2010 17.09.2011–16.09.2015
(a) 0.2000 80,000,000 — — — — — 80,000,000 0.1570 0.0676
TSUI Ching Hung 02.09.2010 17.09.2011–16.09.2015
(a) 0.2000 20,000,000 — — — — — 20,000,000 0.1570 0.0676
(b) Ex-DirectorsBARBER Damon G. 02.09.2010 17.09.2011–
16.09.2015(a) 0.2000 80,000,000 — — — — (80,000,000) — 0.1570 0.0676
Total for Directors 370,000,000 16,000,000 — — — (80,000,000) 306,000,000
(c) Employees 02.09.2010 17.09.2011–16.09.2015
(a) 0.2000 16,800,000 — — — — — 16,800,000 0.1570 0.0676
24.09.2010 24.09.2011–23.09.2015
(a) 0.2000 16,000,000 — — — — (16,000,000) — 0.1810 0.0829
30.09.2010 30.09.2011–29.09.2015
(a) 0.2350 36,000,000 (16,000,000) — — — — 20,000,000 0.2140 0.0982
01.12.2010 01.12.2011–30.11.2015
(a) 0.2300 100,000,000 — — — — (100,000,000) — 0.2260 0.1065
05.12.2010 05.12.2011–04.12.2015
(a) 0.2350 100,000,000 — — — — (90,000,000) 10,000,000 0.2300 0.1083
13.12.2010 13.12.2011–12.12.2015
(a) 0.2700 16,000,000 — — — — — 16,000,000 0.2250 0.1001
28.02.2011 28.02.2012–27.02.2016
(a) 0.2350 63,000,000 — — — — (33,000,000) 30,000,000 0.2290 0.1057
16.03.2011 17.03.2012–15.03.2016
(a) 0.2350 10,000,000 — — — — (10,000,000) — 0.2240 0.1016
07.04.2011 07.04.2012–06.04.2016
(a) 0.2350 — — 10,000,000 — — (10,000,000) — 0.2290 0.1046
Total for employees
357,800,000 (16,000,000) 10,000,000 — — (259,000,000) 92,800,000
Total for Tranche A 727,800,000 — 10,000,000 — — (339,000,000) 398,800,000
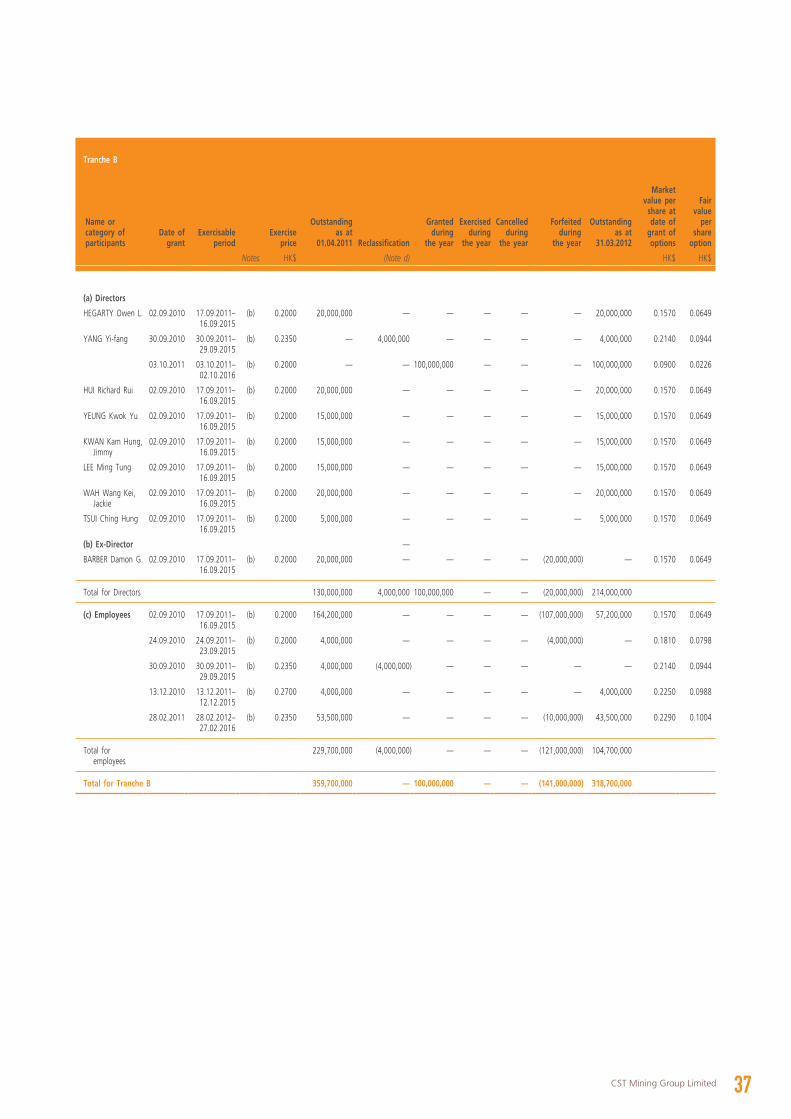
37CST Mining Group Limited
Tranche B
Name or category of participants
Date of grant
Exercisable period
Exercise price
Outstanding as at
01.04.2011 Reclassification
Granted during
the year
Exercised during
the year
Cancelled during
the year
Forfeited during
the year
Outstanding as at
31.03.2012
Market value per
share at date of
grant of options
Fair value
per share
option
Notes HK$ (Note d) HK$ HK$
(a) Directors
HEGARTY Owen L. 02.09.2010 17.09.2011–16.09.2015
(b) 0.2000 20,000,000 — — — — — 20,000,000 0.1570 0.0649
YANG Yi-fang 30.09.2010 30.09.2011–29.09.2015
(b) 0.2350 — 4,000,000 — — — — 4,000,000 0.2140 0.0944
03.10.2011 03.10.2011–02.10.2016
(b) 0.2000 — — 100,000,000 — — — 100,000,000 0.0900 0.0226
HUI Richard Rui 02.09.2010 17.09.2011–16.09.2015
(b) 0.2000 20,000,000 — — — — — 20,000,000 0.1570 0.0649
YEUNG Kwok Yu 02.09.2010 17.09.2011–16.09.2015
(b) 0.2000 15,000,000 — — — — — 15,000,000 0.1570 0.0649
KWAN Kam Hung, Jimmy
02.09.2010 17.09.2011–16.09.2015
(b) 0.2000 15,000,000 — — — — — 15,000,000 0.1570 0.0649
LEE Ming Tung 02.09.2010 17.09.2011–16.09.2015
(b) 0.2000 15,000,000 — — — — — 15,000,000 0.1570 0.0649
WAH Wang Kei, Jackie
02.09.2010 17.09.2011–16.09.2015
(b) 0.2000 20,000,000 — — — — — 20,000,000 0.1570 0.0649
TSUI Ching Hung 02.09.2010 17.09.2011–16.09.2015
(b) 0.2000 5,000,000 — — — — — 5,000,000 0.1570 0.0649
(b) Ex-Director —
BARBER Damon G. 02.09.2010 17.09.2011–16.09.2015
(b) 0.2000 20,000,000 — — — — (20,000,000) — 0.1570 0.0649
Total for Directors 130,000,000 4,000,000 100,000,000 — — (20,000,000) 214,000,000
(c) Employees 02.09.2010 17.09.2011–16.09.2015
(b) 0.2000 164,200,000 — — — — (107,000,000) 57,200,000 0.1570 0.0649
24.09.2010 24.09.2011–23.09.2015
(b) 0.2000 4,000,000 — — — — (4,000,000) — 0.1810 0.0798
30.09.2010 30.09.2011–29.09.2015
(b) 0.2350 4,000,000 (4,000,000) — — — — — 0.2140 0.0944
13.12.2010 13.12.2011–12.12.2015
(b) 0.2700 4,000,000 — — — — — 4,000,000 0.2250 0.0988
28.02.2011 28.02.2012–27.02.2016
(b) 0.2350 53,500,000 — — — — (10,000,000) 43,500,000 0.2290 0.1004
Total for employees
229,700,000 (4,000,000) — — — (121,000,000) 104,700,000
Total for Tranche B 359,700,000 — 100,000,000 — — (141,000,000) 318,700,000
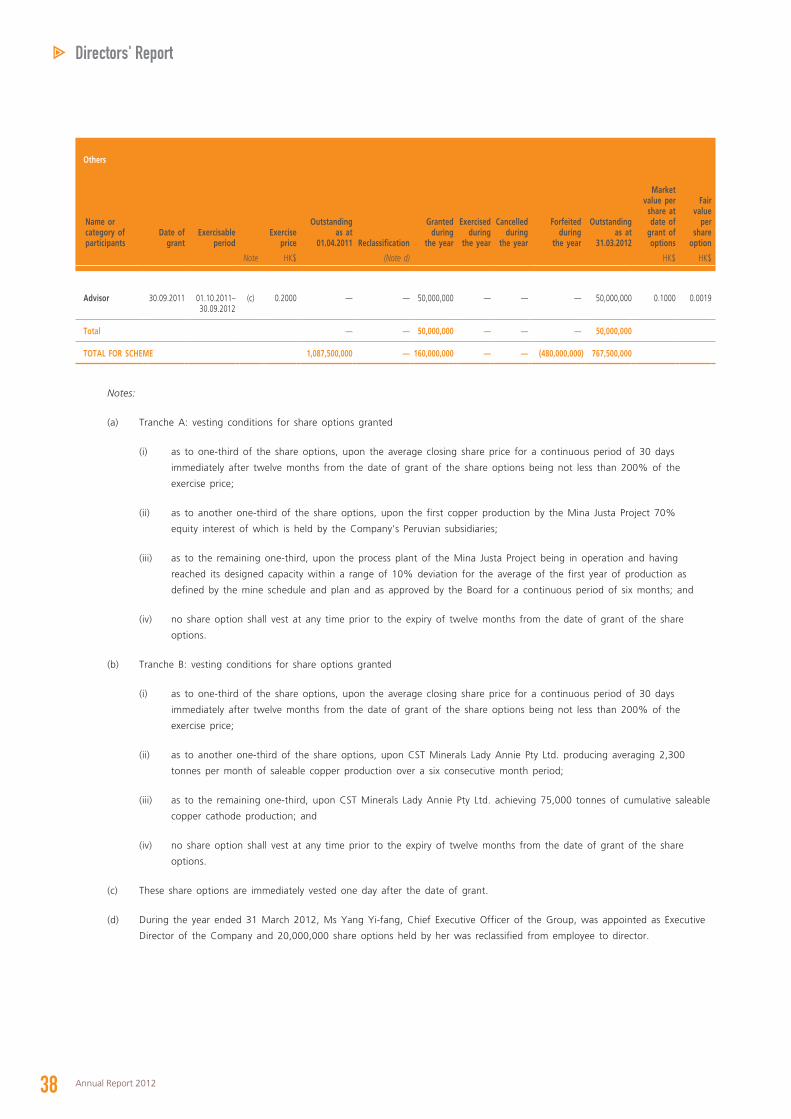
38 Annual Report 2012
Directors' Report
Others
Name or category of participants
Date of grant
Exercisable period
Exercise price
Outstanding as at
01.04.2011 Reclassification
Granted during
the year
Exercised during
the year
Cancelled during
the year
Forfeited during
the year
Outstanding as at
31.03.2012
Market value per
share at date of
grant of options
Fair value
per share
option
Note HK$ (Note d) HK$ HK$
Advisor 30.09.2011 01.10.2011–30.09.2012
(c) 0.2000 — — 50,000,000 — — — 50,000,000 0.1000 0.0019
Total — — 50,000,000 — — — 50,000,000
TOTAL FOR SCHEME 1,087,500,000 — 160,000,000 — — (480,000,000) 767,500,000
Notes:
(a) Tranche A: vesting conditions for share options granted
(i) as to one-third of the share options, upon the average closing share price for a continuous period of 30 days
immediately after twelve months from the date of grant of the share options being not less than 200% of the
exercise price;
(ii) as to another one-third of the share options, upon the first copper production by the Mina Justa Project 70%
equity interest of which is held by the Company’s Peruvian subsidiaries;
(iii) as to the remaining one-third, upon the process plant of the Mina Justa Project being in operation and having
reached its designed capacity within a range of 10% deviation for the average of the first year of production as
defined by the mine schedule and plan and as approved by the Board for a continuous period of six months; and
(iv) no share option shall vest at any time prior to the expiry of twelve months from the date of grant of the share
options.
(b) Tranche B: vesting conditions for share options granted
(i) as to one-third of the share options, upon the average closing share price for a continuous period of 30 days
immediately after twelve months from the date of grant of the share options being not less than 200% of the
exercise price;
(ii) as to another one-third of the share options, upon CST Minerals Lady Annie Pty Ltd. producing averaging 2,300
tonnes per month of saleable copper production over a six consecutive month period;
(iii) as to the remaining one-third, upon CST Minerals Lady Annie Pty Ltd. achieving 75,000 tonnes of cumulative saleable
copper cathode production; and
(iv) no share option shall vest at any time prior to the expiry of twelve months from the date of grant of the share
options.
(c) These share options are immediately vested one day after the date of grant.
(d) During the year ended 31 March 2012, Ms Yang Yi-fang, Chief Executive Officer of the Group, was appointed as Executive
Director of the Company and 20,000,000 share options held by her was reclassified from employee to director.
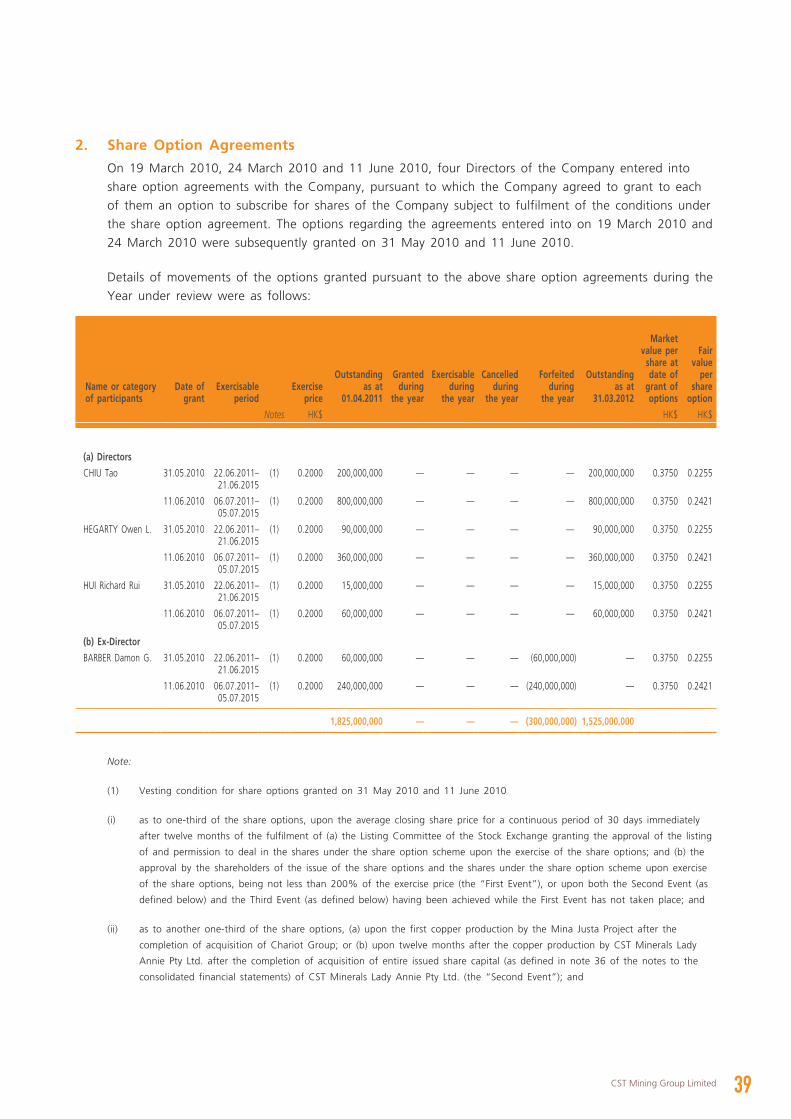
39CST Mining Group Limited
2. Share Option Agreements
On 19 March 2010, 24 March 2010 and 11 June 2010, four Directors of the Company entered into
share option agreements with the Company, pursuant to which the Company agreed to grant to each
of them an option to subscribe for shares of the Company subject to fulfilment of the conditions under
the share option agreement. The options regarding the agreements entered into on 19 March 2010 and
24 March 2010 were subsequently granted on 31 May 2010 and 11 June 2010.
Details of movements of the options granted pursuant to the above share option agreements during the
Year under review were as follows:
Name or category of participants
Date of grant
Exercisable period
Exercise price
Outstanding as at
01.04.2011
Granted during
the year
Exercisable during
the year
Cancelled during
the year
Forfeited during
the year
Outstanding as at
31.03.2012
Market value per
share at date of
grant of options
Fair value
per share
option
Notes HK$ HK$ HK$
(a) Directors
CHIU Tao 31.05.2010 22.06.2011–21.06.2015
(1) 0.2000 200,000,000 — — — — 200,000,000 0.3750 0.2255
11.06.2010 06.07.2011–05.07.2015
(1) 0.2000 800,000,000 — — — — 800,000,000 0.3750 0.2421
HEGARTY Owen L. 31.05.2010 22.06.2011–21.06.2015
(1) 0.2000 90,000,000 — — — — 90,000,000 0.3750 0.2255
11.06.2010 06.07.2011–05.07.2015
(1) 0.2000 360,000,000 — — — — 360,000,000 0.3750 0.2421
HUI Richard Rui 31.05.2010 22.06.2011–21.06.2015
(1) 0.2000 15,000,000 — — — — 15,000,000 0.3750 0.2255
11.06.2010 06.07.2011–05.07.2015
(1) 0.2000 60,000,000 — — — — 60,000,000 0.3750 0.2421
(b) Ex-Director
BARBER Damon G. 31.05.2010 22.06.2011–21.06.2015
(1) 0.2000 60,000,000 — — — (60,000,000) — 0.3750 0.2255
11.06.2010 06.07.2011–05.07.2015
(1) 0.2000 240,000,000 — — — (240,000,000) — 0.3750 0.2421
1,825,000,000 — — — (300,000,000) 1,525,000,000
Note:
(1) Vesting condition for share options granted on 31 May 2010 and 11 June 2010
(i) as to one-third of the share options, upon the average closing share price for a continuous period of 30 days immediately
after twelve months of the fulfilment of (a) the Listing Committee of the Stock Exchange granting the approval of the listing
of and permission to deal in the shares under the share option scheme upon the exercise of the share options; and (b) the
approval by the shareholders of the issue of the share options and the shares under the share option scheme upon exercise
of the share options, being not less than 200% of the exercise price (the “First Event”), or upon both the Second Event (as
defined below) and the Third Event (as defined below) having been achieved while the First Event has not taken place; and
(ii) as to another one-third of the share options, (a) upon the first copper production by the Mina Justa Project after the
completion of acquisition of Chariot Group; or (b) upon twelve months after the copper production by CST Minerals Lady
Annie Pty Ltd. after the completion of acquisition of entire issued share capital (as defined in note 36 of the notes to the
consolidated financial statements) of CST Minerals Lady Annie Pty Ltd. (the “Second Event”); and
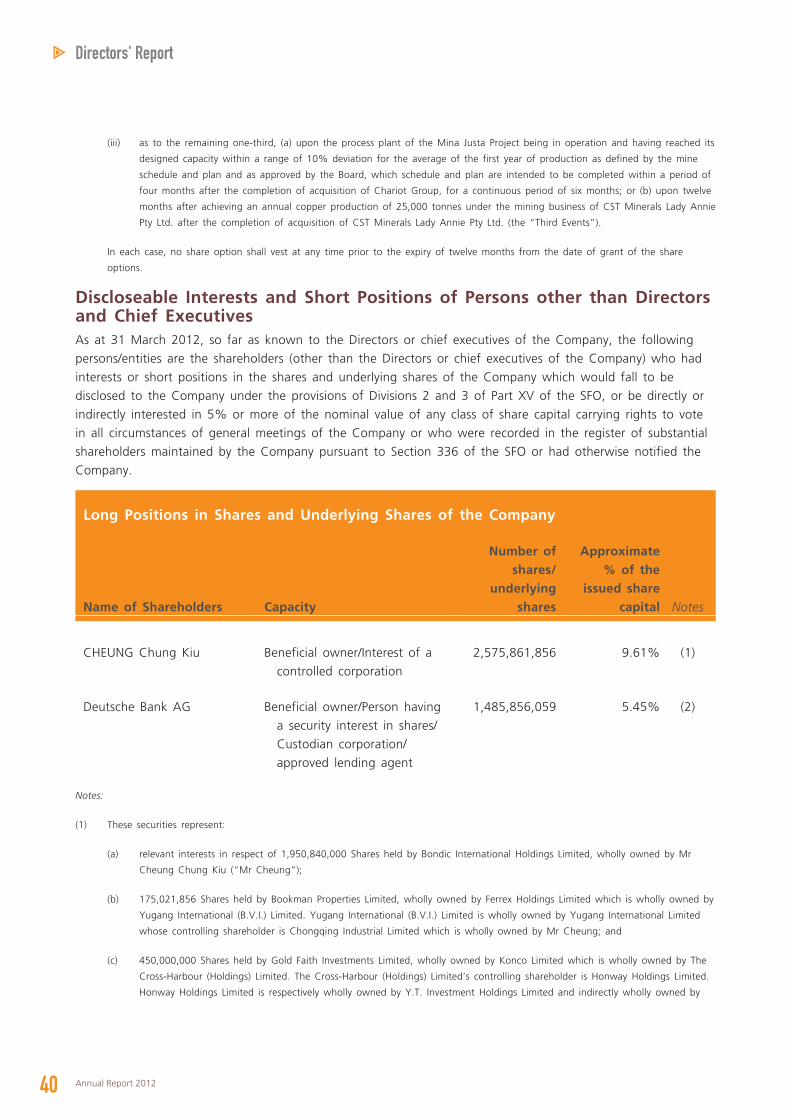
40 Annual Report 2012
Directors' Report
(iii) as to the remaining one-third, (a) upon the process plant of the Mina Justa Project being in operation and having reached its
designed capacity within a range of 10% deviation for the average of the first year of production as defined by the mine
schedule and plan and as approved by the Board, which schedule and plan are intended to be completed within a period of
four months after the completion of acquisition of Chariot Group, for a continuous period of six months; or (b) upon twelve
months after achieving an annual copper production of 25,000 tonnes under the mining business of CST Minerals Lady Annie
Pty Ltd. after the completion of acquisition of CST Minerals Lady Annie Pty Ltd. (the “Third Events”).
In each case, no share option shall vest at any time prior to the expiry of twelve months from the date of grant of the share
options.
Discloseable Interests and Short Positions of Persons other than Directors and Chief ExecutivesAs at 31 March 2012, so far as known to the Directors or chief executives of the Company, the following
persons/entities are the shareholders (other than the Directors or chief executives of the Company) who had
interests or short positions in the shares and underlying shares of the Company which would fall to be
disclosed to the Company under the provisions of Divisions 2 and 3 of Part XV of the SFO, or be directly or
indirectly interested in 5% or more of the nominal value of any class of share capital carrying rights to vote
in all circumstances of general meetings of the Company or who were recorded in the register of substantial
shareholders maintained by the Company pursuant to Section 336 of the SFO or had otherwise notified the
Company.
Long Positions in Shares and Underlying Shares of the Company
Name of Shareholders Capacity
Number of shares/
underlying shares
Approximate % of the
issued share capital Notes
CHEUNG Chung Kiu Beneficial owner/Interest of a
controlled corporation
2,575,861,856 9.61% (1)
Deutsche Bank AG Beneficial owner/Person having
a security interest in shares/
Custodian corporation/
approved lending agent
1,485,856,059 5.45% (2)
Notes:
(1) These securities represent:
(a) relevant interests in respect of 1,950,840,000 Shares held by Bondic International Holdings Limited, wholly owned by Mr
Cheung Chung Kiu (“Mr Cheung”);
(b) 175,021,856 Shares held by Bookman Properties Limited, wholly owned by Ferrex Holdings Limited which is wholly owned by
Yugang International (B.V.I.) Limited. Yugang International (B.V.I.) Limited is wholly owned by Yugang International Limited
whose controlling shareholder is Chongqing Industrial Limited which is wholly owned by Mr Cheung; and
(c) 450,000,000 Shares held by Gold Faith Investments Limited, wholly owned by Konco Limited which is wholly owned by The
Cross-Harbour (Holdings) Limited. The Cross-Harbour (Holdings) Limited’s controlling shareholder is Honway Holdings Limited.
Honway Holdings Limited is respectively wholly owned by Y.T. Investment Holdings Limited and indirectly wholly owned by
41CST Mining Group Limited
Y.T. Realty Group Limited, whose controlling shareholder is Funrise Limited. Funrise Limited is wholly owned by Yugang
International (B.V.I.) Limited, which is wholly owned by Yugang International Limited. Yugang International Limited is
controlled by Chongqing Industrial Limited, which is wholly owned by Mr Cheung.
Accordingly, Mr Cheung is deemed to be interested in 2,575,861,856 Shares of the Company.
(2) These securities represent 1,485,856,059 Shares in long position. Deutsche Bank AG also has 263,837 Shares in short position and
2,021,222 Shares in the lending pool.
Save as disclosed above, the Company has not been notified by any person (other than the Directors or chief
executives of the Company) who had interests or short positions in the shares or underlying shares of the
Company which would fall to be disclosed to the Company under the provisions of Divisions 2 and 3 of Part
XV of the SFO, or be directly or indirectly interested in 5% or more of the nominal value of any class of
share capital carrying rights to vote in all circumstances of general meetings of the Company or who were
recorded in the register of substantial shareholders maintained by the Company pursuant to Section 336 of
the SFO or had otherwise notified the Company as at 31 March 2012.
Directors’ Service ContractsDuring the Year up to the date of this Annual Report, none of the Directors of the Company being proposed
for re-election at the forthcoming annual general meeting has an unexpired service contract with the
Company which is not determinable by the Company within one year without payment of compensation
other than statutory compensation.
Directors’ Interests of Contracts of SignificanceNo contracts of significance to which the Company or its subsidiaries, was a party and in which a Director
had a material interest, either directly or indirectly, subsisted at the end of the year or at any time during the
Year.
Directors’ Interests in Competing BusinessDuring the Year up to the date of this Annual Report, none of the Directors, or any of their respective
associates (as defined in the Listing Rules) had any material interest in a business that competes or may
compete with the business of the Group.
Sufficiency of Public FloatBased on information that is publicly available to the Company and within the knowledge of the Directors,
the Company has maintained the prescribed public float under the Listing Rules as of the date of this Annual
Report.
Purchase, Sale or Redemption of Listed SecuritiesDuring the Year, the Company purchased a total of 184,072,000 shares at prices ranging from HK$0.0830 to
HK$0.1420 per share on the Stock Exchange. We made these repurchases with a view to enhance
shareholder value in the long-term.
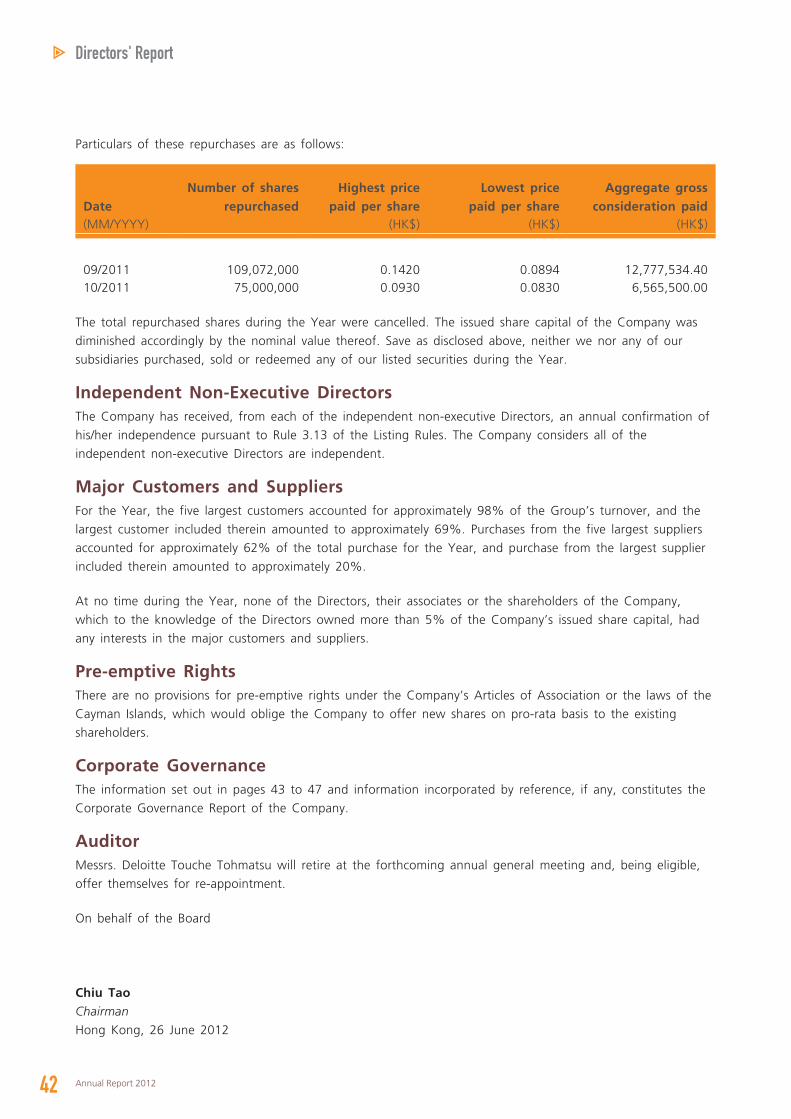
42 Annual Report 2012
Directors' Report
Particulars of these repurchases are as follows:
DateNumber of shares
repurchasedHighest price
paid per shareLowest price
paid per shareAggregate gross
consideration paid(MM/YYYY) (HK$) (HK$) (HK$)
09/2011 109,072,000 0.1420 0.0894 12,777,534.4010/2011 75,000,000 0.0930 0.0830 6,565,500.00
The total repurchased shares during the Year were cancelled. The issued share capital of the Company was
diminished accordingly by the nominal value thereof. Save as disclosed above, neither we nor any of our
subsidiaries purchased, sold or redeemed any of our listed securities during the Year.
Independent Non-Executive DirectorsThe Company has received, from each of the independent non-executive Directors, an annual confirmation of
his/her independence pursuant to Rule 3.13 of the Listing Rules. The Company considers all of the
independent non-executive Directors are independent.
Major Customers and SuppliersFor the Year, the five largest customers accounted for approximately 98% of the Group’s turnover, and the
largest customer included therein amounted to approximately 69%. Purchases from the five largest suppliers
accounted for approximately 62% of the total purchase for the Year, and purchase from the largest supplier
included therein amounted to approximately 20%.
At no time during the Year, none of the Directors, their associates or the shareholders of the Company,
which to the knowledge of the Directors owned more than 5% of the Company’s issued share capital, had
any interests in the major customers and suppliers.
Pre-emptive RightsThere are no provisions for pre-emptive rights under the Company’s Articles of Association or the laws of the
Cayman Islands, which would oblige the Company to offer new shares on pro-rata basis to the existing
shareholders.
Corporate GovernanceThe information set out in pages 43 to 47 and information incorporated by reference, if any, constitutes the
Corporate Governance Report of the Company.
AuditorMessrs. Deloitte Touche Tohmatsu will retire at the forthcoming annual general meeting and, being eligible,
offer themselves for re-appointment.
On behalf of the Board
Chiu Tao Chairman
Hong Kong, 26 June 2012
GovernanceReport
CORPORATE
Corporate Governance Report
44 Annual Report 2012
The Board and the management of the Company are committed to the maintenance of good corporate
governance practices and procedures. The Company believes that good corporate governance provides a framework
that is essential for ensuring effective management, business growth and shareholder value.
The Company has applied the principles as set out in the Code on Corporate Governance Practices (the “CG
Code”) contained in Appendix 14 to the Listing Rules throughout the Year. Any deviation from the Code
Provision is explained in this report.
Board of DirectorsAs at the date of this report, the Board comprised 10 executive Directors and 3 independent non-executive
Directors (the “INEDs”) as follows:
Executive directors:Mr Chiu Tao (Chairman)Mr Owen L. Hegarty (Vice Chairman)Ms Yang Yi-fang (Chief Executive Officer)
(appointed as Chief Executive Officer and Director on 22 September 2011 and 3 October 2011 respectively)Mr Hui Richard Rui (General Manager)Mr Yeung Kwok YuMr Kwan Kam Hung, JimmyMr Tsui Ching HungMr Chung Nai TingMr Lee Ming Tung (Chief Financial Officer)Mr Wah Wang Kei, Jackie
Independent non-executive directors:
Mr Yu Pan
Ms Tong So Yuet
Mr Chan Shek Wah
Biographical details of the Directors are disclosed on page 26 to page 28 of this Annual Report.
Save as disclosed in the headings of the “Directors’ Report” and the “Biographical Details of Directors” of
this Annual Report, none of the Directors had any financial, business, family or other material/relevant
relationship with any other Director.
Each of our INEDs has presented an annual confirmation of independence to the Company in accordance with
the requirement of the Listing Rules. The Company considers all of the INEDs to be independent.
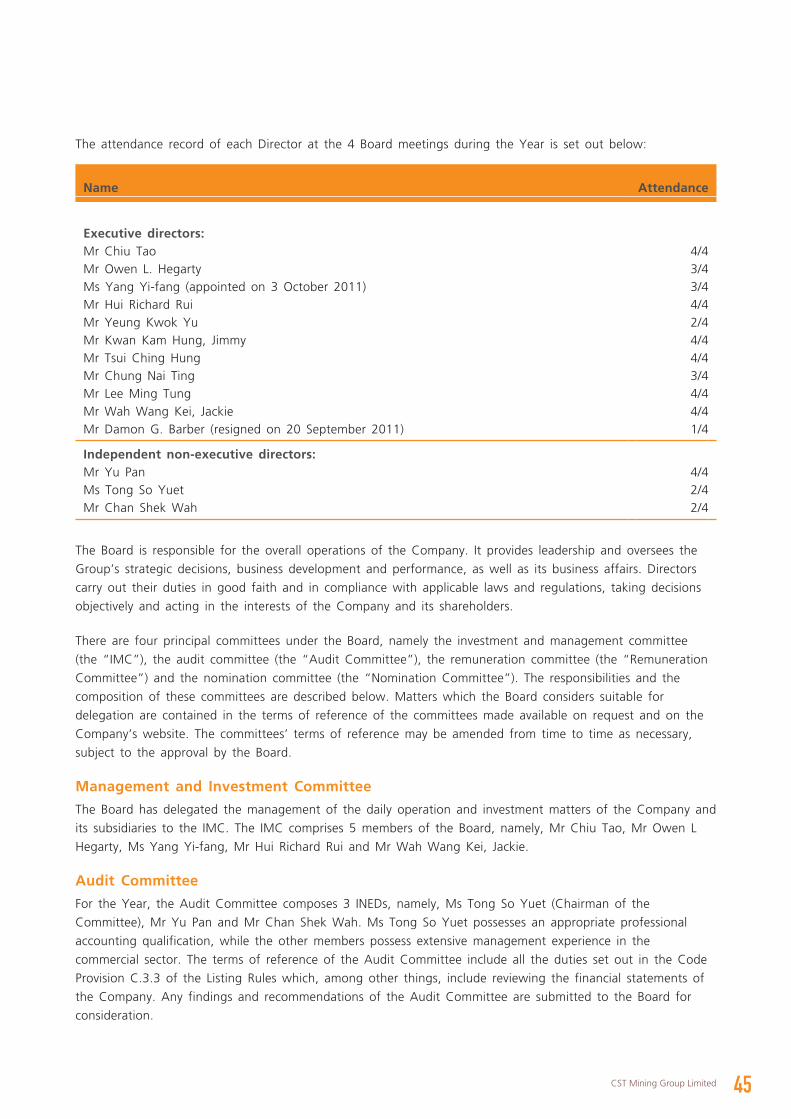
45CST Mining Group Limited
The attendance record of each Director at the 4 Board meetings during the Year is set out below:
Name Attendance
Executive directors:Mr Chiu Tao 4/4Mr Owen L. Hegarty 3/4Ms Yang Yi-fang (appointed on 3 October 2011) 3/4Mr Hui Richard Rui 4/4Mr Yeung Kwok Yu 2/4Mr Kwan Kam Hung, Jimmy 4/4Mr Tsui Ching Hung 4/4Mr Chung Nai Ting 3/4Mr Lee Ming Tung 4/4Mr Wah Wang Kei, Jackie 4/4Mr Damon G. Barber (resigned on 20 September 2011) 1/4
Independent non-executive directors:Mr Yu Pan 4/4Ms Tong So Yuet 2/4Mr Chan Shek Wah 2/4
The Board is responsible for the overall operations of the Company. It provides leadership and oversees the
Group’s strategic decisions, business development and performance, as well as its business affairs. Directors
carry out their duties in good faith and in compliance with applicable laws and regulations, taking decisions
objectively and acting in the interests of the Company and its shareholders.
There are four principal committees under the Board, namely the investment and management committee
(the “IMC”), the audit committee (the “Audit Committee”), the remuneration committee (the “Remuneration
Committee”) and the nomination committee (the “Nomination Committee”). The responsibilities and the
composition of these committees are described below. Matters which the Board considers suitable for
delegation are contained in the terms of reference of the committees made available on request and on the
Company’s website. The committees’ terms of reference may be amended from time to time as necessary,
subject to the approval by the Board.
Management and Investment Committee
The Board has delegated the management of the daily operation and investment matters of the Company and
its subsidiaries to the IMC. The IMC comprises 5 members of the Board, namely, Mr Chiu Tao, Mr Owen L
Hegarty, Ms Yang Yi-fang, Mr Hui Richard Rui and Mr Wah Wang Kei, Jackie.
Audit Committee
For the Year, the Audit Committee composes 3 INEDs, namely, Ms Tong So Yuet (Chairman of the
Committee), Mr Yu Pan and Mr Chan Shek Wah. Ms Tong So Yuet possesses an appropriate professional
accounting qualification, while the other members possess extensive management experience in the
commercial sector. The terms of reference of the Audit Committee include all the duties set out in the Code
Provision C.3.3 of the Listing Rules which, among other things, include reviewing the financial statements of
the Company. Any findings and recommendations of the Audit Committee are submitted to the Board for
consideration.
46 Annual Report 2012
Corporate Governance Report
The Audit Committee is authorised by the Board to investigate any activity within its terms of reference. It is
authorised to seek any information it requires from any employee. It is also authorised to obtain outside legal
or other independent professional advice and to secure the attendance of outsiders with relevant experience
and expertise if considered necessary.
The members and attendance of the 2 Audit Committee meetings during the Year are as follows:
Name Attendance
Ms Tong So Yuet (Chairman) 2/2Mr Yu Pan 2/2Mr Chan Shek Wah 2/2
Remuneration Committee
The Remuneration Committee comprises 2 INEDs, namely, Mr Yu Pan (Chairman of the Committee) and
Mr Chan Shek Wah. The principal responsibilities of the Remuneration Committee include formulation of
the remuneration policy, review and recommendations to the Board on the annual remuneration policy,
and determination of the remuneration of the executive Directors and members of senior management.
The overriding objective of the remuneration policy is to ensure that the Group is able to attract, retain
and motivate a high-calibre team, which is essential to the success of the Group.
The Remuneration Committee held 1 Remuneration Committee meeting during the year to discuss staff
remuneration matters for the Year. The members and attendance at the meeting are as follows:
Name Attendance
Mr Yu Pan (Chairman) 1/1Mr Chan Shek Wah 1/1
Nomination Committee
The Board had retained the function of nomination of directors until the setting up of the Nomination
Committee in March 2012. In view of the compliance with the relevant amendments to the CG Code with
effect from 1 April 2012, the Nomination Committee was established by the Board with specific terms of
reference, for the purpose of making recommendations to the Board in relation to the nomination and
appointment of Directors. The Nomination Committee is responsible for identifying suitable qualified
individuals to the Board and making recommendations for the Board’s consideration. The Nomination
Committee has yet held any meeting after its establishment.
47CST Mining Group Limited
Chairman and Chief Executive Officer
The Company fully supports the division of responsibility between the Chairman of the Board and the Chief
Executive Officer in order to ensure a balance of power and authority and to preserve a balanced judgment
of views. The Chairman as a leader of the Board is responsible for overseeing the function of the Board and
formulating overall strategies and policies of the Group. The Chief Executive Officer, supported by other
members and the senior management, is responsible for managing the Group’s business, implementing major
strategies, making day-to-day decisions and coordinating overall business operations.
Non-Executive Directors
The Code stipulates that non-executive directors should be appointed for a specific term and subject to re-
election. Most time of the Year, all independent non-executive directors of the Company were not appointed
for specific term. However, the Company’s articles of association provide that every director is subject to
retirement by rotation at least once every 3 years and re-election at the annual general meeting. The
Company considered its practice to be in alignment with the objectives of the Code.
By the end of the Year, all independent non-executive directors of the Company have signed appointment
letters with the Company for a term of two years but they continue to be subject to retirement and re-
election as governed by the Company’s articles of association.
Directors’ Securities Transactions
The Company has adopted the Model Code for Securities Transactions by Directors of Listed Issuers (the
“Model Code”) as set out in Appendix 10 of the Listing Rules as its code of conduct regarding directors’
securities transactions. Having made specific enquiry of all Directors, they confirmed that they had complied
with the required standard set out in the Model Code during the Year.
Auditors’ Remuneration
For the Year, the Company engaged Deloitte Touche Tohmatsu as the external auditors of the Company.
During the Year, the fees for non-audit services in relation to taxation services and other professional and
advisory services provided by the external auditors were approximately US$103,000. The fees for audit related
services provided by the external auditors were approximately US$233,000.
Other Matters
The Directors are responsible for the preparation of financial statements. The Directors are not aware of any
material uncertainties relating to events or conditions that may cast significant doubt on the Company’s ability
to continue as a going concern, therefore the Directors continue to adopt the going concern approach in
preparing the financial statements. The internal control system of the Group was reviewed during the Year.
The statement of the external auditor of the Company in regard to their reporting responsibilities on the
Company’s financial statements for the Year is set out in the Independent Auditor’s Report in this Annual
Report.
Financial
OVERVIEW
Independent Auditor’s Report
49CST Mining Group Limited
TO THE MEMBERS OF CST MINING GROUP LIMITED 中科礦業集團有限公司(incorporated in the Cayman Islands with limited liability)
We have audited the consolidated financial statements of CST Mining Group Limited (the “Company”) and its
subsidiaries (collectively referred to as the “Group”) set out on pages 51 to 109, which comprise the
consolidated statement of financial position as at 31 March 2012, and the consolidated statement of
comprehensive income, consolidated statement of changes in equity and consolidated statement of cash flows
for the year then ended, and a summary of significant accounting policies and other explanatory information.
Directors’ Responsibility for the Consolidated Financial StatementsThe directors of the Company are responsible for the preparation of consolidated financial statements that
give a true and fair view in accordance with Hong Kong Financial Reporting Standards issued by the Hong
Kong Institute of Certified Public Accountants and the disclosure requirements of the Hong Kong Companies
Ordinance, and for such internal control as the directors determine is necessary to enable the preparation of
consolidated financial statements that are free from material misstatement, whether due to fraud or error.
Auditor’s ResponsibilityOur responsibility is to express an opinion on these consolidated financial statements based on our audit and
to report our opinion solely to you, as a body, in accordance with our agreed terms of engagement, and for
no other purpose. We do not assume responsibility towards or accept liability to any other person for the
contents of this report. We conducted our audit in accordance with Hong Kong Standards on Auditing issued
by the Hong Kong Institute of Certified Public Accountants. Those standards require that we comply with
ethical requirements and plan and perform the audit to obtain reasonable assurance about whether the
consolidated financial statements are free from material misstatement.
An audit involves performing procedures to obtain audit evidence about the amounts and disclosures in the
consolidated financial statements. The procedures selected depend on the auditor’s judgment, including the
assessment of the risks of material misstatement of the consolidated financial statements, whether due to
fraud or error. In making those risk assessments, the auditor considers internal control relevant to the entity’s
preparation of consolidated financial statements that give a true and fair view in order to design audit
procedures that are appropriate in the circumstances, but not for the purpose of expressing an opinion on
the effectiveness of the entity’s internal control. An audit also includes evaluating the appropriateness of
accounting policies used and the reasonableness of accounting estimates made by the directors, as well as
evaluating the overall presentation of the consolidated financial statements.
We believe that the audit evidence we have obtained is sufficient and appropriate to provide a basis for our
audit opinion.
50 Annual Report 2012
Independent Auditor’s Report
OpinionIn our opinion, the consolidated financial statements give a true and fair view of the state of affairs of the
Group as at 31 March 2012, and of its loss and cash flows for the year then ended in accordance with Hong
Kong Financial Reporting Standards and have been properly prepared in accordance with the disclosure
requirements of the Hong Kong Companies Ordinance.
Deloitte Touche Tohmatsu Certified Public Accountants
Hong Kong
26 June 2012
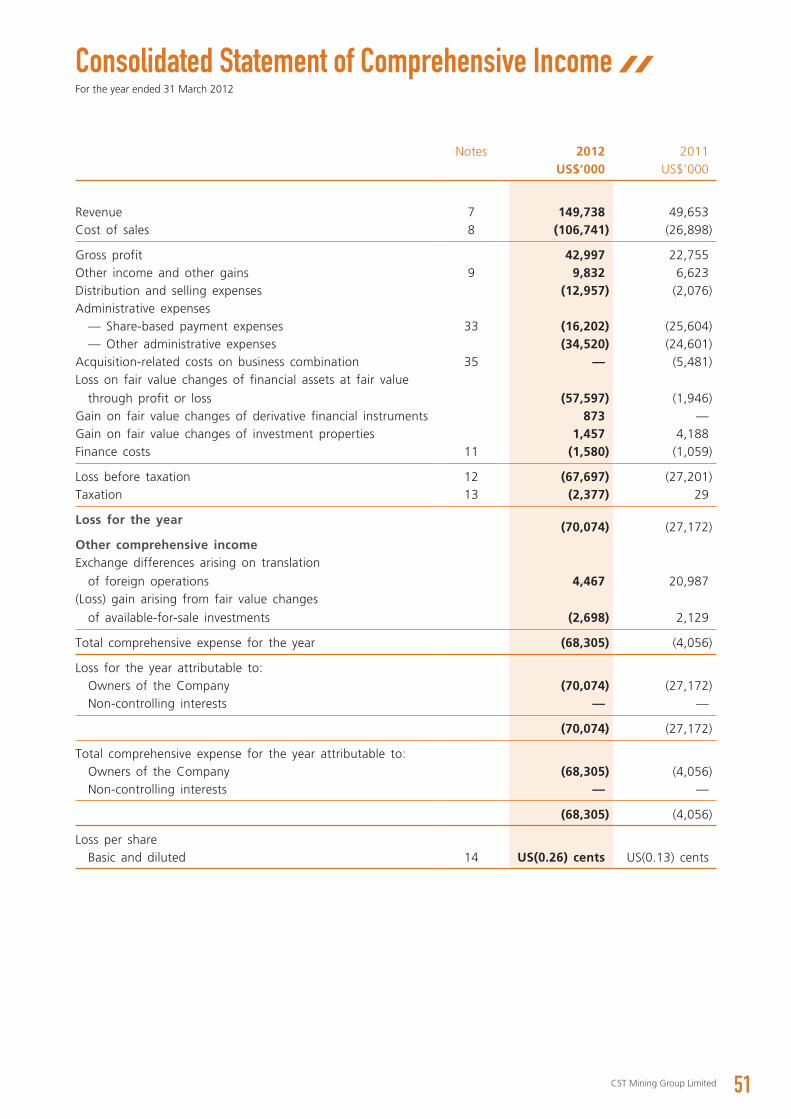
Consolidated Statement of Comprehensive Income
51CST Mining Group Limited
For the year ended 31 March 2012
Notes 2012 2011US$’000 US$’000
Revenue 7 149,738 49,653Cost of sales 8 (106,741) (26,898)
Gross profit 42,997 22,755Other income and other gains 9 9,832 6,623Distribution and selling expenses (12,957) (2,076)Administrative expenses
— Share-based payment expenses 33 (16,202) (25,604)— Other administrative expenses (34,520) (24,601)
Acquisition-related costs on business combination 35 — (5,481)Loss on fair value changes of financial assets at fair value
through profit or loss (57,597) (1,946)Gain on fair value changes of derivative financial instruments 873 —Gain on fair value changes of investment properties 1,457 4,188Finance costs 11 (1,580) (1,059)
Loss before taxation 12 (67,697) (27,201)Taxation 13 (2,377) 29
Loss for the year (70,074) (27,172)Other comprehensive incomeExchange differences arising on translation
of foreign operations 4,467 20,987(Loss) gain arising from fair value changes
of available-for-sale investments (2,698) 2,129
Total comprehensive expense for the year (68,305) (4,056)
Loss for the year attributable to:Owners of the Company (70,074) (27,172)Non-controlling interests — —
(70,074) (27,172)
Total comprehensive expense for the year attributable to:Owners of the Company (68,305) (4,056)Non-controlling interests — —
(68,305) (4,056)
Loss per shareBasic and diluted 14 US(0.26) cents US(0.13) cents
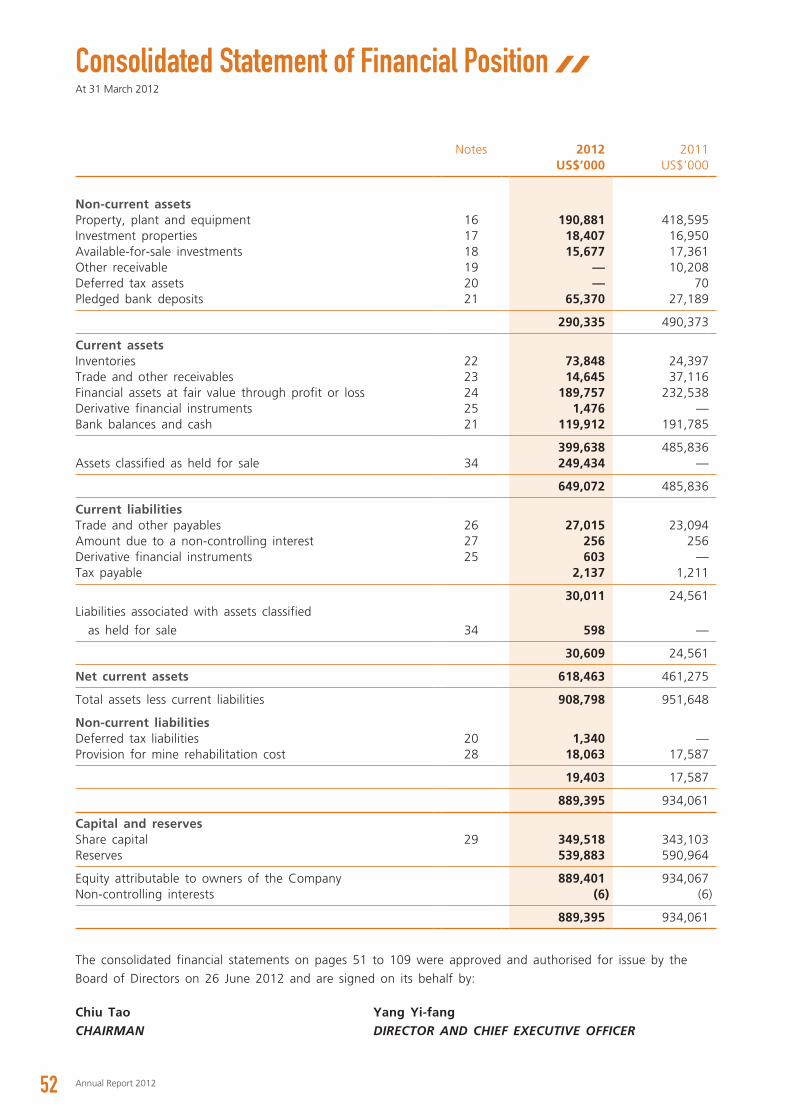
Consolidated Statement of Financial Position
52 Annual Report 2012
At 31 March 2012
Notes 2012 2011US$’000 US$’000
Non-current assetsProperty, plant and equipment 16 190,881 418,595Investment properties 17 18,407 16,950Available-for-sale investments 18 15,677 17,361Other receivable 19 — 10,208Deferred tax assets 20 — 70Pledged bank deposits 21 65,370 27,189
290,335 490,373
Current assetsInventories 22 73,848 24,397Trade and other receivables 23 14,645 37,116Financial assets at fair value through profit or loss 24 189,757 232,538Derivative financial instruments 25 1,476 —Bank balances and cash 21 119,912 191,785
399,638 485,836Assets classified as held for sale 34 249,434 —
649,072 485,836
Current liabilitiesTrade and other payables 26 27,015 23,094Amount due to a non-controlling interest 27 256 256Derivative financial instruments 25 603 —Tax payable 2,137 1,211
30,011 24,561Liabilities associated with assets classified
as held for sale 34 598 —
30,609 24,561
Net current assets 618,463 461,275
Total assets less current liabilities 908,798 951,648
Non-current liabilitiesDeferred tax liabilities 20 1,340 —Provision for mine rehabilitation cost 28 18,063 17,587
19,403 17,587
889,395 934,061
Capital and reservesShare capital 29 349,518 343,103Reserves 539,883 590,964
Equity attributable to owners of the Company 889,401 934,067Non-controlling interests (6) (6)
889,395 934,061
The consolidated financial statements on pages 51 to 109 were approved and authorised for issue by the
Board of Directors on 26 June 2012 and are signed on its behalf by:
Chiu TaoCHAIRMAN
Yang Yi-fangDIRECTOR AND CHIEF EXECUTIVE OFFICER
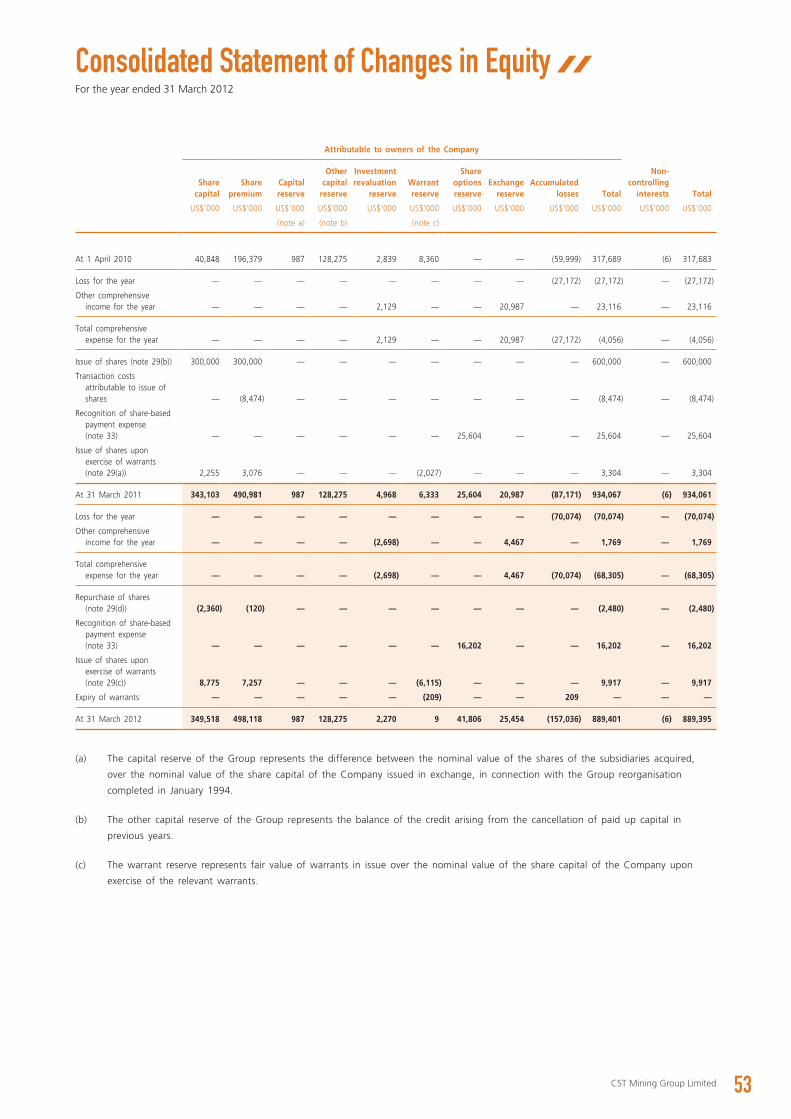
Consolidated Statement of Changes in Equity
53CST Mining Group Limited
For the year ended 31 March 2012
Attributable to owners of the Company
Share capital
Share premium
Capital reserve
Other capital
reserve
Investment revaluation
reserveWarrant reserve
Share options reserve
Exchange reserve
Accumulated losses Total
Non-controlling
interests Total
US$’000 US$’000 US$’000 US$’000 US$’000 US$’000 US$’000 US$’000 US$’000 US$’000 US$’000 US$’000
(note a) (note b) (note c)
At 1 April 2010 40,848 196,379 987 128,275 2,839 8,360 — — (59,999) 317,689 (6) 317,683
Loss for the year — — — — — — — — (27,172) (27,172) — (27,172)
Other comprehensive income for the year — — — — 2,129 — — 20,987 — 23,116 — 23,116
Total comprehensive expense for the year — — — — 2,129 — — 20,987 (27,172) (4,056) — (4,056)
Issue of shares (note 29(b)) 300,000 300,000 — — — — — — — 600,000 — 600,000
Transaction costs attributable to issue of shares — (8,474) — — — — — — — (8,474) — (8,474)
Recognition of share-based payment expense (note 33) — — — — — — 25,604 — — 25,604 — 25,604
Issue of shares upon exercise of warrants (note 29(a)) 2,255 3,076 — — — (2,027) — — — 3,304 — 3,304
At 31 March 2011 343,103 490,981 987 128,275 4,968 6,333 25,604 20,987 (87,171) 934,067 (6) 934,061
Loss for the year — — — — — — — — (70,074) (70,074) — (70,074)
Other comprehensive income for the year — — — — (2,698) — — 4,467 — 1,769 — 1,769
Total comprehensive expense for the year — — — — (2,698) — — 4,467 (70,074) (68,305) — (68,305)
Repurchase of shares (note 29(d)) (2,360) (120) — — — — — — — (2,480) — (2,480)
Recognition of share-based payment expense (note 33) — — — — — — 16,202 — — 16,202 — 16,202
Issue of shares upon exercise of warrants (note 29(c)) 8,775 7,257 — — — (6,115) — — — 9,917 — 9,917
Expiry of warrants — — — — — (209) — — 209 — — —
At 31 March 2012 349,518 498,118 987 128,275 2,270 9 41,806 25,454 (157,036) 889,401 (6) 889,395
(a) The capital reserve of the Group represents the difference between the nominal value of the shares of the subsidiaries acquired,
over the nominal value of the share capital of the Company issued in exchange, in connection with the Group reorganisation
completed in January 1994.
(b) The other capital reserve of the Group represents the balance of the credit arising from the cancellation of paid up capital in
previous years.
(c) The warrant reserve represents fair value of warrants in issue over the nominal value of the share capital of the Company upon
exercise of the relevant warrants.
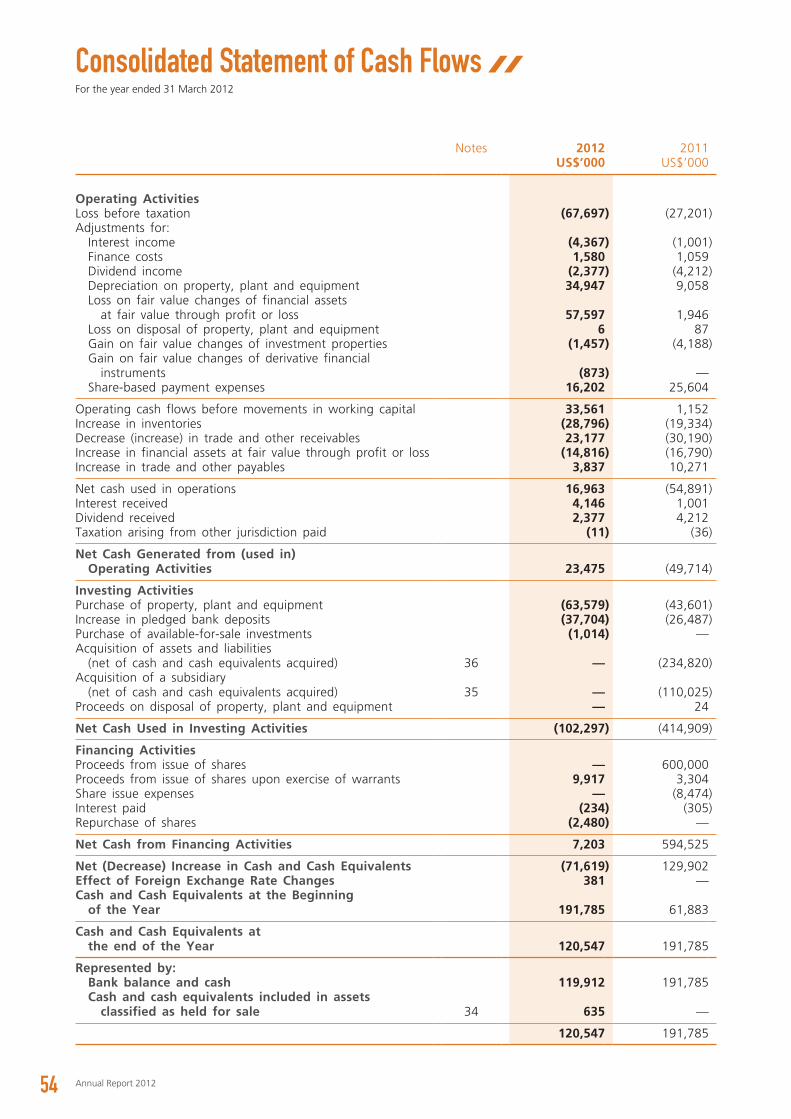
Consolidated Statement of Cash Flows
54 Annual Report 2012
For the year ended 31 March 2012
Notes 2012 2011US$’000 US$’000
Operating ActivitiesLoss before taxation (67,697) (27,201)Adjustments for:
Interest income (4,367) (1,001)Finance costs 1,580 1,059Dividend income (2,377) (4,212)Depreciation on property, plant and equipment 34,947 9,058Loss on fair value changes of financial assets
at fair value through profit or loss 57,597 1,946Loss on disposal of property, plant and equipment 6 87Gain on fair value changes of investment properties (1,457) (4,188)Gain on fair value changes of derivative financial
instruments (873) —Share-based payment expenses 16,202 25,604
Operating cash flows before movements in working capital 33,561 1,152Increase in inventories (28,796) (19,334)Decrease (increase) in trade and other receivables 23,177 (30,190)Increase in financial assets at fair value through profit or loss (14,816) (16,790)Increase in trade and other payables 3,837 10,271
Net cash used in operations 16,963 (54,891)Interest received 4,146 1,001Dividend received 2,377 4,212Taxation arising from other jurisdiction paid (11) (36)
Net Cash Generated from (used in) Operating Activities 23,475 (49,714)
Investing ActivitiesPurchase of property, plant and equipment (63,579) (43,601)Increase in pledged bank deposits (37,704) (26,487)Purchase of available-for-sale investments (1,014) —Acquisition of assets and liabilities
(net of cash and cash equivalents acquired) 36 — (234,820)Acquisition of a subsidiary
(net of cash and cash equivalents acquired) 35 — (110,025)Proceeds on disposal of property, plant and equipment — 24
Net Cash Used in Investing Activities (102,297) (414,909)
Financing ActivitiesProceeds from issue of shares — 600,000Proceeds from issue of shares upon exercise of warrants 9,917 3,304Share issue expenses — (8,474)Interest paid (234) (305)Repurchase of shares (2,480) —
Net Cash from Financing Activities 7,203 594,525
Net (Decrease) Increase in Cash and Cash Equivalents (71,619) 129,902Effect of Foreign Exchange Rate Changes 381 —Cash and Cash Equivalents at the Beginning
of the Year 191,785 61,883
Cash and Cash Equivalents at the end of the Year 120,547 191,785
Represented by:Bank balance and cash 119,912 191,785Cash and cash equivalents included in assets
classified as held for sale 34 635 —
120,547 191,785
Notes to the Consolidated Financial Statements
55CST Mining Group Limited
For the year ended 31 March 2012
1. GeneralThe Company is incorporated in the Cayman Islands as an exempted company with limited liability and
its shares are listed on The Stock Exchange of Hong Kong Limited (the “Stock Exchange”). The
addresses of the registered office and principal place of business of the Company are disclosed in the
corporate information section of this annual report.
The Company is an investment holding company with its subsidiaries engaged in (i) acquisition,
exploration, development and mining of copper and other mineral resources materials, (ii) investment in
financial instruments, and (iii) property investment. The principal activities of each of its principal
subsidiaries and jointly controlled entity are set out in notes 40 and 15 respectively.
The consolidated financial statements are presented in United States dollars (“USD”), which is different
from the Company’s functional currency of Hong Kong dollars (“HKD”). Each entity of the Group
determines its own functional currency and items included in the financial statements of each entity are
measured using that functional currency.
2. Application of New and Revised Hong Kong Financial Reporting Standards (“HKFRSs”)
New and revised HKFRSs applied in the current year
In the current year, the Group has applied the following new and revised HKFRSs issued by the Hong
Kong Institute of Certified Public Accountants (the “HKICPA”).
Amendments to HKFRSs Improvements to HKFRSs issued in 2010HKAS 24 (as revised in 2009) Related Party DisclosuresAmendments to HK(IFRIC) — Int 14 Prepayments of a Minimum Funding RequirementHK(IFRIC) — Int 19 Extinguishing Financial Liabilities with Equity Instruments
The application of the new and revised HKFRSs in the current year has had no material impact on the
Group’s financial performance and position for the current and prior years and/or on the disclosures set
out in these consolidated financial statements.
56 Annual Report 2012
Notes to the Consolidated Financial StatementsFor the year ended 31 March 2012
2. Application of New and Revised Hong Kong Financial Reporting Standards (“HKFRSs”) (continued)
New and revised HKFRSs issued but not yet effective
The Group has not early applied the following new and revised HKFRSs that have been issued but are
not yet effective:
Amendments to HKFRSs Annual Improvements to HKFRSs 2009–2011 Cycle2
Amendments to HKFRS 7 Disclosures — Transfers of Financial Assets1
Amendments to HKFRS 7 Disclosures — Offsetting Financial Assets and Financial Liabilities2
Amendments to HKFRS 7 and
HKFRS 9
Mandatory Effective Date of HKFRS 9 and Transition Disclosures3
HKFRS 9 Financial Instruments3
HKFRS 10 Consolidated Financial Statements2
HKFRS 11 Joint Arrangements2
HKFRS 12 Disclosure of Interests in Other Entities2
HKFRS 13 Fair Value Measurement2
Amendments to HKAS 1 Presentation of Items of Other Comprehensive Income5
Amendments to HKAS 12 Deferred Tax — Recovery of Underlying Assets4
HKAS 19 (as revised in 2011) Employee Benefits2
HKAS 27 (as revised in 2011) Separate Financial Statements2
HKAS 28 (as revised in 2011) Investments in Associates and Joint Ventures2
Amendments to HKAS 32 Offsetting Financial Assets and Financial Liabilities6
HK(IFRIC) — Int 20 Stripping Costs in the Production Phase of a Surface Mine2
1 Effective for annual periods beginning on or after 1 July 2011.2 Effective for annual periods beginning on or after 1 January 2013.3 Effective for annual periods beginning on or after 1 January 2015.4 Effective for annual periods beginning on or after 1 January 2012.5 Effective for annual periods beginning on or after 1 July 2012.6 Effective for annual periods beginning on or after 1 January 2014.
HKFRS 9 Financial Instruments (as issued in November 2009) introduces new requirements for the
classification and measurement of financial assets. HKFRS 9 Financial Instruments (as revised in November
2010) adds requirements for financial liabilities and for derecognition.
• Under HKFRS 9, all recognised financial assets that are within the scope of HKAS 39 Financial
Instruments: Recognition and Measurement are subsequently measured at either amortised cost or
fair value. Specifically, debt investments that are held within a business model whose objective is
to collect the contractual cash flows, and that have contractual cash flows that are solely payments
of principal and interest on the principal outstanding are generally measured at amortised cost at
the end of subsequent accounting periods. All other debt investments and equity investments are
measured at their fair values at the end of subsequent accounting periods. In addition, under
HKFRS 9, entities may make an irrevocable election to present subsequent changes in the fair value
of an equity investment (that is not held for trading) in other comprehensive income, with only
dividend income generally recognised in profit or loss.
57CST Mining Group Limited
2. Application of New and Revised Hong Kong Financial Reporting Standards (“HKFRSs”) (continued)
New and revised HKFRSs issued but not yet effective (continued)
• The most significant effect of HKFRS 9 regarding the classification and measurement of financial
liabilities relates to the presentation of changes in the fair value of a financial liability (designated
as at fair value through profit or loss) attributable to changes in the credit risk of that liability.
Specifically, under HKFRS 9, for financial liabilities that are designated as at fair value through
profit or loss, the amount of change in the fair value of the financial liability that is attributable to
changes in the credit risk of that liability is presented in other comprehensive income, unless the
recognition of the effects of changes in the liability’s credit risk in other comprehensive income
would create or enlarge an accounting mismatch in profit or loss. Changes in fair value
attributable to a financial liability’s credit risk are not subsequently reclassified to profit or loss.
Currently, under HKAS 39, the entire amount of the change in the fair value of the financial
liability designated as at fair value through profit or loss is presented in profit or loss.
HKFRS 9 is effective for accounting periods beginning on or after 1 January 2015, with earlier
application permitted.
The directors anticipate that HKFRS 9 will be adopted in the Group’s consolidated financial statements
for financial year ending 31 March 2016 and that the application of this new standard may mainly
affect the classification and measurement of the Groups’ available-for-sale investments but may not
affect the classification and measurement of the Group’s other financial assets and liabilities based on
an analysis of the Group’s financial assets and financial liabilities as at 31 March 2012.
In June 2011, a package of five standards on consolidation, joint arrangements, associates and
disclosures was issued, including HKFRS 10, HKFRS 11, HKFRS 12, HKAS 27 (as revised in 2011) and
HKAS 28 (as revised in 2011).
Key requirements of these five standards are described below.
HKFRS 10 replaces the parts of HKAS 27 Consolidated and Separate Financial Statements that deal with
consolidated financial statements and HK(SIC) — Int 12 Consolidation — Special Purpose Entities. HKFRS
10 includes a new definition of control that contains three elements: (a) power over an investee, (b)
exposure, or rights, to variable returns from its involvement with the investee, and (c) the ability to use
its power over the investee to affect the amount of the investor’s returns. Extensive guidance has been
added in HKFRS 10 to deal with complex scenarios.
HKFRS 11 replaces HKAS 31 Interests in Joint Ventures and HK(SIC) — Int 13 Jointly Controlled Entities
— Non-Monetary Contributions by Venturers. HKFRS 11 deals with how a joint arrangement of which
two or more parties have joint control should be classified. Under HKFRS 11, joint arrangements are
classified as joint operations or joint ventures, depending on the rights and obligations of the parties to
the arrangements. In contrast, under HKAS 31, there are three types of joint arrangements: jointly
controlled entities, jointly controlled assets and jointly controlled operations.
58 Annual Report 2012
Notes to the Consolidated Financial StatementsFor the year ended 31 March 2012
2. Application of New and Revised Hong Kong Financial Reporting Standards (“HKFRSs”) (continued)
New and revised HKFRSs issued but not yet effective (continued)
In addition, joint ventures under HKFRS 11 are required to be accounted for using the equity method of
accounting, whereas jointly controlled entities under HKAS 31 can be accounted for using the equity
method of accounting or proportionate accounting.
HKFRS 12 is a disclosure standard and is applicable to entities that have interests in subsidiaries, joint
arrangements, associates and/or unconsolidated structured entities. In general, the disclosure
requirements in HKFRS 12 are more extensive than those in the current standards.
These five standards are effective for annual periods beginning on or after 1 January 2013. Earlier
application is permitted provided that all of these five standards are applied early at the same time.
The directors anticipate that these five standards will be adopted in the Group’s consolidated financial
statements for the annual period beginning 1 April 2013. The directors of the Company anticipate that
the application of these new standards and amendments will have no significant impact on the Group’s
consolidated financial statements.
Amendments to HKAS 1 Presentation of Items of Other Comprehensive Income
The amendments to HKAS 1 retain the option to present profit or loss and other comprehensive income
in either a single statement or in two separate but consecutive statements. However, the amendments
to HKAS 1 require additional disclosures to be made in the other comprehensive income section such
that items of other comprehensive income are grouped into two categories: (a) items that will not be
reclassified subsequently to profit or loss; and (b) items that may be reclassified subsequently to profit or
loss when specific conditions are met. Income tax on items of other comprehensive income is required
to be allocated on the same basis.
The amendments to HKAS 1 are effective for annual periods beginning on or after 1 July 2012. The
presentation of items of other comprehensive income will be modified accordingly when the
amendments are applied in the future accounting periods.
The directors of the Company anticipate that the application of the other new and revised standards,
amendments and interpretations will have no material impact on the consolidated financial statements.
59CST Mining Group Limited
3. Significant Accounting PoliciesThe consolidated financial statements have been prepared in accordance with HKFRSs issued by the
HKICPA. In addition, the consolidated financial statements include applicable disclosures required by the
Rules Governing the Listing of Securities on the Stock Exchange and by the Hong Kong Companies
Ordinance.
The consolidated financial statements have been prepared on the historical cost basis, except for the
investment properties and certain financial instruments, which are measured at fair values, as explained
in the accounting policies set out below. Historical cost is generally based on the fair value of the
consideration given in exchange for goods.
The principal accounting policies are set out below.
Basis of consolidation
The consolidated financial statements incorporate the financial statements of the Company and entities
controlled by the Company (its subsidiaries). Control is achieved where the Company has the power to
govern the financial and operating policies of an entity so as to obtain benefits from its activities.
The results of subsidiaries acquired or disposed of during the year are included in the consolidated
statement of comprehensive income from the effective date of acquisition or up to the effective date of
disposal, as appropriate.
Where necessary, adjustments are made to the financial statements of subsidiaries to bring their
accounting policies into line with those used by other members of the Group.
All intra-group transactions, balances, income and expenses are eliminated in full on consolidation.
Non-controlling interests in subsidiaries are presented separately from the Group’s equity therein.
Allocation of total comprehensive income to non-controlling interests
Total comprehensive income and expense of a subsidiary is attributed to the owners of the Company
and to the non-controlling interests even if this results in the non-controlling interests having a deficit
balance (effective form 1 April 2010 onwards).
60 Annual Report 2012
Notes to the Consolidated Financial StatementsFor the year ended 31 March 2012
3. Significant Accounting Policies (continued) Business combinations
Acquisitions of businesses are accounted for using the acquisition method. The consideration transferred
in a business combination is measured at fair value, which is calculated as the sum of the acquisition-
date fair values of the assets transferred by the Group, liabilities incurred by the Group to the former
owners of the acquiree and the equity interests issued by the Group in exchange for control of the
acquiree. Acquisition-related costs are generally recognised in profit or loss as incurred.
At the acquisition date, the identifiable assets acquired and the liabilities assumed are recognised at their
fair value at the acquisition date.
Non-controlling interests that are present ownership interests and entitle their holders to a proportionate
share of the entity’s net assets in the event of liquidation may be initially measured either at fair value
or at the non-controlling interests’ proportionate share of the recognised amounts of the acquiree’s
identifiable net assets.
Where the consideration transferred by the Group in a business combination includes assets or liabilities
resulting from a contingent consideration arrangement, the contingent consideration is measured at its
acquisition-date fair value and considered as part of the consideration transferred in a business
combination. Changes in the fair value of the contingent consideration that qualify as measurement
period adjustments are adjusted retrospectively, with the corresponding adjustments made against
goodwill. Measurement period adjustments are adjustments that arise from additional information
obtained during the “measurement period” (which cannot exceed one year from the acquisition date)
about facts and circumstances that existed at the acquisition date.
The subsequent accounting for changes in the fair value of the contingent consideration that do not
qualify as measurement period adjustments depends on how the contingent consideration is classified.
Contingent consideration that is classified as equity is not remeasured at subsequent reporting dates and
its subsequent settlement is accounted for within equity. Contingent consideration that is classified as an
asset or a liability is remeasured at subsequent reporting dates in accordance with HKAS 39, or HKAS
37 Provisions, Contingent Liabilities and Contingent Assets, as appropriate, with the corresponding gain
or loss being recognised in profit or loss.
61CST Mining Group Limited
3. Significant Accounting Policies (continued) Jointly controlled entities
A joint venture is a contractual arrangement whereby two or more parties undertake economic activities
that are subject to joint control. Joint venture arrangement that involves the establishment of a separate
entity in which the Group has an interest are referred to as jointly controlled entities.
The Group recognises its interests in jointly controlled entities using the proportionate consolidation,
whereby the Group’s share of each of the assets, liabilities, income and expenses of the jointly
controlled entities are combined with the Group’s similar items, line by line, in the consolidated financial
statements.
Non-current assets held for sale
Non-current assets and disposal groups are classified as held for sale if their carrying amount will be
recovered principally through a sale transaction rather than through continuing use. This condition is
regarded as met only when the sale is highly probable and the non-current asset (or disposal groups) is
available for immediate sale in its present condition. Management must be committed to the sale, which
should be expected to qualify for recognition as a completed sale within one year from the date of
classification.
When the Group is committed to a sale plan involving loss of control of a subsidiary, all of the assets
and liabilities of that subsidiary are classified as held for sale when the criteria described above are met,
regardless of whether the Group will retain a non-controlling interest in its former subsidiary after the
sale.
Non-current assets (and disposal groups) classified as held for sale are measured at the lower of their
previous carrying amount and fair value less costs to sell.
Revenue recognition
Revenue, being amounts receivable for goods sold in the normal course of business, excludes discounts
and any applicable sales taxes, is recognised at the fair value of the consideration received or receivable
to the extent that it is probable that economic benefits will flow to the Group and the revenues and
costs can be reliably measured. Revenue is recognised when the seller has transferred to the buyer
significant risks and rewards of ownership of the goods sold, and the Group retains neither continuing
managerial involvement to the degree usually associated with ownership nor effective control over the
goods sold.
Dividend income from financial assets at fair value through profit or loss and available-for-sale
investments is recognised when the Group’s rights to receive payment have been established.
Rental income from operating leases is recognised in profit or loss on a straight-line basis over the term
of the relevant leases.
Interest income from a financial asset is recognised when it is probable that the economic benefits will
flow to the Group and the amount of revenue can be measured reliably. Interest income from a
financial asset is accrued on a time basis, by reference to the principal outstanding and at the effective
interest rate applicable, which is the rate that exactly discounts the estimated future cash receipts
through the expected life of the financial asset to that asset’s net carrying amount on initial recognition.
62 Annual Report 2012
Notes to the Consolidated Financial StatementsFor the year ended 31 March 2012
3. Significant Accounting Policies (continued) Property, plant and equipment
Property, plant and equipment are stated at cost, being the fair value of the consideration given to
acquire or construct the asset, including directly attributable costs required to bring the asset to the
location or to a condition necessary for operation, the direct cost of dismantling and removing the asset
and the cost to restore and rehabilitate the mine environment, less accumulated depreciation and any
accumulated impairment losses.
Where an item of property, plant and equipment comprises major components with different useful
lives, the components are accounted for as separate items of property, plant and equipment.
Expenditures incurred to replace a component of an item of property, plant and equipment that is
accounted for separately, including major inspection and overhaul expenditures, are capitalised.
Management reviews the estimated useful lives, residual values and depreciation methods of the Group’s
property, plant and equipment at the end of each reporting period and when events and circumstances
indicate that such a review should be made. Changes to estimated useful lives, residual values or
depreciation methods resulting from such review are accounted for prospectively.
An item of property, plant and equipment is derecognised upon disposal or when no future economic
benefits are expected to arise from the continued use of the asset. Any gain or loss arising on the
disposal or retirement of an item of property, plant and equipment is determined as the difference
between the sales proceeds and the carrying amount of the asset and is recognised in profit or loss.
Exploration and evaluation assets
Exploration and evaluation expenditure relates to expenditure incurred on the exploration and evaluation
of potential mineral resources, such as costs of researching and analysing historical exploration data,
exploratory drilling, trenching, sampling and the costs of feasibility studies.
Exploration and evaluation expenditure incurred in respect of each area of interest, other than that
acquired through a business combination, is charged to profit or loss as incurred. However, when the
expenditure is expected to be recouped from future exploitation or from sale of the area of interest and
it is planned to continue with active and significant operations in relation to the area, or at the
reporting period end, the activity has not reached a stage which permits a reasonable assessment of the
existence of commercially recoverable reserves and resources, the expenditure is capitalised and included
as a component in property, plant and equipment. Exploration and evaluation assets are recognised at
their fair value at acquisition date if it is acquired through a business combination.
Exploration and evaluation assets are measured at cost and assessed for impairment if:
• sufficient data exists to determine technical feasibility and commercial viability; or
• facts and circumstances suggest that the carrying amount exceeds the recoverable amount.
Where a potential impairment is indicated, an assessment is performed for each area of interest or at
the cash generating unit level. To the extent that capitalised expenditure is not expected to be
recovered, it is charged to the statement of income.
63CST Mining Group Limited
3. Significant Accounting Policies (continued) Property, plant and equipment (continued)
Exploration and evaluation assets (continued)
No amortisation is provided in respect of exploration and evaluation assets until they are reclassified as
mine property and development assets following the commencement of commercial production.
When economically recoverable mineral resources have been identified and are reasonably assured,
exploration and evaluation assets previously capitalised are first tested for impairment and then
reclassified to mine property and development assets included in property, plant and equipment.
Mine property and development assets
The distinction between mining expenditures and expenditures incurred to develop new orebodies or to
develop mine areas in advance of current production is mainly based on the mining area. For those
areas being developed which will be mined in future periods, the expenditures incurred, including costs
transferred from exploration and evaluation assets, are capitalised and depleted when the related mining
area is mined as compared to current production areas where development costs are expensed as
incurred.
Capitalisation of costs incurred ceases when the related mining property and development assets have
reached production levels intended by management. Incidental costs to bring mineral assets to the
condition necessary for it to be capable of operating in the manner intended by management are
capitalised.
When future economic benefits are established by further development expenditure in respect of an area
of interest in production, such expenditure is carried forward as part of the cost of that mine property.
Otherwise such expenditure is classified as part of the cost of production.
Depreciation of mine property and development assets and plant and equipment in area of interest in
production is provided for using the unit of production method. The unit of production basis results in a
charge proportional to the depletion of estimated recoverable copper contained in proved and probable
ore reserves. The amortisation charge is allocated to inventory throughout the production processes from
the point at which ore is extracted from the pit until the ore is processed into copper cathode. The
proven and probable reserve is determined for each area of interest, with an area-of-interest defined as
an individual ore body or pit.
Where a change in estimated recoverable copper tonnage contained in proved and probable ore reserves
is made, adjustments to depreciation and amortisation of mine properties are accounted for
prospectively.
For open-pit operations the removal of overburden or waste ore is required to obtain access to the
orebody. Stripping costs incurred in the development of a mine (or pit) are capitalised as part of the
mine property and development assets and are subsequently amortised over the life of the mine (or pit)
on a unit of production basis.
64 Annual Report 2012
Notes to the Consolidated Financial StatementsFor the year ended 31 March 2012
3. Significant Accounting Policies (continued) Property, plant and equipment (continued)
Leasehold land and buildings
When a lease includes both land and building elements, the Group assesses the classification of each
element as a finance or an operating lease separately based on the assessment as to whether
substantially all the risks and rewards incidental to ownership of each element have been transferred to
the Group. Specifically, the minimum lease payments (including any lump-sum upfront payments) are
allocated between the land and the building elements in proportion to the relative fair values of the
leasehold interests in the land element and building element of the lease at the inception of the lease.
To the extent the allocation of the lease payments can be made reliably, interest in leasehold land that
is classified as an operating lease is presented as “prepaid lease payments” in the consolidated
statement of financial position and is amortised over the lease term on a straight-line basis except for
those that are classified and accounted for as investment properties under fair value model.
Capital work in progress
Capital work in progress includes property, plant and equipment in the course of construction for
production or for its own use purposes. Capital work in progress is carried at costs less any recognised
impairment loss. Costs include professional fees and, for qualifying assets, borrowing costs capitalised in
accordance with the Group’s accounting policy. Capital work in progress is classified to the appropriate
category of property, plant and equipment when completed and ready for intended use. Depreciation of
these assets, on the same basis as other property assets, commences when the assets are ready for their
intended use.
Depreciation
Property, plant and equipment is depreciated to its estimated residual value over the estimated useful
life of the specific asset concerned, or the estimated remaining life of the associated mine, field or
lease, if shorter. Depreciation commences when the asset is available for use.
Mine properties and development assets are depreciated using the unit of production method based on
the estimated total recoverable copper contained in proven and probable reserves at the related mine
when the production level intended by management has been reached.
The production level intended by management is considered to be reached when operational
commissioning of major mine and plant components is completed, operating results are being achieved
consistently for a period of time and there are indicators that these operating results will be sustained.
Other factors include one or more of the following:
• A significant utilisation rate of plant capacity has been achieved; and
• A pre-determined, reasonable period of time of stable operation has passed.
65CST Mining Group Limited
3. Significant Accounting Policies (continued) Property, plant and equipment (continued)
Depreciation (continued)
Management reviews the estimated total recoverable copper contained in proven and probable reserves
at the end of each reporting period and when events and circumstances indicate that such a review
should be made. Changes to estimated total recoverable copper contained in proven and probable
reserves are accounted for prospectively.
Capital work in progress are not depreciated until they are substantially complete and available for their
intended use.
Other property, plant and equipment items are depreciated on a straight-line basis over their estimated
useful life.
Investment properties
Investment properties are properties held to earn rentals and/or for capital appreciation.
Investment properties are initially measured at cost, including any directly attributable expenditure.
Subsequent to initial recognition, investment properties are measured at their fair values. Gains or losses
arising from changes in the fair value of investment property are included in profit or loss for the period
in which they arise.
An investment property is derecognised upon disposal or when the investment property is permanently
withdrawn from use and no future economic benefits are expected from its disposal. Any gain or loss
arising on derecognition of the asset (calculated as the difference between the net disposal proceeds
and the carrying amount of the asset) is included in profit or loss in the period in which the item is
derecognised.
Inventories
Inventories are valued at the lower of weighted average production cost or net realisable value. Copper
in process inventory consists of copper contained in mineral ores, the ore on leach pads and in-circuit
material within processing operations.
66 Annual Report 2012
Notes to the Consolidated Financial StatementsFor the year ended 31 March 2012
3. Significant Accounting Policies (continued) Financial instruments
Financial assets and financial liabilities are recognised on the consolidated statement of financial position
when a group entity becomes a party to the contractual provisions of the instrument. Financial assets
and financial liabilities are initially measured at fair value. Transaction costs that are directly attributable
to the acquisition or issue of financial assets and financial liabilities (other than financial assets or
financial liabilities at fair value through profit or loss) are added to or deducted from the fair value of
the financial assets or financial liabilities, as appropriate, on initial recognition. Transaction costs directly
attributable to the acquisition of financial assets or financial liabilities at fair value through profit or loss
are recognised immediately in profit or loss.
Financial assets
The Group’s financial assets are mainly classified into financial assets at fair value through profit or loss
(“FVTPL”), loans and receivables and available-for-sale financial assets. The classification depends on the
nature and purpose of the financial assets and is determined at the time of initial recognition. All
regular way purchases or sales of financial assets are recognised and derecognised on a trade date basis.
Regular way purchases or sales are purchases or sales of financial assets that require delivery of assets
within the time frame established by regulation or convention in the marketplace.
Effective interest method
The effective interest method is a method of calculating the amortised cost of a financial asset and of
allocating interest income over the relevant period. The effective interest rate is the rate that exactly
discounts estimated future cash receipts (including all fees paid or received that form an integral part of
the effective interest rate, transaction costs and other premiums or discounts) through the expected life
of the financial asset, or, where appropriate, a shorter period to the net carrying amount on initial
recognition.
Financial assets at fair value through profit or loss
Financial assets at FVTPL comprise of financial assets held for trading.
A financial asset is classified as held for trading if:
• it has been acquired principally for the purpose of selling in the near future; or
• it is a part of an identified portfolio of financial instruments that the Group manages together and
has a recent actual pattern of short-term profit-taking; or
• it is a derivative that is not designated and effective as a hedging instrument.
Financial assets at FVTPL are measured at fair value, with changes in fair value arising from
remeasurement recognised directly in profit or loss in the period in which they arise. The net gain or
loss recognised in profit or loss excludes any dividend or interest earned on the financial assets.
Loans and receivables
Loans and receivables are non-derivative financial assets with fixed or determinable payments that are
not quoted in an active market. Subsequent to initial recognition, loans and receivables (including trade
and other receivables and bank balances and cash) are carried at amortised cost using the effective
interest method, less any identified impairment losses.
67CST Mining Group Limited
3. Significant Accounting Policies (continued) Financial instruments (continued)
Financial assets (continued)
Available-for-sale financial assets
Available-for-sale financial assets are non-derivatives that are either designated or not classified as
financial assets at FVTPL, loans and receivables or held-to-maturity investments.
Available-for-sale financial assets are measured at fair value at the end of the reporting period. Changes
in fair value are recognised in other comprehensive income and accumulated in investment revaluation
reserve, until the financial asset is disposed of or is determined to be impaired, at which time, the
cumulative gain or loss previously accumulated in the investment revaluation reserve is reclassified to
profit or loss.
For available-for-sale equity investments that do not have a quoted market price in an active market and
whose fair value cannot be reliably measured and derivatives that are linked to and must be settled by
delivery of such unquoted equity instruments, they are measured at cost less any identified impairment
losses at the end of the reporting period.
Impairment of financial assets
Financial assets, other than those at FVTPL, are assessed for indicators of impairment at the end of the
reporting period. Financial assets are considered to be impaired where there is objective evidence that,
as a result of one or more events that occurred after the initial recognition of the financial asset, the
estimated future cash flows of the financial assets have been affected.
For an available-for-sale equity investment, a significant or prolonged decline in the fair value of that
investment below its cost is considered to be objective evidence of impairment.
For all other financial assets, objective evidence of impairment could include:
• significant financial difficulty of the issuer or counterparty; or
• breach of contract, such as default or delinquency in interest or principal payments; or
• it becoming probable that the borrower will enter bankruptcy or financial re-organisation; or
• the disappearance of an active market of that financial asset because of financial difficulties.
For financial assets carried at amortised cost, the amount of the impairment loss recognised is the
difference between the asset’s carrying amount and the present value of the estimated future cash flows
discounted at the original effective interest rate.
For financial assets carried at cost, the amount of the impairment loss is measured as the difference
between the asset’s carrying amount and the present value of the estimated future cash flows
discounted at the current market rate of return for a similar financial asset. Such impairment loss will
not be reversed in subsequent periods.
68 Annual Report 2012
Notes to the Consolidated Financial StatementsFor the year ended 31 March 2012
3. Significant Accounting Policies (continued) Financial instruments (continued)
Financial assets (continued)
Impairment of financial assets (continued)
The carrying amount of the financial asset is reduced by the impairment loss directly for all financial
assets with the exception of trade receivables, where the carrying amount is reduced through the use of
an allowance account. When a trade receivable is considered uncollectible, it is written off against the
allowance account. Subsequent recoveries of amounts previously written off are credited to profit or
loss.
When an available-for-sale financial asset is considered to be impaired, cumulative gains or losses
previously recognised in other comprehensive income are reclassified to profit or loss in the period in
which the impairment takes place.
For financial assets measured at amortised cost, if, in a subsequent period, the amount of impairment
loss decreases and the decrease can be related objectively to an event occurring after the impairment
losses was recognised, the previously recognised impairment loss is reversed through profit or loss to the
extent that the carrying amount of the asset at the date the impairment is reversed does not exceed
what the amortised cost would have been had the impairment not been recognised.
Impairment losses on available-for-sale equity investments will not be reversed through profit or loss in
subsequent periods. Any increase in fair value subsequent to impairment loss is recognised directly in
other comprehensive income and accumulated in investment revaluation reserve. For available-for-sale
debt investments, impairment losses are subsequently reversed through profit or loss if an increase in the
fair value of the investment can be objectively related to an event occurring after the recognition of the
impairment loss.
Financial liabilities and equity instruments
Financial liabilities and equity instruments issued by a group entity are classified as either financial
liabilities or as equity in accordance with the substance of the contractual arrangements and the
definitions of a financial liability and an equity instrument.
Effective interest method
The effective interest method is a method of calculating the amortised cost of a financial liability and of
allocating interest expense over the relevant period. The effective interest rate is the rate that exactly
discounts estimated future cash payments (including all fees paid or received that form an integral part
of the effective interest rate, transaction costs and other premiums or discounts) through the expected
life of the financial liability, or, where appropriate, a shorter period, to the net carrying amount on
initial recognition.
Interest expense is recognised on an effective interest basis.
Financial liabilities
Financial liabilities, including trade and other payables and amount due to a non-controlling interest, are
measured at amortised cost, using the effective interest method.
69CST Mining Group Limited
3. Significant Accounting Policies (continued) Financial instruments (continued)
Financial liabilities and equity instruments (continued)
Equity instruments
An equity instrument is any contract that evidences a residual interest in the assets of the Group after
deducting all of its liabilities. Equity instruments issued by the Company are recorded at the proceeds
received, net of direct issue costs.
Repurchase of the Company’s own equity instruments is recognised and deducted directly in equity. No
gain or loss is recognised in profit or loss on the purchase, sale, issue or cancellation of the Company’s
own equity instruments.
Warrants
Warrants issued by the Company that will be settled by the exchange of a fixed amount of cash for a
fixed number of the Company’s own equity instruments are classified as an equity instrument.
For warrants issued to subscribers of the Company’s shares, the fair value of warrants on the date of
issue is recognised in equity (warrant reserve). The warrant reserve will be transferred to share capital
and share premium upon exercise of the warrants. Where the warrants remain unexercised at the expiry
date, the amount previously recognised in warrant reserve will be transferred to the accumulated losses.
Derivative financial instruments
Derivatives are initially recognised at fair value at the date a derivative contract is entered into and are
subsequently remeasured to their fair value at the end of the reporting period. The resulting gain or loss
is recognised in profit or loss immediately.
Derecognition
The Group derecognises a financial asset only when the contractual rights to the cash flows from the
asset expire, or when it transfers the financial asset and substantially all the risks and rewards of
ownership of the asset to another entity.
On derecognition of a financial asset in its entirety, the difference between the asset’s carrying amount
and the sum of the consideration received and receivable and the cumulative gain or loss that had been
recognised in other comprehensive income is recognised in profit or loss.
Financial liabilities are derecognised when, and only when, the Group’s obligations are discharged,
cancelled or expire. The difference between the carrying amount of the financial liability derecognised
and the consideration paid or payable is recognised in profit or loss.
70 Annual Report 2012
Notes to the Consolidated Financial StatementsFor the year ended 31 March 2012
3. Significant Accounting Policies (continued) Taxation
Income tax expense represents the sum of the tax currently payable and deferred tax.
The tax currently payable is based on taxable profit for the year. Taxable profit differs from profit as
reported in the consolidated statement of comprehensive income because it excludes items of income or
expense that are taxable or deductible in other years and it further excludes items that are never taxable
or deductible. The Group’s liability for current tax is calculated using tax rates that have been enacted
or substantively enacted by the end of the reporting period.
Deferred tax is recognised on temporary differences between the carrying amounts of assets and
liabilities in the consolidated financial statements and the corresponding tax base used in the
computation of taxable profit. Deferred tax liabilities are generally recognised for all taxable temporary
differences. Deferred tax assets are generally recognised for all deductible temporary difference to the
extent that it is probable that taxable profits will be available against which those deductible temporary
differences can be utilised. Such assets and liabilities are not recognised if the temporary difference
arises from goodwill or from the initial recognition (other than in a business combination) of other
assets and liabilities in a transaction that affects neither the taxable profit nor the accounting profit.
Deferred tax liabilities are recognised for taxable temporary differences associated with investments in
subsidiaries and a jointly controlled entity, except where the Group is able to control the reversal of the
temporary difference and it is probable that the temporary difference will not reverse in the foreseeable
future. Deferred tax assets arising from deductible temporary differences associated with such
investments are only recognised to the extent that it is probable that there will be sufficient taxable
profits against which to utilise the benefits of the temporary differences and they are expected to
reverse in the foreseeable future.
The carrying amount of deferred tax assets is reviewed at the end of the reporting period and reduced
to the extent that it is no longer probable that sufficient taxable profits will be available to allow all or
part of the asset to be recovered.
Deferred tax assets and liabilities are measured at the tax rates that are expected to apply in the period
in which the liability is settled or the asset is realised, based on tax rate (and tax laws) that have been
enacted or substantively enacted by the end of the reporting period.
The measurement of deferred tax liabilities and assets reflects the tax consequences that would follow
from the manner in which the Group expects, at the end of the reporting period, to recover or settle
the carrying amount of its assets and liabilities.
Current and deferred tax is recognised in profit or loss, except when it relates to items that are
recognised in other comprehensive income or directly in equity, in which case the current and deferred
tax are also recognised in other comprehensive income or directly in equity respectively. Where current
tax or deferred tax arises from the initial accounting for a business combination, the tax effect is
included in the accounting for the business combination.
71CST Mining Group Limited
3. Significant Accounting Policies (continued) Foreign currencies
In preparing the financial statements of each individual group entity, transactions in currencies other
than the functional currency of that entity (foreign currencies) are recorded in the respective functional
currency (i.e. the currency of the primary economic environment in which the entity operates) at the
rates of exchanges prevailing on the dates of the transactions. At the end of the reporting period,
monetary items denominated in foreign currencies are retranslated at the rates prevailing at that date.
Non-monetary items carried at fair value that are denominated in foreign currencies are retranslated at
the rates prevailing on the date when the fair value was determined. Non-monetary items that are
measured in terms of historical cost in a foreign currency are not retranslated.
Exchange differences arising on the settlement of monetary items, and on the retranslation of monetary
items, are recognised in profit or loss in the period in which they arise, except for exchange differences
arising on a monetary item that forms part of the Company’s net investment in a foreign operation, in
which case, such exchange differences are recognised in other comprehensive income and accumulated
in equity and will be reclassified from equity to profit or loss on disposal of the foreign operation.
Exchange differences arising on the retranslation of non-monetary items carried at fair value are included
in profit or loss for the period, except for exchange differences arising on the retranslation of non-
monetary items in respect of which gains and losses are recognised directly in other comprehensive
income, in which cases, the exchange differences are also recognised directly in other comprehensive
income.
For the purposes of presenting the consolidated financial statements, the assets and liabilities of the
Group’s foreign operations are translated into the presentation currency of the Group (i.e. USD) at the
rate of exchange prevailing at the end of the reporting period, and their income and expenses are
translated at the average exchange rates for the year, unless exchange rates fluctuate significantly during
the period, in which case, the exchange rates prevailing at the dates of transactions are used. Exchange
differences arising, if any, are recognised in other comprehensive income and accumulated in equity (the
translation reserve). Such exchange differences are recognised in profit or loss in the period in which the
foreign operation is disposed of.
Retirement benefit costs
Payments to the Mandatory Provident Fund Scheme are recognised as expense when employees have
rendered service entitling them to the contributions.
Defined contribution plans
Contributions to defined contribution superannuation plans are expensed when employees have rendered
service entitling them to the contributions.
Borrowing costs
Borrowing costs directly attributable to the acquisition, construction or production of qualifying assets,
which are assets that necessarily take a substantial period of time to get ready for their intended use or
sale, are added to the cost of those assets until such time as the assets are substantially ready for their
intended use or sale.
All other borrowing costs are recognised in profit or loss in the period in which they are incurred.
72 Annual Report 2012
Notes to the Consolidated Financial StatementsFor the year ended 31 March 2012
3. Significant Accounting Policies (continued) Operating leases
Leases are classified as operating leases whenever the terms of the lease do not transfer substantially all
the risks and rewards of ownership to the lessee.
The Group as lessor
Rental income from operating leases is recognised in profit or loss on a straight-line basis over the term
of the relevant lease.
The Group as lessee
Operating lease payments are recognised as an expense on a straight-line basis over the term of the
relevant lease.
In the event that lease incentives are received to enter into operating leases, such incentives are
recognised as a liability. The aggregate benefit of incentives is recognised as a reduction of rental
expense on a straight-line basis.
Impairment
Receivables and property, plant and equipment are reviewed for impairment whenever events or changes
in circumstances indicate the carrying value may not be recoverable. If there are indicators of
impairment, a review is undertaken to determine whether the carrying amounts are in excess of their
recoverable amounts. An asset’s recoverable amount is determined as the higher of its fair value less
costs to sell and its value in use. Such reviews are undertaken on an asset-by-asset basis, except where
assets do not generate cash flows independent of other assets, in which case the review is undertaken
at the cash generating unit level.
If the carrying amount of an asset exceeds its recoverable amount, an impairment loss is recorded in the
consolidated statement of comprehensive income to reflect the asset at the lower amount.
An impairment loss is reversed in the statement of income if there is a change in the estimates used to
determine the recoverable amount since the prior impairment loss was recognised. The carrying amount
is increased to the recoverable amount, but not beyond the carrying amount net of depreciation or
amortisation which would have arisen if the prior impairment loss had not been recognised.
Provisions
A provision is recognised when a present obligation (legal or constructive) has arisen as a result of a
past event and it is probable that a future outflow of resources will be required to settle the obligation,
provided that a reliable estimate can be made of the amount of the obligation.
If the effect of the time value of money is material, provisions are determined by discounting the
expected future cash flows at a pre-tax rate that reflects current market assessments of the time value
of money and, where appropriate, the risks specific to the liability. Where discounting is used, the
increase in the provision due to the passage of time is recognised as a finance cost in the statement of
comprehensive income.
73CST Mining Group Limited
3. Significant Accounting Policies (continued) Provision for mine rehabilitation cost
Provisions for the Group’s obligations for restoration, rehabilitation and environmental costs are based
on estimates of required expenditure at the mines in accordance with the relevant rules and regulations.
The Group estimates its liabilities for final reclamation and mine closure based upon detailed calculations
of the amount and timing of the future cash expenditure to perform the required work. Spending
estimates are escalated for inflation, then discounted at a discount rate that reflects current market
assessments of the time value of money and the risks specific to the liability such that the amount of
provision reflects the present value of the expenditures expected to be required to settle the obligation.
The expected timing of cash outflows of such mine rehabilitation cost is estimated based on the
expected completion date of the mine projects and is subject to any significant changes to the
production plan.
Share-based payment transactions
Equity settled share-based payment transactions
Share options granted to directors and employees of the Company
The fair value of services received determined by reference to the fair value of share options granted at
the grant date is expensed on a straight-line basis over the vesting period, with a corresponding increase
in equity (share options reserve).
At the end of each reporting period, the Group revises its estimates of the number of options that are
expect to ultimately vest. The impact of the revision of the original estimates, if any, is recognised in
profit and loss such that the cumulative expense reflects the revised estimated, with a corresponding
adjustment to share options reserve.
At the time when the share options are exercised, the amount previously recognised in share options
reserve will be transferred to share premium. When the share options are forfeited after the vesting
date or are still not exercised at the expiry date, the amount previously recognised in share options
reserve will be transferred to accumulated losses.
If the share options expire or lapse (due to termination of employment) after the vesting period, the
share options reserve is transferred directly to accumulated losses.
74 Annual Report 2012
Notes to the Consolidated Financial StatementsFor the year ended 31 March 2012
4. Key Sources of Estimation UncertaintyIn the application of the Group’s accounting policies, which are described in note 3, the directors of the
Company are required to make judgments, estimates and assumptions about the carrying amounts of
assets and liabilities that are not readily apparent from other sources. The estimates and associated
assumptions are based on historical experience and other factors that are considered to be relevant.
Actual results may differ from these estimates.
The estimates and underlying assumptions are reviewed on an ongoing basis. Revisions to accounting
estimates are recognised in the period in which the estimate is revised if the revision affects only that
period, or in the period of the revision and future periods if the revision affects both current and future
periods.
The key assumptions concerning the future, and other key sources of estimation uncertainty at the end
of the reporting period, that have a significant risk of causing a material adjustment to the carrying
amounts of assets within the next financial year, are discussed below:
Depreciation of mining property and development assets and other property, plant and equipment in relation to mining business
Mine property and development assets in area of interest where copper production commence, are
amortised using the unit of production method (the “UOP”). The calculation of the UOP rate of
amortisation, and therefore the amortisation charge for the year can fluctuate from initial estimates. This
could generally happen when there are significant changes in any of the factors or assumptions used in
estimating proven and probable reserves. Such changes in reserves could similarly impact the useful lives
of assets in relation to mining business which are depreciated on a straight-line basis but limited to the
life of that area of interest. Estimates of proven and probable reserves are prepared by experts in
extraction, geology and reserve determination. Assessments of UOP rates against the estimated reserve
base and the operating and development plan are performed regularly. As at 31 March 2012, mine
property and development assets is at carrying amount of US$105,539,000 (2011: US$358,308,000).
Impairment of property, plant and equipment, other than exploration and evaluation assets
Property, plant and equipment other than exploration and evaluation assets, are reviewed for impairment
whenever events or changes in circumstances indicate that the carrying value may not be fully
recoverable. If an asset’s recoverable amount is less than the asset’s carrying amount, an impairment loss
is recognised. Future cash flow estimates which are used to calculate the asset’s recoverable amount are
based on expectations about future operations primarily comprising estimates about production and sales
volumes, commodity prices, reserves, operating, rehabilitation and restoration costs and capital
expenditures. Changes in such estimates could impact recoverable values of these assets. Estimates are
reviewed regularly by management. As at 31 March 2012, property, plant and equipment other than
exploration and evaluation assets is at carrying amount of US$152,125,000 (2011: US$392,995,000).
Provision for mine rehabilitation cost
A provision for future rehabilitation cost requires estimates and assumptions to be made around the
relevant regulatory framework, the magnitude of the possible disturbance and the timing, extent and
costs of the required closure and rehabilitation activities. To the extent that the actual future costs differ
from these estimates, adjustments will be recorded and the consolidated statement of income could be
impacted. The provisions, including the estimates and assumptions contained therein are reviewed
regularly by management. As at 31 March 2012, provision for mine rehabilitation cost is at carrying
amount of US$18,063,000 (2011: US$17,587,000).
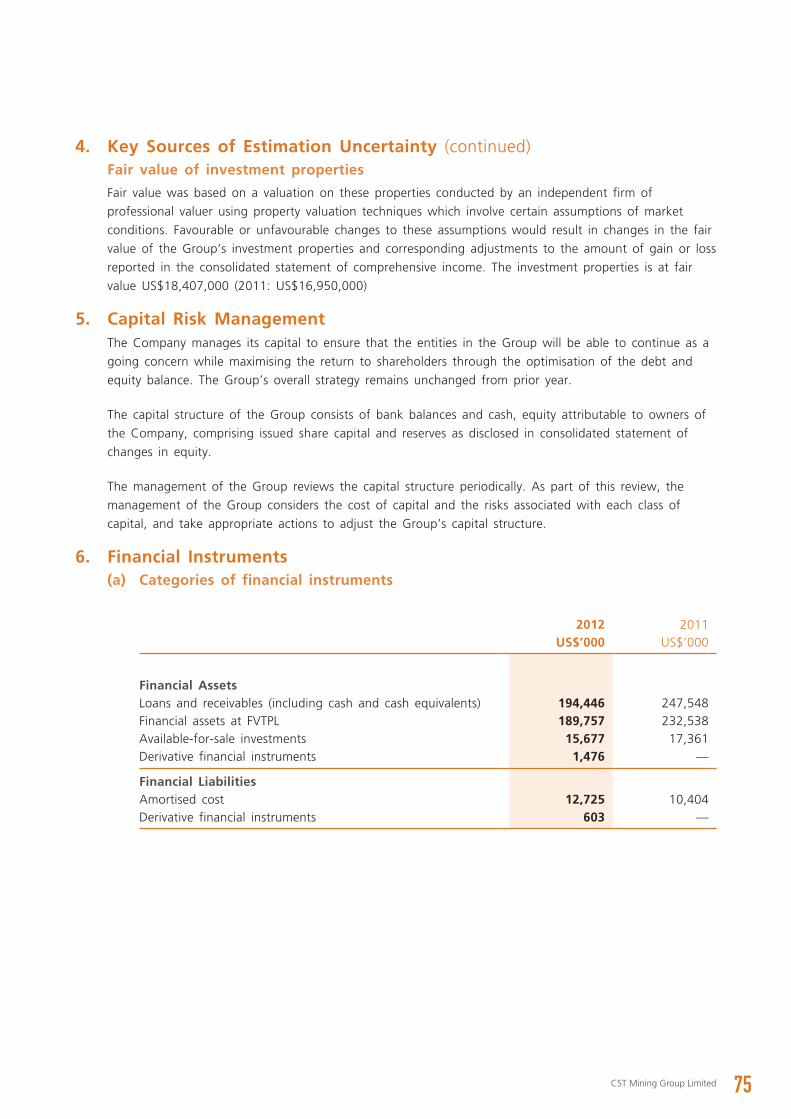
75CST Mining Group Limited
4. Key Sources of Estimation Uncertainty (continued) Fair value of investment properties
Fair value was based on a valuation on these properties conducted by an independent firm of
professional valuer using property valuation techniques which involve certain assumptions of market
conditions. Favourable or unfavourable changes to these assumptions would result in changes in the fair
value of the Group’s investment properties and corresponding adjustments to the amount of gain or loss
reported in the consolidated statement of comprehensive income. The investment properties is at fair
value US$18,407,000 (2011: US$16,950,000)
5. Capital Risk ManagementThe Company manages its capital to ensure that the entities in the Group will be able to continue as a
going concern while maximising the return to shareholders through the optimisation of the debt and
equity balance. The Group’s overall strategy remains unchanged from prior year.
The capital structure of the Group consists of bank balances and cash, equity attributable to owners of
the Company, comprising issued share capital and reserves as disclosed in consolidated statement of
changes in equity.
The management of the Group reviews the capital structure periodically. As part of this review, the
management of the Group considers the cost of capital and the risks associated with each class of
capital, and take appropriate actions to adjust the Group’s capital structure.
6. Financial Instruments (a) Categories of financial instruments
2012 2011US$’000 US$’000
Financial AssetsLoans and receivables (including cash and cash equivalents) 194,446 247,548Financial assets at FVTPL 189,757 232,538Available-for-sale investments 15,677 17,361Derivative financial instruments 1,476 —
Financial LiabilitiesAmortised cost 12,725 10,404Derivative financial instruments 603 —
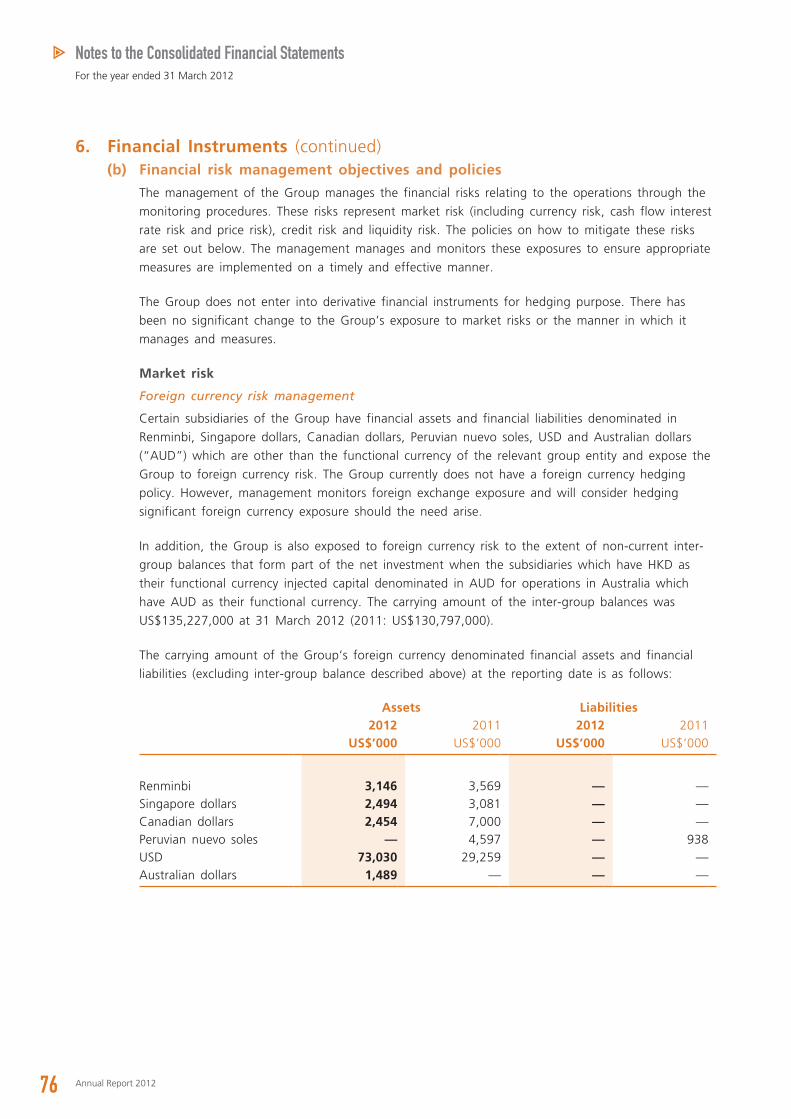
76 Annual Report 2012
Notes to the Consolidated Financial StatementsFor the year ended 31 March 2012
6. Financial Instruments (continued) (b) Financial risk management objectives and policies
The management of the Group manages the financial risks relating to the operations through the
monitoring procedures. These risks represent market risk (including currency risk, cash flow interest
rate risk and price risk), credit risk and liquidity risk. The policies on how to mitigate these risks
are set out below. The management manages and monitors these exposures to ensure appropriate
measures are implemented on a timely and effective manner.
The Group does not enter into derivative financial instruments for hedging purpose. There has
been no significant change to the Group’s exposure to market risks or the manner in which it
manages and measures.
Market risk
Foreign currency risk management
Certain subsidiaries of the Group have financial assets and financial liabilities denominated in
Renminbi, Singapore dollars, Canadian dollars, Peruvian nuevo soles, USD and Australian dollars
(“AUD”) which are other than the functional currency of the relevant group entity and expose the
Group to foreign currency risk. The Group currently does not have a foreign currency hedging
policy. However, management monitors foreign exchange exposure and will consider hedging
significant foreign currency exposure should the need arise.
In addition, the Group is also exposed to foreign currency risk to the extent of non-current inter-
group balances that form part of the net investment when the subsidiaries which have HKD as
their functional currency injected capital denominated in AUD for operations in Australia which
have AUD as their functional currency. The carrying amount of the inter-group balances was
US$135,227,000 at 31 March 2012 (2011: US$130,797,000).
The carrying amount of the Group’s foreign currency denominated financial assets and financial
liabilities (excluding inter-group balance described above) at the reporting date is as follows:
Assets Liabilities2012 2011 2012 2011
US$’000 US$’000 US$’000 US$’000
Renminbi 3,146 3,569 — —Singapore dollars 2,494 3,081 — —Canadian dollars 2,454 7,000 — —Peruvian nuevo soles — 4,597 — 938USD 73,030 29,259 — —Australian dollars 1,489 — — —
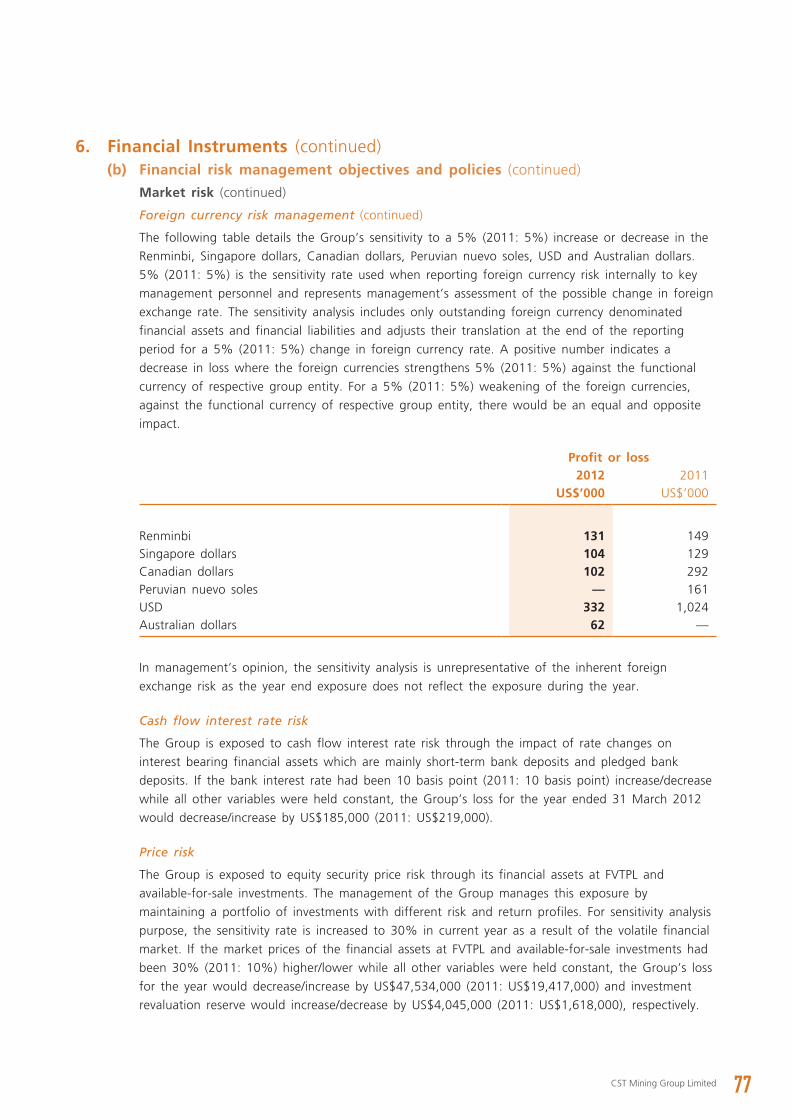
77CST Mining Group Limited
6. Financial Instruments (continued) (b) Financial risk management objectives and policies (continued)
Market risk (continued)
Foreign currency risk management (continued)
The following table details the Group’s sensitivity to a 5% (2011: 5%) increase or decrease in the
Renminbi, Singapore dollars, Canadian dollars, Peruvian nuevo soles, USD and Australian dollars.
5% (2011: 5%) is the sensitivity rate used when reporting foreign currency risk internally to key
management personnel and represents management’s assessment of the possible change in foreign
exchange rate. The sensitivity analysis includes only outstanding foreign currency denominated
financial assets and financial liabilities and adjusts their translation at the end of the reporting
period for a 5% (2011: 5%) change in foreign currency rate. A positive number indicates a
decrease in loss where the foreign currencies strengthens 5% (2011: 5%) against the functional
currency of respective group entity. For a 5% (2011: 5%) weakening of the foreign currencies,
against the functional currency of respective group entity, there would be an equal and opposite
impact.
Profit or loss2012 2011
US$’000 US$’000
Renminbi 131 149Singapore dollars 104 129Canadian dollars 102 292Peruvian nuevo soles — 161USD 332 1,024Australian dollars 62 —
In management’s opinion, the sensitivity analysis is unrepresentative of the inherent foreign
exchange risk as the year end exposure does not reflect the exposure during the year.
Cash flow interest rate risk
The Group is exposed to cash flow interest rate risk through the impact of rate changes on
interest bearing financial assets which are mainly short-term bank deposits and pledged bank
deposits. If the bank interest rate had been 10 basis point (2011: 10 basis point) increase/decrease
while all other variables were held constant, the Group’s loss for the year ended 31 March 2012
would decrease/increase by US$185,000 (2011: US$219,000).
Price risk
The Group is exposed to equity security price risk through its financial assets at FVTPL and
available-for-sale investments. The management of the Group manages this exposure by
maintaining a portfolio of investments with different risk and return profiles. For sensitivity analysis
purpose, the sensitivity rate is increased to 30% in current year as a result of the volatile financial
market. If the market prices of the financial assets at FVTPL and available-for-sale investments had
been 30% (2011: 10%) higher/lower while all other variables were held constant, the Group’s loss
for the year would decrease/increase by US$47,534,000 (2011: US$19,417,000) and investment
revaluation reserve would increase/decrease by US$4,045,000 (2011: US$1,618,000), respectively.

78 Annual Report 2012
Notes to the Consolidated Financial StatementsFor the year ended 31 March 2012
6. Financial Instruments (continued) (b) Financial risk management objectives and policies (continued)
Credit risk
The Group’s principal financial assets which are exposed to credit risk are trade receivables, other
receivables and bank balances and cash.
The Group’s maximum exposure to credit risk in the event of the counterparties failure to perform
their obligations at the end of the reporting period in relation to each class of recognised financial
assets is the carrying amount of those assets stated in the consolidated statement of financial
position. The Group reviews the recoverable amount of each individual receivable at the end of the
reporting period to ensure that adequate impairment losses, if necessary, are made for
irrecoverable amounts. In this regard, the directors of the Company consider that the Group’s
credit risk is significantly reduced.
The Group’s trade receivable is due from a single customer within the mining business segment.
The Group’s management monitor the debtor’s performance continuously to ensure the Group’s
exposure to credit risk is minimised.
Although the bank balances are concentrated on certain counterparties, the credit risk on liquid
funds is limited because the counterparties are banks with good reputation.
Liquidity risk
In the management of the liquidity risk, the Group monitors and maintain a level of cash and cash
equivalents deemed adequate by the management to finance the Group’s operations and mitigate
the effects of fluctuations in cash flows.
All of the Group’s financial liabilities have maturity dates of less than 180 days based on the
agreed repayment dates.
(c) Fair values of financial instruments
The fair values of financial assets and financial liabilities are determined as follows:
• the fair values of financial assets and financial liabilities with standard terms and conditions
and traded on active liquid markets are determined with reference to quoted market bid
prices and ask prices respectively;
• the fair value of the unlisted convertible note is determined by using the discounted cash
flows method at a market interest rate for the equivalent non-convertible note for its straight
debt component and using the binomial model for its derivative components;
• the fair value of the investment fund is determined with reference to the value of the
underlying assets of the funds which are provided by the counterparty financial institutions;
and
• the fair values of other financial assets and financial liabilities are determined in accordance
with generally accepted pricing models based on discounted cash flow analysis.
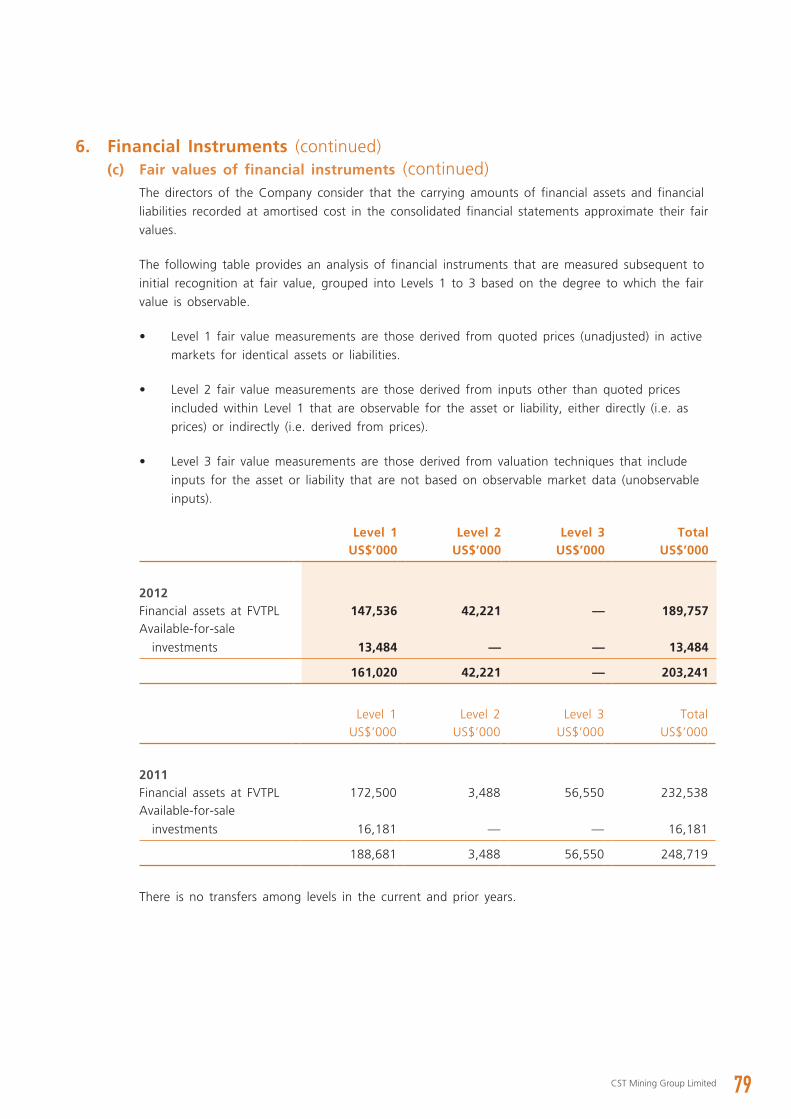
79CST Mining Group Limited
6. Financial Instruments (continued) (c) Fair values of financial instruments (continued)
The directors of the Company consider that the carrying amounts of financial assets and financial
liabilities recorded at amortised cost in the consolidated financial statements approximate their fair
values.
The following table provides an analysis of financial instruments that are measured subsequent to
initial recognition at fair value, grouped into Levels 1 to 3 based on the degree to which the fair
value is observable.
• Level 1 fair value measurements are those derived from quoted prices (unadjusted) in active
markets for identical assets or liabilities.
• Level 2 fair value measurements are those derived from inputs other than quoted prices
included within Level 1 that are observable for the asset or liability, either directly (i.e. as
prices) or indirectly (i.e. derived from prices).
• Level 3 fair value measurements are those derived from valuation techniques that include
inputs for the asset or liability that are not based on observable market data (unobservable
inputs).
Level 1 Level 2 Level 3 TotalUS$’000 US$’000 US$’000 US$’000
2012Financial assets at FVTPL 147,536 42,221 — 189,757Available-for-sale
investments 13,484 — — 13,484
161,020 42,221 — 203,241
Level 1 Level 2 Level 3 TotalUS$’000 US$’000 US$’000 US$’000
2011Financial assets at FVTPL 172,500 3,488 56,550 232,538Available-for-sale
investments 16,181 — — 16,181
188,681 3,488 56,550 248,719
There is no transfers among levels in the current and prior years.
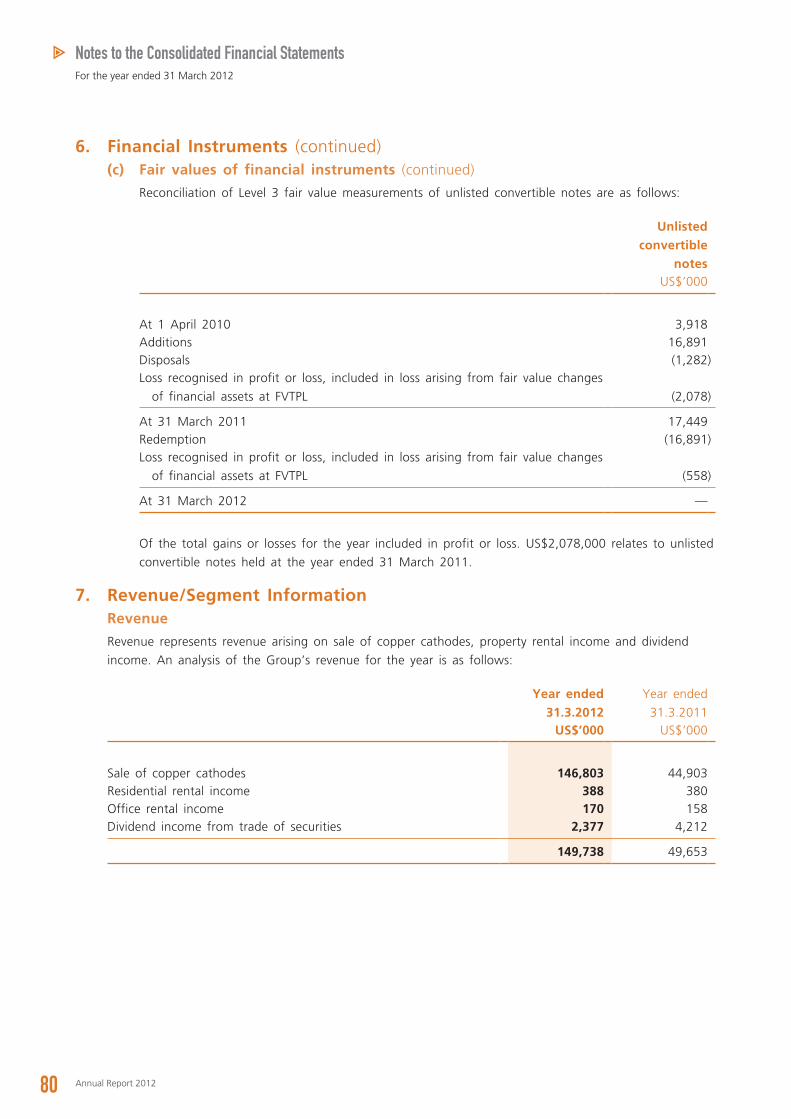
80 Annual Report 2012
Notes to the Consolidated Financial StatementsFor the year ended 31 March 2012
6. Financial Instruments (continued) (c) Fair values of financial instruments (continued)
Reconciliation of Level 3 fair value measurements of unlisted convertible notes are as follows:
Unlisted convertible
notesUS$’000
At 1 April 2010 3,918Additions 16,891Disposals (1,282)Loss recognised in profit or loss, included in loss arising from fair value changes
of financial assets at FVTPL (2,078)
At 31 March 2011 17,449Redemption (16,891)Loss recognised in profit or loss, included in loss arising from fair value changes
of financial assets at FVTPL (558)
At 31 March 2012 —
Of the total gains or losses for the year included in profit or loss. US$2,078,000 relates to unlisted
convertible notes held at the year ended 31 March 2011.
7. Revenue/Segment Information Revenue
Revenue represents revenue arising on sale of copper cathodes, property rental income and dividend
income. An analysis of the Group’s revenue for the year is as follows:
Year ended 31.3.2012
Year ended
31.3.2011US$’000 US$’000
Sale of copper cathodes 146,803 44,903Residential rental income 388 380Office rental income 170 158Dividend income from trade of securities 2,377 4,212
149,738 49,653
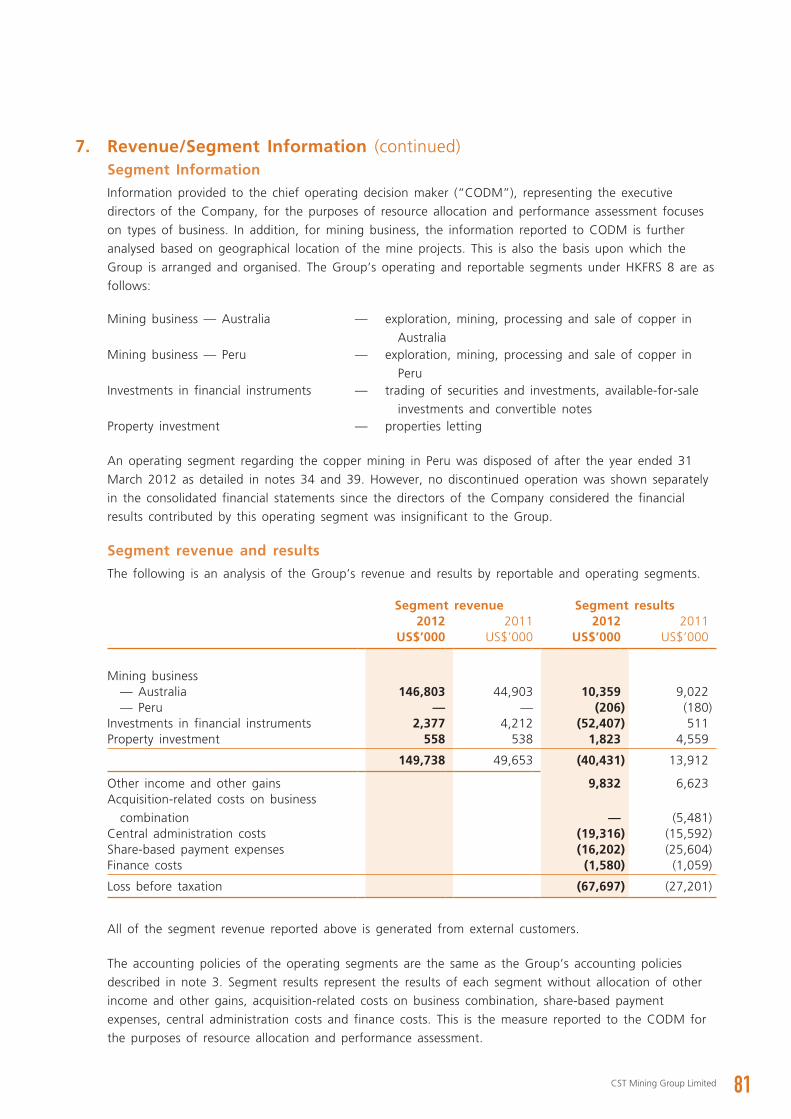
81CST Mining Group Limited
7. Revenue/Segment Information (continued) Segment Information
Information provided to the chief operating decision maker (“CODM”), representing the executive
directors of the Company, for the purposes of resource allocation and performance assessment focuses
on types of business. In addition, for mining business, the information reported to CODM is further
analysed based on geographical location of the mine projects. This is also the basis upon which the
Group is arranged and organised. The Group’s operating and reportable segments under HKFRS 8 are as
follows:
Mining business — Australia — exploration, mining, processing and sale of copper in
AustraliaMining business — Peru — exploration, mining, processing and sale of copper in
PeruInvestments in financial instruments — trading of securities and investments, available-for-sale
investments and convertible notesProperty investment — properties letting
An operating segment regarding the copper mining in Peru was disposed of after the year ended 31
March 2012 as detailed in notes 34 and 39. However, no discontinued operation was shown separately
in the consolidated financial statements since the directors of the Company considered the financial
results contributed by this operating segment was insignificant to the Group.
Segment revenue and results
The following is an analysis of the Group’s revenue and results by reportable and operating segments.
Segment revenue Segment results2012 2011 2012 2011
US$’000 US$’000 US$’000 US$’000
Mining business— Australia 146,803 44,903 10,359 9,022— Peru — — (206) (180)
Investments in financial instruments 2,377 4,212 (52,407) 511Property investment 558 538 1,823 4,559
149,738 49,653 (40,431) 13,912
Other income and other gains 9,832 6,623Acquisition-related costs on business
combination — (5,481)Central administration costs (19,316) (15,592)Share-based payment expenses (16,202) (25,604)Finance costs (1,580) (1,059)
Loss before taxation (67,697) (27,201)
All of the segment revenue reported above is generated from external customers.
The accounting policies of the operating segments are the same as the Group’s accounting policies
described in note 3. Segment results represent the results of each segment without allocation of other
income and other gains, acquisition-related costs on business combination, share-based payment
expenses, central administration costs and finance costs. This is the measure reported to the CODM for
the purposes of resource allocation and performance assessment.
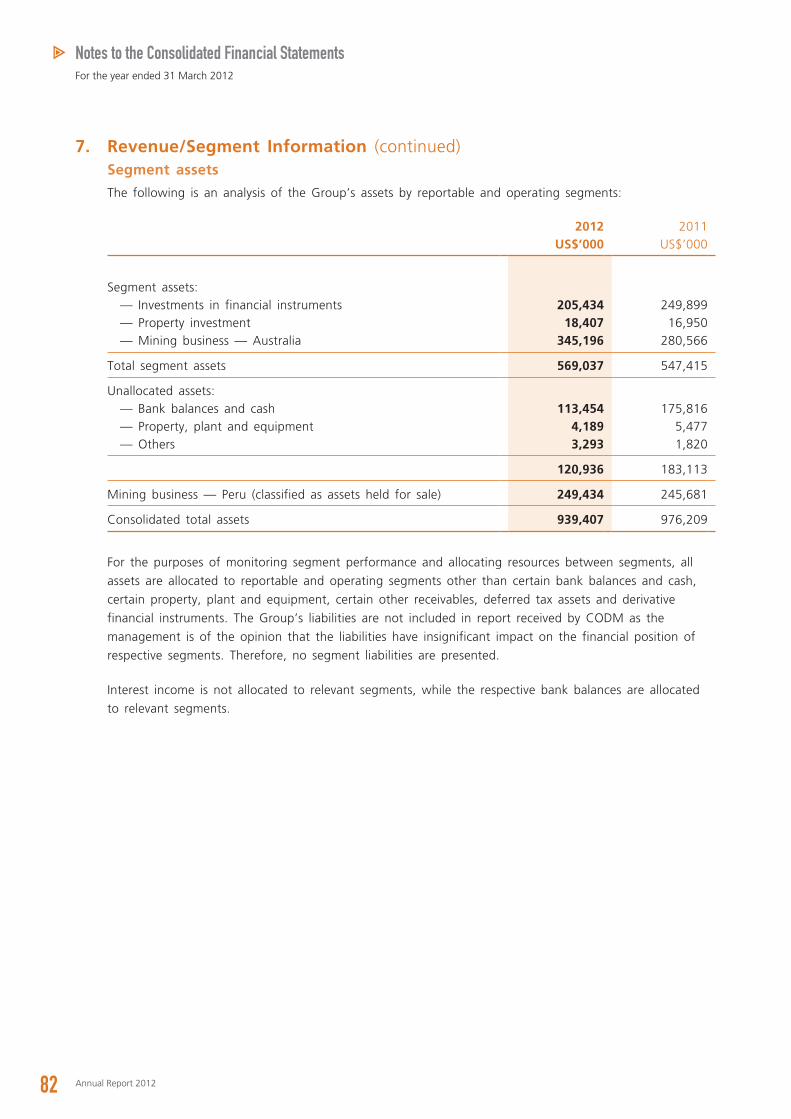
82 Annual Report 2012
Notes to the Consolidated Financial StatementsFor the year ended 31 March 2012
7. Revenue/Segment Information (continued) Segment assets
The following is an analysis of the Group’s assets by reportable and operating segments:
2012 2011US$’000 US$’000
Segment assets:— Investments in financial instruments 205,434 249,899— Property investment 18,407 16,950— Mining business — Australia 345,196 280,566
Total segment assets 569,037 547,415
Unallocated assets:— Bank balances and cash 113,454 175,816— Property, plant and equipment 4,189 5,477— Others 3,293 1,820
120,936 183,113
Mining business — Peru (classified as assets held for sale) 249,434 245,681
Consolidated total assets 939,407 976,209
For the purposes of monitoring segment performance and allocating resources between segments, all
assets are allocated to reportable and operating segments other than certain bank balances and cash,
certain property, plant and equipment, certain other receivables, deferred tax assets and derivative
financial instruments. The Group’s liabilities are not included in report received by CODM as the
management is of the opinion that the liabilities have insignificant impact on the financial position of
respective segments. Therefore, no segment liabilities are presented.
Interest income is not allocated to relevant segments, while the respective bank balances are allocated
to relevant segments.
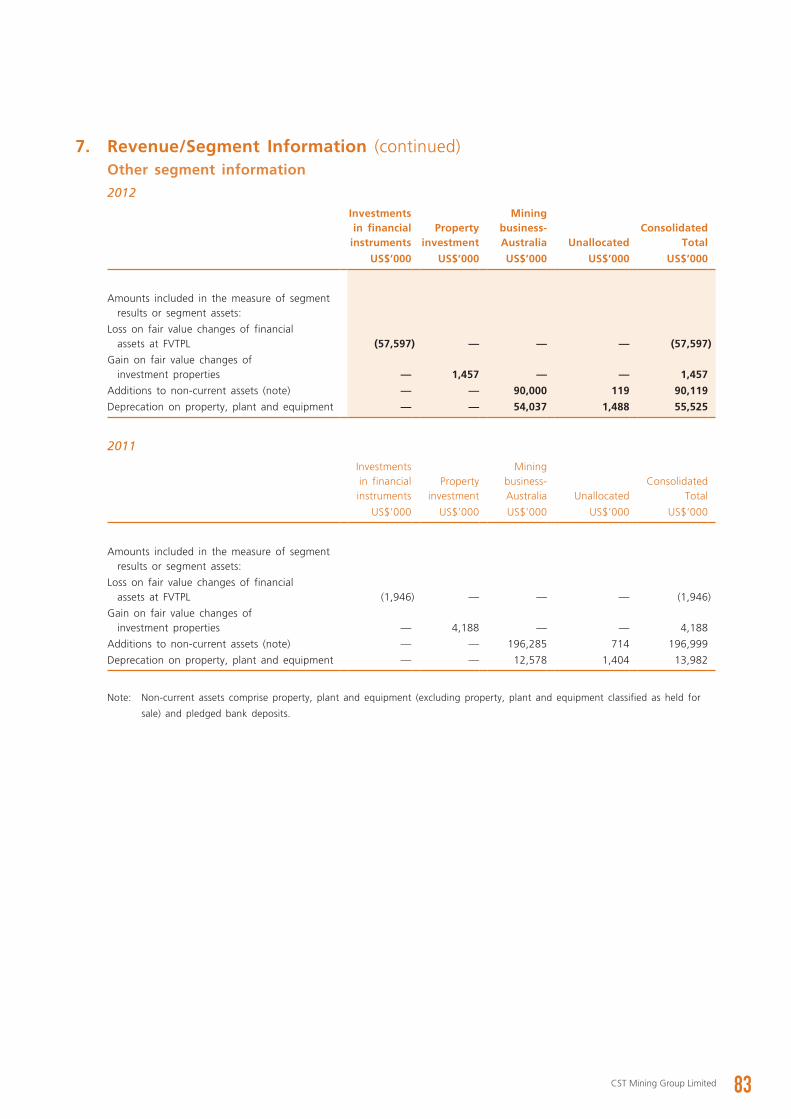
83CST Mining Group Limited
7. Revenue/Segment Information (continued) Other segment information
2012
Investments in financial
instrumentsProperty
investment
Mining business-Australia Unallocated
Consolidated Total
US$’000 US$’000 US$’000 US$’000 US$’000
Amounts included in the measure of segment results or segment assets:
Loss on fair value changes of financial assets at FVTPL (57,597) — — — (57,597)
Gain on fair value changes of investment properties — 1,457 — — 1,457
Additions to non-current assets (note) — — 90,000 119 90,119
Deprecation on property, plant and equipment — — 54,037 1,488 55,525
2011
Investments in financial instruments
Property investment
Mining business- Australia Unallocated
Consolidated Total
US$’000 US$’000 US$’000 US$’000 US$’000
Amounts included in the measure of segment results or segment assets:
Loss on fair value changes of financial assets at FVTPL (1,946) — — — (1,946)
Gain on fair value changes of investment properties — 4,188 — — 4,188
Additions to non-current assets (note) — — 196,285 714 196,999
Deprecation on property, plant and equipment — — 12,578 1,404 13,982
Note: Non-current assets comprise property, plant and equipment (excluding property, plant and equipment classified as held for
sale) and pledged bank deposits.
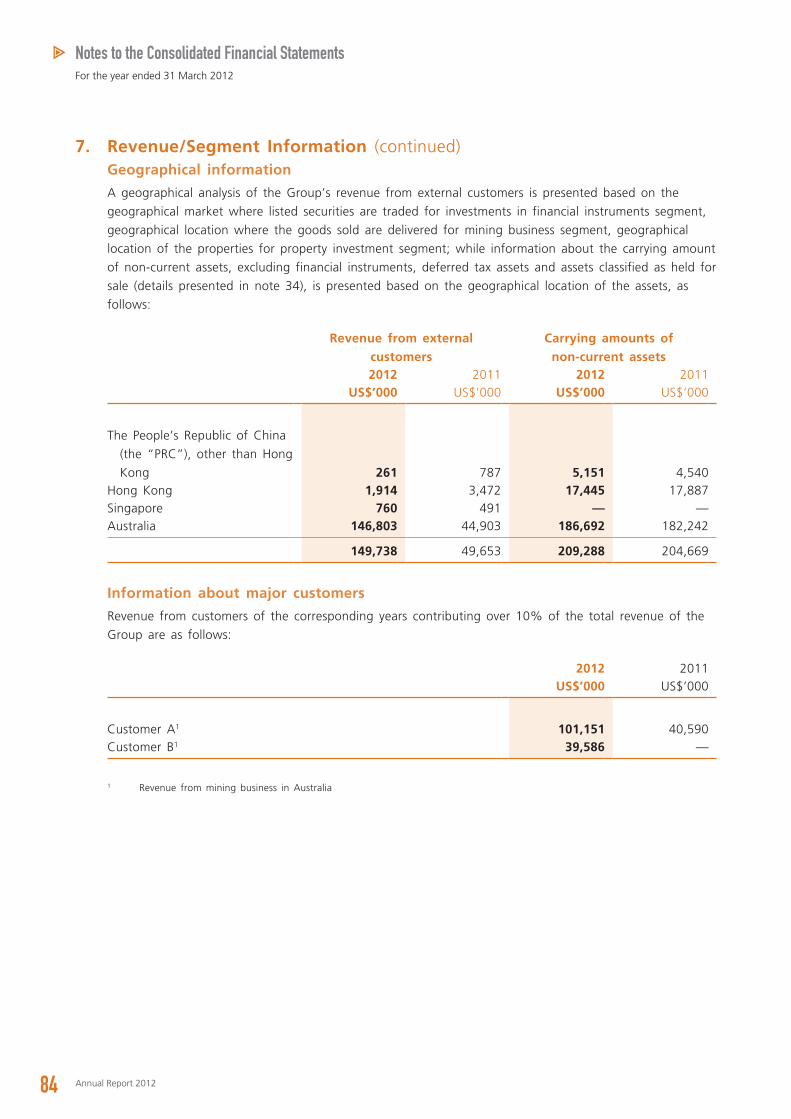
84 Annual Report 2012
Notes to the Consolidated Financial StatementsFor the year ended 31 March 2012
7. Revenue/Segment Information (continued) Geographical information
A geographical analysis of the Group’s revenue from external customers is presented based on the
geographical market where listed securities are traded for investments in financial instruments segment,
geographical location where the goods sold are delivered for mining business segment, geographical
location of the properties for property investment segment; while information about the carrying amount
of non-current assets, excluding financial instruments, deferred tax assets and assets classified as held for
sale (details presented in note 34), is presented based on the geographical location of the assets, as
follows:
Revenue from external customers
Carrying amounts of non-current assets
2012 2011 2012 2011US$’000 US$’000 US$’000 US$’000
The People’s Republic of China
(the “PRC”), other than Hong
Kong 261 787 5,151 4,540Hong Kong 1,914 3,472 17,445 17,887Singapore 760 491 — —Australia 146,803 44,903 186,692 182,242
149,738 49,653 209,288 204,669
Information about major customers
Revenue from customers of the corresponding years contributing over 10% of the total revenue of the
Group are as follows:
2012 2011US$’000 US$’000
Customer A1 101,151 40,590Customer B1 39,586 —
1 Revenue from mining business in Australia
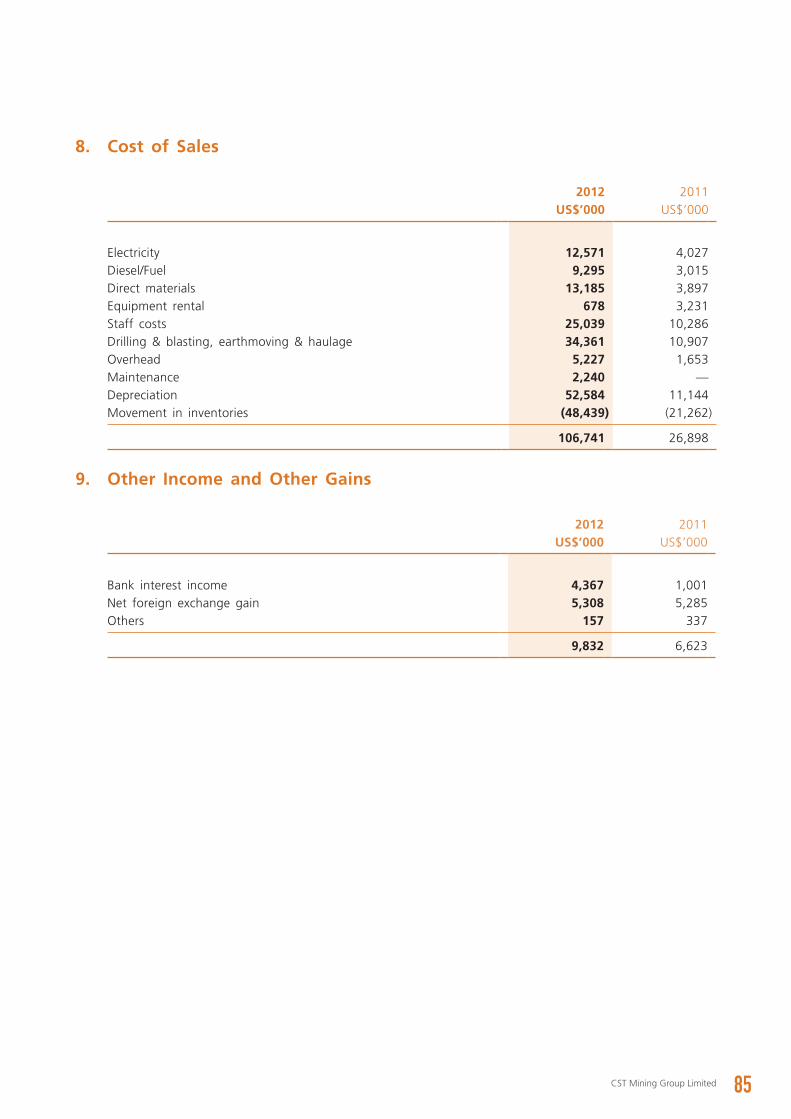
85CST Mining Group Limited
8. Cost of Sales
2012 2011US$’000 US$’000
Electricity 12,571 4,027Diesel/Fuel 9,295 3,015Direct materials 13,185 3,897Equipment rental 678 3,231Staff costs 25,039 10,286Drilling & blasting, earthmoving & haulage 34,361 10,907Overhead 5,227 1,653Maintenance 2,240 —Depreciation 52,584 11,144Movement in inventories (48,439) (21,262)
106,741 26,898
9. Other Income and Other Gains
2012 2011US$’000 US$’000
Bank interest income 4,367 1,001Net foreign exchange gain 5,308 5,285Others 157 337
9,832 6,623
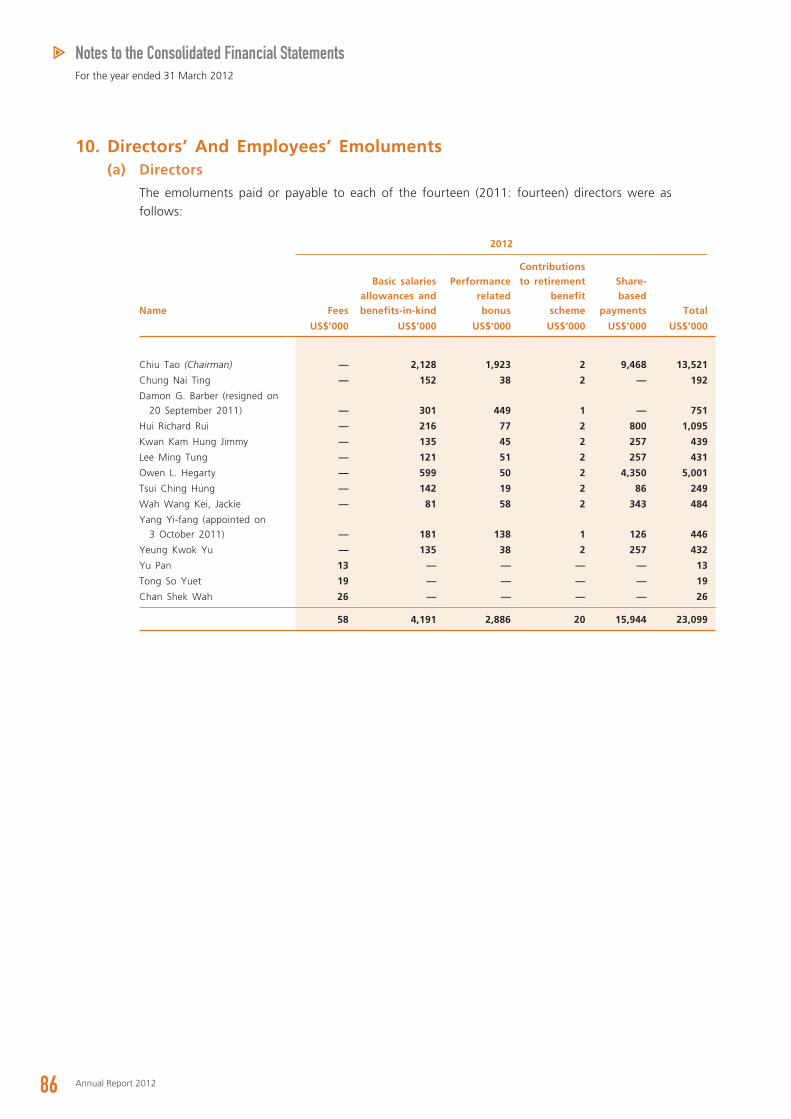
86 Annual Report 2012
Notes to the Consolidated Financial StatementsFor the year ended 31 March 2012
10. Directors’ And Employees’ Emoluments (a) Directors
The emoluments paid or payable to each of the fourteen (2011: fourteen) directors were as
follows:
2012
Name Fees
Basic salaries allowances and benefits-in-kind
Performance related bonus
Contributions to retirement
benefit scheme
Share-based
payments Total
US$’000 US$’000 US$’000 US$’000 US$’000 US$’000
Chiu Tao (Chairman) — 2,128 1,923 2 9,468 13,521
Chung Nai Ting — 152 38 2 — 192
Damon G. Barber (resigned on
20 September 2011) — 301 449 1 — 751
Hui Richard Rui — 216 77 2 800 1,095
Kwan Kam Hung Jimmy — 135 45 2 257 439
Lee Ming Tung — 121 51 2 257 431
Owen L. Hegarty — 599 50 2 4,350 5,001
Tsui Ching Hung — 142 19 2 86 249
Wah Wang Kei, Jackie — 81 58 2 343 484
Yang Yi-fang (appointed on
3 October 2011) — 181 138 1 126 446
Yeung Kwok Yu — 135 38 2 257 432
Yu Pan 13 — — — — 13
Tong So Yuet 19 — — — — 19
Chan Shek Wah 26 — — — — 26
58 4,191 2,886 20 15,944 23,099
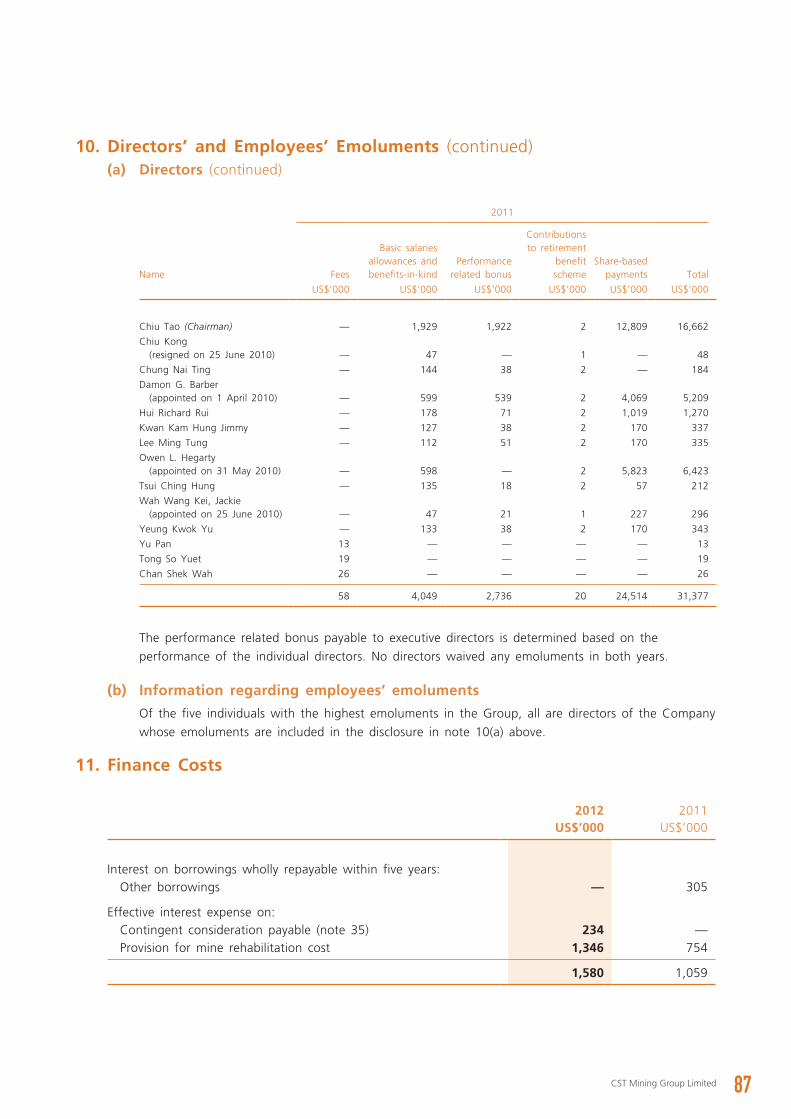
87CST Mining Group Limited
10. Directors’ and Employees’ Emoluments (continued) (a) Directors (continued)
2011
Name Fees
Basic salaries allowances and benefits-in-kind
Performance related bonus
Contributions to retirement
benefit scheme
Share-based payments Total
US$’000 US$’000 US$’000 US$’000 US$’000 US$’000
Chiu Tao (Chairman) — 1,929 1,922 2 12,809 16,662
Chiu Kong (resigned on 25 June 2010) — 47 — 1 — 48
Chung Nai Ting — 144 38 2 — 184
Damon G. Barber (appointed on 1 April 2010) — 599 539 2 4,069 5,209
Hui Richard Rui — 178 71 2 1,019 1,270
Kwan Kam Hung Jimmy — 127 38 2 170 337
Lee Ming Tung — 112 51 2 170 335
Owen L. Hegarty (appointed on 31 May 2010) — 598 — 2 5,823 6,423
Tsui Ching Hung — 135 18 2 57 212
Wah Wang Kei, Jackie (appointed on 25 June 2010) — 47 21 1 227 296
Yeung Kwok Yu — 133 38 2 170 343
Yu Pan 13 — — — — 13
Tong So Yuet 19 — — — — 19
Chan Shek Wah 26 — — — — 26
58 4,049 2,736 20 24,514 31,377
The performance related bonus payable to executive directors is determined based on the
performance of the individual directors. No directors waived any emoluments in both years.
(b) Information regarding employees’ emoluments
Of the five individuals with the highest emoluments in the Group, all are directors of the Company
whose emoluments are included in the disclosure in note 10(a) above.
11. Finance Costs
2012 2011US$’000 US$’000
Interest on borrowings wholly repayable within five years:Other borrowings — 305
Effective interest expense on:Contingent consideration payable (note 35) 234 —Provision for mine rehabilitation cost 1,346 754
1,580 1,059
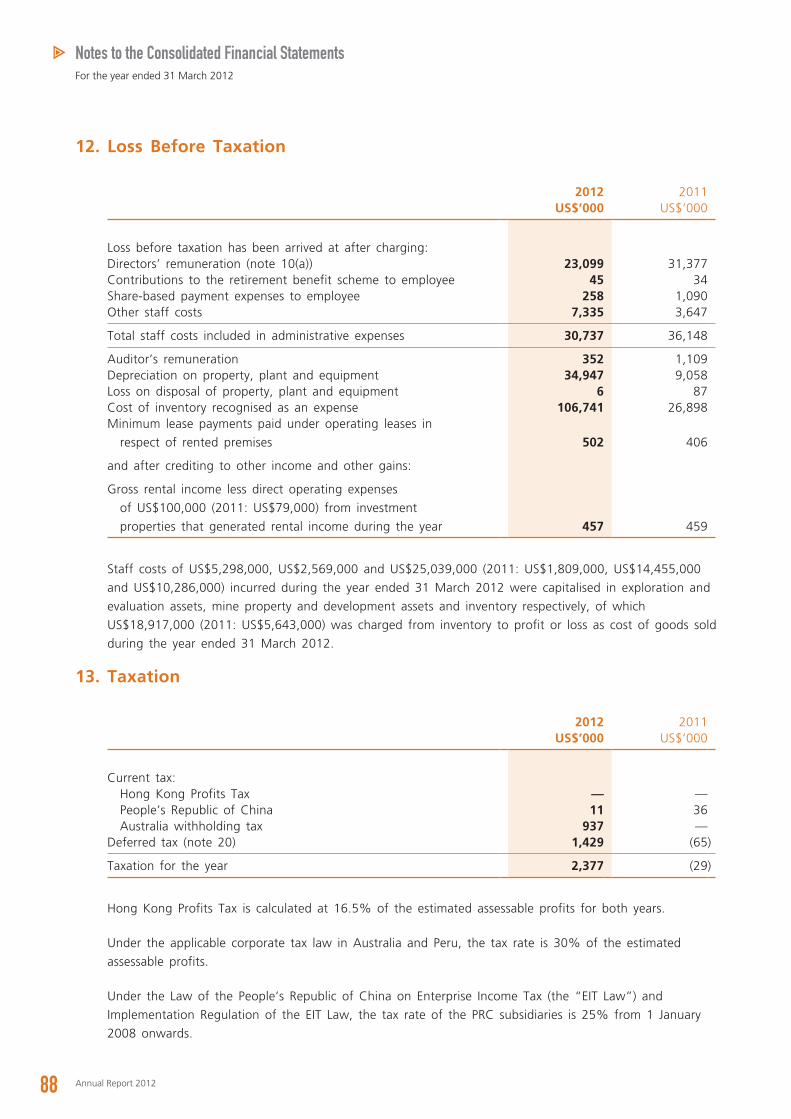
88 Annual Report 2012
Notes to the Consolidated Financial StatementsFor the year ended 31 March 2012
12. Loss Before Taxation
2012 2011US$’000 US$’000
Loss before taxation has been arrived at after charging:Directors’ remuneration (note 10(a)) 23,099 31,377Contributions to the retirement benefit scheme to employee 45 34Share-based payment expenses to employee 258 1,090Other staff costs 7,335 3,647
Total staff costs included in administrative expenses 30,737 36,148
Auditor’s remuneration 352 1,109Depreciation on property, plant and equipment 34,947 9,058Loss on disposal of property, plant and equipment 6 87Cost of inventory recognised as an expense 106,741 26,898Minimum lease payments paid under operating leases in
respect of rented premises 502 406
and after crediting to other income and other gains:
Gross rental income less direct operating expenses
of US$100,000 (2011: US$79,000) from investment
properties that generated rental income during the year 457 459
Staff costs of US$5,298,000, US$2,569,000 and US$25,039,000 (2011: US$1,809,000, US$14,455,000
and US$10,286,000) incurred during the year ended 31 March 2012 were capitalised in exploration and
evaluation assets, mine property and development assets and inventory respectively, of which
US$18,917,000 (2011: US$5,643,000) was charged from inventory to profit or loss as cost of goods sold
during the year ended 31 March 2012.
13. Taxation
2012 2011US$’000 US$’000
Current tax:Hong Kong Profits Tax — —People’s Republic of China 11 36Australia withholding tax 937 —
Deferred tax (note 20) 1,429 (65)
Taxation for the year 2,377 (29)
Hong Kong Profits Tax is calculated at 16.5% of the estimated assessable profits for both years.
Under the applicable corporate tax law in Australia and Peru, the tax rate is 30% of the estimated
assessable profits.
Under the Law of the People’s Republic of China on Enterprise Income Tax (the “EIT Law”) and
Implementation Regulation of the EIT Law, the tax rate of the PRC subsidiaries is 25% from 1 January
2008 onwards.
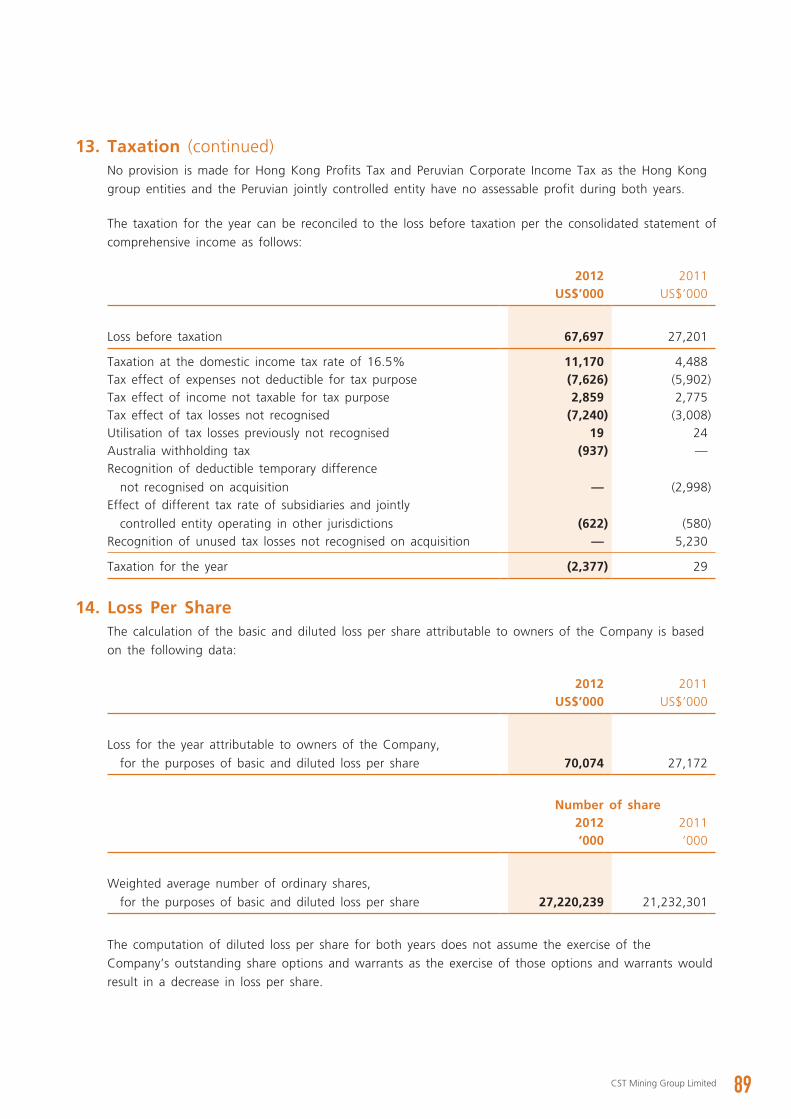
89CST Mining Group Limited
13. Taxation (continued)No provision is made for Hong Kong Profits Tax and Peruvian Corporate Income Tax as the Hong Kong
group entities and the Peruvian jointly controlled entity have no assessable profit during both years.
The taxation for the year can be reconciled to the loss before taxation per the consolidated statement of
comprehensive income as follows:
2012 2011US$’000 US$’000
Loss before taxation 67,697 27,201
Taxation at the domestic income tax rate of 16.5% 11,170 4,488Tax effect of expenses not deductible for tax purpose (7,626) (5,902)Tax effect of income not taxable for tax purpose 2,859 2,775Tax effect of tax losses not recognised (7,240) (3,008)Utilisation of tax losses previously not recognised 19 24Australia withholding tax (937) —Recognition of deductible temporary difference
not recognised on acquisition — (2,998)Effect of different tax rate of subsidiaries and jointly
controlled entity operating in other jurisdictions (622) (580)Recognition of unused tax losses not recognised on acquisition — 5,230
Taxation for the year (2,377) 29
14. Loss Per ShareThe calculation of the basic and diluted loss per share attributable to owners of the Company is based
on the following data:
2012 2011US$’000 US$’000
Loss for the year attributable to owners of the Company,
for the purposes of basic and diluted loss per share 70,074 27,172
Number of share2012 2011’000 ’000
Weighted average number of ordinary shares,
for the purposes of basic and diluted loss per share 27,220,239 21,232,301
The computation of diluted loss per share for both years does not assume the exercise of the
Company’s outstanding share options and warrants as the exercise of those options and warrants would
result in a decrease in loss per share.
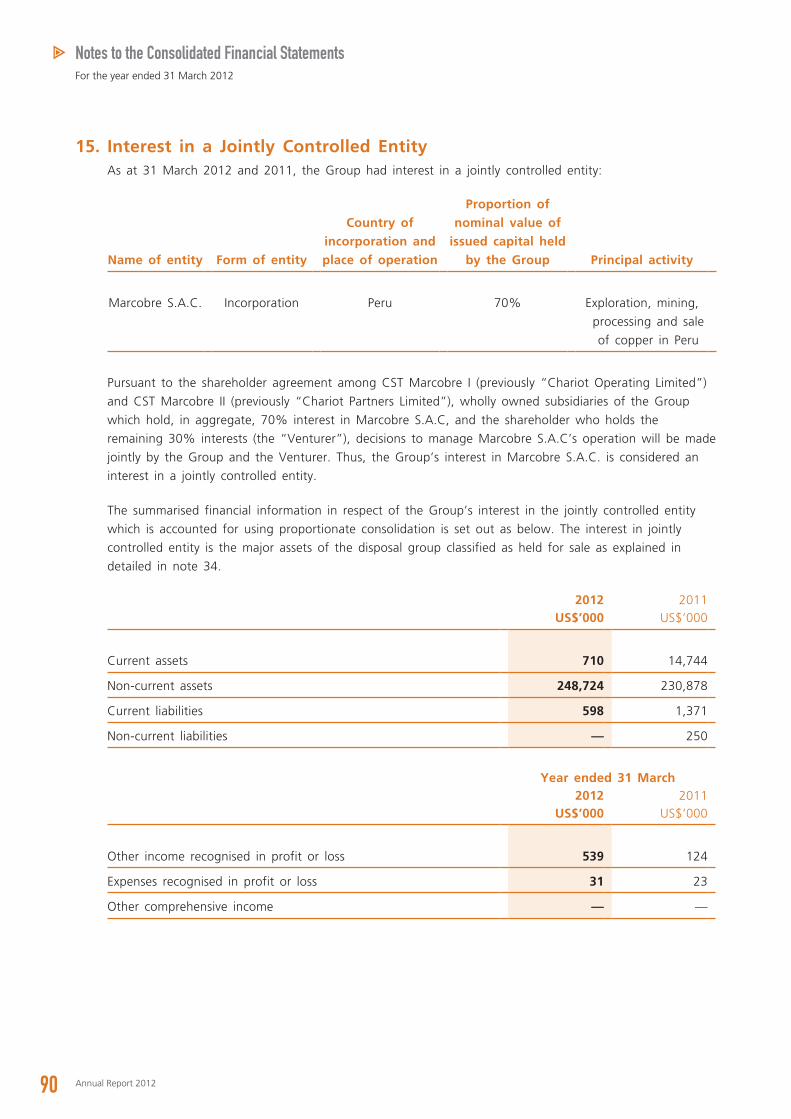
90 Annual Report 2012
Notes to the Consolidated Financial StatementsFor the year ended 31 March 2012
15. Interest in a Jointly Controlled EntityAs at 31 March 2012 and 2011, the Group had interest in a jointly controlled entity:
Name of entity Form of entity
Country of incorporation and place of operation
Proportion of nominal value of
issued capital held by the Group Principal activity
Marcobre S.A.C. Incorporation Peru 70% Exploration, mining,
processing and sale
of copper in Peru
Pursuant to the shareholder agreement among CST Marcobre I (previously “Chariot Operating Limited”)
and CST Marcobre II (previously “Chariot Partners Limited”), wholly owned subsidiaries of the Group
which hold, in aggregate, 70% interest in Marcobre S.A.C, and the shareholder who holds the
remaining 30% interests (the “Venturer”), decisions to manage Marcobre S.A.C’s operation will be made
jointly by the Group and the Venturer. Thus, the Group’s interest in Marcobre S.A.C. is considered an
interest in a jointly controlled entity.
The summarised financial information in respect of the Group’s interest in the jointly controlled entity
which is accounted for using proportionate consolidation is set out as below. The interest in jointly
controlled entity is the major assets of the disposal group classified as held for sale as explained in
detailed in note 34.
2012 2011US$’000 US$’000
Current assets 710 14,744
Non-current assets 248,724 230,878
Current liabilities 598 1,371
Non-current liabilities — 250
Year ended 31 March2012 2011
US$’000 US$’000
Other income recognised in profit or loss 539 124
Expenses recognised in profit or loss 31 23
Other comprehensive income — —
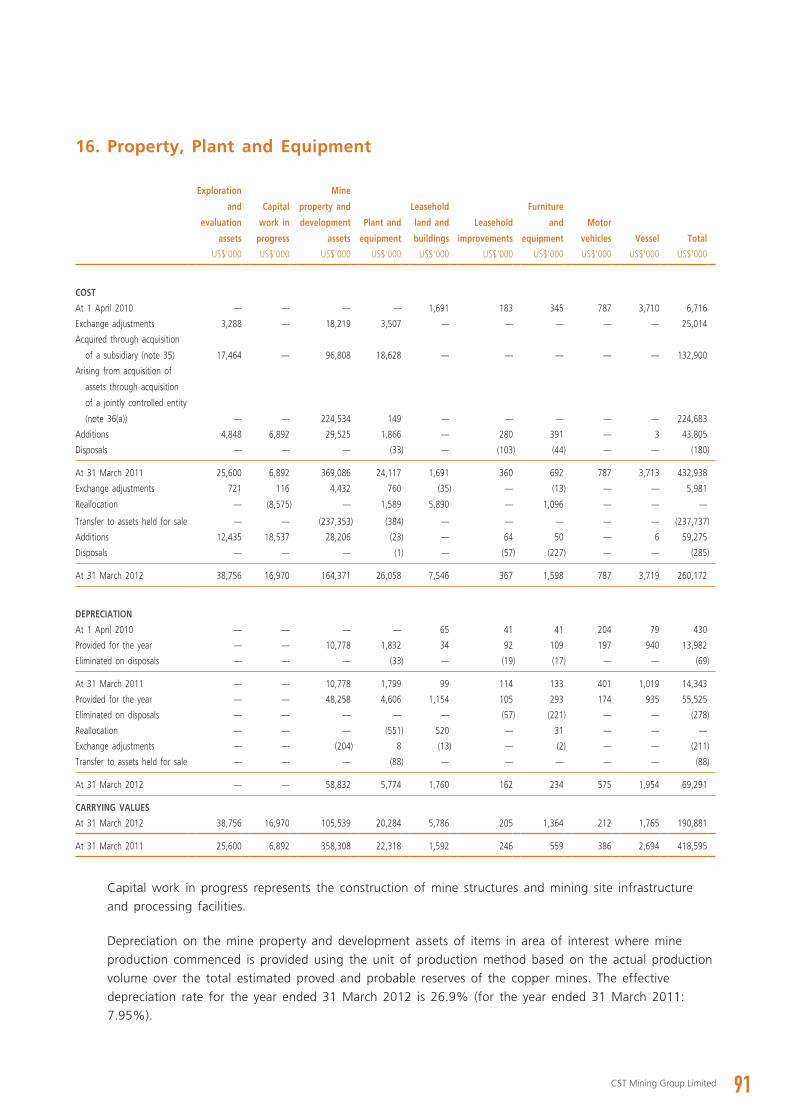
91CST Mining Group Limited
16. Property, Plant and Equipment
Exploration
and
evaluation
assets
Capital
work in
progress
Mine
property and
development
assets
Plant and
equipment
Leasehold
land and
buildings
Leasehold
improvements
Furniture
and
equipment
Motor
vehicles Vessel Total
US$’000 US$’000 US$’000 US$’000 US$’000 US$’000 US$’000 US$’000 US$’000 US$’000
COST
At 1 April 2010 — — — — 1,691 183 345 787 3,710 6,716
Exchange adjustments 3,288 — 18,219 3,507 — — — — — 25,014
Acquired through acquisition
of a subsidiary (note 35) 17,464 — 96,808 18,628 — — — — — 132,900
Arising from acquisition of
assets through acquisition
of a jointly controlled entity
(note 36(a)) — — 224,534 149 — — — — — 224,683
Additions 4,848 6,892 29,525 1,866 — 280 391 — 3 43,805
Disposals — — — (33) — (103) (44) — — (180)
At 31 March 2011 25,600 6,892 369,086 24,117 1,691 360 692 787 3,713 432,938
Exchange adjustments 721 116 4,432 760 (35) — (13) — — 5,981
Reallocation — (8,575) — 1,589 5,890 — 1,096 — — —
Transfer to assets held for sale — — (237,353) (384) — — — — — (237,737)
Additions 12,435 18,537 28,206 (23) — 64 50 — 6 59,275
Disposals — — — (1) — (57) (227) — — (285)
At 31 March 2012 38,756 16,970 164,371 26,058 7,546 367 1,598 787 3,719 260,172
DEPRECIATION
At 1 April 2010 — — — — 65 41 41 204 79 430
Provided for the year — — 10,778 1,832 34 92 109 197 940 13,982
Eliminated on disposals — — — (33) — (19) (17) — — (69)
At 31 March 2011 — — 10,778 1,799 99 114 133 401 1,019 14,343
Provided for the year — — 48,258 4,606 1,154 105 293 174 935 55,525
Eliminated on disposals — — — — — (57) (221) — — (278)
Reallocation — — — (551) 520 — 31 — — —
Exchange adjustments — — (204) 8 (13) — (2) — — (211)
Transfer to assets held for sale — — — (88) — — — — — (88)
At 31 March 2012 — — 58,832 5,774 1,760 162 234 575 1,954 69,291
CARRYING VALUES
At 31 March 2012 38,756 16,970 105,539 20,284 5,786 205 1,364 212 1,765 190,881
At 31 March 2011 25,600 6,892 358,308 22,318 1,592 246 559 386 2,694 418,595
Capital work in progress represents the construction of mine structures and mining site infrastructure
and processing facilities.
Depreciation on the mine property and development assets of items in area of interest where mine
production commenced is provided using the unit of production method based on the actual production
volume over the total estimated proved and probable reserves of the copper mines. The effective
depreciation rate for the year ended 31 March 2012 is 26.9% (for the year ended 31 March 2011:
7.95%).
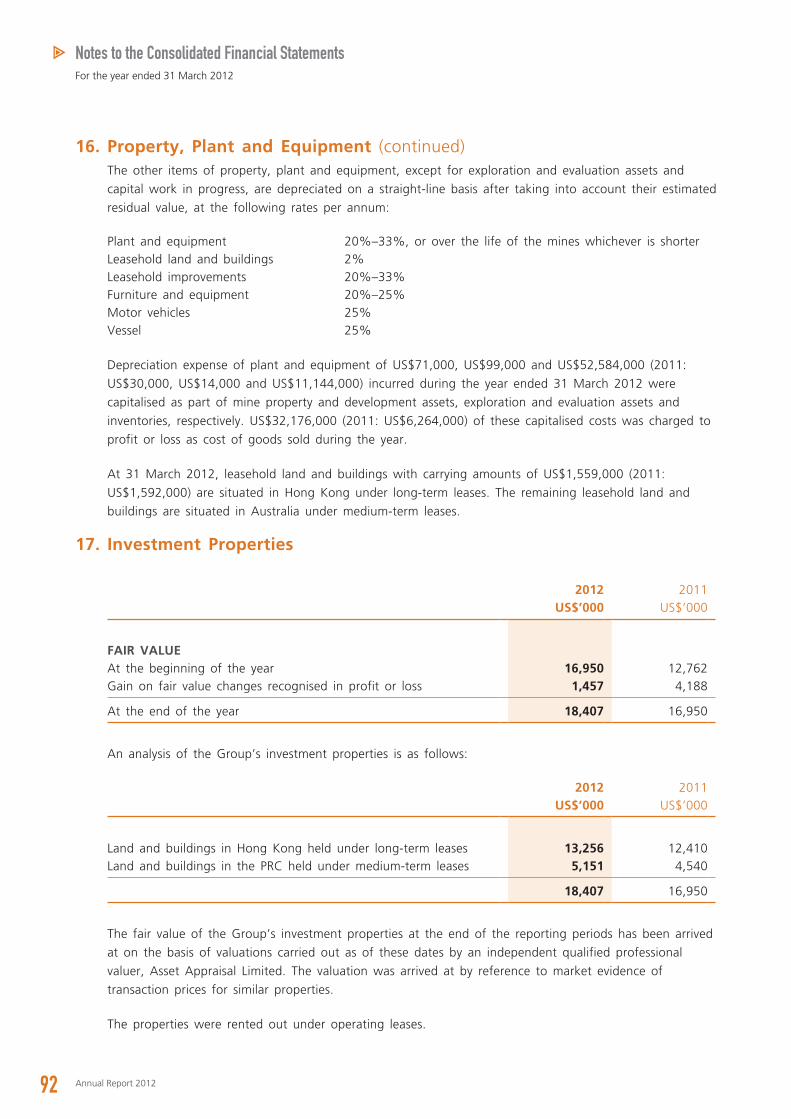
92 Annual Report 2012
Notes to the Consolidated Financial StatementsFor the year ended 31 March 2012
16. Property, Plant and Equipment (continued)The other items of property, plant and equipment, except for exploration and evaluation assets and
capital work in progress, are depreciated on a straight-line basis after taking into account their estimated
residual value, at the following rates per annum:
Plant and equipment 20%–33%, or over the life of the mines whichever is shorterLeasehold land and buildings 2%Leasehold improvements 20%–33%Furniture and equipment 20%–25%Motor vehicles 25%Vessel 25%
Depreciation expense of plant and equipment of US$71,000, US$99,000 and US$52,584,000 (2011:
US$30,000, US$14,000 and US$11,144,000) incurred during the year ended 31 March 2012 were
capitalised as part of mine property and development assets, exploration and evaluation assets and
inventories, respectively. US$32,176,000 (2011: US$6,264,000) of these capitalised costs was charged to
profit or loss as cost of goods sold during the year.
At 31 March 2012, leasehold land and buildings with carrying amounts of US$1,559,000 (2011:
US$1,592,000) are situated in Hong Kong under long-term leases. The remaining leasehold land and
buildings are situated in Australia under medium-term leases.
17. Investment Properties
2012 2011US$’000 US$’000
FAIR VALUEAt the beginning of the year 16,950 12,762Gain on fair value changes recognised in profit or loss 1,457 4,188
At the end of the year 18,407 16,950
An analysis of the Group’s investment properties is as follows:
2012 2011US$’000 US$’000
Land and buildings in Hong Kong held under long-term leases 13,256 12,410Land and buildings in the PRC held under medium-term leases 5,151 4,540
18,407 16,950
The fair value of the Group’s investment properties at the end of the reporting periods has been arrived
at on the basis of valuations carried out as of these dates by an independent qualified professional
valuer, Asset Appraisal Limited. The valuation was arrived at by reference to market evidence of
transaction prices for similar properties.
The properties were rented out under operating leases.
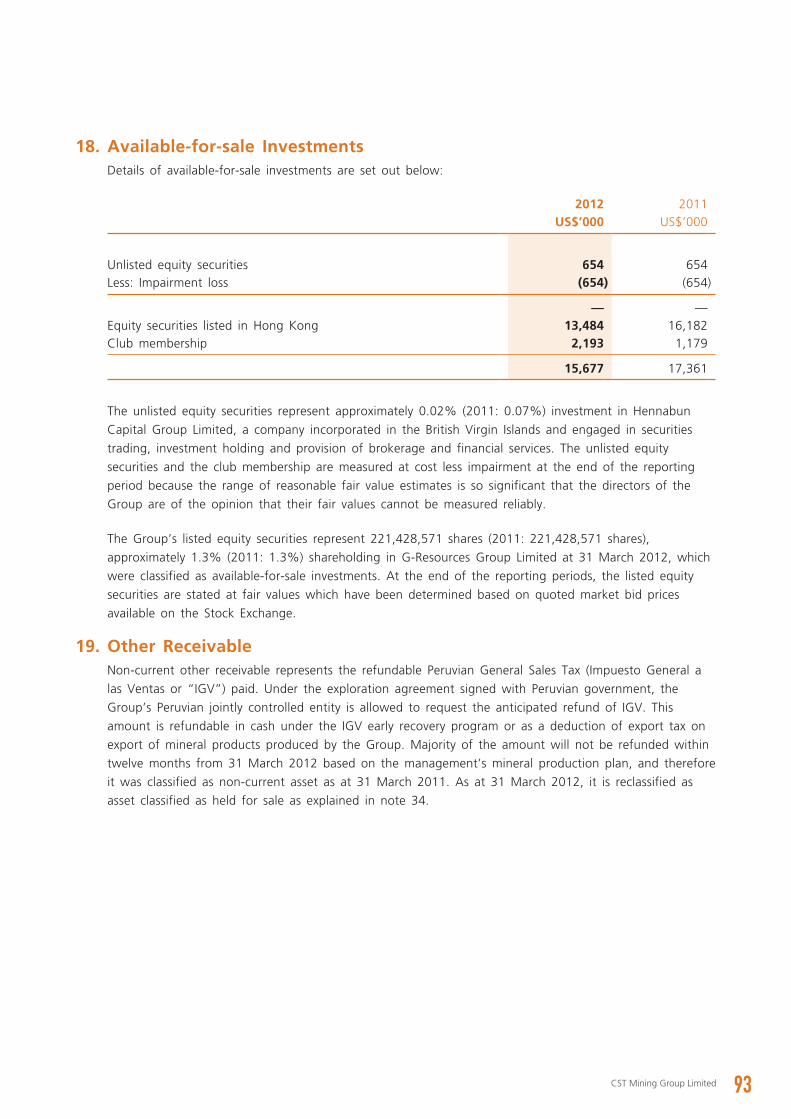
93CST Mining Group Limited
18. Available-for-sale InvestmentsDetails of available-for-sale investments are set out below:
2012 2011US$’000 US$’000
Unlisted equity securities 654 654Less: Impairment loss (654) (654)
— —Equity securities listed in Hong Kong 13,484 16,182Club membership 2,193 1,179
15,677 17,361
The unlisted equity securities represent approximately 0.02% (2011: 0.07%) investment in Hennabun
Capital Group Limited, a company incorporated in the British Virgin Islands and engaged in securities
trading, investment holding and provision of brokerage and financial services. The unlisted equity
securities and the club membership are measured at cost less impairment at the end of the reporting
period because the range of reasonable fair value estimates is so significant that the directors of the
Group are of the opinion that their fair values cannot be measured reliably.
The Group’s listed equity securities represent 221,428,571 shares (2011: 221,428,571 shares),
approximately 1.3% (2011: 1.3%) shareholding in G-Resources Group Limited at 31 March 2012, which
were classified as available-for-sale investments. At the end of the reporting periods, the listed equity
securities are stated at fair values which have been determined based on quoted market bid prices
available on the Stock Exchange.
19. Other ReceivableNon-current other receivable represents the refundable Peruvian General Sales Tax (Impuesto General a
las Ventas or “IGV”) paid. Under the exploration agreement signed with Peruvian government, the
Group’s Peruvian jointly controlled entity is allowed to request the anticipated refund of IGV. This
amount is refundable in cash under the IGV early recovery program or as a deduction of export tax on
export of mineral products produced by the Group. Majority of the amount will not be refunded within
twelve months from 31 March 2012 based on the management’s mineral production plan, and therefore
it was classified as non-current asset as at 31 March 2011. As at 31 March 2012, it is reclassified as
asset classified as held for sale as explained in note 34.
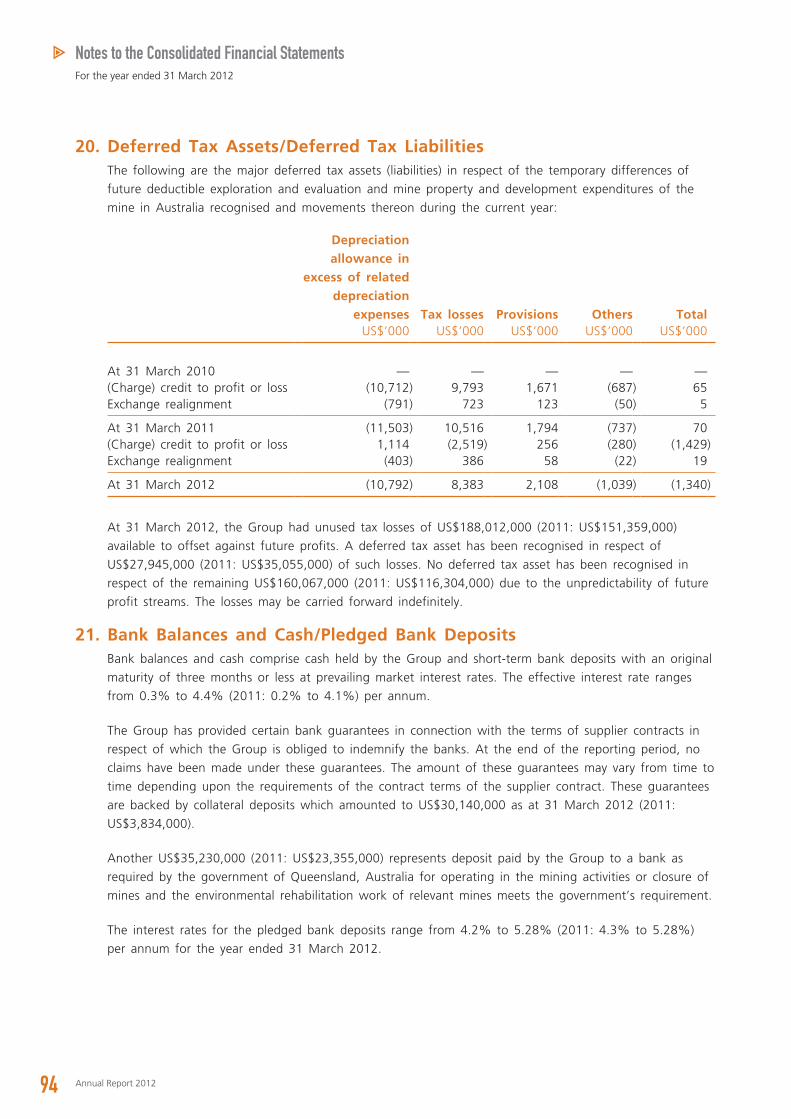
94 Annual Report 2012
Notes to the Consolidated Financial StatementsFor the year ended 31 March 2012
20. Deferred Tax Assets/Deferred Tax LiabilitiesThe following are the major deferred tax assets (liabilities) in respect of the temporary differences of
future deductible exploration and evaluation and mine property and development expenditures of the
mine in Australia recognised and movements thereon during the current year:
Depreciation allowance in
excess of related depreciation
expenses Tax losses Provisions Others TotalUS$’000 US$’000 US$’000 US$’000 US$’000
At 31 March 2010 — — — — —(Charge) credit to profit or loss (10,712) 9,793 1,671 (687) 65Exchange realignment (791) 723 123 (50) 5
At 31 March 2011 (11,503) 10,516 1,794 (737) 70(Charge) credit to profit or loss 1,114 (2,519) 256 (280) (1,429)Exchange realignment (403) 386 58 (22) 19
At 31 March 2012 (10,792) 8,383 2,108 (1,039) (1,340)
At 31 March 2012, the Group had unused tax losses of US$188,012,000 (2011: US$151,359,000)
available to offset against future profits. A deferred tax asset has been recognised in respect of
US$27,945,000 (2011: US$35,055,000) of such losses. No deferred tax asset has been recognised in
respect of the remaining US$160,067,000 (2011: US$116,304,000) due to the unpredictability of future
profit streams. The losses may be carried forward indefinitely.
21. Bank Balances and Cash/Pledged Bank DepositsBank balances and cash comprise cash held by the Group and short-term bank deposits with an original
maturity of three months or less at prevailing market interest rates. The effective interest rate ranges
from 0.3% to 4.4% (2011: 0.2% to 4.1%) per annum.
The Group has provided certain bank guarantees in connection with the terms of supplier contracts in
respect of which the Group is obliged to indemnify the banks. At the end of the reporting period, no
claims have been made under these guarantees. The amount of these guarantees may vary from time to
time depending upon the requirements of the contract terms of the supplier contract. These guarantees
are backed by collateral deposits which amounted to US$30,140,000 as at 31 March 2012 (2011:
US$3,834,000).
Another US$35,230,000 (2011: US$23,355,000) represents deposit paid by the Group to a bank as
required by the government of Queensland, Australia for operating in the mining activities or closure of
mines and the environmental rehabilitation work of relevant mines meets the government’s requirement.
The interest rates for the pledged bank deposits range from 4.2% to 5.28% (2011: 4.3% to 5.28%)
per annum for the year ended 31 March 2012.
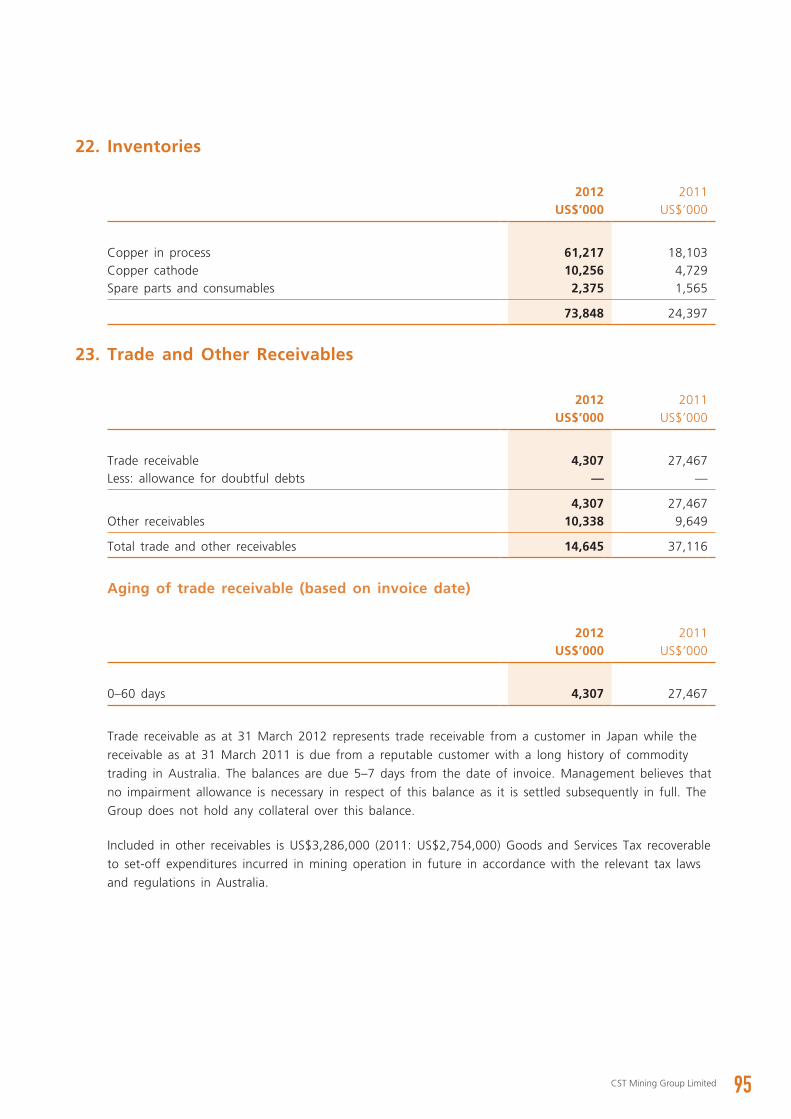
95CST Mining Group Limited
22. Inventories
2012 2011US$’000 US$’000
Copper in process 61,217 18,103Copper cathode 10,256 4,729Spare parts and consumables 2,375 1,565
73,848 24,397
23. Trade and Other Receivables
2012 2011US$’000 US$’000
Trade receivable 4,307 27,467Less: allowance for doubtful debts — —
4,307 27,467Other receivables 10,338 9,649
Total trade and other receivables 14,645 37,116
Aging of trade receivable (based on invoice date)
2012 2011US$’000 US$’000
0–60 days 4,307 27,467
Trade receivable as at 31 March 2012 represents trade receivable from a customer in Japan while the
receivable as at 31 March 2011 is due from a reputable customer with a long history of commodity
trading in Australia. The balances are due 5–7 days from the date of invoice. Management believes that
no impairment allowance is necessary in respect of this balance as it is settled subsequently in full. The
Group does not hold any collateral over this balance.
Included in other receivables is US$3,286,000 (2011: US$2,754,000) Goods and Services Tax recoverable
to set-off expenditures incurred in mining operation in future in accordance with the relevant tax laws
and regulations in Australia.
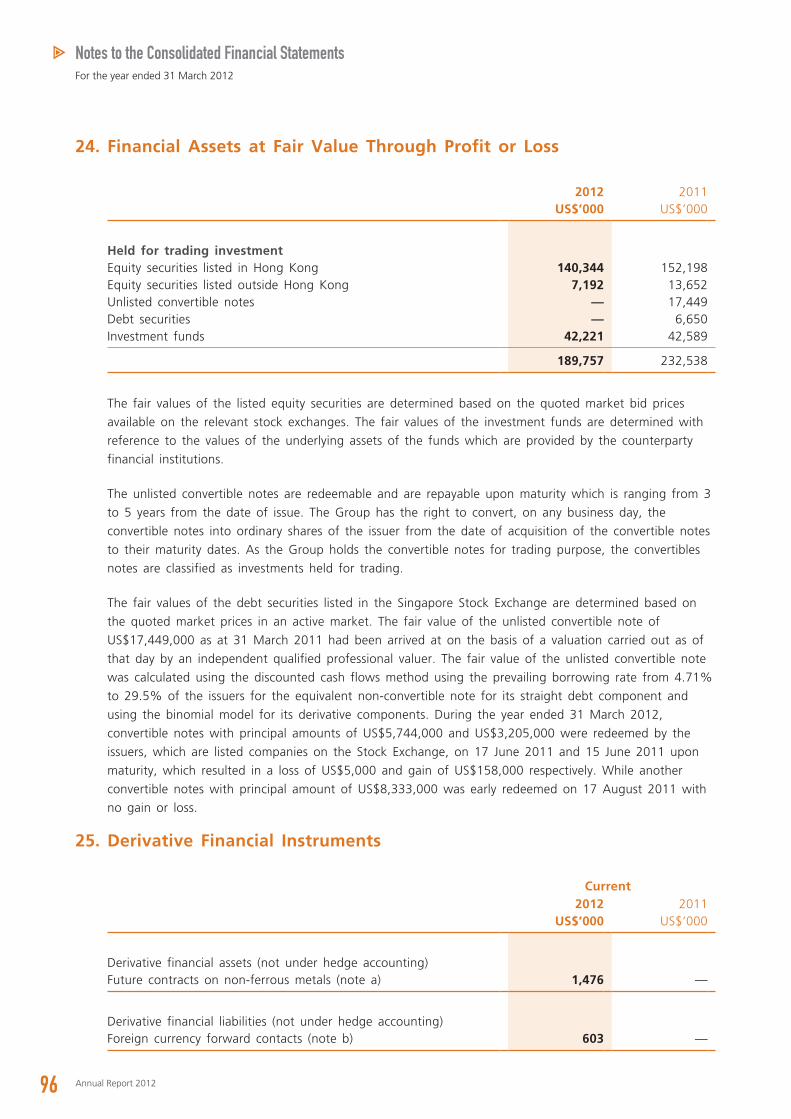
96 Annual Report 2012
Notes to the Consolidated Financial StatementsFor the year ended 31 March 2012
24. Financial Assets at Fair Value Through Profit or Loss
2012 2011US$’000 US$’000
Held for trading investmentEquity securities listed in Hong Kong 140,344 152,198Equity securities listed outside Hong Kong 7,192 13,652Unlisted convertible notes — 17,449Debt securities — 6,650Investment funds 42,221 42,589
189,757 232,538
The fair values of the listed equity securities are determined based on the quoted market bid prices
available on the relevant stock exchanges. The fair values of the investment funds are determined with
reference to the values of the underlying assets of the funds which are provided by the counterparty
financial institutions.
The unlisted convertible notes are redeemable and are repayable upon maturity which is ranging from 3
to 5 years from the date of issue. The Group has the right to convert, on any business day, the
convertible notes into ordinary shares of the issuer from the date of acquisition of the convertible notes
to their maturity dates. As the Group holds the convertible notes for trading purpose, the convertibles
notes are classified as investments held for trading.
The fair values of the debt securities listed in the Singapore Stock Exchange are determined based on
the quoted market prices in an active market. The fair value of the unlisted convertible note of
US$17,449,000 as at 31 March 2011 had been arrived at on the basis of a valuation carried out as of
that day by an independent qualified professional valuer. The fair value of the unlisted convertible note
was calculated using the discounted cash flows method using the prevailing borrowing rate from 4.71%
to 29.5% of the issuers for the equivalent non-convertible note for its straight debt component and
using the binomial model for its derivative components. During the year ended 31 March 2012,
convertible notes with principal amounts of US$5,744,000 and US$3,205,000 were redeemed by the
issuers, which are listed companies on the Stock Exchange, on 17 June 2011 and 15 June 2011 upon
maturity, which resulted in a loss of US$5,000 and gain of US$158,000 respectively. While another
convertible notes with principal amount of US$8,333,000 was early redeemed on 17 August 2011 with
no gain or loss.
25. Derivative Financial Instruments
Current2012 2011
US$’000 US$’000
Derivative financial assets (not under hedge accounting)Future contracts on non-ferrous metals (note a) 1,476 —
Derivative financial liabilities (not under hedge accounting)Foreign currency forward contacts (note b) 603 —
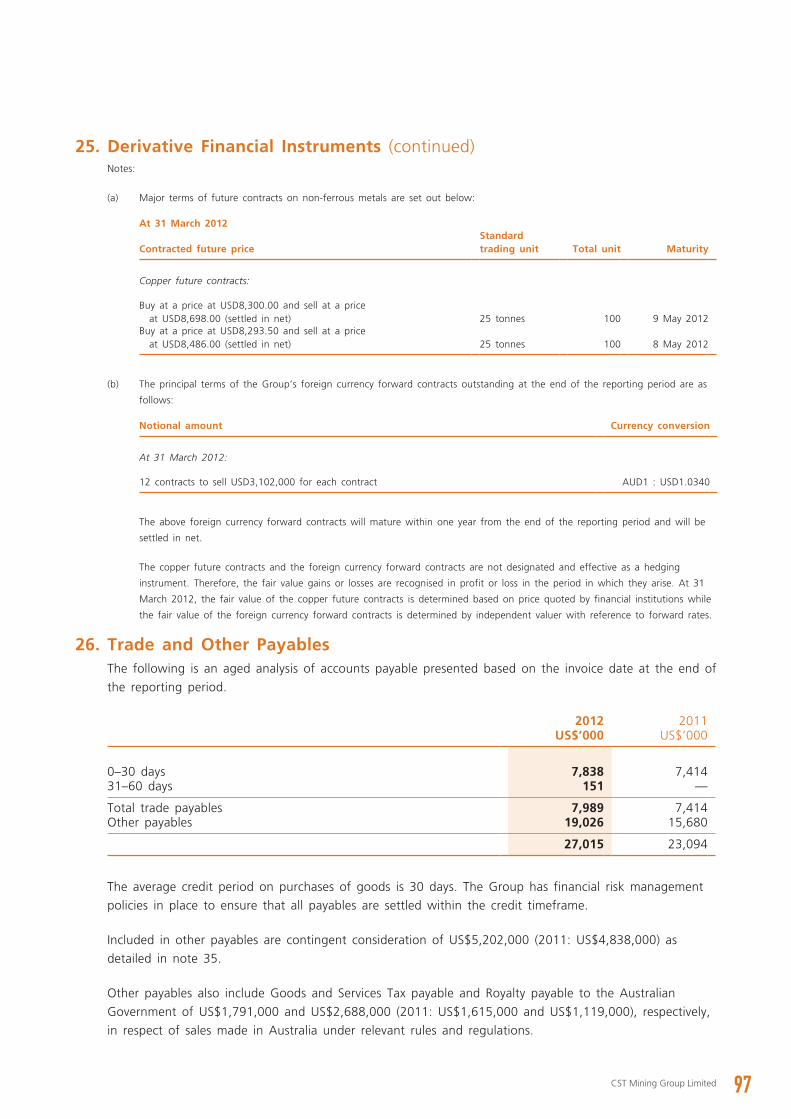
97CST Mining Group Limited
25. Derivative Financial Instruments (continued)Notes:
(a) Major terms of future contracts on non-ferrous metals are set out below:
At 31 March 2012
Contracted future priceStandard trading unit Total unit Maturity
Copper future contracts:
Buy at a price at USD8,300.00 and sell at a price at USD8,698.00 (settled in net) 25 tonnes 100 9 May 2012
Buy at a price at USD8,293.50 and sell at a price at USD8,486.00 (settled in net) 25 tonnes 100 8 May 2012
(b) The principal terms of the Group’s foreign currency forward contracts outstanding at the end of the reporting period are as
follows:
Notional amount Currency conversion
At 31 March 2012:
12 contracts to sell USD3,102,000 for each contract AUD1 : USD1.0340
The above foreign currency forward contracts will mature within one year from the end of the reporting period and will be
settled in net.
The copper future contracts and the foreign currency forward contracts are not designated and effective as a hedging
instrument. Therefore, the fair value gains or losses are recognised in profit or loss in the period in which they arise. At 31
March 2012, the fair value of the copper future contracts is determined based on price quoted by financial institutions while
the fair value of the foreign currency forward contracts is determined by independent valuer with reference to forward rates.
26. Trade and Other PayablesThe following is an aged analysis of accounts payable presented based on the invoice date at the end of
the reporting period.
2012 2011US$’000 US$’000
0–30 days 7,838 7,41431–60 days 151 —
Total trade payables 7,989 7,414Other payables 19,026 15,680
27,015 23,094
The average credit period on purchases of goods is 30 days. The Group has financial risk management
policies in place to ensure that all payables are settled within the credit timeframe.
Included in other payables are contingent consideration of US$5,202,000 (2011: US$4,838,000) as
detailed in note 35.
Other payables also include Goods and Services Tax payable and Royalty payable to the Australian
Government of US$1,791,000 and US$2,688,000 (2011: US$1,615,000 and US$1,119,000), respectively,
in respect of sales made in Australia under relevant rules and regulations.
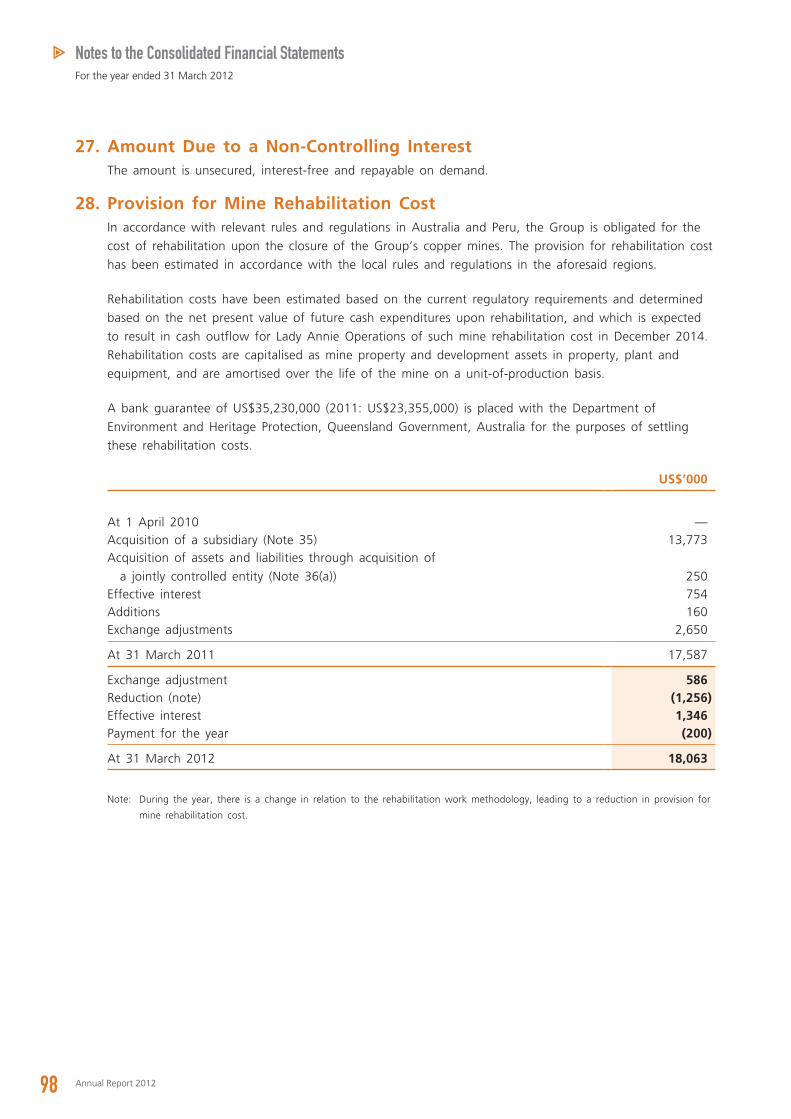
98 Annual Report 2012
Notes to the Consolidated Financial StatementsFor the year ended 31 March 2012
27. Amount Due to a Non-Controlling InterestThe amount is unsecured, interest-free and repayable on demand.
28. Provision for Mine Rehabilitation CostIn accordance with relevant rules and regulations in Australia and Peru, the Group is obligated for the
cost of rehabilitation upon the closure of the Group’s copper mines. The provision for rehabilitation cost
has been estimated in accordance with the local rules and regulations in the aforesaid regions.
Rehabilitation costs have been estimated based on the current regulatory requirements and determined
based on the net present value of future cash expenditures upon rehabilitation, and which is expected
to result in cash outflow for Lady Annie Operations of such mine rehabilitation cost in December 2014.
Rehabilitation costs are capitalised as mine property and development assets in property, plant and
equipment, and are amortised over the life of the mine on a unit-of-production basis.
A bank guarantee of US$35,230,000 (2011: US$23,355,000) is placed with the Department of
Environment and Heritage Protection, Queensland Government, Australia for the purposes of settling
these rehabilitation costs.
US$’000
At 1 April 2010 —Acquisition of a subsidiary (Note 35) 13,773Acquisition of assets and liabilities through acquisition of
a jointly controlled entity (Note 36(a)) 250Effective interest 754Additions 160Exchange adjustments 2,650
At 31 March 2011 17,587
Exchange adjustment 586Reduction (note) (1,256)Effective interest 1,346Payment for the year (200)
At 31 March 2012 18,063
Note: During the year, there is a change in relation to the rehabilitation work methodology, leading to a reduction in provision for
mine rehabilitation cost.
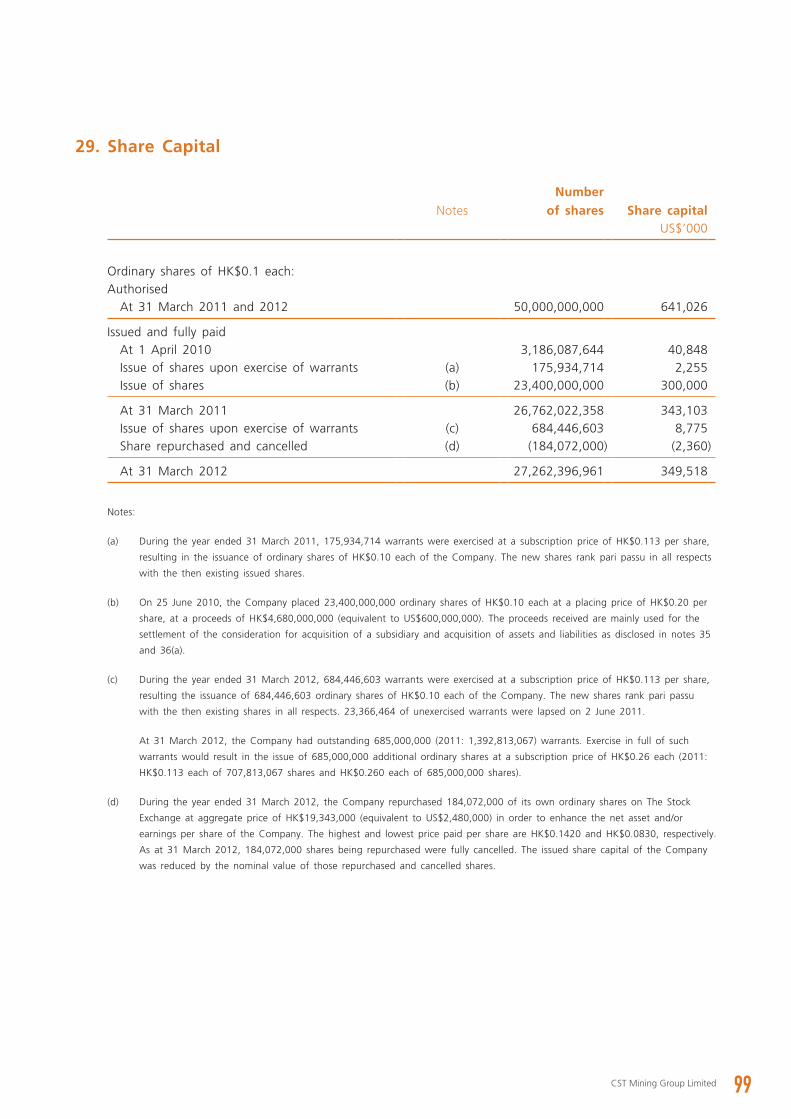
99CST Mining Group Limited
29. Share Capital
Notes
Number of shares Share capital
US$’000
Ordinary shares of HK$0.1 each:Authorised
At 31 March 2011 and 2012 50,000,000,000 641,026
Issued and fully paidAt 1 April 2010 3,186,087,644 40,848Issue of shares upon exercise of warrants (a) 175,934,714 2,255Issue of shares (b) 23,400,000,000 300,000
At 31 March 2011 26,762,022,358 343,103Issue of shares upon exercise of warrants (c) 684,446,603 8,775Share repurchased and cancelled (d) (184,072,000) (2,360)
At 31 March 2012 27,262,396,961 349,518
Notes:
(a) During the year ended 31 March 2011, 175,934,714 warrants were exercised at a subscription price of HK$0.113 per share,
resulting in the issuance of ordinary shares of HK$0.10 each of the Company. The new shares rank pari passu in all respects
with the then existing issued shares.
(b) On 25 June 2010, the Company placed 23,400,000,000 ordinary shares of HK$0.10 each at a placing price of HK$0.20 per
share, at a proceeds of HK$4,680,000,000 (equivalent to US$600,000,000). The proceeds received are mainly used for the
settlement of the consideration for acquisition of a subsidiary and acquisition of assets and liabilities as disclosed in notes 35
and 36(a).
(c) During the year ended 31 March 2012, 684,446,603 warrants were exercised at a subscription price of HK$0.113 per share,
resulting the issuance of 684,446,603 ordinary shares of HK$0.10 each of the Company. The new shares rank pari passu
with the then existing shares in all respects. 23,366,464 of unexercised warrants were lapsed on 2 June 2011.
At 31 March 2012, the Company had outstanding 685,000,000 (2011: 1,392,813,067) warrants. Exercise in full of such
warrants would result in the issue of 685,000,000 additional ordinary shares at a subscription price of HK$0.26 each (2011:
HK$0.113 each of 707,813,067 shares and HK$0.260 each of 685,000,000 shares).
(d) During the year ended 31 March 2012, the Company repurchased 184,072,000 of its own ordinary shares on The Stock
Exchange at aggregate price of HK$19,343,000 (equivalent to US$2,480,000) in order to enhance the net asset and/or
earnings per share of the Company. The highest and lowest price paid per share are HK$0.1420 and HK$0.0830, respectively.
As at 31 March 2012, 184,072,000 shares being repurchased were fully cancelled. The issued share capital of the Company
was reduced by the nominal value of those repurchased and cancelled shares.
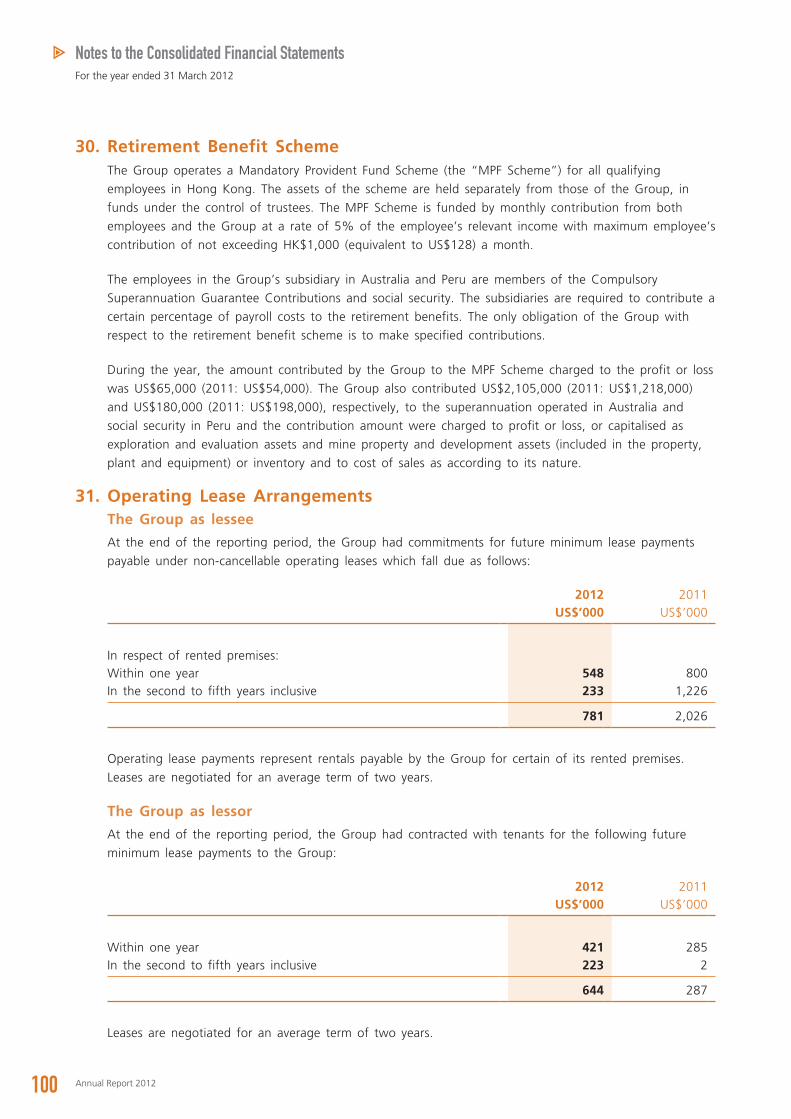
100 Annual Report 2012
Notes to the Consolidated Financial StatementsFor the year ended 31 March 2012
30. Retirement Benefit SchemeThe Group operates a Mandatory Provident Fund Scheme (the “MPF Scheme”) for all qualifying
employees in Hong Kong. The assets of the scheme are held separately from those of the Group, in
funds under the control of trustees. The MPF Scheme is funded by monthly contribution from both
employees and the Group at a rate of 5% of the employee’s relevant income with maximum employee’s
contribution of not exceeding HK$1,000 (equivalent to US$128) a month.
The employees in the Group’s subsidiary in Australia and Peru are members of the Compulsory
Superannuation Guarantee Contributions and social security. The subsidiaries are required to contribute a
certain percentage of payroll costs to the retirement benefits. The only obligation of the Group with
respect to the retirement benefit scheme is to make specified contributions.
During the year, the amount contributed by the Group to the MPF Scheme charged to the profit or loss
was US$65,000 (2011: US$54,000). The Group also contributed US$2,105,000 (2011: US$1,218,000)
and US$180,000 (2011: US$198,000), respectively, to the superannuation operated in Australia and
social security in Peru and the contribution amount were charged to profit or loss, or capitalised as
exploration and evaluation assets and mine property and development assets (included in the property,
plant and equipment) or inventory and to cost of sales as according to its nature.
31. Operating Lease Arrangements The Group as lessee
At the end of the reporting period, the Group had commitments for future minimum lease payments
payable under non-cancellable operating leases which fall due as follows:
2012 2011US$’000 US$’000
In respect of rented premises:Within one year 548 800In the second to fifth years inclusive 233 1,226
781 2,026
Operating lease payments represent rentals payable by the Group for certain of its rented premises.
Leases are negotiated for an average term of two years.
The Group as lessor
At the end of the reporting period, the Group had contracted with tenants for the following future
minimum lease payments to the Group:
2012 2011US$’000 US$’000
Within one year 421 285In the second to fifth years inclusive 223 2
644 287
Leases are negotiated for an average term of two years.
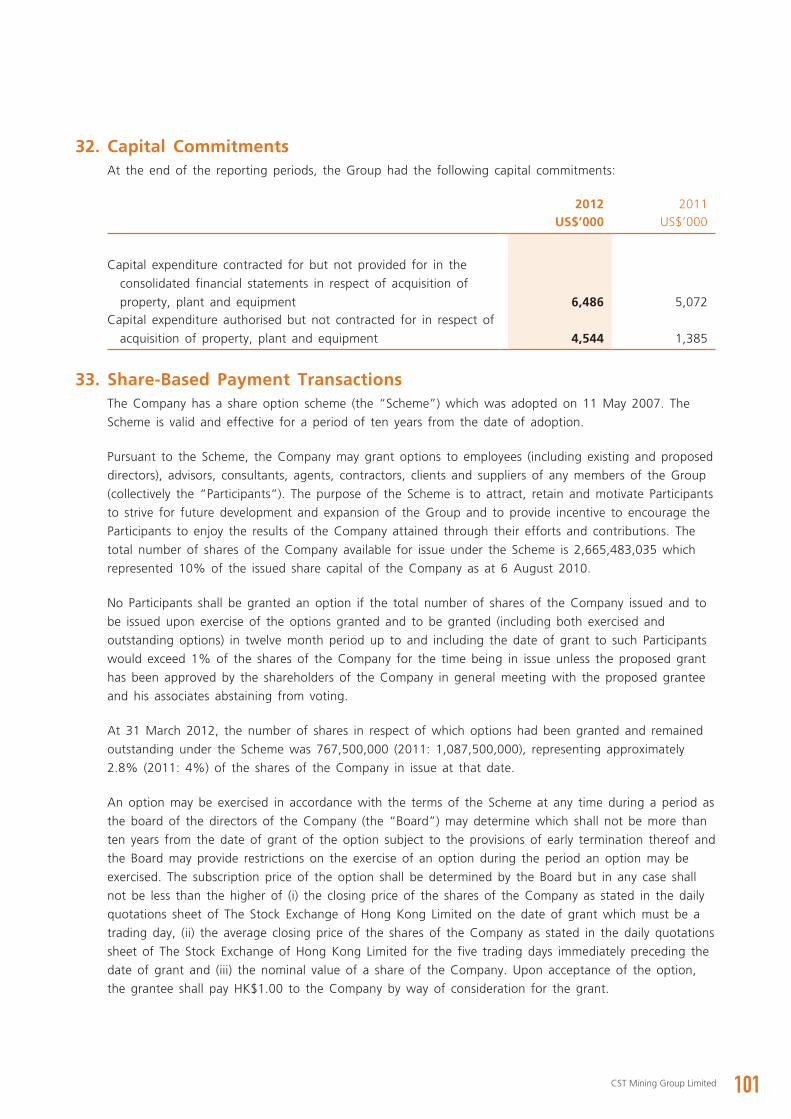
101CST Mining Group Limited
32. Capital CommitmentsAt the end of the reporting periods, the Group had the following capital commitments:
2012 2011US$’000 US$’000
Capital expenditure contracted for but not provided for in the
consolidated financial statements in respect of acquisition of
property, plant and equipment 6,486 5,072Capital expenditure authorised but not contracted for in respect of
acquisition of property, plant and equipment 4,544 1,385
33. Share-Based Payment TransactionsThe Company has a share option scheme (the “Scheme”) which was adopted on 11 May 2007. The
Scheme is valid and effective for a period of ten years from the date of adoption.
Pursuant to the Scheme, the Company may grant options to employees (including existing and proposed
directors), advisors, consultants, agents, contractors, clients and suppliers of any members of the Group
(collectively the “Participants”). The purpose of the Scheme is to attract, retain and motivate Participants
to strive for future development and expansion of the Group and to provide incentive to encourage the
Participants to enjoy the results of the Company attained through their efforts and contributions. The
total number of shares of the Company available for issue under the Scheme is 2,665,483,035 which
represented 10% of the issued share capital of the Company as at 6 August 2010.
No Participants shall be granted an option if the total number of shares of the Company issued and to
be issued upon exercise of the options granted and to be granted (including both exercised and
outstanding options) in twelve month period up to and including the date of grant to such Participants
would exceed 1% of the shares of the Company for the time being in issue unless the proposed grant
has been approved by the shareholders of the Company in general meeting with the proposed grantee
and his associates abstaining from voting.
At 31 March 2012, the number of shares in respect of which options had been granted and remained
outstanding under the Scheme was 767,500,000 (2011: 1,087,500,000), representing approximately
2.8% (2011: 4%) of the shares of the Company in issue at that date.
An option may be exercised in accordance with the terms of the Scheme at any time during a period as
the board of the directors of the Company (the “Board”) may determine which shall not be more than
ten years from the date of grant of the option subject to the provisions of early termination thereof and
the Board may provide restrictions on the exercise of an option during the period an option may be
exercised. The subscription price of the option shall be determined by the Board but in any case shall
not be less than the higher of (i) the closing price of the shares of the Company as stated in the daily
quotations sheet of The Stock Exchange of Hong Kong Limited on the date of grant which must be a
trading day, (ii) the average closing price of the shares of the Company as stated in the daily quotations
sheet of The Stock Exchange of Hong Kong Limited for the five trading days immediately preceding the
date of grant and (iii) the nominal value of a share of the Company. Upon acceptance of the option,
the grantee shall pay HK$1.00 to the Company by way of consideration for the grant.
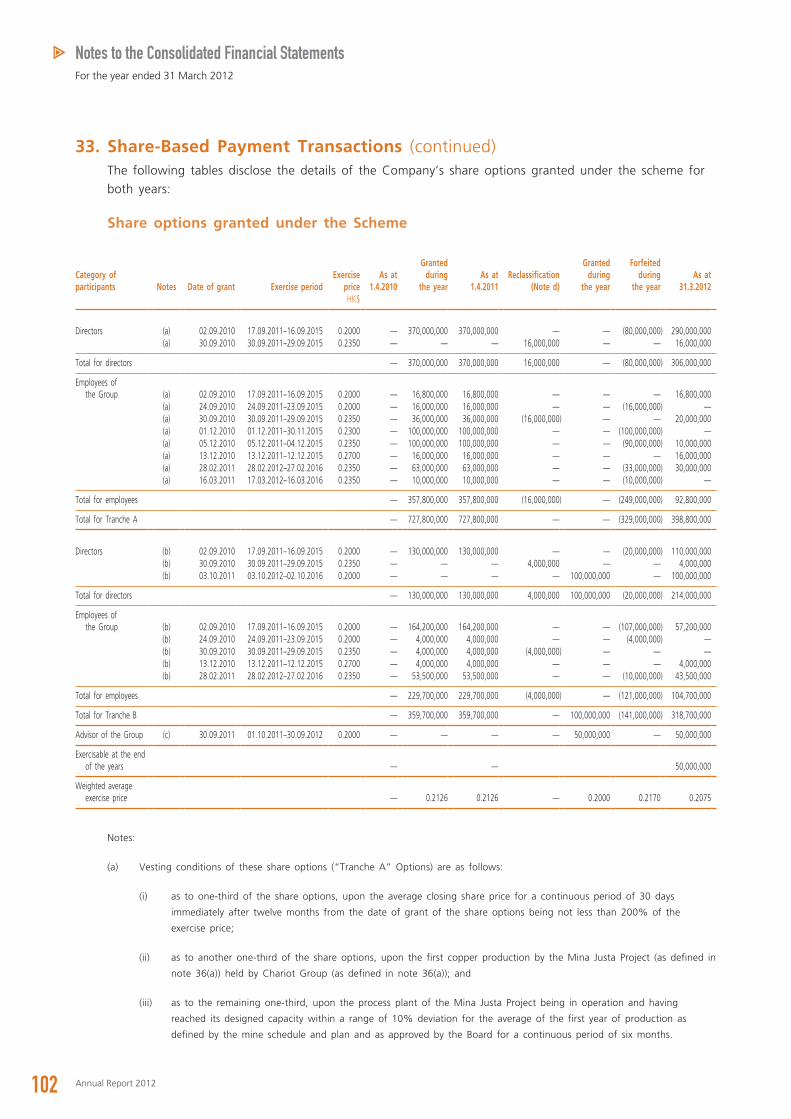
102 Annual Report 2012
Notes to the Consolidated Financial StatementsFor the year ended 31 March 2012
33. Share-Based Payment Transactions (continued)The following tables disclose the details of the Company’s share options granted under the scheme for
both years:
Share options granted under the Scheme
Category of participants Notes Date of grant Exercise period
Exercise price
As at 1.4.2010
Granted during
the yearAs at
1.4.2011Reclassification
(Note d)
Granted during
the year
Forfeited during
the yearAs at
31.3.2012HK$
Directors (a) 02.09.2010 17.09.2011–16.09.2015 0.2000 — 370,000,000 370,000,000 — — (80,000,000) 290,000,000(a) 30.09.2010 30.09.2011–29.09.2015 0.2350 — — — 16,000,000 — — 16,000,000
Total for directors — 370,000,000 370,000,000 16,000,000 — (80,000,000) 306,000,000
Employees of the Group (a) 02.09.2010 17.09.2011–16.09.2015 0.2000 — 16,800,000 16,800,000 — — — 16,800,000
(a) 24.09.2010 24.09.2011–23.09.2015 0.2000 — 16,000,000 16,000,000 — — (16,000,000) —(a) 30.09.2010 30.09.2011–29.09.2015 0.2350 — 36,000,000 36,000,000 (16,000,000) — — 20,000,000(a) 01.12.2010 01.12.2011–30.11.2015 0.2300 — 100,000,000 100,000,000 — — (100,000,000) —(a) 05.12.2010 05.12.2011–04.12.2015 0.2350 — 100,000,000 100,000,000 — — (90,000,000) 10,000,000(a) 13.12.2010 13.12.2011–12.12.2015 0.2700 — 16,000,000 16,000,000 — — — 16,000,000(a) 28.02.2011 28.02.2012–27.02.2016 0.2350 — 63,000,000 63,000,000 — — (33,000,000) 30,000,000(a) 16.03.2011 17.03.2012–16.03.2016 0.2350 — 10,000,000 10,000,000 — — (10,000,000) —
Total for employees — 357,800,000 357,800,000 (16,000,000) — (249,000,000) 92,800,000
Total for Tranche A — 727,800,000 727,800,000 — — (329,000,000) 398,800,000
Directors (b) 02.09.2010 17.09.2011–16.09.2015 0.2000 — 130,000,000 130,000,000 — — (20,000,000) 110,000,000(b) 30.09.2010 30.09.2011–29.09.2015 0.2350 — — — 4,000,000 — — 4,000,000(b) 03.10.2011 03.10.2012–02.10.2016 0.2000 — — — — 100,000,000 — 100,000,000
Total for directors — 130,000,000 130,000,000 4,000,000 100,000,000 (20,000,000) 214,000,000
Employees of the Group (b) 02.09.2010 17.09.2011–16.09.2015 0.2000 — 164,200,000 164,200,000 — — (107,000,000) 57,200,000
(b) 24.09.2010 24.09.2011–23.09.2015 0.2000 — 4,000,000 4,000,000 — — (4,000,000) —(b) 30.09.2010 30.09.2011–29.09.2015 0.2350 — 4,000,000 4,000,000 (4,000,000) — — —(b) 13.12.2010 13.12.2011–12.12.2015 0.2700 — 4,000,000 4,000,000 — — — 4,000,000(b) 28.02.2011 28.02.2012–27.02.2016 0.2350 — 53,500,000 53,500,000 — — (10,000,000) 43,500,000
Total for employees — 229,700,000 229,700,000 (4,000,000) — (121,000,000) 104,700,000
Total for Tranche B — 359,700,000 359,700,000 — 100,000,000 (141,000,000) 318,700,000
Advisor of the Group (c) 30.09.2011 01.10.2011–30.09.2012 0.2000 — — — — 50,000,000 — 50,000,000
Exercisable at the end of the years — — 50,000,000
Weighted average exercise price — 0.2126 0.2126 — 0.2000 0.2170 0.2075
Notes:
(a) Vesting conditions of these share options (“Tranche A” Options) are as follows:
(i) as to one-third of the share options, upon the average closing share price for a continuous period of 30 days
immediately after twelve months from the date of grant of the share options being not less than 200% of the
exercise price;
(ii) as to another one-third of the share options, upon the first copper production by the Mina Justa Project (as defined in
note 36(a)) held by Chariot Group (as defined in note 36(a)); and
(iii) as to the remaining one-third, upon the process plant of the Mina Justa Project being in operation and having
reached its designed capacity within a range of 10% deviation for the average of the first year of production as
defined by the mine schedule and plan and as approved by the Board for a continuous period of six months.
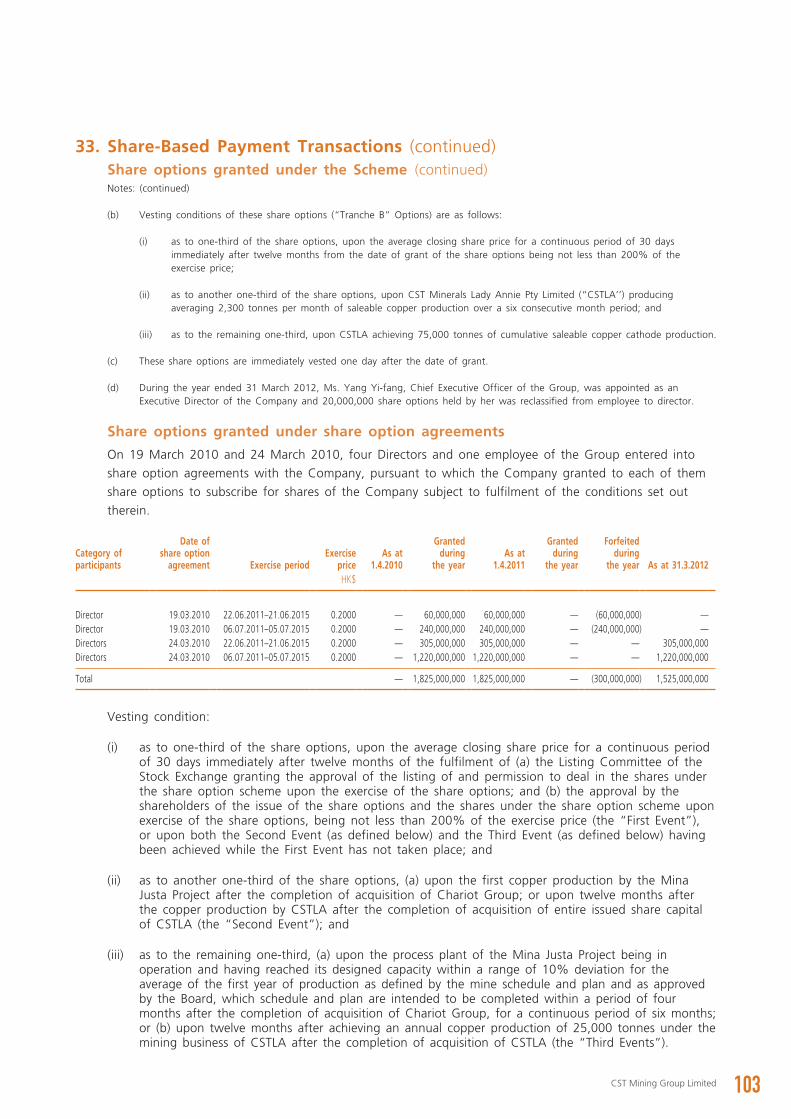
103CST Mining Group Limited
33. Share-Based Payment Transactions (continued) Share options granted under the Scheme (continued)
Notes: (continued)
(b) Vesting conditions of these share options (“Tranche B” Options) are as follows:
(i) as to one-third of the share options, upon the average closing share price for a continuous period of 30 days immediately after twelve months from the date of grant of the share options being not less than 200% of the exercise price;
(ii) as to another one-third of the share options, upon CST Minerals Lady Annie Pty Limited (“CSTLA’’) producing averaging 2,300 tonnes per month of saleable copper production over a six consecutive month period; and
(iii) as to the remaining one-third, upon CSTLA achieving 75,000 tonnes of cumulative saleable copper cathode production.
(c) These share options are immediately vested one day after the date of grant.
(d) During the year ended 31 March 2012, Ms. Yang Yi-fang, Chief Executive Officer of the Group, was appointed as an Executive Director of the Company and 20,000,000 share options held by her was reclassified from employee to director.
Share options granted under share option agreements
On 19 March 2010 and 24 March 2010, four Directors and one employee of the Group entered into
share option agreements with the Company, pursuant to which the Company granted to each of them
share options to subscribe for shares of the Company subject to fulfilment of the conditions set out
therein.
Category of participants
Date of share option
agreement Exercise periodExercise
priceAs at
1.4.2010
Granted during
the yearAs at
1.4.2011
Granted during
the year
Forfeited during
the year As at 31.3.2012HK$
Director 19.03.2010 22.06.2011–21.06.2015 0.2000 — 60,000,000 60,000,000 — (60,000,000) —Director 19.03.2010 06.07.2011–05.07.2015 0.2000 — 240,000,000 240,000,000 — (240,000,000) —Directors 24.03.2010 22.06.2011–21.06.2015 0.2000 — 305,000,000 305,000,000 — — 305,000,000Directors 24.03.2010 06.07.2011–05.07.2015 0.2000 — 1,220,000,000 1,220,000,000 — — 1,220,000,000
Total — 1,825,000,000 1,825,000,000 — (300,000,000) 1,525,000,000
Vesting condition:
(i) as to one-third of the share options, upon the average closing share price for a continuous period of 30 days immediately after twelve months of the fulfilment of (a) the Listing Committee of the Stock Exchange granting the approval of the listing of and permission to deal in the shares under the share option scheme upon the exercise of the share options; and (b) the approval by the shareholders of the issue of the share options and the shares under the share option scheme upon exercise of the share options, being not less than 200% of the exercise price (the “First Event”), or upon both the Second Event (as defined below) and the Third Event (as defined below) having been achieved while the First Event has not taken place; and
(ii) as to another one-third of the share options, (a) upon the first copper production by the Mina Justa Project after the completion of acquisition of Chariot Group; or upon twelve months after the copper production by CSTLA after the completion of acquisition of entire issued share capital of CSTLA (the “Second Event”); and
(iii) as to the remaining one-third, (a) upon the process plant of the Mina Justa Project being in operation and having reached its designed capacity within a range of 10% deviation for the average of the first year of production as defined by the mine schedule and plan and as approved by the Board, which schedule and plan are intended to be completed within a period of four months after the completion of acquisition of Chariot Group, for a continuous period of six months; or (b) upon twelve months after achieving an annual copper production of 25,000 tonnes under the mining business of CSTLA after the completion of acquisition of CSTLA (the “Third Events”).
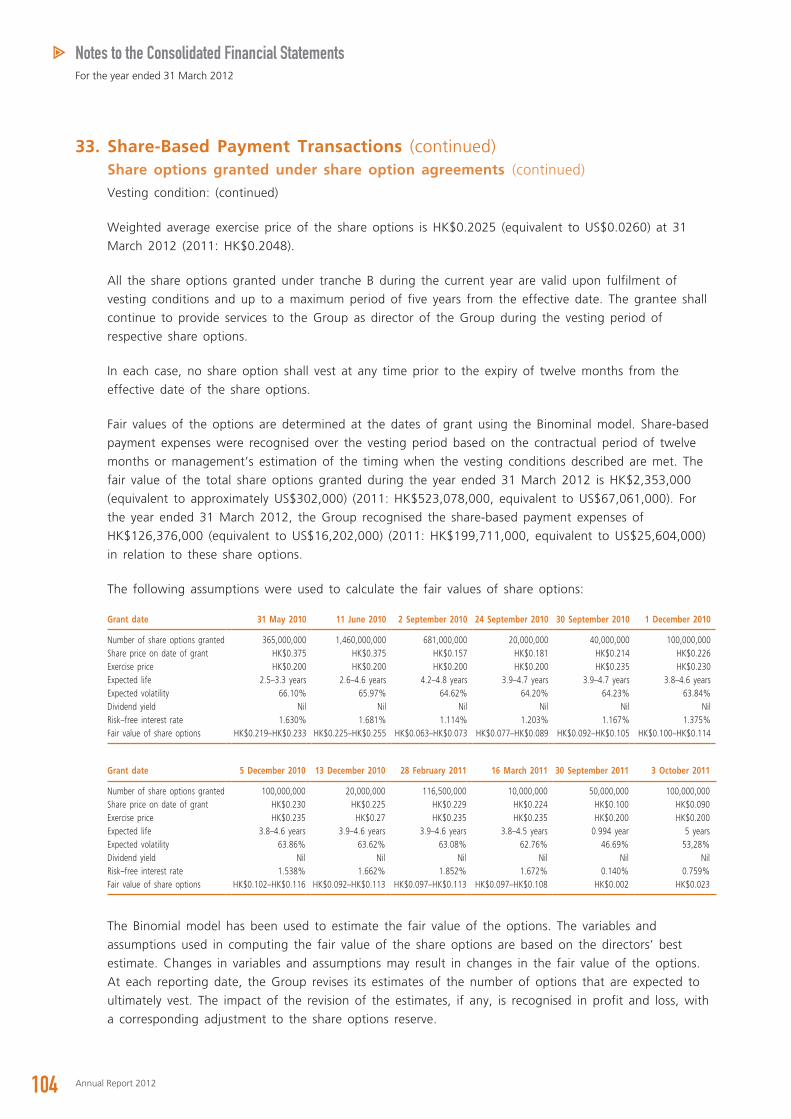
104 Annual Report 2012
Notes to the Consolidated Financial StatementsFor the year ended 31 March 2012
33. Share-Based Payment Transactions (continued) Share options granted under share option agreements (continued)
Vesting condition: (continued)
Weighted average exercise price of the share options is HK$0.2025 (equivalent to US$0.0260) at 31
March 2012 (2011: HK$0.2048).
All the share options granted under tranche B during the current year are valid upon fulfilment of
vesting conditions and up to a maximum period of five years from the effective date. The grantee shall
continue to provide services to the Group as director of the Group during the vesting period of
respective share options.
In each case, no share option shall vest at any time prior to the expiry of twelve months from the
effective date of the share options.
Fair values of the options are determined at the dates of grant using the Binominal model. Share-based
payment expenses were recognised over the vesting period based on the contractual period of twelve
months or management’s estimation of the timing when the vesting conditions described are met. The
fair value of the total share options granted during the year ended 31 March 2012 is HK$2,353,000
(equivalent to approximately US$302,000) (2011: HK$523,078,000, equivalent to US$67,061,000). For
the year ended 31 March 2012, the Group recognised the share-based payment expenses of
HK$126,376,000 (equivalent to US$16,202,000) (2011: HK$199,711,000, equivalent to US$25,604,000)
in relation to these share options.
The following assumptions were used to calculate the fair values of share options:
Grant date 31 May 2010 11 June 2010 2 September 2010 24 September 2010 30 September 2010 1 December 2010
Number of share options granted 365,000,000 1,460,000,000 681,000,000 20,000,000 40,000,000 100,000,000Share price on date of grant HK$0.375 HK$0.375 HK$0.157 HK$0.181 HK$0.214 HK$0.226Exercise price HK$0.200 HK$0.200 HK$0.200 HK$0.200 HK$0.235 HK$0.230Expected life 2.5–3.3 years 2.6–4.6 years 4.2–4.8 years 3.9–4.7 years 3.9–4.7 years 3.8–4.6 yearsExpected volatility 66.10% 65.97% 64.62% 64.20% 64.23% 63.84%Dividend yield Nil Nil Nil Nil Nil NilRisk–free interest rate 1.630% 1.681% 1.114% 1.203% 1.167% 1.375%Fair value of share options HK$0.219–HK$0.233 HK$0.225–HK$0.255 HK$0.063–HK$0.073 HK$0.077–HK$0.089 HK$0.092–HK$0.105 HK$0.100–HK$0.114
Grant date 5 December 2010 13 December 2010 28 February 2011 16 March 2011 30 September 2011 3 October 2011
Number of share options granted 100,000,000 20,000,000 116,500,000 10,000,000 50,000,000 100,000,000Share price on date of grant HK$0.230 HK$0.225 HK$0.229 HK$0.224 HK$0.100 HK$0.090Exercise price HK$0.235 HK$0.27 HK$0.235 HK$0.235 HK$0.200 HK$0.200Expected life 3.8–4.6 years 3.9–4.6 years 3.9–4.6 years 3.8–4.5 years 0.994 year 5 yearsExpected volatility 63.86% 63.62% 63.08% 62.76% 46.69% 53,28%Dividend yield Nil Nil Nil Nil Nil NilRisk–free interest rate 1.538% 1.662% 1.852% 1.672% 0.140% 0.759%Fair value of share options HK$0.102–HK$0.116 HK$0.092–HK$0.113 HK$0.097–HK$0.113 HK$0.097–HK$0.108 HK$0.002 HK$0.023
The Binomial model has been used to estimate the fair value of the options. The variables and
assumptions used in computing the fair value of the share options are based on the directors’ best
estimate. Changes in variables and assumptions may result in changes in the fair value of the options.
At each reporting date, the Group revises its estimates of the number of options that are expected to
ultimately vest. The impact of the revision of the estimates, if any, is recognised in profit and loss, with
a corresponding adjustment to the share options reserve.
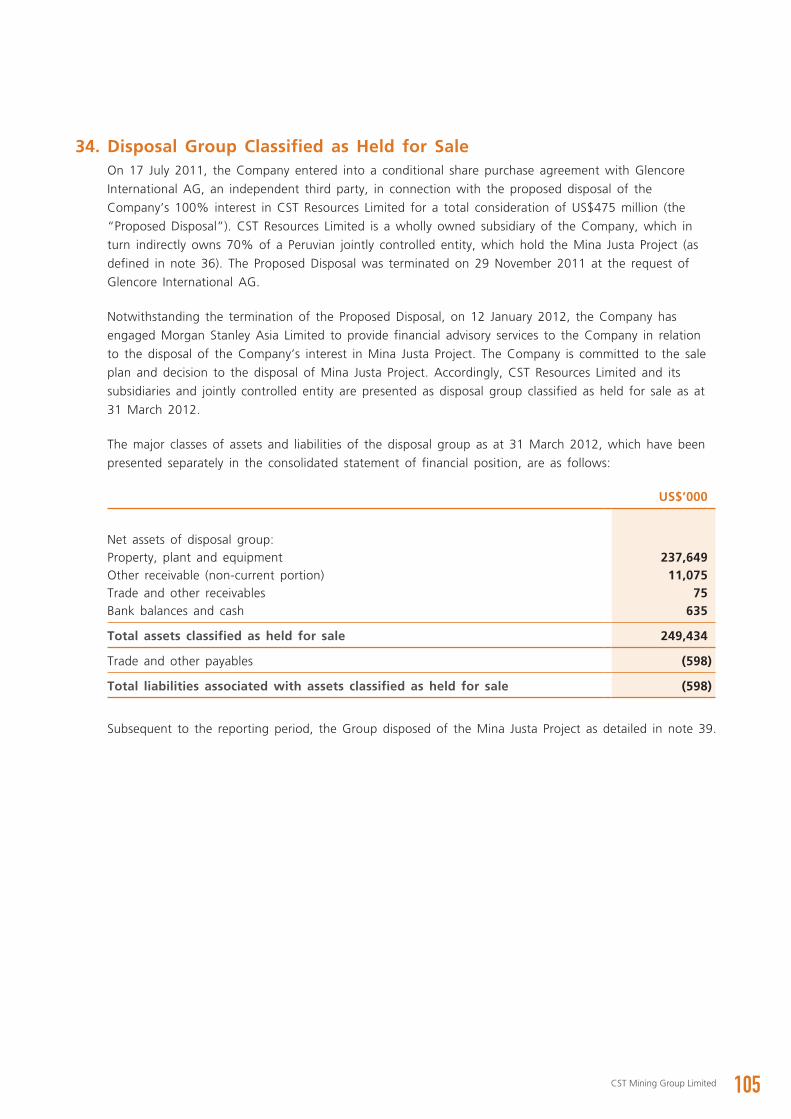
105CST Mining Group Limited
34. Disposal Group Classified as Held for SaleOn 17 July 2011, the Company entered into a conditional share purchase agreement with Glencore
International AG, an independent third party, in connection with the proposed disposal of the
Company’s 100% interest in CST Resources Limited for a total consideration of US$475 million (the
“Proposed Disposal”). CST Resources Limited is a wholly owned subsidiary of the Company, which in
turn indirectly owns 70% of a Peruvian jointly controlled entity, which hold the Mina Justa Project (as
defined in note 36). The Proposed Disposal was terminated on 29 November 2011 at the request of
Glencore International AG.
Notwithstanding the termination of the Proposed Disposal, on 12 January 2012, the Company has
engaged Morgan Stanley Asia Limited to provide financial advisory services to the Company in relation
to the disposal of the Company’s interest in Mina Justa Project. The Company is committed to the sale
plan and decision to the disposal of Mina Justa Project. Accordingly, CST Resources Limited and its
subsidiaries and jointly controlled entity are presented as disposal group classified as held for sale as at
31 March 2012.
The major classes of assets and liabilities of the disposal group as at 31 March 2012, which have been
presented separately in the consolidated statement of financial position, are as follows:
US$’000
Net assets of disposal group:Property, plant and equipment 237,649Other receivable (non-current portion) 11,075Trade and other receivables 75Bank balances and cash 635
Total assets classified as held for sale 249,434
Trade and other payables (598)
Total liabilities associated with assets classified as held for sale (598)
Subsequent to the reporting period, the Group disposed of the Mina Justa Project as detailed in note 39.
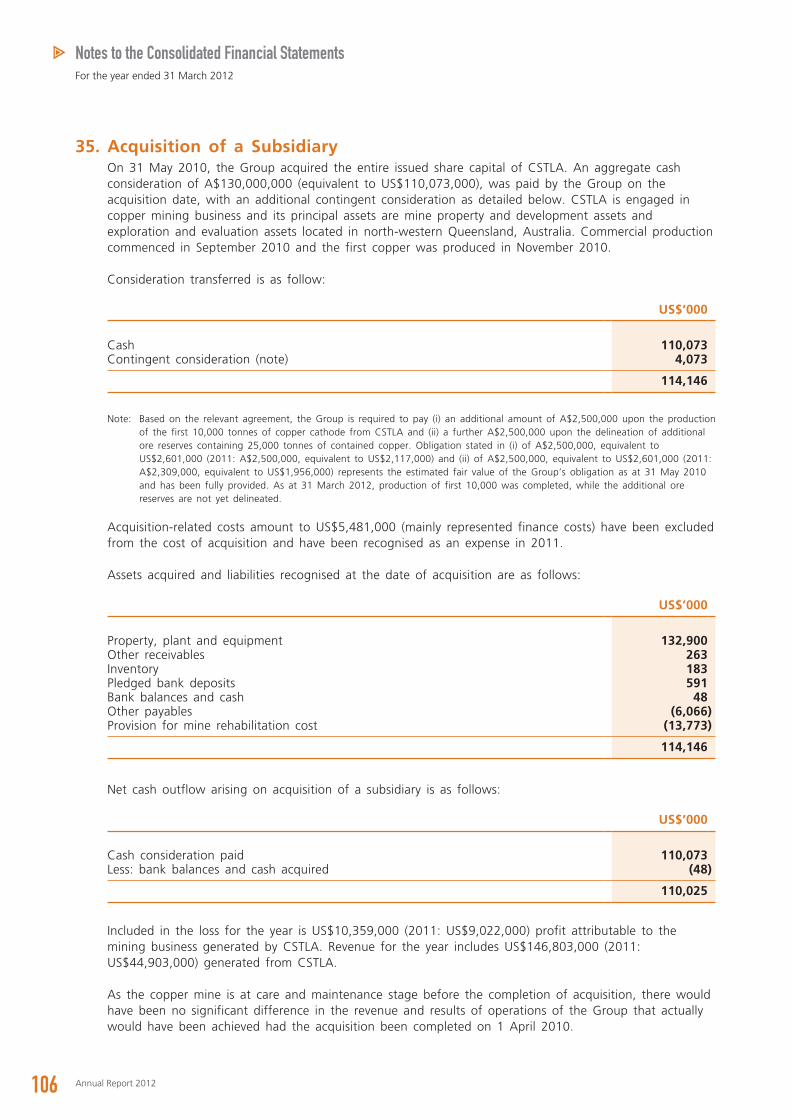
106 Annual Report 2012
Notes to the Consolidated Financial StatementsFor the year ended 31 March 2012
35. Acquisition of a SubsidiaryOn 31 May 2010, the Group acquired the entire issued share capital of CSTLA. An aggregate cash consideration of A$130,000,000 (equivalent to US$110,073,000), was paid by the Group on the acquisition date, with an additional contingent consideration as detailed below. CSTLA is engaged in copper mining business and its principal assets are mine property and development assets and exploration and evaluation assets located in north-western Queensland, Australia. Commercial production commenced in September 2010 and the first copper was produced in November 2010.
Consideration transferred is as follow:
US$’000
Cash 110,073Contingent consideration (note) 4,073
114,146
Note: Based on the relevant agreement, the Group is required to pay (i) an additional amount of A$2,500,000 upon the production of the first 10,000 tonnes of copper cathode from CSTLA and (ii) a further A$2,500,000 upon the delineation of additional ore reserves containing 25,000 tonnes of contained copper. Obligation stated in (i) of A$2,500,000, equivalent to US$2,601,000 (2011: A$2,500,000, equivalent to US$2,117,000) and (ii) of A$2,500,000, equivalent to US$2,601,000 (2011: A$2,309,000, equivalent to US$1,956,000) represents the estimated fair value of the Group’s obligation as at 31 May 2010 and has been fully provided. As at 31 March 2012, production of first 10,000 was completed, while the additional ore reserves are not yet delineated.
Acquisition-related costs amount to US$5,481,000 (mainly represented finance costs) have been excluded from the cost of acquisition and have been recognised as an expense in 2011.
Assets acquired and liabilities recognised at the date of acquisition are as follows:
US$’000
Property, plant and equipment 132,900Other receivables 263Inventory 183Pledged bank deposits 591Bank balances and cash 48Other payables (6,066)Provision for mine rehabilitation cost (13,773)
114,146
Net cash outflow arising on acquisition of a subsidiary is as follows:
US$’000
Cash consideration paid 110,073Less: bank balances and cash acquired (48)
110,025
Included in the loss for the year is US$10,359,000 (2011: US$9,022,000) profit attributable to the mining business generated by CSTLA. Revenue for the year includes US$146,803,000 (2011: US$44,903,000) generated from CSTLA.
As the copper mine is at care and maintenance stage before the completion of acquisition, there would have been no significant difference in the revenue and results of operations of the Group that actually would have been achieved had the acquisition been completed on 1 April 2010.
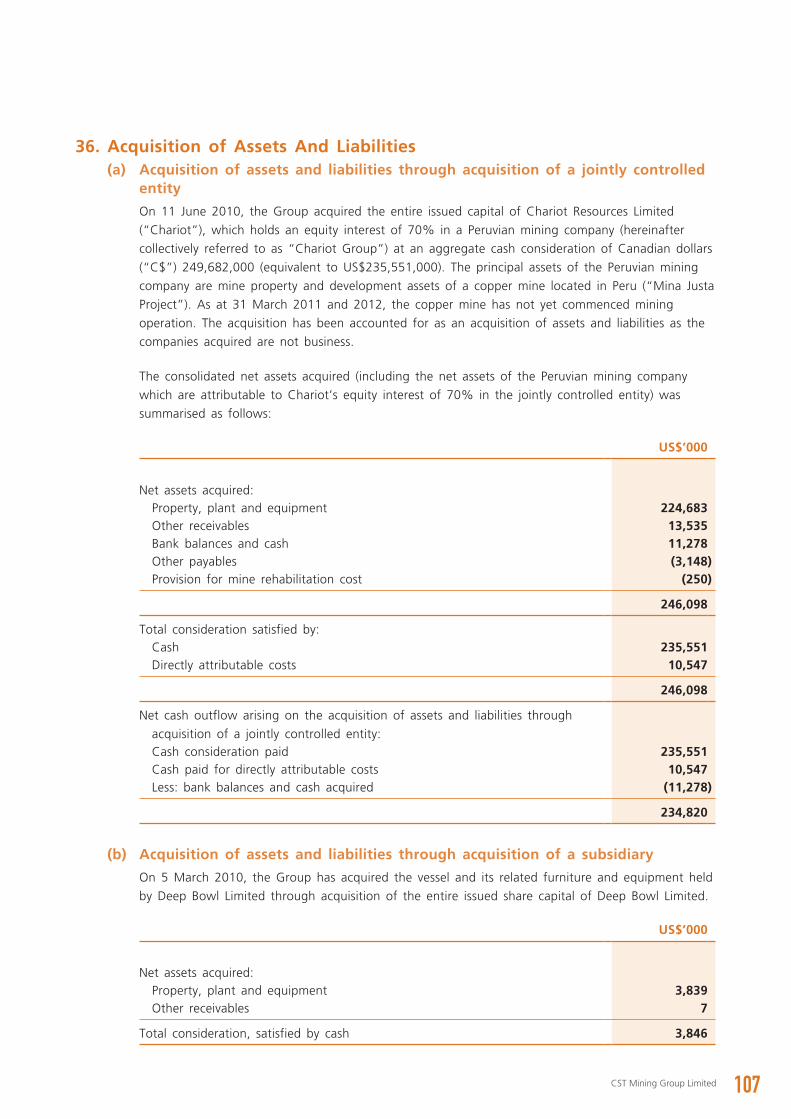
107CST Mining Group Limited
36. Acquisition of Assets And Liabilities (a) Acquisition of assets and liabilities through acquisition of a jointly controlled
entity
On 11 June 2010, the Group acquired the entire issued capital of Chariot Resources Limited
(“Chariot”), which holds an equity interest of 70% in a Peruvian mining company (hereinafter
collectively referred to as “Chariot Group”) at an aggregate cash consideration of Canadian dollars
(“C$”) 249,682,000 (equivalent to US$235,551,000). The principal assets of the Peruvian mining
company are mine property and development assets of a copper mine located in Peru (“Mina Justa
Project”). As at 31 March 2011 and 2012, the copper mine has not yet commenced mining
operation. The acquisition has been accounted for as an acquisition of assets and liabilities as the
companies acquired are not business.
The consolidated net assets acquired (including the net assets of the Peruvian mining company
which are attributable to Chariot’s equity interest of 70% in the jointly controlled entity) was
summarised as follows:
US$’000
Net assets acquired:Property, plant and equipment 224,683Other receivables 13,535Bank balances and cash 11,278Other payables (3,148)Provision for mine rehabilitation cost (250)
246,098
Total consideration satisfied by:Cash 235,551Directly attributable costs 10,547
246,098
Net cash outflow arising on the acquisition of assets and liabilities through
acquisition of a jointly controlled entity:Cash consideration paid 235,551Cash paid for directly attributable costs 10,547Less: bank balances and cash acquired (11,278)
234,820
(b) Acquisition of assets and liabilities through acquisition of a subsidiary
On 5 March 2010, the Group has acquired the vessel and its related furniture and equipment held
by Deep Bowl Limited through acquisition of the entire issued share capital of Deep Bowl Limited.
US$’000
Net assets acquired:Property, plant and equipment 3,839Other receivables 7
Total consideration, satisfied by cash 3,846
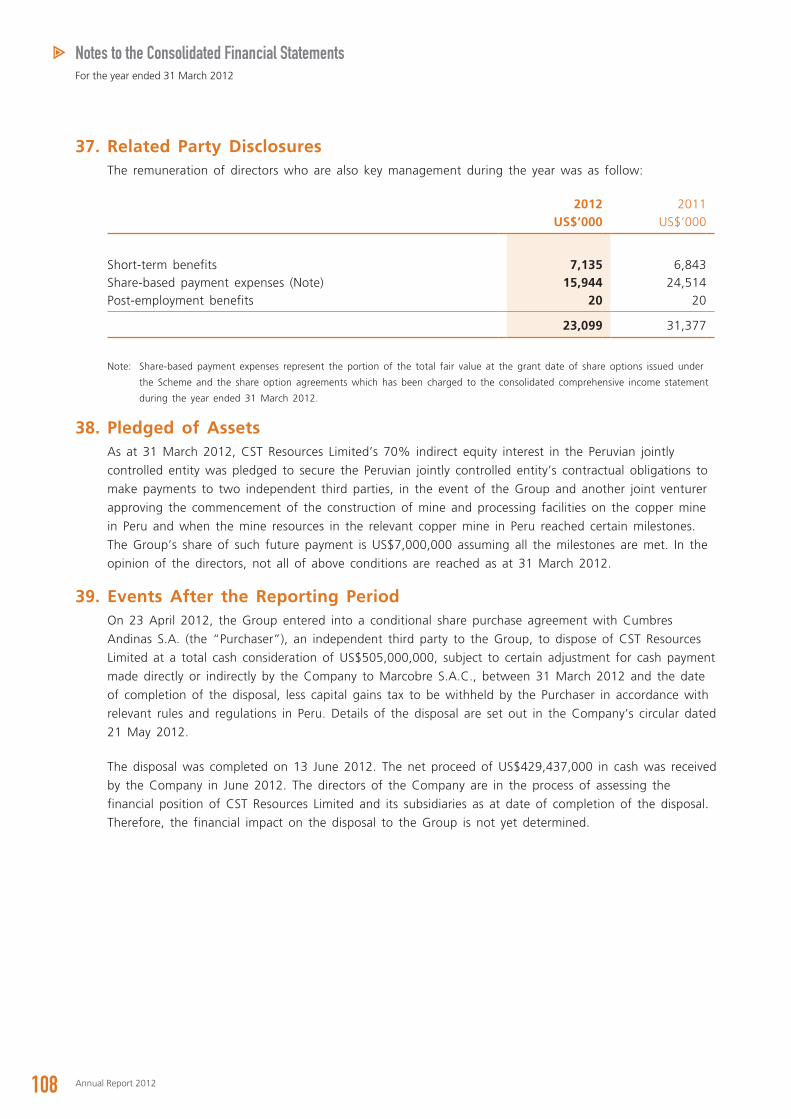
108 Annual Report 2012
Notes to the Consolidated Financial StatementsFor the year ended 31 March 2012
37. Related Party DisclosuresThe remuneration of directors who are also key management during the year was as follow:
2012 2011US$’000 US$’000
Short-term benefits 7,135 6,843Share-based payment expenses (Note) 15,944 24,514Post-employment benefits 20 20
23,099 31,377
Note: Share-based payment expenses represent the portion of the total fair value at the grant date of share options issued under
the Scheme and the share option agreements which has been charged to the consolidated comprehensive income statement
during the year ended 31 March 2012.
38. Pledged of AssetsAs at 31 March 2012, CST Resources Limited’s 70% indirect equity interest in the Peruvian jointly
controlled entity was pledged to secure the Peruvian jointly controlled entity’s contractual obligations to
make payments to two independent third parties, in the event of the Group and another joint venturer
approving the commencement of the construction of mine and processing facilities on the copper mine
in Peru and when the mine resources in the relevant copper mine in Peru reached certain milestones.
The Group’s share of such future payment is US$7,000,000 assuming all the milestones are met. In the
opinion of the directors, not all of above conditions are reached as at 31 March 2012.
39. Events After the Reporting PeriodOn 23 April 2012, the Group entered into a conditional share purchase agreement with Cumbres
Andinas S.A. (the “Purchaser”), an independent third party to the Group, to dispose of CST Resources
Limited at a total cash consideration of US$505,000,000, subject to certain adjustment for cash payment
made directly or indirectly by the Company to Marcobre S.A.C., between 31 March 2012 and the date
of completion of the disposal, less capital gains tax to be withheld by the Purchaser in accordance with
relevant rules and regulations in Peru. Details of the disposal are set out in the Company’s circular dated
21 May 2012.
The disposal was completed on 13 June 2012. The net proceed of US$429,437,000 in cash was received
by the Company in June 2012. The directors of the Company are in the process of assessing the
financial position of CST Resources Limited and its subsidiaries as at date of completion of the disposal.
Therefore, the financial impact on the disposal to the Group is not yet determined.
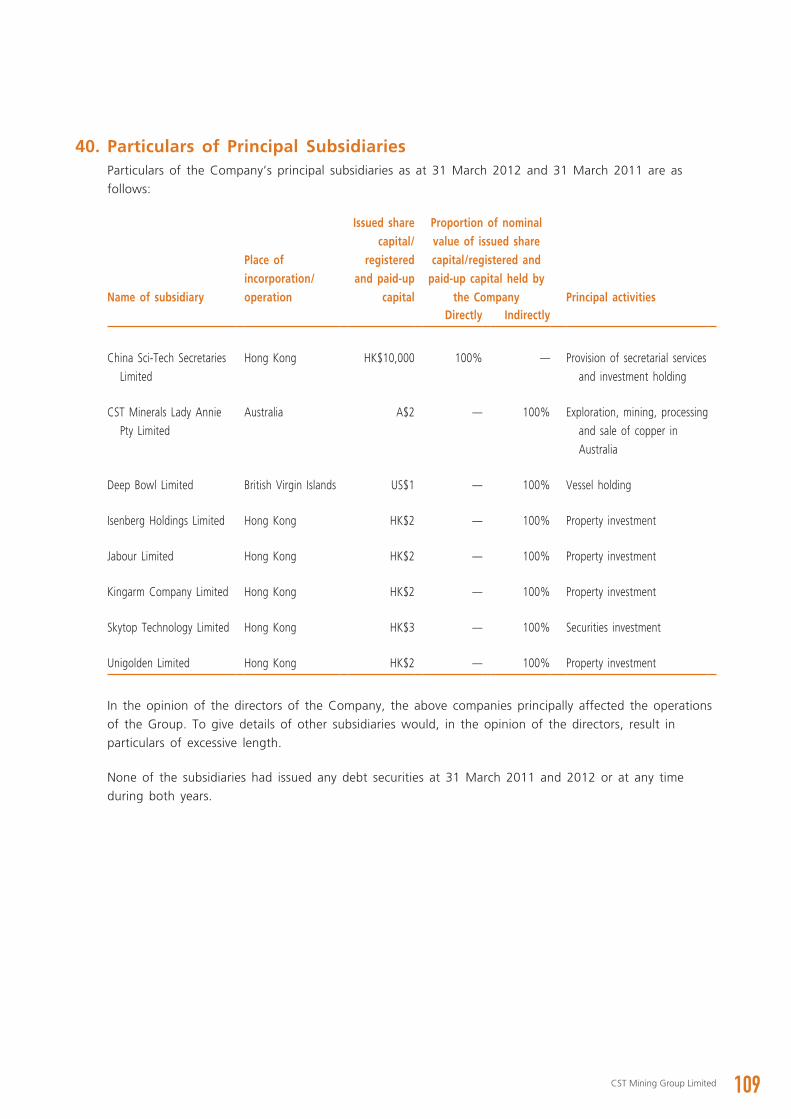
109CST Mining Group Limited
40. Particulars of Principal SubsidiariesParticulars of the Company’s principal subsidiaries as at 31 March 2012 and 31 March 2011 are as
follows:
Name of subsidiary
Place of incorporation/operation
Issued share capital/
registered and paid-up
capital
Proportion of nominal value of issued share capital/registered and
paid-up capital held by the Company Principal activities
Directly Indirectly
China Sci-Tech Secretaries
Limited
Hong Kong HK$10,000 100% — Provision of secretarial services
and investment holding
CST Minerals Lady Annie
Pty Limited
Australia A$2 — 100% Exploration, mining, processing
and sale of copper in
Australia
Deep Bowl Limited British Virgin Islands US$1 — 100% Vessel holding
Isenberg Holdings Limited Hong Kong HK$2 — 100% Property investment
Jabour Limited Hong Kong HK$2 — 100% Property investment
Kingarm Company Limited Hong Kong HK$2 — 100% Property investment
Skytop Technology Limited Hong Kong HK$3 — 100% Securities investment
Unigolden Limited Hong Kong HK$2 — 100% Property investment
In the opinion of the directors of the Company, the above companies principally affected the operations
of the Group. To give details of other subsidiaries would, in the opinion of the directors, result in
particulars of excessive length.
None of the subsidiaries had issued any debt securities at 31 March 2011 and 2012 or at any time
during both years.
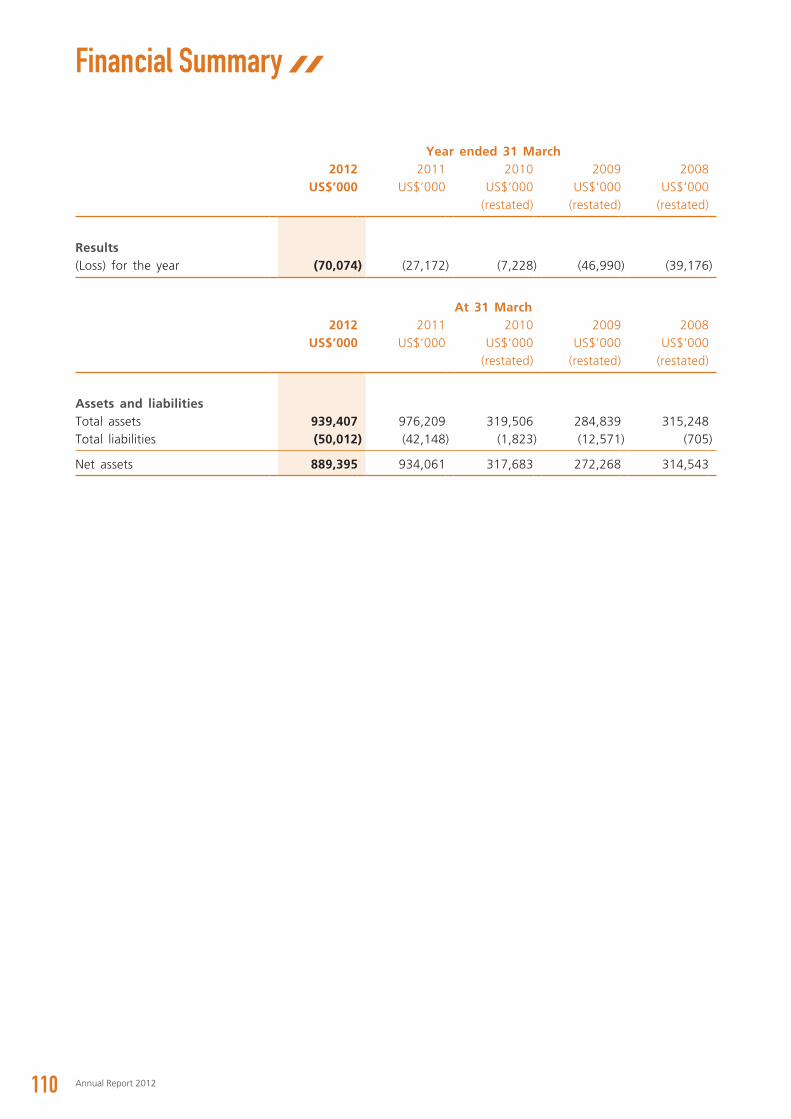
Financial Summary
110 Annual Report 2012
Year ended 31 March2012 2011 2010 2009 2008
US$’000 US$’000 US$’000 US$’000 US$’000(restated) (restated) (restated)
Results(Loss) for the year (70,074) (27,172) (7,228) (46,990) (39,176)
At 31 March2012 2011 2010 2009 2008
US$’000 US$’000 US$’000 US$’000 US$’000(restated) (restated) (restated)
Assets and liabilitiesTotal assets 939,407 976,209 319,506 284,839 315,248Total liabilities (50,012) (42,148) (1,823) (12,571) (705)
Net assets 889,395 934,061 317,683 272,268 314,543
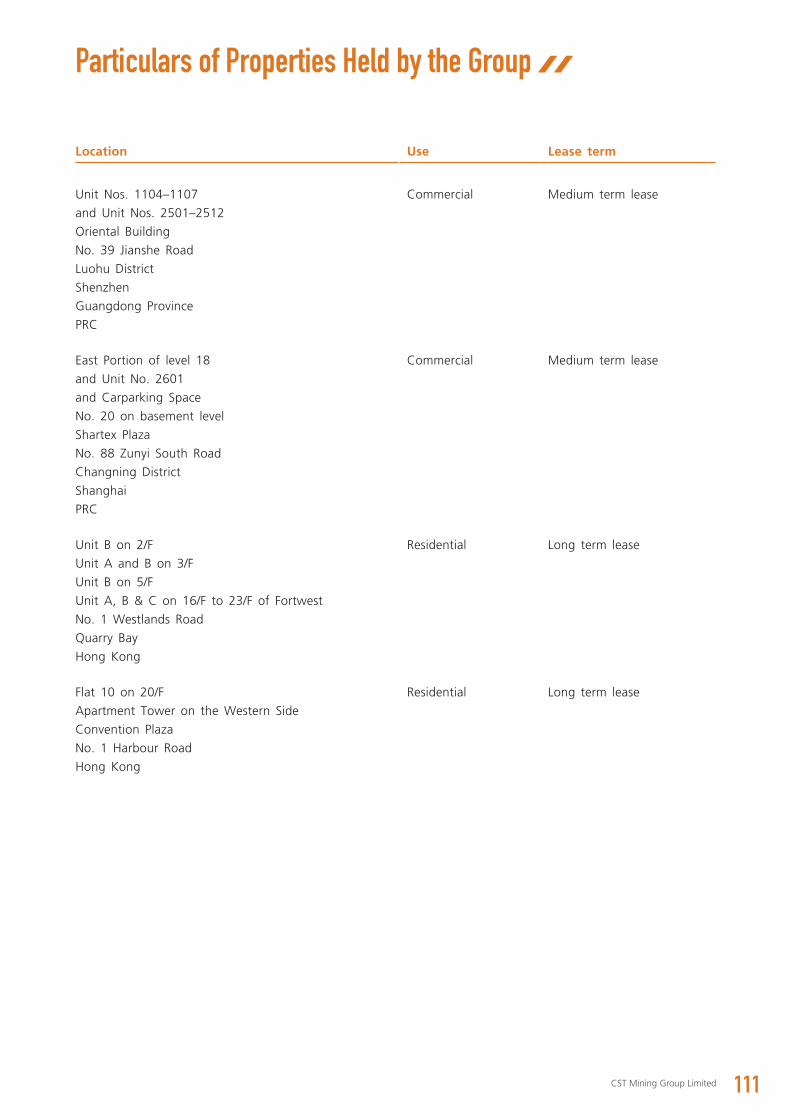
Particulars of Properties Held by the Group
111CST Mining Group Limited
Location Use Lease term
Unit Nos. 1104–1107
and Unit Nos. 2501–2512
Oriental Building
No. 39 Jianshe Road
Luohu District
Shenzhen
Guangdong Province
PRC
Commercial Medium term lease
East Portion of level 18
and Unit No. 2601
and Carparking Space
No. 20 on basement level
Shartex Plaza
No. 88 Zunyi South Road
Changning District
Shanghai
PRC
Commercial Medium term lease
Unit B on 2/F
Unit A and B on 3/F
Unit B on 5/F
Unit A, B & C on 16/F to 23/F of Fortwest
No. 1 Westlands Road
Quarry Bay
Hong Kong
Residential Long term lease
Flat 10 on 20/F
Apartment Tower on the Western Side
Convention Plaza
No. 1 Harbour Road
Hong Kong
Residential Long term lease
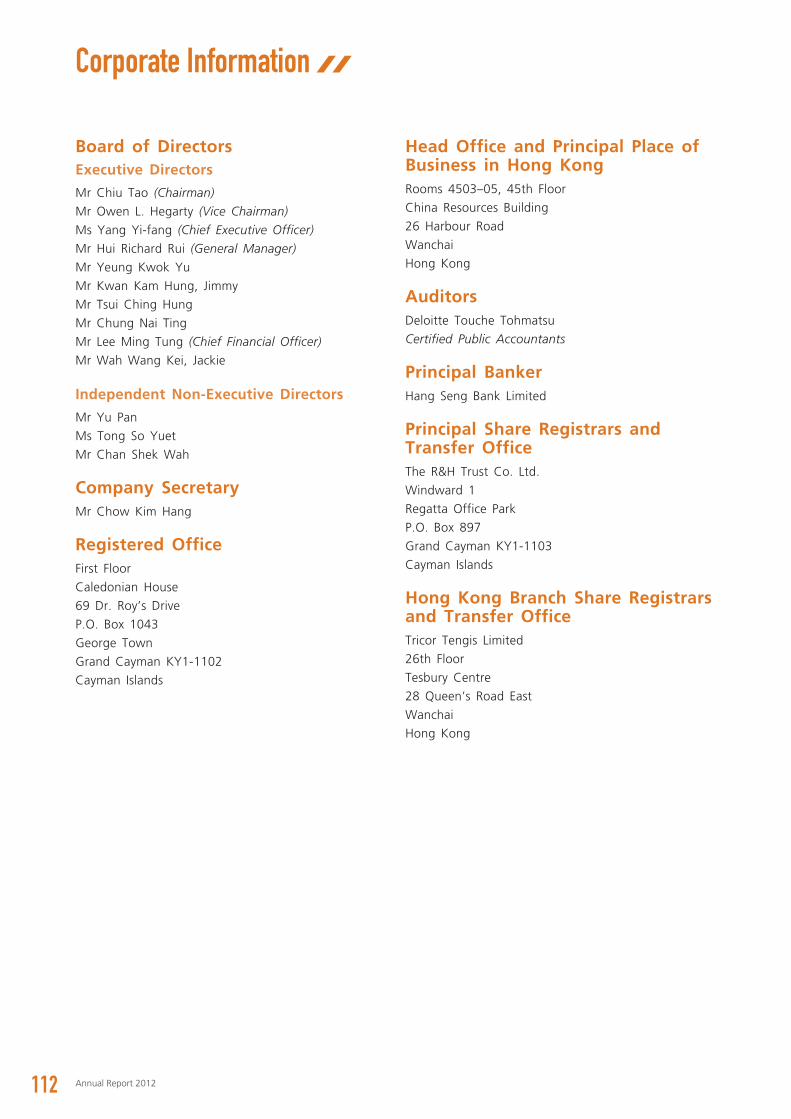
Corporate Information
112 Annual Report 2012
Board of DirectorsExecutive Directors
Mr Chiu Tao (Chairman)
Mr Owen L. Hegarty (Vice Chairman)
Ms Yang Yi-fang (Chief Executive Officer)
Mr Hui Richard Rui (General Manager)
Mr Yeung Kwok Yu
Mr Kwan Kam Hung, Jimmy
Mr Tsui Ching Hung
Mr Chung Nai Ting
Mr Lee Ming Tung (Chief Financial Officer)
Mr Wah Wang Kei, Jackie
Independent Non-Executive Directors
Mr Yu Pan
Ms Tong So Yuet
Mr Chan Shek Wah
Company SecretaryMr Chow Kim Hang
Registered OfficeFirst Floor
Caledonian House
69 Dr. Roy’s Drive
P.O. Box 1043
George Town
Grand Cayman KY1-1102
Cayman Islands
Head Office and Principal Place of Business in Hong KongRooms 4503–05, 45th Floor
China Resources Building
26 Harbour Road
Wanchai
Hong Kong
AuditorsDeloitte Touche Tohmatsu
Certified Public Accountants
Principal BankerHang Seng Bank Limited
Principal Share Registrars and Transfer OfficeThe R&H Trust Co. Ltd.
Windward 1
Regatta Office Park
P.O. Box 897
Grand Cayman KY1-1103
Cayman Islands
Hong Kong Branch Share Registrars and Transfer OfficeTricor Tengis Limited
26th Floor
Tesbury Centre
28 Queen’s Road East
Wanchai
Hong Kong

Des
igne
d b
y
Annual Report 2012
CST Mining Group Limited
NEW ERA Corporate OverviewCST Mining Group Limited (“Company” or “We”) is an international copper mining company headquartered in Hong Kong and listed on the Hong Kong Stock Exchange (HKEx: 985).
At present, the Company has two operations: a whollyowned mine in Queensland, Australia (Lady Annie) and a late-stage development project (Mina Justa) in southernPeru through our 70%-owned company, Marcobre S.A.C.
We also own a 9.9% stake in Hong Kong listed G-Resources Group Limited, whose primary asset is a 95% equity interestin the Martabe Gold and Silver Project in Indonesia.
Mission and VisionTo become a globally competitive copper-group producer.
We intend to grow both organically through exploration and non-organically through acquisitions, with a focus on development-ready or advanced exploration projects.
CST M
inin
g G
rou
p Lim
ited
An
nu
al Rep
ort 2012CST Mining Group Limited
(Incorporated in Cayman Islands with limited liability)
Stock code: 985
REGISTERED OFFICE
First Floor
Caledonian House
69 Dr. Roy’s Drive
P.O. Box 1043
George Town
Grand Cayman KY1-1102
Cayman Islands
HONG KONG OFFICE
Rooms 4503-05, 45th Floor
China Resources Building
26 Harbour Road
Wanchai
Hong Kong
www.cstmining.com
Prepare to enter into a


![[ENTER] - Sacramento Area Council of Governments](https://img.pdfslide.net/doc/110x75/6332bd753108fad7760ec187/enter-sacramento-area-council-of-governments.jpg)


