Embed Size (px)
Citation preview

Management Accounting for Multinational
Companies
Associate ProfessorIGOR BARANOV
Graduate School of ManagementSt.Petersburg State University

INTRODUCTION

3
Activities
Lectures
Case studies discussions
Presentations

4
What are we going to discuss? Management accounting in an organization Cost Management Concepts and Cost Behavior Full (absorption) costing Strategic cost management Life-cycle, target and kaizen costing Differential cost analysis for marketing and production decisions
Budgeting, responsibility centers, and performance evaluation
Balanced scorecard

5
Textbooks Blocher, Chen, Cokins, Lin. Cost Management: A Strategic Emphasis. 2005.
Drury C. Cost and Management Accounting. 2006.
Reference textbooks (Introduction of Management Accounting)

6
Case studies Cases in Management Accounting: Current Practices in European Companies. T.Groot and K.Lukka (eds.)
HBS case studies Russian case studies

7
Case studies Wilkerson Company: Introducing ABC Denim Finishing: Using ABC Information for Decision Making
Kemps LLC: Introducing Time-Driven ABC AB SKA (Sweden): Management Accounting of R&D Expenses
Microsoft Latin America: Balanced Scorecard

8
Presentations: some examples Operational and strategic activity-based management
“Beyond budgeting” Using Balanced Scorecards for Universities
Management accounting in transitional economies
Using balanced scorecards in the public sector
Management accounting in France

9
Grading Policy Case studies (based on your input) – 20%
Presentations – 10% (presentation + report).
Mid-term exam – 20% Final exam – 50%
Discussion questions Problems and mini cases

10
Contacts Classes: Mondays 10:45am – 2:30pm
Office: 317 (A.Schultz building)
Office hours: Mondays 2:30pm and by appointment
E-mail: [email protected]
Management Accounting in an Organization
12
Learning Objectives Distinguish between managerial &
financial accounting. Understand how managers can use
accounting information to implement strategies.
Identify the key financial players in the organization.
Understand managerial accountants’ professional environment.
Master the concept of cost.

13
Compare Financial & Managerial AccountingFinancial Accounting Deals with reporting to parties outside the organization
Highly regulated Primarily uses historical data
Managerial Accounting
Deals with activities inside an organization
Unregulated May use projections about the future

14
Management Accounting Information (1)
The Institute of Management Accountants has defined management accounting as: A value-adding continuous improvement process of
planning, designing, measuring and operating both nonfinancial information systems and financial information systems that guides management action, motivates behavior, and supports and creates the cultural values necessary to achieve an organization’s strategic, tactical and operating objectives

15
Management Accounting Information (2)
Be aware that this definition identifies: Management accounting as providing both financial information and nonfinancial information
The role of management information as supporting strategic (planning), operational (operating) and control (performance evaluation) management decision making
In short, management accounting information is pervasive and purposeful It is intended to meet specific decision-making needs at all levels in the organization

16
Examples of management accounting information include: The reported expense of an operating department, such as the assembly department of an automobile plant or an electronics company
The costs of producing a product The cost of delivering a service The cost of performing an activity or business process – such as creating a customer invoice
The costs of serving a customer
Management Accounting Information (3)

17
Management Accounting Information (4) Management accounting also produces measures of the economic performance of decentralized operating units, such as: Business units Divisions Departments
These measures help senior managers assess the performance of the company’s decentralized units

18
Management Accounting Information (5)
Management accounting information is a key source of information for decision making, improvement, and control in organizations
Effective management accounting systems can create considerable value to today’s organizations by providing timely and accurate information about the activities required for their success

19
Changing Focus Traditionally, management accounting information has been financial information
Management accounting information has now expanded to encompass information that is operational and nonfinancial: Quality and process times More subjective measurements (such as customer satisfaction, employee capabilities, new product performance)
Three dimensions: Financial / Non-financial information Internal / External information Operational / Strategic information

20
Financial v. Management Accounting Financial Accounting Deals with reporting to parties outside the organization
Deals with the organization as a whole
Highly regulated Primarily uses historical data
Management Accounting Deals with activities inside an organization
Deals with responsibilities centers within the organization as well as with the organization as a whole
Unregulated May use projections about the future
21
A Brief History (1 of 4) In the late 19th century, railroad managers implemented large and complex costing systems Allowed them to compute the costs of the different types of freight that they carried
Supported efficiency improvements and pricing in the railroads
The railroads were the first modern industry to develop and use broad financial statistics to assess organization performance
About the same time, Andrew Carnegie was developing detailed records of the cost of materials and labor used to make the steel produced in his steel mills

22
A Brief History (2 of 4) The emergence of large and integrated companies at the start of the 20th century created a demand for measuring the performance of different organizational units DuPont and General Motors are examples
Managers developed ways to measure the return on investment and the performance of their units
After the late 1920s management accounting development stalled Accounting interest focused on preparing financial statements to meet new regulatory requirements
23
A Brief History (3 of 4) It was only in the 1970s that interest returned to developing more effective management accounting systems American and European companies were under intense pressure from Japanese automobile manufacturers
During the latter part of the 20th century there were innovations in costing and performance measurement systems

C1 - ‹#›
Focus
Stage
CostDeterminationControland Financial
Transformation
InformationforPlanning andControlManagement
Transformation
Reduction ofWaste ofResources inProcessesBusiness
Transformation
Creation of ValueResource Usethrough Effective
Transformation
The Evolution of Management Accounting
1990s
1980s
1950s
1910s

25
A Brief History (4 of 4) The history of management accounting comprises
two characteristics:1. Management accounting was driven by the
evolution of organizations and their strategic imperatives
When cost control was the goal, costing systems became more accurate
When the ability of organizations to adapt to environmental changes became important, management accounting systems that supported adaptability were developed
2. Management accounting innovations have usually been developed by managers to address their own decision-making needs

26
Work Activities That Will Increase In Importance
0 0.1 0.2 0.3 0.4 0.5 0.6 0.7
Q UALITY SYSTEM S & CO NTRO LS
FINANCIAL & ECO NO M IC ANALYSIS
INTERNAL CO NSULTING
EDUCATING THE O RG ANIZATIO N
PRO JECT ACCO UNTING
M ERG ERS, ACQ UISITIO NS & DIVESTM ENTS
CO ST ACCO UNTING SYSTEM S
CO M PUTER SYSTEM S & O PERATIO NS
LO NG -TERM , STRATEG IC PLANNING
PERFO RM ANCE EVALUATIO N
PRO CESS IM PRO VEM ENT
CUSTO M ER & PRO DUCT PRO FITABILITY
PERCENT
Source: The Practice Analysis of Management Accounting, 1996, p.14; Counting More, Counting Less…, 1999, p. 17.
x 3 4 5
2 1 3 4
1 x 5 2 x x
2000+3yrsMore Mosttime critical
New!
New!
New!
New!

27
Management Accounting Systems
Absorption (full) costing Volume-based costing Activity-based costing
Direct (marginal, variable, differential) costing
Responsibility accounting

28
Key Financial PlayersPresident and
Chief Executive Officer
Finance Vice-President (CFO)
OtherVice-Presidents
Treasurer Controller Internal Audit
ManagementAccounting
FinancialReporting
Tax Reporting

29
Finance function:Russian companies (traditional)
General Director
Chief Accountant Finance Director
Finance Department
Planning Department
WagesDepartment
AccountingDepartment

30
Finance function:Russian companies (modern)
General Director
Chief Accountant Finance Director
Finance Department
Management Accounting / BudgetingDepartment
AccountingDepartment

31
Professional Environment Institute of Management Accountants (IMA)
Sponsors Certified Management Accountant & Certified Financial Management programs
Publishes a journal, policy statements and research studies on management accounting issues
www.imanet.org Chartered Institute of Management Accounting (CIMA) Leading professional organization in England and Wales
Sponsors certificate and diploma programs www.cimaglobal.org

32
Professional diploma (CIMA)

Cost Management Concepts and Cost
Behavior

34
Match Terms & DefinitionsCost
ExpenseCost Object Direct Cost
Opportunity Cost
Indirect Cost
The return that could not be realized from the best forgone alternative use of a resourceA cost charged against revenueCosts not directly related to a cost object
Any item for which a manager wants to measure a costCosts directly related to a cost object
A sacrifice of resources

35
Information in Management Accounting
Revenue
(-) Costs
= Profit
Cash Inflow
(-) Cash Outflow
= Net Cash Flow

36
Opportunity Cost An opportunity cost is the sacrifice you make when you use a resource for one purpose instead of another
Opportunity costs = explicit costs + implicit costs that do not appear anywhere in the accounting records
Machine time used to make one product cannot be used to make another, so a product that has a higher contribution margin per unit may not be more profitable if it takes longer to make.
Management accountants often use the concept of opportunity cost for decision making
Economic Profit v. Accounting Profit
37
Classification of Costs Variable / Fixed costs
Direct / Indirect costs
Prime costs / Overheads
Cost hierarchy (types of activities and their associated costs) New!

38
Nature of Fixed & Variable Costs Variable costs - change in total as the level of
activity changes There is a definitive physical relationship to the
activity measure Fixed costs - do not change in total with changes
in activity levels Accounting concepts of variable and fixed costs
are short run concepts Apply to a particular period of time Relate to a particular level of production
Relevant range is the range of activity over which the firm expects cost behavior to be consistent Outside the relevant range, estimates of fixed and
variable costs may not be valid

39
Types of Fixed Costs (1)
Capacity costs- fixed costs that provide a firm with the capacity to produce and/or sell its goods and services Also know as committed costs and typically relate to a firm’s ownership of facilities and its basic organizational structure
Capacity costs may cease if operations shut down, but continue in fixed amounts at any level of operations
Examples: property taxes, executive salaries

40
Types of Fixed Costs (2)
Discretionary costs - need not be incurred in the short run to operate the business, however, usually they are essential for achieving long-run goals Also referred to as programmed or managed costs
Examples: research and development costs, advertising

41
Semifixed Costs Refers to costs that increase in steps Example: A quality-control inspector can examine 1,000 units per day. Inspection costs are semifixed with a step up for every 1,000 units per day
Distinction between fixed and semifixed is subtle
Change in fixed costs usually involves a change in long-term assets: a change in semifixed costs often does not
42
Cost ObjectA cost object is something for which we want to compute a cost: A product
A pair of pants A product line
Women’s boot cut jeans An organizational unit
The on-line sales unit of a clothing retailer
43
Direct Cost A cost of a resource or activity that is acquired for or used by a single cost object
Cost object = A dining room table Cost of the wood that went into the dining room table
Cost object = Line of dining room tables A manager’s salary would be a direct cost if a manager were hired to supervise the production of dining room tables and only dining room tables

44
Indirect Cost The cost of a resource that was acquired to be used by more than one cost object
The cost of a saw used in a furniture factory to make different products It is used to make different products such as dining room tables, china cabinets, and dining room chairs

45
Direct or Indirect? A cost classification can vary as the chosen cost object varies Consider a factory supervisor’s salary
If the cost object is a product the factory supervisor’s salary is an indirect cost
If the factory is the cost object, the factory supervisor’s salary is a direct cost
A cost object can be any unit of analysis including product, product line, customer, department, division, geographical area, country, or continent

46
Types Of Production Activities Traditional cost systems classified activities into those that varied with volume and those that did not
This simple dichotomy does not capture the variety of the types of activities that take place in organizations
A new classification system, developed originally for manufacturing operations, gives a broader framework for classifying an activity and its associated costs

47
New Classification System The new classification system
places activities and their associated costs into one of the following categories:
Unit related Batch related Product sustaining Customer sustaining Business sustaining

48
Cost HierarchiesActivity Category Capacity
Customer
Product
Batch
Unit
Examples Plant Mgmt & Depr
Mkt Research
Product Specs & Testing
Machine Setups
Direct Materials

49
Unit-Related Activities Unit-related activities are those whose volume or level is proportional to the number of units produced or to other measures, such as direct labor hours or machine hours that are themselves proportional to the number of units produced
Unit-related activities apply to more than just production activities Loading shipments onto a truck is an example of a unit-related activity because it is proportional to the volume of shipments

50
Batch-Related Activities In a production environment, batch-related activities are triggered by the number of batches produced rather than by the number of units manufactured E.g., Machine setups are required when beginning the production of a new batch of products
Indirect labor for first-item quality inspections involves testing a fixed number of units for each batch produced and is, therefore, associated with the number of batches
Many shipping costs may be batch related if the organization pays the shipper a charge per container or truckload
51
Product-Sustaining Activities Product-sustaining activities support the production
and sale of individual products These activities provide the infrastructure the
enables the production, distribution, and sale of the product but are not involved directly in the production of the product
Examples include: Administrative efforts required to maintain drawings and labor and machine routings for each part
Product engineering efforts to maintain coherent specifications such as the bill of materials for individual products and their component parts and their routing through different work centers in the plant
Managing and sustaining the product distribution channel
The process engineering required to implement engineering change orders (ECOs)

52
Customer-Sustaining Activities Customer-sustaining activities enable the company to sell to an individual customer but are independent of the volume and mix of the products and services sold and delivered to the customer
Examples of customer-sustaining activities include: Sales calls Technical support provided to individual customers
53
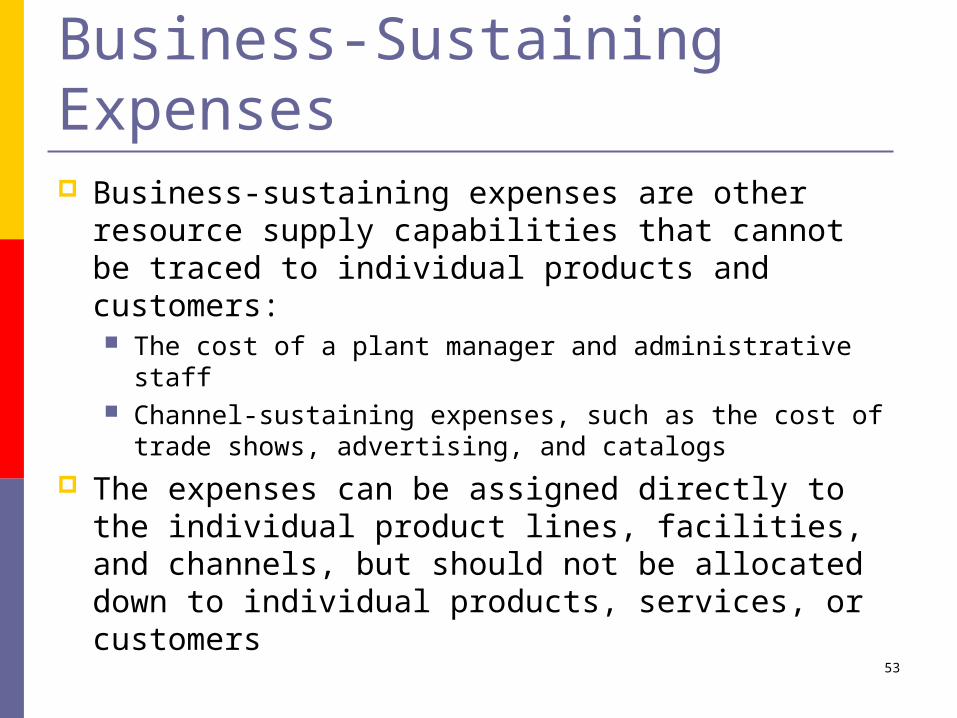
Business-Sustaining Expenses Business-sustaining expenses are other resource supply capabilities that cannot be traced to individual products and customers: The cost of a plant manager and administrative staff
Channel-sustaining expenses, such as the cost of trade shows, advertising, and catalogs
The expenses can be assigned directly to the individual product lines, facilities, and channels, but should not be allocated down to individual products, services, or customers

54
Business-Sustaining Activities Business-sustaining activities are those required for the basic functioning of the business
For example, organizations need only one CEO irrespective of their size, and they need to perform certain basic functions, such as registration or reporting, that also are independent of the size of the organization
These core activities are independent of the size of the organization, or the volume and mix of products and customers

55
Using The Cost Hierarchy The cost hierarchy just discussed is a model of cost behavior that can be used in two ways: To predict costs To develop the costs for a cost object such as a product or product line
If we understand the underlying behavior of costs, we have a basis to predict costs and to understand how costs will behave as volume expands and contracts

Full costing
57
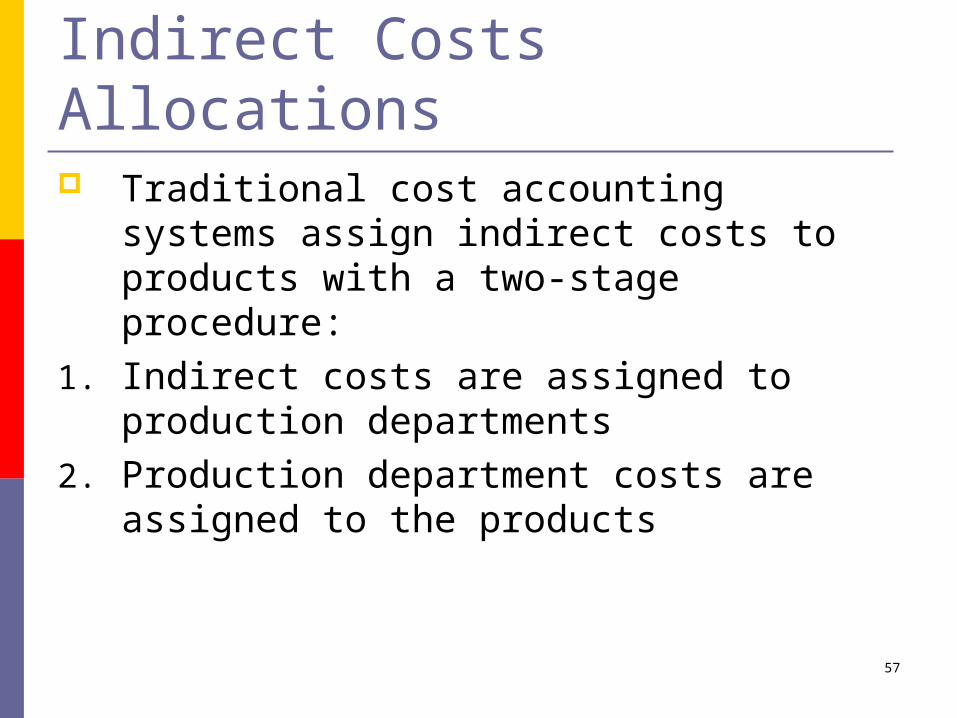
Indirect Costs Allocations Traditional cost accounting
systems assign indirect costs to products with a two-stage procedure:
1. Indirect costs are assigned to production departments
2. Production department costs are assigned to the products

58
Cost Pools Cost pools are groups of costs Three major types of cost pools:
Plant (traditional) Department (traditional) Activity center (activity-based costing)

59
Cost Driver Rates A cost driver is a factor that causes or “drives” an activity’s costs
All costs associated with a cost driver, such as setup hours, are accumulated separately Each subset of total support costs that can be associated with a distinct cost driver is referred to as a cost pool
Each cost pool has a separate cost driver rate The cost driver rate is the ratio of the cost of a support activity accumulated in the cost pool to the level of the cost driver for the activity Activity cost driver rate =
Cost of support activity / Level of cost driver

60
Determination Of Cost Driver Rates Determining realistic cost driver rates has become increasingly important in recent years Support costs now comprise a large portion of the total costs in many industries
Many firms now recognize that several different factors may be driving support costs rather than one or even two factors, such as direct labor or machine hours Firms are now taking greater care in identifying which support costs should relate to what cost driver

61
Number of Cost Pools The number of cost pools can vary
Some German firms use over 1,000 Henkel-Era-Tosno
The general principle is to use separate cost pools if the cost or productivity of resources is different and if the pattern of demand varies across resources
The increase in measurement costs required by a more detailed cost system must be traded off against the benefit of increased accuracy in estimating product costs If cost and productivity differences between resources are small, having more cost pools will make little difference in the accuracy of product cost estimates

62
Effect Of Departmental Structure Many plants are organized into departments that are
responsible for performing designated activities Departments that have direct responsibility for converting raw materials into finished products are called production departments
Service departments perform activities that support production, such as:
•Machine setup•Production engineering•Production scheduling–All service department costs are
indirect support activity costs because they do not arise from direct production activities
•Machine maintenance

63
Two-Stage Cost Allocation (1)
Conventional product costing systems assign indirect costs to jobs or products in two stages
1. In the first stage: System identifies indirect costs with
various production and service departments Service department costs are then
allocated to production departments2. The system assigns the accumulated indirect
costs for the production departments to individual jobs or products based on predetermined departmental cost driver rates

64
Two-Stage Cost Allocation (2)

65
Final Word on Two-Stage Allocation
The fundamental assumption of the two-stage allocation method is the absence of a strong direct link between the support activities and the products manufactured For this reason, service department costs are first allocated to production departments using one of the conventional two-stage allocation methods previously described
Activity-based costing rejects this assumption and instead develops the idea of cost drivers that directly link the activities performed to the products manufactured and measure the average demand placed on each activity by the various products Activity costs are assigned to products in proportion to the average demand that the products place on the activities, usually eliminating the need for the second step in Stage 1 allocations

Activity-based costing

67
Activity-Based Costing ”Today’s management accounting information, driven by the procedures and cycles of the organisation’s financial reporting system, is too late, too aggregated and too distorted to be relevant for manager’s planning and control decisions”
Kaplan & Johnson, Relevance Lost: The Rise and Fall of Management Accounting, HBS Press 1987
68
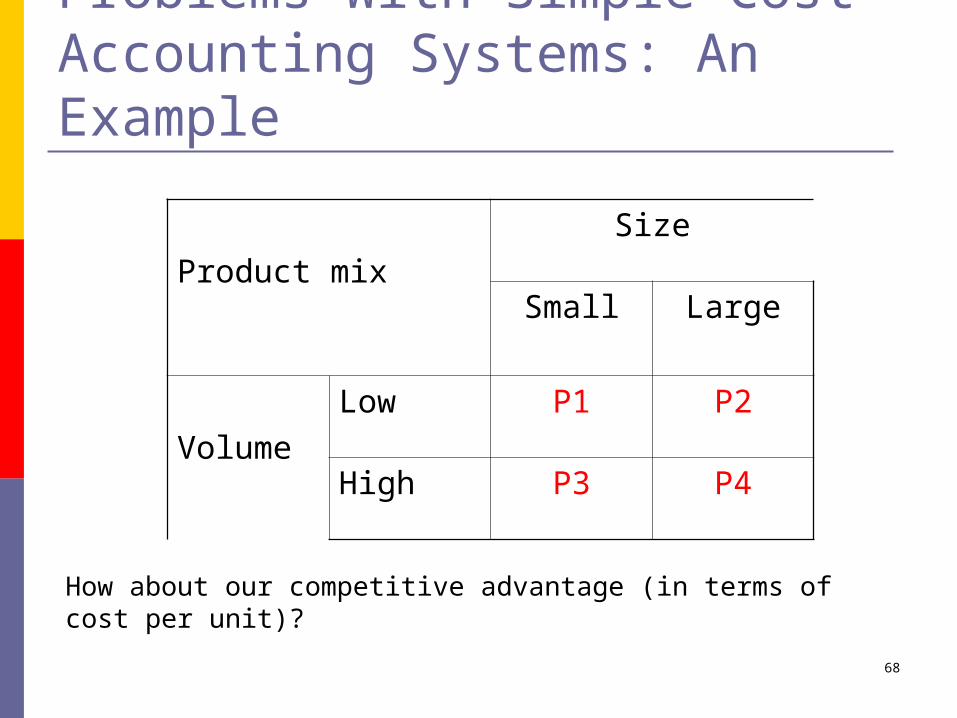
Problems With Simple Cost Accounting Systems: An Example
Product mixSize
Small Large
VolumeLow P1 P2
High P3 P4
How about our competitive advantage (in terms of cost per unit)?
69
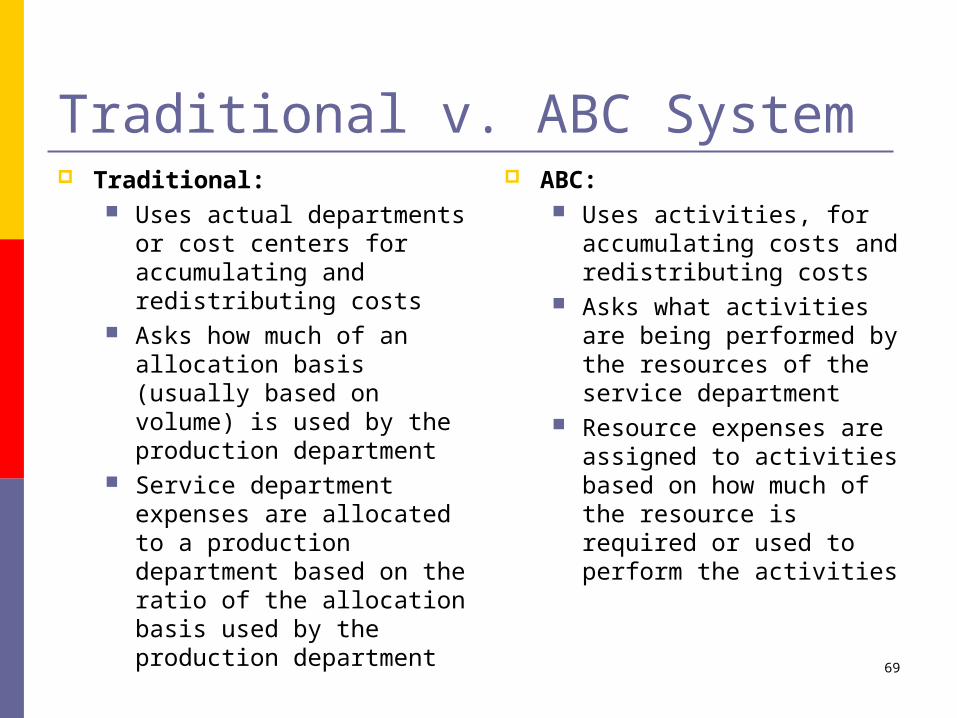
Traditional v. ABC System Traditional:
Uses actual departments or cost centers for accumulating and redistributing costs
Asks how much of an allocation basis (usually based on volume) is used by the production department
Service department expenses are allocated to a production department based on the ratio of the allocation basis used by the production department
ABC: Uses activities, for
accumulating costs and redistributing costs
Asks what activities are being performed by the resources of the service department
Resource expenses are assigned to activities based on how much of the resource is required or used to perform the activities

70
Strategic Use of ABC Managers use activity-based information in 2 ways: To shift the mix of activities and products away from less profitable to more profitable operations
To help them become a low-cost producer or seller Activity Analysis involves 4 steps:
Chart activities used to complete the product or service
Classify activities as value-added or non-value-added Eliminate non-value-added activities Continuously improve & reevaluate efficiency of activities or replace them with more efficient activities

71
Tracing Marketing-RelatedCosts to Customers The costs of marketing, selling, and distribution
expenses have been increasing rapidly in recent years Result of increased importance of customer satisfaction and market-oriented strategies
Many of these expenses do not relate to individual products or product lines but are associated with: Individual customers Market segments Distribution channels
Companies need to understand the cost of selling to and serving their diverse customer base

72
Alpha – Beta Example (1)
Assume Alpha and Beta are customers generating about equal revenue and seen as equally valuable customers
Using a conventional cost accounting system, marketing, selling, distribution, and administrative (MSDA) expenses were allocated to customers at a rate of 35% of Sales ALPHA BETA
Sales $320,000 $315,000CGS 154,000 156,000Gross Margin $166,000 $159,000MSDA expenses (@35% of Sales) 112,000 110,250Operating profit $ 54,000 $ 48,750Profit percentage 16.9% 15.5%
In many respects, however, the customers were not similar

73
Alpha – Beta Example (2) Beta’s account manager spent a huge amount of
time on that account Beta required a great deal of hand-holding and was
continually inquiring whether the company could modify products to meet its specific needs
Beta’s account required many technical resources, in addition to marketing resources
Beta also: Tended to place many small orders for special
products Required expedited delivery Tended to pay slowly
All of which increased the demands on the order processing, invoicing, and accounts receivable process

74
Alpha – Beta Example (3) Alpha, on the other hand:
Ordered only a few products and in large quantities
Placed its orders predictably and with long lead times
Required little sales and technical support The Accounting Manager in Marketing knew that Alpha was a much more profitable customer than the financial statements were currently reporting
He launched an activity-based cost study of the company’s marketing, selling, distribution, and administrative costs
75
Alpha – Beta Example (4) The multifunctional project team:
Studied the resource spending of the various accounts
Identified the activities performed by the resources
Selected activity cost drivers that could link each activity to individual customers
The Accounting Manager used: Transactional activity cost drivers
Number of orders, number of mailings Duration drivers
Estimated time and effort Intensity drivers when he had readily-available data
Actual freight and travel expenses

76
Alpha – Beta Example (5) The manager also used a customer cost hierarchy that was similar to the manufacturing cost hierarchy Some activities were order-related
Handle customer orders Ship to customers
Others were customer-sustaining Service customers Travel to customers Provide marketing and technical support

77
Alpha – Beta Example (6) The picture of relative profitability of Alpha and
Beta shifted dramaticallyAlpha Beta
Gross Margin (as previously) $166,000 $159,000Marketing & tech. support 7,000 54,000Travel to customer 1,200 7,200Distribute sales catalog 100 100Service customers 4,000 42,000Handle customer orders 500 18,000Warehouse inventory 800 8,800Ship to customers 12,600 42,000Total activity expenses 26,200 172,100Operating profit $ 139,800 $ (13,100)Profit percentage 43.7% (4.2%)

78
Alpha – Beta Example (7) As the manager suspected, Alpha Company was a highly profitable customer Its ordering and support activities placed few demands on the company’s marketing, selling, distribution, and administrative resources
Almost all the gross margin earned by selling to Alpha dropped to the operating margin bottom line
Beta Company was now seen to be the most unprofitable customer that the company had
While the manager intuitively sensed that Alpha was a more profitable customer than Beta, he had no idea of the magnitude of the difference
79
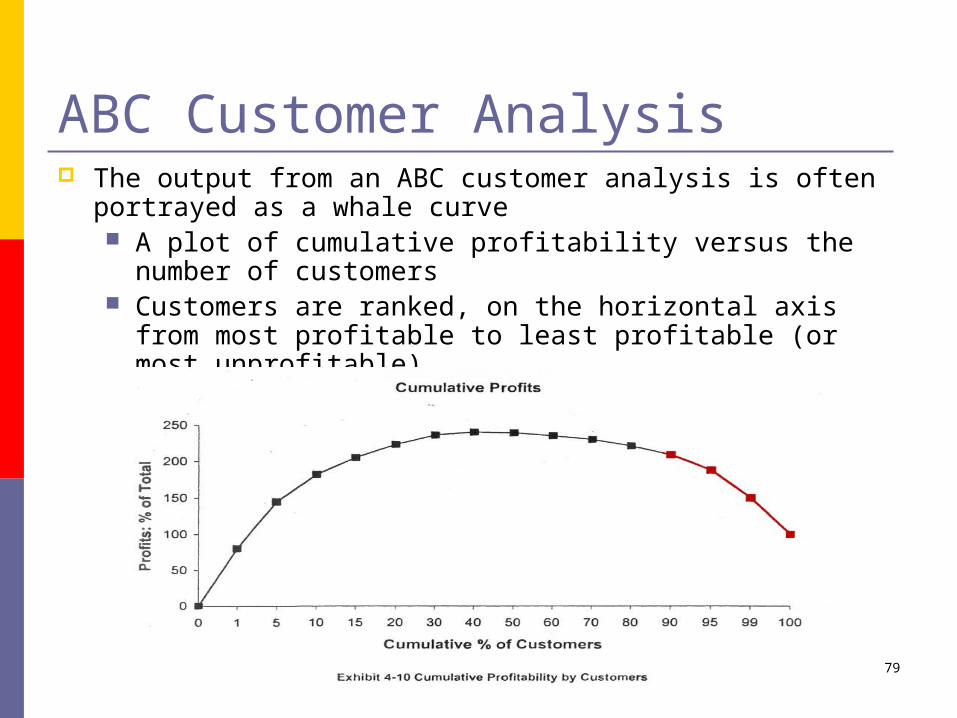
ABC Customer Analysis The output from an ABC customer analysis is often
portrayed as a whale curve A plot of cumulative profitability versus the number of customers
Customers are ranked, on the horizontal axis from most profitable to least profitable (or most unprofitable)

80
Customer Profitability Cumulative sales follow the usual 20-80 rule
20% of the customers provide 80% of the sales A whale curve for cumulative profitability typically
reveals: The most profitable 20% of customers generate between 150% and 300% of total profits
The middle 70% of customers break even The least profitable 10% of customers lose 50% - 200% of total profits, leaving the company with its 100% of total profits
It is not unusual for some of the largest customers to turn out being the most unprofitable The largest customers are either the company’s most profitable or its most unprofitable
They are rarely in the middle

81
Managing Customer Profitability (1) High-profit customers, such as Alpha, appear in the left section of the profitability whale curve These customers should be cherished and protected
They could be vulnerable to competitive inroads
The managers of a company serving them should be prepared to offer discounts, incentives, and special services to retain the loyalty of these valuable customers if a competitor threatens
82
Managing Customer Profitability (2) The challenging customers, like Beta, appear on the right tail of the whale curve, dragging the company’s profitability down with their low margins and high cost-to-serve
The high cost of serving such customers can be caused by their: Unpredictable order pattern Small order quantities for customized products
Nonstandard logistics and delivery requirements
Large demands on technical and sales personnel
83
Managing Customer Profitability (3) The opportunities for a company to transform its unprofitable customers into profitable ones is perhaps the most powerful benefit the company’s managers can receive from an activity-based costing system
Managers have a full range of actions for transforming unprofitable customers into profitable ones Process improvements Activity-based pricing Managing customer relationships

Life-cycle costing

85
Life-Cycle Costs Life-cycle costing is a relatively new perspective that argues that organizations should consider a product’s costs over its entire lifetime when deciding whether to introduce a new product
There are five distinct stages in a typical product’s life cycle Not all products will follow this pattern
Some products will fail early and have a truncated life cycle

86
Product Life Cycle (1)
Product development and planning The organization incurs significant research
and development costs and product testing costs Because of the increasing costs of launching
products, organizations are devoting more effort to the product development and planning phase
The nature and magnitude of these costs should be identified so that when products are initially proposed, planners have some idea of the cost that new product development will inflict on the organization
Shorter life cycles provide less time to recover costs

87
Product Life Cycle (2)
Introduction phase The organization incurs significant
promotional costs as the new product is introduced to the marketplace
At this stage the product’s revenue will often not cover the flexible and capacity-related costs that it has inflicted on the organization

88
Product Life Cycle (3)
Growth phase The product’s revenues finally begin to
cover the flexible and capacity-related costs incurred to produce, market, and distribute the product
There is often little or no price competition
The focus of attention is on developing systems to deliver the product to the customer in the most effective way

89
Product Life Cycle (4)
Product maturity phase Price competition becomes intense and
product margins begin to decline While the product is still profitable,
profitability is declining relative to the growth phase
The organization undertakes intense efforts to reduce costs to remain competitive and profitable

90
Product Life Cycle (5)
Product decline and abandonment phase
Phase in which the product begins to become unprofitable
Competitors begin to drop out—the least efficient first—and the remaining competitors find themselves competing for a share of a smaller and declining market
The organization incurs abandonment costs, which can include selling off equipment no longer required or restoring an asset (e.g., land) prior to abandoning it

91
Product Life Cycle (6)
Product-related costs occur unevenly over the product’s lifetime
The motivation for considering total life cycle costs before the product is introduced is to ensure that the difference between the product’s revenues and its manufacturing and distribution costs cover the other costs associated with developing, supporting, and abandoning the product
Life-cycle costing is a good example of a costing system designed for decision making that has little or no practical relevance in external reporting

Direct costingand short-term
decisions

93
Cost-Volume-Profit Analysis Decision makers often like to combine information about flexible and capacity-related costs with revenue information to project profits for different levels of volume
Conventional cost-volume-profit (CVP) analysis rests on the following assumptions: All organization costs are either purely variable or fixed
Units made equal units sold Revenue per unit does not change as volume changes

94
CVP Model Cost-volume-profit (CVP) model summarizes the effects of volume changes on a firm’s costs, revenues, and profit Analysis can be extended to determine the impact on profit of changes in selling prices, service fees, costs, income tax rates, and the mix of products and services
Break-even point is the volume of activity that produces equal revenues and costs for the firm No profit or loss at this point

95
The CVP Profit EquationProfit:= Revenue - Flexible costs - Capacity-related costs
= (Units sold x Revenue per unit) - (Units sold x flexible cost per unit) - Capacity-related costs
= [Units sold x (Revenue per unit-Flexible cost per unit)] - Capacity-related costs
= (Units sold x Contribution marginContribution margin per unit) - Capacity-related costs

96
Break-even Volume Using the CVP profit equation, break-even volume is determined by calculating the volume where profit = 0
0 = (Units sold x Contribution margin per unit) - Fixed costs
Units sold to break even =Fixed costs÷ Contribution margin per unit

97
Target Profit CVP analysis can be used to determine the sales volume required to achieve a specified target profit Note that the previous break-even analysis was used to determine the unit sales required to achieve a target profit of $0

98
Margin of Safety Margin of safety - excess of projected sales units over break-even sales level, calculated as follows:
Sales Units - Break-Even Sales Units = Margin of Safety
Provides an estimate of the amount that sales can drop before the firm incurs a loss
99
Multiple Product Financial Modeling (1)
When a firm has multiple products, several alternatives are available to facilitate financial modeling Assume all products have the same contribution margin
Assume a weighted-average contribution margin Treat each product line as a separate entity Use sales dollars as a measure of volume

100
Multiple Product Financial Modeling (2)
Assume all products have the same contribution margin Can group products so they have equal or near equal contribution margins
Can be a problem when products have substantially different contribution margins
Assume a weighted-average contribution margin To determine break-even units, use the following formula:
Fixed Costs________
Weighted Average Contribution Margin

101
Multiple Product Financial Modeling (3) Treat each product line as a separate entity Requires allocating indirect costs to product lines
To extent allocations are arbitrary, may lead to inaccurate estimates
Use sales dollars as a measure of volume Can use weighted average contribution margin break-even dollar sales calculated as follows:
Total Contribution MarginTotal Sales

102
CVP Model Assumptions Costs can be separated into fixed and variable components
Cost and revenue behavior is linear throughout the relevant range Total fixed costs, variable costs per unit, and sales price per unit remain constant throughout the relevant range
Product mix remains constant

103
Relevant Costs and Revenues Whether particular costs and revenues are relevant for decision making depends on the decision context and the alternatives available
When choosing among different alternatives, managers should concentrate only on the costs and revenues that differ across the decision alternatives These are the relevant cost/revenues Opportunity costs by definition are relevant costs for any decision
The costs that remain the same regardless of the alternative chosen are not relevant for the decision

104
Sunk Costs are Not Relevant Sunk costs often cause confusion for decision makers Costs of resources that already have been committed and no current action or decision can change
Not relevant to the evaluation of alternatives because they cannot be influenced by any alternative the manager chooses

105
Replacement Of A Machine
(1) A Company purchased a new drilling machine for
$180,000 on September 1, 2003 They paid $30,000 in cash and financed the remaining $150,000 with a bank loan
The loan requires a monthly payment of $5,200 for the next 36 months
On September 27, 2003, a sales representative from another supplier of drilling machines approached the company with a newly designed machine that had only recently been introduced to the market and offered special financing arrangements The new supplier agreed to pay $50,000 for the old machine, which would serve as the down payment required for the new machine
In addition, the new supplier would require monthly payments of $6,000 for the next 35 months
106
Replacement Of A Machine (2) The new design relied on innovative computer chips, which would reduce the labor required to operate the machine The company estimated that direct labor costs would decrease by $4,400 per month on the average if it purchased the newnew machine
In addition it had fewer moving parts than thethe current machine The new machine would decrease maintenance costs by $800 per month
The new machine has greater reliability This would allow the company to reduce materials scrap cost by $1,000 per month
Should the company dispose of the machine it just purchased on September 1 and buy the new machine?
107
Analysis Of Relevant Costs (1) If the company buys the new machine, it will still be responsible for the monthly payments of $5,200 committed to on September 1 Therefore, the $30,000 that it paid in cash for the oldold machine and the $5,200 it is committed to pay each month for the next 36 months are sunk costs
The company already has committed these resources, and regardless if it decides to buy the new machine, it cannot avoid any of these costs
None of these sunk costs are relevant to the decision

108
Analysis Of Relevant Costs (2) What costs are relevant? The 35 monthly payments of $6,000 and the down
payment of $50,000 are relevant costs, because they depend on the decision
Labor, materials, and machine maintenance costs will be affected if the company acquires the new machine The relevant expected monthly savings are:
$4,400 in labor costs $1,000 in materials costs $ 800 in machine maintenance costs
The revenue of $50,000 expected on the trade-in of the old machine is also relevant, because the old machine will be disposed of only if the company decides to acquire the new machine

109
Analysis Of Relevant Costs (3)
In a comparison of the cost increases/cash outflows to cost savings/cash inflows The down payment required for the new machine is matched by the expected trade-in value of the old machine
The expected savings in labor, materials, and machine maintenance costs each month ($6,200) are more than the monthly lease payments for the new machine ($6,000)
Thus, it is apparent that the company will be better off trading in the old machine and replacing it with the new machine


