Embed Size (px)
Citation preview
June 2012 Volume 46, Number 2 GHANA MEDICAL JOURNAL
66
PREVALENCE OF OVERWEIGHT AND OBESITY AND PERCEPTION OF HEALTHY AND DESIRABLE BODY SIZE IN URBAN, GHANAIAN
WOMEN
R. M. BENKESER1, R. BIRITWUM2 and A. G. HILL1 1Harvard School of Public Health, Boston, MA, USA 2Department. of Community Medicine, University of
Ghana Medical School, Accra, Ghana Author for Correspondence: Rachel Benkeser E-mail: [email protected] Conflict of Interest: None declared SUMMARY Objective: To determine if the perceived ideal body size of urban women in Accra, Ghana influences cur-rent body size. Methods: The sample (n=2,814) consisted of Ghanaian women aged 18 years and older, living in the Accra Metropolitan Area. Data were collected between Octo-ber 2008 and June 2009 in the Women’s Health Study of Accra, Wave II household survey. Height (m), weight (kg), waist (cm) and hip (cm) measurements were used to calculate body mass index (BMI, meas-ured in kg/m2), waist circumference, and waist-to-hip ratio. In addition to reported socio-demographic char-acteristics, medical history, and exercise and diet histo-ry, the standardized Stunkard Figure Rating Scale (FRS) was used to identify silhouettes of varying body sizes that most closely resemble a woman’s current body image (CBI), the body image she sees as the ideal for Ghanaian women (IBI), and the body image she sees as healthiest (HBI). The validity of using the standardized Stunkard FRS to assess body image in a population of Ghanaian women was assessed using Receiver Operating Curve (ROC) analysis. Household wealth, a proxy for income, was assessed using an in-dex derived by principal components analysis from a selection of 20 variables measuring quality of the dwelling (e.g water source, sewage arrangements, type of housing, roof etc.) and possession of household du-rable goods (e.g. television, radio, iron, refrigerator and car).1 Logistic and linear regression was used to test the association between various socio-demographic char-acteristics, BMI and body image satisfaction. Results: Using the WHO criteria for BMI, 3.6% (95) of women were underweight, 31.5% (828) normal weight, 27.8% (730) overweight and 37.1% (973) obese. In total, 64.9% of women sampled were either overweight or obese. A WC of greater than 88 cm re-vealed 78.7% (2,113) obesity. A WHR cut-off for obe-sity of 0.8 revealed 78.9% (2,119) obesity. ROC analy-sis confirmed the validity of using the standardized Stunkard FRS to assess body image in a population of Ghanaian women. Age, relative wealth, being married, having grown up in an urban environment and having
parity >2 are associated with higher risk of overweight or obesity. Education level is not associated with over-weight status. Overall, 72.2% (1,936) of women were dissatisfied with their current body size and 41.8% of women preferred a smaller figure. Overweight and obese women were significantly more likely than nor-mal weight women to desire weight loss (OR: 10.12, CI: 8.04 – 12.72). Conclusion: Ideal body image in urban, Ghanaian women should not be viewed as an inhibitor to healthy weight maintenance. Interventions should be designed to help women achieve their ideal and healthy weights. Keywords: Obesity, body mass index (BMI), anthro-pometric measures, body images, Ghana. INTRODUCTION The prevalence of obesity in West Africa rapidly in-creased during the last two decades of the 20th century and continues to increase in the 21st century. A recent review of obesity prevalence in West Africa indicates that between 2000 and 2004, 10% of West African adults were obese.2 In this time period, according to the same study, half of the urban population in general and 60% of urban, West African women were either overweight or obese. As in earlier reviews of socio-economic status and obesity in developing countries,3 this review also found a direct relationship between obesity prevalence and increased socio-economic sta-tus. In Ghana, the DHS surveys indicate that the per-centage of women aged 15-49 overweight or obese grew from 25% to 30% between 2003 and 2008 with the highest values among urban women.4 Wave 1 of the Women’s Health Study of Accra (WHSA-1) found 62.2% of 1,237 non-pregnant women living in Accra were overweight or obese; the same study found no relationship between obesity prevalence and socio-economic status.5 Though the public health and medical consequences of the rise in obesity in West Africa are evident, the rea-sons for the rapid increase in body size and body mass remain speculative.
June 2012 R. M. Benkeser et al Overwieght and obesity in urban Ghanaian women
67
Overweight and obesity are well understood to be the result of an energy imbalance – consuming more calo-ries than are equivalently expended in physical activity. Two popularly cited theories for the West African change in energy balance include increases in urbaniza-tion and westernization. In theory, urbanization and westernization lead to decreased physical activity and increased food supply, including access to high caloric fast foods and sugar sweetened beverages.5 Such envi-ronmental changes, however, do not completely ex-plain why women, in particular women of high socio-economic status, are disproportionally affected by the obesity epidemic in West Africa. West African social desirability for overweight women is frequently cited as cause for the continued direct relationship between obesity and socio-economic status in the region.6-11 Indeed, it is well documented that some ethnic groups in Africa historically preferred overweight women and embraced cultural practices that encouraged female obesity (as in the pre-marital “fattening rooms” of Nigeria).12 This argument sug-gests that the recent increase in overweight and obesity in West Africa may not be a consequence of changes in the environment but rather is the result of society-wide intentional weight gain enabled by the increased avail-ability of food concurrent with decreased need for physical exertion. Because behavioural interventions are only successful if individuals agree to participate in the intervention, understanding this preference for body size is crucial to understanding the approach of future overweight and obesity interventions. Although understanding preference for body image is critical to crafting public health obesity interventions, studies examining the relationship between socially desirable body size and overweight/obesity are rare. In reviewing the literature restricted to West Africa, ten articles address the relationship between body image and obesity. In the largest study considered here, Duda et al used culturally specific silhouettes and surveyed urban Gha-naian women on whether improved health outcomes would incentivize women to change their current body image. 13 Of the 305 participants, 86% of 214 over-weight or obese women stated they would be willing to decrease their body weight if it meant leading a health-ier life. Women over the age of 50, however, were sig-nificantly less willing to decrease their body weight. These small sample size studies on urban, West Afri-can women suggest a general dissatisfaction with body image irrespective of body weight. These studies offer
some evidence that women in general preferred a nor-mal weight figure, even though some obese women wanted to gain weight in order to achieve their ideal image. Additionally, some evidence from these studies suggests that age may be an important determinant of both a woman’s weight preference and her willingness to lose weight, older women being less willing to lose weight for health. At least one study suggests that the majority of women would be willing to lose weight if requested by her husband or to improve her health.13 Taking this history into account, in this study we exam-ined a large sample of urban, Ghanaian women (n=2,814) to determine if indeed an urban, West Afri-can woman’s ideal body size influences her current weight. METHODS The Women’s Health Study of Accra The Women’s Health Study of Accra, Wave II (WHSA-II) conducted in 2008-2009 is the second cross-sectional, community-based population study of a longitudinal assessment of health in a sample of women age 18 and older residing in Ghana’s Accra Metropolitan Area. Older women were over-sampled to provide enough elderly cases for analysis but other-wise, the sample, after stratification for socio-economic status, is representative of all adult women in Accra. WHSA-II was conducted by the joint partnership be-tween the University of Ghana Institute for Statistical, Social, and Economic Research and the Harvard School of Public Health. The WHSA-II sample consists primarily of participants from Wave I of the study (WHSA-I), conducted in 2003. Participants to WHSA-I were selected by a two-stage cluster probability sample stratified by socioeco-nomic status based on the 2000 Ghanaian census data, and older women were progressively over-sampled. When a participant from WHSA-I could not be located, a woman of similar age, socioeconomic status and geo-graphic location as the initial participant in WHSA-I replaced the woman in the sample. A total of 995 re-placement women were interviewed for a total of two thousand eight hundred and fourteen (2,814) WHSA-II participants interviewed between October 2008 and June 2009. The complete methodology and sampling of WHSA-I and WHSA II are described elsewhere.14,15
All women interviewed in WHSA-II were eligible for this study (n=2,814). Following WHO protocol, wom-en who were pregnant or less than three months post partum (n=130) at the time of interview were excluded from the analysis of body weight and body size.
June 2012 Volume 46, Number 2 GHANA MEDICAL JOURNAL
68
In this analysis, the WHSA-II sample population is not weighted nor are the findings standardized. Questionnaires The WHSA-II included a twenty-five section house-hold questionnaire, a household roster and details of the dwelling’s characteristics. The questionnaire was field tested and administered by trained interviewers. The questionnaire included a variety of questions ad-dressing health-related subject areas chosen to address major health issues identified in WHSA-I and to ad-dress topics of interest to policy makers and programs. The main sections examined in this analysis include self-reported general health, medical history, physical activity, nutrition, food security, and body image as-sessment. The household questionnaire also included a standard-ized Stunkard Figure Rating Scale (FRS) and records of anthropometric measurements taken at the partici-pant’s home by a trained field interviewer at the time of questionnaire administration. No laboratory tests or physical examinations were conducted during WHSA-II. Anthropometric Measurements Overweight and obesity were assessed using three measures, body mass index (BMI), waist circumfer-ence (WC), and waist-to-hip ratio (WHR). Trained interviewers at home obtained anthropometric meas-urements at the time of survey administration with women wearing lightweight clothing without shoes. Height (m) was measured with a Shorr height board to the nearest 0.01 cm with women standing upright. Weight was measured on a separate calibrated Fazzini scale to the nearest 0.5 kg. BMI was calculated as weight (kg) divided by height squared (m2), and weight categories were defined following the WHO standard as <18.5 kg/m2 underweight, 18.5 – 24.9 kg/m2 normal weight, 25.0-29.9 kg/m2 overweight, and >30 kg/m2 obese. WC was measured at the widest girth to the nearest 0.1 cm. Hip circumference (HC) was measured at the level of the greater trochanter to the nearest 0.1 cm. Waist-to-hip ratio was calculated by dividing WC by HC. WHR and WC are used as indirect measures of ab-dominal obesity, and fat distributions around the waist are associated with greater risk for metabolic and car-diovascular disease.16 WC and WHR are better predic-tors of obesity in the elderly than BMI due to differen-tial muscle loss associated with aging.17 Recommended by the National Institutes of Health, cut points for obe-sity defined by WHR and WC are >0.8 and >88 cm respectively. While WHR provides no advantage over
WC alone in the measurement of obesity risk, it is re-ported here due to its clinical significance. Body Image Assessment Stunkard’s FRS, a silhouette scale originally developed to determine weight of parents of Danish adoptees,18 is the standard scale used in obesity studies and was used in the WHSA-II. Though designed for a white popula-tion and not preferred by black women to other scales, the Stunkard FRS achieves comparable results to other less widely used but culturally adapted scales.19 The Stunkard FRS consists of a series of nine silhouette images of women whose weight ranges from emaciated to morbidly obese. These images do not correspond to specific anthropometric measurements. To assess body image in the WHSA-II, a series of three questions were asked in reference to the Stunkard FRS images: 1.) What image do you think most closely re-sembles the way you look at this time (CBI)? 2.) Which image do you think looks like the healthiest woman (HBI)? 3.) Which image represents the way you think Ghanaian women should look (IBI). A body image dissatisfaction score was calculated by subtract-ing a woman’s IBI from her CBI. Negative values indi-cate a desire to be heavier and positive values indicate desire to be slimmer; a null difference indicates satis-faction with CBI. Statistical Methods All analysis was performed using SPSS version 17.0 for Windows (SPSS, Inc., Chicago, IL). Analysis in-cluded descriptive statistics for frequencies, ROC anal-ysis, bivariate logistic regression and linear regression. A p-value of <.05 was considered significant. Strength of association is expressed as an odds ratio with a 95% confidence interval (CI). Body image assessment tools have rarely been validat-ed in non-Caucasian populations. Following the meth-odology of Bulik et al,20 a validation study constructing receiver operating curves (ROC) was conducted on the Stunkard FRS data obtained in WHSA-II. Receiver operating curves are created by plotting the fraction of true positives out of the positives vs. the fraction of false positives out of the negatives at various thresh-old settings. To test for relative wealth, a wealth index was created using principal components analysis from a selection of 20 variables measuring quality of the dwelling (e.g water source, sewage arrangements, type of housing, roof etc.) and possession of household durable goods (e.g. television, radio, iron, refrigerator and car).1
June 2012 R. M. Benkeser et al Overwieght and obesity in urban Ghanaian women
69
To test for the influence of education, relative wealth, parity, region of birth and marital status on obesity outcomes, logistic regression models controlling for survey age group were created (Table 3). To test for the influence of education, relative wealth, parity, region of birth and marital status on body satisfaction (a desire to be heavier and a desire to be skinnier), logistic re-gression models controlling for BMI category were created (Table 6). RESULTS Demographic Characteristics Mean self-reported age (+ standard deviation) was 46.28 + 18.21 years (range 18 to 99 years). Of the women, over half were born in Greater Accra (58.7%), and almost all lived in an urban area until the age of twelve (88.0%). At the time of survey, approximately half of women were currently married (49.3%), one fifth were nulliparous (19.1%) and just over two-thirds
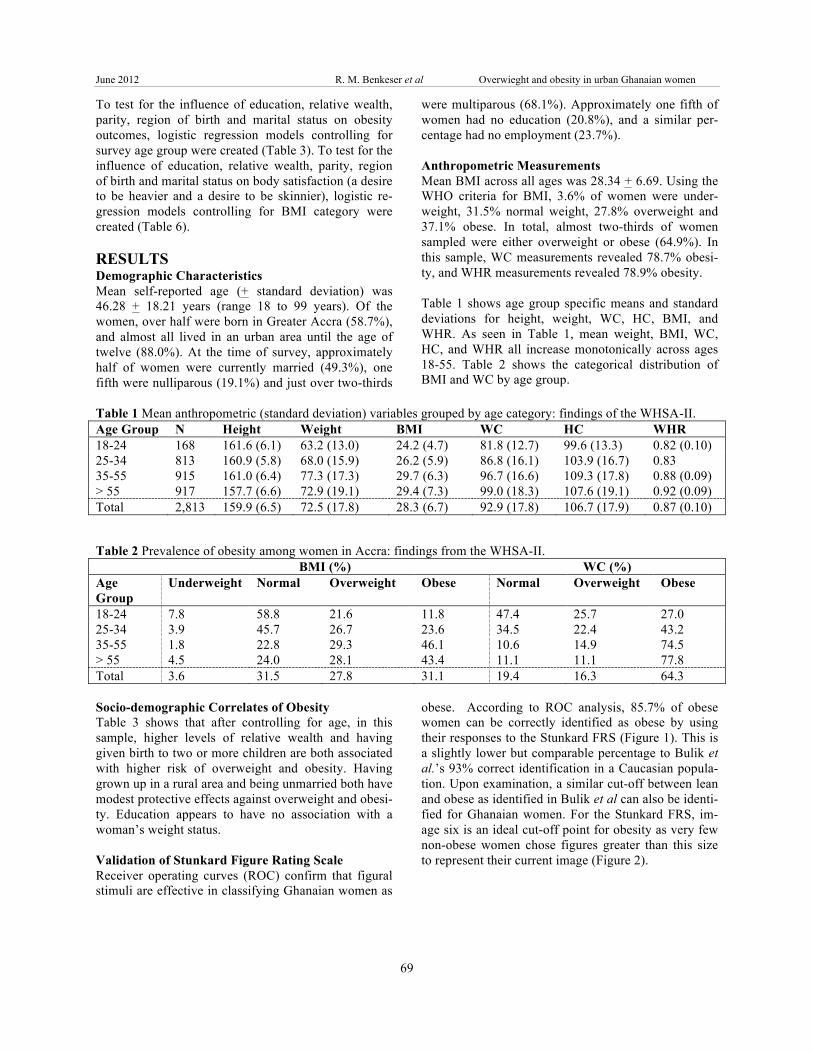
were multiparous (68.1%). Approximately one fifth of women had no education (20.8%), and a similar per-centage had no employment (23.7%). Anthropometric Measurements Mean BMI across all ages was 28.34 + 6.69. Using the WHO criteria for BMI, 3.6% of women were under-weight, 31.5% normal weight, 27.8% overweight and 37.1% obese. In total, almost two-thirds of women sampled were either overweight or obese (64.9%). In this sample, WC measurements revealed 78.7% obesi-ty, and WHR measurements revealed 78.9% obesity. Table 1 shows age group specific means and standard deviations for height, weight, WC, HC, BMI, and WHR. As seen in Table 1, mean weight, BMI, WC, HC, and WHR all increase monotonically across ages 18-55. Table 2 shows the categorical distribution of BMI and WC by age group.
Table 1 Mean anthropometric (standard deviation) variables grouped by age category: findings of the WHSA-II. Age Group N Height Weight BMI WC HC WHR 18-24 168 161.6 (6.1) 63.2 (13.0) 24.2 (4.7) 81.8 (12.7) 99.6 (13.3) 0.82 (0.10) 25-34 813 160.9 (5.8) 68.0 (15.9) 26.2 (5.9) 86.8 (16.1) 103.9 (16.7) 0.83 35-55 915 161.0 (6.4) 77.3 (17.3) 29.7 (6.3) 96.7 (16.6) 109.3 (17.8) 0.88 (0.09) > 55 917 157.7 (6.6) 72.9 (19.1) 29.4 (7.3) 99.0 (18.3) 107.6 (19.1) 0.92 (0.09) Total 2,813 159.9 (6.5) 72.5 (17.8) 28.3 (6.7) 92.9 (17.8) 106.7 (17.9) 0.87 (0.10)
Table 2 Prevalence of obesity among women in Accra: findings from the WHSA-II. BMI (%) WC (%)
Age Group
Underweight Normal Overweight Obese Normal Overweight Obese
18-24 7.8 58.8 21.6 11.8 47.4 25.7 27.0 25-34 3.9 45.7 26.7 23.6 34.5 22.4 43.2 35-55 1.8 22.8 29.3 46.1 10.6 14.9 74.5 > 55 4.5 24.0 28.1 43.4 11.1 11.1 77.8 Total 3.6 31.5 27.8 31.1 19.4 16.3 64.3 Socio-demographic Correlates of Obesity Table 3 shows that after controlling for age, in this sample, higher levels of relative wealth and having given birth to two or more children are both associated with higher risk of overweight and obesity. Having grown up in a rural area and being unmarried both have modest protective effects against overweight and obesi-ty. Education appears to have no association with a woman’s weight status. Validation of Stunkard Figure Rating Scale Receiver operating curves (ROC) confirm that figural stimuli are effective in classifying Ghanaian women as
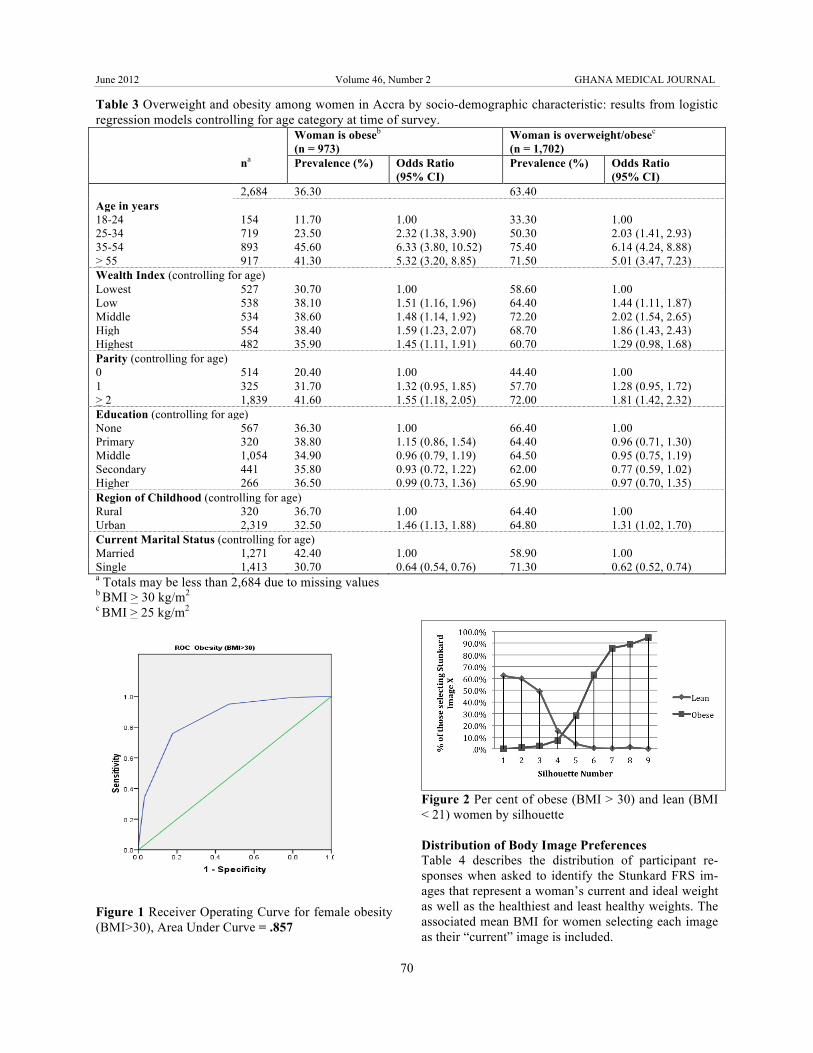
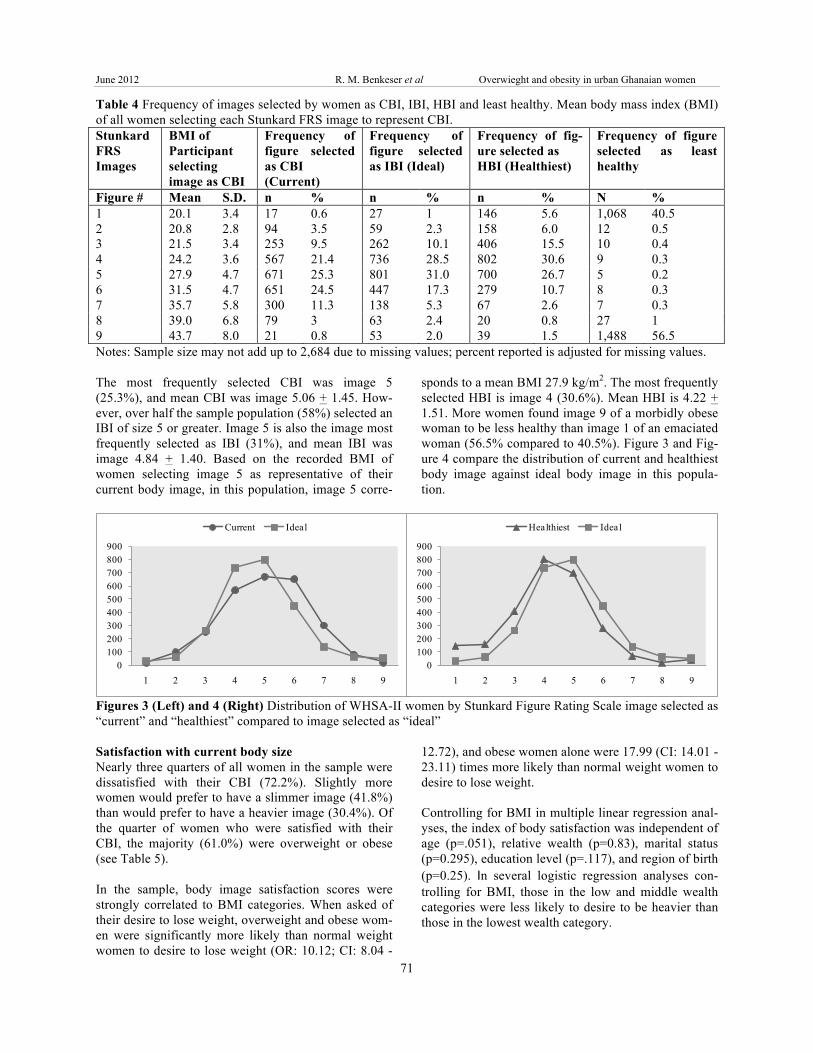
obese. According to ROC analysis, 85.7% of obese women can be correctly identified as obese by using their responses to the Stunkard FRS (Figure 1). This is a slightly lower but comparable percentage to Bulik et al.’s 93% correct identification in a Caucasian popula-tion. Upon examination, a similar cut-off between lean and obese as identified in Bulik et al can also be identi-fied for Ghanaian women. For the Stunkard FRS, im-age six is an ideal cut-off point for obesity as very few non-obese women chose figures greater than this size to represent their current image (Figure 2).
June 2012 Volume 46, Number 2 GHANA MEDICAL JOURNAL
70
Table 3 Overweight and obesity among women in Accra by socio-demographic characteristic: results from logistic regression models controlling for age category at time of survey. Woman is obeseb
(n = 973) Woman is overweight/obesec (n = 1,702)
na Prevalence (%) Odds Ratio (95% CI)
Prevalence (%) Odds Ratio (95% CI)
2,684 36.30 63.40 Age in years 18-24 154 11.70 1.00 33.30 1.00 25-34 719 23.50 2.32 (1.38, 3.90) 50.30 2.03 (1.41, 2.93) 35-54 893 45.60 6.33 (3.80, 10.52) 75.40 6.14 (4.24, 8.88) > 55 917 41.30 5.32 (3.20, 8.85) 71.50 5.01 (3.47, 7.23) Wealth Index (controlling for age) Lowest 527 30.70 1.00 58.60 1.00 Low 538 38.10 1.51 (1.16, 1.96) 64.40 1.44 (1.11, 1.87) Middle 534 38.60 1.48 (1.14, 1.92) 72.20 2.02 (1.54, 2.65) High 554 38.40 1.59 (1.23, 2.07) 68.70 1.86 (1.43, 2.43) Highest 482 35.90 1.45 (1.11, 1.91) 60.70 1.29 (0.98, 1.68) Parity (controlling for age) 0 514 20.40 1.00 44.40 1.00 1 325 31.70 1.32 (0.95, 1.85) 57.70 1.28 (0.95, 1.72) > 2 1,839 41.60 1.55 (1.18, 2.05) 72.00 1.81 (1.42, 2.32) Education (controlling for age) None 567 36.30 1.00 66.40 1.00 Primary 320 38.80 1.15 (0.86, 1.54) 64.40 0.96 (0.71, 1.30) Middle 1,054 34.90 0.96 (0.79, 1.19) 64.50 0.95 (0.75, 1.19) Secondary 441 35.80 0.93 (0.72, 1.22) 62.00 0.77 (0.59, 1.02) Higher 266 36.50 0.99 (0.73, 1.36) 65.90 0.97 (0.70, 1.35) Region of Childhood (controlling for age) Rural 320 36.70 1.00 64.40 1.00 Urban 2,319 32.50 1.46 (1.13, 1.88) 64.80 1.31 (1.02, 1.70) Current Marital Status (controlling for age) Married 1,271 42.40 1.00 58.90 1.00 Single 1,413 30.70 0.64 (0.54, 0.76) 71.30 0.62 (0.52, 0.74) a Totals may be less than 2,684 due to missing values b BMI > 30 kg/m2 c BMI > 25 kg/m2
Figure 1 Receiver Operating Curve for female obesity (BMI>30), Area Under Curve = .857
Figure 2 Per cent of obese (BMI > 30) and lean (BMI < 21) women by silhouette Distribution of Body Image Preferences Table 4 describes the distribution of participant re-sponses when asked to identify the Stunkard FRS im-ages that represent a woman’s current and ideal weight as well as the healthiest and least healthy weights. The associated mean BMI for women selecting each image as their “current” image is included.
June 2012 R. M. Benkeser et al Overwieght and obesity in urban Ghanaian women
71
Table 4 Frequency of images selected by women as CBI, IBI, HBI and least healthy. Mean body mass index (BMI) of all women selecting each Stunkard FRS image to represent CBI. Stunkard FRS Images
BMI of Participant selecting image as CBI
Frequency of figure selected as CBI (Current)
Frequency of figure selected as IBI (Ideal)
Frequency of fig-ure selected as HBI (Healthiest)
Frequency of figure selected as least healthy
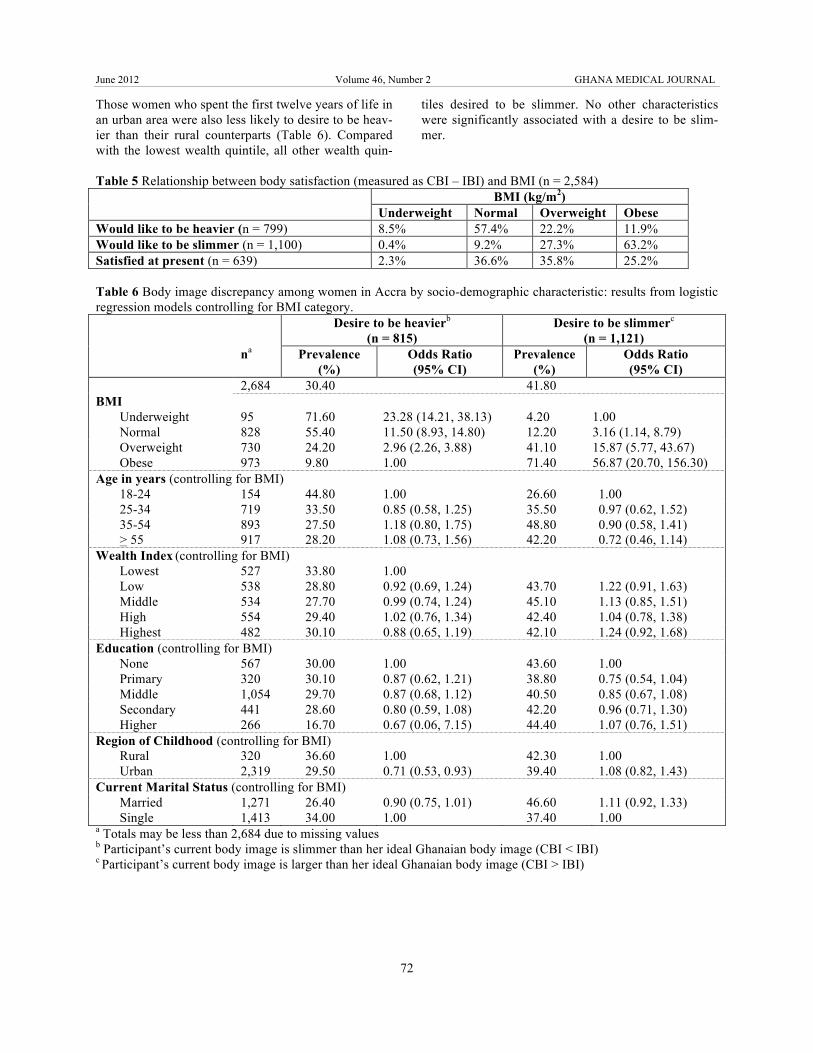
Figure # Mean S.D. n % n % n % N % 1 20.1 3.4 17 0.6 27 1 146 5.6 1,068 40.5 2 20.8 2.8 94 3.5 59 2.3 158 6.0 12 0.5 3 21.5 3.4 253 9.5 262 10.1 406 15.5 10 0.4 4 24.2 3.6 567 21.4 736 28.5 802 30.6 9 0.3 5 27.9 4.7 671 25.3 801 31.0 700 26.7 5 0.2 6 31.5 4.7 651 24.5 447 17.3 279 10.7 8 0.3 7 35.7 5.8 300 11.3 138 5.3 67 2.6 7 0.3 8 39.0 6.8 79 3 63 2.4 20 0.8 27 1 9 43.7 8.0 21 0.8 53 2.0 39 1.5 1,488 56.5 Notes: Sample size may not add up to 2,684 due to missing values; percent reported is adjusted for missing values. The most frequently selected CBI was image 5 (25.3%), and mean CBI was image 5.06 + 1.45. How-ever, over half the sample population (58%) selected an IBI of size 5 or greater. Image 5 is also the image most frequently selected as IBI (31%), and mean IBI was image 4.84 + 1.40. Based on the recorded BMI of women selecting image 5 as representative of their current body image, in this population, image 5 corre-
sponds to a mean BMI 27.9 kg/m2. The most frequently selected HBI is image 4 (30.6%). Mean HBI is 4.22 + 1.51. More women found image 9 of a morbidly obese woman to be less healthy than image 1 of an emaciated woman (56.5% compared to 40.5%). Figure 3 and Fig-ure 4 compare the distribution of current and healthiest body image against ideal body image in this popula-tion.
0100200300400500600700800900
1 2 3 4 5 6 7 8 9
Current Ideal
0100200300400500600700800900
1 2 3 4 5 6 7 8 9
Healthiest Ideal
Figures 3 (Left) and 4 (Right) Distribution of WHSA-II women by Stunkard Figure Rating Scale image selected as “current” and “healthiest” compared to image selected as “ideal” Satisfaction with current body size Nearly three quarters of all women in the sample were dissatisfied with their CBI (72.2%). Slightly more women would prefer to have a slimmer image (41.8%) than would prefer to have a heavier image (30.4%). Of the quarter of women who were satisfied with their CBI, the majority (61.0%) were overweight or obese (see Table 5). In the sample, body image satisfaction scores were strongly correlated to BMI categories. When asked of their desire to lose weight, overweight and obese wom-en were significantly more likely than normal weight women to desire to lose weight (OR: 10.12; CI: 8.04 -
12.72), and obese women alone were 17.99 (CI: 14.01 - 23.11) times more likely than normal weight women to desire to lose weight. Controlling for BMI in multiple linear regression anal-yses, the index of body satisfaction was independent of age (p=.051), relative wealth (p=0.83), marital status (p=0.295), education level (p=.117), and region of birth (p=0.25). In several logistic regression analyses con-trolling for BMI, those in the low and middle wealth categories were less likely to desire to be heavier than those in the lowest wealth category.
June 2012 Volume 46, Number 2 GHANA MEDICAL JOURNAL
72
Those women who spent the first twelve years of life in an urban area were also less likely to desire to be heav-ier than their rural counterparts (Table 6). Compared with the lowest wealth quintile, all other wealth quin-
tiles desired to be slimmer. No other characteristics were significantly associated with a desire to be slim-mer.
Table 5 Relationship between body satisfaction (measured as CBI – IBI) and BMI (n = 2,584) BMI (kg/m2)
Underweight Normal Overweight Obese Would like to be heavier (n = 799) 8.5% 57.4% 22.2% 11.9% Would like to be slimmer (n = 1,100) 0.4% 9.2% 27.3% 63.2% Satisfied at present (n = 639) 2.3% 36.6% 35.8% 25.2% Table 6 Body image discrepancy among women in Accra by socio-demographic characteristic: results from logistic regression models controlling for BMI category. Desire to be heavierb
(n = 815) Desire to be slimmerc
(n = 1,121) na Prevalence
(%) Odds Ratio (95% CI)
Prevalence (%)
Odds Ratio (95% CI)
2,684 30.40 41.80 BMI
Underweight 95 71.60 23.28 (14.21, 38.13) 4.20 1.00 Normal 828 55.40 11.50 (8.93, 14.80) 12.20 3.16 (1.14, 8.79) Overweight 730 24.20 2.96 (2.26, 3.88) 41.10 15.87 (5.77, 43.67) Obese 973 9.80 1.00 71.40 56.87 (20.70, 156.30)
Age in years (controlling for BMI) 18-24 154 44.80 1.00 26.60 1.00 25-34 719 33.50 0.85 (0.58, 1.25) 35.50 0.97 (0.62, 1.52) 35-54 893 27.50 1.18 (0.80, 1.75) 48.80 0.90 (0.58, 1.41) > 55 917 28.20 1.08 (0.73, 1.56) 42.20 0.72 (0.46, 1.14)
Wealth Index (controlling for BMI) Lowest 527 33.80 1.00 Low 538 28.80 0.92 (0.69, 1.24) 43.70 1.22 (0.91, 1.63) Middle 534 27.70 0.99 (0.74, 1.24) 45.10 1.13 (0.85, 1.51) High 554 29.40 1.02 (0.76, 1.34) 42.40 1.04 (0.78, 1.38) Highest 482 30.10 0.88 (0.65, 1.19) 42.10 1.24 (0.92, 1.68)
Education (controlling for BMI) None 567 30.00 1.00 43.60 1.00 Primary 320 30.10 0.87 (0.62, 1.21) 38.80 0.75 (0.54, 1.04) Middle 1,054 29.70 0.87 (0.68, 1.12) 40.50 0.85 (0.67, 1.08) Secondary 441 28.60 0.80 (0.59, 1.08) 42.20 0.96 (0.71, 1.30) Higher 266 16.70 0.67 (0.06, 7.15) 44.40 1.07 (0.76, 1.51)
Region of Childhood (controlling for BMI) Rural 320 36.60 1.00 42.30 1.00 Urban 2,319 29.50 0.71 (0.53, 0.93) 39.40 1.08 (0.82, 1.43)
Current Marital Status (controlling for BMI) Married 1,271 26.40 0.90 (0.75, 1.01) 46.60 1.11 (0.92, 1.33) Single 1,413 34.00 1.00 37.40 1.00
a Totals may be less than 2,684 due to missing values b Participant’s current body image is slimmer than her ideal Ghanaian body image (CBI < IBI) c Participant’s current body image is larger than her ideal Ghanaian body image (CBI > IBI)
June 2012 R. M. Benkeser et al Overwieght and obesity in urban Ghanaian women
73
Table 7 The food and physical activity environment for women in WHSA-II Age Group 18-24
(n=168) 25-34 (n=813)
35-54 (n=915)
> 55 (n=917)
Workplace Physical Activity Level (%) Sedentary 43 35 33 54 Moderate activity alone 56 61 61 45 Moderate and intense activity 1 4 6 1 Leisure Time Physical Activity Level (%) No leisure time activity 79 83 83 84 Moderate activity only (walking) 18 16 16 16 Vigorous activity only (sport) 0 0 0 0 Vigorous and moderate activity 2 1 1 0 Food Security (%) Enough food and always kinds wanted 50 55 53 54 Enough food but not always kinds 43 39 40 39 Sometimes not enough food 7 6 6 6 Often not enough food 0 0 1 1 Weight Influencing Behaviours and Environment Though 30.4% of women in the sample reported a de-sire to be heavier, only 6.3% of women in the sample have tried to increase weight by eating more food or calorie dense food. Similarly, though 41.8% of women desire to be lighter, only 17.7% have tried to decrease weight by eating less food or food with fewer calories, 12.6% have tried to decrease weight by exercising, and 2.6% have tried to decrease weight by taking diet pills. Women in this sample also report an awareness of the health risk associated with overweight and obesity (92.2%) and a desire to change body size to lead a healthier life (52.2%). Additionally, the food and phys-ical activity environment is described in Table 7. DISCUSSION Compared to the relatively small body of prior work on body image and obesity in Ghana including publica-tions from the WHSA-I, this study both confirms prior conclusions and brings new information into the obesi-ty/body image dialogue. It is clear that female over-weight/obesity is a pressing issue in Accra, and that reporting prevalence rates without gender stratification will lead to a misleading picture of obesity prevalence. For example, using World Health Survey 2003 data collected in Ghana, Biritwum et al calculate over-weight and obesity prevalence in the Greater Accra Region to be 42.7%,21 low compared with both the WHSA-I and WHSA-II which generated female over-weight and obesity prevalence of 62.2% and 64.9% respectively. The substantially increased obesity rates calculated from waist measurements compared with BMI may be attributed to the selection bias of the sample to include older women. Age related muscle loss can influence
BMI such that WC and WHR may provide a more ac-curate picture of disease risk. Additionally, due to the increased risk for disease in obese persons, it is likely that there are fewer obese women in the oldest age group due to early death. Indeed, the life expectancy in Ghana during 2009 was just 58 years.22 The population-wide weight distribution did not change drastically in the 5 years between WHSA sur-veys (mean BMI 27.9 + 7.2 vs. 28.3 + 6.7). Similar to WHSA-I, this study of WHSA-II found age to be the strongest determinant of overweight/obesity status in urban, Ghanaian women. After adjusting for age, mar-ried women and women with two or more children were more likely than their peers to be overweight or obese. In this sample, education is not significantly associated with risk of overweight or obesity. Unlike the WHSA-I, relative household wealth was found to be a significant risk factor for obesity in this analysis. Of all the quintiles of the wealth index, only the poor-est women had a lower risk for obesity when compared to the wealthiest quintile (OR:0.68 CI: 0.54-0.94). This reduced risk in the poorest women is likely a reflection of the poorest quintile’s lack of access to foods, for example, only 28.7% of these women in the lowest wealth index category had full food security (compared with over 50% in each of the other wealth index cate-gories). Interestingly, when comparing risk for over-weight and obesity, the wealthiest and poorest wealth quintiles have the lower risk of obesity compared to the 2-4 quintiles. A new finding is that women who spent the first 12 years of their childhood in an urban environment were at increased risk for overweight and obesity and at de-creased risk for desiring to be heavier. This finding seems to suggest there may be some credence to the
June 2012 Volume 46, Number 2 GHANA MEDICAL JOURNAL
74
westernization and urbanization hypotheses. According to this study, individual characteristics of the women themselves, like education level, are not as significant as age and parity suggesting that exposure to the envi-ronment (either social or physical) in Accra, as op-posed to individual characteristics, influences weight status. Indeed, a brief examination of the obesogenic environment in Accra in Table 7 reveals the environ-mental hurdles women face. However, given the high prevalence of overweight and obesity, it seems unlikely that these factors alone capture all of the variation in obesity levels in the population. Additional cofounders likely exist and should be explored in future analyses. The assessment of body image tests the hypothesis that it is the social environment and a preference for obesity that drives the epidemic. In this study, standardized Stunkard FRS were tested and used to evaluate percep-tual and attitudinal body image. Results were compara-ble to an earlier study conducted in Accra using cultur-ally relevant figural stimuli. In 2005, Duda et al assessed body image preference and overweight/obesity status in a sample of 305 wom-en visiting a radiology clinic in a public hospital in Accra, Ghana. These researchers used culturally adapted figural stimuli rather than the standardized Stunkard FRS.13 Duda et al found similar prevalence of overweight and obesity as in WHSA-II (65.6% v. 64.9%) though mean BMI was not reported. Using a scale with 12 images, the researchers found preference for an ideal body image associated with images whose corresponding BMIs were 26.1 and 26.5 kg/m2. When compared with the WHSA-II IBI preference for an image with mean BMI 27.9 kg/m2, the two studies both illustrate a slight preference for a figure outside the normal weight range. Comparing the images preferred as healthiest (HBI), Duda et al’s women selected healthy body images equivalent to ideal body image (mean BMI 26.1-26.5 kg/m2) while WHSA-II women selected healthy body images slightly smaller than ide-al body image (mean BMI 24.2 kg/m2 vs. 27.9 kg/m2). Dissatisfaction with CBI in both groups of women was quite high (76.4% vs. 75.9% in WHSA-II). Similar to Duda et al, the largest factor contributing to a woman’s desire for a slimmer or a heavier image was her BMI. Controlling for BMI, age, education and marital status do not influence a woman’s desire for a heavier or slimmer image. If heavier body image were indeed idealized, women with heavier BMI would not experi-ence significantly greater body dissatisfaction than those in the normal or underweight range. In addition to this finding, women growing up in urban areas were less likely than their rural peers to desire a heavier im-age (OR: 0.71, CI: 0.53-0.93).
Though the results in this study suggest that preferred body image should no longer be viewed as a major inhibitor to maintaining normal weight status in the urban, female population of Ghana, qualitative studies are necessary to better understand the ideal weight de-sires of women in this population. Over half (52.2%) of the women in the WHSA-II sample expressed willing-ness to change her body size to improve health out-comes and 41.8% of women wanted a body image smaller than her current size. If these women were able to achieve their ideal body images, the mean BMI dis-tribution in the population would shift resulting in a lower mean BMI than currently exists. Ideal body im-age in this group of women should not be viewed as an inhibitor to healthy weight maintenance, and interven-tions should be designed to help women achieve their ideal and healthy weights. REFERENCES 1. Table 3.1.7. in: Douptcheva, N and Allan G. Hill
with The WHSA-II Writing Team (2011) Final Report on the Women’s Health Study of Accra, Wave II. Institute for Statistical, Social and Eco-nomic Research, Technical Report 91. Accra: University of Ghana.
2. Abubakari, A.R., Lauder, W., Agyemang, C., Jones, M., Kirk, A. and Bhopal, R.S. Prevalence and time trends in obesity among adult West Afri-can populations: a meta-analysis. Obesity Reviews 2008; 9: 297-311.
3. Sobal, J. and Stunkard, A. Socio-economic Status and Obesity: A Review of the Literature. Psycho-logical Bulletin 1989; 105(2): 260-275.
4. Ghana Statistical Service (GSS), Ghana Health Service (GHS), and ICF Macro. Ghana Demo-graphic and Health Survey 2008. Accra, Ghana: GSS, GHS, and ICF Macro; 2009.
5. Duda, R.B., Dark, R., Seffah, J., Adanu, R.M.K., Anarfi, J.K. and Hill, A.G. Prevalence of Obesity in Women of Accra, Ghana. African Journal of Health Sciences 2007; 14: 154-159.
6. Jackson, M., Walker, S., Cruickshank, J.K., Shar-ma, S., Cade, J., Mbanya. J-C., Younger, N., For-rester, T.F. and Wilks, R. Diet and overweight and obesity in populations of African origin: Came-roon, Jamaica and the UK. Public Health Nutrition 2005; 10(2): 122-130.
7. Agyemang, C., Owusu-Dabo, E., Jonge, A., Mar-tins, D., Ogedegbe, G. and Stronks, K. Overweight and obesity among Ghanaian residents in The Netherlands: How do they weigh against their ur-ban and rural counterparts in Ghana? Public Health Nutrition 2008; 12(7): 909-916.
8. Fezeu, L.K., Assah, F.K., Balkau, B., Mbanya, D.S., Kenge, A., Awah, P.K. and Mbanya, J.N. Ten-year changes in central obesity and BMI in ru-
June 2012 R. M. Benkeser et al Overwieght and obesity in urban Ghanaian women
75
ral and urban Cameroon. Obesity 2008; 1144-1147.
9. Jackson M, Walker S, Cruickshank JK, Sharma S, Cade J, Mbanya J-C, Younger N, Forrester TF, Wilks R. Diet and overweight and obesity in popu-lations of African origin: Cameroon, Jamaica and the UK. Public Health Nutrition 2005; 10(2):122-130.
10. Pasquet, P., Temgoua, L.S., Melaman-Sego, F., Froment, A. and Rikong-Adie, H. Prevalence of overweight and obesity for urban adults in Came-roon. Annals of Human Biology 2003; 30(5): 551-562.
11. Fezeu, L. Association between socio-economic status and adiposity in urban Cameroon. Interna-tional Journal of Epidemiology 2005; 35:105-111.
12. Brink, P.M. Chapter 4: Fertility and Fat: The An-nang Fattening Room. In: Garine, I., Pollock, N.J. (eds.) Social Aspects of Obesity. Luxembourg 1995, pp 71-86.
13. Duda, R., Jumah, N.A., Hill, A.G., Seffah, J. and Biritwum, R. Assessment of the Ideal Body Image of Women in Accra, Ghana. Tropical Doctor 2007; 37(4): 241-244.
14. Hill, A.G., Darko, R., Seffah, J., Adanu , R., An-arfi, J. and Duda, R. Health of urban Ghanaian women as identified by the Women’s Health Study of Accra. International Journal of Gynecology & Obstetrics 2007; 99(2): 150-156.
15. Douptcheva, N and Allan G. Hill with The WHSA-II Writing Team (2011) Final Report on the Women’s Health Study of Accra, Wave II. In-
stitute for Statistical, Social and Economic Re-search, Technical Report 91. Accra: University of Ghana.
16. Despres, J.P. Is visceral obesity the cause of the metabolic syndrome? Annals of Medicine 2006; 38:52-63.
17. Snijder, M.B., van Dam, R.M., Visser, M., Seidell, J.C. What aspects of body fat are particularly haz-ardous and how do we measure them? Interna-tional Journal of Epidemiology 2006; 35:83-92.
18. Stunkard, A.J., Sorenson, T. and Schulsinger, F. Use of the Danish Adoption Register for the study of obesity and thinness. In Kety, S.S., Rowland, L.P., Sidman, R.L., Matthysse, S.W. (eds). The Genetics of Neurological and Psychiatric Disor-ders. New York: Raven Press, 1983, pp. 115-120.
19. Patt, M.R., Lane, A.E., Finney, C.P., Yanek, L.R. and Becker, D.M. Body image assessment: com-parison of figure rating scales among urban black women. Ethnicity and Disease 2002; 12:54-62.
20. Bulik, C.M., Wade, T.D., Heath, A.C., Martin, N.G., Stunkard, A.J. and Eaves, L.J. Relating body mass index to figural stimuli: population-based normative data for Caucasians. International Jour-nal of Obesity 2001; 25:1517-1524.
21. Biritwum, R.B., Gyapong, J. and Mensah, G. The Epidemiology of Obesity in Ghana. Ghana Medi-cal Journal 2005; 39(3): 82-85.
22. World Health Organization. (2006). Ghana: Mor-tality Country Fact Sheet. URL: http://www.who.int/whosis/mort/profiles/mort_afro_gha_ghana.pdf


