Embed Size (px)
Citation preview
13296
ISSN 2286-4822
www.euacademic.org
EUROPEAN ACADEMIC RESEARCH
Vol. II, Issue 10/ January 2015
Impact Factor: 3.1 (UIF)
DRJI Value: 5.9 (B+)
Prevalence of Rural Poverty in Sindh, Pakistan:
Case of Tando Allahyar District
ABDUL WAHID MEMON
Sindh Agriculture University, Tandojam, Pakistan
INAYATULLAH MAGSI
Sukkur IBA, Community College Kahirpur, Pakistan
HABIBULLAH MAGSI Sindh Agriculture University Tandojam, Pakistan
Abstract:
In order to understand the situation of rural poverty in Sindh
province of Pakistan, a descriptive research study has been conducted
in the district of Tando Allahyar. Results reveal that rural local actors
mostly engaged in traditional agriculture with illiteracy, poor-
infrastructure and lack of basic amenities, which has created
inequalities among them. It was hypothesized that the income is not
equally distributed, so the Lorenz curve has been fitted which was
estimated to be 20097.01409.07725.3 xxy with sufficiently
large R-square value of 0.99, where Gini coefficient was estimated to be
0.43. The value of Gini coefficient revealed that there was moderate
disparity in distribution of income. From present research it is
projected that efforts may be taken to increase literacy ratio in the
region as well as the awareness regarding scientific agricultural
practices, livestock and poultry keeping in order to fetch more income
from those basic sources. Finally it is projected that efforts may be
taken for the export of agricultural products, which will not only affect
the livelihood of rural communities but also the country's economy.
Key words: rural poverty, Sindh, Pakistan, Tando Allahyar District
Abdul Wahid Memon, Inayatullah Magsi, Habibullah Magsi- Prevalence of Rural
Poverty in Sindh, Pakistan: Case of Tando Allahyar District
EUROPEAN ACADEMIC RESEARCH - Vol. II, Issue 10 / January 2015
13297
Introduction
Poverty is a condition in which a person or community is
deprived of, or lacks the essentials for a minimum standard of
well-being and life (Haq, 2005). Since poverty is understood in
many senses, these essentials may be material resources such
as food, safe drinking water, and shelter, or they may be social
resources such as access to information, education, health care,
social status, political power, or the opportunity to develop
meaningful connections with other people in society. Poverty
may also be defined in relative terms. Therefore income
disparities or wealth disparities are seen as an indicator of
poverty and the condition of poverty is linked to questions of
scarcity and distribution of resources and power (Mulyanto and
Magsi 2014). Poverty is also a type of religious vow, a state
that may be taken on voluntarily in keeping with practices of
piety. Poverty has many dimentions; the poor has not only low
incomes, but also lack of access to basic needs such as
education, health, clean drinking water and proper sanitation.
The latter undermines their capabilities, limits their
opportunities to secure employment, results in their social
exclusion and exposes them to exogenous shocks (GOP, 2014).
Poverty is a state of multiple needs such as food, clothing,
education, medical relief, job opportunity and security and
political and social freedom, all of which are essential for
meaningful existence (Sayed, 2005). FAO (2009) has disclosed
some actualities that more than 80 percent of the world's
population lives in countries where income differentials
widening. The poorest 40 percent of the world’s population
account for only 5 percent of global income. On the other hand
the richest 20 percent account for 75 percent of world income.
In Pakistan poverty has historically been higher in rural
areas and lower in the cities. Out of the total 40 million living
below the poverty line, 30 million live in rural areas. Poverty
rose sharply in the rural areas in the 1990s, and the gap in
Abdul Wahid Memon, Inayatullah Magsi, Habibullah Magsi- Prevalence of Rural
Poverty in Sindh, Pakistan: Case of Tando Allahyar District
EUROPEAN ACADEMIC RESEARCH - Vol. II, Issue 10 / January 2015
13298
income between urban and rural areas of the country became
more significant. This trend has been attributed to a
disproportionate impact of economic events in the rural and
urban areas. Rural poverty is a complex and multi dimensional
phenomenon. It has many faces changing from place and across
time, and was illustrated in many ways; either relative or
absolute poverty; transient and chronic poverty. The issues of
rural poverty and income inequality are difficult to comprehend
without through examination of several interrelated aspects of
changes in the agriculture sector. The recent analysis of large
international and interregional data sets show that the
structure of the agricultural growth is a major factor in
explaining the bulk of rural poverty reduction. even though
agriculture sector continues to play a central role in Pakistan’s
economy, which contributes more than 20 percent in national
income (GOP, 2014). Besides that it is also a fact that Pakistan
stood at sixth most populous countries of the world with growth
rate of 2.05 percent and total fertility rate of 3.5 per
woman(GOP, 2014). Therefore, present study is undertaken to
frame universally acceptable threshold of poverty, to find out
trend analysis of rural poverty and income inequality by
employing axiomatic approach. In particular to assess the
impact of various factors on poverty status of a household and
to develop poverty equivalent growth rate (PEGR ) for
analyzing the trickle down impact of agricultural growth to the
rural poor and to forecast the co-integrated trends of
agricultural growth, rural poverty and income inequality in
Pakistan particularly in Sindh province.
Methodological Consideration
The data
This empirical study was conducted to document the socio-
economic conditions as well as to assess the role of agriculture
in enhancing household income by using survey method.
Abdul Wahid Memon, Inayatullah Magsi, Habibullah Magsi- Prevalence of Rural
Poverty in Sindh, Pakistan: Case of Tando Allahyar District
EUROPEAN ACADEMIC RESEARCH - Vol. II, Issue 10 / January 2015
13299
Therefore, the name of the research was proposed to be
Descriptive Survey Research. Thus multistage cluster sampling
was applied to select a representative sample of households. At
first stage, district Tando Allahyar has been selected which is
comprised over 3 Talukas. At second stage 3 villages from each
Taluka were selected and at final stage 10 respondents from
each village were randomly selected. Thus 90 households were
surveyed and interviewed through a well structured
questionnaire and the data were analyzed after all.
Poverty measurement
The level of income to subsist in a society show poverty line
measured. The cost of living and people’s expectations were
varies from place to place and from time to time, depending on
people's expectations and amenities. Normally the measures of
the total amount of income necessary to raise everyone whose
income are below the poverty line. The total income short fall or
Total Poverty Gap (TPG) of the poor is defined as;
H
i
ip yyTPG1
)(
Where
TPG = Total poverty gap
H = No of the poor who fall below poverty line
yp = Poverty line
yi = Income of the poor
Poverty index was developed by Amartya Sen (Sen, 2005). It
takes into account both the number of poor and the extent of
their poverty. Sen defined the index as:
A
AB
N
PSI
Where:
P = number of people below the poverty line
N = total number of people in society
B = poverty line income
Abdul Wahid Memon, Inayatullah Magsi, Habibullah Magsi- Prevalence of Rural
Poverty in Sindh, Pakistan: Case of Tando Allahyar District
EUROPEAN ACADEMIC RESEARCH - Vol. II, Issue 10 / January 2015
13300
A = average income of those people below the poverty line
Measurement of Inequality for Distribution of Income
Inequality can be measured by using Lorenz Curve and Gini
Coefficient. Lorenz curve is defined as a graph depicting the
variance of the size distribution of income from perfect equality.
It is graphically measured by dividing the area between the
perfect equality line and Lorenz Curve. The higher the value of
the coefficient, the higher the inequality of income distribution
and the lower it is the more equitable distribution of income.
The Lorenz curve is a graphical representation of the
cumulative distribution function of a probability distribution; it
is a graph showing the proportion of the distribution assumed
by the bottom y% of the values. It is often used to represent
income distribution, where it shows for the bottom x% of
households, what percentage y% of the total income they have.
The percentage of households is plotted on the x-axis, the
percentage of income on the y-axis. It can also be used to show
distribution of assets. In such uses, some political doctrines (e.g.
Socialism) consider it to represent social inequality.
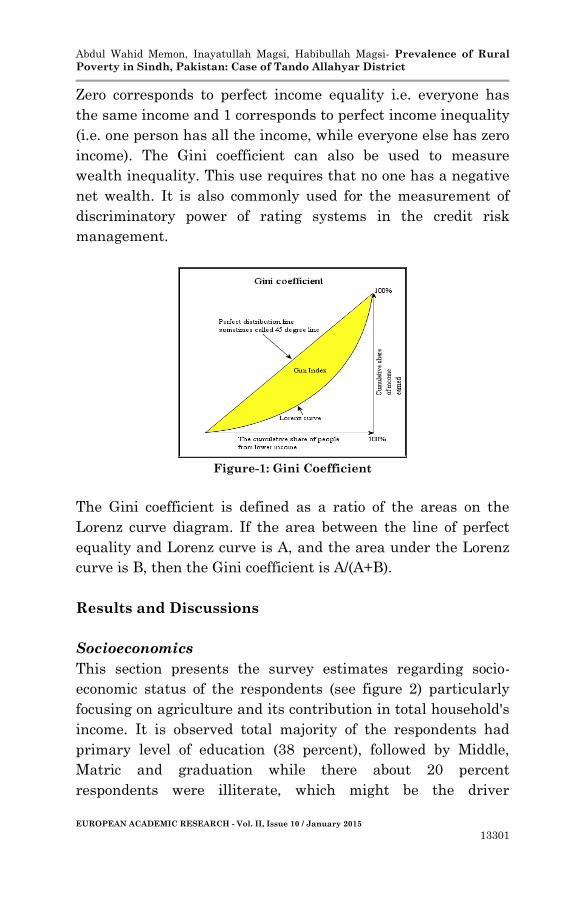
Gini coefficient
Gini coefficient (see figure 1) is defined as an aggregate
numerical measure of inequality ranging from zero (perfect
equality) to one (perfect inequality). It is defined as a ratio with
values between 0 and 1: the numerator is the area between the
Lorenz curve of the distribution and the uniform (perfect)
distribution line; the denominator is the area under the
uniform distribution line. It was developed by the Italian
statistician Corrado Gini and published in his 1912 paper
"Variabilità e mutabilità" ("Variability and Mutability"). The
Gini index is the Gini coefficient expressed as a percentage, and
is equal to the Gini coefficient multiplied by 100. The Gini
coefficient is equal to half of the relative mean difference. The
Gini coefficient is often used as an income inequality metric.
Abdul Wahid Memon, Inayatullah Magsi, Habibullah Magsi- Prevalence of Rural
Poverty in Sindh, Pakistan: Case of Tando Allahyar District
EUROPEAN ACADEMIC RESEARCH - Vol. II, Issue 10 / January 2015
13301
Zero corresponds to perfect income equality i.e. everyone has
the same income and 1 corresponds to perfect income inequality
(i.e. one person has all the income, while everyone else has zero
income). The Gini coefficient can also be used to measure
wealth inequality. This use requires that no one has a negative
net wealth. It is also commonly used for the measurement of
discriminatory power of rating systems in the credit risk
management.
Figure-1: Gini Coefficient
The Gini coefficient is defined as a ratio of the areas on the
Lorenz curve diagram. If the area between the line of perfect
equality and Lorenz curve is A, and the area under the Lorenz
curve is B, then the Gini coefficient is A/(A+B).
Results and Discussions
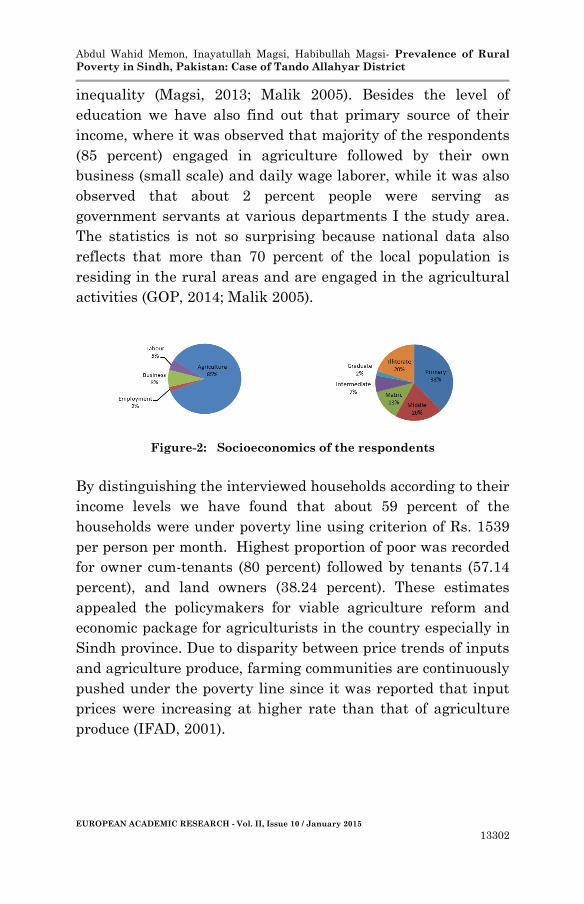
Socioeconomics
This section presents the survey estimates regarding socio-
economic status of the respondents (see figure 2) particularly
focusing on agriculture and its contribution in total household's
income. It is observed total majority of the respondents had
primary level of education (38 percent), followed by Middle,
Matric and graduation while there about 20 percent
respondents were illiterate, which might be the driver
Abdul Wahid Memon, Inayatullah Magsi, Habibullah Magsi- Prevalence of Rural
Poverty in Sindh, Pakistan: Case of Tando Allahyar District
EUROPEAN ACADEMIC RESEARCH - Vol. II, Issue 10 / January 2015
13302
inequality (Magsi, 2013; Malik 2005). Besides the level of
education we have also find out that primary source of their
income, where it was observed that majority of the respondents
(85 percent) engaged in agriculture followed by their own
business (small scale) and daily wage laborer, while it was also
observed that about 2 percent people were serving as
government servants at various departments I the study area.
The statistics is not so surprising because national data also
reflects that more than 70 percent of the local population is
residing in the rural areas and are engaged in the agricultural
activities (GOP, 2014; Malik 2005).
Figure-2: Socioeconomics of the respondents
By distinguishing the interviewed households according to their
income levels we have found that about 59 percent of the
households were under poverty line using criterion of Rs. 1539
per person per month. Highest proportion of poor was recorded
for owner cum-tenants (80 percent) followed by tenants (57.14
percent), and land owners (38.24 percent). These estimates
appealed the policymakers for viable agriculture reform and
economic package for agriculturists in the country especially in
Sindh province. Due to disparity between price trends of inputs
and agriculture produce, farming communities are continuously
pushed under the poverty line since it was reported that input
prices were increasing at higher rate than that of agriculture
produce (IFAD, 2001).
Abdul Wahid Memon, Inayatullah Magsi, Habibullah Magsi- Prevalence of Rural
Poverty in Sindh, Pakistan: Case of Tando Allahyar District
EUROPEAN ACADEMIC RESEARCH - Vol. II, Issue 10 / January 2015
13303
Poverty measurement
For further poverty analyses it was aimed that the development
estimates namely, poverty head count ratio, poverty gap, Sen
index and Gini coefficient might be calculated in order to have
true picture of poverty in the local actors. Thus results are
given in the following tables
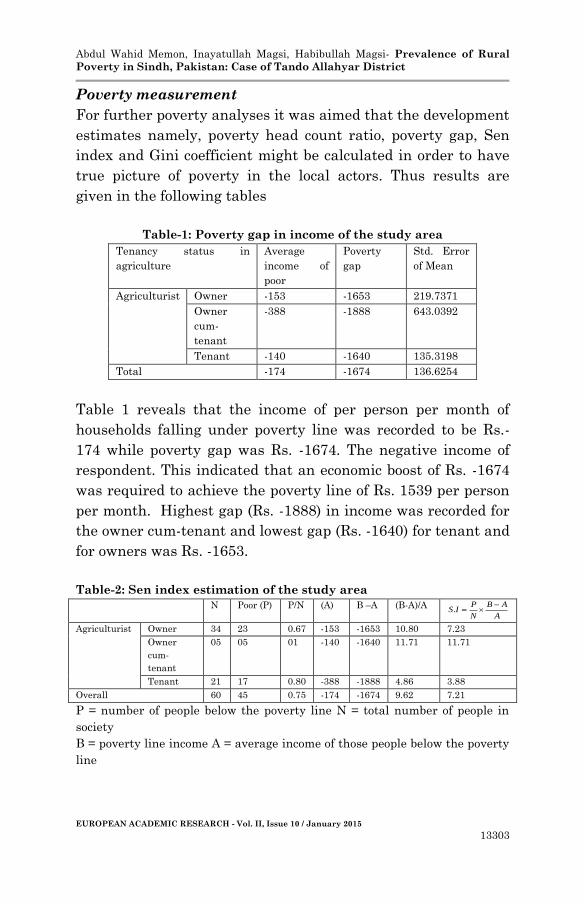
Table-1: Poverty gap in income of the study area
Tenancy status in
agriculture
Average
income of
poor
Poverty
gap
Std. Error
of Mean
Agriculturist Owner -153 -1653 219.7371
Owner
cum-
tenant
-388 -1888 643.0392
Tenant -140 -1640 135.3198
Total -174 -1674 136.6254
Table 1 reveals that the income of per person per month of
households falling under poverty line was recorded to be Rs.-
174 while poverty gap was Rs. -1674. The negative income of
respondent. This indicated that an economic boost of Rs. -1674
was required to achieve the poverty line of Rs. 1539 per person
per month. Highest gap (Rs. -1888) in income was recorded for
the owner cum-tenant and lowest gap (Rs. -1640) for tenant and
for owners was Rs. -1653.
Table-2: Sen index estimation of the study area
N Poor (P) P/N (A) B –A (B-A)/A A
AB
N
PIS
.
Agriculturist Owner 34 23 0.67 -153 -1653 10.80 7.23
Owner
cum-
tenant
05 05 01 -140 -1640 11.71 11.71
Tenant 21 17 0.80 -388 -1888 4.86 3.88
Overall 60 45 0.75 -174 -1674 9.62 7.21
P = number of people below the poverty line N = total number of people in
society
B = poverty line income A = average income of those people below the poverty
line
Abdul Wahid Memon, Inayatullah Magsi, Habibullah Magsi- Prevalence of Rural
Poverty in Sindh, Pakistan: Case of Tando Allahyar District
EUROPEAN ACADEMIC RESEARCH - Vol. II, Issue 10 / January 2015
13304
From Tabl-2 it can be seen that lowest Sen Index of 3.88 for
tenant and the highest (11.71) for owner-cum tenants has been
calculated, while the overall index of the study area was about
7.21. And owner’s index was recorded to be 7.23. Increased
input costs, stagnant output revenues, shortage of irrigation
water, and poor quality of inputs have deteriorated economic
conditions of tenants. The villages, ragged clothes, children out
of school, and gloomy look were the distinct features of poor
despondence and the same were protesting to the policymakers,
public and private institutions as well as multinational donor
agencies that despite their big claims, the poor were going to be
poorer. They were looking for agricultural and land reforms so
that they could come out of poverty curse, which is the situation
in the country also (Anwar, 2005).
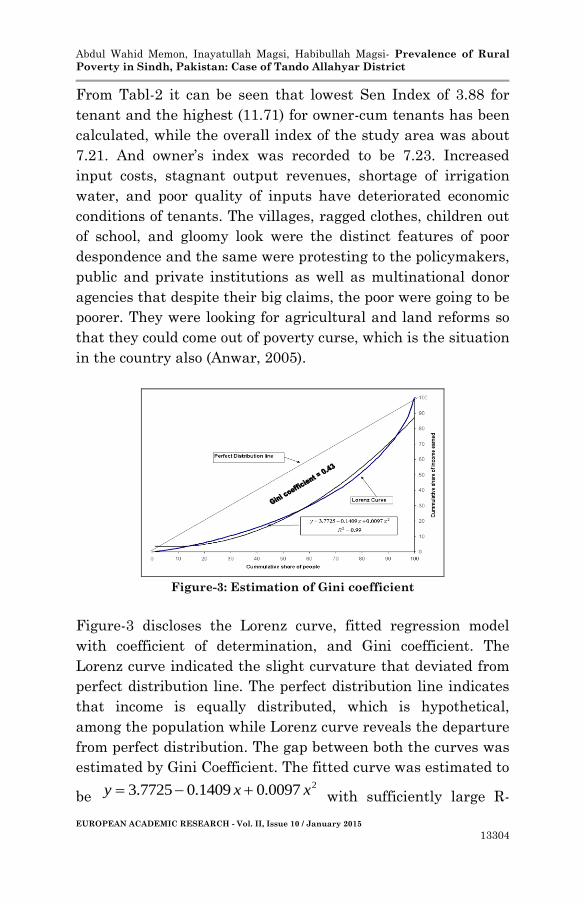
Figure-3: Estimation of Gini coefficient
Figure-3 discloses the Lorenz curve, fitted regression model
with coefficient of determination, and Gini coefficient. The
Lorenz curve indicated the slight curvature that deviated from
perfect distribution line. The perfect distribution line indicates
that income is equally distributed, which is hypothetical,
among the population while Lorenz curve reveals the departure
from perfect distribution. The gap between both the curves was
estimated by Gini Coefficient. The fitted curve was estimated to
be 20097.01409.07725.3 xxy with sufficiently large R-
Abdul Wahid Memon, Inayatullah Magsi, Habibullah Magsi- Prevalence of Rural
Poverty in Sindh, Pakistan: Case of Tando Allahyar District
EUROPEAN ACADEMIC RESEARCH - Vol. II, Issue 10 / January 2015
13305
square value of 0.99, nearby perfect relationship between
Lorenz curve and estimated quadratic regression line. The Gini
coefficient was estimated to be 0.43. The value of Gini
coefficient revealed that there was moderate disparity in
distribution of income. The difference could be on the account of
disparity in level of income between tenants and landlords.
From this, it may not be inferred that landlords possessed
upper socioeconomic profile (Mulyanto, 2014; Anwar 2005).
Conclusion and Suggestions
The present study was conducted to document the socio-
economic conditions as well as to assess the role of agriculture
in enhancing household income by using survey methods. It is
concluded that the respondents lacking proper education and
unawareness in targeted area, because only 2 percent of the
interviewees had education at university level. Such situation
kept them away from better sources of income. That is why they
were engaged in conventional agriculture and small kind of
business like shop keeping etc, while very few respondents were
working in services sector. In order to assess gap Lorenz curve
has been fitted which was estimated to be 20097.01409.07725.3 xxy with sufficiently large R-
square value of 0.99, where Gini coefficient was estimated to be
0.43. The value of Gini coefficient revealed that there was
moderate disparity in distribution of income. From present
research it is projected that efforts may be taken to increase
literacy ratio in the region. Viable educational programs may be
developed and effectively implemented to enhance enrolment
ratio in schools. as majority of the respondents were engaged in
agriculture, so the agriculture education extension services may
be provided then at far gates in order to augment this sector at
scientific lines. Vocational education may be imparted for
females so that they could be able to generate income along
with their men. Training programs particularly focusing on
Abdul Wahid Memon, Inayatullah Magsi, Habibullah Magsi- Prevalence of Rural
Poverty in Sindh, Pakistan: Case of Tando Allahyar District
EUROPEAN ACADEMIC RESEARCH - Vol. II, Issue 10 / January 2015
13306
profitable crops and raising livestock and poultry may be
arranged for capacity building of farmers to enhance their
incomes. Marketing infrastructure may be improved to enhance
the profit margins in comparison of intermediaries. Cold
storages may be developed to stabilize the prices of agricultural
products especially for fruits and vegetables. Efforts may be
taken for the export of agricultural products, which will not
only affect the livelihood of rural communities but also the
country's economy.
REFERENCES
Anderson, D.R., Sweeny, D.J. and Williams, T.A. 1993.
Statistics for business and Economics; West Publication
Company. 610, Opera man Drive, P.O. 64526. Stationary
Plant, MN, USA.
Anwar, Talat. 2005. Prevalence of Relative Poverty in Pakistan.
The Pakistan Development Review, 44, 4, 1111-1131.
Fraenkel and Wallen, 1994. Statistics for business and
economics, 4th edition, McGraw Hill. PP. 255-256
Gini, Corrado, 1912. Variabilità e mutabilità" Reprinted in
Memorie di metodologica statistica (Ed. Pizetti E,
Salvemini, T). Rome: Libreria Eredi Virgilio Veschi
(1955).
Gini, Corrado, 1921. Measurement of Inequality and Incomes.
The Economic Journal 31: 124-126.
GOP, 2014. Economic Survey of Pakistan, 2013-14. Economic
Advisor's wing, Finance Division, Islamabad. June 2014.
Haq, Rashida. 2005. An Analysis of Poverty at the Local Level.
The Pakistan Development Review, 44, 4, 1093-1109.
IFAD Report, 2001. “ Rural Poverty Report”. International
Fund for Agricultural Development.
Magsi, H., Mirani, Z. and Lohano, H.D. 2014. Marketing
System and Structure for Agroforestry Products in
Abdul Wahid Memon, Inayatullah Magsi, Habibullah Magsi- Prevalence of Rural
Poverty in Sindh, Pakistan: Case of Tando Allahyar District
EUROPEAN ACADEMIC RESEARCH - Vol. II, Issue 10 / January 2015
13307
Sindh, Pakistan. European Academic Research, 2(7):
9509-9522
Magsi, H. 2013. Land use conflicts in developing countries:
framing conflict resolution and prevention strategies to
ensure economic growth and human welfare (The case of
Chotiari water reservoir from Pakistan). PhD thesis of
Economics, AgroParisTech. pp.209.
Malik, S. J. 2005. Agricultural Growth and Rural Poverty: A
Review of the Evidence. Pakistan Resident Mission
Working Paper Series. Working Paper No. 2. Islamabad:
Asian Development Bank.
Mulyanto and Magsi, H. 2014. Approaches to measure quality
of human resource development index in the village
context: case of Central Java, Indonesia. The
Macrotheme Review, 3(6): 1-17.
Saboor, A. 2004. Agricultural growth, rural poverty and income
inequality in pakistan: a time series analysis. PhD
thesis, University of Agriculture, Faisalabad.
Sayed, 2005. Rural poverty in Pakistan, The Daily Times of
Pakistan, online available at;
http://www.dailytimes.com.pk/default.asp?page=story_1
4-6-2005_pp7_36.
Sen, Dilip Kumar. 2005. Economics of Poverty and Social
Justice: A Brief Analysis. Pakistan Economic and Social
Review, 43, 2, 213-226.
Tryfos, P. 1996. Sampling methods for applied research: Text
and cases. John Wiley & Sons, Inc. New York.


