Embed Size (px)
Citation preview
Prevalence of transcription promoters within archaealoperons and coding sequences
Tie Koide1,5,6, David J Reiss1,5, J Christopher Bare1, Wyming Lee Pang1, Marc T Facciotti1,2, Amy K Schmid1, Min Pan1, Bruz Marzolf1,Phu T Van1, Fang-Yin Lo1, Abhishek Pratap1, Eric W Deutsch1, Amelia Peterson3, Dan Martin1,3 and Nitin S Baliga1,4,*
1 Institute for Systems Biology, Seattle, WA, USA, 2 Department of Biomedical Engineering and UC Davis Genome Center, One Shields Avenue, University ofCalifornia, Davis, CA, USA, 3 Divisions of Human Biology and Clinical Research, Fred Hutchinson Cancer Research Center, Seattle, WA, USA and 4 Departments ofMicrobiology, and Molecular and Cellular Biology, University of Washington, Seattle, WA, USA5 These authors contributed equally to this work6 Present address: Departamento de Bioquımica e Imunologia, Faculdade de Medicina de Ribeirao Preto, Universidade de Sao Paulo, Brazil.
E-mail: [email protected]* Corresponding author. Institute for Systems Biology, Departments of Microbiology, and Molecular and Cellular Biology, University of Washington, 1441 N 34th Street,Seattle, WA 98103, USA. Tel.: þ 1 206 732 1266; Fax: þ 1 206 732 1299; E-mail: [email protected]
Received 20.11.08; accepted 13.5.09
Despite the knowledge of complex prokaryotic-transcription mechanisms, generalized rules, suchas the simplified organization of genes into operons with well-defined promoters and terminators,have had a significant role in systems analysis of regulatory logic in both bacteria and archaea. Here,we have investigated the prevalence of alternate regulatory mechanisms through genome-widecharacterization of transcript structures of B64% of all genes, including putative non-coding RNAsin Halobacterium salinarum NRC-1. Our integrative analysis of transcriptome dynamics andprotein–DNA interaction data sets showed widespread environment-dependent modulation ofoperon architectures, transcription initiation and termination inside coding sequences, andextensive overlap in 30 ends of transcripts for many convergently transcribed genes. A significantfraction of these alternate transcriptional events correlate to binding locations of 11 transcriptionfactors and regulators (TFs) inside operons and annotated genes—events usually consideredspurious or non-functional. Using experimental validation, we illustrate the prevalence ofoverlapping genomic signals in archaeal transcription, casting doubt on the general perception ofrigid boundaries between coding sequences and regulatory elements.Molecular Systems Biology 5: 285; published online 16 June 2009; doi:10.1038/msb.2009.42Subject Categories: functional genomics; chromatin & transcriptionKeywords: archaea; ChIP–chip; non-coding RNA; tiling array; transcription
This is an open-access article distributed under the terms of the Creative Commons Attribution Licence,which permits distribution and reproduction in any medium, provided the original author and source arecredited. Creation of derivative works is permitted but the resulting work may be distributed only under thesame or similar licence to this one. This licence does not permit commercial exploitation without specificpermission.
Introduction
Systems-biology approaches have been successfully appliedto construct quantitative and predictive models of bio-logical networks (Bonneau et al, 2007; Faith et al, 2007).However, a significant amount of information is missingfrom these models because of incomplete parts lists (unan-notated genes, non-coding RNAs (ncRNAs), poorly under-stood protein modifications and so on) as well as a lack ofmolecular detail associated with these processes. Incorporat-ing such detail will make these models mechanisticallyaccurate and useful for synthetic-biology approachestargeting large-scale biological-circuit re-engineering. Amongthe current systems-scale models most amenable for suchlarge-scale redesign are those that describe gene-regulatorynetworks (GRNs).
GRN models are usually built upon transcriptome data, inwhich typically genes or gene modules (with similar expres-sion patterns and shared regulatory motifs) are associated withtheir transcriptional regulators through linear or Bayesianmodels. However, although these models can be predictive(Bonneau et al, 2007), they often rely on approximations of thetranscription process and lack finer details of dynamicenvironment-dependent assembly of transcription complexesat each of the numerous promoters in the genome. High-density tiling arrays can be used to define transcribed regions(David et al, 2006), start sites (McGrath et al, 2007), andprotein–DNA interaction sites (Reiss et al, 2008), which can beused to identify some of these missing details associated withtranscriptional regulation, and thereby enable us to constructsystems-scale predictive models of GRNs that are alsomechanistically accurate.
& 2009 EMBO and Macmillan Publishers Limited Molecular Systems Biology 2009 1
Molecular Systems Biology 5; Article number 285; doi:10.1038/msb.2009.42Citation: Molecular Systems Biology 5:285& 2009 EMBO and Macmillan Publishers Limited All rights reserved 1744-4292/09www.molecularsystemsbiology.com
We recently constructed a model of an environment andgene-regulatory influence network (EGRIN) for the halophilicarchaeon Halobacterium salinarum NRC-1. This modelaccurately predicts the transcriptional changes in 80% of allgenes to new environmental and genetic perturbations(Bonneau et al, 2007). Using an integrated biclusteringalgorithm to identify regulons and their putative cis-regulatorymotifs (Reiss et al, 2006), and a sparse regression procedure tostatistically pair these regulons with their putative regulators(Bonneau et al, 2006), we were able to discover thecombinatorial and conditional regulation of genes by multipleTFs and EFs (environmental factors) (Bonneau et al, 2007).Although several of the statistically inferred influences in thisnetwork were shown to be likely mediated through directinteractions with the promoters of regulated genes, a largenumber of influences are thought to be indirect. The logicalnext step is to make this quantitative and predictive networkalso mechanistically accurate on a systems scale.
Construction of a mechanistically accurate systems-scalemodel is a reasonable expectation for Halobacterium salinarumNRC-1, as its transcription is driven by a simplified version of aeukaryotic RNA polymerase (RNAP) II (Hirata et al, 2008) in agenome with prokaryotic organization. The archaeal RNAPrequires only two general transcription factors – GTFs (TATAbinding protein –TBP and transcription factor B –TFB) forpromoter recruitment and basal transcription initiation.Furthermore, only B130 putative transcriptional regulators(TRs) are present among the B2400 genes encoded in thegenome of H. salinarum NRC-1 (Ng et al, 2000). A relativelysmall number of genes and few TFs (GTFs and TRs) togethermake H. salinarum NRC-1 an attractive model system forcharacterizing gene-regulatory mechanisms at all promoters.Notably, the combinatorial action of multiple TFBs and TBPs(H. salinarum NRC-1 possesses 6 TBPs and 7 TFBs) in definingbasal promoter architecture in most archaea (Baliga et al, 2000;Facciotti et al, 2007) provides a unique opportunity tocharacterize dynamic conditional regulation of a large fractionof genes during cellular responses to complex changes.
Here, we report a significant step toward a mechanisticallyaccurate EGRIN model by characterizing the dynamic remo-deling of the transcriptome structure of H. salinarum NRC-1during a complex cellular response, and correlating thesechanges to genome-wide binding locations of 50% of allpredicted GTFs as well as several specific TRs. By integratingdiverse data types, we identified: (i) transcription start sites(TSSs) and termination sites (TTSs) for B64% of the genes,including new and revised protein-coding genes; (ii) 61 new
ncRNA candidates; (iii) 50 and 30 untranslated regions (UTRs)of mRNAs; (iv) functional promoters upstream and internal tocoding regions; (v) instances of transcription terminationinside coding sequences; (vi) mRNA populations with variable30-end locations; (vii) transcripts with extensive overlaps intheir 30 termini; and (viii) operon-encoding transcripts ofvariable length. Significantly, these findings suggest that theincorporation of mechanistic accuracy into GRN models wouldrequire genes, operons, promoters, and terminators to betreated as dynamic entities.
Results
Genome-wide protein–DNA binding data show TFbinding inside genes and operons
A detailed map of genomic locations where TFs bind DNA andmodulate transcription is essential to model mechanisms ofgene regulation on a systems scale. Chromatin immunopreci-pitation of transcription complexes coupled to microarray(ChIP–chip Ren et al (2000)) or sequencing (ChIP–seq(Robertson et al (2007)) is a commonly used approach toconstruct such maps. In ChIP–chip, the resolution to which theprotein–DNA binding sites (TFBSs) can be identified is oftenlimited by the genomic spacing of the probes in the array. Weutilized the MeDiChI algorithm (Reiss et al, 2008) to estimateprecise TFBS locations and their corresponding local falsediscovery rates (LFDRs) from new and previously reportedgenome-wide ChIP–chip measurements for 11 TFs (with twoor more biological replicates for each): all TFBs (TFBa, TFBb,TFBc, TFBd, TFBe, TFBf, and TFBg), one TBP (TBPb) andthree TRs (Trh3, Trh4, and VNG1451C) in H. salinarum NRC-1(see Materials and methods). On the basis of simulationssimilar to those of Reiss et al (2008), with a noise modelcustomized to mimic the data used in this study, we estimatedthat the average positional uncertainty in TFBS locationsidentified by MeDiChI averaged B50 nucleotides (nt) (1SE)over all ChIP–chip data sets used in this study.
We found that the 3072 significant (LFDRo0.1) individualTFBSs for all data sets often fell within distinct loci where atleast three different TFs were observed within a ±50 ntwindow (Po10�8). We therefore refined this TFBS list to aconservative set of 318 such distinct ‘multi-TF-binding loci’,hereafter TFBS loci throughout the genome (Table I; seeSupplementary Table 1 for each loci). As we applied to eachindividual data set an LFDR cutoff of 0.1, which by itself israther stringent, the joint LFDR of these 318 TFBS loci is
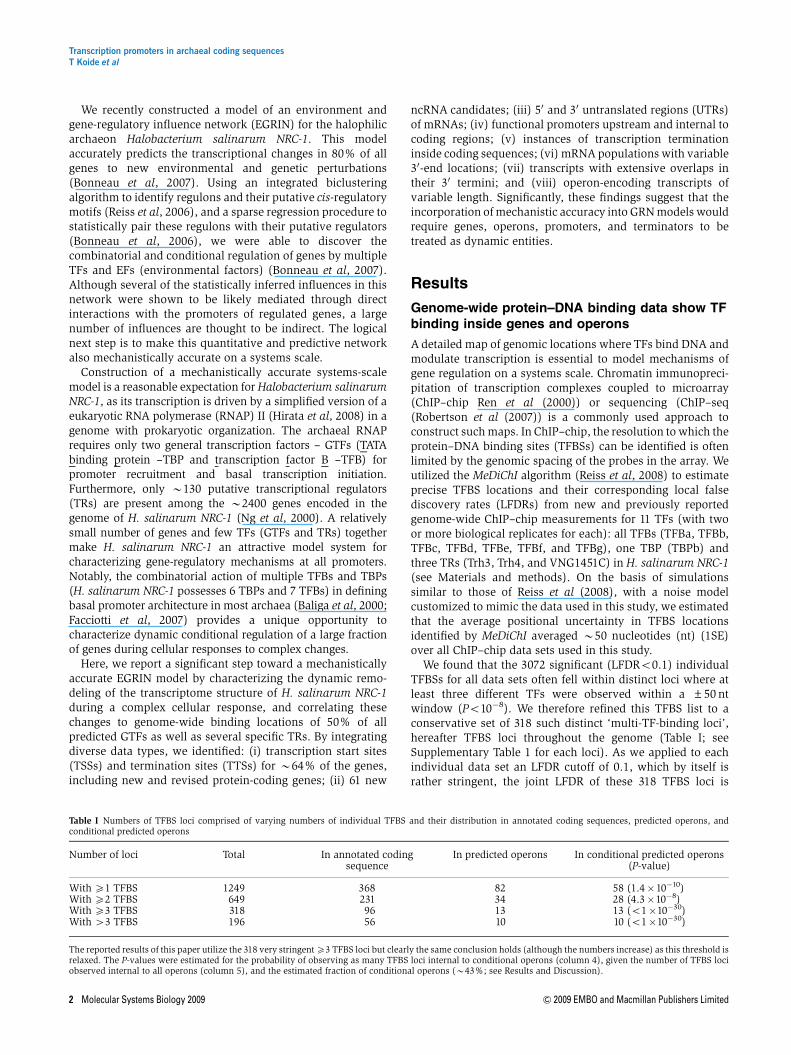
Table I Numbers of TFBS loci comprised of varying numbers of individual TFBS and their distribution in annotated coding sequences, predicted operons, andconditional predicted operons
Number of loci Total In annotated codingsequence
In predicted operons In conditional predicted operons(P-value)
With X1 TFBS 1249 368 82 58 (1.4�10�10)With X2 TFBS 649 231 34 28 (4.3�10�8)With X3 TFBS 318 96 13 13 (o1�10�30)With 43 TFBS 196 56 10 10 (o1�10�30)
The reported results of this paper utilize the 318 very stringent X3 TFBS loci but clearly the same conclusion holds (although the numbers increase) as this threshold isrelaxed. The P-values were estimated for the probability of observing as many TFBS loci internal to conditional operons (column 4), given the number of TFBS lociobserved internal to all operons (column 5), and the estimated fraction of conditional operons (B43%; see Results and Discussion).
Transcription promoters in archaeal coding sequencesT Koide et al
2 Molecular Systems Biology 2009 & 2009 EMBO and Macmillan Publishers Limited
significantly smaller than that. Although each individual TFhad a significant bias of binding in annotated intergenicregions (B60%, on average, versus B16% expected), thisfraction increased to B70% (276) when considering the 318TFBS loci (PB10�31). Monte Carlo simulations of TFBSsplaced only in non-coding regions in the genome with a B50–75 nt positional uncertainty and an LFDR between 0.1–0.01show that 80–85% of detected TFBSs should fall in intergenicregions (for more details, see Materials and methods). Thus,our assessment was that a small but significant fraction ofthese significant TFBS loci in our ChIP–chip data sets (as many asB10% of the multi-TFBS loci) fell within coding regions. Hereonwards, we present detailed and systematic experimentalvalidation that shows that many of these TF-binding eventsinside coding sequences have significant consequences on thetranscriptional regulation of diverse aspects of cellular physiology.
Analysis of transcriptome structure shows newexpression features
The location of a TFBS in the vicinity of a TSS or a TTS couldindicate whether a given binding event is functional, especiallyfor the interactions localized within a gene or operon. Weinvestigated this by systematically mapping transcript bound-aries and their dynamic changes at the whole-genome levelusing genome-wide tiling array data and then integrating thisinformation with the TF-binding information.
We define transcriptome structure as the collection of TSSsand TTSs that together characterize transcriptional units(mono- and polycistronic mRNAs, tRNAs, rRNAs, and otherncRNAs). Sequence signatures for these features are yet to becharacterized in archaea, and computational predictionsbased on known signatures in bacteria and eukaryotes remainerror prone due to incomplete understanding of transcriptionprocesses in all organisms (Jones, 2006). Therefore, weexperimentally mapped the transcriptome structure of
H. salinarum NRC-1 by hybridizing total RNA (including RNAspecies o200 nt) to genome-wide high-density tiling arrays(60mer probes with 40 nt overlap between contiguous probes).
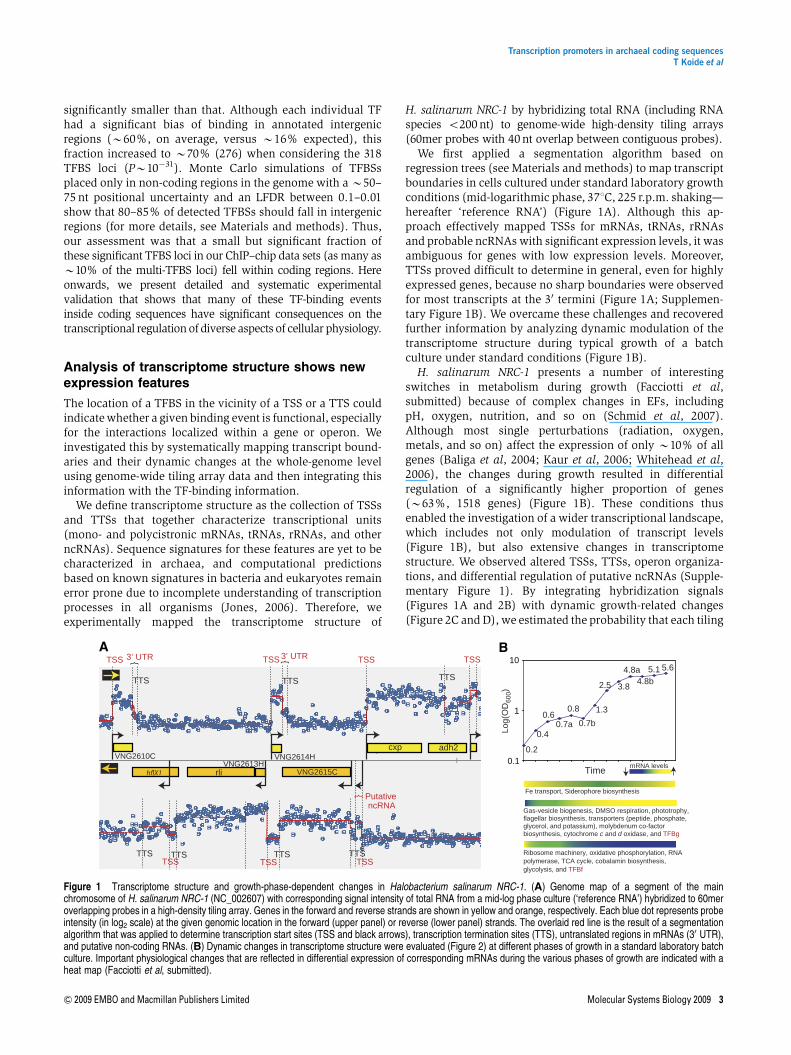
We first applied a segmentation algorithm based onregression trees (see Materials and methods) to map transcriptboundaries in cells cultured under standard laboratory growthconditions (mid-logarithmic phase, 371C, 225 r.p.m. shaking—hereafter ‘reference RNA’) (Figure 1A). Although this ap-proach effectively mapped TSSs for mRNAs, tRNAs, rRNAsand probable ncRNAs with significant expression levels, it wasambiguous for genes with low expression levels. Moreover,TTSs proved difficult to determine in general, even for highlyexpressed genes, because no sharp boundaries were observedfor most transcripts at the 30 termini (Figure 1A; Supplemen-tary Figure 1B). We overcame these challenges and recoveredfurther information by analyzing dynamic modulation of thetranscriptome structure during typical growth of a batchculture under standard conditions (Figure 1B).
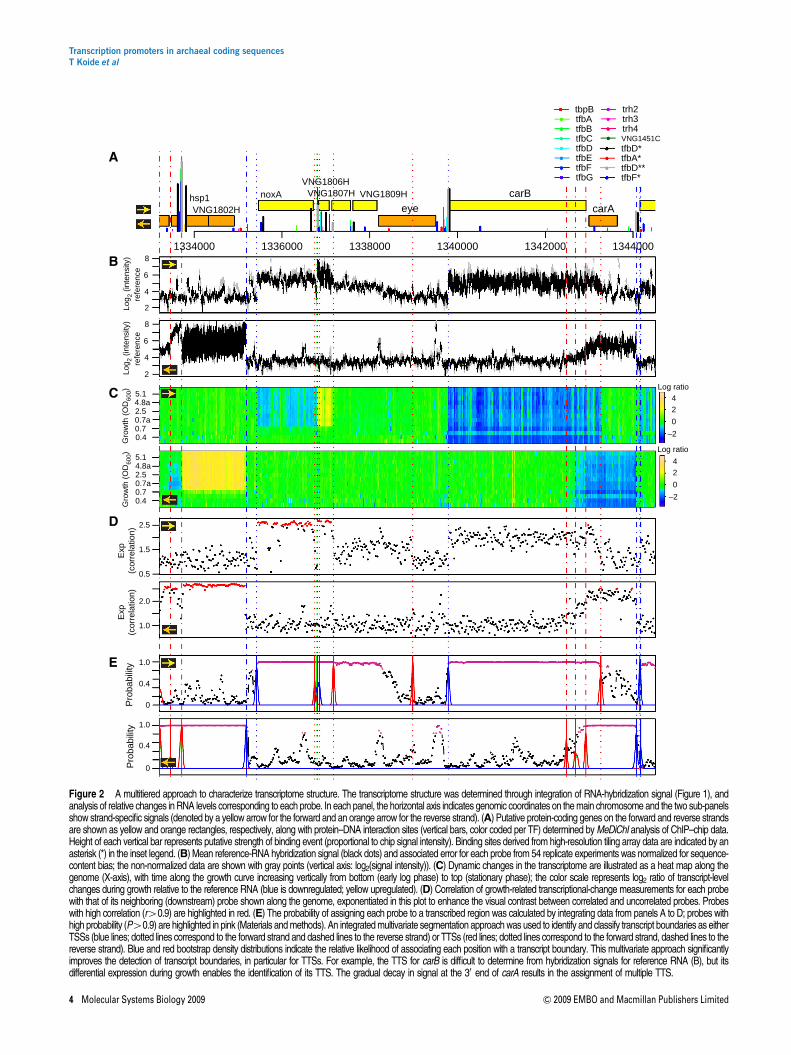
H. salinarum NRC-1 presents a number of interestingswitches in metabolism during growth (Facciotti et al,submitted) because of complex changes in EFs, includingpH, oxygen, nutrition, and so on (Schmid et al, 2007).Although most single perturbations (radiation, oxygen,metals, and so on) affect the expression of only B10% of allgenes (Baliga et al, 2004; Kaur et al, 2006; Whitehead et al,2006), the changes during growth resulted in differentialregulation of a significantly higher proportion of genes(B63%, 1518 genes) (Figure 1B). These conditions thusenabled the investigation of a wider transcriptional landscape,which includes not only modulation of transcript levels(Figure 1B), but also extensive changes in transcriptomestructure. We observed altered TSSs, TTSs, operon organiza-tions, and differential regulation of putative ncRNAs (Supple-mentary Figure 1). By integrating hybridization signals(Figures 1A and 2B) with dynamic growth-related changes(Figure 2C and D), we estimated the probability that each tiling
0.1
1
10
0.2
0.4
0.60.7a
0.8
0.7b
1.3
2.5 3.8
4.8a4.8b
5.1 5.6
Time
Log(
OD
600)
mRNA levelsVNG2610C VNG2614H
cxp adh2
rliVNG2613H
VNG2615C
PutativencRNA
}
3’ UTR
}
3’ UTR}TSS
TTSTTS TTS
TTS TTS TTS
TSS TSS TSS
TSSTSSTSSTTS
Fe transport, Siderophore biosynthesis
Gas-vesicle biogenesis, DMSO respiration, phototrophy,flagellar biosynthesis, transporters (peptide, phosphate,glycerol, and potassium), molybdenum co-factor biosynthesis, cytochrome c and d oxidase, and TFBg
Ribosome machinery, oxidative phosphorylation, RNA polymerase, TCA cycle, cobalamin biosynthesis,glycolysis, and TFBf
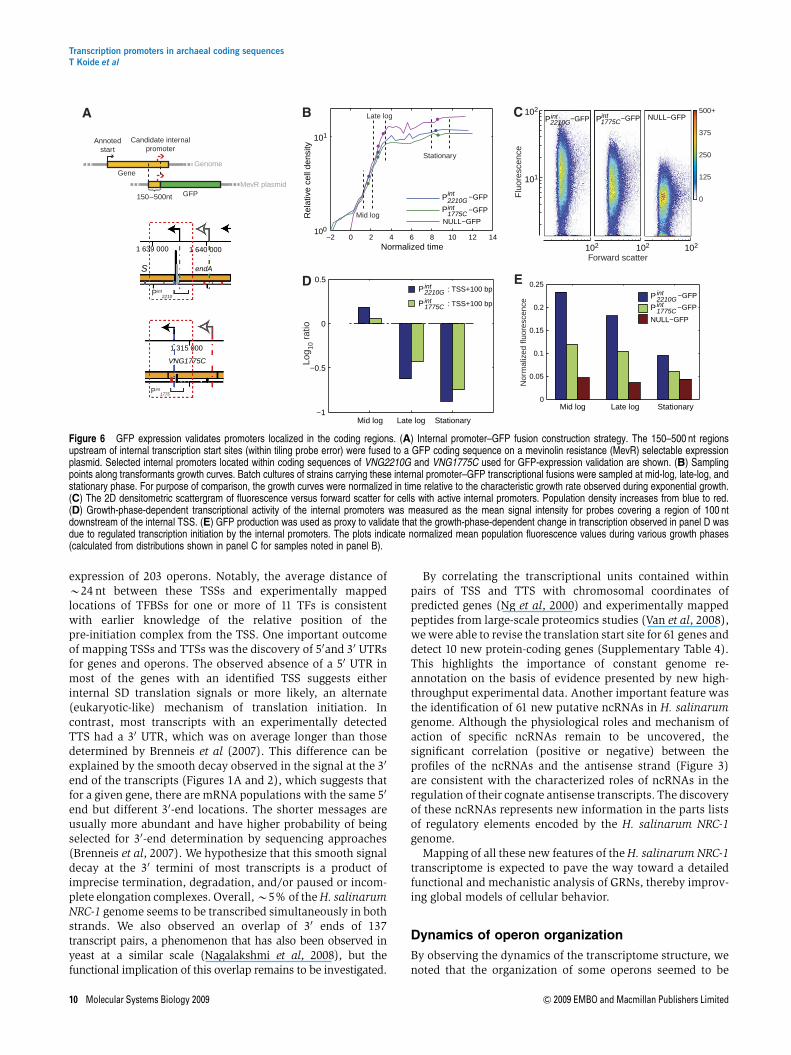
Figure 1 Transcriptome structure and growth-phase-dependent changes in Halobacterium salinarum NRC-1. (A) Genome map of a segment of the mainchromosome of H. salinarum NRC-1 (NC_002607) with corresponding signal intensity of total RNA from a mid-log phase culture (‘reference RNA’) hybridized to 60meroverlapping probes in a high-density tiling array. Genes in the forward and reverse strands are shown in yellow and orange, respectively. Each blue dot represents probeintensity (in log2 scale) at the given genomic location in the forward (upper panel) or reverse (lower panel) strands. The overlaid red line is the result of a segmentationalgorithm that was applied to determine transcription start sites (TSS and black arrows), transcription termination sites (TTS), untranslated regions in mRNAs (30 UTR),and putative non-coding RNAs. (B) Dynamic changes in transcriptome structure were evaluated (Figure 2) at different phases of growth in a standard laboratory batchculture. Important physiological changes that are reflected in differential expression of corresponding mRNAs during the various phases of growth are indicated with aheat map (Facciotti et al, submitted).
Transcription promoters in archaeal coding sequencesT Koide et al
& 2009 EMBO and Macmillan Publishers Limited Molecular Systems Biology 2009 3
1334000 1336000 1338000 1340000 1342000 1344000
VNG1809H
eyecarB
carA
VNG1806HVNG1807H
VNG1802Hhsp1 noxA
0.40.7
5.1
2.50.7a
4.8a
Gro
wth
(O
D60
0)G
row
th (
OD
600)
0.40.7
5.1
2.50.7a
4.8a
Pro
babi
lity
Pro
babi
lity
0
0.4
1.0
0
0.4
1.0
Log ratio
42
0
–2
42
0
–2
Log ratio
2
4
6
8
2
4
6
8
Log 2
(in
tens
ity)
refe
renc
eLo
g 2 (
inte
nsity
)re
fere
nce
1.0
2.0
1.5
2.5
0.5
Exp
(cor
rela
tion)
Exp
(cor
rela
tion)
tbpBtfbAtfbBtfbCtfbDtfbEtfbFtfbG
trh2trh3trh4
tfbD*tfbA*tfbD**tfbF*
VNG1451C
Figure 2 A multitiered approach to characterize transcriptome structure. The transcriptome structure was determined through integration of RNA-hybridization signal (Figure 1), andanalysis of relative changes in RNA levels corresponding to each probe. In each panel, the horizontal axis indicates genomic coordinates on the main chromosome and the two sub-panelsshow strand-specific signals (denoted by a yellow arrow for the forward and an orange arrow for the reverse strand). (A) Putative protein-coding genes on the forward and reverse strandsare shown as yellow and orange rectangles, respectively, along with protein–DNA interaction sites (vertical bars, color coded per TF) determined by MeDiChI analysis of ChIP–chip data.Height of each vertical bar represents putative strength of binding event (proportional to chip signal intensity). Binding sites derived from high-resolution tiling array data are indicated by anasterisk (*) in the inset legend. (B) Mean reference-RNA hybridization signal (black dots) and associated error for each probe from 54 replicate experiments was normalized for sequence-content bias; the non-normalized data are shown with gray points (vertical axis: log2(signal intensity)). (C) Dynamic changes in the transcriptome are illustrated as a heat map along thegenome (X-axis), with time along the growth curve increasing vertically from bottom (early log phase) to top (stationary phase); the color scale represents log2 ratio of transcript-levelchanges during growth relative to the reference RNA (blue is downregulated; yellow upregulated). (D) Correlation of growth-related transcriptional-change measurements for each probewith that of its neighboring (downstream) probe shown along the genome, exponentiated in this plot to enhance the visual contrast between correlated and uncorrelated probes. Probeswith high correlation (r40.9) are highlighted in red. (E) The probability of assigning each probe to a transcribed region was calculated by integrating data from panels A to D; probes withhigh probability (P40.9) are highlighted in pink (Materials and methods). An integrated multivariate segmentation approach was used to identify and classify transcript boundaries as eitherTSSs (blue lines; dotted lines correspond to the forward strand and dashed lines to the reverse strand) or TTSs (red lines; dotted lines correspond to the forward strand, dashed lines to thereverse strand). Blue and red bootstrap density distributions indicate the relative likelihood of associating each position with a transcript boundary. This multivariate approach significantlyimproves the detection of transcript boundaries, in particular for TTSs. For example, the TTS for carB is difficult to determine from hybridization signals for reference RNA (B), but itsdifferential expression during growth enables the identification of its TTS. The gradual decay in signal at the 30 end of carA results in the assignment of multiple TTS.
Transcription promoters in archaeal coding sequencesT Koide et al
4 Molecular Systems Biology 2009 & 2009 EMBO and Macmillan Publishers Limited
array probe was complementary to a transcribed region,mapped locations of putative transcript boundaries (Figure 2E;see Materials and methods) and identified 1574 TSSs and 1952TTSs for most genes with some transcriptional variation.Subsequently, we manually assessed and curated gene assign-ment to each TSS and TTS. The error of these assignments isgiven by the resolution of probes on the tiling array (20 nt). Insum, TSSs were assigned to 64% (1156 singletons and 544genes in 203 operons) of all annotated genes and TTSs wereassigned to 1114 genes and 202 operons. A TSS and a TTStogether define a unit of transcription (Supplementary Table2). We describe below, how by correlating locations of thesetranscriptional units to predicted coding sequences in thegenome, we were able to characterize and discover newfeatures within the transcriptome structure.
a. Transcription of mono- and polycistronic mRNAs. In manyorganisms, especially prokaryotes, genes of related functionare often co-transcribed as a single polycistronic mRNA(operons). Operon predictions based on genome-specificdistance models, combined with comparative genomics andfunctional features identified 299 operons in H. salinarumNRC-1 (Price et al, 2005). According to our analysis of 1,698genes with significant transcription signal, at least 544(32%) genes were transcribed as polycistronic mRNAs in203 operons. Comparative analysis with the predictedoperon structures identified 123 new or truncated operons,which are dynamically regulated during growth.
b. Discovery of leaderless transcripts and 50 and 30 UTRs. UTRsin the proximal (50) end of transcripts often contain signals,such as the Shine–Dalgarno (SD) sequence signature forribosome loading (Sartorius-Neef and Pfeifer, 2004).Although some mRNAs spanned short distance beyond thecoding-sequence boundaries, others were significantly long-er (greater than the error in transcript-boundary assignment-20 nt), with 50 (457 transcripts, 40% of genes assigned to anexperimentally determined TSS) and/or 30 (857 transcripts,77% of the genes assigned to an experimentally determinedTTS) UTRs (Supplementary Table 2 and SupplementaryFigure 2). We validated the TSS and 50 UTR lengths bycomparing our observed UTR lengths with those experimen-tally measured in a closely related strain -H. salinarum R-1(Brenneis et al, 2007). We found that, on average, thepredicted 50-UTR lengths correlate strongly with thosedetermined by Brenneis et al (2007) (Po0.001); howeverthe predicted NRC-1 30 UTRs are usually longer (on average1.8 ±1.3 times longer than those of R-1) (SupplementaryFigure 2). Interestingly, 137 transcript pairs had overlapping30 ends (Supplementary Table 3) ranging from 25 to 788 nt inlength, with a median length of 264 nt.
c. Distance between newly mapped TSSs and GTF-binding sitesagrees with earlier knowledge of GTF binding. It is knownthat the archaeal pre-initiation complex lies between25–30 nt upstream of the TSS (Bell et al, 1999). Althoughthe relatively large uncertainty in the MeDiChI-mappedTFBSs precludes the quantification of this distance forindividual TSSs, we found that the 318 TFBS loci (definedabove) lie at an average of 24 nt (95% probability that theaverage falls between 35 and 16 nt) upstream of the nearestTSS. This may be compared with an average upstream
distance of 59 nt (95% probability that the average liesbetween 69 and 49 nt) between the TFBS loci and the first(annotated) translation codon. This difference is furtherevidence of the significant number of genes with 50 UTRs(see above).
d. Revisions of predicted translation start sites and discovery ofnew protein-coding genes. For 222 transcripts (178 genesand 31 operons), we observed that the TSS is downstream(by420 nt) of the predicted start codon (Ng et al, 2000) andthat the TSSs for 45% of these (52% of the genes and 26% ofthe operons) are corroborated by the locations of one ormore TFBSs. We investigated this further by analyzing thedistribution of peptides detected in 527 tandem massspectrometry runs from 91 proteomics experiments repre-senting 121 618 high-quality tandem mass spectra within theH. salinarum NRC-1 peptide atlas (PA) (Van et al, 2008).This study added 30 runs in four new experimentsconducted specifically to catalog the proteome underconditions in which the reference RNA was prepared.Absence of peptides from these apparently untranscribedregions led to the revision of start codons for 61 genes and 12operons. Conversely, we were also able to match previouslyunassigned tandem mass spectra to 10 new transcriptsrepresenting new protein-coding genes, and to detect longerproteins and transcripts for three genes (SupplementaryTable 4). Comparison with strain H. salinarum R-1 (Pfeifferet al, 2008) showed that most of these discrepancies withthe original genome annotation of H. salinarum NRC-1 hadbeen resolved in the newer annotation.
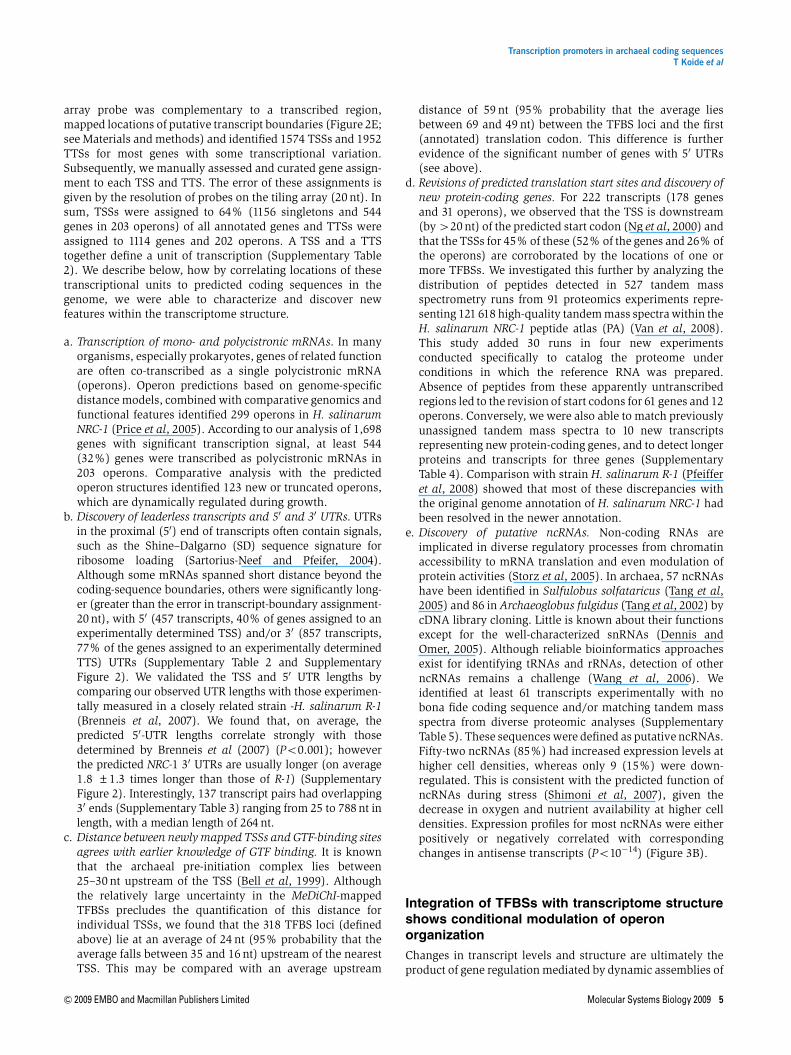
e. Discovery of putative ncRNAs. Non-coding RNAs areimplicated in diverse regulatory processes from chromatinaccessibility to mRNA translation and even modulation ofprotein activities (Storz et al, 2005). In archaea, 57 ncRNAshave been identified in Sulfulobus solfataricus (Tang et al,2005) and 86 in Archaeoglobus fulgidus (Tang et al, 2002) bycDNA library cloning. Little is known about their functionsexcept for the well-characterized snRNAs (Dennis andOmer, 2005). Although reliable bioinformatics approachesexist for identifying tRNAs and rRNAs, detection of otherncRNAs remains a challenge (Wang et al, 2006). Weidentified at least 61 transcripts experimentally with nobona fide coding sequence and/or matching tandem massspectra from diverse proteomic analyses (SupplementaryTable 5). These sequences were defined as putative ncRNAs.Fifty-two ncRNAs (85%) had increased expression levels athigher cell densities, whereas only 9 (15%) were down-regulated. This is consistent with the predicted function ofncRNAs during stress (Shimoni et al, 2007), given thedecrease in oxygen and nutrient availability at higher celldensities. Expression profiles for most ncRNAs were eitherpositively or negatively correlated with correspondingchanges in antisense transcripts (Po10�14) (Figure 3B).
Integration of TFBSs with transcriptome structureshows conditional modulation of operonorganization
Changes in transcript levels and structure are ultimately theproduct of gene regulation mediated by dynamic assemblies of
Transcription promoters in archaeal coding sequencesT Koide et al
& 2009 EMBO and Macmillan Publishers Limited Molecular Systems Biology 2009 5
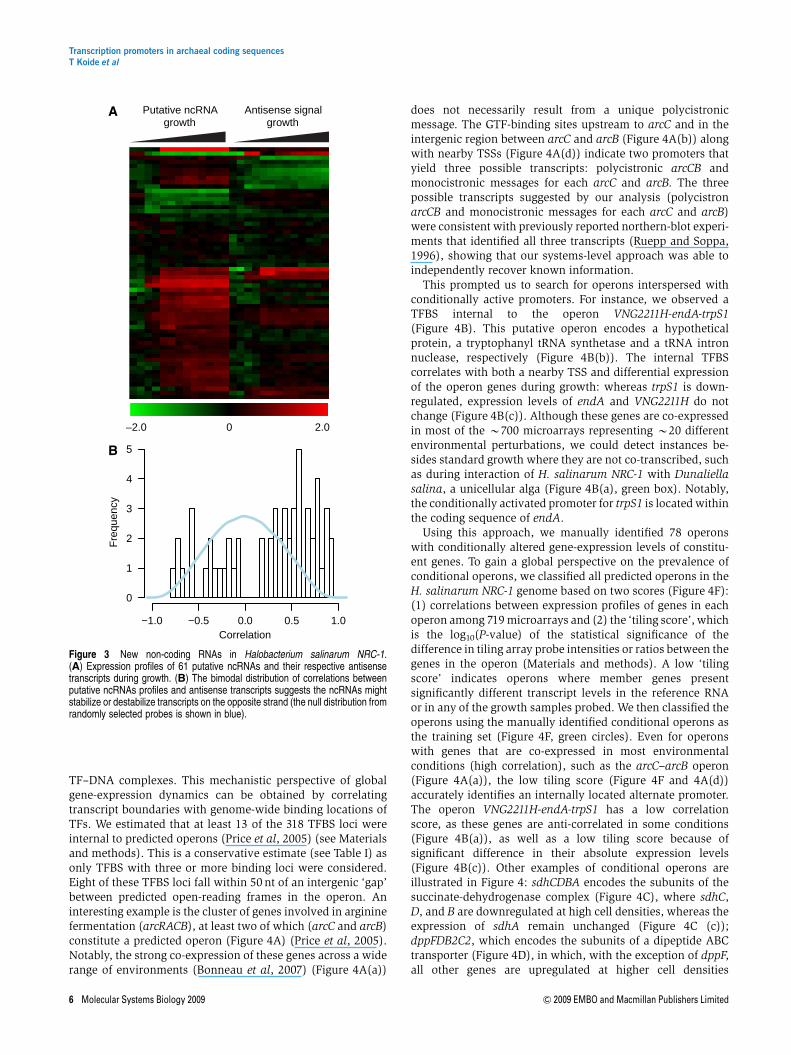
TF–DNA complexes. This mechanistic perspective of globalgene-expression dynamics can be obtained by correlatingtranscript boundaries with genome-wide binding locations ofTFs. We estimated that at least 13 of the 318 TFBS loci wereinternal to predicted operons (Price et al, 2005) (see Materialsand methods). This is a conservative estimate (see Table I) asonly TFBS with three or more binding loci were considered.Eight of these TFBS loci fall within 50 nt of an intergenic ‘gap’between predicted open-reading frames in the operon. Aninteresting example is the cluster of genes involved in argininefermentation (arcRACB), at least two of which (arcC and arcB)constitute a predicted operon (Figure 4A) (Price et al, 2005).Notably, the strong co-expression of these genes across a widerange of environments (Bonneau et al, 2007) (Figure 4A(a))
does not necessarily result from a unique polycistronicmessage. The GTF-binding sites upstream to arcC and in theintergenic region between arcC and arcB (Figure 4A(b)) alongwith nearby TSSs (Figure 4A(d)) indicate two promoters thatyield three possible transcripts: polycistronic arcCB andmonocistronic messages for each arcC and arcB. The threepossible transcripts suggested by our analysis (polycistronarcCB and monocistronic messages for each arcC and arcB)were consistent with previously reported northern-blot experi-ments that identified all three transcripts (Ruepp and Soppa,1996), showing that our systems-level approach was able toindependently recover known information.
This prompted us to search for operons interspersed withconditionally active promoters. For instance, we observed aTFBS internal to the operon VNG2211H-endA-trpS1(Figure 4B). This putative operon encodes a hypotheticalprotein, a tryptophanyl tRNA synthetase and a tRNA intronnuclease, respectively (Figure 4B(b)). The internal TFBScorrelates with both a nearby TSS and differential expressionof the operon genes during growth: whereas trpS1 is down-regulated, expression levels of endA and VNG2211H do notchange (Figure 4B(c)). Although these genes are co-expressedin most of the B700 microarrays representing B20 differentenvironmental perturbations, we could detect instances be-sides standard growth where they are not co-transcribed, suchas during interaction of H. salinarum NRC-1 with Dunaliellasalina, a unicellular alga (Figure 4B(a), green box). Notably,the conditionally activated promoter for trpS1 is located withinthe coding sequence of endA.
Using this approach, we manually identified 78 operonswith conditionally altered gene-expression levels of constitu-ent genes. To gain a global perspective on the prevalence ofconditional operons, we classified all predicted operons in theH. salinarum NRC-1 genome based on two scores (Figure 4F):(1) correlations between expression profiles of genes in eachoperon among 719 microarrays and (2) the ‘tiling score’, whichis the log10(P-value) of the statistical significance of thedifference in tiling array probe intensities or ratios between thegenes in the operon (Materials and methods). A low ‘tilingscore’ indicates operons where member genes presentsignificantly different transcript levels in the reference RNAor in any of the growth samples probed. We then classified theoperons using the manually identified conditional operons asthe training set (Figure 4F, green circles). Even for operonswith genes that are co-expressed in most environmentalconditions (high correlation), such as the arcC–arcB operon(Figure 4A(a)), the low tiling score (Figure 4F and 4A(d))accurately identifies an internally located alternate promoter.The operon VNG2211H-endA-trpS1 has a low correlationscore, as these genes are anti-correlated in some conditions(Figure 4B(a)), as well as a low tiling score because ofsignificant difference in their absolute expression levels(Figure 4B(c)). Other examples of conditional operons areillustrated in Figure 4: sdhCDBA encodes the subunits of thesuccinate-dehydrogenase complex (Figure 4C), where sdhC,D, and B are downregulated at high cell densities, whereas theexpression of sdhA remain unchanged (Figure 4C (c));dppFDB2C2, which encodes the subunits of a dipeptide ABCtransporter (Figure 4D), in which, with the exception of dppF,all other genes are upregulated at higher cell densities
growthPutative ncRNA Antisense signal
growth
−1.0 −0.5 0.0 0.5 1.0
0
1
2
3
4
5
Correlation
Fre
quen
cy
–2.0 0 2.0
Figure 3 New non-coding RNAs in Halobacterium salinarum NRC-1.(A) Expression profiles of 61 putative ncRNAs and their respective antisensetranscripts during growth. (B) The bimodal distribution of correlations betweenputative ncRNAs profiles and antisense transcripts suggests the ncRNAs mightstabilize or destabilize transcripts on the opposite strand (the null distribution fromrandomly selected probes is shown in blue).
Transcription promoters in archaeal coding sequencesT Koide et al
6 Molecular Systems Biology 2009 & 2009 EMBO and Macmillan Publishers Limited
VNG2211H - endA - trpS1 arcC–arcB
0 100 200 300 400 500 600 700
0 100 200 300 400 500 600 700
0 100 200 300 400 500 600 700
–4
024
Conditions
Log
ratio
–2
0 100 200 300 400 500 600 700–4
024
Conditions
0 100 200 300 400 500 600 700Conditions
Log
ratio
–2
–4
024
Log
ratio
–2
nhaC3 arcB arcC
2.04.06.0
Ref
eren
ce
0.40.7b4.8a
Gro
wth
244000 245000 246000 247000
−2024
Log ratio
1638000
trpS endA VNG2211H
3.0
4.5
6.0
Ref
eren
ce
0.40.7b4.8a
Gro
wth
−200
−0.5
−150
−100
−50
0
0.0 0.5 1.0
Correlation
Tili
ng s
core
arcC–arcB
endA-trpS1nirH-vng1775C-hemA
sdhCDBA
dppFDB2C1
−2024
Log ratio
purDsdhA sdhB C alkAD
0.40.7b4.8a
Gro
wth
2.04.06.0
Ref
eren
ce
976000 978000 980000
sdhCDBA
210
–1
Log ratio
Conditions
1892000 1894000 1896000 1898000 1900000dppF dppD dppB2 dppC1 VNG2532H
pyrC
0.40.7b4.8a
Gro
wth
3.0
5.0
7.0
Ref
eren
ce
210
–1
Log ratio
Log
ratio
–4
024
–2
dppFDB2C1
nirH - VNG1775C - hemA
cad
0.40.7b4.8a
3.0
5.0
7.0
10
–1
Log ratio
−0.4
0.0
0.4
Log
ratio
1313000
1637000
hemA VNG1775C nirH VNG1777H1314000 1315000 1316000 1317000
1639000 1640000 1641000
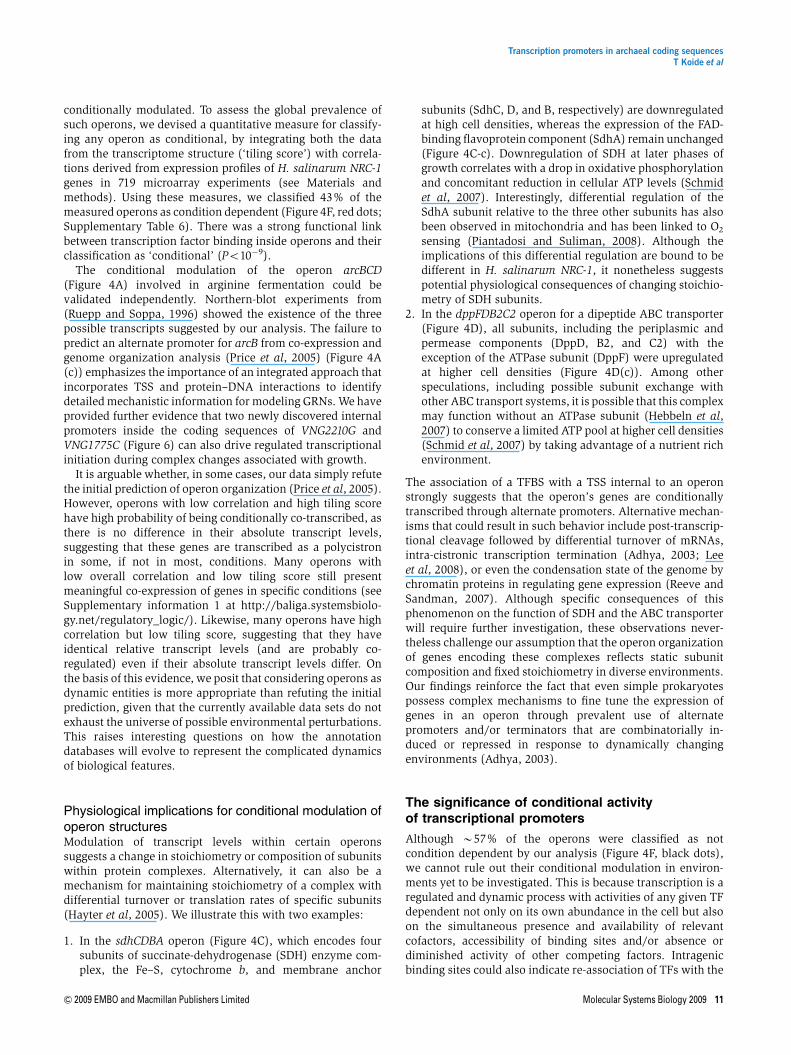
Figure 4 Conditional modulation of operon organization. Analysis of predicted operon structures identifies unexpected internal promoters that conditionally break the organizationduring cellular responses in differing environments. (A) The high degree of co-expression of arcC (red) and arcB (black) transcript-level changes in diverse environments (probed byB700 microarray experiments) (a) coupled to their genomic organization (b) strongly suggested co-transcription of these genes as an operon. Dynamic transcriptional changes ofthese genes during growth (c) also support this prediction. However, the integrated transcriptome-structure analysis identified a promoter (black arrow along genome coordinates ofplasmid pNRC200 (NC_002608) in (b) and vertical blue line spanning panels b–d) in the 56-nt intergenic region between arcB and arcC. The location of the promoter is consistentwith the different absolute levels of transcripts spanning the two genes (d) as well as with locations of TFBSs (vertical lines in the pNRC200 map in (b); for color code see Figure 2).(B) Although the predicted operon organization of VNG2211H (blue), endA (red), and trpS1 (black) is supported by their co-expression in most environments, their expression is notcorrelated during a few responses, including experiments investigating H. salinarum NRC-1 interaction with a unicellular alga (green box) (a). This differential regulation was alsoobserved during growth (c) and could be explained by an alternate promoter within the coding sequence of endA (black arrow) whose location was corroborated by co-localizedTFBSs (b) and a distinct TSS (c and d). A second weak TSS was also identified internal to endA (gray open arrow). (C) Genes in the predicted operon sdhCDBA (sdhC - blue, sdhD -green, sdhB – red, and sdhA - black) are co-expressed in most of the environmental perturbations, except for sdhA during a few responses. (b) TFBS (vertical lines, color coded asFigure 2) are found near the TSS for sdhC and in the coding region of sdhB (black arrows, blue dashed lines). (c) Dynamic changes during growth show that sdhCDB isdownregulated and sdhA does not have the expression levels altered (d) and reference-RNA hybridization shows that sdhA is expressed. (D) Operon dppFDB2C1. (a) dppF (black)and dppD (red), dppB2 (green) and dppC1 (blue) are organized in a predicted operon and are co-expressed in most of the environmental perturbations. TSS identified for dppF anddppDB2C2 (black arrows and blue dotted lines) are localized near (b) TFBS (vertical lines, color coded according to Figure 2), which could explain the (c) differential expression ofdppF and dppDB2C1 during growth. (E) Operon nirH-VNG1775C-hemA. (a) nirH (green), VNG1775C (red), and hemA (black) are organized in a predicted operon and co-expressedin most of the environmental perturbations. (b) TFBS localized internal to VNG1775C (vertical lines) are found near the TSS for hemA (black arrow), which could explain (c) thedifferential expression of this gene at higher cell densities. (F) Conditional operons were identified in a genome-wide manner by analyzing two parameters: minimum correlation scorealong all 719 environmental conditions between each gene in each predicted operon (horizontal axis) and minimum ‘tiling score’, which quantifies the difference in the tiling probelevels for genes constituting the operon (vertical axis; see Results and Discussion for details). Green circles represent operons that were manually identified as condition dependentand were used as a training set for the conditional-operon classification. Red dots represent operons that were automatically classified as condition dependent (see Materials andmethods for details). The conditional operons described above are highlighted.
Transcription promoters in archaeal coding sequencesT Koide et al
& 2009 EMBO and Macmillan Publishers Limited Molecular Systems Biology 2009 7
(Figure 4D(c)) and nirH-VNG1775C-hemA (Figure 4E), wherehemA, encoding a glutamyl-tRNA reductase is downregulatedat high cell densities.
We were able to compute tiling and correlation scores for the269 operons in H. salinarum NRC-1 with significant expressionin the tiling-array experiments, and classified 115 (B43%) ascondition dependent (Figure 4F, red dots; SupplementaryTable 6). Interestingly, conditional operons were highlyenriched for internal TFBS loci relative to their non-condi-tional-classified peers (Po10�9, Figure 4F, black dots); indeedall 13 operon-internal TFBS loci fell within conditionaloperons (Po10�30, see Table I).
Interaction of TFs within coding regionsis associated with transcript boundaries
The operons in H. salinarum NRC-1 usually have very short(B50 nt) or no intergenic regions between constituentannotated coding regions (‘gaps’). We find that although only27% of the gaps between coding regions in all 299 predictedoperons are longer than 20 nt, this fraction increases to 37% inthe conditional operons (Supplementary Figure 3). Althoughthis might partly explain some of the internal promoteractivity, the lack of a significant intergenic region (p20 nt)between at least 53 conditionally co-transcribed genepairs within operons suggest the presence of alternateinternal promoters within coding sequences, as illustratedwith operons VNG2211H-endA-trpS1, sdhCDBA, and nirH-VNG1775C-hemA. Notably, absence of a significant intergenicgap and high degree of correlation in transcription profiles forthese genes would have precluded discovery of their condi-
tional co-transcription based on generally accepted rules foroperon organization (Supplementary Figure 3E).
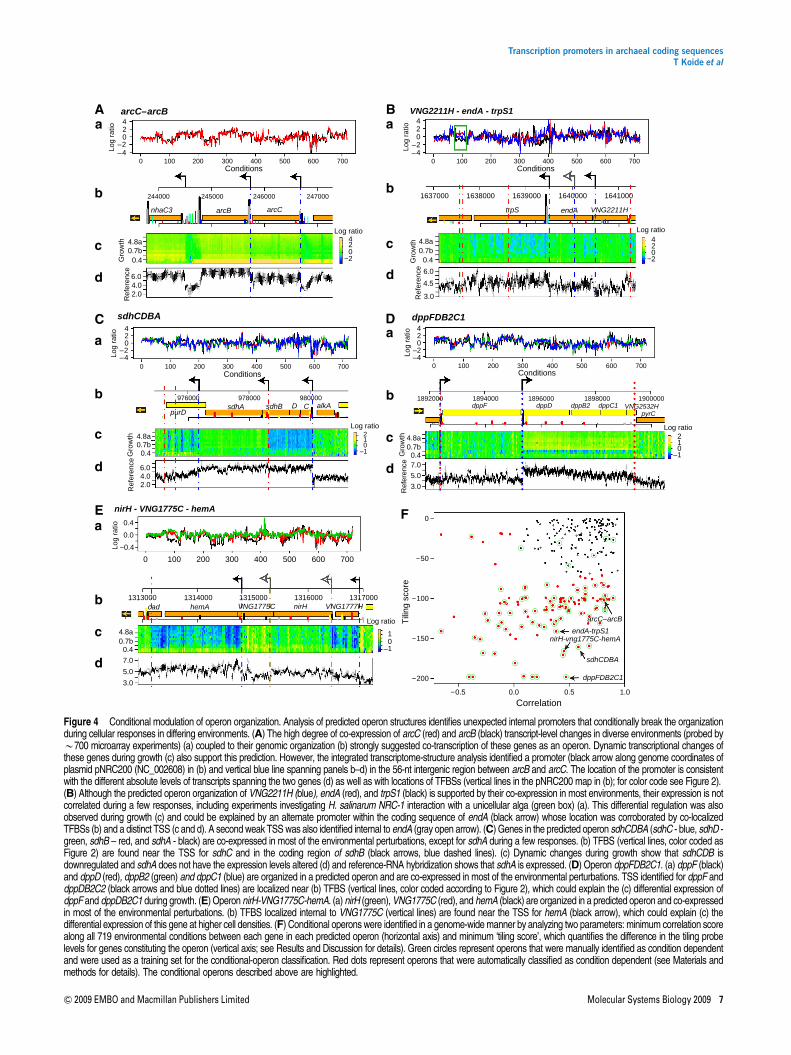
TF binding in the middle of coding sequences can also resultin transcription initiation or termination internal to a singleannotated protein-coding gene. We highlight this with anexample that focuses on gas-vesicle biogenesis—a hallmarkresponse of H. salinarum NRC-1 to low toxic conditions underhigh cell density (Yang and DasSarma, 1990). Several TFs,including TFBd, bind internally to two distinct loci withingvpE1, a transcriptional regulator of gas-vesicle biogenesis(Scheuch et al, 2008). The binding locations of one set of TFscorrelates with the termination of a transcript initiatedupstream to gvpD. Moreover, when we observe the relativetranscript levels in a strain overexpressing TFBd, it results inupregulation of a transcript downstream of its binding locationin the second locus (Figure 5d). Together these results showboth a regulated TFBd-dependent promoter and a growth-phase dependent terminator located inside the gvpE codingsequence. It is noteworthy that despite extensive prior analysisof the transcriptional regulation of gas-vesicle biogenesis, thisaspect of growth-dependent regulation was never discovered.
We note that our estimate of the prevalence of internalTFBSs as described above is conservative given the stringentnature of our automated analysis with the inclusion of onlysignificant multi-TFBS loci, as well as the limited range ofconditions under which both transcriptome and ChIP–chipdata were collected. Indeed, although 69% of the 318 TFBS locilie in intergenic regions, a fraction of the remaining 31%(B100 sites) which fall within annotated coding regions (inparticular, 42 of these, which fall 450 nt from any annotatedstart or stop site) are likely functional (Table I). After revisingthe predicted translation start sites based on the transcriptome
19 000 20 000 21 000 22 000
0.4
0
0.7a
4.8a
0
Gro
wth
Pro
babi
lity
TF
Bd
over
expr 1.0
–1.0
0.4
1.0
gvpA1gvpH1 gvpF1gvpG1 gvpE1 gvpD1
19 000 20 000 21 000 22 000
−2024
Log ratio
tbpBtfbAtfbBtfbCtfbDtfbEtfbFtfbG
trh2trh3trh4
tfbD*tfbA*tfbD**tfbF*
1451C
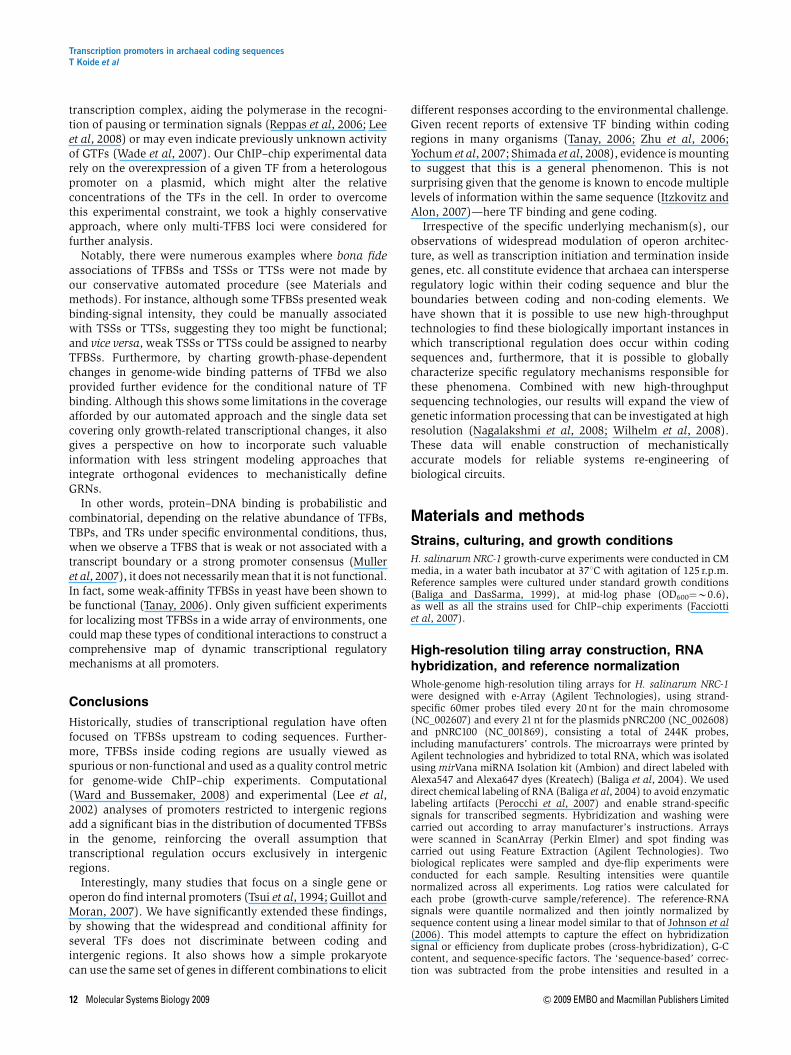
Figure 5 TF binding internal to coding regions results in transcriptome-structure changes. A putative promoter and a terminator internal to the coding sequence ofgvpE1, a gas-vesicle biogenesis regulator, is corroborated by co-localized TFBSs for several TFs, including TFBd (A). Although the activity of the terminator was verifiedby growth-phase-dependent termination of transcription originating upstream to gvpD1 (B), this region also presented high probability of being transcribed (P40.9 arehighlighted in pink) and a putative transcription start site from an internal promoter (blue line) (C); the internal promoter could be validated by analyzing the transcriptomestructure in a strain overexpressing TFBd (D). The red line indicates a break in the transcription levels of the strain overexpressing TFBd relative to the reference RNA.This evidence associated with mapped TFBd-binding site and TSS suggests the presence of an internal promoter.
Transcription promoters in archaeal coding sequencesT Koide et al
8 Molecular Systems Biology 2009 & 2009 EMBO and Macmillan Publishers Limited
structure as described previously, we observed 610 TFBSs overall 11 TFs (LFDRo0.1) that fell within coding regions (by450 nt) and 47 (7.7%) were nearby (within 100 nt) a putativeinternal transcription break point (PB0.015 relative torandomly placed internal break points), suggesting that theymight constitute functional promoters and/or terminators(Supplementary Table 7).
However, using the automated procedure, about half of alldetected TSSs for annotated genes were not associated withany detectable TFBSs and about half of all detected TFBSs werenot associated with any identifiable TSS. Although a sig-nificant fraction of transcript boundaries might also resultfrom alternate regulatory mechanisms, such as transcriptcleavage, our inability to correlate these features to TF-bindinglocations might also reflect the dynamics and complexity ofcombinatorial TF binding and TSS selection.
Discovery of conditional promoter bindingof GTFs
All ChIP–chip data described above were collected at mid tolate phase of growth in batch cultures (OD60041.0), andtherefore are not specific to the conditions over the entiregrowth curve, which were investigated in the mRNA-expres-sion experiments. We investigated the effect of this conditiondependence on the ChIP–chip data by comparing genome-wide binding locations of TFBd during three different phasesof growth (OD600¼0.3, 0.8, and 1.4). Surprisingly, even thoughTFBd was strongly overexpressed in all three ODs, only theChIP–chip data obtained at OD600¼0.8 (mid phase) showedhighly enriched over-representation of TFBSs within inter-genic regions (PB10�19 for OD600¼0.8, versus PB10�3 forOD600¼0.3 and PB10�2 for OD600¼1.4), a stringent criterionwhich we have used throughout this and other studies (e.g.Reiss et al, 2008) to enrich ChIP–chip TFBS selections for likelyfunctional binding. Moreover, the locations of the strongestTFBSs were more in agreement (within 50 nt) between theearly- and mid-phase (OD600¼0.3 and 0.8, respectively) data(PB10�3) and between the mid- and late-phase (OD600¼0.8and 1.4, respectively) (PB10�3) than between the early- andlate-phase (OD600¼0.3 and 1.4, respectively) data (PB0.35).
Validation of regulated transcriptional initiationfrom promoters in coding sequences
The proximity of chromosomal loci with multiple TFBSs andexperimentally mapped TSSs within coding regions stronglyindicates that the observed conditional modulation of operonorganization is achieved through the activation of promotersin coding sequences. However, it is imperative to rule outalternate hypotheses, such as conditional transcript cleavagefollowed by differential degradation of the mRNA fragments assuch a process could also result in truncated transcript(s) witha 50 or a 30 boundary within a coding sequence. Verifying ourprecision of mapping a transcript boundary and TFBSs withother technologies (EMSA, northern blot, 50 RACE and so on)cannot definitively refute this alternate hypothesis. Instead,the ultimate proof for functional promoters within a codingsequence is the in vivo demonstration of regulated transcrip-
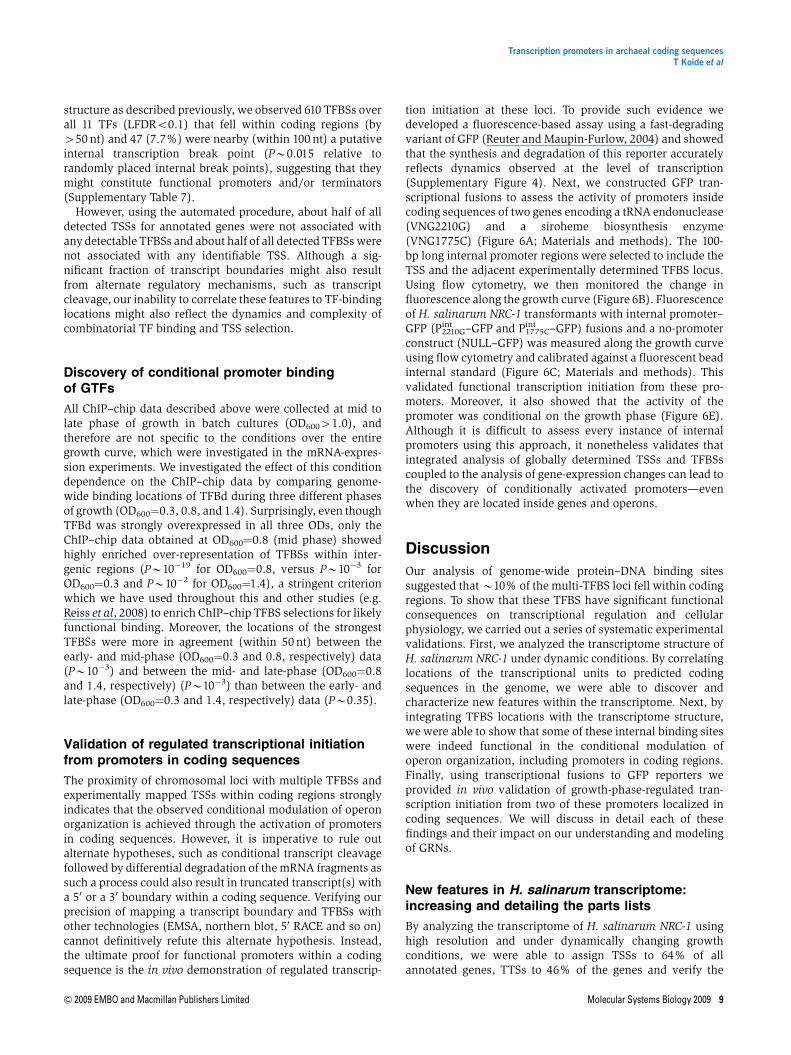
tion initiation at these loci. To provide such evidence wedeveloped a fluorescence-based assay using a fast-degradingvariant of GFP (Reuter and Maupin-Furlow, 2004) and showedthat the synthesis and degradation of this reporter accuratelyreflects dynamics observed at the level of transcription(Supplementary Figure 4). Next, we constructed GFP tran-scriptional fusions to assess the activity of promoters insidecoding sequences of two genes encoding a tRNA endonuclease(VNG2210G) and a siroheme biosynthesis enzyme(VNG1775C) (Figure 6A; Materials and methods). The 100-bp long internal promoter regions were selected to include theTSS and the adjacent experimentally determined TFBS locus.Using flow cytometry, we then monitored the change influorescence along the growth curve (Figure 6B). Fluorescenceof H. salinarum NRC-1 transformants with internal promoter–GFP (Pint
2210G–GFP and Pint1775C–GFP) fusions and a no-promoter
construct (NULL–GFP) was measured along the growth curveusing flow cytometry and calibrated against a fluorescent beadinternal standard (Figure 6C; Materials and methods). Thisvalidated functional transcription initiation from these pro-moters. Moreover, it also showed that the activity of thepromoter was conditional on the growth phase (Figure 6E).Although it is difficult to assess every instance of internalpromoters using this approach, it nonetheless validates thatintegrated analysis of globally determined TSSs and TFBSscoupled to the analysis of gene-expression changes can lead tothe discovery of conditionally activated promoters—evenwhen they are located inside genes and operons.
Discussion
Our analysis of genome-wide protein–DNA binding sitessuggested that B10% of the multi-TFBS loci fell within codingregions. To show that these TFBS have significant functionalconsequences on transcriptional regulation and cellularphysiology, we carried out a series of systematic experimentalvalidations. First, we analyzed the transcriptome structure ofH. salinarum NRC-1 under dynamic conditions. By correlatinglocations of the transcriptional units to predicted codingsequences in the genome, we were able to discover andcharacterize new features within the transcriptome. Next, byintegrating TFBS locations with the transcriptome structure,we were able to show that some of these internal binding siteswere indeed functional in the conditional modulation ofoperon organization, including promoters in coding regions.Finally, using transcriptional fusions to GFP reporters weprovided in vivo validation of growth-phase-regulated tran-scription initiation from two of these promoters localized incoding sequences. We will discuss in detail each of thesefindings and their impact on our understanding and modelingof GRNs.
New features in H. salinarum transcriptome:increasing and detailing the parts lists
By analyzing the transcriptome of H. salinarum NRC-1 usinghigh resolution and under dynamically changing growthconditions, we were able to assign TSSs to 64% of allannotated genes, TTSs to 46% of the genes and verify the
Transcription promoters in archaeal coding sequencesT Koide et al
& 2009 EMBO and Macmillan Publishers Limited Molecular Systems Biology 2009 9
expression of 203 operons. Notably, the average distance ofB24 nt between these TSSs and experimentally mappedlocations of TFBSs for one or more of 11 TFs is consistentwith earlier knowledge of the relative position of thepre-initiation complex from the TSS. One important outcomeof mapping TSSs and TTSs was the discovery of 50and 30 UTRsfor genes and operons. The observed absence of a 50 UTR inmost of the genes with an identified TSS suggests eitherinternal SD translation signals or more likely, an alternate(eukaryotic-like) mechanism of translation initiation. Incontrast, most transcripts with an experimentally detectedTTS had a 30 UTR, which was on average longer than thosedetermined by Brenneis et al (2007). This difference can beexplained by the smooth decay observed in the signal at the 30
end of the transcripts (Figures 1A and 2), which suggests thatfor a given gene, there are mRNA populations with the same 50
end but different 30-end locations. The shorter messages areusually more abundant and have higher probability of beingselected for 30-end determination by sequencing approaches(Brenneis et al, 2007). We hypothesize that this smooth signaldecay at the 30 termini of most transcripts is a product ofimprecise termination, degradation, and/or paused or incom-plete elongation complexes. Overall,B5% of the H. salinarumNRC-1 genome seems to be transcribed simultaneously in bothstrands. We also observed an overlap of 30 ends of 137transcript pairs, a phenomenon that has also been observed inyeast at a similar scale (Nagalakshmi et al, 2008), but thefunctional implication of this overlap remains to be investigated.
By correlating the transcriptional units contained withinpairs of TSS and TTS with chromosomal coordinates ofpredicted genes (Ng et al, 2000) and experimentally mappedpeptides from large-scale proteomics studies (Van et al, 2008),we were able to revise the translation start site for 61 genes anddetect 10 new protein-coding genes (Supplementary Table 4).This highlights the importance of constant genome re-annotation on the basis of evidence presented by new high-throughput experimental data. Another important feature wasthe identification of 61 new putative ncRNAs in H. salinarumgenome. Although the physiological roles and mechanism ofaction of specific ncRNAs remain to be uncovered, thesignificant correlation (positive or negative) between theprofiles of the ncRNAs and the antisense strand (Figure 3)are consistent with the characterized roles of ncRNAs in theregulation of their cognate antisense transcripts. The discoveryof these ncRNAs represents new information in the parts listsof regulatory elements encoded by the H. salinarum NRC-1genome.
Mapping of all these new features of the H. salinarum NRC-1transcriptome is expected to pave the way toward a detailedfunctional and mechanistic analysis of GRNs, thereby improv-ing global models of cellular behavior.
Dynamics of operon organization
By observing the dynamics of the transcriptome structure, wenoted that the organization of some operons seemed to be
Forward scatter
Flu
ores
cenc
e
NULL−GFPP 1775C int −GFPP 2210G
int −GFP
−2 0 2 4 6 8 10 12 14100
101
102
102 102 102
101
Normalized time
Rel
ativ
e ce
ll de
nsity
P 2210G int −GFP
P 1775C int −GFP
NULL−GFPMid log
Late log
Stationary
Mid log Late log Stationary0
0.05
0.1
0.15
0.2
0.25
P 2210G int −GFP
P 1775C int −GFP
NULL−GFP
Nor
mal
ized
fluo
resc
ence
Mid log Late log Stationary−1
−0.5
0
0.5
Log 10
rat
io
P 2210G int : TSS+100 bp
P 1775C int : TSS+100 bp
GFP
Gene
Annotedstart
Candidate internalpromoter
150–500nt
Genome
MevR plasmid
Pint2210
Pint1775
0
500+
125
375
250
1 639 000 1 640 000
1 315 000
endA
VNG1775C
S
Figure 6 GFP expression validates promoters localized in the coding regions. (A) Internal promoter–GFP fusion construction strategy. The 150–500 nt regionsupstream of internal transcription start sites (within tiling probe error) were fused to a GFP coding sequence on a mevinolin resistance (MevR) selectable expressionplasmid. Selected internal promoters located within coding sequences of VNG2210G and VNG1775C used for GFP-expression validation are shown. (B) Samplingpoints along transformants growth curves. Batch cultures of strains carrying these internal promoter–GFP transcriptional fusions were sampled at mid-log, late-log, andstationary phase. For purpose of comparison, the growth curves were normalized in time relative to the characteristic growth rate observed during exponential growth.(C) The 2D densitometric scattergram of fluorescence versus forward scatter for cells with active internal promoters. Population density increases from blue to red.(D) Growth-phase-dependent transcriptional activity of the internal promoters was measured as the mean signal intensity for probes covering a region of 100 ntdownstream of the internal TSS. (E) GFP production was used as proxy to validate that the growth-phase-dependent change in transcription observed in panel D wasdue to regulated transcription initiation by the internal promoters. The plots indicate normalized mean population fluorescence values during various growth phases(calculated from distributions shown in panel C for samples noted in panel B).
Transcription promoters in archaeal coding sequencesT Koide et al
10 Molecular Systems Biology 2009 & 2009 EMBO and Macmillan Publishers Limited
conditionally modulated. To assess the global prevalence ofsuch operons, we devised a quantitative measure for classify-ing any operon as conditional, by integrating both the datafrom the transcriptome structure (‘tiling score’) with correla-tions derived from expression profiles of H. salinarum NRC-1genes in 719 microarray experiments (see Materials andmethods). Using these measures, we classified 43% of themeasured operons as condition dependent (Figure 4F, red dots;Supplementary Table 6). There was a strong functional linkbetween transcription factor binding inside operons and theirclassification as ‘conditional’ (Po10�9).
The conditional modulation of the operon arcBCD(Figure 4A) involved in arginine fermentation could bevalidated independently. Northern-blot experiments from(Ruepp and Soppa, 1996) showed the existence of the threepossible transcripts suggested by our analysis. The failure topredict an alternate promoter for arcB from co-expression andgenome organization analysis (Price et al, 2005) (Figure 4A(c)) emphasizes the importance of an integrated approach thatincorporates TSS and protein–DNA interactions to identifydetailed mechanistic information for modeling GRNs. We haveprovided further evidence that two newly discovered internalpromoters inside the coding sequences of VNG2210G andVNG1775C (Figure 6) can also drive regulated transcriptionalinitiation during complex changes associated with growth.
It is arguable whether, in some cases, our data simply refutethe initial prediction of operon organization (Price et al, 2005).However, operons with low correlation and high tiling scorehave high probability of being conditionally co-transcribed, asthere is no difference in their absolute transcript levels,suggesting that these genes are transcribed as a polycistronin some, if not in most, conditions. Many operons withlow overall correlation and low tiling score still presentmeaningful co-expression of genes in specific conditions (seeSupplementary information 1 at http://baliga.systemsbiolo-gy.net/regulatory_logic/). Likewise, many operons have highcorrelation but low tiling score, suggesting that they haveidentical relative transcript levels (and are probably co-regulated) even if their absolute transcript levels differ. Onthe basis of this evidence, we posit that considering operons asdynamic entities is more appropriate than refuting the initialprediction, given that the currently available data sets do notexhaust the universe of possible environmental perturbations.This raises interesting questions on how the annotationdatabases will evolve to represent the complicated dynamicsof biological features.
Physiological implications for conditional modulation ofoperon structuresModulation of transcript levels within certain operonssuggests a change in stoichiometry or composition of subunitswithin protein complexes. Alternatively, it can also be amechanism for maintaining stoichiometry of a complex withdifferential turnover or translation rates of specific subunits(Hayter et al, 2005). We illustrate this with two examples:
1. In the sdhCDBA operon (Figure 4C), which encodes foursubunits of succinate-dehydrogenase (SDH) enzyme com-plex, the Fe–S, cytochrome b, and membrane anchor
subunits (SdhC, D, and B, respectively) are downregulatedat high cell densities, whereas the expression of the FAD-binding flavoprotein component (SdhA) remain unchanged(Figure 4C-c). Downregulation of SDH at later phases ofgrowth correlates with a drop in oxidative phosphorylationand concomitant reduction in cellular ATP levels (Schmidet al, 2007). Interestingly, differential regulation of theSdhA subunit relative to the three other subunits has alsobeen observed in mitochondria and has been linked to O2
sensing (Piantadosi and Suliman, 2008). Although theimplications of this differential regulation are bound to bedifferent in H. salinarum NRC-1, it nonetheless suggestspotential physiological consequences of changing stoichio-metry of SDH subunits.
2. In the dppFDB2C2 operon for a dipeptide ABC transporter(Figure 4D), all subunits, including the periplasmic andpermease components (DppD, B2, and C2) with theexception of the ATPase subunit (DppF) were upregulatedat higher cell densities (Figure 4D(c)). Among otherspeculations, including possible subunit exchange withother ABC transport systems, it is possible that this complexmay function without an ATPase subunit (Hebbeln et al,2007) to conserve a limited ATP pool at higher cell densities(Schmid et al, 2007) by taking advantage of a nutrient richenvironment.
The association of a TFBS with a TSS internal to an operonstrongly suggests that the operon’s genes are conditionallytranscribed through alternate promoters. Alternative mechan-isms that could result in such behavior include post-transcrip-tional cleavage followed by differential turnover of mRNAs,intra-cistronic transcription termination (Adhya, 2003; Leeet al, 2008), or even the condensation state of the genome bychromatin proteins in regulating gene expression (Reeve andSandman, 2007). Although specific consequences of thisphenomenon on the function of SDH and the ABC transporterwill require further investigation, these observations never-theless challenge our assumption that the operon organizationof genes encoding these complexes reflects static subunitcomposition and fixed stoichiometry in diverse environments.Our findings reinforce the fact that even simple prokaryotespossess complex mechanisms to fine tune the expression ofgenes in an operon through prevalent use of alternatepromoters and/or terminators that are combinatorially in-duced or repressed in response to dynamically changingenvironments (Adhya, 2003).
The significance of conditional activityof transcriptional promoters
Although B57% of the operons were classified as notcondition dependent by our analysis (Figure 4F, black dots),we cannot rule out their conditional modulation in environ-ments yet to be investigated. This is because transcription is aregulated and dynamic process with activities of any given TFdependent not only on its own abundance in the cell but alsoon the simultaneous presence and availability of relevantcofactors, accessibility of binding sites and/or absence ordiminished activity of other competing factors. Intragenicbinding sites could also indicate re-association of TFs with the
Transcription promoters in archaeal coding sequencesT Koide et al
& 2009 EMBO and Macmillan Publishers Limited Molecular Systems Biology 2009 11
transcription complex, aiding the polymerase in the recogni-tion of pausing or termination signals (Reppas et al, 2006; Leeet al, 2008) or may even indicate previously unknown activityof GTFs (Wade et al, 2007). Our ChIP–chip experimental datarely on the overexpression of a given TF from a heterologouspromoter on a plasmid, which might alter the relativeconcentrations of the TFs in the cell. In order to overcomethis experimental constraint, we took a highly conservativeapproach, where only multi-TFBS loci were considered forfurther analysis.
Notably, there were numerous examples where bona fideassociations of TFBSs and TSSs or TTSs were not made byour conservative automated procedure (see Materials andmethods). For instance, although some TFBSs presented weakbinding-signal intensity, they could be manually associatedwith TSSs or TTSs, suggesting they too might be functional;and vice versa, weak TSSs or TTSs could be assigned to nearbyTFBSs. Furthermore, by charting growth-phase-dependentchanges in genome-wide binding patterns of TFBd we alsoprovided further evidence for the conditional nature of TFbinding. Although this shows some limitations in the coverageafforded by our automated approach and the single data setcovering only growth-related transcriptional changes, it alsogives a perspective on how to incorporate such valuableinformation with less stringent modeling approaches thatintegrate orthogonal evidences to mechanistically defineGRNs.
In other words, protein–DNA binding is probabilistic andcombinatorial, depending on the relative abundance of TFBs,TBPs, and TRs under specific environmental conditions, thus,when we observe a TFBS that is weak or not associated with atranscript boundary or a strong promoter consensus (Mulleret al, 2007), it does not necessarily mean that it is not functional.In fact, some weak-affinity TFBSs in yeast have been shown tobe functional (Tanay, 2006). Only given sufficient experimentsfor localizing most TFBSs in a wide array of environments, onecould map these types of conditional interactions to construct acomprehensive map of dynamic transcriptional regulatorymechanisms at all promoters.
Conclusions
Historically, studies of transcriptional regulation have oftenfocused on TFBSs upstream to coding sequences. Further-more, TFBSs inside coding regions are usually viewed asspurious or non-functional and used as a quality control metricfor genome-wide ChIP–chip experiments. Computational(Ward and Bussemaker, 2008) and experimental (Lee et al,2002) analyses of promoters restricted to intergenic regionsadd a significant bias in the distribution of documented TFBSsin the genome, reinforcing the overall assumption thattranscriptional regulation occurs exclusively in intergenicregions.
Interestingly, many studies that focus on a single gene oroperon do find internal promoters (Tsui et al, 1994; Guillot andMoran, 2007). We have significantly extended these findings,by showing that the widespread and conditional affinity forseveral TFs does not discriminate between coding andintergenic regions. It also shows how a simple prokaryotecan use the same set of genes in different combinations to elicit
different responses according to the environmental challenge.Given recent reports of extensive TF binding within codingregions in many organisms (Tanay, 2006; Zhu et al, 2006;Yochum et al, 2007; Shimada et al, 2008), evidence is mountingto suggest that this is a general phenomenon. This is notsurprising given that the genome is known to encode multiplelevels of information within the same sequence (Itzkovitz andAlon, 2007)—here TF binding and gene coding.
Irrespective of the specific underlying mechanism(s), ourobservations of widespread modulation of operon architec-ture, as well as transcription initiation and termination insidegenes, etc. all constitute evidence that archaea can intersperseregulatory logic within their coding sequence and blur theboundaries between coding and non-coding elements. Wehave shown that it is possible to use new high-throughputtechnologies to find these biologically important instances inwhich transcriptional regulation does occur within codingsequences and, furthermore, that it is possible to globallycharacterize specific regulatory mechanisms responsible forthese phenomena. Combined with new high-throughputsequencing technologies, our results will expand the view ofgenetic information processing that can be investigated at highresolution (Nagalakshmi et al, 2008; Wilhelm et al, 2008).These data will enable construction of mechanisticallyaccurate models for reliable systems re-engineering ofbiological circuits.
Materials and methods
Strains, culturing, and growth conditions
H. salinarum NRC-1 growth-curve experiments were conducted in CMmedia, in a water bath incubator at 371C with agitation of 125 r.p.m.Reference samples were cultured under standard growth conditions(Baliga and DasSarma, 1999), at mid-log phase (OD600¼B0.6),as well as all the strains used for ChIP–chip experiments (Facciottiet al, 2007).
High-resolution tiling array construction, RNAhybridization, and reference normalization
Whole-genome high-resolution tiling arrays for H. salinarum NRC-1were designed with e-Array (Agilent Technologies), using strand-specific 60mer probes tiled every 20 nt for the main chromosome(NC_002607) and every 21 nt for the plasmids pNRC200 (NC_002608)and pNRC100 (NC_001869), consisting a total of 244K probes,including manufacturers’ controls. The microarrays were printed byAgilent technologies and hybridized to total RNA, which was isolatedusing mirVana miRNA Isolation kit (Ambion) and direct labeled withAlexa547 and Alexa647 dyes (Kreatech) (Baliga et al, 2004). We useddirect chemical labeling of RNA (Baliga et al, 2004) to avoid enzymaticlabeling artifacts (Perocchi et al, 2007) and enable strand-specificsignals for transcribed segments. Hybridization and washing werecarried out according to array manufacturer’s instructions. Arrayswere scanned in ScanArray (Perkin Elmer) and spot finding wascarried out using Feature Extraction (Agilent Technologies). Twobiological replicates were sampled and dye-flip experiments wereconducted for each sample. Resulting intensities were quantilenormalized across all experiments. Log ratios were calculated foreach probe (growth-curve sample/reference). The reference-RNAsignals were quantile normalized and then jointly normalized bysequence content using a linear model similar to that of Johnson et al(2006). This model attempts to capture the effect on hybridizationsignal or efficiency from duplicate probes (cross-hybridization), G-Ccontent, and sequence-specific factors. The ‘sequence-based’ correc-tion was subtracted from the probe intensities and resulted in a
Transcription promoters in archaeal coding sequencesT Koide et al
12 Molecular Systems Biology 2009 & 2009 EMBO and Macmillan Publishers Limited
reduction byB10% in residual sum-of-squares between the intensitiesof neighboring probes. Interactive visualization of the data was carriedout in the Gaggle Genome Browser (Bare et al., in preparation),available at http://baliga.systemsbiology.net/regulatory_logic/.
ChIP–chip experiments and analysis
ChIP–chip experiments were carried out for all TFBs (TFBa, TFBb,TFBc, TFBd, TFBe, TFBf, and TFBg), one TBP (TBPb) and three TRs(Trh3, Trh4, and VNG1451C) in H. salinarum NRC-1 using theHaloSpan array (Facciotti et al, 2007), which consists of 500 nt PCRproducts of successive regions of H. salinarum NRC-1 genome. Thedata for all TFBs were retrieved from Facciotti et al (2007). For TFBa,TFBd, and TFBf, data for additional biological replicates were alsoacquired using 13-nt resolution tiling arrays on the Nimblegenplatform (for TFBd, two such distinct biological replicates wereacquired). The TRs encoding genes were cloned in pMTFcmyc vector;chromatin immunoprecipitation and identification were carried out asdescribed by Facciotti et al (2007). Binding locations were defined byapplying the MeDiChI algorithm (Reiss et al, 2008) to each data set.This regression-based method deconvolves the ChIP–chip enrichmentratios along the genome by fitting them with a ‘peak profile’ model ofbinding events, assuming a distribution in enriched DNA fragmentlengths. It was shown that MeDiChI can increase the effectiveresolution of TFBS locations by a factor of five relative to the probespacing of the tiling array, even for overlapping peaks (Reiss et al,2008). P-values reported by MeDiChI (based upon peaks detected inbootstrap-resampled data that statistically seem to contain only noise;see (Reiss et al, 2008)) for each data set were converted to LFDRestimates through a semi-parametric two-component mixture model(Robin et al, 2007). A comparison of the peak intensities derived fromMeDiChI for all three TFs (TFBd, TFBf, and TFBa) for which there werebiological replicate measurements using both microarray platforms(500 nt resolution spotted arrays versus 13 nt resolution Nimblegenarrays) (Supplementary Figure 5) provided strong validation (with R2
of 0.66, 0.52, and 0.81, respectively) of most (B500) TFBSs included inthe analysis, and even for TFBSs with LFDR 40.1. The 318 multi-TFBSloci described in Results and Discussion were computed by locatingpeaks in a kernel density estimate (bandwidth¼50 nt) of all TFBSs withLFDRo0.1 across the genome. Only density peaks generated by 42individual TFBSs were counted. Monte Carlo simulations were used toestimate the expected fraction of TFBSs, which would be detected inintergenic regions, as a function of detection positional uncertainty s,and FDR f, given that the true TFBS locations fall only in intergenicregions across the genome. In these simulations, n TFBSs weresimulated by placing n (1–f) TFBSs in intergenic regions and n f inannotated coding regions, and Gaussian-distributed random offsets(±s in nucleotides) were added to each simulated TFBS location. Weused n¼20 000 for our simulations. A binding event was consideredinternal to a transcribed or annotated coding region only if it wasinternally localized at a distance of450 nt from the respective region’sboundaries.
The microarray data reported in this paper have been deposited inthe National Center for Biotechnology Information Gene ExpressionOmnibus (GEO) database (GEO accession no. GSE13150).
Identification of probes hybridizing withtranscribed regions of the genome
Probes in the tiling arrays were assessed as to whether they werecomplementary to a region that is transcribed in one or more of theobserved conditions. We integrated the following probe measure-ments: (a) their log intensities in the 54 reference-RNA tiling arrays,(b) their relative changes across the growth curve in the 12 growth-curve tiling arrays, and (c) their Pearson correlations with the changesof their two neighboring probes across the growth curve (McGrathet al, 2007) into an iteratively reweighted logistic regression model thatused annotated coding regions as the ‘training’ set. The resultingmodel was used to estimate a probability that each probe wascomplementary to a transcribed region.
Integrated, multivariate segmentation definestranscript boundaries
Regression trees (CART; Breiman et al (1984)) were used to partitionthe tiling array data (log probe intensity values) into regions ofconstant intensity, separated by abrupt ‘break points’, by fitting aconstant value to a large, contiguous region, and recursively dividingthe regions to significantly improve the residual sum-of-squares. Thenumber of splits (and hence the complexity of the model) wasdetermined using 100-fold cross-validation, to choose the mostparsimonious model within 1s from the optimal one. The relativelikelihood of each break was estimated using 100 bootstraps withsymmetric wild resampling (as in Reiss et al (2008)). Each segmentwas constrained to contain no fewer than five probes, restricting theprocedure to detect only larger (X100 nt) segments (putativetranscripts). Using the multivariate implementation of this procedurein the mvpart R library, we could apply the procedure simultaneouslyto all tiling arrays described above, enabling us to constrain thesegments in an integrated manner using the reference-RNA andgrowth-curve tiling arrays, as well as the growth-curve correlationsand the probe transcription probabilities. The maximum resolution ofthe derived transcription break points is no better than the tiling arrayresolution (here, 20 nt). The resulting breaks were subsequentlyclassified into transcription ‘starts’ and ‘stops’ based upon whether thesignal increased or decreased across the break in both the RNAreferences and the probe transcription probabilities.
Detection of putative non-coding RNAs
The procedure described above for segmenting the data andidentifying transcriptional start/stop sites was constrained to omitsmaller (p100 nt) transcripts. To identify putative non-coding RNAs(ncRNAs), including smaller ncRNA candidates, we individuallypartitioned each growth-curve sample data set (log ratios of thegrowth-curve samples relative to the reference RNA) using recursivepartitioning trees as previously described. For each sample, P-valuesfor each segment were computed relative to the log ratios of reference-RNA samples localized in the segment’s coordinates. A segment wasclassified as a putative non-coding RNA if it presented a highprobability of being expressed (P-valueo0.05), its neighboringsegments were not differentially expressed (P-value 40.05, in orderto filter out possible UTR regions of genes), and no annotated gene orrepeat overlapped the segment’s coordinates. Further filtering wascarried out through the model used to estimate a probability that eachprobe was complementary to a transcribed region (see section‘Identification of probes hybridizing with transcribed regions of thegenome’), and segments with P40.05 were discarded. Many ncRNAswere complementary to repeat regions of the genome, so all duplicatencRNA candidates were removed if they contained a 12-nt contiguoussequence similarity with any other ncRNA candidate.
Peptide atlas update
H. salinarum NRC-1 Peptide Atlas was updated with the addition ofthree new experiments corresponding to cultures grown understandard conditions. Sample preparation and mass spectrometryanalyses were carried out as described by Van et al (2008), resultingin an additional 30 mass spectrometry runs and 33 986 tandem massspectra. A new search database was constructed, including sequencesfrom newly identified transcribed regions in the tiling array experi-ments. The updated version of H. salinarum NRC-1 peptide atlas isavailable at https://db.systemsbiology.net/sbeams/cgi/PeptideAtlas/buildDetails?atlas_build_id¼130, including a total of 527 massspectrometry runs and 121 618 tandem mass spectra.
Identification of conditional operons
For each of the predicted operons obtained from Price et al (2005),three different statistics were computed in a pairwise manner over allgenes in that operon: (1) the log10(P-value) for the two-sampleStudent’s t-test of the mean levels of the probes complementary to each
Transcription promoters in archaeal coding sequencesT Koide et al
& 2009 EMBO and Macmillan Publishers Limited Molecular Systems Biology 2009 13
pair of genes; (2) the Spearman rank correlation of the gene-expressionprofiles across 719 microarray experiments covering several diverseenvironmental perturbations (oxygen (Schmid et al, 2007), transitionmetals—Mn, Fe, Co, Ni, Cu, and Zn (Kaur et al, 2006), UV (Baliga et al,2004) and gamma (Whitehead et al, 2006) radiation, interaction withDunaliella salina, growth curve in CM media and in defined media,light–dark cycle, and oxidative stress—H2O2 and paraquat (unpub-lished; see http://gaggle.systemsbiology.net/projects/halo/2007-04),and (3) the Spearman rank correlation of the genes’ tiling array probesover the growth curve. Thus, conditional operons (as opposed toclassical operons) were identified on the basis of (1) the similarity inexpression levels of the probes for each gene in the operon in the tilingarray data, and (2) co-expression of the operon’s genes across 719microarrays. To obtain a probability that each operon is conditional,we computed the minimum values of each of these statistics for eachoperon (resulting in three ‘scores’ per operon), and applied a quadraticdiscriminant classifier to these scores, using a set of 73 manuallyidentified conditional operons as the training set. A probability cutoffof P¼0.64 was chosen to minimize the false classification rate for themanually classified training set. This protocol resulted in a total of 123classified conditional operons. Finally, the cumulative hypergeometricdistribution was used to assess the P-value for the over-representationof TFBSs internal to the 123 conditional operons (from the ChIP–chipdata for all GTRs and TFs described above) versus the number ofTFBSs internal to the 176 non-conditional (classical) operons.
Construction of promoter–GFP fusions andevaluation of promoter activity
A 150–500 bp region surrounding the TSS localized in codingsequences of VNG2210G and VNG1775C was PCR amplified (primersVNG2210G-F: 50-CGAAAACCGGATTCAAGTTC-30, VNG2210G-R:50- ATCGTGTCGTCTGTGTCGTC-30, resulting in a 208-bp PCR productcorresponding to region 1 639 638–1 639 431 in H. salinarum mainchromosome and VNG1775C-F: 50-CTTCGGTCGACAGGGTTATC-30
and VNG1775C-R: 50-TGTCGACCAATCTACGTCGC-30, resulting in a162-bp PCR product corresponding to region 1 314 877–1 314 716 inH. salinarum main chromosome) and fused to a GFP coding sequenceon a MevR selectable expression plasmid. H. salinarum NRC-1 cellswere transformed and selected on CM agar containing 20mg/mlmevinolin. Cells were sampled at mid-log, late-log, and stationaryphases. On sampling, the cells were simultaneously washed, diluted toa nominal density of OD600 0.2, and fixed in a basal salt solution with0.25% (w/v) formaldehyde. Cells were incubated in the fixative for10 min at 41C, followed by a second wash in basal salt solution. Thefixative concentration was previously determined to adequately arrestcell function while also preserving GFP fluorescence and the combinedwash steps served to remove as much of the peptone-based growthmedium as possible to reduce fluorescence background. The dynamicrange of the flow cytometer (InFlux, Cytopia/BD) was calibrated usingfixed, non-fluorescent H. salinarum NRC-1 cells and 1-mm Y/Gfluorescent beads (Polysciences, Inc). Before running on the flowcytometer, 1-mm beads were spiked into each sample to a final densityof 1�107 beads/ml (approximately ten-fold less than the nominal celldensity) to serve as an internal calibration standard. The meanfluorescence from 100 000 cells in each sample was normalizedrelative to the bead fluorescence level.
Supplementary information
Supplementary information is available at the Molecular SystemsBiology website (www.nature.com/msb).
AcknowledgementsThanks to Kenia Whitehead and Sacha Coesel for helpful discussions,Dan Tenenbaum for the construction of the webpage and KenichiMasumura for help in the growth-curve experiments. This work wassupported by grants from NIH (P50GM076547 and 1R01GM077398-01A2), DoE (MAGGIE: DE-FG02-07ER64327 and DE-FG02-
07ER64327), NSF (EF-0313754, EIA-0220153, MCB-0425825, DBI-0640950) and NASA (NNG05GN58G) to NSB.
Conflict of interest
The authors declare that they have no conflict of interest.
References
Adhya S (2003) Suboperonic regulatory signals. Sci STKE 2003: pe22Baliga NS, Bjork SJ, Bonneau R, Pan M, Iloanusi C, Kottemann MC,
Hood L, DiRuggiero J (2004) Systems level insights into the stressresponse to UV radiation in the halophilic archaeon HalobacteriumNRC-1. Genome Res 14: 1025–1035
Baliga NS, DasSarma S (1999) Saturation mutagenesis of the TATA boxand upstream activator sequence in the haloarchaeal bop genepromoter. J Bacteriol 181: 2513–2518
Baliga NS, Goo YA, Ng WV, Hood L, Daniels CJ, DasSarma S(2000) Is gene expression in Halobacterium NRC-1 regulated bymultiple TBP and TFB transcription factors? Mol Microbiol 36:1184–1185
Bell SD, Kosa PL, Sigler PB, Jackson SP (1999) Orientation of thetranscription preinitiation complex in archaea. Proc Natl Acad SciUSA 96: 13662–13667
Bonneau R, Facciotti MT, Reiss DJ, Schmid AK, Pan M, Kaur A,Thorsson V, Shannon P, Johnson MH, Bare JC, Longabaugh W,Vuthoori M, Whitehead K, Madar A, Suzuki L, Mori T, Chang DE,Diruggiero J, Johnson CH, Hood L et al (2007) A predictive modelfor transcriptional control of physiology in a free living cell. Cell131: 1354–1365
Bonneau R, Reiss DJ, Shannon P, Facciotti M, Hood L, Baliga NS,Thorsson V (2006) The Inferelator: an algorithm for learningparsimonious regulatory networks from systems-biology data setsde novo. Genome Biol 7: R36
Breiman L, Friedman JH, Olshen RA, Stone CJ (1984) Classificationand Regression Trees. Pacific Grove, CA: Wadsworth & Brooks/ColeAdvanced Books & Software
Brenneis M, Hering O, Lange C, Soppa J (2007) Experimentalcharacterization of Cis-acting elements important fortranslation and transcription in halophilic archaea. PLoS Genet 3:e229
David L, Huber W, Granovskaia M, Toedling J, Palm CJ, Bofkin L, JonesT, Davis RW, Steinmetz LM (2006) A high-resolution map oftranscription in the yeast genome. Proc Natl Acad Sci USA 103:5320–5325
Dennis PP, Omer A (2005) Small non-coding RNAs in Archaea. CurrOpin Microbiol 8: 685–694
Facciotti MT, Reiss DJ, Pan M, Kaur A, Vuthoori M, Bonneau R,Shannon P, Srivastava A, Donohoe SM, Hood LE, Baliga NS (2007)General transcription factor specified global gene regulation inarchaea. Proc Natl Acad Sci USA 104: 4630–4635
Faith JJ, Hayete B, Thaden JT, Mogno I, Wierzbowski J, Cottarel G,Kasif S, Collins JJ, Gardner TS (2007) Large-scale mapping andvalidation of Escherichia coli transcriptional regulation from acompendium of expression profiles. PLoS Biol 5: e8
Guillot C, Moran Jr CP (2007) Essential internal promoter in thespoIIIA locus of Bacillus subtilis. J Bacteriol 189: 7181–7189
Hayter JR, Doherty MK, Whitehead C, McCormack H, Gaskell SJ,Beynon RJ (2005) The subunit structure and dynamics of the 20Sproteasome in chicken skeletal muscle. Mol Cell Proteomics 4:1370–1381
Hebbeln P, Rodionov DA, Alfandega A, Eitinger T (2007) Biotinuptake in prokaryotes by solute transporters with an optional ATP-binding cassette-containing module. Proc Natl Acad Sci USA 104:2909–2914
Transcription promoters in archaeal coding sequencesT Koide et al
14 Molecular Systems Biology 2009 & 2009 EMBO and Macmillan Publishers Limited
Hirata A, Klein BJ, Murakami KS (2008) The X-ray crystalstructure of RNA polymerase from Archaea. Nature 451:851–854
Itzkovitz S, Alon U (2007) The genetic code is nearly optimal forallowing additional information within protein-coding sequences.Genome Res 17: 405–412
Johnson WE, Li W, Meyer CA, Gottardo R, Carroll JS, Brown M, Liu XS(2006) Model-based analysis of tiling-arrays for ChIP-chip. ProcNatl Acad Sci USA 103: 12457–12462
Jones SJ (2006) Prediction of genomic functional elements. Annu RevGenomics Hum Genet 7: 315–338
Kaur A, Pan M, Meislin M, Facciotti MT, El-Gewely R, Baliga NS (2006)A systems view of haloarchaeal strategies to withstand stress fromtransition metals. Genome Res 16: 841–854
Lee HJ, Jeon HJ, Ji SC, Yun SH, Lim HM (2008) Establishment of anmRNA gradient depends on the promoter: an investigation ofpolarity in gene expression. J Mol Biol 378: 318–327
Lee TI, Rinaldi NJ, Robert F, Odom DT, Bar-Joseph Z, Gerber GK,Hannett NM, Harbison CT, Thompson CM, Simon I, Zeitlinger J,Jennings EG, Murray HL, Gordon DB, Ren B, Wyrick JJ, Tagne JB,Volkert TL, Fraenkel E, Gifford DK et al (2002) Transcriptionalregulatory networks in Saccharomyces cerevisiae. Science 298:799–804
McGrath PT, Lee H, Zhang L, Iniesta AA, Hottes AK,Tan MH, Hillson NJ, Hu P, Shapiro L, McAdams HH (2007)High-throughput identification of transcription start sites,conserved promoter motifs and predicted regulons. NatBiotechnol 25: 584–592
Muller F, Demeny MA, Tora L (2007) New problems in RNApolymerase II transcription initiation: matching the diversity ofcore promoters with a variety of promoter recognition factors. J BiolChem 282: 14685–14689
Nagalakshmi U, Wang Z, Waern K, Shou C, Raha D, Gerstein M, SnyderM (2008) The transcriptional landscape of the yeast genomedefined by RNA sequencing. Science 320: 1344–1349
Ng WV, Kennedy SP, Mahairas GG, Berquist B, Pan M, Shukla HD,Lasky SR, Baliga NS, Thorsson V, Sbrogna J, Swartzell S, Weir D,Hall J, Dahl TA, Welti R, Goo YA, Leithauser B, Keller K, Cruz R,Danson MJ et al (2000) Genome sequence of Halobacterium speciesNRC-1. Proc Natl Acad Sci USA 97: 12176–12181
Perocchi F, Xu Z, Clauder-Munster S, Steinmetz LM (2007) Antisenseartifacts in transcriptome microarray experiments are resolved byactinomycin D. Nucleic Acids Res 35: e128
Pfeiffer F, Schuster SC, Broicher A, Falb M, Palm P, Rodewald K, RueppA, Soppa J, Tittor J, Oesterhelt D (2008) Evolution in the laboratory:the genome of Halobacterium salinarum strain R1 compared to thatof strain NRC-1. Genomics 91: 335–346
Piantadosi CA, Suliman HB (2008) Transcriptional regulationof SDHa flavoprotein by nuclear respiratory factor-1 preventspseudo-hypoxia in aerobic cardiac cells. J Biol Chem 283:10967–10977
Price MN, Huang KH, Alm EJ, Arkin AP (2005) A novel method foraccurate operon predictions in all sequenced prokaryotes. NucleicAcids Res 33: 880–892
Reeve JN, Sandman K (2007) Chromatin and regulation. In Archaea:evolution, physiology and molecular biology, Garret RA, Klenk H(eds) 147–158. Wiley-Blackwell
Reiss DJ, Baliga NS, Bonneau R (2006) Integrated biclustering ofheterogeneous genome-wide datasets for the inference of globalregulatory networks. BMC Bioinformatics 7: 280
Reiss DJ, Facciotti MT, Baliga NS (2008) Model-based deconvolution ofgenome-wide DNA binding. Bioinformatics 24: 396–403
Ren B, Robert F, Wyrick JJ, Aparicio O, Jennings EG, Simon I, ZeitlingerJ, Schreiber J, Hannett N, Kanin E, Volkert TL, Wilson CJ, Bell SP,Young RA (2000) Genome-wide location and function of DNAbinding proteins. Science 290: 2306–2309
Reppas NB, Wade JT, Church GM, Struhl K (2006) The transitionbetween transcriptional initiation and elongation in E. coli is highlyvariable and often rate limiting. Mol Cell 24: 747–757
Reuter CJ, Maupin-Furlow JA (2004) Analysis of proteasome-dependent proteolysis in Haloferax volcanii cells, usingshort-lived green fluorescent proteins. Appl Environ Microbiol 70:7530–7538
Robertson G, Hirst M, Bainbridge M, Bilenky M, Zhao Y,Zeng T, Euskirchen G, Bernier B, Varhol R, Delaney A, ThiessenN, Griffith OL, He A, Marra M, Snyder M, Jones S (2007) Genome-wide profiles of STAT1 DNA association using chromatinimmunoprecipitation and massively parallel sequencing. NatMethods 4: 651–657
Robin S, Bar-Hen A, Daudin J, Pierre L (2007) A semi-parametricapproach for mixture models: Application to local false discoveryrate estimation. 51: 5483–5493
Ruepp A, Soppa J (1996) Fermentative arginine degradation inHalobacterium salinarium (formerly Halobacterium halobium):genes, gene products, and transcripts of the arcRACB gene cluster.J Bacteriol 178: 4942–4947
Sartorius-Neef S, Pfeifer F (2004) In vivo studies on putative Shine-Dalgarno sequences of the halophilic archaeon Halobacteriumsalinarum. Mol Microbiol 51: 579–588
Scheuch S, Marschaus L, Sartorius-Neef S, Pfeifer F (2008) Regulationof gvp genes encoding gas vesicle proteins in halophilic Archaea.Arch Microbiol 190: 333–339
Schmid AK, Reiss DJ, Kaur A, Pan M, King N, Van PT, Hohmann L,Martin DB, Baliga NS (2007) The anatomy of microbialcell state transitions in response to oxygen. Genome Res 17:1399–1413
Shimada T, Ishihama A, Busby SJ, Grainger DC (2008) The Escherichiacoli RutR transcription factor binds at targets within genes as well asintergenic regions. Nucleic Acids Res 36: 3950–3955
Shimoni Y, Friedlander G, Hetzroni G, Niv G, Altuvia S, Biham O,Margalit H (2007) Regulation of gene expression by small non-coding RNAs: a quantitative view. Mol Syst Biol 3: 138
Storz G, Altuvia S, Wassarman KM (2005) An abundance of RNAregulators. Annu Rev Biochem 74: 199–217
Tanay A (2006) Extensive low-affinity transcriptional interactions inthe yeast genome. Genome Res 16: 962–972
Tang TH, Bachellerie JP, Rozhdestvensky T, Bortolin ML, Huber H,Drungowski M, Elge T, Brosius J, Huttenhofer A (2002)Identification of 86 candidates for small non-messenger RNAsfrom the archaeon Archaeoglobus fulgidus. Proc Natl Acad Sci USA99: 7536–7541
Tang TH, Polacek N, Zywicki M, Huber H, Brugger K, Garrett R,Bachellerie JP, Huttenhofer A (2005) Identification of novel non-coding RNAs as potential antisense regulators in the archaeonSulfolobus solfataricus. Mol Microbiol 55: 469–481
Tsui HC, Zhao G, Feng G, Leung HC, Winkler ME (1994)The mutL repair gene of Escherichia coli K-12 forms asuperoperon with a gene encoding a new cell-wall amidase. MolMicrobiol 11: 189–202
Van PT, Schmid AK, King NL, Kaur A, Pan M, Whitehead K, Koide T,Facciotti MT, Goo YA, Deutsch EW, Reiss DJ, Mallick P, Baliga NS(2008) Halobacterium salinarum NRC-1 PeptideAtlas: towardstrategies for targeted proteomics and improved proteomecoverage. J Proteome Res 7: 3755–3764
Wade JT, Struhl K, Busby SJ, Grainger DC (2007) Genomic analysis ofprotein-DNA interactions in bacteria: insights into transcriptionand chromosome organization. Mol Microbiol 65: 21–26
Wang C, Ding C, Meraz RF, Holbrook SR (2006) PSoL: a positivesample only learning algorithm for finding non-coding RNA genes.Bioinformatics 22: 2590–2596
Ward LD, Bussemaker HJ (2008) Predicting functional transcriptionfactor binding through alignment-free and affinity-basedanalysis of orthologous promoter sequences. Bioinformatics 24:i165–i171
Whitehead K, Kish A, Pan M, Kaur A, Reiss DJ, King N, Hohmann L,DiRuggiero J, Baliga NS (2006) An integrated systems approach forunderstanding cellular responses to gamma radiation. Mol Syst Biol2: 47
Transcription promoters in archaeal coding sequencesT Koide et al
& 2009 EMBO and Macmillan Publishers Limited Molecular Systems Biology 2009 15
Wilhelm BT, Marguerat S, Watt S, Schubert F, Wood V, Goodhead I,Penkett CJ, Rogers J, Bahler J (2008) Dynamic repertoire of aeukaryotic transcriptome surveyed at single-nucleotide resolution.Nature 453: 1239–1243
Yang CF, DasSarma S (1990) Transcriptional induction of purplemembrane and gas vesicle synthesis in the archaebacteriumHalobacterium halobium is blocked by a DNA gyrase inhibitor.J Bacteriol 172: 4118–4121
Yochum GS, Rajaraman V, Cleland R, McWeeney S (2007) Localizationof TFIIB binding regions using serial analysis of chromatinoccupancy. BMC Mol Biol 8: 102
Zhu X, Wiren M, Sinha I, Rasmussen NN, Linder T, Holmberg S, EkwallK, Gustafsson CM (2006) Genome-wide occupancy profile ofmediator and the Srb8-11 module reveals interactions with codingregions. Mol Cell 22: 169–178
Molecular Systems Biology is an open-access journalpublished by European Molecular Biology Organiza-
tion and Nature Publishing Group.This article is licensed under a Creative Commons Attribution-Noncommercial-Share Alike 3.0 Licence.
Transcription promoters in archaeal coding sequencesT Koide et al
16 Molecular Systems Biology 2009 & 2009 EMBO and Macmillan Publishers Limited


