Embed Size (px)
Citation preview

ARTICLE
Previous growing season climate controls the occurrence ofblack spruce growth anomalies in boreal forests of EasternCanadaClémentine Ols, Annika Hofgaard, Yves Bergeron, and Igor Drobyshev
Abstract: To better understand climatic origins of annual tree-growth anomalies in boreal forests, we analysed 895 black spruce(Picea mariana (Mill.) B.S.P.) tree-growth series from 46 xeric sites situated along three latitudinal transects in Eastern Canada. Weidentified interannual (based on comparison with previous year growth) and multidecadal (based on the entire tree-ring widthdistribution) growth anomalies between 1901 and 2001 at site and transect levels. Growth anomalies occurred mainly at site leveland seldom at larger spatial scales. Both positive interannual and multidecadal growth anomalies were strongly associated withbelow-average temperatures and above-average precipitation during the previous growing season (Junet–1 – Augustt–1). Theclimatic signature of negative interannual and multidecadal growth anomalies was more complex and mainly associated withcurrent-year climatic anomalies. Between the early and late 20th century, only negative multidecadal anomalies became morefrequent. Our results highlight the role of previous growing season climate in controlling tree growth processes and suggest apositive association between climate warming and increases in the frequency of negative multidecadal growth anomalies.Projected climate change may further favour the occurrence of tree-growth anomalies and enhance the role of site conditions asmodifiers of tree response to regional climate change.
Key words: ecological resilience, climate change, growth sensitivity, adaptive capacity, forest productivity.
Résumé : Nous avons étudié l’origine climatique des anomalies de croissance des forêts boréales en analysant 895 séries decroissance d’épinette noire (Picea mariana (Mill.) B.S.P.) provenant de 46 sites xériques repartis le long de trois transects latitudi-naux dans l’Est Canadien. Nous avons identifié les anomalies de croissance interannuelles (comparaison a l’année précédente) etmulti-décennales (comparaison a toutes les années) pour chaque site et transect de 1901 a 2001. Les anomalies de croissanceapparaissent principalement a l’échelle du site mais rarement a de plus larges échelles géographiques. Les anomalies positives(interannuelles et multi-décennales) sont fortement associées a des températures basses et des précipitations fortes pendant lasaison de croissance de l’année précédente. L’origine climatique des anomalies négatives (interannuelles et multi-décennales) estplus complexe et généralement associée a des anomalies climatiques de l’année en cours. Entre le début et la fin du XXe siècle,seules les anomalies multi-décennales négatives sont devenues plus fréquentes. Nos résultats révèlent l’importance du climat dela saison de croissance précédente dans l’apparition d’anomalies de croissance et suggèrent un lien positif entre le réchauffe-ment climatique et l’augmentation de la fréquence des anomalies multi-décennales négatives. L’augmentation prévue destempératures dans les prochaines décennies pourrait davantage accroitre la fréquence des anomalies.
Mots-clés : résilience écologique, changement climatique, sensitivité de croissance, capacité d’adaptation, production forestière.
IntroductionRecent climate dynamics indicate an increase in global mean
temperature and in the frequency and intensity of climate extremes(Intergovernmental Panel on Climate Change (IPCC) 2014). Treeshave shown physiological limitations to cope with the rate ofclimate changes (Renwick and Rocca 2015), as evidenced by theoccurrence of recent geographically widespread growth declines(Girardin et al. 2014) and drought-induced mortality (Allen et al.2010). Effects of climate change on tree growth are most often as-sessed by correlating continuous time series of annual tree-ringsdata with climate variables (Fritts 1976). Among less common ap-proaches is the use of discontinuous series such as binary time seriesof years of growth anomalies that also provide information on theeffects of climate anomalies on tree-growth dynamics (Neuwirth
et al. 2007). Nevertheless, the influence of climate extremes ontree growth and, particularly, on the occurrence of tree-growthanomalies is complex and still poorly understood. Existing studiessuggest that, depending on their timing, duration, and intensity,climate extremes impact tree growth in different ways. For in-stance, unusually low precipitation during spring and summerhas often been associated with reduced tree growth, whereas sim-ilar anomalies in autumn and winter rarely affect growth (Zeppelet al. 2014). Similarly, frost events prior to bud break usually donot impact growth, whereas frost events following bud break candamage newly formed needles or leaves and lead to a decreasedgrowth during the remaining growing period (Sutinen et al. 2001).Moreover, due to temporal changes in tree sensitivity to climate,recurrent climate extremes during an individual tree’s lifespanmay trigger contrasting growth responses (Fritts 1976).
Received 23 October 2015. Accepted 5 March 2016.
C. Ols and Y. Bergeron. Institut de Recherche sur les Forêts, Université du Québec en Abitibi-Témiscamingue, 445 boul. de l’Université,Rouyn-Noranda, QC J9X 5E4, Canada.A. Hofgaard. Norwegian Institute for Nature Research, P.O. Box 5685 Sluppen, NO-7485 Trondheim, Norway.I. Drobyshev. Institut de Recherche sur les Forêts, Université du Québec en Abitibi-Témiscamingue, 445 boul. de l’Université, Rouyn-Noranda, QC J9X5E4, Canada; Southern Swedish Forest Research Centre, Swedish University of Agricultural Sciences, P.O. Box 49, SE-230 53 Alnarp, Sweden.Corresponding author: Clémentine Ols (email: [email protected]).
696
Can. J. For. Res. 46: 696–705 (2016) dx.doi.org/10.1139/cjfr-2015-0404 Published at www.nrcresearchpress.com/cjfr on 9 March 2016.
Can
. J. F
or. R
es. D
ownl
oade
d fr
om w
ww
.nrc
rese
arch
pres
s.co
m b
y C
lém
entin
e O
ls o
n 04
/15/
16Fo
r pe
rson
al u
se o
nly.

Despite the complexity of associations between climate ex-tremes and growth anomalies, temporal changes in the frequencyof growth anomalies may reflect occurrence of extreme weatherconditions at regional scales (Fonti et al. 2010) and may also pro-vide information on tree sensitivity and tree capacity to adapt toclimate change, especially in well-drained sites where trees aremore sensitive to changes in precipitation patterns (Fritts 1976). Forexample, narrow rings formed during droughts are generally char-acterized by higher proportions of latewood cells that increase tree“hydraulic safety” (Pothier et al. 1989). The plasticity of anatomicalstructure in tree rings may therefore represent an adaptation strat-egy to withstand soil water deficits (Bigler and Veblen 2009). On theother hand, more frequent negative growth anomalies may reflectan increase in the occurrence of drought conditions whereas morefrequent positive growth anomalies may reflect trees’ capacity tomaintain high growth levels despite changes in mean climate andclimate variability. The use of temporal changes in the frequency ofgrowth anomalies as proxy for climate variability and (or) treecapacity to withstand such variability calls for a better under-standing of associations between regional climate dynamics andgrowth anomalies.
Growth anomalies are commonly studied on annually resolvedtree-ring series (Schweingruber et al. 1990). Anomalies observed ina large proportion of individual tree-growth series within the samesite or region have been called pointer years (Schweingruber et al.1990) and have been associated with large-scale climatic anoma-lies (Schultz et al. 2009), insect outbreaks (Boulanger et al. 2012),and volcanic eruptions (Gennaretti et al. 2014).
Boreal forests in Canada cover 55% of the land area and are domi-nated by black spruce (Picea mariana (Mill.) B.S.P.). Because of its eco-logical and economical importance, large geographical distribution,and sensitivity to climate, black spruce has been widely used to studyclimate–growth interactions (Hofgaard et al. 1999; Rossi et al. 2006).Growth declines have been reported to dominate across old-growthblack spruce forests of North America (Girardin et al. 2012). Theseresults suggest that the benefits of warmer temperatures such as alonger growing season may not necessarily counterbalance the mois-ture stress and respiration-associated carbon loss triggered by highertemperatures.
In Eastern Canada, seasonal temperatures have increased sincethe beginning of the 20th century (Hansen et al. 2010), whereasseasonal precipitations have shown inconsistent patterns (Wanget al. 2014). Warmer temperatures increase tree respiration, de-crease trees’ carbon stock, and shift carbon allocation from thestem to roots or foliage (Gifford and Evans 1981). Such changes inallocation patterns may favour the occurrence of growth anoma-lies. In the boreal forest of western Quebec, pointer years of blackspruce have recently been associated with anomalies in springand summer weather (Drobyshev et al. 2013). However, no studieshave yet specifically investigated the spatiotemporal frequencyand climatic origin of black spruce growth anomalies at synoptic(10 000 km2) scales. In this paper, we analyze the (1) spatiotemporalpatterns and (2) climatic origin of pointer years across province-wideclimatic gradients in well-drained boreal forests in Quebec. We for-mulate three hypotheses: (i) pointer years occur synchronouslyacross climatic gradients within boreal Quebec, (ii) pointers years aremainly associated with climatic anomalies during the growing sea-son, and (iii) in the face of climate change, negative and positivepointer years have become more and less frequent, respectively.
Material and methods
Study areaWe studied black spruce growth along three latitudinal tran-
sects in northern Quebec (Fig. 1). The western transect (hereafter,
West) is characterised by low plains (200–350 m above sea level(a.s.l.)), whereas the central and eastern transects (hereafter, Centraland East, respectively) are dominated by hills (400–800 ma.s.l.), which are particularly pronounced in the north. Dominantoverlying bedrock deposits consist of peat along the West and of tillalong the Central and East (Ministère des Ressources naturelles duQuébec 2013). The two main climatic gradients in the study area area decreasing temperature gradient from south to north and an in-creasing summer precipitation gradient from west to east. Julyand January are the warmest and coldest months of the year, respec-tively (Table 1). The mean growing season length (1971–2000), starting10 days after the mean daily temperature is above 5 °C and ending atfall frost, ranges from <100 days in northern parts to 110–120 days insouthern parts of all transects (Agriculture and Agri-Food Canada2014). The growing season starts in late April in the West and earlyMay in the Central and East and ends in early October in all transects(Table 1). The whole study area receives a similar amount of precipi-tation between May and September, even if it rains substantially lessalong the West than along the Central and East over June to August(Fig. 1). Major snowfall periods occur in December and January in alltransects, with additional important snowfall in March in the Cen-tral and East (Table 1). Due to these temperature and precipitationgradients, current fire cycles are shorter in the western part (about95 years) than in the eastern part (up to 2000 years) of the study area(Ministère des Ressources naturelles du Québec 2013).
Site selection and samplingWe selected 14 to 17 sampling sites along each transect (Table 1;
Fig. 1) using the 2007 Provincial Forest Inventory (Ministère desRessources naturelles du Québec 2009). Most sites were situated inthe spruce–moss forest bioclimatic domain; however, a few of thenorthernmost sites were located in the spruce – lichen domain(Fig. 1; Supplementary Table S11). Selected sites consisted of unman-aged black spruce forests (>100 years old) on well-drained soils. Weselected unmanaged forests to minimize anthropogenic impacts ongrowth patterns, old stands to allow the construction of long series,and sites on well-drained soils (xeric to mesoxeric) to maximize pre-cipitation signal in tree-growth series and drought effects on treegrowth.
At each site, we collected 3–16 cores from dominant healthyliving trees (one core per tree) and 0–15 cookies from dead trees(one cookie per tree) (Supplementary Table S21). We sampled coresand cookies as close as possible to the ground but above stem basedeformities using an increment borer and chainsaw, respectively.The total number of samples per site ranged from 10 to 27 (Table 1;Supplementary Table S21). Dead trees were sampled to extendseries and accounted for 0%–100% (40% on average) of the sampledtrees per site (Supplementary Table S21). We attempted to restrictsampling of dead trees to snags of trees that were dominant whenstill alive. Ten pre-selected sites along the West burnt before sam-pling in 2013. As no trees had survived, sampling was adapted accord-ingly to only include recently dead but previously dominating trees(15 cookies per site; Supplementary Table S21). We sampled treesduring the summers of 2013 and 2014.
Sample preparation, crossdating, and measurementsTree-growth samples were sanded, scanned, and measured with
an accuracy of 0.01 mm using the CooRecorder program (CybisElektronik & Data AB 2015). Prior to analyses, we quality checkedeach tree-growth series. First, we visually and statistically cross-dated tree-growth series at site level using the R package dplR(Bunn 2010) and the COFECHA program (Grissino-Mayer 2001). Fol-lowing crossdating, we excluded tree-growth series presenting a lowcorrelation (r < 0.4) with their respective site master (average of allseries of a site except the focal series). We also excluded tree-growth
1Supplementary data are available with the article through the journal Web site at http://nrcresearchpress.com/doi/suppl/10.1139/cjfr-2015-0404.
Ols et al. 697
Published by NRC Research Press
Can
. J. F
or. R
es. D
ownl
oade
d fr
om w
ww
.nrc
rese
arch
pres
s.co
m b
y C
lém
entin
e O
ls o
n 04
/15/
16Fo
r pe
rson
al u
se o
nly.

series presenting any growth reduction longer than 5 years thatsynchronized with years of known spruce budworm (Choristoneurafumiferana (Clem.)) outbreaks (Boulanger and Arseneault 2004). Outof 1380 tree-growth series, 895 passed the quality check and were
used in the analyses, with 183, 342, and 370 individual tree-growthseries along the West, Central, and East, respectively (Table 1;Supplementary Table S21). Quality checked tree-growth series werethen log transformed, detrended using a 32 year spline, and
Fig. 1. Location, bioclimatic domains (a and b), and climate (c) of the study area and study sites along the latitudinal West (black), Central(red), and East (blue) transects in northern Quebec. The median site latitude on each transect separates southern sites (circles) from northernsites (triangles). Mean temperature (°C) and precipitation (mm) along each transect are presented. Standard deviation for each climate variableis added in pale colors. Figure is provided in colour online.
Table 1. Characteristics of transects.
West Central East
SamplingSites 14 15 17Series per site (range) 10–22 19–25 12–27Series per transect 183 342 370Site series length (range in years) 120–302 140–312 136–301
ClimateLatitude (WGS84) (50.3N, 52.6N) (50N, 52.2N) (50.2N, 52.9N)Longitude (WGS84) (–77.7E, –77.1E) (–74.1E, –72.1E) (–68.8E, –67.1E)Growing season late April–early October early May–early October early May–early OctoberGrowing season (days) <100–120 <100–120 <100–120Warmest month (minimum, maximum; °C) July (11, 18) July (10, 19) July (10, 19)Coldest month (minimum, maximum; °C) January (–29, –14) January (–30, –14) January (–29, –13)Months with the most snow December–January December–January–March December–January–MarchMonths with the most rain September July (September) July (September)
Note: Climate data represent variability in site-level climate along each transect.
698 Can. J. For. Res. Vol. 46, 2016
Published by NRC Research Press
Can
. J. F
or. R
es. D
ownl
oade
d fr
om w
ww
.nrc
rese
arch
pres
s.co
m b
y C
lém
entin
e O
ls o
n 04
/15/
16Fo
r pe
rson
al u
se o
nly.

prewhitened (Cook and Peters 1997). This standardisation proce-dure kept high-frequency variations in growth, mainly linked toclimate variability, while removing low-frequency variations com-monly related to biological or stand-level effects. As a result, thestandardisation increased correlation between tree-growth seriesand climate. Finally, we built raw and detrended site series, cal-culated as the biweighted robust mean of all raw or detrendedseries from a site (Supplementary Table S21). Site series lengthsranged from 120 to 312 years (Table 1; Supplementary Table S21).Most raw site series presented a signal-to-noise ratio greaterthan 2 and an expressed population signal greater than 0.6. Bothindicators generally increased after detrending (SupplementaryTable S21).
Identification of pointer yearsPointer years are commonly defined as growth anomalies
appearing synchronously in several individual tree-growth serieswithin a specific geographical region or site (Fritts 1976). The identi-fication of pointer years can vary substantially depending on thetime frame within which anomalies are defined (Bijak 2008). In thisstudy, we concomitantly considered two definitions of pointer yearspreviously used in the literature. First, we considered pointer yearsas interannual growth anomalies, also known as a pointer interval(Schweingruber et al. 1990). We termed these as year-to-year (YTY)pointer years. YTY pointer years were defined as years in which atleast 75% of the trees within a site recorded a 10% increase or decreasein ring width compared with the previous year (Mérian 2012). Sec-ond, we considered pointer years as multidecadal growth anomalies,i.e., years in which tree-ring width fell outside the central 90% of thering width distribution of a tree. We termed these as quantile (QTL)pointer years. QTL pointer years were defined as years in which atleast 20% of the trees within a site exhibited a growth in the upperand lower 5% quantiles of the distribution (Drobyshev et al. 2013).The two identification methods differ in initial inputs (raw series forYTY pointer years and detrended series for QTL pointer years) and inthe temporal scale at which anomalies are defined (short-term vari-ability in YTY pointer years and long-term variability, i.e., over theentire lifespan of an individual tree, in QTL pointer years).
We identified positive and negative pointer years at site levelwhen site series included at least 10 individual tree series between1901 and 2001. All site series presented a sample depth of 10 overthe entire study period except six series in the West that had areplication of only 10, namely 1900–1950, 1920–1974, 1900–1973,1900–1988, 1900–1972, and 1918–2001. Lastly, we identified years inwhich at least 50% of the site series within a transect recorded apointer year of identical sign (positive or negative), hereafter namedmain pointer years.
Ordination of pointer years’ occurrence at site levelBetween 1901 and 2001, we coded pointer years as 1 and all other
years as 0 and built site-specific binary time series for each of thefour types of pointer years (positive or negative and YTY or QTL).Years with a sample depth less than 10 trees were coded as NA. Weevaluated between-site similarity in the occurrence of pointer yearsby nonmetric multidimensional scaling using the R package vegan(Oksanen et al. 2015). This ordination method condenses a set ofmultiple time series into a set of two or three principal components(dimensions) to facilitate the visual interpretation of the results. Theordination was performed separately for each type of pointer yearusing Euclidean distances between binary time series. We ran theordination at a two-dimension level with a limit of 150 random iter-ations. However, stable results were always found after a maximumof 10 iterations.
Synchronicity of pointer years along and across transectsTo account for possible random effects on synchronicity, we
tested differences between observed and expected frequencies ofsynchronous pointer years along and across transects between
1901 and 2001 using a �2 test. Considering within-transect synchron-icity, we calculated transect-specific ratios of observed vs. expectednumber of years with zero to N sites synchronously presenting apointer year. N was the highest observed number of sites synchro-nously recording a pointer year. Similarly, to evaluate synchronicitylevels across transects, we calculated ratios of observed vs. expectednumber of years with zero to three transects synchronously present-ing a main pointer year (cf. identification of pointer years). To complywith requirements of the �2 test, we aggregated data into classes withexpected frequency greater than five.
Climate dataClimate data from meteorological stations in Quebec are too
scarce to perform accurate and reliable climate-growth analysesat large geographical scales. We, therefore, used climate data fromthe 0.5° × 0.5° CRU TS 3.22 global dataset (Harris et al. 2014). Site-specific climate data were extracted using 0.5° × 0.5° grid cells, eachsite location defining the centre of a climatic grid cell. Prior to anal-yses, we verified the quality of the extrapolated grid data by compar-ing them with climate data from 11 meteorological stations inQuebec (Environment Canada 2014) that had not been used in theconstruction of the CRU dataset (Supplementary Table S31). Weaveraged station data at the transect level and compared themwith the mean of all site-specific 0.5° × 0.5° grid cells data alongeach transect between 1936 and 2004, the longest common periodbetween both types of climate data. Grid data correlated well(r > 0.97) with station data, preserving climate variability within andbetween transects, i.e., north–south temperature and west–east pre-cipitation gradients (data not shown). The extrapolated grid datawere, therefore, selected as climate input for all further analyses. Themean climatic characteristics of each transect between 1901and 2001 are presented in Table 1. In addition to temperature andprecipitation, we extracted monthly North Atlantic Oscillation andArctic Oscillation indices from the Climate Prediction Center data-base (National Oceanic and Atmospheric Administration (NOAA)2014) between 1950 and 2001.
Associations between pointer years and climateWe studied associations between the occurrence of pointer
years and climatic anomalies at site level through superposedepoch analyses using the R package dplR (Bunn 2010). These anal-yses evaluate whether the mean values of climate variables duringpointer years significantly differ from their mean values duringnormal years. Climate variables included monthly mean, maxi-mum, and minimum temperatures, total precipitation, and thetwo monthly oscillation indices. We performed superposed epochanalyses for each of the four types of pointer years (positive ornegative and YTY or QTL). We ran analyses on the longest com-mon period between climatic records and site-specific binary timeseries, i.e., 1901–2001 for temperature and precipitation and 1950–2001 for the two oscillation indices. Analyses included monthsfrom previous May (Mayt–1) to current August (Augustt).
In addition, we studied climate–growth interactions along eachtransect by investigating correlations and response functions be-tween detrended transect series (average of all detrended site se-ries along a transect) and the above-mentioned climate variables.Analyses were performed using the R package bootRes (Zang andBiondi 2013). All correlations and response functions were testedfor 95% confidence intervals using 1000 bootstrap samples.
Temporal changes in the frequency of pointer yearsWe studied changes in the frequency of pointer years between
1901 and 2001 by dividing the study period into three subperiods,each approximately 30 years long (1901–1935, 1936–1970, and1971–2001). This temporal division, based on the definition of cli-mate by the World Meteorological Organization (WMO) (2015),assumes a 30-year block–stationary climate (Visser and Petersen2012). We partitioned our study area into six regions by dividing
Ols et al. 699
Published by NRC Research Press
Can
. J. F
or. R
es. D
ownl
oade
d fr
om w
ww
.nrc
rese
arch
pres
s.co
m b
y C
lém
entin
e O
ls o
n 04
/15/
16Fo
r pe
rson
al u
se o
nly.

each transect into a northern and southern region (Fig. 1; Supple-mentary Table S11). The north–south delimitation along each tran-sect was defined by the median latitude of all sites.
We identified changes in the frequency of pointer years betweenthe first (1901–1935) and last (1971–2001) subperiods using generalizedlinear models with binomial distribution (Crawley 2005). Modelswere run at a regional level. For each region, we tested the signifi-cance of temporal changes in pointer year frequencies, aggregatingdata from all site-specific binary time series within that region. Incase of over-dispersion in the residuals, we refitted the models usingquasibinomial distribution and performed a Pearson’s �2 test to testfor significance in differences following this readjustment (Crawley2005). All �2 tests were significant at p < 0.05.
Results
Among-site similarities in occurrence of pointer yearsRegardless of the type of pointer year, the ordination revealed
strong longitudinal and latitudinal patterns in the occurrence ofpointer years, particularly for negative pointer years (Fig. 2). Theaggregation level of ordination was generally low for all types ofpointer years, except for QTL positive pointer years in which siteswere strongly aggregated around the origin of the ordination (Fig. 2).For all types of pointer years, the West was the most geographicallydefined group, although some overlap occurred between the Centraland East, especially during positive pointer years.
Spatial scale of pointer year occurrenceBoth YTY and QTL pointer years mainly occurred at site level
and more rarely at larger scales, as underlined by the few mainpointer years (2 to 7) identified on each transect (Fig. 3). This lowsynchronicity along all transects was, nevertheless, significantlyhigher than what would be expected by a random process (Table 2).
Only 3 out of 18 YTY main pointer years (1927, 1959, and 1974)were recorded simultaneously on two transects, whereas no syn-chronous QTL main pointer year occurred across transects (Fig. 3).This level of synchronicity across transects was significantly lowerthan would be expected by a random process (Table 2).
The occurrence of main pointer years was temporally irregularand transect specific (Fig. 3). QTL main pointer years did not revealclear temporal patterns in any of the transects, and YTY mainpointer years only occurred between 1920 and 1960 in the East,precisely when they ceased occurring in the West. Along the Cen-tral, YTY main pointer years only occurred between 1960 and 1980,except 1927. Regardless of the pointer year type, the number ofpositive and negative main pointer years was identical in the Westand East. YTY main pointer years were more numerous than QTLmain pointer years on all transects (Fig. 3).
Spatial frequency of main pointer yearsThe spatial distribution of sites recording either YTY or QTL
main pointer years varied over the study period along each tran-sect (Fig. 4). Nevertheless, a number of main pointer years pre-dominantly occurred at southern or northern sites, e.g., YTY 1924in the East and YTY 1927 in the Central. Along the West, both YTYand QTL main pointer years tended to occur more often in the north.Along the Central, all main pointer years before 1960 mostly oc-curred at northern sites, their occurrence extending southwardthereafter but disappearing from the central part of the transect(C8–C12). Along the East, main pointer years (both YTY and QTL) inthe late 1950s had a dominant northern occurrence.
The latitudinal range of sites recording YTY main pointer yearswas larger than those recording QTL main pointer years, e.g., 1913in the West and 1943 in the East (Fig. 4). All or almost all main pointeryears occurred at some sites (W10–W12, C7, and E5), whereas, atother sites, only a few were observed (C1 and E1) (Fig. 4).
Climatic origin of pointer yearsRegardless of their type, positive pointer years were mainly
associated with climatic anomalies during the previous growingseason, whereas negative pointer years were mainly associatedwith current year climatic anomalies. Significant associations ob-served with mean, maximum, and minimum temperatures weremostly similar (Supplementary Fig. S51). Few significant associa-tions with monthly oscillation indices were found, and these weresite specific (Supplementary Fig. S51).
Fig. 2. Nonmetric multidimensional scaling of positive and negativeyear to year (YTY) and quantile (QTL) pointer year occurrence at sitelevel between1901 and 2001. West (W), Central (C), and East (E) sitesare plotted in black, red, and blue, respectively. Latitude and longitude(arrows) significantly explained each ordination (p < 0.01). s values givethe stress of the ordination, and values between 0.1 and 0.2 usuallyprovide a good representation of multidimensional between-sitedistances. Figure is provided in colour online.
700 Can. J. For. Res. Vol. 46, 2016
Published by NRC Research Press
Can
. J. F
or. R
es. D
ownl
oade
d fr
om w
ww
.nrc
rese
arch
pres
s.co
m b
y C
lém
entin
e O
ls o
n 04
/15/
16Fo
r pe
rson
al u
se o
nly.

Positive pointer yearsThere was a strong and spatially consistent association between
both positive YTY and QTL pointer years and below-average previousgrowing season mean temperatures (Junet–1 through Augustt–1)(Fig. 5). This overall strong association was also highlighted by rela-tively high correlation and response function coefficients (Supple-mentary Table S41). However, some differences between the climaticorigin of YTY and QTL pointer years were evident. For instance, theassociation between positive pointer years and below-averageAugustt–1 temperature was only significant for YTY pointer years inthe Central and West and for QTL pointer years in the East and West.Positive YTY pointer years were also associated with below-averagetemperatures in Mayt–1 and Decembert–1 in the East, and positive QTLpointer years were associated with below-average temperatures inOctobert–1 through Novembert–1 in the West and Central.
Significant associations between maximum temperature anoma-lies and positive pointer years (both YTY and QTL) were mostly com-parable with those observed for mean temperature. However,associations observed with below-average mean temperature
in Novembert–1 and Decembert–1 were no longer observed withmaximum temperature. In addition, associations between QTLpointer years and above-average spring maximum temperature(Aprilt – Junet), which were not observed for mean temperature,emerged in the Central.
Associations between positive pointer years and precipitationwere few but mainly linked to above-average previous growingseason anomalies. Positive YTY pointer years were associated withhigher Mayt–1 – Junet–1 precipitation, and positive QTL pointer yearswere linked to anomalously high Julyt–1 – Augustt–1 precipitation(Fig. 5).
Negative pointer yearsSignificant associations between the occurrence of negative
pointer years and climatic anomalies were less numerous comparedwith the occurrence of positive pointer years and climatic anom-alies (Fig. 5).
Both negative YTY and QTL pointer years were associated withbelow-average Januaryt mean temperature in all transects. A strongassociation between negative YTY pointer years and below-averageAprilt temperatures was found in the West.
Significant associations between maximum temperature anom-alies and negative pointer years (both YTY and QTL) were largelycomparable with those observed for mean temperature. However,we noticed that associations with below-average Januaryt meantemperature in the Central and East were no longer observed forthe maximum temperature. In addition, significant associationswith below-average Aprilt maximum temperatures were more nu-merous than for mean temperature.
Significant associations with precipitation were rare and verysite specific (Fig. 5). However, both types of negative pointer yearswere significantly associated with above-average Mayt precipita-tion (Fig. 5).
Temporal changes in the frequency of pointer yearsWe detected few significant changes in the frequency of YTY
and QTL pointer years between the early and late 20th century.The frequency of positive pointer years of both types remainedlargely the same between these two periods, except in the West.There, the frequency of positive YTY pointer years increased in thesouthern region, whereas the frequency of positive QTL pointeryears decreased in the northern region (Fig. 6).
Fig. 3. Transect-level frequency and occurrence of pointer years for 1901–2001. Results for year to year (YTY) and quantile (QTL) pointer yearsare respectively presented in the upper and lower sections of the figures. Left Y axes show proportion of sites (%) recording a pointer year foreach calendar year. Right Y axes show the number of sites included in the analyses through time (horizontal lines). Positive and negativepointer years are plotted in black and grey, respectively. Calendar years’ markers are given for main pointer years, i.e., years when more than50% of the sites along a transect record the same pointer year.
Table 2. Pointeryears’ synchronicityalongand across transects.
�2 df p value
YTY pointer yearsAlong transects
West 33.0 4 <0.001Central 44.4 4 <0.001East 40.7 4 <0.001
Across transects 0.2 1 0.7
QTL pointer yearsAlong transects
West 9.9 3 0.02Central 6.6 3 0.09East 21.1 4 <0.001
Across transects 0.04 1 0.8
Note: The table presents results of contin-gency analyses for YTY and QTL pointer years,respectively; only collapsed �2 statistics arepresented in the table. Significant p values(p < 0.05) are in bold. YTY, year to year; QTL,quantile.
Ols et al. 701
Published by NRC Research Press
Can
. J. F
or. R
es. D
ownl
oade
d fr
om w
ww
.nrc
rese
arch
pres
s.co
m b
y C
lém
entin
e O
ls o
n 04
/15/
16Fo
r pe
rson
al u
se o
nly.

Negative QTL pointer years became significantly more frequentin all six regions between the early and late 20th century, whereasthe frequency of negative YTY pointer years did not change, ex-cept in the southern region of the West, where it increased (Fig. 6).
Discussion
Spatial synchronicity of pointer yearsFew pointer years synchronized across boreal Quebec, suggesting
that, even if common climatic forcing causing extreme tree growthoccurs, these events are rare, particularly along longitudinal gradi-ents. This suggests that climatic forcing leading to the occurrence ofsynchronous growth events such as pointer years or frost rings(Plasse et al. 2015) occur more easily along latitudinal climatic gradi-ents in our study area. Longitudinal climatic gradients in boreal Que-bec, triggering differences in climate-growth relationships in blackspruce (Nicault et al. 2014), appear to prevent the formation of syn-chronous pointer years at large scales. Pointer years occurring simul-taneously over the entire study area would involve large-scaleclimatic and biotic events such as volcanic eruptions (Gennarettiet al. 2014), anomalies in atmospheric circulation patterns (Schultzet al. 2009), and (or) region-wide synchronous insect outbreaks(Boulanger et al. 2012). However, our data did not suggest occur-rence of such events during the 20th century.
Climatic origin of pointer yearsPositive pointer years in boreal Quebec, despite their site-specific
occurrence, originated from similar site-level climatic anomaliesduring the previous growing season. We hypothesize that low tem-perature and high precipitation anomalies during the previousgrowing season increase carbon accumulation before dormancyby lowering climatic stress, e.g., heat and water limitations, whichresults in growth-promoting higher carbon stocks the following
growing season. Indeed, a recent study on black spruce growthacross the entire boreal Canada has shown that water limitationand heat stress negatively affected carbon assimilation in blackspruce the year preceding tree-ring formation and decreasedgrowth during the subsequent growing season (Girardin et al.2015). A positive effect of moist previous summers on black sprucegrowth during the subsequent growing season has also been previ-ously reported for western Quebec (Hofgaard et al. 1999).
Negative pointer years of both types were not associated to anyparticular climatic conditions, suggesting that negative pointeryears might arise from complex and temporally inconsistent combi-nations of climatic anomalies (Schultz et al. 2009). For example, re-peated frost events during June and July, a period with highcambium activity (Rossi et al. 2006), have been shown to disturbgrowth and lead to the formation of negative pointer years (Plasseet al. 2015). The lack of consistent climatic signature in the occur-rence of negative pointer years might also suggest that their appear-ance is strongly modulated by site-level factors (Neuwirth et al.2004), e.g., topography (Desplanque et al. 1999) and (or) groundvegetation (Plasse et al. 2015).
Temporal changes in the frequency of pointer yearsThe large-scale increase in the frequency of negative QTL pointer
years between the early and late 20th century echoes recent growthdeclines observed in boreal forests of North America (Girardin et al.2014, 2015) and might, similar to reported growth declines, reflectnegative effects of climate warming, e.g., heat stress, on multidec-adal growth patterns (Girardin et al. 2015). The observed higher fre-quency of negative QTL pointer years does not appear to be linked toa decrease in water availability, as no significant changes in regionalprecipitation patterns occurred in the study area during the 20thcentury (Wang et al. 2014).
Fig. 4. Spatial frequency of main pointer years along their respective transect (see Fig. 3 for identified main pointer years). Filled squaresshow site-level occurrence of transect-specific main pointer years. Negative and positive main pointer years are plotted in blue and red,respectively. Light and dark colors are used for year to year (YTY) and quantile (QTL) main pointer years, respectively. An “x” stands for yearswhen pointer year identification was not conceivable (i.e., when sites series were based on less than 10 trees). Panels are aligned using themedian latitude of each transect (thick, black horizontal line), representing the limit between southern and northern sites (West (W), 51.4°;Central (C), 51.5°; East (E), 51.3°). Figure is provided in colour online.
702 Can. J. For. Res. Vol. 46, 2016
Published by NRC Research Press
Can
. J. F
or. R
es. D
ownl
oade
d fr
om w
ww
.nrc
rese
arch
pres
s.co
m b
y C
lém
entin
e O
ls o
n 04
/15/
16Fo
r pe
rson
al u
se o
nly.

Fig. 5. Significant associations between the occurrence of pointer years and monthly temperature (Tmean and Tmax) and total precipitation (1901–2001) at site level, as revealed bysuperposed epoch analyses. Analyses were run from previous May (Mayt–1) to current August (Augustt) and for positive (upper section) and negative (lower section) pointer years. Emptyand filled circles represent significant associations found for year to year (YTY) and quantile (QTL) pointer years, respectively. Filled circles with a black outline are sites at whichassociations were significant for both YTY and QTL pointer years. Blue and red circles stand for significant association with below- and above-average climates, respectively. Maps of thestudy area are only plotted when three or more sites along the same transect presented a significant association (p < 0.05) to a specific monthly climate variable. Figure is provided incolour online.
Ols
etal.
703
Publish
edby
NR
CR
esearchPress
Can
. J. F
or. R
es. D
ownl
oade
d fr
om w
ww
.nrc
rese
arch
pres
s.co
m b
y C
lém
entin
e O
ls o
n 04
/15/
16Fo
r pe
rson
al u
se o
nly.
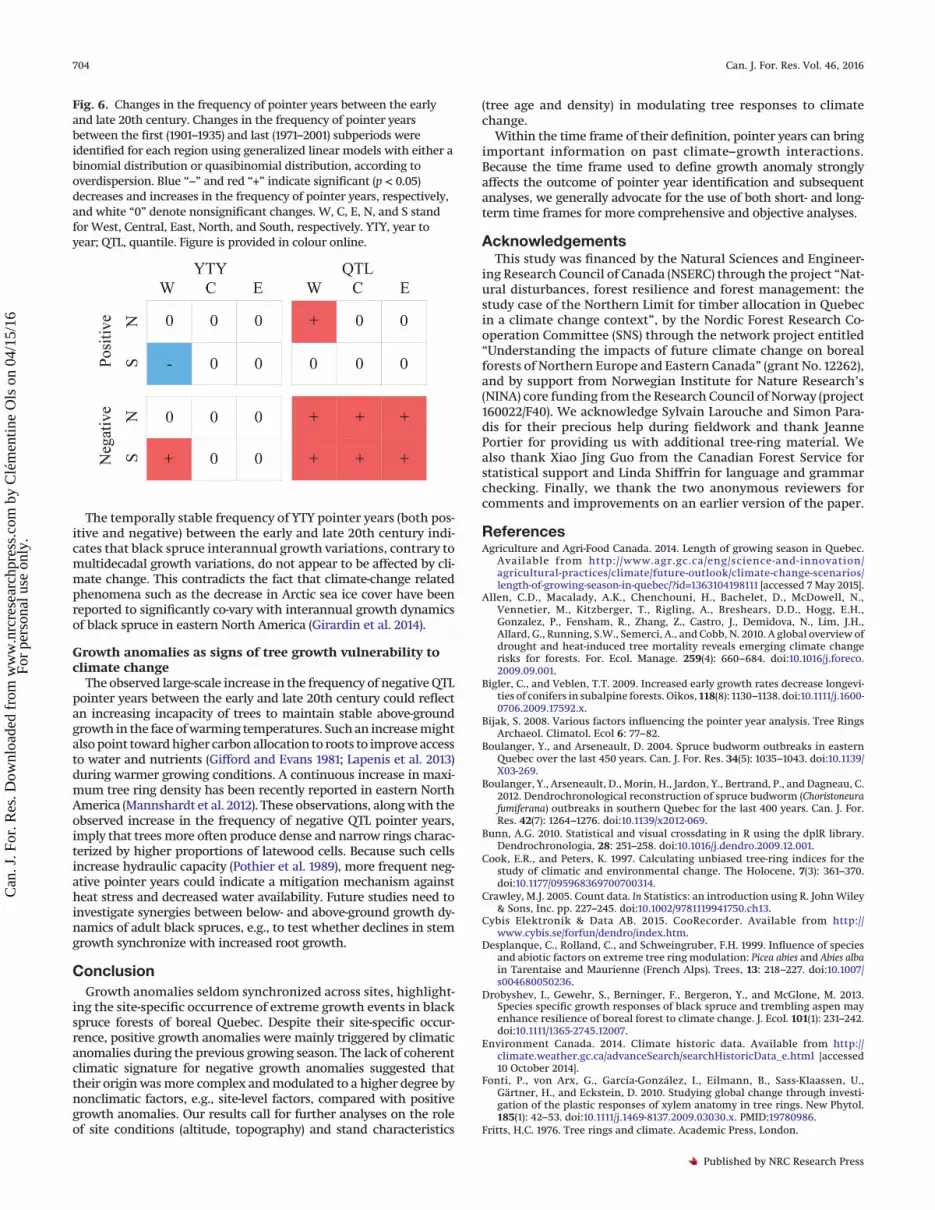
The temporally stable frequency of YTY pointer years (both pos-itive and negative) between the early and late 20th century indi-cates that black spruce interannual growth variations, contrary tomultidecadal growth variations, do not appear to be affected by cli-mate change. This contradicts the fact that climate-change relatedphenomena such as the decrease in Arctic sea ice cover have beenreported to significantly co-vary with interannual growth dynamicsof black spruce in eastern North America (Girardin et al. 2014).
Growth anomalies as signs of tree growth vulnerability toclimate change
The observed large-scale increase in the frequency of negative QTLpointer years between the early and late 20th century could reflectan increasing incapacity of trees to maintain stable above-groundgrowth in the face of warming temperatures. Such an increase mightalso point toward higher carbon allocation to roots to improve accessto water and nutrients (Gifford and Evans 1981; Lapenis et al. 2013)during warmer growing conditions. A continuous increase in maxi-mum tree ring density has been recently reported in eastern NorthAmerica (Mannshardt et al. 2012). These observations, along with theobserved increase in the frequency of negative QTL pointer years,imply that trees more often produce dense and narrow rings charac-terized by higher proportions of latewood cells. Because such cellsincrease hydraulic capacity (Pothier et al. 1989), more frequent neg-ative pointer years could indicate a mitigation mechanism againstheat stress and decreased water availability. Future studies need toinvestigate synergies between below- and above-ground growth dy-namics of adult black spruces, e.g., to test whether declines in stemgrowth synchronize with increased root growth.
ConclusionGrowth anomalies seldom synchronized across sites, highlight-
ing the site-specific occurrence of extreme growth events in blackspruce forests of boreal Quebec. Despite their site-specific occur-rence, positive growth anomalies were mainly triggered by climaticanomalies during the previous growing season. The lack of coherentclimatic signature for negative growth anomalies suggested thattheir origin was more complex and modulated to a higher degree bynonclimatic factors, e.g., site-level factors, compared with positivegrowth anomalies. Our results call for further analyses on the roleof site conditions (altitude, topography) and stand characteristics
(tree age and density) in modulating tree responses to climatechange.
Within the time frame of their definition, pointer years can bringimportant information on past climate–growth interactions.Because the time frame used to define growth anomaly stronglyaffects the outcome of pointer year identification and subsequentanalyses, we generally advocate for the use of both short- and long-term time frames for more comprehensive and objective analyses.
AcknowledgementsThis study was financed by the Natural Sciences and Engineer-
ing Research Council of Canada (NSERC) through the project “Nat-ural disturbances, forest resilience and forest management: thestudy case of the Northern Limit for timber allocation in Quebecin a climate change context”, by the Nordic Forest Research Co-operation Committee (SNS) through the network project entitled“Understanding the impacts of future climate change on borealforests of Northern Europe and Eastern Canada” (grant No. 12262),and by support from Norwegian Institute for Nature Research’s(NINA) core funding from the Research Council of Norway (project160022/F40). We acknowledge Sylvain Larouche and Simon Para-dis for their precious help during fieldwork and thank JeannePortier for providing us with additional tree-ring material. Wealso thank Xiao Jing Guo from the Canadian Forest Service forstatistical support and Linda Shiffrin for language and grammarchecking. Finally, we thank the two anonymous reviewers forcomments and improvements on an earlier version of the paper.
ReferencesAgriculture and Agri-Food Canada. 2014. Length of growing season in Quebec.
Available from http://www.agr.gc.ca/eng/science-and-innovation/agricultural-practices/climate/future-outlook/climate-change-scenarios/length-of-growing-season-in-quebec/?id=1363104198111 [accessed 7 May 2015].
Allen, C.D., Macalady, A.K., Chenchouni, H., Bachelet, D., McDowell, N.,Vennetier, M., Kitzberger, T., Rigling, A., Breshears, D.D., Hogg, E.H.,Gonzalez, P., Fensham, R., Zhang, Z., Castro, J., Demidova, N., Lim, J.H.,Allard, G., Running, S.W., Semerci, A., and Cobb, N. 2010. A global overview ofdrought and heat-induced tree mortality reveals emerging climate changerisks for forests. For. Ecol. Manage. 259(4): 660–684. doi:10.1016/j.foreco.2009.09.001.
Bigler, C., and Veblen, T.T. 2009. Increased early growth rates decrease longevi-ties of conifers in subalpine forests. Oikos, 118(8): 1130–1138. doi:10.1111/j.1600-0706.2009.17592.x.
Bijak, S. 2008. Various factors influencing the pointer year analysis. Tree RingsArchaeol. Climatol. Ecol 6: 77–82.
Boulanger, Y., and Arseneault, D. 2004. Spruce budworm outbreaks in easternQuebec over the last 450 years. Can. J. For. Res. 34(5): 1035–1043. doi:10.1139/X03-269.
Boulanger, Y., Arseneault, D., Morin, H., Jardon, Y., Bertrand, P., and Dagneau, C.2012. Dendrochronological reconstruction of spruce budworm (Choristoneurafumiferana) outbreaks in southern Quebec for the last 400 years. Can. J. For.Res. 42(7): 1264–1276. doi:10.1139/x2012-069.
Bunn, A.G. 2010. Statistical and visual crossdating in R using the dplR library.Dendrochronologia, 28: 251–258. doi:10.1016/j.dendro.2009.12.001.
Cook, E.R., and Peters, K. 1997. Calculating unbiased tree-ring indices for thestudy of climatic and environmental change. The Holocene, 7(3): 361–370.doi:10.1177/095968369700700314.
Crawley, M.J. 2005. Count data. In Statistics: an introduction using R. John Wiley& Sons, Inc. pp. 227–245. doi:10.1002/9781119941750.ch13.
Cybis Elektronik & Data AB. 2015. CooRecorder. Available from http://www.cybis.se/forfun/dendro/index.htm.
Desplanque, C., Rolland, C., and Schweingruber, F.H. 1999. Influence of speciesand abiotic factors on extreme tree ring modulation: Picea abies and Abies albain Tarentaise and Maurienne (French Alps). Trees, 13: 218–227. doi:10.1007/s004680050236.
Drobyshev, I., Gewehr, S., Berninger, F., Bergeron, Y., and McGlone, M. 2013.Species specific growth responses of black spruce and trembling aspen mayenhance resilience of boreal forest to climate change. J. Ecol. 101(1): 231–242.doi:10.1111/1365-2745.12007.
Environment Canada. 2014. Climate historic data. Available from http://climate.weather.gc.ca/advanceSearch/searchHistoricData_e.html [accessed10 October 2014].
Fonti, P., von Arx, G., García-González, I., Eilmann, B., Sass-Klaassen, U.,Gärtner, H., and Eckstein, D. 2010. Studying global change through investi-gation of the plastic responses of xylem anatomy in tree rings. New Phytol.185(1): 42–53. doi:10.1111/j.1469-8137.2009.03030.x. PMID:19780986.
Fritts, H.C. 1976. Tree rings and climate. Academic Press, London.
Fig. 6. Changes in the frequency of pointer years between the earlyand late 20th century. Changes in the frequency of pointer yearsbetween the first (1901–1935) and last (1971–2001) subperiods wereidentified for each region using generalized linear models with either abinomial distribution or quasibinomial distribution, according tooverdispersion. Blue “−” and red “+” indicate significant (p < 0.05)decreases and increases in the frequency of pointer years, respectively,and white “0” denote nonsignificant changes. W, C, E, N, and S standfor West, Central, East, North, and South, respectively. YTY, year toyear; QTL, quantile. Figure is provided in colour online.
704 Can. J. For. Res. Vol. 46, 2016
Published by NRC Research Press
Can
. J. F
or. R
es. D
ownl
oade
d fr
om w
ww
.nrc
rese
arch
pres
s.co
m b
y C
lém
entin
e O
ls o
n 04
/15/
16Fo
r pe
rson
al u
se o
nly.

Gennaretti, F., Arseneault, D., Nicault, A., Perreault, L., and Bégin, Y. 2014.Volcano-induced regime shifts in millennial tree-ring chronologies fromnortheastern North America. Proc. Natl. Acad. Sci. U. S. A. 111(28): 10077–10082. doi:10.1073/pnas.1324220111. PMID:24982132.
Gifford, R.M., and Evans, L.T. 1981. Photosynthesis, carbon partitioning, andyield. Annu. Rev. Plant Physiol. 32: 485–509. doi:10.1146/annurev.pp.32.060181.002413.
Girardin, M.P., Guo, X.J., Bernier, P.Y., Raulier, F., and Gauthier, S. 2012. Changesin growth of pristine boreal North American forests from 1950 to 2005 drivenby landscape demographics and species traits. Biogeosciences, 9: 2523–2536.doi:10.5194/bgd-9-2523-2012.
Girardin, M.P., Guo, X.J., De, Jong, R., Kinnard, C., Bernier, P., and Raulier, F.2014. Unusual forest growth decline in boreal North America covaries withthe retreat of Arctic sea ice. Glob. Chang. Biol. 20(3): 851–866. doi:10.1111/gcb.12400. PMID:24115302.
Girardin, M.P., Hogg, E.H., Bernier, P.Y., Kurz, W.A., Guo, X.J., and Cyr, G. 2015.Negative impacts of high temperatures on growth of black spruce forestsintensify with the anticipated climate warming. Global Change Biol. 22(2):627–643. doi:10.1111/gcb.13072.
Grissino-Mayer, H.D. 2001. Evaluating crossdating accuracy: a manual and tuto-rial for the computer program COFECHA. The University of Arizona CampusRepository, Tree-Ring Research, 57(2): 205–221.
Hansen, J., Ruedy, R., Sato, M., and Lo, K. 2010. Global surface temperaturechange. Rev. Geophys. 48(4). doi:10.1029/2010rg000345.
Harris, I., Jones, P.D., Osborn, T.J., and Lister, D.H. 2014. Updated high-resolutiongrids of monthly climatic observations — the CRU TS3.10 dataset. Int. J.Climatol. 34(3): 623–642. doi:10.1002/joc.3711.
Hofgaard, A., Tardif, J.C., and Bergeron, Y. 1999. Dendroclimatic response ofPicea mariana and Pinus banksiana along a latitudinal gradient in the easternCanadian boreal forest. Can. J. For. Res. 29(9): 1333–1346. doi:10.1139/x99-073.
Intergovernmental Panel on Climate Change (IPCC). 2014. IPCC fifth assessmentreport climate change 2014. synthesis report — summary for policymakers.pp. 1–35.
Lapenis, A.G., Lawrence, G.B., Heim, A., Zheng, C., and Shortle, W. 2013. Climatewarming shifts carbon allocation from stemwood to roots in calcium-depleted spruce forests. Glob. Biogeochem. Cycles, 27(1): 101–107. doi:10.1029/2011gb004268.
Mannshardt, E., Craigmile, P.F., and Tingley, M.P. 2012. Statistical modeling ofextreme value behavior in North American tree-ring density series. Clim.Chang. 117(4): 843–858. doi:10.1007/s10584-012-0575-5.
Mérian, P. 2012. POINTER et DENDRO: deux applications sous R pour l’analyse dela re=ponse des arbres au climat par approche dendroe=cologique. Rev. for. fr.6: 789–798.
Ministère des Ressources naturelles du Québec. 2009. Norme d’inventaire éco-dendrométrique nordique.
Ministère des Ressources naturelles du Québec. 2013. Rapport du Comité scien-tifique chargé d’examiner la limite nordique des forêts attribuables.
Neuwirth, B., Esper, J., Schweingruber, F.H., and Winiger, M. 2004. Site ecolog-ical differences to the climatic forcing of spruce pointer years from theLötschental, Switzerland. Dendrochronologia, 21(2): 69–78. doi:10.1078/1125-7865-00040.
Neuwirth, B., Schweingruber, F.H., and Winiger, M. 2007. Spatial patterns ofcentral European pointer years from 1901 to 1971. Dendrochronologia, 24(2–3): 79–89. doi:10.1016/j.dendro.2006.05.004.
Nicault, A., Boucher, E., Tapsoba, D., Arseneault, D., Berninger, F., Bégin, C.,DesGranges, J.L., Guiot, J., Marion, J., Wicha, S., and Bégin, Y. 2014. Spatialanalysis of the black spruce (Picea mariana (Mill) B.S.P.) radial growth responseto climate in northern Quebec – Labrador Peninsula, Canada. Can. J. For. Res.45(3): 343–352. doi:10.1139/cjfr-2014-0080.
National Oceanic and Atmospheric Administration (NOAA). 2014. Teleconnec-tions indices. Available from http://www.cpc.ncep.noaa.gov/products/precip/CWlink/daily_ao_index/teleconnections.shtml [accessed 10 October 2014].
Oksanen, J., Blanchet, F.G., Kindt, R., Legendre, P., Minchin, P.R., O’Hara, R.B.,Simpson, G.L., Solymos, P., Stevens, M.H.H., and Wagner, H. 2015. vegan:community ecology package.
Plasse, C., Payette, S., and Matlack, G. 2015. Frost hollows of the boreal forest:a spatiotemporal perspective. J. Ecol. 103(3): 669–678. doi:10.1111/1365-2745.12399.
Pothier, D., Margolis, H.A., Poliquin, J., and Waring, R.H. 1989. Relation betweenthe permeability and the anatomy of jack pine sapwood with stand develop-ment. Can. J. For. Res. 19(12): 1564–1570. doi:10.1139/x89-238.
Renwick, K.M., and Rocca, M.E. 2015. Temporal context affects the observed rateof climate-driven range shifts in tree species. Glob. Ecol. Biogeogr. 24(1):44–51. doi:10.1111/geb.12240.
Rossi, S., Deslauriers, A., Anfodillo, T., Morin, H., Saracino, A., Motta, R., andBorghetti, M. 2006. Conifers in cold environments synchronize maximumgrowth rate of tree-ring formation with day length. New Phytol. 170(2): 301–310. doi:10.1111/j.1469-8137.2006.01660.x. PMID:16608455.
Schultz, J., Neuwirth, B., Winiger, M., and Löffler, J. 2009. Negative pointer yearsfrom Central European tree-rings caused by circulation patterns. TRACE, 7:78–84.
Schweingruber, F.H., Dieter, E., Serre-Bachet, F., and Bräker, O.U. 1990. Identifi-cation, presentation and interpretation of event years and pointer years indendrochronology. Dendrochronologia, 8: 9–38.
Sutinen, M.-L., Arora, R., Wisniewski, M., Ashworth, E., Strimbeck, R., and Palta,J. 2001. Mechanisms of frost survival and freeze-damage in nature. In Conifercold hardiness. Edited by F. Bigras and S. Colombo. Springer Netherlands.pp. 89–120.
Visser, H., and Petersen, A.C. 2012. Inferences on weather extremes and weather-related disasters: a review of statistical methods. Clim. Past, 8(1): 265–286.doi:10.5194/cp-8-265-2012.
Wang, Y., Hogg, E.H., Price, D.T., Edwards, J., and Williamson, T. 2014. Past andprojected future changes in moisture conditions in the Canadian borealforest. For. Chron. 90(5): 678–691. doi:10.5558/tfc2014-134.
World Meteorological Organization (WMO). 2015. What is Climate? Availablefrom http://www.wmo.int/pages/prog/wcp/ccl/faqs.php [accessed 24 August2015].
Zang, C., and Biondi, F. 2013. Dendroclimatic calibration in R: the bootRes pack-age for response and correlation function analysis. Dendrochronologia, 31(1):68–74. doi:10.1016/j.dendro.2012.08.001.
Zeppel, M.J.B., Wilks, J.V., and Lewis, J.D. 2014. Impacts of extreme precipitationand seasonal changes in precipitation on plants. Biogeosciences, 11(11): 3083–3093. doi:10.5194/bg-11-3083-2014.
Ols et al. 705
Published by NRC Research Press
Can
. J. F
or. R
es. D
ownl
oade
d fr
om w
ww
.nrc
rese
arch
pres
s.co
m b
y C
lém
entin
e O
ls o
n 04
/15/
16Fo
r pe
rson
al u
se o
nly.


