Embed Size (px)
Citation preview
Probing Electrospray Ionization Dynamics Using Differential MobilitySpectrometry: The Curious Case of 4‑Aminobenzoic AcidJ. Larry Campbell,* J. C. Yves Le Blanc, and Bradley B. Schneider
AB SCIEX, 71 Four Valley Drive, Concord, Ontario L4K 4V8, Canada
*S Supporting Information
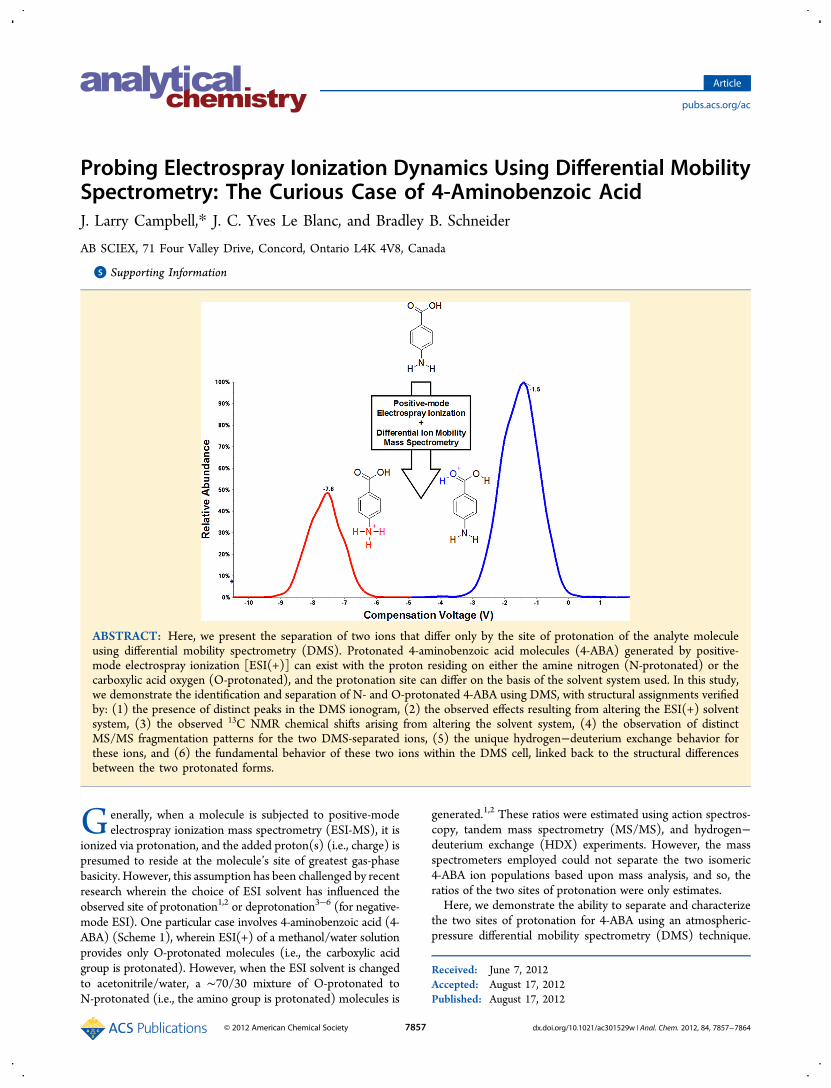
ABSTRACT: Here, we present the separation of two ions that differ only by the site of protonation of the analyte moleculeusing differential mobility spectrometry (DMS). Protonated 4-aminobenzoic acid molecules (4-ABA) generated by positive-mode electrospray ionization [ESI(+)] can exist with the proton residing on either the amine nitrogen (N-protonated) or thecarboxylic acid oxygen (O-protonated), and the protonation site can differ on the basis of the solvent system used. In this study,we demonstrate the identification and separation of N- and O-protonated 4-ABA using DMS, with structural assignments verifiedby: (1) the presence of distinct peaks in the DMS ionogram, (2) the observed effects resulting from altering the ESI(+) solventsystem, (3) the observed 13C NMR chemical shifts arising from altering the solvent system, (4) the observation of distinctMS/MS fragmentation patterns for the two DMS-separated ions, (5) the unique hydrogen−deuterium exchange behavior forthese ions, and (6) the fundamental behavior of these two ions within the DMS cell, linked back to the structural differencesbetween the two protonated forms.
Generally, when a molecule is subjected to positive-modeelectrospray ionization mass spectrometry (ESI-MS), it is
ionized via protonation, and the added proton(s) (i.e., charge) ispresumed to reside at the molecule’s site of greatest gas-phasebasicity. However, this assumption has been challenged by recentresearch wherein the choice of ESI solvent has influenced theobserved site of protonation1,2 or deprotonation3−6 (for negative-mode ESI). One particular case involves 4-aminobenzoic acid (4-ABA) (Scheme 1), wherein ESI(+) of a methanol/water solutionprovides only O-protonated molecules (i.e., the carboxylic acidgroup is protonated). However, when the ESI solvent is changedto acetonitrile/water, a ∼70/30 mixture of O-protonated toN-protonated (i.e., the amino group is protonated) molecules is
generated.1,2 These ratios were estimated using action spectros-copy, tandem mass spectrometry (MS/MS), and hydrogen−deuterium exchange (HDX) experiments. However, the massspectrometers employed could not separate the two isomeric4-ABA ion populations based upon mass analysis, and so, theratios of the two sites of protonation were only estimates.Here, we demonstrate the ability to separate and characterize
the two sites of protonation for 4-ABA using an atmospheric-pressure differential mobility spectrometry (DMS) technique.
Received: June 7, 2012Accepted: August 17, 2012Published: August 17, 2012
Article
pubs.acs.org/ac
© 2012 American Chemical Society 7857 dx.doi.org/10.1021/ac301529w | Anal. Chem. 2012, 84, 7857−7864
DMS and other related techniques (such as field asymmetricwaveform ionmobility spectrometry or FAIMS)7 are well-knownfor their abilities to separate analyte ions from the less-desiredchemical noise associated with ESI. These techniques have alsodemonstrated the ability to distinguish ions that are structuralisomers,8,9 stereoisomers,10 and even isotopomers.11 However,to our knowledge, this is the first example of a DMS-basedseparation of isomeric species that differ only in their sites ofprotonation.
■ EXPERIMENTAL SECTIONMaterials. Three isomers of aminobenzoic acid (2-, 3-, and
4-ABA), as well as deuterated water (99%), were obtained fromSigma-Aldrich (St. Louis, MO) and used without further purifica-tion. HPLC-grade acetonitrile (Caledon Laboratory Chemicals,Georgetown, ON) and HPLC-grade methanol (J.T. Baker,Avantor Performance Chemicals, Center Valley, PA) werealso used without further purification. Distilled deionized water(15 MΩ) was produced in-house using a Millipore (Billerica,MA) Integral 10 water purification system.Differential Mobility Spectrometry-Mass Spectrome-
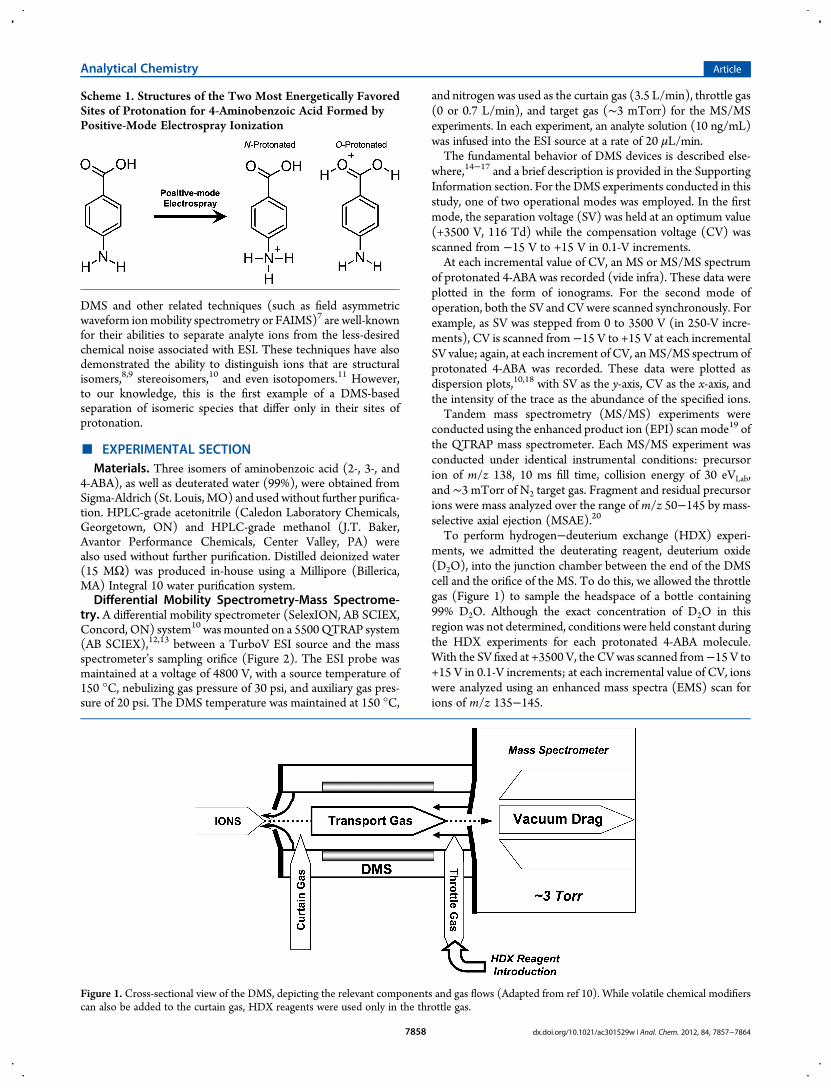
try. A differential mobility spectrometer (SelexION, AB SCIEX,Concord, ON) system10 was mounted on a 5500QTRAP system(AB SCIEX),12,13 between a TurboV ESI source and the massspectrometer’s sampling orifice (Figure 2). The ESI probe wasmaintained at a voltage of 4800 V, with a source temperature of150 °C, nebulizing gas pressure of 30 psi, and auxiliary gas pres-sure of 20 psi. The DMS temperature was maintained at 150 °C,
and nitrogen was used as the curtain gas (3.5 L/min), throttle gas(0 or 0.7 L/min), and target gas (∼3 mTorr) for the MS/MSexperiments. In each experiment, an analyte solution (10 ng/mL)was infused into the ESI source at a rate of 20 μL/min.The fundamental behavior of DMS devices is described else-
where,14−17 and a brief description is provided in the SupportingInformation section. For the DMS experiments conducted in thisstudy, one of two operational modes was employed. In the firstmode, the separation voltage (SV) was held at an optimum value(+3500 V, 116 Td) while the compensation voltage (CV) wasscanned from −15 V to +15 V in 0.1-V increments.At each incremental value of CV, an MS or MS/MS spectrum
of protonated 4-ABA was recorded (vide infra). These data wereplotted in the form of ionograms. For the second mode ofoperation, both the SV and CV were scanned synchronously. Forexample, as SV was stepped from 0 to 3500 V (in 250-V incre-ments), CV is scanned from−15 V to +15 V at each incrementalSV value; again, at each increment of CV, anMS/MS spectrum ofprotonated 4-ABA was recorded. These data were plotted asdispersion plots,10,18 with SV as the y-axis, CV as the x-axis, andthe intensity of the trace as the abundance of the specified ions.Tandem mass spectrometry (MS/MS) experiments were
conducted using the enhanced product ion (EPI) scan mode19 ofthe QTRAP mass spectrometer. Each MS/MS experiment wasconducted under identical instrumental conditions: precursorion of m/z 138, 10 ms fill time, collision energy of 30 eVLab,and ∼3 mTorr of N2 target gas. Fragment and residual precursorions were mass analyzed over the range of m/z 50−145 by mass-selective axial ejection (MSAE).20
To perform hydrogen−deuterium exchange (HDX) experi-ments, we admitted the deuterating reagent, deuterium oxide(D2O), into the junction chamber between the end of the DMScell and the orifice of the MS. To do this, we allowed the throttlegas (Figure 1) to sample the headspace of a bottle containing99% D2O. Although the exact concentration of D2O in thisregion was not determined, conditions were held constant duringthe HDX experiments for each protonated 4-ABA molecule.With the SV fixed at +3500 V, the CVwas scanned from−15 V to+15 V in 0.1-V increments; at each incremental value of CV, ionswere analyzed using an enhanced mass spectra (EMS) scan forions of m/z 135−145.
Scheme 1. Structures of the Two Most Energetically FavoredSites of Protonation for 4-Aminobenzoic Acid Formed byPositive-Mode Electrospray Ionization
Figure 1. Cross-sectional view of the DMS, depicting the relevant components and gas flows (Adapted from ref 10). While volatile chemical modifierscan also be added to the curtain gas, HDX reagents were used only in the throttle gas.
Analytical Chemistry Article
dx.doi.org/10.1021/ac301529w | Anal. Chem. 2012, 84, 7857−78647858
Theoretical Methods. All calculations were performed usingGaussian 09 (revision A.1),21 and the results were visualized usingGaussView 5.0.9.Geometry optimization was performed at the density
functional (DFT) level of theory with functionals of the “pure”-DFT type; both of these used the gradient-corrected exchangefunctional of Becke combined with the gradient corrected correla-tion functional of Lee, Yang, and Parr22−25 (B3LYP) using thecc-pVTZ basis set.26
■ RESULTS AND DISCUSSION
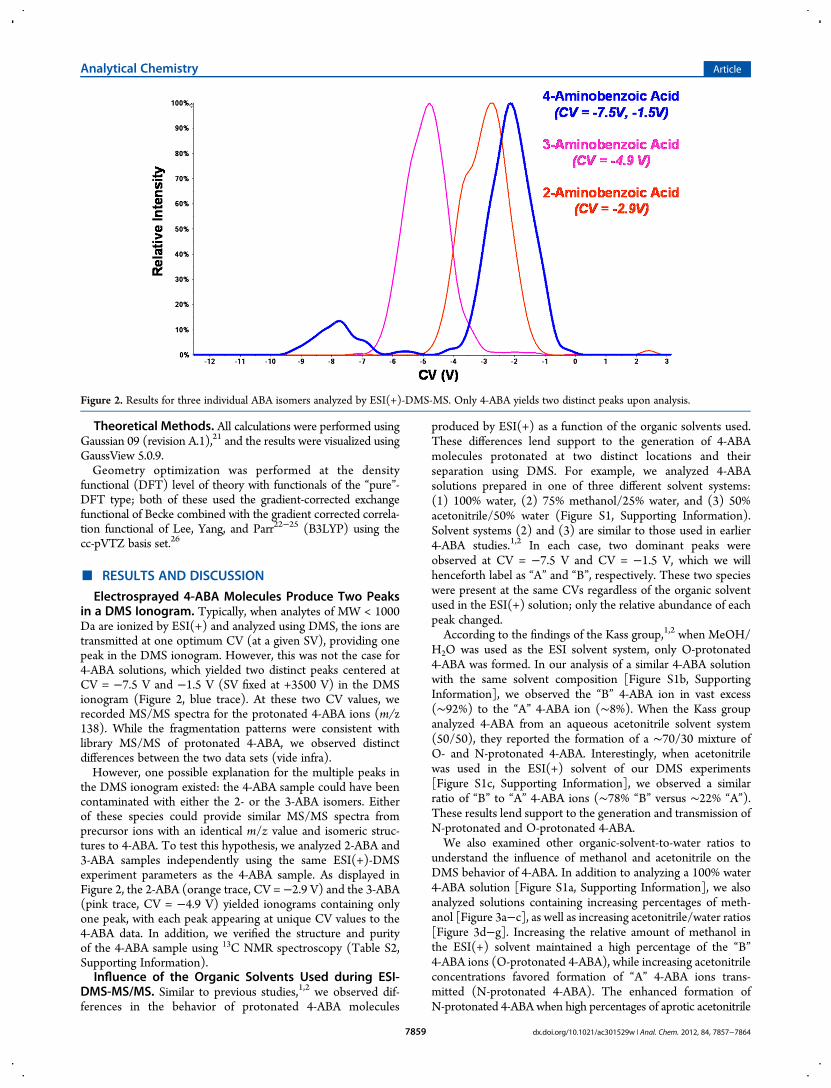
Electrosprayed 4-ABA Molecules Produce Two Peaksin a DMS Ionogram. Typically, when analytes of MW < 1000Da are ionized by ESI(+) and analyzed using DMS, the ions aretransmitted at one optimum CV (at a given SV), providing onepeak in the DMS ionogram. However, this was not the case for4-ABA solutions, which yielded two distinct peaks centered atCV = −7.5 V and −1.5 V (SV fixed at +3500 V) in the DMSionogram (Figure 2, blue trace). At these two CV values, werecorded MS/MS spectra for the protonated 4-ABA ions (m/z138). While the fragmentation patterns were consistent withlibrary MS/MS of protonated 4-ABA, we observed distinctdifferences between the two data sets (vide infra).However, one possible explanation for the multiple peaks in
the DMS ionogram existed: the 4-ABA sample could have beencontaminated with either the 2- or the 3-ABA isomers. Eitherof these species could provide similar MS/MS spectra fromprecursor ions with an identical m/z value and isomeric struc-tures to 4-ABA. To test this hypothesis, we analyzed 2-ABA and3-ABA samples independently using the same ESI(+)-DMSexperiment parameters as the 4-ABA sample. As displayed inFigure 2, the 2-ABA (orange trace, CV = −2.9 V) and the 3-ABA(pink trace, CV = −4.9 V) yielded ionograms containing onlyone peak, with each peak appearing at unique CV values to the4-ABA data. In addition, we verified the structure and purityof the 4-ABA sample using 13C NMR spectroscopy (Table S2,Supporting Information).Influence of the Organic Solvents Used during ESI-
DMS-MS/MS. Similar to previous studies,1,2 we observed dif-ferences in the behavior of protonated 4-ABA molecules
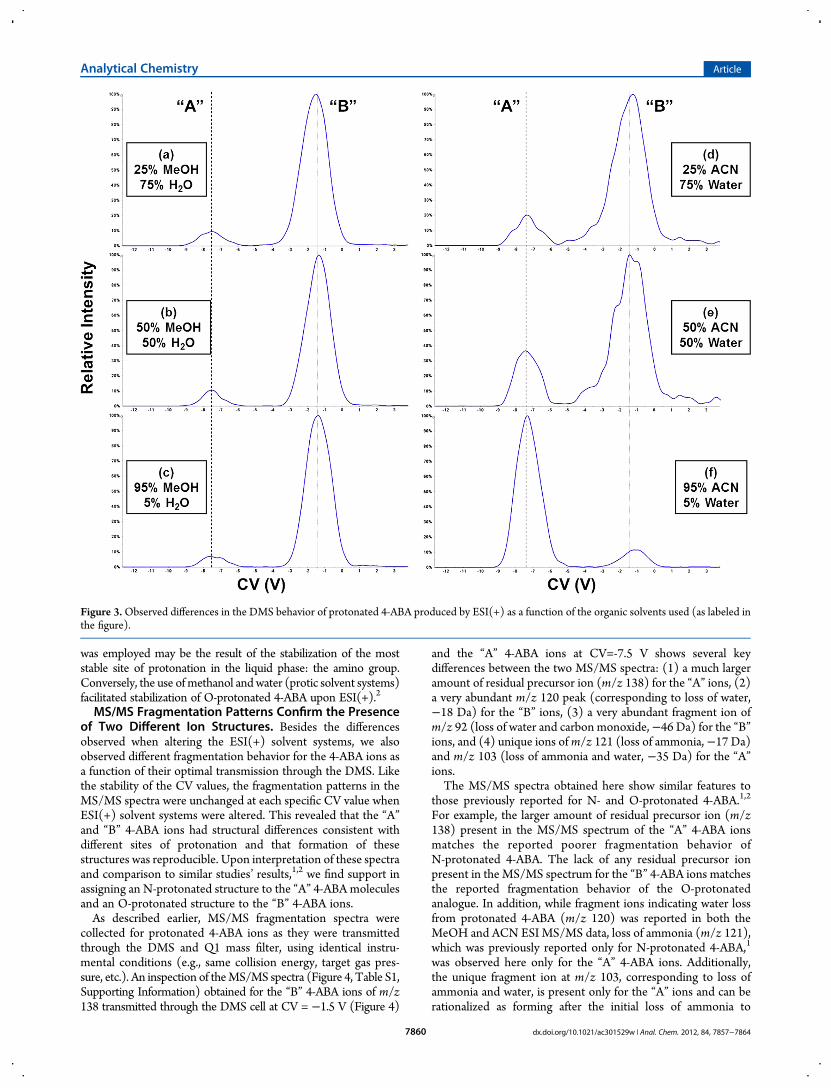
produced by ESI(+) as a function of the organic solvents used.These differences lend support to the generation of 4-ABAmolecules protonated at two distinct locations and theirseparation using DMS. For example, we analyzed 4-ABAsolutions prepared in one of three different solvent systems:(1) 100% water, (2) 75% methanol/25% water, and (3) 50%acetonitrile/50% water (Figure S1, Supporting Information).Solvent systems (2) and (3) are similar to those used in earlier4-ABA studies.1,2 In each case, two dominant peaks wereobserved at CV = −7.5 V and CV = −1.5 V, which we willhenceforth label as “A” and “B”, respectively. These two specieswere present at the same CVs regardless of the organic solventused in the ESI(+) solution; only the relative abundance of eachpeak changed.According to the findings of the Kass group,1,2 when MeOH/
H2O was used as the ESI solvent system, only O-protonated4-ABA was formed. In our analysis of a similar 4-ABA solutionwith the same solvent composition [Figure S1b, SupportingInformation], we observed the “B” 4-ABA ion in vast excess(∼92%) to the “A” 4-ABA ion (∼8%). When the Kass groupanalyzed 4-ABA from an aqueous acetonitrile solvent system(50/50), they reported the formation of a ∼70/30 mixture ofO- and N-protonated 4-ABA. Interestingly, when acetonitrilewas used in the ESI(+) solvent of our DMS experiments[Figure S1c, Supporting Information], we observed a similarratio of “B” to “A” 4-ABA ions (∼78% “B” versus ∼22% “A”).These results lend support to the generation and transmission ofN-protonated and O-protonated 4-ABA.We also examined other organic-solvent-to-water ratios to
understand the influence of methanol and acetonitrile on theDMS behavior of 4-ABA. In addition to analyzing a 100% water4-ABA solution [Figure S1a, Supporting Information], we alsoanalyzed solutions containing increasing percentages of meth-anol [Figure 3a−c], as well as increasing acetonitrile/water ratios[Figure 3d−g]. Increasing the relative amount of methanol inthe ESI(+) solvent maintained a high percentage of the “B”4-ABA ions (O-protonated 4-ABA), while increasing acetonitrileconcentrations favored formation of “A” 4-ABA ions trans-mitted (N-protonated 4-ABA). The enhanced formation ofN-protonated 4-ABA when high percentages of aprotic acetonitrile
Figure 2. Results for three individual ABA isomers analyzed by ESI(+)-DMS-MS. Only 4-ABA yields two distinct peaks upon analysis.
Analytical Chemistry Article
dx.doi.org/10.1021/ac301529w | Anal. Chem. 2012, 84, 7857−78647859
was employed may be the result of the stabilization of the moststable site of protonation in the liquid phase: the amino group.Conversely, the use ofmethanol andwater (protic solvent systems)facilitated stabilization of O-protonated 4-ABA upon ESI(+).2
MS/MS Fragmentation Patterns Confirm the Presenceof Two Different Ion Structures. Besides the differencesobserved when altering the ESI(+) solvent systems, we alsoobserved different fragmentation behavior for the 4-ABA ions asa function of their optimal transmission through the DMS. Likethe stability of the CV values, the fragmentation patterns in theMS/MS spectra were unchanged at each specific CV value whenESI(+) solvent systems were altered. This revealed that the “A”and “B” 4-ABA ions had structural differences consistent withdifferent sites of protonation and that formation of thesestructures was reproducible. Upon interpretation of these spectraand comparison to similar studies’ results,1,2 we find support inassigning an N-protonated structure to the “A” 4-ABA moleculesand an O-protonated structure to the “B” 4-ABA ions.As described earlier, MS/MS fragmentation spectra were
collected for protonated 4-ABA ions as they were transmittedthrough the DMS and Q1 mass filter, using identical instru-mental conditions (e.g., same collision energy, target gas pres-sure, etc.). An inspection of theMS/MS spectra (Figure 4, Table S1,Supporting Information) obtained for the “B” 4-ABA ions of m/z138 transmitted through the DMS cell at CV = −1.5 V (Figure 4)
and the “A” 4-ABA ions at CV=-7.5 V shows several keydifferences between the two MS/MS spectra: (1) a much largeramount of residual precursor ion (m/z 138) for the “A” ions, (2)a very abundant m/z 120 peak (corresponding to loss of water,−18 Da) for the “B” ions, (3) a very abundant fragment ion ofm/z 92 (loss of water and carbon monoxide,−46 Da) for the “B”ions, and (4) unique ions ofm/z 121 (loss of ammonia,−17 Da)and m/z 103 (loss of ammonia and water, −35 Da) for the “A”ions.The MS/MS spectra obtained here show similar features to
those previously reported for N- and O-protonated 4-ABA.1,2
For example, the larger amount of residual precursor ion (m/z138) present in the MS/MS spectrum of the “A” 4-ABA ionsmatches the reported poorer fragmentation behavior ofN-protonated 4-ABA. The lack of any residual precursor ionpresent in the MS/MS spectrum for the “B” 4-ABA ions matchesthe reported fragmentation behavior of the O-protonatedanalogue. In addition, while fragment ions indicating water lossfrom protonated 4-ABA (m/z 120) was reported in both theMeOH and ACN ESI MS/MS data, loss of ammonia (m/z 121),which was previously reported only for N-protonated 4-ABA,1
was observed here only for the “A” 4-ABA ions. Additionally,the unique fragment ion at m/z 103, corresponding to loss ofammonia and water, is present only for the “A” ions and can berationalized as forming after the initial loss of ammonia to
Figure 3.Observed differences in the DMS behavior of protonated 4-ABA produced by ESI(+) as a function of the organic solvents used (as labeled inthe figure).
Analytical Chemistry Article
dx.doi.org/10.1021/ac301529w | Anal. Chem. 2012, 84, 7857−78647860
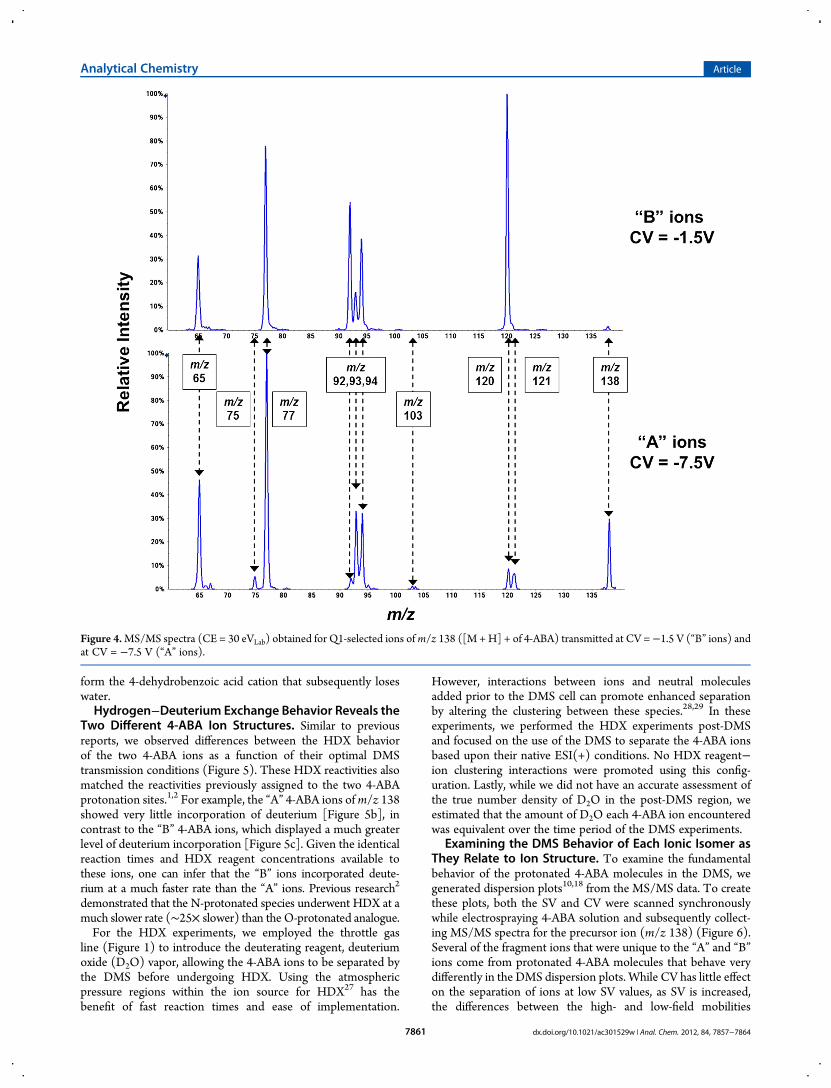
form the 4-dehydrobenzoic acid cation that subsequently loseswater.Hydrogen−Deuterium Exchange Behavior Reveals the
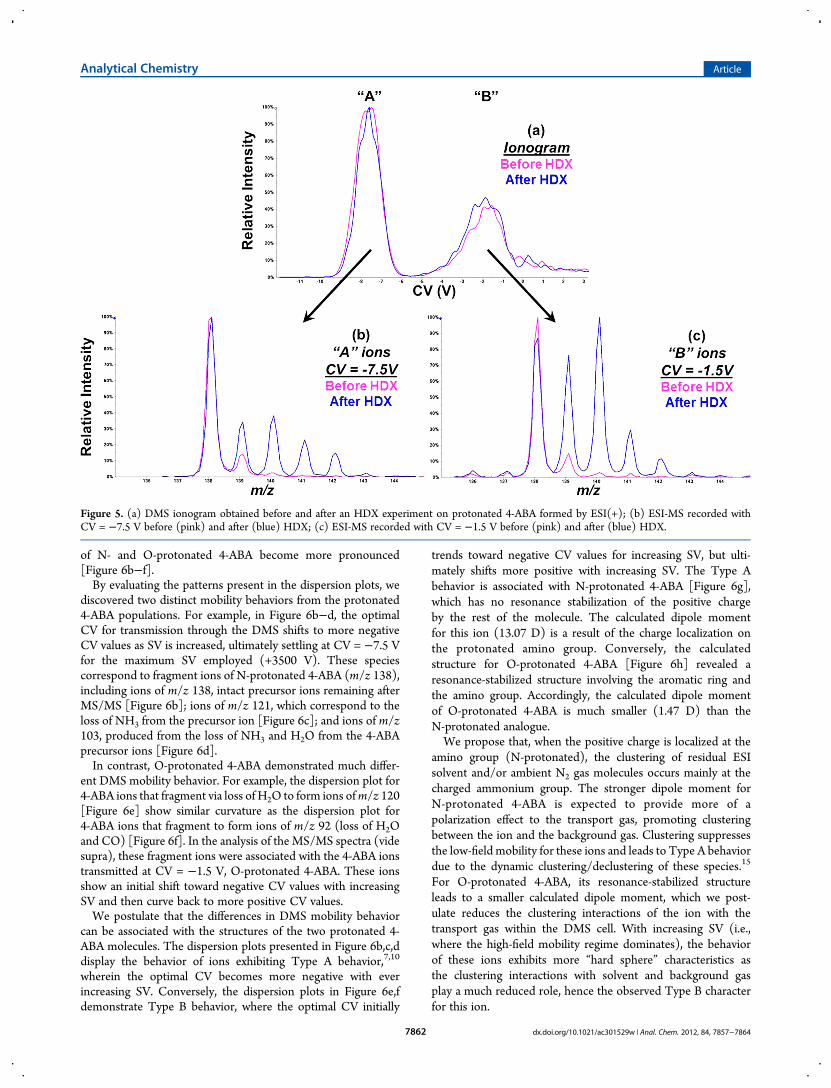
Two Different 4-ABA Ion Structures. Similar to previousreports, we observed differences between the HDX behaviorof the two 4-ABA ions as a function of their optimal DMStransmission conditions (Figure 5). These HDX reactivities alsomatched the reactivities previously assigned to the two 4-ABAprotonation sites.1,2 For example, the “A” 4-ABA ions ofm/z 138showed very little incorporation of deuterium [Figure 5b], incontrast to the “B” 4-ABA ions, which displayed a much greaterlevel of deuterium incorporation [Figure 5c]. Given the identicalreaction times and HDX reagent concentrations available tothese ions, one can infer that the “B” ions incorporated deute-rium at a much faster rate than the “A” ions. Previous research2
demonstrated that the N-protonated species underwent HDX at amuch slower rate (∼25× slower) than the O-protonated analogue.For the HDX experiments, we employed the throttle gas
line (Figure 1) to introduce the deuterating reagent, deuteriumoxide (D2O) vapor, allowing the 4-ABA ions to be separated bythe DMS before undergoing HDX. Using the atmosphericpressure regions within the ion source for HDX27 has thebenefit of fast reaction times and ease of implementation.
However, interactions between ions and neutral moleculesadded prior to the DMS cell can promote enhanced separationby altering the clustering between these species.28,29 In theseexperiments, we performed the HDX experiments post-DMSand focused on the use of the DMS to separate the 4-ABA ionsbased upon their native ESI(+) conditions. No HDX reagent−ion clustering interactions were promoted using this config-uration. Lastly, while we did not have an accurate assessment ofthe true number density of D2O in the post-DMS region, weestimated that the amount of D2O each 4-ABA ion encounteredwas equivalent over the time period of the DMS experiments.
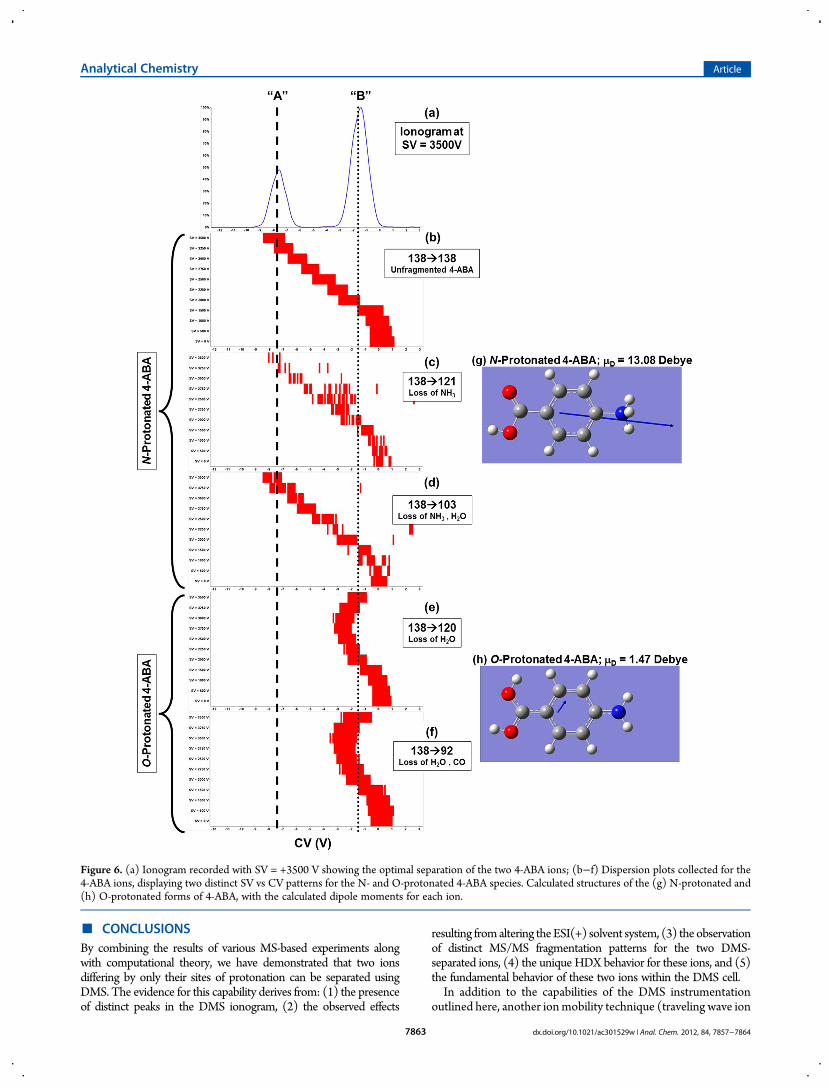
Examining the DMS Behavior of Each Ionic Isomer asThey Relate to Ion Structure. To examine the fundamentalbehavior of the protonated 4-ABA molecules in the DMS, wegenerated dispersion plots10,18 from the MS/MS data. To createthese plots, both the SV and CV were scanned synchronouslywhile electrospraying 4-ABA solution and subsequently collect-ing MS/MS spectra for the precursor ion (m/z 138) (Figure 6).Several of the fragment ions that were unique to the “A” and “B”ions come from protonated 4-ABA molecules that behave verydifferently in the DMS dispersion plots. While CV has little effecton the separation of ions at low SV values, as SV is increased,the differences between the high- and low-field mobilities
Figure 4.MS/MS spectra (CE = 30 eVLab) obtained for Q1-selected ions ofm/z 138 ([M +H] + of 4-ABA) transmitted at CV =−1.5 V (“B” ions) andat CV = −7.5 V (“A” ions).
Analytical Chemistry Article
dx.doi.org/10.1021/ac301529w | Anal. Chem. 2012, 84, 7857−78647861
of N- and O-protonated 4-ABA become more pronounced[Figure 6b−f].By evaluating the patterns present in the dispersion plots, we
discovered two distinct mobility behaviors from the protonated4-ABA populations. For example, in Figure 6b−d, the optimalCV for transmission through the DMS shifts to more negativeCV values as SV is increased, ultimately settling at CV = −7.5 Vfor the maximum SV employed (+3500 V). These speciescorrespond to fragment ions of N-protonated 4-ABA (m/z 138),including ions of m/z 138, intact precursor ions remaining afterMS/MS [Figure 6b]; ions of m/z 121, which correspond to theloss of NH3 from the precursor ion [Figure 6c]; and ions of m/z103, produced from the loss of NH3 and H2O from the 4-ABAprecursor ions [Figure 6d].In contrast, O-protonated 4-ABA demonstrated much differ-
ent DMS mobility behavior. For example, the dispersion plot for4-ABA ions that fragment via loss of H2O to form ions ofm/z 120[Figure 6e] show similar curvature as the dispersion plot for4-ABA ions that fragment to form ions of m/z 92 (loss of H2Oand CO) [Figure 6f]. In the analysis of the MS/MS spectra (videsupra), these fragment ions were associated with the 4-ABA ionstransmitted at CV = −1.5 V, O-protonated 4-ABA. These ionsshow an initial shift toward negative CV values with increasingSV and then curve back to more positive CV values.We postulate that the differences in DMS mobility behavior
can be associated with the structures of the two protonated 4-ABA molecules. The dispersion plots presented in Figure 6b,c,ddisplay the behavior of ions exhibiting Type A behavior,7,10
wherein the optimal CV becomes more negative with everincreasing SV. Conversely, the dispersion plots in Figure 6e,fdemonstrate Type B behavior, where the optimal CV initially
trends toward negative CV values for increasing SV, but ulti-mately shifts more positive with increasing SV. The Type Abehavior is associated with N-protonated 4-ABA [Figure 6g],which has no resonance stabilization of the positive chargeby the rest of the molecule. The calculated dipole momentfor this ion (13.07 D) is a result of the charge localization onthe protonated amino group. Conversely, the calculatedstructure for O-protonated 4-ABA [Figure 6h] revealed aresonance-stabilized structure involving the aromatic ring andthe amino group. Accordingly, the calculated dipole momentof O-protonated 4-ABA is much smaller (1.47 D) than theN-protonated analogue.We propose that, when the positive charge is localized at the
amino group (N-protonated), the clustering of residual ESIsolvent and/or ambient N2 gas molecules occurs mainly at thecharged ammonium group. The stronger dipole moment forN-protonated 4-ABA is expected to provide more of apolarization effect to the transport gas, promoting clusteringbetween the ion and the background gas. Clustering suppressesthe low-field mobility for these ions and leads to Type A behaviordue to the dynamic clustering/declustering of these species.15
For O-protonated 4-ABA, its resonance-stabilized structureleads to a smaller calculated dipole moment, which we post-ulate reduces the clustering interactions of the ion with thetransport gas within the DMS cell. With increasing SV (i.e.,where the high-field mobility regime dominates), the behaviorof these ions exhibits more “hard sphere” characteristics asthe clustering interactions with solvent and background gasplay a much reduced role, hence the observed Type B characterfor this ion.
Figure 5. (a) DMS ionogram obtained before and after an HDX experiment on protonated 4-ABA formed by ESI(+); (b) ESI-MS recorded withCV = −7.5 V before (pink) and after (blue) HDX; (c) ESI-MS recorded with CV = −1.5 V before (pink) and after (blue) HDX.
Analytical Chemistry Article
dx.doi.org/10.1021/ac301529w | Anal. Chem. 2012, 84, 7857−78647862
■ CONCLUSIONSBy combining the results of various MS-based experiments alongwith computational theory, we have demonstrated that two ionsdiffering by only their sites of protonation can be separated usingDMS. The evidence for this capability derives from: (1) the presenceof distinct peaks in the DMS ionogram, (2) the observed effects
resulting fromaltering theESI(+) solvent system, (3) the observationof distinct MS/MS fragmentation patterns for the two DMS-separated ions, (4) the unique HDX behavior for these ions, and (5)the fundamental behavior of these two ions within the DMS cell.In addition to the capabilities of the DMS instrumentation
outlined here, another ionmobility technique (traveling wave ion
Figure 6. (a) Ionogram recorded with SV = +3500 V showing the optimal separation of the two 4-ABA ions; (b−f) Dispersion plots collected for the4-ABA ions, displaying two distinct SV vs CV patterns for the N- and O-protonated 4-ABA species. Calculated structures of the (g) N-protonated and(h) O-protonated forms of 4-ABA, with the calculated dipole moments for each ion.
Analytical Chemistry Article
dx.doi.org/10.1021/ac301529w | Anal. Chem. 2012, 84, 7857−78647863
mobility spectrometry or TWIMS) has recently been employedto separate ions based upon their sites of protonation30a using anunconventional polar carrier gas (i.e., carbon dioxide) in theTWIMS cell. Interestingly, this study provided more conclusiveseparation and identification for two forms of protonated anilinethan an earlier drift-time IMS study30b had provided.The data presented here also highlight the importance for
understanding the potential influence of somewhat subtle effects(i.e., ESI solvents, sites of protonation, etc.) on the outcomes ofDMS analyses. However, once an understanding of such effectshas been acquired, these factors can be exploited to promotebetter S/N though selective manipulation of the optimal DMSvoltage settings. For example, if chemical noise consisting of ionsisobaric to protonated 4-ABA were present at CV = −1.5 V, theESI(+) solvent conditions could be modified (e.g., greater per-centage of ACN) to promote formation of N-protonated 4-ABA,with optimal DMS transmission at CV = −7.5 V instead.With this in mind, future research will examine the DMS
behavior of other ions that can protonate or deprotonate at dif-ferent and/or multiple sites. Some research has shown thatfragmentation patterns for peptides and proteins and even drugmolecules31 can be influenced by the site of protonation. Aswell, sites of deprotonation for acidic species [e.g., deprotonatedtyrosine,3,5 4-hydroxybenzoic acid4] will be examined for thepotential role of solvent systems in the ESI-DMS behaviors ofthese ions.
■ ASSOCIATED CONTENT*S Supporting InformationAdditional information as noted in text. This material is availablefree of charge via the Internet at http://pubs.acs.org.
■ AUTHOR INFORMATIONCorresponding Author*E-mail: [email protected].
NotesThe authors declare no competing financial interest.
■ ACKNOWLEDGMENTSWe thank Drs. Rob Nieckarz, Tom Covey, Ron Bonner, SteveTate, and David Cox of AB SCIEX for invaluable insights and Dr.Howard Hunter of York University’s NMR facility for sampleanalysis and helpful discussions.
■ REFERENCES(1) Tian, Z.; Kass, S. R. Angew. Chem., Int. Ed. 2009, 48, 1321−1323.(2) Schmidt, J.; Meyer, M. M.; Spector, I.; Kass, S. R. J. Phys. Chem. A.2011, 115, 7625−7632.(3) Oomens, J.; Steill, J. D.; Redlich, B. J. Am. Soc. Chem. 2009, 131,4310−4319.(4) Steill, J. D.; Oomens, J. J. Am. Chem. Soc. 2009, 131, 13570−13571.(5) Tian, Z.; Kass, S. R. J. Am. Chem. Soc. 2008, 130, 10842−10843.(6) Tian, Z.; Wang, X.-B.; Wang, L.-S.; Kass, S. R. J. Am. Chem. Soc.2009, 131, 1174−1181.(7) Purves, R. W.; Guevremont, R. Anal. Chem. 1999, 71, 2346−2357.(8) Barnett, D. A.; Ells, B.; Guevremont, R.; Purves, R. W. J. Am. Soc.Mass Spectrom. 1999, 10, 1279−1284.(9) Blagojevic, V.; Chramow, A.; Schneider, B. B.; Covey, T. R.;Bohme, D. K. Anal. Chem. 2011, 83, 3470−3476.(10) Schneider, B. B.; Covey, T. R.; Coy, S. L.; Krylov, E. V.; Nazarov,E. G. Int. J. Mass Spectrom. 2010, 298, 45−54.(11) Shvartsburg, A. A.; Clemmer, D. E.; Smith, R. D. Anal. Chem.2010, 82, 8047−8051.
(12) Guna, M.; Biesenthal, T. A. J. Am. Soc. Mass Spectrom. 2009, 20,1132−1140.(13) Collings, B. A.; Romaschin, M. A. J. Am. Soc. Mass Spectrom. 2009,20, 1714−1717.(14) Eiceman, G.; Karpas, Z. Ion Mobility Spectrometry, 2nd ed.; CRCPress: Boca Raton, FL, 2005.(15) Krylov, E. V.; Nazarov, E. G.; Miller, R. A. Int. J. Mass Spectrom.2007, 226, 76−85.(16) Shvartsburg, A. A.Differential Ion Mobility Spectrometry: NonlinearIon Transport and Fundamentals of FAIMS; CRC Press: Boca Raton, FL,2009.(17) Krylov, E. V.; Coy, S. L.; Vandermey, J.; Schneider, B. B.; Covey,T. R.; Nazarov, E. G. Rev. Sci. Instrum. 2010, 81, 024101.(18) Levin, D. S.; Miller, R. A.; Nazarov, E. G.; Vouros, P. Anal. Chem.2006, 78, 5443−5452.(19) Hager, J. W.; Le Blanc, J. C. Y. Rapid Commun. Mass Spectrom.2003, 17, 1056−1064.(20) Londry, F. A.; Hager, J. W. J. Am. Soc. Mass Spectrom. 2003, 14,1130−1147.(21) Frisch, M. J.; Trucks, G. W.; Schlegel, H. B.; Scuseria, G. E.; Robb,M. A.; Cheeseman, J. R.; Scalmani, G.; Barone, V.; Mennucci, B.;Petersson, G. A.; Nakatsuji, H.; Caricato, M.; Li, X.; Hratchian, H. P.;Izmaylov, A. F.; Bloino, J.; Zheng, G.; Sonnenberg, J. L.; Hada, M.;Ehara, M.; Toyota, K.; Fukuda, R.; Hasegawa, J.; Ishida, M.; Nakajima,T.; Honda, Y.; Kitao, O.; Nakai, H.; Vreven, T.; Montgomery, J. A., Jr.;Peralta, J. E.; Ogliaro, F.; Bearpark, M.; Heyd, J. J.; Brothers, E.; Kudin,K. N.; Staroverov, V. N.; Kobayashi, R.; Normand, J.; Raghavachari, K.;Rendell, A.; Burant, J. C.; Iyengar, S. S.; Tomasi, J.; Cossi, M.; Rega, N.;Millam, N. J.; Klene, M.; Knox, J. E.; Cross, J. B.; Bakken, V.; Adamo, C.;Jaramillo, J.; Gomperts, R.; Stratmann, R. E.; Yazyev, O.; Austin, A. J.;Cammi, R.; Pomelli, C.; Ochterski, J. W.; Martin, R. L.; Morokuma, K.;Zakrzewski, V. G.; Voth, G. A.; Salvador, P.; Dannenberg, J. J.; Dapprich,S.; Daniels, A. D.; Farkas, O.; Foresman, J. B.; Ortiz, J. V.; Cioslowski, J.;Fox, D. J. Gaussian 09, Revision A.1; Gaussian, Inc., Wallingford CT,2009.(22) Becke, A. D. J. Chem. Phys. 1993, 98, 5648−5652.(23) Lee, C.; Yang, W.; Parr, R. G. Phys. Rev. B 1988, 37, 785−789.(24) Stephens, P. J.; Devlin, F. J.; Chabalowski, C. F.; Frisch, M. J. J.Phys. Chem. 1994, 98, 11623−11627.(25) Vosko, S. H.; Wilk, L.; Nusair, M. Can. J. Phys. 1980, 58, 1200−1211.(26) Kendall, R. A.; Dunning, T. H., Jr.; Harrison, R. J. J. Chem. Phys.1992, 96, 6796−6806.(27) Takats, Z.; Schlosser, G.; Vekey, K. Int. J. Mass Spectrom. 2003,228, 729−741.(28) Schneider, B. B.; Covey, T. R.; Coy, S. L.; Krylov, E. V.; Nazarov,E. G. Eur. J. Mass Spectrom. 2010, 16, 57−71.(29) Schneider, B. B.; Covey, T. R.; Coy, S. L.; Krylov, E. V.; Nazarov,E. G. Anal. Chem. 2010, 82, 1867−1880.(30) (a) Lalli, P. M.; Iglesias, B. A.; Toma, H. E.; de Sa, G. F.; Daroda,R. J.; Silva Filho, J. C.; Szulejko, J. E.; Araki, K.; Eberlin, M. N. J. MassSpectrom. 2012, 47, 712−719. (b) Karpas, Z.; Berant, Z.; Stimac, R. M.Struct. Chem. 1990, 1, 201.(31) Joyce, J. R.; Richards, D. S. J. Am. Soc. Mass Spectrom. 2011, 22,360−368.
Analytical Chemistry Article
dx.doi.org/10.1021/ac301529w | Anal. Chem. 2012, 84, 7857−78647864