Embed Size (px)
Citation preview
Malaysian Journal of Medicine and Health Sciences Vol.16 Supp 13 , Dec 2020 (eISSN 2636-9346)
Proceedings of the 1st IPB International Conference on Nutrition and Food 18-19 Nov 2020
Proceedings of the 1st IPB International Conference on Nutrition and Food 2020
(1st IPB ICNF 2020)
Nutrition and Food Innovation for Better Life
Held at the Department of Community Nutrition, Faculty of Human Ecology, IPB University,
Bogor, West Java, Indonesia
On 18 – 19 November 2020
Proceedings of the 1st IPB International Conference on Nutrition and Food 18-19 Nov 2020i
Malaysian Journal of Medicine and Health Sciences Vol.16 Supp 13 , Dec 2020 (eISSN 2636-9346)
Editorial Information
Scientific Committee/Extended Abstract Reviewers & Editors Prof. Dr. Ir. Ali Khomsan, MS (Head of Scientific Committee)Prof. Dr. Ir. Sri Anna Marliyati, M.SiProf. Dr. Ir. Dodik Briawan, MCN Dr. Rimbawan Rimbawan Dr. Ir. Cesilia Meti Dwiriani, M.Sc Dr. Ir. Budi Setiawan, MS Dr. dr. Mira Dewi, M.Si Dr. agr Eny Palupi, STP, M.Sc Dr. Zuraidah Nasution, STP, M.Sc dr. Karina Rahmadia Ekawidyani, M.Gizi Anna Vipta Resti Mauludyani, SP, M.Gizi
Proceedings of the 1st IPB International Conference on Nutrition and Food 18-19 Nov 2020 ii
Malaysian Journal of Medicine and Health Sciences Vol.16 Supp 13 , Dec 2020 (eISSN 2636-9346)
Editorial Message from the Head of Scientific Committee
Welcome to the Proceedings of the 1st IPB International Conference on Nutrition and Food 2020 (1st IPB ICNF 2020) that is published by the Malaysian Journal of Medicine and Health Sciences. Amidst the current global pandemic situation, the conference was successfully organized fully online by the Department of Community Nutrition, Faculty of Human Ecology, IPB University, Bogor, Indonesia on 18 – 19 November 2020.
This conference was aimed to be a platform where academia, researchers, private sectors and general audience could get update on latest issues in nutrition and food. Recognizing the importance of promoting research and innovation in nutrition and food, we have chosen to focus on Nutrition and Food Innovation for Better Life as the theme of the conference this year. The conference speakers, oral presenters, poster presenters and participants of this conference came from a variety of countries, such as Australia, Bangladesh, India, Japan, the Philippines, Thailand, UK and USA.
On behalf of the scientific committee of ICNF 2020, I would like to congratulate all participants who submitted their research papers to the conference and 61 of them are featured in this issue. The articles covered three main areas: clinical nutrition, community nutrition, and food innovation. Each of those articles underwent three cycles of thorough review by two reviewers, to ensure their academic merit and quality. The significance of the research presented in this conference represents the importance of nutrition and food in improving our quality of life.I would like to thank the organizing committee of the ICNF 2020 and all their supporting partners for ensuring the success of the conference. Finally, I hope that these proceedings serve the need for high quality research articles in the area of nutrition and food.
Head of scientific committee of the 1st IPB ICNF 2020,
Prof. Dr. Ir. Ali Khomsan, MS
iii
Malaysian Journal of Medicine and Health Sciences Vol.16 Supp 13 , Dec 2020 (eISSN 2636-9346)
Proceedings of the 1st IPB International Conference on Nutrition and Food 18-19 Nov 2020
1st IPB International Conference on Nutrition and Food 2020Extended Abstract Title Page
Clinical NutritionThe Effect of Monday-Thursday Fasting on Body Weight and Body Fat Percentage among Overweight and Obese MenS. Sobariah & S. A. Marliyati
1
Effect of Brewing Temperature Variation on the Glycemic Control Capacity of Moringa Oleifera DrinksR. Prasetya, R. Rimbawan, & N. M. Nurdin
3
The Effect of Different Methods of Rice Consumption on Eating Rate, Glycemic Response, and Glycemic Index of Healthy AdultsR. Rimbawan & Y. G. Sari
5
Observational Study of Diet on the Burn Patients at Cipto Mangunkusumo Hospital JakartaM. Srimiati, C. M. Kusharto, F. Anwar, H. Rachmawati, M. Dewi, A. Wardhana, M. Aitonam, Kartini, U. Y. Ningrum, & N. A. Shofiyyatunnisaak
7
The Effect of Chicken Essense on Lactation and Recovery from Fatigue: A Meta-AnalysisE. Puspasari, E. Palupi, F. H. Pasaribu, A. Apriantini, & A. Sulaeman
9
The Effect of Ethanolic Cajanus cajan Leaves and Zingiber officinale Extracts on Spermatogenic Cells, Interstitial Cells and Superoxide Dismutase in Testicular Tissues of Experimental Diabetic RatsT. Wresdiyati, A.Mayangfauni, S. Sa’diah, & M. Astawan
11
In Vitro and In Vivo Hypoglycaemic Activity Test of Indonesian Cajanus cajan Leaves and Zingiber officinale ExtractsT. Wresdiyati, D. C. Iskandar, S. Sa’diah, & M. Astawan
13
Community NutritionCarbohydrate Intake as a Dominant Factor of Underweight among Toddlers in Bogor District, IndonesiaC. S. Nasrianti & T. Sudiarti
15
Consumers and Food Manufacturers Preferences for Front-of-Pack Nutrition Labelling in IndonesiaRimbawan, Z. Nasution, A. V. R. Mauludyani, M. Aries, Y. Egayanti, & S. E. Irianto
17
The Effect of Interactive Nutrition Education on Knowledge, Attitude, and Practice of Primary School Children in Sub-Urban IndonesiaM. Aries, H. F. Navratilova, K. Anwar, & Hardinsyah
19
Nutritional Status of Children Given Freshwater Fish Intervention S. Widayani & B. Triatma
21
Economic Status, Stunting and Diet Quality as Important Determinants of Anaemia among Indonesian Children aged 6-35 Months Old: A SEANUTS StudyF. Ernawati, Y. Octaria, & Y. Widodo
23
Exclusive Breastfeeding for Preventing the Occurrence of Wasting among Under-Five Children in Guntung Payung, Banjar-baru M. I. Setiawan, Husaini, F. Yulidasari, L. Anggraini, A. O. Putri, N. Laily, M. S. Noor, F. Rahman, V.Y. Anhar, A. Wulandari, A. R. Sari, & D. Rosadi
25
Relationship between Breakfast Types and Blood Glucose Level and Short-Term Memory of Elementary School Children in Bogor, Indonesia L. Kustiyah, C. Carissa, & F. Anwar
27
Determinants of Stunting in 6 – 59 Months Old Children from Rural Agricultural Households in Cianjur, Indonesia Y. Octaria, F. Ernawati, A. Khomsan, & Z. Wardani
29
Risk Factors of Stunting among 24-59-Months-Old Children in the Work Area of Bakarangan Public Health Center, Tapin DistrictF. Yulidasari, L. Anggraini, M. S. Noor, F. Rahman, A. Rahayu, A. O. Putri, N. Laily, A. R. Sari, V. Y. Anhar, & D. Rosadi
31
Online Food Delivery and Food Consumption Quality among Students of SMA Negeri 2 Yogyakarta Indonesia A. S. H. Rubby & D. Briawan
33
Facilitators and Barriers to Sunnah Eating Practices among Overweight Middle-aged Muslim Women N. A. Ismail & N. I. M. F. Teng
35
Dietary Quality in Indonesian Adults with and without Type 2 Diabetes Mellitus using Healthy Eating Index. N. Husnul, D. Briawan, I. Tanziha, & Sudikno
37
Diet Quality among Postgraduate Students with Obese and Normal Nutritional Status at IPB University, Bogor, Indonesia N. Hikmawaty, D. Briawan, & T. Sinaga
39
The Diversity of Indigenous Staple Foods from Palembang, South Sumatera, Indonesia and Their Potentials to Support Food Security N. S. Nilawati, I. Tanziha, D. Sukandar, & E. Palupi
41
Physical Activity, Daily Steps, Sleep Duration and Sleep Quality in Overweight and Obese WomenI. Harun, H. Riyadi, D. Briawan, & A. Khomsan
43
iv
Malaysian Journal of Medicine and Health Sciences Vol.16 Supp 13 , Dec 2020 (eISSN 2636-9346)
Proceedings of the 1st IPB International Conference on Nutrition and Food 18-19 Nov 2020
1st IPB International Conference on Nutrition and Food 2020Extended Abstract Title PageEating Behaviour and Physical Activity among Female Workers with Metabolic Syndrome: A Qualitative StudyF. Nailufar, A. Khomsan, Y. F. Baliwati, & H. Riyadi
45
An Overview of the Adolescents Nutrition Status in Samarinda, East KalimantanI. Kamaruddin, F. Anwar, L. Kustiyah, & H. Riyadi
47
Nutrition Education: Media Development and Nutrition Knowledge of Prospective Brides to Prevent Stunting on Newborn. G. A. D. Pramoni, I. Tanziha, D. Briawan, & A. Khomsan
49
Maternal Parity and Height as Determinants of Stunting for Infants 0-6 Months InfantsP. R. Alamsyah, D. Briawan, M. Dewi, & Y. Widodo
51
Could Food Diary Intervention Improve School Children’s Eating Habit? H. F. Navratilova, L. Kustiyah, & S. W. Utami
53
Sensitivity and Specificity of Food Consumption Score in Predicting Hypertension among Lacto-vegetarian and Non-vege-tarian Women of BaliW. Astuti, H. Riyadi, F. Anwar, & N. K. Sutiari
55
Relationship between Pre-pregnancy BMI with MUAC and Haemoglobin Level in PregnancyD. F. Christianti, R. Diana, C. M. Dwiriani, & F. Anwar
57
Determinants of Double Burden of Undernutrition among Women of Reproductive Age in IndonesiaA. V. R. Mauludyani & D. Briawan
59
The Impact of School Lunch Project and Nutrition Education about Nutritional Status, Knowledge, Attitude, and Practice on the Nutrition and Health of Adolescents in Islamic Boarding SchoolR. Nurdiani & P. H. Rachman
61
Knowledge, Attitudes, Vegetables and Fruit Consumption and Nutrition Status among SchoolchildrenSyahbuddin, D. Briawan, D. Martianto, & D. P. Lubis
63
Body Composition and Anaemia Status of Adolescent Girls in West Java, IndonesiaM. Oktaviana, M. Dewi, & C. M. Dwiriani
65
Potential Losses of Inadequate Soybean Supply in Indonesia: Protein Adequacy, Revenue and ManpowerA. V. R. Mauludyani, D. Martianto, & L. A. A. Wiradnyani
67
Diet Quality of Junior High School Students in Bogor, IndonesiaL. Devie & C. M. Dwiriani
69
Identification of Balanced Nutrition in Indonesia Elementary School CurriculumN. I. Sofianita, A. Khomsan, B. Setiawan, & I. Ekayanti
71
Anemia, Stunting, and Wasting in School-age Children: A Crosssectional Study in Pidie District, Aceh IndonesiaA. Ahmad, Ridwandi, Mutiawati, & Syahbuddin
73
Nutrition Training Courses of Post-Disaster Recovery at Sembalun Bumbung Village, West Nusa Tenggara ProvinceD. E. Andayani, O. L. Sari, N. Hanisa, E. Prafiantini, W. Sinaga, L. I. Octovia, F. Muda, & M. D. Rahayu
75
Association of Breastfeeding Self-Efficacy and Maternal Obesity in Kuala Selangor District, Malaysia: A Cross SectionalS. N. S. M. Azmi & S. B. A. Hamid
77
Food InnovationProduction of Wholemeal Bread from Banana Peel Flour: Improvement of Sensory CharacteristicsM. Azmi, Z. Nasution, & A. Yusof
79
Increased Fibre Content in Frozen Par-Baked Chapatti with Incorporation of Okara FlourZ. Nasution, K. R. Subramaniam, & Y. Hamzah
81
The Microbiological Safety of Instant Pumpkin and Tempeh Cream Soup Formulated as Geriatric FoodS. S. Aulia, B. Setiawan, A. Sulaeman, & C. M. Kusharto
83
Proximate Composition and Sensory Characteristics of Milkfish (Chanos chanos) Snack BarI. Christina, K. Lewerissa, M. Hulu, & S. Suprapti
85
Development of Instant Pumpkin (Cucurbita moschata) Soup as a Potential Source of β-Carotene for the ElderlyW. S. Irwan, B. Setiawan, & A. Sulaeman
87
Powdered Drink from Mixture of Coconut Water and Flesh: a Potential Beverage Formulation with Increased FibreJ. M. Azra, B. Setiawan, Z. Nasution, & A. Sulaeman
89
v
Malaysian Journal of Medicine and Health Sciences Vol.15 Supp 1, July 2019 (eISSN 2636-9346)
Proceedings of the 1st IPB International Conference on Nutrition and Food 18-19 Nov 2020
1st IPB International Conference on Nutrition and Food 2020Extended Abstract Title PageThe Use of Germinated Soybean as Tempe Ingredient during Extended Fermentation Time: Its Hypoglycaemic ComponentZ. Abdurrasyid, M. Astawan, H. N. Lioe, & T. Wresdiyati
91
Pempek Made from Javanese Bird Grasshopper (Valanga nigricornis) as an Innovative Food Product: Nutritional and Ac-ceptability AssessmentsS. P. Lirizka, F. Anwar, & E. Palupi
93
Indigenous Black Soybean (Glycine soja L. merrit) Tempeh Nugget as Plant-Based Protein SourceA.T. Nurrahmi & E. Palupi
95
Development of Roll Cake from Rice-bran Flour Mixed with Taro Flour and Breadfruit Flour Purposed for the Elderly A. Irfani, A. Sulaeman, & U. F. Rokhmah
97
Amino Acids, Calcium, and Zinc Contents of Spray-dried Balinese Cow Bone Marrow Encapsulated with Maltodextrin, Ar-abic Gum, and Milk PowderU. F. Rokhmah, A. Sulaeman, & I. Ekayanti
99
Nutritional Profile of Lamtoro Seed (Leucaena leucocephala) and Its Fermented Product (Mlanding Tempeh)R. Dzulhijjah, B. Setiawan, & E. Palupi
101
Formulation of Liquid Breakfast from Campolay Fruit with Mung Bean and White Rice Flour as Supplementary Food for School ChildrenB. Setiawan & M. Kurniawati
103
Cookies and Beverage from Tempeh: Potential Nutritive Supplementary Products for Pregnant WomenL. Kustiyah, M. Dewi, C. M. Dwiriani, & E. Damayanthi
105
Cookies from Tempeh Semangit as Indigenous High Protein Supplemental Food for Pregnant WomenN. Kusumawaty, A. Sulaeman, S. A.Marliyati, & N. Laily
107
Antioxidant Activity in Ready-to-Drink Beverage Made from Snake Fruit (Salacca edulis Reinw) Enriched with Butterfly Pea (Clitoria ternatea) and Roselle (Hibiscus sabdariffa) Flower ExtractsH. A. Purnawijayanti & H. M. E. Nai
109
Development of Fibre Snack Bar for Obese Teenagers Using Lesser Yam (Dioscorea esculenta)F. S. Khairani & A. Q. Marjan
111
Improving the Quality of Chicken Sausage by Using Germinated Soybean Tempe Protein IsolateA. P-G Prayudani, E. Syamsir, & M. Astawan
113
Reduced-Sugar ‘Serikaya’ as Potential Sweet Spread for Diabetic PatientsY. Hamzah, M. A. Ghani, Z. Nasution, & S. N. A. Jaafar
115
Meta-Analysis on Edible Larva as a Future Protein Source for Human: Do They have Comparable Nutritional Quality with Red Meat? E. Palupi, B.Setiawan, A. Sulaeman, A. Khomsan, & A. Ploeger
117
Potentials of Ozone Pre-treatment in Prolonging the Freshness of Oyster Mushrooms (Pleurotus Florida)S. M. Anjaly, A. C. Khanashyam, B. V. S. Balasubrahmanyam, & B. K. Yadav
119
The Effect of Blanching and Drying on Retention of Ascorbic Acid in Indian Gooseberry (Phyllanthus emblica) Candy. D. K. Yadav, A. C. Khanashyam, D. D. Wadikar, P. E. Patki, & A. D. Semwal
121
Proceedings of the 1st IPB International Conference on Nutrition and Food 2020 1
Malaysian Journal of Medicine and Health Sciences Vol.16 Supp 13, Dec 2020 (eISSN 2636-9346)
EXTENDED ABSTRACT
The Effect of Monday and Thursday Fasting on Body Weight and Body Fat Percentage among Overweight and Obese MenSalma Sobariah1 and Sri Anna Marliyati2
1 Undergraduate Program in Nutrition Science, IPB University, Bogor, Indonesia2 Department of Community Nutrition, Faculty of Human Ecology, IPB University, Bogor, Indonesia
Corresponding author’s email: [email protected]
SUMMARY
The purpose of this study was to analyze the effect of Monday and Thursday fasting on body weight and fat percent-age among overweight and obese men. Twenty subjects aged 19-29 years living in Bogor district were divided into 2 groups. The intervention group followed a 12-week Monday and Thursday fasting while the control group did none. The paired T-test and Mann Whitney test were used to analyze the data. The results indicated that after 12 weeks of Monday and Thursday fasting, the body weight, BMI, body fat percentage, and visceral fat of both groups were not significantly different with the baseline data and from each other.
Keywords: Body fat percentage, Body weight, Monday-thursday fasting, Obese, Overweight
INTRODUCTION
Obesity is a growing nutritional problem in the world with 39% of men and women in the world having excess weight (1). This problem also occurs in Indonesia Data of the Ministry of Health show that 35.4% of the population suffer from either obese or overweight (2). Monday and Thursday fasting are commonly practiced by Muslim community. They are one type of intermittent fasting (IF) that may regulate energy intake. The latest meta-analysis results showed that restriction during IF reduced energy intake by 70-75% on fasting day and fasting for the period 3-12 months was effective for weight loss in overweight and obesity cases (3). IF also affects other anthropometry indicators such as waist circumference, body fat mass and lean body mass (4). With 87.2% of Indonesian identified themselves as Muslims, this study aims to analyze the effect of Monday and Thursday fasting on weight loss and body fat in Indonesian overweight and obese adult men.
MATERIALS AND METHODS
This quasi-experimental study was conducted in Bogor district, Indonesia. The subjects were selected using convenient sampling and divided into 2 groups, control and intervention group. The Intervention Group did Monday and Thursday fasting for 12 weeks while the control group did nothing. The total subjects who participated were 20, with 10 subjects in each group. The inclusion criteria were males aged 19-29 years, BMI ≥ 25.0 kg/m2, not suffering from diseases that affect body weight (e.g. cancer, hypothyroid, diabetes mellitus), and
willing to participate in the research. The data collected were the subjects’ characteristics, food consumption and physical activity as well as baseline and end line measurement of body weight, total fat percentage, and visceral fat. The food consumption and physical activity data were collected by recall, while body weight, total fat percentage and visceral fat data were collected using Bioelectrical Impedance Analysis. Data were tested using Mann Whitney tests, and paired T-tests.
RESULTS AND DISCUSSION
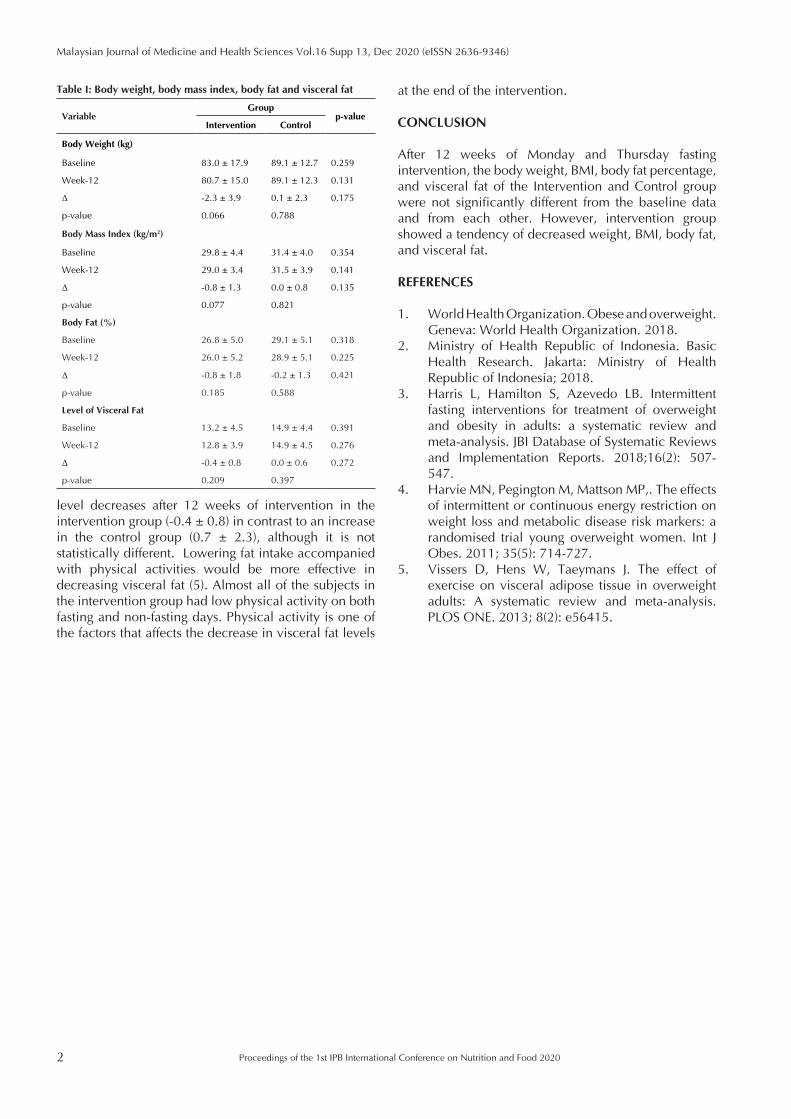
Table I shows that subjects in the intervention group tend to experience weight loss (- 2.3 kg), but it was not significantly different from that of the subjects in the control group (p > 0.05). A similar trend in the body mass index (BMI) was found, in which the intervention group also experienced a decline. However, the difference was not significant compared to the control group (p > 0.05).
The subjects in the intervention group fulfilled only around 60% of their energy adequacy level on their fasting days. Meanwhile, the control group had the same energy and macronutrient intake on fasting and non-fasting days, making its BMI scores remain stable until the 12th week of intervention.
Table I also shows that the percentage of body fat in the intervention group was not significantly different from that of the control group. However, the tendency of decline in body fat percentage after 12 weeks was greater in the intervention group. Furthermore, the data also show that there is a tendency that the visceral fat
2
Malaysian Journal of Medicine and Health Sciences Vol.16 Supp 13, Dec 2020 (eISSN 2636-9346)
Proceedings of the 1st IPB International Conference on Nutrition and Food 2020
level decreases after 12 weeks of intervention in the intervention group (-0.4 ± 0.8) in contrast to an increase in the control group (0.7 ± 2.3), although it is not statistically different. Lowering fat intake accompanied with physical activities would be more effective in decreasing visceral fat (5). Almost all of the subjects in the intervention group had low physical activity on both fasting and non-fasting days. Physical activity is one of the factors that affects the decrease in visceral fat levels
at the end of the intervention.
CONCLUSION
After 12 weeks of Monday and Thursday fasting intervention, the body weight, BMI, body fat percentage, and visceral fat of the Intervention and Control group were not significantly different from the baseline data and from each other. However, intervention group showed a tendency of decreased weight, BMI, body fat, and visceral fat.
REFERENCES
1. World Health Organization. Obese and overweight. Geneva: World Health Organization. 2018.
2. Ministry of Health Republic of Indonesia. Basic Health Research. Jakarta: Ministry of Health Republic of Indonesia; 2018.
3. Harris L, Hamilton S, Azevedo LB. Intermittent fasting interventions for treatment of overweight and obesity in adults: a systematic review and meta-analysis. JBI Database of Systematic Reviews and Implementation Reports. 2018;16(2): 507-547.
4. Harvie MN, Pegington M, Mattson MP,. The effects of intermittent or continuous energy restriction on weight loss and metabolic disease risk markers: a randomised trial young overweight women. Int J Obes. 2011; 35(5): 714-727.
5. Vissers D, Hens W, Taeymans J. The effect of exercise on visceral adipose tissue in overweight adults: A systematic review and meta-analysis. PLOS ONE. 2013; 8(2): e56415.
Table I: Body weight, body mass index, body fat and visceral fat
VariableGroup
p-valueIntervention Control
Body Weight (kg)
Baseline 83.0 ± 17.9 89.1 ± 12.7 0.259
Week-12 80.7 ± 15.0 89.1 ± 12.3 0.131
Δ -2.3 ± 3.9 0.1 ± 2.3 0.175
p-value 0.066 0.788
Body Mass Index (kg/m2)
Baseline 29.8 ± 4.4 31.4 ± 4.0 0.354
Week-12 29.0 ± 3.4 31.5 ± 3.9 0.141
Δ -0.8 ± 1.3 0.0 ± 0.8 0.135
p-value 0.077 0.821
Body Fat (%)
Baseline 26.8 ± 5.0 29.1 ± 5.1 0.318
Week-12 26.0 ± 5.2 28.9 ± 5.1 0.225
Δ Δ -0.8 ± 1.8 -0.2 ± 1.3 0.421
p-value 0.185 0.588
Level of Visceral Fat
Baseline 13.2 ± 4.5 14.9 ± 4.4 0.391
Week-12 12.8 ± 3.9 14.9 ± 4.5 0.276
Δ -0.4 ± 0.8 0.0 ± 0.6 0.272
p-value 0.209 0.397
Proceedings of the 1st IPB International Conference on Nutrition and Food 2020 3
Malaysian Journal of Medicine and Health Sciences Vol.16 Supp 13, Dec 2020 (eISSN 2636-9346)
EXTENDED ABSTRACT
The Effect of Brewing Temperature Variation on the Glycemic Control Capacity of Moringa oleifera Drinks Randy Prasetya1, Rimbawan Rimbawan2, Naufal Muharam Nurdin2
1 Natuna Regional Public Hospital, Natuna District, Riau Islands Province, Indonesia2 Department of Community Nutrition, IPB University, Bogor 16680, Indonesia
Corresponding author’s email: [email protected]
SUMMARY
Moringa oleifera leaves contain Epigallocatechin gallate (EGCG), which is potential for controlling blood glucose. The research aims to analyze the effect of Moringa oleifera leaves brewing temperature on healthy adults’ glycemic control capacity. Ten subjects consumed anhydrous glucose diluted in 200 ml water, and 3-gram moringa leaves diluted in 200 ml water according to various brewing temperatures (26oC, 70oC, and 90oC). The glycemic control capacity observed include the Oral Glucose Tolerance Test (OGTT) and Glucose Score (GS). This study showed that groups treated with moringa leaves brewed at 70oC and 90oC had lower glucose score than did the control and when brewed at 26oC.
Keywords: Brewing temperature, Glucose score, Glycemic response, Moringa oleifera
INTRODUCTION
Controlling blood glucose levels is essential for preventing and treating non-communicable diseases like diabetes mellitus. Drinking tea and leave-based drinks after eating has become a culture in many countries. Previous studies showed that drinking brewed tea reduces glycemic responses (1) due to polyphenol content, mainly EGCG in tea leaves, dissolved in hot water. Polyphenol level that was dissolved in water is affected by brewing temperature. The optimal temperature for brewing is from 70 to 90oC (2). The EGCG contained in Moringa oleifera leaf extract has anti-hyperglycemic activity by inhibiting the α-glucosidase enzyme found in the brush border of the small intestine (3). Therefore, this study investigates the effect of brewing temperature variation on the glycemic control capacity of Moringa oleifera drinks.
MATERIALS AND METHODS
The study was conducted in Natuna Hospital, and it has been approved by the Human Research Ethics Committee of IPB University No. 085/IT3.KEPMSM-IPB/SK/2018. Moringa leaves were dried at 30-35oC for three days. Ten healthy adult subjects with normal BMI and fasting blood glucose were involved in four sessions with 1-week interval of OGTTs. First, 50 g glucose diluted in 200 mL water (control), and the next 3 sessions were glucose with 3 g moringa leaves brewed in 200 mL water for 5 minutes at 26oC (P1), 70oC (P2), and 90oC (P3). The drinks were consumed directly after
brewing for P1 and when the temperature reached 50oC for P2 and P3. Capillary blood glucose was measured by glucometer device (Easytouch GCU, Taiwan). The OGTT method used blood glucose level data at 0, 30, 60, 90, and 120 minutes. The GS was calculated using the Incremental Area Under Curve (IAUC) (4) obtained from subjects receiving P1, P2, or P3 divided by control (1).
RESULTS AND DISCUSSION
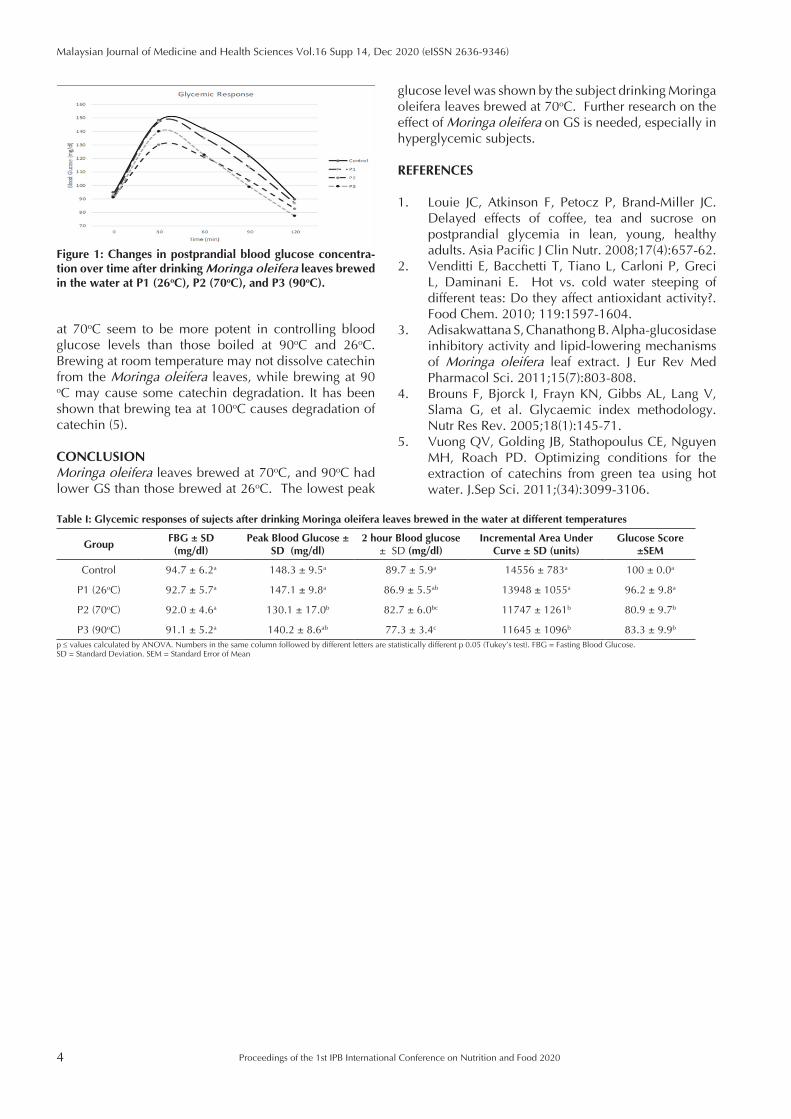
Figure 1 shows the increase of blood glucose level with 30 minutes interval. The increase of blood glucose level in the subjects who consumed moringa leaves brewed at 70oC (P2) and 90oC (P3) were lower than those at 26oC (P1) and control (p<0.05). At 30 minutes, all groups reached their maximum blood glucose level, but groups of P2 and P3 had significantly lower peak blood glucose levels than P1 and control. After 60 minutes, all blood glucose levels decreased, and the treatment of P3 has lowered blood glucose sharply. As shown in Table I, at 120 minutes, the blood glucose level of P3 was significantly lower than P1 and control. IAUC in P2 and P3 is significantly lower than control and P1. Groups with the treatment of moringa leave brewed in 70oC and 90oC have significantly smaller IAUC units than those in control and 26oC. P2 have 12.27±6.07% and P3 have 11.39±5.37% smaller IAUCs than the control. The lowest GS was obtained from P2 (80.9±9.7), followed by P3 (83.3±9.9) and P1 (96.2±9.8). The lowest peak glucose level was observed in P2. Results of this study show that Moringa oleifera leaves brewed in water
4
Malaysian Journal of Medicine and Health Sciences Vol.16 Supp 14, Dec 2020 (eISSN 2636-9346)
Proceedings of the 1st IPB International Conference on Nutrition and Food 2020
glucose level was shown by the subject drinking Moringa oleifera leaves brewed at 70oC. Further research on the effect of Moringa oleifera on GS is needed, especially in hyperglycemic subjects.
REFERENCES
1. Louie JC, Atkinson F, Petocz P, Brand-Miller JC. Delayed effects of coffee, tea and sucrose on postprandial glycemia in lean, young, healthy adults. Asia Pacific J Clin Nutr. 2008;17(4):657-62.
2. Venditti E, Bacchetti T, Tiano L, Carloni P, Greci L, Daminani E. Hot vs. cold water steeping of different teas: Do they affect antioxidant activity?. Food Chem. 2010; 119:1597-1604.
3. Adisakwattana S, Chanathong B. Alpha-glucosidase inhibitory activity and lipid-lowering mechanisms of Moringa oleifera leaf extract. J Eur Rev Med Pharmacol Sci. 2011;15(7):803-808.
4. Brouns F, Bjorck I, Frayn KN, Gibbs AL, Lang V, Slama G, et al. Glycaemic index methodology. Nutr Res Rev. 2005;18(1):145-71.
5. Vuong QV, Golding JB, Stathopoulus CE, Nguyen MH, Roach PD. Optimizing conditions for the extraction of catechins from green tea using hot water. J.Sep Sci. 2011;(34):3099-3106.
at 70oC seem to be more potent in controlling blood glucose levels than those boiled at 90oC and 26oC. Brewing at room temperature may not dissolve catechin from the Moringa oleifera leaves, while brewing at 90 oC may cause some catechin degradation. It has been shown that brewing tea at 100oC causes degradation of catechin (5).
CONCLUSIONMoringa oleifera leaves brewed at 70oC, and 90oC had lower GS than those brewed at 26oC. The lowest peak
Table I: Glycemic responses of sujects after drinking Moringa oleifera leaves brewed in the water at different temperatures
GroupFBG ± SD(mg/dl)
Peak Blood Glucose ± SD (mg/dl)
2 hour Blood glucose ± SD (mg/dl)
Incremental Area Under Curve ± SD (units)
Glucose Score ±SEM
Control 94.7 ± 6.2a 148.3 ± 9.5a 89.7 ± 5.9a 14556 ± 783a 100 ± 0.0a
P1 (26oC) 92.7 ± 5.7a 147.1 ± 9.8a 86.9 ± 5.5ab 13948 ± 1055a 96.2 ± 9.8a
P2 (70oC) 92.0 ± 4.6a 130.1 ± 17.0b 82.7 ± 6.0bc 11747 ± 1261b 80.9 ± 9.7b
P3 (90oC) 91.1 ± 5.2a 140.2 ± 8.6ab 77.3 ± 3.4c 11645 ± 1096b 83.3 ± 9.9b
p ≤ values calculated by ANOVA. Numbers in the same column followed by different letters are statistically different p 0.05 (Tukey’s test). FBG = Fasting Blood Glucose. SD = Standard Deviation. SEM = Standard Error of Mean
Figure 1: Changes in postprandial blood glucose concentra-tion over time after drinking Moringa oleifera leaves brewed in the water at P1 (26oC), P2 (70oC), and P3 (90oC).
Proceedings of the 1st IPB International Conference on Nutrition and Food 2020 5
Malaysian Journal of Medicine and Health Sciences Vol.16 Supp 13, Dec 2020 (eISSN 2636-9346)
EXTENDED ABSTRACT
The Effect of Different Methods of Rice Consumption on Eating Rate, Glycemic Response, and Glycemic Index of Healthy Adults Rimbawan Rimbawan1, Yeni Gustia Sari2
1 Department of Community Nutrition, IPB University, Bogor 16680 Indonesia2 Alumnus of Undergraduate Program in Nutrition Science, Department of Community Nutrition, IPB University, Bogor 16680
Indonesia
Corresponding author’s email: [email protected]
SUMMARY
Different chewing habits can affect postprandial blood glucose. This study assessed the effect of different methods of Japonica rice consumption (spoon, chopsticks, and fingers) on the eating rate (ER), glycemic response (GR), and the glycemic index (GI) of healthy adults. The ER was not significantly different between the different methods of consumption. The GR of consuming rice with chopsticks tended to be lower, but not significantly different compared to the spoon and fingers. There were no significant differences among the GI of rice eaten using chopsticks, spoon, and fingers, categorized as high with scores of 79.3, 92.2, and 94.1, respectively.
Keywords: Eating rate, Glycemic index, Glycemic response, Method of consumption
INTRODUCTION
Rice remains as a staple food in Indonesia and is consumed in different methods such as using a spoon, chopsticks, and fingers. Different methods of eating may affect the speed of eating and will cause varying levels of the breakdown of food particles, resulting in differences in postprandial glucose levels (1) and glycemic response. This research analyzes the effect of Japonica rice’s different consumption methods by using spoons, chopsticks, and fingers-on eating rate, glycemic response (GR), i.e. the postprandial change in the blood glucose when foods containing carbohydrate sources are digested (2), and the glycemic index (GI) of healthy adults.
MATERIALS AND METHODS
This research has been approved by the Research Ethics Commission of Human Subjects, IPB University through approval Number: 227/IT3.KEPMSM-IPB/SK/ 2019. The test sample was Japonica rice cooked using a rice cooker with rice to water ratio of 1:1.5 (w/v). Proximate and dietary fiber analyses of rice using AOAC methods (3) were performed to calculate available carbohydrates. Ten healthy adult subjects were involved in the research. For GR and GI measurement, they received 50 gr of pure glucose as a control food and 149 g of rice, which is equivalent to 50 g of available carbohydrates. Rice was consumed using three different eating methods (spoon, chopsticks, and fingers). The interval time between periods was 1-week. The glycemic index was calculated
by comparing the area of the Incremental Area Under Curve (IAUC) of the test food with the control food (4). Statistical data analysis was performed using ANOVA followed by Duncan’s test.
RESULTS AND DISCUSSION
Subjects consisted of four men and six women with an average age of 21.9 ± 0.7 years and an average BMI of 21.1± 1.7 kg/m2. Age, weight, height, and BMI among subjects were not significantly different (p> 0.05), meaning that all subjects were homogeneous in those aspects. Eating rate can be determined from the number of mouthfuls, the average weight per mouthful, and the length of eating time; these all are related to the process of chewing food (4). The average weight per mouthful was calculated by dividing the weight of one serving of rice (149 g) with the number of mouthfuls. The data presented in Table 1 shows that for consuming one serving of Japonica rice using chopsticks resulted in significantly less weight per mouthful and a higher number of mouthfuls compared to the method of eating using a spoon and fingers. However, there was no significant difference in the length of time to consume one serving of rice.
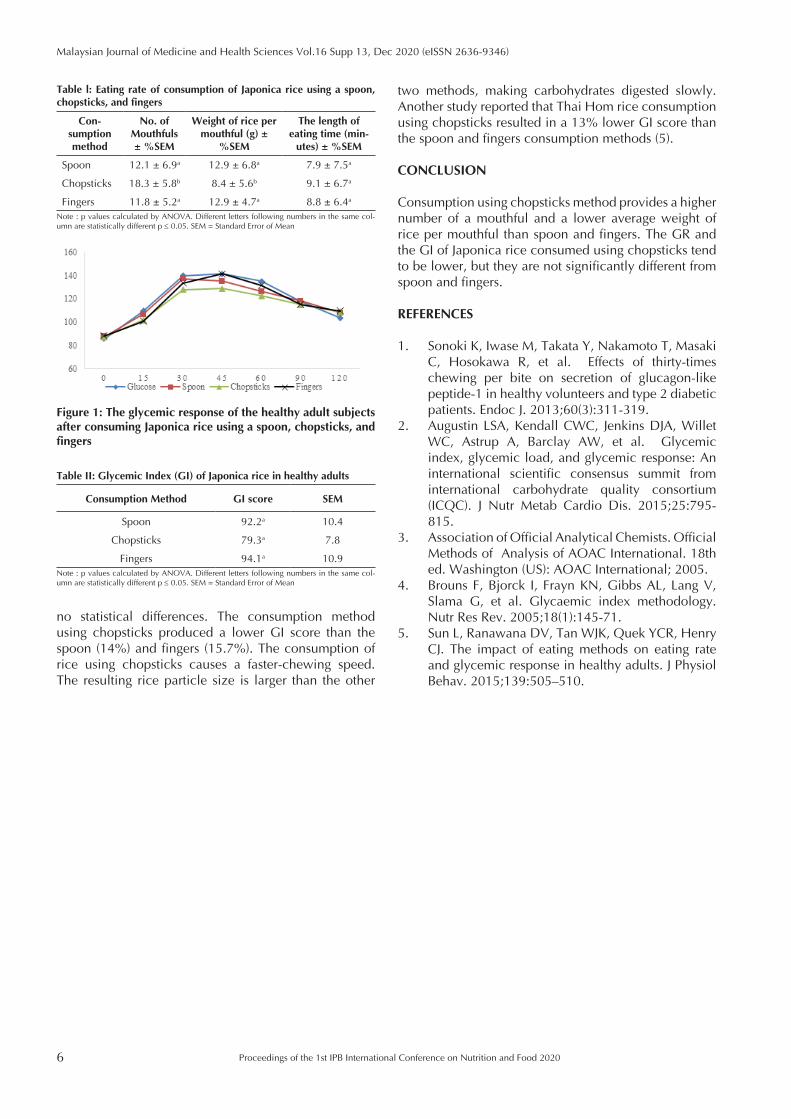
The data presented in Figure 1 show that the peak blood glucose of subjects who consumed Japonica rice using chopsticks tended to be lower, but not significantly different from using a spoon and fingers. The GI score of Japonica rice consumed using the three different consumption methods is classified as high GI with
6
Malaysian Journal of Medicine and Health Sciences Vol.16 Supp 13, Dec 2020 (eISSN 2636-9346)
Proceedings of the 1st IPB International Conference on Nutrition and Food 2020
two methods, making carbohydrates digested slowly. Another study reported that Thai Hom rice consumption using chopsticks resulted in a 13% lower GI score than the spoon and fingers consumption methods (5).
CONCLUSION
Consumption using chopsticks method provides a higher number of a mouthful and a lower average weight of rice per mouthful than spoon and fingers. The GR and the GI of Japonica rice consumed using chopsticks tend to be lower, but they are not significantly different from spoon and fingers.
REFERENCES
1. Sonoki K, Iwase M, Takata Y, Nakamoto T, Masaki C, Hosokawa R, et al. Effects of thirty-times chewing per bite on secretion of glucagon-like peptide-1 in healthy volunteers and type 2 diabetic patients. Endoc J. 2013;60(3):311-319.
2. Augustin LSA, Kendall CWC, Jenkins DJA, Willet WC, Astrup A, Barclay AW, et al. Glycemic index, glycemic load, and glycemic response: An international scientific consensus summit from international carbohydrate quality consortium (ICQC). J Nutr Metab Cardio Dis. 2015;25:795-815.
3. Association of Official Analytical Chemists. Official Methods of Analysis of AOAC International. 18th ed. Washington (US): AOAC International; 2005.
4. Brouns F, Bjorck I, Frayn KN, Gibbs AL, Lang V, Slama G, et al. Glycaemic index methodology. Nutr Res Rev. 2005;18(1):145-71.
5. Sun L, Ranawana DV, Tan WJK, Quek YCR, Henry CJ. The impact of eating methods on eating rate and glycemic response in healthy adults. J Physiol Behav. 2015;139:505–510.
Figure 1: The glycemic response of the healthy adult subjects after consuming Japonica rice using a spoon, chopsticks, and fingers
Table l: Eating rate of consumption of Japonica rice using a spoon, chopsticks, and fingers
Con-sumption method
No. of Mouthfuls ± %SEM
Weight of rice per mouthful (g) ±
%SEM
The length of eating time (min-
utes) ± %SEM
Spoon 12.1 ± 6.9a 12.9 ± 6.8a 7.9 ± 7.5a
Chopsticks 18.3 ± 5.8b 8.4 ± 5.6b 9.1 ± 6.7a
Fingers 11.8 ± 5.2a 12.9 ± 4.7a 8.8 ± 6.4a
Note : p values calculated by ANOVA. Different letters following numbers in the same col-umn are statistically different p ≤ 0.05. SEM = Standard Error of Mean
Table II: Glycemic Index (GI) of Japonica rice in healthy adults
Consumption Method GI score SEM
Spoon 92.2a 10.4
Chopsticks 79.3a 7.8
Fingers 94.1a 10.9Note : p values calculated by ANOVA. Different letters following numbers in the same col-umn are statistically different p ≤ 0.05. SEM = Standard Error of Mean
no statistical differences. The consumption method using chopsticks produced a lower GI score than the spoon (14%) and fingers (15.7%). The consumption of rice using chopsticks causes a faster-chewing speed. The resulting rice particle size is larger than the other
Proceedings of the 1st IPB International Conference on Nutrition and Food 2020 7
Malaysian Journal of Medicine and Health Sciences Vol.16 Supp 13, Dec 2020 (eISSN 2636-9346)
EXTENDED ABSTRACT
Observational Study on the Diet of Burn Patients at Cipto Mangunkusumo Hospital Jakarta Mia Srimiati1,2, Clara M Kusharto3, Faisal Anwar3, Heni Rachmawati4, Mira Dewi3, Aditya Wardhana5, Merry Aitonam6, Kartini5, Utari Yunita Ningrum1, NA Shofiyyatunnisaak1
1 Postgraduate Program in Nutrition Science, IPB University, Indonesia2 Nutrition Science Department, Faculty of Public Health, Binawan University, Indonesia3 Departmen of Community Nutrition, Faculty of Human Ecology, IPB University, Indonesia4 School of Pharmacy, Bandung Institute of Technology, Bandung, Indonesia5 Burn Unit, Cipto Mangunkusomo General Hospital, Jakarta, Indonesia6 Food Service Unit, Cipto Mangunkusumo General Hospital, Jakarta, Indonesia
Corresponding author’s email: [email protected]
SUMMARY
A certain administration of diet to support the healing process of burn patients is necessary. This study aimed to ob-serve the dietary intake of burn patients at Cipto Mangunkusumo Hospital. Research data were collected using food weighing, integrated patient progress notes, and medical records. The results revealed that on average, the nutrient intake during hospitalization was inadequate (energy 71,92%, protein 66.93%, carbohydrate 58.58%, fat 83.55%). Further, the blood parameters level after 21 days admission was not significantly different from the baseline. There-fore, diet modification is needed to increase the nutrition intake of the patients.
Keywords: Burn, Diet, Liquid food, Nutrition, Patient
INTRODUCTION
Burn patients are patients with a very high level of pain from moderate to severe burn injury. Their condition usually gets worse, and the other co-morbidities caused a higher mortality rate (1). A worsening of the patients’ condition is associated with the hyper-catabolism, especially if it is not supported by a proper diet (2). The administration of a high energy-protein diet to support the healing process is crucial (3). They also need micronutrients such as vitamins A, C, and D, Fe, Cu, Se, and Zn which have been found to affect wound healing and skeletal function, neuromuscular, and immune system (4). A proper nutrition supply could improve the patients’ recovery process. Therefore, the purpose of this study was to observe the diet for burn patients at Cipto Mangun Kusumo Hospital.
MATERIALS AND METHODS
This is an observational study; the data were collected from November 2019 to January 2020. There were 53 patients who were admitted to the burn unit of Cipto Mangunkusumo Hospital during that period, but only seven patients who met the criteria (20-50% burn area, aged 18-59 years, only receiving soft and liquid diet, not suffering from diabetes mellitus, and chronic kidney failure). The subjects were observed intensively
for 21 days. The main variables were energy, protein, carbohydrate, and fat intake. The laboratory assessment result such as ALT, AST, albumin, eGFR, blood creatinine, blood urea, procalcitonin (PCT), lactate, and leucocytes were recorded from the patients’ medical record. We collected dietary intake data by the food weighing method and performed a cross-check to integrated patient progress notes from a dietitian. The other data were collected from the patients’ medical records.
RESULTS AND DISCUSSION
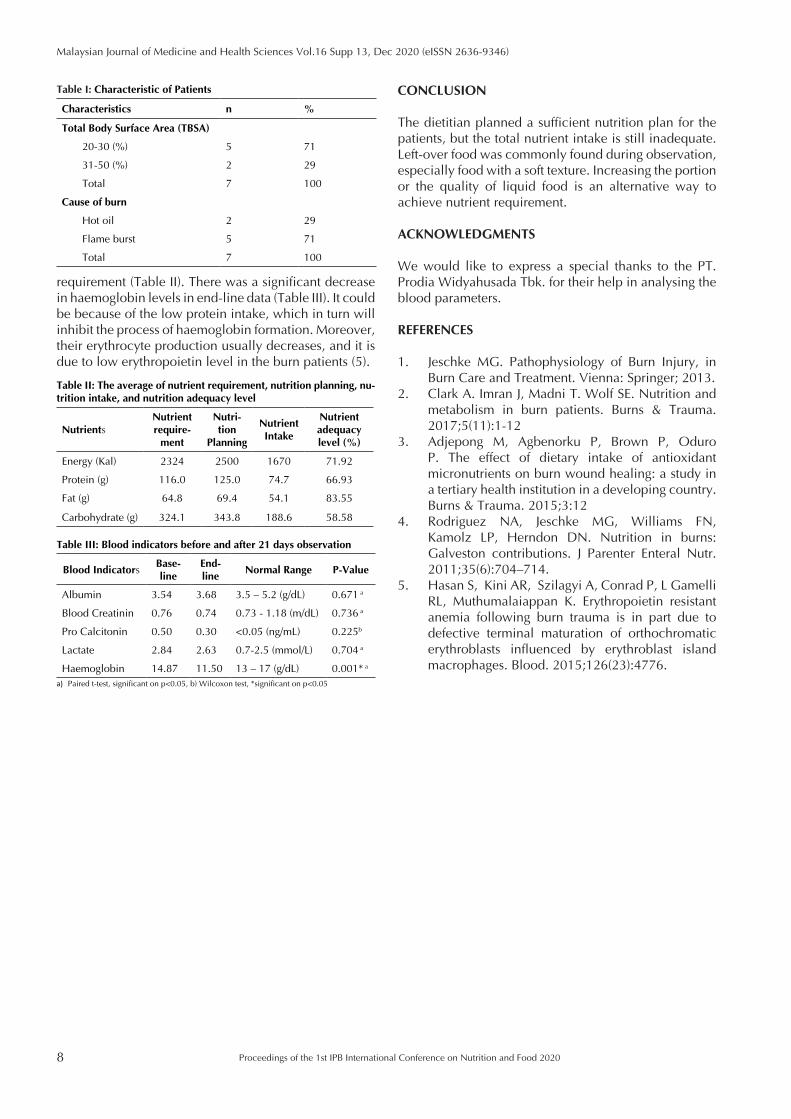
The purpose of the burn diet is to achieve daily nutrient intake up to or more than 80% of the nutrient requirement. However, most of the patients could not achieve the target. This is related to their medical condition since they had to undergo several surgeries during the hospitalization. Most of the patients have a 20-30% burn area, and it was caused by a flame burst (Table I). The dietitian usually provides a soft texture diet: 1100-1500 kcal (rice and dishes), two portions of extra animal-based protein side dishes, 2-3 portions of egg, and liquid food (low-fat milk) 3x250 ml. Unfortunately, the patients usually consumed only 1/2 - 2/3 portion of soft foods but consumed all the liquid food. Therefore, the nutrient adequacy level for energy, protein and carbohydrate were deficit; only fat that meets the
8
Malaysian Journal of Medicine and Health Sciences Vol.16 Supp 13, Dec 2020 (eISSN 2636-9346)
Proceedings of the 1st IPB International Conference on Nutrition and Food 2020
CONCLUSION
The dietitian planned a sufficient nutrition plan for the patients, but the total nutrient intake is still inadequate. Left-over food was commonly found during observation, especially food with a soft texture. Increasing the portion or the quality of liquid food is an alternative way to achieve nutrient requirement.
ACKNOWLEDGMENTS
We would like to express a special thanks to the PT. Prodia Widyahusada Tbk. for their help in analysing the blood parameters.
REFERENCES
1. Jeschke MG. Pathophysiology of Burn Injury, in Burn Care and Treatment. Vienna: Springer; 2013.
2. Clark A. Imran J, Madni T. Wolf SE. Nutrition and metabolism in burn patients. Burns & Trauma. 2017;5(11):1-12
3. Adjepong M, Agbenorku P, Brown P, Oduro P. The effect of dietary intake of antioxidant micronutrients on burn wound healing: a study in a tertiary health institution in a developing country. Burns & Trauma. 2015;3:12
4. Rodriguez NA, Jeschke MG, Williams FN, Kamolz LP, Herndon DN. Nutrition in burns: Galveston contributions. J Parenter Enteral Nutr. 2011;35(6):704–714.
5. Hasan S, Kini AR, Szilagyi A, Conrad P, L Gamelli RL, Muthumalaiappan K. Erythropoietin resistant anemia following burn trauma is in part due to defective terminal maturation of orthochromatic erythroblasts influenced by erythroblast island macrophages. Blood. 2015;126(23):4776.
requirement (Table II). There was a significant decrease in haemoglobin levels in end-line data (Table III). It could be because of the low protein intake, which in turn will inhibit the process of haemoglobin formation. Moreover, their erythrocyte production usually decreases, and it is due to low erythropoietin level in the burn patients (5).
Table I: Characteristic of Patients
Characteristics n %
Total Body Surface Area (TBSA)
20-30 (%) 5 71
31-50 (%) 2 29
Total 7 100
Cause of burn
Hot oil 2 29
Flame burst 5 71
Total 7 100
Table II: The average of nutrient requirement, nutrition planning, nu-trition intake, and nutrition adequacy level
NutrientsNutrient require-
ment
Nutri-tion
Planning
Nutrient Intake
Nutrient adequacy level (%)
Energy (Kal) 2324 2500 1670 71.92
Protein (g) 116.0 125.0 74.7 66.93
Fat (g) 64.8 69.4 54.1 83.55
Carbohydrate (g) 324.1 343.8 188.6 58.58
Table III: Blood indicators before and after 21 days observation
Blood IndicatorsBase-line
End-line
Normal Range P-Value
Albumin 3.54 3.68 3.5 – 5.2 (g/dL) 0.671 a
Blood Creatinin 0.76 0.74 0.73 - 1.18 (m/dL) 0.736 a
Pro Calcitonin 0.50 0.30 <0.05 (ng/mL) 0.225b
Lactate 2.84 2.63 0.7-2.5 (mmol/L) 0.704 a
Haemoglobin 14.87 11.50 13 – 17 (g/dL) 0.001* a
a) Paired t-test, significant on p<0.05, b) Wilcoxon test, *significant on p<0.05
Proceedings of the 1st IPB International Conference on Nutrition and Food 2020 9
Malaysian Journal of Medicine and Health Sciences Vol.16 Supp 13, Dec 2020 (eISSN 2636-9346)
EXTENDED ABSTRACT
The Effect of Chicken Essense on Lactation and Recovery from Fatigue: A Meta-Analysis Erna Puspasari1, Eny Palupi1, Fachriyan H. Pasaribu2, Astari Apriantini3, Ahmad Sulaeman1
1 Department of Community Nutrition, Faculty of Human Ecology, IPB University, Indonesia2 Department of Animal Diseases and Veterinary Health, Faculty of Veterinary Medicine, IPB University, Indonesia 3 Department of Livestock Production and Technology, Faculty of Animal Science, IPB University, Indonesia
Corresponding author’s email: [email protected]
SUMMARY
Chicken essence (CE), known as a traditional liquid supplement popular in Asian Country, contains high protein and various valuable amino acids. Many studies have shown the benefits of CE in mice and humans. This study aimed to synthesize the previous studies on the effect of CE on lactation and recovery from fatigue using Hedges’d effect size method. The results showed that the contents of iron, lactoferrin, Transforming Growth Factor-β2 (TGF-β2) and Epidermal Growth Factor (EGF) in colostrum have a significant cumulative effect size. A similar result was obtained from the effect of recovery from fatigue for total protein.
Keywords: Carnosine, Chicken essence, Functional supplement, Lactation, Protein
INTRODUCTION
Chicken essence is a traditional drink from Asian Country (China) made from chicken meat extract. Usually, Chinese people add herbal plants to increase the benefits and variations of chicken essence according to consumer needs. A number of studies have been published evaluating the health benefits of chicken essence i.e increasing protein intake, restoring and increasing physical strength, overcoming fatigue, and improving memory and learning concentration in mice and human. CE is also mainly used in postpartum woman to restore physical strength, lowering plasma lipids and for neonatal by improving milk quality (1). Daily intake of CE can be an alternative treatment for recovery from fatigue in mice and humans (2,3,4). This study aimed to synthesize the previous studies on the effect of CE on lactation and recovery from fatigue, especially to observe how much CE can be considered to improve health conditions in preclinical dan clinical study.
MATERIALS AND METHODS
The literature search was conducted by using literature database, i.e. Science Direct and PubMed with keywords used in the search- ‘chicken essence’, ‘chicken extract’, ‘lactation’, ‘recovery*fatigue’, ‘carnosine’, ‘anserine’, ‘food*supplement’-. The criteria used in this study were: (1) articles written in English; (2) Published peer-reviewed articles . The screening yielded 15 studies which were included in the data
synthesis with 19 parameters from 4 articles used in this study, with subject mice and human. Meta-analysis in this study used Hedges’d effect size method to quantify the parameter between control and chicken essence products. 95% CI was used for precision of the effect size in this study (5).
RESULTS AND DISCUSSION
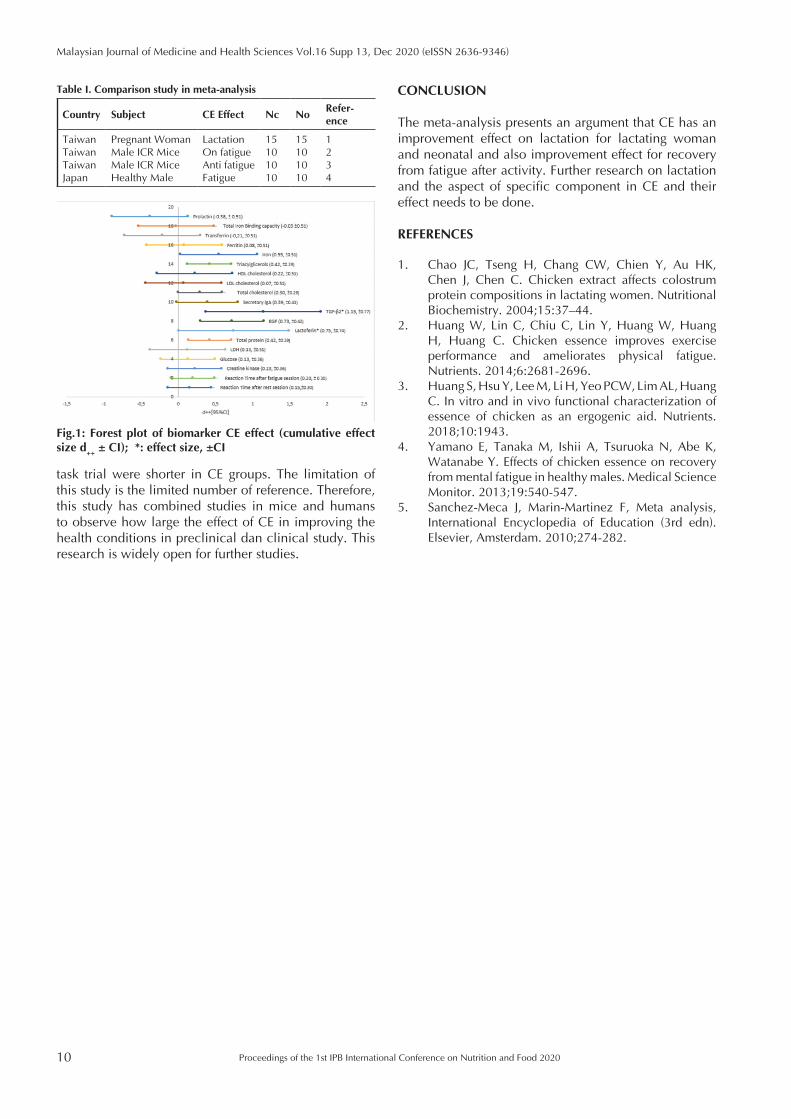
The studies were done in Taiwan and Japan (Table I). The results showed (Fig.1) the content of iron, lactoferrin, TGF-β2 in colostrum and 37 weeks was significantly higher in CE group, with cumulative effect size ± 95% CI were 0.54±0.51; 0.75±0.74; 1.15±0.77, respectively, and EGF in colostrum was 0.33 ±0.31. This intake plays many roles in the development of neonate. The analysis also indicated that the total protein was higher in the control group during postpartum, but the total protein was higher in CE group for colostrum and 37 weeks pregnancy (d
++±CI, 0.33±0.31).
Similar result was obtained on the effect of recovery from fatigue. The total protein for recovery from fatigue from CE group is significantly higher than that of the control group (d++±CI, 0.42±0.29). The biomarkers of physical fatigue i.e. glucose, serum lactate and creatine kinase after treatment indicated lower in CE group than the control group with d
++ ± CI of 0.13±0.51;
0.13±0.36; 0.27±0.36, respectively. This shows that CE product decreased physical fatigue-related biomarkers. In heathy males, reaction times after doing the cognitive
10
Malaysian Journal of Medicine and Health Sciences Vol.16 Supp 13, Dec 2020 (eISSN 2636-9346)
Proceedings of the 1st IPB International Conference on Nutrition and Food 2020
task trial were shorter in CE groups. The limitation of this study is the limited number of reference. Therefore, this study has combined studies in mice and humans to observe how large the effect of CE in improving the health conditions in preclinical dan clinical study. This research is widely open for further studies.
CONCLUSION
The meta-analysis presents an argument that CE has an improvement effect on lactation for lactating woman and neonatal and also improvement effect for recovery from fatigue after activity. Further research on lactation and the aspect of specific component in CE and their effect needs to be done.
REFERENCES
1. Chao JC, Tseng H, Chang CW, Chien Y, Au HK, Chen J, Chen C. Chicken extract affects colostrum protein compositions in lactating women. Nutritional Biochemistry. 2004;15:37–44.
2. Huang W, Lin C, Chiu C, Lin Y, Huang W, Huang H, Huang C. Chicken essence improves exercise performance and ameliorates physical fatigue. Nutrients. 2014;6:2681-2696.
3. Huang S, Hsu Y, Lee M, Li H, Yeo PCW, Lim AL, Huang C. In vitro and in vivo functional characterization of essence of chicken as an ergogenic aid. Nutrients. 2018;10:1943.
4. Yamano E, Tanaka M, Ishii A, Tsuruoka N, Abe K, Watanabe Y. Effects of chicken essence on recovery from mental fatigue in healthy males. Medical Science Monitor. 2013;19:540-547.
5. Sanchez-Meca J, Marin-Martinez F, Meta analysis, International Encyclopedia of Education (3rd edn). Elsevier, Amsterdam. 2010;274-282.
Table I. Comparison study in meta-analysis
Country Subject CE Effect Nc NoRefer-ence
TaiwanTaiwanTaiwanJapan
Pregnant WomanMale ICR MiceMale ICR MiceHealthy Male
LactationOn fatigueAnti fatigueFatigue
15101010
15101010
1234
Fig.1: Forest plot of biomarker CE effect (cumulative effect size d++ ± CI); *: effect size, ±CI
Proceedings of the 1st IPB International Conference on Nutrition and Food 2020 11
Malaysian Journal of Medicine and Health Sciences Vol.16 Supp 13, Dec 2020 (eISSN 2636-9346)
EXTENDED ABSTRACT
The Effect of Ethanolic Cajanus cajan Leaves and Zingiber officinale Extracts on Spermatogenic Cells, Interstitial Cells and Superoxide Dismutase in Testicular Tissues of Experimental Diabetic Rats Tutik Wresdiyati1, Almalia Mayangfauni1, Siti Sa’diah1, Made Astawan2
1 Department of Anatomy, Physiology and Pharmacology, Faculty of Veterinary Medicine, IPB University, Bogor, Indonesia 2 Department of Food Science and Technology, Faculty of Agricultural Engineering and Technology, IPB University, Bogor,
Indonesia
Corresponding author’s email: [email protected]
SUMMARY
Hyperglycaemia in diabetes mellitus causes oxidative stress. Reactive Oxygen Species (ROS) attacks all cell types, including spermatogenic and Leydig cells in testicular tissues. This study aimed to evaluate the effect of ethanolic C. cajan and Z. officinale extracts on the profile of spermatogenic and interstitial cells, SOD content in rat’s testis, body weight, and blood glucose level of alloxan-diabetic rats. This study concluded that the combination extracts of C. cajan (300mg/kgbw) and Z. officinale (60 mg/kgbw) increased the profile of spermatogenic and interstitial cells num-ber, Cu,Zn-SOD antioxidant content in testis and body weight, reduced blood glucose level of alloxan-diabetic rats.
Keywords: Cajanus cajan, Diabetes mellitus, Superoxide dismutase, Testis, Zingiber officinale
INTRODUCTION
Diabetes mellitus (DM) is a metabolic disorder characterised by hyperglycaemia. Hyperglycaemia causes oxidative stress through increased ROS (1). ROS attacks all cell types including spermatogenic and interstitial cells. Hyperglycaemia also causes disturbances in hypothalamus pituitary gonadal axis (HPG) that lead to the decrease of luteinizing hormone synthesis, followed by Leydig cell activity decline (2). It was reported that DM decreased the spermatogonia, primary spermatocyte, and interstitial cells number, as well as SOD content in testis of alloxan-diabetic rats (3). Therefore, hyperglycaemia and oxidative stress in DM could be controlled by the presence of exogenous antioxidants and hypoglycaemic agents. C. cajan leaves and Z. officinale exhibit hypoglycaemic and antioxidant activities (4). This study aimed to evaluate the effects of C. cajan and Z. officinale extracts on the profile of spermatogenic and interstitial cells number, and SOD antioxidant content in testis, body weight and blood glucose level of alloxan-diabetic rats..
MATERIALS AND METHODS
C. cajan leaves and Z. officinale were extracted using maceration with 96% ethanol as solvent. This study used 30 male Sprague-Dawley rats that were divided
into five treatment groups: 1. non DM (NDM), 2. DM, 3. DM rats given glibenclamide (G), 4. DM rats given a combination extracts of C. cajan (300mg/kgbw) and Z. officinale (60 mg/kgbw) (E1), and 5. DM rats were given a combination of C. cajan (300mg/kgbw) and Z. officinale (125 mg/kgbw) (E2). The diabetic condition was caused by alloxan induction. The treatment was conducted for 28 days. Body weight and blood glucose level were measured every four days. Testicular tissues were processed using paraffin embedding standard method and then stained with hematoxylin-eosin for spermatogenic and interstitial cells analysis, and immunohistochemical technique for Cu,Zn-SOD antioxidant content analysis. The SOD content was observed quantitatively based on the intensity of positive reaction product in spermatogenic cells.
RESULTS AND DISCUSSION
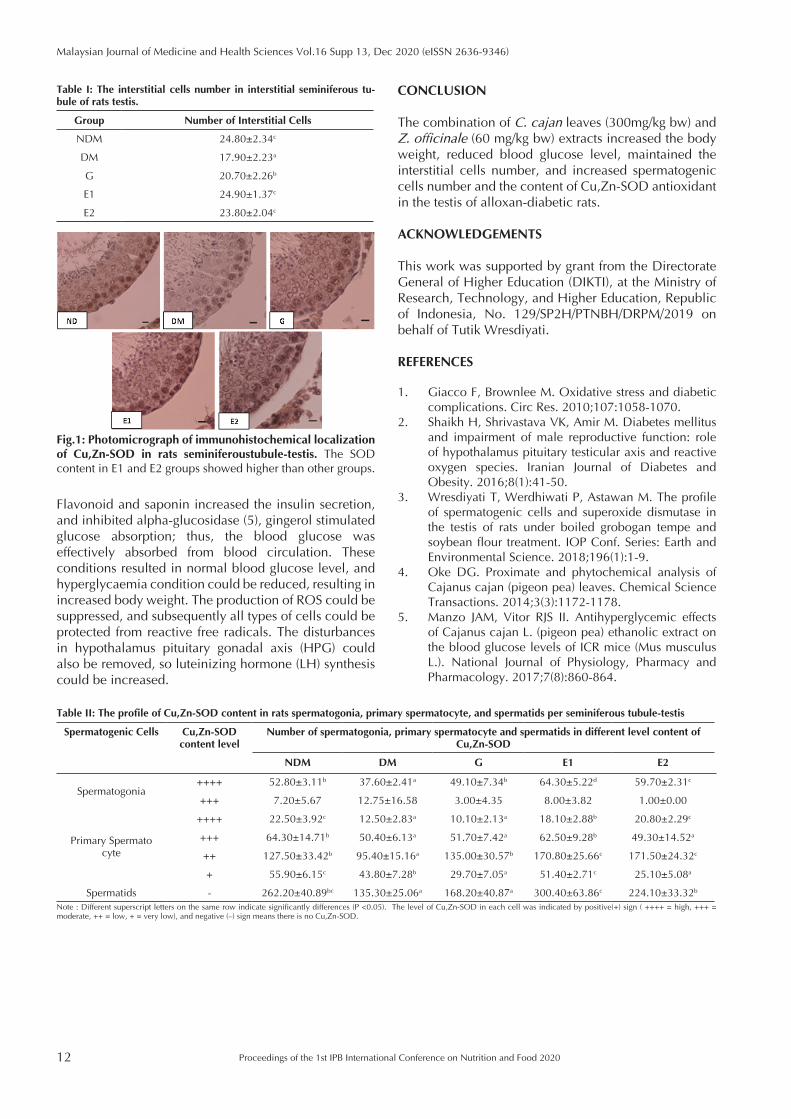
The results revealed that the combination of C. cajan leaves (300mg/kgbw) and Z. officinale (60mg/kgbw) (E1) extracts showed the best effect; it increased the spermatogenic and interstitial cells number (Table I), the SOD antioxidant content in spermatogenic cells, body weight, and decreased blood glucose level of alloxan-diabetic rats (Fig.1, Table II). There were abundant number of antioxidants and compounds in the extract of C. cajan leaves (4) and Z. officinale.
12
Malaysian Journal of Medicine and Health Sciences Vol.16 Supp 13, Dec 2020 (eISSN 2636-9346)
Proceedings of the 1st IPB International Conference on Nutrition and Food 2020
CONCLUSION
The combination of C. cajan leaves (300mg/kg bw) and Z. officinale (60 mg/kg bw) extracts increased the body weight, reduced blood glucose level, maintained the interstitial cells number, and increased spermatogenic cells number and the content of Cu,Zn-SOD antioxidant in the testis of alloxan-diabetic rats.
ACKNOWLEDGEMENTS
This work was supported by grant from the Directorate General of Higher Education (DIKTI), at the Ministry of Research, Technology, and Higher Education, Republic of Indonesia, No. 129/SP2H/PTNBH/DRPM/2019 on behalf of Tutik Wresdiyati.
REFERENCES
1. Giacco F, Brownlee M. Oxidative stress and diabetic complications. Circ Res. 2010;107:1058-1070.
2. Shaikh H, Shrivastava VK, Amir M. Diabetes mellitus and impairment of male reproductive function: role of hypothalamus pituitary testicular axis and reactive oxygen species. Iranian Journal of Diabetes and Obesity. 2016;8(1):41-50.
3. Wresdiyati T, Werdhiwati P, Astawan M. The profile of spermatogenic cells and superoxide dismutase in the testis of rats under boiled grobogan tempe and soybean flour treatment. IOP Conf. Series: Earth and Environmental Science. 2018;196(1):1-9.
4. Oke DG. Proximate and phytochemical analysis of Cajanus cajan (pigeon pea) leaves. Chemical Science Transactions. 2014;3(3):1172-1178.
5. Manzo JAM, Vitor RJS II. Antihyperglycemic effects of Cajanus cajan L. (pigeon pea) ethanolic extract on the blood glucose levels of ICR mice (Mus musculus L.). National Journal of Physiology, Pharmacy and Pharmacology. 2017;7(8):860-864.
Fig.1: Photomicrograph of immunohistochemical localization of Cu,Zn-SOD in rats seminiferoustubule-testis. The SOD content in E1 and E2 groups showed higher than other groups.
Table I: The interstitial cells number in interstitial seminiferous tu-bule of rats testis.
Group Number of Interstitial Cells
NDM 24.80±2.34c
DM 17.90±2.23a
G 20.70±2.26b
E1 24.90±1.37c
E2 23.80±2.04c
Table II: The profile of Cu,Zn-SOD content in rats spermatogonia, primary spermatocyte, and spermatids per seminiferous tubule-testis
Spermatogenic Cells Cu,Zn-SOD content level
Number of spermatogonia, primary spermatocyte and spermatids in different level content of Cu,Zn-SOD
NDM DM G E1 E2
Spermatogonia++++ 52.80±3.11b 37.60±2.41a 49.10±7.34b 64.30±5.22d 59.70±2.31c
+++ 7.20±5.67 12.75±16.58 3.00±4.35 8.00±3.82 1.00±0.00
Primary Spermato cyte
++++ 22.50±3.92c 12.50±2.83a 10.10±2.13a 18.10±2.88b 20.80±2.29c
+++ 64.30±14.71b 50.40±6.13a 51.70±7.42a 62.50±9.28b 49.30±14.52a
++ 127.50±33.42b 95.40±15.16a 135.00±30.57b 170.80±25.66c 171.50±24.32c
+ 55.90±6.15c 43.80±7.28b 29.70±7.05a 51.40±2.71c 25.10±5.08a
Spermatids - 262.20±40.89bc 135.30±25.06a 168.20±40.87a 300.40±63.86c 224.10±33.32b
Note : Different superscript letters on the same row indicate significantly differences (P <0.05). The level of Cu,Zn-SOD in each cell was indicated by positive(+) sign ( ++++ = high, +++ = moderate, ++ = low, + = very low), and negative (–) sign means there is no Cu,Zn-SOD.
Flavonoid and saponin increased the insulin secretion, and inhibited alpha-glucosidase (5), gingerol stimulated glucose absorption; thus, the blood glucose was effectively absorbed from blood circulation. These conditions resulted in normal blood glucose level, and hyperglycaemia condition could be reduced, resulting in increased body weight. The production of ROS could be suppressed, and subsequently all types of cells could be protected from reactive free radicals. The disturbances in hypothalamus pituitary gonadal axis (HPG) could also be removed, so luteinizing hormone (LH) synthesis could be increased.
Proceedings of the 1st IPB International Conference on Nutrition and Food 2020 13
Malaysian Journal of Medicine and Health Sciences Vol.16 Supp 13, Dec 2020 (eISSN 2636-9346)
EXTENDED ABSTRACT
In Vitro and In Vivo Hypoglycaemic Activity Test of Indonesian Cajanus cajan Leaves and Zingiber officinale Extracts Tutik Wresdiyati1, Dewi Cahyani Iskandar1, Siti Sa’diah1, Made Astawan2
1 Department of Anatomy, Physiology and Pharmacology, Faculty of Veterinary Medicine, IPB University, Bogor, Indonesia 2 Department of Food Science and Technology, Faculty of Agricultural Engineering and Technology, IPB University, Bogor,
Indonesia
Corresponding author’s email: [email protected]
SUMMARY
Hypoglycaemic agent can manage diabetes mellitus. This study aimed to analyse phytochemical content, in vitro in-hibitory activity to alpha-glucosidase, antioxidant activity, and in vivo hypoglycaemic activity of Indonesian C. cajan leaves and Z. officinale extracts in experimental hyperglycaemic rats. Both C. cajan leaves and Z. officinale extracts contained steroids, tannin, saponin, flavonoids, and exhibit antioxidant (IC50 value 287 and 232) and alpha-gluco-sidase inhibitory activities. The combination of C. cajan leaves 96% etanol extract (300 mg/kgbw) and Z. officinale extract (60 mg/kgbw) demonstrated the best hypoglycaemic effect, with area under the curve of blood glucose value significantly lower than acarbose (P<0.01).
Keywords: Alpha-glucosidase, Antioxidant, Cajanus cajan, Hypoglycaemia, Zingiber officinale
INTRODUCTION
Hyperglycaemia is an abnormally high level of glucose in the blood. Hyperglycaemia is one of diabetes mellitus (DM) symptoms. The low secretion of insulin, the low sensitivity of insulin receptors, or both cause hyperglycaemia in people suffering from DM. Hyperglycaemia is a very dangerous condition as it could induce an increased production of reactive oxygen species (ROS) (1), thus resulted in oxidative stress. Continuous oxidative stress will exacerbate the patients’ condition and could lead to complications related the microvascular and macrovascular impairments. Therefore, antioxidants and hypoglycaemic agent are directly needed to control DM. This study aimed to analyse the phytochemical contents, in vitro inhibitory activity to alpha-glucosidase enzyme, antioxidant activity and in vivo hypoglycaemic effect of C. cajan leaves extract, specifically from Lombok, West Nusa Tenggara, combined with Z. officinale extract from Solo, Central Java, that exhibit high antioxidant property, in experimental hyperglycaemic rats.
MATERIALS AND METHODS
The extraction of C. cajan and Z. officinale was conducted by maceration method using water, ethanol 70% and ethanol 96% (2). These extracts were then analysed for phytochemical contents and antioxidant activity using the 2,2-diphenyl-1-picrylhydrazyl
method. Inhibitory activity of these extracts against alpha-glucosidase was analysed using ELISA reader. In vivo oral glucose tolerant test was used for this study to evaluate the hypoglycaemic activity of C. cajan leaves and Z. officinale extracts (2). This study used 50 male Sprague Dawley rats for ten treatment groups: positive control (hyperglycaemia), negative control, acarbose control, four groups treated with C. cajan leaves extract (200, 300, 400, 500 mg/kgbw), and three groups treated with the combination extracts of C. cajan (200, 300, and 400 mg/kgbw) and Z. officinale (60 mg/kgbw) for 120 minutes. Area under the curve of the blood glucose level was also calculated.
RESULTS AND DISCUSSION
C. cajan leaves extract contained steroids, tannin, saponin, and flavonoids, whereas the Z. officinale extracts contained steroids, saponin, and flavonoids. The IC50 value of antioxidant activity and inhibitory activity to alpha-glucosidase of both C. cajan leaves and Z. officinale 96% ethanol extracts revealed the best activity. It was reported that terpenes, alkaloid, quinones, flavonoid, phenols, phenylpropanoids, and steroids exhibited alpha-glucosidase inhibitory function (3). Flavonoids exhibited alpha-glucosidase inhibitor properties (4). Saponin had also been reported to have antioxidant as well as alpha-amylase and alpha-glucosidase inhibitory activities (5). In vivo analysis of C. cajan leaves extract showed hypoglycaemic
14
Malaysian Journal of Medicine and Health Sciences Vol.16 Supp 13, Dec 2020 (eISSN 2636-9346)
Proceedings of the 1st IPB International Conference on Nutrition and Food 2020
CONCLUSION
C. cajan and Z. officinale extracts contained steroid, tannin, saponin, and flavonoids. The ethanolic extracts of C. cajan and Z. officinale had antioxidant, alpha-glucosidase inhibitory, and hypoglycaemic activities. The combination of C. cajan (300 mg/kgbw) and Z. officinale (60 m,g/kgbw) extracts could be proposed as a potential hypoglycaemic agent.
ACKNOWLEDGEMENTS
This work was supported by grant from the Directorate General of Higher Education (DIKTI), at the Ministry of Research, Technology, and Higher Education, Republic of Indonesia, No. 129/SP2H/PTNBH/DRPM/2019 on behalf of Tutik Wresdiyati.
REFERENCES
1. Giacco F, Brownlee M. Oxidative stress and diabetic complications. Circ Res. 2010;107:1058-1070.
2. Wresdiyati T, S Sa’diah, A Winarto. Alpha-glucosidase inhibition and hypoglycemic activities of Swietenia mahagoni seed extract. Hayati Journal of Bioscience. 2015;55(22):73-78.
3. Yin Z, Zhang W, Feng F, Zhang Y, Kang W. α-Glucosidase inhibitors isolated from medicinal plants. Food Science and Human Wellness. 2014;3:136–174.
4. Proença C, Freitas M, Riberio D, Oliveira EFT, Sousa JLC, Tome SM, et al. α-Glucosidase inhibition by flavonoids: an in vitro and in silico structure-activity relationship study. J Enzyme Inhib Med Chem. 2017;32(1):1216-1228.
5. Nafiu MO, Ashafa AOT. Antioxidant and inhibitory effects of saponin extracts from Dianthus basuticus burtt davy on key enzymes implicated in type 2 diabetes in vitro. Pharmacogn Mag. 2017;13(52):576-582.
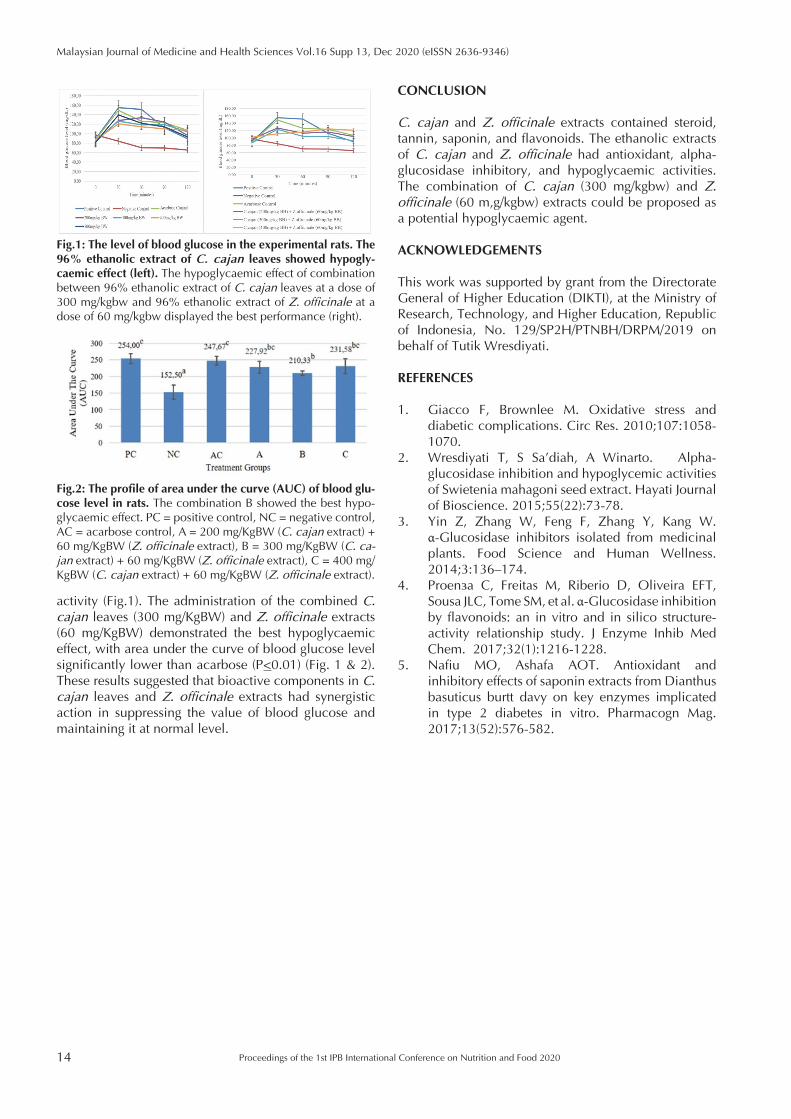
Fig.1: The level of blood glucose in the experimental rats. The 96% ethanolic extract of C. cajan leaves showed hypogly-caemic effect (left). The hypoglycaemic effect of combination between 96% ethanolic extract of C. cajan leaves at a dose of 300 mg/kgbw and 96% ethanolic extract of Z. officinale at a dose of 60 mg/kgbw displayed the best performance (right).
activity (Fig.1). The administration of the combined C. cajan leaves (300 mg/KgBW) and Z. officinale extracts (60 mg/KgBW) demonstrated the best hypoglycaemic effect, with area under the curve of blood glucose level significantly lower than acarbose (P<0.01) (Fig. 1 & 2). These results suggested that bioactive components in C. cajan leaves and Z. officinale extracts had synergistic action in suppressing the value of blood glucose and maintaining it at normal level.
Fig.2: The profile of area under the curve (AUC) of blood glu-cose level in rats. The combination B showed the best hypo-glycaemic effect. PC = positive control, NC = negative control, AC = acarbose control, A = 200 mg/KgBW (C. cajan extract) + 60 mg/KgBW (Z. officinale extract), B = 300 mg/KgBW (C. ca-jan extract) + 60 mg/KgBW (Z. officinale extract), C = 400 mg/KgBW (C. cajan extract) + 60 mg/KgBW (Z. officinale extract).
Proceedings of the 1st IPB International Conference on Nutrition and Food 2020 15
Malaysian Journal of Medicine and Health Sciences Vol.16 Supp 13, Dec 2020 (eISSN 2636-9346)
EXTENDED ABSTRACT
Carbohydrate Intake as a Dominant Factor of Underweight among Toddlers in Bogor District, IndonesiaCitra Sari Nasrianti1, Trini Sudiarti2
1 Postgraduate Student, Faculty of Public Health, Universitas Indonesia, 16424 Depok, West Java, Indonesia2 Department of Public Health Nutrition, Faculty of Public Health, Universitas Indonesia, 16424 Depok, West Java, Indonesia
Corresponding author’s email: [email protected]
SUMMARY
Globally, underweight contributes to more than half of the total annual deaths in toddlers. This study was performed to determine a dominant factor of underweight among toddlers in Bogor District, Indonesia. The design of this study was cross-sectional, using secondary data with a total sample of 612 toddlers. Chi-square test and multiple logistic regression were used to determine factors contributing to toddler underweight. The prevalence of underweight in toddlers in Bogor District, Indonesia in 2019 was 19.8%, and carbohydrate intake was found to be a dominant factor of underweight in toddlers (p-value<0.05; OR=2.45; 95% Cl=1.43-4.18).
Keywords: Carbohydrate intake, Cross-sectional, Multiple logistic regression, Toddler, Underweight.
INTRODUCTION
Malnourishment in children remains a main issue in developing countries because of its long-term effects, which include cognitive problems, growth, toddler development, and children’s morbidity and mortality (1). Two-to-five-year-old children belong to a vulnerable age group that experiences malnourishment because of the increased need for nutrition to maintain growth and development. Meanwhile, toddlers generally have insufficient nutrient intake and get an infectious disease. This condition results in a weak immune system, so that the toddlers vulnerably become underweight as their nutrition intake decreases. Based on previous research in 2019, the prevalence of stunting in Bogor is still high. This condition indicates that there are serious public health problems which need to be resolved. However, factors of nutrition intake related to underweight are still underresearched. This study was conducted to determine the dominant factor of underweight among toddlers in Bogor District, Indonesia.
MATERIALS AND METHODS
This research used secondary data of a study receiving a grant from Universitas Indonesia. The design of this study was cross-sectional with 95% confidence intervals. Samples were taken using a cluster random sampling method, and 612 toddlers paired with their mothers were recruited as the sample. A questionnaire was used to collect data. Weight data were needed to understand nutritional status, so that toddler underweight could be determined by plotting the z-score on a Weight/Age
WHO table. The energy and macronutrient intake data were collected through a 24-hour food recall method and presented in kilocalorie and grams. The data were then converted into intake percentage based on the Recommendation Dietary Allowance of Indonesian. Data analysis was performed using SPSS. Multiple logistic regression was used to determine factor that contributed to underweight. This research has been approved by the Research and Community Engagement Ethical Committee of the Faculty of Public Health, Universitas Indonesia (No: Ket/612/UN2.F10/PPM.00.02/2019).
RESULTS AND DISCUSSION
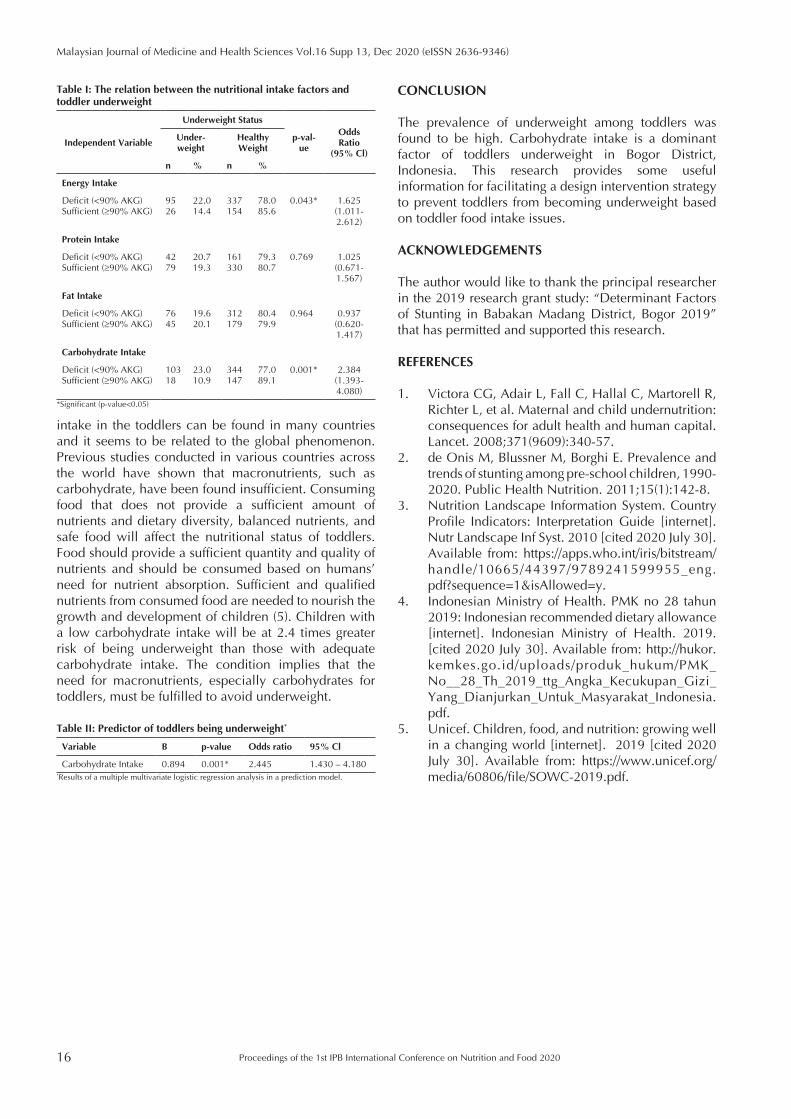
This research found that the prevalence of toddler underweight in Bogor District is higher (19.8%) compared to the results of 2018 Nutritional Status Monitoring (17.3 %). The results show that underweight is a public health issue. This needs required attention because the prevalence of underweight is above 10.0% (2,3). The majority of the toddlers (70.6%) had inadequate energy intake and inadequate carbohydrate intake (73.0%). Table I shows that the statistical relationship between the energy and carbohydrate intake and toddler underweight was significant (p-value<0.05).
The final model of the multiple logistic regression analysis is provided in Table II which shows that carbohydrate intake was the only statistically significant predictor of toddler underweight. The condition happened because the average carbohydrate intake in toddlers (122 gram) is lower than Recommended Dietary Allowance of Indonesian (220 gram) (4). The deficiency of carbohydrate
16
Malaysian Journal of Medicine and Health Sciences Vol.16 Supp 13, Dec 2020 (eISSN 2636-9346)
Proceedings of the 1st IPB International Conference on Nutrition and Food 2020
intake in the toddlers can be found in many countries and it seems to be related to the global phenomenon. Previous studies conducted in various countries across the world have shown that macronutrients, such as carbohydrate, have been found insufficient. Consuming food that does not provide a sufficient amount of nutrients and dietary diversity, balanced nutrients, and safe food will affect the nutritional status of toddlers. Food should provide a sufficient quantity and quality of nutrients and should be consumed based on humans’ need for nutrient absorption. Sufficient and qualified nutrients from consumed food are needed to nourish the growth and development of children (5). Children with a low carbohydrate intake will be at 2.4 times greater risk of being underweight than those with adequate carbohydrate intake. The condition implies that the need for macronutrients, especially carbohydrates for toddlers, must be fulfilled to avoid underweight.
CONCLUSION
The prevalence of underweight among toddlers was found to be high. Carbohydrate intake is a dominant factor of toddlers underweight in Bogor District, Indonesia. This research provides some useful information for facilitating a design intervention strategy to prevent toddlers from becoming underweight based on toddler food intake issues.
ACKNOWLEDGEMENTS
The author would like to thank the principal researcher in the 2019 research grant study: “Determinant Factors of Stunting in Babakan Madang District, Bogor 2019” that has permitted and supported this research.
REFERENCES
1. Victora CG, Adair L, Fall C, Hallal C, Martorell R, Richter L, et al. Maternal and child undernutrition: consequences for adult health and human capital. Lancet. 2008;371(9609):340-57.
2. de Onis M, Blössner M, Borghi E. Prevalence and trends of stunting among pre-school children, 1990-2020. Public Health Nutrition. 2011;15(1):142-8.
3. Nutrition Landscape Information System. Country Profile Indicators: Interpretation Guide [internet]. Nutr Landscape Inf Syst. 2010 [cited 2020 July 30]. Available from: https://apps.who.int/iris/bitstream/handle/10665/44397/9789241599955_eng.pdf?sequence=1&isAllowed=y.
4. Indonesian Ministry of Health. PMK no 28 tahun 2019: Indonesian recommended dietary allowance [internet]. Indonesian Ministry of Health. 2019. [cited 2020 July 30]. Available from: http://hukor.kemkes.go.id/uploads/produk_hukum/PMK_No__28_Th_2019_ttg_Angka_Kecukupan_Gizi_Yang_Dianjurkan_Untuk_Masyarakat_Indonesia.pdf.
5. Unicef. Children, food, and nutrition: growing well in a changing world [internet]. 2019 [cited 2020 July 30]. Available from: https://www.unicef.org/media/60806/file/SOWC-2019.pdf.
Table I: The relation between the nutritional intake factors and toddler underweight
Independent Variable
Underweight Status
p-val-ue
Odds Ratio
(95% Cl)
Under-weight
Healthy Weight
n % n %
Energy Intake
Deficit (<90% AKG)Sufficient (≥90% AKG)
9526
22.014.4
337154
78.085.6
0.043* 1.625(1.011-2.612)
Protein Intake
Deficit (<90% AKG)Sufficient (≥90% AKG)
4279
20.719.3
161330
79.380.7
0.769 1.025(0.671-1.567)
Fat Intake
Deficit (<90% AKG)Sufficient (≥90% AKG)
7645
19.620.1
312179
80.479.9
0.964 0.937 (0.620-1.417)
Carbohydrate Intake
Deficit (<90% AKG)Sufficient (≥90% AKG)
10318
23.010.9
344147
77.089.1
0.001* 2.384(1.393-4.080)
*Significant (p-value<0.05)
Table II: Predictor of toddlers being underweight*
Variable B p-value Odds ratio 95% Cl
Carbohydrate Intake 0.894 0.001* 2.445 1.430 – 4.180*Results of a multiple multivariate logistic regression analysis in a prediction model.
Proceedings of the 1st IPB International Conference on Nutrition and Food 2020 17
Malaysian Journal of Medicine and Health Sciences Vol.16 Supp 13, Dec 2020 (eISSN 2636-9346)
EXTENDED ABSTRACT
Consumers and Food Manufacturers Preferences for Front-of-Pack Nutrition Labelling in IndonesiaRimbawan Rimbawan1, Zuraidah Nasution1, Anna Vipta Resti Mauludyani1, Muhammad Aries1, Yusra Egayanti2, Sugeng Eko Irianto3
1 Department of Community Nutrition, Faculty of Human Ecology, IPB University, Bogor, Indonesia 166802 Directorate of Processed Food Standardization, Indonesia Food and Drug Authority, Jakarta, Indonesia 105603 Indonesian Nutrition Association, Jakarta, Indonesia 12320
Corresponding author’s email: [email protected]
SUMMARY
In Indonesia, front-of-pack (FoP) nutrition label is a voluntary action, which could potentially improve consumers’ understanding on nutrient profile of food products. This study assessed the preferences of consumers and food man-ufacturers in Indonesia for FoP nutrition label. A cross-sectional study using questionnaire was conducted involving 400 consumers and 117 food manufacturers, with six types of FoP mock label presented. The consumers were inter-viewed while the food manufacturers were surveyed online. The results indicated that the majority of consumers and small and medium enterprises preferred ‘healthier choice’ style, with information about energy, fat, sugar and salt deemed to be the most important information.
Keywords: Front-of-pack label, Healthier choice logo, Nutrition fact, Traffic light labelling
INTRODUCTION
Front-of-pack nutrition label can attract attention and encourage healthy eating behaviour in consumers through convenient label reading and enhanced attention to nutrient profile of food products (1, 2). The Indonesian FDA currently mandates all processed food to have nutrition facts consisting of total energy, fat, saturated fat, protein, carbohydrate, sugar, and salt. Meanwhile, FoP nutrition label is still a voluntary action, although there have been intensive discussions on making it compulsory. Several types of FoP nutrition label are used globally to present condensed nutrition information, where each type has its own benefits and might bring different behaviours from consumers (1). Decision on which type of FoP nutrition label to be implemented in a country has to be made carefully based on robust research evidence (3). This study aimed to investigate the preferred style of FoP nutrition label in Indonesia from the perspectives of general consumers and food manufacturers.
MATERIALS AND METHODS
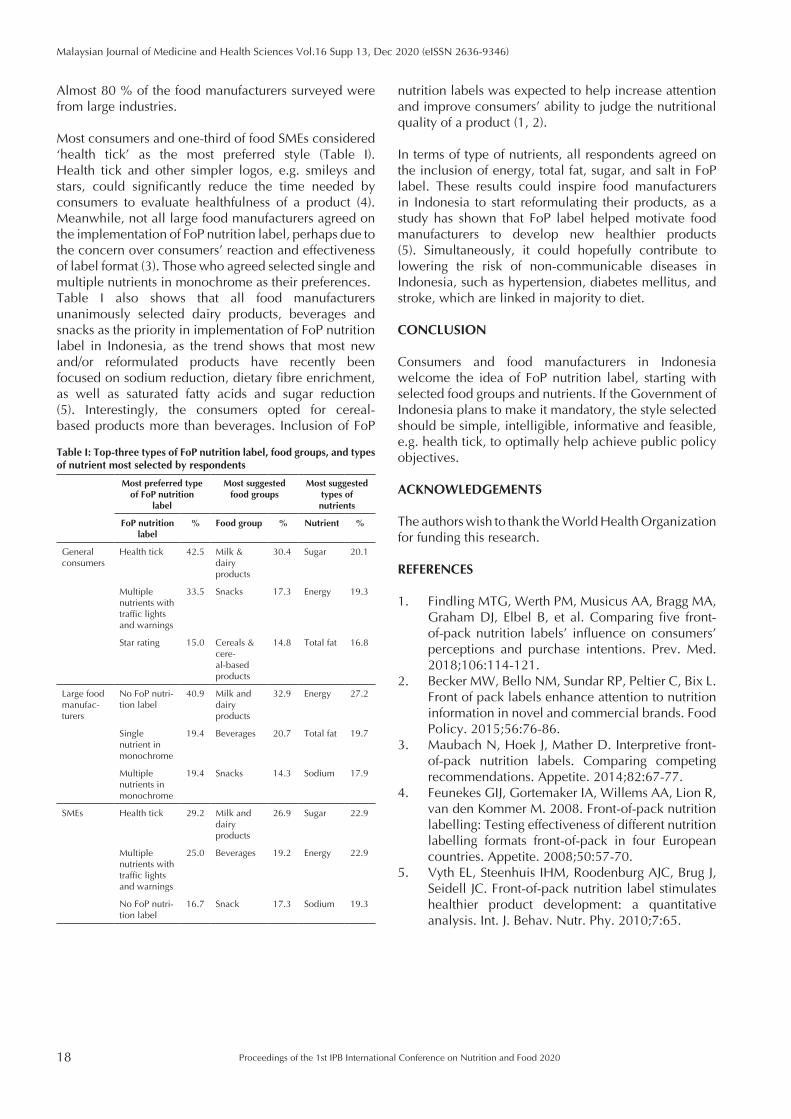
A cross-sectional study was conducted using a structured questionnaire from August to September 2018 in five cities in Indonesia: Jakarta, Bogor, Depok, Tangerang and Bekasi, by interviewing 400 general consumers. Simultaneously, a survey was also conducted online with 117 food manufacturers, involving large food manufacturers and small and medium enterprises
(SMEs). A control (no FoP label) and six styles of FoP mock label, which were based on existing labels used in other countries, were prepared (Fig. 1). The mock labels were included in the questionnaire along with information on each of them to help respondents understand the concept.
Fig. 1: FoP labels used in the survey: (A) single nutrient in monochrome, (B) multiple nutrients in monochrome, (C) multiple nutrients with traffic light colours, (D) multiple nu-trients with traffic light colours and warnings, (E) star rating, and (F) health tick
RESULTS AND DISCUSSION
The age of the respondents was almost equally split between older and younger than 23-year-old and 78.5 % of them were female. About one-third of the respondents were university students and 36 % were employees.
18
Malaysian Journal of Medicine and Health Sciences Vol.16 Supp 13, Dec 2020 (eISSN 2636-9346)
Proceedings of the 1st IPB International Conference on Nutrition and Food 2020
Almost 80 % of the food manufacturers surveyed were from large industries.
Most consumers and one-third of food SMEs considered ‘health tick’ as the most preferred style (Table I). Health tick and other simpler logos, e.g. smileys and stars, could significantly reduce the time needed by consumers to evaluate healthfulness of a product (4). Meanwhile, not all large food manufacturers agreed on the implementation of FoP nutrition label, perhaps due to the concern over consumers’ reaction and effectiveness of label format (3). Those who agreed selected single and multiple nutrients in monochrome as their preferences.Table I also shows that all food manufacturers unanimously selected dairy products, beverages and snacks as the priority in implementation of FoP nutrition label in Indonesia, as the trend shows that most new and/or reformulated products have recently been focused on sodium reduction, dietary fibre enrichment, as well as saturated fatty acids and sugar reduction (5). Interestingly, the consumers opted for cereal-based products more than beverages. Inclusion of FoP
nutrition labels was expected to help increase attention and improve consumers’ ability to judge the nutritional quality of a product (1, 2).
In terms of type of nutrients, all respondents agreed on the inclusion of energy, total fat, sugar, and salt in FoP label. These results could inspire food manufacturers in Indonesia to start reformulating their products, as a study has shown that FoP label helped motivate food manufacturers to develop new healthier products (5). Simultaneously, it could hopefully contribute to lowering the risk of non-communicable diseases in Indonesia, such as hypertension, diabetes mellitus, and stroke, which are linked in majority to diet.
CONCLUSION
Consumers and food manufacturers in Indonesia welcome the idea of FoP nutrition label, starting with selected food groups and nutrients. If the Government of Indonesia plans to make it mandatory, the style selected should be simple, intelligible, informative and feasible, e.g. health tick, to optimally help achieve public policy objectives.
ACKNOWLEDGEMENTS
The authors wish to thank the World Health Organization for funding this research.
REFERENCES
1. Findling MTG, Werth PM, Musicus AA, Bragg MA, Graham DJ, Elbel B, et al. Comparing five front-of-pack nutrition labels’ influence on consumers’ perceptions and purchase intentions. Prev. Med. 2018;106:114-121.
2. Becker MW, Bello NM, Sundar RP, Peltier C, Bix L. Front of pack labels enhance attention to nutrition information in novel and commercial brands. Food Policy. 2015;56:76-86.
3. Maubach N, Hoek J, Mather D. Interpretive front-of-pack nutrition labels. Comparing competing recommendations. Appetite. 2014;82:67-77.
4. Feunekes GIJ, Gortemaker IA, Willems AA, Lion R, van den Kommer M. 2008. Front-of-pack nutrition labelling: Testing effectiveness of different nutrition labelling formats front-of-pack in four European countries. Appetite. 2008;50:57-70.
5. Vyth EL, Steenhuis IHM, Roodenburg AJC, Brug J, Seidell JC. Front-of-pack nutrition label stimulates healthier product development: a quantitative analysis. Int. J. Behav. Nutr. Phy. 2010;7:65.
Table I: Top-three types of FoP nutrition label, food groups, and types of nutrient most selected by respondents
Most preferred type of FoP nutrition
label
Most suggested food groups
Most suggested types of nutrients
FoP nutrition label
% Food group % Nutrient %
General consumers
Health tick 42.5 Milk & dairy products
30.4 Sugar 20.1
Multiple nutrients with traffic lights and warnings
33.5 Snacks 17.3 Energy 19.3
Star rating 15.0 Cereals & cere-al-based products
14.8 Total fat 16.8
Large food manufac-turers
No FoP nutri-tion label
40.9 Milk and dairy products
32.9 Energy 27.2
Single nutrient in monochrome
19.4 Beverages 20.7 Total fat 19.7
Multiple nutrients in monochrome
19.4 Snacks 14.3 Sodium 17.9
SMEs Health tick 29.2 Milk and dairy products
26.9 Sugar 22.9
Multiple nutrients with traffic lights and warnings
25.0 Beverages 19.2 Energy 22.9
No FoP nutri-tion label
16.7 Snack 17.3 Sodium 19.3
Proceedings of the 1st IPB International Conference on Nutrition and Food 2020 19
Malaysian Journal of Medicine and Health Sciences Vol.16 Supp 13, Dec 2020 (eISSN 2636-9346)
EXTENDED ABSTRACT
The Effect of Interactive Nutrition Education on Knowledge, Attitude, and Practice of Primary School Children in Sub-Urban IndonesiaMuhammad Aries1, Hana Fitria Navratilova1, Khoirul Anwar2, Hardinsyah1
1 Department of Community Nutrition, Faculty of Human Ecology, IPB University, Bogor, Indonesia 16680 2 Nutrition Study Program, Faculty of Food Technology and Health, Sahid University, Jakarta, Indonesia
Corresponding author’s email: [email protected]
SUMMARY
Healthy eating and active lifestyle play a significant role in the health and development of school children. This study measured the effect of interactive nutrition education on knowledge, attitude, and practice of primary school children in suburban Indonesia. A quasi-experimental study using a questionnaire was conducted from August to November 2018 involving 220 school children aged 9 – 10 years old from SDN Gunung Batu 1 and 2. Nutrition knowledge, attitude and practice (KAP) scores of the participants show an improvement following the interactive nu-trition education implementation. The increasing practice scores in some participants may be due to multiple factors.
Keywords: Attitude, Interactive nutrition education, Knowledge, Practice
INTRODUCTION
Interactive nutrition education has an important role in helping children aged 9–10 years old to develop good nutritional KAP. This specific method is considered to have better effectiveness in increasing KAP because the targets are involved actively and the topics are closely related to their daily life. Furthermore, the interactive delivery methods are in the game format which encourage targets to perform some physical activities they prefer. Good nutritional KAP also plays a significant role in targets’ school achievement because children at this age are at risk of experiencing nutrition and health problems which can interfere their educational process (1, 2). The objective of this study was to measure the effectiveness of interactive nutrition education in increasing their nutritional KAP. Nutrition interventions are necessary for various areas, including suburban because these areas have very high information exposure that will affect children’s nutritional KAP.
MATERIALS AND METHODS
This study was conducted at SDN Gunung Batu 1 and 2, Bogor, West Java, which are located in a suburban area. Participants of this study were 3rd and 4th-grade students from both schools, who were willing to participate and get their parents’ permission to take part in the research activities. Those participants will be
excluded if did not fully participate. The intervention was conducted weekly and required 30-45 minutes per session. The implemented kit was based on the previously reported method (3, 4). Briefly, the kit has some forms (guide book, game cards) designed colourfully and interestingly. This kit was developed by the Technical Working Group (TWG) that consists of academics, professionals, and school teachers from the target schools. The research data collected included the pre-post KAP (by questionnaire) and nutritional status (by anthropometric measurement). In addition, before the study was conducted, the TWG obtained a recommendation letter from Bogor Educational Office No. 421.2/2.7.37–SD.
RESULTS AND DISCUSSION
Questions that many participants answered incorrectly (<20%) in the pre-activity survey include examples of food that should be limited regarding obesity and diabetic issues and protein-containing foods. After the lessons, more participants (84.1%) managed to provide correct answers (Table I). Most of them had better nutritional knowledge scores after the lessons and the majority had good (60 – 70) scores. There is one question that slightly decreases to be answered correctly and this question was about an example of whole-grain. However, this finding was relevant because the whole-grain food is a type of food that is rarely accessed by the participants.
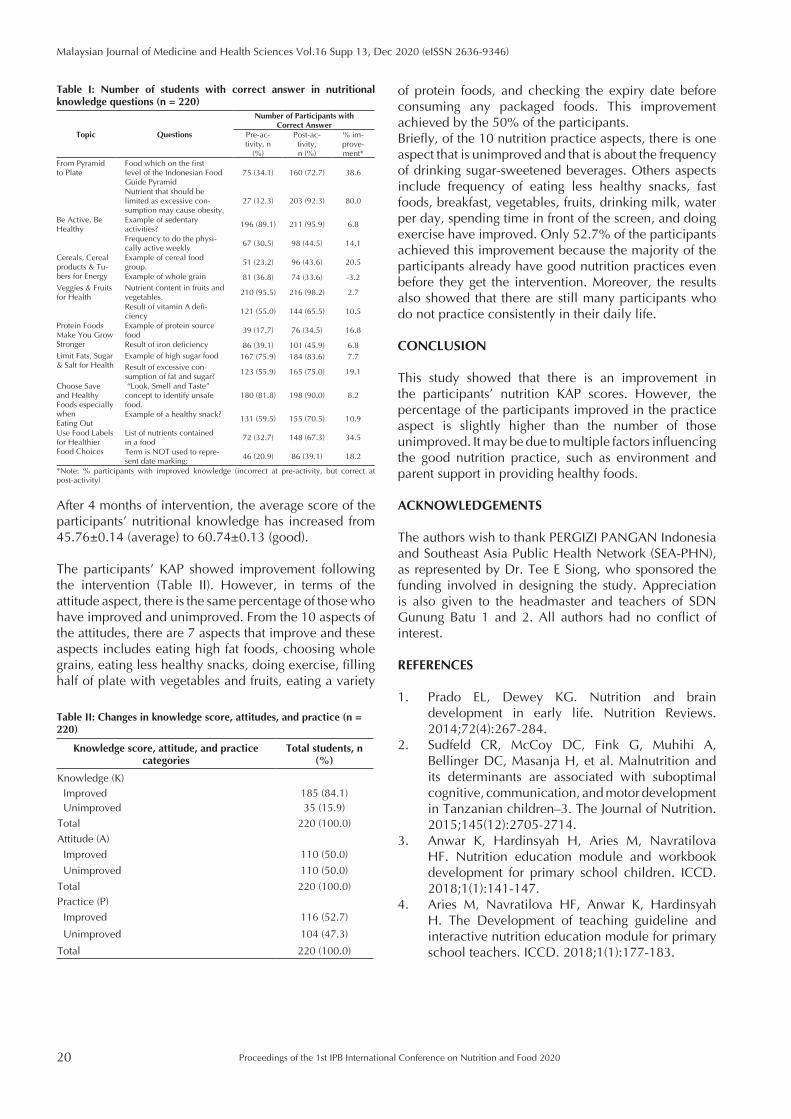
20
Malaysian Journal of Medicine and Health Sciences Vol.16 Supp 13, Dec 2020 (eISSN 2636-9346)
Proceedings of the 1st IPB International Conference on Nutrition and Food 2020
of protein foods, and checking the expiry date before consuming any packaged foods. This improvement achieved by the 50% of the participants. Briefly, of the 10 nutrition practice aspects, there is one aspect that is unimproved and that is about the frequency of drinking sugar-sweetened beverages. Others aspects include frequency of eating less healthy snacks, fast foods, breakfast, vegetables, fruits, drinking milk, water per day, spending time in front of the screen, and doing exercise have improved. Only 52.7% of the participants achieved this improvement because the majority of the participants already have good nutrition practices even before they get the intervention. Moreover, the results also showed that there are still many participants who do not practice consistently in their daily life. CONCLUSION
This study showed that there is an improvement in the participants’ nutrition KAP scores. However, the percentage of the participants improved in the practice aspect is slightly higher than the number of those unimproved. It may be due to multiple factors influencing the good nutrition practice, such as environment and parent support in providing healthy foods.
ACKNOWLEDGEMENTS
The authors wish to thank PERGIZI PANGAN Indonesia and Southeast Asia Public Health Network (SEA-PHN), as represented by Dr. Tee E Siong, who sponsored the funding involved in designing the study. Appreciation is also given to the headmaster and teachers of SDN Gunung Batu 1 and 2. All authors had no conflict of interest.
REFERENCES
1. Prado EL, Dewey KG. Nutrition and brain development in early life. Nutrition Reviews. 2014;72(4):267-284.
2. Sudfeld CR, McCoy DC, Fink G, Muhihi A, Bellinger DC, Masanja H, et al. Malnutrition and its determinants are associated with suboptimal cognitive, communication, and motor development in Tanzanian children–3. The Journal of Nutrition. 2015;145(12):2705-2714.
3. Anwar K, Hardinsyah H, Aries M, Navratilova HF. Nutrition education module and workbook development for primary school children. ICCD. 2018;1(1):141-147.
4. Aries M, Navratilova HF, Anwar K, Hardinsyah H. The Development of teaching guideline and interactive nutrition education module for primary school teachers. ICCD. 2018;1(1):177-183.
After 4 months of intervention, the average score of the participants’ nutritional knowledge has increased from 45.76±0.14 (average) to 60.74±0.13 (good).
The participants’ KAP showed improvement following the intervention (Table II). However, in terms of the attitude aspect, there is the same percentage of those who have improved and unimproved. From the 10 aspects of the attitudes, there are 7 aspects that improve and these aspects includes eating high fat foods, choosing whole grains, eating less healthy snacks, doing exercise, filling half of plate with vegetables and fruits, eating a variety
Table I: Number of students with correct answer in nutritional knowledge questions (n = 220)
Topic Questions
Number of Participants with Correct Answer
Pre-ac-tivity, n
(%)
Post-ac-tivity, n (%)
% im-prove-ment*
From Pyramid to Plate
Food which on the first level of the Indonesian Food Guide Pyramid
75 (34.1) 160 (72.7) 38.6
Nutrient that should be limited as excessive con-sumption may cause obesity.
27 (12.3) 203 (92.3) 80.0
Be Active, Be Healthy
Example of sedentary activities?
196 (89.1) 211 (95.9) 6.8
Frequency to do the physi-cally active weekly
67 (30.5) 98 (44.5) 14.1
Cereals, Cereal products & Tu-bers for Energy
Example of cereal food group.
51 (23.2) 96 (43.6) 20.5
Example of whole grain 81 (36.8) 74 (33.6) -3.2Veggies & Fruits for Health
Nutrient content in fruits and vegetables.
210 (95.5) 216 (98.2) 2.7
Result of vitamin A defi-ciency
121 (55.0) 144 (65.5) 10.5
Protein Foods Make You Grow Stronger
Example of protein source food
39 (17.7) 76 (34.5) 16.8
Result of iron deficiency 86 (39.1) 101 (45.9) 6.8Limit Fats, Sugar & Salt for Health
Example of high sugar food 167 (75.9) 184 (83.6) 7.7Result of excessive con-sumption of fat and sugar?
123 (55.9) 165 (75.0) 19.1
Choose Save and Healthy Foods especially when Eating Out
“Look, Smell and Taste” concept to identify unsafe food.
180 (81.8) 198 (90.0) 8.2
Example of a healthy snack?131 (59.5) 155 (70.5) 10.9
Use Food Labels for Healthier Food Choices
List of nutrients contained in a food
72 (32.7) 148 (67.3) 34.5
Term is NOT used to repre-sent date marking:
46 (20.9) 86 (39.1) 18.2
*Note: % participants with improved knowledge (incorrect at pre-activity, but correct at post-activity)
Table II: Changes in knowledge score, attitudes, and practice (n = 220)
Knowledge score, attitude, and practice categories
Total students, n (%)
Knowledge (K)
Improved 185 (84.1)Unimproved 35 (15.9)
Total 220 (100.0)
Attitude (A)
Improved 110 (50.0)
Unimproved 110 (50.0)
Total 220 (100.0)
Practice (P)
Improved 116 (52.7)
Unimproved 104 (47.3)
Total 220 (100.0)
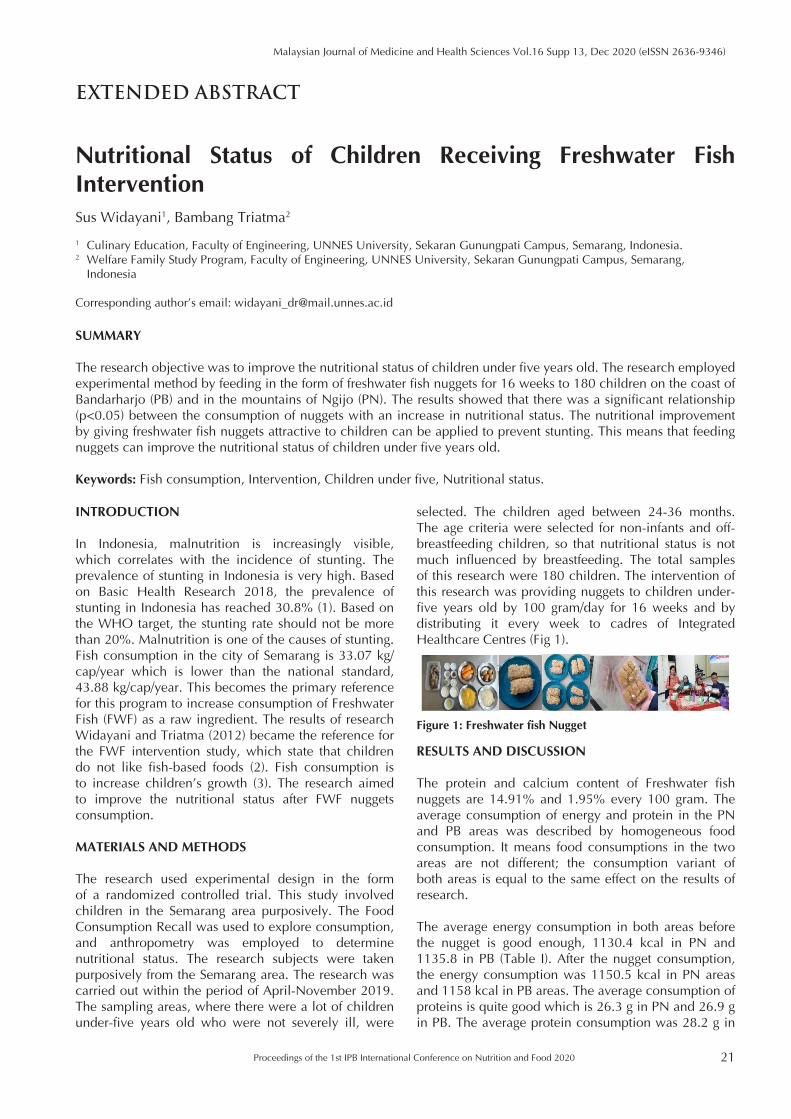
Proceedings of the 1st IPB International Conference on Nutrition and Food 2020 21
Malaysian Journal of Medicine and Health Sciences Vol.16 Supp 13, Dec 2020 (eISSN 2636-9346)
EXTENDED ABSTRACT
Nutritional Status of Children Receiving Freshwater Fish InterventionSus Widayani1, Bambang Triatma2
1 Culinary Education, Faculty of Engineering, UNNES University, Sekaran Gunungpati Campus, Semarang, Indonesia.2 Welfare Family Study Program, Faculty of Engineering, UNNES University, Sekaran Gunungpati Campus, Semarang,
Indonesia
Corresponding author’s email: [email protected]
SUMMARY
The research objective was to improve the nutritional status of children under five years old. The research employed experimental method by feeding in the form of freshwater fish nuggets for 16 weeks to 180 children on the coast of Bandarharjo (PB) and in the mountains of Ngijo (PN). The results showed that there was a significant relationship (p<0.05) between the consumption of nuggets with an increase in nutritional status. The nutritional improvement by giving freshwater fish nuggets attractive to children can be applied to prevent stunting. This means that feeding nuggets can improve the nutritional status of children under five years old.
Keywords: Fish consumption, Intervention, Children under five, Nutritional status.
INTRODUCTION
In Indonesia, malnutrition is increasingly visible, which correlates with the incidence of stunting. The prevalence of stunting in Indonesia is very high. Based on Basic Health Research 2018, the prevalence of stunting in Indonesia has reached 30.8% (1). Based on the WHO target, the stunting rate should not be more than 20%. Malnutrition is one of the causes of stunting. Fish consumption in the city of Semarang is 33.07 kg/cap/year which is lower than the national standard, 43.88 kg/cap/year. This becomes the primary reference for this program to increase consumption of Freshwater Fish (FWF) as a raw ingredient. The results of research Widayani and Triatma (2012) became the reference for the FWF intervention study, which state that children do not like fish-based foods (2). Fish consumption is to increase children’s growth (3). The research aimed to improve the nutritional status after FWF nuggets consumption.
MATERIALS AND METHODS
The research used experimental design in the form of a randomized controlled trial. This study involved children in the Semarang area purposively. The Food Consumption Recall was used to explore consumption, and anthropometry was employed to determine nutritional status. The research subjects were taken purposively from the Semarang area. The research was carried out within the period of April-November 2019. The sampling areas, where there were a lot of children under-five years old who were not severely ill, were
selected. The children aged between 24-36 months. The age criteria were selected for non-infants and off-breastfeeding children, so that nutritional status is not much influenced by breastfeeding. The total samples of this research were 180 children. The intervention of this research was providing nuggets to children under-five years old by 100 gram/day for 16 weeks and by distributing it every week to cadres of Integrated Healthcare Centres (Fig 1).
Figure 1: Freshwater fish Nugget
RESULTS AND DISCUSSION
The protein and calcium content of Freshwater fish nuggets are 14.91% and 1.95% every 100 gram. The average consumption of energy and protein in the PN and PB areas was described by homogeneous food consumption. It means food consumptions in the two areas are not different; the consumption variant of both areas is equal to the same effect on the results of research.
The average energy consumption in both areas before the nugget is good enough, 1130.4 kcal in PN and 1135.8 in PB (Table I). After the nugget consumption, the energy consumption was 1150.5 kcal in PN areas and 1158 kcal in PB areas. The average consumption of proteins is quite good which is 26.3 g in PN and 26.9 g in PB. The average protein consumption was 28.2 g in
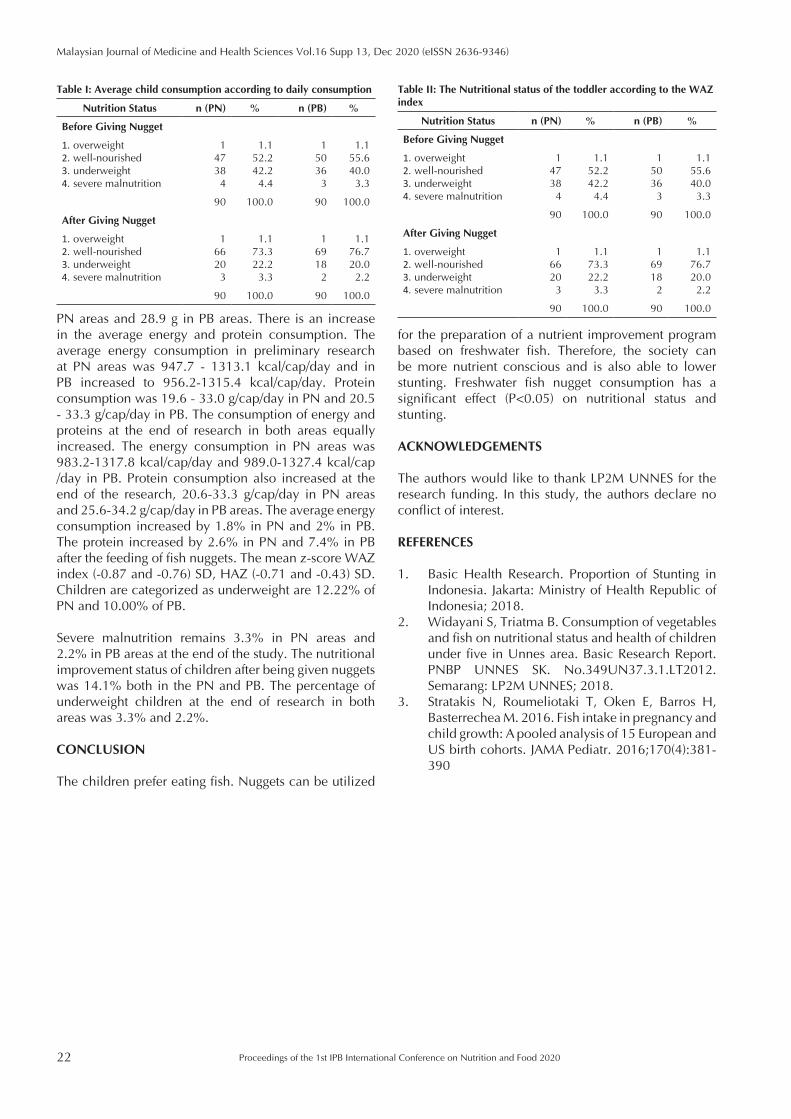
22
Malaysian Journal of Medicine and Health Sciences Vol.16 Supp 13, Dec 2020 (eISSN 2636-9346)
Proceedings of the 1st IPB International Conference on Nutrition and Food 2020
for the preparation of a nutrient improvement program based on freshwater fish. Therefore, the society can be more nutrient conscious and is also able to lower stunting. Freshwater fish nugget consumption has a significant effect (P<0.05) on nutritional status and stunting.
ACKNOWLEDGEMENTS
The authors would like to thank LP2M UNNES for the research funding. In this study, the authors declare no conflict of interest.
REFERENCES
1. Basic Health Research. Proportion of Stunting in Indonesia. Jakarta: Ministry of Health Republic of Indonesia; 2018.
2. Widayani S, Triatma B. Consumption of vegetables and fish on nutritional status and health of children under five in Unnes area. Basic Research Report. PNBP UNNES SK. No.349UN37.3.1.LT2012. Semarang: LP2M UNNES; 2018.
3. Stratakis N, Roumeliotaki T, Oken E, Barros H, Basterrechea M. 2016. Fish intake in pregnancy and child growth: A pooled analysis of 15 European and US birth cohorts. JAMA Pediatr. 2016;170(4):381-390
PN areas and 28.9 g in PB areas. There is an increase in the average energy and protein consumption. The average energy consumption in preliminary research at PN areas was 947.7 - 1313.1 kcal/cap/day and in PB increased to 956.2-1315.4 kcal/cap/day. Protein consumption was 19.6 - 33.0 g/cap/day in PN and 20.5 - 33.3 g/cap/day in PB. The consumption of energy and proteins at the end of research in both areas equally increased. The energy consumption in PN areas was 983.2-1317.8 kcal/cap/day and 989.0-1327.4 kcal/cap /day in PB. Protein consumption also increased at the end of the research, 20.6-33.3 g/cap/day in PN areas and 25.6-34.2 g/cap/day in PB areas. The average energy consumption increased by 1.8% in PN and 2% in PB. The protein increased by 2.6% in PN and 7.4% in PB after the feeding of fish nuggets. The mean z-score WAZ index (-0.87 and -0.76) SD, HAZ (-0.71 and -0.43) SD. Children are categorized as underweight are 12.22% of PN and 10.00% of PB.
Severe malnutrition remains 3.3% in PN areas and 2.2% in PB areas at the end of the study. The nutritional improvement status of children after being given nuggets was 14.1% both in the PN and PB. The percentage of underweight children at the end of research in both areas was 3.3% and 2.2%.
CONCLUSION
The children prefer eating fish. Nuggets can be utilized
Table I: Average child consumption according to daily consumption
Nutrition Status n (PN) % n (PB) %
Before Giving Nugget
1. overweight 2. well-nourished3. underweight4. severe malnutrition
147384
1.152.242.24.4
150363
1.155.640.03.3
90 100.0 90 100.0
After Giving Nugget
1. overweight 2. well-nourished3. underweight4. severe malnutrition
166203
1.173.322.23.3
169182
1.176.720.02.2
90 100.0 90 100.0
Table II: The Nutritional status of the toddler according to the WAZ index
Nutrition Status n (PN) % n (PB) %
Before Giving Nugget
1. overweight 2. well-nourished3. underweight4. severe malnutrition
147384
1.152.242.24.4
150363
1.155.640.03.3
90 100.0 90 100.0
After Giving Nugget
1. overweight 2. well-nourished3. underweight4. severe malnutrition
166203
1.173.322.23.3
169182
1.176.720.02.2
90 100.0 90 100.0
Proceedings of the 1st IPB International Conference on Nutrition and Food 2020 23
Malaysian Journal of Medicine and Health Sciences Vol.16 Supp 13, Dec 2020 (eISSN 2636-9346)
EXTENDED ABSTRACT
Economic Status, Stunting and Diet Quality as Important Determinants of Anaemia among Indonesian Children aged 6-35 Months Old: A SEANUTS StudyFitrah Ernawati1, Yessi Octaria2, Yekti Widodo3
1 Center of Research and Development for Biomedical and Basic Technology of Health, National Institute of Health Research and Development Indonesia, Indonesia
2 Center for Public Health Innovation, Faculty of Medicine Udayana University, Denpasar, Indonesia3 Center of Research and development in Public Health Efforts, National Institute of Health Research and Development
Indonesia, Indonesia
Corresponding author’s email: [email protected]
SUMMARY
More than half of Indonesian children in their golden age period of 6-35 months are anaemic. In order to solve this problem, a more effective approach needs to be designed to identify the determining factors. The study objective is to analyse determinants of anaemia among children aged 6-35 months. We conducted secondary data analysis using the SEANUTS cross sectional survey for Indonesia. Our study found that the children’s haemoglobin levels were associated with economic status, stunting, and diet quality. Hence, nutrition sensitive and nutrition specific intervention are both pivotal for prevention of anaemia in young children.
Keywords: Children aged 6-35 months, Diet quality, Haemoglobin concentration, Economic status
INTRODUCTION
Anaemia in early childhood has a significant effect on human resources quality. In Indonesia, the prevalence of anaemia was considered high to very high, especially in young children where more than half (55%) of Indonesian children under 2 years old were anaemic.1 Many country wide studies have found that children’s age, residential areas, nutritional status and family wealth are significant predictors for anaemia among young children in developing countries.2,3 From this knowledge on the possible determinants of anaemia, this study aimed to analysed the available South East Asian Nutrition Survey (SEANUTS) data on anaemia in Indonesian children aged 6-35 months old in relation to their economic variables, nutrient intake and their anthropometric status. The result will provide insights useful for addressing the problem of high prevalence of anaemia among young children in Indonesia.
MATERIALS AND METHODS
For data analysis, we extracted 578 samples of children aged 6-35 months from the SEANUTS data and weighted the data to represent the national level. Details of the SEANUTS methodology for data collection is published elsewhere.4 Weight factors were based on the 2010
census data on the number of children in specific age groups. Independent variables for this study are economic status, children’s height and weight as well as protein and energy intake. The children were classified into two age groups: 6-12 months and 12.1-35 months. We conducted a two-way ANOVA test and set the significance at p<0.05 to determine the variables associated with haemoglobin (Hb) level, using the IBM SPSS 17 software. Only variables with significant difference in mean Hb are presented in this extended abstract.
RESULTS AND DISCUSSION
There were 25.6% of children aged 6-12 months and 74.4% of children aged 12.1-35 months. More children were from rural area (57.7%) compared to urban area (42.3%). The mean Hb level was 111.3 g/dl (SD = 13.4 g/dl). The anaemia prevalence among children aged 6-35 months was 43.1%. Summary of the ANOVA test is presented in Table I.
We found no significant associations between economic level and nutritional status with mean Hb in children under 12 months old. However, in older children we found a significant difference in mean Hb between different economic status (p=0.023). Our
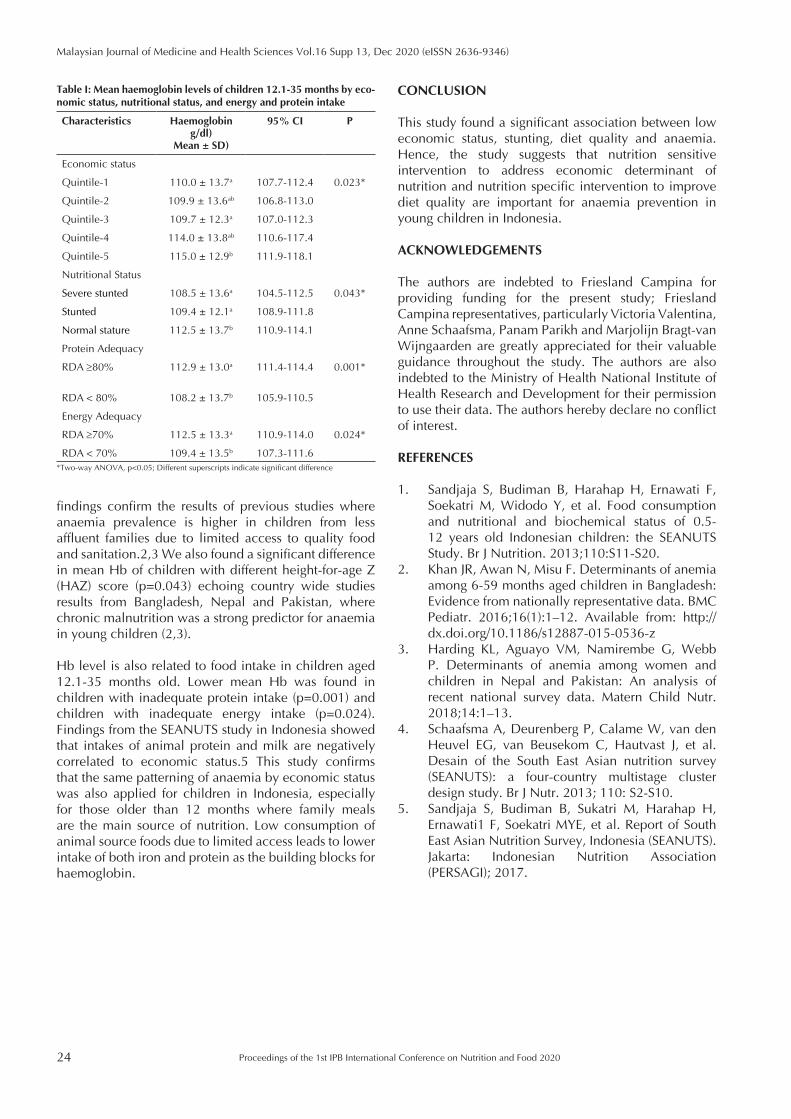
24
Malaysian Journal of Medicine and Health Sciences Vol.16 Supp 13, Dec 2020 (eISSN 2636-9346)
Proceedings of the 1st IPB International Conference on Nutrition and Food 2020
CONCLUSION
This study found a significant association between low economic status, stunting, diet quality and anaemia. Hence, the study suggests that nutrition sensitive intervention to address economic determinant of nutrition and nutrition specific intervention to improve diet quality are important for anaemia prevention in young children in Indonesia.
ACKNOWLEDGEMENTS
The authors are indebted to Friesland Campina for providing funding for the present study; Friesland Campina representatives, particularly Victoria Valentina, Anne Schaafsma, Panam Parikh and Marjolijn Bragt-van Wijngaarden are greatly appreciated for their valuable guidance throughout the study. The authors are also indebted to the Ministry of Health National Institute of Health Research and Development for their permission to use their data. The authors hereby declare no conflict of interest.
REFERENCES
1. Sandjaja S, Budiman B, Harahap H, Ernawati F, Soekatri M, Widodo Y, et al. Food consumption and nutritional and biochemical status of 0.5-12 years old Indonesian children: the SEANUTS Study. Br J Nutrition. 2013;110:S11-S20.
2. Khan JR, Awan N, Misu F. Determinants of anemia among 6-59 months aged children in Bangladesh: Evidence from nationally representative data. BMC Pediatr. 2016;16(1):1–12. Available from: http://dx.doi.org/10.1186/s12887-015-0536-z
3. Harding KL, Aguayo VM, Namirembe G, Webb P. Determinants of anemia among women and children in Nepal and Pakistan: An analysis of recent national survey data. Matern Child Nutr. 2018;14:1–13.
4. Schaafsma A, Deurenberg P, Calame W, van den Heuvel EG, van Beusekom C, Hautvast J, et al. Desain of the South East Asian nutrition survey (SEANUTS): a four-country multistage cluster design study. Br J Nutr. 2013; 110: S2-S10.
5. Sandjaja S, Budiman B, Sukatri M, Harahap H, Ernawati1 F, Soekatri MYE, et al. Report of South East Asian Nutrition Survey, Indonesia (SEANUTS). Jakarta: Indonesian Nutrition Association (PERSAGI); 2017.
findings confirm the results of previous studies where anaemia prevalence is higher in children from less affluent families due to limited access to quality food and sanitation.2,3 We also found a significant difference in mean Hb of children with different height-for-age Z (HAZ) score (p=0.043) echoing country wide studies results from Bangladesh, Nepal and Pakistan, where chronic malnutrition was a strong predictor for anaemia in young children (2,3).
Hb level is also related to food intake in children aged 12.1-35 months old. Lower mean Hb was found in children with inadequate protein intake (p=0.001) and children with inadequate energy intake (p=0.024). Findings from the SEANUTS study in Indonesia showed that intakes of animal protein and milk are negatively correlated to economic status.5 This study confirms that the same patterning of anaemia by economic status was also applied for children in Indonesia, especially for those older than 12 months where family meals are the main source of nutrition. Low consumption of animal source foods due to limited access leads to lower intake of both iron and protein as the building blocks for haemoglobin.
Table I: Mean haemoglobin levels of children 12.1-35 months by eco-nomic status, nutritional status, and energy and protein intake
Characteristics Haemoglobin g/dl)
Mean ± SD)
95% CI P
Economic status
Quintile-1 110.0 ± 13.7a 107.7-112.4 0.023*
Quintile-2 109.9 ± 13.6ab 106.8-113.0
Quintile-3 109.7 ± 12.3a 107.0-112.3
Quintile-4 114.0 ± 13.8ab 110.6-117.4
Quintile-5 115.0 ± 12.9b 111.9-118.1
Nutritional Status
Severe stunted 108.5 ± 13.6a 104.5-112.5 0.043*
Stunted 109.4 ± 12.1a 108.9-111.8
Normal stature 112.5 ± 13.7b 110.9-114.1
Protein Adequacy
RDA ≥80% 112.9 ± 13.0a 111.4-114.4 0.001*
RDA < 80% 108.2 ± 13.7b 105.9-110.5
Energy Adequacy
RDA ≥70% 112.5 ± 13.3a 110.9-114.0 0.024*
RDA < 70% 109.4 ± 13.5b 107.3-111.6*Two-way ANOVA, p<0.05; Different superscripts indicate significant difference
Proceedings of the 1st IPB International Conference on Nutrition and Food 2020 25
Malaysian Journal of Medicine and Health Sciences Vol.16 Supp 13, Dec 2020 (eISSN 2636-9346)
EXTENDED ABSTRACT
Exclusive Breastfeeding for Preventing the Occurrence of Wasting among Under-Five Children in Guntung Payung, BanjarbaruMuhammad Irwan Setiawan1, Husaini2, Fahrini Yulidasari1, Lia Anggraini1, Andini Oktaviana Putri1, Nur Laily1, Meitria Syahadatina Noor3, Fauzie Rahman1, Vina Yulia Anhar1, Anggun Wulandari1, Ayu Riana Sari1, Dian Rosadi1
1 Public Health Department, Faculty of Medicine, Lambung Mangkurat University2 Magister of Public Health Department, Faculty of Medicine, Lambung Mangkurat University3 Faculty of Medicine, Lambung Mangkurat University
Corresponding author’s email: [email protected]
SUMMARY
Wasting is a growth failure based on weight for height z-score due to chronic lack of nutrition. The purpose of this study was to analyze the relationship between parity, family size, exclusive breastfeeding and complete basic immu-nization, and the prevalance of wasting among under-five children in Guntung Payung Community Health Center Banjarbaru. A case control design was conducted on 60 respondents (30 controls and 30 wasting). These variabels were analyzed by Chi-square test. The results showed that mothers who do not provide exclusive breastfeeding (p<0.036) are 3.6 times more likely to have wasted children.
Keywords: Exclusive breastfeeding, Under-five children, Wasting
INTRODUCTION
Wasting is a chronic malnutrition of under-five children which is characterized by failure of optimal growth as measured by weight for height z-score (WHZ). Around 13.5% of Indonesian under-five children experience wasting, which ranks 12th highest in the world (1). The prevalence of wasting in Banjarbaru City is 9%. In the area of Guntung Payung Health Center, Landasan Ulin District, the prevalence is 10.3%. So, it can be considered a serious problem. Wasting can decrease intellectual performance, negatively affect work capacity, and increase mortality in children (2,3). Parity, number of families, history of exclusive breastfeeding and complete basic immunization are factors associated with wasting among under-five children (4). This study aims to investigate these factors related to wasting among under-five children in the area of Guntung Payung Public Health Center, Banjarbaru City.
MATERIALS AND METHODS
A case-control study was conducted involving 60 under-five children (aged 12-59 months): 30 controls and 30 wasting. Wasting children were categorized based on WHZ -3 to <-2 SD. Parity data, family size, exclusive breastfeeding and complete basic immunization
were collected using the questionnaire. Exclusive breastfeeding was determined by choosing the history of exclusive breastfeeding, then verified by the type of food given for the age of under 6 months. The 2x2 chi-square test was used to analyze these variables.
RESULTS AND DISCUSSION
Table I shows that there is a significant relationship between the history of exclusive breastfeeding and wasting among under-five children (p = 0.036, OR: 3.596), meaning that mothers who do not provide exclusive breastfeeding have a 3.6 times risk of having a wasted children. Exclusive breastfeeding is one of the indicators of success in fulfilling the nutrition of under-five children, affecting their growth and development (5). The high number of mothers of under-five children who are involved in economic activities as active workers in various sectors might reduce the fulfillment of exclusive breastfeeding for under-five children, so that the risk of malnutrition is higher. Exclusive breastfeeding plays an important role in the prevention of malnutrition in childhood, including wasting, stunting, overweight, underweight, and micronutrient deficiencies. The risk of infectious diseases can also be minimized by exclusive breastfeeding. On the other hand, we cannot prove the relationship between parity, family size, complete basic
26
Malaysian Journal of Medicine and Health Sciences Vol.16 Supp 13, Dec 2020 (eISSN 2636-9346)
Proceedings of the 1st IPB International Conference on Nutrition and Food 2020
REFERENCES
1. Indonesian Ministry of Health. Main Results of Basic Health Research 2018. Jakarta: Ministry of Health of the Republic of Indonesia; 2018.
2. Simanjuntak BY, Haya M, Suryani D, Khomsan A, Ahmad CA. Maternal knowledge, attitude, and practices about traditional food feeding with stunting and wasting of toddlers in farmer families. Kesmas: National Public Health Journal. 2019;14(2):58-64.
3. Ahishakiye A, Abimana MC, Beck K, Miller AC, Betancourt TS, Magge H, et al. Developmental outcomes of preterm and low birth weight toddlers and term peers in Rwanda. Annals of Global Health. 2019; 85(1).
4. Khairunnas K, Husna A, Marniati M. The relationship of socio-economic with nutritional status in toddlers in Meureubo Sub-District West Aceh Regency. Journal of Nutrition Science. 2020;15;1(1):6-10.
5. Victora CG, Bahl R, Barros AJ, França GV, Horton S, Krasevec J, et al. Breastfeeding in the 21st century: epidemiology, mechanisms, and lifelong effect. The Lancet. 2016; 387(10017):475-90.
immunization and wasted children.
CONCLUSION
Our study suggests that mothers who do not provide exclusive breastfeeding are 3.6 times more likely to have wasted children. On the other hand, parity status, family size, and complete basic immunization have no relationship with wasted children. It seems that breastfeeding prevents the occurrence of wasted among under-five children.
Table I: Correlation of parity, family size, exclusive breastfeeding, complete basic immunization on wasting under five children.
Category Case Controln
(60)p
value
Parity1 10(33.3%) 6(20%) 16
0.381>1 20(66.7%) 24(80%) 44
Family size>4 19(63.3%) 14(46.7%) 27
0.2991-4 11(36.7%) 16(53.3%) 33
Complete basic immunization
Incomplete 3(10%) 4(13.3%) 71.000
Complete 27(90%) 26(86.7%) 53
Exclusive breastfeeding
No 22(73.3%) 13(43.3%) 350.036†
Yes 8(26.7%) 17(56.7%) 25†Significant at p<0.05, 95%CI: 3.596 (1.216-10.638)
Proceedings of the 1st IPB International Conference on Nutrition and Food 2020 27
Malaysian Journal of Medicine and Health Sciences Vol.16 Supp 13, Dec 2020 (eISSN 2636-9346)
EXTENDED ABSTRACT
Relationship between Breakfast Types and Blood Glucose Level and Short-Term Memory of Elementary School Children in Bogor, IndonesiaLilik Kustiyah, Cindy Carissa, Faisal Anwar
Department of Community Nutrition, Faculty of Human Ecology, IPB University, Bogor 16680 Indonesia
Corresponding author’s email: [email protected]
SUMMARY
Breakfast consumption has a positive effect on blood glucose level (BGL) and short-term memory (STM) of elemen-tary school children (ESC). This research aimed to analyze the effect of different breakfast types on BGL and STM of ESC. Quasi-experimental study was conducted on 90 ESC. Subjects were divided randomly into control group (C), fried rice with egg group (RE), and fried instant noodles with egg group (NE). The BGL and STM of subjects were sig-nificantly higher after provision of breakfast. There was a positive significant correlation between breakfast type and STM. Breakfast with better nutrient profile increased BGL and STM better than breakfast with lower nutrient profile.
Keywords: Blood glucose level, Nutrient profile of breakfast, Breakfast type, School-aged children, Short-term mem-ory
INTRODUCTION
Breakfast consumption has a positive effect on BGL and STM of ESC (1). School children who do not eat breakfast will have low blood glucose level; therefore, the energy supply for brain work decreases (2). Breakfast type should be considered because they contain different nutrients. The type of breakfast menu is better if it consists of a variety of food sources containing energy, protein, and other nutrients. The different types of breakfast might also relate to nutrient profiles. There are some foods usually eaten as breakfast, such as rice, noodles, bread, egg, etc. However, in Indonesia, there are no studies analyzing the effect of different types of breakfast on BGL and STM. This research aimed to analyze the effect of different breakfast type on BGL and STM of ESC.
MATERIALS AND METHODS
Quasi-experimental study was conducted on 90 ESC aged 10-12 years old from one public elementary school in Bogor. This research had received approval from the IPB ethics commission number 083/IT3.KEPMSM-IPB/SK/2018. Subjects were randomly divided into three groups, as follows: control group (C), fried rice with egg group (RE) and fried instant noodles with egg group (NE). Rice and instant noodles were selected as intervention breakfast because ESC frequently eat these two food types for breakfast. Pre-test measurement was done before intervention and post-test measurement
was done 1 hour after intervention. The intervention was only done once. As for C group, breakfast was not given before the measurement of BGL and STM, but was given after the measurement of BGL and STM were finished. Subjects’ STM was estimated using word list and figure test (1). Mann-Whitney, Kruskal Wallis, Wilcoxon and Spearman test were used for statistical analysis.
RESULTS AND DISCUSSION
The result showed that not having breakfast (C group) caused BGL to decrease. BGL of C group subjects decreased approximately 1 hour after the intervention. BGL of RE subjects were significantly higher than that of C and NE subjects after intervention. STM of subjects was significantly higher after the provision of breakfast. Even though STM of RE subjects was not significantly different from that with NE, STM of RE subjects tended to be higher than that of NE subjects after intervention (Table I). RE can maintain BGL longer than NE. Moreover, this research showed there was a positive significant correlation between BGL and STM of word (p=0.023, r=0.240) and STM of figure (p=0.044, r=0.213). Spearman correlation test also showed that the provision of RE increased STM of word (p=0.004, r=0.302) and the figure (p=0.000, r=0.402) was higher than NE and C, respectively. The composition of the type of carbohydrate of the two types of breakfast intervention was quite different. Complex carbohydrates in rice are digested longer. Therefore, the increase of
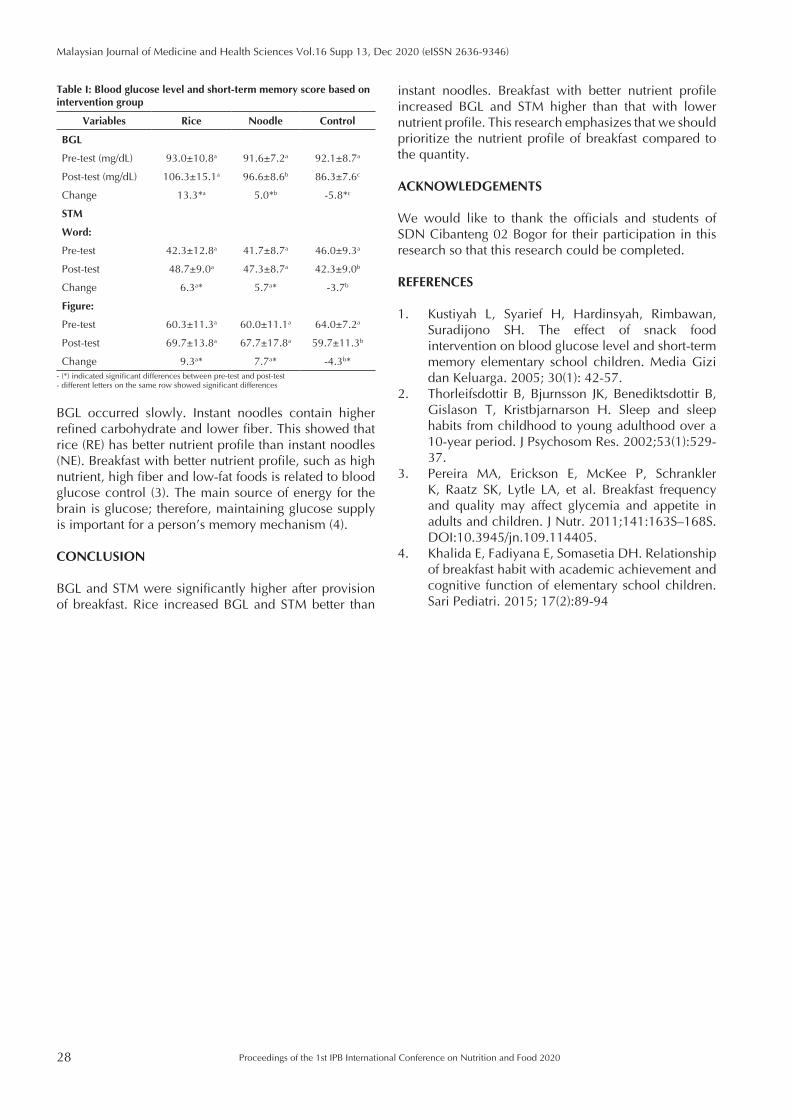
28
Malaysian Journal of Medicine and Health Sciences Vol.16 Supp 13, Dec 2020 (eISSN 2636-9346)
Proceedings of the 1st IPB International Conference on Nutrition and Food 2020
instant noodles. Breakfast with better nutrient profile increased BGL and STM higher than that with lower nutrient profile. This research emphasizes that we should prioritize the nutrient profile of breakfast compared to the quantity.
ACKNOWLEDGEMENTS
We would like to thank the officials and students of SDN Cibanteng 02 Bogor for their participation in this research so that this research could be completed. REFERENCES
1. Kustiyah L, Syarief H, Hardinsyah, Rimbawan, Suradijono SH. The effect of snack food intervention on blood glucose level and short-term memory elementary school children. Media Gizi dan Keluarga. 2005; 30(1): 42-57.
2. Thorleifsdottir B, Björnsson JK, Benediktsdottir B, Gislason T, Kristbjarnarson H. Sleep and sleep habits from childhood to young adulthood over a 10-year period. J Psychosom Res. 2002;53(1):529-37.
3. Pereira MA, Erickson E, McKee P, Schrankler K, Raatz SK, Lytle LA, et al. Breakfast frequency and quality may affect glycemia and appetite in adults and children. J Nutr. 2011;141:163S–168S. DOI:10.3945/jn.109.114405.
4. Khalida E, Fadiyana E, Somasetia DH. Relationship of breakfast habit with academic achievement and cognitive function of elementary school children. Sari Pediatri. 2015; 17(2):89-94
BGL occurred slowly. Instant noodles contain higher refined carbohydrate and lower fiber. This showed that rice (RE) has better nutrient profile than instant noodles (NE). Breakfast with better nutrient profile, such as high nutrient, high fiber and low-fat foods is related to blood glucose control (3). The main source of energy for the brain is glucose; therefore, maintaining glucose supply is important for a person’s memory mechanism (4).
CONCLUSION
BGL and STM were significantly higher after provision of breakfast. Rice increased BGL and STM better than
Table I: Blood glucose level and short-term memory score based on intervention group
Variables Rice Noodle Control
BGL
Pre-test (mg/dL) 93.0±10.8a 91.6±7.2a 92.1±8.7a
Post-test (mg/dL) 106.3±15.1a 96.6±8.6b 86.3±7.6c
Change 13.3*a 5.0*b -5.8*c
STM
Word:
Pre-test 42.3±12.8a 41.7±8.7a 46.0±9.3a
Post-test 48.7±9.0a 47.3±8.7a 42.3±9.0b
Change 6.3a* 5.7a* -3.7b
Figure:
Pre-test 60.3±11.3a 60.0±11.1a 64.0±7.2a
Post-test 69.7±13.8a 67.7±17.8a 59.7±11.3b
Change 9.3a* 7.7a* -4.3b*- (*) indicated significant differences between pre-test and post-test - different letters on the same row showed significant differences
Proceedings of the 1st IPB International Conference on Nutrition and Food 2020 29
Malaysian Journal of Medicine and Health Sciences Vol.16 Supp 13, Dec 2020 (eISSN 2636-9346)
EXTENDED ABSTRACT
Determinants of stunting in 6-59-month-old children from rural agricultural households in Cianjur, IndonesiaYessi Octaria1,2, Fitrah Ernawati3, Ali Khomsan2, Zenderi Wardani4
1 Center for Public Health Innovation, Faculty of Medicine Udayana University, Denpasar, Indonesia2 Postgraduate Program in Nutrition Science, Department of Community Nutrition, Faculty of Human Ecology, IPB University,
Bogor 166803 Center of Research and Development for Biomedical and Basic Technology of Health, National Institute of Health Research
and Development Indonesia, Indonesia.4 Nutrition Departement, Poltekkes Gizi Pangkal Pinang, Indonesia
Corresponding author’s email: [email protected]
SUMMARY
Stunting is affecting children from rural agricultural households in Indonesia. This study aimed to identify determi-nants of height for age Z (HAZ) score among children under five years old in Cianjur district, an agriculture area with high stunting prevalence. The sample were 200 children aged 6-59 months old from farmers’ households, selected randomly proportionate to size based on the community health post list. The HAZ score was strongly associated with age, access to clean water, vaccination and energy intake adequacy. Hence, Water Sanitation and Hygiene (WaSH), vaccination and energy intake are important elements for stunting prevention in rural Indonesia.
Keywords: Clean water, Energy adequacy, Height-for-age, Stunting, Vaccination
INTRODUCTION
The number of chronic malnutrition indicated by stunting prevalence among under-five children in Indonesia is fluctuating, but it remains high; the prevalence was 35.6%, 36.8% and 37.2% respectively for 2007, 2010 and 2013 (1). By the WHO standard, prevalence of stunting over 30% is considered as a serious public health problem. In addition, stunting is found to be more prevalent in rural areas, especially among poor farmer households (2). Hence, this population group needs more attention.
Cianjur district is a stunting prevalent area where most of the population earn a living from agriculture sector. Thus, to better address the stunting problem among children from rural agricultural households, knowledge of the factors contributing to children’s linier growth in this demography is pivotal to design a more effective intervention. This study aimed to explore factors associated with height for age Z score (HAZ) in children aged 6 to 59 months from rural agricultural households in Cianjur.
MATERIALS AND METHODS
We conducted a cross-sectional survey in Cianjur district, West Java in September 2019. Two hundred children aged 6-59 months old from farmers’ households participated in the study. The sampling frame used was the
community based health post list of under-five children; the children were sampled randomly proportionate to size based on this list. The dependent variable for the study was the children’s HAZ score. The independent variables at individual level consisted of children’s age and sex, nutrient adequacy for energy, protein and calcium, history of diarrhea and acute respiratory tract infection. Meanwhile, factors for household level were income level, household size, vaccination, ownership of sanitary toilets, access to clean water, and household dietary diversity. Multiple linier regression analysis was conducted using IBM SPSS version 24.
RESULTS AND DISCUSSION
In terms of gender, 55.5% of the participants were male and 44.5% were female. The stunting prevalence was 37% and 49.5% of all families surveyed from the lowest socioeconomic background. However, the majority of the families had access to both clean water (87.5%) and sanitary toilet (87.5%). Fifty eight percent had a complete vaccination according to their age, but only 25.5% received exclusive breastfeeding. Data on children’s age, history of illness, household dietary diversity score (HDDS) and household size are presented in Table I.
We conducted a multiple linear regression analysis using the backward method where all variables had significance coefficient of < 0.25. We found that age, energy adequacy, diarrhea episodes, vaccination and
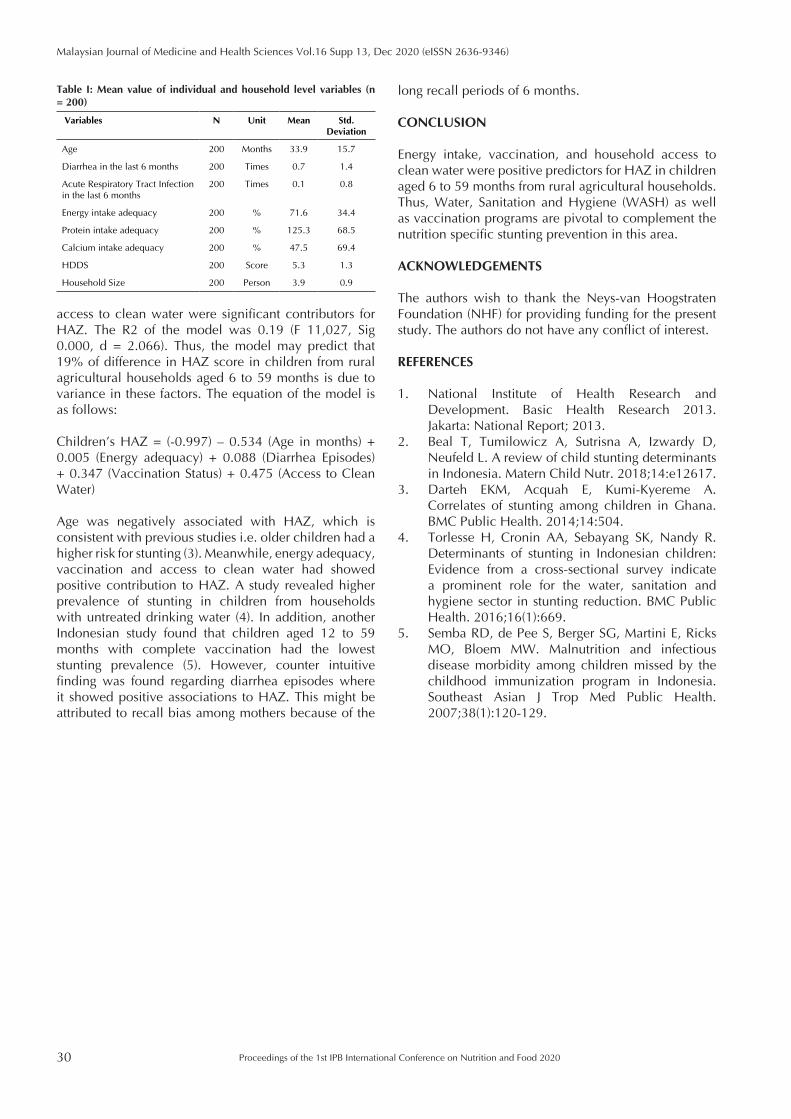
30
Malaysian Journal of Medicine and Health Sciences Vol.16 Supp 13, Dec 2020 (eISSN 2636-9346)
Proceedings of the 1st IPB International Conference on Nutrition and Food 2020
long recall periods of 6 months.
CONCLUSION
Energy intake, vaccination, and household access to clean water were positive predictors for HAZ in children aged 6 to 59 months from rural agricultural households. Thus, Water, Sanitation and Hygiene (WASH) as well as vaccination programs are pivotal to complement the nutrition specific stunting prevention in this area.
ACKNOWLEDGEMENTS
The authors wish to thank the Neys-van Hoogstraten Foundation (NHF) for providing funding for the present study. The authors do not have any conflict of interest.
REFERENCES
1. National Institute of Health Research and Development. Basic Health Research 2013. Jakarta: National Report; 2013.
2. Beal T, Tumilowicz A, Sutrisna A, Izwardy D, Neufeld L. A review of child stunting determinants in Indonesia. Matern Child Nutr. 2018;14:e12617.
3. Darteh EKM, Acquah E, Kumi-Kyereme A. Correlates of stunting among children in Ghana. BMC Public Health. 2014;14:504.
4. Torlesse H, Cronin AA, Sebayang SK, Nandy R. Determinants of stunting in Indonesian children: Evidence from a cross-sectional survey indicate a prominent role for the water, sanitation and hygiene sector in stunting reduction. BMC Public Health. 2016;16(1):669.
5. Semba RD, de Pee S, Berger SG, Martini E, Ricks MO, Bloem MW. Malnutrition and infectious disease morbidity among children missed by the childhood immunization program in Indonesia. Southeast Asian J Trop Med Public Health. 2007;38(1):120-129.
access to clean water were significant contributors for HAZ. The R2 of the model was 0.19 (F 11,027, Sig 0.000, d = 2.066). Thus, the model may predict that 19% of difference in HAZ score in children from rural agricultural households aged 6 to 59 months is due to variance in these factors. The equation of the model is as follows:
Children’s HAZ = (-0.997) – 0.534 (Age in months) + 0.005 (Energy adequacy) + 0.088 (Diarrhea Episodes) + 0.347 (Vaccination Status) + 0.475 (Access to Clean Water)
Age was negatively associated with HAZ, which is consistent with previous studies i.e. older children had a higher risk for stunting (3). Meanwhile, energy adequacy, vaccination and access to clean water had showed positive contribution to HAZ. A study revealed higher prevalence of stunting in children from households with untreated drinking water (4). In addition, another Indonesian study found that children aged 12 to 59 months with complete vaccination had the lowest stunting prevalence (5). However, counter intuitive finding was found regarding diarrhea episodes where it showed positive associations to HAZ. This might be attributed to recall bias among mothers because of the
Table I: Mean value of individual and household level variables (n = 200)
Variables N Unit Mean Std. Deviation
Age 200 Months 33.9 15.7
Diarrhea in the last 6 months 200 Times 0.7 1.4
Acute Respiratory Tract Infection in the last 6 months
200 Times 0.1 0.8
Energy intake adequacy 200 % 71.6 34.4
Protein intake adequacy 200 % 125.3 68.5
Calcium intake adequacy 200 % 47.5 69.4
HDDS 200 Score 5.3 1.3
Household Size 200 Person 3.9 0.9
Proceedings of the 1st IPB International Conference on Nutrition and Food 2020 31
Malaysian Journal of Medicine and Health Sciences Vol.16 Supp 13, Dec 2020 (eISSN 2636-9346)
EXTENDED ABSTRACT
Risk Factors of Stunting Among 24-59-Month-Old Children in the Work Area of Bakarangan Public Health Center, Tapin District Fahrini Yulidasari, Lia Anggraini, Meitria Syahadatina Noor, Fauzie Rahman, Atikah Rahayu, Andini Octaviana Putri, Nur Laily, Ayu Riana Sari, Vina Yulia Anhar, Dian Rosadi
Public Health Study Programme Faculty of Medicine Lambung Mangkurat University, Indonesia
Corresponding author’s email: [email protected]
SUMMARY
Stunting is a growth failure in infants under five years old due to chronic malnutrition, which is related to either the z-score of length or height according to age is <-2 SD based on the standard of WHO. In 2018 the percentage of stunting in Tapin District is 32.7% and the highest is in the work area of Bakarangan’s Public Health Center, which is 44.35%. The purpose of this study was to analyze the risk factors of stunting in the Work Area of Bakarangan’s Public Health Center in Tapin District. This observational analytic study used case control design. The results showed that there was a relationship between the basic immunization status with the incidence of stunting, while there is no relationship between maternal education, maternal occupation and exclusive breastfeeding with the incidence of stunting.
Keywords: Basic immunization status, Exclusive breastfeeding, Maternal education, Maternal occupation, Stunting
INTRODUCTION
Stunting is a growth failure in infants under five years old due to chronic malnutrition. Under this condition, the children are too short for their age. Stunting children can be known if the z-score of length or height according to age is <-2 SD (standard deviation) based on World Health Organization-Multicentre Growth Reference Study (WHO-MGRS) standards in 2005 (1). The average prevalence of stunting toddlers in Indonesia in 2005-2017 was 36.4%. The percentage of stunting in infants (0-59 months) in South Kalimantan Province continued to decline starting from 2016, amounting to 21.31%, 2017 by 21.2% and 2018 by 21.1%. However, according to WHO, the prevalence of stunting under five can be regarded as a public health problem if the prevalence is 20% or more. Even though the stunting incidence in South Kalimantan continues to decline, it is still a health problem because the prevalence is still above the limits set by WHO (2,3). In 2016, the percentage of stunting in Tapin District was 24.4%; in 2017, it was 28.7%, and in 2018, it was 32.7% (4). The highest incidince of stunting in Tapin District in 2017 and 2018 was in the work area of Bakarangan’s Public Health Center with a percentage of 40.08% and 44.35% (5). Stunting in toddlers needs special attention because it can inhibit physical growth, mental development, and health status in toddlers.
MATERIALS AND METHODS
This observational analytic study used case control design. This research was conducted in August 2019 in the work area of Bakarangan’s Public Health Center. The population in this study included toddlers aged 24-59 months old in the work area of Bakarangan’s Public Health Center. The research sample was determined by simple random sampling method. The sample of this study included 88 respondents, consisting of 44 stunting toddlers and 44 normal toddlers. The research instrument was microtoise/length board to measure height/length and body sheets. The bivariate analysis used an alternative chi-square test with a 95% confidence level with a significance value of 5%.
RESULTS AND DISCUSSION
Table I shows that in the normal group, almost half of the respondents (45.5%) have high maternal education, while in the stunting group, the percentage was only 27.3%. Further, it is found that in the normal group, almost all of the respondents (93.2%) received complete basic immunization, while in the stunting group, the percentage was 56.8%.
The level of education affects the way a person receives information. People with higher levels of education will
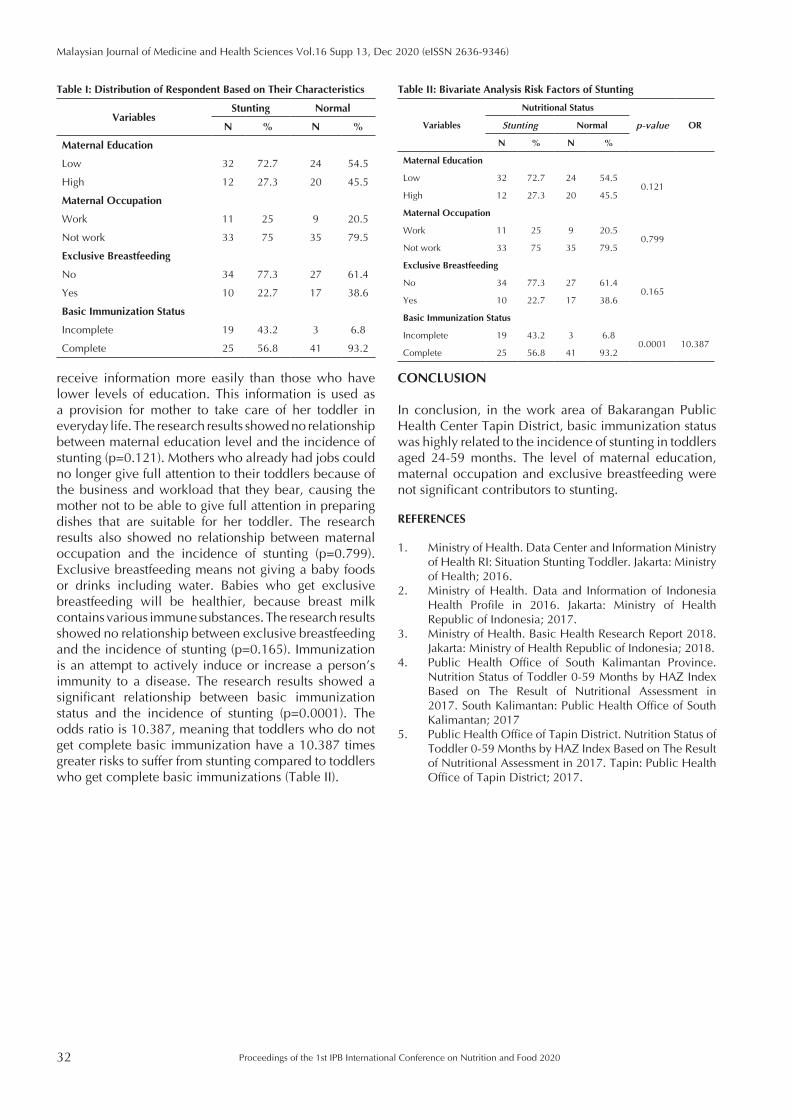
32
Malaysian Journal of Medicine and Health Sciences Vol.16 Supp 13, Dec 2020 (eISSN 2636-9346)
Proceedings of the 1st IPB International Conference on Nutrition and Food 2020
CONCLUSION
In conclusion, in the work area of Bakarangan Public Health Center Tapin District, basic immunization status was highly related to the incidence of stunting in toddlers aged 24-59 months. The level of maternal education, maternal occupation and exclusive breastfeeding were not significant contributors to stunting.
REFERENCES
1. Ministry of Health. Data Center and Information Ministry of Health RI: Situation Stunting Toddler. Jakarta: Ministry of Health; 2016.
2. Ministry of Health. Data and Information of Indonesia Health Profile in 2016. Jakarta: Ministry of Health Republic of Indonesia; 2017.
3. Ministry of Health. Basic Health Research Report 2018. Jakarta: Ministry of Health Republic of Indonesia; 2018.
4. Public Health Office of South Kalimantan Province. Nutrition Status of Toddler 0-59 Months by HAZ Index Based on The Result of Nutritional Assessment in 2017. South Kalimantan: Public Health Office of South Kalimantan; 2017
5. Public Health Office of Tapin District. Nutrition Status of Toddler 0-59 Months by HAZ Index Based on The Result of Nutritional Assessment in 2017. Tapin: Public Health Office of Tapin District; 2017.
receive information more easily than those who have lower levels of education. This information is used as a provision for mother to take care of her toddler in everyday life. The research results showed no relationship between maternal education level and the incidence of stunting (p=0.121). Mothers who already had jobs could no longer give full attention to their toddlers because of the business and workload that they bear, causing the mother not to be able to give full attention in preparing dishes that are suitable for her toddler. The research results also showed no relationship between maternal occupation and the incidence of stunting (p=0.799). Exclusive breastfeeding means not giving a baby foods or drinks including water. Babies who get exclusive breastfeeding will be healthier, because breast milk contains various immune substances. The research results showed no relationship between exclusive breastfeeding and the incidence of stunting (p=0.165). Immunization is an attempt to actively induce or increase a person’s immunity to a disease. The research results showed a significant relationship between basic immunization status and the incidence of stunting (p=0.0001). The odds ratio is 10.387, meaning that toddlers who do not get complete basic immunization have a 10.387 times greater risks to suffer from stunting compared to toddlers who get complete basic immunizations (Table II).
Table I: Distribution of Respondent Based on Their Characteristics
VariablesStunting Normal
N % N %
Maternal Education
Low 32 72.7 24 54.5
High 12 27.3 20 45.5
Maternal Occupation
Work 11 25 9 20.5
Not work 33 75 35 79.5
Exclusive Breastfeeding
No 34 77.3 27 61.4
Yes 10 22.7 17 38.6
Basic Immunization Status
Incomplete 19 43.2 3 6.8
Complete 25 56.8 41 93.2
Table II: Bivariate Analysis Risk Factors of Stunting
Variables
Nutritional Status
p-value ORStunting Normal
N % N %
Maternal Education
Low 32 72.7 24 54.50.121
High 12 27.3 20 45.5
Maternal Occupation
Work 11 25 9 20.50.799
Not work 33 75 35 79.5
Exclusive Breastfeeding
No 34 77.3 27 61.40.165
Yes 10 22.7 17 38.6
Basic Immunization Status
Incomplete 19 43.2 3 6.80.0001 10.387
Complete 25 56.8 41 93.2
Proceedings of the 1st IPB International Conference on Nutrition and Food 2020 33
Malaysian Journal of Medicine and Health Sciences Vol.16 Supp 13, Dec 2020 (eISSN 2636-9346)
EXTENDED ABSTRACT
Online Food Delivery and Food Consumption Quality among Students of SMA Negeri 2 Yogyakarta IndonesiaAnanda Salsabilla Harlan Rubby1, Dodik Briawan2
1 Undergraduate Program in Nutrition Science, Department of Community Nutrition, Faculty of Human Ecology, IPB University, Bogor 16680, Indonesia
2 Department of Community Nutrition, Faculty of Human Ecology, IPB University, Bogor 16680, Indonesia
Corresponding author’s email: [email protected]
SUMMARY
OFD (online food delivery) applications might alter individuals’ dietary pattern, including adolescents. This research aimed to analyze the correlation between OFD with sample characteristics and food consumption quality among students of SMA Negeri 2 Yogyakarta. The design of this research was a cross-sectional study. The data were col-lected in November-December 2019 with 87 samples. There were significant correlations between OFD frequency with gender (C=-0.334,p=0.002) and age (r=-0.316,p=0.003), but there was no significant correlation between OFD frequency and food consumption quality. This research may depict how OFD correlated with dietary habit.
Keywords: Adolescent, Fast food, Food delivery, Obesity, Online application
INTRODUCTION
OFD applications, such as Gojek, have increased the transaction volume of MSMEs (micro, small, and medium enterprises) that have joined as their partners (1). Increasing transactions in food businesses in Indonesia can also have an impact on increasing community’s consumption. Purchasing fast food is associated with a higher risk of obesity. There was a significant correlation between the frequency of online food delivery with BMI of Medan University students (2). One of the age groups that mostly use gadgets and the internet is adolescents. The users of the Gojek application were mostly high school students with a percentage of 42% of the entire education level group (1). This study aimed to analyze the correlation between OFD with the quality of high school students’ food consumption.
MATERIALS AND METHODS
The study population included students of SMA Negeri 2 Yogyakarta. Convenience sampling method was used to select 87 subjects from 900 students. They were girls and boys aged 15-18 years. Data collection consisted of filling out a questionnaire, a week period of SQ-FFQ (3), and also measuring the subject’s anthropometry (weight and height). Data analysis was performed using Microsoft Excel, WHO Anthro-plus, and SPSS 16.0. The data consisted of the characteristics of the subjects and the quality of their food consumption. Subjects’ characteristics consisted of gender, age, pocket money,
and nutritional status. The quality of the subjects’ food consumption consisted of food consumption, nutrient intake, nutrient adequacy level, and nutrient density. Each parameter’s normality test was done using the Kolmogorov-Smirnov normality test. The correlation tests were done using the Spearman correlation test, except for the correlation of the subject’s gender and their OFD frequency that was done using Chi-square.
RESULTS AND DISCUSSION
OFD applications available on the subjects’ gadget were Gojek, Grab, and Mc Delivery. Subjects’ average frequency of OFD was 1.6±2.0 times per week and most of them infrequently (≤3 times a week) order food through online applications (83.9%). The most common reason for the subjects to order food through the online application was discounts and promotions offered (74.7%).
Subjects’ gender and age had a significant correlation with their OFD frequency. Girls were more likely to buy food through online applications (C=-0.334, p=0.002). The correlation may happen because girls tend to be more interested in discounts and promotions offered by the restaurants (4). Other than that, the older the subjects, the less their frequency of using OFD (r=-0.316, p=0.003). Locus of control that grows along with the age of someone may correlate with their food purchasing and food habits, including OFD frequency (5). OFD only contributes to the group of grain, tubers,
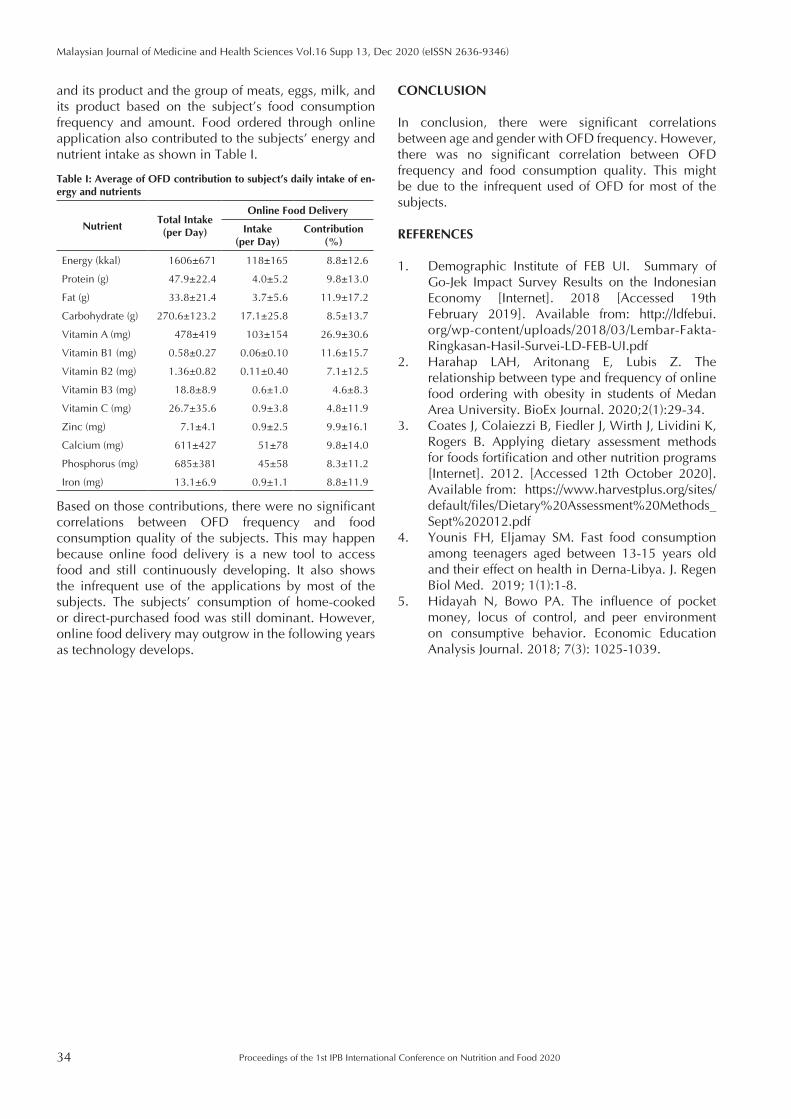
34
Malaysian Journal of Medicine and Health Sciences Vol.16 Supp 13, Dec 2020 (eISSN 2636-9346)
Proceedings of the 1st IPB International Conference on Nutrition and Food 2020
CONCLUSION
In conclusion, there were significant correlations between age and gender with OFD frequency. However, there was no significant correlation between OFD frequency and food consumption quality. This might be due to the infrequent used of OFD for most of the subjects.
REFERENCES
1. Demographic Institute of FEB UI. Summary of Go-Jek Impact Survey Results on the Indonesian Economy [Internet]. 2018 [Accessed 19th February 2019]. Available from: http://ldfebui.org/wp-content/uploads/2018/03/Lembar-Fakta-Ringkasan-Hasil-Survei-LD-FEB-UI.pdf
2. Harahap LAH, Aritonang E, Lubis Z. The relationship between type and frequency of online food ordering with obesity in students of Medan Area University. BioEx Journal. 2020;2(1):29-34.
3. Coates J, Colaiezzi B, Fiedler J, Wirth J, Lividini K, Rogers B. Applying dietary assessment methods for foods fortification and other nutrition programs [Internet]. 2012. [Accessed 12th October 2020]. Available from: https://www.harvestplus.org/sites/default/files/Dietary%20Assessment%20Methods_Sept%202012.pdf
4. Younis FH, Eljamay SM. Fast food consumption among teenagers aged between 13-15 years old and their effect on health in Derna-Libya. J. Regen Biol Med. 2019; 1(1):1-8.
5. Hidayah N, Bowo PA. The influence of pocket money, locus of control, and peer environment on consumptive behavior. Economic Education Analysis Journal. 2018; 7(3): 1025-1039.
and its product and the group of meats, eggs, milk, and its product based on the subject’s food consumption frequency and amount. Food ordered through online application also contributed to the subjects’ energy and nutrient intake as shown in Table I.
Table I: Average of OFD contribution to subject’s daily intake of en-ergy and nutrients
NutrientTotal Intake (per Day)
Online Food Delivery
Intake (per Day)
Contribution (%)
Energy (kkal) 1606±671 118±165 8.8±12.6
Protein (g) 47.9±22.4 4.0±5.2 9.8±13.0
Fat (g) 33.8±21.4 3.7±5.6 11.9±17.2
Carbohydrate (g) 270.6±123.2 17.1±25.8 8.5±13.7
Vitamin A (mg) 478±419 103±154 26.9±30.6
Vitamin B1 (mg) 0.58±0.27 0.06±0.10 11.6±15.7
Vitamin B2 (mg) 1.36±0.82 0.11±0.40 7.1±12.5
Vitamin B3 (mg) 18.8±8.9 0.6±1.0 4.6±8.3
Vitamin C (mg) 26.7±35.6 0.9±3.8 4.8±11.9
Zinc (mg) 7.1±4.1 0.9±2.5 9.9±16.1
Calcium (mg) 611±427 51±78 9.8±14.0
Phosphorus (mg) 685±381 45±58 8.3±11.2
Iron (mg) 13.1±6.9 0.9±1.1 8.8±11.9
Based on those contributions, there were no significant correlations between OFD frequency and food consumption quality of the subjects. This may happen because online food delivery is a new tool to access food and still continuously developing. It also shows the infrequent use of the applications by most of the subjects. The subjects’ consumption of home-cooked or direct-purchased food was still dominant. However, online food delivery may outgrow in the following years as technology develops.
Proceedings of the 1st IPB International Conference on Nutrition and Food 2020 35
Malaysian Journal of Medicine and Health Sciences Vol.16 Supp 13, Dec 2020 (eISSN 2636-9346)
EXTENDED ABSTRACT
Facilitators and Barriers to Sunnah Eating Practices among Overweight Middle-aged Muslim WomenNashrah Adilah Ismail, Nur Islami Mohd Fahmi Teng
Centre of Nutrition and Dietetics, Faculty of Health Sciences, Universiti Teknologi MARA, 42300 Puncak Alam, Selangor, Malaysia
Corresponding author’s email: [email protected]
SUMMARY
Sunnah eating practices (SEP) as guided by the Prophet Muhammad contains an element of healthy eating practices. This study assessed the facilitators and barriers towards SEP among overweight middle-aged Muslim women. A total of 22 participants were recruited through purposive sampling technique and were interviewed face-to-face using a semi-structured interview guide. The major facilitators of SEP are health status, awareness, observed Sunnah practice and culture. Meanwhile, the major barriers are time constraints, outside foods, preferences and culture. Overall, the facilitators and barriers to SEP were much influenced by several factors including family, environment and education.
Keywords: Barriers, Facilitators, Overweight, Sunnah eating practices
INTRODUCTION
Malaysia, which has been recognized as a Muslim country (1), has also been recognized as having the highest number of overweight (38.5%) and obese (13.3%) people among ASEAN countries (2). This had portrayed Malaysia as one of Muslim countries with a high number of over-nutrition. Numerous efforts have been done in order to overcome the overweight issue. The Sunnah eating practices (SEP), has been widely discussed as the best way to practice (3). This includes eating in moderation, healthy food choices and fasting (4-5). The element of Islamic faith in SEP can be the mediator to behaviour change, especially for the Muslim community. In order to design an appropriate faith-based intervention using SEP, the facilitators and barriers towards it should be studied and addressed. Hence, this preliminary study was conducted to explore the facilitators and barriers towards SEP with a focus on Middle-aged Women Muslim.
MATERIALS AND METHODS
This qualitative study employed phenomenology study design. A semi-structured interview guide consisting of a series of open-ended questions based on the facilitators and barriers to SEP was administered. Interview session was recorded by voice recorder. In-depth interview lasted from 15 to 20 minutes. Weight and height measurements were performed and the Body Mass Index (BMI) was calculated. Participants were chosen among 40-59 years old healthy overweight Muslim women
living in the Muslim community around Klang Valley (residential area and mosque).
The audio-recording was transcribed into verbatim within 24 hours after the interview session and was listened entirely at least twice. The researcher then coded the facilitators and barriers into themes and categories. In the first instance, coding was done as broad as possible. The codes were revised, re-grouped, and re-coded to obtain the final theme and categories before they were managed by NVivo10.
RESULTS AND DISCUSSION
A total of 22 overweight Muslim women participated in this study. The findings from thematic content analysis revealed that there are four major themes for facilitators and barriers to SEP respectively (Table I). CONCLUSION
This study provided insights into the implementation of SEP. The facilitators include health status, awareness, observed Sunnah practice and culture while the barriers are time constraints, outside foods, preferences and culture. Therefore, factors including family, environment and education should be considered in designing or providing cost-effective Islamic intervention studies.
ACKNOWLEDGEMENTS
The authors wish to thank all the participating adults
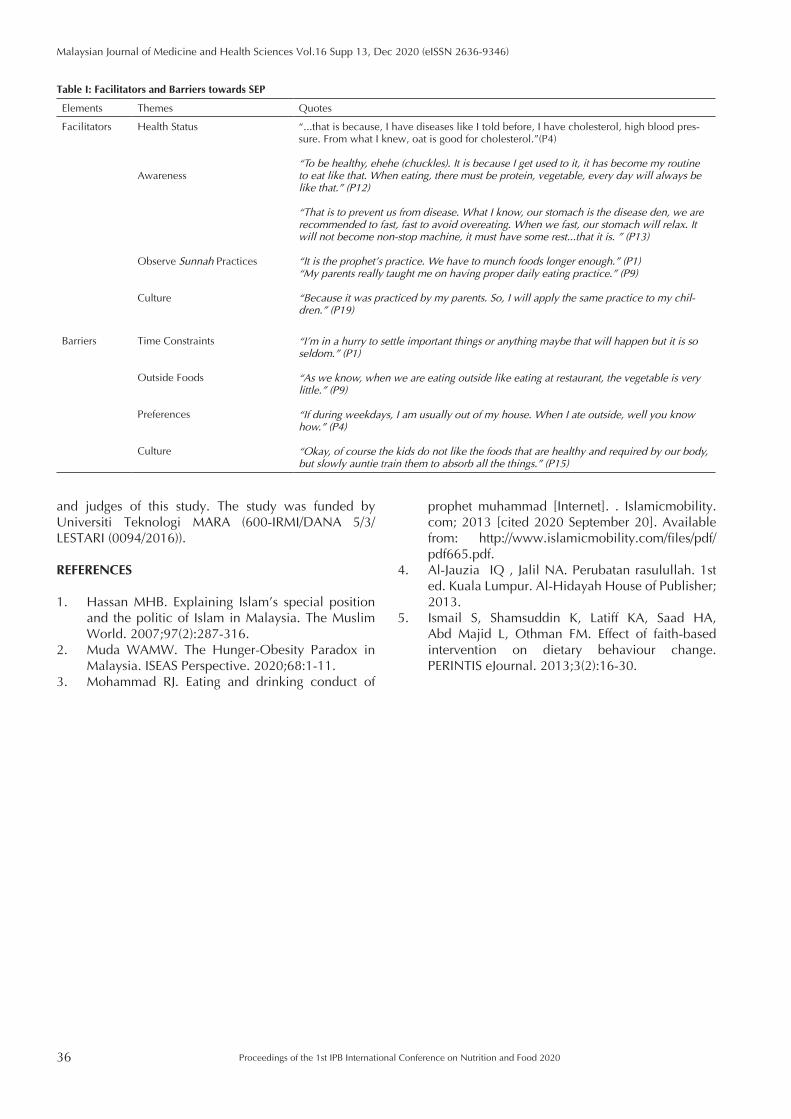
36
Malaysian Journal of Medicine and Health Sciences Vol.16 Supp 13, Dec 2020 (eISSN 2636-9346)
Proceedings of the 1st IPB International Conference on Nutrition and Food 2020
prophet muhammad [Internet]. . Islamicmobility.com; 2013 [cited 2020 September 20]. Available from: http://www.islamicmobility.com/files/pdf/pdf665.pdf.
4. Al-Jauzia IQ , Jalil NA. Perubatan rasulullah. 1st ed. Kuala Lumpur. Al-Hidayah House of Publisher; 2013.
5. Ismail S, Shamsuddin K, Latiff KA, Saad HA, Abd Majid L, Othman FM. Effect of faith-based intervention on dietary behaviour change. PERINTIS eJournal. 2013;3(2):16-30.
and judges of this study. The study was funded by Universiti Teknologi MARA (600-IRMI/DANA 5/3/LESTARI (0094/2016)).
REFERENCES
1. Hassan MHB. Explaining Islam’s special position and the politic of Islam in Malaysia. The Muslim World. 2007;97(2):287-316.
2. Muda WAMW. The Hunger-Obesity Paradox in Malaysia. ISEAS Perspective. 2020;68:1-11.
3. Mohammad RJ. Eating and drinking conduct of
Table I: Facilitators and Barriers towards SEP
Elements Themes Quotes
Facilitators Health Status
Awareness
Observe Sunnah Practices
Culture
“...that is because, I have diseases like I told before, I have cholesterol, high blood pres-sure. From what I knew, oat is good for cholesterol.”(P4)
“To be healthy, ehehe (chuckles). It is because I get used to it, it has become my routine to eat like that. When eating, there must be protein, vegetable, every day will always be like that.” (P12)
“That is to prevent us from disease. What I know, our stomach is the disease den, we are recommended to fast, fast to avoid overeating. When we fast, our stomach will relax. It will not become non-stop machine, it must have some rest...that it is. ” (P13)
“It is the prophet’s practice. We have to munch foods longer enough.” (P1)“My parents really taught me on having proper daily eating practice.” (P9)
“Because it was practiced by my parents. So, I will apply the same practice to my chil-dren.” (P19)
Barriers Time Constraints
Outside Foods
Preferences
Culture
“I’m in a hurry to settle important things or anything maybe that will happen but it is so seldom.” (P1)
“As we know, when we are eating outside like eating at restaurant, the vegetable is very little.” (P9)
“If during weekdays, I am usually out of my house. When I ate outside, well you know how.” (P4)
“Okay, of course the kids do not like the foods that are healthy and required by our body, but slowly auntie train them to absorb all the things.” (P15)
Proceedings of the 1st IPB International Conference on Nutrition and Food 2020 37
Malaysian Journal of Medicine and Health Sciences Vol.16 Supp 13, Dec 2020 (eISSN 2636-9346)
EXTENDED ABSTRACT
Dietary Quality in Indonesian Adults with and without Type 2 Diabetes Mellitus using Healthy Eating IndexNisatami Husnul1, Dodik Briawan1, Ikeu Tanziha1, Sudikno2
1 Department of Community Nutrition, Faculty of Human Ecology, IPB University, 16680 Bogor, West Java, Indonesia2 Centre for Research and Development of Public Health Efforts, Indonesian Ministry of Health, 10560 Central Jakarta, Jakarta,
Indonesia
Corresponding author’s email: [email protected]
SUMMARY
Diet affects the incidence of Type 2 Diabetes Mellitus (T2DM), whilst dietary quality in Indonesia has not been assessed by the Healthy Eating Index (HEI). This study examines differences in dietary quality between T2DM and non-T2DM. There were 246 subjects T2DM and non-T2DM selected from The Non-Communicable Disease Cohort Study. Dietary quality was measured using HEI scores adjusted for Balanced Nutrition Guidelines (BNG). The result showed that dietary qualities in T2DM and non-T2DM adults were not different. T2DM adults consumed higher foods source of polyunsaturated fatty acid (PUFA) and lower sugar-sweetened beverages (SSB) compared to non-T2DM.
Keywords: Balanced nutrition guidelines, Case-control, Diabetes mellitus, Healthy eating index
INTRODUCTION
Lifestyle changes and an increasingly unhealthy dietary quality in adult population result in the increasing incidence of non-communicable diseases (NCD), one of which is T2DM (1). Indonesia is among the top 10 countries with the largest adult population with T2DM where new cases continue to grow in the last five years (2). Dietary quality assessment instruments can be NCD predictors, such as the lower value of dietary quality, the higher blood sugar levels (1). Some countries developed HEI instruments to assess the dietary quality of the population by applicable guidelines (3). Indonesia has not yet applied a dietary quality instrument to prevent T2DM. This study aimed to analyse differences in diet quality between T2DM and non-T2DM adults.
MATERIALS AND METHODS
This study used data from The NCD Cohort Study, The Indonesian Ministry of Health’s Centre for Research and Development of Public Health Efforts. In this case-control study, subjects were selected by simple random sampling from 284 new cases of T2DM in 2018 with 123 subjects finally chosen. The non-T2DM was determined using matching processes; from 499 healthy subjects, 123 subjects were selected. Matching began by selecting healthy subjects whose gender and age were similar to T2DM, subjects whose nutritional status
and physical activity approached T2DM subjects were selected. Determination of T2DM status was done based on the results of blood glucose levels and diagnosed by health professional. The nutritional status used body mass index and abdominal circumference. The dietary quality assessment was adopted from Alternate HEI (AHEI) (3), and its portion size was adjusted for BNG. Data on food consumption was collected by using 24-hours dietary recall.
RESULTS AND DISCUSSION This study analysed 123 subjects in each group, consisting of 24 males and 99 females. The subjects involved were 31-67 years old; 38.6% of subjects were obese. In terms of physical activity, all subjects were classified as active. The blood glucose levels showed a difference between groups (p <0.001) (Table I).
The good dietary quality (score ≥ 66.9) proportion of T2DM and non-T2DM was 15.9% and 8.9% respectively. There were no differences in the proportion of dietary quality (p = 0.141). Non-T2DM subjects consumed more SSB (p < 0.05), while T2DM subjects consumed more PUFA (p < 0.05). Mostly, the dietary quality in both groups still needs improvement. The dietary quality in non-T2DM was lower because they adopted a western diet (4). The T2DM subjects already have nutritional knowledge from routine checks, thereby increasing their
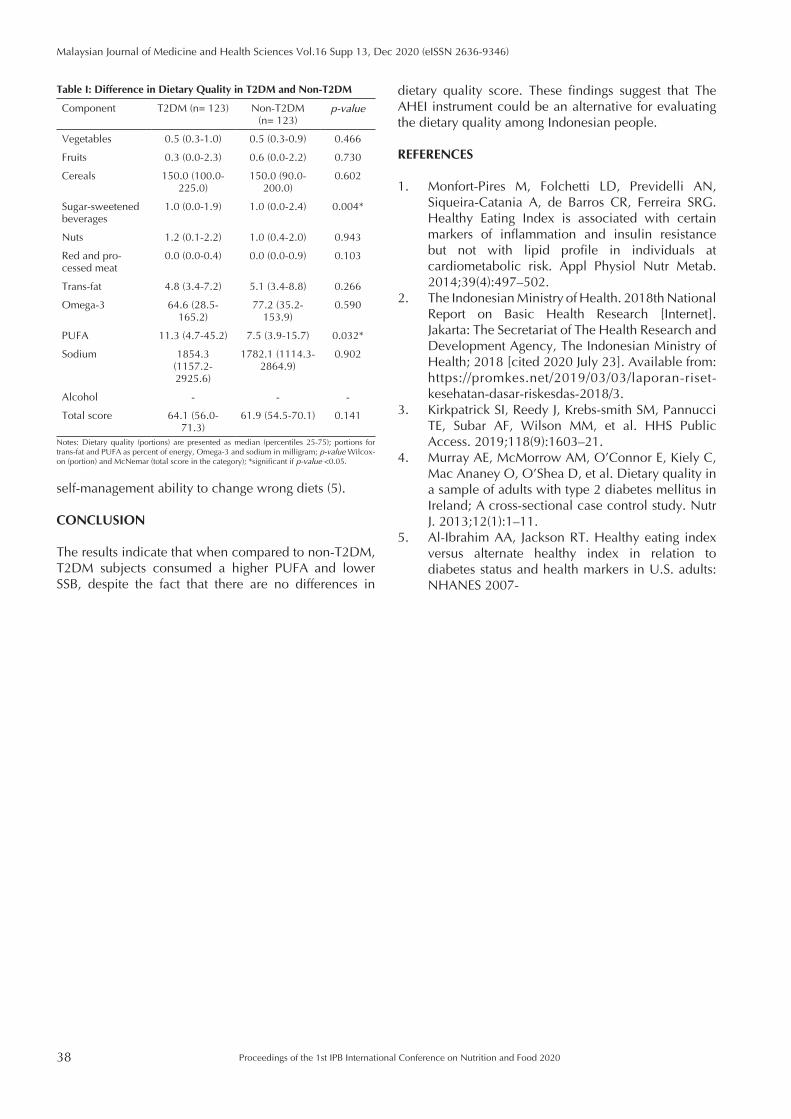
38
Malaysian Journal of Medicine and Health Sciences Vol.16 Supp 13, Dec 2020 (eISSN 2636-9346)
Proceedings of the 1st IPB International Conference on Nutrition and Food 2020
dietary quality score. These findings suggest that The AHEI instrument could be an alternative for evaluating the dietary quality among Indonesian people.
REFERENCES
1. Monfort-Pires M, Folchetti LD, Previdelli AN, Siqueira-Catania A, de Barros CR, Ferreira SRG. Healthy Eating Index is associated with certain markers of inflammation and insulin resistance but not with lipid profile in individuals at cardiometabolic risk. Appl Physiol Nutr Metab. 2014;39(4):497–502.
2. The Indonesian Ministry of Health. 2018th National Report on Basic Health Research [Internet]. Jakarta: The Secretariat of The Health Research and Development Agency, The Indonesian Ministry of Health; 2018 [cited 2020 July 23]. Available from: https://promkes.net/2019/03/03/laporan-riset-kesehatan-dasar-riskesdas-2018/3.
3. Kirkpatrick SI, Reedy J, Krebs-smith SM, Pannucci TE, Subar AF, Wilson MM, et al. HHS Public Access. 2019;118(9):1603–21.
4. Murray AE, McMorrow AM, O’Connor E, Kiely C, Mac Ananey O, O’Shea D, et al. Dietary quality in a sample of adults with type 2 diabetes mellitus in Ireland; A cross-sectional case control study. Nutr J. 2013;12(1):1–11.
5. Al-Ibrahim AA, Jackson RT. Healthy eating index versus alternate healthy index in relation to diabetes status and health markers in U.S. adults: NHANES 2007-
self-management ability to change wrong diets (5).
CONCLUSION
The results indicate that when compared to non-T2DM, T2DM subjects consumed a higher PUFA and lower SSB, despite the fact that there are no differences in
Table I: Difference in Dietary Quality in T2DM and Non-T2DM
Component T2DM (n= 123) Non-T2DM (n= 123)
p-value
Vegetables 0.5 (0.3-1.0) 0.5 (0.3-0.9) 0.466
Fruits 0.3 (0.0-2.3) 0.6 (0.0-2.2) 0.730
Cereals 150.0 (100.0-225.0)
150.0 (90.0-200.0)
0.602
Sugar-sweetened beverages
1.0 (0.0-1.9) 1.0 (0.0-2.4) 0.004*
Nuts 1.2 (0.1-2.2) 1.0 (0.4-2.0) 0.943
Red and pro-cessed meat
0.0 (0.0-0.4) 0.0 (0.0-0.9) 0.103
Trans-fat 4.8 (3.4-7.2) 5.1 (3.4-8.8) 0.266
Omega-3 64.6 (28.5-165.2)
77.2 (35.2-153.9)
0.590
PUFA 11.3 (4.7-45.2) 7.5 (3.9-15.7) 0.032*
Sodium 1854.3 (1157.2-2925.6)
1782.1 (1114.3-2864.9)
0.902
Alcohol - - -
Total score 64.1 (56.0-71.3)
61.9 (54.5-70.1) 0.141
Notes: Dietary quality (portions) are presented as median (percentiles 25-75); portions for trans-fat and PUFA as percent of energy, Omega-3 and sodium in milligram; p-value Wilcox-on (portion) and McNemar (total score in the category); *significant if p-value <0.05.
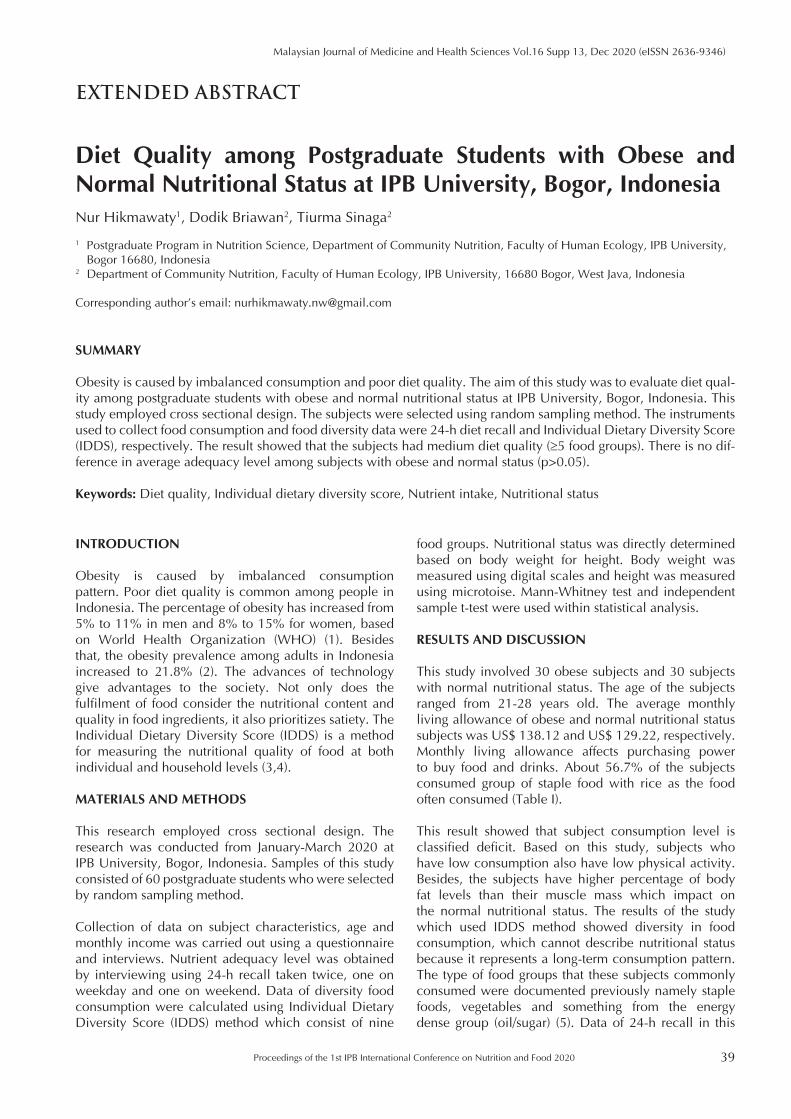
Proceedings of the 1st IPB International Conference on Nutrition and Food 2020 39
Malaysian Journal of Medicine and Health Sciences Vol.16 Supp 13, Dec 2020 (eISSN 2636-9346)
EXTENDED ABSTRACT
Diet Quality among Postgraduate Students with Obese and Normal Nutritional Status at IPB University, Bogor, IndonesiaNur Hikmawaty1, Dodik Briawan2, Tiurma Sinaga2
1 Postgraduate Program in Nutrition Science, Department of Community Nutrition, Faculty of Human Ecology, IPB University, Bogor 16680, Indonesia
2 Department of Community Nutrition, Faculty of Human Ecology, IPB University, 16680 Bogor, West Java, Indonesia
Corresponding author’s email: [email protected]
SUMMARY
Obesity is caused by imbalanced consumption and poor diet quality. The aim of this study was to evaluate diet qual-ity among postgraduate students with obese and normal nutritional status at IPB University, Bogor, Indonesia. This study employed cross sectional design. The subjects were selected using random sampling method. The instruments used to collect food consumption and food diversity data were 24-h diet recall and Individual Dietary Diversity Score (IDDS), respectively. The result showed that the subjects had medium diet quality (≥5 food groups). There is no dif-ference in average adequacy level among subjects with obese and normal status (p>0.05).
Keywords: Diet quality, Individual dietary diversity score, Nutrient intake, Nutritional status
INTRODUCTION
Obesity is caused by imbalanced consumption pattern. Poor diet quality is common among people in Indonesia. The percentage of obesity has increased from 5% to 11% in men and 8% to 15% for women, based on World Health Organization (WHO) (1). Besides that, the obesity prevalence among adults in Indonesia increased to 21.8% (2). The advances of technology give advantages to the society. Not only does the fulfilment of food consider the nutritional content and quality in food ingredients, it also prioritizes satiety. The Individual Dietary Diversity Score (IDDS) is a method for measuring the nutritional quality of food at both individual and household levels (3,4).
MATERIALS AND METHODS
This research employed cross sectional design. The research was conducted from January-March 2020 at IPB University, Bogor, Indonesia. Samples of this study consisted of 60 postgraduate students who were selected by random sampling method.
Collection of data on subject characteristics, age and monthly income was carried out using a questionnaire and interviews. Nutrient adequacy level was obtained by interviewing using 24-h recall taken twice, one on weekday and one on weekend. Data of diversity food consumption were calculated using Individual Dietary Diversity Score (IDDS) method which consist of nine
food groups. Nutritional status was directly determined based on body weight for height. Body weight was measured using digital scales and height was measured using microtoise. Mann-Whitney test and independent sample t-test were used within statistical analysis.
RESULTS AND DISCUSSION
This study involved 30 obese subjects and 30 subjects with normal nutritional status. The age of the subjects ranged from 21-28 years old. The average monthly living allowance of obese and normal nutritional status subjects was US$ 138.12 and US$ 129.22, respectively. Monthly living allowance affects purchasing power to buy food and drinks. About 56.7% of the subjects consumed group of staple food with rice as the food often consumed (Table I).
This result showed that subject consumption level is classified deficit. Based on this study, subjects who have low consumption also have low physical activity. Besides, the subjects have higher percentage of body fat levels than their muscle mass which impact on the normal nutritional status. The results of the study which used IDDS method showed diversity in food consumption, which cannot describe nutritional status because it represents a long-term consumption pattern. The type of food groups that these subjects commonly consumed were documented previously namely staple foods, vegetables and something from the energy dense group (oil/sugar) (5). Data of 24-h recall in this
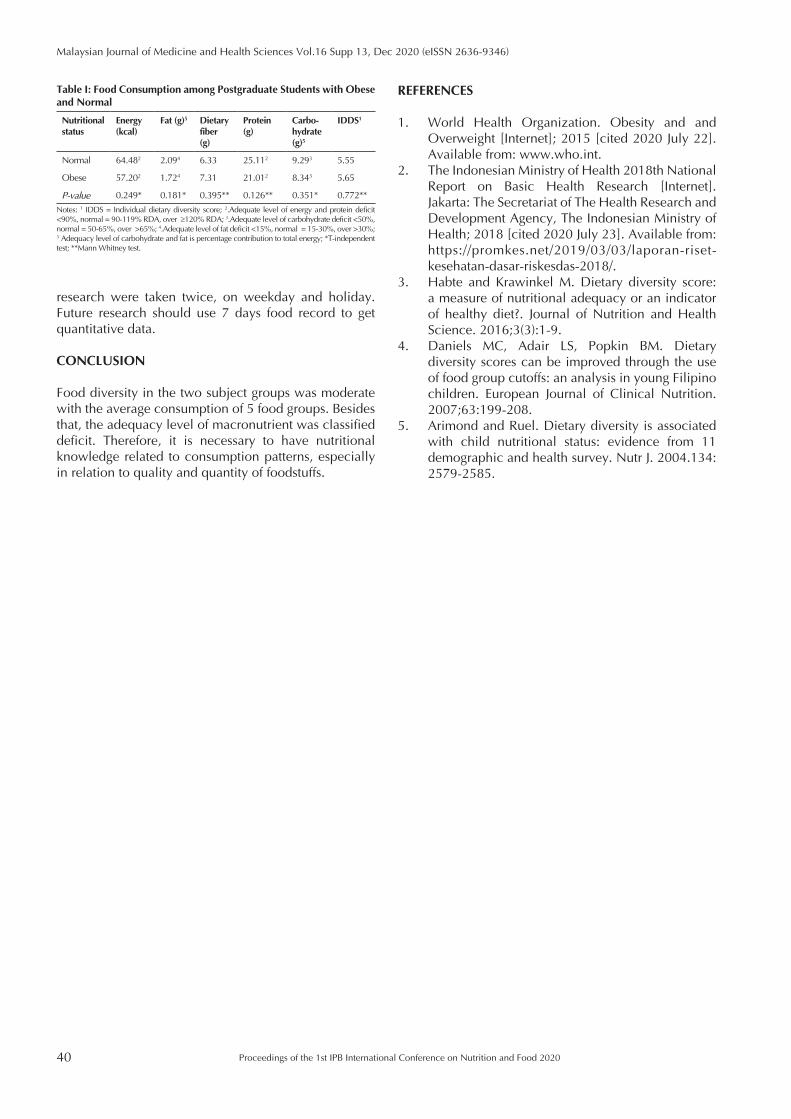
40
Malaysian Journal of Medicine and Health Sciences Vol.16 Supp 13, Dec 2020 (eISSN 2636-9346)
Proceedings of the 1st IPB International Conference on Nutrition and Food 2020
REFERENCES
1. World Health Organization. Obesity and and Overweight [Internet]; 2015 [cited 2020 July 22]. Available from: www.who.int.
2. The Indonesian Ministry of Health 2018th National Report on Basic Health Research [Internet]. Jakarta: The Secretariat of The Health Research and Development Agency, The Indonesian Ministry of Health; 2018 [cited 2020 July 23]. Available from: https://promkes.net/2019/03/03/laporan-riset-kesehatan-dasar-riskesdas-2018/.
3. Habte and Krawinkel M. Dietary diversity score: a measure of nutritional adequacy or an indicator of healthy diet?. Journal of Nutrition and Health Science. 2016;3(3):1-9.
4. Daniels MC, Adair LS, Popkin BM. Dietary diversity scores can be improved through the use of food group cutoffs: an analysis in young Filipino children. European Journal of Clinical Nutrition. 2007;63:199-208.
5. Arimond and Ruel. Dietary diversity is associated with child nutritional status: evidence from 11 demographic and health survey. Nutr J. 2004.134: 2579-2585.
research were taken twice, on weekday and holiday. Future research should use 7 days food record to get quantitative data.
CONCLUSION
Food diversity in the two subject groups was moderate with the average consumption of 5 food groups. Besides that, the adequacy level of macronutrient was classified deficit. Therefore, it is necessary to have nutritional knowledge related to consumption patterns, especially in relation to quality and quantity of foodstuffs.
Table I: Food Consumption among Postgraduate Students with Obese and Normal
Nutritional status
Energy (kcal)
Fat (g)5 Dietary fiber (g)
Protein (g)
Carbo-hydrate (g)5
IDDS1
Normal 64.482 2.094 6.33 25.112 9.293 5.55
Obese 57.202 1.724 7.31 21.012 8.343 5.65
P-value 0.249* 0.181* 0.395** 0.126** 0.351* 0.772**
Notes: 1 IDDS = Individual dietary diversity score; 2.Adequate level of energy and protein deficit <90%, normal = 90-119% RDA, over ≥120% RDA; 3.Adequate level of carbohydrate deficit <50%, normal = 50-65%, over >65%; 4.Adequate level of fat deficit <15%, normal = 15-30%, over >30%; 5 Adequacy level of carbohydrate and fat is percentage contribution to total energy; *T-independent test; **Mann Whitney test.
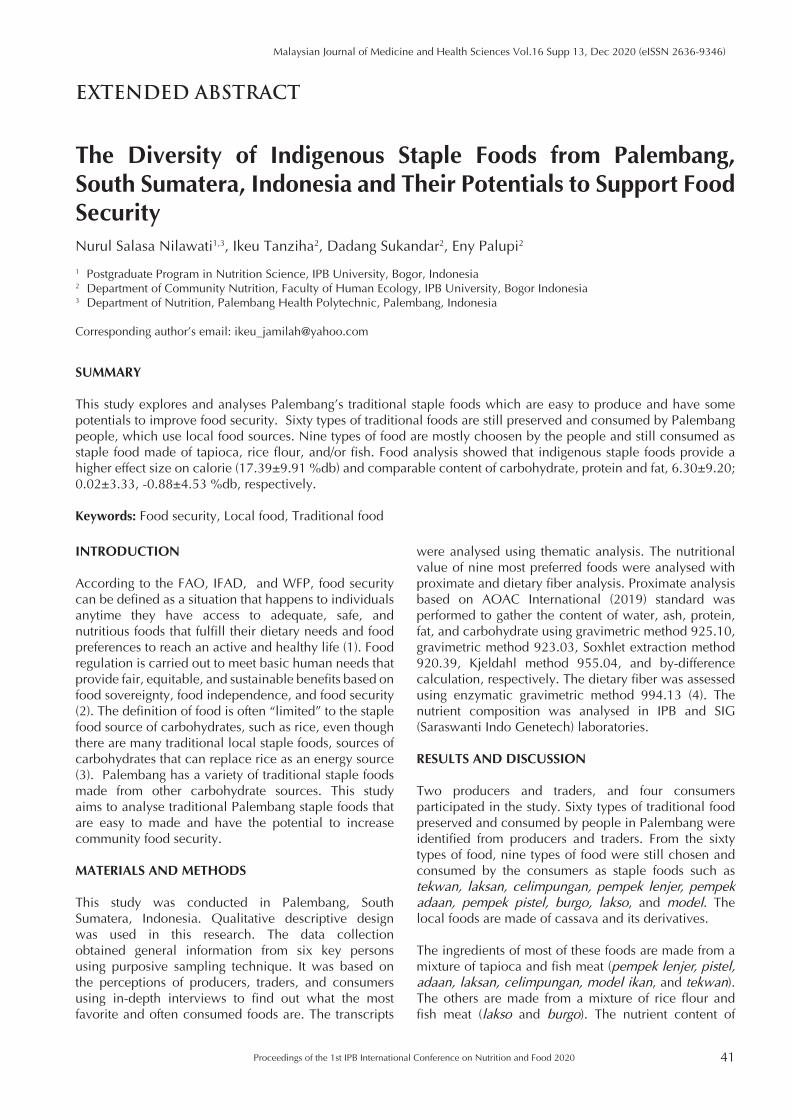
Proceedings of the 1st IPB International Conference on Nutrition and Food 2020 41
Malaysian Journal of Medicine and Health Sciences Vol.16 Supp 13, Dec 2020 (eISSN 2636-9346)
EXTENDED ABSTRACT
The Diversity of Indigenous Staple Foods from Palembang, South Sumatera, Indonesia and Their Potentials to Support Food Security Nurul Salasa Nilawati1,3, Ikeu Tanziha2, Dadang Sukandar2, Eny Palupi2
1 Postgraduate Program in Nutrition Science, IPB University, Bogor, Indonesia2 Department of Community Nutrition, Faculty of Human Ecology, IPB University, Bogor Indonesia 3 Department of Nutrition, Palembang Health Polytechnic, Palembang, Indonesia
Corresponding author’s email: [email protected]
SUMMARY
This study explores and analyses Palembang’s traditional staple foods which are easy to produce and have some potentials to improve food security. Sixty types of traditional foods are still preserved and consumed by Palembang people, which use local food sources. Nine types of food are mostly choosen by the people and still consumed as staple food made of tapioca, rice flour, and/or fish. Food analysis showed that indigenous staple foods provide a higher effect size on calorie (17.39±9.91 %db) and comparable content of carbohydrate, protein and fat, 6.30±9.20; 0.02±3.33, -0.88±4.53 %db, respectively.
Keywords: Food security, Local food, Traditional food
INTRODUCTION
According to the FAO, IFAD, and WFP, food security can be defined as a situation that happens to individuals anytime they have access to adequate, safe, and nutritious foods that fulfill their dietary needs and food preferences to reach an active and healthy life (1). Food regulation is carried out to meet basic human needs that provide fair, equitable, and sustainable benefits based on food sovereignty, food independence, and food security (2). The definition of food is often “limited” to the staple food source of carbohydrates, such as rice, even though there are many traditional local staple foods, sources of carbohydrates that can replace rice as an energy source (3). Palembang has a variety of traditional staple foods made from other carbohydrate sources. This study aims to analyse traditional Palembang staple foods that are easy to made and have the potential to increase community food security.
MATERIALS AND METHODS
This study was conducted in Palembang, South Sumatera, Indonesia. Qualitative descriptive design was used in this research. The data collection obtained general information from six key persons using purposive sampling technique. It was based on the perceptions of producers, traders, and consumers using in-depth interviews to find out what the most favorite and often consumed foods are. The transcripts
were analysed using thematic analysis. The nutritional value of nine most preferred foods were analysed with proximate and dietary fiber analysis. Proximate analysis based on AOAC International (2019) standard was performed to gather the content of water, ash, protein, fat, and carbohydrate using gravimetric method 925.10, gravimetric method 923.03, Soxhlet extraction method 920.39, Kjeldahl method 955.04, and by-difference calculation, respectively. The dietary fiber was assessed using enzymatic gravimetric method 994.13 (4). The nutrient composition was analysed in IPB and SIG (Saraswanti Indo Genetech) laboratories.
RESULTS AND DISCUSSION
Two producers and traders, and four consumers participated in the study. Sixty types of traditional food preserved and consumed by people in Palembang were identified from producers and traders. From the sixty types of food, nine types of food were still chosen and consumed by the consumers as staple foods such as tekwan, laksan, celimpungan, pempek lenjer, pempek adaan, pempek pistel, burgo, lakso, and model. The local foods are made of cassava and its derivatives.
The ingredients of most of these foods are made from a mixture of tapioca and fish meat (pempek lenjer, pistel, adaan, laksan, celimpungan, model ikan, and tekwan). The others are made from a mixture of rice flour and fish meat (lakso and burgo). The nutrient content of
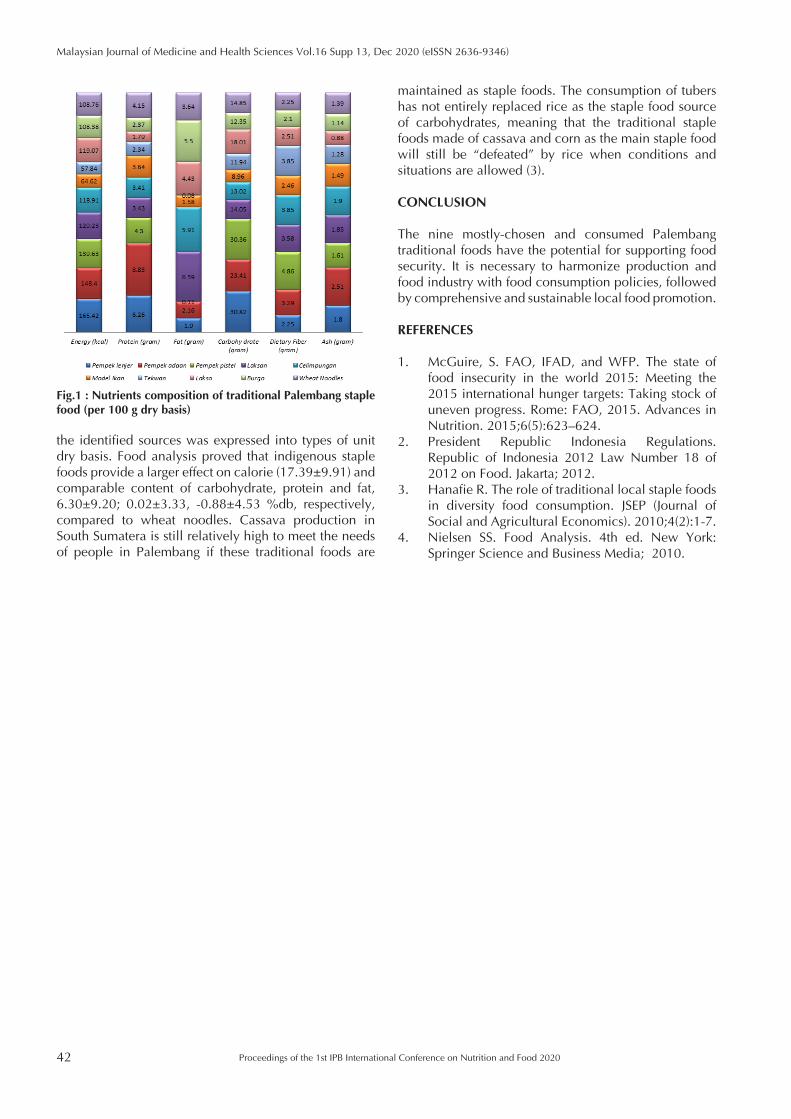
42
Malaysian Journal of Medicine and Health Sciences Vol.16 Supp 13, Dec 2020 (eISSN 2636-9346)
Proceedings of the 1st IPB International Conference on Nutrition and Food 2020
the identified sources was expressed into types of unit dry basis. Food analysis proved that indigenous staple foods provide a larger effect on calorie (17.39±9.91) and comparable content of carbohydrate, protein and fat, 6.30±9.20; 0.02±3.33, -0.88±4.53 %db, respectively, compared to wheat noodles. Cassava production in South Sumatera is still relatively high to meet the needs of people in Palembang if these traditional foods are
maintained as staple foods. The consumption of tubers has not entirely replaced rice as the staple food source of carbohydrates, meaning that the traditional staple foods made of cassava and corn as the main staple food will still be “defeated” by rice when conditions and situations are allowed (3).
CONCLUSION
The nine mostly-chosen and consumed Palembang traditional foods have the potential for supporting food security. It is necessary to harmonize production and food industry with food consumption policies, followed by comprehensive and sustainable local food promotion.
REFERENCES
1. McGuire, S. FAO, IFAD, and WFP. The state of food insecurity in the world 2015: Meeting the 2015 international hunger targets: Taking stock of uneven progress. Rome: FAO, 2015. Advances in Nutrition. 2015;6(5):623–624.
2. President Republic Indonesia Regulations. Republic of Indonesia 2012 Law Number 18 of 2012 on Food. Jakarta; 2012.
3. Hanafie R. The role of traditional local staple foods in diversity food consumption. JSEP (Journal of Social and Agricultural Economics). 2010;4(2):1-7.
4. Nielsen SS. Food Analysis. 4th ed. New York: Springer Science and Business Media; 2010.
Fig.1 : Nutrients composition of traditional Palembang staple food (per 100 g dry basis)
Proceedings of the 1st IPB International Conference on Nutrition and Food 2020 43
Malaysian Journal of Medicine and Health Sciences Vol.16 Supp 13, Dec 2020 (eISSN 2636-9346)
EXTENDED ABSTRACT
Physical Activity, Daily Steps, Sleep Duration and Sleep Quality in Overweight and Obese Women Iriyani Harun1,2, Hadi Riyadi3, Dodik Briawan3, Ali Khomsan3
1 Postgraduate Program in Nutrition Science, IPB University,Bogor, Indonesia2 Department of Midwifery, Tanawali Persada Institute of Health Sciences, Takalar, Indonesia3 Department of Community Nutrition, Faculty of Human Ecology, IPB University, Indonesia
Corresponding author’s email: [email protected]
SUMMARY
This study aims to determine the level of physical activity, daily steps, sleep duration, and sleep quality in overweight and obese women. The study applied a survey-based cross-sectional study on forty female students at IPB University in Indonesia. Data were analyzed using an independent sample t-test. The results showed that the daily steps of both are less active compared to the recommended steps a day. Furthermore, the obtained level of overweight physical activity and obesity were categorized as low. The two groups had a lack of sleep compared to the recommended sleep duration and quality per night. In addition, no significant difference was observed between the two groups with p> 0.05.
Keywords: Daily steps, Sleep duration, Sleep quality, Overweight, Physical activity level
INTRODUCTION
Obesity is a serious public health threat because its prevalence has increased almost all over the world. Physical inactivity is one of the factors causing the increasing prevalence of overweight and obese, which is the cause of global death around 3.2 million deaths each year (1). Walking is considered as an activity for increasing the daily physical activity for the less active population, and the average daily steps for adults in Indonesia are very low at around 3513 steps daily (2). In addition, sleep duration and sleep quality also contribute to overweight and obesity. Therefore, it has a major influence on health problems such as the increased risk of hypertension, diabetes mellitus, coronary heart disease, and risk of the ovarian, breast as well as uterine cancer specifically for women. This study aims to identify patterns of physical activity levels, daily steps, sleep duration, and sleep quality in overweight and obese women.
MATERIALS AND METHODS
A cross-sectional survey was conducted on forty overweight and obese female students at IPB University in Indonesia. The inclusion criteria for the respondents were woman aged 20-30 years old, having BMI of more than 25 kg/m2, willing to wear smart band devices for seven days. Meanwhile, the level of physical activity was measured for 3x24 hours with mild (PAL 1.40-1.69),
moderate (PAL 1.70-1.99), and severe (PAL 2.00-2.40) criteria. Daily steps, sleep duration, and sleep quality were measured using the Xiaomi Smart band version 4 for seven consecutive days with active and inactive criteria ≥ 7500 and <7500 steps respectively. Furthermore, sleep duration categories on a daily basis were good and bad at 7-9 and <7 hours respectively. However, sleep quality in the night was good and bad at 1.5-2 and <1.5 hours respectively. Finally, this study used descriptive statistical analysis and independent sample t-test with a level of p<0.05 considered statistically significant.
RESULTS AND DISCUSSION
The age of the respondents ranged from 23-25 years old, and most of them were obese than overweight. Almost all respondents have a very high percentage of body fat and most of the respondents did not have a history of obesity (Table I).
Furthermore, when compared with the recommended daily steps of ≥ 7500 (3), both groups were classified as inactive with obesity and overweight of 5675 ± 2194 and 5014 ± 2546 respectively. Overweight and obesity groups had a physical activity level of 1.48 ± 0.1 and 1.59 ± 0.4 respectively and are still very low compared to the normal PAL standard of 1.70-1.99 (4). They tend to do more passive activities such as using gadgets, watching YouTube, doing tasks, and not having exercising habits.
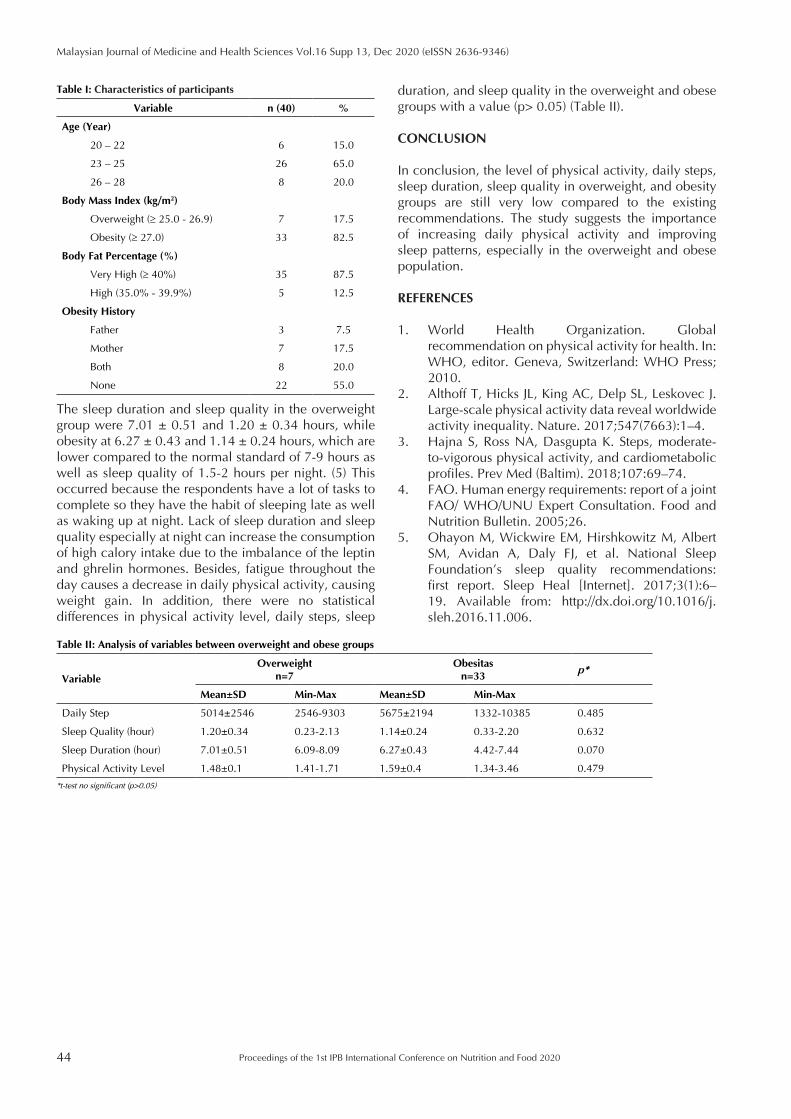
44
Malaysian Journal of Medicine and Health Sciences Vol.16 Supp 13, Dec 2020 (eISSN 2636-9346)
Proceedings of the 1st IPB International Conference on Nutrition and Food 2020
The sleep duration and sleep quality in the overweight group were 7.01 ± 0.51 and 1.20 ± 0.34 hours, while obesity at 6.27 ± 0.43 and 1.14 ± 0.24 hours, which are lower compared to the normal standard of 7-9 hours as well as sleep quality of 1.5-2 hours per night. (5) This occurred because the respondents have a lot of tasks to complete so they have the habit of sleeping late as well as waking up at night. Lack of sleep duration and sleep quality especially at night can increase the consumption of high calory intake due to the imbalance of the leptin and ghrelin hormones. Besides, fatigue throughout the day causes a decrease in daily physical activity, causing weight gain. In addition, there were no statistical differences in physical activity level, daily steps, sleep
duration, and sleep quality in the overweight and obese groups with a value (p> 0.05) (Table II).
CONCLUSION
In conclusion, the level of physical activity, daily steps, sleep duration, sleep quality in overweight, and obesity groups are still very low compared to the existing recommendations. The study suggests the importance of increasing daily physical activity and improving sleep patterns, especially in the overweight and obese population.
REFERENCES
1. World Health Organization. Global recommendation on physical activity for health. In: WHO, editor. Geneva, Switzerland: WHO Press; 2010.
2. Althoff T, Hicks JL, King AC, Delp SL, Leskovec J. Large-scale physical activity data reveal worldwide activity inequality. Nature. 2017;547(7663):1–4.
3. Hajna S, Ross NA, Dasgupta K. Steps, moderate-to-vigorous physical activity, and cardiometabolic profiles. Prev Med (Baltim). 2018;107:69–74.
4. FAO. Human energy requirements: report of a joint FAO/ WHO/UNU Expert Consultation. Food and Nutrition Bulletin. 2005;26.
5. Ohayon M, Wickwire EM, Hirshkowitz M, Albert SM, Avidan A, Daly FJ, et al. National Sleep Foundation’s sleep quality recommendations: first report. Sleep Heal [Internet]. 2017;3(1):6–19. Available from: http://dx.doi.org/10.1016/j.sleh.2016.11.006.
Table I: Characteristics of participants
Variable n (40) %
Age (Year)
20 – 22 6 15.0
23 – 25 26 65.0
26 – 28 8 20.0
Body Mass Index (kg/m2)
Overweight (≥ 25.0 - 26.9) 7 17.5
Obesity (≥ 27.0) 33 82.5
Body Fat Percentage (%)
Very High (≥ 40%) 35 87.5
High (35.0% - 39.9%) 5 12.5
Obesity History
Father 3 7.5
Mother 7 17.5
Both 8 20.0
None 22 55.0
Table II: Analysis of variables between overweight and obese groups
Variable
Overweightn=7
Obesitasn=33
p*
Mean±SD Min-Max Mean±SD Min-Max
Daily Step 5014±2546 2546-9303 5675±2194 1332-10385 0.485
Sleep Quality (hour) 1.20±0.34 0.23-2.13 1.14±0.24 0.33-2.20 0.632
Sleep Duration (hour) 7.01±0.51 6.09-8.09 6.27±0.43 4.42-7.44 0.070
Physical Activity Level 1.48±0.1 1.41-1.71 1.59±0.4 1.34-3.46 0.479
*t-test no significant (p>0.05)
Proceedings of the 1st IPB International Conference on Nutrition and Food 2020 45
Malaysian Journal of Medicine and Health Sciences Vol.16 Supp 13, Dec 2020 (eISSN 2636-9346)
EXTENDED ABSTRACT
Eating Behaviour and Physical Activity among Female Workers with Metabolic Syndrome : A Qualitative Study Farida Nailufar1,2, Ali Khomsan3, Yayuk Farida Baliwati3, Hadi Riyadi3
1 Postgraduate Program in Nutrition Science, IPB University, Indonesia2 Department of Nutrition, Health Polytechnic of East Kalimantan, Indonesia3 Department of Community Nutrition, Faculty of Human Ecology, IPB University, Indonesia
Corresponding author’s email: [email protected]
SUMMARY
This study explored eating behaviour and physical activity among female workers with metabolic syndrome con-ducted from June to July 2020 in the Government Offices of East Kalimantan Province. Twelve female workers with metabolic syndrome participated in this study. The primary data were collected by using in-depth interviews, and the transcripts were analyzed using a thematic analysis. The five key themes were identified as their eating behavior and physical activity: low consumption of fruit and vegetables, irregular eating time, unhealthy food choices, eating outside the home, and physical inactivity.
Keywords: Eating behaviour, Physical activity, Female workers, Metabolic syndrome
INTRODUCTION
Metabolic syndrome leads to many chronic diseases, in which unhealthy eating behavior and low physical activity can increase individuals’ risk of developing metabolic syndrome. The occurrence of metabolic syndrome at a productive age has a significant relationship with the high consumption of saturated fat, sodium, sugar, and low dietary fiber. Most studies have shown that low physical activity is associated with metabolic risk factor in adults (1). This qualitative study was conducted to better understand eating behavior and physical activity among female workers with metabolic syndrome by exploring the views and experiences of all participants that may not be answered by quantitative study.
MATERIALS AND METHODS
The subjects were female workers purposively selected from the Government Offices in East Kalimantan Province. The eligibility criteria were defined as follows: i) age between 30 to 55 years; ii) diagnosed with metabolic syndrome according to International Diabetic Federation (2005) criteria by the presence of any three of the five following indicators: 1) waist circumference (> 80 cm), 2) blood pressure level (≥130/85 mmHg), 3) fasting blood glucose level (≥100 mg/dL), 4) triglyceride levels (>150 mg/dL), and 5) high-density lipoprotein levels (<50 mg/dL). A qualitative method was used
to find out the eating behaviour (fruit and vegetables consumption, food choices, eating time, eating outside the home) and physical activity (activity at work, travel to and from places, recreational activities) of female workers. In depth interviews were conducted as the primary data collection method with 12 female workers. Thematic analysis was carried out using NVivo 12.
RESULTS AND DISCUSSION
Almost all female workers consumed less fruit and vegetables. One female workers mentioned, “I don’t eat fruits and vegetables every day because I don’t have time to prepare and cook at home”. Studies shows that low consumption of fruits and vegetables is associated with an increased risk of chronic diseases, such as CVD and diabetes. Fruit and vegetables have the protective constituents such as potassium, folate, vitamins, fibre and phenolic compounds which are useful for preventing chronic disease (2). It was reported that most female workers were more likely to skipped meals especially breakfast. One of them said, “I rarely eat breakfast. Lunch and dinner also at irregular times”. Skipping meals and irregular eating time makes people more likely to consume foods containing high carbohydrates, fat and less fruits and vegetables (3). The lack of unhealthy food choices was mentioned by many of the subjects in the canteen or nearby foodstall. One subject reported, “In the canteen most foods sold are soto, rawon, bakso and fried food. It’s difficult to get healthy food choices. I only
46
Malaysian Journal of Medicine and Health Sciences Vol.16 Supp 13, Dec 2020 (eISSN 2636-9346)
Proceedings of the 1st IPB International Conference on Nutrition and Food 2020
choose food that are available in the canteen or fast food like instant noodles”. Most of the female workers often eat outside the home or buy food from street vendors. One of them stated, “I often buy food outside the home because it’s practical”. People who rarely prepare food from home have been shown poor diet quality and consume more calories, which increases the risk for excess weight and chronic disease (4). Physical inactivity was identified in most of the subjects. One subject mentioned, “I mostly sitting at work. I never exercise. Time after work I used for rest or relax with my family”. A worker who were physically inactive reported have an increased risk of comorbidities such as hypertension, obesity and diabetes (5).
CONCLUSION
The five key themes related to eating behaviour and physical activity among female workers with metabolic syndrome are: low consumption of fruit and vegetables, irregular eating time, unhealthy food choices, eating outside home and physical inactivity. This research provides information for supporting and improving the health of the workers.
REFERENCES
1. Kataria I, Chadha R, Pathak R. Dietary and lifestyle modification in metabolic syndrome: a review of randomized control trials in different population groups. Journal of Health Research. 2016;4(4):209-30.
2. Van Duyn MAS, Pivonka E. Overview of the health benefits of fruit and vegetable consumption for the dietetics professional: selected literature. J Am Diet Assoc 2000;100:1511–1521.
3. Pedersen TP, Meilstrup C, Holstein BE, Rasmussen M. Fruit and vegetable intake is associated with frequency of breakfast, lunch and evening meal: crosssectional study of 11-,13-,and 15-year-olds. International Journal of Behavioral Nutrition and Physical Activity. 2012;9:9-19.
4. Binkley JK, Eales J, Jekanowski M. The relation between dietary change and rising US obesity. Int J Obes Relat Metab Disord. 2000;24(8):1032-1039.
5. Aravindalochanan V, Kumpatla S, Rengarajan M, Rajan R, Viswanathan V. Risk of diabetes in subjects with sedentary profession and the synergistic effect of positive family history of diabetes. Diabetes Technol Ther. 2014;16(1):26-32.
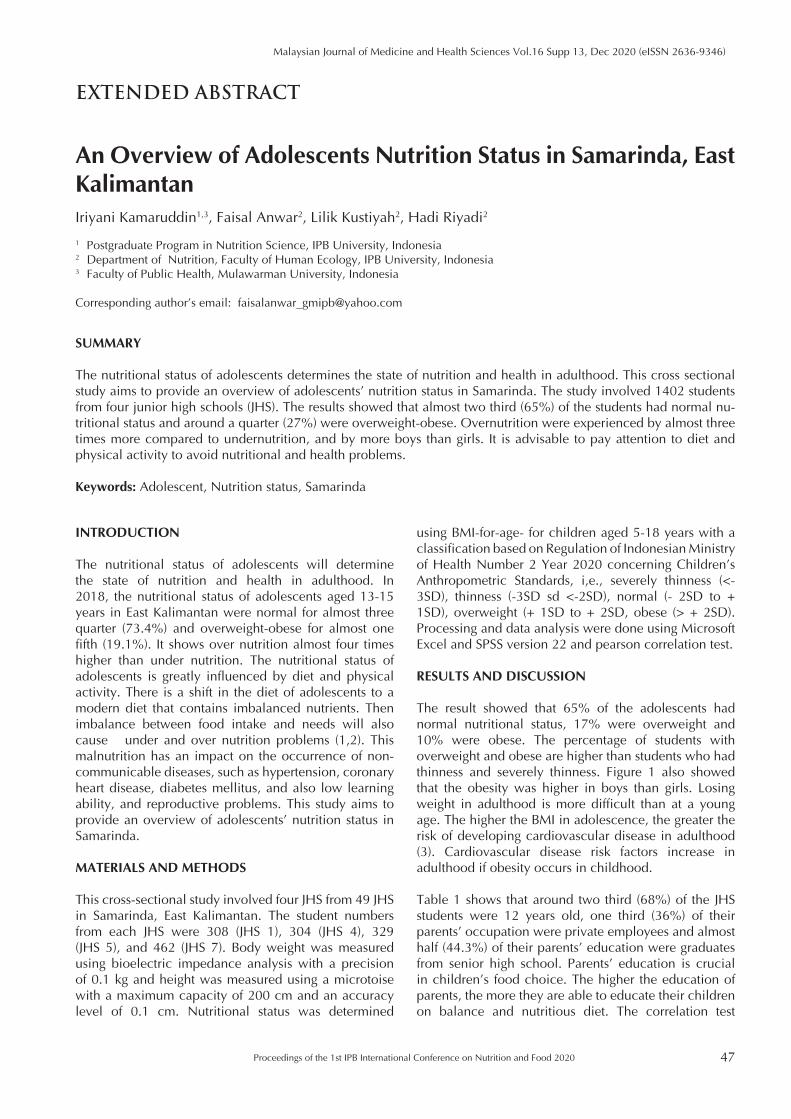
Proceedings of the 1st IPB International Conference on Nutrition and Food 2020 47
Malaysian Journal of Medicine and Health Sciences Vol.16 Supp 13, Dec 2020 (eISSN 2636-9346)
EXTENDED ABSTRACT
An Overview of Adolescents Nutrition Status in Samarinda, East Kalimantan Iriyani Kamaruddin1,3, Faisal Anwar2, Lilik Kustiyah2, Hadi Riyadi2
1 Postgraduate Program in Nutrition Science, IPB University, Indonesia2 Department of Nutrition, Faculty of Human Ecology, IPB University, Indonesia3 Faculty of Public Health, Mulawarman University, Indonesia
Corresponding author’s email: [email protected]
SUMMARY
The nutritional status of adolescents determines the state of nutrition and health in adulthood. This cross sectional study aims to provide an overview of adolescents’ nutrition status in Samarinda. The study involved 1402 students from four junior high schools (JHS). The results showed that almost two third (65%) of the students had normal nu-tritional status and around a quarter (27%) were overweight-obese. Overnutrition were experienced by almost three times more compared to undernutrition, and by more boys than girls. It is advisable to pay attention to diet and physical activity to avoid nutritional and health problems.
Keywords: Adolescent, Nutrition status, Samarinda
INTRODUCTION
The nutritional status of adolescents will determine the state of nutrition and health in adulthood. In 2018, the nutritional status of adolescents aged 13-15 years in East Kalimantan were normal for almost three quarter (73.4%) and overweight-obese for almost one fifth (19.1%). It shows over nutrition almost four times higher than under nutrition. The nutritional status of adolescents is greatly influenced by diet and physical activity. There is a shift in the diet of adolescents to a modern diet that contains imbalanced nutrients. Then imbalance between food intake and needs will also cause under and over nutrition problems (1,2). This malnutrition has an impact on the occurrence of non-communicable diseases, such as hypertension, coronary heart disease, diabetes mellitus, and also low learning ability, and reproductive problems. This study aims to provide an overview of adolescents’ nutrition status in Samarinda.
MATERIALS AND METHODS
This cross-sectional study involved four JHS from 49 JHS in Samarinda, East Kalimantan. The student numbers from each JHS were 308 (JHS 1), 304 (JHS 4), 329 (JHS 5), and 462 (JHS 7). Body weight was measured using bioelectric impedance analysis with a precision of 0.1 kg and height was measured using a microtoise with a maximum capacity of 200 cm and an accuracy level of 0.1 cm. Nutritional status was determined
using BMI-for-age- for children aged 5-18 years with a classification based on Regulation of Indonesian Ministry of Health Number 2 Year 2020 concerning Children’s Anthropometric Standards, i,e., severely thinness (<-3SD), thinness (-3SD sd <-2SD), normal (- 2SD to + 1SD), overweight (+ 1SD to + 2SD, obese (> + 2SD). Processing and data analysis were done using Microsoft Excel and SPSS version 22 and pearson correlation test.
RESULTS AND DISCUSSION
The result showed that 65% of the adolescents had normal nutritional status, 17% were overweight and 10% were obese. The percentage of students with overweight and obese are higher than students who had thinness and severely thinness. Figure 1 also showed that the obesity was higher in boys than girls. Losing weight in adulthood is more difficult than at a young age. The higher the BMI in adolescence, the greater the risk of developing cardiovascular disease in adulthood (3). Cardiovascular disease risk factors increase in adulthood if obesity occurs in childhood.
Table 1 shows that around two third (68%) of the JHS students were 12 years old, one third (36%) of their parents’ occupation were private employees and almost half (44.3%) of their parents’ education were graduates from senior high school. Parents’ education is crucial in children’s food choice. The higher the education of parents, the more they are able to educate their children on balance and nutritious diet. The correlation test
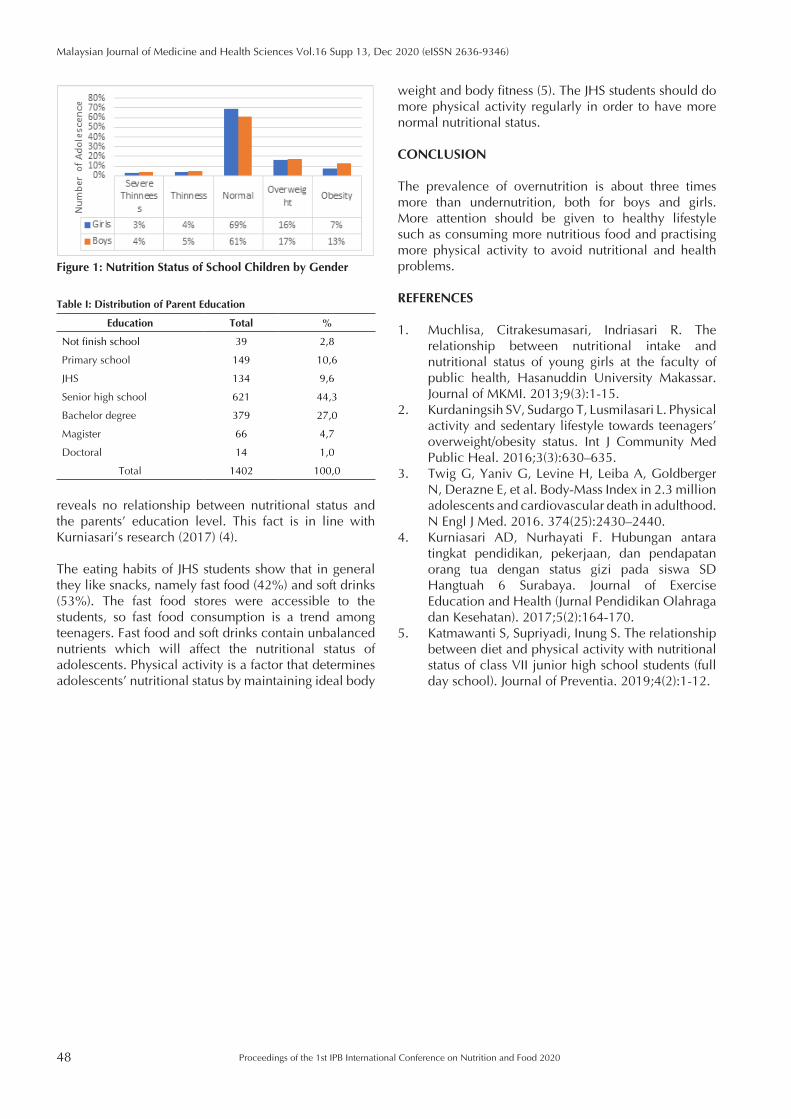
48
Malaysian Journal of Medicine and Health Sciences Vol.16 Supp 13, Dec 2020 (eISSN 2636-9346)
Proceedings of the 1st IPB International Conference on Nutrition and Food 2020
reveals no relationship between nutritional status and the parents’ education level. This fact is in line with Kurniasari’s research (2017) (4).
The eating habits of JHS students show that in general they like snacks, namely fast food (42%) and soft drinks (53%). The fast food stores were accessible to the students, so fast food consumption is a trend among teenagers. Fast food and soft drinks contain unbalanced nutrients which will affect the nutritional status of adolescents. Physical activity is a factor that determines adolescents’ nutritional status by maintaining ideal body
weight and body fitness (5). The JHS students should do more physical activity regularly in order to have more normal nutritional status.
CONCLUSION
The prevalence of overnutrition is about three times more than undernutrition, both for boys and girls. More attention should be given to healthy lifestyle such as consuming more nutritious food and practising more physical activity to avoid nutritional and health problems.
REFERENCES
1. Muchlisa, Citrakesumasari, Indriasari R. The relationship between nutritional intake and nutritional status of young girls at the faculty of public health, Hasanuddin University Makassar. Journal of MKMI. 2013;9(3):1-15.
2. Kurdaningsih SV, Sudargo T, Lusmilasari L. Physical activity and sedentary lifestyle towards teenagers’ overweight/obesity status. Int J Community Med Public Heal. 2016;3(3):630–635.
3. Twig G, Yaniv G, Levine H, Leiba A, Goldberger N, Derazne E, et al. Body-Mass Index in 2.3 million adolescents and cardiovascular death in adulthood. N Engl J Med. 2016. 374(25):2430–2440.
4. Kurniasari AD, Nurhayati F. Hubungan antara tingkat pendidikan, pekerjaan, dan pendapatan orang tua dengan status gizi pada siswa SD Hangtuah 6 Surabaya. Journal of Exercise Education and Health (Jurnal Pendidikan Olahraga dan Kesehatan). 2017;5(2):164-170.
5. Katmawanti S, Supriyadi, Inung S. The relationship between diet and physical activity with nutritional status of class VII junior high school students (full day school). Journal of Preventia. 2019;4(2):1-12.
Figure 1: Nutrition Status of School Children by Gender
Table I: Distribution of Parent Education
Education Total %
Not finish school 39 2,8
Primary school 149 10,6
JHS 134 9,6
Senior high school 621 44,3
Bachelor degree 379 27,0
Magister 66 4,7
Doctoral 14 1,0
Total 1402 100,0
Proceedings of the 1st IPB International Conference on Nutrition and Food 2020 49
Malaysian Journal of Medicine and Health Sciences Vol.16 Supp 13, Dec 2020 (eISSN 2636-9346)
EXTENDED ABSTRACT
Nutrition Education: Media Development and Nutrition Knowledge of Prospective Brides to Prevent Stunting on Newborns G.A.Dewi Pramoni1,3, Ikeu Tanziha2, Dodik Briawan2, Ali Khomsan2
1 Postgraduate Program in Nutrition Science, IPB University Bogor Indonesia2 Department of Community Nutrition, Faculty of Human Ecology, IPB University, Bogor Indonesia 3 Public Health Office, Sumbawa District, West Nusa Tenggara Province, Indonesia
Corresponding author’s email: [email protected]
SUMMARY
Prospective brides as the target of pre-1000 first day of life nutritional status have implications for the growth, devel-opment and long-term health of their offspring. This research aims to develop nutrition education materials as an effort to prevent stunting in newborns as well as knowing the acceptability and effectiveness of change in bride nu-trition knowledge. The result shows that the acceptance of the materials was high; 88.9% of the subjects liked it very much and the rest like it. Paired t-test revealed a significant increase in the brides’ nutrition knowledge (p=0.000).
Keywords: Bride, Nutrition education, Nutrition knowledge, Stunting
INTRODUCTION
Stunting shows a slow growth due to cronic deficiency of energy, macronutrient and micronutrient intake and chronic infection, that contributes to morbidity and mortality in infants / children. Factors affecting fetus growth and development in the womb until born are nutritional status and health of pregnant women. The brides are strategic entry poin for improving knowledge, attitude, nutritional practice and health of expectant pregnant women and give birth to a quality generation. Nutritional intake, behavior and good health before and during pregnancy can prevent the incident of stunting (1). Problems before pregnancy can be overcome through health education. Education and improved access to health information for childbearing age women in Brazil have be proven to be able to decrease the prevalence of short toddlers from 37% in 1974, to 7% in 2006 (2). The objective of this study was to develop nutrition education materials and nutrition knowledge for brides to prevent stunting in newborns.
MATERIALS AND METHODS
The research used quasi experimental pre and post test one grup design. Subject were selected using purposive sampling technique. Media development trial involved forty five women of childbearing age, between 20 and 30 years old, to assess the acceptability of the pocket book based on the perceptions of the subject by using a questionnaire. Evaluation of product feasibility was
carried out by material and media experts. Knowledge was assessed using questionnaires before and after given the pocket book (80 question). Each correct answer was given a score of 1 (one) and incorrect answer was given zero (0). The effectiveness of nutrition education was analyzed using paired t-test.
RESULTS AND DISCUSSION
The assessment of pocketbook acceptability includes communicative material so that it is better understood, the writing can be read, the pocketbook is easy to carry, it contains attractive images and colors so that it can increase the subject’s knowledge in applying the material to prevent stunting (Figure 1).
Pocket book content validation was set by two media experts in the field of nutrition. Every expert was required to assess the pocket book to ensure that the pocketbook fit the purpose. Each pocket book was judged on the basis of content, language and design with a score of 1 for dislike, score 2 like (with revision) and score 3 really like (no revisions). Suggestions were given to improve the pocket book in terms of language content and design.Two experts valued the pocket book with a score of two (like and there are revisions). After the pocket book was corrected based on suggestions and criticism from the validator, then a trial was done on the subject. The results show that there is a significant difference in knowledge before and after being given pocket book (p value = 0.000). The pocket book is very effective in
50
Malaysian Journal of Medicine and Health Sciences Vol.16 Supp 13, Dec 2020 (eISSN 2636-9346)
Proceedings of the 1st IPB International Conference on Nutrition and Food 2020
increasing the knowledge and practice of the respondent (3),(4). The subject which has not been well-understood by the respondents based on the presentation is nutrition of pregnant women because it does not show an increase in the pre and post test scores.
CONCLUSION
The overall acceptance of the pocket book media is in the high category; it is effective in increasing the nutritional knowledge of the brides (paired t-test : p =
0.000). Further research should improve attitudes and behaviors of the brides toward nutrition.
REFERENCES
1. Czeizel AE. Experience of the hungarian preconception service between 1984 and 2010. Eur J Obstet Gynecol Reprod Biol. 2012;161:18–25.
2. Monteiro CA, Aquino HD, Conde L, Konno S, Lucia A. Narrowing socioeconomic inequality in child stunting : the Brazilian experience 1974–2007. Bull World Heal Organ. 2010;88:305–11.
3. Azadirachta FL, Sumarmi S. Nutrition education with pocket book increase knowledge and practice of vegetable and fruit consumption among elementary student. Media Gizi Indonesia. 2017;12:107–15.
4. Eliana D, Solikhah. The pocket book influence nutrition towards the level of nutritional knowledge at 5th grader of Muhammadiyah Dadapan Desa Wonokerto, Turi District, Sleman Regency Yogyakarta. Journal Public Health. 2013;6(2).
Figure 1: Subject’s acceptance on pocket book media
Table I: Subject’s knowledge score
SubjectPre test (n=45) Post test (n=45)
p-value *pMedian Min-Max Median Min-Max
Stunting and 1000 First Days of Life 5 4 – 7 6 5 – 9 0.000 P<0.05
Macro and Micro Nutrient 5 3 – 8 6 4 – 9 0.008 P< 0.05
Balance Nutrition Guidlines 5 3 – 8 6 3 – 9 0.001 P<0.05
Nutrition Before Pregnancy 6 4 – 9 7 4 – 9 0.003 P<0.05
Nutrition of pregnant women 6 3 – 8 6 3 – 8 0.573 P>0.05
Breastfeeding and Complementary Food of Breastfeeding 5 4 – 8 6 3 – 8 0.070 P>0.05
Growth and Development and Parenting 6 4 – 8 7 4 – 9 0.000 P<0.05
Hygiene and Sanitation Behavior 6 3 – 8 7 5 – 8 0.000 P<0.05
Paired t-test 0.000* P<0.05*pairet t-test Significant P<0.05
Proceedings of the 1st IPB International Conference on Nutrition and Food 2020 51
Malaysian Journal of Medicine and Health Sciences Vol.16 Supp 13, Dec 2020 (eISSN 2636-9346)
EXTENDED ABSTRACT
Maternal Parity and Height as Determinants of Stunting for 0-6 Month Infants Putri Rahmah Alamsyah1, Dodik Briawan1, Mira Dewi1, Yekti Widodo2
1 Department of Community Nutrition, Faculty of Human Ecology, IPB University, Bogor, 16680, Indonesia2 National Institute of Health Research and Development, Indonesian Ministry of Health
Corresponding author’s email: [email protected]
SUMMARY
This study aims to analyze factors during pregnancy that cause stunting in children. The data used are secondary data from a cohort study of child development. The analysis was performed using normality test and logistic test. The analysis results show that maternal parity and height affect the incidence of stunting. Meanwhile, maternal age, upper arm circumference, body mass index before pregnancy, and maternal anemia status did not significantly in-fluence stunting.
Keywords: Bogor cohort study, Maternal height, Parity, Pregnancy, Stunting infant 0-6 months.
INTRODUCTION
Stunting is a form of growth failure that results from the accumulation of nutritional insufficiency from pregnancy (1). The incidence of stunting in children will have an impact on their growth, development, health, and productivity in the future (2). The prevalence of stunting incidence by 2018 in zero to five month age group is 11.7% (severe) and 11.4% (moderate) (3). The cohort study of child development in Bogor city assessed factors that influence the growth of children from the womb to the age of 18. The results of this cohort study show that stunted infants had a history of being born by mothers aged >35 years, mothers who gave birth to children more than twice, mothers with height <150 cm, and mothers whose upper arm circumference is <23.5 cm (4). Therefore, this study aims to focus on analyzing maternal factors during pregnancy that affect the incidence of stunting in children aged 0-6 months.
MATERIALS AND METHODS
This study used secondary data sourced from Cohort Study of Child Growth and Development. The research design used was a retrospective cohort study. Research subjects were infants aged zero to six months. The determination of the samples was based on the calculation formula. A total of 140 subjects were selected for this study, consisting of 70 children experiencing stunting and 70 children not experiencing stunting (control group). Furthermore, the research subjects were recruited based on the cohort study data to be selected according to the inclusion criteria. Exclusion criteria
for case groups and control groups were children with congenital abnormalities and incomplete data. Analyzed variables were maternal factors including age, maternal BMI before pregnancy, parity, height, and hemoglobin level measured in trimester 1, 2, and 3. The next step was checking the completeness of the data, cleaning the data, and testing the normality. Then, logistic regression analysis was performed.
RESULTS AND DISCUSSION
Statistical test results with logistic regression showed that parity is a maternal factor during pregnancy that affects the incidence of stunting (p <0.05) and has a positive coefficient (OR 2.760, 95% CI 0.880-0.865). A mother with parity ≥ 4 children has a risk of 2.760 times stunting in her child compared to those with parity < 4 children. In addition, there is a factor of maternal height <150 cm (OR 2.203, 95% CI 1.025-7.735) which also affects the incidence of stunting. Mothers who are less than 150 cm tall will have a risk of 2.203 times compared to a woman whose height is >150cm (Table I).
This study is in line with previous studies which show that there is an effect of parity on the incidence of stunting. The study showed that children with mothers who had high parity had a 3.25 time greater risk of experiencing stunting than children with mothers who had little parity (5). Other factors that showed insignificant results are maternal age [OR 0.954, 95% CI 0.245-3.720], upper arm circumference <23.5 cm [OR 1.012, 95% CI 0.309-3.316], low BMI (underweight) before pregnancy [OR 2.041, 95% CI 0.306-13.622] and anemia status [OR
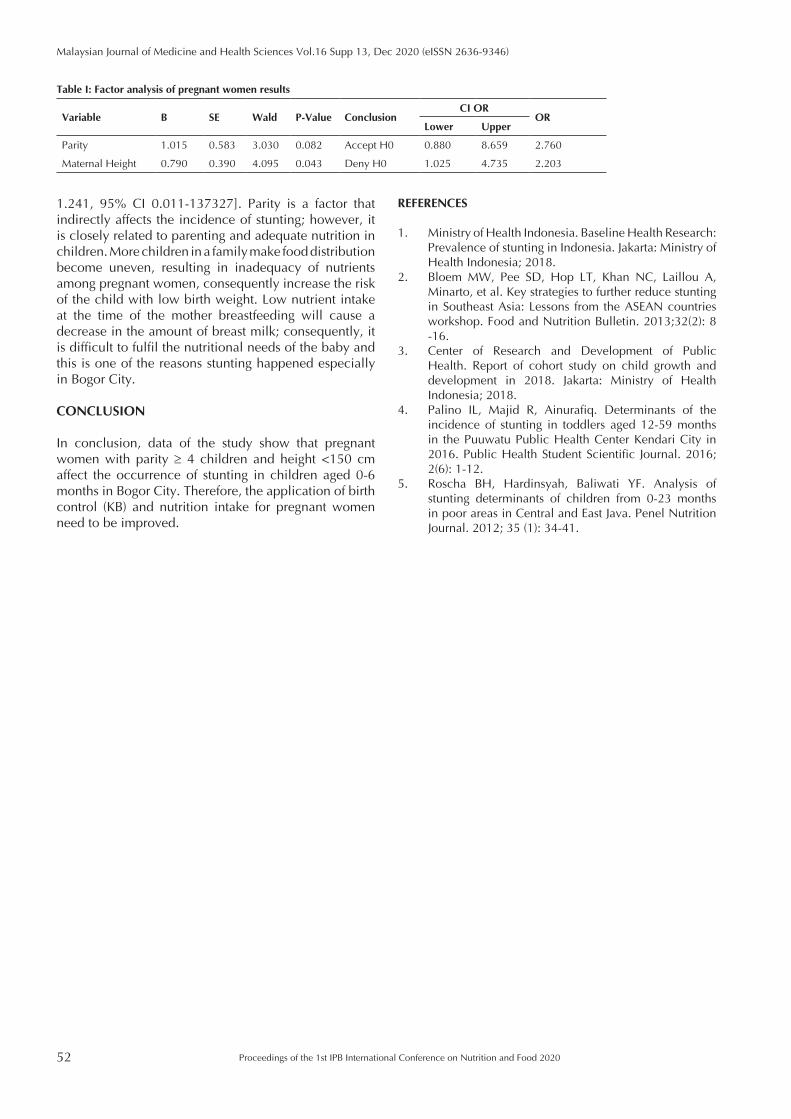
52
Malaysian Journal of Medicine and Health Sciences Vol.16 Supp 13, Dec 2020 (eISSN 2636-9346)
Proceedings of the 1st IPB International Conference on Nutrition and Food 2020
1.241, 95% CI 0.011-137327]. Parity is a factor that indirectly affects the incidence of stunting; however, it is closely related to parenting and adequate nutrition in children. More children in a family make food distribution become uneven, resulting in inadequacy of nutrients among pregnant women, consequently increase the risk of the child with low birth weight. Low nutrient intake at the time of the mother breastfeeding will cause a decrease in the amount of breast milk; consequently, it is difficult to fulfil the nutritional needs of the baby and this is one of the reasons stunting happened especially in Bogor City.
CONCLUSION
In conclusion, data of the study show that pregnant women with parity ≥ 4 children and height <150 cm affect the occurrence of stunting in children aged 0-6 months in Bogor City. Therefore, the application of birth control (KB) and nutrition intake for pregnant women need to be improved.
REFERENCES
1. Ministry of Health Indonesia. Baseline Health Research: Prevalence of stunting in Indonesia. Jakarta: Ministry of Health Indonesia; 2018.
2. Bloem MW, Pee SD, Hop LT, Khan NC, Laillou A, Minarto, et al. Key strategies to further reduce stunting in Southeast Asia: Lessons from the ASEAN countries workshop. Food and Nutrition Bulletin. 2013;32(2): 8 -16.
3. Center of Research and Development of Public Health. Report of cohort study on child growth and development in 2018. Jakarta: Ministry of Health Indonesia; 2018.
4. Palino IL, Majid R, Ainurafiq. Determinants of the incidence of stunting in toddlers aged 12-59 months in the Puuwatu Public Health Center Kendari City in 2016. Public Health Student Scientific Journal. 2016; 2(6): 1-12.
5. Roscha BH, Hardinsyah, Baliwati YF. Analysis of stunting determinants of children from 0-23 months in poor areas in Central and East Java. Penel Nutrition Journal. 2012; 35 (1): 34-41.
Table I: Factor analysis of pregnant women results
Variable B SE Wald P-Value ConclusionCI OR
ORLower Upper
Parity 1.015 0.583 3.030 0.082 Accept H0 0.880 8.659 2.760
Maternal Height 0.790 0.390 4.095 0.043 Deny H0 1.025 4.735 2.203
Proceedings of the 1st IPB International Conference on Nutrition and Food 2020 53
Malaysian Journal of Medicine and Health Sciences Vol.16 Supp 13, Dec 2020 (eISSN 2636-9346)
EXTENDED ABSTRACT
Could Food Diary Intervention Improve School Children’s Eating Habit? Hana Fitria Navratilova, Lilik Kustiyah, Sri Wiji Utami
Department of Community Nutrition, Faculty of Human Ecology, IPB University, 16680 Bogor, West Java, Indonesia
Corresponding author’s email: [email protected]
SUMMARY
This study examines the efficacy of My Eating Journal (MEJ) to improve healthy dietary behaviour. Using a qua-si-experimental design, the study divided 70 children and their mothers as participants into 2 groups, control and intervention. In the intervention group, the children were asked to record their dietary intake data in MEJ for 30 days, and the mothers reviewed their child’s dietary diversity score report every 2 weeks. The results showed that knowl-edge score of healthy dietary behaviour increased for the intervention group compared to the control; however, no improvement for eating practices was observed during the intervention.
Keywords: Dietary diversity score, Nutrition education, School children
INTRODUCTION
Food diary is an assessment method for dietary intake that may serve different purposes based on the diary design. Recorded data can be used to analyse and change dietary habits (1). The diary is also useful for developing healthy eating habits if the process of reflection is incorporated with food tracking (2). Eating behaviours established in childhood persist; therefore, healthy dietary habits must be shaped at a young age. Specifically developed for children, MEJ is a medium for nutrition education in the form of a food diary (3). This tool provides functions that help individuals see the suitability of their daily eating frequency in terms of guidelines for balanced nutrition. This study evaluates the efficacy of MEJ to change children’s eating habits to become healthy dietary behaviour.
MATERIALS AND METHODS
Using a quasi-experimental design, the study involved 70 fifth-grade children and their mothers as participants, who were divided into 2 groups. The control group received no treatment. Children in the intervention group were asked to record their dietary intake data for 30 days using MEJ, which comprised a food chart and food menu notes. Mothers in the intervention group were given a weekly pamphlet about balanced nutrition guidelines and a biweekly report on their child’s Individual Dietary Diversity Score (IDDS) based on MEJ data from the end of Day 15 and Day 30 for reflection. To test the ability of MEJ to serve as nutrition education media, both groups completed the Knowledge, Attitude and Practice (KAP)
survey before and after the intervention period. To assess improvement of dietary habits during intervention, differences in IDDS between Days 1–15 and Days 16–30 of the intervention period were analysed.
RESULTS AND DISCUSSION
Results of the KAP survey showed a significant increase in the knowledge score and a tendency for improvement in attitude score after the intervention compared with the control group (Table I). Interestingly, the intervention group practice score decreased, although this finding was not statistically significant. This result was attributed to the practice question about weekly portion size consumed because children in the intervention group had more awareness of portion size for each food type after completing the MEJ for 30 days; therefore, it did not truly reflect the deterioration of eating practice. Based on Attitude–Behaviour–Context theory, contextual factors such as economic values, social norms and physical capabilities may play a greater role than knowledge alone to change eating behaviour (4). Because children’s food choices are limited to what their parents provide, nutrition intervention should also involve the parents as food provider, which is why mothers in the intervention group were given a nutrition education pamphlet and IDDS report. The report serves as a reflection for the mothers on the areas for improvement to provide a balanced diet, supported by the pamphlet information. No IDDS improvement was observed; the mean IDDS decreased from 5.2 pre-intervention to 5.0 post-intervention (Table II). Most of children in the intervention group were in moderate IDDS category.
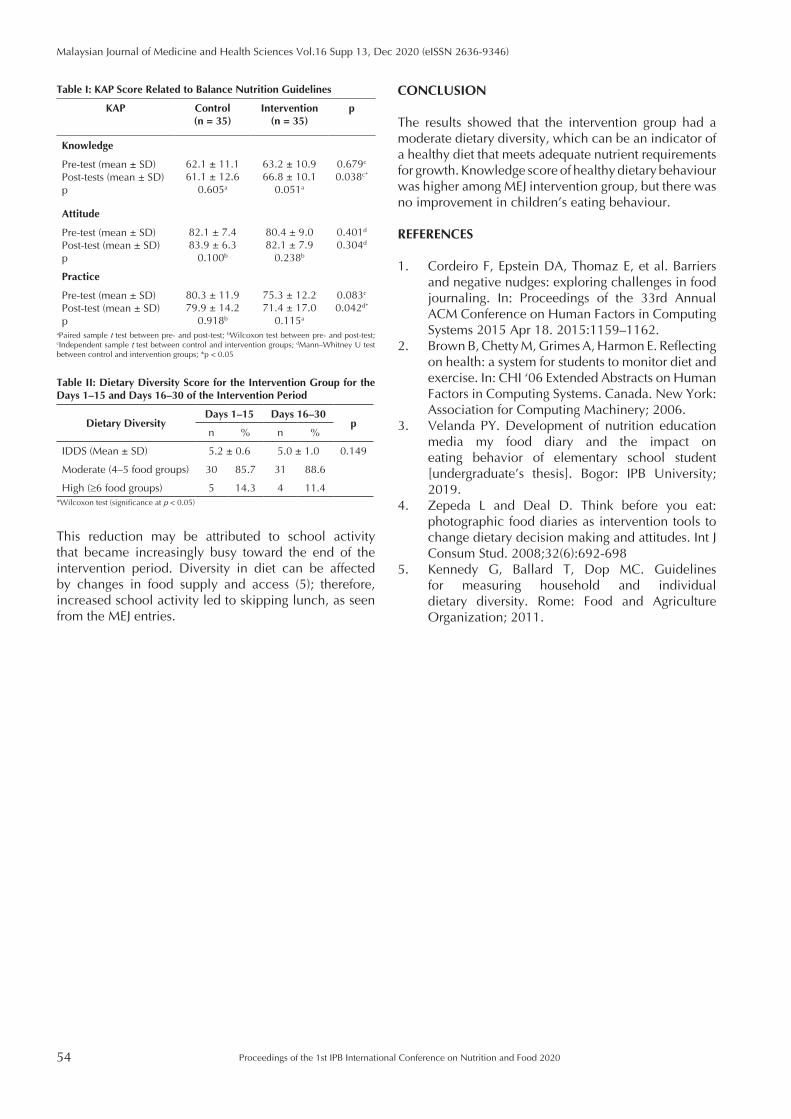
54
Malaysian Journal of Medicine and Health Sciences Vol.16 Supp 13, Dec 2020 (eISSN 2636-9346)
Proceedings of the 1st IPB International Conference on Nutrition and Food 2020
This reduction may be attributed to school activity that became increasingly busy toward the end of the intervention period. Diversity in diet can be affected by changes in food supply and access (5); therefore, increased school activity led to skipping lunch, as seen from the MEJ entries.
CONCLUSION
The results showed that the intervention group had a moderate dietary diversity, which can be an indicator of a healthy diet that meets adequate nutrient requirements for growth. Knowledge score of healthy dietary behaviour was higher among MEJ intervention group, but there was no improvement in children’s eating behaviour.
REFERENCES
1. Cordeiro F, Epstein DA, Thomaz E, et al. Barriers and negative nudges: exploring challenges in food journaling. In: Proceedings of the 33rd Annual ACM Conference on Human Factors in Computing Systems 2015 Apr 18. 2015:1159–1162.
2. Brown B, Chetty M, Grimes A, Harmon E. Reflecting on health: a system for students to monitor diet and exercise. In: CHI ‘06 Extended Abstracts on Human Factors in Computing Systems. Canada. New York: Association for Computing Machinery; 2006.
3. Velanda PY. Development of nutrition education media my food diary and the impact on eating behavior of elementary school student [undergraduate’s thesis]. Bogor: IPB University; 2019.
4. Zepeda L and Deal D. Think before you eat: photographic food diaries as intervention tools to change dietary decision making and attitudes. Int J Consum Stud. 2008;32(6):692-698
5. Kennedy G, Ballard T, Dop MC. Guidelines for measuring household and individual dietary diversity. Rome: Food and Agriculture Organization; 2011.
Table I: KAP Score Related to Balance Nutrition Guidelines
KAP Control(n = 35)
Intervention(n = 35)
p
Knowledge
Pre-test (mean ± SD)Post-tests (mean ± SD)p
62.1 ± 11.161.1 ± 12.6
0.605a
63.2 ± 10.966.8 ± 10.1
0.051a
0.679c
0.038c*
Attitude
Pre-test (mean ± SD)Post-test (mean ± SD)p
82.1 ± 7.483.9 ± 6.3
0.100b
80.4 ± 9.082.1 ± 7.9
0.238b
0.401d
0.304d
Practice
Pre-test (mean ± SD)Post-test (mean ± SD)p
80.3 ± 11.979.9 ± 14.2
0.918b
75.3 ± 12.271.4 ± 17.0
0.115a
0.083c
0.042d*
aPaired sample t test between pre- and post-test; bWilcoxon test between pre- and post-test; cIndependent sample t test between control and intervention groups; dMann–Whitney U test between control and intervention groups; *p < 0.05
Table II: Dietary Diversity Score for the Intervention Group for the Days 1–15 and Days 16–30 of the Intervention Period
Dietary Diversity Days 1–15 Days 16–30
pn % n %
IDDS (Mean ± SD) 5.2 ± 0.6 5.0 ± 1.0 0.149
Moderate (4–5 food groups) 30 85.7 31 88.6
High (≥6 food groups) 5 14.3 4 11.4*Wilcoxon test (significance at p < 0.05)
Proceedings of the 1st IPB International Conference on Nutrition and Food 2020 55
Malaysian Journal of Medicine and Health Sciences Vol.16 Supp 13, Dec 2020 (eISSN 2636-9346)
EXTENDED ABSTRACT
Sensitivity and Specificity of Food Consumption Score in Predicting Hypertension among Lacto-vegetarian and Non-vegetarian Women in Bali Widya Astuti1, Hadi Riyadi2, Faisal Anwar2, Ni Ketut Sutiari3
1 Faculty of Sport Education and Health, Indonesian University of Education, Setiabudi Campus, Bandung 40154, Indonesia2 Departement of Community Nutrition, Faculty of Human Ecology, IPB University, IPB Dramaga Campus, Bogor 16680,
Indonesia3 Departemen of Public Health and Preventive Medicine, Faculty of Medic, Udayana University, PB Sudirman Denpasar Street,
Denpasar 80232, Indonesia
Corresponding author’s email: [email protected]
SUMMARY
Modifying eating habits, such as practicing vegetarian diet, can decrease hypertension prevalence. This study an-alyzed the sensitivity (Se) and specificity (Sp) of food recall and food frequency questionnaire in predicting hyper-tension among lacto-vegetarian and non-vegetarian women. Food habits were assessed using a 24-hour food recall and food frequency questionnaire. The food recall method identified 86.6%(Se) and 4%(Sp) among non-vegetarian women. The food frequency questionnaire found 83.3%(Se) and 21.4%(Sp) among lacto-vegetarian women. The results show that food recall and food frequency questionnaire can be a predictor for hypertension.
Keywords: Food frequency questionnaire, Food recall, Hypertension, Sensitivity, Specificity
INTRODUCTION
Results of Basic Health Research (Riskesdas) in 2018 show that the prevalence of hypertension in Indonesia for 2013 was 25.8% and increased to 32.1% in 2018 (1). Results of Adventist Health Study-2 show that the adoption of a vegetarian diet is related to the decrease of deaths caused by heart diseases where hypertension was one of the causes (2). Consumption patterns between groups can be assessed from food habits of each individual. The patterns can be collected using a 2x24-hour food recall method and food frequency questionnaire (FFQ). A method was good if it had a sensitivity and specificity value of 100%; that method can predict sick subject and healthy subjects (3). This study aimed to analyze the sensitivity (Se) and specificity (Sp) of food recall and food frequency questionnaire using food consumption scores in predicting hypertension among lacto-vegetarian and non-vegetarian women.
MATERIALS AND METHODS
This study was conducted in Bali Province from July-October 2018. The subject in this study was divided into 2 groups (lacto-vegetarian and non-vegetarian). The total number of subjects in this study were 80 women aging 40-65 years old. Data on anthropometric measurements (weight, height, and waist-hip ratio) and blood pressure
were obtained by direct measurements. Measuring blood pressure using a sphygmomanometer was done with two repetitions. The data of blood pressure (BP) were used as parameters for hypertension. Data were collected through interviews by using questionnaires. Food habits were assessed using a 2 x 24-hour food recall questionnaire and food frequency questionnaire. The types of food from each method were included in 9 food categories of food consumption score (FCS) (4). The total score of FCS was categorized into 2 categories (borderline (≤45) and acceptable (>45) that was a modification of the World Food Programme category.
RESULTS AND DISCUSSION
According to a previous study, non-vegetarian group had higher rates of hypertension and waist hip-ratio (>80cm) compared to the lacto-vegetarian group that can be the risk factor hypertension (5). The results of calculation FCS score based on the recall method show that non-vegetarian (92.5%) included in the acceptable category was higher than lacto-vegetarian. In contrast, the result of FCS score based on the FFQ method, lacto-vegetarian (82.5%) that included in the acceptable category was higher than non-vegetarian. The sensitivity value of the recall method in non-vegetarian (Se 86.6%) was higher than that of the lacto-vegetarian (31%). In contrast, specificity value of the recall method in lacto-vegetarian
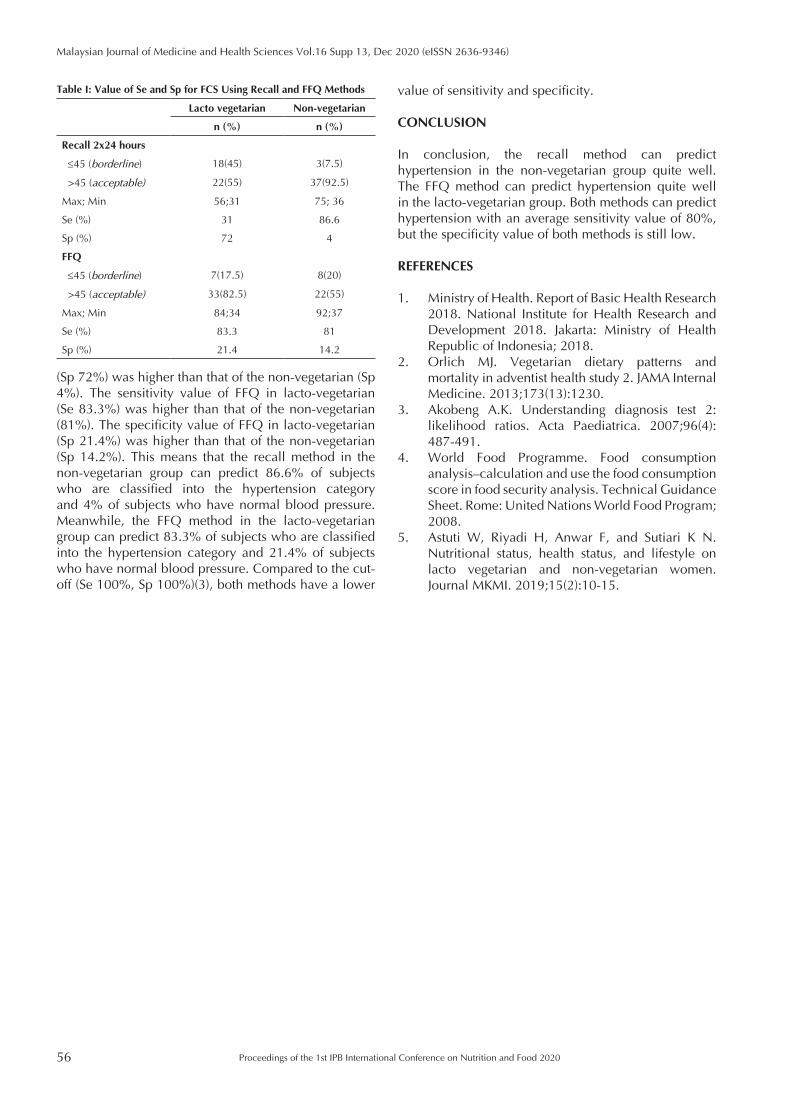
56
Malaysian Journal of Medicine and Health Sciences Vol.16 Supp 13, Dec 2020 (eISSN 2636-9346)
Proceedings of the 1st IPB International Conference on Nutrition and Food 2020
(Sp 72%) was higher than that of the non-vegetarian (Sp 4%). The sensitivity value of FFQ in lacto-vegetarian (Se 83.3%) was higher than that of the non-vegetarian (81%). The specificity value of FFQ in lacto-vegetarian (Sp 21.4%) was higher than that of the non-vegetarian (Sp 14.2%). This means that the recall method in the non-vegetarian group can predict 86.6% of subjects who are classified into the hypertension category and 4% of subjects who have normal blood pressure. Meanwhile, the FFQ method in the lacto-vegetarian group can predict 83.3% of subjects who are classified into the hypertension category and 21.4% of subjects who have normal blood pressure. Compared to the cut-off (Se 100%, Sp 100%)(3), both methods have a lower
value of sensitivity and specificity.
CONCLUSION
In conclusion, the recall method can predict hypertension in the non-vegetarian group quite well. The FFQ method can predict hypertension quite well in the lacto-vegetarian group. Both methods can predict hypertension with an average sensitivity value of 80%, but the specificity value of both methods is still low.
REFERENCES
1. Ministry of Health. Report of Basic Health Research 2018. National Institute for Health Research and Development 2018. Jakarta: Ministry of Health Republic of Indonesia; 2018.
2. Orlich MJ. Vegetarian dietary patterns and mortality in adventist health study 2. JAMA Internal Medicine. 2013;173(13):1230.
3. Akobeng A.K. Understanding diagnosis test 2: likelihood ratios. Acta Paediatrica. 2007;96(4): 487-491.
4. World Food Programme. Food consumption analysis–calculation and use the food consumption score in food security analysis. Technical Guidance Sheet. Rome: United Nations World Food Program; 2008.
5. Astuti W, Riyadi H, Anwar F, and Sutiari K N. Nutritional status, health status, and lifestyle on lacto vegetarian and non-vegetarian women. Journal MKMI. 2019;15(2):10-15.
Table I: Value of Se and Sp for FCS Using Recall and FFQ Methods
Lacto vegetarian Non-vegetarian
n (%) n (%)
Recall 2x24 hours
≤45 (borderline) 18(45) 3(7.5)
>45 (acceptable) 22(55) 37(92.5)
Max; Min 56;31 75; 36
Se (%) 31 86.6
Sp (%) 72 4
FFQ
≤45 (borderline) 7(17.5) 8(20)
>45 (acceptable) 33(82.5) 22(55)
Max; Min 84;34 92;37
Se (%) 83.3 81
Sp (%) 21.4 14.2
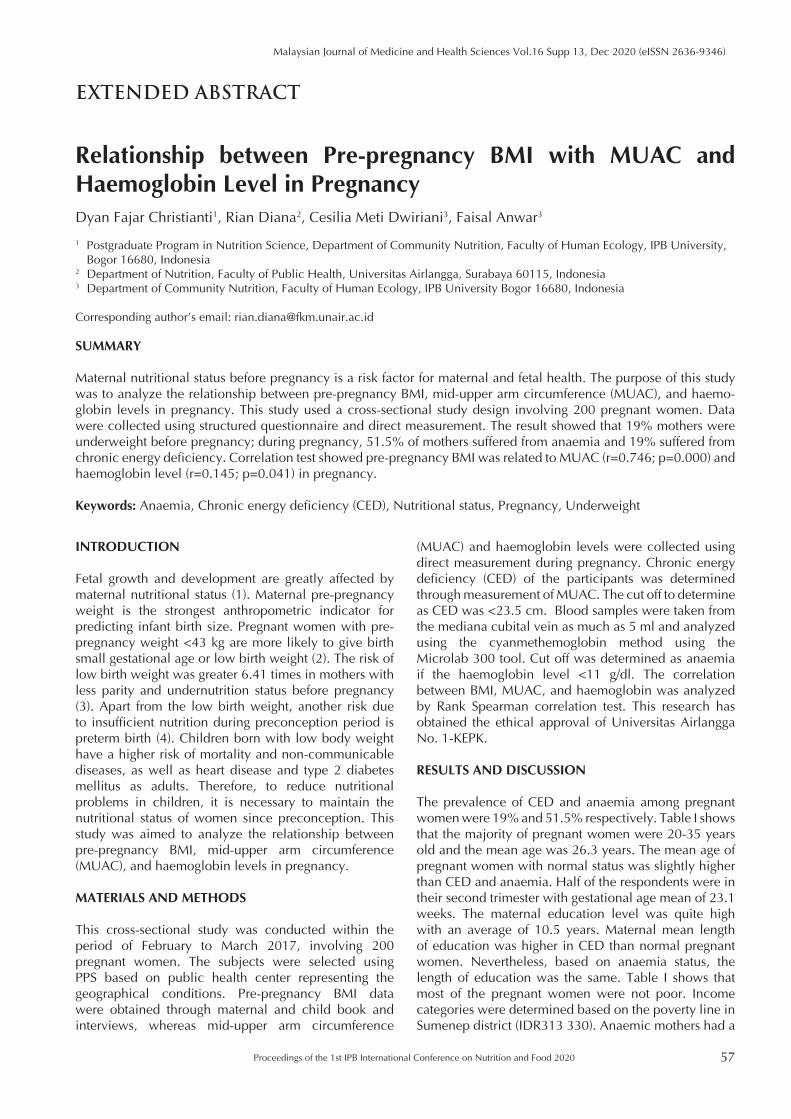
Proceedings of the 1st IPB International Conference on Nutrition and Food 2020 57
Malaysian Journal of Medicine and Health Sciences Vol.16 Supp 13, Dec 2020 (eISSN 2636-9346)
EXTENDED ABSTRACT
Relationship between Pre-pregnancy BMI with MUAC and Haemoglobin Level in Pregnancy Dyan Fajar Christianti1, Rian Diana2, Cesilia Meti Dwiriani3, Faisal Anwar3
1 Postgraduate Program in Nutrition Science, Department of Community Nutrition, Faculty of Human Ecology, IPB University, Bogor 16680, Indonesia
2 Department of Nutrition, Faculty of Public Health, Universitas Airlangga, Surabaya 60115, Indonesia3 Department of Community Nutrition, Faculty of Human Ecology, IPB University Bogor 16680, Indonesia
Corresponding author’s email: [email protected]
SUMMARY
Maternal nutritional status before pregnancy is a risk factor for maternal and fetal health. The purpose of this study was to analyze the relationship between pre-pregnancy BMI, mid-upper arm circumference (MUAC), and haemo-globin levels in pregnancy. This study used a cross-sectional study design involving 200 pregnant women. Data were collected using structured questionnaire and direct measurement. The result showed that 19% mothers were underweight before pregnancy; during pregnancy, 51.5% of mothers suffered from anaemia and 19% suffered from chronic energy deficiency. Correlation test showed pre-pregnancy BMI was related to MUAC (r=0.746; p=0.000) and haemoglobin level (r=0.145; p=0.041) in pregnancy.
Keywords: Anaemia, Chronic energy deficiency (CED), Nutritional status, Pregnancy, Underweight
INTRODUCTION
Fetal growth and development are greatly affected by maternal nutritional status (1). Maternal pre-pregnancy weight is the strongest anthropometric indicator for predicting infant birth size. Pregnant women with pre-pregnancy weight <43 kg are more likely to give birth small gestational age or low birth weight (2). The risk of low birth weight was greater 6.41 times in mothers with less parity and undernutrition status before pregnancy (3). Apart from the low birth weight, another risk due to insufficient nutrition during preconception period is preterm birth (4). Children born with low body weight have a higher risk of mortality and non-communicable diseases, as well as heart disease and type 2 diabetes mellitus as adults. Therefore, to reduce nutritional problems in children, it is necessary to maintain the nutritional status of women since preconception. This study was aimed to analyze the relationship between pre-pregnancy BMI, mid-upper arm circumference (MUAC), and haemoglobin levels in pregnancy.
MATERIALS AND METHODS
This cross-sectional study was conducted within the period of February to March 2017, involving 200 pregnant women. The subjects were selected using PPS based on public health center representing the geographical conditions. Pre-pregnancy BMI data were obtained through maternal and child book and interviews, whereas mid-upper arm circumference
(MUAC) and haemoglobin levels were collected using direct measurement during pregnancy. Chronic energy deficiency (CED) of the participants was determined through measurement of MUAC. The cut off to determine as CED was <23.5 cm. Blood samples were taken from the mediana cubital vein as much as 5 ml and analyzed using the cyanmethemoglobin method using the Microlab 300 tool. Cut off was determined as anaemia if the haemoglobin level <11 g/dl. The correlation between BMI, MUAC, and haemoglobin was analyzed by Rank Spearman correlation test. This research has obtained the ethical approval of Universitas Airlangga No. 1-KEPK.
RESULTS AND DISCUSSION
The prevalence of CED and anaemia among pregnant women were 19% and 51.5% respectively. Table I shows that the majority of pregnant women were 20-35 years old and the mean age was 26.3 years. The mean age of pregnant women with normal status was slightly higher than CED and anaemia. Half of the respondents were in their second trimester with gestational age mean of 23.1 weeks. The maternal education level was quite high with an average of 10.5 years. Maternal mean length of education was higher in CED than normal pregnant women. Nevertheless, based on anaemia status, the length of education was the same. Table I shows that most of the pregnant women were not poor. Income categories were determined based on the poverty line in Sumenep district (IDR313 330). Anaemic mothers had a
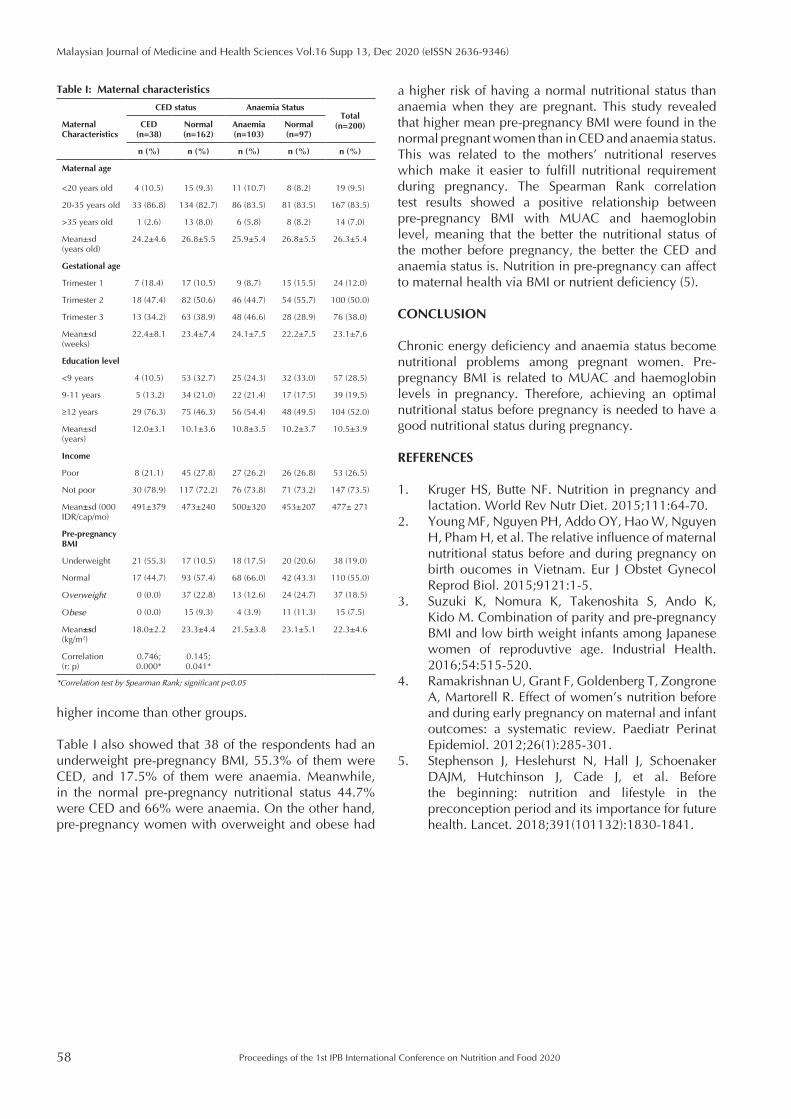
58
Malaysian Journal of Medicine and Health Sciences Vol.16 Supp 13, Dec 2020 (eISSN 2636-9346)
Proceedings of the 1st IPB International Conference on Nutrition and Food 2020
a higher risk of having a normal nutritional status than anaemia when they are pregnant. This study revealed that higher mean pre-pregnancy BMI were found in the normal pregnant women than in CED and anaemia status. This was related to the mothers’ nutritional reserves which make it easier to fulfill nutritional requirement during pregnancy. The Spearman Rank correlation test results showed a positive relationship between pre-pregnancy BMI with MUAC and haemoglobin level, meaning that the better the nutritional status of the mother before pregnancy, the better the CED and anaemia status is. Nutrition in pre-pregnancy can affect to maternal health via BMI or nutrient deficiency (5).
CONCLUSION
Chronic energy deficiency and anaemia status become nutritional problems among pregnant women. Pre-pregnancy BMI is related to MUAC and haemoglobin levels in pregnancy. Therefore, achieving an optimal nutritional status before pregnancy is needed to have a good nutritional status during pregnancy.
REFERENCES
1. Kruger HS, Butte NF. Nutrition in pregnancy and lactation. World Rev Nutr Diet. 2015;111:64-70.
2. Young MF, Nguyen PH, Addo OY, Hao W, Nguyen H, Pham H, et al. The relative influence of maternal nutritional status before and during pregnancy on birth oucomes in Vietnam. Eur J Obstet Gynecol Reprod Biol. 2015;9121:1-5.
3. Suzuki K, Nomura K, Takenoshita S, Ando K, Kido M. Combination of parity and pre-pregnancy BMI and low birth weight infants among Japanese women of reproduvtive age. Industrial Health. 2016;54:515-520.
4. Ramakrishnan U, Grant F, Goldenberg T, Zongrone A, Martorell R. Effect of women’s nutrition before and during early pregnancy on maternal and infant outcomes: a systematic review. Paediatr Perinat Epidemiol. 2012;26(1):285-301.
5. Stephenson J, Heslehurst N, Hall J, Schoenaker DAJM, Hutchinson J, Cade J, et al. Before the beginning: nutrition and lifestyle in the preconception period and its importance for future health. Lancet. 2018;391(101132):1830-1841.
Table I: Maternal characteristics
Maternal Characteristics
CED status Anaemia StatusTotal
(n=200)CED (n=38)
Normal (n=162)
Anaemia (n=103)
Normal (n=97)
n (%) n (%) n (%) n (%) n (%)
Maternal age
<20 years old 4 (10.5) 15 (9.3) 11 (10.7) 8 (8.2) 19 (9.5)
20-35 years old 33 (86.8) 134 (82.7) 86 (83.5) 81 (83.5) 167 (83.5)
>35 years old 1 (2.6) 13 (8.0) 6 (5.8) 8 (8.2) 14 (7.0)
Mean±sd (years old)
24.2±4.6 26.8±5.5 25.9±5.4 26.8±5.5 26.3±5.4
Gestational age
Trimester 1 7 (18.4) 17 (10.5) 9 (8.7) 15 (15.5) 24 (12.0)
Trimester 2 18 (47.4) 82 (50.6) 46 (44.7) 54 (55.7) 100 (50.0)
Trimester 3 13 (34.2) 63 (38.9) 48 (46.6) 28 (28.9) 76 (38.0)
Mean±sd (weeks)
22.4±8.1 23.4±7.4 24.1±7.5 22.2±7.5 23.1±7.6
Education level
<9 years 4 (10.5) 53 (32.7) 25 (24.3) 32 (33.0) 57 (28.5)
9-11 years 5 (13.2) 34 (21.0) 22 (21.4) 17 (17.5) 39 (19.5)
≥12 years 29 (76.3) 75 (46.3) 56 (54.4) 48 (49.5) 104 (52.0)
Mean±sd (years)
12.0±3.1 10.1±3.6 10.8±3.5 10.2±3.7 10.5±3.9
Income
Poor 8 (21.1) 45 (27.8) 27 (26.2) 26 (26.8) 53 (26.5)
Not poor 30 (78.9) 117 (72.2) 76 (73.8) 71 (73.2) 147 (73.5)
Mean±sd (000 IDR/cap/mo)
491±379 473±240 500±320 453±207 477± 271
Pre-pregnancy BMI
Underweight 21 (55.3) 17 (10.5) 18 (17.5) 20 (20.6) 38 (19.0)
Normal 17 (44.7) 93 (57.4) 68 (66.0) 42 (43.3) 110 (55.0)
Overweight 0 (0.0) 37 (22.8) 13 (12.6) 24 (24.7) 37 (18.5)
Obese 0 (0.0) 15 (9.3) 4 (3.9) 11 (11.3) 15 (7.5)
Mean±sd (kg/m2)
18.0±2.2 23.3±4.4 21.5±3.8 23.1±5.1 22.3±4.6
Correlation (r; p)
0.746; 0.000*
0.145; 0.041*
*Correlation test by Spearman Rank; significant p<0.05
higher income than other groups.
Table I also showed that 38 of the respondents had an underweight pre-pregnancy BMI, 55.3% of them were CED, and 17.5% of them were anaemia. Meanwhile, in the normal pre-pregnancy nutritional status 44.7% were CED and 66% were anaemia. On the other hand, pre-pregnancy women with overweight and obese had
Proceedings of the 1st IPB International Conference on Nutrition and Food 2020 59
Malaysian Journal of Medicine and Health Sciences Vol.16 Supp 13, Dec 2020 (eISSN 2636-9346)
EXTENDED ABSTRACT
Determinants of Double Burden of Undernutrition among Women of Reproductive Age in IndonesiaAnna Vipta Resti Mauludyani, Dodik Briawan
Department of Community Nutrition, Faculty of Human Ecology, IPB University, IPB Darmaga Bogor 16680, Indonesia
Corresponding author’s email: [email protected]
SUMMARY
Undernutrition problems among women of reproductive age (WRA) may deteriorate the pregnancy outcomes. This study analysed determinants of double burden of undernutrition (chronic energy deficiency and anaemia) among WRA (15-49 years old). Logistic regression was applied to analyse data from 14,467 WRA included in Indonesian Basic Health Research 2013. Prevalence of the undernutrition was 4.7%. Double burden of undernutrition was as-sociated with history of diarrhoea (OR 3.8 95%CI1.709-8.553, p=0.001), younger age (OR 0.9 95%CI0.847-0.978, p=0.010), poor handwashing after defecation (OR 0.3 95%CI0.113-0.929, p=0.036), and low economic status (OR 0.3 95%CI0.109-0.853, p=0.024). Socioeconomic improvement and adequate hygiene and sanitation are needed to overcome the problem.
Keywords: Childbearing age, Hygiene and sanitation, Influencing factor, Poverty, Women malnutrition
INTRODUCTION
Undernourished women at reproductive age (WRA) are common in Indonesia (1). Nutrition problems among them may worsen the pregnancy outcomes. WHO mentioned that the term ‘double burden of malnutrition’ refers to the coexistence of two or more types of malnutrition, while the problem can be caused by various factors, such as individual and environmental characteristics (2). Other studies found that age at first marriage and household food insecurity were predictors of nutritional status of WRA (3). The most common undernutrition problems among WRA were chronic energy deficiency (CED) and anaemia. A study also found that both undernutrition problems were related (4). Nonetheless, to our knowledge, studies on double burden of undernutrition (CED and anaemia) among WRA are still rare. The objective of this study was to identify the magnitude of double burden of undernutrition among Indonesian WRA and its risk factors.
MATERIALS AND METHODS
This cross-sectional study used secondary data obtained from a national survey (Basic Health Research 2013) collected by the Ministry of Health of Republic of Indonesia. Women with haemoglobin level of 5 g/dL or higher and not pregnant were included as subjects. This study analysed data from14,467 WRA in 497 districts in 33 provinces in Indonesia. This study utilized data
on subjects’ characteristics (age, education, occupation, economic status), mid-upper arm circumference to measure CED, haemoglobin level to measure anaemia, diarrhoea and acute respiratory infection/ARI in the last month, malaria, pneumonia, and pulmonary TB in the last 12 months, pregnancy history, hygiene and sanitation, and physical activity. Calculation of the prevalence involved design weight determined in the survey. Multivariate analyses were conducted using logistic regression test. A p-value less than 0.05 was considered significant.
RESULTS AND DISCUSSION
The median age of the subjects was 33 years. Most of them had <9 years of education (71.2%), non-employee occupation (78.1%), owned latrine (83.7%), consumed IFA tablets (89.6%), had no vigorous physical activity (77.1%), had improved drinking water source (85.4%), practiced handwashing before preparing food (77.4%), after defecation (88.3%), and when their hands were dirty (77.8%). The highest proportion of subjects was in economic status Quintile 4 (26.5%). There were 19.1%, 19.4% and 4.7% of WRA who suffered from CED, anaemia, and both, respectively. The CED prevalence was lower than the prevalence in Bangladesh (>30%) and Ethiopia (47.9%) (1,3). Determinants of double burden of undernutrition among WRA were history of diarrhoea, younger age, poor handwashing after defecation, and poverty. WRA with diarrhoea in the
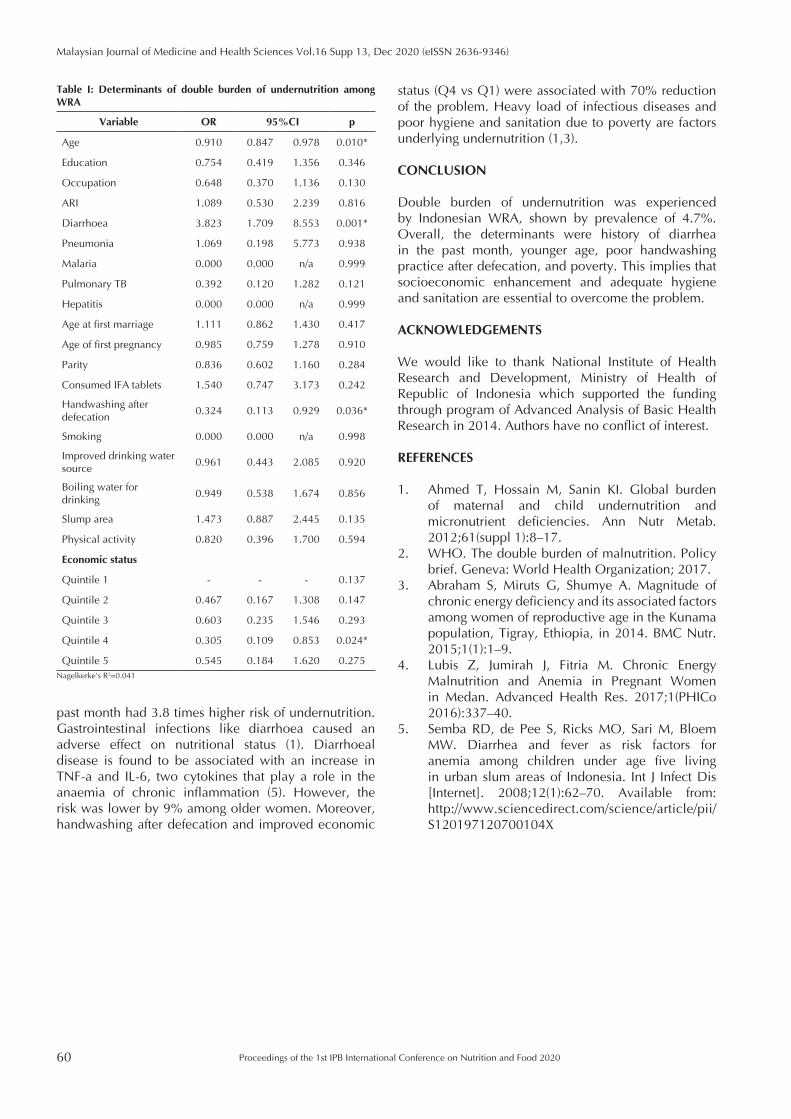
60
Malaysian Journal of Medicine and Health Sciences Vol.16 Supp 13, Dec 2020 (eISSN 2636-9346)
Proceedings of the 1st IPB International Conference on Nutrition and Food 2020
past month had 3.8 times higher risk of undernutrition. Gastrointestinal infections like diarrhoea caused an adverse effect on nutritional status (1). Diarrhoeal disease is found to be associated with an increase in TNF-a and IL-6, two cytokines that play a role in the anaemia of chronic inflammation (5). However, the risk was lower by 9% among older women. Moreover, handwashing after defecation and improved economic
status (Q4 vs Q1) were associated with 70% reduction of the problem. Heavy load of infectious diseases and poor hygiene and sanitation due to poverty are factors underlying undernutrition (1,3).
CONCLUSION
Double burden of undernutrition was experienced by Indonesian WRA, shown by prevalence of 4.7%. Overall, the determinants were history of diarrhea in the past month, younger age, poor handwashing practice after defecation, and poverty. This implies that socioeconomic enhancement and adequate hygiene and sanitation are essential to overcome the problem.
ACKNOWLEDGEMENTS
We would like to thank National Institute of Health Research and Development, Ministry of Health of Republic of Indonesia which supported the funding through program of Advanced Analysis of Basic Health Research in 2014. Authors have no conflict of interest.
REFERENCES
1. Ahmed T, Hossain M, Sanin KI. Global burden of maternal and child undernutrition and micronutrient deficiencies. Ann Nutr Metab. 2012;61(suppl 1):8–17.
2. WHO. The double burden of malnutrition. Policy brief. Geneva: World Health Organization; 2017.
3. Abraham S, Miruts G, Shumye A. Magnitude of chronic energy deficiency and its associated factors among women of reproductive age in the Kunama population, Tigray, Ethiopia, in 2014. BMC Nutr. 2015;1(1):1–9.
4. Lubis Z, Jumirah J, Fitria M. Chronic Energy Malnutrition and Anemia in Pregnant Women in Medan. Advanced Health Res. 2017;1(PHICo 2016):337–40.
5. Semba RD, de Pee S, Ricks MO, Sari M, Bloem MW. Diarrhea and fever as risk factors for anemia among children under age five living in urban slum areas of Indonesia. Int J Infect Dis [Internet]. 2008;12(1):62–70. Available from: http://www.sciencedirect.com/science/article/pii/S120197120700104X
Table I: Determinants of double burden of undernutrition among WRA
Variable OR 95%CI p
Age 0.910 0.847 0.978 0.010*
Education 0.754 0.419 1.356 0.346
Occupation 0.648 0.370 1.136 0.130
ARI 1.089 0.530 2.239 0.816
Diarrhoea 3.823 1.709 8.553 0.001*
Pneumonia 1.069 0.198 5.773 0.938
Malaria 0.000 0.000 n/a 0.999
Pulmonary TB 0.392 0.120 1.282 0.121
Hepatitis 0.000 0.000 n/a 0.999
Age at first marriage 1.111 0.862 1.430 0.417
Age of first pregnancy 0.985 0.759 1.278 0.910
Parity 0.836 0.602 1.160 0.284
Consumed IFA tablets 1.540 0.747 3.173 0.242
Handwashing after defecation
0.324 0.113 0.929 0.036*
Smoking 0.000 0.000 n/a 0.998
Improved drinking water source
0.961 0.443 2.085 0.920
Boiling water for drinking
0.949 0.538 1.674 0.856
Slump area 1.473 0.887 2.445 0.135
Physical activity 0.820 0.396 1.700 0.594
Economic status
Quintile 1 - - - 0.137
Quintile 2 0.467 0.167 1.308 0.147
Quintile 3 0.603 0.235 1.546 0.293
Quintile 4 0.305 0.109 0.853 0.024*
Quintile 5 0.545 0.184 1.620 0.275Nagelkerke’s R2=0.041
Proceedings of the 1st IPB International Conference on Nutrition and Food 2020 61
Malaysian Journal of Medicine and Health Sciences Vol.16 Supp 13, Dec 2020 (eISSN 2636-9346)
EXTENDED ABSTRACT
The Impact of School Lunch Project and Nutrition Education About Nutritional Status, Knowledge, Attitude, and Practice on the Nutrition and Health of Adolescents in Islamic Boarding SchoolReisi Nurdiani, Purnawati Hustina Rachman
Department of Community Nutrition, Faculty of Human Ecology, IPB University, Indonesia
Corresponding author’s email: [email protected]
SUMMARY
This study aimed to assess the impact of School Lunch Project (SLP) concerning nutritional status and the knowledge, attitude and practice on the nutrition and health of adolescents. The pre-post quasi experimental study was used with to 102 subjects. The subjects received a healthy lunch for 156 days and ten sessions of nutrition education. The result showed a significant reduction in obesity prevalence (p<0.05), increased intake of energy, protein, and iron (p<0.05), as well as increased knowledge, practice, and attitude on nutrition and health (p<0.05). This study revealed that an integrated SLP is capable of significantly improving nutrient intake, nutritional status and nutrition education of adolescents.
Keywords: Adolescents, Healthy lunch, Nutrition education, Nutrient intake, Obesity.
INTRODUCTION
The recent Indonesian National Basic Health Survey revealed that the prevalence of energy and protein deficiency among girls and boys aged 13-18 years was 54.5% and 38.1%, respectively. Moreover, 93.5% adolescents consume less than five servings of vegetables and fruit per day and 47% of adolescents practice good hand washing (1). A review of various studies revealed that 14-88% of adolescents are skipping meals at breakfast, 8-57% skipping meals at lunch, and 4-57% skipping meals at dinner (2). Currently school meals are part of efforts to prevent health problems and to support the development of sustainable healthy eating behaviors (3,4). It shows that school meals can be a viable and sustainable program to improve health, nutrition and the development of good and sustainable eating behavior. The objective of this study was to evaluate the changing nutritional status, nutrient intake and nutrition knowledge, attitude and behavior as the results of school meal intervention.
MATERIALS AND METHODS
The study was conducted at Darul Fallah Islamic Boarding School, Bogor, West Java, Indonesia. The interventions included the provision of animal protein and fruit during lunch every day, as well as nutrition education program for one semester. To assess the effect of this intervention, baseline and endline surveys
were conducted. The lunch menu was developed in accordance with the Recommended Dietary Allowances (RDA) for children aged 13-18 years, that is one-third of the energy and protein required per day or 635-776 kkal per day and 18-22 gram per day, respectively. Data collection was conducted through anthropometric measurements, dietary intake survey (SQ FFQ), and validated questionnaire on eating habits, knowledge, attitudes, and practices. Knowledge and attitude were categorized into poor, fair, and good of all correct answers. The practice was categorized into never, rarely (1-2 times a week), sometimes (3-4 times a week), often (5-6 times a week), and always.
RESULTS AND DISCUSSION
The results showed that based on the baseline and end line, the nutrition knowledge significantly increased (p<0.05). Moreover, the nutrition atittude also incrased showed simililar results with the nutrition knowledge (p<0.05) (Table I).
The results of the study also revealed that 10 out of 15 topics had a significant increase in their practice, including eating food rich of iron, vegetables, animal-source protein, fruits, and physical activity also applying guide of balanced nutrition (Table II). However, compared to the significant changes in knowledge and attitude aspects, only physical activity showed a consistent increase in knowledge, attitude and practice.
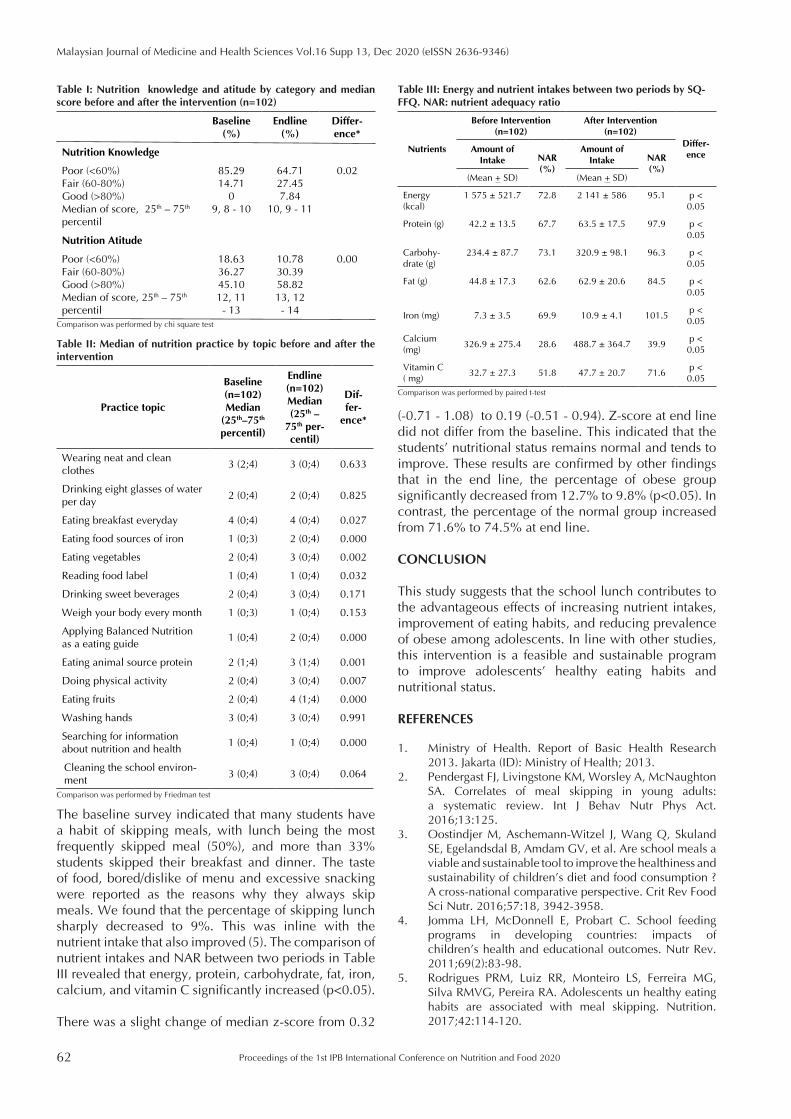
62
Malaysian Journal of Medicine and Health Sciences Vol.16 Supp 13, Dec 2020 (eISSN 2636-9346)
Proceedings of the 1st IPB International Conference on Nutrition and Food 2020
The baseline survey indicated that many students have a habit of skipping meals, with lunch being the most frequently skipped meal (50%), and more than 33% students skipped their breakfast and dinner. The taste of food, bored/dislike of menu and excessive snacking were reported as the reasons why they always skip meals. We found that the percentage of skipping lunch sharply decreased to 9%. This was inline with the nutrient intake that also improved (5). The comparison of nutrient intakes and NAR between two periods in Table III revealed that energy, protein, carbohydrate, fat, iron, calcium, and vitamin C significantly increased (p<0.05).
There was a slight change of median z-score from 0.32
Table I: Nutrition knowledge and atitude by category and median score before and after the intervention (n=102)
Baseline (%)
Endline (%)
Differ-ence*
Nutrition Knowledge
Poor (<60%)Fair (60-80%) Good (>80%)Median of score, 25th – 75th percentil
85.2914.71
09, 8 - 10
64.7127.457.84
10, 9 - 11
0.02
Nutrition Atitude
Poor (<60%)Fair (60-80%) Good (>80%)Median of score, 25th – 75th percentil
18.6336.2745.1012, 11 - 13
10.7830.3958.8213, 12 - 14
0.00
Comparison was performed by chi square test
Table II: Median of nutrition practice by topic before and after the intervention
Practice topic
Baseline (n=102)Median
(25th–75th
percentil)
Endline (n=102) Median (25th –
75th per-centil)
Dif-fer-
ence*
Wearing neat and clean clothes
3 (2;4) 3 (0;4) 0.633
Drinking eight glasses of water per day
2 (0;4) 2 (0;4) 0.825
Eating breakfast everyday 4 (0;4) 4 (0;4) 0.027
Eating food sources of iron 1 (0;3) 2 (0;4) 0.000
Eating vegetables 2 (0;4) 3 (0;4) 0.002
Reading food label 1 (0;4) 1 (0;4) 0.032
Drinking sweet beverages 2 (0;4) 3 (0;4) 0.171
Weigh your body every month 1 (0;3) 1 (0;4) 0.153
Applying Balanced Nutrition as a eating guide
1 (0;4) 2 (0;4) 0.000
Eating animal source protein 2 (1;4) 3 (1;4) 0.001
Doing physical activity 2 (0;4) 3 (0;4) 0.007
Eating fruits 2 (0;4) 4 (1;4) 0.000
Washing hands 3 (0;4) 3 (0;4) 0.991
Searching for information about nutrition and health
1 (0;4) 1 (0;4) 0.000
Cleaning the school environ-ment
3 (0;4) 3 (0;4) 0.064
Comparison was performed by Friedman test
Table III: Energy and nutrient intakes between two periods by SQ-FFQ. NAR: nutrient adequacy ratio
Nutrients
Before Intervention (n=102)
After Intervention (n=102)
Differ-ence
Amount of Intake NAR
(%)
Amount of Intake NAR
(%)(Mean + SD) (Mean + SD)
Energy (kcal)
1 575 ± 521.7 72.8 2 141 ± 586 95.1 p < 0.05
Protein (g) 42.2 ± 13.5 67.7 63.5 ± 17.5 97.9 p < 0.05
Carbohy-drate (g)
234.4 ± 87.7 73.1 320.9 ± 98.1 96.3 p < 0.05
Fat (g) 44.8 ± 17.3 62.6 62.9 ± 20.6 84.5 p < 0.05
Iron (mg) 7.3 ± 3.5 69.9 10.9 ± 4.1 101.5 p < 0.05
Calcium (mg)
326.9 ± 275.4 28.6 488.7 ± 364.7 39.9 p < 0.05
Vitamin C ( mg)
32.7 ± 27.3 51.8 47.7 ± 20.7 71.6 p < 0.05
Comparison was performed by paired t-test
(-0.71 - 1.08) to 0.19 (-0.51 - 0.94). Z-score at end line did not differ from the baseline. This indicated that the students’ nutritional status remains normal and tends to improve. These results are confirmed by other findings that in the end line, the percentage of obese group significantly decreased from 12.7% to 9.8% (p<0.05). In contrast, the percentage of the normal group increased from 71.6% to 74.5% at end line.
CONCLUSION
This study suggests that the school lunch contributes to the advantageous effects of increasing nutrient intakes, improvement of eating habits, and reducing prevalence of obese among adolescents. In line with other studies, this intervention is a feasible and sustainable program to improve adolescents’ healthy eating habits and nutritional status.
REFERENCES
1. Ministry of Health. Report of Basic Health Research 2013. Jakarta (ID): Ministry of Health; 2013.
2. Pendergast FJ, Livingstone KM, Worsley A, McNaughton SA. Correlates of meal skipping in young adults: a systematic review. Int J Behav Nutr Phys Act. 2016;13:125.
3. Oostindjer M, Aschemann-Witzel J, Wang Q, Skuland SE, Egelandsdal B, Amdam GV, et al. Are school meals a viable and sustainable tool to improve the healthiness and sustainability of children’s diet and food consumption ? A cross-national comparative perspective. Crit Rev Food Sci Nutr. 2016;57:18, 3942-3958.
4. Jomma LH, McDonnell E, Probart C. School feeding programs in developing countries: impacts of children’s health and educational outcomes. Nutr Rev. 2011;69(2):83-98.
5. Rodrigues PRM, Luiz RR, Monteiro LS, Ferreira MG, Silva RMVG, Pereira RA. Adolescents un healthy eating habits are associated with meal skipping. Nutrition. 2017;42:114-120.
Proceedings of the 1st IPB International Conference on Nutrition and Food 2020 63
Malaysian Journal of Medicine and Health Sciences Vol.16 Supp 13, Dec 2020 (eISSN 2636-9346)
EXTENDED ABSTRACT
Knowledge, Attitudes, Vegetables and Fruit Consumption and Nutrition Status among School ChildrenSyahbuddin1, Dodik Briawan2, Drajat Martianto2, Djuara P Lubis3
1 Postgraduate Program in Nutrition Science, IPB University2 Departement of Community Nutrition, Bogor Agricultural University3 Departement of Communication and Community Development Sciences, Bogor Agricultural University
Corresponding author’s email: [email protected]
SUMMARY
This study aims to determine knowledge, attitudes, vegetable and fruit consumption practices and the nutritional status of school children. A cross-sectional study design was employed, which involved schoolchildren. Data on knowledge, attitudes and practices of consumption of vegetables and fruit were collected by interviews. Nutritional status was determined using body mass index z-score (BAZ). The results showed that knowledge, attitudes and con-sumption of vegetables and fruits and nutrient intake are still in the low category (59.8%, 42.7% and 59.8%), and 23.9% stunted and 12.0% wasted. It is necessary to provide structured nutrition education in schools to increase daily vegetable and fruit intake.
Keywords: Attitude, Knowledge, School children, Vegetables fruit intake.
INTRODUCTION
School age is a phase vulnerable to disease and malnutrition. There are 11.2% and 30.7% schoolchildren suffering from wasting and stunting in Aceh. Malnutrition is affected by the food consumption pattern and low intake of nutrients (1). Studies showed that many schoolchildren consumed less balanced meals including less consumption of vegetables from the food served at schools and low intake of energy and nutrients (2). Studies in Colorado also showed that students chose certain food from the food served on the dinner plate; only 45% of elementary school students chose vegetables; more than one third of fruit and vegetables remained (3). This study aims to analyze the knowledge, attitudes, and practices of vegetable and fruit consumption among schoolchildren.
MATERIALS AND METHODS
A cross-sectional design was conducted, involving 117 schoolchildren in Aceh. Knowledge and attitudes were explored using interviews. Data on consumption of vegetables and fruit were collected using semi-quantitative food frequency questionaire, while data on energy and nutrient intake were collected using repeated 24-h food recall. Data on nutritional status were collected by antrophometric method and classified by Body Mass Index z-score (BAZ) index. The analysis of intake was
conducted using nutrisurvey software, and Knowledge, attitude, and vegetable and fruit consumption data analysis by scoring methods, categorized to less (score ≤80), and good (score ≥80). Data analysis employed univariate and bivariate using the chi-square test at 95% confident interval.
RESULTS AND DISCUSSION
The results showed (Table I) that knowledge, attitudes and practices of consumption of vegetables and fruits are still low; the level of energy intake, protein, fiber, vitamin A and iron are mostly at deficit categories. The results of this study also showed that nutritional intake of schoolchildren was still under the RDA. The results also showed that malnutrition among schoolchildren was still a problem; almost a quarter of the children were stunted. There is a relationship between knowledge and attitude (p=0.01); there is no relationship (Table II) between knowledge and attitude, and the practice of consumption of vegetables and fruit (p=0.113 and p=0.67). This is in line with other studies showing that only a small proportion of children are provided with foods that contain vegetables and some housewives understand the importance of vegetables and fruit but do not practice them in family food arrangement. The results of this study are also in line with other studies showing that there is a relationship between knowledge and attiudes of mothers with their behavior in providing
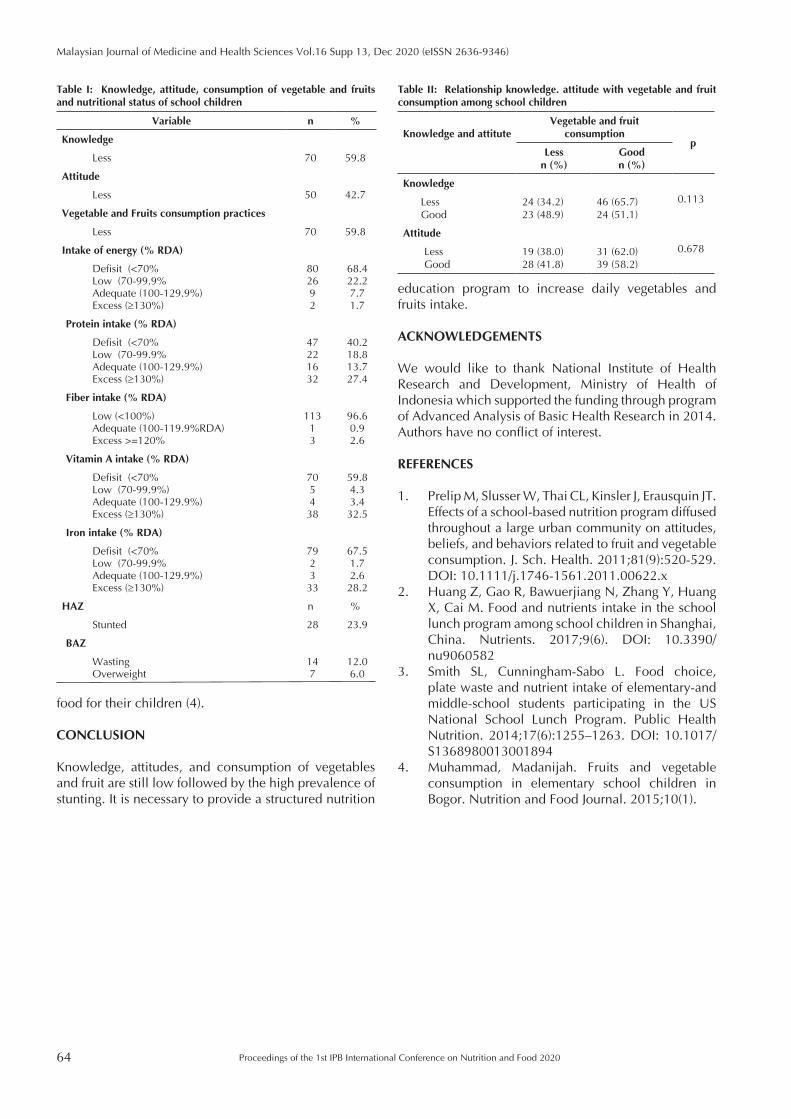
64
Malaysian Journal of Medicine and Health Sciences Vol.16 Supp 13, Dec 2020 (eISSN 2636-9346)
Proceedings of the 1st IPB International Conference on Nutrition and Food 2020
education program to increase daily vegetables and fruits intake.
ACKNOWLEDGEMENTS
We would like to thank National Institute of Health Research and Development, Ministry of Health of Indonesia which supported the funding through program of Advanced Analysis of Basic Health Research in 2014. Authors have no conflict of interest.
REFERENCES
1. Prelip M, Slusser W, Thai CL, Kinsler J, Erausquin JT. Effects of a school-based nutrition program diffused throughout a large urban community on attitudes, beliefs, and behaviors related to fruit and vegetable consumption. J. Sch. Health. 2011;81(9):520-529. DOI: 10.1111/j.1746-1561.2011.00622.x
2. Huang Z, Gao R, Bawuerjiang N, Zhang Y, Huang X, Cai M. Food and nutrients intake in the school lunch program among school children in Shanghai, China. Nutrients. 2017;9(6). DOI: 10.3390/nu9060582
3. Smith SL, Cunningham-Sabo L. Food choice, plate waste and nutrient intake of elementary-and middle-school students participating in the US National School Lunch Program. Public Health Nutrition. 2014;17(6):1255–1263. DOI: 10.1017/S1368980013001894
4. Muhammad, Madanijah. Fruits and vegetable consumption in elementary school children in Bogor. Nutrition and Food Journal. 2015;10(1).
Table I: Knowledge, attitude, consumption of vegetable and fruits and nutritional status of school children
Variable n %
Knowledge
Less 70 59.8
Attitude
Less 50 42.7
Vegetable and Fruits consumption practices
Less 70 59.8
Intake of energy (% RDA)
Defisit (<70% Low (70-99.9% Adequate (100-129.9%)Excess (≥130%)
802692
68.422.27.71.7
Protein intake (% RDA)
Defisit (<70% Low (70-99.9% Adequate (100-129.9%)Excess (≥130%)
47221632
40.218.813.727.4
Fiber intake (% RDA)
Low (<100%)Adequate (100-119.9%RDA)Excess >=120%
11313
96.60.92.6
Vitamin A intake (% RDA)
Defisit (<70% Low (70-99.9%) Adequate (100-129.9%)Excess (≥130%)
7054
38
59.84.33.432.5
Iron intake (% RDA)
Defisit (<70% Low (70-99.9% Adequate (100-129.9%)Excess (≥130%)
7923
33
67.51.72.628.2
HAZ n %
Stunted 28 23.9
BAZ
WastingOverweight
147
12.06.0
Table II: Relationship knowledge. attitude with vegetable and fruit consumption among school children
Knowledge and attituteVegetable and fruit
consumptionp
Lessn (%)
Goodn (%)
Knowledge
0.113 Less Good
24 (34.2)23 (48.9)
46 (65.7)24 (51.1)
Attitude
0.678LessGood
19 (38.0)28 (41.8)
31 (62.0)39 (58.2)
food for their children (4).
CONCLUSION
Knowledge, attitudes, and consumption of vegetables and fruit are still low followed by the high prevalence of stunting. It is necessary to provide a structured nutrition
Proceedings of the 1st IPB International Conference on Nutrition and Food 2020 65
Malaysian Journal of Medicine and Health Sciences Vol.16 Supp 13, Dec 2020 (eISSN 2636-9346)
EXTENDED ABSTRACT
Body Composition and Anaemia Status of Adolescent Girls in West Java, IndonesiaMelda Oktaviana1, Mira Dewi2, Cesilia Meti Dwiriani2
1 Postgraduate Program in Nutrition Science, IPB University, Bogor, Indonesia2 Department of Community Nutrition, Faculty of Human Ecology, IPB University, Bogor, 16680, Indonesia
Corresponding author’s email: [email protected]
SUMMARY
There is a possible correlation between obesity and anaemia. This study analyses the correlation between body com-position and Hb concentration among female adolescents. We measured anthropometrics and Hb concentration of 2,184 female students aged 15-19 years who participated in a Nutrition International (NI) funded project, i.e. a base-line survey of The ‘Better Investment for Stunting Alleviation (BISA)’ program in West Bandung and Sumedang-West Java. The results indicate that the highest prevalence of anaemia was found among female adolescents with normal nutritional status and there was no correlation between BMI for age z-score (BAZ) and waist circumference with blood Hb.
Keywords: Adolescent girls, Anaemia, BAZ, Hb, Waist circumference
INTRODUCTION
Anaemia and obesity are still dominant public health problems in Indonesia. At the national level, the prevalence of obesity in adolescent has increased from 1.4% in 2010 to 7.3% in 2013 (1). The anaemia prevalence of adolescent girls and women of reproductive age (15 to 24 years) increased from 18.4% in 2013 to 32% in 2018 (2). Furthermore, the obesity prevalence of adolescents (16 to 18 years) in West Java was higher than the national level in 2018 (2). Some studies have shown a correlation between anaemia and obesity. Female adolescents with normal nutritional status were found to have a lower risk of iron deficiency compared to their overweight peers (3). Therefore, the study aims to investigate the correlation between body composition and anaemia status of female adolescents in West Java Province, Indonesia.
MATERIALS AND METHODS
We measured anthropometrics including central obesity (as the proxy for body fatness) of 2,184 female students aged 15-19 years who participated in a NI funded project, i.e. a baseline survey of The BISA program in West Bandung and Sumedang-West Java. Data on the subjects’ characteristics and blood Hb level measured by HemoCue 201+ were collected for the survey and were analysed. WHO standards were used in categorizing subjects based on BAZ. Subjects with a waist circumference >80 cm were categorized as central
obesity, while those with Hb concentration <12 g/dl were categorized as having anaemia. The prevalence of anaemia was compared across nutritional status (by BAZ and waist circumference). Spearman test was used to analyse the correlation of all variables with Hb concentration.
RESULTS AND DISCUSSION
The result showed that 82.0% of the subjects were in the normal weight category and 9.6% of the subjects had central obesity (Table I). The overall prevalence of anaemia was 49.3% with an average Hb concentration of 11.8 ± 1.4 g/dL. The highest prevalence of anaemia was found in subjects with normal BAZ (83.6%) and waist circumference ≤80 cm (91%), but not significantly different. There was no correlation between age, height, waist circumference, and BAZ with Hb concentration (Table II). These findings, contrary to previous studies, showed that female adolescents with a high level of body fat were less likely to be anaemic as compared to normal weight female adolescents. This may occur because the Hb concentration can only detect the final stage of iron deficiency in the subjects (4). The alterations of iron homeostasis that may have occurred due to excess body fat in the early stages cannot be seen in the study results. Therefore, a decrease in hepcidin together with transferrin saturation and a decreased in ferritin can be used as additional parameters as early biomarkers of iron deficiency in the future study (5).
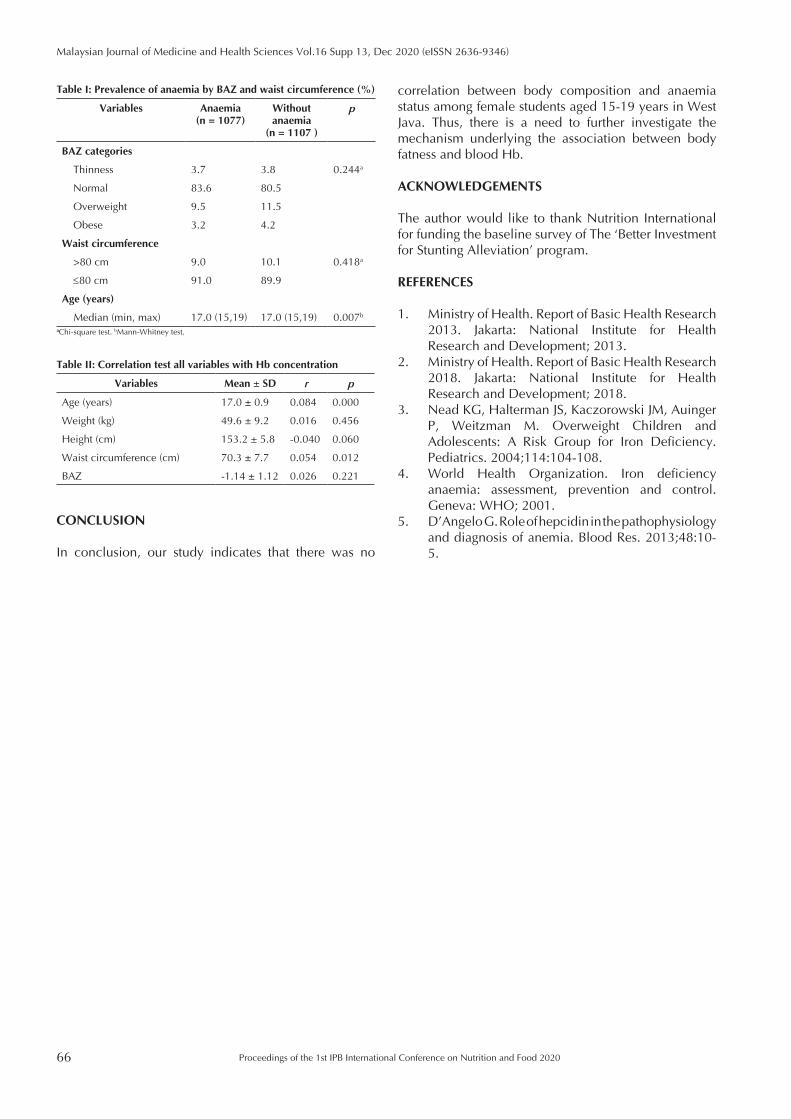
66
Malaysian Journal of Medicine and Health Sciences Vol.16 Supp 13, Dec 2020 (eISSN 2636-9346)
Proceedings of the 1st IPB International Conference on Nutrition and Food 2020
correlation between body composition and anaemia status among female students aged 15-19 years in West Java. Thus, there is a need to further investigate the mechanism underlying the association between body fatness and blood Hb.
ACKNOWLEDGEMENTS
The author would like to thank Nutrition International for funding the baseline survey of The ‘Better Investment for Stunting Alleviation’ program.
REFERENCES
1. Ministry of Health. Report of Basic Health Research 2013. Jakarta: National Institute for Health Research and Development; 2013.
2. Ministry of Health. Report of Basic Health Research 2018. Jakarta: National Institute for Health Research and Development; 2018.
3. Nead KG, Halterman JS, Kaczorowski JM, Auinger P, Weitzman M. Overweight Children and Adolescents: A Risk Group for Iron Deficiency. Pediatrics. 2004;114:104-108.
4. World Health Organization. Iron deficiency anaemia: assessment, prevention and control. Geneva: WHO; 2001.
5. D’Angelo G. Role of hepcidin in the pathophysiology and diagnosis of anemia. Blood Res. 2013;48:10-5.
CONCLUSION
In conclusion, our study indicates that there was no
Table I: Prevalence of anaemia by BAZ and waist circumference (%)
Variables Anaemia(n = 1077)
Without anaemia
(n = 1107 )
p
BAZ categories
Thinness 3.7 3.8 0.244a
Normal 83.6 80.5
Overweight 9.5 11.5
Obese 3.2 4.2
Waist circumference
>80 cm 9.0 10.1 0.418a
≤80 cm 91.0 89.9
Age (years)
Median (min, max) 17.0 (15,19) 17.0 (15,19) 0.007b
aChi-square test. bMann-Whitney test.
Table II: Correlation test all variables with Hb concentration
Variables Mean ± SD r p
Age (years) 17.0 ± 0.9 0.084 0.000
Weight (kg) 49.6 ± 9.2 0.016 0.456
Height (cm) 153.2 ± 5.8 -0.040 0.060
Waist circumference (cm) 70.3 ± 7.7 0.054 0.012
BAZ -1.14 ± 1.12 0.026 0.221
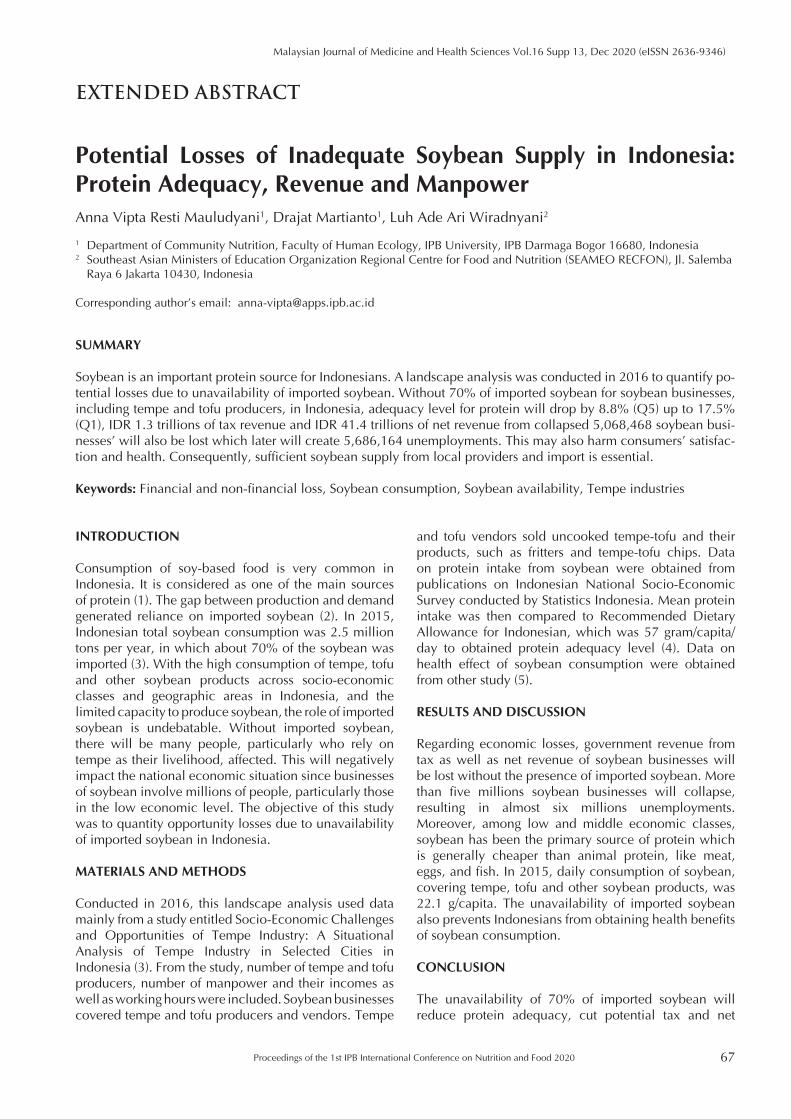
Proceedings of the 1st IPB International Conference on Nutrition and Food 2020 67
Malaysian Journal of Medicine and Health Sciences Vol.16 Supp 13, Dec 2020 (eISSN 2636-9346)
EXTENDED ABSTRACT
Potential Losses of Inadequate Soybean Supply in Indonesia: Protein Adequacy, Revenue and Manpower Anna Vipta Resti Mauludyani1, Drajat Martianto1, Luh Ade Ari Wiradnyani2
1 Department of Community Nutrition, Faculty of Human Ecology, IPB University, IPB Darmaga Bogor 16680, Indonesia2 Southeast Asian Ministers of Education Organization Regional Centre for Food and Nutrition (SEAMEO RECFON), Jl. Salemba
Raya 6 Jakarta 10430, Indonesia
Corresponding author’s email: [email protected]
SUMMARY
Soybean is an important protein source for Indonesians. A landscape analysis was conducted in 2016 to quantify po-tential losses due to unavailability of imported soybean. Without 70% of imported soybean for soybean businesses, including tempe and tofu producers, in Indonesia, adequacy level for protein will drop by 8.8% (Q5) up to 17.5% (Q1), IDR 1.3 trillions of tax revenue and IDR 41.4 trillions of net revenue from collapsed 5,068,468 soybean busi-nesses’ will also be lost which later will create 5,686,164 unemployments. This may also harm consumers’ satisfac-tion and health. Consequently, sufficient soybean supply from local providers and import is essential.
Keywords: Financial and non-financial loss, Soybean consumption, Soybean availability, Tempe industries
INTRODUCTION
Consumption of soy-based food is very common in Indonesia. It is considered as one of the main sources of protein (1). The gap between production and demand generated reliance on imported soybean (2). In 2015, Indonesian total soybean consumption was 2.5 million tons per year, in which about 70% of the soybean was imported (3). With the high consumption of tempe, tofu and other soybean products across socio-economic classes and geographic areas in Indonesia, and the limited capacity to produce soybean, the role of imported soybean is undebatable. Without imported soybean, there will be many people, particularly who rely on tempe as their livelihood, affected. This will negatively impact the national economic situation since businesses of soybean involve millions of people, particularly those in the low economic level. The objective of this study was to quantity opportunity losses due to unavailability of imported soybean in Indonesia.
MATERIALS AND METHODS
Conducted in 2016, this landscape analysis used data mainly from a study entitled Socio-Economic Challenges and Opportunities of Tempe Industry: A Situational Analysis of Tempe Industry in Selected Cities in Indonesia (3). From the study, number of tempe and tofu producers, number of manpower and their incomes as well as working hours were included. Soybean businesses covered tempe and tofu producers and vendors. Tempe
and tofu vendors sold uncooked tempe-tofu and their products, such as fritters and tempe-tofu chips. Data on protein intake from soybean were obtained from publications on Indonesian National Socio-Economic Survey conducted by Statistics Indonesia. Mean protein intake was then compared to Recommended Dietary Allowance for Indonesian, which was 57 gram/capita/day to obtained protein adequacy level (4). Data on health effect of soybean consumption were obtained from other study (5).
RESULTS AND DISCUSSION
Regarding economic losses, government revenue from tax as well as net revenue of soybean businesses will be lost without the presence of imported soybean. More than five millions soybean businesses will collapse, resulting in almost six millions unemployments. Moreover, among low and middle economic classes, soybean has been the primary source of protein which is generally cheaper than animal protein, like meat, eggs, and fish. In 2015, daily consumption of soybean, covering tempe, tofu and other soybean products, was 22.1 g/capita. The unavailability of imported soybean also prevents Indonesians from obtaining health benefits of soybean consumption.
CONCLUSION
The unavailability of 70% of imported soybean will reduce protein adequacy, cut potential tax and net
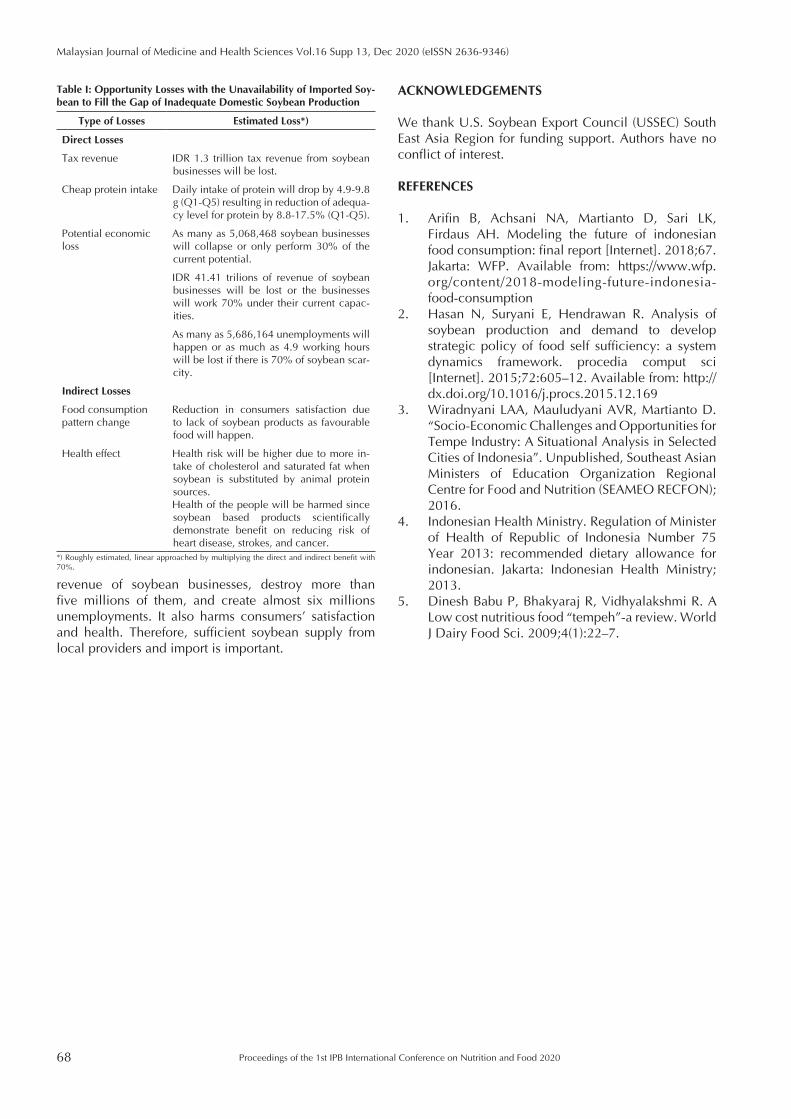
68
Malaysian Journal of Medicine and Health Sciences Vol.16 Supp 13, Dec 2020 (eISSN 2636-9346)
Proceedings of the 1st IPB International Conference on Nutrition and Food 2020
ACKNOWLEDGEMENTS
We thank U.S. Soybean Export Council (USSEC) South East Asia Region for funding support. Authors have no conflict of interest.
REFERENCES
1. Arifin B, Achsani NA, Martianto D, Sari LK, Firdaus AH. Modeling the future of indonesian food consumption: final report [Internet]. 2018;67. Jakarta: WFP. Available from: https://www.wfp.org/content/2018-modeling-future-indonesia-food-consumption
2. Hasan N, Suryani E, Hendrawan R. Analysis of soybean production and demand to develop strategic policy of food self sufficiency: a system dynamics framework. procedia comput sci [Internet]. 2015;72:605–12. Available from: http://dx.doi.org/10.1016/j.procs.2015.12.169
3. Wiradnyani LAA, Mauludyani AVR, Martianto D. “Socio-Economic Challenges and Opportunities for Tempe Industry: A Situational Analysis in Selected Cities of Indonesia”. Unpublished, Southeast Asian Ministers of Education Organization Regional Centre for Food and Nutrition (SEAMEO RECFON); 2016.
4. Indonesian Health Ministry. Regulation of Minister of Health of Republic of Indonesia Number 75 Year 2013: recommended dietary allowance for indonesian. Jakarta: Indonesian Health Ministry; 2013.
5. Dinesh Babu P, Bhakyaraj R, Vidhyalakshmi R. A Low cost nutritious food “tempeh”-a review. World J Dairy Food Sci. 2009;4(1):22–7.
revenue of soybean businesses, destroy more than five millions of them, and create almost six millions unemployments. It also harms consumers’ satisfaction and health. Therefore, sufficient soybean supply from local providers and import is important.
Table I: Opportunity Losses with the Unavailability of Imported Soy-bean to Fill the Gap of Inadequate Domestic Soybean Production
Type of Losses Estimated Loss*)
Direct Losses
Tax revenue IDR 1.3 trillion tax revenue from soybean businesses will be lost.
Cheap protein intake Daily intake of protein will drop by 4.9-9.8 g (Q1-Q5) resulting in reduction of adequa-cy level for protein by 8.8-17.5% (Q1-Q5).
Potential economic loss
As many as 5,068,468 soybean businesses will collapse or only perform 30% of the current potential.
IDR 41.41 trilions of revenue of soybean businesses will be lost or the businesses will work 70% under their current capac-ities.
As many as 5,686,164 unemployments will happen or as much as 4.9 working hours will be lost if there is 70% of soybean scar-city.
Indirect Losses
Food consumption pattern change
Reduction in consumers satisfaction due to lack of soybean products as favourable food will happen.
Health effect Health risk will be higher due to more in-take of cholesterol and saturated fat when soybean is substituted by animal protein sources.Health of the people will be harmed since soybean based products scientifically demonstrate benefit on reducing risk of heart disease, strokes, and cancer.
*) Roughly estimated, linear approached by multiplying the direct and indirect benefit with 70%.
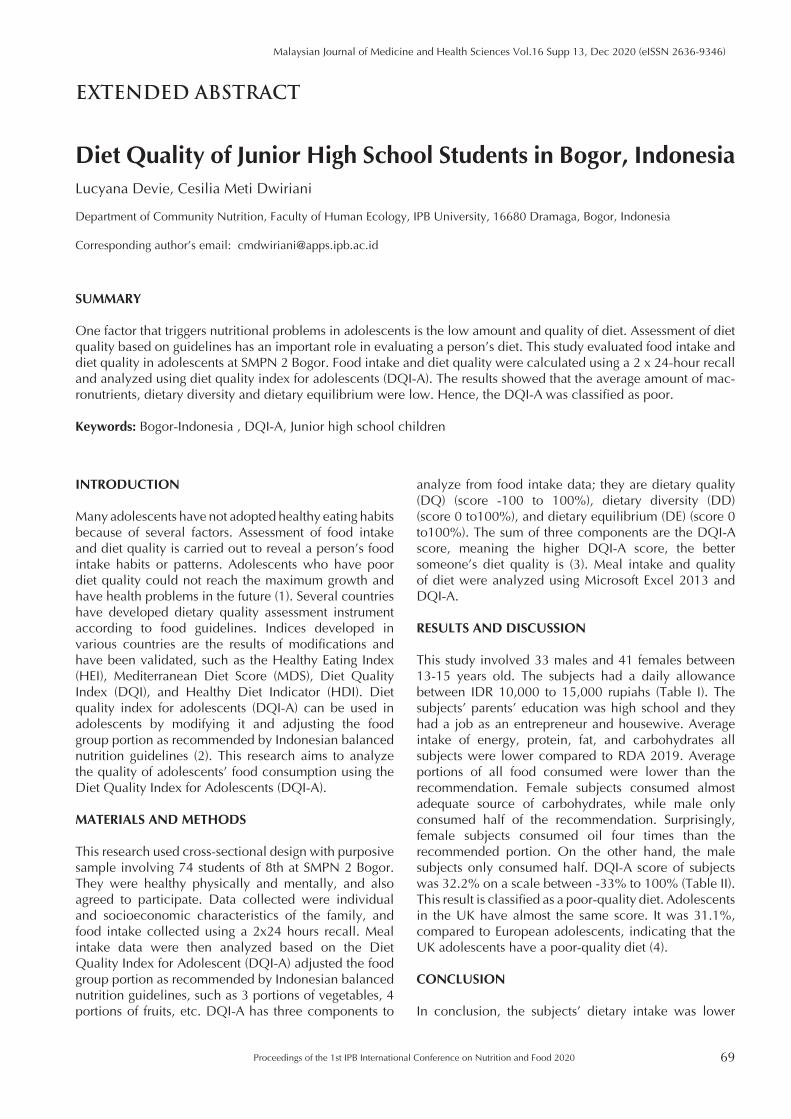
Proceedings of the 1st IPB International Conference on Nutrition and Food 2020 69
Malaysian Journal of Medicine and Health Sciences Vol.16 Supp 13, Dec 2020 (eISSN 2636-9346)
EXTENDED ABSTRACT
Diet Quality of Junior High School Students in Bogor, Indonesia Lucyana Devie, Cesilia Meti Dwiriani
Department of Community Nutrition, Faculty of Human Ecology, IPB University, 16680 Dramaga, Bogor, Indonesia
Corresponding author’s email: [email protected]
SUMMARY
One factor that triggers nutritional problems in adolescents is the low amount and quality of diet. Assessment of diet quality based on guidelines has an important role in evaluating a person’s diet. This study evaluated food intake and diet quality in adolescents at SMPN 2 Bogor. Food intake and diet quality were calculated using a 2 x 24-hour recall and analyzed using diet quality index for adolescents (DQI-A). The results showed that the average amount of mac-ronutrients, dietary diversity and dietary equilibrium were low. Hence, the DQI-A was classified as poor.
Keywords: Bogor-Indonesia , DQI-A, Junior high school children
INTRODUCTION
Many adolescents have not adopted healthy eating habits because of several factors. Assessment of food intake and diet quality is carried out to reveal a person’s food intake habits or patterns. Adolescents who have poor diet quality could not reach the maximum growth and have health problems in the future (1). Several countries have developed dietary quality assessment instrument according to food guidelines. Indices developed in various countries are the results of modifications and have been validated, such as the Healthy Eating Index (HEI), Mediterranean Diet Score (MDS), Diet Quality Index (DQI), and Healthy Diet Indicator (HDI). Diet quality index for adolescents (DQI-A) can be used in adolescents by modifying it and adjusting the food group portion as recommended by Indonesian balanced nutrition guidelines (2). This research aims to analyze the quality of adolescents’ food consumption using the Diet Quality Index for Adolescents (DQI-A).
MATERIALS AND METHODS
This research used cross-sectional design with purposive sample involving 74 students of 8th at SMPN 2 Bogor. They were healthy physically and mentally, and also agreed to participate. Data collected were individual and socioeconomic characteristics of the family, and food intake collected using a 2x24 hours recall. Meal intake data were then analyzed based on the Diet Quality Index for Adolescent (DQI-A) adjusted the food group portion as recommended by Indonesian balanced nutrition guidelines, such as 3 portions of vegetables, 4 portions of fruits, etc. DQI-A has three components to
analyze from food intake data; they are dietary quality (DQ) (score -100 to 100%), dietary diversity (DD) (score 0 to100%), and dietary equilibrium (DE) (score 0 to100%). The sum of three components are the DQI-A score, meaning the higher DQI-A score, the better someone’s diet quality is (3). Meal intake and quality of diet were analyzed using Microsoft Excel 2013 and DQI-A.
RESULTS AND DISCUSSION
This study involved 33 males and 41 females between 13-15 years old. The subjects had a daily allowance between IDR 10,000 to 15,000 rupiahs (Table I). The subjects’ parents’ education was high school and they had a job as an entrepreneur and housewive. Average intake of energy, protein, fat, and carbohydrates all subjects were lower compared to RDA 2019. Average portions of all food consumed were lower than the recommendation. Female subjects consumed almost adequate source of carbohydrates, while male only consumed half of the recommendation. Surprisingly, female subjects consumed oil four times than the recommended portion. On the other hand, the male subjects only consumed half. DQI-A score of subjects was 32.2% on a scale between -33% to 100% (Table II). This result is classified as a poor-quality diet. Adolescents in the UK have almost the same score. It was 31.1%, compared to European adolescents, indicating that the UK adolescents have a poor-quality diet (4).
CONCLUSION
In conclusion, the subjects’ dietary intake was lower
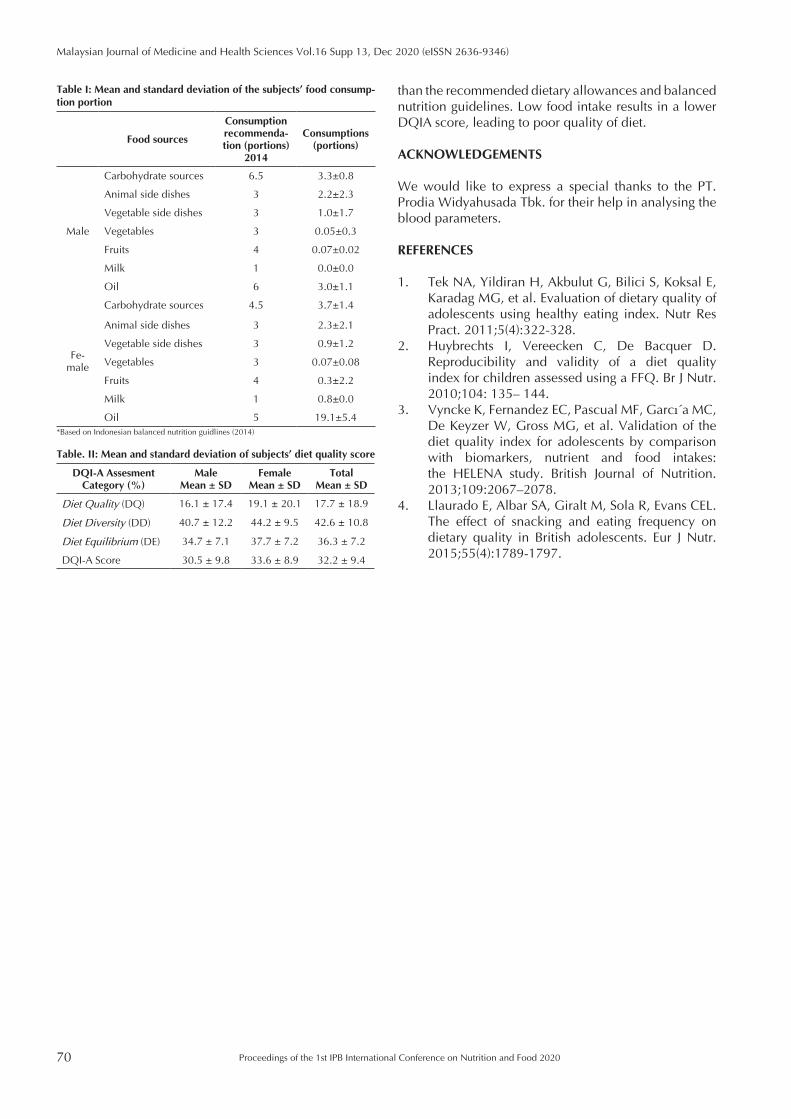
70
Malaysian Journal of Medicine and Health Sciences Vol.16 Supp 13, Dec 2020 (eISSN 2636-9346)
Proceedings of the 1st IPB International Conference on Nutrition and Food 2020
than the recommended dietary allowances and balanced nutrition guidelines. Low food intake results in a lower DQIA score, leading to poor quality of diet.
ACKNOWLEDGEMENTS
We would like to express a special thanks to the PT. Prodia Widyahusada Tbk. for their help in analysing the blood parameters.
REFERENCES
1. Tek NA, Yildiran H, Akbulut G, Bilici S, Koksal E, Karadag MG, et al. Evaluation of dietary quality of adolescents using healthy eating index. Nutr Res Pract. 2011;5(4):322-328.
2. Huybrechts I, Vereecken C, De Bacquer D. Reproducibility and validity of a diet quality index for children assessed using a FFQ. Br J Nutr. 2010;104: 135– 144.
3. Vyncke K, Fernandez EC, Pascual MF, Garcı´a MC, De Keyzer W, Gross MG, et al. Validation of the diet quality index for adolescents by comparison with biomarkers, nutrient and food intakes: the HELENA study. British Journal of Nutrition. 2013;109:2067–2078.
4. Llaurado E, Albar SA, Giralt M, Sola R, Evans CEL. The effect of snacking and eating frequency on dietary quality in British adolescents. Eur J Nutr. 2015;55(4):1789-1797.
Table I: Mean and standard deviation of the subjects’ food consump-tion portion
Food sources
Consumption recommenda-tion (portions)
2014
Consumptions (portions)
Male
Carbohydrate sources 6.5 3.3±0.8
Animal side dishes 3 2.2±2.3
Vegetable side dishes 3 1.0±1.7
Vegetables 3 0.05±0.3
Fruits 4 0.07±0.02
Milk 1 0.0±0.0
Oil 6 3.0±1.1
Fe-male
Carbohydrate sources 4.5 3.7±1.4
Animal side dishes 3 2.3±2.1
Vegetable side dishes 3 0.9±1.2
Vegetables 3 0.07±0.08
Fruits 4 0.3±2.2
Milk 1 0.8±0.0
Oil 5 19.1±5.4*Based on Indonesian balanced nutrition guidlines (2014)
Table. II: Mean and standard deviation of subjects’ diet quality score
DQI-A Assesment Category (%)
MaleMean ± SD
FemaleMean ± SD
TotalMean ± SD
Diet Quality (DQ) 16.1 ± 17.4 19.1 ± 20.1 17.7 ± 18.9
Diet Diversity (DD) 40.7 ± 12.2 44.2 ± 9.5 42.6 ± 10.8
Diet Equilibrium (DE) 34.7 ± 7.1 37.7 ± 7.2 36.3 ± 7.2
DQI-A Score 30.5 ± 9.8 33.6 ± 8.9 32.2 ± 9.4
Proceedings of the 1st IPB International Conference on Nutrition and Food 2020 71
Malaysian Journal of Medicine and Health Sciences Vol.16 Supp 13, Dec 2020 (eISSN 2636-9346)
EXTENDED ABSTRACT
Identification of Balanced Nutrition in Indonesia Elementary School Curriculum Nur Intania Sofianita1,3, Ali Khomsan2, Budi Setiawan2, Ikeu Ekayanti2
1 Postgraduate Program in Nutrition Science, Department of Community Nutrition, Faculty of Human Ecology, IPB University, Bogor 16680
2 Department of Community Nutrition, Faculty of Human Ecology, IPB University, Bogor 166803 Department of Nutrition, Faculty of Health Science, Pembangunan Nasional Veteran Jakarta University, Jakarta 12450
Corresponding author’s email: [email protected]
SUMMARY
Poor nutrition and dietary habit are common among elementary school students in Indonesia. One way to improve the condition is through nutrition education at school. This study aimed to examine nutrition topics in the elementary school curriculum by conducting content analysis using the Balanced Nutrition Guidelines as predetermined codes. The results of the study indicate that many competencies are dominated by physical activity and clean and healthy living habits. So, it is necessary to include other balanced nutrition messages in the subjects learned by the school children.
Keywords: Balanced nutrition, Competency, Curriculum, Elementary school
INTRODUCTION
Malnutrition can be caused by poor eating habit. In general, children tend to choose foods that look attractive, tasty, sweet and savoury but unhealthy. A study in Cianjur found low food and vegetable consumption among elementary school children, based on the recommended amount of 400 grams per day. (1) Schools play an important role in the education and promotion of healthy eating habit among children (2). However, information about nutrition is not adequately provided by the schools (3), resulting in a lack of knowledge and changes in healthier food consumption in children. The obstacles include lack of time, teacher working conditions, low understanding and awareness of nutritional education in the curriculum and school community (4). In Indonesia, studies exploring the school curriculum on nutrition are still limited; therefore, this study aimed to examine nutrition topics in the elementary school curriculum documents by conducting content analysis.
MATERIALS AND METHODS
We collected curriculum documents from the Regulation of Minister of Education and Culture of Republic of Indonesia Number 37 Year 2018. The documents were screened and grouped into: balanced nutrition pictures and slogans, four pillars of balanced nutrition and ten messages on balanced nutrition, which include: (1) consumption of a variety of staple foods, (2) limiting the
consumption of sweet, salty and fatty food, (3) doing enough physical activity and maintaining a healthy body weight (4) consumption of side dishes containing high protein, (5) washing hands under running water with soap, (6) having breakfast, (7) drinking enough water and safe, (8) eating lots of fruits and vegetables, (9) reading labels on food packaging, (10) being grateful and enjoying a variety of foods. Further, selected contents were coded based on balance nutrition predetermined codes and counted to represent their proportion within the overall content. Data processing was done using Microsoft Excel.
RESULTS AND DISCUSSION
There are 468 basic competencies in the curriculum. The results of the analysis showed that the competence of physical activity and healthy living behaviors are most mentioned in sports, religion, arts and culture subjects. Furthermore, the consumption of a wide range of staple foods, vegetables, fruits, proteins and limitation of sweet, salty and fatty foods was not mentioned, but the importance of understanding and choosing nutritious foods and healthy snacks to maintain the healthy body found in sports subjects was mentioned in basic competencies. The balanced nutrition message regarding hand washing is not specifically mentioned but it is represented by competence which emphasizes the behavior of clean bodies, clothes, items and places in religious subjects. The unwritten and unmentionable message of balanced
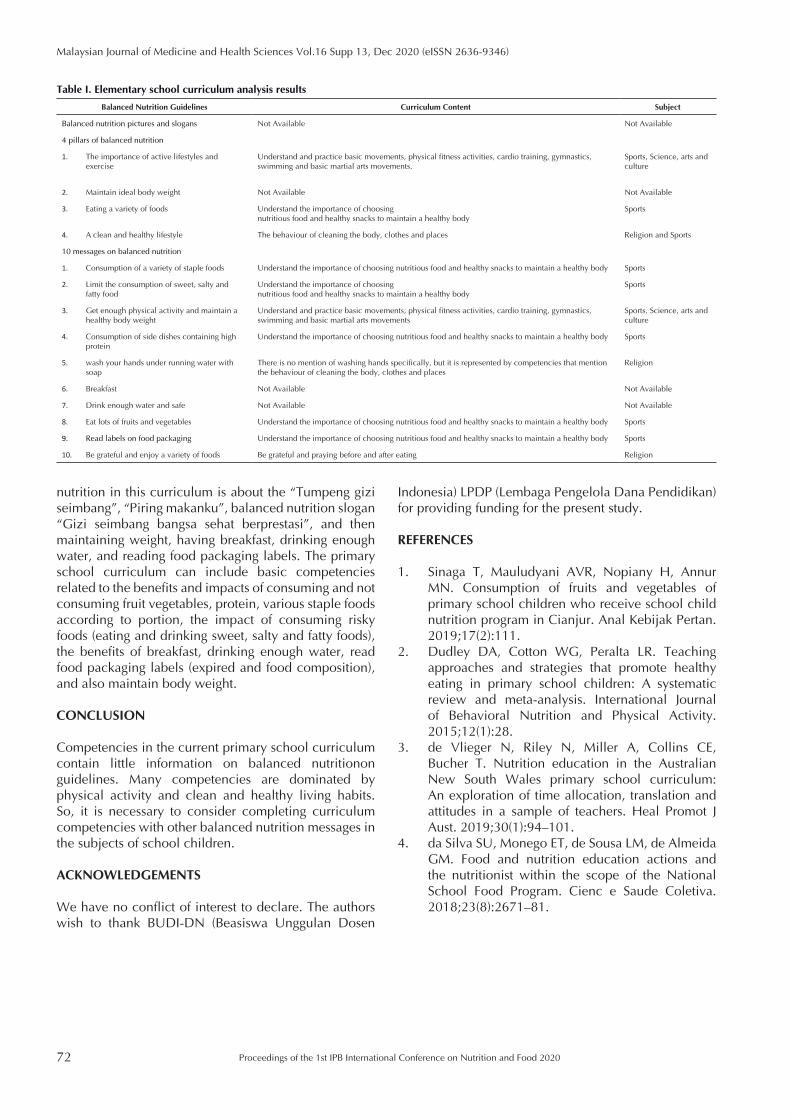
72
Malaysian Journal of Medicine and Health Sciences Vol.16 Supp 13, Dec 2020 (eISSN 2636-9346)
Proceedings of the 1st IPB International Conference on Nutrition and Food 2020
nutrition in this curriculum is about the “Tumpeng gizi seimbang”, “Piring makanku”, balanced nutrition slogan “Gizi seimbang bangsa sehat berprestasi”, and then maintaining weight, having breakfast, drinking enough water, and reading food packaging labels. The primary school curriculum can include basic competencies related to the benefits and impacts of consuming and not consuming fruit vegetables, protein, various staple foods according to portion, the impact of consuming risky foods (eating and drinking sweet, salty and fatty foods), the benefits of breakfast, drinking enough water, read food packaging labels (expired and food composition), and also maintain body weight.
CONCLUSION
Competencies in the current primary school curriculum contain little information on balanced nutritionon guidelines. Many competencies are dominated by physical activity and clean and healthy living habits. So, it is necessary to consider completing curriculum competencies with other balanced nutrition messages in the subjects of school children.
ACKNOWLEDGEMENTS
We have no conflict of interest to declare. The authors wish to thank BUDI-DN (Beasiswa Unggulan Dosen
Table I. Elementary school curriculum analysis results
Balanced Nutrition Guidelines Curriculum Content Subject
Balanced nutrition pictures and slogans Not Available Not Available
4 pillars of balanced nutrition
1. The importance of active lifestyles and exercise
Understand and practice basic movements, physical fitness activities, cardio training, gymnastics, swimming and basic martial arts movements.
Sports, Science, arts and culture
2. Maintain ideal body weight Not Available Not Available
3. Eating a variety of foods Understand the importance of choosingnutritious food and healthy snacks to maintain a healthy body
Sports
4. A clean and healthy lifestyle The behaviour of cleaning the body, clothes and places Religion and Sports
10 messages on balanced nutrition
1. Consumption of a variety of staple foods Understand the importance of choosing nutritious food and healthy snacks to maintain a healthy body Sports
2. Limit the consumption of sweet, salty and fatty food
Understand the importance of choosingnutritious food and healthy snacks to maintain a healthy body
Sports
3. Get enough physical activity and maintain a healthy body weight
Understand and practice basic movements, physical fitness activities, cardio training, gymnastics, swimming and basic martial arts movements
Sports, Science, arts and culture
4. Consumption of side dishes containing high protein
Understand the importance of choosing nutritious food and healthy snacks to maintain a healthy body Sports
5. wash your hands under running water with soap
There is no mention of washing hands specifically, but it is represented by competencies that mention the behaviour of cleaning the body, clothes and places
Religion
6. Breakfast Not Available Not Available
7. Drink enough water and safe Not Available Not Available
8. Eat lots of fruits and vegetables Understand the importance of choosing nutritious food and healthy snacks to maintain a healthy body Sports
9. Read labels on food packaging Understand the importance of choosing nutritious food and healthy snacks to maintain a healthy body Sports
10. Be grateful and enjoy a variety of foods Be grateful and praying before and after eating Religion
Indonesia) LPDP (Lembaga Pengelola Dana Pendidikan) for providing funding for the present study.
REFERENCES
1. Sinaga T, Mauludyani AVR, Nopiany H, Annur MN. Consumption of fruits and vegetables of primary school children who receive school child nutrition program in Cianjur. Anal Kebijak Pertan. 2019;17(2):111.
2. Dudley DA, Cotton WG, Peralta LR. Teaching approaches and strategies that promote healthy eating in primary school children: A systematic review and meta-analysis. International Journal of Behavioral Nutrition and Physical Activity. 2015;12(1):28.
3. de Vlieger N, Riley N, Miller A, Collins CE, Bucher T. Nutrition education in the Australian New South Wales primary school curriculum: An exploration of time allocation, translation and attitudes in a sample of teachers. Heal Promot J Aust. 2019;30(1):94–101.
4. da Silva SU, Monego ET, de Sousa LM, de Almeida GM. Food and nutrition education actions and the nutritionist within the scope of the National School Food Program. Cienc e Saude Coletiva. 2018;23(8):2671–81.
Proceedings of the 1st IPB International Conference on Nutrition and Food 2020 73
Malaysian Journal of Medicine and Health Sciences Vol.16 Supp 13, Dec 2020 (eISSN 2636-9346)
EXTENDED ABSTRACT
Anemia, Stunting, and Wasting in School-age Children: A Crosssectional Study in Pidie District, Aceh Indonesia Aripin Ahmad1, Ridwandi2, Mutiawati2, Syahbuddin3
1 Department of Nutrition, Health Polytechnic, Aceh Health Ministry, Indonesia2 District Education officer of Pidie District, Aceh, Indonesia3 Departement of Nursing, Jabal Ghafur University, Indonesia
Corresponding author’s email: [email protected]
SUMMARY
Malnutrition in school-age children can impair their growth and academic achievement. This study aimed to ana-lyze anemia and nutritional status in school children in Pidie District, Aceh. This cross-sectional study involved 607 children. Anemia is defined as having blood hemoglobin (Hb) levels <12 g/dL. Wasting and stunting are defined as having body mass index z-score (BAZ) and having height for age index z-score (HAZ) less than -2 SD, resfectively. This research showed that 41.7% children were stunted, 10.4% were wasted, and 81.6% had anemia. There were a positive relationship between children’s age, and the grade of students with stunting, the prevalence of stunting highest in ≥8 years old chidren and in grade 4 and 5 respectively. Malnutrition prevalence in the study area was very high. Therefore, nutrition programs are needed to improve the condition.
Keywords: Anemia, Malnutrition, Nutritional status, Schoolchildren
INTRODUCTION
Children aged 6-12 years are in the second phase of rapid growth after the first two years of birth. Nutritional deficiencies that occur in this phase can lead to not achieving catch-up growth. Malnutrition among school-age children is also caused by multi factors, including individual factors, nutrient intake, eating behavior, environment, and family socio-demographics. The high level of malnutrition in children will affect their growth as well as concentration and learning achievement (1), contribute to schooling outcome, developmental delays, school achievement, and behavioral abnormalities (2). Until now, studies examining the magnitude of malnutrition among school-age children are still limited, while Aceh is a province with very high stunting, wasting and anemia among underfive children. This study aimed to analyze anemia and nutritional status in elementary school children in Pidie district, Aceh.
MATERIALS AND METHODS
The cross-sectional study involved 607 elementary schoolchildren recruited using stratfied random sampling method in Pidie District Aceh Indonesia. Data on body weight and height were collected by anthropometric methods and hemoglobin levels were collected using electrochemical biosensor method. Wasting was analyzed using the body mass index z-score (BAZ) and stunting was determined using the height for age index z-score (HAZ), and determined using z-score
<-2 standard deviation, while the risk status for anemia was determined based on the cut off Hb <11.5 g/dL. Data analysis was performed; univariate and bivariate analyses were carried out to analyze the proportions of wasting, stunting, and anemia based on age, grade, and sex. To determine the relationship between socio-demographic and characteristic of the subject with stunting, anemia and wasting, chi-square test at the 95% confident interval (α=0.05) was used.
RESULTS AND DISCUSSION
Research results showed that half of the samples were male (51.4%), and almost half of the sample (45.6%) were 10 years old with the mean age of 9.78±1.31 years. In terms of class, the children were almost evenly distributed in class 3 to grade 6 (22.4% to 26.0%) except for class 2 only a small portion (2.1%). The results of the study (Table I) showed that 41.7% of schoolchildren stunted, namely 9.9% severe stunted and 31.6% stunted. Meanwhile, the prevalence of wasting was 12.4%. Furthermore, the mean of hemoglobin (Hb) level of school children was 10.40±1.25 mg/dL and 81.6% of the samples were at risk of suffering from anemia (Hb <11.5 mg/dL).
The results (Table II) showed that there were differences in the proportion of stunting by age (p=0.019), and there was a significant difference in the proportion of stunting by class (p=0.008). The highest prevalence of stunting is in ≥8 years age and grade 4 and 5 children. Furthermore,
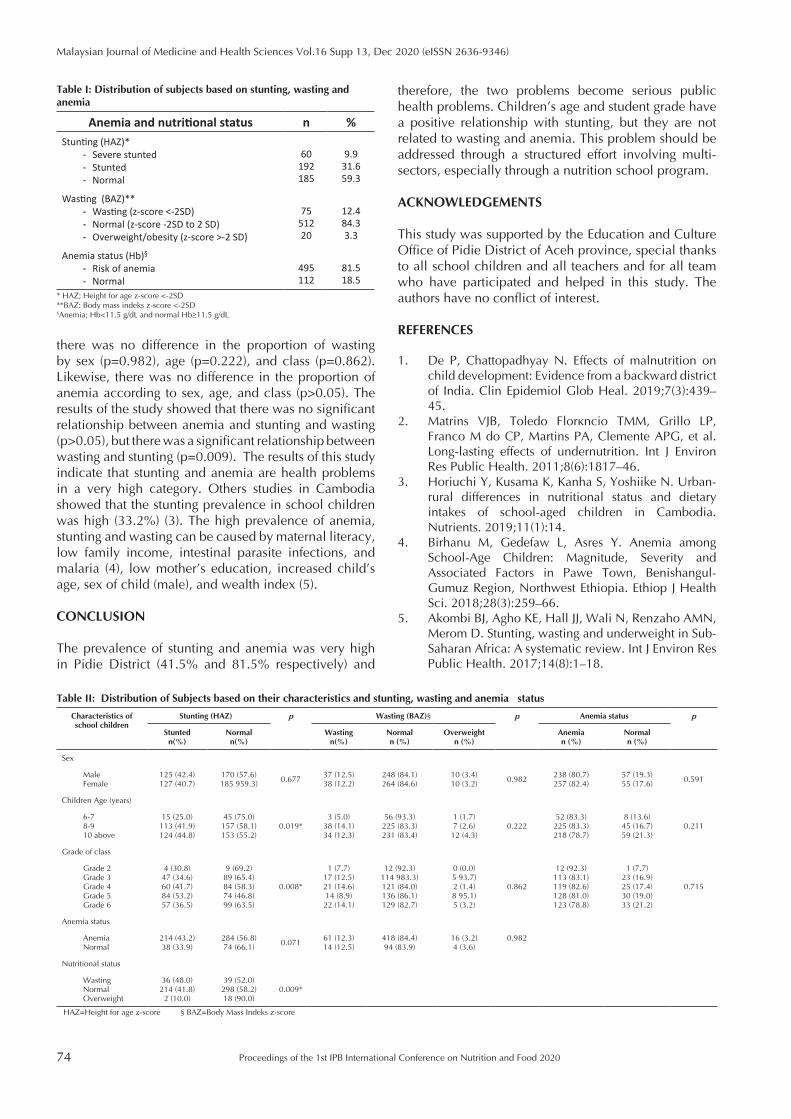
74
Malaysian Journal of Medicine and Health Sciences Vol.16 Supp 13, Dec 2020 (eISSN 2636-9346)
Proceedings of the 1st IPB International Conference on Nutrition and Food 2020
there was no difference in the proportion of wasting by sex (p=0.982), age (p=0.222), and class (p=0.862). Likewise, there was no difference in the proportion of anemia according to sex, age, and class (p>0.05). The results of the study showed that there was no significant relationship between anemia and stunting and wasting (p>0.05), but there was a significant relationship between wasting and stunting (p=0.009). The results of this study indicate that stunting and anemia are health problems in a very high category. Others studies in Cambodia showed that the stunting prevalence in school children was high (33.2%) (3). The high prevalence of anemia, stunting and wasting can be caused by maternal literacy, low family income, intestinal parasite infections, and malaria (4), low mother’s education, increased child’s age, sex of child (male), and wealth index (5).
CONCLUSION
The prevalence of stunting and anemia was very high in Pidie District (41.5% and 81.5% respectively) and
therefore, the two problems become serious public health problems. Children’s age and student grade have a positive relationship with stunting, but they are not related to wasting and anemia. This problem should be addressed through a structured effort involving multi-sectors, especially through a nutrition school program.
ACKNOWLEDGEMENTS
This study was supported by the Education and Culture Office of Pidie District of Aceh province, special thanks to all school children and all teachers and for all team who have participated and helped in this study. The authors have no conflict of interest.
REFERENCES
1. De P, Chattopadhyay N. Effects of malnutrition on child development: Evidence from a backward district of India. Clin Epidemiol Glob Heal. 2019;7(3):439–45.
2. Matrins VJB, Toledo Florêncio TMM, Grillo LP, Franco M do CP, Martins PA, Clemente APG, et al. Long-lasting effects of undernutrition. Int J Environ Res Public Health. 2011;8(6):1817–46.
3. Horiuchi Y, Kusama K, Kanha S, Yoshiike N. Urban-rural differences in nutritional status and dietary intakes of school-aged children in Cambodia. Nutrients. 2019;11(1):14.
4. Birhanu M, Gedefaw L, Asres Y. Anemia among School-Age Children: Magnitude, Severity and Associated Factors in Pawe Town, Benishangul-Gumuz Region, Northwest Ethiopia. Ethiop J Health Sci. 2018;28(3):259–66.
5. Akombi BJ, Agho KE, Hall JJ, Wali N, Renzaho AMN, Merom D. Stunting, wasting and underweight in Sub-Saharan Africa: A systematic review. Int J Environ Res Public Health. 2017;14(8):1–18.
Table I: Distribution of subjects based on stunting, wasting and anemia
Anemia and nutritional status n %Stunting (HAZ)*
- Severe stunted- Stunted- Normal
60192185
9.931.659.3
Wasting (BAZ)**- Wasting (z-score <-2SD)- Normal (z-score -2SD to 2 SD) - Overweight/obesity (z-score >-2 SD)
7551220
12.484.33.3
Anemia status (Hb)§
- Risk of anemia - Normal
495112
81.518.5
* HAZ; Height for age z-score <-2SD**BAZ: Body mass indeks z-score <-2SD§Anemia; Hb<11.5 g/dL and normal Hb≥11.5 g/dL
Table II: Distribution of Subjects based on their characteristics and stunting, wasting and anemia status
Characteristics of school children
Stunting (HAZ) £ p Wasting (BAZ)§ p Anemia status p
Stuntedn(%)
Normaln(%)
Wastingn(%)
Normaln (%)
Overweightn (%)
Anemian (%)
Normaln (%)
Sex
MaleFemale
125 (42.4)127 (40.7)
170 (57.6)185 959.3)
0.67737 (12.5)38 (12.2)
248 (84.1)264 (84.6)
10 (3.4)10 (3.2)
0.982238 (80.7)257 (82.4)
57 (19.3)55 (17.6)
0.591
Children Age (years)
6-7 8-9 10 above
15 (25.0)113 (41.9)124 (44.8)
45 (75.0)157 (58.1)153 (55.2)
0.019*3 (5.0)
38 (14.1)34 (12.3)
56 (93.3)225 (83.3)231 (83.4)
1 (1.7)7 (2.6)12 (4.3)
0.22252 (83.3)225 (83.3)218 (78.7)
8 (13.6)45 (16.7)59 (21.3)
0.211
Grade of class
Grade 2Grade 3 Grade 4Grade 5Grade 6
4 (30.8)47 (34.6)60 (41.7)84 (53.2)57 (36.5)
9 (69.2)89 (65.4)84 (58.3)74 (46.8)99 (63.5)
0.008*
1 (7.7)17 (12.5)21 (14.6)14 (8.9)22 (14.1)
12 (92.3)114 983.3)121 (84.0)136 (86.1)129 (82.7)
0 (0.0)5 93.7)2 (1.4)8 95.1)5 (3.2)
0.862
12 (92.3)113 (83.1)119 (82.6)128 (81.0)123 (78.8)
1 (7.7)23 (16.9)25 (17.4)30 (19.0)33 (21.2)
0.715
Anemia status
Anemia Normal
214 (43.2)38 (33.9)
284 (56.8)74 (66.1)
0.07161 (12.3)14 (12.5)
418 (84.4)94 (83.9)
16 (3.2)4 (3.6)
0.982
Nutritional status
WastingNormal Overweight
36 (48.0)214 (41.8)2 (10.0)
39 (52.0)298 (58.2)18 (90.0)
0.009*
£ HAZ=Height for age z-score § BAZ=Body Mass Indeks z-score
Proceedings of the 1st IPB International Conference on Nutrition and Food 2020 75
Malaysian Journal of Medicine and Health Sciences Vol.16 Supp 13, Dec 2020 (eISSN 2636-9346)
EXTENDED ABSTRACT
Nutrition Training Courses of Post-Disaster Recovery at Sembalun Bumbung Village, West Nusa Tenggara Province Diyah Eka Andayani, Okky Lupita Sari, Nisrina Hanisa, Erfi Prafiantini, Wina Sinaga, Lily Indriani Octovia, Faisal Muda, Mega Diasty Rahayu
Department of Nutrition, Faculty of Medicine, Universitas Indonesia - Dr. Cipto Mangunkusumo General Hospital, Jakarta 10430, Indonesia
Corresponding author’s email: [email protected]
SUMMARY
Nutrition disaster training courses help participants gain new knowledge and skills in maintaining nutrition status for under-five children. The study evaluates cadres’ knowledge and skills after one-day training in Sembalun Bumbung Village. Twenty nine cadres participated in courses; each session lasted for 2 hours with material presentation, dis-cussion, and practice method. The data were collected using pre-test and post-test questionnaires for knowledge and evaluation sheets for skill in developing a food menu during a disaster based on local food availability. The results indicate that the courses are useful for empowering the participants in applying knowledge in the community.
Keywords: Child, Knowledge, Nutrition, Disasters, Education
INTRODUCTION
In early August 2018, an earthquake with 7.0 magnitude occurred in West Nusa Tenggara Province, which resulted in 17 fatalities, 365 injuries, 8.871 people displaced, and more than 14.000 houses damaged (1). Several disruptions of these situations are food production and the harvesting of farm produce, accessibility of food from the market, reduced household income, food distribution, food preparation practices, and food safety. This disruption increases vulnerability to food insecurity and malnutrition (2). Increased mortality and morbidity are most frequent in under-five children as a result of increased exposure to infections and inadequate feeding of infants and young children (3). In Sembalun Bumbung Village, about 129 and 19 children suffered from undernutrition and malnutrition. Nutrition programs in emergency contexts are needed to deal with those problems. It is necessary to provide information on post-disaster nutrition recovery to the community, especially cadres who have a key role in improving nutrition during an emergency.
MATERIALS AND METHODSA quasi-experimental, with one-group pretest-posttest design, was used in this study, using a non-probability sampling technique with voluntary sampling. The study was conducted in August 2019. The participants were 29 cadres from 8 hamlets in Sembalun Bumbung Village. The participants were randomly divided into three groups. They were requested to complete pretest and posttest questionnaires. The course session which
had been evaluated consists of 1) presentation about nutrition in disasters, nutrition in under-five children, and feeding practice in infant and young children; 2) focus group discussion (FGD) about nutritional problems that occured post-disaster; 3) FGD and practice of anthropometric measurements (body weight, body height or length, and upper arm circumference) for screening children at malnutrition risk; 4) FGD and practice of using the growth chart; 5) FGD and practice in preparing under-five children food menus according to age groups based on local food ingredients.
RESULTS AND DISCUSSION
They were cadres who were representatives of integrated healthcare centres in Batu Jalik, Daya Rurung Baret, Daya Rurung Timuk, Lauk Rurung Baret, Lauk Rurung Timuk, Bebante, Jorong Selatan, and Jorong Utara. Their characteristics are presented in Table I.
The participants were asked to fill the pre-test and post-test. They answered with true or false answers based on statements that represent each section of the topic: nutrition in disasters, nutrition in under-five children, and feeding practice in infants and young children. A total of 29 participants attended the nutrition training course and filled in the pre- and post-test completely. With a minimum score limit of 75, about 48.3% of the participants had a pre-test score above 75, whereas about 89.7% had a post-test score above 75 (Table II).
After conducting the explanation session of nutrition in
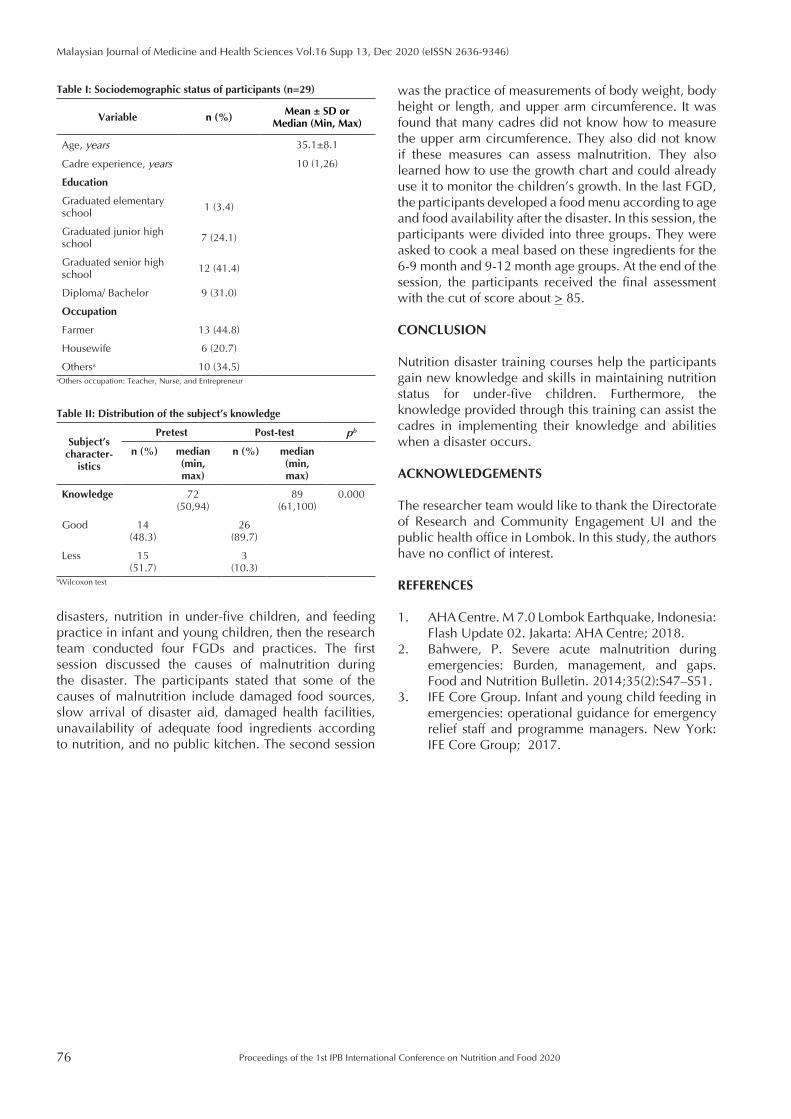
76
Malaysian Journal of Medicine and Health Sciences Vol.16 Supp 13, Dec 2020 (eISSN 2636-9346)
Proceedings of the 1st IPB International Conference on Nutrition and Food 2020
was the practice of measurements of body weight, body height or length, and upper arm circumference. It was found that many cadres did not know how to measure the upper arm circumference. They also did not know if these measures can assess malnutrition. They also learned how to use the growth chart and could already use it to monitor the children’s growth. In the last FGD, the participants developed a food menu according to age and food availability after the disaster. In this session, the participants were divided into three groups. They were asked to cook a meal based on these ingredients for the 6-9 month and 9-12 month age groups. At the end of the session, the participants received the final assessment with the cut of score about > 85.
CONCLUSION
Nutrition disaster training courses help the participants gain new knowledge and skills in maintaining nutrition status for under-five children. Furthermore, the knowledge provided through this training can assist the cadres in implementing their knowledge and abilities when a disaster occurs.
ACKNOWLEDGEMENTS
The researcher team would like to thank the Directorate of Research and Community Engagement UI and the public health office in Lombok. In this study, the authors have no conflict of interest. REFERENCES
1. AHA Centre. M 7.0 Lombok Earthquake, Indonesia: Flash Update 02. Jakarta: AHA Centre; 2018.
2. Bahwere, P. Severe acute malnutrition during emergencies: Burden, management, and gaps. Food and Nutrition Bulletin. 2014;35(2):S47–S51.
3. IFE Core Group. Infant and young child feeding in emergencies: operational guidance for emergency relief staff and programme managers. New York: IFE Core Group; 2017.
disasters, nutrition in under-five children, and feeding practice in infant and young children, then the research team conducted four FGDs and practices. The first session discussed the causes of malnutrition during the disaster. The participants stated that some of the causes of malnutrition include damaged food sources, slow arrival of disaster aid, damaged health facilities, unavailability of adequate food ingredients according to nutrition, and no public kitchen. The second session
Table II: Distribution of the subject’s knowledge
Subject’s character-
istics
Pretest Post-test pb
n (%) median (min, max)
n (%) median (min, max)
Knowledge 72 (50,94)
89 (61,100)
0.000
Good 14 (48.3)
26 (89.7)
Less 15 (51.7)
3 (10.3)
bWilcoxon test
Table I: Sociodemographic status of participants (n=29)
Variable n (%)Mean ± SD or
Median (Min, Max)
Age, years 35.1±8.1
Cadre experience, years 10 (1,26)
Education
Graduated elementary school
1 (3.4)
Graduated junior high school
7 (24.1)
Graduated senior high school
12 (41.4)
Diploma/ Bachelor 9 (31.0)
Occupation
Farmer 13 (44.8)
Housewife 6 (20.7)
Othersa 10 (34.5)aOthers occupation: Teacher, Nurse, and Entrepreneur
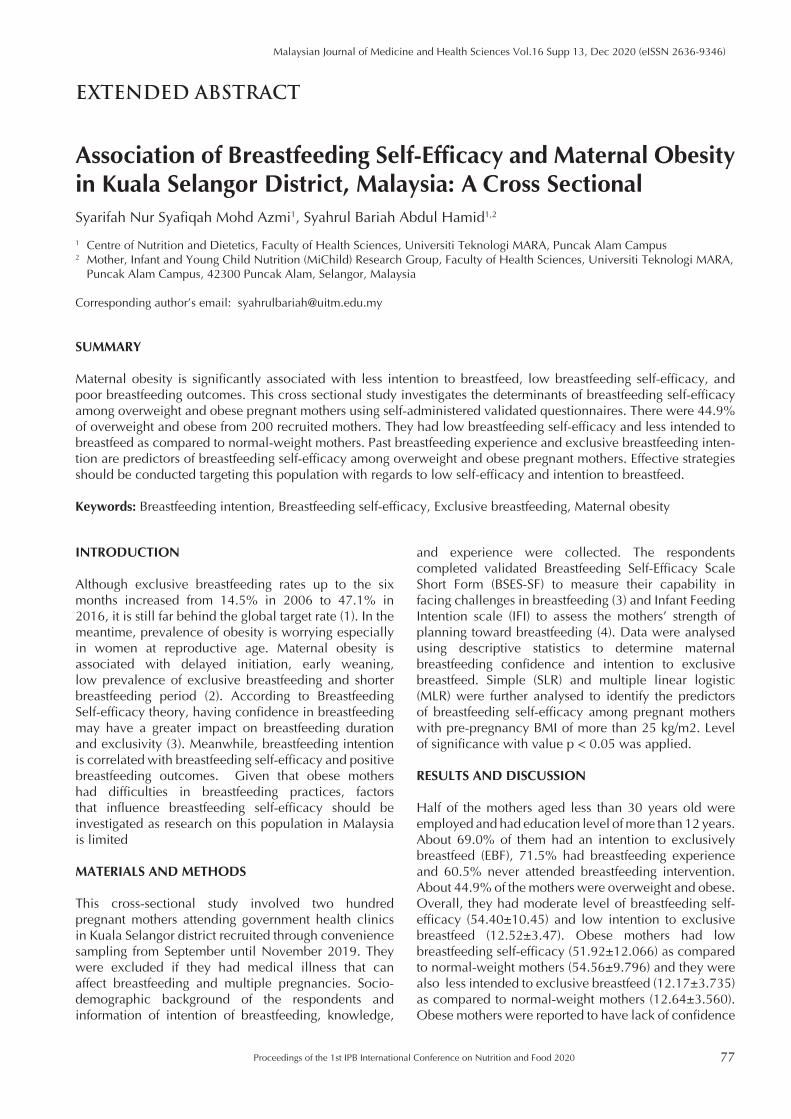
Proceedings of the 1st IPB International Conference on Nutrition and Food 2020 77
Malaysian Journal of Medicine and Health Sciences Vol.16 Supp 13, Dec 2020 (eISSN 2636-9346)
EXTENDED ABSTRACT
Association of Breastfeeding Self-Efficacy and Maternal Obesity in Kuala Selangor District, Malaysia: A Cross Sectional Syarifah Nur Syafiqah Mohd Azmi1, Syahrul Bariah Abdul Hamid1,2
1 Centre of Nutrition and Dietetics, Faculty of Health Sciences, Universiti Teknologi MARA, Puncak Alam Campus2 Mother, Infant and Young Child Nutrition (MiChild) Research Group, Faculty of Health Sciences, Universiti Teknologi MARA,
Puncak Alam Campus, 42300 Puncak Alam, Selangor, Malaysia
Corresponding author’s email: [email protected]
SUMMARY
Maternal obesity is significantly associated with less intention to breastfeed, low breastfeeding self-efficacy, and poor breastfeeding outcomes. This cross sectional study investigates the determinants of breastfeeding self-efficacy among overweight and obese pregnant mothers using self-administered validated questionnaires. There were 44.9% of overweight and obese from 200 recruited mothers. They had low breastfeeding self-efficacy and less intended to breastfeed as compared to normal-weight mothers. Past breastfeeding experience and exclusive breastfeeding inten-tion are predictors of breastfeeding self-efficacy among overweight and obese pregnant mothers. Effective strategies should be conducted targeting this population with regards to low self-efficacy and intention to breastfeed.
Keywords: Breastfeeding intention, Breastfeeding self-efficacy, Exclusive breastfeeding, Maternal obesity
INTRODUCTION
Although exclusive breastfeeding rates up to the six months increased from 14.5% in 2006 to 47.1% in 2016, it is still far behind the global target rate (1). In the meantime, prevalence of obesity is worrying especially in women at reproductive age. Maternal obesity is associated with delayed initiation, early weaning, low prevalence of exclusive breastfeeding and shorter breastfeeding period (2). According to Breastfeeding Self-efficacy theory, having confidence in breastfeeding may have a greater impact on breastfeeding duration and exclusivity (3). Meanwhile, breastfeeding intention is correlated with breastfeeding self-efficacy and positive breastfeeding outcomes. Given that obese mothers had difficulties in breastfeeding practices, factors that influence breastfeeding self-efficacy should be investigated as research on this population in Malaysia is limited
MATERIALS AND METHODS
This cross-sectional study involved two hundred pregnant mothers attending government health clinics in Kuala Selangor district recruited through convenience sampling from September until November 2019. They were excluded if they had medical illness that can affect breastfeeding and multiple pregnancies. Socio-demographic background of the respondents and information of intention of breastfeeding, knowledge,
and experience were collected. The respondents completed validated Breastfeeding Self-Efficacy Scale Short Form (BSES-SF) to measure their capability in facing challenges in breastfeeding (3) and Infant Feeding Intention scale (IFI) to assess the mothers’ strength of planning toward breastfeeding (4). Data were analysed using descriptive statistics to determine maternal breastfeeding confidence and intention to exclusive breastfeed. Simple (SLR) and multiple linear logistic (MLR) were further analysed to identify the predictors of breastfeeding self-efficacy among pregnant mothers with pre-pregnancy BMI of more than 25 kg/m2. Level of significance with value p < 0.05 was applied.
RESULTS AND DISCUSSION
Half of the mothers aged less than 30 years old were employed and had education level of more than 12 years. About 69.0% of them had an intention to exclusively breastfeed (EBF), 71.5% had breastfeeding experience and 60.5% never attended breastfeeding intervention. About 44.9% of the mothers were overweight and obese. Overall, they had moderate level of breastfeeding self-efficacy (54.40±10.45) and low intention to exclusive breastfeed (12.52±3.47). Obese mothers had low breastfeeding self-efficacy (51.92±12.066) as compared to normal-weight mothers (54.56±9.796) and they were also less intended to exclusive breastfeed (12.17±3.735) as compared to normal-weight mothers (12.64±3.560). Obese mothers were reported to have lack of confidence
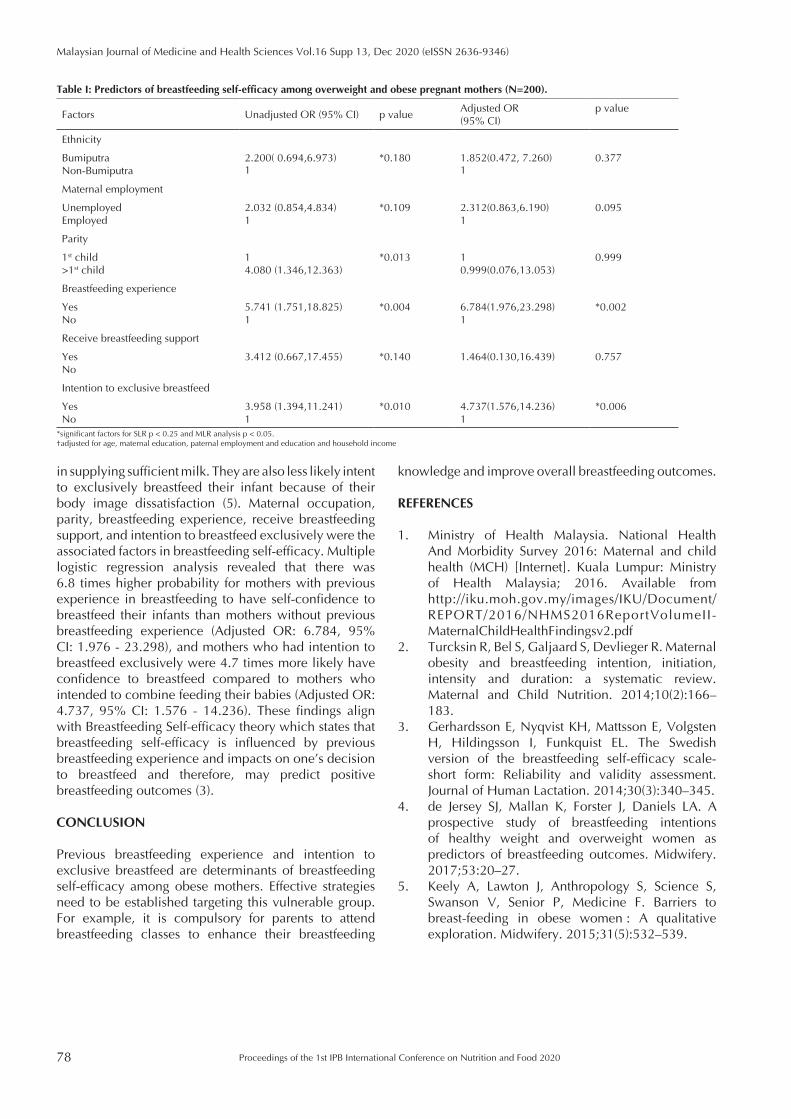
78
Malaysian Journal of Medicine and Health Sciences Vol.16 Supp 13, Dec 2020 (eISSN 2636-9346)
Proceedings of the 1st IPB International Conference on Nutrition and Food 2020
knowledge and improve overall breastfeeding outcomes.
REFERENCES
1. Ministry of Health Malaysia. National Health And Morbidity Survey 2016: Maternal and child health (MCH) [Internet]. Kuala Lumpur: Ministry of Health Malaysia; 2016. Available from http://iku.moh.gov.my/images/IKU/Document/REPORT/2016/NHMS2016ReportVolumeII-MaternalChildHealthFindingsv2.pdf
2. Turcksin R, Bel S, Galjaard S, Devlieger R. Maternal obesity and breastfeeding intention, initiation, intensity and duration: a systematic review. Maternal and Child Nutrition. 2014;10(2):166–183.
3. Gerhardsson E, Nyqvist KH, Mattsson E, Volgsten H, Hildingsson I, Funkquist EL. The Swedish version of the breastfeeding self-efficacy scale-short form: Reliability and validity assessment. Journal of Human Lactation. 2014;30(3):340–345.
4. de Jersey SJ, Mallan K, Forster J, Daniels LA. A prospective study of breastfeeding intentions of healthy weight and overweight women as predictors of breastfeeding outcomes. Midwifery. 2017;53:20–27.
5. Keely A, Lawton J, Anthropology S, Science S, Swanson V, Senior P, Medicine F. Barriers to breast-feeding in obese women : A qualitative exploration. Midwifery. 2015;31(5):532–539.
in supplying sufficient milk. They are also less likely intent to exclusively breastfeed their infant because of their body image dissatisfaction (5). Maternal occupation, parity, breastfeeding experience, receive breastfeeding support, and intention to breastfeed exclusively were the associated factors in breastfeeding self-efficacy. Multiple logistic regression analysis revealed that there was 6.8 times higher probability for mothers with previous experience in breastfeeding to have self-confidence to breastfeed their infants than mothers without previous breastfeeding experience (Adjusted OR: 6.784, 95% CI: 1.976 - 23.298), and mothers who had intention to breastfeed exclusively were 4.7 times more likely have confidence to breastfeed compared to mothers who intended to combine feeding their babies (Adjusted OR: 4.737, 95% CI: 1.576 - 14.236). These findings align with Breastfeeding Self-efficacy theory which states that breastfeeding self-efficacy is influenced by previous breastfeeding experience and impacts on one’s decision to breastfeed and therefore, may predict positive breastfeeding outcomes (3).
CONCLUSION
Previous breastfeeding experience and intention to exclusive breastfeed are determinants of breastfeeding self-efficacy among obese mothers. Effective strategies need to be established targeting this vulnerable group. For example, it is compulsory for parents to attend breastfeeding classes to enhance their breastfeeding
Table I: Predictors of breastfeeding self-efficacy among overweight and obese pregnant mothers (N=200).
Factors Unadjusted OR (95% CI) p valueAdjusted OR (95% CI)
p value
Ethnicity
BumiputraNon-Bumiputra
2.200( 0.694,6.973)1
*0.180 1.852(0.472, 7.260)1
0.377
Maternal employment
UnemployedEmployed
2.032 (0.854,4.834)1
*0.109 2.312(0.863,6.190)1
0.095
Parity
1st child>1st child
14.080 (1.346,12.363)
*0.013 10.999(0.076,13.053)
0.999
Breastfeeding experience
YesNo
5.741 (1.751,18.825)1
*0.004 6.784(1.976,23.298)1
*0.002
Receive breastfeeding support
YesNo
3.412 (0.667,17.455) *0.140 1.464(0.130,16.439) 0.757
Intention to exclusive breastfeed
YesNo
3.958 (1.394,11.241)1
*0.010 4.737(1.576,14.236)1
*0.006
*significant factors for SLR p < 0.25 and MLR analysis p < 0.05.†adjusted for age, maternal education, paternal employment and education and household income
Proceedings of the 1st IPB International Conference on Nutrition and Food 2020 79
Malaysian Journal of Medicine and Health Sciences Vol.16 Supp 13, Dec 2020 (eISSN 2636-9346)
EXTENDED ABSTRACT
Production of Wholemeal Bread from Banana Peel Flour: Improvement of Sensory CharacteristicsMusliha Azmi1,2, Zuraidah Nasution3, Aziz Yusof4
1 Bachelor of Food Science (Food Technology), Universiti Malaysia Terengganu, 21030 Kuala Nerus, Malaysia2 Department of Quality Management, AEON Co. (M) Bhd, 55100 Kuala Lumpur, Malaysia3 Department of Community Nutrition, Faculty of Human Ecology, IPB University, Bogor, Indonesia 166804 Food Science Programme, Faculty of Fisheries and Food Science, Universiti Malaysia Terengganu, 21030 Kuala Terengganu,
Malaysia
Corresponding author’s email: [email protected]
SUMMARY
Banana peel flour is high in dietary fibre and can be used in bakery products; however, it often results in low consum-er acceptance due to poor sensory properties. This study aimed to produce wholemeal bread which included banana peel flour with improved sensory characteristics. Six treatments were employed: control, increased sugar, increased fat, increased water, prolonged fermentation time, and use of food conditioner. Two treatments yielding bread with the most optimum physical characteristics were increased water and prolonged fermentation time. Wholemeal bread produced with prolonged fermentation time resulted in satisfactory sensory acceptance without detrimental effects on its fibre content.
Keywords: Consumer acceptance, Dough fermentation, High-fibre bread, Non-wheat flour, Organoleptic properties
INTRODUCTION
The consumption of bananas in Malaysia is high, thus creating an issue of a large disposal of banana peels. Banana peel flour (BPF) has been reported to contain high amount of dietary fibre (1). Therefore, it has potentials in the production of bakery products such as wholemeal bread (WMB) as a partial substitute to whole wheat flour (WWF). A preliminary study has determined 7 % as the optimum amount for substitution of WWF with BPF. The WMB produced had higher total dietary fibre, total phenolic content, and percent of inhibition of lipid peroxidation (2). Unfortunately, incorporation of BPF caused few disadvantages for WMB characteristics, such as decreased specific volume and pore size, darker colour, and dry-crumbling texture, leading to lower acceptance from sensory panellists (2, 3, 4). Thus, this study was conducted to investigate suitable methods that can be employed to enhance the characteristics of WMB from BPF.
MATERIALS AND METHODS
Ripe berangan bananas of maturity index 6 were obtained from a local farm in Kuala Terengganu, Malaysia. The peels were steam-blanched, dried, ground, and sieved into flour. Seven percent of BPF was used in production of WMB. Treatments to improve WMB characteristics were: control (untreated), increased sugar (2 g), increased
fat (4 g), increased water (2 g), prolonged fermentation time (45 min), and addition of food conditioner (0.6 g of NH4Cl). All samples were analysed for their physical characteristics. Two treatments with the most optimum physical characteristics were analysed for sensory acceptance using 7-point hedonic scale. The most accepted sample and control sample were then analysed for crude fibre content gravimetrically following chemical digestion steps. Experiment was duplicated and significance differences were determined at p<0.05 with one-way ANOVA followed by Fisher’s LSD test for physical characteristics and independent t-test for sensory acceptance.
RESULTS AND DISCUSSION
Table I shows that the sample produced with prolonged fermentation time had a significantly higher lightness value in terms of its crust than other samples. Longer proofing time provides more opportunity for yeast to consume amino acids and sugars available in the dough, leading to less severe Maillard reaction to take place during baking since there were less precursors available for the reaction (5). Meanwhile, the sample with additional water had its starch granules in the dough to swell more, leading to larger pores that were left after evaporation of water during baking. Larger pores would lead to less dense crumb and eventually affect texture and eating quality of WMB.
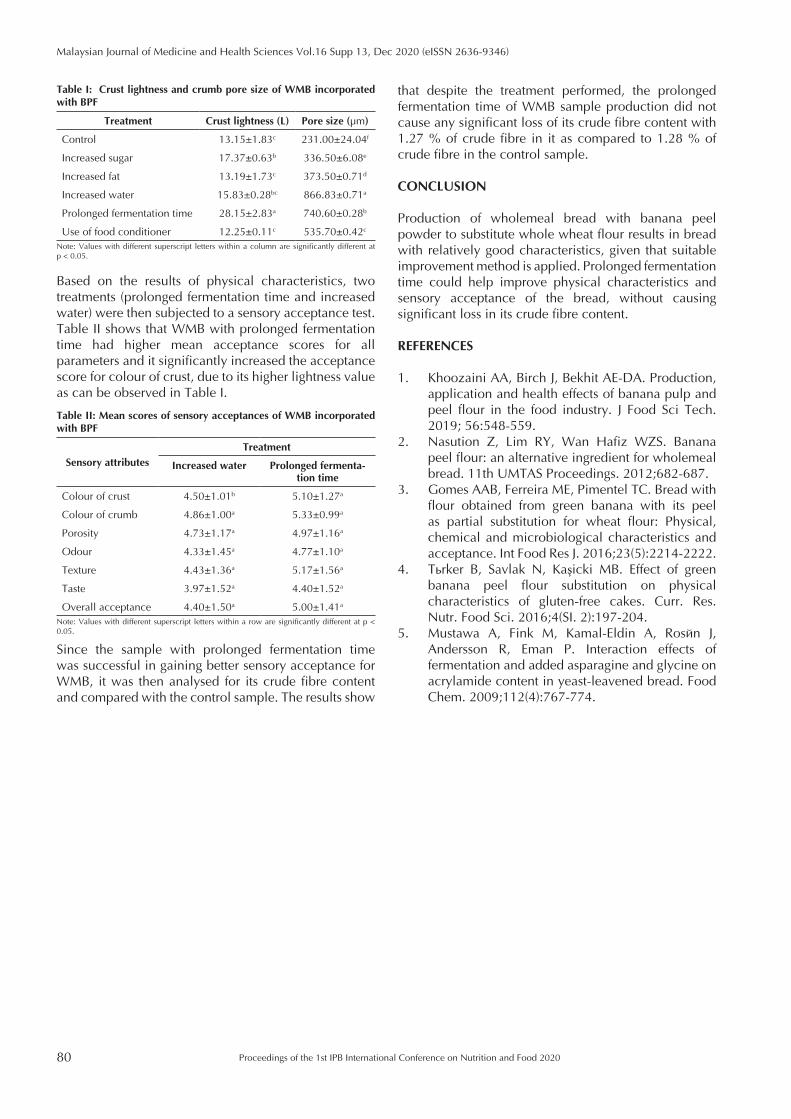
80
Malaysian Journal of Medicine and Health Sciences Vol.16 Supp 13, Dec 2020 (eISSN 2636-9346)
Proceedings of the 1st IPB International Conference on Nutrition and Food 2020
that despite the treatment performed, the prolonged fermentation time of WMB sample production did not cause any significant loss of its crude fibre content with 1.27 % of crude fibre in it as compared to 1.28 % of crude fibre in the control sample.
CONCLUSION
Production of wholemeal bread with banana peel powder to substitute whole wheat flour results in bread with relatively good characteristics, given that suitable improvement method is applied. Prolonged fermentation time could help improve physical characteristics and sensory acceptance of the bread, without causing significant loss in its crude fibre content.
REFERENCES
1. Khoozaini AA, Birch J, Bekhit AE-DA. Production, application and health effects of banana pulp and peel flour in the food industry. J Food Sci Tech. 2019; 56:548-559.
2. Nasution Z, Lim RY, Wan Hafiz WZS. Banana peel flour: an alternative ingredient for wholemeal bread. 11th UMTAS Proceedings. 2012;682-687.
3. Gomes AAB, Ferreira ME, Pimentel TC. Bread with flour obtained from green banana with its peel as partial substitution for wheat flour: Physical, chemical and microbiological characteristics and acceptance. Int Food Res J. 2016;23(5):2214-2222.
4. Türker B, Savlak N, Kaşicki MB. Effect of green banana peel flour substitution on physical characteristics of gluten-free cakes. Curr. Res. Nutr. Food Sci. 2016;4(SI. 2):197-204.
5. Mustawa A, Fink M, Kamal-Eldin A, Rosén J, Andersson R, Åman P. Interaction effects of fermentation and added asparagine and glycine on acrylamide content in yeast-leavened bread. Food Chem. 2009;112(4):767-774.
Table I: Crust lightness and crumb pore size of WMB incorporated with BPF
Treatment Crust lightness (L) Pore size (μm)
Control 13.15±1.83c 231.00±24.04f
Increased sugar 17.37±0.63b 336.50±6.08e
Increased fat 13.19±1.73c 373.50±0.71d
Increased water 15.83±0.28bc 866.83±0.71a
Prolonged fermentation time 28.15±2.83a 740.60±0.28b
Use of food conditioner 12.25±0.11c 535.70±0.42c
Note: Values with different superscript letters within a column are significantly different at p < 0.05.
Based on the results of physical characteristics, two treatments (prolonged fermentation time and increased water) were then subjected to a sensory acceptance test. Table II shows that WMB with prolonged fermentation time had higher mean acceptance scores for all parameters and it significantly increased the acceptance score for colour of crust, due to its higher lightness value as can be observed in Table I.
Table II: Mean scores of sensory acceptances of WMB incorporated with BPF
Sensory attributes
Treatment
Increased water Prolonged fermenta-tion time
Colour of crust 4.50±1.01b 5.10±1.27a
Colour of crumb 4.86±1.00a 5.33±0.99a
Porosity 4.73±1.17a 4.97±1.16a
Odour 4.33±1.45a 4.77±1.10a
Texture 4.43±1.36a 5.17±1.56a
Taste 3.97±1.52a 4.40±1.52a
Overall acceptance 4.40±1.50a 5.00±1.41a
Note: Values with different superscript letters within a row are significantly different at p < 0.05.
Since the sample with prolonged fermentation time was successful in gaining better sensory acceptance for WMB, it was then analysed for its crude fibre content and compared with the control sample. The results show
Proceedings of the 1st IPB International Conference on Nutrition and Food 2020 81
Malaysian Journal of Medicine and Health Sciences Vol.16 Supp 13, Dec 2020 (eISSN 2636-9346)
EXTENDED ABSTRACT
Increased Fibre Content in Frozen Par-Baked Chapatti with Incorporation of Okara FlourZuraidah Nasution1, Kalai Rubini Subramaniam2, Yusnita Hamzah3
1 Department of Community Nutrition, Faculty of Human Ecology, IPB University, Bogor, Indonesia 166802 Bachelor in Food Science (Food Service and Nutrition), Universiti Malaysia Terengganu, 21030, Kuala Nerus Malaysia 3 Food Science Programme, Faculty of Fisheries and Food Science, Universiti Malaysia Terengganu, 21030, Kuala Nerus,
Malaysia
Corresponding author’s email: [email protected]
SUMMARY
With its high fibre content, okara has potentials to be used in bakery products, e.g. par-baked frozen bakery. This study aimed to develop frozen par-baked chapatti (Indian flat bread) through substitution of atta flour with okara flour. Six substitution treatments were applied. Samples were analysed for their physical characteristics, sensory acceptance and nutrient content. Up to 15 % substitution gave no significant effects on samples’ texture and colour. Furthermore, it almost tripled the sample’s fibre content without any detrimental effects on its sensory acceptance. Frozen storage up to eight weeks did not significantly affect samples’ characteristics, thus making this product fea-sible.
Keywords: Flat bread, Frozen bakery, Soybean residue, Unleavened bread, Wholemeal bread
INTRODUCTION
Okara, soybean residue from soybean-based industry, has about 50 % dietary fibre, making it suitable for partial inclusion in bakery products (1). It was also reported to contain bioactive and protein components with better quality than those of other soy-based products (2). However, the high fibre often brings disadvantages in sensory acceptability due to its effect on texture (3). Therefore, its use in unleavened breads such as chapatti would be suitable, where okara flour could be employed for partial substitution of atta flour in the formulation. To suit to current trend of convenient foods, frozen par-baked chapatti was selected for this study. Partial baking in production of frozen chapatti was suggested since it could bring similar texture to that of conventionally baked chapatti while reducing staling during frozen storage (4). Therefore, this study was conducted to develop frozen par-baked chapatti with acceptable quality through incorporation of okara flour.
MATERIALS AND METHODS
Fresh okara was dried, ground, and sieved to flour. Six levels of substitution of atta flour with okara flour were used: 0, 3, 6, 9, 12 and 15 %. Samples were stored frozen after partial baking (210 oC; 30 s for each side). Next, they were analysed for their physical characteristics (colour and tensile strength) and sensory acceptance after thawing (ambient temperature; 1 h) and subsequent
baking (210 oC; 90 s for one side and 30 s for another side). Samples were observed after two months of frozen storage and compared with fresh fully-baked samples. Sensory acceptance test was performed with 7-point hedonic scale. Two treatments with optimum physical properties and acceptable sensory characteristics were analysed for total protein content (Kjeldahl method) and crude fibre content (gravimetric method following chemical digestion steps). Data were subjected to one-way ANOVA followed by Fisher’s LSD test at 95 % confidence interval.
RESULTS AND DISCUSSION
Table I shows that frozen storage of par-baked chapatti with incorporation of okara flour did not significantly affect the texture and colour of the samples up until eight weeks of storage as compared to control sample. These results implied that substitution of atta flour with okara flour in production of chapatti did not negatively affect the physical characteristics of par-baked frozen chapatti, similar to the results of a study with wheat flour chapatti (4). Unleavened bakery products such as chapatti could be seen as a potential choice since utilization of okara in leavened bakery products like bread has been shown to have effects on texture to certain extent (5). Even in production of cookies with okara flour, texture improvers were needed to be added to yield products with good characteristics (2). The effect of okara on the texture of bakery products was reported to be caused by defects
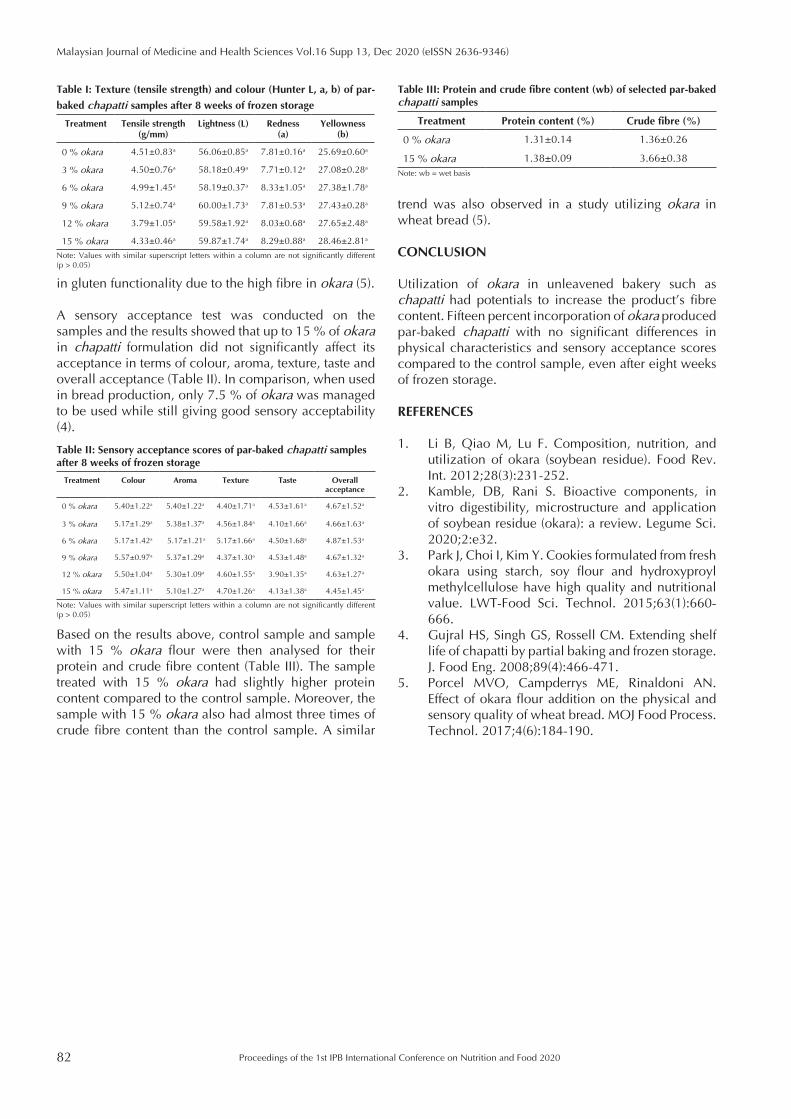
82
Malaysian Journal of Medicine and Health Sciences Vol.16 Supp 13, Dec 2020 (eISSN 2636-9346)
Proceedings of the 1st IPB International Conference on Nutrition and Food 2020
trend was also observed in a study utilizing okara in wheat bread (5).
CONCLUSION
Utilization of okara in unleavened bakery such as chapatti had potentials to increase the product’s fibre content. Fifteen percent incorporation of okara produced par-baked chapatti with no significant differences in physical characteristics and sensory acceptance scores compared to the control sample, even after eight weeks of frozen storage.
REFERENCES
1. Li B, Qiao M, Lu F. Composition, nutrition, and utilization of okara (soybean residue). Food Rev. Int. 2012;28(3):231-252.
2. Kamble, DB, Rani S. Bioactive components, in vitro digestibility, microstructure and application of soybean residue (okara): a review. Legume Sci. 2020;2:e32.
3. Park J, Choi I, Kim Y. Cookies formulated from fresh okara using starch, soy flour and hydroxyproyl methylcellulose have high quality and nutritional value. LWT-Food Sci. Technol. 2015;63(1):660-666.
4. Gujral HS, Singh GS, Rossell CM. Extending shelf life of chapatti by partial baking and frozen storage. J. Food Eng. 2008;89(4):466-471.
5. Porcel MVO, Campderrós ME, Rinaldoni AN. Effect of okara flour addition on the physical and sensory quality of wheat bread. MOJ Food Process. Technol. 2017;4(6):184-190.
in gluten functionality due to the high fibre in okara (5).
A sensory acceptance test was conducted on the samples and the results showed that up to 15 % of okara in chapatti formulation did not significantly affect its acceptance in terms of colour, aroma, texture, taste and overall acceptance (Table II). In comparison, when used in bread production, only 7.5 % of okara was managed to be used while still giving good sensory acceptability (4).
Table I: Texture (tensile strength) and colour (Hunter L, a, b) of par-
baked chapatti samples after 8 weeks of frozen storage
Treatment Tensile strength (g/mm)
Lightness (L) Redness (a)
Yellowness (b)
0 % okara 4.51±0.83a 56.06±0.85a 7.81±0.16a 25.69±0.60a
3 % okara 4.50±0.76a 58.18±0.49a 7.71±0.12a 27.08±0.28a
6 % okara 4.99±1.45a 58.19±0.37a 8.33±1.05a 27.38±1.78a
9 % okara 5.12±0.74a 60.00±1.73a 7.81±0.53a 27.43±0.28a
12 % okara 3.79±1.05a 59.58±1.92a 8.03±0.68a 27.65±2.48a
15 % okara 4.33±0.46a 59.87±1.74a 8.29±0.88a 28.46±2.81a
Note: Values with similar superscript letters within a column are not significantly different (p > 0.05)
Table II: Sensory acceptance scores of par-baked chapatti samples after 8 weeks of frozen storage
Treatment Colour Aroma Texture Taste Overall acceptance
0 % okara 5.40±1.22a 5.40±1.22a 4.40±1.71a 4.53±1.61a 4.67±1.52a
3 % okara 5.17±1.29a 5.38±1.37a 4.56±1.84a 4.10±1.66a 4.66±1.63a
6 % okara 5.17±1.42a 5.17±1.21a 5.17±1.66a 4.50±1.68a 4.87±1.53a
9 % okara 5.57±0.97a 5.37±1.29a 4.37±1.30a 4.53±1.48a 4.67±1.32a
12 % okara 5.50±1.04a 5.30±1.09a 4.60±1.55a 3.90±1.35a 4.63±1.27a
15 % okara 5.47±1.11a 5.10±1.27a 4.70±1.26a 4.13±1.38a 4.45±1.45a
Note: Values with similar superscript letters within a column are not significantly different (p > 0.05)
Based on the results above, control sample and sample with 15 % okara flour were then analysed for their protein and crude fibre content (Table III). The sample treated with 15 % okara had slightly higher protein content compared to the control sample. Moreover, the sample with 15 % okara also had almost three times of crude fibre content than the control sample. A similar
Table III: Protein and crude fibre content (wb) of selected par-baked chapatti samples
Treatment Protein content (%) Crude fibre (%)
0 % okara 1.31±0.14 1.36±0.26
15 % okara 1.38±0.09 3.66±0.38Note: wb = wet basis
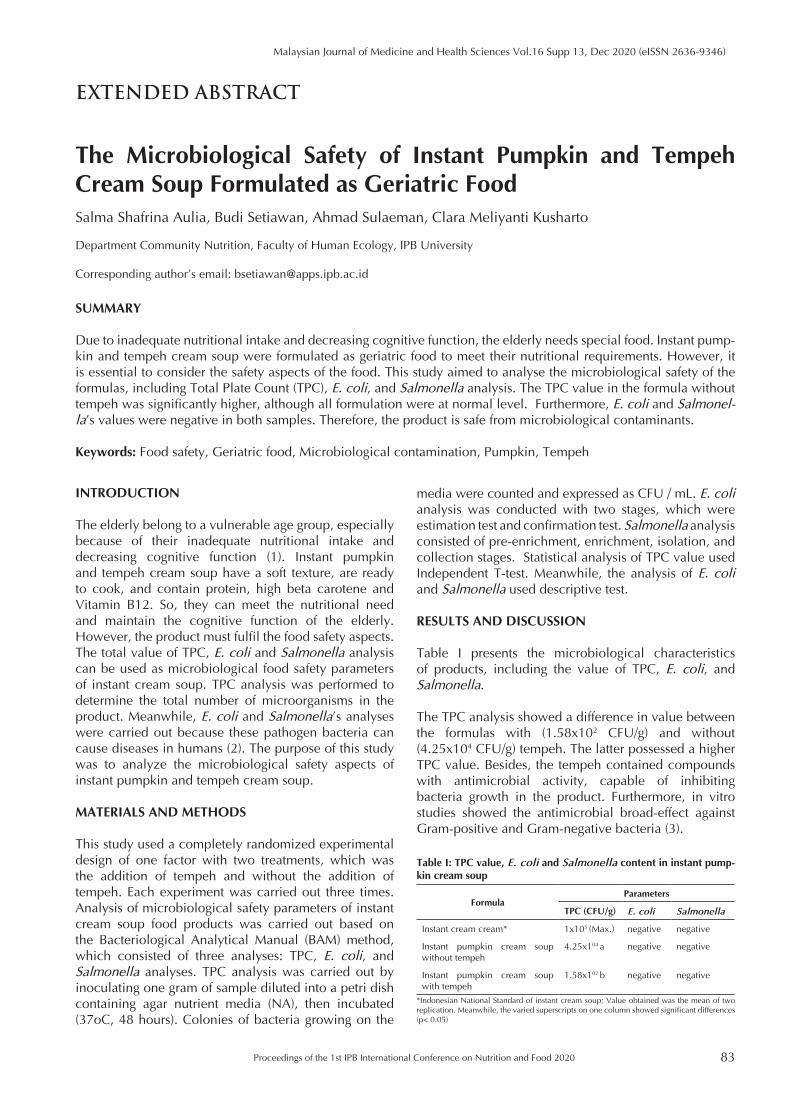
Proceedings of the 1st IPB International Conference on Nutrition and Food 2020 83
Malaysian Journal of Medicine and Health Sciences Vol.16 Supp 13, Dec 2020 (eISSN 2636-9346)
EXTENDED ABSTRACT
The Microbiological Safety of Instant Pumpkin and Tempeh Cream Soup Formulated as Geriatric FoodSalma Shafrina Aulia, Budi Setiawan, Ahmad Sulaeman, Clara Meliyanti Kusharto
Department Community Nutrition, Faculty of Human Ecology, IPB University
Corresponding author’s email: [email protected]
SUMMARY
Due to inadequate nutritional intake and decreasing cognitive function, the elderly needs special food. Instant pump-kin and tempeh cream soup were formulated as geriatric food to meet their nutritional requirements. However, it is essential to consider the safety aspects of the food. This study aimed to analyse the microbiological safety of the formulas, including Total Plate Count (TPC), E. coli, and Salmonella analysis. The TPC value in the formula without tempeh was significantly higher, although all formulation were at normal level. Furthermore, E. coli and Salmonel-la’s values were negative in both samples. Therefore, the product is safe from microbiological contaminants.
Keywords: Food safety, Geriatric food, Microbiological contamination, Pumpkin, Tempeh
INTRODUCTION
The elderly belong to a vulnerable age group, especially because of their inadequate nutritional intake and decreasing cognitive function (1). Instant pumpkin and tempeh cream soup have a soft texture, are ready to cook, and contain protein, high beta carotene and Vitamin B12. So, they can meet the nutritional need and maintain the cognitive function of the elderly. However, the product must fulfil the food safety aspects. The total value of TPC, E. coli and Salmonella analysis can be used as microbiological food safety parameters of instant cream soup. TPC analysis was performed to determine the total number of microorganisms in the product. Meanwhile, E. coli and Salmonella’s analyses were carried out because these pathogen bacteria can cause diseases in humans (2). The purpose of this study was to analyze the microbiological safety aspects of instant pumpkin and tempeh cream soup.
MATERIALS AND METHODS
This study used a completely randomized experimental design of one factor with two treatments, which was the addition of tempeh and without the addition of tempeh. Each experiment was carried out three times. Analysis of microbiological safety parameters of instant cream soup food products was carried out based on the Bacteriological Analytical Manual (BAM) method, which consisted of three analyses: TPC, E. coli, and Salmonella analyses. TPC analysis was carried out by inoculating one gram of sample diluted into a petri dish containing agar nutrient media (NA), then incubated (37oC, 48 hours). Colonies of bacteria growing on the
media were counted and expressed as CFU / mL. E. coli analysis was conducted with two stages, which were estimation test and confirmation test. Salmonella analysis consisted of pre-enrichment, enrichment, isolation, and collection stages. Statistical analysis of TPC value used Independent T-test. Meanwhile, the analysis of E. coli and Salmonella used descriptive test.
RESULTS AND DISCUSSION
Table I presents the microbiological characteristics of products, including the value of TPC, E. coli, and Salmonella.
The TPC analysis showed a difference in value between the formulas with (1.58x10² CFU/g) and without (4.25x10⁴ CFU/g) tempeh. The latter possessed a higher TPC value. Besides, the tempeh contained compounds with antimicrobial activity, capable of inhibiting bacteria growth in the product. Furthermore, in vitro studies showed the antimicrobial broad-effect against Gram-positive and Gram-negative bacteria (3).
Table I: TPC value, E. coli and Salmonella content in instant pump-kin cream soup
FormulaParameters
TPC (CFU/g) E. coli Salmonella
Instant cream cream* 1x10⁵ (Max.) negative negative
Instant pumpkin cream soup without tempeh
4.25x10⁴ a negative negative
Instant pumpkin cream soup with tempeh
1.58x10² b negative negative
*Indonesian National Standard of instant cream soup; Value obtained was the mean of two replication. Meanwhile, the varied superscripts on one column showed significant differences (p< 0.05)
84
Malaysian Journal of Medicine and Health Sciences Vol.16 Supp 13, Dec 2020 (eISSN 2636-9346)
Proceedings of the 1st IPB International Conference on Nutrition and Food 2020
ACKNOWLEDGEMENTS
The authors would like to thank the Ministry of Research, Technology, and Higher Education in the Republic of Indonesia for funding this research through Program Magister Menuju Doktor Bagi Sarjana Unggul (PMDSU) scheme under contract no. 4418/IT3.11/PN/2018.
REFERENCES
1. Phillips SM. Nutrition in the elderly: a recommendation for more (evenly distributed) protein?. Amr J Clin Nutr. 2017;106(1):12-13.
2. Smith JL, Fratamico PM. Escherichia coli as other Enterobacteriaceae: food poisoning and health effects. In: Caballero B, Finglas P, Toldra, editor. Oxford: Acad;2016.
3. Cao ZH, Green-Johnson JM, Buckley ND, Lin QY. Bioactivity of soy-based fermented foods: A review. Biotechnol Adv. 2019;37(1):223-238.
4. Finn S, Condell O, McClure P, Amezquita A, Fanning S. Mechanisms of survival, responses, and sources of Salmonella in low-moisture environments. Frontiers in Microbiology. 2013;14(4):331.
5. Aulia SS, Setiawan B, Sinaga T, Sulaeman A. Quality degradation and estimated shelf life of pumpkin instant cream soup enriched with tempeh for the elderly using accelerated shelf life testing (ASLT) method. The Indonesian Journal of Nutrition. 2020;8(2):134-142.
On the other hand, the analysis of E. coli and Salmonella in both formulas showed negative results. It can be caused by the drying process in making instant cream soup. The drying process with high temperature (drum dryer) can inactivate pathogenic bacteria in dry food (4). Foods with water activity (aw) <0.85 do not support bacterial growth. In both formulas, aw products ranged from 0.43 to 0.56 so that the possibility of bacteria to grow in pumpkin instant cream soup is relatively low. This condition can made Viable but Not Culturable (VBNC) state in bacteria where the bacteria had a very low metabolic activity so that they cannot grow but they are still alive and it was possible for the bacteria to grow when they found a suitable environment. It also caused the TPC value to remain, even it was in standard limit (5). Based on these results, the instant pumpkin and tempeh cream soup fulfil the microbiological food safety criteria of instant cream soup to be used as geriatric food.
CONCLUSION
The analysis showed that the products TPC value was below the threshold of 1 x 10⁵ CFU / mL, and the product was undetectable or negative for E. coli and Salmonella. Furthermore, the addition of tempeh to the formula reduces total number of bacteria.
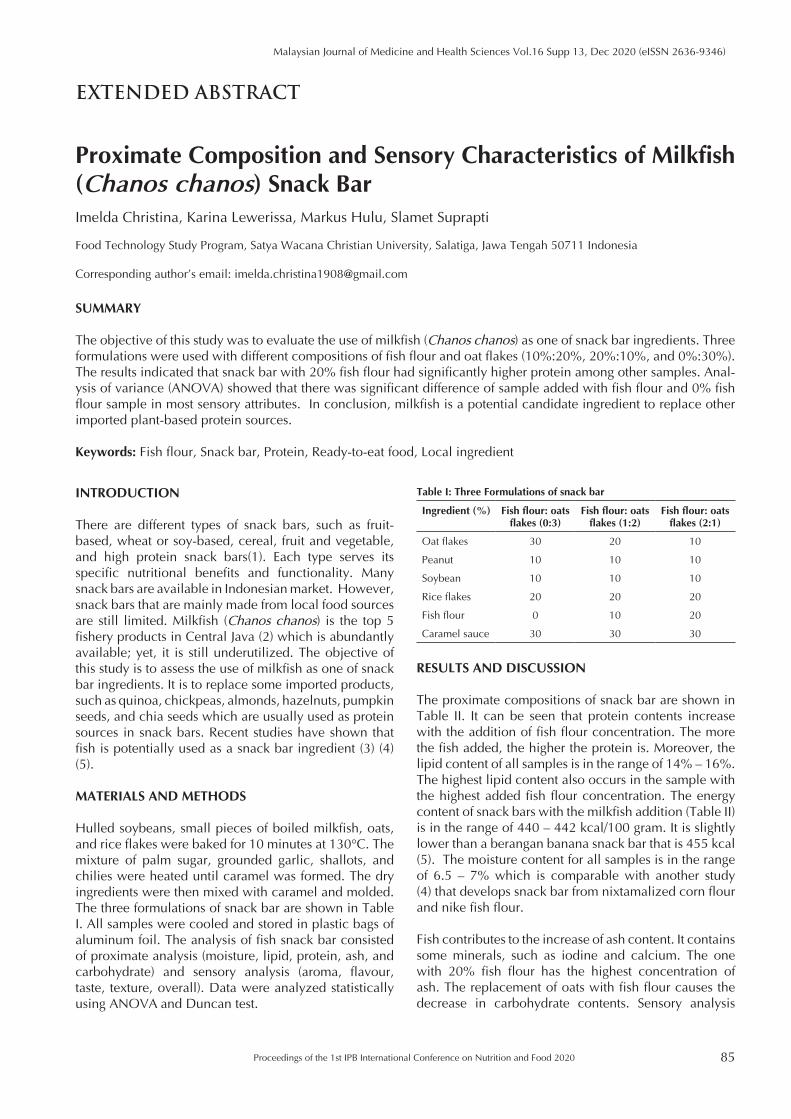
Proceedings of the 1st IPB International Conference on Nutrition and Food 2020 85
Malaysian Journal of Medicine and Health Sciences Vol.16 Supp 13, Dec 2020 (eISSN 2636-9346)
EXTENDED ABSTRACT
Proximate Composition and Sensory Characteristics of Milkfish (Chanos chanos) Snack BarImelda Christina, Karina Lewerissa, Markus Hulu, Slamet Suprapti
Food Technology Study Program, Satya Wacana Christian University, Salatiga, Jawa Tengah 50711 Indonesia
Corresponding author’s email: [email protected]
SUMMARY
The objective of this study was to evaluate the use of milkfish (Chanos chanos) as one of snack bar ingredients. Three formulations were used with different compositions of fish flour and oat flakes (10%:20%, 20%:10%, and 0%:30%). The results indicated that snack bar with 20% fish flour had significantly higher protein among other samples. Anal-ysis of variance (ANOVA) showed that there was significant difference of sample added with fish flour and 0% fish flour sample in most sensory attributes. In conclusion, milkfish is a potential candidate ingredient to replace other imported plant-based protein sources.
Keywords: Fish flour, Snack bar, Protein, Ready-to-eat food, Local ingredient
INTRODUCTION
There are different types of snack bars, such as fruit-based, wheat or soy-based, cereal, fruit and vegetable, and high protein snack bars(1). Each type serves its specific nutritional benefits and functionality. Many snack bars are available in Indonesian market. However, snack bars that are mainly made from local food sources are still limited. Milkfish (Chanos chanos) is the top 5 fishery products in Central Java (2) which is abundantly available; yet, it is still underutilized. The objective of this study is to assess the use of milkfish as one of snack bar ingredients. It is to replace some imported products, such as quinoa, chickpeas, almonds, hazelnuts, pumpkin seeds, and chia seeds which are usually used as protein sources in snack bars. Recent studies have shown that fish is potentially used as a snack bar ingredient (3) (4) (5).
MATERIALS AND METHODS
Hulled soybeans, small pieces of boiled milkfish, oats, and rice flakes were baked for 10 minutes at 130°C. The mixture of palm sugar, grounded garlic, shallots, and chilies were heated until caramel was formed. The dry ingredients were then mixed with caramel and molded. The three formulations of snack bar are shown in Table I. All samples were cooled and stored in plastic bags of aluminum foil. The analysis of fish snack bar consisted of proximate analysis (moisture, lipid, protein, ash, and carbohydrate) and sensory analysis (aroma, flavour, taste, texture, overall). Data were analyzed statistically using ANOVA and Duncan test.
RESULTS AND DISCUSSION
The proximate compositions of snack bar are shown in Table II. It can be seen that protein contents increase with the addition of fish flour concentration. The more the fish added, the higher the protein is. Moreover, the lipid content of all samples is in the range of 14% – 16%. The highest lipid content also occurs in the sample with the highest added fish flour concentration. The energy content of snack bars with the milkfish addition (Table II) is in the range of 440 – 442 kcal/100 gram. It is slightly lower than a berangan banana snack bar that is 455 kcal (5). The moisture content for all samples is in the range of 6.5 – 7% which is comparable with another study (4) that develops snack bar from nixtamalized corn flour and nike fish flour.
Fish contributes to the increase of ash content. It contains some minerals, such as iodine and calcium. The one with 20% fish flour has the highest concentration of ash. The replacement of oats with fish flour causes the decrease in carbohydrate contents. Sensory analysis
Table I: Three Formulations of snack bar
Ingredient (%) Fish flour: oats flakes (0:3)
Fish flour: oats flakes (1:2)
Fish flour: oats flakes (2:1)
Oat flakes 30 20 10
Peanut 10 10 10
Soybean 10 10 10
Rice flakes 20 20 20
Fish flour 0 10 20
Caramel sauce 30 30 30
86
Malaysian Journal of Medicine and Health Sciences Vol.16 Supp 13, Dec 2020 (eISSN 2636-9346)
Proceedings of the 1st IPB International Conference on Nutrition and Food 2020
CONCLUSION
The addition of fish flour increases the protein and lipid content in snack bars. The sensory evaluations shows that snack bars with 20% fish flour are the most preferred by the panelists. This study indicates that fish flour can be an alternative protein source for snack bars.
REFERENCES
1. Constantin OE, Istrati Daniela I. Functional Properties of Snack Bars. In: Lagouri V, editor. Functional Food [Internet]. Intech Open; 2018. Available from: https://www.intechopen.com/books/functional-foods/functional-properties-of-snack-bars
2. Jateng PP. Produksi Perikanan Budidaya Jateng Capai 510 ribu Ton Lebih [Internet]. 2020 [cited 2020 Sep 10]. Available from: https://jatengprov.go.id/publik/produksi-perikanan-budidaya-jateng-capai-510-ribu-ton-lebih/
3. Elnovriza D, Hadi R, Rimbawan, Evy D,& Adi Winarto. Development of Fish Bars as a High Zinc and Calcium Snack Made from Bilih Fish (Mystacoleuseus padangensis Blkr) Flour. Journal of Food and Nutrition. 2019;14(2):83-90
4. Kasim R, Ahmad L, Une S, Bait Y, Liputo SA. Characterization of Snack Food Bars Made of Nixtamalized Corn Flour and Flour Of Nike Fish for Emergency Food. Int J Agric Syst. 2017;5(1):33.
5. Ho LH, Tang JYH, Akma SM, Aiman HM, Roslan A. Development of Novel “energy” Snack Bar by Utilizing Local Malaysian Ingredients. Inter Food Res. 2016; J23(5):2280-2285.
shows that sample added to fish has no significant effect in all parameters except for taste (Table III). This result is congruent with another study (4) that shows no significant difference among samples added with different concentrations of bilih fish. Sample without fish flour differs significantly with added ones in almost all parameters. From Table III, it can be seen that sample with fish flour: oat flakes (2:1) has the highest score for all attributes tested. It shows that snack bars with fish flour and oat flakes (2:1) are the most preferred by panelists.
Table II: Proximate data of fish snack bars
Parameters Fish flour: oats flakes (0:3)
Fish flour: oats flakes (1:2)
fish flour: oats flakes (2:1)
Lipid (%) 14.85 + 0.44a 15.29 + 0.81ab 16.47 + 0.47b
Protein (%) 16.34 + 0.35a 20.82 + 0.78b 24.83 + 0.35c
Moisture (%) 6.54 + 0.04a 7.05 + 0.26b 7.05 + 0.09b
Ash (%) 1.70 + 0.05a 2.83 +0.69b 3.87 + 0.42c
Carbohydrate (%)
60.57a 54.00c 47.78b
*Mean + standard deviation (n=3). Different letters in the same line mean significant differ-ences between samples (p<0.05)
Table III: Sensory analysis results for fish snack bars
Parameters Fish flour: oats flakes (0:3)
Fish flour: oats flakes (1:2)
Fish flour: oats flakes (2:1)
Aroma 3.30b 3.57ab 3.90a
Flavor 3.30b 3.60ab 3.93a
Taste 3.20c 3.67a 4.20b
Texture 2.40b 2.80a 3.20a
Overall 3.06b 3.67a 3.93a
*Average value from sensory test (n=30). Different letters in the same row mean significant differences between samples (p<0.05)
Proceedings of the 1st IPB International Conference on Nutrition and Food 2020 87
Malaysian Journal of Medicine and Health Sciences Vol.16 Supp 13, Dec 2020 (eISSN 2636-9346)
EXTENDED ABSTRACT
Development of Instant Pumpkin (Cucurbita moschata) Soup as a Potential Source of β-Carotene for the ElderlyWawan Saepul Irwan1,2, Budi Setiawan1, Ahmad Sulaeman1
1 Department of Community Nutrition, Faculty of Human Ecology, IPB University, Bogor, 16680 Indonesia2 Centre for the Development and Empowerment of Educators and Educational Personnel (CDETEP) for Business and Tourism,
Ministry of Education and Culture of Republic of Indonesia
Corresponding author’s email: [email protected]
SUMMARY
Instant soup is an ideal meal for the elderly due to its fast preparation and easy-to-digest characteristic. Pumpkin and carrot are highly nutritious food, rich in β-carotene. This study aimed to develop soup with different ratios of pump-kin and carrot (1:2, 1:1 and 2:1) and different types of processing (fresh and instant). Nutrient contents (energy, pro-tein, fat, carbohydrate, β-carotene) were determined using proximate analysis and HPLC. ANOVA with Duncan’s test and independent samples t-test were applied. Based on hedonic test, the selected formula was instantly processed soup with 2:1 pumpkin to carrot ratio containing 3380 mcg β-carotene.
Keywords: β-carotene, Cucurbita moschata, Elderly, Soup, Pumpkin
INTRODUCTION
Indonesia is facing the growth of the aging population. The number of elders (> 60 years) in Indonesia is projected to increase by 48.2 million in 2035 (1). In fact, 26% of older adults were disabled (1). Adequate nutrition is one of important aspects to guarantee the health status of the elderly (2). β-Carotene is a carotenoid which plays an important role in the elderly’s health. β-carotene status of the elderly is associated with dementia risk, cognitive function, Alzheimer’s diseases, macular degeneration, and overall risks of death. Pumpkin and carrot are nutritious food rich in vitamins, minerals, fibre, and β-carotene. Moreover, instant soup is easy to cook and eat, and has long-lasting flavour and nutritional stability. Thus, it is suitable for the elderly (3). Therefore, the present study aimed to develop instant pumpkin-based soup as an alternative food for the elderly to fulfil their nutritional needs, especially β-carotene.
MATERIALS AND METHODS
Soup was formulated with different ratios of pumpkin (Curcubita moshata) and carrot (1:2, 1:1 and 2:1), and different types of processing (fresh and instant). Materials used for making fresh soup were pumpkin, carrot, wheat flour, broth, cooking cream, butter, and condiments. The fresh soup was dried with drum dryer to produce instant soup. The acceptability was evaluated by semi-trained panellists (n=30) to obtain the selected formula, which was then evaluated by the elderly as targeted consumer (n=70) in terms of aroma, texture, freshness,
temperature and taste. Energy, protein, fat, and carbohydrate were measured with proximate analysis. β-carotene and potassium content were determined using HPLC and inductively couple plasma–optical emission spectrophotometer, respectively. The selected formula was determined with ANOVA and Duncan’s post-hoc test, while independent t-test was used to determine the differences in acceptability level between fresh and instant soup. The differences were considered significant at p-value < 0.05.
RESULTS AND DISCUSSION
Based on the evaluation of the semi-trained panellists, all formulas were acceptable (overall acceptability score > 5), except instantly processed soup with the ratio of 1:2. Formula with 2:1 ratio of pumpkin and carrot had the highest acceptability, while types of processing did not affect the acceptability of this formula according to overall acceptability evaluation by semi-trained panellists (Table I). Therefore, this ratio was selected for the acceptability test to see which type of processing they preferred as target consumers. The result showed that the acceptability of texture, aroma, taste, and freshness were higher in instant soup than fresh soup (p < 0.05) (Fig. 1). Advanced food processing could improve food quality. Our previous results also showed that that the instant soup had lighter colour, was sweeter, had less onion flavour, and was less salty than fresh soup.
In one serving size, instant pumpkin-based soup (100 g of instant soup powder diluted in 300 ml of water) had
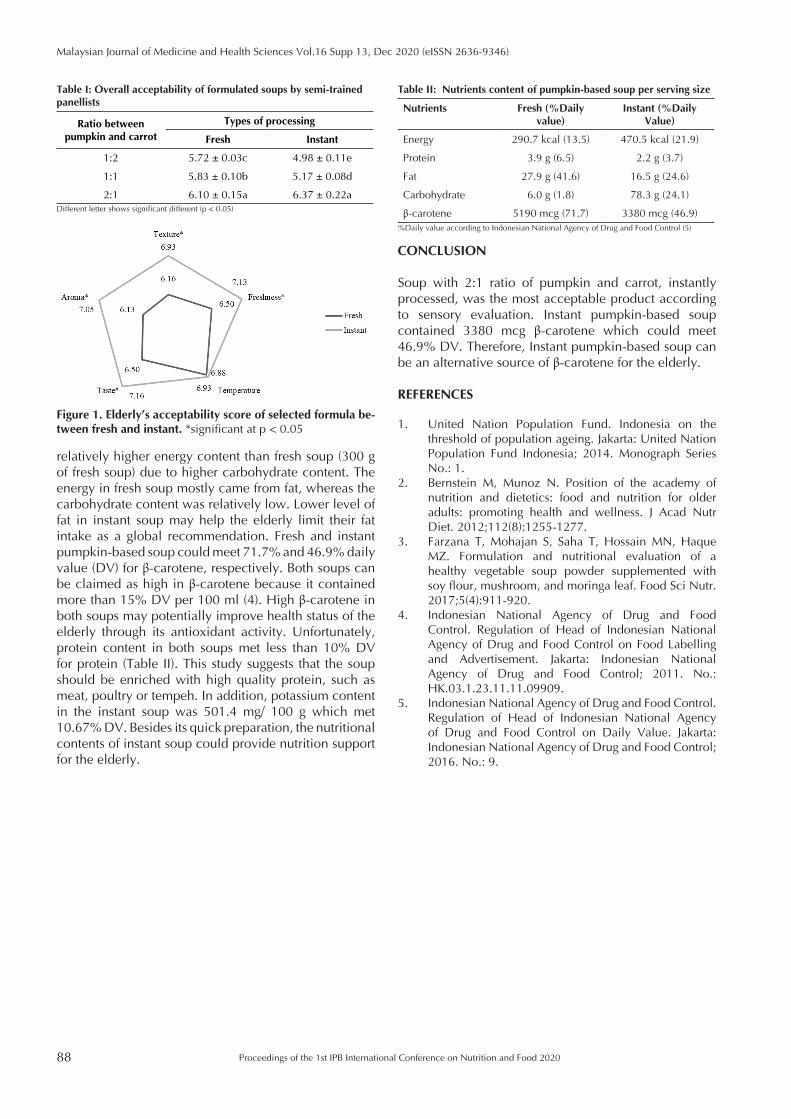
88
Malaysian Journal of Medicine and Health Sciences Vol.16 Supp 13, Dec 2020 (eISSN 2636-9346)
Proceedings of the 1st IPB International Conference on Nutrition and Food 2020
CONCLUSION
Soup with 2:1 ratio of pumpkin and carrot, instantly processed, was the most acceptable product according to sensory evaluation. Instant pumpkin-based soup contained 3380 mcg β-carotene which could meet 46.9% DV. Therefore, Instant pumpkin-based soup can be an alternative source of β-carotene for the elderly.
REFERENCES
1. United Nation Population Fund. Indonesia on the threshold of population ageing. Jakarta: United Nation Population Fund Indonesia; 2014. Monograph Series No.: 1.
2. Bernstein M, Munoz N. Position of the academy of nutrition and dietetics: food and nutrition for older adults: promoting health and wellness. J Acad Nutr Diet. 2012;112(8):1255-1277.
3. Farzana T, Mohajan S, Saha T, Hossain MN, Haque MZ. Formulation and nutritional evaluation of a healthy vegetable soup powder supplemented with soy flour, mushroom, and moringa leaf. Food Sci Nutr. 2017;5(4):911-920.
4. Indonesian National Agency of Drug and Food Control. Regulation of Head of Indonesian National Agency of Drug and Food Control on Food Labelling and Advertisement. Jakarta: Indonesian National Agency of Drug and Food Control; 2011. No.: HK.03.1.23.11.11.09909.
5. Indonesian National Agency of Drug and Food Control. Regulation of Head of Indonesian National Agency of Drug and Food Control on Daily Value. Jakarta: Indonesian National Agency of Drug and Food Control; 2016. No.: 9.
Table I: Overall acceptability of formulated soups by semi-trained panellists
Ratio between pumpkin and carrot
Types of processing
Fresh Instant
1:2 5.72 ± 0.03c 4.98 ± 0.11e
1:1 5.83 ± 0.10b 5.17 ± 0.08d
2:1 6.10 ± 0.15a 6.37 ± 0.22aDifferent letter shows significant different (p < 0.05)
Figure 1. Elderly’s acceptability score of selected formula be-tween fresh and instant. *significant at p < 0.05
relatively higher energy content than fresh soup (300 g of fresh soup) due to higher carbohydrate content. The energy in fresh soup mostly came from fat, whereas the carbohydrate content was relatively low. Lower level of fat in instant soup may help the elderly limit their fat intake as a global recommendation. Fresh and instant pumpkin-based soup could meet 71.7% and 46.9% daily value (DV) for β-carotene, respectively. Both soups can be claimed as high in β-carotene because it contained more than 15% DV per 100 ml (4). High β-carotene in both soups may potentially improve health status of the elderly through its antioxidant activity. Unfortunately, protein content in both soups met less than 10% DV for protein (Table II). This study suggests that the soup should be enriched with high quality protein, such as meat, poultry or tempeh. In addition, potassium content in the instant soup was 501.4 mg/ 100 g which met 10.67% DV. Besides its quick preparation, the nutritional contents of instant soup could provide nutrition support for the elderly.
Table II: Nutrients content of pumpkin-based soup per serving size
Nutrients Fresh (%Daily value)
Instant (%Daily Value)
Energy 290.7 kcal (13.5) 470.5 kcal (21.9)
Protein 3.9 g (6.5) 2.2 g (3.7)
Fat 27.9 g (41.6) 16.5 g (24.6)
Carbohydrate 6.0 g (1.8) 78.3 g (24.1)
β-carotene 5190 mcg (71.7) 3380 mcg (46.9)%Daily value according to Indonesian National Agency of Drug and Food Control (5)
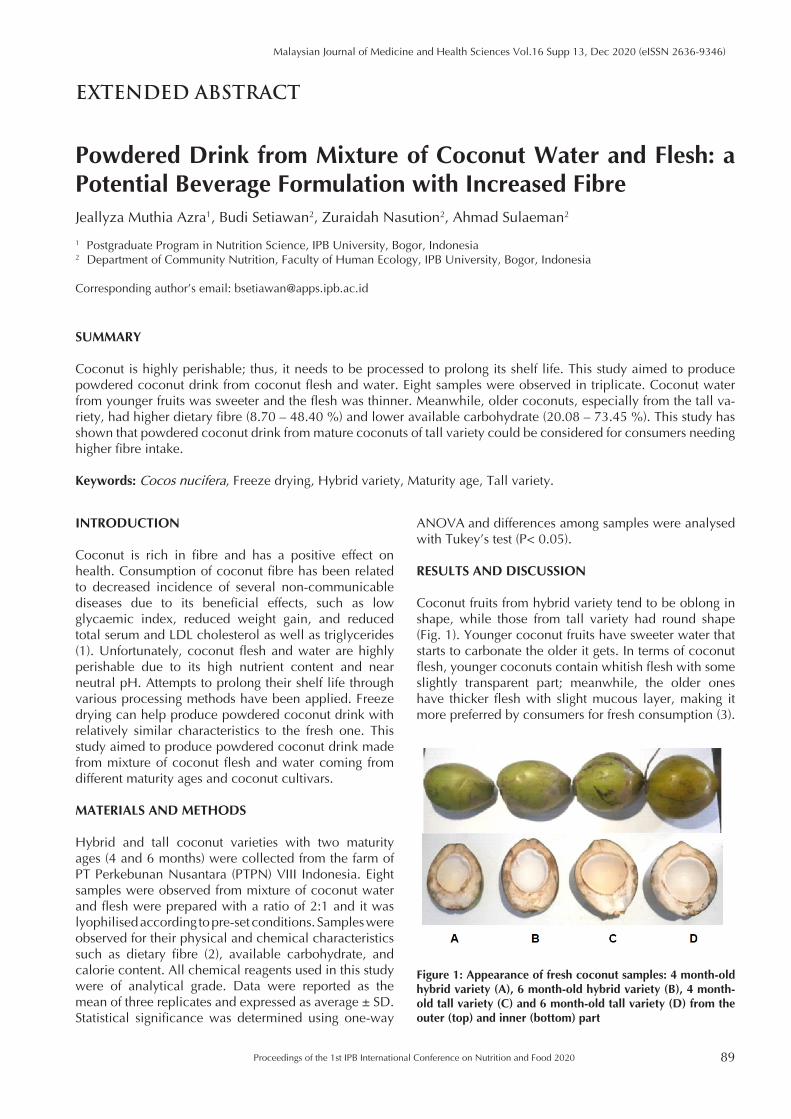
Proceedings of the 1st IPB International Conference on Nutrition and Food 2020 89
Malaysian Journal of Medicine and Health Sciences Vol.16 Supp 13, Dec 2020 (eISSN 2636-9346)
EXTENDED ABSTRACT
Powdered Drink from Mixture of Coconut Water and Flesh: a Potential Beverage Formulation with Increased FibreJeallyza Muthia Azra1, Budi Setiawan2, Zuraidah Nasution2, Ahmad Sulaeman2
1 Postgraduate Program in Nutrition Science, IPB University, Bogor, Indonesia2 Department of Community Nutrition, Faculty of Human Ecology, IPB University, Bogor, Indonesia
Corresponding author’s email: [email protected]
SUMMARY
Coconut is highly perishable; thus, it needs to be processed to prolong its shelf life. This study aimed to produce powdered coconut drink from coconut flesh and water. Eight samples were observed in triplicate. Coconut water from younger fruits was sweeter and the flesh was thinner. Meanwhile, older coconuts, especially from the tall va-riety, had higher dietary fibre (8.70 – 48.40 %) and lower available carbohydrate (20.08 – 73.45 %). This study has shown that powdered coconut drink from mature coconuts of tall variety could be considered for consumers needing higher fibre intake.
Keywords: Cocos nucifera, Freeze drying, Hybrid variety, Maturity age, Tall variety.
INTRODUCTION
Coconut is rich in fibre and has a positive effect on health. Consumption of coconut fibre has been related to decreased incidence of several non-communicable diseases due to its beneficial effects, such as low glycaemic index, reduced weight gain, and reduced total serum and LDL cholesterol as well as triglycerides (1). Unfortunately, coconut flesh and water are highly perishable due to its high nutrient content and near neutral pH. Attempts to prolong their shelf life through various processing methods have been applied. Freeze drying can help produce powdered coconut drink with relatively similar characteristics to the fresh one. This study aimed to produce powdered coconut drink made from mixture of coconut flesh and water coming from different maturity ages and coconut cultivars.
MATERIALS AND METHODS
Hybrid and tall coconut varieties with two maturity ages (4 and 6 months) were collected from the farm of PT Perkebunan Nusantara (PTPN) VIII Indonesia. Eight samples were observed from mixture of coconut water and flesh were prepared with a ratio of 2:1 and it was lyophilised according to pre-set conditions. Samples were observed for their physical and chemical characteristics such as dietary fibre (2), available carbohydrate, and calorie content. All chemical reagents used in this study were of analytical grade. Data were reported as the mean of three replicates and expressed as average ± SD. Statistical significance was determined using one-way
ANOVA and differences among samples were analysed with Tukey’s test (P< 0.05).
RESULTS AND DISCUSSION
Coconut fruits from hybrid variety tend to be oblong in shape, while those from tall variety had round shape (Fig. 1). Younger coconut fruits have sweeter water that starts to carbonate the older it gets. In terms of coconut flesh, younger coconuts contain whitish flesh with some slightly transparent part; meanwhile, the older ones have thicker flesh with slight mucous layer, making it more preferred by consumers for fresh consumption (3).
Figure 1: Appearance of fresh coconut samples: 4 month-old hybrid variety (A), 6 month-old hybrid variety (B), 4 month-old tall variety (C) and 6 month-old tall variety (D) from the outer (top) and inner (bottom) part
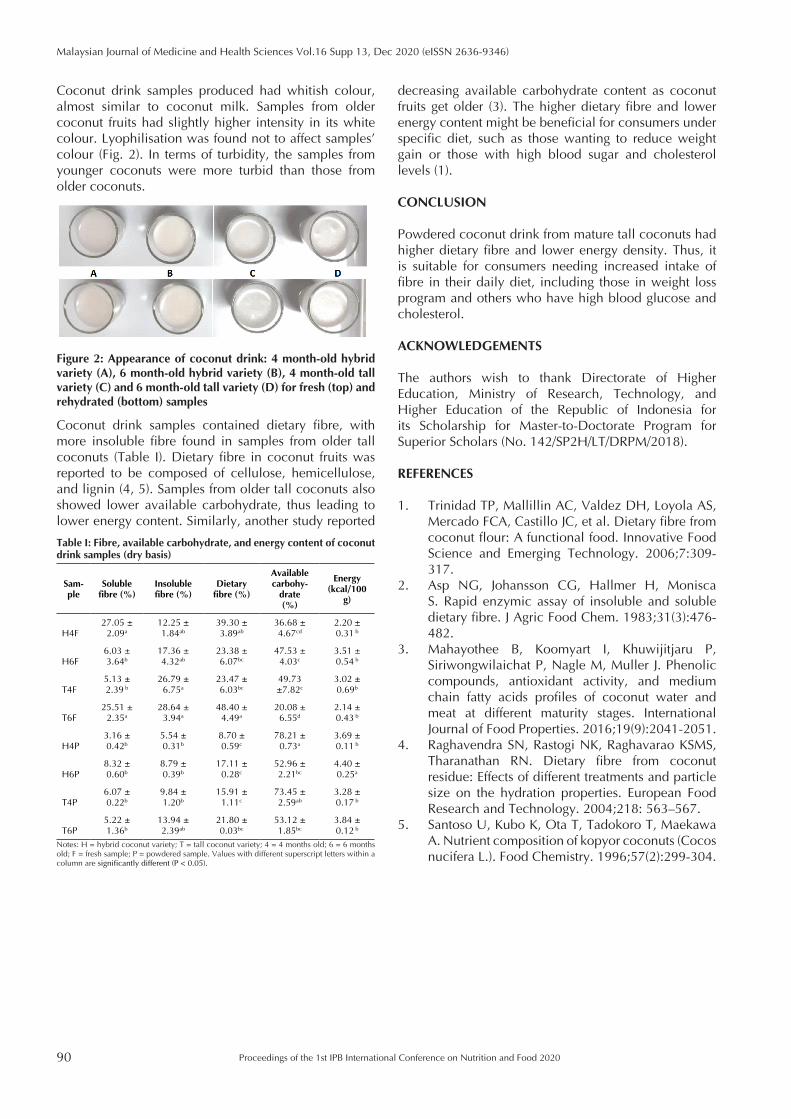
90
Malaysian Journal of Medicine and Health Sciences Vol.16 Supp 13, Dec 2020 (eISSN 2636-9346)
Proceedings of the 1st IPB International Conference on Nutrition and Food 2020
decreasing available carbohydrate content as coconut fruits get older (3). The higher dietary fibre and lower energy content might be beneficial for consumers under specific diet, such as those wanting to reduce weight gain or those with high blood sugar and cholesterol levels (1).
CONCLUSION
Powdered coconut drink from mature tall coconuts had higher dietary fibre and lower energy density. Thus, it is suitable for consumers needing increased intake of fibre in their daily diet, including those in weight loss program and others who have high blood glucose and cholesterol.
ACKNOWLEDGEMENTS
The authors wish to thank Directorate of Higher Education, Ministry of Research, Technology, and Higher Education of the Republic of Indonesia for its Scholarship for Master-to-Doctorate Program for Superior Scholars (No. 142/SP2H/LT/DRPM/2018).
REFERENCES
1. Trinidad TP, Mallillin AC, Valdez DH, Loyola AS, Mercado FCA, Castillo JC, et al. Dietary fibre from coconut flour: A functional food. Innovative Food Science and Emerging Technology. 2006;7:309-317.
2. Asp NG, Johansson CG, Hallmer H, Monisca S. Rapid enzymic assay of insoluble and soluble dietary fibre. J Agric Food Chem. 1983;31(3):476-482.
3. Mahayothee B, Koomyart I, Khuwijitjaru P, Siriwongwilaichat P, Nagle M, Muller J. Phenolic compounds, antioxidant activity, and medium chain fatty acids profiles of coconut water and meat at different maturity stages. International Journal of Food Properties. 2016;19(9):2041-2051.
4. Raghavendra SN, Rastogi NK, Raghavarao KSMS, Tharanathan RN. Dietary fibre from coconut residue: Effects of different treatments and particle size on the hydration properties. European Food Research and Technology. 2004;218: 563–567.
5. Santoso U, Kubo K, Ota T, Tadokoro T, Maekawa A. Nutrient composition of kopyor coconuts (Cocos nucifera L.). Food Chemistry. 1996;57(2):299-304.
Coconut drink samples produced had whitish colour, almost similar to coconut milk. Samples from older coconut fruits had slightly higher intensity in its white colour. Lyophilisation was found not to affect samples’ colour (Fig. 2). In terms of turbidity, the samples from younger coconuts were more turbid than those from older coconuts.
Figure 2: Appearance of coconut drink: 4 month-old hybrid variety (A), 6 month-old hybrid variety (B), 4 month-old tall variety (C) and 6 month-old tall variety (D) for fresh (top) and rehydrated (bottom) samples
Coconut drink samples contained dietary fibre, with more insoluble fibre found in samples from older tall coconuts (Table I). Dietary fibre in coconut fruits was reported to be composed of cellulose, hemicellulose, and lignin (4, 5). Samples from older tall coconuts also showed lower available carbohydrate, thus leading to lower energy content. Similarly, another study reported
Table I: Fibre, available carbohydrate, and energy content of coconut drink samples (dry basis)
Sam-ple
Soluble fibre (%)
Insoluble fibre (%)
Dietary fibre (%)
Availablecarbohy-
drate(%)
Energy(kcal/100
g)
H4F 27.05 ±
2.09a
12.25 ± 1.84ab
39.30 ± 3.89ab
36.68 ± 4.67cd
2.20 ± 0.31 b
H6F 6.03 ± 3.64b
17.36 ± 4.32ab
23.38 ± 6.07bc
47.53 ± 4.03c
3.51 ± 0.54 b
T4F 5.13 ± 2.39 b
26.79 ± 6.75a
23.47 ± 6.03bc
49.73 ±7.82c
3.02 ± 0.69b
T6F25.51 ±
2.35a
28.64 ± 3.94a
48.40 ± 4.49a
20.08 ± 6.55d
2.14 ± 0.43 b
H4P 3.16 ± 0.42b
5.54 ± 0.31b
8.70 ± 0.59c
78.21 ± 0.73a
3.69 ± 0.11 b
H6P 8.32 ± 0.60b
8.79 ± 0.39b
17.11 ± 0.28c
52.96 ± 2.21bc
4.40 ± 0.25a
T4P6.07 ± 0.22b
9.84 ± 1.20b
15.91 ± 1.11c
73.45 ± 2.59ab
3.28 ± 0.17 b
T6P 5.22 ± 1.36b
13.94 ± 2.39ab
21.80 ± 0.03bc
53.12 ± 1.85bc
3.84 ± 0.12 b
Notes: H = hybrid coconut variety; T = tall coconut variety; 4 = 4 months old; 6 = 6 months old; F = fresh sample; P = powdered sample. Values with different superscript letters within a column are significantly different (P < 0.05).
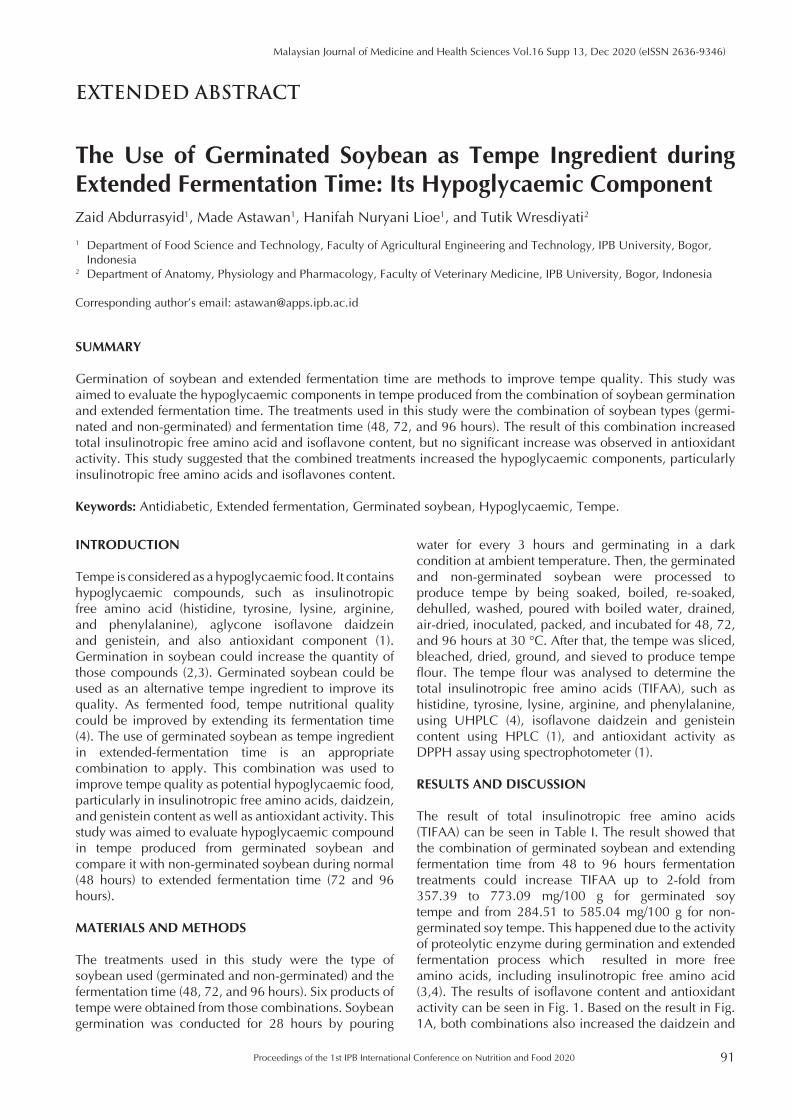
Proceedings of the 1st IPB International Conference on Nutrition and Food 2020 91
Malaysian Journal of Medicine and Health Sciences Vol.16 Supp 13, Dec 2020 (eISSN 2636-9346)
EXTENDED ABSTRACT
The Use of Germinated Soybean as Tempe Ingredient during Extended Fermentation Time: Its Hypoglycaemic Component Zaid Abdurrasyid1, Made Astawan1, Hanifah Nuryani Lioe1, and Tutik Wresdiyati2
1 Department of Food Science and Technology, Faculty of Agricultural Engineering and Technology, IPB University, Bogor, Indonesia
2 Department of Anatomy, Physiology and Pharmacology, Faculty of Veterinary Medicine, IPB University, Bogor, Indonesia
Corresponding author’s email: [email protected]
SUMMARY
Germination of soybean and extended fermentation time are methods to improve tempe quality. This study was aimed to evaluate the hypoglycaemic components in tempe produced from the combination of soybean germination and extended fermentation time. The treatments used in this study were the combination of soybean types (germi-nated and non-germinated) and fermentation time (48, 72, and 96 hours). The result of this combination increased total insulinotropic free amino acid and isoflavone content, but no significant increase was observed in antioxidant activity. This study suggested that the combined treatments increased the hypoglycaemic components, particularly insulinotropic free amino acids and isoflavones content.
Keywords: Antidiabetic, Extended fermentation, Germinated soybean, Hypoglycaemic, Tempe.
INTRODUCTION
Tempe is considered as a hypoglycaemic food. It contains hypoglycaemic compounds, such as insulinotropic free amino acid (histidine, tyrosine, lysine, arginine, and phenylalanine), aglycone isoflavone daidzein and genistein, and also antioxidant component (1). Germination in soybean could increase the quantity of those compounds (2,3). Germinated soybean could be used as an alternative tempe ingredient to improve its quality. As fermented food, tempe nutritional quality could be improved by extending its fermentation time (4). The use of germinated soybean as tempe ingredient in extended-fermentation time is an appropriate combination to apply. This combination was used to improve tempe quality as potential hypoglycaemic food, particularly in insulinotropic free amino acids, daidzein, and genistein content as well as antioxidant activity. This study was aimed to evaluate hypoglycaemic compound in tempe produced from germinated soybean and compare it with non-germinated soybean during normal (48 hours) to extended fermentation time (72 and 96 hours).
MATERIALS AND METHODS
The treatments used in this study were the type of soybean used (germinated and non-germinated) and the fermentation time (48, 72, and 96 hours). Six products of tempe were obtained from those combinations. Soybean germination was conducted for 28 hours by pouring
water for every 3 hours and germinating in a dark condition at ambient temperature. Then, the germinated and non-germinated soybean were processed to produce tempe by being soaked, boiled, re-soaked, dehulled, washed, poured with boiled water, drained, air-dried, inoculated, packed, and incubated for 48, 72, and 96 hours at 30 °C. After that, the tempe was sliced, bleached, dried, ground, and sieved to produce tempe flour. The tempe flour was analysed to determine the total insulinotropic free amino acids (TIFAA), such as histidine, tyrosine, lysine, arginine, and phenylalanine, using UHPLC (4), isoflavone daidzein and genistein content using HPLC (1), and antioxidant activity as DPPH assay using spectrophotometer (1).
RESULTS AND DISCUSSION
The result of total insulinotropic free amino acids (TIFAA) can be seen in Table I. The result showed that the combination of germinated soybean and extending fermentation time from 48 to 96 hours fermentation treatments could increase TIFAA up to 2-fold from 357.39 to 773.09 mg/100 g for germinated soy tempe and from 284.51 to 585.04 mg/100 g for non-germinated soy tempe. This happened due to the activity of proteolytic enzyme during germination and extended fermentation process which resulted in more free amino acids, including insulinotropic free amino acid (3,4). The results of isoflavone content and antioxidant activity can be seen in Fig. 1. Based on the result in Fig. 1A, both combinations also increased the daidzein and
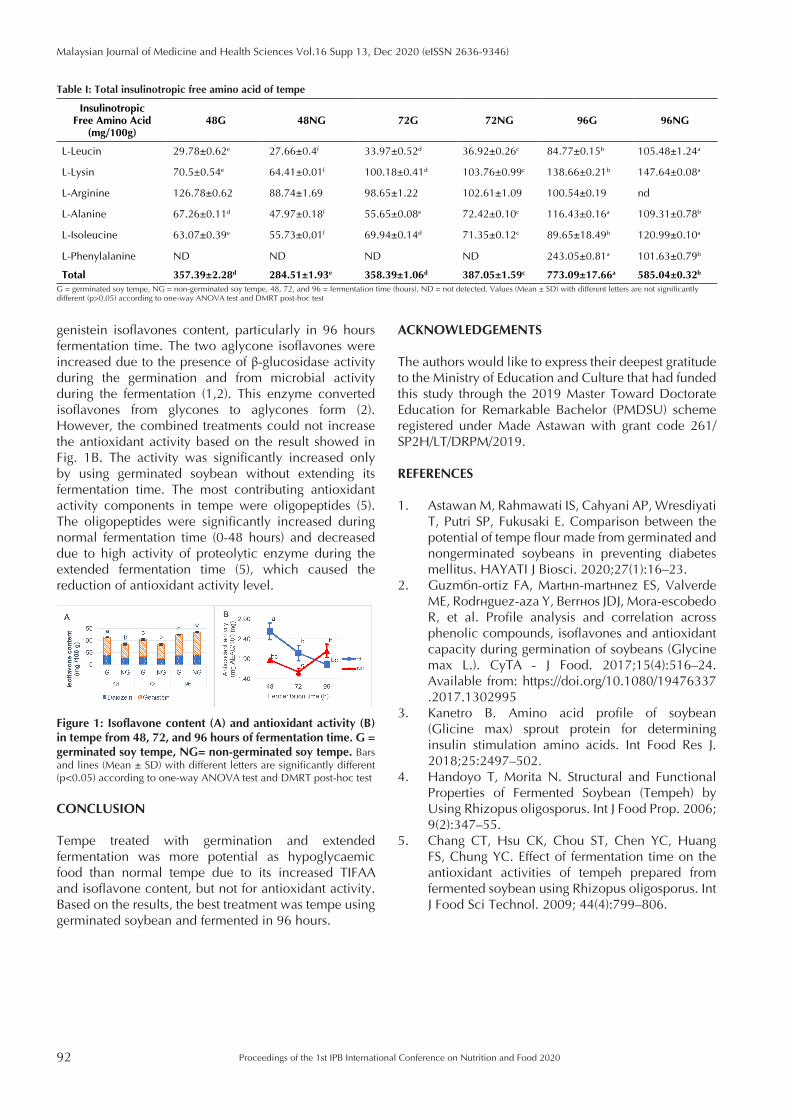
92
Malaysian Journal of Medicine and Health Sciences Vol.16 Supp 13, Dec 2020 (eISSN 2636-9346)
Proceedings of the 1st IPB International Conference on Nutrition and Food 2020
ACKNOWLEDGEMENTS
The authors would like to express their deepest gratitude to the Ministry of Education and Culture that had funded this study through the 2019 Master Toward Doctorate Education for Remarkable Bachelor (PMDSU) scheme registered under Made Astawan with grant code 261/SP2H/LT/DRPM/2019.
REFERENCES
1. Astawan M, Rahmawati IS, Cahyani AP, Wresdiyati T, Putri SP, Fukusaki E. Comparison between the potential of tempe flour made from germinated and nongerminated soybeans in preventing diabetes mellitus. HAYATI J Biosci. 2020;27(1):16–23.
2. Guzmán-ortiz FA, Martín-martínez ES, Valverde ME, Rodríguez-aza Y, Berríos JDJ, Mora-escobedo R, et al. Profile analysis and correlation across phenolic compounds, isoflavones and antioxidant capacity during germination of soybeans (Glycine max L.). CyTA - J Food. 2017;15(4):516–24. Available from: https://doi.org/10.1080/19476337.2017.1302995
3. Kanetro B. Amino acid profile of soybean (Glicine max) sprout protein for determining insulin stimulation amino acids. Int Food Res J. 2018;25:2497–502.
4. Handoyo T, Morita N. Structural and Functional Properties of Fermented Soybean (Tempeh) by Using Rhizopus oligosporus. Int J Food Prop. 2006; 9(2):347–55.
5. Chang CT, Hsu CK, Chou ST, Chen YC, Huang FS, Chung YC. Effect of fermentation time on the antioxidant activities of tempeh prepared from fermented soybean using Rhizopus oligosporus. Int J Food Sci Technol. 2009; 44(4):799–806.
Figure 1: Isoflavone content (A) and antioxidant activity (B) in tempe from 48, 72, and 96 hours of fermentation time. G = germinated soy tempe, NG= non-germinated soy tempe. Bars and lines (Mean ± SD) with different letters are significantly different (p<0.05) according to one-way ANOVA test and DMRT post-hoc test
genistein isoflavones content, particularly in 96 hours fermentation time. The two aglycone isoflavones were increased due to the presence of β-glucosidase activity during the germination and from microbial activity during the fermentation (1,2). This enzyme converted isoflavones from glycones to aglycones form (2). However, the combined treatments could not increase the antioxidant activity based on the result showed in Fig. 1B. The activity was significantly increased only by using germinated soybean without extending its fermentation time. The most contributing antioxidant activity components in tempe were oligopeptides (5). The oligopeptides were significantly increased during normal fermentation time (0-48 hours) and decreased due to high activity of proteolytic enzyme during the extended fermentation time (5), which caused the reduction of antioxidant activity level.
Table I: Total insulinotropic free amino acid of tempe
Insulinotropic Free Amino Acid
(mg/100g)48G 48NG 72G 72NG 96G 96NG
L-Leucin 29.78±0.62e 27.66±0.4f 33.97±0.52d 36.92±0.26c 84.77±0.15b 105.48±1.24a
L-Lysin 70.5±0.54e 64.41±0.01f 100.18±0.41d 103.76±0.99c 138.66±0.21b 147.64±0.08a
L-Arginine 126.78±0.62 88.74±1.69 98.65±1.22 102.61±1.09 100.54±0.19 nd
L-Alanine 67.26±0.11d 47.97±0.18f 55.65±0.08e 72.42±0.10c 116.43±0.16a 109.31±0.78b
L-Isoleucine 63.07±0.39e 55.73±0.01f 69.94±0.14d 71.35±0.12c 89.65±18.49b 120.99±0.10a
L-Phenylalanine ND ND ND ND 243.05±0.81a 101.63±0.79b
Total 357.39±2.28d 284.51±1.93e 358.39±1.06d 387.05±1.59c 773.09±17.66a 585.04±0.32b
G = germinated soy tempe, NG = non-germinated soy tempe, 48, 72, and 96 = fermentation time (hours), ND = not detected. Values (Mean ± SD) with different letters are not significantly different (p>0.05) according to one-way ANOVA test and DMRT post-hoc test
CONCLUSION
Tempe treated with germination and extended fermentation was more potential as hypoglycaemic food than normal tempe due to its increased TIFAA and isoflavone content, but not for antioxidant activity. Based on the results, the best treatment was tempe using germinated soybean and fermented in 96 hours.
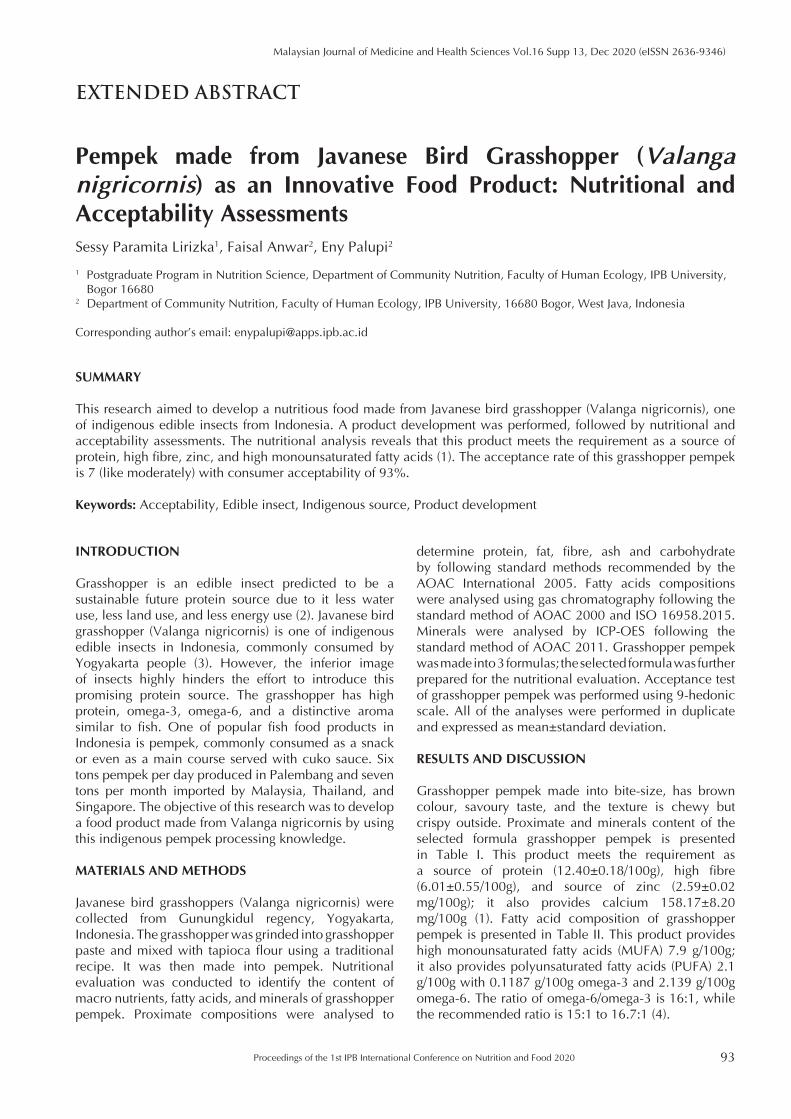
Proceedings of the 1st IPB International Conference on Nutrition and Food 2020 93
Malaysian Journal of Medicine and Health Sciences Vol.16 Supp 13, Dec 2020 (eISSN 2636-9346)
EXTENDED ABSTRACT
Pempek made from Javanese Bird Grasshopper (Valanga nigricornis) as an Innovative Food Product: Nutritional and Acceptability Assessments Sessy Paramita Lirizka1, Faisal Anwar2, Eny Palupi2
1 Postgraduate Program in Nutrition Science, Department of Community Nutrition, Faculty of Human Ecology, IPB University, Bogor 16680
2 Department of Community Nutrition, Faculty of Human Ecology, IPB University, 16680 Bogor, West Java, Indonesia
Corresponding author’s email: [email protected]
SUMMARY
This research aimed to develop a nutritious food made from Javanese bird grasshopper (Valanga nigricornis), one of indigenous edible insects from Indonesia. A product development was performed, followed by nutritional and acceptability assessments. The nutritional analysis reveals that this product meets the requirement as a source of protein, high fibre, zinc, and high monounsaturated fatty acids (1). The acceptance rate of this grasshopper pempek is 7 (like moderately) with consumer acceptability of 93%.
Keywords: Acceptability, Edible insect, Indigenous source, Product development
INTRODUCTION
Grasshopper is an edible insect predicted to be a sustainable future protein source due to it less water use, less land use, and less energy use (2). Javanese bird grasshopper (Valanga nigricornis) is one of indigenous edible insects in Indonesia, commonly consumed by Yogyakarta people (3). However, the inferior image of insects highly hinders the effort to introduce this promising protein source. The grasshopper has high protein, omega-3, omega-6, and a distinctive aroma similar to fish. One of popular fish food products in Indonesia is pempek, commonly consumed as a snack or even as a main course served with cuko sauce. Six tons pempek per day produced in Palembang and seven tons per month imported by Malaysia, Thailand, and Singapore. The objective of this research was to develop a food product made from Valanga nigricornis by using this indigenous pempek processing knowledge.
MATERIALS AND METHODS
Javanese bird grasshoppers (Valanga nigricornis) were collected from Gunungkidul regency, Yogyakarta, Indonesia. The grasshopper was grinded into grasshopper paste and mixed with tapioca flour using a traditional recipe. It was then made into pempek. Nutritional evaluation was conducted to identify the content of macro nutrients, fatty acids, and minerals of grasshopper pempek. Proximate compositions were analysed to
determine protein, fat, fibre, ash and carbohydrate by following standard methods recommended by the AOAC International 2005. Fatty acids compositions were analysed using gas chromatography following the standard method of AOAC 2000 and ISO 16958.2015. Minerals were analysed by ICP-OES following the standard method of AOAC 2011. Grasshopper pempek was made into 3 formulas; the selected formula was further prepared for the nutritional evaluation. Acceptance test of grasshopper pempek was performed using 9-hedonic scale. All of the analyses were performed in duplicate and expressed as mean±standard deviation.
RESULTS AND DISCUSSION
Grasshopper pempek made into bite-size, has brown colour, savoury taste, and the texture is chewy but crispy outside. Proximate and minerals content of the selected formula grasshopper pempek is presented in Table I. This product meets the requirement as a source of protein (12.40±0.18/100g), high fibre (6.01±0.55/100g), and source of zinc (2.59±0.02 mg/100g); it also provides calcium 158.17±8.20 mg/100g (1). Fatty acid composition of grasshopper pempek is presented in Table II. This product provides high monounsaturated fatty acids (MUFA) 7.9 g/100g; it also provides polyunsaturated fatty acids (PUFA) 2.1 g/100g with 0.1187 g/100g omega-3 and 2.139 g/100g omega-6. The ratio of omega-6/omega-3 is 16:1, while the recommended ratio is 15:1 to 16.7:1 (4).

94
Malaysian Journal of Medicine and Health Sciences Vol.16 Supp 13, Dec 2020 (eISSN 2636-9346)
Proceedings of the 1st IPB International Conference on Nutrition and Food 2020
Consumer test which involved 74 panellists was performed. The consumer acceptability of grasshopper pempek reached 93%. The result of the consumer test demonstrates that that food product has a positive impact on consumer willingness to purchase the product (5). Acceptance rate of grasshopper pempek is 7 (like moderately from the 9-point hedonic scale).
CONCLUSION
Acceptance rate of grasshopper pempek (Valanga nigricornis) is 7 hedonic score (like moderately) and reaches consumer acceptability until 93%. This pempek is able to provide protein and zinc, high fibre and MUFA. Further research on its potential allergen, safety, shelf life and sustainable food processing should be done, especially for the next improvement.
REFERENCES
1. European Commission. Nutrition and Health Claims [Internet]. Belgium: European Commission; 2020 [cited 2020 September 11]. Available from: https://ec.europa.eu/food/safety/claims_en
2. Van Huis A, Oonincx D. The environmental sustainability of insects as food and feed: A review. Trends Food Sci Technol. 2017;107:37-43
3. Palupi E, Anwar F, Tanziha I, Gunawan MA. Forgotten fringe-food for future protein source: A
Table I: Proximate and minerals composition of grasshopper pem-pek
Components % Dry Matter (DM)
Moisture (% WB) 45.47±0.13
Protein 12.40±0.18
Fat 13.64±0.24
Fibre 6.01±0.55
Carbohydrate 26.07±0.62
Ash 2.45±0.01
Calcium (mg/100 g) 158.17±8.20
Iron (mg/100 g) 2.62±0.24
Zinc (mg/100 g) 2.59±0.02
Table II: Fatty acid composition of grasshopper pempek
Fatty acid Lipid Numbers g/100 g DM
Docosahexaenoic C22:6n3 0.008
Eicosapentaenoic C22:5n3 0.014
Arachidonic C20:4n6 0.036
Eruic C22:1n9 0
Eicosapentaenoic C20:3n6 0.004
Linoleic C18:2n6c 0.134
Linolenic C18:3n3 2.039
Eicosanoic C20:1 0.052
C-oleic C18:1 7.935
Heptadecanoic C17:1 0.008
Palmitoleic C16:1 0.103
lignoceric C24:0 0.014
Tricosanoic C23:0 0.002
Eicosanoic C20:0 0.062
Stearic C18:0 0.851
Margaric C17:0 0.020
Palmitic C16:0 2.173
Pentadecylic C15:0 0.008
Myristic C14:0 0.144
Tridecylic C13:0 0
Lauric C12:0 0.024
SFA 3.303
MUFA 8.101
PUFA 2.235
n-3 0.153
n-6 2.078
study among households in a food-insecure area of Gunungkidul, Yogyakarta. Biodiversitas Journal or Biological Diversity. 2020;288:44-45
4. Simopoulos AP. The importance of the ratio of omega-6/omega-3 essential fatty acids. Biomed Pharmacother. 2002;8:56-79.
5. Stefani G, Romano D, Cavicchi A. Consumer expectations, liking and willingness to pay for specialty foods: Do sensory characteristic tell the whole story? Food Qual. 2006; 17:53-62.
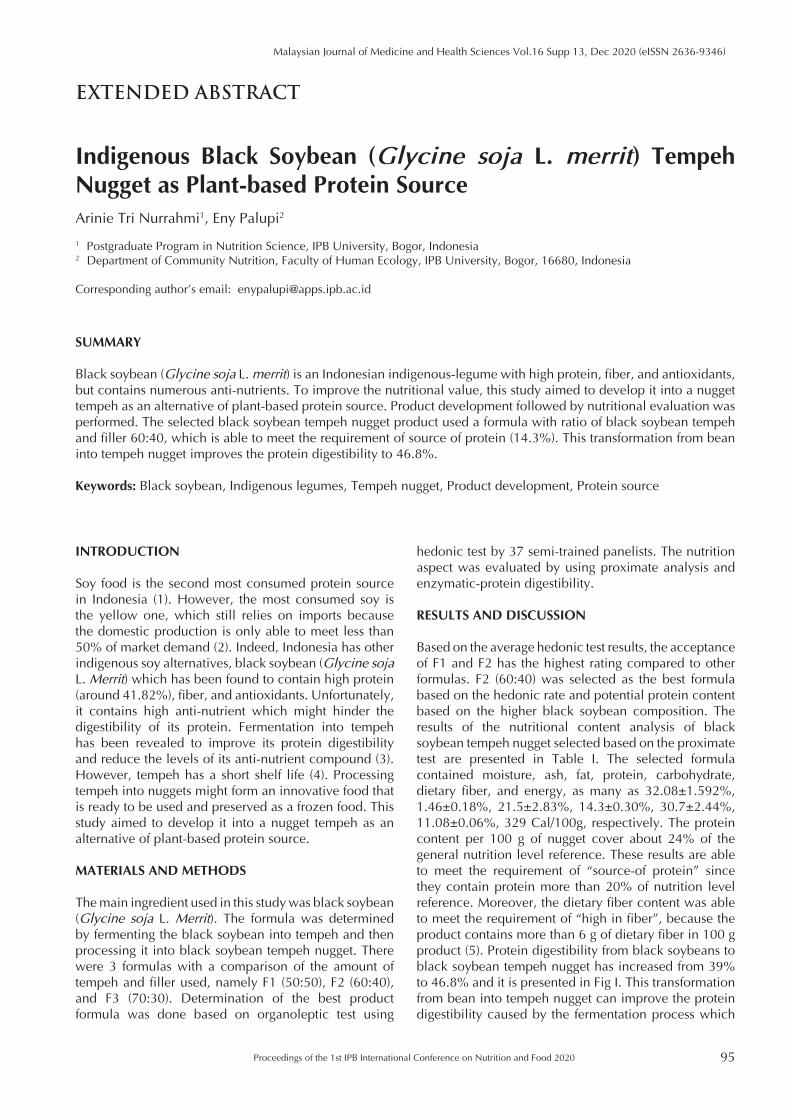
Proceedings of the 1st IPB International Conference on Nutrition and Food 2020 95
Malaysian Journal of Medicine and Health Sciences Vol.16 Supp 13, Dec 2020 (eISSN 2636-9346)
EXTENDED ABSTRACT
Indigenous Black Soybean (Glycine soja L. merrit) Tempeh Nugget as Plant-based Protein Source Arinie Tri Nurrahmi1, Eny Palupi2
1 Postgraduate Program in Nutrition Science, IPB University, Bogor, Indonesia2 Department of Community Nutrition, Faculty of Human Ecology, IPB University, Bogor, 16680, Indonesia
Corresponding author’s email: [email protected]
SUMMARY
Black soybean (Glycine soja L. merrit) is an Indonesian indigenous-legume with high protein, fiber, and antioxidants, but contains numerous anti-nutrients. To improve the nutritional value, this study aimed to develop it into a nugget tempeh as an alternative of plant-based protein source. Product development followed by nutritional evaluation was performed. The selected black soybean tempeh nugget product used a formula with ratio of black soybean tempeh and filler 60:40, which is able to meet the requirement of source of protein (14.3%). This transformation from bean into tempeh nugget improves the protein digestibility to 46.8%.
Keywords: Black soybean, Indigenous legumes, Tempeh nugget, Product development, Protein source
INTRODUCTION
Soy food is the second most consumed protein source in Indonesia (1). However, the most consumed soy is the yellow one, which still relies on imports because the domestic production is only able to meet less than 50% of market demand (2). Indeed, Indonesia has other indigenous soy alternatives, black soybean (Glycine soja L. Merrit) which has been found to contain high protein (around 41.82%), fiber, and antioxidants. Unfortunately, it contains high anti-nutrient which might hinder the digestibility of its protein. Fermentation into tempeh has been revealed to improve its protein digestibility and reduce the levels of its anti-nutrient compound (3). However, tempeh has a short shelf life (4). Processing tempeh into nuggets might form an innovative food that is ready to be used and preserved as a frozen food. This study aimed to develop it into a nugget tempeh as an alternative of plant-based protein source.
MATERIALS AND METHODS
The main ingredient used in this study was black soybean (Glycine soja L. Merrit). The formula was determined by fermenting the black soybean into tempeh and then processing it into black soybean tempeh nugget. There were 3 formulas with a comparison of the amount of tempeh and filler used, namely F1 (50:50), F2 (60:40), and F3 (70:30). Determination of the best product formula was done based on organoleptic test using
hedonic test by 37 semi-trained panelists. The nutrition aspect was evaluated by using proximate analysis and enzymatic-protein digestibility.
RESULTS AND DISCUSSION
Based on the average hedonic test results, the acceptance of F1 and F2 has the highest rating compared to other formulas. F2 (60:40) was selected as the best formula based on the hedonic rate and potential protein content based on the higher black soybean composition. The results of the nutritional content analysis of black soybean tempeh nugget selected based on the proximate test are presented in Table I. The selected formula contained moisture, ash, fat, protein, carbohydrate, dietary fiber, and energy, as many as 32.08±1.592%, 1.46±0.18%, 21.5±2.83%, 14.3±0.30%, 30.7±2.44%, 11.08±0.06%, 329 Cal/100g, respectively. The protein content per 100 g of nugget cover about 24% of the general nutrition level reference. These results are able to meet the requirement of “source-of protein” since they contain protein more than 20% of nutrition level reference. Moreover, the dietary fiber content was able to meet the requirement of “high in fiber”, because the product contains more than 6 g of dietary fiber in 100 g product (5). Protein digestibility from black soybeans to black soybean tempeh nugget has increased from 39% to 46.8% and it is presented in Fig I. This transformation from bean into tempeh nugget can improve the protein digestibility caused by the fermentation process which
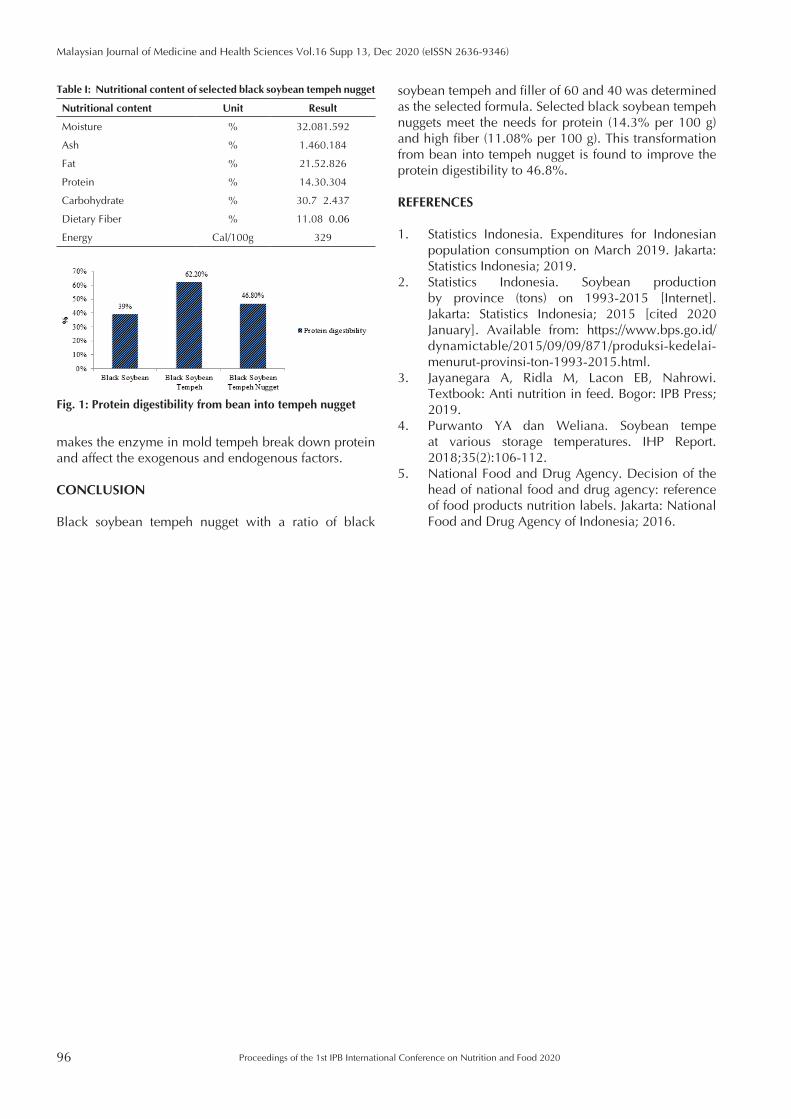
96
Malaysian Journal of Medicine and Health Sciences Vol.16 Supp 13, Dec 2020 (eISSN 2636-9346)
Proceedings of the 1st IPB International Conference on Nutrition and Food 2020
makes the enzyme in mold tempeh break down protein and affect the exogenous and endogenous factors.
CONCLUSION
Black soybean tempeh nugget with a ratio of black
soybean tempeh and filler of 60 and 40 was determined as the selected formula. Selected black soybean tempeh nuggets meet the needs for protein (14.3% per 100 g) and high fiber (11.08% per 100 g). This transformation from bean into tempeh nugget is found to improve the protein digestibility to 46.8%.
REFERENCES
1. Statistics Indonesia. Expenditures for Indonesian population consumption on March 2019. Jakarta: Statistics Indonesia; 2019.
2. Statistics Indonesia. Soybean production by province (tons) on 1993-2015 [Internet]. Jakarta: Statistics Indonesia; 2015 [cited 2020 January]. Available from: https://www.bps.go.id/dynamictable/2015/09/09/871/produksi-kedelai-menurut-provinsi-ton-1993-2015.html.
3. Jayanegara A, Ridla M, Lacon EB, Nahrowi. Textbook: Anti nutrition in feed. Bogor: IPB Press; 2019.
4. Purwanto YA dan Weliana. Soybean tempe at various storage temperatures. IHP Report. 2018;35(2):106-112.
5. National Food and Drug Agency. Decision of the head of national food and drug agency: reference of food products nutrition labels. Jakarta: National Food and Drug Agency of Indonesia; 2016.
Table I: Nutritional content of selected black soybean tempeh nugget
Nutritional content Unit Result
Moisture % 32.081.592
Ash % 1.460.184
Fat % 21.52.826
Protein % 14.30.304
Carbohydrate % 30.7 2.437
Dietary Fiber % 11.08 0.06
Energy Cal/100g 329
Fig. 1: Protein digestibility from bean into tempeh nugget
Proceedings of the 1st IPB International Conference on Nutrition and Food 2020 97
Malaysian Journal of Medicine and Health Sciences Vol.16 Supp 13, Dec 2020 (eISSN 2636-9346)
EXTENDED ABSTRACT
Development of Roll Cake from Rice-bran Flour Mixed with Taro Flour and Breadfruit Flour for the Elderly Alifia Irfani, Ahmad Sulaeman, Umi Faza Rokhmah
Department of Community Nutrition, Faculty of Human Ecology, IPB University, Jl. Raya Dramaga Kampus IPB Dramaga, Bogor, West Java, Indonesia 16680
Corresponding author’s email: [email protected]
SUMMARY
Elderly is a group susceptible to malnutrition due to insufficient and poor diet. Commonly, they had various age-re-lated health problems including constipation. The aim of this study was to create roll cake from a mixture of rice-bran, taro, and breadfruit flour as fiber-rich food products. This study was an experimental study using completely randomized design. The highest dietary fiber and lowest fat content were found in roll cake produced from a com-bination of rice-bran and breadfruit flour. The roll cake could be an alternative nutritious product for supplying suf-ficient energy and preventing constipation in the elderly.
Keywords: Breadfruit, Elderly, Fiber, Rice-bran flour, Roll cake
INTRODUCTION
Aging is one phase that causes some changes in some aspects of human life. Inadequate and poor diet are common factors that trigger malnutrition in the elderly. Moreover, they also have digestive problems which involve constipation. Underweight and tooth loss were found in 28.3% and 24% of the elderly (1). Besides, constipation prevalence was relatively high in people aged above 60 years old (2). Hence, consumption of nutritious food is the first method for alleviating their health problems. However, food for the elderly should consider not only its nutrients but also consistency for adjusting their physiological changes (3). A previous study indicated that flour processed from rice-bran, taro, and breadfruits contains high dietary fiber and energy that can be utilized to develop food products for the elderly (4,5). This study aimed to produce roll cake from a mixture of three flours (rice bran, taro, and breadfruit flour) which is abundant of fiber for elder people.
MATERIALS AND METHODS
The ingredients comprised rice-bran flour (RF), wheat flour (WF), breadfruit flour (BF), taro flour (TF), egg, sugar, oil, ovalet, salt, white butter, sweet condensed milk, and crushed peanut. The roll cake was prepared with various proportions of flours in preliminary study to develop palatable and fiber-rich products. F1 consisted of 50% RB and 50% WF, F2 40% RB and 60% TF, and F3 used 75% RB and 25% BF. The role cake was
produced with two replications. An acceptance test with hedonic scale was performed using six attributes and the products were preserved in two types with cream and without cream. Water and ash content were determined by gravimetric method, fat content by the Soxhlet method, protein content by Kjeldahl method, dietary fiber by Enzymatic method, and carbohydrate content by difference method. ANOVA and Duncan tests were used to analyze the difference (p< 0.05).
RESULTS AND DISCUSSION
Roll cake produced from mixture of rice-bran and breadfruit flour (F3) had the greatest score from hedonic test (Table I). The roll cake prepared with cream was more preferable than that without cream. Also, the least fat content and highest dietary fiber were performed in F3. Barber et al. (4) found that substitution up to 30% level of breadfruit flour decreased the fat content of cookies (Table II). Breadfruit provides an excellent source of calories, fiber, and phytochemicals. Similar to breadfruit flour, rice-brain flour also comprised high dietary fiber both soluble and insoluble fiber (5). Therefore, the addition of more rice-brain flour increased the higher fiber level in roll cake. Per serving size (100 g), roll cake of this study provided 19.5% energy, 11.2% carbohydrate, 41.9% fat, 10.5% protein, and 76.7% dietary fiber according to recommended dietary allowance (RDA) for the elderly (65-80 years old). This serving size was determined based on the maximum macronutrient content obtained from additional food
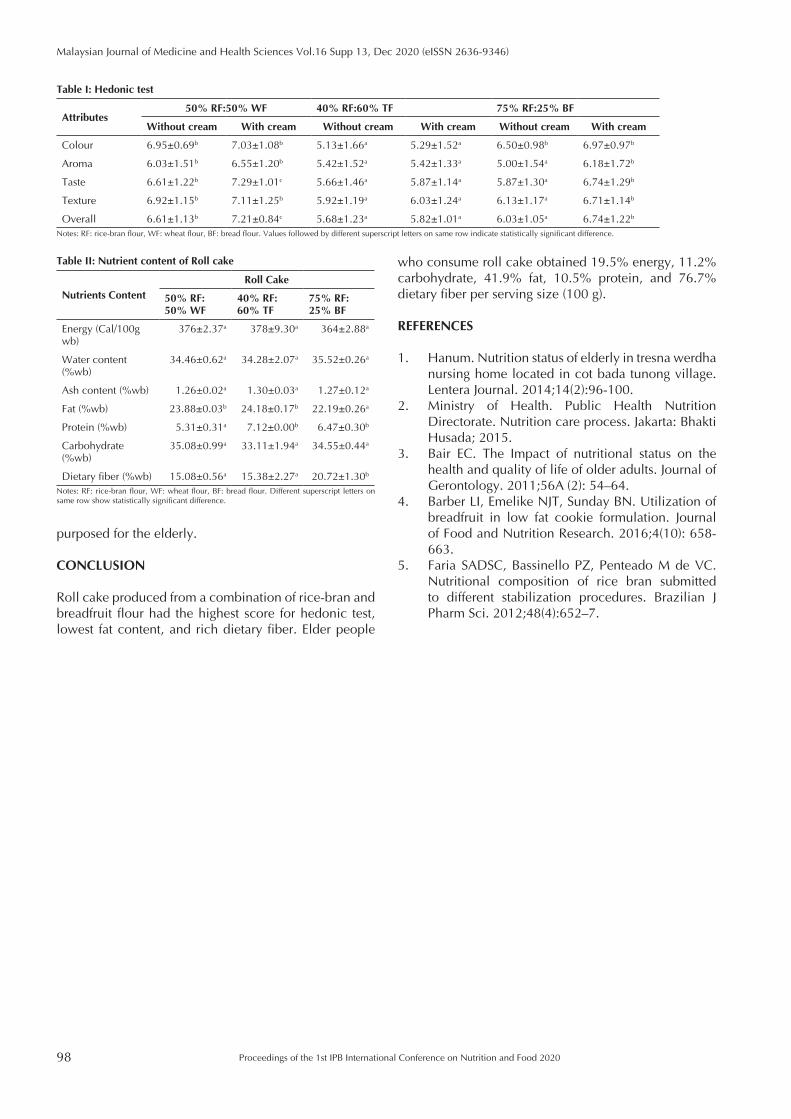
98
Malaysian Journal of Medicine and Health Sciences Vol.16 Supp 13, Dec 2020 (eISSN 2636-9346)
Proceedings of the 1st IPB International Conference on Nutrition and Food 2020
purposed for the elderly.
CONCLUSION
Roll cake produced from a combination of rice-bran and breadfruit flour had the highest score for hedonic test, lowest fat content, and rich dietary fiber. Elder people
who consume roll cake obtained 19.5% energy, 11.2% carbohydrate, 41.9% fat, 10.5% protein, and 76.7% dietary fiber per serving size (100 g).
REFERENCES
1. Hanum. Nutrition status of elderly in tresna werdha nursing home located in cot bada tunong village. Lentera Journal. 2014;14(2):96-100.
2. Ministry of Health. Public Health Nutrition Directorate. Nutrition care process. Jakarta: Bhakti Husada; 2015.
3. Bair EC. The Impact of nutritional status on the health and quality of life of older adults. Journal of Gerontology. 2011;56A (2): 54–64.
4. Barber LI, Emelike NJT, Sunday BN. Utilization of breadfruit in low fat cookie formulation. Journal of Food and Nutrition Research. 2016;4(10): 658-663.
5. Faria SADSC, Bassinello PZ, Penteado M de VC. Nutritional composition of rice bran submitted to different stabilization procedures. Brazilian J Pharm Sci. 2012;48(4):652–7.
Table I: Hedonic test
Attributes50% RF:50% WF 40% RF:60% TF 75% RF:25% BF
Without cream With cream Without cream With cream Without cream With cream
Colour 6.95±0.69b 7.03±1.08b 5.13±1.66a 5.29±1.52a 6.50±0.98b 6.97±0.97b
Aroma 6.03±1.51b 6.55±1.20b 5.42±1.52a 5.42±1.33a 5.00±1.54a 6.18±1.72b
Taste 6.61±1.22b 7.29±1.01c 5.66±1.46a 5.87±1.14a 5.87±1.30a 6.74±1.29b
Texture 6.92±1.15b 7.11±1.25b 5.92±1.19a 6.03±1.24a 6.13±1.17a 6.71±1.14b
Overall 6.61±1.13b 7.21±0.84c 5.68±1.23a 5.82±1.01a 6.03±1.05a 6.74±1.22b
Notes: RF: rice-bran flour, WF: wheat flour, BF: bread flour. Values followed by different superscript letters on same row indicate statistically significant difference.
Table II: Nutrient content of Roll cake
Nutrients Content
Roll Cake
50% RF: 50% WF
40% RF: 60% TF
75% RF: 25% BF
Energy (Cal/100g wb)
376±2.37a 378±9.30a 364±2.88a
Water content (%wb)
34.46±0.62a 34.28±2.07a 35.52±0.26a
Ash content (%wb) 1.26±0.02a 1.30±0.03a 1.27±0.12a
Fat (%wb) 23.88±0.03b 24.18±0.17b 22.19±0.26a
Protein (%wb) 5.31±0.31a 7.12±0.00b 6.47±0.30b
Carbohydrate (%wb)
35.08±0.99a 33.11±1.94a 34.55±0.44a
Dietary fiber (%wb) 15.08±0.56a 15.38±2.27a 20.72±1.30b
Notes: RF: rice-bran flour, WF: wheat flour, BF: bread flour. Different superscript letters on same row show statistically significant difference.
Proceedings of the 1st IPB International Conference on Nutrition and Food 2020 99
Malaysian Journal of Medicine and Health Sciences Vol.16 Supp 13, Dec 2020 (eISSN 2636-9346)
EXTENDED ABSTRACT
Amino Acids, Calcium, and Zinc Contents of Spray-dried Balinese Cow Bone Marrow Encapsulated with Maltodextrin, Arabic Gum, and Milk Powder Umi Faza Rokhmah, Ahmad Sulaeman, Ikeu Ekayanti
Department of Community Nutrition, Faculty of Human Ecology, IPB University, Bogor 16680, Indonesia
Corresponding author’s email: [email protected]
SUMMARY
Balinese cow bone marrow is a by-product from cattle farms that contains abundant nutrients required during growth period. Due to its high lipid level, bone marrow is less soluble and contains low amino acid level. Encapsulation with appropriate coatings can protect the nutrients, enhance the solubility, and complete their nutrients level. This study aimed to analyze amino acids, calcium, and zinc content of Balinese cow bone marrow encapsulated by spray drying technique. It was coated with milk powder, Arabic gum, and maltodextrin. Balinese cow bone marrow en-capsulated only with milk powder had the highest amino acids, calcium, and zinc content.
Keywords: Balinese cow, Bone marrow, Coating materials, Microencapsulation, Spray dryer
INTRODUCTION
Balinese cow is one of local cows from Indonesia. The by-products from Balinese cow include bone marrow that has not been widely developed. Commonly, it is only processed as a soup or bone broth e.g. Kaledo in Central Sulawesi.It contains various essential lipids and micronutrients. A previous study proved that bone marrow improved fetal growth of mice during early life through stimulating growth hormone production (1). However, due to the high lipid content, it was less solubility and prone to oxidation. Thus, it requires advanced processes including encapsulation. Spray drying is the most applicable encapsulation method for high lipid ingredients such as bone marrow (2). A combination with proper coatings will optimize the protection as well as complete their nutrient content because it has low amino acid levels. This study aimed to analyze amino acids, calcium, and zinc content of Balinese cow bone marrow microcapsules processed by spray drying technique.
MATERIALS AND METHODS
The bone marrow of Balinese cow was obtained from Tapos abbatoir in Depok, Indonesia. In this study, the formulation was determined using trial and error method. There were four formulations based on the ratio of coatings. Formula I comprised only milk powder, whereas Formula II, III, and IV consisted of milk powder and maltodextrin 50%:50%; milk powder and Arabic
gum 50%:50%; and combination of milk powder, maltodextrin, Arabic gum 50%:25%:25%, respectively. Composition of bone marrow, coatings, and water was similar in all formulas (1:2:20). Encapsulation of bone marrow was carried out by spray-drying method. Briefly, the coatings and water were mixed using Homogenizer (26.000 rpm, 5 minutes), then added with the bone marrow and homogenized again (22.000 rpm, 6 minutes). After that, the bone marrow emulsion was dried using spray dryer (inlet temperature 180oC, and outlet temperature 80 oC). The differences were analyzed by ANOVA and Duncan test (p<0.05).
RESULTS AND DISCUSSION
According to the statistical analyses, the highest indispensable amino acid content was observed in Formula I (Figure 1). Thus, the highest amino acid was identified in formula coated by milk powder. Milk powder had 3.28 g/100g protein and rich in essential amino acids (3). It improved and completed amino acid level in Balinese bone marrow which only had 3% protein (1). Animal sources comprised high essential amino acids which has good digestibility. Adequate protein intake, particularly from animal sources, is necessary for supporting rapid fetal growth and development in early life (4).
There was a significant difference in calcium and zinc content within microcapsules (Table I). The formula made from milk powder only produced the highest
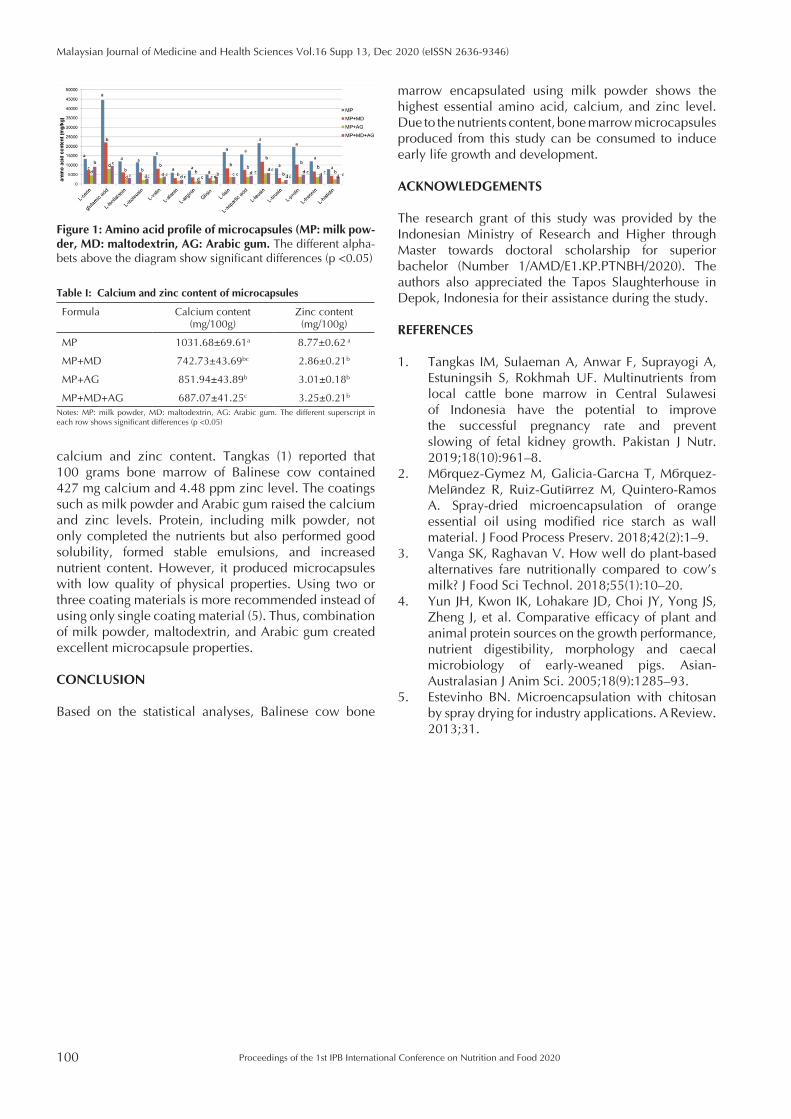
100
Malaysian Journal of Medicine and Health Sciences Vol.16 Supp 13, Dec 2020 (eISSN 2636-9346)
Proceedings of the 1st IPB International Conference on Nutrition and Food 2020
calcium and zinc content. Tangkas (1) reported that 100 grams bone marrow of Balinese cow contained 427 mg calcium and 4.48 ppm zinc level. The coatings such as milk powder and Arabic gum raised the calcium and zinc levels. Protein, including milk powder, not only completed the nutrients but also performed good solubility, formed stable emulsions, and increased nutrient content. However, it produced microcapsules with low quality of physical properties. Using two or three coating materials is more recommended instead of using only single coating material (5). Thus, combination of milk powder, maltodextrin, and Arabic gum created excellent microcapsule properties.
CONCLUSION
Based on the statistical analyses, Balinese cow bone
marrow encapsulated using milk powder shows the highest essential amino acid, calcium, and zinc level. Due to the nutrients content, bone marrow microcapsules produced from this study can be consumed to induce early life growth and development.
ACKNOWLEDGEMENTS
The research grant of this study was provided by the Indonesian Ministry of Research and Higher through Master towards doctoral scholarship for superior bachelor (Number 1/AMD/E1.KP.PTNBH/2020). The authors also appreciated the Tapos Slaughterhouse in Depok, Indonesia for their assistance during the study.
REFERENCES
1. Tangkas IM, Sulaeman A, Anwar F, Suprayogi A, Estuningsih S, Rokhmah UF. Multinutrients from local cattle bone marrow in Central Sulawesi of Indonesia have the potential to improve the successful pregnancy rate and prevent slowing of fetal kidney growth. Pakistan J Nutr. 2019;18(10):961–8.
2. Márquez-Gómez M, Galicia-García T, Márquez-Meléndez R, Ruiz-Gutiérrez M, Quintero-Ramos A. Spray-dried microencapsulation of orange essential oil using modified rice starch as wall material. J Food Process Preserv. 2018;42(2):1–9.
3. Vanga SK, Raghavan V. How well do plant-based alternatives fare nutritionally compared to cow’s milk? J Food Sci Technol. 2018;55(1):10–20.
4. Yun JH, Kwon IK, Lohakare JD, Choi JY, Yong JS, Zheng J, et al. Comparative efficacy of plant and animal protein sources on the growth performance, nutrient digestibility, morphology and caecal microbiology of early-weaned pigs. Asian-Australasian J Anim Sci. 2005;18(9):1285–93.
5. Estevinho BN. Microencapsulation with chitosan by spray drying for industry applications. A Review. 2013;31.
Figure 1: Amino acid profile of microcapsules (MP: milk pow-der, MD: maltodextrin, AG: Arabic gum. The different alpha-bets above the diagram show significant differences (p <0.05)
Table I: Calcium and zinc content of microcapsules
Formula Calcium content (mg/100g)
Zinc content (mg/100g)
MP 1031.68±69.61a 8.77±0.62 a
MP+MD 742.73±43.69bc 2.86±0.21b
MP+AG 851.94±43.89b 3.01±0.18b
MP+MD+AG 687.07±41.25c 3.25±0.21b
Notes: MP: milk powder, MD: maltodextrin, AG: Arabic gum. The different superscript in each row shows significant differences (p <0.05)
Proceedings of the 1st IPB International Conference on Nutrition and Food 2020 101
Malaysian Journal of Medicine and Health Sciences Vol.16 Supp 13, Dec 2020 (eISSN 2636-9346)
EXTENDED ABSTRACT
Nutritional Profile of Lamtoro Seed (Leucaena leucocephala) and Its Fermented Product (Mlanding Tempeh)Rahmi Dzulhijjah, Budi Setiawan, Eny Palupi
Department of Community Nutrition, Faculty of Human Ecology, IPB University, Bogor 16680, Indonesia
Corresponding author’s email: [email protected]
SUMMARY
As a global issue, the search for alternative vegetable proteins aligns with the effort to maintain global protein sustain-ability. Lamtoro is a legume which has a complete nutrient content. The aim of the study is to investigate the content of nutrient in lamtoro seeds and the acceptability of mlanding tempeh using various cooking methods. This study used an explorative experimental design. The nutritional content of lamtoro seeds changed after the fermentation process was carried out. Fried mlanding tempeh has the highest score in taste and color. The fermented product of lamtoro seeds can be an alternative source of vegetable proteins.
Keywords: Fermentation, Legumes, Leucaena leucocephala, Mlanding tempeh
INTRODUCTION
The effort to search for local alternative vegetable proteins can contribute to the effort to maintain the national food security (1). Lamtoro is a legume with high protein and has a complete nutrient content (2). However, lamtoro seeds are known to contain anti-nutritional substances (3) and this can be reduced by fermentation process (4). Processing of food (cooking) through heating aims to increase shelf life, taste, digestibility and availability of nutrient contents (5).The research focused on the content of nutrition, protein digestibility and acceptability of lamtoro seeds (Leucaena leucocephala) and its fermented product (mlanding tempeh).
MATERIALS AND METHODS
Lamtoro seeds used were from Bogor area. The other material was commercial tempeh inoculum merck Raprima, obtained from a local market in Bogor. The process of making mlanding tempeh was fermentation for 48 hours by using yeast. The AOAC International methods (AOAC 2005) were used to analyze the nutrient contents. Moisture content of lamtoro seed and its fermented product were determined using oven drying methods. The ash content was determined using gravimetric method. Fat content was determined using solvent extraction methods (Soxhlet). Protein content was analysed using Kjehdal methods, amino acid component using HPLC. The acceptability of mlanding tempeh was determined using rating test (ISO-8587:1988).
RESULTS AND DISCUSSION
The nutrient content of lamtoro seed and mlanding tempeh are shown in Table I.
Table I: Nutrient content of lamtoro seeds and its fermented product (mlanding tempeh)
Kandungan zat gizi Lamtoro seed Mlanding tempeh
Moisture (%wb) 10.93a±0.49 61.70b ±0.80
Ash (%db) 4.59a±0.03 1.69 b ±0.05
Fat (%db) 3.09a±0.08 1.57b±0.07
Protein (%db) 30.97a±1.26 27.01b±0.55
Carbohydrate (%db) 72.73a±0.42 49.96b±1.05
Dietry fiber (%db) 57.66a±0.56 49.04b±1.16a, b = different test results based on the Paired T-Test between lamtoro seeds and tempeh lamtoro. Different letters on the same line indicate a significant difference (p <0.05)
The nutritional content of lamtoro seeds changed after the fermentation process. The water content of tempe lamtoro increased from 10.93 to 61.70 (% b.b). The increase in water content during fermentation is caused by the hydrolytic activity of the fermenting organisms which release moisture as part of the metabolic products.
Amino acid composition of lamtoro seeds and the fermented product (mlanding tempeh) are presented in Table II. Tyrosine + Phenylalanine in lamtoro seed and its fermented product (mlanding tempeh) is higher compared to other amino acids. Lamtoro seeds were quite rich in Essential Amino Acids namely Isoleucine,
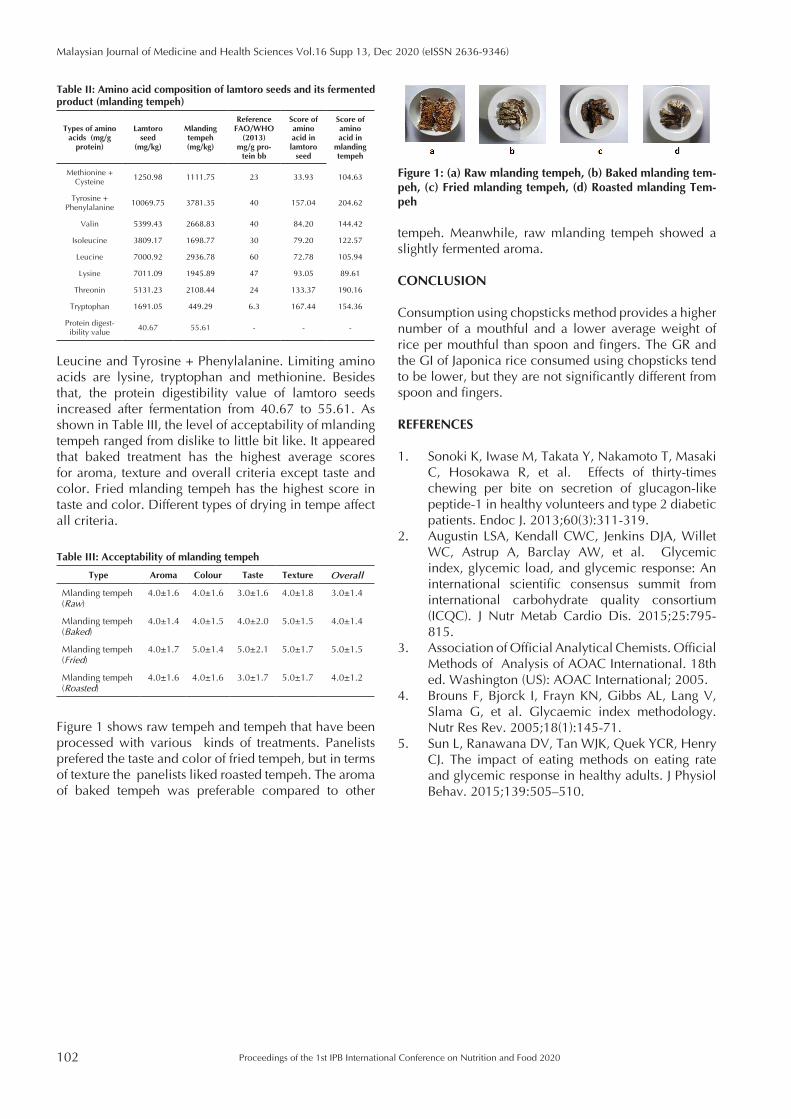
102
Malaysian Journal of Medicine and Health Sciences Vol.16 Supp 13, Dec 2020 (eISSN 2636-9346)
Proceedings of the 1st IPB International Conference on Nutrition and Food 2020
tempeh. Meanwhile, raw mlanding tempeh showed a slightly fermented aroma.
CONCLUSION
Consumption using chopsticks method provides a higher number of a mouthful and a lower average weight of rice per mouthful than spoon and fingers. The GR and the GI of Japonica rice consumed using chopsticks tend to be lower, but they are not significantly different from spoon and fingers.
REFERENCES
1. Sonoki K, Iwase M, Takata Y, Nakamoto T, Masaki C, Hosokawa R, et al. Effects of thirty-times chewing per bite on secretion of glucagon-like peptide-1 in healthy volunteers and type 2 diabetic patients. Endoc J. 2013;60(3):311-319.
2. Augustin LSA, Kendall CWC, Jenkins DJA, Willet WC, Astrup A, Barclay AW, et al. Glycemic index, glycemic load, and glycemic response: An international scientific consensus summit from international carbohydrate quality consortium (ICQC). J Nutr Metab Cardio Dis. 2015;25:795-815.
3. Association of Official Analytical Chemists. Official Methods of Analysis of AOAC International. 18th ed. Washington (US): AOAC International; 2005.
4. Brouns F, Bjorck I, Frayn KN, Gibbs AL, Lang V, Slama G, et al. Glycaemic index methodology. Nutr Res Rev. 2005;18(1):145-71.
5. Sun L, Ranawana DV, Tan WJK, Quek YCR, Henry CJ. The impact of eating methods on eating rate and glycemic response in healthy adults. J Physiol Behav. 2015;139:505–510.
Figure 1: (a) Raw mlanding tempeh, (b) Baked mlanding tem-peh, (c) Fried mlanding tempeh, (d) Roasted mlanding Tem-peh
Leucine and Tyrosine + Phenylalanine. Limiting amino acids are lysine, tryptophan and methionine. Besides that, the protein digestibility value of lamtoro seeds increased after fermentation from 40.67 to 55.61. As shown in Table III, the level of acceptability of mlanding tempeh ranged from dislike to little bit like. It appeared that baked treatment has the highest average scores for aroma, texture and overall criteria except taste and color. Fried mlanding tempeh has the highest score in taste and color. Different types of drying in tempe affect all criteria.
Table II: Amino acid composition of lamtoro seeds and its fermented product (mlanding tempeh)
Types of amino acids (mg/g
protein)
Lamtoro seed
(mg/kg)
Mlanding tempeh(mg/kg)
Reference FAO/WHO
(2013) mg/g pro-
tein bb
Score of amino acid in lamtoro
seed
Score of amino acid in
mlanding tempeh
Methionine + Cysteine
1250.98 1111.75 23 33.93 104.63
Tyrosine + Phenylalanine
10069.75 3781.35 40 157.04 204.62
Valin 5399.43 2668.83 40 84.20 144.42
Isoleucine 3809.17 1698.77 30 79.20 122.57
Leucine 7000.92 2936.78 60 72.78 105.94
Lysine 7011.09 1945.89 47 93.05 89.61
Threonin 5131.23 2108.44 24 133.37 190.16
Tryptophan 1691.05 449.29 6.3 167.44 154.36
Protein digest-ibility value
40.67 55.61 - - -
Table III: Acceptability of mlanding tempeh
Type Aroma Colour Taste Texture Overall
Mlanding tempeh (Raw)
4.0±1.6 4.0±1.6 3.0±1.6 4.0±1.8 3.0±1.4
Mlanding tempeh (Baked)
4.0±1.4 4.0±1.5 4.0±2.0 5.0±1.5 4.0±1.4
Mlanding tempeh (Fried)
4.0±1.7 5.0±1.4 5.0±2.1 5.0±1.7 5.0±1.5
Mlanding tempeh (Roasted)
4.0±1.6 4.0±1.6 3.0±1.7 5.0±1.7 4.0±1.2
Figure 1 shows raw tempeh and tempeh that have been processed with various kinds of treatments. Panelists prefered the taste and color of fried tempeh, but in terms of texture the panelists liked roasted tempeh. The aroma of baked tempeh was preferable compared to other
Proceedings of the 1st IPB International Conference on Nutrition and Food 2020 103
Malaysian Journal of Medicine and Health Sciences Vol.16 Supp 13, Dec 2020 (eISSN 2636-9346)
EXTENDED ABSTRACT
Formulation of Liquid Breakfast from Campolay Fruit with Mung Bean and White Rice Flour as Supplementary Food for School ChildrenBudi Setiawan1, Mega Kurniawati2
1 Department of Community Nutrition, Faculty of Human Ecology, IPB University, Bogor, Indonesia2 Alumni from Department of Community Nutrition, Faculty of Human Ecology, IPB University, Bogor, Indonesia
Corresponding author’s email: [email protected]
SUMMARY
Liquid breakfast can be used as an alternative to the breakfast menu. The aim of this research was to develop a for-mula from campolay fruit with mung bean and white rice. Campolay (Pouteria campechiana) is a potential carbo-hydrate source. Moreover, combination of rice and mung bean could complete amino acids. The selected formula (25% mung bean and white rice flour addition) had a significantly higher acceptance level than others treatments. The selected formula contained 73.2% moisture, 0.9% ash, 4.3% protein, 2.2% fat, and 19.5% carbohydrate. The limiting amino acid in this product was sulphur amino acid. This product has higher protein, fat, and carbohydrate content compared to existing products.
Keywords: Amino acids, Campolay fruit, Liquid breakfast, Mung bean, White rice flour
INTRODUCTION
Previous research showed that most Indonesian children do not meet their energy and protein needs in their breakfast (1). This situation leads to decreased academic ability and physical fitness of school children. Liquid breakfast is practical, nutritious, delicious, and healthy food with fluid consistency (2). Campolay (Pouteria campechiana) is one of carbohydrate sources that can fulfill nutrient requirement of the children. Mung bean also provides protein content with complete essential and non-essential amino acids. The highest essential amino acids in mung bean are aromatic amino acid, lysine, and leucine; but it has limited methionine. White rice flour could complete amino acid types in mung bean especially sulphuric amino acid. The aim of this research was to develop liquid breakfast from campolay fruit with mung bean and white rice flour formulated for school children.
MATERIALS AND METHODS
The main ingredients of the liquid breakfast were campolay fruit obtained from campolay farmer; mung bean obtained from grocery shop, and white rice flour and plain full cream powder milk obtained from supermarket in Bogor. Campolay fruit liquid breakfast was formulated based on cereal milk product composition with modification in ingredients and
procedures. Product formulation contained mung bean and rice flour, 0%, 25%, 50%, and 75%. Organoleptic tests included hedonic rating test, quality rating test, and ranking organoleptic tests by 31 semi-trained panelists. Proximate nutrient analysis included gravimetric method for moisture content analysis, gravimetric method for ash analysis, Kjeldhal method for protein analysis, and Soxhlet method for fat analysis. Carbohydrate analysis was performed by different method. Amino acid analysis used Ultra Performance Liquid Chromatography (UPLC) method. Data analysis used difference test, analysis of variance (ANOVA), and Duncan test.
RESULTS AND DISCUSSION
The selected formula was the formula of campolay fruit with 25% mung bean and white rice flour (F1), which had a significantly higher acceptance level (74%) than F2 and F3; it was also confirmed by the ranking test results presented in Table I.
Nutriens content of the selected formula (F1) was higher in protein (4.3%), fat (2.2%) and carbohydrate (19.5%) than imported and local commercial liquid breakfast available in supermarkets in Indonesia. Protein quality can be expressed in the amino acid score (AAS) indicating limiting amino acid content of the food product. Combination of mug bean and white rice in campolay fruit liquid breakfast resulted in AAS 75 with sulfuric
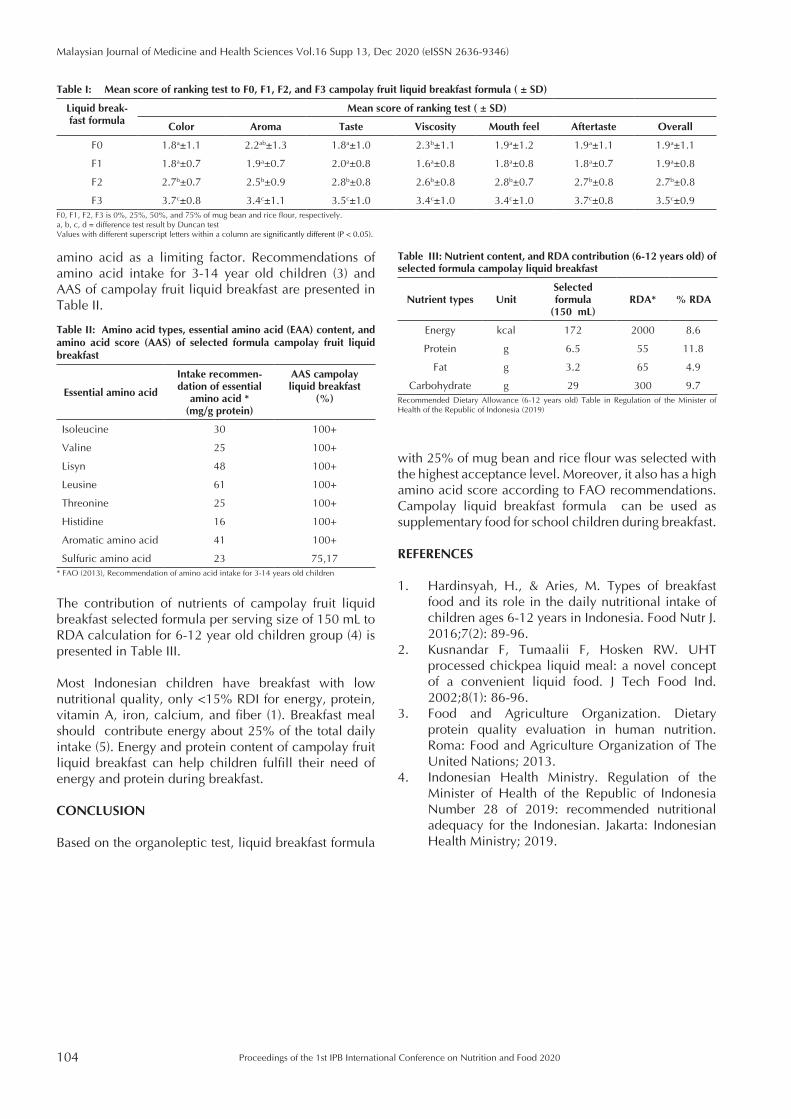
104
Malaysian Journal of Medicine and Health Sciences Vol.16 Supp 13, Dec 2020 (eISSN 2636-9346)
Proceedings of the 1st IPB International Conference on Nutrition and Food 2020
with 25% of mug bean and rice flour was selected with the highest acceptance level. Moreover, it also has a high amino acid score according to FAO recommendations. Campolay liquid breakfast formula can be used as supplementary food for school children during breakfast.
REFERENCES
1. Hardinsyah, H., & Aries, M. Types of breakfast food and its role in the daily nutritional intake of children ages 6-12 years in Indonesia. Food Nutr J. 2016;7(2): 89-96.
2. Kusnandar F, Tumaalii F, Hosken RW. UHT processed chickpea liquid meal: a novel concept of a convenient liquid food. J Tech Food Ind. 2002;8(1): 86-96.
3. Food and Agriculture Organization. Dietary protein quality evaluation in human nutrition. Roma: Food and Agriculture Organization of The United Nations; 2013.
4. Indonesian Health Ministry. Regulation of the Minister of Health of the Republic of Indonesia Number 28 of 2019: recommended nutritional adequacy for the Indonesian. Jakarta: Indonesian Health Ministry; 2019.
amino acid as a limiting factor. Recommendations of amino acid intake for 3-14 year old children (3) and AAS of campolay fruit liquid breakfast are presented in Table II.
Table I: Mean score of ranking test to F0, F1, F2, and F3 campolay fruit liquid breakfast formula ( ± SD)
Liquid break-fast formula
Mean score of ranking test ( ± SD)
Color Aroma Taste Viscosity Mouth feel Aftertaste Overall
F0 1.8a±1.1 2.2ab±1.3 1.8a±1.0 2.3b±1.1 1.9a±1.2 1.9a±1.1 1.9a±1.1
F1 1.8a±0.7 1.9a±0.7 2.0a±0.8 1.6a±0.8 1.8a±0.8 1.8a±0.7 1.9a±0.8
F2 2.7b±0.7 2.5b±0.9 2.8b±0.8 2.6b±0.8 2.8b±0.7 2.7b±0.8 2.7b±0.8
F3 3.7c±0.8 3.4c±1.1 3.5c±1.0 3.4c±1.0 3.4c±1.0 3.7c±0.8 3.5c±0.9F0, F1, F2, F3 is 0%, 25%, 50%, and 75% of mug bean and rice flour, respectively.a, b, c, d = difference test result by Duncan testValues with different superscript letters within a column are significantly different (P < 0.05).
Table II: Amino acid types, essential amino acid (EAA) content, and amino acid score (AAS) of selected formula campolay fruit liquid breakfast
Essential amino acid
Intake recommen-dation of essential
amino acid *(mg/g protein)
AAS campolay liquid breakfast
(%)
Isoleucine 30 100+
Valine 25 100+
Lisyn 48 100+
Leusine 61 100+
Threonine 25 100+
Histidine 16 100+
Aromatic amino acid 41 100+
Sulfuric amino acid 23 75,17* FAO (2013), Recommendation of amino acid intake for 3-14 years old children
Table III: Nutrient content, and RDA contribution (6-12 years old) of selected formula campolay liquid breakfast
Nutrient types UnitSelected formula
(150 mL)RDA* % RDA
Energy kcal 172 2000 8.6
Protein g 6.5 55 11.8
Fat g 3.2 65 4.9
Carbohydrate g 29 300 9.7Recommended Dietary Allowance (6-12 years old) Table in Regulation of the Minister of Health of the Republic of Indonesia (2019)
The contribution of nutrients of campolay fruit liquid breakfast selected formula per serving size of 150 mL to RDA calculation for 6-12 year old children group (4) is presented in Table III.
Most Indonesian children have breakfast with low nutritional quality, only <15% RDI for energy, protein, vitamin A, iron, calcium, and fiber (1). Breakfast meal should contribute energy about 25% of the total daily intake (5). Energy and protein content of campolay fruit liquid breakfast can help children fulfill their need of energy and protein during breakfast.
CONCLUSION
Based on the organoleptic test, liquid breakfast formula
Proceedings of the 1st IPB International Conference on Nutrition and Food 2020 105
Malaysian Journal of Medicine and Health Sciences Vol.16 Supp 13, Dec 2020 (eISSN 2636-9346)
EXTENDED ABSTRACT
Cookies and Beverage from Tempeh: Potential Nutritive Supplementary Products for Pregnant Women Lilik Kustiyah, Mira Dewi, Cesilia Meti Dwiriani, Evy Damayanthi
Department of Community Nutrition, Faculty of Human Ecology, IPB University, IPB Darmaga Bogor 16680, Indonesia
Corresponding author’s email: [email protected]
SUMMARY
Tempeh-based products for pregnant women are not yet available. This research aimed to identify the characteristics of tempeh cookies and beverage and their nutritional contribution to pregnant women. Nutrient, sensory, mineral content analyses were conducted. Both products contained 18 essential and non-essential amino acids, omega 3, 6 and 9 fatty acids. Nutrient contribution per serving size of tempeh cookies and beverage were 16.6 and 3.2% of energy, 7.8 and 2.9% of protein, 18.0 and 9.2% of calcium, 8.8 and 5% of iron, 15.2 and 2.1% of zinc, 22.0 and 14.6% of folic acid, respectively. Both products were accepted and safe to be consumed.
Keywords: Pregnancy, Tempeh beverage, Tempeh cookies
INTRODUCTION
Many studies showed that supplementary feeding during pregnancy is one of the best strategies to fulfill the nutrient need of pregnant women in order to maintain healthy pregnancy and fetus development. Supplementary food for pregnant women can be made from locally available food that is available in each region (1). One of the local food ingredients that can be used as supplementary food for pregnant women is tempeh. Tempeh is a fermented soy product that is rich in amino acids, fatty acids, higher digestibility values, protein efficiency values and chemical scores compared to soybean (2). So far, tempeh-based products for pregnant women are not yet available. Cookies and beverage have a long sustainability because they could be made by the research subject. This research aimed to identify the characteristics of tempeh-based products (cookies and beverage) and their nutritional contribution to pregnant women.
MATERIALS AND METHODS
There were three formulas of cookies: cheese tempeh cookies, raisin tempeh cookies and original tempeh cookies. Meanwhile, there was only one formula for tempeh beverage. Nutrient content was analyzed by standard method. Sensory test, mineral content analysis and shelf-life analysis were also conducted. Sensory test was performed using hedonic test which involved 30 panelists, using ANNOVA and Duncan post-hoc test in statistical analyses. Data on energy and nutrient contribution of tempeh cookies and beverage
were calculated by comparing the value of energy and nutrients content per serving size with the nutrient adequacy level of pregnant women aged 19-39 years in their second and third trimester (3).
RESULTS AND DISCUSSION
The products contained 18 essential and non-essential amino acids; omega-3, omega-6 and omega-9 fatty acids. Nutrient contributions per serving size of tempeh cookies (80 gram) and beverage (100 mL) are presented on Table I. If a pregnant woman consumed each serving of tempeh cookies and beverage, it could meet energy need by 19.7% and protein by 10.7% each day. This value was in accordance with the recommended contribution of supplemental food for pregnant women, which is about 10-20% of daily nutrient need (1). Therefore, these tempeh-based cookies and beverage product have been proved to be good supplemental food for pregnant women based on their energy content. The results showed that differences in three cookies formula did not significantly affect the level of preference of the panelists on the color, aroma and mouthfeel of tempeh cookies. However, based on the average level of preference, taste and aftertaste of cheese tempeh cookies tend to be preferred over the other two cookies formulas (Table II). The use of tempeh flour and additional ingredients (cheese and raisin) did not cause differences in color, aroma and mouthfeel cookies acceptance. The content of Pb and Hg in both products were very low and even not detected. Therefore, it is safe to be consumed. The shelf life prediction of tempeh cookies was 11.9 (~12 month) at room temperature with relative humidity 85%.
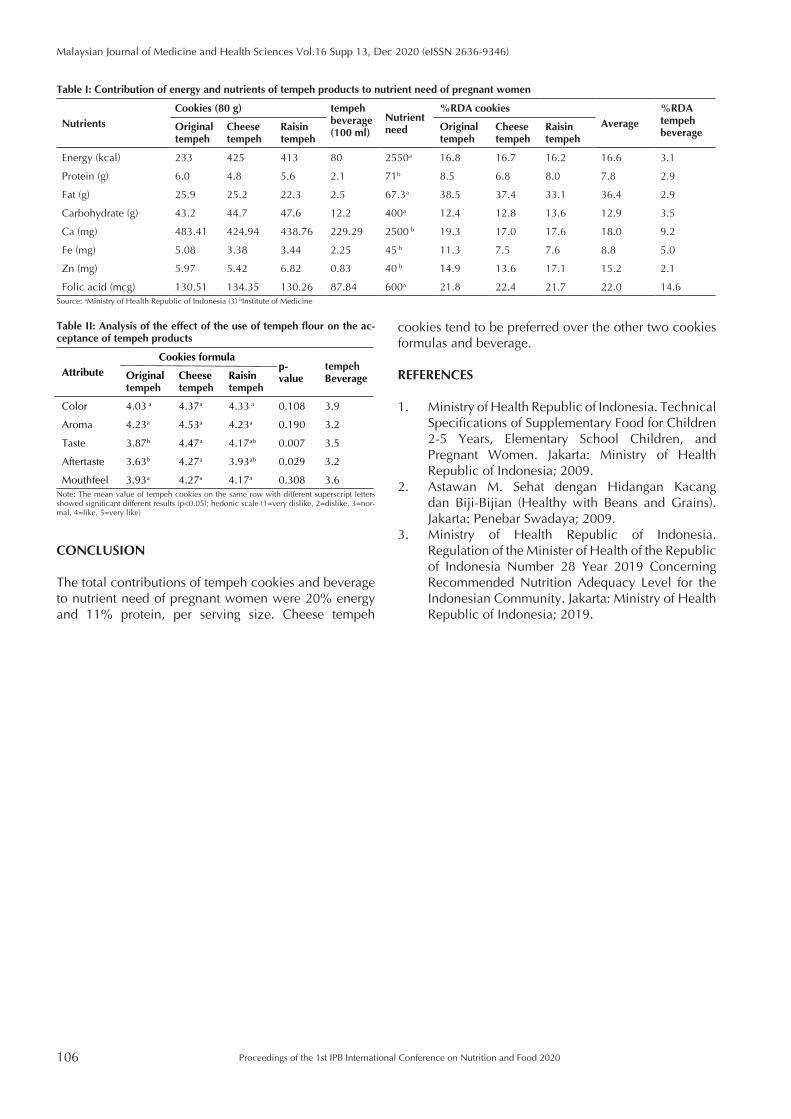
106
Malaysian Journal of Medicine and Health Sciences Vol.16 Supp 13, Dec 2020 (eISSN 2636-9346)
Proceedings of the 1st IPB International Conference on Nutrition and Food 2020
cookies tend to be preferred over the other two cookies formulas and beverage.
REFERENCES
1. Ministry of Health Republic of Indonesia. Technical Specifications of Supplementary Food for Children 2-5 Years, Elementary School Children, and Pregnant Women. Jakarta: Ministry of Health Republic of Indonesia; 2009.
2. Astawan M. Sehat dengan Hidangan Kacang dan Biji-Bijian (Healthy with Beans and Grains). Jakarta: Penebar Swadaya; 2009.
3. Ministry of Health Republic of Indonesia. Regulation of the Minister of Health of the Republic of Indonesia Number 28 Year 2019 Concerning Recommended Nutrition Adequacy Level for the Indonesian Community. Jakarta: Ministry of Health Republic of Indonesia; 2019.
CONCLUSION
The total contributions of tempeh cookies and beverage to nutrient need of pregnant women were 20% energy and 11% protein, per serving size. Cheese tempeh
Table I: Contribution of energy and nutrients of tempeh products to nutrient need of pregnant women
Nutrients
Cookies (80 g) tempeh beverage (100 ml)
Nutrient need
%RDA cookies
Average
%RDA tempeh beverageOriginal
tempehCheese tempeh
Raisin tempeh
Original tempeh
Cheese tempeh
Raisin tempeh
Energy (kcal) 233 425 413 80 2550a 16.8 16.7 16.2 16.6 3.1
Protein (g) 6.0 4.8 5.6 2.1 71b 8.5 6.8 8.0 7.8 2.9
Fat (g) 25.9 25.2 22.3 2.5 67.3a 38.5 37.4 33.1 36.4 2.9
Carbohydrate (g) 43.2 44.7 47.6 12.2 400a 12.4 12.8 13.6 12.9 3.5
Ca (mg) 483.41 424.94 438.76 229.29 2500 b 19.3 17.0 17.6 18.0 9.2
Fe (mg) 5.08 3.38 3.44 2.25 45 b 11.3 7.5 7.6 8.8 5.0
Zn (mg) 5.97 5.42 6.82 0.83 40 b 14.9 13.6 17.1 15.2 2.1
Folic acid (mcg) 130.51 134.35 130.26 87.84 600a 21.8 22.4 21.7 22.0 14.6Source: aMinistry of Health Republic of Indonesia (3) bInstitute of Medicine
Table II: Analysis of the effect of the use of tempeh flour on the ac-ceptance of tempeh products
Attribute
Cookies formula p-value
tempeh Beverage Original
tempehCheese tempeh
Raisin tempeh
Color 4.03 a 4.37a 4.33 a 0.108 3.9
Aroma 4.23a 4.53a 4.23a 0.190 3.2
Taste 3.87b 4.47a 4.17ab 0.007 3.5
Aftertaste 3.63b 4.27a 3.93ab 0.029 3.2
Mouthfeel 3.93a 4.27a 4.17a 0.308 3.6Note: The mean value of tempeh cookies on the same row with different superscript letters showed significant different results (p<0.05); hedonic scale (1=very dislike, 2=dislike, 3=nor-mal, 4=like, 5=very like)
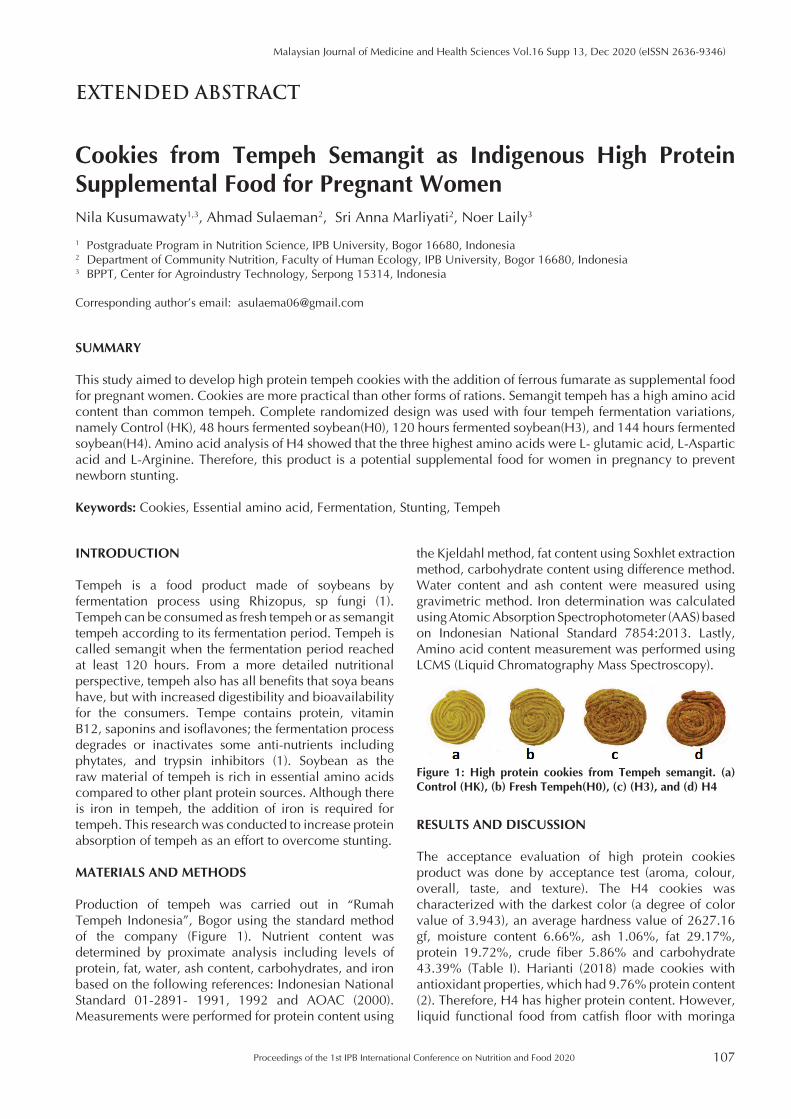
Proceedings of the 1st IPB International Conference on Nutrition and Food 2020 107
Malaysian Journal of Medicine and Health Sciences Vol.16 Supp 13, Dec 2020 (eISSN 2636-9346)
EXTENDED ABSTRACT
Cookies from Tempeh Semangit as Indigenous High Protein Supplemental Food for Pregnant Women Nila Kusumawaty1,3, Ahmad Sulaeman2, Sri Anna Marliyati2, Noer Laily3
1 Postgraduate Program in Nutrition Science, IPB University, Bogor 16680, Indonesia2 Department of Community Nutrition, Faculty of Human Ecology, IPB University, Bogor 16680, Indonesia3 BPPT, Center for Agroindustry Technology, Serpong 15314, Indonesia
Corresponding author’s email: [email protected]
SUMMARY
This study aimed to develop high protein tempeh cookies with the addition of ferrous fumarate as supplemental food for pregnant women. Cookies are more practical than other forms of rations. Semangit tempeh has a high amino acid content than common tempeh. Complete randomized design was used with four tempeh fermentation variations, namely Control (HK), 48 hours fermented soybean(H0), 120 hours fermented soybean(H3), and 144 hours fermented soybean(H4). Amino acid analysis of H4 showed that the three highest amino acids were L- glutamic acid, L-Aspartic acid and L-Arginine. Therefore, this product is a potential supplemental food for women in pregnancy to prevent newborn stunting.
Keywords: Cookies, Essential amino acid, Fermentation, Stunting, Tempeh
INTRODUCTION
Tempeh is a food product made of soybeans by fermentation process using Rhizopus, sp fungi (1). Tempeh can be consumed as fresh tempeh or as semangit tempeh according to its fermentation period. Tempeh is called semangit when the fermentation period reached at least 120 hours. From a more detailed nutritional perspective, tempeh also has all benefits that soya beans have, but with increased digestibility and bioavailability for the consumers. Tempe contains protein, vitamin B12, saponins and isoflavones; the fermentation process degrades or inactivates some anti-nutrients including phytates, and trypsin inhibitors (1). Soybean as the raw material of tempeh is rich in essential amino acids compared to other plant protein sources. Although there is iron in tempeh, the addition of iron is required for tempeh. This research was conducted to increase protein absorption of tempeh as an effort to overcome stunting.
MATERIALS AND METHODS
Production of tempeh was carried out in “Rumah Tempeh Indonesia”, Bogor using the standard method of the company (Figure 1). Nutrient content was determined by proximate analysis including levels of protein, fat, water, ash content, carbohydrates, and iron based on the following references: Indonesian National Standard 01-2891- 1991, 1992 and AOAC (2000). Measurements were performed for protein content using
the Kjeldahl method, fat content using Soxhlet extraction method, carbohydrate content using difference method. Water content and ash content were measured using gravimetric method. Iron determination was calculated using Atomic Absorption Spectrophotometer (AAS) based on Indonesian National Standard 7854:2013. Lastly, Amino acid content measurement was performed using LCMS (Liquid Chromatography Mass Spectroscopy).
Figure 1: High protein cookies from Tempeh semangit. (a) Control (HK), (b) Fresh Tempeh(H0), (c) (H3), and (d) H4
RESULTS AND DISCUSSION
The acceptance evaluation of high protein cookies product was done by acceptance test (aroma, colour, overall, taste, and texture). The H4 cookies was characterized with the darkest color (a degree of color value of 3.943), an average hardness value of 2627.16 gf, moisture content 6.66%, ash 1.06%, fat 29.17%, protein 19.72%, crude fiber 5.86% and carbohydrate 43.39% (Table I). Harianti (2018) made cookies with antioxidant properties, which had 9.76% protein content (2). Therefore, H4 has higher protein content. However, liquid functional food from catfish floor with moringa
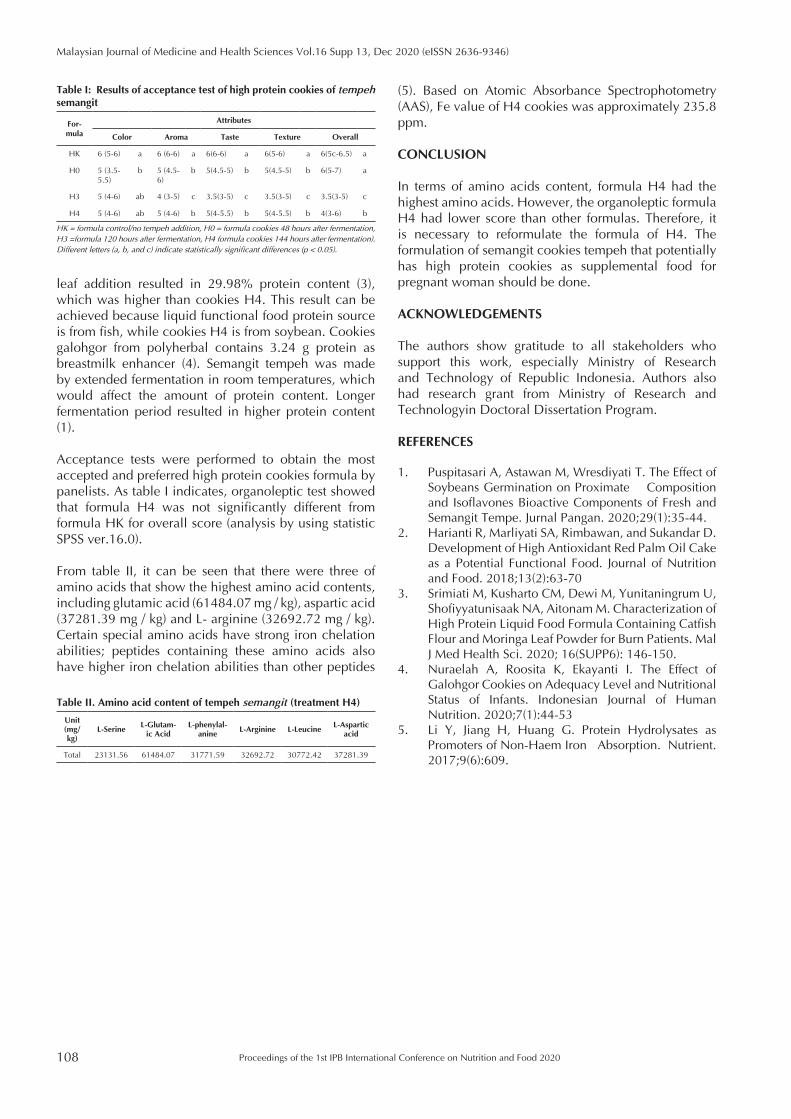
108
Malaysian Journal of Medicine and Health Sciences Vol.16 Supp 13, Dec 2020 (eISSN 2636-9346)
Proceedings of the 1st IPB International Conference on Nutrition and Food 2020
leaf addition resulted in 29.98% protein content (3), which was higher than cookies H4. This result can be achieved because liquid functional food protein source is from fish, while cookies H4 is from soybean. Cookies galohgor from polyherbal contains 3.24 g protein as breastmilk enhancer (4). Semangit tempeh was made by extended fermentation in room temperatures, which would affect the amount of protein content. Longer fermentation period resulted in higher protein content (1).
Acceptance tests were performed to obtain the most accepted and preferred high protein cookies formula by panelists. As table I indicates, organoleptic test showed that formula H4 was not significantly different from formula HK for overall score (analysis by using statistic SPSS ver.16.0).
From table II, it can be seen that there were three of amino acids that show the highest amino acid contents, including glutamic acid (61484.07 mg / kg), aspartic acid (37281.39 mg / kg) and L- arginine (32692.72 mg / kg). Certain special amino acids have strong iron chelation abilities; peptides containing these amino acids also have higher iron chelation abilities than other peptides
(5). Based on Atomic Absorbance Spectrophotometry (AAS), Fe value of H4 cookies was approximately 235.8 ppm.
CONCLUSION
In terms of amino acids content, formula H4 had the highest amino acids. However, the organoleptic formula H4 had lower score than other formulas. Therefore, it is necessary to reformulate the formula of H4. The formulation of semangit cookies tempeh that potentially has high protein cookies as supplemental food for pregnant woman should be done.
ACKNOWLEDGEMENTS
The authors show gratitude to all stakeholders who support this work, especially Ministry of Research and Technology of Republic Indonesia. Authors also had research grant from Ministry of Research and Technologyin Doctoral Dissertation Program.
REFERENCES
1. Puspitasari A, Astawan M, Wresdiyati T. The Effect of Soybeans Germination on Proximate Composition and Isoflavones Bioactive Components of Fresh and Semangit Tempe. Jurnal Pangan. 2020;29(1):35-44.
2. Harianti R, Marliyati SA, Rimbawan, and Sukandar D. Development of High Antioxidant Red Palm Oil Cake as a Potential Functional Food. Journal of Nutrition and Food. 2018;13(2):63-70
3. Srimiati M, Kusharto CM, Dewi M, Yunitaningrum U, Shofiyyatunisaak NA, Aitonam M. Characterization of High Protein Liquid Food Formula Containing Catfish Flour and Moringa Leaf Powder for Burn Patients. Mal J Med Health Sci. 2020; 16(SUPP6): 146-150.
4. Nuraelah A, Roosita K, Ekayanti I. The Effect of Galohgor Cookies on Adequacy Level and Nutritional Status of Infants. Indonesian Journal of Human Nutrition. 2020;7(1):44-53
5. Li Y, Jiang H, Huang G. Protein Hydrolysates as Promoters of Non-Haem Iron Absorption. Nutrient. 2017;9(6):609.
Table I: Results of acceptance test of high protein cookies of tempeh semangit
For-mula
Attributes
Color Aroma Taste Texture Overall
HK 6 (5-6) a 6 (6-6) a 6(6-6) a 6(5-6) a 6(5c-6.5) a
H0 5 (3.5-5.5)
b 5 (4.5-6)
b 5(4.5-5) b 5(4.5-5) b 6(5-7) a
H3 5 (4-6) ab 4 (3-5) c 3.5(3-5) c 3.5(3-5) c 3.5(3-5) c
H4 5 (4-6) ab 5 (4-6) b 5(4-5.5) b 5(4-5.5) b 4(3-6) b
HK = formula control/no tempeh addition, H0 = formula cookies 48 hours after fermentation, H3 = formula 120 hours after fermentation, H4 formula cookies 144 hours after fermentation). Different letters (a, b, and c) indicate statistically significant differences (p < 0.05).
Table II. Amino acid content of tempeh semangit (treatment H4)
Unit (mg/kg)
L-SerineL-Glutam-
ic AcidL-phenylal-
anineL-Arginine L-Leucine
L-Aspartic acid
Total 23131.56 61484.07 31771.59 32692.72 30772.42 37281.39
Proceedings of the 1st IPB International Conference on Nutrition and Food 2020 109
Malaysian Journal of Medicine and Health Sciences Vol.16 Supp 13, Dec 2020 (eISSN 2636-9346)
EXTENDED ABSTRACT
Antioxidant Activity in Ready-to-Drink Beverage Made from Snake Fruit (Salacca edulis Reinw) Enriched with Butterfly Pea (Clitoria ternatea) and Roselle (Hibiscus sabdariffa) Flower Extracts Hiasinta A. Purnawijayanti, Hildagardis Meliyani Erista Nai
Department of Nutrition, Panti Rapih School of Health Sciences, Yogyakarta, Indonesia
Corresponding author’s email: [email protected]
SUMMARY
This research aimed to develop an antioxidant-rich ready-to-drink beverage made from snake fruit and to observe the effect of addition of butterfly pea and roselle flower extracts on the antioxidant activity of snake fruit juice. Snake fruit juice was prepared by boiling sliced snake fruit in water for 15 minutes. Dried flowers were added to snake fruit extract at 90 oC then the extract was cooled and filtered. The addition of butterfly pea flowers did not increase pH, the amount of vitamin C, phenolic compounds and antioxidant activity of snake fruit juice, while roselle flowers decreased pH and increased vitamin C, phenolic compounds and antioxidant activity.
Keywords: Antioxidant activity, Clitoria ternatea, Healthy drink, Hibiscus sabdarifa, Snake fruit
INTRODUCTION
Snake fruit is rich in vitamins, minerals, dietary fiber, and bioactive compounds with antioxidant activities. Snake fruit also has high dissolved solids so it can be extracted and processed into a ready-to-drink beverage. Nevertheless, the snake fruit juice’s color looks less attractive. On the other hand, butterfly pea and roselle flowers are potential sources of natural colorant. Butterfly pea flower had blue gradation color and roselle flower had red gradation color. Both butterfly pea and roselle flower are also rich in antioxidant. Bioactive compounds that have been extracted from butterfly pea flowers were triterpenoids, phenolic acids, flavonoids, anthocyanins and steroids (1). Bioactive compounds in roselle flower were phenolic acids, flavonoids, and anthocyanidin (2). This study aimed to develop an antioxidant-rich ready-to-drink beverage made from snake fruit and to observe the effect of addition of butterfly pea and roselle flowers on the antioxidant activity of snake fruit juice.
MATERIALS AND METHODS
Snake fruit var “pondoh” was obtained from Sleman, Yogyakarta; table sugar, dried butterfly pea flower (BPF) and roselle flower (RF) were obtained from local market. Snake fruit juice was prepared by boiling sliced snake fruit in boiling water (30% w/v). Boiling process lasted for 15 minutes. The additions of BPF were 0.25% and 0.50% and RF were 0.75% and 1.00% w/v, as it is the most
attractive color according to consumers’ preferences in the preliminary study. Dried flowers were added to snake fruit extract while it was still hot (± 90 oC), then it was cooled and filtered to separate the flowers residue and obtained clear snake fruit juice. Vitamin C was measured by 2.6 dichlorophenol titration method. Total phenolic compound was measured by Folin-Ciocalteu method using gallic acid as a standard. Antioxidant activity (AA) was measured by DPPH (2,2’-Diphenyl-1-Picrylhydrazyl) radical scavenging activity. pH was measured using pH meter. The data were analyzed by analysis of variance (ANOVA), followed by the LSD test at p < 0.05. RESULTS AND DISCUSSION
Vitamin C acted as a cofactor and reducing agent of various enzymatic reactions. Because of its low oxidation-reduction potential, vitamin C can react with almost all oxidized free radicals. Vitamin C in fresh roselle flowers was 14 mg/100 g, while in dried roselle it was 60-280 mg/100 g (3). Thus, it was reasonable that there was an increase in vitamin C with the addition of dry roselle flowers. To the best of our knowledge, there is no data reported on the quantity of vitamin C in butterfly pea flowers (Figure 1).
Bioactive compounds with antioxidant activity that have been extracted from BPF were triterpenoids, phenolic acids, flavonoids, anthocyanins and steroids
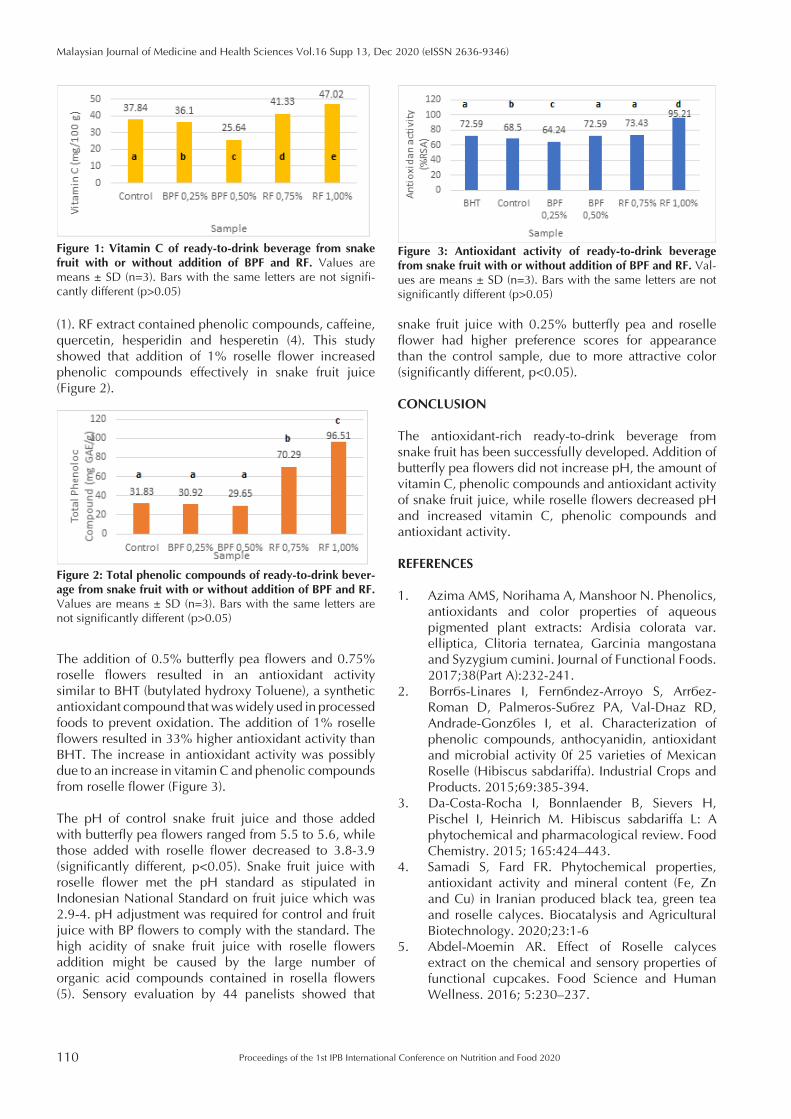
110
Malaysian Journal of Medicine and Health Sciences Vol.16 Supp 13, Dec 2020 (eISSN 2636-9346)
Proceedings of the 1st IPB International Conference on Nutrition and Food 2020
(1). RF extract contained phenolic compounds, caffeine, quercetin, hesperidin and hesperetin (4). This study showed that addition of 1% roselle flower increased phenolic compounds effectively in snake fruit juice (Figure 2).
snake fruit juice with 0.25% butterfly pea and roselle flower had higher preference scores for appearance than the control sample, due to more attractive color (significantly different, p<0.05).
CONCLUSION
The antioxidant-rich ready-to-drink beverage from snake fruit has been successfully developed. Addition of butterfly pea flowers did not increase pH, the amount of vitamin C, phenolic compounds and antioxidant activity of snake fruit juice, while roselle flowers decreased pH and increased vitamin C, phenolic compounds and antioxidant activity.
REFERENCES
1. Azima AMS, Norihama A, Manshoor N. Phenolics, antioxidants and color properties of aqueous pigmented plant extracts: Ardisia colorata var. elliptica, Clitoria ternatea, Garcinia mangostana and Syzygium cumini. Journal of Functional Foods. 2017;38(Part A):232-241.
2. Borrás-Linares I, Fernández-Arroyo S, Arráez-Roman D, Palmeros-Suárez PA, Val-Díaz RD, Andrade-Gonzáles I, et al. Characterization of phenolic compounds, anthocyanidin, antioxidant and microbial activity 0f 25 varieties of Mexican Roselle (Hibiscus sabdariffa). Industrial Crops and Products. 2015;69:385-394.
3. Da-Costa-Rocha I, Bonnlaender B, Sievers H, Pischel I, Heinrich M. Hibiscus sabdariffa L: A phytochemical and pharmacological review. Food Chemistry. 2015; 165:424–443.
4. Samadi S, Fard FR. Phytochemical properties, antioxidant activity and mineral content (Fe, Zn and Cu) in Iranian produced black tea, green tea and roselle calyces. Biocatalysis and Agricultural Biotechnology. 2020;23:1-6
5. Abdel-Moemin AR. Effect of Roselle calyces extract on the chemical and sensory properties of functional cupcakes. Food Science and Human Wellness. 2016; 5:230–237.
Figure 1: Vitamin C of ready-to-drink beverage from snake fruit with or without addition of BPF and RF. Values are means ± SD (n=3). Bars with the same letters are not signifi-cantly different (p>0.05)
Figure 2: Total phenolic compounds of ready-to-drink bever-age from snake fruit with or without addition of BPF and RF. Values are means ± SD (n=3). Bars with the same letters are not significantly different (p>0.05)
The addition of 0.5% butterfly pea flowers and 0.75% roselle flowers resulted in an antioxidant activity similar to BHT (butylated hydroxy Toluene), a synthetic antioxidant compound that was widely used in processed foods to prevent oxidation. The addition of 1% roselle flowers resulted in 33% higher antioxidant activity than BHT. The increase in antioxidant activity was possibly due to an increase in vitamin C and phenolic compounds from roselle flower (Figure 3).
The pH of control snake fruit juice and those added with butterfly pea flowers ranged from 5.5 to 5.6, while those added with roselle flower decreased to 3.8-3.9 (significantly different, p<0.05). Snake fruit juice with roselle flower met the pH standard as stipulated in Indonesian National Standard on fruit juice which was 2.9-4. pH adjustment was required for control and fruit juice with BP flowers to comply with the standard. The high acidity of snake fruit juice with roselle flowers addition might be caused by the large number of organic acid compounds contained in rosella flowers (5). Sensory evaluation by 44 panelists showed that
Figure 3: Antioxidant activity of ready-to-drink beverage from snake fruit with or without addition of BPF and RF. Val-ues are means ± SD (n=3). Bars with the same letters are not significantly different (p>0.05)
Proceedings of the 1st IPB International Conference on Nutrition and Food 2020 111
Malaysian Journal of Medicine and Health Sciences Vol.16 Supp 13, Dec 2020 (eISSN 2636-9346)
EXTENDED ABSTRACT
Development of Fibre Snack Bar for Obese Teenagers using Lesser Yam (Dioscorea esculenta) Farah Safitri Khairani1, Avliya Quratul Marjan2
1 Undergraduate Program in Nutrition Science, “Veteran” Jakarta University, Jakarta 12450, Indonesia.2 Faculty of Health Science, “Veteran” Jakarta University, Jakarta 12450, Indonesia.
Corresponding author’s email: [email protected]
SUMMARY
To improve food security, it is preferable to produce snacks using local comestibles such as lesser yam (Dioscorea esculenta) that contain high dietary fibre. This study aimed to analyse the effect of lesser-yam-based snack bar to the acceptability, chemical and physical characteristics. This study used a completely randomised design (CRD) with three treatments conducted on 30 semi-trained panellists from April to May 2019. F1 (50 g of lesser yam flour) that contains total dietary fibre 12.8% was chosen as the selected formula. Therefore, lesser yam snack bars are catego-rised as a source of fibre.
Keywords: Fibre, Lesser yam, Obesity, Snack, Snack bar
INTRODUCTION
One of major health issues in the world is the increase of obesity prevalence. The obesity prevalence of population over the last 18 years in Indonesia is 21.8% (2). Obesity impacts adolescent development, especially psychosocial development aspects and health disorders (3). Obesity impacts could be prevented by consuming adequate fibre intake. Most adolescent are still lacking in high-fibre snack consumption. They commonly consume snacks that are practical and easy to consume such as snack bars. To improve food security, it is preferable to make snacks using local comestibles such as lesser yam that can be used as a substitute for wheat flour since it does not change the taste and texture of the snack bar too much. Based on the above background, the researchers were interested in developing lesser yam flour (Dioscorea esculenta) and analysed the effects of Lesser-yam-based snack bar to acceptability, chemical and physical characteristics.
MATERIALS AND METHODS
This study used a completely randomised design (CRD) with three treatments and two replications. The treatments were F0 as control (0:130g), F1 (50g:80g), F2 (65g:65g) and F3 (80g:50g). This study was conducted from April to May 2019 at “Veteran” Jakarta University and Bogor Agricultural University. The procedure of the research began with making lesser yam flour, weighing ingredients, mixing, moulding of dough, baking with an oven at 160 oC for 40 minutes, and cooling. The AOAC
method was used for the chemical analysis. The physical characteristics hardness level was analysed using the Stevens-LFRA method, the colour degree was analysed using Chroma meter CR-310 Minolta method, and the acceptance test was done by using a hedonic test of thirty semi-trained panellists. The sensory evaluation data were analysed using the Kruskal-Wallis test, followed by the Mann-Whitney test. The chemical and physical evaluation were statistically analysed using ANOVA, followed by Duncan’s Multiple Range test (DMRT). RESULTS AND DISCUSSION
The results showed that the addition of different lesser yam tuber flour had a significant effect (p <0.05) on total dietary fibre, proximate composition, hardness level, colour and organoleptic properties of a snack bar (Table I, Table II and Table III). The ash and carbohydrate content of the lesser yam snack bar were similar to that observed by Cahyani and Rosiana (1). The moisture and fat content of the lesser yam snack bar are slightly higher than those reported in the literature. Although the protein content of the lesser yam snack bar in this study is higher than the one observed by Retnowati et al (4), the addition of other protein sources could increase the protein content of the snack bar such as eggs and skim milk. Fibre is a carbohydrate that the body cannot digest. Fibre helps to keep hunger and blood sugar in check. The lesser yam snack bar contains 1.37-5.37% fibre, which is lower than those reported by Senanayake et al. (5), because baking process during the snack bar making can increase the total dietary fibre content. Based on the
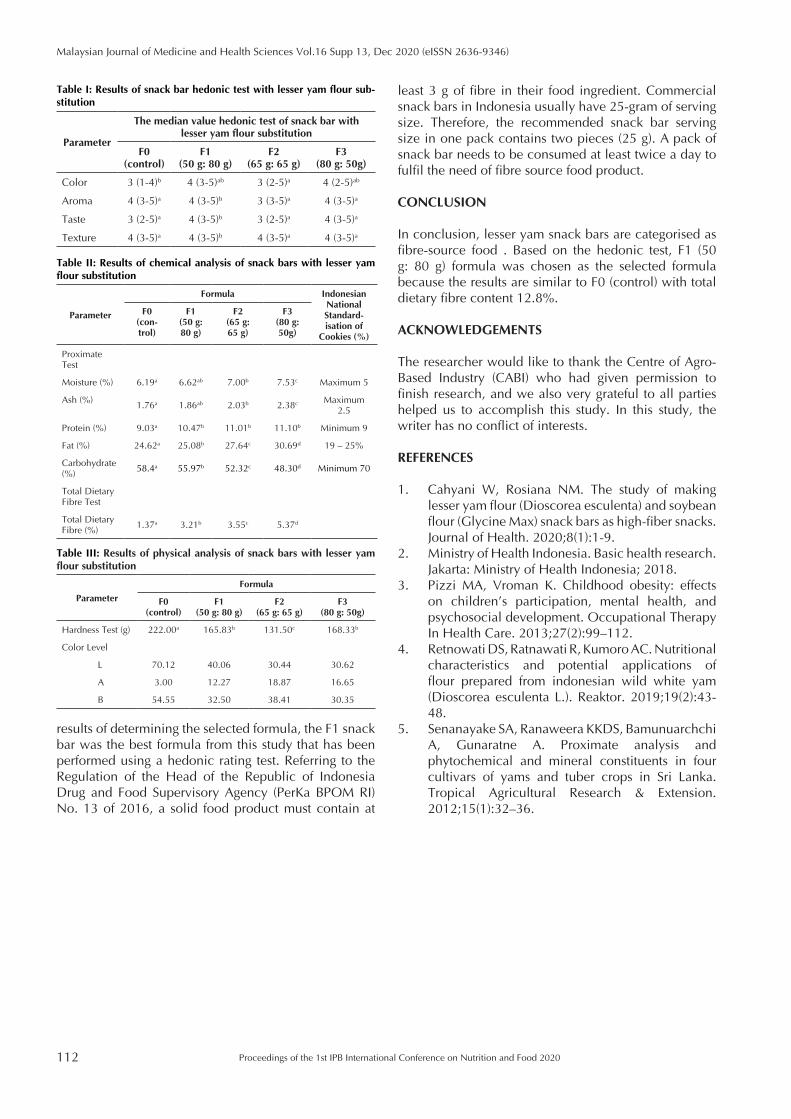
112
Malaysian Journal of Medicine and Health Sciences Vol.16 Supp 13, Dec 2020 (eISSN 2636-9346)
Proceedings of the 1st IPB International Conference on Nutrition and Food 2020
least 3 g of fibre in their food ingredient. Commercial snack bars in Indonesia usually have 25-gram of serving size. Therefore, the recommended snack bar serving size in one pack contains two pieces (25 g). A pack of snack bar needs to be consumed at least twice a day to fulfil the need of fibre source food product.
CONCLUSION
In conclusion, lesser yam snack bars are categorised as fibre-source food . Based on the hedonic test, F1 (50 g: 80 g) formula was chosen as the selected formula because the results are similar to F0 (control) with total dietary fibre content 12.8%.
ACKNOWLEDGEMENTS
The researcher would like to thank the Centre of Agro-Based Industry (CABI) who had given permission to finish research, and we also very grateful to all parties helped us to accomplish this study. In this study, the writer has no conflict of interests.
REFERENCES
1. Cahyani W, Rosiana NM. The study of making lesser yam flour (Dioscorea esculenta) and soybean flour (Glycine Max) snack bars as high-fiber snacks. Journal of Health. 2020;8(1):1-9.
2. Ministry of Health Indonesia. Basic health research. Jakarta: Ministry of Health Indonesia; 2018.
3. Pizzi MA, Vroman K. Childhood obesity: effects on children’s participation, mental health, and psychosocial development. Occupational Therapy In Health Care. 2013;27(2):99–112.
4. Retnowati DS, Ratnawati R, Kumoro AC. Nutritional characteristics and potential applications of flour prepared from indonesian wild white yam (Dioscorea esculenta L.). Reaktor. 2019;19(2):43-48.
5. Senanayake SA, Ranaweera KKDS, Bamunuarchchi A, Gunaratne A. Proximate analysis and phytochemical and mineral constituents in four cultivars of yams and tuber crops in Sri Lanka. Tropical Agricultural Research & Extension. 2012;15(1):32–36.
results of determining the selected formula, the F1 snack bar was the best formula from this study that has been performed using a hedonic rating test. Referring to the Regulation of the Head of the Republic of Indonesia Drug and Food Supervisory Agency (PerKa BPOM RI) No. 13 of 2016, a solid food product must contain at
Table I: Results of snack bar hedonic test with lesser yam flour sub-stitution
Parameter
The median value hedonic test of snack bar with lesser yam flour substitution
F0(control)
F1(50 g: 80 g)
F2(65 g: 65 g)
F3(80 g: 50g)
Color 3 (1-4)b 4 (3-5)ab 3 (2-5)a 4 (2-5)ab
Aroma 4 (3-5)a 4 (3-5)b 3 (3-5)a 4 (3-5)a
Taste 3 (2-5)a 4 (3-5)b 3 (2-5)a 4 (3-5)a
Texture 4 (3-5)a 4 (3-5)b 4 (3-5)a 4 (3-5)a
Table II: Results of chemical analysis of snack bars with lesser yam flour substitution
Parameter
Formula Indonesian National Standard-isation of
Cookies (%)
F0(con-trol)
F1(50 g: 80 g)
F2(65 g: 65 g)
F3(80 g: 50g)
Proximate Test
Moisture (%) 6.19a 6.62ab 7.00b 7.53c Maximum 5
Ash (%)1.76a 1.86ab 2.03b 2.38c Maximum
2.5
Protein (%) 9.03a 10.47b 11.01b 11.10b Minimum 9
Fat (%) 24.62a 25.08b 27.64c 30.69d 19 – 25%
Carbohydrate (%)
58.4a 55.97b 52.32c 48.30d Minimum 70
Total Dietary Fibre Test
Total Dietary Fibre (%)
1.37a 3.21b 3.55c 5.37d
Table III: Results of physical analysis of snack bars with lesser yam flour substitution
Parameter
Formula
F0(control)
F1(50 g: 80 g)
F2(65 g: 65 g)
F3(80 g: 50g)
Hardness Test (g) 222.00a 165.83b 131.50c 168.33b
Color Level
L 70.12 40.06 30.44 30.62
A 3.00 12.27 18.87 16.65
B 54.55 32.50 38.41 30.35
Proceedings of the 1st IPB International Conference on Nutrition and Food 2020 113
Malaysian Journal of Medicine and Health Sciences Vol.16 Supp 13, Dec 2020 (eISSN 2636-9346)
EXTENDED ABSTRACT
Improving the Quality of Chicken Sausage by Using Germinated Soybean Tempe Protein Isolate Ayu P-G Prayudani, Elvira Syamsir, Made Astawan
Department of Food Science and Technology, IPB University, Bogor, West Java, Indonesia
Corresponding author’s email: [email protected]
SUMMARY
Tempe protein isolate (TPI) is a potential local commodity due to the high quality of protein as the main compound. TPI can be utilized in various food products for quality improvement, such as sausage, which often has emulsification problems. This study was aimed to compare the application of TPI with commercial soy protein isolate (SPI) in chick-en sausage based on functional, physicochemical, and sensory characteristics. TPI was obtained from germinated and non-germinated soybean tempe. The results showed that sausage with germinated soybean tempe protein isolate had the highest quality as compared to non-germinated soybean tempe protein isolate and SPI.
Keywords: Functional properties, Germinated soybean, Protein isolate, Sausage, Tempe
INTRODUCTION
Sausage is a processed-meat product; poor and varied textures are often found in its production due to poor emulsification. The quality of sausage can be improved by increasing water holding capacity (WHC) and emulsion stability by using binders with high protein content. Binder commonly used in meat processing industries is soy protein isolate (SPI). The most recent study showed that there was a potential meat binder, namely tempe protein isolate (TPI) which consisted of germinated soybean tempe protein isolate (GTI) and non-germinated soybean tempe protein isolate (NGTI) (1). The fermentation of soybean to tempe results in higher protein quality and content (dry basis) compared to soybean (2). The germination process converts protein into amino acids, resulting in the protein content increase of soybean sprout (3), causing better functional properties. This study was aimed to compare TPI and SPI in improving chicken sausage quality.
MATERIALS AND METHODS
The concentrations of protein isolates (SPI, GTI, and NGTI) used for sausage were 1, 1.5, and 2% with other ingredients formulation (4). WHC of the chicken sausage was analysed by centrifugation. Cooking loss was observed by the weight decrease post-cooking. Emulsion stability was obtained from the subtraction of cooking loss percentage. Texture (hardness) was measured using Texture Profile Analyzer. The results were analysed to determine the optimum concentration
of each treatment. Furthermore, sausages with optimum concentration were analysed to select the best protein isolate, through proximate analysis and organoleptic test (hedonic rating) to 75 semi-trained panellists on colour, taste, aroma, hardness, chewiness, juiciness, and overall acceptance. Data were analysed using ANOVA by completely randomized factorial design. If the result showed significant differences (p<0.05), further analysis would be conducted using DMRT (Duncan Multiple Range Test). RESULTS AND DISCUSSION
Fig. 1 showed that sausages treated with GTI and NGTI had significantly higher WHC than SPI sausages. This implied the higher capability of water absorption in GTI and NGTI as compared to SPI sausages (1). Besides, GTI and NGTI sausages were also significantly improved than SPI sausages in cooking loss and emulsion stability parameters due to the protein ability in water binding, thus reducing the water loss during heating process, as well as the high content of protein resulted from fermentation process in GTI and NGTI and types of hydrophilic and hydrophobic free amino acids resulted from germination process in GTI (1). In terms of texture, GTI sausages had significantly improved the hardness level than NGTI and SPI. The high content of protein from GTI affected meat protein matrix structure, resulting in a more dense and solid matrix structure. Based on the overall parameter, the determined optimum concentration for GTI and NGTI was 1.5% (not significantly different with 2%), while for SPI was 2% (highest concentration). Enzymatic
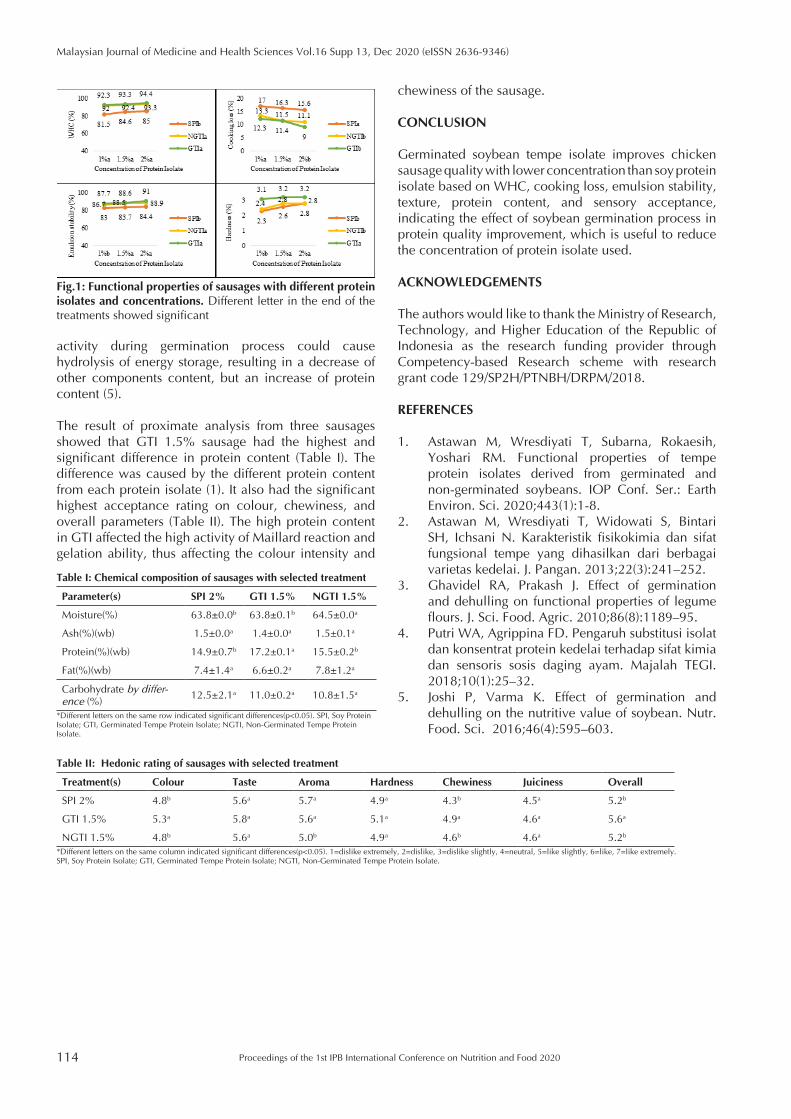
114
Malaysian Journal of Medicine and Health Sciences Vol.16 Supp 13, Dec 2020 (eISSN 2636-9346)
Proceedings of the 1st IPB International Conference on Nutrition and Food 2020
chewiness of the sausage.
CONCLUSION
Germinated soybean tempe isolate improves chicken sausage quality with lower concentration than soy protein isolate based on WHC, cooking loss, emulsion stability, texture, protein content, and sensory acceptance, indicating the effect of soybean germination process in protein quality improvement, which is useful to reduce the concentration of protein isolate used.
ACKNOWLEDGEMENTS
The authors would like to thank the Ministry of Research, Technology, and Higher Education of the Republic of Indonesia as the research funding provider through Competency-based Research scheme with research grant code 129/SP2H/PTNBH/DRPM/2018.
REFERENCES
1. Astawan M, Wresdiyati T, Subarna, Rokaesih, Yoshari RM. Functional properties of tempe protein isolates derived from germinated and non-germinated soybeans. IOP Conf. Ser.: Earth Environ. Sci. 2020;443(1):1-8.
2. Astawan M, Wresdiyati T, Widowati S, Bintari SH, Ichsani N. Karakteristik fisikokimia dan sifat fungsional tempe yang dihasilkan dari berbagai varietas kedelai. J. Pangan. 2013;22(3):241–252.
3. Ghavidel RA, Prakash J. Effect of germination and dehulling on functional properties of legume flours. J. Sci. Food. Agric. 2010;86(8):1189–95.
4. Putri WA, Agrippina FD. Pengaruh substitusi isolat dan konsentrat protein kedelai terhadap sifat kimia dan sensoris sosis daging ayam. Majalah TEGI. 2018;10(1):25–32.
5. Joshi P, Varma K. Effect of germination and dehulling on the nutritive value of soybean. Nutr. Food. Sci. 2016;46(4):595–603.
activity during germination process could cause hydrolysis of energy storage, resulting in a decrease of other components content, but an increase of protein content (5).
The result of proximate analysis from three sausages showed that GTI 1.5% sausage had the highest and significant difference in protein content (Table I). The difference was caused by the different protein content from each protein isolate (1). It also had the significant highest acceptance rating on colour, chewiness, and overall parameters (Table II). The high protein content in GTI affected the high activity of Maillard reaction and gelation ability, thus affecting the colour intensity and
Fig.1: Functional properties of sausages with different protein isolates and concentrations. Different letter in the end of the treatments showed significant
Table I: Chemical composition of sausages with selected treatment
Parameter(s) SPI 2% GTI 1.5% NGTI 1.5%
Moisture(%) 63.8±0.0b 63.8±0.1b 64.5±0.0a
Ash(%)(wb) 1.5±0.0a 1.4±0.0a 1.5±0.1a
Protein(%)(wb) 14.9±0.7b 17.2±0.1a 15.5±0.2b
Fat(%)(wb) 7.4±1.4a 6.6±0.2a 7.8±1.2a
Carbohydrate by differ-ence (%)
12.5±2.1a 11.0±0.2a 10.8±1.5a
*Different letters on the same row indicated significant differences(p<0.05). SPI, Soy Protein Isolate; GTI, Germinated Tempe Protein Isolate; NGTI, Non-Germinated Tempe Protein Isolate.
Table II: Hedonic rating of sausages with selected treatment
Treatment(s) Colour Taste Aroma Hardness Chewiness Juiciness Overall
SPI 2% 4.8b 5.6a 5.7a 4.9a 4.3b 4.5a 5.2b
GTI 1.5% 5.3a 5.8a 5.6a 5.1a 4.9a 4.6a 5.6a
NGTI 1.5% 4.8b 5.6a 5.0b 4.9a 4.6b 4.6a 5.2b
*Different letters on the same column indicated significant differences(p<0.05). 1=dislike extremely, 2=dislike, 3=dislike slightly, 4=neutral, 5=like slightly, 6=like, 7=like extremely. SPI, Soy Protein Isolate; GTI, Germinated Tempe Protein Isolate; NGTI, Non-Germinated Tempe Protein Isolate.
Proceedings of the 1st IPB International Conference on Nutrition and Food 2020 115
Malaysian Journal of Medicine and Health Sciences Vol.16 Supp 13, Dec 2020 (eISSN 2636-9346)
EXTENDED ABSTRACT
Reduced-Sugar ‘Serikaya’ as Potential Sweet Spread for Diabetic Patients Yusnita Hamzah1, Maisarah A Ghani2, Zuraidah Nasution3, Siti Nur Afifah Jaafar1
1 Food Science Programme, Faculty of Fisheries and Food Science, Universiti Malaysia Terengganu, 21030, Kuala Nerus, Malaysia
2 Bachelor Program in Food Science (Food Technology), Universiti Malaysia Terengganu, 21030, Kuala Nerus Malaysia 3 Department of Community Nutrition, Faculty of Human Ecology, IPB University, Bogor, Indonesia 16680
Corresponding author’s email: [email protected]
SUMMARY
Sucrose, a simple sugar contributing to quick increase of blood sugar, is not favoured by diabetic patients. Stevia, a sugar substitute, can be used to produce products with lower sugar and it may reduce the amount of available car-bohydrate for digestion. ‘Serikaya’, a popular sweet and delicious spread from coconut, traditionally contains high sugar. This study aimed to develop ‘serikaya’ with lower sugar through substitution of sucrose with stevia as a natural non-caloric sweetener. Five combinations of sugar and stevia were studied and analysed for physical characteristics, sensory acceptability and calculated for nutrient composition.
Keywords: Calorie content, Glycemic index, Stevia rebaudiana, Sweetener, Table sugar
INTRODUCTION
Serikaya is basically produced by using eggs, sugar and coconut milk to yield a concentrated semi-solid table spread. Most table spreads are high in fat and sugar, thus limiting choices available for diabetic patients. Sucrose, used in ‘serikaya’, importantly affects the product’s quality. High level of sugar is undesirable; thus, sugar replacement is important. Previous studies have shown that sugar reduction undesirably affected the characteristics of several products such as kulfi (1). Stevia, a potential sugar substitute, is known as a non-caloric natural sweetener. Stevia extract powder is ~250 times sweeter than sucrose (2) and it is generally recognized as safe (GRAS). A study showed that stevia could not totally replace sucrose in kulfi due to its bitter after taste (1). Oppositely, no negative effects of stevia were observed in yoghurt (3), indicating its limitation was not applicable to all types of food. Thus, a study on stevia incorporation in ‘serikaya’ is important to be carried out to observe its effect towards the product’s quality.
MATERIALS AND METHODS
Materials used were sugar, stevia powder, coconut milk, eggs, palm sugar and pandan leaves. ‘Serikaya’ samples were prepared with different ratios of sugar to stevia: 100:0 (control sample), 85:15, 70:30, 55:45 and 40:60, respectively. The amounts of stevia used were determined by calculation according to the sweetness intensity of stevia (250x) as relative to sugar. Triplicates
of samples were prepared using double-boiling method with constant stirring at 90oC. Cooking process was stopped once the samples reached 60 oBrix. Then, the samples were kept at room temperature overnight prior to analysis. Physical analysis involved was determination of colour and viscosity, while sensory analysis was carried out using acceptance test with 7-point hedonic scale. Data collected were subjected to one-way ANOVA followed by Fisher’s LSD test at 95 % confidence level. Nutrient content of ‘serikaya’ was determined by calculation.
RESULTS AND DISCUSSION
Reduction of sugar significantly increased viscosity of ‘serikaya’. Incorporation of stevia produced no bulking characteristic (4), making the product more firm and viscous. Stevia is thermally stable and it does not undergo browning or caramelization when heated (4); thus, it produced ‘serikaya’ with higher lightness and lower redness and yellowness. (Table I).
Table I: Viscosity and colour (Hunter L, a, b) of ‘serikaya’ made from different ratios of sugar and stevia
Sugar:stevia (%)
Viscosity (g/mm)
Lightness (L) Redness (a)
Yellowness (b)
100 : 0 4167±141.4b 41.2±1.6c 9.4±0.1a 47.6±1.9a
85 : 15 4333±94.3b 43.2±3.5bc 7.6±0.7a 47.6±1.2a
70 : 30 5700±47.1a 45.8±2.6bc 5.7±0.5b 37.8±1.8b
55 : 45 5900±141.4a 48.1±2.7b 5.1±0.6bc 32.8±0.6c
40 : 60 6162±134.4a 62.3±2.2a 3.4±0.1c 29.4±0.1d
Note: Mean values with different superscript letters for each property are significantly different (p<0.05)
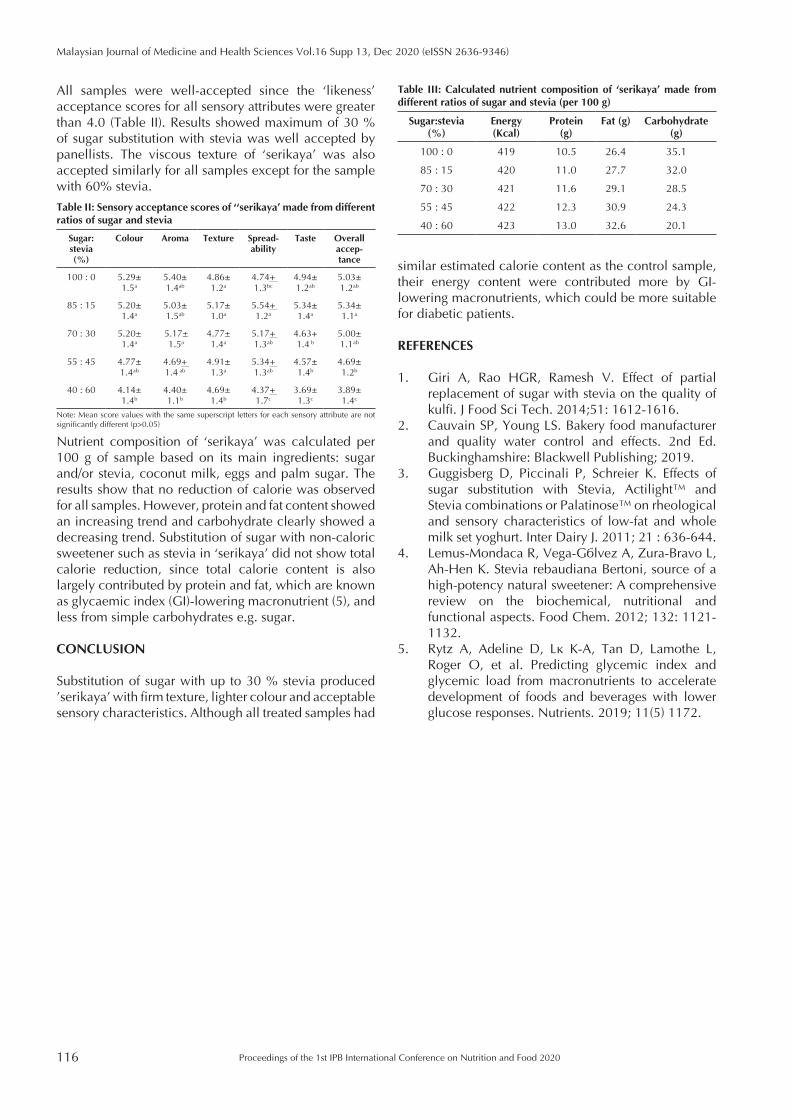
116
Malaysian Journal of Medicine and Health Sciences Vol.16 Supp 13, Dec 2020 (eISSN 2636-9346)
Proceedings of the 1st IPB International Conference on Nutrition and Food 2020
similar estimated calorie content as the control sample, their energy content were contributed more by GI-lowering macronutrients, which could be more suitable for diabetic patients.
REFERENCES
1. Giri A, Rao HGR, Ramesh V. Effect of partial replacement of sugar with stevia on the quality of kulfi. J Food Sci Tech. 2014;51: 1612-1616.
2. Cauvain SP, Young LS. Bakery food manufacturer and quality water control and effects. 2nd Ed. Buckinghamshire: Blackwell Publishing; 2019.
3. Guggisberg D, Piccinali P, Schreier K. Effects of sugar substitution with Stevia, Actilight™ and Stevia combinations or Palatinose™ on rheological and sensory characteristics of low-fat and whole milk set yoghurt. Inter Dairy J. 2011; 21 : 636-644.
4. Lemus-Mondaca R, Vega-Gálvez A, Zura-Bravo L, Ah-Hen K. Stevia rebaudiana Bertoni, source of a high-potency natural sweetener: A comprehensive review on the biochemical, nutritional and functional aspects. Food Chem. 2012; 132: 1121-1132.
5. Rytz A, Adeline D, Lê K-A, Tan D, Lamothe L, Roger O, et al. Predicting glycemic index and glycemic load from macronutrients to accelerate development of foods and beverages with lower glucose responses. Nutrients. 2019; 11(5) 1172.
All samples were well-accepted since the ‘likeness’ acceptance scores for all sensory attributes were greater than 4.0 (Table II). Results showed maximum of 30 % of sugar substitution with stevia was well accepted by panellists. The viscous texture of ‘serikaya’ was also accepted similarly for all samples except for the sample with 60% stevia.
Table II: Sensory acceptance scores of ‘‘serikaya’ made from different ratios of sugar and stevia
Sugar: stevia (%)
Colour Aroma Texture Spread-ability
Taste Overall accep-tance
100 : 0 5.29± 1.5a
5.40± 1.4ab
4.86± 1.2a
4.74+ 1.3bc
4.94± 1.2ab
5.03± 1.2ab
85 : 15 5.20± 1.4a
5.03± 1.5ab
5.17± 1.0a
5.54+ 1.2a
5.34± 1.4a
5.34± 1.1a
70 : 30 5.20± 1.4a
5.17± 1.5a
4.77± 1.4a
5.17+ 1.3ab
4.63+ 1.4 b
5.00± 1.1ab
55 : 45 4.77± 1.4ab
4.69+ 1.4 ab
4.91± 1.3a
5.34+ 1.3ab
4.57± 1.4b
4.69± 1.2b
40 : 60 4.14± 1.4b
4.40± 1.1b
4.69± 1.4b
4.37+ 1.7c
3.69± 1.3c
3.89± 1.4c
Note: Mean score values with the same superscript letters for each sensory attribute are not significantly different (p>0.05)
Table III: Calculated nutrient composition of ‘serikaya’ made from different ratios of sugar and stevia (per 100 g)
Sugar:stevia (%)
Energy (Kcal)
Protein (g)
Fat (g) Carbohydrate (g)
100 : 0 419 10.5 26.4 35.1
85 : 15 420 11.0 27.7 32.0
70 : 30 421 11.6 29.1 28.5
55 : 45 422 12.3 30.9 24.3
40 : 60 423 13.0 32.6 20.1
Nutrient composition of ‘serikaya’ was calculated per 100 g of sample based on its main ingredients: sugar and/or stevia, coconut milk, eggs and palm sugar. The results show that no reduction of calorie was observed for all samples. However, protein and fat content showed an increasing trend and carbohydrate clearly showed a decreasing trend. Substitution of sugar with non-caloric sweetener such as stevia in ‘serikaya’ did not show total calorie reduction, since total calorie content is also largely contributed by protein and fat, which are known as glycaemic index (GI)-lowering macronutrient (5), and less from simple carbohydrates e.g. sugar.
CONCLUSION
Substitution of sugar with up to 30 % stevia produced ’serikaya’ with firm texture, lighter colour and acceptable sensory characteristics. Although all treated samples had
Proceedings of the 1st IPB International Conference on Nutrition and Food 2020 117
Malaysian Journal of Medicine and Health Sciences Vol.16 Supp 13, Dec 2020 (eISSN 2636-9346)
EXTENDED ABSTRACT
Meta-Analysis on Edible Larvae as a Future Protein Source for Human: Do They have Comparable Nutritional Quality with Red Meat? Eny Palupi1, Budi Setiawan1, Ahmad Sulaeman1, Ali Khomsan1, Angelika Ploeger2
1 Department of Community Nutrition, Faculty of Human Ecology, IPB University. Bogor 16680, Indonesia2 Department of Organic Food Quality and Food Culture, University of Kassel, 37213 Witzenhausen, Germany
Corresponding author’s email: [email protected]
SUMMARY
This preliminary meta-analysis was intended to evaluate the nutritional quality of edible insects only from larva stage and compared it with that of red meat. A total of related 18 studies were integrated. For such a comparison, effect size using Hedges’ d method was employed. The results revealed that, in comparison to red-meat, the edible insect larvae had a significantly higher protein content with comparable amino acid score, higher ratio of PUFA/SFA, and higher contents of valuable minerals (Ca, Mg, K, Fe, Zn). Further development of food process technology to cover the original form of the larvae would be very important to increase the community acceptance.
Keywords: Edible insects, Future protein, Insect stage, Protein quality, Sustainable nutrition
INTRODUCTION
Edible insects have become promising and valuable protein sources for human and animals. Not only do they have important nutrients and health-promoting compounds, but insects are also recognized as a sustainable protein source with abundance availability (1,2). As globally known, red meat production significantly contributes to the methane emission causing global warming. Therefore, nowadays the global situation demands non-red meat quality protein (3). Edible-insects have very low carbon print due to their less land and energy requirements compared to the ruminant production (4). Despite the potential, there is a huge variation of nutrient contents among the insects, and this has been addressed due to a wide variety of species and age of the insects. This preliminary meta-analysis was intended to evaluate the nutritional quality of edible insects only from larva stage and compared it with that of red meat.
MATERIALS AND METHODS
Literature search was conducted using the following keywords: ‘edible insects’, ‘nutritional content’, ‘compare’, ‘meat’, ‘wild insects’. The selection criteria were as follows: English full-text articles; peer-reviewed published articles; present clearly the content and the analytical method; comparing with other common protein sources. A total of related 18 studies were integrated into
a database (Table I). For such a comparison, effect size using Hedges’ d method expressed as cumulative effect size was employed (5). The mean value together with Table I: List of comparison studies used in meta-analysis
Study code
Place Type of insect Scientific nameSam-pling
1 Java, Indonesia Caterpillar Hyblaea puera Wild
2 South Korea ColeopteraAllomyrina dicho-toma
Farm
3 South Korea Coleoptera Protaetia brevitarsis Farm
4 South Korea Coleoptera Tenebrio molitor Farm
5 NetherlandsYellow meal-worm
Tenebrio molitor Farm
6 Netherlands Super worm Zophobas morio Farm
7 Canada Silkworm Bombyx mor Farm
8 Venezuela Waxworm Galleria mellonella Wild
9 Netherlands Palm wormRhynchophorus palmarum
Wild
10 Papua Sago grubRhynchophorus ferrugineus
Wild
11Sumatra, Indonesia
Giant meal-worm larva
Zophobas morio Farm
12Sumatra, Indonesia
Common mealworm pupa
Tenebrio molitor Farm
13Sumatra, Indonesia
Common mealworm larvae
Tenebrio molitor Farm
14 Czech Cockroach Blaberus craniifer Farm
15 Czech Cockroach Blaberus craniifer Farm
16 Czech Super worm Zophobas morio Farm
17 Czech Super worm Zophobas morio Farm
18 Czech Super worm Zophobas morio Farm
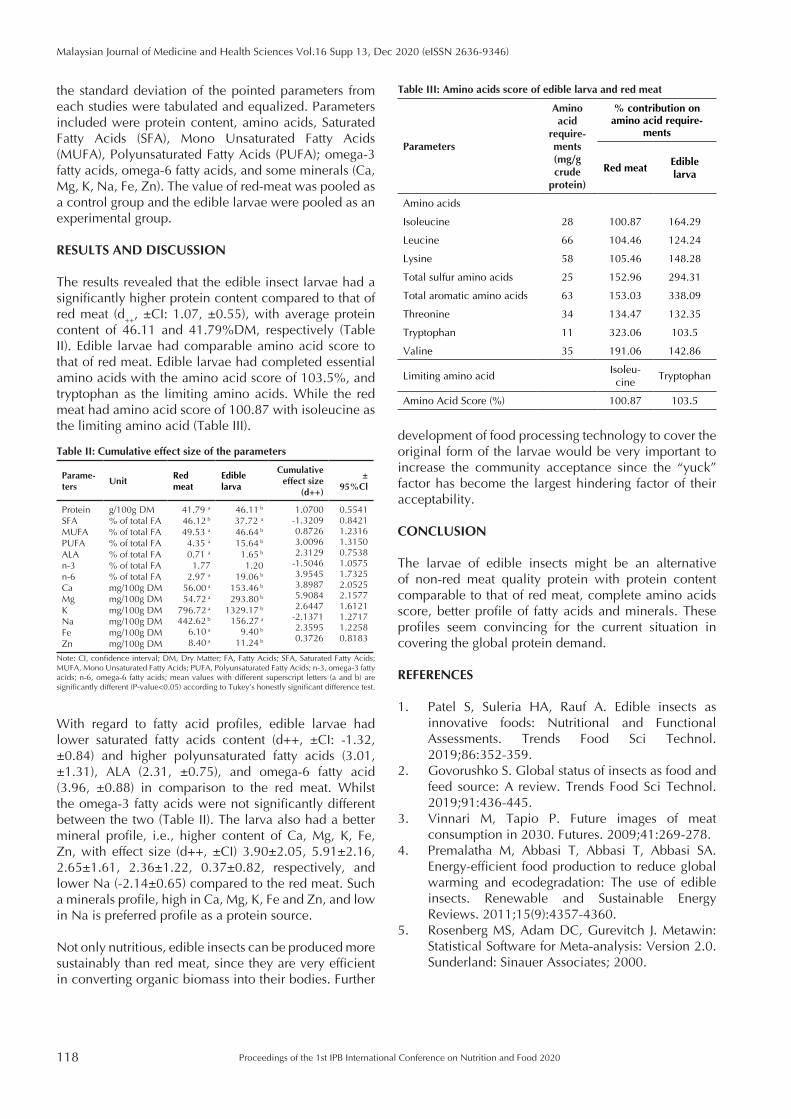
118
Malaysian Journal of Medicine and Health Sciences Vol.16 Supp 13, Dec 2020 (eISSN 2636-9346)
Proceedings of the 1st IPB International Conference on Nutrition and Food 2020
development of food processing technology to cover the original form of the larvae would be very important to increase the community acceptance since the “yuck” factor has become the largest hindering factor of their acceptability.
CONCLUSION
The larvae of edible insects might be an alternative of non-red meat quality protein with protein content comparable to that of red meat, complete amino acids score, better profile of fatty acids and minerals. These profiles seem convincing for the current situation in covering the global protein demand.
REFERENCES
1. Patel S, Suleria HA, Rauf A. Edible insects as innovative foods: Nutritional and Functional Assessments. Trends Food Sci Technol. 2019;86:352-359.
2. Govorushko S. Global status of insects as food and feed source: A review. Trends Food Sci Technol. 2019;91:436-445.
3. Vinnari M, Tapio P. Future images of meat consumption in 2030. Futures. 2009;41:269-278.
4. Premalatha M, Abbasi T, Abbasi T, Abbasi SA. Energy-efficient food production to reduce global warming and ecodegradation: The use of edible insects. Renewable and Sustainable Energy Reviews. 2011;15(9):4357-4360.
5. Rosenberg MS, Adam DC, Gurevitch J. Metawin: Statistical Software for Meta-analysis: Version 2.0. Sunderland: Sinauer Associates; 2000.
the standard deviation of the pointed parameters from each studies were tabulated and equalized. Parameters included were protein content, amino acids, Saturated Fatty Acids (SFA), Mono Unsaturated Fatty Acids (MUFA), Polyunsaturated Fatty Acids (PUFA); omega-3 fatty acids, omega-6 fatty acids, and some minerals (Ca, Mg, K, Na, Fe, Zn). The value of red-meat was pooled as a control group and the edible larvae were pooled as an experimental group.
RESULTS AND DISCUSSION
The results revealed that the edible insect larvae had a significantly higher protein content compared to that of red meat (d
++, ±CI: 1.07, ±0.55), with average protein
content of 46.11 and 41.79%DM, respectively (Table II). Edible larvae had comparable amino acid score to that of red meat. Edible larvae had completed essential amino acids with the amino acid score of 103.5%, and tryptophan as the limiting amino acids. While the red meat had amino acid score of 100.87 with isoleucine as the limiting amino acid (Table III).
Table II: Cumulative effect size of the parameters
Parame-ters
UnitRed meat
Edible larva
Cumulative effect size
(d++)
± 95%Cl
ProteinSFAMUFAPUFAALAn-3n-6CaMgKNaFeZn
g/100g DM% of total FA% of total FA% of total FA% of total FA% of total FA% of total FAmg/100g DMmg/100g DMmg/100g DMmg/100g DMmg/100g DMmg/100g DM
41.79 a
46.12 b
49.53 a
4.35 a
0.71 a
1.772.97 a
56.00 a
54.72 a
796.72 a
442.62 b
6.10 a
8.40 a
46.11 b
37.72 a
46.64 b
15.64 b
1.65 b
1.2019.06 b
153.46 b
293.80 b
1329.17 b
156.27 a
9.40 b
11.24 b
1.0700-1.32090.87263.00962.3129
-1.50463.95453.89875.90842.6447
-2.13712.35950.3726
0.55410.84211.23161.31500.75381.05751.73252.05252.15771.61211.27171.22580.8183
Note: CI, confidence interval; DM, Dry Matter; FA, Fatty Acids; SFA, Saturated Fatty Acids; MUFA, Mono Unsaturated Fatty Acids; PUFA, Polyunsaturated Fatty Acids; n-3, omega-3 fatty acids; n-6, omega-6 fatty acids; mean values with different superscript letters (a and b) are significantly different (P-value<0.05) according to Tukey’s honestly significant difference test.
Table III: Amino acids score of edible larva and red meat
Parameters
Amino acid
require-ments(mg/g crude
protein)
% contribution on amino acid require-
ments
Red meatEdible larva
Amino acids
Isoleucine 28 100.87 164.29
Leucine 66 104.46 124.24
Lysine 58 105.46 148.28
Total sulfur amino acids 25 152.96 294.31
Total aromatic amino acids 63 153.03 338.09
Threonine 34 134.47 132.35
Tryptophan 11 323.06 103.5
Valine 35 191.06 142.86
Limiting amino acidIsoleu-cine
Tryptophan
Amino Acid Score (%) 100.87 103.5
With regard to fatty acid profiles, edible larvae had lower saturated fatty acids content (d++, ±CI: -1.32, ±0.84) and higher polyunsaturated fatty acids (3.01, ±1.31), ALA (2.31, ±0.75), and omega-6 fatty acid (3.96, ±0.88) in comparison to the red meat. Whilst the omega-3 fatty acids were not significantly different between the two (Table II). The larva also had a better mineral profile, i.e., higher content of Ca, Mg, K, Fe, Zn, with effect size (d++, ±CI) 3.90±2.05, 5.91±2.16, 2.65±1.61, 2.36±1.22, 0.37±0.82, respectively, and lower Na (-2.14±0.65) compared to the red meat. Such a minerals profile, high in Ca, Mg, K, Fe and Zn, and low in Na is preferred profile as a protein source.
Not only nutritious, edible insects can be produced more sustainably than red meat, since they are very efficient in converting organic biomass into their bodies. Further
Proceedings of the 1st IPB International Conference on Nutrition and Food 2020 119
Malaysian Journal of Medicine and Health Sciences Vol.16 Supp 13, Dec 2020 (eISSN 2636-9346)
EXTENDED ABSTRACT
Potentials of Ozone Pre-treatment in Prolonging the Freshness of Oyster Mushrooms (Pleurotus Florida) Anjaly S.M1, Khanashyam A.C1, Balasubrahmanyam B.V.S1, B.K. Yadav2
1 Graduates, Indian Institute of Food Processing Technology, Pudukkottai Road, Thanjavur, India 2 Professor & Head, Indian Institute of Food Processing Technology, LO, Guwahati, Assam, India
Corresponding author’s email: [email protected]
SUMMARY
The objective of this study was to determine the effect of ozone and packaging condition on post-harvest quality of mushrooms. Browning is primarily influenced by the presence of Polyphenol Oxidase enzyme. Ozone being a strong antimicrobial and a reducing agent can help in retarding the action of the enzyme and thereby promoting the quality of mushrooms. Mushrooms were treated with gaseous ozone at 10 and 15 ppm for 5 and 10 minutes and packed in HDPE packaging material with ambient and vacuum-packed conditions. Ozone pre-treatment combined with pack-aging condition was found to be effective in extending the shelf life of mushrooms.
Keywords: Browning, Oyster mushroom, Ozone, Polyphenol oxidase enzyme, Shelf life extension
INTRODUCTION
Pleurotus spp. is one of the three most cultivated mushroom species in the world. They are good source of proteins, vitamins, dietary fibers etc. with low calorific value, starch and fat content. Mushrooms are highly perishable in nature with their shelf life limited to few days. The physiological changes such as browning, weight loss, dehydration and textural changes that develop in mushrooms are due to temperature conditions and relative humidity during the storage. In order to preserve their nutrition content, efforts should be made to arrest the enzymatic activity, respiration rate and dehydration in mushrooms by modifying the storage environment. The effect of ozone treatment on mushrooms studied (3) reveals that the ozone has capabilities to control the intensity of browning in mushrooms. Taking this into account, the present work was conducted to study the effect of ozone pretreatment and packaging condition on keeping quality of mushrooms.
MATERIALS AND METHODS
The experiment was conducted at Food packing lab, IIFPT, Thanjavur with locally bought mushrooms. Samples were first ozone pre-treated with 2 levels of concentration (10 and 15ppm) and 2 levels of duration (5 and 10minutes) and were packed in HDPE packaging material in 2 atmospheric conditions, viz., normal and vacuum. After initial treatments, packages were stored at 4oC and 90%RH. Parameters like colour, weight loss and hardness inside the package were measured
each day in triplicates and suitable combination was selected. The colour was monitored in terms of L* using Hunter colour lab colorimeter. Weight loss was evaluated by comparing the initial weight and weight of the samples each day during storage period. Hardness was measured using texture profile analyser using 2mm cylindrical probe with 2mm penetration depth. The effect of pretreatment on microbial count was evaluated and sensory attributes of the samples were also studied using five-point headonic scale.
RESULTS AND DISCUSSION
There was a progressive decrease in the luminosity value of the mushroom throughout the storage duration. Ozone also showed a high bactericidal effect as samples exposed to gaseous ozone at 15ppm for 10 minutes lowered the aerobic plate count of the naturally present microbes by 2.25 log CFU. Even though there was an initial browning soon after the ozone treatment (P > 0.05), the synergistic effect of ozone and packaging conditions extended the mushroom shelf life to 10 days as compared to control samples which retained the quality only for a maximum of 5 days. Ozone being a reducing agent can control the activity of enzyme and can alter the degree of discolouration that happens during storage (4).
Weight loss and texture parameters were not largely influenced by the degree of ozone treatment. Weight loss is mainly due to the water loss caused by respiration and transpiration process. The better retention in weight of
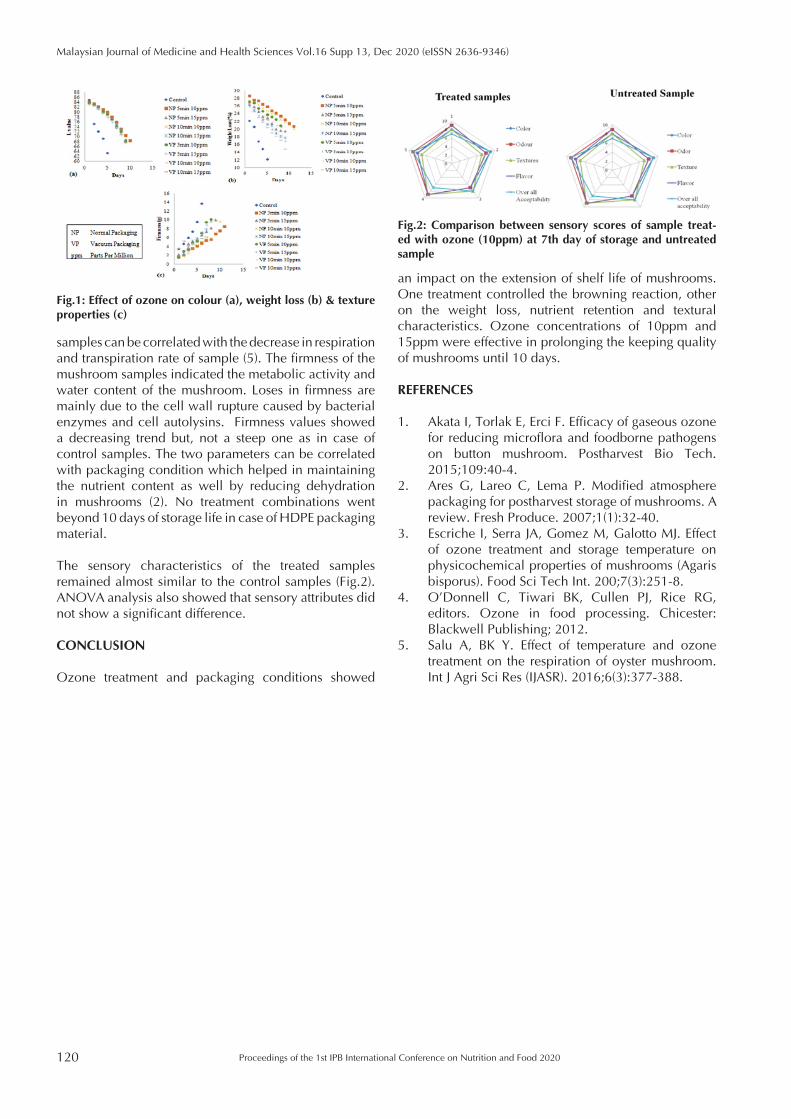
120
Malaysian Journal of Medicine and Health Sciences Vol.16 Supp 13, Dec 2020 (eISSN 2636-9346)
Proceedings of the 1st IPB International Conference on Nutrition and Food 2020
an impact on the extension of shelf life of mushrooms. One treatment controlled the browning reaction, other on the weight loss, nutrient retention and textural characteristics. Ozone concentrations of 10ppm and 15ppm were effective in prolonging the keeping quality of mushrooms until 10 days.
REFERENCES
1. Akata I, Torlak E, Erci F. Efficacy of gaseous ozone for reducing microflora and foodborne pathogens on button mushroom. Postharvest Bio Tech. 2015;109:40-4.
2. Ares G, Lareo C, Lema P. Modified atmosphere packaging for postharvest storage of mushrooms. A review. Fresh Produce. 2007;1(1):32-40.
3. Escriche I, Serra JA, Gomez M, Galotto MJ. Effect of ozone treatment and storage temperature on physicochemical properties of mushrooms (Agaris bisporus). Food Sci Tech Int. 200;7(3):251-8.
4. O’Donnell C, Tiwari BK, Cullen PJ, Rice RG, editors. Ozone in food processing. Chicester: Blackwell Publishing; 2012.
5. Salu A, BK Y. Effect of temperature and ozone treatment on the respiration of oyster mushroom. Int J Agri Sci Res (IJASR). 2016;6(3):377-388.
samples can be correlated with the decrease in respiration and transpiration rate of sample (5). The firmness of the mushroom samples indicated the metabolic activity and water content of the mushroom. Loses in firmness are mainly due to the cell wall rupture caused by bacterial enzymes and cell autolysins. Firmness values showed a decreasing trend but, not a steep one as in case of control samples. The two parameters can be correlated with packaging condition which helped in maintaining the nutrient content as well by reducing dehydration in mushrooms (2). No treatment combinations went beyond 10 days of storage life in case of HDPE packaging material.
The sensory characteristics of the treated samples remained almost similar to the control samples (Fig.2). ANOVA analysis also showed that sensory attributes did not show a significant difference.
CONCLUSION
Ozone treatment and packaging conditions showed
Fig.1: Effect of ozone on colour (a), weight loss (b) & texture properties (c)
Fig.2: Comparison between sensory scores of sample treat-ed with ozone (10ppm) at 7th day of storage and untreated sample
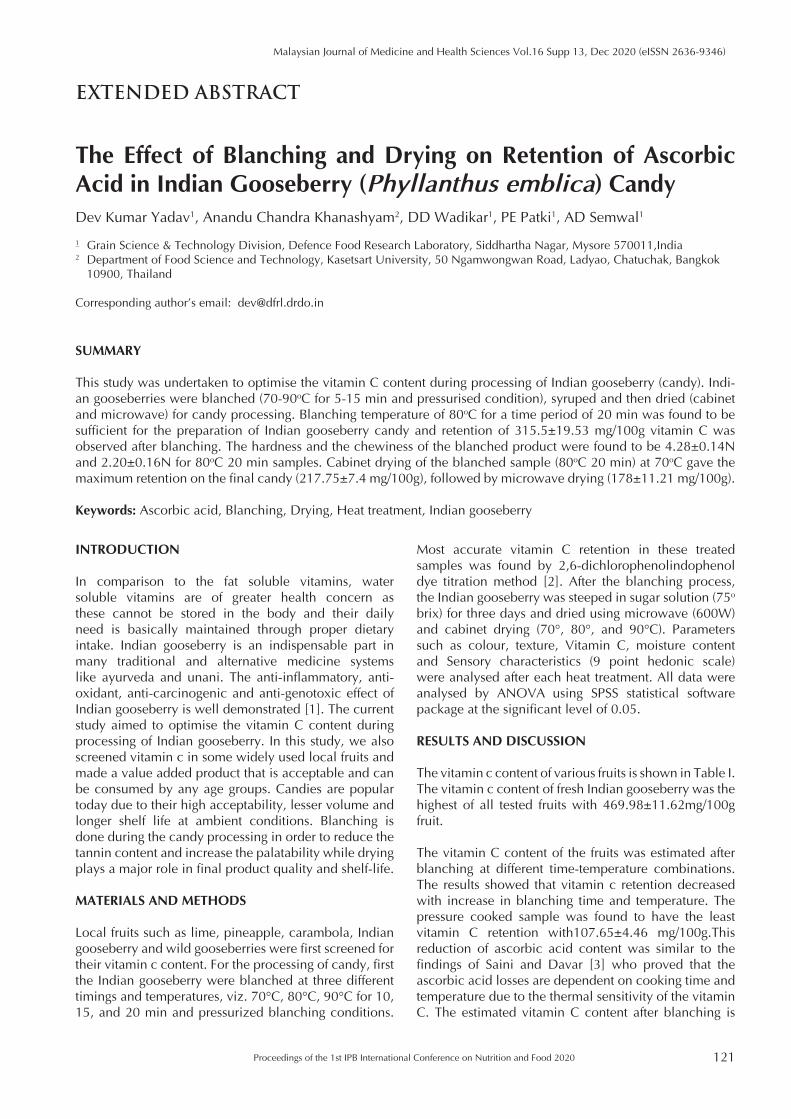
Proceedings of the 1st IPB International Conference on Nutrition and Food 2020 121
Malaysian Journal of Medicine and Health Sciences Vol.16 Supp 13, Dec 2020 (eISSN 2636-9346)
EXTENDED ABSTRACT
The Effect of Blanching and Drying on Retention of Ascorbic Acid in Indian Gooseberry (Phyllanthus emblica) Candy Dev Kumar Yadav1, Anandu Chandra Khanashyam2, DD Wadikar1, PE Patki1, AD Semwal1
1 Grain Science & Technology Division, Defence Food Research Laboratory, Siddhartha Nagar, Mysore 570011,India2 Department of Food Science and Technology, Kasetsart University, 50 Ngamwongwan Road, Ladyao, Chatuchak, Bangkok
10900, Thailand
Corresponding author’s email: [email protected]
SUMMARY
This study was undertaken to optimise the vitamin C content during processing of Indian gooseberry (candy). Indi-an gooseberries were blanched (70-90oC for 5-15 min and pressurised condition), syruped and then dried (cabinet and microwave) for candy processing. Blanching temperature of 80oC for a time period of 20 min was found to be sufficient for the preparation of Indian gooseberry candy and retention of 315.5±19.53 mg/100g vitamin C was observed after blanching. The hardness and the chewiness of the blanched product were found to be 4.28±0.14N and 2.20±0.16N for 80oC 20 min samples. Cabinet drying of the blanched sample (80oC 20 min) at 70oC gave the maximum retention on the final candy (217.75±7.4 mg/100g), followed by microwave drying (178±11.21 mg/100g).
Keywords: Ascorbic acid, Blanching, Drying, Heat treatment, Indian gooseberry
INTRODUCTION
In comparison to the fat soluble vitamins, water soluble vitamins are of greater health concern as these cannot be stored in the body and their daily need is basically maintained through proper dietary intake. Indian gooseberry is an indispensable part in many traditional and alternative medicine systems like ayurveda and unani. The anti-inflammatory, anti-oxidant, anti-carcinogenic and anti-genotoxic effect of Indian gooseberry is well demonstrated [1]. The current study aimed to optimise the vitamin C content during processing of Indian gooseberry. In this study, we also screened vitamin c in some widely used local fruits and made a value added product that is acceptable and can be consumed by any age groups. Candies are popular today due to their high acceptability, lesser volume and longer shelf life at ambient conditions. Blanching is done during the candy processing in order to reduce the tannin content and increase the palatability while drying plays a major role in final product quality and shelf-life.
MATERIALS AND METHODS
Local fruits such as lime, pineapple, carambola, Indian gooseberry and wild gooseberries were first screened for their vitamin c content. For the processing of candy, first the Indian gooseberry were blanched at three different timings and temperatures, viz. 70°C, 80°C, 90°C for 10, 15, and 20 min and pressurized blanching conditions.
Most accurate vitamin C retention in these treated samples was found by 2,6-dichlorophenolindophenol dye titration method [2]. After the blanching process, the Indian gooseberry was steeped in sugar solution (75o brix) for three days and dried using microwave (600W) and cabinet drying (70°, 80°, and 90°C). Parameters such as colour, texture, Vitamin C, moisture content and Sensory characteristics (9 point hedonic scale) were analysed after each heat treatment. All data were analysed by ANOVA using SPSS statistical software package at the significant level of 0.05.
RESULTS AND DISCUSSION
The vitamin c content of various fruits is shown in Table I. The vitamin c content of fresh Indian gooseberry was the highest of all tested fruits with 469.98±11.62mg/100g fruit.
The vitamin C content of the fruits was estimated after blanching at different time-temperature combinations. The results showed that vitamin c retention decreased with increase in blanching time and temperature. The pressure cooked sample was found to have the least vitamin C retention with107.65±4.46 mg/100g.This reduction of ascorbic acid content was similar to the findings of Saini and Davar [3] who proved that the ascorbic acid losses are dependent on cooking time and temperature due to the thermal sensitivity of the vitamin C. The estimated vitamin C content after blanching is
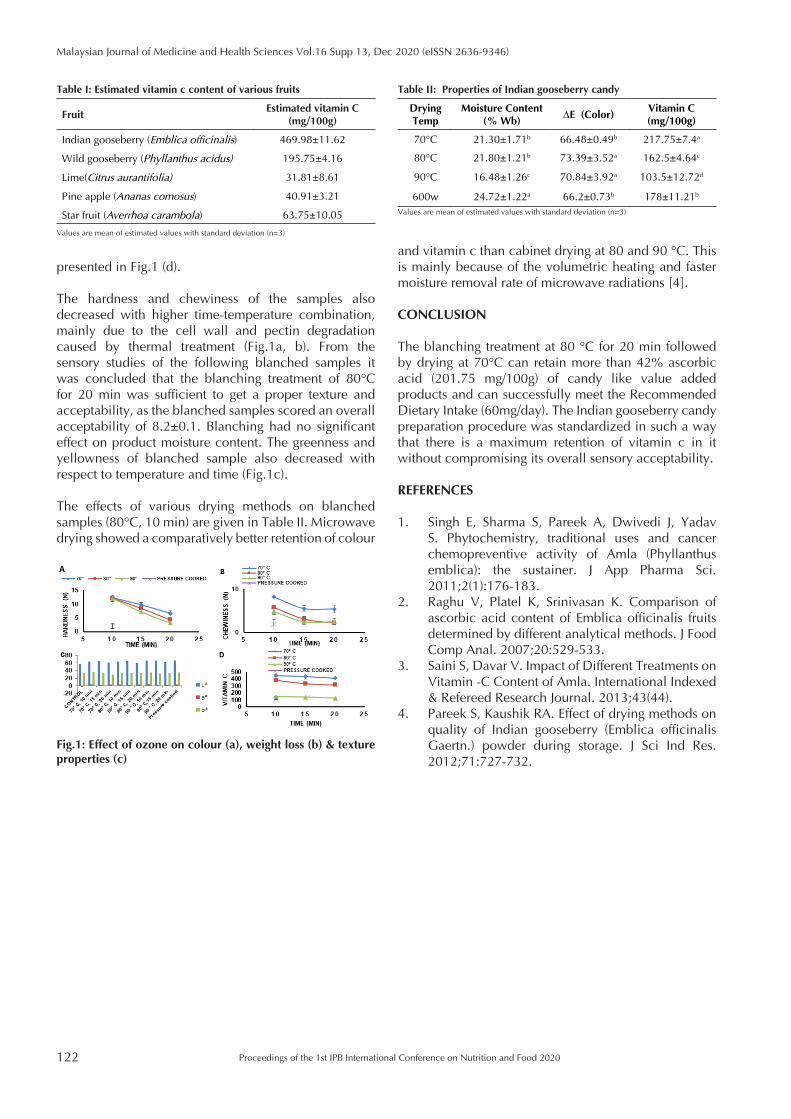
122
Malaysian Journal of Medicine and Health Sciences Vol.16 Supp 13, Dec 2020 (eISSN 2636-9346)
Proceedings of the 1st IPB International Conference on Nutrition and Food 2020
and vitamin c than cabinet drying at 80 and 90 °C. This is mainly because of the volumetric heating and faster moisture removal rate of microwave radiations [4].
CONCLUSION
The blanching treatment at 80 °C for 20 min followed by drying at 70°C can retain more than 42% ascorbic acid (201.75 mg/100g) of candy like value added products and can successfully meet the Recommended Dietary Intake (60mg/day). The Indian gooseberry candy preparation procedure was standardized in such a way that there is a maximum retention of vitamin c in it without compromising its overall sensory acceptability.
REFERENCES
1. Singh E, Sharma S, Pareek A, Dwivedi J, Yadav S. Phytochemistry, traditional uses and cancer chemopreventive activity of Amla (Phyllanthus emblica): the sustainer. J App Pharma Sci. 2011;2(1):176-183.
2. Raghu V, Platel K, Srinivasan K. Comparison of ascorbic acid content of Emblica officinalis fruits determined by different analytical methods. J Food Comp Anal. 2007;20:529-533.
3. Saini S, Davar V. Impact of Different Treatments on Vitamin -C Content of Amla. International Indexed & Refereed Research Journal. 2013;43(44).
4. Pareek S, Kaushik RA. Effect of drying methods on quality of Indian gooseberry (Emblica officinalis Gaertn.) powder during storage. J Sci Ind Res. 2012;71:727-732.
presented in Fig.1 (d).
The hardness and chewiness of the samples also decreased with higher time-temperature combination, mainly due to the cell wall and pectin degradation caused by thermal treatment (Fig.1a, b). From the sensory studies of the following blanched samples it was concluded that the blanching treatment of 80°C for 20 min was sufficient to get a proper texture and acceptability, as the blanched samples scored an overall acceptability of 8.2±0.1. Blanching had no significant effect on product moisture content. The greenness and yellowness of blanched sample also decreased with respect to temperature and time (Fig.1c).
The effects of various drying methods on blanched samples (80°C, 10 min) are given in Table II. Microwave drying showed a comparatively better retention of colour
Fig.1: Effect of ozone on colour (a), weight loss (b) & texture properties (c)
Table I: Estimated vitamin c content of various fruits
FruitEstimated vitamin C
(mg/100g)
Indian gooseberry (Emblica officinalis) 469.98±11.62
Wild gooseberry (Phyllanthus acidus) 195.75±4.16
Lime(Citrus aurantifolia) 31.81±8.61
Pine apple (Ananas comosus) 40.91±3.21
Star fruit (Averrhoa carambola) 63.75±10.05
Values are mean of estimated values with standard deviation (n=3)
Table II: Properties of Indian gooseberry candy
Drying Temp
Moisture Content (% Wb)
∆E (Color)Vitamin C (mg/100g)
70°C 21.30±1.71b 66.48±0.49b 217.75±7.4a
80°C 21.80±1.21b 73.39±3.52a 162.5±4.64c
90°C 16.48±1.26c 70.84±3.92a 103.5±12.72d
600w 24.72±1.22a 66.2±0.73b 178±11.21b
Values are mean of estimated values with standard deviation (n=3)


![-JJlililtJr-iloili]., - IPB Repository](https://img.pdfslide.net/doc/110x75/634f9e1ce543846a0d058cd1/-jjlililtjr-iloili-ipb-repository.jpg)


