Embed Size (px)
Citation preview

Brain and Language 92 (2005) 185–203
www.elsevier.com/locate/b&l
Process dissociation of sight vocabulary and phonetic decodingin reading: A new perspective on surface and phonological dyslexias
Patricia McDougall,a,*,1 Ron Borowsky,b,*,1 G.E. MacKinnon,c and Shelley Hymeld
a St. Thomas More College, University of Saskatchewan, 1437 College Drive, Saskatoon, Saskatchewan, Canadab Department of Psychology, University of Saskatchewan, 9 Campus Drive, Saskatoon, SK, Canada S7N 5A5
c Department of Psychology, University of Waterloo, 200 University Avenue West, Waterloo, Ont., Canada N2L 3GLd Department of Educational & Counselling Psychology and Special Education, Faculty of Education, University of British Columbia,
2125 Main Mall, Vancouver, British Columbia, Canada V6T 1Z4
Accepted 7 June 2004
Available online 30 July 2004
Abstract
Recent research on developmental dyslexia has suggested a phonological core deficit hypothesis (e.g., Manis, Seidenberg, Doi,
McBride-Chang, & Peterson, 1996; Stanovich, Siegel, & Gottardo, 1997) whereby pure cases of developmental phonological dyslexia
(dysfunctional phonetic decoding processing but normal sight vocabulary processing) can exist, but pure cases of developmental
surface dyslexia (dysfunctional sight vocabulary processing but normal phonetic decoding processing) should not. By applying Ja-
coby’s (1991) and Lindsay and Jacoby’s (1994) process dissociation procedure to the reading of regular and exception words, we
present a method that serves to estimate readers’ reliance on sight vocabulary and phonetic decoding during real word recognition.
These reliance estimates are then used in Castles and Coltheart’s (1993) regression-based approach to identify normal readers and
developmental dyslexics. This new method: (1) allows one to explore normal reading acquisition and both the delay and deviance
accounts of developmental dyslexia, (2) provides an alternative to matching dyslexics to both chronological-age and reading-age
control groups, and (3) uses only real words. We present evidence that pure cases of developmental surface dyslexia can be obtained
with both Castles and Coltheart’s measure as well as our own, and that developmental surface dyslexia is not simply a delayed reading
deficit. The theoretical importance and utility of estimates of reliance on sight vocabulary and phonetic decoding is discussed.
� 2004 Elsevier Inc. All rights reserved.
1. Introduction
We often take reading ability for granted. The cog-
nitive processes involved in reading have become so
well-learned that skilled word recognition has been de-
scribed by some as an automatic process (e.g., consider
the Stroop paradigm, where participants are to identifythe colour in which a word is presented, and perfor-
mance is decreased by the lack of congruency between
the word’s identity and its colour, such as the word
RED in the colour black, Stroop, 1935; see MacLeod,
1991, for a review; and Lindsay & Jacoby, 1994; as well
* Corresponding authors. Fax: +1-3069666630.
E-mail addresses: [email protected] (P. McDougall),
[email protected] (R. Borowsky).1 Both authors contributed equally to this work.
0093-934X/$ - see front matter � 2004 Elsevier Inc. All rights reserved.
doi:10.1016/j.bandl.2004.06.003
as Spieler, Balota, & Faust, 1996, for a process disso-
ciation of the Stroop effect). The presence of reading
disabilities (or dyslexias) in the form of both develop-
mental and acquired cases serve to remind us that
reading can be a very effortful (or even impossible)
process for some.
The present research involves the development of ameasure for assessing reliance on Sight Vocabulary (SV;
i.e., naming a word using whole-word orthographic
representations to access a phonological lexical repre-
sentation) and Phonetic Decoding (PD; i.e., naming a
word using sub-lexical spelling-sound correspondences,
which will often involve phonological lexical access gi-
ven that a child’s spoken vocabulary is typically quite
large when learning to read). Fig. 1 illustrates a frame-work for examining SV and PD processing, which shows
how dual-route models and single-route models differ in

Fig. 1. A framework for sight vocabulary (SV) and phonetic decoding (PD) processing in reading (see Owen & Borowsky, 2004a, for a revised
version).
186 P. McDougall et al. / Brain and Language 92 (2005) 185–203
terms of subsystems and their grouping (see alsoBorowsky, Owen, & Fonos, 1999; and Owen &
Borowsky, 2004a, for experiments that examine the
nature and direction of connections between subsystems
in this framework). Specifically, dual-route models
specify more subsystems, whereby SV and PD process-
ing can function independently across two processes,
whereas single-route models specify more grouping
whereby SV and PD processing can only operate re-dundantly within one process.
Our measure of reliance on SV and PD processing
differs from current approaches (e.g., Castles & Colt-
heart, 1993; Manis, Seidenberg, Doi, McBride-Chang &
Peterson, 1996; Stanovich, Siegel, & Gottardo, 1997)
mainly in that it does not use nonwords (e.g., ‘‘gead’’)
for which we have no set criteria, and no means of
phonological lexical assistance, to assess reliance on PDprocessing (see also Borowsky & Besner, 1991, 1993,
2000, for discussion of an additive factors approach to
examining reliance on processing routes, and Borowsky,
Owen, & Masson, 2002, for discussion how list context
effects on pseudohomophone naming reflect the degree
to which PD processing involves phonological lexical
access). When engaged in PD processing during normal
reading acquisition, the greater the extent to which weexpect the words presented to us to be real words (a fair
expectation), the greater the likelihood of phonological
lexical assistance, and thus the more problematic it is to
use nonwords as diagnostic stimuli for PD processing.
This problem also demands that our theories be more
specific about what is meant by PD processing (or ‘‘as-
sembled phonology’’). The present paper provides a
solution for this problem by presenting a new, theoret-ically derived approach for estimating reliance on SV
and PD processing that uses only word stimuli. Beforedescribing this approach, we will briefly discuss the
traditional methods for identifying dyslexic subtypes,
and some of the problems associated with the traditional
methods that can also be dealt with using this new ap-
proach.
2. Current methods for identifying developmental dyslexias
Castles and Coltheart (1993) presented a very influ-
ential regression-based approach to identifying surface
versus phonological subtypes of developmental dyslexia
(e.g., Manis et al., 1996; Stanovich et al., 1997; and
several others since). This method involves plotting
‘‘normal’’ naming accuracy as a function of chrono-
logical age (where ‘‘normal’’ readers achieved a readingage score that was within 6 months of their chronolog-
ical age), calculating a 90% sample confidence interval
around this ‘‘normal’’ regression line, and then over-
laying the plot of ‘‘dyslexic’’ naming accuracy as a
function of chronological age (where ‘‘dyslexic’’ readers
achieved a reading age equivalency below 18 months of
their chronological age). A surface dyslexic pattern is
exemplified by lower-than-normal accuracy at namingexception words (e.g., ‘‘two’’), reflecting the commonly
held assumption that exception word naming selectively
involves SV processing. A phonological dyslexic pattern
is exemplified by lower-than-normal accuracy at naming
pronounceable nonwords (e.g., gead), reflecting the
commonly held assumption that nonword naming se-
lectively involves PD processing, an assumption that we
will return to later. Castles and Coltheart found 10 oftheir 53 participants to be relatively pure surface dys-

P. McDougall et al. / Brain and Language 92 (2005) 185–203 187
lexics, 8 to be relatively pure phonological dyslexics,and 27 to be both surface and phonologically dyslexic.
We note that this dissociation between pure surface
and pure phonological dyslexia, along with the ex-
istence of cases that illustrate both of these dyslexic
subtypes, presents a compelling illustration of the
(mathematically) independent relationship between SV
and PD processes (see also Hendricks & Kolk, 1997),
as do several cases of acquired dyslexia (e.g., Badde-ley, Ellis, Miles, & Lewis, 1982; Castles & Coltheart,
1993).
2 Stanovich et al. presented a reanalysis of Castles and Coltheart’s
data using a reading age control group, which resulted in about half
the number of phonological dyslexic cases (17) and surface dyslexic
cases (6). We note that the cases of surface dyslexia were not entirely
eliminated after controlling for reading age.
3. The control group problem
The most contentious issue regarding Castles and
Coltheart’s (1993) method has been the nature of theircontrol group. Castles and Coltheart chose to use a
chronological age control group (i.e., dyslexic readers
matched to the control group of good readers on the
basis of chronological age). The utility of chronological
age controls has been debated extensively in the litera-
ture, with some researchers arguing that ‘‘reading age’’
controls must be used instead (e.g., Bryant & Impey,
1986; Snowling, Bryant, & Hulme, 1996), and othersarguing that it is informative to make comparisons to
both types of control groups (e.g., Manis et al., 1996;
Stanovich et al., 1997). We agree with the latter re-
searchers that both types of control groups are infor-
mative, in that chronological age controls provide an
initial perspective on the dyslexic readers in terms of
how delayed they are compared to good readers of the
same age (a comparison that will continue to define whois and who is not dyslexic in our elementary schools,
given that children are always grouped according to
chronological age). In contrast, the reading age controls
allow one to examine whether any cases exemplify de-
viant processing. The logic here is that when comparing
dyslexics to chronological age controls, any differences
may reflect either delay in acquisition of the particular
reading process, or the operation of a nonnormal (or‘‘deviant’’) reading process, whereas the comparison of
dyslexics to reading age controls allows one to control
for delay (as the participants are matched on reading
age), such that any differences can only reflect the op-
eration of a deviant reading process.
When using a chronological age control group, the
examination of developmental surface dyslexia by
Manis et al. (1996) and Stanovich et al. (1997) revealedseveral cases of surface dyslexia (15 in each study;
N ¼ 51 and 68, respectively). In contrast, using a read-
ing age control group revealed only one case in each of
their studies that could be considered as illustrating
surface dyslexia. Based on the finding that surface dys-
lexia cases seem to disappear when controlling for dif-
ferences in reading age, these authors have argued that
developmental surface dyslexia most likely represents adelay deficit.2
With respect to developmental phonological dyslexia,
Manis et al. (1996) and Stanovich et al. (1997) found
evidence for several cases in their two studies (17 in each
study) when a chronological age control group was used
as an index of normal performance. Moreover, these
researchers found several cases of phonological dyslexia
in their studies when a reading age control group wasused (12 and 17, respectively). Based on the finding that
several cases of phonological dyslexia remain when
controlling for reading age, these authors have sug-
gested that developmental phonological dyslexia cannot
be considered a delay deficit, and thus it most likely
reflects some form of deviant processing.
4. The matching problem
The low numbers of surface dyslexia cases observed
when reading age is controlled (compared to when
chronological age controls are used) has led to the
suggestion that developmental surface dyslexia repre-
sents a developmental delay deficit (Manis et al., 1996;
Stanovich et al., 1997). An alternative interpretation ofwhy there are so few cases of developmental surface
dyslexia when participants are matched on reading age
has to do with how participants were matched. In both
the Manis et al. and Stanovich et al. studies, reading age
control participants were matched to the dyslexics on
the basis of their real word reading performance (i.e., the
Word Identification subtest from the Woodcock Read-
ing Mastery Test-Revised [WRMT-R; Woodcock,1987], and the Wide Range Achievement Test-Revised
[WRAT-R; Jastak & Wilkinson, 1984], respectively, in
these studies). Given that surface dyslexia is, by defini-
tion, an impairment of SV processing that specifically
serves to access lexical phonology for real words only,
we should not be surprised that cases of surface dyslexia
are reduced (relative to cases of phonological dyslexia)
when participants are matched on the basis of real wordreading performance. Clearly, it is important to not let
the participant matching procedure bias the identifica-
tion of dyslexic subtypes.
It is possible that this matching bias could have in-
fluenced Manis et al.’s (1996) and Stanovich et al.’s
(1997) findings regarding the nature of surface dyslexia.
We note that these authors have themselves acknowl-
edged this problem (e.g., Manis et al., 1996; Stanovich,Nathan, & Vala-Rossi, 1986), and that additional

188 P. McDougall et al. / Brain and Language 92 (2005) 185–203
problems with using reading age controls have beendebated in the literature (e.g., Coltheart, 1987; Jackson
& Butterfield, 1989; Stanovich & Siegel, 1994, but see
Bryant & Impey, 1986, and Snowling et al., 1996, for an
alternative view). Ideally, the types of stimuli that have
been used for the purpose of matching should not bias
one’s method for identifying cases of dyslexia. Given
that we are most interested in SV and PD processing in
the context of real word reading, it seems appropriate touse real words for the purposes of both matching and
identification. However, the use of nonwords as stimuli
for diagnosing PD processing and phonological dys-
lexia, along with using exception words as stimuli for
diagnosing SV processing and surface dyslexia, has be-
come somewhat of a convention in reading assessment.
5. The nonword problem
Accuracy in naming nonword stimuli is used as a
process-pure measure of PD processing ability in the
Castles and Coltheart (1993) regression-based method
described above. We argue that nonword stimuli can be
considered problematic for studying word reading pro-
cesses. For example, pronounce gead to yourself. Didyou pronounce it to rhyme with ‘‘bead’’ or ‘‘head,’’ and
was the ‘g’ hard (e.g., ‘‘gun’’) or soft (e.g., ‘‘gem’’)?
Which is the ‘‘correct’’ pronunciation, or are there sev-
eral ‘‘correct’’ pronunciations? Will another researcher
be as conservative or as liberal as you in selecting their
criteria for naming this nonword stimulus? Even if
consistent scoring criteria were adopted across labora-
tories, would we really be measuring PD ability as it isinvolved in real word reading? Recent research suggests
that both SV and PD processes are relied on to different
degrees when the reader is expecting all responses to
sound like real words that they know, than when all
responses are novel, or when some mixture of the two is
presented (e.g., Baluch & Besner, 1991; Borowsky et al.,
2002; Marmurek & Kwantes, 1996; Monsell, Patterson,
Graham, Hughes, & Milroy, 1992). Using an index oflexical access such as the magnitude of the word-fre-
quency effect during word identification, these studies
support the notion that PD is relied on more when the
stimulus set includes nonwords, and that SV is relied on
more when the stimulus set includes words (especially
exception or irregular words, which can only be named
correctly by relying on SV processing, e.g., yacht, pint).3
3 On this point, it is interesting to note that Castles and Coltheart
(1993) used a mixed presentation of their diagnostic exception word
and nonword stimuli, and found several more cases of phonological
developmental dyslexia than either Manis et al. (1996) or Stanovich
et al. (1997), who presented their diagnostic exception words and
nonwords in pure blocks. It would be interesting to examine whether
the discrepancy between the number of phonological developmental
dyslexics found in these studies could be partly attributable to whether
the diagnostic stimuli are presented in a mixed block or pure blocks.
However, and more importantly, the point here is thatnonwords may not make for a valid, process-pure
measure of PD in the context that we are interested in,
namely, a normal reading context in which real words
are expected. Although nonword naming performance
may reflect a reader’s ability to use PD when confronted
with letter strings that are both orthographically and
phonologically unfamiliar, it may not serve as a very
good measure of a reader’s reliance on PD duringphonological lexical access (arguably, a more common
occurrence during reading acquisition). Furthermore,
recent frameworks and models of visual word recogni-
tion have paid considerably more attention to the fact
that new readers typically have a large phonological
vocabulary consisting of familiar words prior to their
acquisition of orthographic representations (e.g.,
Borowsky et al., 1999; Harm & Seidenberg, 1999).
6. The process dissociation approach to estimating
reliance on SV and PD processes
Current frameworks and models of word recognition
have informed our development of this method. Briefly,
there are many dual-route models of word recognitionthat subscribe to the notion that there are two mathe-
matically independent routes involved in computing
pronunciations from print (see Fig. 2; e.g., Besner &
Smith, 1992; Borowsky et al., 1999; Coltheart, Curtis,
Atkins, & Haller, 1993; Coltheart, Rastle, Perry, Lang-
don, & Ziegler, 2001; Paap, McDonald, Schvaneveldt, &
Noel, 1987; Zorzi, Houghton, & Butterworth, 1998). We
are using the term ‘‘independent’’ in its strict mathe-matical sense, whereby the two processing routes can
contribute separately, or jointly, to the response. Gen-
erally speaking, reliance on PD processing can produce
correct pronunciations only for words with regular
spelling-sound correspondences, while reliance on SV
processing can produce correct pronunciations of words
with either regular or irregular spelling-sound corre-
spondences, as long as they are familiar to the readerand thus included in their SV. A recent method for de-
riving estimates of reliance on independent processes has
been provided by Jacoby (1991, process dissociation
procedure), and it has seen considerable development in
the literature (e.g., Jacoby, McElree, & Trainham, 1999;
Joordens & Merikle, 1993; Lindsay & Jacoby, 1994;
Fig. 2. Venn diagram of the relationship between sight vocabulary (SV)
and phonetic decoding (PD) reading processes.

P. McDougall et al. / Brain and Language 92 (2005) 185–203 189
Spieler et al., 1996; Trainham, Lindsay, & Jacoby,1997). This procedure can be applied to estimating re-
liance on PD and SV during real word recognition in a
manner similar to Lindsay and Jacoby’s (1994; see also
Hillstrom & Logan, 1997; Spieler et al., 1996; Trainham
et al., 1997) process dissociation of reliance on word
reading and colour naming in the Stroop task (i.e., name
the colour in which a word has been presented).
The procedure requires one experimental conditionthat allows either processing route to contribute to a
correct response, and another experimental condition in
which only one of the processing routes can contribute
to a correct response. Lindsay and Jacoby (1994) co-
gently argued that a congruent Stroop item (e.g., the
word BLUE presented in the colour blue) fulfils the
former experimental condition in that either word
reading or colour naming can contribute to a correctresponse (i.e., ‘‘blue’’). They further argued that an in-
congruent Stroop item (e.g., the word BLUE presented
in the colour red) fulfils the latter experimental condi-
tion in that only the colour naming process can con-
tribute to a correct response (i.e., ‘‘red’’). An analogous
situation exists with regular words and exception words
in models of basic reading processes that deal with the
distinction between SV and PD processing. Currentmodels have assumed that regular words (e.g., mint,
hint, flint, rave, save, and crave) are correctly pro-
nounced by either processing route (PD or SV), whereas
exception words (e.g., pint, have, yacht, and aisle) can
only be pronounced correctly by using one of the pro-
cessing routes (i.e., SV), but not the other. Thus, the
former experimental condition can be satisfied by having
children pronounce regular words, and the latter ex-perimental condition can be satisfied in a similar fashion
by having children pronounce exception words.
Given the assumption that these processing routes are
independent, two equations involving overall correct
response probability and two unknown reliance vari-
ables can be derived and solved. In the equations which
follow, PD represents reliance on PD, and SV represents
reliance on SV:
pðcorrectjregular wordsÞ ¼ PDþ SV� ðPD � SVÞ; ð1Þ
pðcorrectjexception wordsÞ ¼ SV� ðPD � SVÞ: ð2Þ
Eq. (1) states that the overall probability of correctpronunciation given regular words reflects the propor-
tion of trials that (the reader) relied on either processing
routine, minus their ‘‘intersection’’ (i.e., the proportion
of trials relying on both routes). The second equation
states that the overall probability of correct pronuncia-
tion given exception words reflects the proportion of
trials that relied on SV, minus the proportion of trials
involving both routes. The intersection of the two routes(i.e., PD*SV) is subtracted in the first equation because
the proportion of trials involving both routes is included
twice through the separate estimates of PD and SV re-liance, whereas the intersection is subtracted in the sec-
ond equation because any reliance on PD will yield an
incorrect pronunciation of an exception word.These
equations can be simplified to:
pðcorrectjregular wordsÞ ¼ PDþ SVð1� PDÞ; ð3Þ
pðcorrectjexception wordsÞ ¼ SVð1� PDÞ: ð4Þand rearranged for solving reliance on PD and SV:
PD ¼ pðcorrectjregular wordsÞ� pðcorrectjexception wordsÞ ð5Þ
SV ¼ pðcorrectjexception wordsÞ=ð1� PDÞ ð6Þ
Eq. (5) clearly illustrates how reliance on PD is esti-
mated by subtracting the proportion of correctly named
exception words from the proportion of correctly namedregular words. From what we know about regularity
effects during word naming for skilled readers of En-
glish, there is a small but reliable advantage for naming
regular words, and thus the estimate of reliance on PD
should usually be a small and positive value for skilled
readers (see also Manis, Szeszulski, Holt, & Graves,
1990; Olson, Kliegl, Davidson, & Foltz, 1985; Stanovich
& Siegel, 1994). These equations make intuitive senseonce one examines the possible extremes in perfor-
mance. For example, for the particular set of words
presented, if one was to never rely on PD but always rely
on SV, then you would not expect regular word naming
accuracy to exceed exception word naming accuracy
(assuming the use of stimuli that are well matched on
variables like word frequency, grade level, and length),
and the estimate of reliance on PD would equal zerowhile the estimate of reliance on SV would be equal to
the proportion of correctly named exception words. If
one was to never rely on SV, but always on PD, then one
would expect the proportion of correctly named excep-
tion words to equal zero, and thus the reliance on SV
will be zero, and reliance on PD would be estimated by
the proportion of correctly named regular words. In-
terestingly, if one correctly names fewer regular wordsthan exception words, then PD reliance must be inhib-
ited relative to SV reliance, and a negative value for PD
reliance would result. We note that negative values are
theoretically possible whenever this version of the pro-
cess dissociation procedure is used to estimate inde-
pendent processes (comparable to the situation where
accuracy in the incongruent condition of the Stroop task
exceeds accuracy in the congruent condition), and maygenerally represent the participant’s attempt to inhibit
the dominant process. For example, in the Stroop task,
if one was presented with a congruent item like the word
BLUE in the colour blue and is consciously trying to
inhibit the word, then the participant may experience
more difficulty resolving a congruent trial word code

190 P. McDougall et al. / Brain and Language 92 (2005) 185–203
(‘‘not BLUE’’) with the colour code (‘‘blue’’), than anincongruent trial word code (e.g., for the word RED in
the colour blue, the inhibited word code would be ‘‘not
RED’’) with the colour code (e.g., ‘‘blue’’; see Merikle &
Cheesman, 1987, for evidence of a reverse Stroop effect
when the proportion of incongruent trials is high).
These equations also assume that PD is the ‘‘domi-
nant’’ process (i.e., when both PD and SV processing are
completed at the same time, PD is relied on, and thuswould contribute to naming errors on exception words;
see also Lindsay & Jacoby’s (1994) assumption that
word naming dominates over colour naming in the
Stroop task). While we believe that this assumption is
appropriate for developing readers, one might prefer to
assume that SV is the dominant process for skilled
readers of English. Assuming that SV is the dominant
process would result in the following equations:
pðcorrectjregular wordsÞ ¼ PDþ SV� ðPD � SVÞ; ð7Þ
pðcorrectjexception wordsÞ ¼ SV ð8ÞEq. (7) can be simplified to:
pðcorrectjregular wordsÞ ¼ SVþ PDð1� SVÞ; ð9Þand both equations can be rearranged for solving reli-
ance on PD and SV:
SV ¼ pðcorrectjexception wordsÞ ð10Þ
PD ¼ ðpðcorrectjregular wordsÞ� pðcorrectjexception wordsÞÞ=ð1� pðcorrectjexception wordsÞÞ: ð11Þ
We will return to a discussion of these SV-dominantequations, and how they impact the identification of
dyslexics, in Section 9. To foreshadow, our identification
of dyslexics does not change dramatically as a function
of whether PD or SV is assumed to be the dominant
process.
7. The present study
The obtained estimates of reliance on PD and SV
processing can be used in the regression-based method
for identifying phonological and surface dyslexics in the
same way that previous researchers used nonword and
exception word naming accuracy (e.g., Castles & Colt-
heart, 1993; Manis et al., 1996; Stanovich et al., 1997).
In the current study, we present an extension of Castlesand Coltheart’s (1993) regression-based methodology
that: (1) allows us to explore normal reading develop-
ment and both the delay and deviance accounts of de-
velopmental dyslexia, (2) provides an alternative to
matching dyslexics to two separate control groups, and
(3) uses only real words. We present regression plots of
the dependent variables: (1) as a function of chrono-
logical age, and, (2) residualized on reading age, andthen plotted as a function of chronological age. This
type of ‘‘statistical matching’’ has been used by other
researchers (e.g., Stanovich & Siegel, 1994), and has
been argued to be advantageous in terms of maximizing
external validity over matching by sample selection (e.g.,
Jackson & Butterfield, 1989).
8. Method
8.1. Participants
In the first phase of data collection, 202 students in
grades 2 through 5 were recruited from 11 classrooms in
two elementary schools. In an effort to obtain a greater
number of challenged readers, we recruited an addi-tional 22 students in a second phase of data collection.
Remaining within the same school district, Phase 2 data
were collected from teacher-referred students in three
elementary schools. Specifically, teachers were asked to
nominate grade 2–5 students in their classroom who
were considered to be struggling readers and who were
viewed as doing more poorly than their classmates. The
majority of the students in Phase 2 (77%) were receivingremedial support beyond their regular classroom in-
struction in the areas of reading, spelling and language.
The total sample consisted of 224 students in grade 2
(n ¼ 59, 33 boys, mean age¼ 7 years 8 months), grade 3
(n ¼ 55, 21 boys, mean age¼ 8 years 8 months), grade 4
(n ¼ 63, 35 boys, mean age¼ 9 years 9 months), and
grade 5 (n ¼ 47, 24 boys, mean age¼ 10 years 8
months). All students received parental consent for theirparticipation.
8.2. Apparatus
Micro Experimental Laboratories (MEL) software
and a NEC Versa laptop computer controlled the
stimulus displays, the timing of events, and recorded
the data. The stimuli were presented in monochrome onthe laptop computer screen in a sans serif font measur-
ing 7mm in height and 5mm in width (with ascenders
10mm high). Participants controlled the rate of stimulus
presentation by pressing the space-bar on the computer
keyboard. Accuracy of participant’s naming response
was coded by the experimenter using a MEL button-
box.
8.3. Materials and procedure
Phase 1 data were collected in March, April, and May
of the school year. The second phase of testing was
conducted one year later during the month of May. All
data were collected during 35–45min individual sessions
conducted in a quiet room within the school setting.

4 A goal for future research would be to treat the reliance estimates
as inferential (i.e., generalizable to the reading of an entire population
of words) instead of just descriptive. To do so would require one to use
a sample of words that would be representative of the population of
words (as ever-changing as that population must be, but it certainly
must include more low frequency, and ‘‘unknown’’ words than what
we used). Following this logic, and assuming that no single person
knows all of the words of the language, such a sample of words must
include some ‘‘unknown’’ words in order for it to be convincing as an
inferential test. Clearly, we are not there yet, but it is possible to create
larger sets of graded (and matched) regular and exception words in
order to work towards an inferential test. In its current form, the
reliance estimates speak to the issue of correct responding given the set
of words used, and cannot be taken strictly as estimating all-or-none use
of SV and PD processes. Consider an error in naming a regular word as
an example. Our assumption of mathematical independence between
SV and PD processes clearly allows either, or both, processes, to
contribute to correct responding. With respect to misreading a regular
word, it would be misread if the child is unfamiliar with a particular
spelling-sound mapping. Such mappings may be regular in the
language, but one still needs to be exposed to them over time in order
to learn them. The child made an error because the relevant
information was not available to them through either the PD or SV
process, but that does not imply that neither process was engaged, just
that neither process could provide a correct response.
P. McDougall et al. / Brain and Language 92 (2005) 185–203 191
Each participant was seated in front of a laptop com-puter with the experimenter sitting directly beside. At
the outset of the session participants were instructed
that they were going to see some things to read on the
computer screen, some of which they might find easy
and some they might find hard, that they were not ex-
pected to know all of them, and that we just wanted
them to try as hard as they could to read them.
Each of the specific tasks are described below in theorder in which they were administered. Unless otherwise
specified, each task involved isolated word naming using
the laptop computer to present the stimuli. Each trial
involved the following sequence of events: (1) a fixation
cross appeared, (2) the participant initiated the trial by
pressing the space bar, (3) a stimulus appeared after
275ms, (4) the stimulus remained on the screen for a set
length of time (see each task below), and (5) the par-ticipant’s naming response was coded by the experi-
menter as correct or incorrect. Following each trial,
participants were not given any feedback regarding the
accuracy of their response.
8.4. Word identification subtest
The Word Identification subtest from the WoodcockReading Mastery Tests-Revised, Form H (Woodcock,
1987) is a widely used standardized measure of sight
vocabulary (SV) and phonetic decoding (PD) ability
together. The Word Identification subtest contains a
total of 106 items (no practice trials) including both
regular and exception words. In the present study, we
followed the standardized protocol provided for this
subtest and gave the prescribed instructions. However,instead of entering the stimulus list at varying starting
points (based on the experimenter’s estimate of the
child’s reading ability) and establishing a basal level, we
had all participants begin with the first item. We utilized
the exit or ceiling criteria prescribed for the subtest
whereby testing is discontinued when the participant
makes six errors in a row that end with the last item in a
subset (see WRMT-R manual). Consistent with stan-dardized administration, each stimulus was presented on
the screen for 5000ms. If a participant provided no re-
sponse during this five second period, the item was co-
ded as an error. Previous research from our lab has
shown that the traditional (i.e., easel) and computerized
methods of administering this subtest are comparable
(Borowsky, McDougall, Hymel, & MacKinnon, 1997).
8.5. Process dissociation task
The process dissociation task was designed to mea-
sure reliance on SV versus PD without using nonword
stimuli. The task involved a set of 55 pairs of regular
and exception words (see Appendix A) plus four prac-
tice words, presented in a fixed, pre-randomized order
(i.e., block 1 contained a randomized order of the first66 items, block 2 contained a randomized order of items
67–76, and block 3 was a randomized set of items 77–
110). In order to ensure that the PD and SV processes
involved in exception word reading are the same as for
regular word reading, each pair of regular and exception
words was matched on word frequency, initial phoneme,
word length, and grade level. Graded word lists from
seven commercially available Informal Reading Inven-tories (IRIs) were used to estimate word frequency
ranges that are typical of words at different grade levels.
Words were compiled without replacement across IRIs
to yield samples of words from Primer to Grade 6 (n’s
varied from 82 to 121 words per level). While there was
some overlap across samples from adjacent graded lists
in the distributions of word frequency [using the The
Word Frequency Guide (Zeno, Ivens, Millard, & Duvv-uri, 1995)], a nonoverlapping word frequency range for
each grade was defined using the range from the median
frequency and above at a particular level to just below
the frequency of the median at an adjacent lower level.
This procedure yielded the following ranges: Pre-Primer
Words, >2133; Primer, 1431–2133; Grade 1, 1430–679;
Grade 2, 678–194; Grade 3, 193–59; Grade 4, 58–13;
Grade 5, 12–8; and Grade 6, 7–5. These ranges werethen used to estimate the grade levels of the words used
in this task. Words in block 1 ranged from pre-primer to
grade 3.5 whereas block 2 contained words at the 3.5
grade level and block 3 words ranged from grades 4 to
7.4 Each item remained on the screen for a 5000ms in-
terval and participants were instructed to respond as
quickly and accurately as possible. When the participant
did not respond within the 5000ms interval, the item

5 Due to equipment problems, one participant was unable to
participate in the Castles and Coltheart (1993) diagnostic naming task,
and two participants were unable to participate in the orthographic
choice task.6 We did not encounter any division by zero problems because they
are restricted to one scenario. In order to obtain a zero in the
denominator of Eq. (6), it is necessary for PD reliance to equal 1,
which would imply that the participant named all regular words
correctly, and named none of the exception words correctly. If no
exception words have been named correctly, then the numerator of Eq.
(6) also becomes zero. In this case, the division by zero problem could
be handled by substituting a value slightly less than 1 for PD reliance
(e.g., .999), resulting in an estimate of SV reliance equal to zero. It
makes sense that SV reliance should equal zero in this case, because
any degree of reliance on SV should have yielded an accuracy value for
naming exception words that is greater than zero.
192 P. McDougall et al. / Brain and Language 92 (2005) 185–203
was coded as an error. Testing was discontinued if aparticipant made errors on all of the items in block 2
(only one participant stopped at this point).
8.6. Castles and Coltheart (1993) exception and
nonword stimuli
Castles and Coltheart’s (1993) set of 30 inconsistent/
exception words and 30 pronounceable nonwords wereincluded in the present study. This set of stimuli was
included to measure what we refer to as SV and PD
‘‘ability’’ (i.e., nonword naming performance may reflect
a participant’s ability to use PD when confronted with
unfamiliar letter strings), and to allow for comparison
with our process dissociation task (which measures a
participant’s reliance on PD and SV when confronted
with real words). In contrast to Castles and Coltheart,who presented each item for unlimited time, we re-
stricted the stimulus presentation duration to 10,000ms.
Items were presented in a random order and partici-
pants were encouraged to respond as accurately as
possible. If a participant did not respond within 10 s, an
error was recorded for that item.
8.7. Orthographic choice task
The orthographic choice task consisted of 50 experi-
mental trials plus two practice trials and was designed to
measure orthographic lexical knowledge. The task was
adopted from Manis et al. (1996), although we dropped
two of their original 52 experimental items because of
overlap with the Word Identification subtest of the
WRMT-R (described above). Items were presented inrandom order. The experimenter initiated each trial by
pressing the space bar, following which participants saw
two horizontally presented stimuli; one was a correctly
spelled word (e.g., train) and the other was a pseud-
ohomophone (e.g., trane). Participants were instructed
to indicate which was the correctly spelled word by
pressing the left or right key on a button-box which
corresponded with the position of the items on thescreen. Although participants were encouraged to re-
spond as quickly and accurately as possible, each pair of
items remained on the screen until the participant re-
sponded.
8.8. Position analysis task
The position analysis task adopted from Manis et al.(1996) is an orally administered phonemic awareness
task and did not involve the use of a computer. The task
was designed to measure the ability to sequence, seg-
ment and produce a variety of phonemes and consisted
of 24 nonwords plus four practice trials. In an effort to
ensure that participants had in fact correctly heard an
item, they were first asked to listen to and repeat a
nonword (e.g., say ‘‘grive’’). After correctly repeatingthe item, participants were asked to identify a phoneme
that came either before or after a designated sound (e.g.,
‘‘What sound comes before the sound ‘‘r’’ in ‘‘grive’’).
The stimulus list was presented in a fixed order and
organized such that the first 12 experimental items in-
volved naming a sound after the target phoneme and the
second 12 involved naming sounds before the target
phoneme. Target sounds varied across items to includeeight items with a target sound in the initial consonant
cluster, eight items with a target sound in the final
consonant cluster and eight items which involved vowel
sounds. Consistent with the instructions utilized by
Manis et al. participants were encouraged to respond
with phonemes, but were not penalized for using letter
names. Feedback regarding the correctness of responses
was provided on the practice trials only. Verbatim re-sponses were recorded by the experimenter. If a partic-
ipant did not respond within 10 s, the item was coded as
incorrect.
9. Results
Sample size, minimum, maximum, mean, upper, andlower 95th percentile confidence interval around the
mean, and standard deviation for each measure, as a
function of reading ability, are given in Table 1.5 Castles
and Coltheart’s exception word and nonword naming
accuracy represent the number of correct responses out
of 30. The estimates of reliance on PD were computed
by use of Eq. (5) as described in the introduction, and
can range between 1 and )1 (although the typical rangeis between 1 and close to 0, as a negative value will only
occur when a participant names exception words with
greater accuracy than regular words, which occurred in
only five cases in our sample). As mentioned earlier, a
negative value in this context may represent inhibition
of reliance on the process (i.e., PD). The estimates of
reliance on SV were computed by Eq. (6) as described in
the introduction, and can range from 1 to 0.6 Age and

Table 1
Sample size, minimum, maximum, mean, upper, and lower 95% confidence limits around the mean, and standard deviations of measures for good
and poor (i.e., Dyslexic) readers
EX NW PD SV AGE R.AGE ORTH POSANA
Good readers
N 197 197 198 198 198 198 196 198
Min 2.000 3.000 )0.055 0.164 85.000 81.000 20.000 2.000
Max 23.000 30.000 0.436 1.000 137.000 222.000 48.000 24.000
Mean 14.645 20.503 0.130 0.887 111.152 121.722 35.643 19.056
95% Upper 15.237 21.404 0.140 0.907 113.035 125.066 36.497 19.599
95% Lower 14.053 19.602 0.119 0.868 109.268 118.379 34.789 18.512
SD 4.213 6.412 0.076 0.140 13.442 23.857 6.063 3.875
Poor readers
N 26 26 26 26 26 26 26 26
Min 2.000 0.0 )0.109 0.180 88.000 80.000 20.000 5.000
Max 14.000 20.000 0.273 0.857 141.000 102.000 40.000 24.000
Mean 8.231 10.269 0.125 0.585 112.115 92.462 29.654 15.385
95% Upper 9.827 12.640 0.158 0.674 117.672 95.424 31.745 17.558
95% Lower 6.634 7.899 0.092 0.497 106.559 89.500 27.563 13.211
SD 3.953 5.869 0.082 0.220 13.756 7.333 5.176 5.382
EX, exception word naming accuracy; NW, nonword naming accuracy; PD, reliance on phonetic decoding; SV, reliance on sight vocabulary;
AGE, chronological age; R.AGE, reading age; ORTH, orthographic choice task accuracy; and POSANA, position analysis task accuracy.
P. McDougall et al. / Brain and Language 92 (2005) 185–203 193
reading age are expressed in number of months. Or-
thographic choice task accuracy represents the number
of correct choices out of 50. Position analysis task
accuracy represents the number of correct responses outof 24.
To be considered as a ‘‘good’’ reader, a participant
was required to score higher than the 15th percentile on
the Word Identification subtest of the WRMT-R (i.e.,
no less than 1 SD below the mean of the normative
distribution). Participants who scored equal to or less
than the 15th percentile on this subtest were considered
to be dyslexic, or ‘‘poor’’ readers (i.e., 16 of the 202students from the first phase of data collection, and 10
of the 22 students from the second phase).
Independent t tests revealed significant, systematic
differences between the good and poor readers (in fa-
vour of good readers) on almost all measures, support-
ing the validity of the groups (i.e., Castles & Coltheart’s
exception words (EX), tð221Þ ¼ 7:346, p < :001; Castles& Coltheart’s nonwords (NW), tð221Þ ¼ 7:719,p < :001; reliance on SV (SV), tð222Þ ¼ 9:576, p < :001;
Table 2
Matrix of correlations between measures
EX NW PD
NW .740�
PD ).219� .018
SV .859� .816� .046
AGE .552� .360� ).265�
R.AGE .787� .740� ).275�
ORTH .790� .627� ).302�
POSANA .454� .612� .030
EX, exception word naming accuracy; NW, nonword naming accuracy;
AGE, chronological age; R.AGE, reading age; ORTH, orthographic choice* p < :01.
reading age from the Word Identification subtest of the
WRMT-R (R. AGE), tð222Þ ¼ 6:205, p < :001; ortho-graphic choice task (ORTH), tð220Þ ¼ 4:807, p < :001;and the position analysis task (POSANA),tð222Þ ¼ 4:321, p < :001), except for reliance on PD
(PD), tð222Þ ¼ :276, p ¼ :783, and chronological age
(AGE), tð222Þ ¼ :343, p ¼ :732. The apparent equiva-
lency between good and poor readers on PD is com-
promised by an interaction with AGE, which will be
discussed later.
Overall correlations among these measures (including
all participants) are presented in Table 2. Most pairwisecorrelations are significant and positive, and reflect the
typical relationships between measures related to read-
ing skill (as indexed by R.AGE), and thus to each other.
All significant correlations involving PD reliance were
negative, suggesting that reliance on PD decreases with
age, reading age, and orthographic knowledge. Given
that this is an index of reliance on PD, and not an index
of PD ability, these negative correlations appeal to ourintuitions that reliance on PD would decrease as a
SV AGE R.AGE ORTH
.431�
.677� .522�
.674� .505� .764�
.493� .184� .471� .352�
PD, reliance on phonetic decoding; SV, reliance on sight vocabulary;
task accuracy; and POSANA, position analysis task accuracy.
7 Our method for statistical matching differs somewhat from
Stanovich and Siegel’s (1994) method, who fully partial the influence of
the to-be-controlled variable from the dependent variable (DV) and
other independent variables (IVs) by way of a standard, simultaneous
multiple regression. We remove the influence of the to-be-controlled
variable (i.e., reading age) from the DV only by first residualizing the
DV on the to-be-controlled variable, and then regressing the residu-
alized DV on the IVs. We prefer our approach in that it removes only
the variability that is shared between the DV and reading age from the
DV only, and not from the other IVs (e.g., chronological age), and so
avoids removing everything that is related to reading age from the
other IVs. Our approach also allows us to plot performance as a
function of an intact IV (i.e., chronological age), and thus apply the
regression-based approach for identifying dyslexic cases. However, we
have performed all of the relevant multiple regressions that represent
Stanovich and Siegal’s full partialing approach, only to find the same
pattern of results, with the same effects holding at a ¼ :05.
194 P. McDougall et al. / Brain and Language 92 (2005) 185–203
function of increasing age and reading experience (asindexed by AGE and R.AGE), and as a function of an
increasing number (and quality) of representations in
the orthographic lexicon (as indexed by EXC and
ORTH). This distinction between reliance and ability is
also illustrated by the lack of correlations between PD
reliance and a phonemic awareness task (POSANA),
and a traditional measure of PD ability (NW). The lack
of a significant correlation between PD and SV relianceis also of no surprise given the independent nature of the
equations that produced them.
9.1. Identification of dyslexic subgroups using Castles
& Coltheart’s task
Our analysis of Castles and Coltheart’s (1993) task
reflects some changes in method that we felt were im-portant to implement in our study. First, instead of
trying to capture the good readers’ scatterplot perfor-
mance within a parallelogram-like figure, which Castles
and Coltheart (and others, e.g., Manis et al., 1996;
Stanovich et al., 1997) have done by drawing confidence
limits around the regression line, we computed 95%
confidence sample ellipses in order to capture the good
readers’ performance (see Fig. 3). These ellipses areGaussian bivariate confidence intervals centered on the
sample means of the x and y variables. The unbiased
sample SDs of x and y determine major axes, whereas
the sample covariance between x and y determines the
orientation. We argue that Gaussian bivariate ellipses
are much better at capturing the continuous and distri-
butional nature of the data, and more closely reflect the
underlying distribution of the data than do confidencelimits around a regression line. Using confidence limits
around a regression line to capture data involves an
assumption that the distribution of the variable along
the x axis is rectangular, whereas using the Gaussian
bivariate ellipse assumes that both the x and y variables
are better approximated by a normal distribution. Vi-
sual inspection of our data supported the assumption
that our variables are best approximated by a normaldistribution. Second, instead of attempting to match
dyslexic participants to (multiple) control group partic-
ipants, we adopted a reasonable criterion for discrimi-
nating between good and poor readers, and plotted
exception word and nonword accuracy: (1) as a function
of chronological age (see Figs. 3A and C), and (2) re-
sidualized on reading age, and then plotted as a function
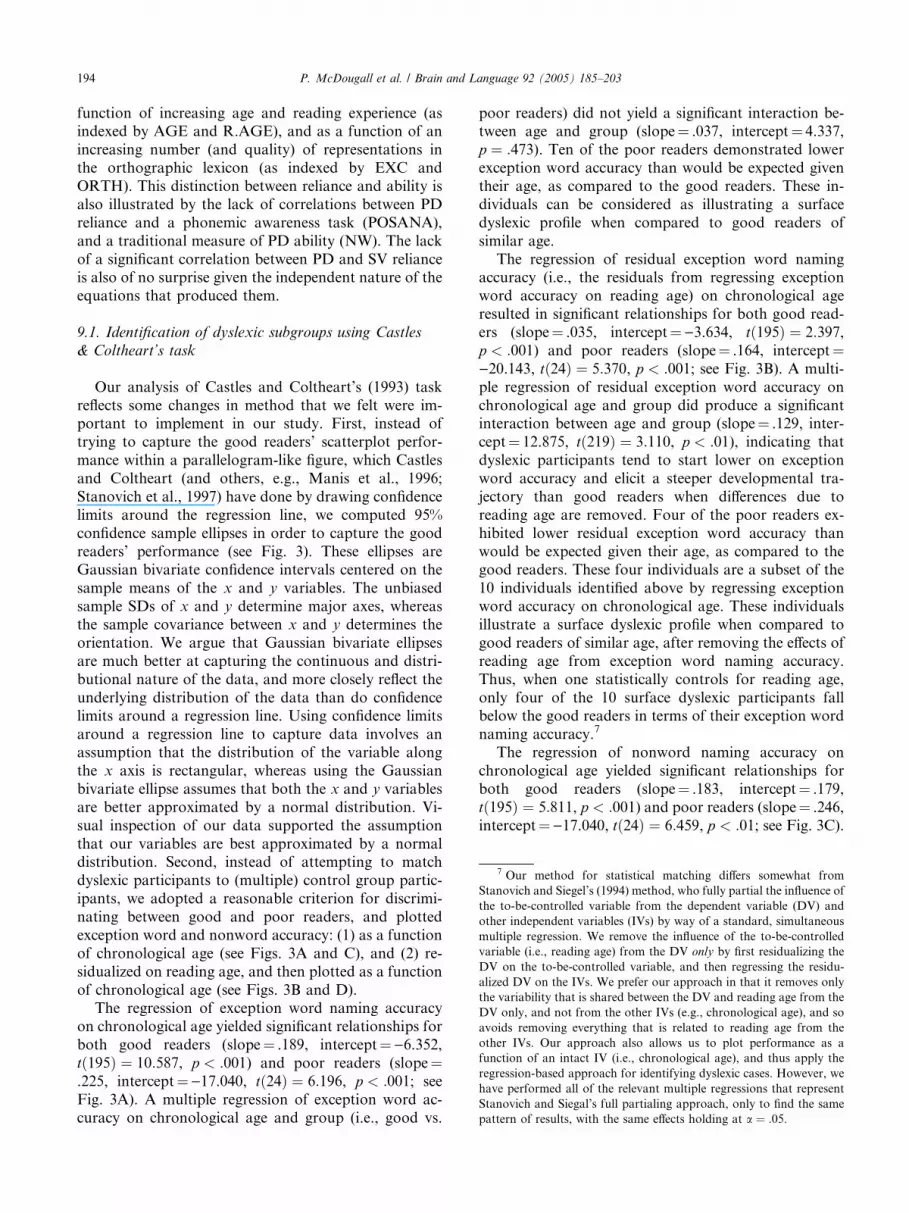
of chronological age (see Figs. 3B and D).The regression of exception word naming accuracy
on chronological age yielded significant relationships for
both good readers (slope¼ .189, intercept¼)6.352,tð195Þ ¼ 10:587, p < :001) and poor readers (slope¼.225, intercept¼)17.040, tð24Þ ¼ 6:196, p < :001; see
Fig. 3A). A multiple regression of exception word ac-
curacy on chronological age and group (i.e., good vs.
poor readers) did not yield a significant interaction be-tween age and group (slope¼ .037, intercept¼ 4.337,
p ¼ :473). Ten of the poor readers demonstrated lower
exception word accuracy than would be expected given
their age, as compared to the good readers. These in-
dividuals can be considered as illustrating a surface
dyslexic profile when compared to good readers of
similar age.
The regression of residual exception word namingaccuracy (i.e., the residuals from regressing exception
word accuracy on reading age) on chronological age
resulted in significant relationships for both good read-
ers (slope¼ .035, intercept¼)3.634, tð195Þ ¼ 2:397,p < :001) and poor readers (slope¼ .164, intercept¼)20.143, tð24Þ ¼ 5:370, p < :001; see Fig. 3B). A multi-
ple regression of residual exception word accuracy on
chronological age and group did produce a significantinteraction between age and group (slope¼ .129, inter-
cept¼ 12.875, tð219Þ ¼ 3:110, p < :01), indicating that
dyslexic participants tend to start lower on exception
word accuracy and elicit a steeper developmental tra-
jectory than good readers when differences due to
reading age are removed. Four of the poor readers ex-
hibited lower residual exception word accuracy than
would be expected given their age, as compared to thegood readers. These four individuals are a subset of the
10 individuals identified above by regressing exception
word accuracy on chronological age. These individuals
illustrate a surface dyslexic profile when compared to
good readers of similar age, after removing the effects of
reading age from exception word naming accuracy.
Thus, when one statistically controls for reading age,
only four of the 10 surface dyslexic participants fallbelow the good readers in terms of their exception word
naming accuracy.7
The regression of nonword naming accuracy on
chronological age yielded significant relationships for
both good readers (slope¼ .183, intercept¼ .179,
tð195Þ ¼ 5:811, p < :001) and poor readers (slope¼ .246,
intercept¼)17.040, tð24Þ ¼ 6:459, p < :01; see Fig. 3C).

Fig. 3. (A) Exception word naming accuracy, (B) residual exception word naming accuracy, (C) nonword naming accuracy, (D) residual nonword
naming accuracy, (E) sight vocabulary (SV) reliance, (F) residual SV reliance, (G) phonetic decoding (PD) reliance, and (H) residual PD reliance,
plotted as a function of age and reading ability.
P. McDougall et al. / Brain and Language 92 (2005) 185–203 195
196 P. McDougall et al. / Brain and Language 92 (2005) 185–203
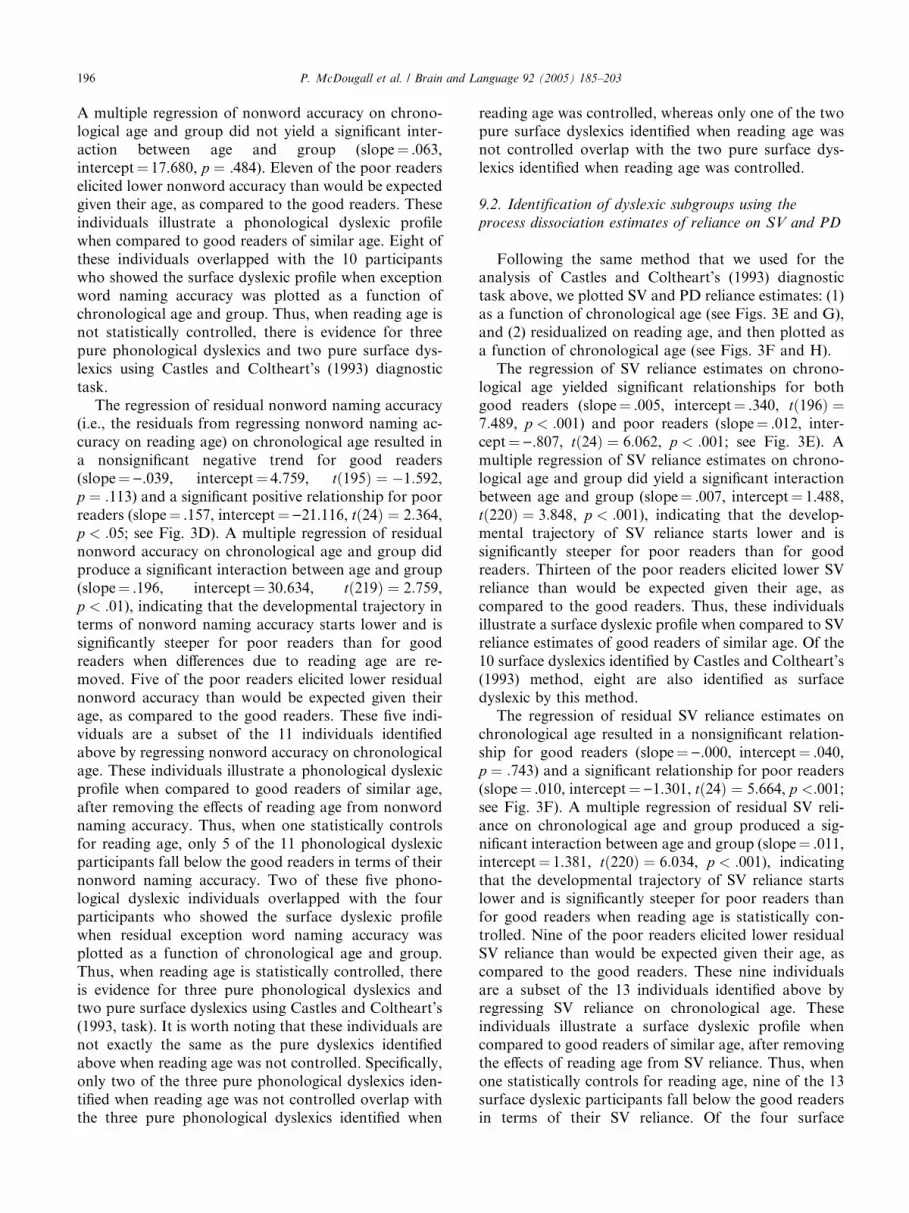
A multiple regression of nonword accuracy on chrono-logical age and group did not yield a significant inter-
action between age and group (slope¼ .063,
intercept¼ 17.680, p ¼ :484). Eleven of the poor readers
elicited lower nonword accuracy than would be expected
given their age, as compared to the good readers. These
individuals illustrate a phonological dyslexic profile
when compared to good readers of similar age. Eight of
these individuals overlapped with the 10 participantswho showed the surface dyslexic profile when exception
word naming accuracy was plotted as a function of
chronological age and group. Thus, when reading age is
not statistically controlled, there is evidence for three
pure phonological dyslexics and two pure surface dys-
lexics using Castles and Coltheart’s (1993) diagnostic
task.
The regression of residual nonword naming accuracy(i.e., the residuals from regressing nonword naming ac-
curacy on reading age) on chronological age resulted in
a nonsignificant negative trend for good readers
(slope¼).039, intercept¼ 4.759, tð195Þ ¼ �1:592,p ¼ :113) and a significant positive relationship for poor
readers (slope¼ .157, intercept¼)21.116, tð24Þ ¼ 2:364,p < :05; see Fig. 3D). A multiple regression of residual
nonword accuracy on chronological age and group didproduce a significant interaction between age and group
(slope¼ .196, intercept¼ 30.634, tð219Þ ¼ 2:759,p < :01), indicating that the developmental trajectory in
terms of nonword naming accuracy starts lower and is
significantly steeper for poor readers than for good
readers when differences due to reading age are re-
moved. Five of the poor readers elicited lower residual
nonword accuracy than would be expected given theirage, as compared to the good readers. These five indi-
viduals are a subset of the 11 individuals identified
above by regressing nonword accuracy on chronological
age. These individuals illustrate a phonological dyslexic
profile when compared to good readers of similar age,
after removing the effects of reading age from nonword
naming accuracy. Thus, when one statistically controls
for reading age, only 5 of the 11 phonological dyslexicparticipants fall below the good readers in terms of their
nonword naming accuracy. Two of these five phono-
logical dyslexic individuals overlapped with the four
participants who showed the surface dyslexic profile
when residual exception word naming accuracy was
plotted as a function of chronological age and group.
Thus, when reading age is statistically controlled, there
is evidence for three pure phonological dyslexics andtwo pure surface dyslexics using Castles and Coltheart’s
(1993, task). It is worth noting that these individuals are
not exactly the same as the pure dyslexics identified
above when reading age was not controlled. Specifically,
only two of the three pure phonological dyslexics iden-
tified when reading age was not controlled overlap with
the three pure phonological dyslexics identified when
reading age was controlled, whereas only one of the twopure surface dyslexics identified when reading age was
not controlled overlap with the two pure surface dys-
lexics identified when reading age was controlled.
9.2. Identification of dyslexic subgroups using the
process dissociation estimates of reliance on SV and PD
Following the same method that we used for theanalysis of Castles and Coltheart’s (1993) diagnostic
task above, we plotted SV and PD reliance estimates: (1)
as a function of chronological age (see Figs. 3E and G),
and (2) residualized on reading age, and then plotted as
a function of chronological age (see Figs. 3F and H).
The regression of SV reliance estimates on chrono-
logical age yielded significant relationships for both
good readers (slope¼ .005, intercept¼ .340, tð196Þ ¼7:489, p < :001) and poor readers (slope¼ .012, inter-
cept¼).807, tð24Þ ¼ 6:062, p < :001; see Fig. 3E). A
multiple regression of SV reliance estimates on chrono-
logical age and group did yield a significant interaction
between age and group (slope¼ .007, intercept¼ 1.488,
tð220Þ ¼ 3:848, p < :001), indicating that the develop-
mental trajectory of SV reliance starts lower and is
significantly steeper for poor readers than for goodreaders. Thirteen of the poor readers elicited lower SV
reliance than would be expected given their age, as
compared to the good readers. Thus, these individuals
illustrate a surface dyslexic profile when compared to SV
reliance estimates of good readers of similar age. Of the
10 surface dyslexics identified by Castles and Coltheart’s
(1993) method, eight are also identified as surface
dyslexic by this method.The regression of residual SV reliance estimates on
chronological age resulted in a nonsignificant relation-
ship for good readers (slope¼).000, intercept¼ .040,
p ¼ :743) and a significant relationship for poor readers
(slope¼ .010, intercept¼)1.301, tð24Þ ¼ 5:664, p <:001;see Fig. 3F). A multiple regression of residual SV reli-
ance on chronological age and group produced a sig-
nificant interaction between age and group (slope¼ .011,intercept¼ 1.381, tð220Þ ¼ 6:034, p < :001), indicating
that the developmental trajectory of SV reliance starts
lower and is significantly steeper for poor readers than
for good readers when reading age is statistically con-
trolled. Nine of the poor readers elicited lower residual
SV reliance than would be expected given their age, as
compared to the good readers. These nine individuals
are a subset of the 13 individuals identified above byregressing SV reliance on chronological age. These
individuals illustrate a surface dyslexic profile when
compared to good readers of similar age, after removing
the effects of reading age from SV reliance. Thus, when
one statistically controls for reading age, nine of the 13
surface dyslexic participants fall below the good readers
in terms of their SV reliance. Of the four surface

8 Although we have argued in favour of assuming PD as the
dominant process for developing readers, it is informative to compare
our results to what is obtained when SV is assumed to be the dominant
process. The main difference when SV dominant equations are used is
that there are now significant positive correlations between PD reliance
and all other variables in Table 2. Specifically, the correlations
involving PD reliance are (with): EXC .669, NW .764, SV .644, AGE
.291, R.AGE .640, ORTH .526, and POSANA .474. Note that the
presence of a significant positive correlation between PD and SV
reliance estimates does not compromise the assumption of mathemat-
ical independence between PD and SV processes, as this assumption
involves both unique and shared contributions of SV and PD reliance
(see Fig. 2; i.e., the presence and sign of a correlation between PD and
SV reliance does not support nor refute the assumption of mathemat-
ical independence). The other correlations involving SV reliance are
(with): EXC .898, NW .766, AGE .510, R.AGE .745, ORTH .754, and
POSANA .455. In summary, when one assumes SV dominance, SV
and PD reliance estimates become correlated, but the correlations
involving the SV reliance estimates and all other variables remain
similar in comparison to when PD dominance is assumed. However,
the correlations involving the PD reliance estimate and all other
variables change dramatically when one assumes SV dominance (i.e.,
they all become positive and significant). Most importantly, however,
the identification of dyslexic subtype cases did not change dramatically
when SV was assumed to be the dominant process. After removing the
influence of reading age, the following number of dyslexic cases were
identified (original cases identified assuming PD dominance are in
square brackets): 0 [0] pure phonological dyslexics, 5 pure surface
dyslexics [all overlapping with the original 7], and 1 mixed cases
[overlapping with the original 2].
P. McDougall et al. / Brain and Language 92 (2005) 185–203 197
dyslexics identified by Castles and Coltheart’s (1993)method (when reading age is statistically controlled), all
four are also identified as surface dyslexic by this
method.
The regression of PD reliance estimates on chrono-
logical age yielded a significant negative relationship for
good readers (slope¼).002, intercept¼ .344, tð196Þ ¼�5:100, p < :001) and no significant relationship for
poor readers (slope¼ .002, intercept¼).049, p ¼ :197;see Fig. 3G). A multiple regression of PD reliance on
chronological age and group did produce a significant
interaction between age and group (slope¼ .003, inter-
cept¼ .736, tð220Þ ¼ 3:106, p < :01), which indicates
that good readers decrease their reliance on PD as a
function of age at a rate that is statistically different
from that of poor readers. Only one of the poor readers
elicited lower PD reliance than would be expected giventheir age, as compared to the good readers. This indi-
vidual illustrates a phonological dyslexic profile when
compared to good readers of similar age. However, this
individual overlaps with the 13 participants who showed
the surface dyslexic profile when SV reliance was plotted
as a function of chronological age and group (this in-
dividual is also diagnosed as showing both surface and
phonological dyslexia using Castles & Coltheart’s, 1993,task). Thus, when reading age is not statistically con-
trolled, the process dissociation method involving esti-
mates of reliance on SV and PD yields no evidence for
any pure phonological dyslexics in our study, and evi-
dence for 12 pure surface dyslexics.
The regression of residual PD reliance estimates on
chronological age resulted in a significant negative re-
lationship for good readers (slope¼).001, intercept¼.119, tð196Þ ¼ �2:800, p < :01) and a nonsignificant
positive trend for poor readers (slope¼ .002, inter-
cept¼).240, tð24Þ ¼ 1:620, p ¼ :118; see Fig. 3H). A
multiple regression of residual PD reliance on chro-
nological age and group did produce a significant
interaction between age and group (slope¼ .003, inter-
cept¼ .478, tð220Þ ¼ 2:665, p < :01), which indicates
that good readers decrease their reliance on PD as afunction of age at a rate that is statistically different
from that of poor readers when differences due to
reading age are controlled. Two of the poor readers
elicited lower residual PD reliance than would be ex-
pected given their age, as compared to the good readers.
These two individuals illustrate a phonological dyslexic
profile when compared to good readers of similar age,
after removing the effects of reading age from the esti-mates of PD reliance. Thus, when one statistically con-
trols for reading age, only two phonological dyslexic
participants fall below the good readers in terms of their
PD reliance. These two phonological dyslexic individu-
als overlap with the nine participants who showed the
surface dyslexic profile when residual SV reliance was
plotted as a function of chronological age and group.
Thus, when reading age is statistically controlled, theprocess dissociation method involving estimates of reli-
ance on SV and PD yields no evidence for any pure
phonological dyslexics in our study, and evidence for
seven pure surface dyslexics. These seven pure cases of
surface dyslexia overlap with the 12 pure dyslexics
identified above when reading age was not controlled.
Of the two pure surface dyslexics identified by Castles
and Coltheart’s (1993) method (when reading age isstatistically controlled), both are also identified as sur-
face dyslexic by this method.8
10. Discussion
The process dissociation method of estimating reli-
ance on SV and PD processing presents a somewhatdifferent picture of developmental dyslexia than current
regression-based approaches for identifying dyslexic
participants (e.g., Castles & Coltheart, 1993; Manis et
al., 1996; Stanovich et al., 1997). In general, the process
dissociation method appears to yield a slightly larger
number of surface dyslexic cases, but a dramatically
lower number of phonological dyslexic cases than Cas-
tles and Coltheart’s regression-based approach. Whenplotting performance as a function of chronological age
(and ignoring differences in reading age), our application
of Castles and Coltheart’s method yielded 10 cases of
surface dyslexia and 11 cases of phonological dyslexia,
9 Given that reliance on PD is estimated by subtracting exception
word accuracy from regular word accuracy, and that the grade level
difficulty of these words did not exceed grade 7, one potential criticism
is that a floor effect may be biasing our method from being sensitive
enough to detect more cases of lower than normal reliance on PD (i.e.,
cases of phonological dyslexia). One would expect PD reliance (as
measured by the size of the regular word naming advantage) to
decrease as a function of increasing word frequency. Indeed, the
negative correlations between PD reliance and age (or reading age)
support this notion. Thus, if the words are highly familiar, then
estimates of reliance on PD will be lower than if the words are less
familiar. We note, however, if such a floor effect was present, it should
be restricted to the older or more experienced readers. If one was
interested in applying this process dissociation method specifically to
older readers (e.g., grades 4–5), then additional lower frequency (or
higher grade level) items should be included.
198 P. McDougall et al. / Brain and Language 92 (2005) 185–203
eight of which were overlapping cases. To contrast, ourprocess dissociation method yielded 13 cases of surface
dyslexia, and only one case of phonological dyslexia,
which was an overlapping case (i.e., both surface and
phonologically dyslexic). Removing the influence of
reading age did not change the number of pure cases of
surface (n ¼ 2) and phonological (n ¼ 3) dyslexia ob-
tained through Castles and Coltheart’s method (al-
though the identity of some of these cases did change asa function of removing the influence of reading age). In
contrast, our process dissociation method yielded seven
cases of pure surface dyslexia (constituting a subset of
the 13 cases obtained when reading age was not statis-
tically controlled), two overlapping cases, and no cases
of pure phonological dyslexia when the effects of reading
age were removed.
One reason for the discrepancy in the frequency ofphonological dyslexia diagnoses between these two
methods has to do with the presence of nonword
stimuli in the traditional diagnostic tests (e.g., Castles
& Coltheart, 1993; Manis et al., 1996; Stanovich et al.,
1997). Given that, by definition, there is no established
criterion for the pronunciation of any nonword, it
seems quite plausible that any criteria for scoring
nonword pronunciations simply serve to increase thevariability in ‘‘accuracy’’ rate, and would likely de-
crease the observed ‘‘accuracy’’ rate for some readers.
Thus, it seems that nonword naming accuracy may
estimate an unstable (and possibly inflated) frequency
of phonological dyslexia cases because of the necessary
invention of pronunciation criteria for each stimulus.
As discussed in the introduction, we know that par-
ticipants will perform differently during the namingtask when nonwords are included (either in mixed or
pure blocks), compared to when only words are pre-
sented. We all have the expectation that, when reading
text, the orthography should correspond to a familiar
phonology (aside from the occasional novel term in
technical texts), and this may be particularly salient
when we are learning to read. Just as the influence of
semantic context has been argued to be particularlyrelevant for poorer readers (e.g., Stanovich, 1980; West
& Stanovich, 1988), so may the influence of this ex-
pectancy for familiar sounding words, accounting for
why poorer readers could be more susceptible to
making nonword naming errors.
More importantly, it is not clear how nonword
naming accuracy can be taken as a measure of PD
ability during real word recognition (i.e., when thephonological lexical system can provide assistance to
the PD process). Indeed, some children were surprised
(and a bit offput) by the presentation of the nonwords
used in this study. Given all of the time spent in school
learning real words, and expecting tests of their reading
ability to involve real words, perhaps we should not be
surprised that some children do not enjoy trying to
read such orthographically and phonologically strangestimuli. Clearly, if the participant expects (through in-
structions or experience with the task) the pronuncia-
tions of the stimuli to correspond to real words that
they may have at least heard before, then we have an
opportunity to study processes like SV and PD as they
pertain to natural word recognition and reading.
Nonword naming accuracy may very likely be reflect-
ing something different from PD ability during realword recognition.
A second reason for this discrepancy in frequency of
phonological dyslexic cases between our study and
previous research concerns the matching problem de-
scribed in the introduction. Our process dissociation
method allows us to use real words both for (statisti-
cal) matching and for dyslexic subtype identification.
Traditional approaches that use nonwords for dyslexicsubtype identification do not use the same type of
stimulus for (individual) matching, and thus the
matching method itself can bias the identification of
phonological dyslexia (e.g., Manis et al., 1996; Stano-
vich et al., 1997). Specifically, if one matches poor
readers to good readers on the basis of real word
naming accuracy (as is the case when one matches on
reading age from a test like the Word Identificationsubtest of the WRMT-R), then one should expect more
differences between poor readers and good readers on
an unmatched variable like nonword naming accuracy
as opposed to a matched variable like word naming
accuracy. Matching participants and identifying dys-
lexic cases on the basis of different stimuli will serve to
bias the dyslexia diagnosis in favour of the subtype
that is measured by the unmatched variable (i.e.,phonological dyslexia as measured by nonword naming
accuracy).
Taken together, these reasons for the discrepancy in
frequency of phonological dyslexia between our process
dissociation method and traditional methods that em-
ploy nonwords as diagnostic stimuli suggest that the
traditional methods may result in inflated frequencies of
phonological dyslexia.9 Despite our criticisms about

P. McDougall et al. / Brain and Language 92 (2005) 185–203 199
using nonwords to assess PD processing, the prevalenceof this method in the literature requires an interpretation
of the results from our application of Castles and
Coltheart’s (1993) diagnostic task. Indeed, given what is
known about dyslexia from the traditional methods, it
would be premature to suggest that they be abandoned
in favour of this new method that we are only beginning
to explore.
10.1. Castles and Coltheart’s method
If we focus our interpretation of the results to those
that do control for the effects of reading age, using
Castles and Coltheart’s (1993) method we see an al-
most equal frequency of pure surface dyslexia and pure
phonological dyslexia. This finding challenges previous
results in that Manis et al. (1996) and Stanovich et al.(1997) found that, compared to when chronological age
controls are used, using reading age controls eliminated
almost all cases of surface dyslexia, whereas relatively
more cases of phonological dyslexia tend to remain.
Given that both Manis et al. and Stanovich et al. used
different stimuli than Castles and Coltheart (and each
other), it is possible that the influence of reading age
could be affected by the choice of stimuli. Using Cas-tles and Coltheart’s stimuli, our results would suggest
that both surface and phonological dyslexia are simi-
larly influenced by reading age, and that just over half
of the cases of each subtype could be considered as
‘‘delay’’ cases in that they no longer appear dyslexic
when reading age is statistically controlled (see also
Footnote 2). The remaining half demonstrate ‘‘devi-
ant’’ processing in that these individuals do appeardyslexic when reading age is statistically controlled.
These observations can be contrasted with Manis et al.
and Stanovich et al.’s conclusion that surface dyslexia
is most likely a delay deficit, whereas phonological
dyslexia can be characterized as being mainly a devi-
ance deficit.
However, we have argued that using different types of
stimuli for matching and identification, and/or usingnonwords for the purpose of assessing PD processing,
may be problematic (e.g., Castles & Coltheart, 1993;
Manis et al., 1996; Stanovich et al., 1997). Thus, we turn
to a discussion of the process dissociation method for
identifying dyslexic cases.
10.2. The process dissociation method
Although we are measuring something new and
different in ‘‘reliance’’ on PD and SV processes (or
actual usage of PD and SV during real word reading)
by applying the process dissociation procedure, instead
of measuring a specific ‘‘ability’’ to use these processes
(i.e., particularly in the case of using nonword naming
performance as a measure of PD processing that is
strictly sublexical), the estimates do make intuitivesense with respect to their correlations (or lack thereof)
with other indices of linguistic proficiency. Reliance on
SV was significantly correlated with both exception
word and nonword naming accuracy, chronological
and reading age, orthographic lexical knowledge and
phonemic awareness. Reliance on PD was negatively
related with exception word naming accuracy, chro-
nological and reading age, and orthographic lexicalknowledge, and unrelated to nonword naming accu-
racy and phonemic awareness when PD dominance
was assumed, whereas these correlations were all po-
sitive when SV dominance was assumed. In general
then, reliance on SV is positively related to other in-
dices of linguistic proficiency, whereas reliance on PD
tends to be either negatively related or unrelated to
these indices if it is assumed to be the dominant pro-cess, and positively related to these indices if SV is
assumed to be the dominant process. If PD dominance
is to be assumed for the developing reader, then as a
function of development (i.e., both reading age and
chronological age), it appears that reliance on SV in-
creases, whereas reliance on PD decreases (see also
Doctor & Coltheart, 1980).
Treating good and poor readers as separate groups,the process dissociation method yielded significant in-
teractions between group and age on both SV and PD
reliance estimates, regardless of whether reading age was
controlled. When reading age was controlled, good
readers no longer showed a positive relationship be-
tween reliance on SV and age, whereas poor readers did.
Thus, reliance on SV increased as a function of chro-
nological age, and the effect can be attributed to readingage level for good readers, but not so for poor readers.
This finding suggests that lower than normal reliance on
SV (i.e., surface dyslexia) is not simply a developmental
delay deficit (in contrast to Manis et al., 1996 and
Stanovich et al., 1997; see also Harm & Seidenberg,
1999, for a model that was developed on the assumption
that surface dyslexia is mainly a developmental delay
deficit).Reliance on PD, on the other hand, decreased as a
function of age for good readers regardless of whether
reading age is controlled, and remained unrelated to age
for poor readers. So, while good readers decreased their
reliance on PD as a function of age, poor readers did
not, and there appeared to be a trend for poor readers to
even increase their reliance on PD as a function of age
when reading age was controlled.When reading age was controlled, the process disso-
ciation method revealed seven cases of pure surface
dyslexia, two overlapping cases that showed both sur-
face and phonological dyslexia, and no pure cases of
phonological dyslexia. Thus, these findings also suggest
that developmental surface dyslexia cannot be simply a
delay deficit [as has been suggested by Manis et al.

200 P. McDougall et al. / Brain and Language 92 (2005) 185–203
(1996), Stanovich et al. (1997), and Harm and Seiden-berg (1999)], as participants were statistically matched
on reading age. Furthermore, we obtained no evidence
for any pure cases of phonological dyslexia, which
stands in contrast to the rather high frequency of pho-
nological dyslexic cases reported by the methods which
used nonword stimuli to identify phonological dyslexia
(i.e., Castles & Coltheart, 1993), and some which also
matched dyslexic readers to reading age control partic-ipants based on word reading performance, leaving only
nonword naming performance free to vary (i.e., Manis
et al., 1996; Stanovich et al., 1997). Given that our
method used the same type of stimuli for dyslexic sub-
type identification as it does for matching (i.e., real
words serve both purposes), and did not use nonword
stimuli to assess PD processing during word recognition,
we feel that the process dissociation method has somevery desirable characteristics for assessing PD process-
ing when reading real words, and as a potential tool for
identifying cases of dyslexia.
Although we have framed our discussion on devel-
opmental dyslexia in terms of SV and PD processing
reliance deficits, we are not wedded to a particular
processing model of word recognition, nor are we ad-
vocating any particular type of representation (e.g.,localist versus distributed). We simply note that the
estimates of reliance could be interpreted in terms of
any processing architecture that involves (or can be
reduced to) two mathematically independent processes
(i.e., the two processing routes can effectively function
separately prior to the response, and a response can be
made, albeit not always correctly, on the basis of ei-
ther, or both, processing routes). The characteristic ofhaving two independent processing routes would seem
to capture many models of visual word recognition
[e.g., the lexical and nonlexical routes in Coltheart et
al.’s, 1993, 2001 dual route cascade model, and inter-
active-activation models such as Jacobs, Rey, Ziegler,
and Grainger (1998), MROM-P model; the semantic
and nonsemantic routes in Plaut, McClelland, Seiden-
berg, and Patterson (1996), Borowsky and Masson’s(1996), and Masson and Borowsky’s (1998), connec-
tionist models; see also Borowsky et al. (1999) and
Owen and Borowsky (2004a), for experiments that
evaluate the nature and direction of sublexical and
lexical influences between orthographic and phonolog-
ical processing, and a framework that captures many
models of visual and spoken word recognition]. Indeed,
a recent hybrid connectionist dual-process model de-veloped by Zorzi et al. (1998) illustrates the advantages
of maintaining dual nonsemantic processing routes
within a connectionist architecture. In this model, an
addressed phonology route corresponds to SV pro-
cessing, while an assembled phonology route corre-
sponds to PD processing. It is our hope that SV and
PD reliance estimates can be utilized in the develop-
ment of such simulation models (e.g., a model’s reli-ance on each route could be weighted by empirically
derived reliance estimates for the population being
studied), and result in more ‘‘ecologically valid’’ im-
plementations of models of basic reading processes.
10.3. Do SV and PD cognitive processes correspond to
independent neurophysiological processes?
Owen, Borowsky, and Sarty (2002) have recently
shown functional magnetic resonance imaging evidence
in support of independent neurophysiological pathways
that correspond to SV and PD processing. Specifically,
familiar exception words (i.e., SV-reliant stimuli) were
processed in both the occipito–temporal regions (i.e., a
ventral pathway) and insular cortices, whereas less fa-
miliar exception words and pseudohomophones (i.e.,PD-reliant stimuli) were processed more so in the su-
perior occipital and inferior parietal lobule, as well as
Broca’s area (i.e., a dorsal pathway). Other researchers
have also noted this type of ventral–dorsal correspon-
dence to SV and PD processes. Pugh et al. (2000) have
argued that the dorsal (temporo–parietal) pathway is
associated with the rule-based analyses engaged during
PD processing, and that the ventral (occipito–tempo-ral) pathway is associated with memory-based word
identification engaged during SV processing. Similar
distinctions between a ventral SV-type system and a
more dorsal PD-type system are discussed by Simos et
al. (2002), and Posner and Raichle (1994), who also
discuss the role of the insular cortex in processing fa-
miliar stimuli, as well as an automatic/controlled pro-
cessing distinction between the ventral and dorsalpathways. Some of our current neuroimaging research
explores the relationship between SV and PD reliance
estimates and activation along the ventral and dorsal
pathways. A central hypothesis in this research is that
the SV and PD reliance estimates will be related to
functional reliance on ventral and dorsal pathways as
measured by blood oxygenation level dependent
(BOLD) volume of activation, or degree of activation.Post-remediation imaging will also be used in this
study to evaluate the efficacy of training that targets
either SV or PD processing.
We realize that the process dissociation method of
estimating reliance on SV and PD requires further de-
velopment before it can contend with all that is known
about word identification and dyslexia based on tradi-
tional methods. The process dissociation procedurelooks promising in this regard in that it has recently seen
considerable development not only in terms of ac-
counting for naming accuracy performance, but also
with respect to accounting for reaction time data (Ja-
coby et al., 1999), through a type of counter model (e.g.,
Ratcliff & McKoon, 1997). We believe that this proce-
dure offers a novel perspective on dual-process models,
P. McDougall et al. / Brain and Language 92 (2005) 185–203 201
and that it is worthwhile to continue to explore amethod that promises to alleviate the need for using
artificial nonword stimuli, and thus the practice of using
different (or nonword) stimuli for matching participants
and identifying dyslexic cases, in the assessment of word
reading performance. The use of real words instead of
nonwords for examining PD processing in models of
visual word recognition could lead to a converging ap-
proach for studying the basic operation of this process(e.g., consider the multitude of experiments that have
used nonword stimuli to examine PD processing, many
of which have had considerable influence on the devel-
opment of models of visual word recognition and other
basic reading processes). Moreover, this approach can
be argued as more ecologically valid given that models
of visual word recognition are concerned with describing
reading processes as they pertain to the reading ofreal-world stimuli (i.e., real words). We have recently
reported evidence in support of the assumption of
independence in our application of the process dissoci-
ation procedure (Owen & Borowsky, 2004b), and we are
also currently examining the estimates of reliance on SV
and PD obtained when pseudohomophones are used.
Like our word stimuli, pseudohomophones can be
considered to have a single ‘‘correct’’ response and thusmaintain a similar expectation for ‘‘sounding familiar’’
as words do (see also Laxon, Smith, & Masterson, 1995,
and Goswami, Ziegler, Dalton, & Schneider, 2001; for
discussion of children’s pseudohomophone reading
effects, and Borowsky & Masson, 1999, and Borowsky
et al., 2002, for discussion on interpreting such effects).
We hope that other researchers will join us in further
evaluating this process dissociation method for esti-mating reliance on SV and PD processing.
Acknowledgments
This research was supported by the Social Sciences
and Humanities Research Council of Canada in the
form of a grant to the authors, and the Natural Sciencesand Engineering Research Council of Canada in the
form of a grant to R.B. We thank Larry Jacoby, Steve
Lindsay, and especially Max Coltheart, for their in-
sightful reviews.
Appendix A. Exception and regular word pairs used in theprocess dissociation task
have had, one with, says saw, two too, door dark,
move must, most much, own off, once well, head hand,does days, learn leave, give girl, world which, front
food, heard hear, where while, both board, grow grew,
love land, gone goes, full feel, four free, won win,
wood wore, heart heat, broad brown, prove proud,
spread speech, touch twice, none nine, climb cliff, footfool, whom home, month mouth, breath bridge, bread
brain, bought bound, bush bunch, thread thrust, flood
flame, tour torn, sweat sweep, earn ease, swear swell,
comb coil, dread ditch, steak stack, dough dodge,
hearth hoarse, sieve snatch, sew sag, mow mug, caste
carve, tread truce.
References
Baddeley, A. D., Ellis, N. C., Miles, T. C., & Lewis, V. J. (1982).
Developmental and acquired dyslexia: a comparison. Cognition, 11,
185–199.
Baluch, B., & Besner, D. (1991). Visual word recognition: Evidence for
strategic control of lexical and nonlexical routines in oral reading.
Journal of Experimental Psychology: Learning, Memory, and
Cognition, 17, 644–652.
Besner, D., & Smith, M. C. (1992). Models of visual word recognition:
When obscuring the stimulus yields a clearer view. Journal of
Experimental Psychology: Learning, Memory, and Cognition, 18,
468–482.
Borowsky, R., & Besner, D. (1991). Visual word recognition across
orthographies: On the interaction between context and degrada-
tion. Journal of Experimental Psychology: Learning, Memory, and
Cognition, 17, 272–276.
Borowsky, R., & Besner, D. (1993). Visual word recognition: A
multistage activation model. Journal of Experimental Psychology:
Learning, Memory, and Cognition, 19, 813–840.
Borowsky, R., & Besner, D. (2000). Lexical access codes in visual word
recognition: Are the joint effects of context and stimulus quality
diagnostic? Canadian Journal of Experimental Psychology, 54, 196–
207.
Borowsky, R., & Masson, M. E. J. (1999). Frequency effects
and lexical access: On the interpretation of null pseud-
ohomophone base-word frequency effects. Journal of Experimen-
tal Psychology: Human Perception and Performance, 25, 270–
275.
Borowsky, R., & Masson, M. E. J. (1996). Semantic ambiguity effects
in word-identification. Journal of Experimental Psychology: Learn-
ing, Memory, and Cognition, 22, 63–85.
Borowsky, R., McDougall, P., Hymel, S., & MacKinnon, G. E. (1997).
Computerized versus manual methods of measuring reading
performance: Implications for studying basic reading processes
outside the laboratory. Paper presented at 7th Annual Meeting of
the Canadian Society for Brain, Behaviour and Cognitive Science,
Winnipeg, Manitoba, Canada.
Borowsky, R., Owen, W. J., & Fonos, N. (1999). Reading speech and
hearing print: Constraining models of visual word recognition by
exploring connections with speech perception. Canadian Journal of
Experimental Psychology, 53, 294–305.
Borowsky, R., Owen, W. J., & Masson, M. E. J. (2002). Diagnostics of
phonological lexical processing: Pseudohomophone advantages,
disadvantages, and baseword frequency effects. Memory & Cogni-
tion, 30, 969–987.
Bryant, P., & Impey, L. (1986). The similarity between normal readers
and developmental and acquired dyslexics. Cognition, 24, 121–137.
Castles, A., & Coltheart, M. (1993). Varieties of developmental
dyslexia. Cognition, 47, 149–180.
Coltheart, M. (1987). Varieties of developmental dyslexia: a comment
on Bryant and Impey. Cognition, 27, 97–101.
Coltheart, M., Curtis, B., Atkins, P., & Haller, M. (1993). Models of
reading: Dual-route and parallel-distributed-processing ap-
proaches. Psychological Review, 100, 589–608.

202 P. McDougall et al. / Brain and Language 92 (2005) 185–203
Coltheart, M., Rastle, K., Perry, C., Langdon, R., & Ziegler, J. C.
(2001). DRC: A computational model of visual word recognition
and reading aloud. Psychological Review, 108, 204–256.
Doctor, E. A., & Coltheart, M. (1980). Children’s use of phonological
encoding when reading for meaning. Memory & Cognition, 8, 195–
209.
Goswami, U., Ziegler, J. C., Dalton, L., & Schneider, W. (2001).
Pseudohomophone effects and phonological recoding procedures in
reading development in English and German. Journal of Memory
and Language, 45, 648–664.
Harm, M. W., & Seidenberg, M. S. (1999). Phonology, reading
acquisition, and dyslexia: Insights from connectionist models.
Psychological Review, 106, 491–528.
Hendricks, A. W., & Kolk, H. H. J. (1997). Strategic control in
developmental dyslexia. Cognitive Neuropsychology, 14, 321–
366.
Hillstrom, A. P., & Logan, G. D. (1997). Process dissociation,
cognitive architecture, and response time: Comments on Lindsay
and Jacoby (1994). Journal of Experimental Psychology: Human
Perception and Performance, 20, 219–234.
Jacobs, A. M., Rey, A., Ziegler, J. C., & Grainger, J. (1998). MROM-
P: An interactive activation, multiple read-out model of ortho-
graphic and phonological processes in visual word recognition. In
J. Grainger & A. M. Jacobs (Eds.), Localist connection approaches
to human cognition (pp. 147–188). Mahwah, NJ: Erlbaum.
Jacoby, L. L. (1991). A process dissociation framework: Separating
automatic from intentional uses of memory. Journal of Memory
and Language, 30, 513–541.
Jacoby, L. L., McElree, B., & Trainham, T. N. (1999). Automatic
influences as accessibility bias in memory and Stroop tasks:
Towards a formal model. In D. Gopher & A. Koriat et al.
(Eds.), Attention and performance XVII (pp. 461–486). Cambridge,
MA: MIT Press.
Jackson,N. E., &Butterfield, E.C. (1989).Reading-level-matchdesigns:
Myths and realities. Journal of Reading Behavior, 21, 387–412.
Jastak, S., & Wilkinson, G. S. (1984). The wide range achievement test-
revised. Wilmington, DE: Jastak Associates.
Joordens, S., & Merikle, P. M. (1993). Independence or redundancy?
Two models of conscious and unconscious influences. Journal of
Experimental Psychology: General, 122, 462–467.
Laxon, V., Smith, B., & Masterson, J. (1995). Children’s nonword
reading: Pseudohomophones, neighborhood size, and priming
effects. Reading Research Quarterly, 30, 126–144.
Lindsay, D. S., & Jacoby, L. L. (1994). Stroop process dissociations:
The relationship between facilitation and interference. Journal of
Experimental Psychology: Human Perception and Performance, 20,
219–234.
MacLeod, C. M. (1991). Half a century of research on the Stroop
effect: An integrative review. Psychological Bulletin, 109, 163–203.
Manis, F. R., Seidenberg, M. S., Doi, L. M., McBride-Chang, C., &
Peterson, A. (1996). On the bases of two subtypes of developmental
dyslexia. Cognition, 58, 157–195.
Manis, F. R., Szeszulski, P. A., Holt, L. K., & Graves, K. (1990).
Variation in component word recognition and spelling skills among
dyslexic children and normal readers. In T. H. Carr & B. A. Levy
(Eds.), Reading and its development: Component skills approaches.
San Diego, CA: Academic Press.
Marmurek, H. H. C., & Kwantes, P. J. (1996). Reading words and
wirds: Phonology and lexical access. The Quarterly Journal of
Experimental Psychology, 49A, 696–714.
Masson, M. E. J., & Borowsky, R. (1998). More than meets the eye:
Context effects on word identification. Memory and Cognition, 26,
1245–1269.
Merikle, P. M., & Cheesman, J. (1987). Current status of research on
subliminal perception. In: M. Wallendorf & P. Anderson (Eds.),
Advances in Consumer Research XIV, Association for Consumer
Research: Provo, UT.
Monsell, S., Patterson, K. E., Graham, A., Hughes, C. H., & Milroy,
R. (1992). Lexical and sublexical translation of spelling to sound:
Strategic anticipation of lexical status. Journal of Experimental
Psychology: Learning, Memory, and Cognition, 18, 452–467.
Olson, R. K., Kliegl, R., Davidson, B., & Foltz, G. (1985). Individual
and developmental differences in reading disability. In G. E.
MacKinnon & T. G. Waller (Eds.), Reading research: Advances in
theory and practice. San Diego, CA: Academic Press.
Owen, W. J., & Borowsky, R. (2004a). Examining the interactivity of
lexical orthographic and phonological processing. Canadian Jour-
nal of Experimental Psychology, 57, 290–303.
Owen, W. J., & Borowsky, R. (2004b). Evaluating the relationship
between phonetic decoding and sight vocabulary: Evidence for
single or dual routes? Manuscript submitted for publication.
Owen, W. J., & Borowsky, R., Sarty, G. E. (2002). Images of the Word
Frequency Effect. 20th Banff Annual Seminar in Cognitive Science,
May, Banff, AB.
Paap, K. R., McDonald, J. E., Schvaneveldt, R. W., & Noel, R. W.
(1987). Frequency and pronounceability in visually presented
naming and lexical decision tasks. In M. Coltheart (Ed.), Attention
and performance XII: The psychology of reading (pp. 221–243).
Hillsdale, NJ: Erlbaum.
Simos, P. G., Breier, J. I., Fletcher, J. M., Foorman, B. R., Castillo, E.
M., & Papanicolaou, A. C. (2002). Brain mechanisms for reading
words and pseudowords: an integrated approach. Cerebral Cortex,
12, 297–305.
Plaut, D. C., McClelland, J. L., Seidenberg, M. S., & Patterson, K. E.
(1996). Understanding normal and impaired word reading: Com-
putational principles in quasi-regular domains. Psychological
Review, 103, 56–115.
Posner, M. I., & Raichle, M. E. (1994). Images of mind. New York:
Scientific American Library.
Pugh, K. R., Mencl, W. E., Jenner, A. R., Katz, L., Frost, S. J., Lee, J.
R., Shaywitz, S. E., & Shaywitz, B. A. (2000). Functional
neuroimaging studies of reading and reading disability (develop-
mental dyslexia). Mental Retardation and Developmental Disabili-
ties Research Reviews, 6, 207–213.
Ratcliff, R., & McKoon, G. (1997). A counter model for implicit
priming in perceptual word identification. Psychological Review,
104, 319–343.
Snowling, M. J., Bryant, P. E., & Hulme, C. (1996). Theoretical and
methodological pitfalls in making comparisons between develop-
mental and acquired dyslexia: Some comments on A. Castles & M.
Coltheart (1993). Reading and Writing: An Interdisciplinary Jour-
nal, 8, 443–451.
Spieler, D. H., Balota, D. A., & Faust, M. E. (1996). Stroop
performance in healthy younger and older adults an in individuals
with dementia of the Alzheimer’s type. Journal of Experimental
Psychology: Human Perception and Performance, 22, 461–479.
Stanovich, K. E. (1980). Toward an interactive-compensatory model
of individual differences in the development of reading fluency.
Reading Research Quarterly, 16, 32–71.
Stanovich, K. E., Nathan, R. G., & Vala-Rossi, M. (1986). Develop-
mental changes in the cognitive correlates of reading ability and the
developmental lag hypothesis. Reading Research Quarterly, 21,
267–283.
Stanovich, K. E., & Siegel, L. S. (1994). Phenotypic performance
profile of children with reading disabilities: A regression-based test
of the phonological-core variable-difference model. Journal of
Educational Psychology, 86, 24–53.
Stanovich, K. E., Siegel, L. S., & Gottardo, A. (1997). Converging
evidence for phonological and surface subtypes of reading disabil-
ity. Journal of Educational Psychology, 89, 114–127.
Stroop, J. R. (1935). Studies of interference in serial verbal reactions.
Journal of Experimental Psychology, 18, 643–661.
Trainham, T. N., Lindsay, D. S., & Jacoby, L. L. (1997). Stroop
process dissociations: Reply to Hillstrom and Logan (1997).

P. McDougall et al. / Brain and Language 92 (2005) 185–203 203
Journal of Experimental Psychology: Human Perception and Per-
formance, 23, 1579–1587.
West, R. F., & Stanovich, K. E. (1988). How much of sentence
priming is word priming. Bulletin of the Psychonomic Society, 26,
1–4.
Woodcock, R. W. (1987). Woodcock reading mastery tests-revised.
Circle Pines, MN: American Guidance Service.
Zeno, S. M., Ivens, S. H., Millard, R. T., & Duvvuri, R. (1995). The
educator’s word frequency guide. Touchstone Applied Science
Associates.
Zorzi, M., Houghton, G., & Butterworth, B. (1998). Two routes or one
in reading aloud. A connectionist dual-process model. Journal of
Experimental Psychology: Human Perception and Performance, 24,
1131–1161.


