Embed Size (px)
Citation preview

http://heb.sagepub.com/Health Education & Behavior
http://heb.sagepub.com/content/early/2011/10/13/1090198111418109The online version of this article can be found at:
DOI: 10.1177/1090198111418109
published online 14 October 2011Health Educ BehavDavid M. DeJoy, Mark G. Wilson, Heather M. Padilla, Ron Z. Goetzel, Kristin B. Parker, Lindsay J. Della and Enid C. Roemer
Process Evaluation Results From an Environmentally Focused Worksite Weight Management Study
Published by:
http://www.sagepublications.com
On behalf of:
Society for Public Health Education
can be found at:Health Education & BehaviorAdditional services and information for
http://heb.sagepub.com/cgi/alertsEmail Alerts:
http://heb.sagepub.com/subscriptionsSubscriptions:
http://www.sagepub.com/journalsReprints.navReprints:
http://www.sagepub.com/journalsPermissions.navPermissions:
at UNIV OF GEORGIA LIBRARIES on October 21, 2011heb.sagepub.comDownloaded from

Health Education & BehaviorXX(X) 1 –14© 2011 by SOPHEReprints and permission: sagepub.com/journalsPermissions.navDOI: 10.1177/1090198111418109http://heb.sagepub.com
418109 HEBXXX10.1177/1090198111418109DeJoy et al.Health Education & Behavior
1University of Georgia, Athens, GA, USA2Emory University, Atlanta, GA, USA3Mercer Consulting, Norwalk, CT, USA4University of Louisville, Louisville, KY, USA
Corresponding Author:David M. DeJoy, Workplace Health Group, School of Public Health, University of Georgia, 303 Ramsey Center, Athens, GA 30602, USA Email: [email protected]
Process Evaluation Results From an Environmentally Focused Worksite Weight Management Study
David M. DeJoy, PhD1, Mark G. Wilson, HSD1, Heather M. Padilla, MS, RD, LD1, Ron Z. Goetzel, PhD2, Kristin B. Parker, PhD3, Lindsay J. Della, PhD4, and Enid C. Roemer, PhD2
Abstract
There is currently much interest in exploring environmental approaches to combat weight gain and obesity. This study presents process evaluation results from a workplace-based study that tested two levels of environmentally focused weight management interventions in a manufacturing setting. The moderate treatment featured a set of relatively simple, low-cost environmental modifications designed to facilitate healthy eating and physical activity; the intense treatment added elements intended to actively involve and engage management in program efforts. Fidelity varied across the 11 interventions comprising the two treatment conditions but did not vary systematically by treatment condition (moderate vs. intense). Environmental assessments showed improvements in workplace supports for weight management and significant differences by treatment level. Positive shifts in health climate perceptions also occurred, but sites receiving the intense treatment were not perceived as more supportive by employees. Challenges and limitations associated with environmental interventions are discussed with specific reference to activating management support.
Keywords
exercise, nutrition, physical activity, process evaluation, worksite health promotion
In response to the increasing prevalence of obesity in the United States, many employers have initiated or expanded health promotion efforts directed at helping employees lose weight and/or maintain healthy body weights (Finkelstein, Fiebelkorn, & Wang, 2005; Schulte et al., 2004). These pro-grams have focused mostly on educational and individually focused interventions, but there is currently growing interest in exploring the potential of environmental interventions designed to support and reinforce healthy eating and increased physical activity (Engbers, van Poppel, Chin A Paw, & van Mechelen, 2005; Stokols, 1996). Much of this interest in environmental approaches can be traced to disap-pointing results from individually focused programs (Anderson et al., 2009; Benedict & Arterburn, 2008; McTigue et al., 2003) and growing recognition that many of our environ-ments appear to encourage overeating and sedentary life-styles (Lake & Townshand, 2006; Swinburn, Egger, & Raza, 1999). However, programs that focus on environmental interventions remain the exception, and much remains to be learned about implementing and evaluating such programs. Of the 47 worksite weight management programs reviewed by the Centers for Disease Control and Prevention Task Force on Community Preventive Services, only 4 studies
examined policy and environmental changes at the worksite (Anderson et al., 2009).
To better understand the potential of environmental inter-ventions, the National Heart, Lung and Blood Institute funded seven research centers to study the impacts of work-place interventions that used environmental approaches or a combination of individual and environmental approaches to preventing or reducing obesity in adults (Pratt et al., 2007). When applied to workplace health promotion, environmen-tal interventions typically involve some combination of strategies designed to alter the physical surroundings and/or associated social, organizational, and economic systems, all with the goal of facilitating positive changes in relevant health behaviors. Environmental interventions involve
at UNIV OF GEORGIA LIBRARIES on October 21, 2011heb.sagepub.comDownloaded from

2 Health Education & Behavior XX(X)
making changes to the context in which behavior occur, and these changes have both objective and subjective qualities (Stokols, 1992). That organizations have different organiza-tional cultures or climates speaks to the importance of the environment as subjectively perceived by those who operate within them (Schein, 2004; Schneider, 1990).
The present article summarizes process evaluation results from one of these studies, a 4-year study that tested two lev-els of environmental interventions in a large manufacturing organization. The moderate-level treatment used a set of inexpensive and potentially generalizable environmental modifications aimed primarily at the physical environment. The intense-level treatment included all of the moderate ele-ments, plus several additional elements that were designed to be indicative of a relatively high level of management engagement and support for the weight management goals of the project. Over the course of the 2-year intervention period, employees in both treatment conditions maintained their weight and body mass index (BMI) whereas control employ-ees gained 1.3 pounds (p < .01) and increased their BMI val-ues by 0.2 (p < .01; Goetzel et al., 2010). No differences were found between the moderate and intense treatment conditions.
Our primary goal was to design a process evaluation that would allow us to assess the quality of implementation of the environmental interventions deployed in this study and to corroborate these mostly objective data with other data col-lected through interviews and surveys of key informants within the organization. In essence, this was an assessment of intervention fidelity; that is, the extent to which the inter-ventions were delivered as planned (Dusenbury, Brannigan, Falco, & Hansen, 2003; Saunders, Evan, & Joshi, 2005; Steckler & Linnan, 2002; Wilson et al., 2010). A second goal of the process evaluation was to be able to monitor antici-pated shifts in the subjective environment or the health cli-mate of the organization. Consistent with Steckler and Linnan (2002), we were interested in capturing the “spirit” as well as the “letter” of the interventions and whether we had affected the hearts and minds of the employees. Producing such impact was an underlying intent of the interventions and important to motivating behavior change. Third, since two levels of environmental interventions were employed in this study, we wanted to be able to detect dose or intensity-related differences using both objective and subjective mea-surement tools.
MethodsStudy Setting and Participants
The study was conducted in 12 worksites of The Dow Chemical Company (hereafter known as Dow), an interna-tional science and technology company. There were 10,281 employees at the 12 Dow sites at the beginning of the study, of whom 8,013 were at the treatment sites (n = 9) and 2,268
were at the control sites (n = 3). The three control sites, selected by Dow’s corporate and site leaders, were instructed not to introduce new environmental interventions for 2 years. Existing individually oriented programs were allowed to continue at all sites. The nine remaining sites were matched on size and other relevant measures and then randomly assigned to moderate or intense intervention conditions based on a coin flip. Five sites served as the intense interven-tion condition (6,620 employees) and four as the moderate intervention condition (1,393 employees). The average age of employees at Dow was 43 years, 75% were male, 82% were Caucasian, 54% were classified as laborers, clerical, or technical workers, and 44% were classified as professionals or managers. Eight of the nine treatment sites housed pro-duction facilities, and the remaining site (Site 8) housed mostly technical and professional personnel. Employees at all nine sites were quite similar in terms of age, gender, and race. All employees were encouraged to complete the par-ticipant questionnaire and provide biometric data; however, these activities were voluntary without financial incentives. The process evaluation only includes data from the nine intervention sites.
InterventionsIntervention development was informed by social–ecological theory (Green & Kreuter, 1999; Stokols, 1992), particularly as it has been applied to work settings, including models of integrated programming (Dalton & Harris, 1991; DeJoy & Southern, 1993), health and productivity management (Goetzel, Guindon, Turshen, & Ozminkowski, 2001), and organizational health promotion (Danna & Griffin, 1999; DeJoy & Wilson, 2003). The final set of interventions was determined through a participatory and consultative process involving site and corporate personnel and the collection and analysis of formative research data (see Wilson et al., 2007). Table 1 contains a brief description for each intervention and the primary and secondary data sources used to assess implementation. The moderate treatment condition focused on environmental strategies that were evidence-based, inex-pensive, and easily applied and sustained in a variety of work settings. The moderate-level interventions primarily involved modifying the physical environment to (a) increase access to healthy foods and physical activity options for all employees, (b) saturate the environment with messages encouraging healthy eating and physical activity, (c) provide ongoing encouragement and social support for healthy eating and physical activity, and (d) recognize and reward employees for efforts they had made to live a healthy lifestyle (see Table 1). The intense treatment condition included all of the moderate-level interventions, plus several additional activities intended to engage management and provide a more robust level of social–organizational support for healthy eating and physical activity (Table 1). This was accomplished by (a) having site manag-ers include health-related goals as part of their organizational
at UNIV OF GEORGIA LIBRARIES on October 21, 2011heb.sagepub.comDownloaded from

DeJoy et al. 3
Table 1. Interventions and Data Sources
Intervention DescriptionPrimary Data
Sources Secondary Data Sources
All sites Vending 25% food items healthy choices (HC); 40%
beverages HC; HC items labeledEAT Site coordinator interviews;
employee survey Cafeteria 3 fresh fruits; 4 vegetable choices; 2 whole
grains; 50% dairy HC; 50% entrees HC; all HC items labeled
EAT; company data Site coordinator interviews; employee survey
Catering policies 100% of items in meetings HC; 50% of items for special events HC; HC items labeled
EAT; company data Site coordinator interviews; employee survey
Walking paths Walking path on site; signage EAT Site coordinator interviews; employee survey
HCFP Health coaches in each workgroup HCFP survey/focus groups
Site coordinator interviews
Targeted messages E-mail messages; newsletter article; phone-in sessions; posters/table tents; HC labeling; walking path signage
EAT Employee survey; HCFP survey
Employee rewards and recognition
Employees recognized for healthy/positive changes and helping others
Company data Site coordinator interviews; employee survey; HCFP survey
Intense sites only Organizational goal setting Site leadership sets program related goals Company data Site coordinator interviews Leadership accountability Site leadership reports status/progress to
senior leadershipCompany data Site coordinator interviews
Leadership training Site leadership trained on program implementation
Company data Site coordinator interviews
Leadership rewards and recognition
Site leadership recognized for achieving site goals
Company data Site coordinator interviews
Note. EAT = Environmental Assessment Tool; HCFP = Healthy Culture Focal Point.
plans, (b) providing accountability for achieving the planned goals during meetings between site leaders and corporate leaders, (c) training site leaders about the program and ways to encourage employee participation, and (d) recognizing and rewarding site leaders for achieving project-related goals. Together, the intense interventions sought to make health promotion an expressed business priority. As an engineering-based enterprise, the culture of this organization assigned great importance to goal setting and the use of objective metrics.
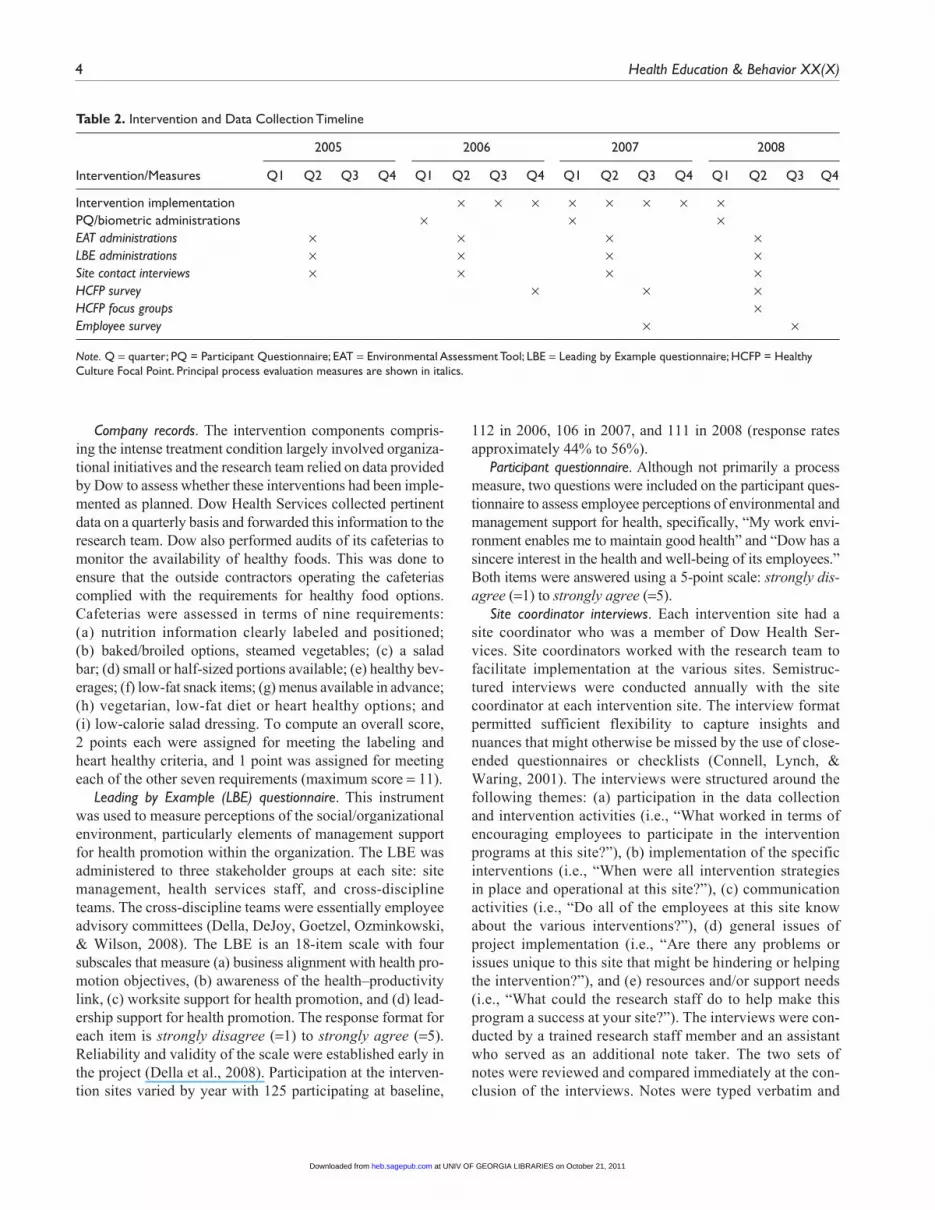
Data Collection and InstrumentsThe overall timeline for the project is presented in Table 2. The principal process evaluation measures are shown in ital-ics in Table 2. Most process data were collected in the sec-ond quarter of each year of the project and included a combination of quantitative and qualitative assessments. The intervention period extended from the second quarter of 2006 through the first quarter of 2008. The 2006 and 2007 process measures are thus most useful for evaluating imple-mentation fidelity.
Environmental Assessment Tool (EAT). The EAT was developed specifically for this project to collect data about
the organization’s physical environment, policies and ongo-ing programs, and the surrounding community. The EAT is an observational or environmental audit tool. A total score is calculated for each EAT administration (maximum score = 100), along with subscores for physical activity, nutrition and weight management, and organizational characteristics and support. The EAT has been shown to have high interrater reliability and concurrent and predictive validity (DeJoy et al., 2008). The EAT provided data specific to several of the moderate-level interventions, primarily those involving direct modifications to the physical environment. The EAT was administered by research staff during site visits. Since many of the sites were too large for observers to inspect every building (site size ranged from 12 to 300 buildings), seven occupied buildings were selected. These selections were made in consultation with site representatives with two criteria in mind: (a) that selected buildings house sig-nificant numbers of employees throughout the work day and (b) that the employees be generally representative of the major employee categories at the facility (laborers, clerical, technical, etc.). The same buildings were reexamined during each data collection period. Additional information about the EAT may be found elsewhere (DeJoy et al., 2008; Parker, DeJoy, Wilson, Bowen, & Goetzel, 2010).
at UNIV OF GEORGIA LIBRARIES on October 21, 2011heb.sagepub.comDownloaded from
4 Health Education & Behavior XX(X)
Company records. The intervention components compris-ing the intense treatment condition largely involved organiza-tional initiatives and the research team relied on data provided by Dow to assess whether these interventions had been imple-mented as planned. Dow Health Services collected pertinent data on a quarterly basis and forwarded this information to the research team. Dow also performed audits of its cafeterias to monitor the availability of healthy foods. This was done to ensure that the outside contractors operating the cafeterias complied with the requirements for healthy food options. Cafeterias were assessed in terms of nine requirements: (a) nutrition information clearly labeled and positioned; (b) baked/broiled options, steamed vegetables; (c) a salad bar; (d) small or half-sized portions available; (e) healthy bev-erages; (f) low-fat snack items; (g) menus available in advance; (h) vegetarian, low-fat diet or heart healthy options; and (i) low-calorie salad dressing. To compute an overall score, 2 points each were assigned for meeting the labeling and heart healthy criteria, and 1 point was assigned for meeting each of the other seven requirements (maximum score = 11).
Leading by Example (LBE) questionnaire. This instrument was used to measure perceptions of the social/organizational environment, particularly elements of management support for health promotion within the organization. The LBE was administered to three stakeholder groups at each site: site management, health services staff, and cross-discipline teams. The cross-discipline teams were essentially employee advisory committees (Della, DeJoy, Goetzel, Ozminkowski, & Wilson, 2008). The LBE is an 18-item scale with four subscales that measure (a) business alignment with health pro-motion objectives, (b) awareness of the health–productivity link, (c) worksite support for health promotion, and (d) lead-ership support for health promotion. The response format for each item is strongly disagree (=1) to strongly agree (=5). Reliability and validity of the scale were established early in the project (Della et al., 2008). Participation at the interven-tion sites varied by year with 125 participating at baseline,
112 in 2006, 106 in 2007, and 111 in 2008 (response rates approximately 44% to 56%).
Participant questionnaire. Although not primarily a process measure, two questions were included on the participant ques-tionnaire to assess employee perceptions of environmental and management support for health, specifically, “My work envi-ronment enables me to maintain good health” and “Dow has a sincere interest in the health and well-being of its employees.” Both items were answered using a 5-point scale: strongly dis-agree (=1) to strongly agree (=5).
Site coordinator interviews. Each intervention site had a site coordinator who was a member of Dow Health Ser-vices. Site coordinators worked with the research team to facilitate implementation at the various sites. Semistruc-tured interviews were conducted annually with the site coordinator at each intervention site. The interview format permitted sufficient flexibility to capture insights and nuances that might otherwise be missed by the use of close-ended questionnaires or checklists (Connell, Lynch, & Waring, 2001). The interviews were structured around the following themes: (a) participation in the data collection and intervention activities (i.e., “What worked in terms of encouraging employees to participate in the intervention programs at this site?”), (b) implementation of the specific interventions (i.e., “When were all intervention strategies in place and operational at this site?”), (c) communication activities (i.e., “Do all of the employees at this site know about the various interventions?”), (d) general issues of project implementation (i.e., “Are there any problems or issues unique to this site that might be hindering or helping the intervention?”), and (e) resources and/or support needs (i.e., “What could the research staff do to help make this program a success at your site?”). The interviews were con-ducted by a trained research staff member and an assistant who served as an additional note taker. The two sets of notes were reviewed and compared immediately at the con-clusion of the interviews. Notes were typed verbatim and
Table 2. Intervention and Data Collection Timeline
2005 2006 2007 2008
Intervention/Measures Q1 Q2 Q3 Q4 Q1 Q2 Q3 Q4 Q1 Q2 Q3 Q4 Q1 Q2 Q3 Q4
Intervention implementation × × × × × × × × PQ/biometric administrations × × × EAT administrations × × × × LBE administrations × × × × Site contact interviews × × × × HCFP survey × × × HCFP focus groups × Employee survey × ×
Note. Q = quarter; PQ = Participant Questionnaire; EAT = Environmental Assessment Tool; LBE = Leading by Example questionnaire; HCFP = Healthy Culture Focal Point. Principal process evaluation measures are shown in italics.
at UNIV OF GEORGIA LIBRARIES on October 21, 2011heb.sagepub.comDownloaded from

DeJoy et al. 5
collected, coded and analyzed using the constant compara-tive method of analysis (Patton, 2002).
Healthy Culture Focal Point (HCFP) questionnaire. HCFPs were employees who served as peer leaders or health coaches/ambassadors for their department or work unit. A brief survey was administered to the healthy culture focal points to collect information about their intervention-related activities and their perceptions of employee participation and organizational support for the intervention activities at their site. Specifically, they were asked how well they had followed through with their designed responsibilities, such as “to attend the HCFP training” or “to nominate an employee for recognition.” These items were answered: “yes” or “no.” A second set of items examined perceptions of various aspects of employee participation (e.g., “employees at this site have time to participate in the intervention activities”) and organizational support (e.g., “site leadership supports the program”). A 5-point strongly disagree to strongly agree scale was used for these items. The final two items asked about the importance of the HCFP to the success of the pro-gram (5-point scale: very unimportant to very important) and their satisfaction with the level of engagement of their work-group in the interventions (5-point scale: very dissatisfied to very satisfied). Completion rates for this questionnaire var-ied with 68 (40%) participating in 2006, 82 (50%) in 2007, and 60 (44%) in 2008. Focus groups were also conducted with HCFPs near the end of the project to further assess their roles and activities.
Employee questionnaire. This instrument was used to assess general employee awareness, participation, and satisfaction with respect to the various interventions implemented at their site. Since environmental interventions target all employees, the employee survey was an important tool for assessing dose and differences between the two treatment conditions (mod-erate vs. intense). The survey asked employees (a) if they remembered receiving/seeing various targeted messages in their work environments (response: “yes” or “no”), (b) if they participated in the various intervention activities (“yes” or “no”), (c) why they chose to participate if they did, (d) why they chose not to participate if they did not, (e) if they set personal goals for weight loss (“yes” or “no”), (f) if their department set goals (“yes” or “no”), and (g) what effect the program had on their morale, productivity, and job satisfac-tion (5-point scale: very negative to very positive). This sur-vey was administered at two different points during the intervention period. For each survey, a 10% random sample of employees at each site was drawn. This was a way to reach employees who may not have completed the participant ques-tionnaire or participated in the biometric screening.
ResultsAlthough the study was conducted over 4 years during a time when many organizations were experiencing significant
economic challenges, the employee characteristics at the study sites remained surprisingly constant. On average, there were 6,769 employees at intense sites (range: 6,737 to 6,837) and 1,394 at moderate sites (range: 1,369 to 1,423). The average age (45 years) and gender breakdown (82% male) were constant across all 4 years. However, one of the study sites (Site 7) was sold to another corporation near the conclusion of the study; therefore, some final data were not obtained for that site.
Intervention Fidelity: Moderate InterventionsBased on data collected, each intervention was assigned a fidelity rating of high, moderate, or low. These were basi-cally summary judgments of how well each intervention component was implemented at the pertinent sites, taking into consideration both quantitative and qualitative data sources. A rating of high indicates that all or most sites met the major criteria specified for that intervention; moderate that performance levels varied considerably across sites and/or criteria; and low that most or all sites failed to meet the major criteria for the intervention. The summary ratings were determined by consensus among the members of the process evaluation team.
Vending. Table 3 summarizes the performance of the nine sites in implementing the vending intervention. No site was able to achieve and maintain the goal of 25% healthy snacks throughout the entire intervention period. Only one site (Site 9) met and maintained the goal for healthy beverages (40%). All intervention sites demonstrated improvements in access to healthy snacks and beverages from baseline, but the improvements were quite variable across sites and time peri-ods. Interviews with the site coordinators highlighted the dif-ficulties of working with multiple vendors and monitoring machines scattered throughout the sites. The inability of the vendors to monitor their own personnel and machines cre-ated additional obstacles to achieving site goals. The overall fidelity of the vending intervention was judged to be low.
Cafeterias. Only six of the nine sites had onsite cafeterias and one of these closed during the course of the study (Site 2). Table 3 includes the healthy food scores for the sites with caf-eterias. All cafeterias at intense sites had scores of at least 10 (maximum = 11) throughout the intervention period. Only one moderate site (Site 3) maintained its cafeteria throughout the study and its scores were generally lower (scores 7-8). The overall fidelity of this intervention was judged to be high.
Catering. Of the six sites with cafeterias, five offered catering services (including the site that closed its cafeteria). Four of these sites met the catering guideline (50% of catered orders meet healthy food criteria) throughout the interven-tion period. Assessing fidelity was more complicated for the sites that relied on outside restaurants for catering services. Performance was generally poorer and more variable for these sites. Based on this, fidelity was rated as moderate.
at UNIV OF GEORGIA LIBRARIES on October 21, 2011heb.sagepub.comDownloaded from

6 Health Education & Behavior XX(X)
Targeted messages. Table 4 summarizes the extent of tar-geted health messages at each site. Overall, most sites increased the percentage of targeted messages from baseline through the intervention period. However, the percentages tended to fluctu-ate widely across time, particularly for areas displaying physi-cal activity messages. Generally, sites were more consistent in posting signs encouraging healthy eating than physical activ-ity. Fidelity was judged as moderate for this intervention.
Walking paths. At baseline, no sites had walking paths onsite. By the beginning of the intervention, every intervention site
had a walking path available to all employees. All these walking paths were in place throughout the intervention period. Sites were also asked to have signage identifying the route and providing distance information. All sites did so with the exception of two (Sites 3 and 4). Fidelity for this intervention was rated as high.
Healthy Culture Focal Points. Every site coordinator reported having HCFPs in place and in sufficient numbers to reach all employees. This was verified by the HCFP survey (44% response rate overall). HCFPs typically performed all their
Table 3. Availability and Promotion of Healthy Foods
Healthy Vending: Snacksa (%) Healthy Vending: Beveragesb (%) Healthy Food Scorec
Worksite Base Int Yr 1 Int Yr 2 Post Int Base Int Yr 1 Int Yr 2 Post Int Base Int Yr 2 Post Int
Moderate Site 1 11 30 21 25 17 25 36 38 — — — Site 2 8 14 16 13 26 30 31 28 — — — Site 3 9 18 11 14 17 23 33 26 7 7 8 Site 4 9 16 10 11 21 22 25 19 — — — Mean 9 20 15 16 20 25 31 28 — — —Intense Site 5 9 16 17 14 28 29 33 28 10 10 11 Site 6 13 14 10 16 23 41 33 38 10 10 11 Site 7 8 24 17 21 28 33 15 22 — — — Site 8 14 18 19 19 34 26 49 31 10 10 11 Site 9 11 18 26 21 38 40 43 42 10 11 11 Mean 11 18 18 18 30 34 35 32 10 10 11
Note. “—” indicates no cafeteria on site, therefore, a Healthy Food Score could not be obtained. Base = baseline; Int Yr 1 = Intervention Year 1; Int Yr 2 = Intervention Year 2; Post Int = postintervention.a. Healthy snack criteria: Fat ≤30% of calories and ≤35% sugar by weight. Goal is 25% of snack and candy items are healthy.b. Healthy beverage criteria: Fat ≤30% of calories, ≤35% sugar by weight, and 100% fruit juice or water or diet soda. Goal is 40% of beverage items are healthy.c. Maximum score = 11.
Table 4. Targeted Messages
Areas With Signs Encouraging Healthy Eating (%) Areas With Signs Encouraging Physical Activity (%)
Worksite Base Int Yr 1 Int Yr 2 Post Int Base Int Yr 1 Int Yr 2 Post Int
Moderate Site 1 19 77 55 78 31 55 35 50 Site 2 20 70 81 59 20 35 19 59 Site 3 8 61 61 50 15 67 52 56 Site 4 0 73 82 83 33 45 45 58 Mean 12 70 70 68 25 51 38 56Intense Site 5 33 55 64 71 33 64 44 54 Site 6 0 38 60 44 25 50 30 67 Site 7 0 100 63 40 0 50 0 40 Site 8 80 100 100 64 80 0 21 79 Site 9 33 55 27 45 33 48 27 24 Mean 29 70 63 53 34 42 24 53
Note. Base = baseline; Int Yr 1 = Intervention Year 1; Int Yr 2 = Intervention Year 2; Post Int = postintervention.
at UNIV OF GEORGIA LIBRARIES on October 21, 2011heb.sagepub.comDownloaded from
DeJoy et al. 7
specified duties (e.g., putting up posters, encouraging healthy food choices at meetings, and nominating employees for rec-ognition) at least once per measurement period but seldom performed these tasks on a more frequent or regular basis. HCFP activity increased somewhat between 2007 and 2008, suggesting that this intervention was somewhat slow to gain momentum during the intervention period. Focus group results suggested that HCFPs had limited time to devote to their role and sometimes did not receive needed information and materials in a timely manner. Fidelity for this interven-tion was rated as moderate.
Employee recognition and rewards. All site coordinators reported having an employee rewards and recognition program in place at each site. This was confirmed by data collected by the organization reporting the number of employees recog-nized each quarter. In total, 106 employees were recognized at the moderate sites (60 in 2006 and 46 in 2007) and 260 were recognized at the intense sites (176 in 2006 and 84 in 2007). On a per employee basis, the recognition rate was somewhat higher at the moderate than the intense sites. Fidelity for the rewards and recognition intervention was judged as high.
Intervention Fidelity: Intense InterventionsOrganizational goal setting. All sites set goals for employee
participation in the health risk assessment/biometric screen-ings (40% of eligible employees), employee weight-tracking program (25%), and leadership training (100%). Four of the five intense sites met or exceeded the 40% participation goal in 2006 (range: 34% to 57%) but only one site did so in 2007 (range: 29% to 49%). For the weight-tracking initiative, all sites met or exceeded the goal in both years (range: 27% to 59%). In 2006, all sites trained at least 50% of their leaders (highest 91%), but leader training fell off significantly dur-ing 2007 because of budget constraints and turnover in lead-ership positions. Overall, the organizational goal-setting intervention was judged as having moderate fidelity.
Leadership accountability. Accountability involved report-ing site performance to senior corporate management. The organization reported that all site leaders were held account-able as established by the intervention, indicating a high level of fidelity.
Leadership training. As indicated above, participation in training by leadership was reasonably good during the first year but fell off considerably during the second year. Fidelity here was judged to be low.
Leadership rewards and recognition. According to informa-tion received from the organization, the leader (senior man-ager) at each intense site was recognized for achieving participation goals and providing overall support for the project, suggesting high fidelity for this intervention.
In summary, 5 of the 11 interventions deployed in this project received fidelity ratings of high; 4 were judged as moderate, and 2 were rated as low. Of the five best imple-mented interventions, three were moderate interventions and
two were intense interventions. Two interventions received ratings of low (vending and leadership training). In terms of the overall pattern, it is difficult to conclude that either set of interventions (moderate or intense) was more or less effec-tively implemented compared with the other. Certainly, it is easy to see where improvements in implementation could be made. Interestingly, some of the seemingly most straightfor-ward interventions, such as vending and targeted messages, proved quite difficult to implement with high fidelity. From interview data and onsite observations, these interventions proved challenging because they involved coordinating mul-tiple outside contractors and because many of the sites were very large, contained a complex array of buildings, some of which were challenging to access (primarily for safety and technical reasons). The interventions that were more under internal control generally experienced better fidelity.
Perceptions of Health ClimateEmployee health climate perceptions were collected from three data sources, each providing a different perspective. The LBE questionnaire was administered to three stake-holder groups at each site (leadership, health services, employee advisory committee); the participant question-naire completed by employees who chose to participate in the study’s main data collection activities (approximately 30% to 50% of employees at each site); and the employee survey administered to a random sample of employees in 2007 and 2008 (2007, n = 554, response rate = 24%) and (2008, n = 428, response rate = 19%). This survey sought to reach employees who were potentially exposed to the inter-ventions but who chose not to be active participants in the study. Results from these instruments by site are presented in Tables 5 and 6.
LBE scores for all nine intervention sites improved over baseline values (Table 5), but stakeholders at the intense sites did not rate their sites as significantly more supportive than those at the moderate sites (see also Della et al., 2010). Comparing the 2006 and 2007 data for the intense sites show some declines in scores during the course of the intervention period. This was more pronounced for leadership support compared with worksite support. Results from the partici-pant questionnaire show a generally similar pattern for this broader sample of employees. The 2006 administration of this questionnaire took place just prior to the roll out of the interventions, so it should be viewed as a baseline assess-ment. Once again, there is a lack of clear distinction between the two treatment levels in terms of climate-related percep-tions. The random sample employee survey also showed fairly comparable climate levels for both treatment condi-tions. Based on these three data sources, health climate clearly improved compared to baseline values and was mod-erately positive at all nine sites throughout the intervention period. That is, there were relatively few means less than 3.0 or greater than 4.0 on the 5-point scale. But in terms of dose,
at UNIV OF GEORGIA LIBRARIES on October 21, 2011heb.sagepub.comDownloaded from

8 Health Education & Behavior XX(X)
Table 5. Perceived Health Climate
Moderate Intervention Sites Intense Intervention Sites
Measures Site 1 Site 2 Site 3 Site 4 Mean Site 5 Site 6 Site 7 Site 8 Site 9 Mean
LBE factor scoresa Worksite support for HP 2005 3.1 2.5 3.1 2.7 2.8 3.3 3.2 2.9 3.4 2.7 3.2 2006 3.3 3.3 3.4 3.3 3.3 3.6 4.0 3.9 3.6 3.1 3.5 2007 3.8 3.3 3.7 3.6 3.6 3.3 — 3.6 3.6 3.7 3.5 2008 3.1 3.6 3.6 3.5 3.5 3.6 3.4 — 3.3 3.7 3.6Leadership support for HP 2005 3.3 3.1 3.4 3.2 3.2 3.6 3.1 3.0 3.3 2.9 3.3 2006 3.7 3.6 3.5 3.6 3.6 3.8 4.4 3.9 3.8 3.8 3.8 2007 3.8 3.3 3.6 4.0 3.6 3.3 — 3.6 3.5 3.6 3.5 2008 3.4 3.6 3.6 3.5 3.6 3.6 3.6 — 3.3 3.8 3.6Participant questionnairea,b Supportive work environment 2006 3.2 3.1 3.1 2.9 3.1 3.2 3.1 2.9 3.2 3.3 3.2 2007 3.4 3.2 3.4 3.0 3.3 3.3 3.5 3.3 3.2 3.5 3.4 2008 3.5 3.4 3.4 3.0 3.4 3.3 3.6 3.4 3.2 3.4 3.3Employer interest in health 2006 3.6 3.3 3.2 3.4 3.3 3.5 3.3 3.6 3.6 3.6 3.5 2007 3.9 3.3 3.5 3.4 3.5 3.6 3.5 3.9 3.5 3.7 3.6 2008 3.7 3.5 3.3 3.5 3.5 3.5 3.8 3.7 3.6 3.6 3.6Employee survey: Program supportc Dow corporate leadership 2007 3.8 3.3 3.4 3.4 3.4 3.7 3.9 4.1 3.5 3.6 3.7 2008 3.6 3.4 3.7 3.8 3.6 3.5 3.6 — 3.8 3.6 3.6Worksite leadership 2007 4.0 3.4 3.6 3.7 3.6 3.8 4.1 4.1 3.5 3.9 3.8 2008 3.9 3.5 3.8 4.2 3.7 3.7 3.8 — 3.8 3.8 3.8
Note. LBE = Leading by Example Questionnaire. Site 7 was sold in 2008 and final data are not available.a. 1-5 scale; 1 = strongly disagree to 5 = strongly agree.b. Sample composed of those in 2006 and 2008 cohort.c. 1-5 scale; 1 = very unsupportive to 5 = very supportive.
there was little evidence that employee perceptions of envi-ronmental support differed substantially as a function of treatment level. Employees at the intense sites did not per-ceive their work environment as being substantively more supportive of their health.
Dose-Related Effects: EAT ScoresThe EAT was used to provide an objective assessment of environmental supports for healthy eating and weight man-agement at the two sets of intervention sites. Table 6 pres-ents total EAT scores and subscores for the nine intervention sites. Total scores for all but one site (Site 8) increased over baseline levels. This one exception had a baseline score (56.0) that already exceeded the scores reached by most other sites during the intervention period. Not surprisingly, physical activity subscores remained quite low through-out the study. Walking paths were the only activity-related
intervention. Safety and other organizational and site constraints made it difficult to include interventions directly targeting physical activity behavior. On the other hand, nutrition and weight management subscores increased substantially over baseline levels at all sites, with some sites showing declines between 2006 and 2007. Subscores for organizational sup-port also increased as a function of the interventions. Effects on this subscore were somewhat dampened because the scoring rubric for this category included elements such as site characteristics, work rules, written policies, and preex-isting programs and services. None of these was specifically targeted by the interventions. Parker et al. (2010) used dif-ference in difference regression analyses to compare the moderate and intense conditions and found significant dif-ferences between treatment levels for both nutrition/weight management and organizational characteristics/support. Intense sites had higher scores both for baseline to 2007 and for baseline to 2008 (p < .05 or better). There also was a
at UNIV OF GEORGIA LIBRARIES on October 21, 2011heb.sagepub.comDownloaded from

DeJoy et al. 9
similar significant difference for EAT total scores from 2006 to 2008, but the 2006 to 2007 comparison fell short of sig-nificance (p < .07).
Dose-Related Effects: Employee SurveyTable 7 presents summary results from the 2007 employee survey that was administered to a random sample of employ-ees midway through the intervention period. Awareness levels for some of the key messaging activities (i.e., news-line articles, posters, and vending machine labels) were quite good overall (70% to 77% across the sites), with only mod-erate amounts of variation across sites. Awareness rates were generally lower for menu labels and table tents/placemats (35% to 50%). Awareness levels for walking paths and suc-cess stories/recognitions were somewhat higher overall (42% to 49%) but showed considerable variability across sites. Based on interviews with site coordinators and HCFPs, usage levels for the walking paths were quite low at almost all sites. Interview results also indicated that employee patronage at some of the cafeterias was low, which, of course, limited the impact of the altered menu offerings. Low patronage would also help explain the lower awareness levels for menu labels and other similar messages. HCFPs and site coordinators were asked about how they viewed employee awareness, interest, and involvement in project
activities. The overall awareness level of employees was judged as being very high.
The surveys also asked about reasons for participating or not participating in project-related interventions. Looking at all nine intervention sites together, the top reason for partici-pating was the desire to make a healthy change (overall aver-age = 52%, range = 30% to 74%). At the opposite end of the spectrum, pressure from peers and managers was the least frequent reason for participating at most of the sites (overall average = 3.4%, range = 0% to 12%). As for reasons for not participating, time commitments was the most frequent rea-son at seven of the nine sites (overall average = 23%, range = 17% to 35%). At one moderate site, lack of interest was the most frequent reason given for not participating (almost 43% of survey respondents). For the remaining site (an intense site), already being at a healthy weight was the top reason for not participating (about 22%).
Comparing awareness levels by treatment condition reveals relatively small differences between moderate and intense sites for most messaging elements, with the notable exception of menu labels. This is almost certainly because of the fact that most cafeterias were located at intense sites. Viewed together, it is difficult to conclude that awareness/familiarity levels were substantially bolstered at the intense sites. If leadership is more engaged and motivated at the intense sites, differences in awareness or familiarity might
Table 6. Environmental Assessment Tool Scores
Total Scores and Subscores
Moderate Intervention Sites Intense Intervention Sites
Site 1 Site 2 Site 3 Site 4 Mean Site 5 Site 6 Site 7 Site 8 Site 9 Mean
Total 2005 30.6 34.2 38.1 27.3 32.6 37.6 39.7 18.4 56.0 47.0 39.7 2006 42.1 44.0 44.1 35.3 41.4 49.8 51.7 32.0 53.3 52.7 47.9 2007 42.6 33.5 51.7 44.5 43.1 48.0 54.3 31.7 58.3 59.8 50.4 2008 45.2 42.9 52.2 44.3 46.1 47.7 50.7 — 55.4 63.5 54.2Physical activity 2005 12.1 7.7 11.7 13.3 11.2 5.9 11.7 1.4 14.0 6.2 7.8 2006 15.3 8.5 11.5 13.0 12.1 8.2 13.7 2.8 10.7 9.8 9.0 2007 14.3 5.8 15.3 18.3 13.4 7.0 13.3 6.2 12.0 10.7 9.8 2008 15.0 9.7 14.3 19.8 14.7 9.0 14.3 — 5.0 11.7 10.0Nutrition and weight management 2005 0.5 12.5 6.4 1.0 5.1 8.7 8.0 1.0 21.0 18.8 11.5 2006 11.8 17.5 12.6 8.3 12.6 20.6 18.0 12.2 20.7 21.8 18.7 2007 10.3 10.6 14.3 7.3 10.6 20.0 20.0 7.5 20.3 20.1 17.6 2008 14.2 15.1 19.8 9.5 14.7 21.7 19.3 — 23.7 28.0 23.2Organizational characteristics and support 2005 18.0 14.0 20.0 13.0 16.3 23.0 20.0 16.0 21.0 22.0 20.4 2006 15.0 18.0 20.0 14.0 16.8 21.0 20.0 17.0 22.0 21.0 20.2 2007 18.0 17.0 22.0 19.0 19.0 21.0 21.0 18.0 26.0 29.0 23.0 2008 16.0 18.0 18.0 15.0 16.8 17.0 17.0 — 22.0 28.0 21.0
Note. Site 7 was sold in 2008 and final data are not available. Maximum total points = 100; subscores: access to physical activity (32 points max.), nutrition and weight management (32 points max.), and organizational characteristics and support (36 points max.).
at UNIV OF GEORGIA LIBRARIES on October 21, 2011heb.sagepub.comDownloaded from

10 Health Education & Behavior XX(X)
Table 7. Employee Survey: Awareness
Activities
Moderate Intervention Sites Intense Intervention Sites
Site 1 Site 2 Site 3 Site 4 Mean Site 5 Site 6 Site 7 Site 8 Site 9 Mean
Monthly newsline articles 78 69 79 85 74 87 83 81 64 81 80Table tents/placemats 52 33 39 31 38 33 48 50 41 26 35Posters 82 69 75 86 74 70 79 83 89 65 74Vending machine labels 85 77 63 92 77 65 92 87 67 79 74Menu item labels 23 27 33 46 30 56 83 32 75 56 59Walking path/route information 58 41 59 0 44 58 59 78 60 41 55Success stories/recognition 39 55 32 71 49 49 46 50 27 32 40
Note: All values are in percentage.
be expected. However, it might be even more plausible to expect that motivated managers would be more likely to encourage participation and remove or modify barriers inhibiting participation. Time commitments as a barrier were virtually equal across the two groups of sites, and all sites had very few employees who were unsure about their eligi-bility to participate in intervention-related activities. The use of various incentive or social strategies (e.g., buddy systems, team competitions) to boost involvement and participation were equally absent at both sets of sites.
DiscussionThe 11 intervention components comprising the two treat-ment conditions in this study were implemented with varying degrees of fidelity. Environmental assessment (EAT) results indicated that environmental/organizational supports for healthy eating and weight management improved markedly when the interventions were deployed, and, as expected, EAT scores were significantly higher at intense than moderate sites. Employee health climate perceptions also improved with the interventions, but here intense sites were not perceived as more supportive than moderate sites. There was convergence among all three climate measures in this regard.
Even with perfect implementation, the moderate interven-tions used in this study were expected to produce only modest changes to the work environment directed at prompting and facilitating healthy behaviors. That these interventions were sufficient to raise employee awareness seems clear; yet in terms of weight-related outcomes, employees at moderate sites did not differ significantly from those at control sites (Goetzel et al., 2010). Furthermore, some of the simplest moderate interventions proved quite difficult to implement (e.g., healthy vending), primarily because of the need to coor-dinate multiple outside contractors. Site characteristics also limited the impact of some of the moderate interventions. For example, the cafeteria intervention was very well imple-mented, but a number of sites did not have cafeterias. This also indirectly affected the catering intervention because these sites had to rely on outside caterers that were more
difficult to manage. Walking paths were introduced and maintained with high fidelity but received only limited usage by employees. Chemical plants do not offer conditions con-ducive to outside walking, and at some sites, path users were required to use or carry personal protection equipment (e.g., ear plugs, escape respirators). EAT scores were significantly higher at intense sites but still not very high in absolute terms (total scores <60 out of 100). In fact, one of the intense sites (Site 7) had lower total EAT scores than almost all of the moderate sites. The absence of treatment effects for the cli-mate measures provided the initial clue that the fully-intended impact of the intense interventions was not being realized.
The workplace health promotion literature has long held that management support is critical to program success (DeJoy & Wilson, 2003; Goetzel et al., 2007; Hunt et al., 2007; O’Donnell, Bishop, & Kaplan, 1997). This study sought to operationalize this idea by using some of the same tools that the business world uses to motivate and hold managers account-able for conventional business performance outcomes. Perhaps with the exception of leader training, these interven-tions were reasonably well implemented in the present study, but their impact did not appear to trickle down to the shop floor and frontline workers. Setting site goals and having site leaders report their progress to senior corporate leadership did not appear to significantly heighten focus or energize action to a greater extent at the intense sites relative to the moderate sites. There are several possible reasons for these observa-tions. One reason might be that the management actions asso-ciated with the interventions were executed on a largely pro forma basis. In other words, they were performed as specified but did not carry or receive the same level of priority and effort devoted to other leadership responsibilities, such as production output, work quality, or cost management. Holding managers accountable for adopting health improvement poli-cies and practices is still a very new idea.
A second possible explanation is that leader training focused more on encouragement and recognition than direc-tion of activity. Site managers were not sufficiently encour-aged to be “hands on” or directive in their support. The leadership training intervention started off reasonably well
at UNIV OF GEORGIA LIBRARIES on October 21, 2011heb.sagepub.comDownloaded from

DeJoy et al. 11
but faded considerably during the second year of the inter-vention because of leadership turnover and budget/travel constraints. Also, since the project was a research study, managers may have been reluctant to actively step in and “interfere” with or “contaminate” what was going on in the study. The study was the responsibility of the Health Services Expertise Center within Dow, which has considerable status and visibility within the company due in part to longstanding legal mandates for chemical exposure assessment and employee surveillance, and in part because of the leadership of a very dynamic medical director. It is conceivable that both these factors limited the direct activity and involvement of line managers, which, in turn, affected the impact of the intense interventions.
A third possibility is that leaders simply became dis-tracted from the goals of the project because of competing priorities. After all, the intervention period for this study was 2 years in duration, following a full year of formative research. As noted earlier, the second year of the interven-tion was marked by considerable leader turnover, a poor eco-nomic climate for business, and spillover effects from Hurricane Katrina. One site was sold during the course of the study. Other sites experienced changes in leadership and/or underwent major shifts in processes and products. Some sites were even threatened or temporarily shut down because of hurricane activity along the Gulf coast.
Results from the stakeholder climate survey (LBE) pro-vide some support for this distraction explanation. The LBE was administered to three stakeholder groups at each inter-vention site: site leadership, health services staff, and cross-discipline team members. These three groups would be expected to be most knowledgeable and most involved with project-related activities. During the first year of the inter-vention (2006), perceptions of both worksite and leadership support were considerably higher at intense than moderate sites (Della et al., 2010). But by 2007, these differences had essentially disappeared. This “parity” across sites in 2007 was due almost entirely to declines in climate perceptions at the intense sites (see Table 5).
The research team chose to focus on management engage-ment as the centerpiece of the intense condition. One impor-tant lesson learned from this study is the need to carefully plan and map the mechanisms and action sequences through which this intervention component is expected to produce its intended results (Bartholomew, Parcel, Kok, & Gottlieb, 2001). Management engagement or support is not really much different from other intervention strategies in health promotion. Management engagement involves providing managers with specific knowledge, motivation, and behav-ioral options that can be used to produce desired environmen-tal and/or behavioral changes in the work setting. In future studies, more attention should be directed at providing mid-dle managers and site leaders with specific training on what they can do to influence health behaviors at the workplace. Today’s business environment is highly dynamic and managers
must continually juggle competing demands and changing priorities. As such, this training should be accompanied by frequent prompts and reminders, as well as an infusion of new ideas and resources that managers can use to help sustain their focus on health promotion goals. This approach should replace conventional thinking that general management and leadership skills automatically and effectively transfer to achieving health promotion goals. Of course, there are other ways to add intensity to environmentally focused interven-tions. One alternate would be to simply ratchet up the envi-ronmental interventions themselves and/or add other features to them. Boosting the impact of environmental interventions targeted at weight management and physical activity may require some combination of pertinent policy directives, managerial and worker incentives, and changes to work rules and work organization systems that enable and reinforce behavior change in direct and tangible ways.
Two decisions made during the formative phase of this project may have contributed to making it more difficult to show differences between the moderate and intense condi-tions. Initially, the plan was to have HCFPs only at intense sites (Wilson et al., 2007). Early on, it became clear that site coordinators were stretched too thin in terms of time and other responsibilities to oversee the implementation of mul-tiple interventions at multiple sites, many of which were very large and operationally complex. Having focal points at all intervention sites did facilitate implementation, but it proba-bly also reduced the contrast between the two treatment con-ditions. Also, as revealed by the HCFP survey and focus groups, the HCFPs, by necessity, spent more time perform-ing routine administrative duties (e.g., posting messages, attending meetings) than providing workgroup support and coaching.
The second issue involved the procedures used to assign site coordinators to the various participating sites. Site coor-dinators were Dow personnel affiliated with site Health Services. Each was responsible for overseeing health promo-tion activities at multiple Dow locations in a particular ser-vice area. They typically had an office at one site and made regular visits to other sites in their area. As part of the study design, intervention sites were randomly assigned to either the moderate or intense condition. Once this was accom-plished, site coordinators were assigned to participating sites within or near their regular service areas, taking site charac-teristics and travel distances into consideration. This resulted in some site coordinators being responsible for sites in both the moderate and intense treatment conditions. Although great care was taken to honor treatment differences, this may have further compromised observed differences between the two intervention levels.
Finally, several limitations often encountered in process evaluations should be considered in interpreting the results of this process evaluation. First, much of the data collected in this process evaluation were self-report and thus subject to bias (Hunt et al., 2007). Several strategies were employed to
at UNIV OF GEORGIA LIBRARIES on October 21, 2011heb.sagepub.comDownloaded from

12 Health Education & Behavior XX(X)
minimize this problem. Survey and interview data were sup-plemented by direct observations when possible such as those provided through the EAT. Process data were collected from multiple perspectives, including implementation staff, site stakeholders, program participants, and general employ-ees. Whenever possible, multiple data sources were used to verify or cross-check results, such as using interview data to verify and enrich questionnaire results.
Having somewhat limited access to the study sites also posed limitations. Limited access necessitated fairly heavy reli-ance on brief questionnaires, sometimes administered electron-ically. This also contributed to the problem of overlapping roles, in that, some individuals, such as site coordinators, both provided and collected process data. This presented some risk of reporting bias or receiving overly positive assessments (Audrey, Holiday, Parry-Langdon, & Campbell, 2006). Also as noted above, site coordinators were typically responsible for more than one site. Although care was taken to collect site spe-cific data, the possibility exists that one site may have been confused with another when site coordinators were interviewed or participated in other process evaluation activities.
A third limitation concerns the basic issue of confounding between intervention and evaluation; that is, not maintaining clear separation between intervention and process evaluation activities. As a case in point, both site coordinators and healthy culture focal points had some involvement in process evaluation activities but were also responsible for various implementation activities within their sites and work units. It is possible that completing a process-related interview or questionnaire may have prompted some individuals to apply more effort or to modify their approach to some aspect of intervention implementation. This potential problem was aggravated somewhat since many process evaluation activi-ties were repeated on an annual basis, rather than being con-ducted only at the conclusion of the study. Given the duration of the intervention period, the need for interim data outweighed the possibility of confounding. The use of stan-dardized implementation protocols helped to limit this problem.
ConclusionsIn summary, altering the basic work environment to prompt and facilitate healthy behaviors can serve to heighten and support employees’ awareness of their own health and improve employees’ perceptions of the organization in which they work as health promoting. However, small modifications to the work context are not likely to produce large amounts of weight loss in the general working popula-tion but may help with weight maintenance. As shown by our research, environmental interventions at the workplace can augment individually focused interventions of varying intensities. The present results leave open the question of how best to increase the intensity of environmental interventions so that they can be more effective in achieving meaning-
ful weight loss when combined with individually focused programs. Management engagement interventions in the future need to actively focus on creating leadership buy-in and ownership and provide clear and specific guidance on how leaders can influence behavior change. This needs to be accomplished taking into consideration that health promo-tion priorities must ultimately compete with other business priorities within a dynamic and changing organizational context. Leaders may need frequent reminders that health improvement is a priority and about how best to influence positive change in targeted health behaviors.
Implications for PracticeDoing worksite health promotion involves inserting interven-tions and programs into ongoing, dynamic organizational systems where there are numerous competing priorities. To maximize the potential for success, interventions need to be aligned with local processes, communication channels, staff resources, and operational priorities. When programs involve multiple interventions and multiple sites, all of these consider-ations must be addressed multiple times and with different decision makers. Some of the interventions used in the present study also involved working with and coordinating parties that were external to the organization itself. The present study involved a 2-year intervention period and maintaining inter-ventions for this length of time is understandably very chal-lenging. Environmental interventions are most likely to succeed and be sustained when they align with other organiza-tional priorities and become part of the organization’s norms and fabric. Environmental interventions, like most other types of intervention, are not automatic or inherently permanent. They must be carefully planned and implemented, refreshed as needed, and actively monitored across time.
Declaration of Conflicting Interests
The authors declared no potential conflicts of interest with respect to the research, authorship, and/or publication of this article.
Funding
The authors disclosed receipt of the following financial support for the research, authorship, and/or publication of this article:
Funding for this study was provided by the National, Heart, Lung and Blood Institute (Grant No. R01 HL79546). The contents of this article are the sole responsibility of the authors and do not neces-sarily represent the official views of the National, Heart, Lung and Blood Institute.
References
Anderson, L. M., Quinn, T. A., Glanz, K., Ramirez, G., Kahwati, L. C., Johnson, D. B., . . . Task Force on Community Preventive Ser-vices. (2009). The effectiveness of worksite nutrition and physical activity interventions for controlling employee overweight and obesity. American Journal of Preventive Medi-cine, 37, 340-357.
at UNIV OF GEORGIA LIBRARIES on October 21, 2011heb.sagepub.comDownloaded from

DeJoy et al. 13
Audrey, S., Holliday, J., Parry-Langdon, N., & Campbell, R. (2006). Meeting the challenges of implementing process evalu-ation within randomized controlled trials: The example of ASSIST (A Stop Smoking in Schools Trial). Health Education Research, 21, 366-377.
Bartholomew, L. K., Parcel, G. S., Kok, G., & Gottlieb, N. (2001). Intervention mapping: A process for designing theory- and evidence-based health promotion programs. New York, NY: McGraw-Hill.
Benedict, M. A., & Arterburn, D. (2008). Worksite-based weight loss programs: A systematic review of recent literature. American Journal of Health Promotion, 22, 408-416.
Connell, J., Lynch, C., & Waring, P. (2001). Constraints, compro-mises, and choice: Comparing three qualitative research stud-ies. Qualitative Report, 6, 1-14.
Dalton, B. A., & Harris, J. S. (1991). A comprehensive approach to corporate health management. Journal of Occupational Medi-cine, 33, 338-348.
Danna, K., & Griffin, R. W. (1999). Health and well-being in the workplace: A review and synthesis of the literature. Journal of Management, 25, 357-384.
DeJoy, D. M., & Southern, D. J. (1993). An integrative perspective on worksite health promotion. Journal of Occupational Medi-cine, 35, 1221-1230.
DeJoy, D. M., & Wilson, M. G. (2003). Organizational health pro-motion: Broadening the horizon of workplace health promo-tion. American Journal of Health Promotion, 17, 337-341.
DeJoy, D. M., Wilson, M. G., Goetzel, R. Z., Ozminkowski, R. J., Wang, S., Baker, K. M., . . . Tully, K. J. (2008). Development of the Environmental Assessment Tool (EAT) to measure orga-nizational physical and social support for worksite obesity pre-vention. Journal of Occupational and Environmental Medicine, 50, 126-137.
Della, L. J., DeJoy, D. M., Goetzel, R. Z., Ozminkowski, R. J., & Wilson, M. G. (2008). Assessing management support for worksite health promotion: Psychometric analysis of the Lead-ing By Example (LBE) instrument. American Journal of Health Promotion, 22, 359-367.
Della, L. J., DeJoy, D. M., Mitchell, S. G., Goetzel, R. Z., Roemer, E. C., & Wilson, M. G. (2010). Management support of workplace health promotion: field test of the Leading by Example tool. American Journal of Health Promotion, 25, 138-146.
Dusenbury, L., Brannigan, R., Falco, M., & Hansen, W. (2003). A review of research on fidelity of implementation: Implications for drug abuse prevention in school settings. Health Education Research, 18, 237-256.
Engbers, L. H., van Poppel, M. N., Chin A Paw, M. J., & van Mechelen, W. (2005). Worksite health promotion programs with environmental changes: A systematic review. American Journal of Preventive Medicine, 29, 61-70.
Finkelstein, E., Fiebelkorn, C., & Wang, G. (2005). The costs of obesity among full-time employees. American Journal of Health Promotion, 20, 45-51.
Goetzel, R. Z., Guindon, A. M., Turshen, I. J., & Ozminkowski, R. J. (2001). Health and productivity management: Establishing key
performance measures, benchmarks, and best practices. Journal of Occupational and Environmental Medicine, 43, 10-17.
Goetzel, R. Z., Shechter, D., Ozminkowski, R. J., Marmet, P. F., Tabrizi, M. J., & Roemer, E. C. (2007). Promising practices in employer health and productivity management efforts: Find-ings from a benchmarking study. Journal of Occupational and Environmental Medicine, 49, 111-130.
Goetzel, R. Z., Roemer, E. C., Pei, X., Short, M. E., Tabrizi, M. J., Wilson, M. G., . . . Baase, C. M. (2010). Second-year results of an obesity prevention program at The Dow Chemical Com-pany. Journal of Occupational and Environmental Medicine, 52, 291-302.
Green, L. W., & Kreuter, M. W. (1999). Health promotion plan-ning: An educational and ecological approach (3rd ed.). Moun-tain View, CA: Mayfield.
Hunt, M. K., Barbeau, E. M., Lederman, R., Stoddard, A. M., Chetkovich, C., Goldman, R., . . . Sorsensen, G. (2007). Process evaluation results from the Healthy Directions-Small Business Study. Health Education and Behavior, 34, 90-107.
Lake, A., & Townshand, T. (2006). Obesogenic environments: Exploring the built and food environments. Journal of the Royal Society for the Promotion of Health, 126, 262-267.
McTigue, K. M., Harris, R., Hemphill, B., Lux, L., Sutton, S., Bunton, A. J., & Lohr, K. N. (2003). Screening and interven-tions for obesity in adults: summary of the evidence for the U.S. Preventive Services Task Force. Annals of Internal Medicine, 139, 933-950.
O’Donnell, M., Bishop, C., & Kaplan, K. (1997). Benchmarking best practices in workplace health promotion. Art of Health Promotion, 1, 1-8.
Parker, K. B., DeJoy, D. M., Wilson, M. G., Bowen, H. M., & Goetzel, R. Z. (2010). Application of the Environmental Assessment Tool (EAT) as a process measure for a worksite weight management intervention. Journal of Occupational and Environmental Medicine, 52(Suppl. 1), S42-S51.
Patton, M. Q. (2002). Qualitative research and evaluation methods (3rd ed.). Thousand Oaks, CA: Sage.
Pratt, C. A., Lemon, S. C., Fernandez, I. D., Goetzel, R., Beresford, S. A., French, S. A., . . . Webber, L. S. (2007). Design characteristics of worksite environmental interventions for obesity prevention. Obesity, 15, 2171-2180.
Saunders, R. P., Evan, M. H., & Joshi, P. (2005). Developing a process-evaluation plan for assessing health promotion implementation: A how-to guide. Health Promotion Practice, 6, 134-147.
Schein, E. H. (2004). Organizational culture and leadership (3rd ed.). San Francisco, CA: Jossey-Bass.
Schneider, B. (Ed.). (1990). Organizational climate and culture. San Francisco, CA: Jossey-Bass.
Schulte, P. A., Wagner, G. R., Ostry, A., Blanciforti, L. A., Cutlip, R. G., & Krajnak, K. M. (2004). Work, obesity, and occupational safety and health. American Journal of Public Health, 97, 428-436.
Steckler, A., & Linnan, L. (2002). Process evaluation for pub-lic health interventions and research. San Francisco, CA: Jossey-Bass.
at UNIV OF GEORGIA LIBRARIES on October 21, 2011heb.sagepub.comDownloaded from

14 Health Education & Behavior XX(X)
Stokols, D. (1992). Establishing and maintaining healthy environ-ments: Toward a social ecology of health promotion. American Psychologist, 47, 6-22.
Stokols, D. (1996). Translating social ecological theory into guide-lines for community health promotion. American Journal of Health Promotion, 10, 282-298.
Swinburn, B., Egger, G., & Raza, F. (1999). Dissecting obesogenic environments: The development and application of a framework for identifying environmental interventions for obesity. Preven-tive Medicine, 29, 563-570.
Wilson, M. G., Basta, T., Bynum, B., DeJoy, D. M., Vandenberg, R. J., & Dishman, R. K. (2010). Do intervention fidelity and dose influence outcomes? Results from the Move to Improve work-site physical activity program. Health Education Research, 25, 294-305.
Wilson, M. G., Goetzel, R. Z., Ozminkowski, R. J., DeJoy, D. M., Della, L., Roemer, E. C., . . . Baase, C. M. (2007). Using for-mative research to develop environmental and ecological inter-ventions to address overweight and obesity. Obesity, 15(Suppl. 1), 37S-47S.
at UNIV OF GEORGIA LIBRARIES on October 21, 2011heb.sagepub.comDownloaded from


