Embed Size (px)
Citation preview

Hitotsubashi University Repository
TitleProductivity Growth and Resource Reallocation in
Japan
Author(s) Fukao, Kyoji; Miyagawa, Tsutomu; Takizawa, Miho
Citation
Issue Date 2007-11
Type Technical Report
Text Version publisher
URL http://hdl.handle.net/10086/15743
Right

Center for Economic Institutions
Working Paper Series CEI Working Paper Series, No. 2007-9
“Productivity Growth and Resource Reallocation
in Japan”
Kyoji Fukao, Tsutomu Miyagawa, Miho Takizawa
November 2007
Center for Economic Institutions
Working Paper Series
Institute of Economic Research
Hitotsubashi University
2-1 Naka, Kunitachi, Tokyo, 186-8603 JAPAN
Tel: +81-42-580-8405
Fax: +81-42-580-8333
e-mail: [email protected]

Productivity Growth and Resource Reallocation in Japan
Prepared for the International Conference of the Korea Productivity Center
Total Factor Productivity Based on the KLEMS Industrial Database The Korea Chamber of Commerce & Industry, Seoul
October 24, 2007
Kyoji Fukao Hitotsubashi University
Tsutomu Miyagawa
Gakushuin University
Miho Takizawa Hitotsubashi University

1
1. Introduction Following the collapse of the bubble economy in the early 1990s, Japan’s
economic growth stalled: real GDP growth in the period 1995-2004 did not exceed 1.0%, which is considerably slower than the 3.3% growth registered in 1973-1995 (based on data from the EU KLEMS Database, March 2007) and the lowest among the six major developed economies (the US, Japan, Germany, France, the UK and Italy).
A frequently heard argument in Europe and the US is that the core countries of the EU, such as Germany and France, have been falling behind the US in terms of increasing productivity. Inklaar et al. (2006), for example, found that although the level of labor productivity in Germany, France and the Netherlands was almost same as that in the US, total factor productivity (TFP) growth in these countries since the mid-1990s has been much slower than in the US, especially in market services. Similarly, van Ark et al. (2006) report that TFP growth in industries using information and telecommunication technology (ICT-using industries) in the core EU countries since 1995 has been much slower than in the US. Meanwhile, Stiroh (2002) and Triplett and Bosworth (2002) report that TFP growth in ICT-using industries in the US, such as communication, finance and commerce, has accelerated substantially since 1995 and this acceleration represents the main engine of productivity growth in the US economy.
The slowdown of Japan’s economic growth and the above mentioned studies comparing TFP growth in the EU and the US raise the question whether Japan has a similar problem as the major EU economies with regard to the introduction of ICT to market services. Yet, despite the importance of this issue, there have been few studies which compare TFP growth and the impact of the ICT revolution in the major EU economies, Japan and the US at the industry level – probably because of the lack of appropriate data for a broad and rigorous international comparison.
In order to analyze this issue, researchers of the Japan Industrial Productivity Database Project, including the authors, have joined the EU KLEMS consortium and supplied original data on Japan for the EU KLEMS database. The first public-release version of the EU KLEMS database is available online at the EU KLEMS website, <http://www.euklems.net/>. In this paper, using this database, we compare productivity growth and the accumulation of ICT capital by industry in Japan, the major EU economies, and the US. We also use the results of the labor productivity comparison project at the Japan Center of Economic Research.
The remainder of the paper is organized as follows. In Section 2, we present an overview of the pattern of economic growth and productivity improvement in Japan, the major EU economies, and the US. We also compare the absolute labor productivity

2
levels of these countries by industry. In Section 3 we analyze the role of ICT investment on economic growth. We compare the movement in ICT investment in Japan with that in Korea based on the data in (Pyo et al. (2007). In addition, we compare the impact of ICT capital services on economic growth in Japan with those in the US and major EU countries. In Section 4, we analyze the reallocation of resources in Japan. We examine this issue using a growth accounting framework based on Jorgenson et al. (2007). Finally, Section 5 summarizes our main results. 2. Overview of Economic Growth and Productivity Improvement in the Major EU Economies, Japan and the US
We first compare the results of growth accounting for Japan, the major EU economies (Germany, France, the UK and Italy), and the US. Figure 1 shows the growth accounting results for the market sector of these countries for the periods 1980-95 and 1995-2004. The figure shows that Japan experienced a severe downturn during the latter period and, of the countries considered here, registered the highest annual rate of growth (3.6%) in 1980-95, but the lowest rate (0.7%) in 1995-2004. Germany experienced a mild slowdown in economic growth (from 1.9% to 1.1%).1 The other four countries registered an acceleration in economic growth after 1995. The average growth rate for the four countries rose from 2.3% in 1980-95 to 2.6% in 1995-2004.
INSERT Figure 1
There is a stark difference in the causes underlying the growth acceleration in
France, the UK and Italy on the one hand and the US on the other. In the three EU countries, the acceleration in economic growth was mainly achieved through labor input growth. As Figure 2 shows, the increase in labor input growth in France and Italy did not take the form of improvements in labor quality but of increases in total hours worked. In contrast, in the case of the UK, the quality of labor input improved substantially. Until 1995, these three countries suffered high unemployment rates, especially among the less-educated young, but succeeded in creating jobs for these unemployed. The average of the standardized unemployment rate of the three countries declined from 11.3% in 1995 to 7.4% in 2004. On the other hand, the standardized unemployment rate in Japan increased from 3.1% to 4.7% during the same period (OECD 2006). In contrast with the three EU countries just mentioned, the main cause of the growth acceleration in the US was an increase in TFP growth (from 0.7% in 1 The EU KLEMS data on Germany for years before Germany’s unification include East Germany.

3
1980-95 to 1.6% in 1995-2004).
INSERT Figure 2 Turning to TFP growth in Japan and the four major EU economies, a similar
slowdown can be observed. Comparing the two periods, Japan’s average TFP growth rate dropped by 0.8 percent points, from 1.2% in 1980-95 to 0.4% in 1995-2004. In the four major EU economies, the TFP growth rate also declined by 0.8 percent points, from 1.0% in 1980-95 to 0.2% in 1995-2004. Thus, among the six major developed economies, the US is exceptional in the acceleration in TFP growth it experienced.
Looking at the factors contributing to the slowdown in growth in the market sector of Japan’s economy, the most important is the decline in the contribution of capital input growth. Of the 2.9 percentage-point decline in the growth rate of Japan’s market sector from the earlier to the latter period, 42% was accounted for by the deceleration in capital accumulation. In contrast, in all of the other five countries, the contribution of capital input growth increased (Figure 3). In particular the US and the UK experienced an acceleration in capital accumulation. As Figure 3 shows, this capital deepening in the two countries was caused by the rapid accumulation of ICT capital.
INSERT Figure 3
To sum up the above analysis, it is not the gap in TFP growth but differences in
factor input growth that caused the large difference in the economic growth performance of France, the UK and Italy on the one hand and Japan on the other in the period after 1995. The four major EU economies (Germany, France, the UK and Italy) and Japan experienced a slowdown in TFP growth of a similar magnitude after 1995. Only the US accomplished an exceptional acceleration in TFP growth.
Figure 4 compares industry level TFP growth in the six countries before and after 1995. TFP growth in the electrical machinery, post and communication sector was still highest in Japan among the six economies after 1995. However, the problem for Japan is that, like in other countries, the share of this sector in the economy overall is not very large. The average share of labor input (hours worked) in this sector in Japan’s total labor input in 1995-2004 was 4.1%. In the US, this share was 3.3%. The largest declines in TFP growth in Japan occurred in distribution services (retail, wholesale and transportation) and in the rest of the manufacturing sector (i.e., excluding electrical machinery). The labor input shares of these two sectors were 23.4% and 16.8%

4
respectively. The US and the major EU economies except Italy recorded high TFP growth in these two sectors. Compared with Germany, France and the UK, Japan’s TFP growth in 1995-2004 was low in other goods-producing industries (construction, mining, agriculture, fishery and forestry), but relatively high in finance and business services. Except in France, TFP growth in personal and social services stalled in all the countries examined here.
INSERT Figure 4
If a country’s productivity is at the world top level, then in order to accomplish
further productivity improvement, the country needs to innovate (Acemoglu et al. 2006) and to adjust its economic structures to novel technologies. On the other hand, if a country’s productivity level lags behind the world frontier, then the adoption of already existing technologies and improvements in its resource allocation are probably more important. Inklaar et al. (2006) found that labor productivity levels in market services in continental Europe were on par with the US in 1997, but since then productivity growth in Europe has been much weaker, suggesting that the continental European countries need to do more to innovate and adjust economic structures to novel technologies. This observation raises the question: Is Japan in a similar situation as the continental European countries?
Unfortunately, the EU KLEMS Database (March 2007 version) does not include data that allow a comparison of productivity levels across countries. In this paper, we therefore use the results of a comparison of labor productivity conducted by the Japan Economic Foundation (JEF) and the Japan Center for Economic Research (JCER) (JEF-JCER 2007).2 The study compares 27 industries covering the whole economy for the period 1980-2003 (1980-2002 in the case of Japan). The JEF-JCER comparison of labor productivity for Japan, Germany, France, the UK and the US is mainly based on purchasing power parity (PPP) data for 1997 from the EU KLEMS Project, real value added and man-hour input data from the EU KLEMS 60-Industry Database, the Input-Output Tables of the OECD STAN Database, and the Asian International Input-Output Table 2000 of the Institute of Developing Economies.3 Differences of
2 We would like to thank Ms. Reiko Suzuki of the JCER for helping us to gain access to the JEF-JCER data and providing us with various valuable comments. 3 The JEF-JCER study also compared the labor productivity of China and the US and of Korea and the US by industry. In addition to the above-mentioned data sources, the intra-Asian comparisons are based on the PPP data of the International Comparison of Productivity Among Asian Countries (ICPA) Project conducted by the Research Institute of Economy, Trade and Industry (RIETI).

5
labor input quality across countries and over time are not taken account of in the JEF-JCER labor productivity comparison. Basically, the study compares the real value added per man-hour after adjustments for absolute price differences.
INSERT Figures 5, 6, 7 and 8
Figures 5, 6, 7 and 8 show the results of the JEF-JCER study for 2002. In the case
of the comparisons between the US and European countries, the results are similar to those of Inklaar et al. (2006). Productivity levels in Germany and France were very close to those in the US both in market services and manufacturing, while productivity levels in the UK were lower than in the two continental European countries. In manufacturing sectors, productivity levels in Japan were on par with those in the US, Germany and France (Figure 5). However, they were very low in comparison with the three countries both in market services and other goods-producing industries. It therefore seems that there is large room for improvement in Japan’s productivity in market services and other goods-producing services through the adoption of already existing technologies and better resource allocation. 3. ICT Investment in Japan and Korea
From the JIP and KIP databases, we are able to extract data on ICT assets and compare the trends in ICT investment in the two countries. Our definition of ICT assets is consistent with that stipulated by the OECD and is comprised of computer and peripheral equipment, communication equipment and software.
Developments in ICT investment in Japan are shown in Figure 9. ICT investment in Japan grew steadily until 1991 and for the period 1970-2004 overall, its average growth rate was 12.1% per annum. However, since the 1990s, ICT investment has followed a cyclical pattern. Stagnating in the first half of the 1990s, ICT investment increased again during the second half, before declining again during the early 2000s. In 2004, ICT investment stood at 22.6 trillion yen, accounting for 19% of total investment and making up the largest component of investment. The biggest component within ICT investment was investment in computer and peripheral equipment, which in 2004 amounted to 11 trillion yen or 50% of total ICT investment.
INSERT Figure 9
Figure 10 shows the trends in ICT investment in Korea as measured by Pyo, et al.

6
(2007). ICT investment in Korea increased steadily until the Asian currency crisis in 1997. After a dramatic decline, ICT investment recovered rapidly and amounted to 26 trillion won. In the 2000s, the amount of ICT investment has consistently exceeded 20 trillion won. Its growth rate from 1970 to 2005 was 15.5% on average, which was higher than the growth rate in Japanese ICT investment. However, if we calculate the growth rate in ICT investment in both countries since 1995, when the ICT revolution started, ICT investment in Korea shows the same growth rate (5.9%) as in Japan.
INSERT Figure 10
However, the composition of ICT investment in Korea differs from that in Japan. In Korea, software investment accounted for over 50% of total ICT investment in 2005 and was the largest component. Computer investment, which was the largest component in Japan, on the other hand accounted for only 17% of total ICT investment. In Japan, both computer investment and software investment have increased at a annual rate of 6% since 1995. In contrast, in Korea, although software investment has increased at a pace of 9% since 1995, the growth in computer investment was negative (-1.2%).
In Figure 11, we show ICT investment as a share of GDP in both countries. Although the ratio in both countries basically shows the same positive trend, it shows different cyclical patterns. For example, during recessions in Japan (in the wake of the oil shocks in the 1970s and the collapse of the bubble economy in the 1990s), the ratio in Korea was higher than that in Japan. However, following the recovery from the long-term stagnation in Japan, the ratio in Japan became higher than in Korea.
INSERT Figure 11
Next, we investigate the trends in ICT capital stock in both countries. Figure 12 shows the development of Japanese ICT capital. ICT capital in Japan increased at an average rate of 11.0% per annum from 1970 to 2004 to reach 79 trillion yen, accounting for 5.3% of total capital stock. Among the three ICT capital components, the stock of computer equipment accounted for the largest share, 40%, of the total ICT capital stock.
INSERT Figure 12
Because Pyo, et al. (2007) provided data on capital stock by type of asset for 1977, we can estimate the ICT capital stock in Korea using the perpetual inventory

7
method. But while Pyo, et al. (2007) also showed the depreciation rate by type of asset, we decided to use our own depreciation rate calculated from the JIP database in order to have a more consistent basis for the comparison of ICT capital stocks in Japan and Korea. The different depreciation rates for ICT asset in Japan and Korea are shown in Table 1. As can be seen, the depreciation rate for ICT assets is higher in Japan than in Korea.
INSERT Table 1
Figure 13 shows the estimated ICT capital stock in Korea. It grew at average rate of 13.2% per annum from 1977 to 2005 and reached 91 trillion won in 2005. While the capital stock in information equipment and software followed an upward trend, the capital stock in computer equipment decreased after 2001. (As a result, the share of capital stock in computer equipment in the total ICT capital is only 14.7% in 2005, while that in Japan is 40%.
INSERT Figure 13
As for the accumulation of ICT capital, Japan and Korea showed similar growth patterns. We were not able to find clearly different trends in the ICT investment/GDP ratios of the two countries. However, the composition of ICT assets in Japan is different from that in Korea. In Japan, ICT investment has been dominated by investment in computer equipment. On the other hand, On the other hand, software investment has dominated the total ICT investment in recent years.
Finally, we examine the impact of the accumulation of ICT capital on economic growth. The impact can be measured by using the growth rate in ICT capital services. Table 2 shows the contribution of ICT capital services to economic growth by industry.4 In the US and the UK, the contribution of ICT capital increased in almost all sectors after 1995. In France, the contribution of ICT capital service input growth increased in all sectors except personal and social services. In Germany, the contribution of ICT capital service input growth increased in all sectors except two (distribution services and personal and social services). In contrast, in Japan and Italy, there are many sectors where the contribution of ICT service input growth decreased after 1995. In Japan, the contribution of ICT capital service input growth declined in all sectors after 1995, while
4 Because we do not know the user cost of capital in Korea, we compare the contribution in ICT capital service in Japan with those in US and major EU countries.

8
in Italy, it fell in all sectors except two (finance and business services and personal and social services).
INSERT Table 2
4. Reallocation of Resources and TFP Growth We commonly observe that factor prices for the same category of labor or rates of
return to capital are different across industries. If such differences are caused by institutional obstacles to inter-industry factor movements and each factor price is equal to the marginal product of that production factor, GDP can be raised by shifting production factors from industries with low factor prices to those with high factor prices. In this section, we analyze how such resource reallocations have contributed to Japan’s economic growth.
Let us analyze this issue in a growth accounting framework. As Jorgenson et al. (2007) have shown, how the resource reallocation effect is measured in growth accounting depends on the type of growth accounting method chosen. In the case of growth accounting in the EU KLEMS project, factor price equalization between industries is not assumed and macro-level factor inputs are calculated by a Tornqvist index, in which factor input growth across industries is aggregated by using factor income in each industry as aggregation weight. Therefore, if production factors move from low factor price industries to high factor price industries, this reallocation will be treated as an increase in macro-level factor inputs. Jorgenson et al. labeled this type of growth accounting method the “direct aggregation across industries” approach.
However, there is another type of growth accounting method, which Jorgenson et al. called the “production possibility frontier” approach. In this case, each input is assumed to receive the same price in all industries. The macro-level quantity of each input is the simple sum of inputs across industries. In this approach, reallocation effects are included in macro TFP growth.
Jorgenson et al. showed the following relationship between the macro TFP growth derived from the production possibility frontier approach, νT, and the macro TFP growth derived from the direct aggregation across industries approach, νT
D.

9
⎟⎟⎠
⎞⎜⎜⎝
⎛Δ−⎟
⎟⎠
⎞⎜⎜⎝
⎛Δ+
⎟⎟⎠
⎞⎜⎜⎝
⎛Δ−⎟
⎟⎠
⎞⎜⎜⎝
⎛Δ+
=
∑
∑
LLw
KKw
Lj
jjV
jLj
Kj
jjV
jKj
DTT
lnln
lnln
,
,
,
,
ννν
ννν
νν
(1)
where νTD is equal to the weighted sum of industry level TFP growth, νj, across
industries:
⎟⎟⎠
⎞⎜⎜⎝
⎛= ∑
jj
jV
jDT
wν
νν
,
(2)
The upper bars denote the average of values in period t and in period t+1, Δ represents the change of a value from period t to period t+1, wj is the proportion of industry j’s value added in aggregate value added, νK, j and νL, j are the share of capital and of labor income in industry j’s gross output, and νV, j stands for industry j’s value added-gross output ratio. Therefore the coefficient of νj, wj/νK, j, in equation (2) denotes the ratio of industry j’s gross output to aggregated value added. Equation (2) implies that the macro TFP growth derived from the direct-aggregation-across-industries approach, νT
D, is equal to the direct aggregation of each industry’s TFP growth with Domar weights.
In equation (1), Kj denotes the Tornqvist index of capital input in industry j and Lj the Tornqvist index of labor input in industry j:
∑ Δ=Δk
jkjkj KwK ,, lnln
∑ Δ=Δl
jljl LwL ,, lnln
where
∑=
kjkjkK
jkjkKjk KP
KPw
,,,
,,,,
∑=
ljljlL
jljlLjl LP
LPw
,,,
,,,,
Kk,j denotes input of type k capital in industry j and Ll,j input of type l labor in industry j. Similarly, PK,k,j denotes the price for type k capital in industry j and PL,l,j the price for type l labor in industry j.5 5 It is difficult to measure the actual income of each type of capital in each industry. Similarly we
10
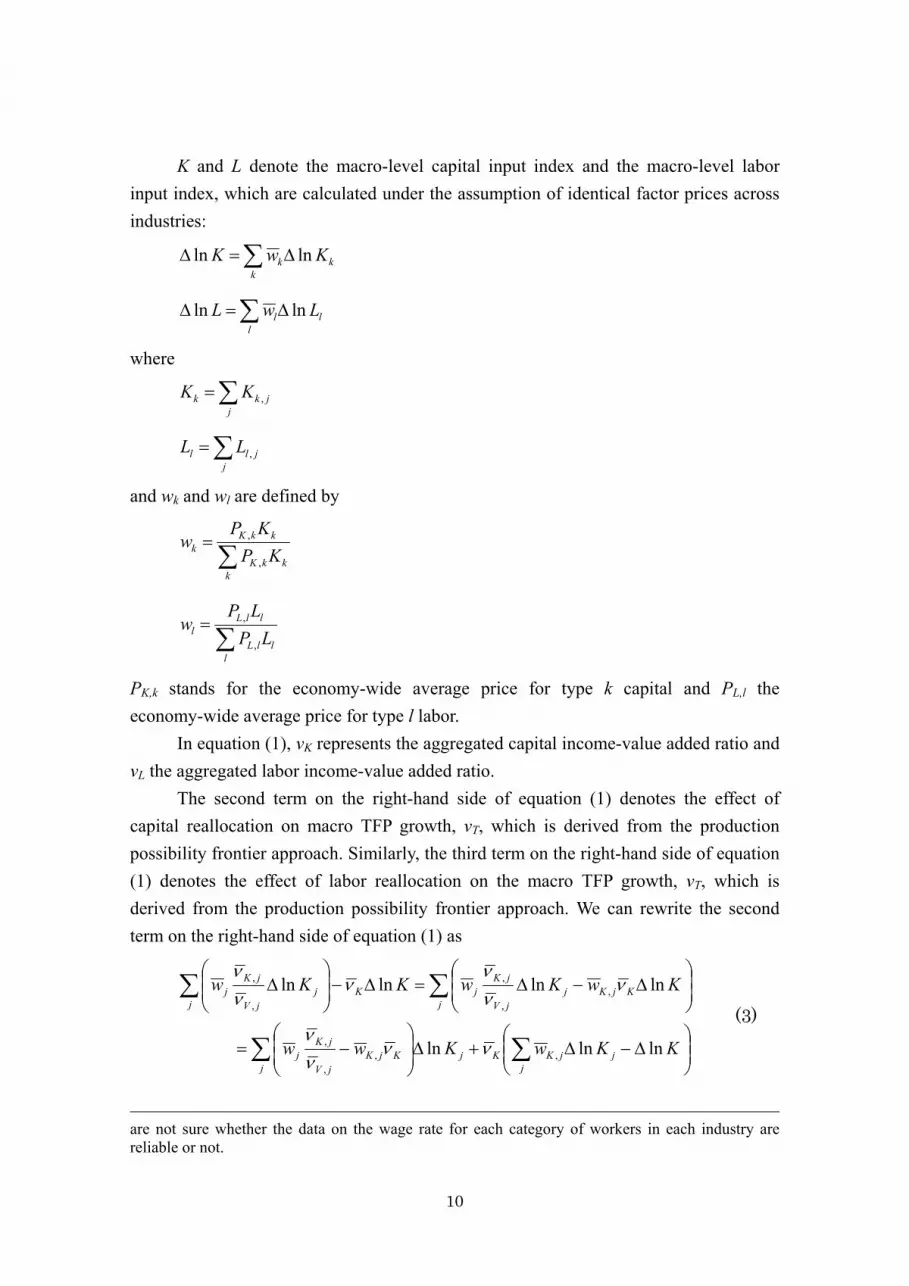
K and L denote the macro-level capital input index and the macro-level labor input index, which are calculated under the assumption of identical factor prices across industries:
∑ Δ=Δk
kk KwK lnln
∑ Δ=Δl
ll LwL lnln
where
∑=j
jkk KK ,
∑=j
jll LL ,
and wk and wl are defined by
∑=
kkkK
kkKk KP
KPw
,
,
∑=
lllL
llLl LP
LPw
,
,
PK,k stands for the economy-wide average price for type k capital and PL,l the economy-wide average price for type l labor.
In equation (1), νK represents the aggregated capital income-value added ratio and νL the aggregated labor income-value added ratio.
The second term on the right-hand side of equation (1) denotes the effect of capital reallocation on macro TFP growth, νT, which is derived from the production possibility frontier approach. Similarly, the third term on the right-hand side of equation (1) denotes the effect of labor reallocation on the macro TFP growth, νT, which is derived from the production possibility frontier approach. We can rewrite the second term on the right-hand side of equation (1) as
∑ ∑
∑∑
⎟⎟⎠
⎞⎜⎜⎝
⎛Δ−Δ+Δ⎟
⎟⎠
⎞⎜⎜⎝
⎛−=
⎟⎟⎠
⎞⎜⎜⎝
⎛Δ−Δ=Δ−⎟
⎟⎠
⎞⎜⎜⎝
⎛Δ
jj
jjKKjKjK
jV
jKj
jKjKj
jV
jKjK
jj
jV
jKj
KKwKww
KwKwKKw
lnlnln
lnlnlnln
,,,
,
,,
,
,
,
νννν
ννν
ννν
(3)
are not sure whether the data on the wage rate for each category of workers in each industry are reliable or not.
11
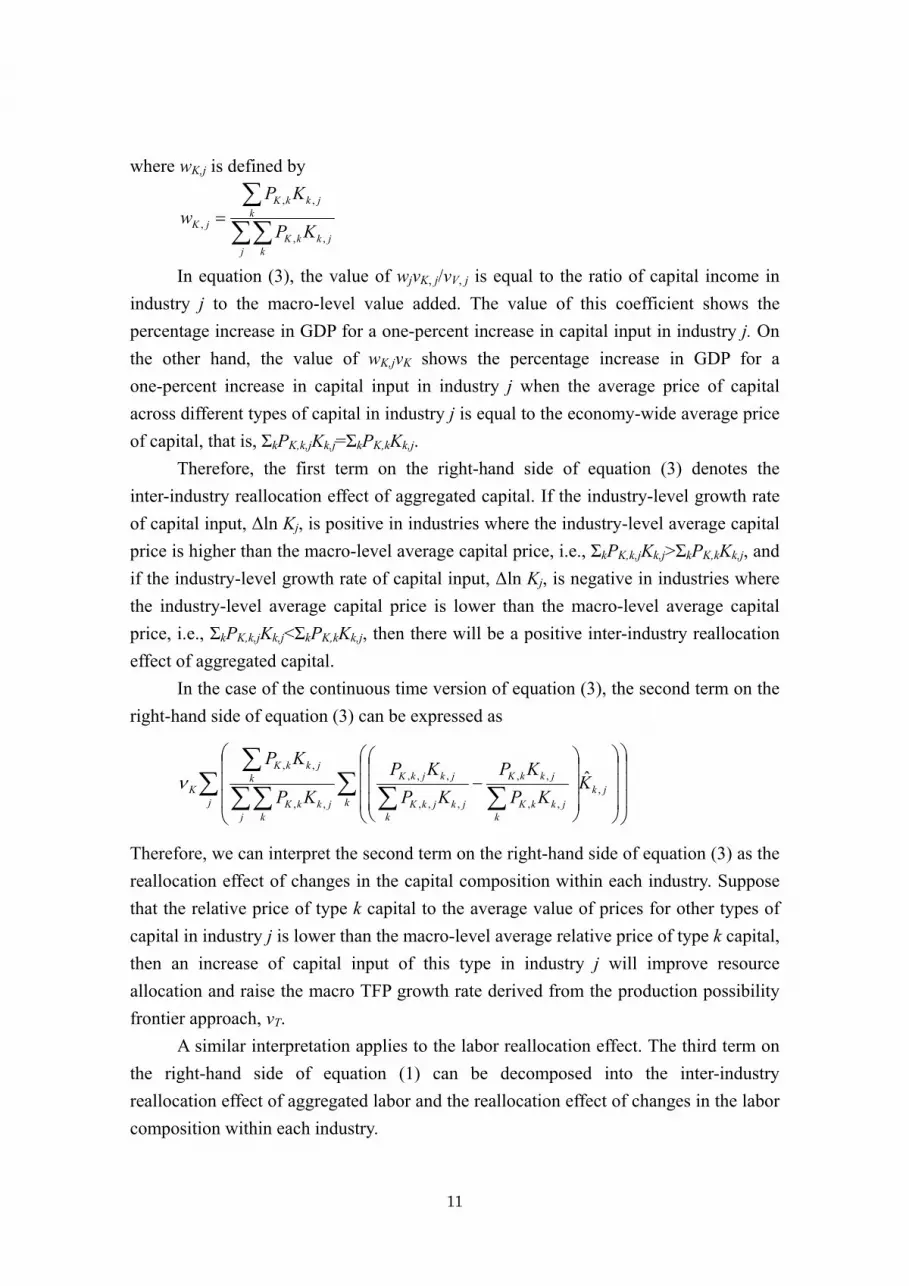
where wK,j is defined by
∑∑∑
=
j kjkkK
kjkkK
jK KP
KPw
,,
,,
,
In equation (3), the value of wjνK, j/νV, j is equal to the ratio of capital income in industry j to the macro-level value added. The value of this coefficient shows the percentage increase in GDP for a one-percent increase in capital input in industry j. On the other hand, the value of wK,jνK shows the percentage increase in GDP for a one-percent increase in capital input in industry j when the average price of capital across different types of capital in industry j is equal to the economy-wide average price of capital, that is, ΣkPK,k,jKk,j=ΣkPK,kKk,j.
Therefore, the first term on the right-hand side of equation (3) denotes the inter-industry reallocation effect of aggregated capital. If the industry-level growth rate of capital input, Δln Kj, is positive in industries where the industry-level average capital price is higher than the macro-level average capital price, i.e., ΣkPK,k,jKk,j>ΣkPK,kKk,j, and if the industry-level growth rate of capital input, Δln Kj, is negative in industries where the industry-level average capital price is lower than the macro-level average capital price, i.e., ΣkPK,k,jKk,j<ΣkPK,kKk,j, then there will be a positive inter-industry reallocation effect of aggregated capital.
In the case of the continuous time version of equation (3), the second term on the right-hand side of equation (3) can be expressed as
∑ ∑ ∑∑∑∑∑
⎟⎟⎟
⎠
⎞
⎜⎜⎜
⎝
⎛
⎟⎟⎟
⎠
⎞
⎜⎜⎜
⎝
⎛
⎟⎟⎟
⎠
⎞
⎜⎜⎜
⎝
⎛−
j kjk
kjkkK
jkkK
kjkjkK
jkjkK
j kjkkK
kjkkK
K KKP
KPKP
KPKP
KP,
,,
,,
,,,
,,,
,,
,,ˆν
Therefore, we can interpret the second term on the right-hand side of equation (3) as the reallocation effect of changes in the capital composition within each industry. Suppose that the relative price of type k capital to the average value of prices for other types of capital in industry j is lower than the macro-level average relative price of type k capital, then an increase of capital input of this type in industry j will improve resource allocation and raise the macro TFP growth rate derived from the production possibility frontier approach, νT.
A similar interpretation applies to the labor reallocation effect. The third term on the right-hand side of equation (1) can be decomposed into the inter-industry reallocation effect of aggregated labor and the reallocation effect of changes in the labor composition within each industry.

12
However, as we have already pointed out, it is difficult to measure actual income for each type of capital in each industry. Similarly, we are not sure whether our data on the wage rate for each category of workers in each industry is reliable or not. Because of these difficulties, we mainly focus on the inter-industry reallocation effect of aggregated capital and aggregated labor in this paper.
Table 3 shows the TFP growth of Japan’s market economy derived from the production possibility frontier approach, νT, the TFP growth of Japan’s market economy derived from the direct aggregation across industries approach, νT
D, the reallocation effect of capital input and the reallocation effect of labor input for the periods 1975-1980, 1980-1990, 1990-2000 and 2000-2002. We used JIP Database 2006 for this analysis.
INSERT Table 3
We find that for all periods expect 1975-80, the reallocation effect of capital input
was negligible. On the other hand, there was a positive and substantial reallocation effect of labor input after 1980. What is more, after 1990, the reallocation effect of labor input became greater than the Domar weighted TFP growth (macro TFP growth derived from the direct aggregation across industries approach), νT
D.
INSERT Figures 14 and 15
Figure 14 shows the industry level reallocation effect of aggregated capital input, (wjνK,j/νV,j - wK,jνK)Δln Kj, and the two components of this value, wjνK,j/νV,j - wK,jνK and Δln Kj for the periods 1975-1990 and 1990-2002. In almost all industries, capital inputs increased in both periods. Therefore, industries with high capital prices, such as construction, civil engineering, wholesale, finance, and other services for businesses, contributed to the improvement of capital allocation. And industries with low capital prices, such as electricity, railway, road transportation, telegraph and telephone, and rental of office equipments and goods, was responsible for negative reallocation effects.
Figure 15 shows the industry level reallocation effect of aggregated labor input, (wjνL,j/νV,j – wL,jνL)Δln Lj, and the two components of this value, wjνL,j/νV,j – wL,jνL and Δln Lj for the periods 1975-1990 and 1990-2002. In most service industries with low labor prices, such as construction, retail, and eating and drinking places, labor input increased and these increases were responsible for negative reallocation effects. On the other hand, in agriculture, in which labor prices are low, the decline of labor input

13
created a large positive reallocation effect. In some service industries with high labor prices, such as wholesale, finance, insurance, and information services, the increase of labor input caused positive reallocation effects.
5. Conclusions
Using the recently released EU KLEMS Database (March 2007) and other statistics, we examined whether Japan experienced similar problems as the major EU economies with regard to the slowdown of TFP growth. We also compared the movement in ICT investment in Japan with that in Korea based on the data in Pyo, Jung and Cho (2007). In addition, we compared the impact of ICT capital services on economic growth in Japan and the US and major EU countries. Using the JIP Database 2006, we also examined the reallocation of resources in Japan. We studied this issue in a growth accounting framework based on Jorgenson et al. (2007).
The major results obtained through our analysis are as follows:
1. It is not the gap in TFP growth but differences in factor input growth that underlie the large difference in the economic growth performance of France, the UK and Italy on the one hand and Japan on the other in the period after 1995. The four major EU economies (Germany, France, the UK and Italy) and Japan experienced a slowdown in TFP growth of a similar magnitude after 1995. The US was exceptional in accomplishing acceleration in TFP growth. 2. TFP growth in the electrical machinery, post and communication sector was still highest in Japan among the six economies after 1995. However, the problem for Japan is that, like in other countries, the share of this sector in the economy overall is not very large. The largest declines in TFP growth in Japan occurred in distribution services (retail, wholesale and transportation) and in the rest of the manufacturing sector (excluding electrical machinery). The labor input shares of these two sectors were very large (23.4% and 16.8% respectively). The US and the major EU economies except Italy recorded high TFP growth in these two sectors. 3. In manufacturing sectors, productivity levels in Japan were on par with those in the US, Germany and France. However, they were very low in comparison with the three countries both in market services and other goods-producing industries. 4. As for ICT capital accumulation, Japan and Korea showed similar patterns. We were not able to find clear differences in the trends of the ICT investment/GDP ratios of the two countries. However, the composition of ICT assets in Japan is different from that in Korea. (In Japan, investment in computer equipment accounted for the largest

14
share of ICT investment. On the other hand, software investment has dominated the total ICT investment in recent years. 5. In the US and the UK, the contribution of ICT capital increased in almost all sectors after 1995. In France, the contribution of ICT capital service input growth increased in all sectors except personal and social services. In Germany, the contribution of ICT capital service input growth increased in all sectors except two (distribution services and personal and social services). In contrast, in Japan and Italy, there are many sectors where the contribution of ICT service input growth decreased after 1995. In Japan, the contribution of ICT capital service input growth declined in all sectors after 1995, while in Italy, it fell in all sectors except two (finance and business services and personal and social services). 6. The reallocation effect of capital input was negligible for all periods except 1975-80. On the other hand, the reallocation effect of labor input became substantial after 1980. Moreover, after 1990, the reallocation effect of labor input became greater than the macro TFP growth rate derived from the direct aggregation across industries approach. 7. In most service industries with low labor prices, such as construction, retail, and eating and drinking places, labor input increased and these increases were responsible for negative reallocation effects. On the other hand, in agriculture, in which labor prices are low, the decline of labor input created a large positive reallocation effect. In some service industries with high labor prices, such as wholesale, finance, insurance, and information services, the increase of labor input generated positive reallocation effects.

15
References
Acemoglu, Daron, Philippe Aghion, and Fabrizio Zilibotti (2006) “Distance to Frontier, Selection, and Economic Growth,” Journal of the European Economic Association 4(1), 37-74.
Ark, Bart van, Robert Inklaar, and Robert H. McGuckin (2003) “ICT and Productivity in Europe and the United States: Where Do the Differences Come From?” Economics Program Working Paper Series 03-05, The Conference Board, New York.
Inklaar, Robert, Marcel P. Timmer and Bart van Ark (2006) “Mind the Gap! International Comparisons of Productivity in Services and Goods Production,” Hi-Stat Discussion Paper Series 175, Hitotsubashi University, Tokyo.
Japan Economic Foundation (JEF) and Japan Center of Economic Research (JCER) (2007) Kikai Sangyo to no Seisan-sei no Kokusai Hikaku ni Kansuru Chosa Kenkyu Hokoku-sho [Report on the Study of International Productivity Comparison in Machinery and Other Industries], JCER, Tokyo.
Jorgenson, Dale W., Mun S. Ho, Jon D. Samuels, Kevin J. Stiroh (2007) “Industry Origins of the American Productivity Resurgence,” paper presented at the Conference on Research on Income and Wealth, NBER Summer Institute 2007, downloaded at http://www.nber.org/~confer/2007/si2007/PRCR/jorgenson.pdf on October 1, 2007.
OECD (2006) Economic Outlook, 80, Statistical Annex Tables, downloaded at http://www.oecd.org/document/61/0,2340,en_2649_201185_2483901_1_1_1_1,00.html on March 20, 2007.
Pyo, Hak K., S. Jung, and J. S. Cho (2007) “Estimates of Gross Fixed Capital Formation, Net Capital Stock and Capital Intensity in Korea: by 11 Assets and by 72 Industries (1970-2005),” paper presented at the Workshop on Productivity Database in China, Japan, and Korea, held in Tokyo on July 23, 2007.
Stiroh, Kevin J. (2002) “Information Technology and the US Productivity Revival: What Do the Industry Data Say?” American Economic Review 92(5), 1559–1576.
Triplett, Jack E. and Barry P Bosworth (2002), “Baumol’s Disease’ Has Been Cured: IT and Multifactor Productivity in U.S. Services Industries,” mimeo, downloaded at http://www3.brookings.edu/es/research/projects/productivity/workshops/2002

16
0517_triplett.pdf on October 13, 2007.

Source: EU KLEMS Database, March 2007.
Figure 1. Growth Accounting for the Market Sector in Japan, the US, and the Major EU Economies
1980-95
-1.0
-0.5
0.0
0.5
1.0
1.5
2.0
2.5
3.0
3.5
4.0Jap
an 8
0-95
Germ
any
80-95
Fra
nce 8
0-95
UK 8
0-95
Ital
y 80-95
US 8
0-95
annu
al a
vera
ge, %
1995-04
-1.0
-0.5
0.0
0.5
1.0
1.5
2.0
2.5
3.0
3.5
4.0
Jap
an 9
5-04
Germ
any
95-04
Fra
nce 9
5-04
UK 9
5-04
Ital
y 95-04
US 9
5-04
annu
al a
vera
ge, %
Contribution ofTFP growth
Contribution of capital inputgrowth
Contribution of labor input growth
Gross value addedgrowth
17

Source: EU KLEMS Database, March 2007.
Figure 2. Contribution of Labor Input Growth: Japan, the US and the Major EU Economies
1980-95
-0.8
-0.6
-0.4
-0.2
0.0
0.2
0.4
0.6
0.8
1.0
1.2
1.4Jap
an 8
0-95
Germ
any
80-95
Fra
nce 8
0-95
UK 8
0-95
Ital
y 80-95
US 8
0-95
annu
al a
vera
ge, %
1995-04
-0.8
-0.6
-0.4
-0.2
0.0
0.2
0.4
0.6
0.8
1.0
1.2
1.4
Jap
an 9
5-04
Germ
any
95-04
Fra
nce 9
5-04
UK 9
5-04
Ital
y 95-04
US 9
5-04
annu
al a
vera
ge, %
of which: Laborcomposition
of which: Totalhours worked
Contribution of labor inputgrowth
18

Source: EU KLEMS Database, March 2007.
Figure 3. Contribution of Capital Input Growth: Japan, the US and the Major EU Economies
1980-95
0.0
0.2
0.4
0.6
0.8
1.0
1.2
1.4
1.6
1.8
2.0
Jap
an 8
0-95
Germ
any
80-95
Fra
nce 8
0-95
UK 8
0-95
Ital
y 80-95
US 8
0-95
annu
al a
vera
ge, %
1995-04
0.0
0.2
0.4
0.6
0.8
1.0
1.2
1.4
1.6
1.8
2.0
Jap
an 9
5-04
Germ
any
95-04
Fra
nce 9
5-04
UK 9
5-04
Ital
y 95-04
US 9
5-04
annu
al a
vera
ge, %
of which: Non-ICT capital
of which: ICTcapital
Contribution of capital inputgrowth
19

Other goods producing industries
Source: EU KLEMS Database, March 2007.
Figure 4. TFP Growth in the Market Sector: by Sector and by Country
Electrical machinery, post andcommunication
0.0
1.0
2.0
3.0
4.0
5.0
6.0
7.0
8.0
Jap
an
Germ
any
Fra
nce
UK
Ital
y
US
1980-95
1995-2004
Manufacturing, excluding electricalmachinery
-1.5
-1.0
-0.5
0.0
0.5
1.0
1.5
2.0
2.5
3.0
3.5
Jap
an
Germ
any
Fra
nce
UK
Ital
y
US
1980-95
1995-2004
Other goods-producing industries
-1
-0.5
0
0.5
1
1.5
2
Jap
an
Germ
any
Fra
nce
UK
Ital
y
US
1980-95
1995-2004
Finance and business services
-4.0
-3.5
-3.0
-2.5
-2.0
-1.5
-1.0
-0.5
0.0
0.5
1.0
1.5
Jap
an
Germ
any
Fra
nce
UK
Ital
y
US
1980-95
1995-2004
Distribution services
-2.0
-1.5
-1.0
-0.5
0.0
0.5
1.0
1.5
2.0
2.5
3.0
3.5
Jap
an
Germ
any
Fra
nce
UK
Ital
y
US
1980-95
1995-2004
Personal and social services
-2.5
-2.0
-1.5
-1.0
-0.5
0.0
0.5
1.0
Jap
an
Germ
any
Fra
nce
UK
Ital
y
US
1980-95
1995-2004
20

Source: JEF-JCER (2007).
Figure 5. Labor Productivity: Japan-US Comparison
0 1 2 3
Economy overall
Agriculture, fisheries and forestryMining
Food productsTextile products
Pulp, paper and wood productsPetroleum and chemical productsStone, clay and ceramic products
MetalsMetal products
General machineryElectrical machineryPrecision machinery
Transportation machineryMiscellaneous manufacturing
productsElectricity, gas and water supply
ConstructionWholesale and retail
Hotels and eating and drinkingplaces
TransportationCommunication
Finance and insuranceReal estate
Other business servicesEducation
Medical servicesOther services for individuals
Public services
Japan/US 1995Japan/US 2002
21

Source: JEF-JCER (2007).
Figure 6. Labor Productivity: Germany-US Comparison
0 1 2 3
Economy overall
Agriculture, fisheries and forestryMining
Food productsTextile products
Pulp, paper and wood productsPetroleum and chemical productsStone, clay and ceramic products
MetalsMetal products
General machineryElectrical machineryPrecision machinery
Transportation machineryMiscellaneous manufacturing
productsElectricity, gas and water supply
ConstructionWholesale and retail
Hotels and eating and drinkingplaces
TransportationCommunication
Finance and insuranceReal estate
Other business servicesEducation
Medical servicesOther services for individuals
Public services
Germany/US 1995
Germany/US 2002
22
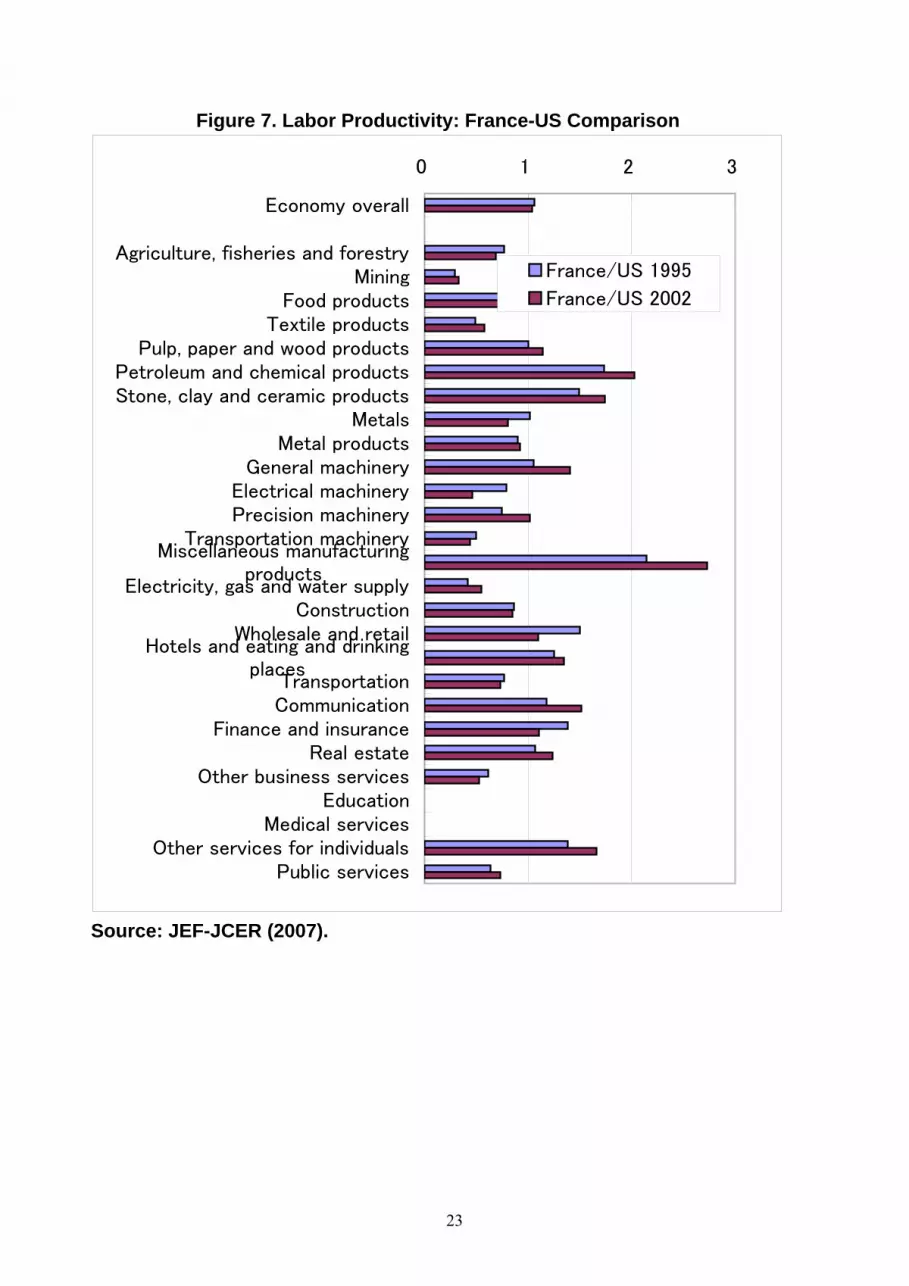
Source: JEF-JCER (2007).
Figure 7. Labor Productivity: France-US Comparison
0 1 2 3
Economy overall
Agriculture, fisheries and forestryMining
Food productsTextile products
Pulp, paper and wood productsPetroleum and chemical productsStone, clay and ceramic products
MetalsMetal products
General machineryElectrical machineryPrecision machinery
Transportation machineryMiscellaneous manufacturing
productsElectricity, gas and water supply
ConstructionWholesale and retail
Hotels and eating and drinkingplaces
TransportationCommunication
Finance and insuranceReal estate
Other business servicesEducation
Medical servicesOther services for individuals
Public services
France/US 1995
France/US 2002
23

Source: JEF-JCER (2007).
Figure 8. Labor Productivity: UK-US Comparison
0 1 2 3
Economy overall
Agriculture, fisheries and forestryMining
Food productsTextile products
Pulp, paper and wood productsPetroleum and chemical productsStone, clay and ceramic products
MetalsMetal products
General machineryElectrical machineryPrecision machinery
Transportation machineryMiscellaneous manufacturing
productsElectricity, gas and water supply
ConstructionWholesale and retail
Hotels and eating and drinkingplaces
TransportationCommunication
Finance and insuranceReal estate
Other business servicesEducation
Medical servicesOther services for individuals
Public services
UK/US 1995
UK/US 2002
24

Figure 9. ICT investment in Japan
0
5000
10000
15000
20000
25000
1970
1971
1972
1973
1974
1975
1976
1977
1978
1979
1980
1981
1982
1983
1984
1985
1986
1987
1988
1989
1990
1991
1992
1993
1994
1995
1996
1997
1998
1999
2000
2001
2002
2003
2004
billio
n ye
n
Software
Information equipment
Computers
25

Figure 10. ICT investment in Korea
0
5000
10000
15000
20000
25000
30000
1970
1971
1972
1973
1974
1975
1976
1977
1978
1979
1980
1981
1982
1983
1984
1985
1986
1987
1988
1989
1990
1991
1992
1993
1994
1995
1996
1997
1998
1999
2000
2001
2002
2003
2004
2005
billio
n w
on
Software
Information equipment
Computers
26

Figure 11. ICT investment/ GDP in Japan and Korea
0
1
2
3
4
5
6
1970
1971
1972
1973
1974
1975
1976
1977
1978
1979
1980
1981
1982
1983
1984
1985
1986
1987
1988
1989
1990
1991
1992
1993
1994
1995
1996
1997
1998
1999
2000
2001
2002
2003
2004
2005
%
Japan
Korea
27

Figure 12. ICT capital stock in Japan
0
10000
20000
30000
40000
50000
60000
70000
80000
90000
1970
1971
1972
1973
1974
1975
1976
1977
1978
1979
1980
1981
1982
1983
1984
1985
1986
1987
1988
1989
1990
1991
1992
1993
1994
1995
1996
1997
1998
1999
2000
2001
2002
2003
2004
billio
n ye
n
Software
Information equipment
Computers
28

Figure 13. ICT capital stock in Korea
0
10000
20000
30000
40000
50000
60000
70000
80000
90000
100000
1977
1978
1979
1980
1981
1982
1983
1984
1985
1986
1987
1988
1989
1990
1991
1992
1993
1994
1995
1996
1997
1998
1999
2000
2001
2002
2003
2004
2005
billio
n w
on
SoftwareInformation equipmentComputers
29
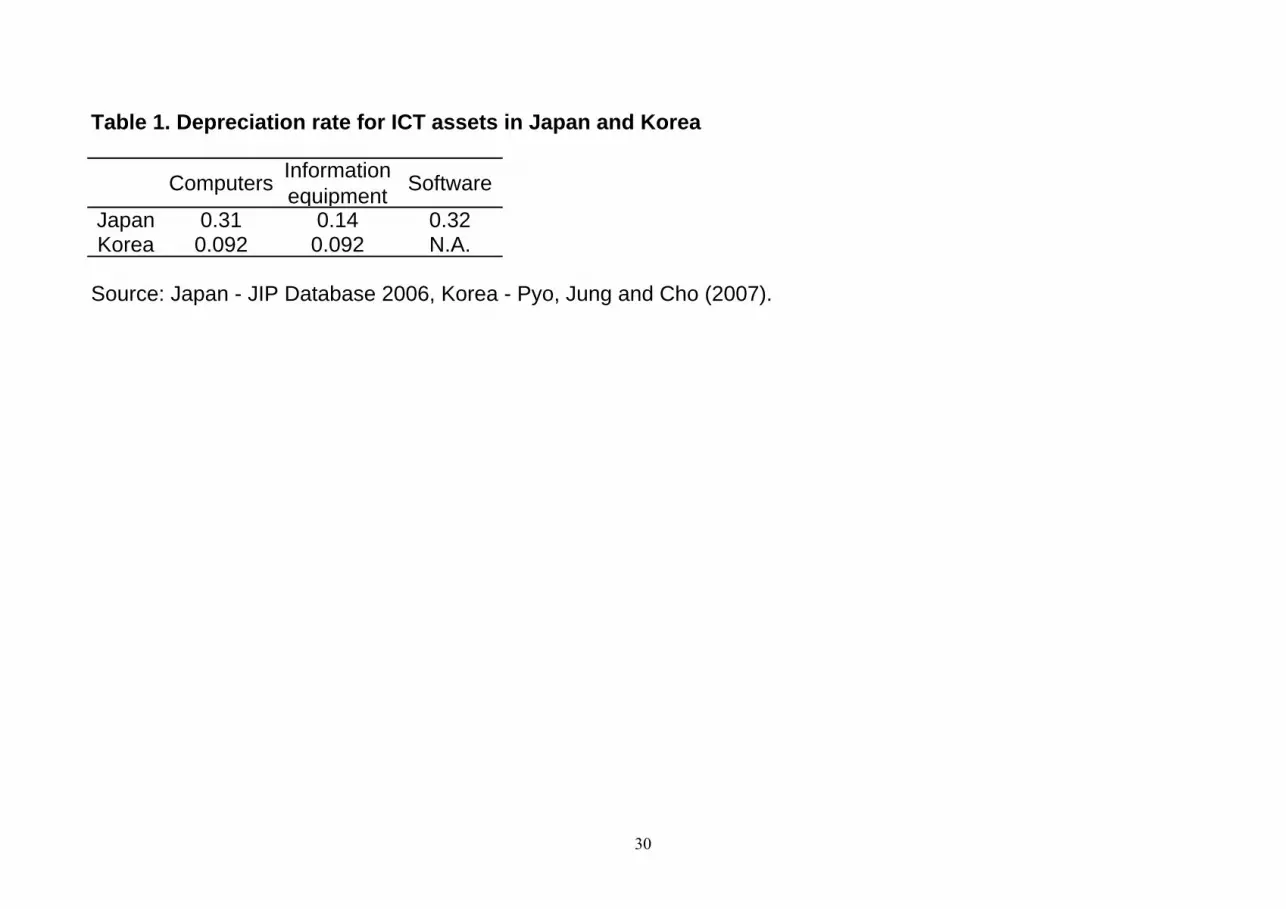
Table 1. Depreciation rate for ICT assets in Japan and Korea
Computers Informationequipment Software
Japan 0.31 0.14 0.32Korea 0.092 0.092 N.A.
Source: Japan - JIP Database 2006, Korea - Pyo, Jung and Cho (2007).
30

Table 2. Contribution of ICT Capital Service Input Growth to Economic Growth(%)
1995-2004Japan US France Germany Italy UK Japan US France Germany Italy UK
Market economy total 0.44 0.52 0.32 0.86 0.23 0.51 0.35 0.81 0.49 0.99 0.25 0.99
.Electrical machinery, postand communication 1.20 0.95 0.41 2.28 0.76 1.32 0.96 1.55 0.85 2.73 0.24 2.73
.Manufacturing, excludingelectrical 0.21 0.30 0.21 0.41 0.10 0.32 0.08 0.41 0.32 0.51 0.08 0.51
.Other goods producingindustries 0.16 0.17 0.05 0.20 0.09 0.14 0.06 0.21 0.21 0.10 0.04 0.10
.Distribution services 0.20 0.61 0.16 0.52 0.28 0.42 0.11 0.96 0.27 0.82 0.19 0.82
.Finance and businessservices 1.55 0.98 0.72 2.22 0.45 1.04 1.19 1.24 1.04 1.82 0.66 1.82
.Personal and socialservices 0.32 0.20 0.47 0.62 0.02 0.43 0.19 0.37 0.02 0.48 0.26 0.48
Source: EU KLEMS Database March 2007.
1980-95
31

Table 3. Aggregate Reallocation Effects (Average Annual Rates)
1975-1980 1980-1990 1990-2000 2000-2002Growth rate of aggregated TFP 2.23% 1.77% 0.34% 0.52%
Domar weighted TFP growth 2.10% 1.65% 0.11% 0.03%Reallocation effects of capital input 0.14% -0.05% -0.03% 0.05%Reallocation effect of labor input 0.00% 0.17% 0.26% 0.45%
32
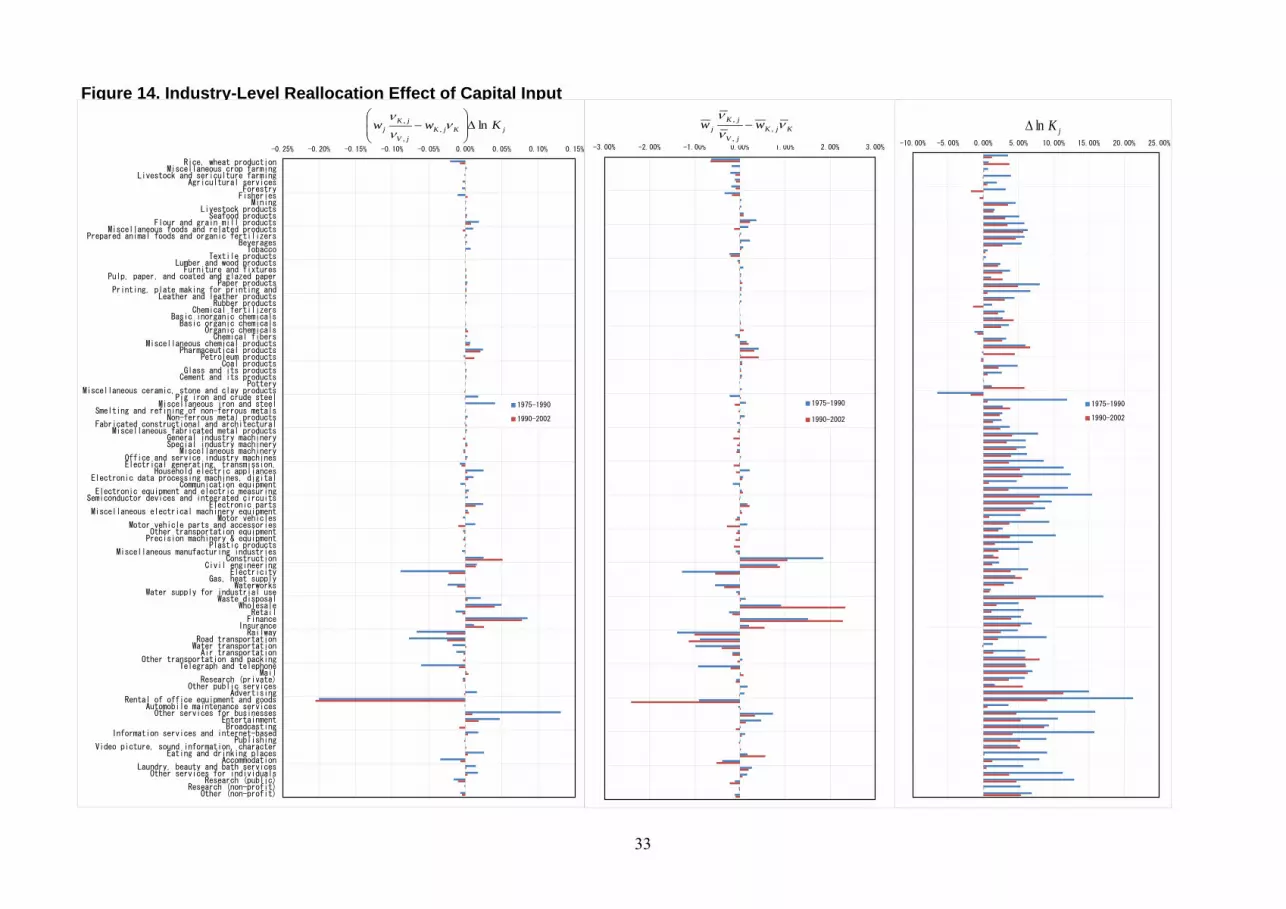
Figure 14. Industry-Level Reallocation Effect of Capital Input
-0.25% -0.20% -0.15% -0.10% -0.05% 0.00% 0.05% 0.10% 0.15%
Rice, wheat productionMiscellaneous crop farming
Livestock and sericulture farmingAgricultural services
ForestryFisheries
MiningLivestock products
Seafood productsFlour and grain mill products
Miscellaneous foods and related productsPrepared animal foods and organic fertilizers
BeveragesTobacco
Textile productsLumber and wood productsFurniture and fixtures
Pulp, paper, and coated and glazed paperPaper products
Printing, plate making for printing andLeather and leather products
Rubber productsChemical fertilizers
Basic inorganic chemicalsBasic organic chemicals
Organic chemicalsChemical fibers
Miscellaneous chemical productsPharmaceutical products
Petroleum productsCoal products
Glass and its productsCement and its products
PotteryMiscellaneous ceramic, stone and clay products
Pig iron and crude steelMiscellaneous iron and steel
Smelting and refining of non-ferrous metalsNon-ferrous metal products
Fabricated constructional and architecturalMiscellaneous fabricated metal products
General industry machinerySpecial industry machinery
Miscellaneous machineryOffice and service industry machinesElectrical generating, transmission,
Household electric appliancesElectronic data processing machines, digital
Communication equipmentElectronic equipment and electric measuring
Semiconductor devices and integrated circuitsElectronic parts
Miscellaneous electrical machinery equipmentMotor vehicles
Motor vehicle parts and accessoriesOther transportation equipment
Precision machinery & equipmentPlastic products
Miscellaneous manufacturing industriesConstruction
Civil engineeringElectricity
Gas, heat supplyWaterworks
Water supply for industrial useWaste disposal
WholesaleRetailFinance
InsuranceRailway
Road transportationWater transportationAir transportation
Other transportation and packingTelegraph and telephone
MailResearch (private)
Other public servicesAdvertising
Rental of office equipment and goodsAutomobile maintenance servicesOther services for businesses
EntertainmentBroadcasting
Information services and internet-basedPublishing
Video picture, sound information, characterEating and drinking places
AccommodationLaundry, beauty and bath services
Other services for individualsResearch (public)
Research (non-profit)Other (non-profit)
1975-1990
1990-2002
-3.00% -2.00% -1.00% 0.00% 1.00% 2.00% 3.00%
1975-1990
1990-2002
-10.00% -5.00% 0.00% 5.00% 10.00% 15.00% 20.00% 25.00%
1975-1990
1990-2002
jKlnΔKjKjV
jKj ww ννν
,,
, −jKjKjV
jKj Kww ln,
,
, Δ⎟⎟⎠
⎞⎜⎜⎝
⎛− ν
νν
33

Figure 15. Industry-Level Reallocation Effect of Labor Input
-0.03% -0.02% -0.01% 0.00% 0.01% 0.02% 0.03% 0.04% 0.05%
Rice, wheat productionMiscellaneous crop farming
Livestock and sericulture farmingAgricultural services
ForestryFisheries
MiningLivestock products
Seafood productsFlour and grain mill products
Miscellaneous foods and related productsPrepared animal foods and organic fertilizers
BeveragesTobacco
Textile productsLumber and wood productsFurniture and fixtures
Pulp, paper, and coated and glazed paperPaper products
Printing, plate making for printing andLeather and leather products
Rubber productsChemical fertilizers
Basic inorganic chemicalsBasic organic chemicals
Organic chemicalsChemical fibers
Miscellaneous chemical productsPharmaceutical products
Petroleum productsCoal products
Glass and its productsCement and its products
PotteryMiscellaneous ceramic, stone and clay products
Pig iron and crude steelMiscellaneous iron and steel
Smelting and refining of non-ferrous metalsNon-ferrous metal products
Fabricated constructional and architecturalMiscellaneous fabricated metal products
General industry machinerySpecial industry machinery
Miscellaneous machineryOffice and service industry machinesElectrical generating, transmission,
Household electric appliancesElectronic data processing machines, digital
Communication equipmentElectronic equipment and electric measuring
Semiconductor devices and integrated circuitsElectronic parts
Miscellaneous electrical machinery equipmentMotor vehicles
Motor vehicle parts and accessoriesOther transportation equipment
Precision machinery & equipmentPlastic products
Miscellaneous manufacturing industriesConstruction
Civil engineeringElectricity
Gas, heat supplyWaterworks
Water supply for industrial useWaste disposal
WholesaleRetailFinance
InsuranceRailway
Road transportationWater transportationAir transportation
Other transportation and packingTelegraph and telephone
MailResearch (private)
Other public servicesAdvertising
Rental of office equipment and goodsAutomobile maintenance servicesOther services for businesses
EntertainmentBroadcasting
Information services and internet-basedPublishing
Video picture, sound information, characterEating and drinking places
AccommodationLaundry, beauty and bath services
Other services for individualsResearch (public)
Research (non-profit)Other (non-profit)
1975-1990
1990-2002
-1.50% -1.00% -0.50% 0.00% 0.50% 1.00% 1.50%
1975-1990
1990-2002
-10.00% -5.00% 0.00% 5.00% 10.00% 15.00% 20.00%
1975-1990
1990-2002
jLjLjV
jLj Lww ln,
,
, Δ⎟⎟⎠
⎞⎜⎜⎝
⎛− ν
νν
LjLjV
jLj ww ννν
,,
, −jLlnΔ
34


