Embed Size (px)
Citation preview

FFB ForschungsinstitutFreie Berufe
Fakultät II - Wirtschaft und Gesellschaft
Postanschrift:Forschungsinstitut Freie BerufePostfach 244021314 Lüneburg
[email protected]://ffb.uni-lueneburg.deTel: +49 4131 677-2051Fax: +49 4131 677-2059
UniversitätL Ü N E B U R G
Professions, entrepreneurs, employees and the new
German tax (cut) reform 2000 - A MICSIM
microsimulation analysis of distributional impacts
Joachim Merz, Henning Stolz and Markus Zwick
FFB Discussion Paper No. 34
July 2002

Professions, entrepreneurs, employees and the new German tax (cut) reform 2000 -
A MICSIM microsimulation analysis of distributional impacts
Joachim Merz, Henning Stolze, Markus Zwick*
Discussion Paper No. 34
Juli 2002 ISSN 0942-2595
* Prof. Dr. Joachim Merz, Dipl.-Kfm. Henning Stolze, Universität Lüneburg, Fachbereich
Wirtschafts- und Sozialwissenschaften, Forschungsinstitut Freie Berufe (FFB), Campus Scharnhorststr. 1, Geb. 5, 21335 Lüneburg, Tel: +49 (0)4131/78-2051, Fax: +49 (0)4131/78-2059, e-mail: [email protected], [email protected], http://ffb.uni-lueneburg.de Dipl.-Vw. Markus Zwick, Statistisches Bundesamt, Wiesbaden, [email protected]

Professions, entrepreneurs, employees and the new German tax (cut) reform 2000 - A MICSIM microsimulation analysis of distributional impacts Joachim Merz, Henning Stolze, Markus Zwick
FFB-Discussion Paper No. 34, Juli 2002, ISSN 0924-2595 Summary
With the tax reform 2000 Germany has seen the implementation of the most ambitious tax reduction programme in its post-war history. In the period from 1998 to 2005, taxpayers will benefit substantially from net tax relief more than DM 100 billions in total. It is expected, that private consumption and investment are stimulated - two essential requirements for promoting growth and employment.
Under the aspect of the tax reform 2000 and the ‘Karlsruher Entwurf’ (an expert draft on further income tax reform approaches) compared to the former taxbase system we investigate in our paper overall and distributional and redistributional impacts on the self employed (professions (free lancers) and entrepreneurs) and employees besides other socioeconomic grouping like gender and family type. In addition, a decomposition analysis based on a generalized entropy approach quantifies the socioeconomic subgroups’ inequality contribution to overall inequality.
Together with the recent poverty and wealth report for our government, this is the first time that the anonymized microdata records of the German Income Tax Statistic can be used by researchers within the Federal Statistical Office. Such a microdata file is essential for analysing above all the often neglected situation of the self-employed; in traditional surveys, where, in principle, firm information yielding the final income and taxes to be paid are not available for the self-employed.
JEL: D30, D31, J23
Keywords: microsimulation, German tax reform, Karlsruhe proposal, self-employed, professions, entrepreneurs, employees, distributional and redistributional policy impacts, inequality and decomposition of inequality
Zusammenfassung
Mit der Steuerreform 2000 wurde das ambitionierteste Steuerreduktionsvorhaben in der deutschen Nachkriegsgeschichte beschlossen. In den Jahren von 1998 bis 2005 werden Steuerzahler von einer Nettoentlastung von insgesamt mehr als 100 Mrd. DM profitieren. Man erwartet hierdurch eine Stimulation der privaten Ausgaben sowie der Investitionen, zwei wichtige Voraussetzungen für Wirtschaftswachstum und mehr Beschäftigung.
Auf der Grundlage von Vergleichen zwischen dem früheren Steuersystem mit der Steuerreform von 2000 und dem Karlsruher Entwurf (einem Vorschlag einer Expertengruppe für weitere Einkommenssteuerreformen) werden in diesem Paper Verteilungs- und Umverteilungseffekte auf die Gruppe der Selbständigen (Freie Berufe und Unternehmer) und anderen sozioökonomischen Gruppen (z.B. unterschieden nach Geschlecht, Familientypus etc.) untersucht. Zusätzlich wird die Ungleichheitsverteilung einzelner sozioökonomischer Untergruppen im Vergleich zur gesamten Ungleichheit mit Hilfe einer Dekompositionsanalyse auf der Basis der Informationstheorie untersucht.
Neben dem kürzlich erschienenen Armuts- und Reichtumsbericht der Bundesregierung ist dies das erste Mal, dass anonymisierte Mikrodatenfiles der deutschen Einkommenssteuerstatistik der Wissenschaft innerhalb des Statistischen Bundesamtes zur Verfügung gestellt werden. Solche Mikrodaten sind jedoch für die Analyse der oft vernachlässigten Selbständigen unerlässlich; über konventionellen Umfragen sind präzise Daten über das Einkommen und die Steuerlast der Selbständigen praktisch nicht zu erheben.
JEL:D30, D31, J23
Schlagwörter: Mikrosimulation, Einkommessteuerreform, Karlsruher Entwurf, Selbständige, Freie Berufe, Unternehmer, Angestellte, Verteilungs- und Umverteilungseffekte, Ungleichheit und Dekom-position von Ungleichheit

Professions, entrepreneurs, employees and the new German tax (cut) reform 2000 - A MICSIM microsimulation analysis of distributional impacts Joachim Merz, Henning Stolze and Markus Zwick1
1 Introduction 4
2 Microsimulation of the Tax Reform: Principle Procedure of our Microanalyses 6
2.1 Our Microsimulation Steps 7
2.2 Adjustment of the 1995 Income Tax File to 2000/2005, Economic Multipliers and Static Aging 7
3 MICSIM: A Microsimulation Model 8
4 Microdatabase: The 10% Sample of the Wage and Income Tax Statistic 1995 8
5 concept of an ‘economic’ market income as a unified initial ‘gross’ income 9
6 The new German tax reform alternatives under investigation 10
6.1 Baseline: the income tax law of 1995 10
6.2 Tax reform 2000: The final income tax situation in the year 2005 after the tax reform 2000 12
6.3 The “Karlsruhe proposal” 14
7 General Results 17
7.1 General results: Overall size of the tax reform alternatives 17
7.2 General results: Distributional and redistributional impacts of the tax reform alternatives 18
8 Results for socioeconomic group 25
8.1 Defining socioeconomic groups 26
8.2 Tax burden impacts of tax reform alternatives for socioeconomic groups 28
8.3 Disposable income impacts of the tax reform alternatives for socioeconomic groups 36
8.4 Distributional impacts of the tax reform alternatives for socioeconomic groups 41
1 Prof. Dr. Joachim Merz, Dipl.-Kfm. Henning Stolze, University of Lüneburg, Department of Economic and
Social Sciences, Research Institute on Professions (FFB), 21332 Lueneburg, Germany, [email protected], [email protected]
Dipl.-Volkswirt Markus Zwick, Federal Statistical Office, Wiesbaden, Germany, [email protected]
We thank the discussants of the Microsimulation Session (organized by Joachim Merz and Holly Sutherland) of the 27th General Conference of The International Association for Research in Income and Wealth,
Stockholm, Sweden, August, 18th to 24th, 2002, for helpful comments.

8.5 Decomposition of inequality: The contribution of subgroups to overall inequality - Impacts of the tax reform alternatives 56
8.6 Redistributional impacts of the tax reform alternatives for socioeconomic groups 64
9 Conclusions 70
References 73
Appendix 1: The German Income Statistic 1995 Definitions 75
Appendix 2: Model for Sunday-, public holiday- and night work extra pay 77
Appendix 3: DISTRIBUTIONAL MEASURES 79
Appendix 4: Numerical Results 82
Publication list 94

Merz/Stolze/Zwick: Microsimulation German Tax Reform 1/106
Professions, entrepreneurs, employees and the new German tax (cut) reform 2000 - A MICSIM microsimulation analysis of distributional impacts Joachim Merz, Henning Stolze and Markus Zwick2
1 Introduction
Beyond traditional taxation aims to cover public expenditures and to promote a just income distribution (based on the principle of productive ability (‘Leistungsfähigkeit’)), during the last two decades another aspect of taxation has been established. Promoted by the discussion of supply side orientated policies of the Reagan and Thatcher era and theoretically based on the so called Laffer-Theorem (Canto, Douglas and Laffer 1983), the questions about the individual impacts and incentives/disincentives of taxes and benefits became increasingly important in the political discussion. Questions discussed were impacts on the individual labour supply, labour market effects through companies and entrepreneurs, and the connected competitiveness of Germany as location for (new) businesses. These questions were embedded in the general discussion about non-market and market economies and the equality/inequality of income as a source of economic growth and well-being. In Germany this mindset resulted in the tax reform 2000 of the new red-green coalition government with estimated overall tax cuts of about 56 billion Euro (= 110 billion DM).
However, before incentive/disincentive impacts of a tax/transfer system can be investigated, so-called first-round effects, the immediate, direct effects of tax cuts (say) of an alternative system to the taxpayers (factual incidence) have to be calculated. Embedded in the above general questions, then the distributional impacts, the winners and losers of a changing system is of central interest for both of them: for a government with regard to their goals of relief and burden, and for the individual tax payers with regard to their concerned income and (economic) well-being. This study will contribute to this task and will analyse the 2 Prof. Dr. Joachim Merz, Dipl.-Kfm. Henning Stolze, University of Lüneburg, Department of Economic and
Social Sciences, Research Institute on Professions (FFB), 21332 Lueneburg, Germany, [email protected], [email protected]
Dipl.-Volkswirt Markus Zwick, Federal Statistical Office, Wiesbaden, Germany, [email protected]
We thank the discussants of the Microsimulation Session (organized by Joachim Merz and Holly Sutherland) of the 27th General Conference of The International Association for Research in Income and Wealth, Stockholm, Sweden, August, 18th to 24th, 2002, for helpful comments.

Merz/Stolze/Zwick: Microsimulation German Tax Reform 2/106
distributional and redistributional impacts on the individual taxpayers of the new German tax reform and discussed alternatives.
Together with administrative new tax regulations the scientific and policy discussion (again) stress the importance of a more transparent and effective tax system. One important attempt in Germany is the so called “Karlsruher Entwurf” (“Karlsruhe proposal”) which was initiated by former federal constitutional court judge Paul Kirchhof and leading tax system academics and experts in 2001 (Karlsruher Arbeitskreis 2001). The gist of the approach is that a drastic simplification of the very complex German tax system will result in greater transparency and will thus increase the acceptance of the taxation laws by the public. This should mobilise the economic impetus while at the same time keeping tax income of the government constant (‘Aufkommensneutralität’).
The government tax reform as well as the Karlsruhe proposal try to reach their goals by a variation of the tax rate and at the same time increasing the taxable base (‘Bemessungs-grundlage’). Both these elements finally determine the total tax liability of the tax units. According to the way they are designed they affect the total population of tax payers in different ways. How they - under the different proposals - influence the final tax payments and the affected incomes is the central question of our paper.
In this study we analyse and quantify by a microsimulation approach the distributional and redistributional impacts of the tax situation before the tax reform 2000 (baseline simulation) the tax reform 2000 itself with its several parts up to 2005 and the mentioned ‘Karlsruher’ proposal for various groups of persons that are liable for taxation. Besides other socio-economic breakdowns, in particular we will focus on the situation of the self-employed, as professions (free- lancer, liberal professions, ‘Freie Berufe’) and entrepreneurs, and the employees. We focus on theses groups not only because they are important group in the economy and the society as a whole, but also because they are respectively targeted by the tax reform under investigation.
Besides the fiscal aim to cover government spending it has been an aim of the German taxation policy to change the income distribution resulting out of the market forces to a socially juster distribution through the tax system (SPD 1998, CDU 1994) by redistribution via the tax and benefit system. As mentioned, we will thus analyse the distributional situation before and after tax and we will quantify the respective redistributional effects.
Though there are some recent analyses of the German Tax Reform 2000, however, either they are restricted to company effects (Börstinghaus and Weinelt 2002) and/or – compared to our possibility with regard to detailed tax information - to a constrained database, the German Socio-Economic Panel (Wagenhals 2001). A thorough database is especially needed for the tax impact microanalysis among others for self-employed income with all their final company’s deductions etc. to achieve the ‘real’ income situation (see Merz 2000a, 2001). Furthermore, one has to be able to take into account and map the many special rules and

Merz/Stolze/Zwick: Microsimulation German Tax Reform 3/106
exceptions provided for in the tax law for each individual. For the first time in Germany we are able to work with such a comprehensive and well-suited micro database: the anonymised individual records of the German Income Tax Statistic as a 10% sample of the currently available income tax statistic 1995 with ca. 3 million records.
Paper organization
In section 2 we describe the principle procedure of our microsimulation tax reform analysis. Section 3 gives a comprehensive description of MICSIM, the microsimulation model we developed and use in our study. Section 4 is about the microdatabase, the 10% sample of the Wage and Income Tax Statistic 1995. Section 5 develops the concept of an ‘economic’ market income as a unified initial ‘gross’ income. All the tax systems are compared to each other regarding their distributional impacts. Section 6 is describing the new German tax reform alternatives: the baseline is the income tax law 1995 situation, the actual tax reform 2000/2005 and the “Karlsruhe proposal”. Section 7 presents general results according to the overall size of the tax reform and the overall distributional and redistributional impacts of the tax reform alternatives. Section 8 is about the results for socio-economic groups: after defining these groups we respectively investigate tax burden and disposable income impacts, distributional effects, the decomposition of inequality and redistributional impacts. The paper ends with the concluding remarks in section 9.
2 Microsimulation of the Tax Reform: Principle Procedure of our Microanalyses
It has been proven by many analyses, microsimulation is a qualified and in particular well-suited instrument to analyse policy impacts on an individual level. Above all, distributional effects, winners and losers, based on a representative sample by this instrument are able to be quantified without all the restrictions of typical cases only. Since the seminal work of Orcutt (1957), over the decades a growing number of microsimulation models and analyses of tax and benefit impacts in many countries worldwide have shown the success and possibilities of static and dynamic cross-section and life-cycle microsimulation. A general description of the microsimulation approach is found e.g. in Merz 1991, international approaches and developments are provided by Orcutt, Caldwell and Wertheimer II 1976, Orcutt, Merz and Quinke 1986, Atkinson and Sutherland 1988, Brunner and Petersen 1990, Citro and Hanushek 1991a,b, Hancock and Harding 1996 and recently by Gupta and Kapur 2000 and Mitton, Sutherland and Weeks 2000.

Merz/Stolze/Zwick: Microsimulation German Tax Reform 4/106
2.1 Our Microsimulation Steps
We analyse the distributional and redistributional effect that the alternative tax regulation scenarios will have. Because the total tax due is determined both by the taxable base (‘Bemessungsgrundlage’) and the tax rate, the first step is to design an unified gross income definition for all of the different proposals. In addition, what is needed is an “economic” income term that defines market income from an economic perspective and not on a tax statistic based view.
Therefore, in the first microsimulation step we derive an ‘economic’ market income from the available tax statistic data (chapter 3). This market income then becomes a (gross) reference term for the further simulation of the tax burden. In the following steps the resulting individual tax burden of the baseline year 1995, the individual tax burdens for the year 2005 (in which the final stage of the tax reform 2000 is achieved), as well as the individual tax burden which would result by implementing the “Karlsruhe proposal” have to be ascertained through the microsimulation calculations for all of the individual 3 million data records of our Income Tax sample.
From the market income the tax is deducted according to the relevant laws applicable for the individual. The market income minus the taxes is further called the net income as the disposable income, which is in the centre of our structural and distributional analyses. The individual difference between the market income and the disposable income of the alternatives quantify the respective redistributional impacts.
2.2 Adjustment of the 1995 Income Tax File to 2000/2005, Economic Multipliers and Static Aging
An extrapolation of the monetary values (inflating by economic multipliers) out of the 1995 Income Tax sample to the year 2005, the year of the final stage of the new German tax reform was not done. Inflating the base line (1995 situation), the new tax reform 2000/2005 and the “Karlsruhe proposal” (with unknown future price inflators, in addition) would bias the results away from the original introduction and discussion of the alternatives. However, since the family/tax unit situation with children, for instance, are treated in different ways within the alternatives, a changing demographic situation may alter the results. We are working on this topic, methodologically based on the computer program package ADJUST (Merz, Stolze and Imme 2001) and shall add these results in the next version of this paper.
3 MICSIM: A Microsimulation Model
As the methodical instrument we use MICSIM, a user friendly and powerful microsimulation tool (Merz 1996). Briefly speaking, the MICSIM basic concept above all is 1. concentration

Merz/Stolze/Zwick: Microsimulation German Tax Reform 5/106
on the substantial demands only, 2. operation by a protected data base management, 3. efficient operation by a set-theoretical based approach, and 4. user-friendly interactive environment. This concept is realized within a windows by a C++ environment arranging the user friendly interface and translating all data transformations to SQL to operate finally on a relational database system.
The substantial microsimulation domains and modules for MICSIM are: 1. Simulation of Alternative Policies, 2. Adjustment and Aging of Microdata, 3. Evaluation of Simulation Runs, and 4. Additional Tools. Each module allows specific work independently of other modules and is available as a stand-alone version. For instance, ADJUST is a powerful windows C-package to adjust (reweight) any microdata set to achieve representative results (Merz 1994, Merz, Stolze and Imme 2001, http://ffb.uni- lueneburg.de/adjust).
In particular, when analysing distributional impacts we developed DISTRI/MICSIM (Merz and Plönnigs 1997), another stand-alone windows-package to provide distributional measures. Since all of our data work had to be done within the Federal Statistical Office in Wiesbaden, we had to provide a program package written in SPSS-code. This is now also a stand-alone MICSIM application for distributional analyses and for analysing a decomposition of inequality to groups of interest (Merz 2000b) and was used finally for our microsimulation analysis.
4 Microdatabase: The 10% Sample of the Wage and Income Tax Statistic 1995
The German Wage and Income Tax Statistic is a population wide statistic with wages and income tax (Lohn- und Einkommensteuer) information of overall ca. 30 mio. tax units. In the case of joint assessment of couples one tax unit represents two taxed persons. Accordingly the wage and income tax statistic 1995 describes the formation and origin of the taxable income for nearly 38 million taxable citizens. Each data set describes with a maximum of 450 characteristics all the items from the sum of all income (Summe der Einkünfte) via the taxable income (Zu versteuerndes Einkommen), the tax amount up to the final fixed income tax (festgesetzte Einkommensteuer) to be paid (Appendix A1). The characteristics are statistically recorded within the framework of the annual tax declaration.
For the further analysis and especially for the calculation- intensive simulation, a 10% sample was drawn out of the total. The sample is constructed as a stratified random sample (Zwick 2001, Merz and Zwick 2001) to meet the requirements of high accuracy according items and socio-demographic breakdowns. Altogether five stratifying characteristics were incorporated: old/new federal states (Bundesländer) (2), assessment type (Veranlagungsart) (4), levels of tax exemption for dependent children (Kinderfreibetragsschritte) (4), primary income (“Einkunftsart”) (7), sum of all income (“Gesamtbetrag der Einkünfte”) (12).

Merz/Stolze/Zwick: Microsimulation German Tax Reform 6/106
The total combination of these characteristics result in 2688 strata. Because some of these strata were only marginally occupied or empty, finally 1568 strata were considered. For our paper the 10% sample as formal anonymised data material was processed with SPSS.
5 The concept of an ‘economic’ market income as a unified initial ‘gross’ income
For our economic analysis of income and its distribution we need an income concept that is based rather on economic requirements than tax requirements as it is provided by our income tax statistic. Required is an income concept that characterises, as a primary market income, an effective (pre government) income reconsidering opportunities through various depreciating possibilities, in particular for high income brackets. In particular we take into consideration miscellaneous depreciation, realisation profits (=Veräußerungsgewinne) and variants in the area of earnings derived from letting and leasing – areas of the tax law that are of high interest and of substantial value to high income groups.
Calculating the individual market income from the income tax information3 some income components that became relevant in further simulation steps could not be taken directly from the data set. This was the case for the trade tax (“Gewerbesteuer”) as well as for the 1995 tax free premiums for night-, Sunday- and holiday work.
The assessment basis of the trade tax (“Gewerbesteuer”) is the profit of business enterprise plus appreciation and minus depreciation applicable to entrepreneurs (in Germany, professions (free- lancers) are not applicable for a trade tax.).4 If the trade tax would be abolished the income of the business enterprises would rise accordingly. A market income concept should thus take this income component into account. The trade tax payable is the product of the tax measurement amount (“Steuermessbetrag”) with the local trade tax rate. Out of the individually calculated tax measurement amount - by multiplying with the weighted average trade tax rate for every federal state – we estimated the ind ividual trade tax which then will be a part of the generated new market income.
The tax free premiums for night-, Sunday- and holiday work were estimated with the help of the micro census 2000 as well as the state subsidy report 2002 (“Subventionsbericht”) of the federal government. The tax advantage of 1.9 billion € mentioned in the subsidy report was allotted to the employees via a distributional model. By taking into account their individual average tax rates these tax advantages were transformed into income components (Appendix A2) and were than respected individually within the generated new market income. 3 For details see Merz 2001 and Bach and Bartholmai 2000 4 Detailed information about appreciation and depreciation is not available. The current trade tax statistic
shows that the appreciation and depreciation balance themselves over all the taxable individuals.

Merz/Stolze/Zwick: Microsimulation German Tax Reform 7/106
6 The new German tax reform alternatives under investigation
The baseline of our microsimulation analyses is the income tax law of 1995. As mentioned, we shall analyse the distributional impacts of two tax reform alternatives: The tax reform 2000 with its final income tax situation in the year 2005 after the tax reform 2000 with several steps, and the “Karlsruhe proposal”. The starting situation and the alternatives are briefly characterised in the following.
6.1 Baseline: the income tax law of 1995
The Income Tax Statistic and our sample display for every tax payer the total tax due for 1995 as one variable. This variable in its current form can not be directly used for the distributional analysis. In order to compare the 1995 situation to the various different tax reform alternatives the total tax due for 1995 also had to be recalculated. The differences of the tax reform alternatives in particular were very distinct regarding the child allowances, the trade tax and the reunification tax surcharge. In 1995, for instance, one could receive a child allowance and also be eligible for a child tax exemption amount, in 2005 a tax unit could choose between a child allowance or a child tax exemption amount, and the Karlsruhe concept proposes a basic tax exemption amount and an additional child allowance up to a certain income level. These differences were taken into account, amongst other thing, by recalculating a total tax due for 1995.
Child allowance: In 1995 every tax payer with children received, apart from the child
allowance, also a child tax exemption amount of 2 098 € per child. From the tax year 1996 on
the child tax exemption amount ceased to exist and was compensated by a higher child
allowance5 and a higher basic tax exemption amount.
Because the total tax amount due according to the tax reform 2000 as well as in the
“Karlsruhe proposal” is in various ways dependent on the number of children, all the taxation
effects out of the tax liability for all alternatives have been deliberately omitted. In a separate
module we thus calculated the income effect caused by the number of children for all the
three taxpayer groups. In the calculation for the total tax amount for 1995 we adjusted the
assessment basis of the tax rate of the taxpayers by the child tax exemption amount. Out of
this “modified taxable income” we calculated the total tax due for 1995 with the help of the
(inverse) tax rate function (“Steuertariffunktion”).
Trade tax: In a further step this tax liability was expanded for taxpayers with trade earnings
to include the trade tax burden. This was necessary because the tax burden reduces the market
5 Taxpayers who were better off with the child tax-exemption amount compared to the new child allowance
amount could still use the child tax-exemption amount.

Merz/Stolze/Zwick: Microsimulation German Tax Reform 8/106
income as defined above. Because the market income includes the trade tax but the
“Karlsruhe proposal” doesn’t, we had to use the tax burden in 1995 to ensure comparability.
Reunification tax surcharge: Furthermore the tax amount payable for the year 1995 was
increased by the reunification tax surcharge of 7.5% on the fixed income tax (“festgesetzte
Einkommensteuer”).
Beyond these modifications for our comparisons the key elements of the Income Tax Law
1995 are sketched in Table 1.
Table 1: Income Tax Law 1995: Key elements
§ basic tax-exemption amount: 2 871 €
⇒ taxation on parts of the minimum living wage
§ top income tax rate at 53%
§ reunification tax surcharge of 7.5% on the fixed income tax
§ tariff limit (“Tarifbegrenzung”) for trade income
⇒ top income tax rate for trade income at 47%
§ half tax rate for exceptional earnings
especially for realised capital gains (from the sale of the asset)
§ nearly unrestricted equalisation possible between the various earnings types
(horizontal loss compensation)
§ loss deduction of 5 112 919 € (10 000 000 DM) possible for the two previous tax assessment years
§ Reduction for lower income § 32 d EStG 1995
§ Reduction in the case of inheritance tax burden
6.2 Tax reform 2000: The final income tax situation in the year 2005 after the tax reform 2000
The laws regarding income tax were changed by various new laws and amendments in quick
succession due to the change of government in 1998. Following the “tax relief law”
(“Steuerentlastungsgesetz”) 1999/2000/2002 of the year 1999, the tax reform 2000 was
passed together with the “tax reduction law” (“Steuersenkungsgesetz”)6 in July 2000. This law
6 Bundesgesetzblatt Nr. 46, Teil 1, October 26, 2000, p. 1433 ff

Merz/Stolze/Zwick: Microsimulation German Tax Reform 9/106
then was amended by the respective “tax reduction amendment law” (“Steuersenkungs-
änderungsgesetz”) in November 2000.
Although the previous government had adjusted the tax rate after the constitutional court
ruling on the tax exemption of the minimum living wage (“Steuerfreistellung des Existenz-
minimums”)7, the previous government did not implement many of the recommendations
made by the so called Bareis-Report. The new red-green coalition government, however,
rather quickly began to implement respective changes.
One central aim of the new German tax reform 2000 was – and still is – the reduction of the
tax burden for large parts of the taxpayers and especially a tax relief for families. A marked
reduction of the top income tax rate should also result in greater incentives for economic
activities for the high-performance and high- income sectors of the population. Furthermore
the aim was to make the tax law simpler, more transparent and fairer.8
The key elements of the new tax reform 2000 with its steps up to 2005 are listed in Table 2.
Table 2: New Income Tax Law 2000/2005: Key elements
§ basic tax-exemption amount of 7 664 €
§ top income tax rate at 42%
§ reunification tax surcharge of 5.5% on the fixed income tax
§ restriction of the loss deduction possibilities and resultantly the introduction of a minimum taxation
§ No further tariff limitation for trade earnings; introduction of flat-rate trade tax with a general collection rate of
180%
§ Higher taxation of extraordinary earnings
§ Restriction of loss carry forward (“Verlustvortrag”) and loss carry back (“Verlustrücktrag”) possibilities
§ Abolishment of tax reductions for farmers
§ Abolishment of recognition of child care costs
§ Abolishment of tax breaks to promote home ownership as well as child home building allowances
(“Baukindergeld”); introduction of a support according to the home ownership allowance law
(“Eigenheimzulagengesetz”)
7 Federal Constitutional Court ruling of September 25, 1992 8 A personal remark: That the law has become simpler or more transparent is really questionable after the
experiences we made while programming the tax reform 2000 with all its step to 2005.

Merz/Stolze/Zwick: Microsimulation German Tax Reform 10/106
The tax reform 2000 had lead to a change of both parameters that determine the total amount
of tax payable: the tax assessment base and the tax rate. On the one hand the tax rate was
reduced markedly and on the other hand the tax base was broadened. In other words: Income
components that were previously not or only partly taxable are now taxable according to the
tax reform bill 2000.
Calculating a new assessment base
To simulate the tax reform 2000/2005 on the basis of our 10% sample a new tax assessment bases had to be calculated. This tax base was than assessed with the applicable tax rate of 2005 and provides the income tax payable for the respective year. In the course of time the tax reform 2000/2005 had further changing items. Some expenditure items that reduced the tax burden in the past are no more or only partly applicable in 2005, e.g. a tax reduction of lower income. On the other hand, new tax reducing items like the lump-sum consideration of the trade tax have been instated.
To calculate the tax assessment basis for the year 2005 the provisions for the minimum taxation (“Mindestbesteuerung”) according to § 2 III EStG (Einkommensteuergesetz, Income Tax Law) had to be taken into account. The limitation of loss compensation possibilities by balancing positive and negative income leads here to a considerable change of the sum of all income (“Summe der Einkünfte”). Because of the extremely complicated rules for the loss compensation possibilities when the two spouses are assessed together we chose a simplified model for those couples that are commonly taxed according to the “splitting table” (“Splittingtabelle”). The accurate calculation for those cases where one partner can not compensate his losses and uses the compensation potential of his partner is controversial in the literature. Our simulation largely follows the wording of the income tax law EStG. In the case of a loss by one spouse that could not be compensated, both tax cases where combined and were treated as one taxpayer with a respective doubling of the assessment amounts (“Anrechnungsbeträge”).
In the further calculation steps between the sum of all income (“Summe der Einkünfte”) and the taxable income (“Zu versteuerndes Einkommen”) changes according personal special expenditures (“Sonderausgaben”) and extraordinary burdens (“Außergewöhnliche Belastungen”), e.g. the elimination of the consideration of child care costs or the restriction of loss carry forward and loss carry back possibilities, were taken into account. This taxable income then was assessed according the 2005 tax tariff to achieve the tariff wise income tax (“tarifliche Einkommensteuer”).
In the further calculation step between the tariff wise income tax and the final fixed income tax the further changes according to the 2005 tax law were incorporated, e.g. the abolishment of tax reductions for farmers or the lump-sum consideration of the trade tax.

Merz/Stolze/Zwick: Microsimulation German Tax Reform 11/106
Finally, the reunification tax surcharge of 5.5% was added to the fixed income tax to calculate the final 2005 tax burden.
To facilitate better comparability the simulated amounts for the tax payers who received tax relief for self-used housing in 1995 (in accordance with the supplementary allowance for home owners law (“Eigenheimzulagengesetz”)) were deducted from the tax amount payable for 2005.
6.3 The “Karlsruhe proposal”
The “”Karlsruhe proposal” of the Karlsruhe Research Group (Karlsruher Arbeitskreis 2001) was presented to the public in the summer of 2001. This research group consisting of renowned tax experts from the scientific community and practitioners was chaired by the former federal constitutional court judge Paul Kirchhof. They propose a fundamental simplification of the very complex German tax law ensuring a ‘just’ distribution of the tax burden. 9. To meet this aim the tax law should be abandoned by any government steering mechanism. Through a rigorous enlargement of the tax base and a much simpler tariff structure the defined aims should be reached while at the same time keeping the government revenue constant. The assessment basis should be calculated according to the net assets addition theory (“Reinvermögenszugangstheorie”). Following this theory only one income source “income out of gainful economic activity” (“Einkünfte aus erwerbswirtschaftlichem Handeln”) should be considered. Nearly all lump-sum allowances for income related expenses, allowances for particular income sources as well as special expenditures, deductions and extraordinary burdens are not allowed anymore to be deducted from the taxable income.
The basis of assessment is however reduced by a tax allowance of 8 181 € (16 000 DM yearly) for every person of the family. For a family with two children only income above 32 723 € (64 000 DM) is taxable. The tax rate only needs two functional areas: The entry tax rate is 15% and rises till 27 610 € (54 000 DM) to 35%. Income above 27 610 € is taxed with the highest tax rate of 35%. Direct deductions from the tax payable amount (that are possible under the current tax law between the income tax according to tariff and the fixed income tax) are not contained anymore in the “Karlsruhe proposal”.
The key elements of the “Karlsruhe proposal” are summarised in Table 3.
9 The aim of the reform proposal is “einen einfachen und systematischen Entwurf eines Einkommen-steuergesetzes vorzulegen, in dem die rechtfertigenden Gründe für eine Steuerbelastung für jedermann bewusst werden, die Belastungsprinzipien allgemein verständlich sind und die Einkommensteuer wieder zu ihrer Grundfunktion, die Stärkung des Staatshaushaltes, zurückkehrt [to submit a simple and systematic draft of an income tax law, in which the justification for the tax burden is clear for everyone, the taxation principles are understandable for all and where the income tax again obtains its original function to strengthen the state finances]

Merz/Stolze/Zwick: Microsimulation German Tax Reform 12/106
The simulation of the “Karlsruhe proposal” had to be done with some restrictions. Some of
the reform proposals are not realisable in practise. For example, the taxation of pensions when
they are paid (“nachgelagerte Besteuerung”) could not be represented with the existing data
because this group of individuals was up to now not fully liable for taxation and was therefore
not represented in the data set. Furthermore some income components that were tax free up to
now are now subject to taxation according to the “Karlsruhe proposal”.
Table 3: The “Karlsruhe proposal”‘: Key elements
§ Entry tax rate of 15 % from the first € over the basic tax allowance
§ top income tax rate of 35 % from 27 610 € over the basic tax allowance
§ “Per person basic tax allowance” of 8 181 € per person, incl. children
§ Only one source of income and therewith complete equalisation possibilities for negative income sources
⇒ no minimum taxation (“Mindestbesteuerung”)
§ Rigorous enlargement of the tax base through:
- taxation of capital gain (gain on sale)
- taxation of social security wage substitution benefits (“Lohnersatzleistungen”) like unemployment benefits
(“Arbeitslosengeld”)
- taxation of extra pay for work at night, on Sundays and public holidays
- taxation of 70% of the pension
- No tax exemption for all charitable donations
- No tax exemption for travel expenses for driving between home and workplace
Figure 1 summarizes the marginal taxrates of all tax system alternatives.

Merz/Stolze/Zwick: Microsimulation German Tax Reform 13/106
Figure 1: Alternative Tax Systems in Germany Marginal Taxrates*
15,000
10
0
20
30
40
50
60
30,000 45,000 60,000
Mar
gin
al ta
x in
per
cen
t
Taxable income in Euro
Taxbase 1995 Taxreform 2005
‘Karlsruhe proposal’
53%
42%
35%
* for one person tax units without children
7 General Results
We present our microsimulation results of distributional and redistributional impacts of the New German tax reform in two chapters. Within the first chapter (this chapter 7) we present general results without further breakdowns. In the second chapter (chapter 8) we inspect the tax reform impacts for important socioeconomic groups.
Baseline for all our computations is the situation before the tax reform with the 1995 tax law (Taxbase 1995, or briefly taxbase). Compared to this baseline we analyse the new German tax reform effective since 2000 with its final stage 2005 (Taxreform 2000/2005, or briefly taxreform) and the discussed “Karlsruhe proposal” (Taxproposal ‘Karlsruher Entwurf’, or briefly taxproposal).
The general results are organised in two sections: In the first section (7.1) general results about the overall size of the alternatives’ impacts are discussed. In the second section (7.2) general results about distributional and redistributional impacts of the tax reform alternatives are analysed.
7.1 General results: Overall size of the tax reform alternatives
As mentioned above, the generated individual market income is our general individual gross income to which we compare the specific individual post tax income, our disposable income. Thus, this disposable income according to the tax system considers the tax dues and benefits but does not consider further transfers like unemployment or old age security contributions.

Merz/Stolze/Zwick: Microsimulation German Tax Reform 14/106
The overall market income based on the 1995 baseline data amounts to 1 017 billion €. As can be seen in Figure 2, the resulting overall disposable income of the tax alternatives is quite different to each other with the most tax payments by the 1995 tax system: taxbase with 839 billion € (-178 billion, -17.5%), taxreform with 897 billion € (-120 billion, - 11,8%) and taxproposal with 916 billion € (-101 billion, -9.9%). As a result of the tax reform 2000/2005 the taxes will be cut, when the last stage of the reform is completed, by 58 billion € (taxproposal by 77 billion €) compared to the former tax (baseline) situation, a remarkable tax cut. Thus, the “Karlsruhe proposal” provides the tax payers, compared to the tax reform 2000/2005, an overall 19 billion € higher disposable income.
Figure 2: Alternative Tax Systems in Germany– Overall Market Income and Disposable Income
1017
839
897916
700
750
800
850
900
950
1000
1050
Market income Disposable IncomeTaxbase 1995
Disposable IncomeTaxreform 2000/2005
Disposable IncomeTaxproposal 'Karlsruher
Entwurf'
sum
in b
il. E
uro
Source: Income Tax Statistic 1995, 10% Sample (n=3 mio.), own computations
When interpreting this result, one should bear in mind that not all of the total tax relief is a result of the tax reform 2000. The original data 1995 describes the income situation 1995. Although it is possible to describe the end-situation in 2005, different relief and burden effects overlap each other. For instance, on the relief side the tax exemption of the so called subsistence income is taken into account. This was taken into account 1996 by a substantially higher basic tax exempt amount.10
10 The data for the fourth quarter of 2002 of the wage- and income tax statistic 1998 will allow a more precise separation of the effects.

Merz/Stolze/Zwick: Microsimulation German Tax Reform 15/106
Altogether, both the effective tax reform as well as the “Karlsruhe proposal” cut the government tax revenue by around 60 billion €, a remarkable sum and push for the economy in Germany.
7.2 General results: Distributional and redistributional impacts of the tax reform alternatives
A first impression on how the three different tax laws overall effect the spread of the alternative disposable income is provided in Figure 3 showing the mean and the interquartile range by Box- and Whisker-Plots.
Figure 3: Alternative Tax Systems in Germany– Overall Distributional Impacts: Box-and Whisker-Plots
10000 20000 30000 40000
Taxbase 1995
Taxreform2000/2005
Taxproposal'Karlsruher Entwurf'
Mean Disposable Income [€]
mean
mean
mean
x0.75
x0.75
x0.75
x0.5
x0.5
x0.5
Source: Income Tax Statistic 1995, 10% Sample (n=3 mio.), own computations
The interquartile range with 50% of all earners (tax units) around the median is slightly larger under the effective tax reform and the “Karlsruhe proposal” compared to the taxbase situation indicating a wider disposable income spread by both reform alternatives. Due to the general tax cuts the mean and median of the disposable income are higher than under the former tax system.
A closer look to the general distributional and redistributional results now is based on Table 4 and Figures 4-6.
In Table 4 different measures of inequality of the market (gross) income and the disposal income of the taxbase, the effective taxreform and the “Karlsruhe proposal” (taxproposal) are shown.
Merz/Stolze/Zwick: Microsimulation German Tax Reform 16/106
The overall distributional and redistributional result: compared to the taxbase 1995 situation, both the actual taxreform as well as the “Karlsruhe proposal” result in a more unequal distribution but with no distinct overall effects. With a Gini-coefficient of 0,3917 (+4,0% compared to the taxbase Gini) the “Karlsruhe proposal” shows slightly more inequality than the taxreform itself (+1,8% compared to the taxbase Gini). However, redistributional differences are more pronounced. This is an interesting and generally not expected result because the “Karlsruhe proposal” – in some contrast to the actual taxreform - follows a particular stringent simple and transparent approach. However, and what a microsimulation analysis is able to disentangle in particular, as our further analyses will show, there are remarkable distributional and redistributional differences with regard to single socioeconomic groups.
A brief analysis of the overall market, taxbase, taxreform and taxproposal income distribution by a Kernel density estimation in Figure 4 shows the overall tax cut effects by all tax systems, the disposable income distributions are focused more on lower incomes. The most redistributional impacts has the taxbase 1995 system. In Figure 4 a remarkable peak for very low incomes is visible. A further inspection with the densities of occupational groups in Figure 9 shows that the ‘other income’ source (non labour income e.g. by a predominant income of letting and leasing, of capital gains etc.) is responsible for this low income peak. Many very low incomes, resulting of the special possibility for this group to take into account losses, result in this peak of relative frequent low income.
Measuring the distribution by the Gini-coefficient11 (which is sensitive for the income region with great population density) the differences with regard to the middle income situation are quite low: the taxbase Gini is 0.3768, the taxreform Gini is 0.3837 (+ 1,8%) and the taxproposal Gini is 0.3917 (+ 4,0%).
The Atkinson-Index is calculated for Table 4 with a relative small (ε=1) and a relative high (ε=2) inequality aversion to cover a broad spectrum with a multitude of possible normative evaluations. The Atkinson- index is sensitive to changes in the lower part of the income distribution. The differences between the tax reform alternatives compared are relatively more pronounced with respect to a low inequality aversion (ε=1: taxreform +3,7%, taxproposal + 6,0%; ε=2: taxreform +1,0%, taxproposal +2,3%). Together with the low income sensitivity of the Atkinson- index in general, the relatively low Atkinson- indices above all show some indication for differences between the alternatives’ distributions in their respective upper income parts.
The decile shares describe the relation between the (ten percent) population share and their share of their total income. The differences between the tax alternatives within theses decile shares are neglectable (see also Figure 5 and the cumulative shares by the Lorenz curves in
11 Methodological issues are provided in the Appendix 3

Merz/Stolze/Zwick: Microsimulation German Tax Reform 17/106
Figure 6). Notice, that under all systems only from the seventh decile the income shares are greater than 10%. Notice, too, that -regardless which tax system is considered- they are all far away from an equally distributed disposable income (as the Lorenz-curve show in Fig. 6).
The 90/10 ratio, which is the relation of the upmost 10% to the lowest 10% income share, underlines the disposable income inequality in favour of the rich under all the tax systems with 90/10 ratios between 27 and 30. For the effective taxreform 2000/2005 as well as for the “Karlsruhe proposal” the income share of the richest ten percent is about 29 times higher than the income share of the poorest ten percent.

Merz/Stolze/Zwick: Microsimulation German Tax Reform 18/106
Figure 4: Alternative Tax Systems in Germany– Kernel Estimates
0
0,005
0,01
0,015
0,02
0,025
0,03
0,035
0,04
0,045
0
50000
100000
150000
200000
250000
Income [€]
Density
market income taxbase taxreform taxproposal
Source: Income Tax Statistic 1995, 10% Sample (n=3 mio.), own computations

Merz/Stolze/Zwick: Microsimulation of the German Tax Reform 19/92
Table 4: Alternative Tax Systems in Germany – General Distributional and Redistributional Results
Total in Bill. EURMean in EUR
Median in EUR
Gini-CoeffizientAktinson Index mit ε = 1Aktinson Index mit ε = 2
Theil Index
Decile shares in %and decile limits in EUR
1. Decile 0,9 6 793 1,0 6 707 1,0 6 777 0,9 6 7952. Decile 3,1 14 141 3,6 13 265 3,5 13 956 3,4 13 8193. Decile 4,9 19 694 5,5 17 694 5,4 18 710 5,3 18 7404. Decile 6,3 23 933 6,8 21 095 6,7 22 332 6,6 22 3955. Decile 7,5 27 924 8,0 24 422 7,9 26 012 7,8 26 0286. Decile 8,7 32 474 9,2 28 211 9,2 30 122 9,0 30 1667. Decile 10,2 38 521 10,7 32 976 10,7 35 158 10,5 35 7218. Decile 12,3 46 671 12,6 39 228 12,6 41 683 12,6 42 9479. Decile 15,3 60 508 15,3 49 578 15,2 52 262 15,4 54 23210. Decile 30,8 - 27,3 - 27,9 - 28,4 -
90/10 Relation
R (%)k(EUR) -
-
27,0 29,336,3
0,8436 0,81510,2975
0,8072
Disposable income "Karlsruhe proposal"
Disposable income Taxbase 2000/2005
Distribution
1 017 839 897 916
Measure Market incomeDisposable income Taxbase
1995
30 470 28 497
Redistribution
34 532 27 924 24 422 26 012
0,33140,37680,2869
0,38370,4172
31 081 26 028
0,39170,30420,8255
0,4080 0,3083 0,3326 0,3457
- 1 759- 2 789-8,1
- 2 313-6,7 -5,1
30,2
Source: Income Tax Statistic 1995, 10% Sample (n = 2 934 476; N = 29 444 074), own computations

Merz/Stolze/Zwick: Microsimulation of the German Tax Reform 20/92
Figure 5: Alternative Tax Systems in Germany– Deciles and Change in Deciles Compared to Taxbase 1995
0102030405060708090
100
1 2 3 4 5 6 7 8 9 10
Deciles
Per
cen
tag
e o
f T
ot.
Inco
me
-15%
-10%
-5%
0%
5%
10%
15%
1 2 3 4 5 6 7 8 9 10
Deciles
Rel
. Cha
nge
(Tax
refo
rm 2
005)
-15%
-10%
-5%
0%
5%
10%
15%
1 2 3 4 5 6 7 8 9 10
Deciles
Rel
. Ch
ang
e (T
axp
rop
osa
l Kar
lsr.
)
Source: Income Tax Statistic 1995, 10% Sample (n=3 mio.), own computations

Merz/Stolze/Zwick: Microsimulation of the German Tax Reform 21/92
Figure 6: Alternative Tax Systems in Germany– Lorenz-Curves
0
10
20
30
40
50
60
70
80
90
100
0 10 20 30 40 50 60 70 80 90 100
Percentage of Population
Per
cen
tag
e o
f D
isp
osa
ble
Inco
me
Taxbase1995
Taxreform2000/2005
Taxproposal'Karlsruher Entwurf'
Source: Income Tax Statistic 1995, 10% Sample (n=3 mio.), own computat ions
Redistributional impacts
One important aspect of any tax system is its redistributional impact. Comparing the market income distribution with the disposable income distribution of the different tax systems the Gini coefficient differences (taxbase –9.7%, taxreform –8%, taxproposal –6.1%) and the 90/10 relation differences (taxbase –25.6%, taxreform –19.3%, taxproposal –18.6%) already indicate less redistributional impacts by both alternatives.
A closer look with an overall redistributional and easily interpretable measure is given by Blackburn’s 1989 k-measure. Blackburn considers a simple redistributive scheme: to every income unit below the median level of income an equal-sized, lump sum tax, is applied while transferring the value of the lump-sum tax to every unit above the median (or vice versa). The redistributional effect, the impact here of the taxation system, is that value of the lump-sum as

Merz/Stolze/Zwick: Microsimulation of the German Tax Reform 22/92
a percentage of the mean level of before tax income. As Blackburn (1989) has shown the respective index partitioning is valid only for the Gini-coefficient resulting in
(1) R = k/mean before tax = 2(Gini after tax - Gini before tax)
With the market income as the before tax income and the respective disposable income of the tax system under consideration as the after tax the redistributional impacts of the German tax system and alternatives are as follows: R% as the percentage of mean market income, or equivalent k EUR, is the lump-sum necessary to make the disposable income distribution equally distributed (same inequality index) as the market ('gross') income: Taxbase R = -8.1% (k = -2 790 EUR), taxreform R = -6,7% (k = -2 316 EUR), taxproposal R= -5.1% (k = -1 759 EUR) is the necessary amount every person above the median had to transfer to the persons below the median to achieve the same distributional measure before and after.
Thus, though both alternatives have less redistributional impacts than the former taxbase 1995 system, the taxreform shows a higher redistribution than the taxproposal.
8 Results for socioeconomic groups
With our previous analyses we take in our mind that the income situation improves markedly by the effective taxreform and the taxproposal compared to the former system. In addition we saw no distinct distributional differences between the tax reform alternatives (taxreform and taxproposal) compared to the former taxbase 1995. However, redistributional differences between the alternatives are more pronounced.
The question now is how the two approaches – tax reform 2000/2005 and “Karlsruhe proposal” – will effect the distribution and redistribution of their higher disposable income for single socioeconomic groups.
The socioeconomic groups’ effects analysis is organised as follows:
Section 8.1 defines the socioeconomic groups under investigation.
Section 8.2 analyses the tax burden impacts for important socioeconomic groups. There and in the following sections, in the upper part of each socioeconomic group’s resulting figure an impression of the respective overall size of a baseline simulation (the 1995 tax law) item is given. In the lower part or each socioeconomic group and for the two tax alternatives – the 2000/2005 new German tax reform and the “Karlsruhe proposal” – the relative differences (in %) compared to the baseline simulation are shown.
Section 8.3 section quantifies the disposable income impacts for socioeconomic groups.
Section 8.4 discusses the distributional impacts for socioeconomic groups by important distributional measures like the Gini-coefficient and decile shares with their Lorenz curves.

Merz/Stolze/Zwick: Microsimulation of the German Tax Reform 23/92
Section 8.5 analyses the decomposition of inequality with inequality shares and contributions of each of the socioeconomic groups’ breakdowns to the overall inequality of the respective socioeconomic group by the Shorrocks decomposition of the Theil measure based on a generalised entropy approach.
Section 8.6 finally presents the redistributional effects of the three tax systems by the concise Blackburn redistributional measure. Appendix 4 provides all socioeconomic group’s single numerical results.
8.1 Defining socioeconomic groups
For the structural analysis the total population of the roughly 30 million taxpayers are divided in various socioeconomic groups. As important groups, both in the sense of their general societal and economic role and importance as well as targeted groups, we consider breakdowns by occupation, gender and family type.
Since the income tax statistic in general is the most suitable source (compared to other data bases) to investigate the situation of the self-employed on the micro level (see Merz 2000a), within the occupational breakdown, in particular, we further investigate and divide the self-employed not only by entrepreneurs and by professions (freelancers, liberal professions, “Freie Berufe”), but also more deeply the group of professions itself. The predominant income source will define an according occupation for a tax unit.
Occupation
The occupational groups were divided according to the 1995 predominant income – out of possible multiple income sources within a year - of the tax payer. Altogether we distinguish between the self-employed, the employees and others (with predominant income from capital gains, lease- and rent- income or other income (“Sonstige Einkünfte”) according to § 2 I EStG) with four occupations:
• Professions (“Freiberufler”) • Entrepreneurs (and other self-employed12 (“Gewerbetreibende und Sonstige
Selbstständige”)) • Employees (“Abhängig Beschäftigte”) • Others („Sonstige Einkünfte“)
Professions Professions are a prominent part of the self-employed. Ranging from the traditional professions like doctors, architects, lawyers, tax advisors, journalists, writers and authors, artists and designers, to the new professions like information brokers and environmental consultants. Professions have a far-reaching impact and influence on everybody as well as on
12 Individuals with profit-income but not part of the professions

Merz/Stolze/Zwick: Microsimulation of the German Tax Reform 24/92
the economy and the society as a whole. They produce high-quality goods like healthcare and law, they protect individual freedom (through lawyers and journalists) and they have a special importance for the labour market and the economic processes.
In contrast to other countries13, in Germany freelance work, work by professions, is defined by the legal framework according to §18 Abs. 1 Nr. 1 Satz 2 EstG (Income tax law). As so-called ‘catalogue professions’ (“Katalogberufe”) there they are explicitly defined. A key element of what is termed a profession are self-employed activities concerned with science, art, writing, teaching, instructing or education. 14
Alongside these definitions further socioeconomic attempts have been made to describe, classify and investigate professions. Examples are Deneke (1956, 1986), Büschges (1989), Sahner (1989) or Merz, Rauberger and Rönnau (1994), Merz (2000a) which all have analysed the particular scope, ‘mission’ of professions and societal and economic relevance.
For our analyses we consider the following six groups of professions (distinguished according to the ‘trade code’ (“Gewerbekennzahl”) out of approximately 420 000 professions in the Income Tax Statistic:
• Medical professions (“Heilkundliche Berufe”) • Law- and business management-consultants (“Rechts- und Wirtschaftsberatende
Berufe”) • Technical and scientific professions (“Technische und naturwissenschaftliche Berufe”) • Education and translation professions (“Pädagogische und übersetzende Berufe”) • Journalists and artists (“Publizistische und künstlerische Berufe”) • Other professions (“sonstige Freie Berufe”)
Because of the high degree of heterogeneity of “Other Professions” they will be considered in our further analyses rather as a remainder than as in detail.
13 Professions, Liberal Professions, Freelancers (Freie Berufe): Definition of the Court of Justice of the
European Communities: The liberal professions just recently mentioned in Annex F(2) to the Sixth Directive 77/388 are activities which involve a marked intellectual character, require a high-level qualification and are usually subject to clear and strict professional regulation. In the exercise of such an activity, the personal element is of special importance and such exercise always involves a large measure of independence in the accomplishment of the professional activities. Source: Judgement of the Court of Justice of the European Communities (Second Chamber), 11 October 2001, case number C-267/99, Christiane Adam ./. Admisnistration de l’enregistrement et des domaines, on the interpretation of Annex F(2) of the Sixth Council Directive (77/388/EEC) of May 1977 on the harmonisation of the laws of the member States relating to turnover taxes – Common system of value added tax: uniform basis of assessment (OJ 1977 L 145, p.1).
14 The tax law in particular (as “Katalogberufe”) describe self-employed professional activities as activities of medical doctors, dentists, veterinarians, lawyers, notaries, patent attorneys, surveying engineers, engineers, architects, trade chemists, auditors (public accountants), tax consultants, consulting economists and business administrators, sworn in auditors, authorised tax agents (Steuerbevollmächtigte), nonmedical practitioners, physiotherapists, journalists, translators, pilots and similar professions (“ähnliche Berufe”).
For the ‘similar professions’, next to being self-employed and self-responsible, it has been decided by the courts that further elements for classification of professions are an individual specialised knowledge of the subject at hand, practising at own risk and on own account. Hereby it is permissible to for the professional to also make use of services supplied by a third party (like an assistant working under a dentist, for instance).

Merz/Stolze/Zwick: Microsimulation of the German Tax Reform 25/92
Gender Though gender might not be an explicit but an implicit target with regard to labour market opportunities and the family situation, we have a look to those implicit impacts of the tax alternatives. Because only in the case of a one person tax unit (and not in the case of a common taxation (“Gemeinsame Veranlagung, Splittingtabelle”) the gender of a tax unit can be detected. In Germany, 1995 there are about 13 million (out of a total of ca. 30 million) one person tax units in the 1995 Income Tax Statistic.
Family type
The family structure, at least targeted via the explicit consideration for children in the tax alternatives, will be a further socioeconomic breakdown in our analyses. Though the tax unit naturally is in the focus of the Income Tax Statistic, we are able to approximate a family type with the help of parameters of one person tax units, common assessed tax units, as well as child tax exemption amounts (“Kinderfreibeträge”) in general. We consider the following five family types:
• Single without a child (one person tax unit without children)
• Single with children (one person tax unit with children)
• Married couple without a child
• Married couple with one child
• Married couple with more than one child.
Because child tax exemption amounts are not bound to the place of residence and can be transferred in the case of divorced couples, possible distortions are possible by our procedure. Furthermore, children living in the household can also be eligible to pay tax by themselves resulting as separate tax units.
8.2 Tax burden impacts of tax reform alternatives for socioeconomic groups
An overview about the tax burden for the tax reform alternatives divided by the above mentioned four socio-economic groups formed are provided by Table 5. Compared to the taxbase situation before the reform, the overall tax burden according the taxreform and the “Karlsruhe proposal” with their relative difference to the baseline tax burden are shown in that table.

Merz/Stolze/Zwick: Microsimulation of the German Tax Reform 26/92
Table 5: Alternative Tax Systems in Germany– Overall Taxes by Socioeconomic Breakdowns
Taxbase 1995bil. € bil. € Difference1
bil. € Difference1
All 178 120 -32,8 % 111 -37,4 %
OccupationProfessions 7 5 -23,1 % 5 -30,8 %Entrepreneurs 33 21 -35,9 % 19 -42,2 %Employees 131 88 -33,1 % 73 -44,4 %Others 6 5 -16,7 % 5 -25,0 %
Professionsmedical 3,9 3,1 -21,4 % 2,6 -32,8 %legal and economic advisors 1,1 0,9 -21,1 % 0,8 -30,0 %technical and scientific 1,1 0,9 -21,5 % 0,8 -30,7 %pedagogic and translating 0,2 0,1 -30,0 % 0,1 -36,4 %publicistic and artistical 0,3 0,2 -24,1 % 0,2 -32,6 %
GenderMen 35 25 -29,4 % 23 -33,8 %Women 20 14 -32,5 % 13 -35,0 %
Family-TypeSingle 49 35 -29,2 % 33 -32,8 %Single /w children 5 3 -40,0 % 3 -49,1 %Married couple 46 31 -32,2 % 31 -32,2 %Married couple /w one child 31 20 -33,3 % 15 -50,1 %Married couple /w two or more children 46 29 -36,0 % 18 -59,6 %
TaxesTaxreform2000/2005
Taxproposal'Karlsruher Entwurf'
1 Taxalternative-Taxbase in percent
Source: Income Tax Statistic 1995, 10% Sample (n=3 mio.), own computations
Occupation: Compared to the taxbase all occupational groups gain more from the taxproposal than from the taxreform. Next to others, Professions remarkably gain less tax cuts than entrepreneurs and employees for the taxreform as well as for the taxproposal. One reason certainly is the different trade tax treatment of the entrepreneurs (trade tax) and the professions (no trade tax) and all the income differences now shown by our factual incidence analysis.
Professions: there are remarkable differences in the tax gain structure of different professional occupations in both alternatives (taxreform and taxproposal). However, in both alternatives medical professions, which encompass almost 50% of all professions, as well as pedagogic and translating professions gain the most by the new tax reform alternatives.

Merz/Stolze/Zwick: Microsimulation of the German Tax Reform 27/92
Gender: More than one third of all taxes under consideration are paid by women. Though this relation holds on for the tax alternatives it is shown, that women in relative terms profit by the tax alternatives more than men. Note, according to gender only one person tax units could be considered.
Family type: It is evident, that both, the effective tax reform as well as the “Karlsruhe proposal” is in favour for consideration of children. Singles and married couples with children have a greater tax reduction in both alternatives than singles and married couples without children. In the “Karlsruhe proposal” this reduction is even larger and larger than approximately 50% of the taxbase burden. Naturally, the children effect is accompanied by all the different family income situations and is now shown by our factual incidence analysis.
Taxrate impacts for socioeconomic groups
In addition to the discussed mean tax burden of Table 5 we now investigate the mean taxrates resulting of the tax reform alternatives for socioeconomic groups. Table 6 provides the numerical overview.
Merz/Stolze/Zwick: Microsimulation of the German Tax Reform 28/92
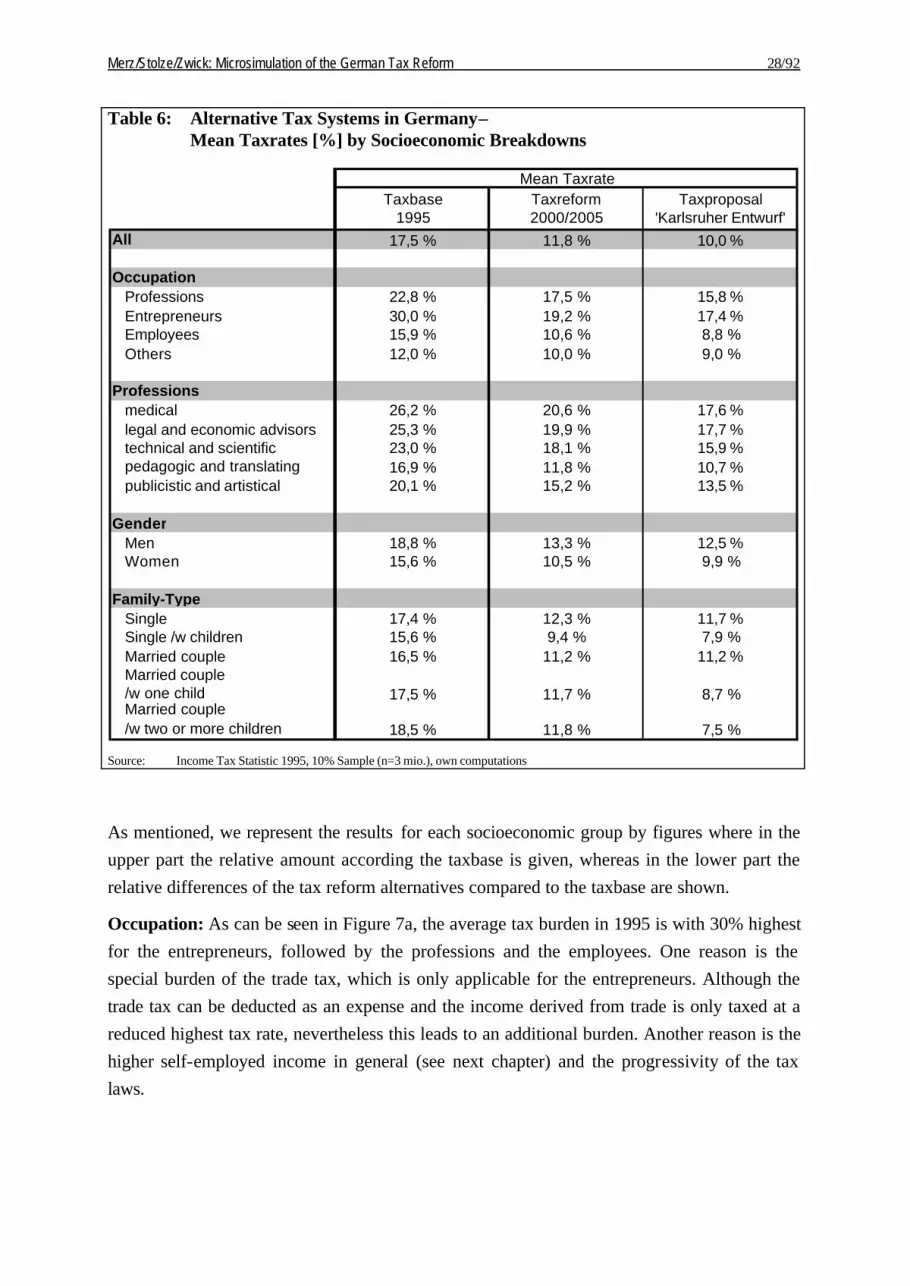
Table 6: Alternative Tax Systems in Germany– Mean Taxrates [%] by Socioeconomic Breakdowns
Taxbase1995
Taxreform2000/2005
Taxproposal'Karlsruher Entwurf'
All 17,5 % 11,8 % 10,0 %
OccupationProfessions 22,8 % 17,5 % 15,8 %Entrepreneurs 30,0 % 19,2 % 17,4 %Employees 15,9 % 10,6 % 8,8 %Others 12,0 % 10,0 % 9,0 %
Professionsmedical 26,2 % 20,6 % 17,6 %legal and economic advisors 25,3 % 19,9 % 17,7 %technical and scientific 23,0 % 18,1 % 15,9 %pedagogic and translating 16,9 % 11,8 % 10,7 %publicistic and artistical 20,1 % 15,2 % 13,5 %
GenderMen 18,8 % 13,3 % 12,5 %Women 15,6 % 10,5 % 9,9 %
Family-TypeSingle 17,4 % 12,3 % 11,7 %Single /w children 15,6 % 9,4 % 7,9 %Married couple 16,5 % 11,2 % 11,2 %Married couple /w one child 17,5 % 11,7 % 8,7 %Married couple/w two or more children 18,5 % 11,8 % 7,5 %
Mean Taxrate
Source: Income Tax Statistic 1995, 10% Sample (n=3 mio.), own computations
As mentioned, we represent the results for each socioeconomic group by figures where in the upper part the relative amount according the taxbase is given, whereas in the lower part the relative differences of the tax reform alternatives compared to the taxbase are shown.
Occupation: As can be seen in Figure 7a, the average tax burden in 1995 is with 30% highest for the entrepreneurs, followed by the professions and the employees. One reason is the special burden of the trade tax, which is only applicable for the entrepreneurs. Although the trade tax can be deducted as an expense and the income derived from trade is only taxed at a reduced highest tax rate, nevertheless this leads to an additional burden. Another reason is the higher self-employed income in general (see next chapter) and the progressivity of the tax laws.

Merz/Stolze/Zwick: Microsimulation of the German Tax Reform 29/92
Figure 7a: Alternative Tax Systems in Germany– Mean Taxrates [%] and Changes in Taxrates compared to Taxbase 1995 Occupation
22,8 %
30,0 %
15,9 %
12,0 %
0%
5%
10%
15%
20%
25%
30%
35%
Professions Entrepreneurs Employees Others
Tax
rate
[%
]
-5,3
-10,8
-5,3
-2,0
-7,0
-12,7
-7,0
-3,0
-20,0
-16,0
-12,0
-8,0
-4,0
0,0
4,0
8,0
Professions Entrepreneurs Employees Others
Ch
ang
e in
Tax
rate
[p
erce
nta
ge
po
ints
]
Taxreform2000/2005
Taxproposal'Karlsruher Entwurf'
Source: Income Tax Statistic 1995, 10% Sample (n=3 mio.), own computations
The tax relief resulting from the tax reform 2000/2005 and the “Karlsruhe proposal” especially benefits the entrepreneurs. The fact that the trade tax is being considered for the largest part in the calculation of the income tax in the tax reform 2000/2005 already leads to a fairly large tax relief. That the trade tax is not totally compensated becomes evident when compared to the “Karlsruhe proposal”. The further tax relief here is a result of the total abolishment of the trade tax.
Professions and employees participate nearly equally from the changes made to the tax system. The further gain from the “Karlsruhe proposal” for the employees can be explained by the significant rise in the child tax exemption amounts. These have a greater effect in the

Merz/Stolze/Zwick: Microsimulation of the German Tax Reform 30/92
lower income groups as in those with higher income, because not used tax exemption amounts are counterbalanced by a further child allowance. Furthermore it can be presumed that families with children will more likely be part of the employee group and that this group therefore profits above average from the tax exempt amounts proposed by the “Karlsruhe proposal” (see the family type discussion).
Figure 7b:Alternative Tax Systems in Germany– Mean Taxrates [%] and Changes in Taxrates compared to Taxbase 1995 Professions
26,2 % 25,3 %23,0 %
16,9 %20,1 %
0%
5%
10%
15%
20%
25%
30%
medical legal andeconomicadvisors
technical andscientific
pedagogicand
translating
publicisticand artistical
Tax
rate
(%
)
-5,6 -5,3 -5,0 -5,1 -4,8-8,6 -7,6 -7,1 -6,1 -6,5
-20,0
-16,0
-12,0
-8,0
-4,0
0,0
4,0
8,0
medical legal andeconomicadvisors
technical andscientific
pedagogicand
translating
publicisticand artisticalC
han
ge
in T
axra
te [
per
cen
tag
e p
oin
ts]
Taxreform2000/2005
Taxproposal'Karlsruher Entwurf'
Source: Income Tax Statistic 1995, 10% Sample (n=3 mio.), own computations
Professions: With regard to overall professions both tax reform alternatives show no difference in reducing the taxrate. However, as it is shown in Figure 7b, the mean tax rates are quite different from 26,2% for medical professions to 16,9% for pedagogic and translating

Merz/Stolze/Zwick: Microsimulation of the German Tax Reform 31/92
professions. This is certainly a result of different income levels (see next chapter) and the progressiveness of the tax systems.
Figure 7c: Alternative Tax Systems in Germany– Mean Taxrate [%] and Changes in Taxrates compared to Taxbase 1995 Gender
18,8 %
15,6 %
0%
2%
4%
6%
8%
10%
12%
14%
16%
18%
20%
Men Women
Tax
rate
(%
)
-5,5 -5,1-6,4 -5,7
-20,0
-16,0
-12,0
-8,0
-4,0
0,0
4,0
8,0
Men Women
Ch
ang
e in
Tax
rate
[p
erce
nta
ge
po
ints
]
Taxreform2000/2005
Taxproposal'Karlsruher Entwurf'
Source: Income Tax Statistic 1995, 10% Sample (n=3 mio.), own computations
Gender: Because of the progressive nature of the tax rates and the higher income for men than for women (see next chapter) the average tax rate for women (15.6%) is lower than for men (18,8%). The tax alternatives’ results indicate that a broadening of the tax base affect men and women equally. Both benefit from the reduction in the tax rates, however because in the average men have a higher tax rate in the initial situation, they benefit slightly more by the tax alternatives.

Merz/Stolze/Zwick: Microsimulation of the German Tax Reform 32/92
Figure 7d:Alternative Tax Systems in Germany– Mean Taxrates [%] and Changes in Taxrates compared to Taxbase 1995 Family-Type
17,4 %
15,6 %
16,5 %
17,5 %
18,5 %
14%15%15%16%16%17%17%18%18%19%19%
Single Single /wchildren
Marriedcouple
Marriedcouple
/w one child
Marriedcouple
/w two ormore children
Tax
rate
(%
)
-5,1 -6,3 -5,3 -5,8 -6,6-5,7-7,7
-5,3-8,8
-11,0
-20,0-16,0-12,0-8,0-4,00,04,08,0
Single Single /wchildren
Marriedcouple
Marriedcouple
/w one child
Marriedcouple
/w two ormore children
Ch
ang
e in
Tax
rate
[p
erce
nta
ge
po
ints
]
Taxreform2000/2005
Taxproposal'Karlsruher Entwurf'
Source: Income Tax Statistic 1995, 10% Sample (n=3 mio.), own computations
Family type: The mean taxrates for all the family types only varies between 15,6% (single with children) and 18,5% (married couple with children). As discussing the tax burden above the “Karlsruhe proposal” relieves in particular families with children with most gains for married couples.
Altogether: The microsimulation analyses of the tax reform impacts according the tax burden and mean taxrate have shown remarkable different tax burden impacts for the above

Merz/Stolze/Zwick: Microsimulation of the German Tax Reform 33/92
socioeconomic groups. The results of factual incidence show the joint effects of different tax systems as well as different living conditions with different earned income.
8.3 Disposable income impacts of the tax reform alternatives for socioeconomic groups
Before we discuss the distributional and redistributional impacts of the tax reform alternatives we characterise a central measure of income location by presenting the respective mean disposable incomes for the socioeconomic groups. As it is evident, the discussion of the alternatives’ impact on the disposable income is mirroring the above discussion of the tax burden and the taxrate. Thus we are very short in describing the details without further reasoning.
The overview in Table 7 shows the absolute and relative changes of the disposable income compared to the taxbase 1995 for the socioeconomic groups.

Merz/Stolze/Zwick: Microsimulation of the German Tax Reform 34/92
Table 7: Alternative Tax Systems in Germany– Mean Disposable Income by Socioeconomic Breakdowns
Taxbase1995
€ € % € %All 28 497 + 1 973 + 6,9 % + 2 584 + 9,1 %
Occupation
Professions 52 933 + 3 716 + 7,0 % + 5 508 + 10,4 %Entrepreneurs 37 958 + 5 832 + 15,4 % + 6 804 + 17,9 %Employees 28 495 + 1 786 + 6,3 % + 2 394 + 8,4 %Others 17 250 + 494 + 2,9 % + 650 + 3,8 %
Professions medical 81 805 + 6 216 + 7,6 % + 9 722 + 11,9 %legal and economic advisors 61 239 + 4 372 + 7,1 % + 6 285 + 10,3 %technical and scientific 50 922 + 3 288 + 6,5 % + 4 658 + 9,1 %pedagogic and translating 23 377 + 1 407 + 6,0 % + 1 696 + 7,3 %publicistic and artistical 23 357 + 1 464 + 6,3 % + 1 858 + 8,0 %
Gender
Men 38 904 + 2 800 + 7,2 % + 4 132 + 10,6 %Women 40 327 + 3 288 + 8,2 % + 5 413 + 13,4 %
Family-Type
Single 18 172 + 1 149 + 6,3 % + 1 263 + 6,9 %Single /w children 21 126 + 1 334 + 6,3 % + 1 908 + 9,0 %Married couple 35 266 + 2 252 + 6,4 % + 2 285 + 6,5 %Married couple /w one child 38 904 + 2 800 + 7,2 % + 4 132 + 10,6 %Married couple /w two or more children 40 327 + 3 288 + 8,2 % + 5 413 + 13,4 %
Mean Disposable IncomeTaxreform2000/2005
Taxproposal'Karlsruher Entwurf'
Difference to Taxbase Difference to Taxbase
Source: Income Tax Statistic 1995, 10% Sample (n=3 mio.), own computations
The overall mean gain from the effective tax reform is 1 973 € (6,9%) and even higher from the “Karlsruhe proposal” with 2 584 € (9,1%) compared to the taxbase 1995. However, there is a wide spread according the mean disposable income over the socioeconomic groups.
Occupation: Professions earn the most: with 52 933 € their mean disposable income is almost two times as high than the employees’ income (Figure 8a). The mean entrepreneur’s disposable income with 37 958 € is between the employee’s mean income (28 495 €) and the professions’ mean income (52 933 €). Entrepreneurs gain the most of the reform alternatives.
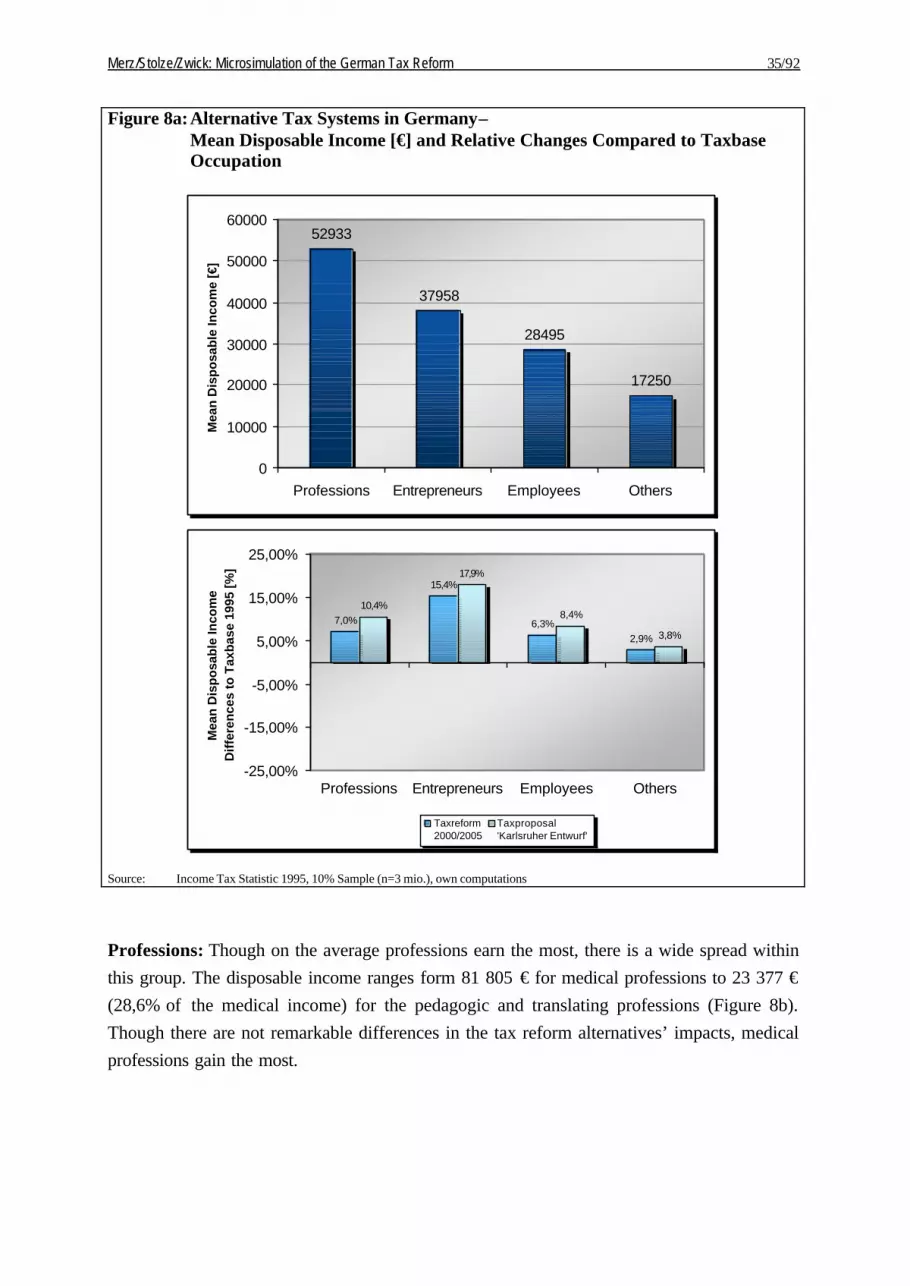
Merz/Stolze/Zwick: Microsimulation of the German Tax Reform 35/92
Figure 8a: Alternative Tax Systems in Germany– Mean Disposable Income [€] and Relative Changes Compared to Taxbase Occupation
52933
37958
28495
17250
0
10000
20000
30000
40000
50000
60000
Professions Entrepreneurs Employees Others
Mea
n D
isp
osa
ble
Inco
me
[€]
7,0%
15,4%
6,3%2,9%
10,4%
17,9%
8,4%
3,8%
-25,00%
-15,00%
-5,00%
5,00%
15,00%
25,00%
Professions Entrepreneurs Employees Others
Mea
n D
isp
osa
ble
Inco
me
Dif
fere
nce
s to
Tax
bas
e 19
95 [
%]
Taxreform2000/2005
Taxproposal'Karlsruher Entwurf'
Source: Income Tax Statistic 1995, 10% Sample (n=3 mio.), own computations
Professions: Though on the average professions earn the most, there is a wide spread within this group. The disposable income ranges form 81 805 € for medical professions to 23 377 € (28,6% of the medical income) for the pedagogic and translating professions (Figure 8b). Though there are not remarkable differences in the tax reform alternatives’ impacts, medical professions gain the most.

Merz/Stolze/Zwick: Microsimulation of the German Tax Reform 36/92
Figure 8b:Alternative Tax Systems in Germany– Mean Disposable Income [€] and Relative Changes Compared to Taxbase Professions
81805
61239
50922
23377 23357
0
10000
20000
30000
40000
50000
60000
70000
80000
90000
medical legal andeconomicadvisors
technicaland
scientific
pedagogicand
translating
publicisticand
artistical
Mea
n D
isp
osa
ble
Inco
me
[€]
7,6% 7,1% 6,5% 6,0% 6,3%
11,9% 10,3% 9,1%7,3% 8,0%
-25,00%
-15,00%
-5,00%
5,00%
15,00%
25,00%
medical legal andeconomicadvisors
technicaland
scientific
pedagogicand
translating
publicisticand
artistical
Mea
n D
isp
osa
ble
Inco
me
Dif
fere
nce
s to
Tax
bas
e 19
95 [
%]
Taxreform2000/2005
Taxproposal'Karlsruher Entwurf'
Source: Income Tax Statistic 1995, 10% Sample (n=3 mio.), own computations
Gender: Men’s mean disposable income is about 19 455 € compared to 17 237 €. Because here only single tax payers are considered, it might be expected that the difference is not very distinct (Figure 8c). The tax reform alternatives accordingly show no distinct different impacts, though the gain is slightly higher for men.

Merz/Stolze/Zwick: Microsimulation of the German Tax Reform 37/92
Figure 8c: Alternative Tax Systems in Germany– Mean Disposable Income [€] and Relative Changes Compared to Taxbase Gender
19455
17237
16000
16500
17000
17500
18000
18500
19000
19500
20000
Men Women
Mea
n D
isp
osa
ble
Inco
me
[€]
7% 6%7,8% 6,4%
-25,00%
-15,00%
-5,00%
5,00%
15,00%
25,00%
Men Women
Mea
n D
isp
osa
ble
Inco
me
Dif
fere
nce
s to
Tax
bas
e 19
95 [
%]
Taxreform2000/2005
Taxproposal'Karlsruher Entwurf'
Source: Income Tax Statistic 1995, 10% Sample (n=3 mio.), own computations
Family type: Mean disposable income ranges from 40 327 € for married couples with children up to singles with 18 172 € (Figure 8d). Again the different treatment of the tax systems with child allowances and child tax exempt amounts is effective. Furthermore the combined earnings of couples leads to a higher average income compared to single tax payers. The “Karlsruhe proposal” not only is in favour for families with children but slightly increases the disposable income of singles as well.

Merz/Stolze/Zwick: Microsimulation of the German Tax Reform 38/92
Figure 8d:Alternative Tax Systems in Germany– Mean Disposable Income [€] and Relative Changes Compared to Taxbase By Family-Type
1817221126
3526638904 40327
05000
1000015000200002500030000350004000045000
Single Single /wchildren
Marriedcouple
Marriedcouple
/w one child
Marriedcouple
/w two ormore
children
Mea
n D
isp
osa
ble
Inco
me
[€]
6,3% 6,3% 6,4% 7,2% 8,2%9,0%6,5%
10,6%13,4%
6,9%
-25,00%
-15,00%
-5,00%
5,00%
15,00%
25,00%
Single Single /wchildren
Marriedcouple
Marriedcouple /w onechild
Marriedcouple
/w two ormore
children
Mea
n D
isp
osa
ble
Inco
me
Dif
fere
nce
s to
Tax
bas
e 19
95 [
%]
Taxreform2000/2005
Taxproposal'Karlsruher Entwurf'
Source: Income Tax Statistic 1995, 10% Sample (n=3 mio.), own computations
8.4 Distributional impacts of the tax reform alternatives for socioeconomic groups
Now, let us consider the distributional effects concerning our socioeconomic group measured by the Gini-coefficient and further by decile shares and the respective Lorenz curve with its cumulative income and population shares. 15
15 For methodological issues see e.g. Cowell 1995

Merz/Stolze/Zwick: Microsimulation of the German Tax Reform 39/92
Occupation
The remarkable distributional differences of the market and the tax alternatives’ disposable income distribution are visible with the respective kernel density estimations in Figure 9. Higher income frequencies for the self-employed compared to the employees are even different between the professions and the entrepreneurs. The statistical measures are quantifying the differences more precisely: The self-employed disposable income is distinctly more unequally distributed than the employees’ income. Since the Gini-coefficient is quite sensitive (sensitive especially to the mid range of income) this difference between the Gini-coefficients from .53 to .32 is quite remarkable (Figure 10a). Almost no difference is given in between the self-employed: professions and entrepreneurs show almost the same overall inequality.
The tax reform 2000/2005 as well as the “Karlsruhe proposal” lead to a stronger differentiation of the disposable income. Especially the disposable income of the entrepreneurs spreads far more widely; the Gini-coefficient rises by 8.4% (taxproposal) respective by 6.6% (taxreform). The reason behind this is the abolishment of the trade tax. There is almost no effect for employees by the tax reform; however the Gini coefficient is increased by 2.8% by the taxproposal. There are some effects for the professions in rising their income spread. Thus, both tax reform alternatives (taxreform and taxproposal) are spreading the disposable income of the self-employed even if there is no influence of the trade tax treatment.
Decile shares allow a closer look to the distribution. They show the sha re of total income a respective ten percent population share was able to earn. With Figure 10b and the respective Lorenz curves from Figure 10c it will become evident, that the richest ten percent in particular for the self-employed are responsible for the ir pronounced income inequality.
The effective tax reform as well as the “Karlsruhe proposal” in particular rise the disposable income of the richest ten percent whereas the other ninety percent – in relative terms – are diminished. The effect is more pronounced for the taxproposal than the taxreform and in particular pronounced for the entrepreneurs. And, the effects are different and of less magnitude for employees. For employees the taxreform as well the taxproposal decile changes are zero or just positive form the 3rd decile on.

Merz/Stolze/Zwick: Microsimulation of the German Tax Reform 40/92
Figure 9: Alternative Tax Systems in Germany– Kernel Estimates
Professions
0
0,005
0,01
0,015
0,02
0,025
0,03
0,035
0,04
0,045
050
000
100000
150000
200000
250000
Income [€]
Density
market income taxbase taxreform taxproposal
Entrepreneurs
0
0,005
0,01
0,015
0,02
0,025
0,03
0,035
0,04
0,045
0
50000
100000
150000
200000
250000Income [€]
Density
market income taxbase taxreform taxproposal
Source: Income Tax Statistic 1995, 10% Sample (n=3 mio.), own computations

Merz/Stolze/Zwick: Microsimulation of the German Tax Reform 41/92
Figure 9: Alternative Tax Systems in Germany– Kernel Estimates (continued)
Employees
0
0,005
0,01
0,015
0,02
0,025
0,03
0,035
0,04
0,045
0
50000
1000
00
150000
2000
00
250000
Income [€]
Density
market income taxbase taxreform taxproposal
Others
0
0,02
0,04
0,06
0,08
0,1
0,12
0,14
0,16
0,18
0,2
0
50000
100000
150000
200000
250000
Income [€]
Density
market income taxbase taxreform taxproposal
Source: Income Tax Statistic 1995, 10% Sample (n=3 mio.), own computations

Merz/Stolze/Zwick: Microsimulation of the German Tax Reform 42/92
Figure 10a: Alternative Tax Systems in Germany– Gini-Coefficient and Relative Change in Gini-Coefficient Compared to
Taxbase 1995 Occupation
0,53
0,55
0,32
0,63
0,00 0,10 0,20 0,30 0,40 0,50 0,60 0,70
Professions
Entrepreneurs
Employees
Others
Gini Coefficient
1,2%
6,6%
0,2%
1,1%
2,9%
8,4%
2,8%
1,6%
-25,0% -20,0% -15,0% -10,0% -5,0% 0,0% 5,0% 10,0% 15,0% 20,0% 25,0%
Professions
Entrepreneurs
Employees
Others
Change in Gini Coefficient [%]
Taxreform2000/2005
Taxproposal'Karlsruher Entwurf'
Source: Income Tax Statistic 1995, 10% Sample (n=3 mio.), own computations

Merz/Stolze/Zwick: Microsimulation of the German Tax Reform 43/92
Figure 10b: Alternative Tax Systems in Germany– Deciles and Change in Deciles Compared to Taxbase 1995 Occupation
0102030405060708090
100
1 2 3 4 5 6 7 8 9 10
Deciles
Per
cen
tag
e o
f T
ot.
Inco
me
Professions Entrepreneurs Employees Others
-20%
-15%-10%
-5%
0%
5%10%
15%
20%
1 2 3 4 5 6 7 8 9 10
Deciles
Rel
. Ch
ang
e
Professions Entrepreneurs Employees Others
-20%
-15%-10%
-5%0%
5%
10%
15%
20%
1 2 3 4 5 6 7 8 9 10
Deciles
Rel
. Ch
ang
e
Professions Entrepreneurs Employees Others
Source: Income Tax Statistic 1995, 10% Sample (n=3 mio.), own computations

Merz/Stolze/Zwick: Microsimulation of the German Tax Reform 44/92
Figure 10c: Alternative Tax Systems in Germany– Lorenz-Curves in Taxbase 1995 Occupation
0
20
40
60
80
100
0 10 20 30 40 50 60 70 80 90 100
Percentage of Population
Per
cen
tag
e o
f Dis
po
sab
le In
com
e
Professions
Entrepreneurs
Employees
Others
Source: Income Tax Statistic 1995, 10% Sample (n=3 mio.), own computations
Professions
Again, the picture is heterogeneous within the heterogeneous group of professions (Figure 11a).
Decile shares: there are no distinct differences with regard to the decile shares of the taxbase situation for the various professional groups (Figure 11b and Figure 11c). The effects of the “Karlsruhe proposal” are more pronounced in their magnitude but in a similar tendency over all deciles compared to the tax reform 2000/2005.

Merz/Stolze/Zwick: Microsimulation of the German Tax Reform 45/92
Figure 11a: Alternative Tax Systems in Germany– Gini-Coefficient and Relative Change in Gini-Coefficient Compared to
Taxbase 1995 Professions
0,45
0,44
0,47
0,46
0,54
0,00 0,10 0,20 0,30 0,40 0,50 0,60
medical
legal and economicadvisors
technical and scientific
pedagogic andtranslating
publicistic andartistical
Gini Coefficient
1,5%
1,7%
1,1%
1,0%
1,0%
3,0%
3,8%
3,1%
2,7%
2,5%
-25,0%
-20,0%
-15,0%
-10,0% -5,0% 0,0% 5,0% 10,0% 15,0% 20,0% 25,0%
medical
legal and economic advisors
technical and scientific
pedagogic and translating
publicistic and artistical
Change in Gini Coefficient [%]
Taxreform2000/2005
Taxproposal'Karlsruher Entwurf'
Source: Income Tax Statistic 1995, 10% Sample (n=3 mio.), own computations

Merz/Stolze/Zwick: Microsimulation of the German Tax Reform 46/92
Figure 11b: Alternative Tax Systems in Germany– Deciles and Change in Deciles Compared to Taxbase 1995 Professions
0102030405060708090
100
1 2 3 4 5 6 7 8 9 10
Deciles
Per
cen
tag
e o
f T
ota
l In
com
e
medical legal and economic advisors
technical and scientific pedagogic and translating
publicistic and artistical
-20%-15%-10%-5%0%5%
10%15%20%
1 2 3 4 5 6 7 8 9 10
Deciles
Rel
. Ch
ang
e
medical legal and economic advisors
technical and scientific pedagogic and translating
publicistic and artistical
-20%-15%-10%-5%0%5%
10%15%20%
1 2 3 4 5 6 7 8 9 10
Deciles
Rel
. Ch
ang
e
medical legal and economic advisors
technical and scientific pedagogic and translating
publicistic and artistical
Source: Income Tax Statistic 1995, 10% Sample (n=3 mio.), own computations

Merz/Stolze/Zwick: Microsimulation of the German Tax Reform 47/92
Figure 11c: Alternative Tax Systems in Germany– Lorenz-Curves in Taxbase 1995 Professions
0
20
40
60
80
1000 10 20 30 40 50 60 70 80 90 100
Percentage of Population
Per
cen
tag
e o
f D
isp
osa
ble
Inco
me medical
legal and economicadvisors
technical andscientific
pedagogic andtranslating
publicistic andartistical
Source: Income Tax Statistic 1995, 10% Sample (n=3 mio.), own computations
Gender
There is practical no difference with regard to the inequality of income between men and women (0.36 rep. 0.35). Both reform alternatives lead to a more unequal disposable income distribution with the most effects for men by the “Karlsruhe proposal” (Figure 12a).
Decile shares: As measured overall by the Gini-coefficient, there are no distinct differences for the decile shares between men and women (one person tax units) (Figure 12b and Figure 12c). The richest ten percent earn more than 20% of total disposable income. The tax reform alternatives show similar impacts with particular decreasing low income shares up to the 3rd decile and some increase in the richest ten percent.

Merz/Stolze/Zwick: Microsimulation of the German Tax Reform 48/92
Figure 12a: Alternative Tax Systems in Germany– Gini-Coefficient and Relative Change in Gini-Coefficient Compared to
Taxbase 1995 Gender
0,36
0,35
0,00 0,10 0,20 0,30 0,40 0,50
Men
Women
Gini Coefficient
2,3%
1,4%
3,7%
2,4%
-25,0% -20,0% -15,0% -10,0% -5,0% 0,0% 5,0% 10,0% 15,0% 20,0% 25,0%
Men
Women
Change in Gini Coefficient [%]
Taxreform2000/2005
Taxproposal'Karlsruher Entwurf'
Source: Income Tax Statistic 1995, 10% Sample (n=3 mio.), own computations

Merz/Stolze/Zwick: Microsimulation of the German Tax Reform 49/92
Figure 12b: Alternative Tax Systems in Germany– Deciles and Change in Deciles Compared to Taxbase 1995 By Gender
0102030405060708090
100
1 2 3 4 5 6 7 8 9 10
Deciles
Per
cen
tag
e o
f T
ot.
Inco
me
Men Women
-15%
-10%
-5%
0%
5%
10%
15%
1 2 3 4 5 6 7 8 9 10
Deciles
Rel
. Ch
ang
e
Men Women
-15%
-10%
-5%
0%
5%
10%
15%
1 2 3 4 5 6 7 8 9 10
Deciles
Rel
. Ch
ang
e
Men Women
Source: Income Tax Statistic 1995, 10% Sample (n=3 mio.), own computations

Merz/Stolze/Zwick: Microsimulation of the German Tax Reform 50/92
Figure 12c: Alternative Tax Systems in Germany– Lorenz-Curves in Taxbase 1995 Gender
0
20
40
60
80
100
0 10 20 30 40 50 60 70 80 90 100
Percentage of Population
Per
cen
tag
e o
f D
isp
osa
ble
Inco
me
Men
Women
Source: Income Tax Statistic 1995, 10% Sample (n=3 mio.), own computations
Family type
Under the former taxbase the disposable income is most unequally distributed for singles and married couples without children. More equally distributed are the incomes of families with children (Fig. 13a).
Remarkably for all family- types both tax reform alternatives increase income inequality. Most for singles with children, the respective reform instruments alter the distribution of the disposable income to more inequality.
Decile shares: Deepening the distributional family type figure by the analysis of decile shares the richest ten percent of all family types hold more than 20% of the respective total income (Figures 13b and 13c). The tax reform 2000/2005 as well as the “Karlsruhe proposal” show a similar decile share picture with diminishing importance of the lowest three to four poorest population deciles and increasing importance of the richest ten percent.

Merz/Stolze/Zwick: Microsimulation of the German Tax Reform 51/92
Figure 13a: Alternative Tax Systems in Germany– Gini-Coefficient and Relative Change in Gini-Coefficient Compared to
Taxbase 1995 Family-Type
0,36
0,30
0,34
0,27
0,29
0,00 0,05 0,10 0,15 0,20 0,25 0,30 0,35 0,40
Single
Single /w children
Married couple
Married couple /w onechild
Married couple /w 2 ormore children
Gini Coefficient
1,8%
3,2%
2,8%
1,3%
0,6%
2,9%
6,7%
3,8%
3,9%
6,0%
-25,0% -20,0% -15,0% -10,0% -5,0% 0,0% 5,0% 10,0% 15,0% 20,0% 25,0%
Single
Single /w children
Married couple
Married couple /w one child
Married couple /w 2 or more children
Change in Gini Coefficient [%]
Taxreform2000/2005
Taxproposal'Karlsruher Entwurf'
Source: Income Tax Statistic 1995, 10% Sample (n=3 mio.), own computations

Merz/Stolze/Zwick: Microsimulation of the German Tax Reform 52/92
Figure 13b: Alternative Tax Systems in Germany– Deciles and Change in Deciles Compared to Taxbase 1995 Family-Type
0102030405060708090
100
1 2 3 4 5 6 7 8 9 10
Deciles
Per
cen
tag
e o
f T
ot.
Inco
me
Single Single /w children
Married couple Married couple /w one child
Married couple /w 2 or more children
-20%-15%-10%-5%0%5%
10%15%20%
1 2 3 4 5 6 7 8 9 10
Deciles
Rel
. Ch
ang
e
Single Single /w children
Married couple Married couple /w one child
Married couple /w 2 or more children
-20%-15%-10%-5%0%5%
10%15%20%
1 2 3 4 5 6 7 8 9 10
Deciles
Rel
. Ch
ang
e
Single Single /w children
Married couple Married couple /w one child
Married couple /w 2 or more children
Source: Income Tax Statistic 1995, 10% Sample (n=3 mio.), own computations

Merz/Stolze/Zwick: Microsimulation of the German Tax Reform 53/92
Figure 13c: Alternative Tax Systems in Germany– Lorenz-Curves in Taxbase 1995 Family-Type
0
20
40
60
80
1000 10 20 30 40 50 60 70 80 90 100
Percentage of Population
Per
cen
tag
e o
f D
isp
osa
ble
Inco
me Single
Single /w children
Married couple
Married couple /wone child
Married couple /w 2or more children
Source: Income Tax Statistic 1995, 10% Sample (n=3 mio.), own computations
8.5 Decomposition of inequality: The contribution of subgroups to overall inequality - Impacts of the tax reform alternatives
This section further deepens the distributional analysis by a decomposition of inequality asking for the contribution of each of the socioeconomic group’s breakdown inequality to the overall inequality of the respective socioeconomic group.
Such a decomposition is available via a class of additively decomposable inequality measures (Shorrocks 1980, 1984) with
(2) Itotal,c = IW + IB = Σg IWg + IB = Σg (ng/n) (µg/µ)c Ic(yg) + IB
where IW is within and IB is between group inequality, g is the group index, µ is the overall respective group mean, n is the number of observations, Ic(yg) is the group inequality index dependent on group's incomes yg; the group weights wg = (ng/n) (µg/µ)c only sums to unity when c = 0 or c = 1. The only class of inequality measures that satisfies the principle of scale invariance when comparing distributions with different means, and that ensure that the decomposition procedure is valid for arbitrary specifications of the partition, belongs to the generalised entropy class with
(3) Ic = (1/n) 1/[c-(c-1)] Σi [(yi/µ)c - 1] c ≠ 0 or 1.

Merz/Stolze/Zwick: Microsimulation of the German Tax Reform 54/92
We further use the Theil index as the overall and group inequality index which is given for c = 1 and applying the rule of de l’hospital by
(4) I1 = 1/n Σi (yi/µ) log(yi/µ).
Thus, the Theil inequality index decomposition by equations (2) and (4) provides additive group specific inequality contributions. We finally use group specific inequality shares (%) as a group specific percentage of Iw, the overall within group inequality part. The between group inequality share (%) is calculated as IB as a percentage of the overall inequality index Itotal,c.
Discussing the impacts results
Now, let us answer the question: How much of the overall inequality can be 'explained' by the specific breakdowns of a socioeconomic group under consideration? The answer is given by the above decomposition of the overall inequality into the inequality within subgroups and the inequality between these subgroups.
Table 8 provides for all our socioeconomic groups and for the taxbase, taxreform and the taxproposal the numerical overview for the decomposition of inequality with inequality shares for all subgroups, the within and the between share for the entire respective socioeconomic group.

Merz/Stolze/Zwick: Microsimulation of the German Tax Reform 55/92
Table 8: Alternative Tax Systems in Germany– Decomposition of Inequality
Taxbase1995
Taxreform2000/2005
Taxproposal'Karlsruher Entwurf'
%1 %1 %1
OccupationProfessions 7,33 6,76 6,71Entrepreneurs 23,65 28,74 29,33Employees 52,39 49,11 49,61Others 16,64 15,40 15,35
Within group share 94,95 94,28 94,00Between group share 5,05 5,72 5,60
Professionsmedical 71,89 70,70 69,82legal and economic advisors 8,02 8,47 8,80technical and scientific 12,66 13,08 13,44pedagogic and translating 2,66 2,79 2,85publicistic and artistical 4,78 4,96 5,10
Within group share 88,70 88,26 87,93Between group share 11,30 11,74 12,07
GenderMen 61,63 62,47 62,92Women 38,37 37,53 37,08
Within group share 99,36 99,36 99,31Between group share 0,64 0,64 0,69
Family-TypeSingle 32,43 32,46 31,90Single /w children 2,96 3,04 3,12Married couple 28,43 28,85 28,25Married couple /w one child 11,80 11,80 12,02Married couple/w two or more children 24,38 23,85 24,79
Within group share 80,26 81,23 80,82Between group share 19,74 18,77 19,18
1 Inquality shares of the Theil-Inequality Measure Source: Income Tax Statistic 1995, 10% Sample (n=3 mio.), own computations
We discuss the results along the derived figures where again on the upper part the taxbase situation and on the lower part the relative differences in % to the taxreform and the taxproposal are shown.

Merz/Stolze/Zwick: Microsimulation of the German Tax Reform 56/92
Occupation
With respect to overall inequality the employees’ inequality (also according their quantitative importance, 83% of all tax units have an predominant employee income) contribute the most by 52% with regard to the taxbase 1995 (Figure 14a). Second in line is the entrepreneurs’ inequality contribution with an inequality share of 24%.
The between group inequality share of 5.05%, above all based on a comparison of subgroups mean income, shows not a distinct difference in the different subgroups’ shapes of distribution and inequality. It is rather the within group inequality which counts by 94,95% for the overall inequality.

Merz/Stolze/Zwick: Microsimulation of the German Tax Reform 57/92
Figure 14a: Alternative Tax Systems in Germany– Inequality Shares in and Changes in Inequality Shares Compared to
Taxbase Occupation
7,33
23,65
52,39
16,64
0
10
20
30
40
50
60
Professions Entrepreneurs Employees Others
Ineq
ual
ity
Sh
are
[%]
-7,78%
21,52%
-6,26% -7,45%-8,46%
24,02%
-5,31%-7,75%
-40,00%
-30,00%
-20,00%
-10,00%
0,00%
10,00%
20,00%
30,00%
40,00%
Professions Entrepreneurs Employees Others
Ch
ang
e in
Ineq
ual
ity
Sh
are
[%]
Taxreform2000/2005
Taxproposal'Karlsruher Entwurf'
Source: Income Tax Statistic 1995, 10% Sample (n=3 mio.), own computations
The tax reform alternatives are influencing the most the inequality shares of the entrepreneurs. Their inequality share increases more than 20% with a slightly stronger increase by the “Karlsruhe proposal”. All the other occupational groups‘ impacts result in an equally sized decrease about less than 10% each.

Merz/Stolze/Zwick: Microsimulation of the German Tax Reform 58/92
Professions
Within the group of professions the medical professions with 72% have an outstanding contribution to the overall inequality (Figure 14b).
The between group inequality share of 11.3% is twice as high as for the overall occupational groups. So, although the within inequality is still dominant (88,7%) the differences in the distributional shape between the professional groups here are larger than in the overall occupational groups.
Figure 14b: Alternative Tax Systems in Germany– Inequality Shares in and Changes in Inequality Shares Compared to
Taxbase Professions
71,89
8,0212,66
2,66 4,78
0
10
20
30
40
50
60
70
80
medical legal andeconomicadvisors
technical andscientific
pedagogicand
translating
publicistic andartistical
Ineq
ual
ity
Sh
are
[%]
3,77%4,89%3,32%
5,61%
-1,66%
6,69%7,14%6,16%
9,73%
-2,88%
-20,00%
-10,00%
0,00%
10,00%
20,00%
medical legal andeconomicadvisors
technicaland scientific
pedagogicand
translating
publicisticand artistical
Ch
ang
e in
Ineq
ual
ity
Sh
are
[%]
Taxreform2000/2005
Taxproposal'Karlsruher Entwurf'
Source: Income Tax Statistic 1995, 10% Sample (n=3 mio.), own computations

Merz/Stolze/Zwick: Microsimulation of the German Tax Reform 59/92
The tax reform alternatives increase the inequality contributions of all further professional groups (in a similar manner) but decrease slightly the medical professions’ inequality share. There are no remarkable differences between the impacts of the taxreform and taxproposal in their effects visible here.
Gender
Here men’s income inequality is dominant (taxbase 1995 inequality share 61,63%) (Figure 14c).
As we have seen by the distributional analysis both for men and women (one person tax unit) the Gini-coefficients are almost identical. Thus the between group inequality share is very low (0.64%) indeed indicating that there is (almost) no difference in the income distributional shapes between men and women.

Merz/Stolze/Zwick: Microsimulation of the German Tax Reform 60/92
Figure 14c: Alternative Tax Systems in Germany– Inequality Shares in and Changes in Inequality Shares Compared to
Taxbase Gender
61,63
38,37
0
10
20
30
40
50
60
70
Men Women
Ineq
ual
ity
Sh
are
[%]
1,36%
-2,19%
2,09%
-3,36%
-20,00%
-10,00%
0,00%
10,00%
20,00%
Men Women
Ch
ang
e in
Ineq
ual
ity
Sh
are
[%]
Taxreform2000/2005
Taxproposal'Karlsruher Entwurf'
Source: Income Tax Statistic 1995, 10% Sample (n=3 mio.), own computations
The two tax reforms slightly diminish the women’s income inequality share and shape with its opposite effect for men. Though this effect is a bit larger for the taxproposal, there is no real difference between the tax reform alternatives.
Family type
Responsible for the overall inequality when a decomposition by family types is considered are singles, married coupes and married couples with two and more children (taxbase 1995,

Merz/Stolze/Zwick: Microsimulation of the German Tax Reform 61/92
Figure 14d). Or in other words, the disposable income distribution of single with children and married couples with one child is more homogeneous (their Ginis are also lower) and more equally distributed.
The between group inequality share for the family type decomposition with 19.35% is by far the largest one within our decomposition consideration of occupation (5.05%), professions (11.3%) and gender (0.64%) showing that the different family types indeed have a distinct different income inequality shape and distribution.
The tax reform alternatives do not show a unified picture. Though the impact amount is not distinct, the impacts of the taxreform and the taxproposal are of different signs for each family type.

Merz/Stolze/Zwick: Microsimulation of the German Tax Reform 62/92
Figure 14d: Alternative Tax Systems in Germany– Inequality Shares in and Changes in Inequality Shares Compared to
Taxbase Family-Type
32,43
2,96
28,43
11,80
24,38
0
5
10
15
20
25
30
35
Single Single /wchildren
Marriedcouple
Marriedcouple
/w one child
Marriedcouple
/w two ormore children
Ineq
ual
ity
Sh
are
[%]
0,09% 2,70% 1,48% 0,00%
-2,17%
-1,63% -0,63% 1,68%5,41%
1,86%
-60,00%
-40,00%
-20,00%
0,00%
20,00%
40,00%
60,00%
Single Single /wchildren
Marriedcouple
Marriedcouple
/w one child
Marriedcouple
/w two ormore
children
Ch
ang
e in
Ineq
ual
ity
Sh
are
[%]
Taxreform2000/2005
Taxproposal'Karlsruher Entwurf'
Source: Income Tax Statistic 1995, 10% Sample (n=3 mio.), own computations
Altogether, the decomposition analysis via the inequality contribution of the respective subgroups to the overall inequality has further quantified the differences of the subgroups shape of distribution. There are remarkable differences in the inequality contributions within the occupational groups, within professions as an important subgroup of the self-employed, within gender and within family types where the family type shows the most heterogeneous distributions.

Merz/Stolze/Zwick: Microsimulation of the German Tax Reform 63/92
8.6 Redistributional impacts of the tax reform alternatives for socioeconomic groups
Our final section presents the redistributional effects of the three tax systems. As we could see in the beginning, overall redistributional impacts visible are and there are different impacts of the different tax systems. Now we ask how large and important these effects are when we consider the socioeconomic groups including their subgroups. We shall again measure the redistributional impacts with the Blackburn approach.
Table 9 provides an overview of the redistributional effects for the three tax systems and our socioeconomic groups with their subgroups.
Table 9: Alternative Tax Systems in Germany– Redistribution: Blackburn’s R and k measures
R (%) k (€) R (%) k (€) R (%) k (€)All -8,1 -2 790 -6,7 -2 316 -5,1 -1 708
OccupationProfessions -8,3 -5 806 -7,0 -4 896 -5,2 -3 659Entrepreneurs -18,4 -9 964 -11,1 -6 044 -9,2 -4 993Employees -5,4 -1 832 -5,3 -1 785 -3,6 -1 230Others -7,2 -1 407 -5,8 -1 145 -5,1 -1 010
Professions
medical -6,2 -6 915 -4,9 -5 430 -3,5 -3 845legal and economic advisors -9,3 -7 615 -7,8 -6 420 -6,0 -4 876technical and scientific -9,2 -6 112 -8,2 -5 424 -6,3 -4 197pedagogic and translating -8,6 -2 428 -7,7 -2 169 -6,1 -1 723publicistic and artistical -10,2 -2 971 -9,0 -2 643 -7,4 -2 170
GenderMen -9,7 -2 331 -8,1 -1 934 -7,1 -1 695Women -7,3 -1 487 -6,3 -1 287 -5,6 -1 145
Family-TypeSingle -8,8 -1 938 -7,5 -1 643 -6,7 -1 480Single /w children -9,3 -2 336 -7,4 -1 852 -5,3 -1 332Married couple -10,4 -4 393 -8,5 -3 586 -7,8 -3 291Married couple /w one child -9,5 -4 465 -8,8 -4 135 -7,4 -3 475Married couple /w two or more children -9,8 -4 852 -9,4 -4 673 -6,3 -3 137
Taxbase1995
Taxreform2000/2005
Taxproposal'Karlsruher Entwurf'
Source: Income Tax Statistic 1995, 10% Sample (n=3 mio.), own computations
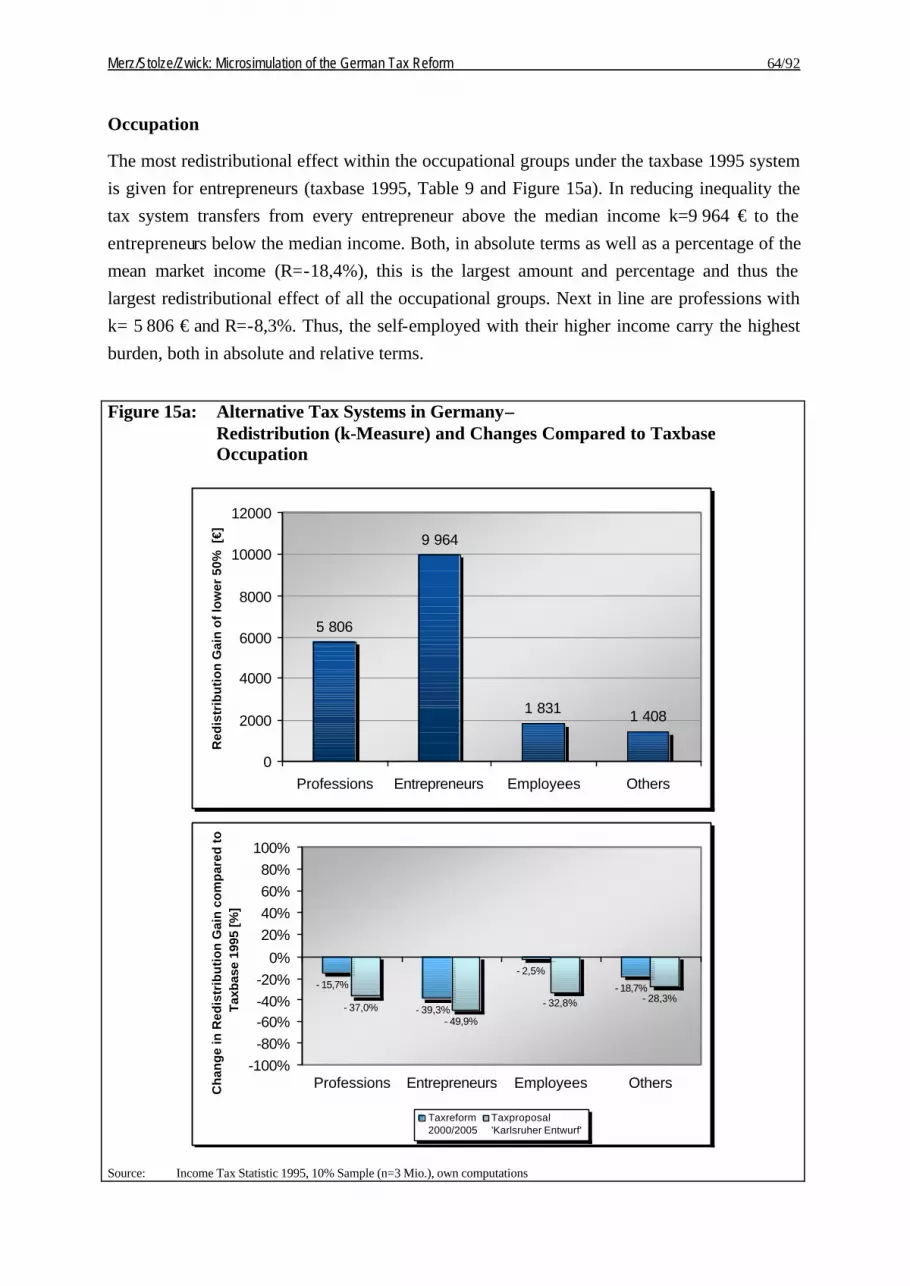
Merz/Stolze/Zwick: Microsimulation of the German Tax Reform 64/92
Occupation
The most redistributional effect within the occupational groups under the taxbase 1995 system is given for entrepreneurs (taxbase 1995, Table 9 and Figure 15a). In reducing inequality the tax system transfers from every entrepreneur above the median income k=9 964 € to the entrepreneurs below the median income. Both, in absolute terms as well as a percentage of the mean market income (R=-18,4%), this is the largest amount and percentage and thus the largest redistributional effect of all the occupational groups. Next in line are professions with k= 5 806 € and R=-8,3%. Thus, the self-employed with their higher income carry the highest burden, both in absolute and relative terms.
Figure 15a: Alternative Tax Systems in Germany– Redistribution (k-Measure) and Changes Compared to Taxbase Occupation
5 806
9 964
1 831 1 408
0
2000
4000
6000
8000
10000
12000
Professions Entrepreneurs Employees Others
Red
istr
ibu
tio
n G
ain
of
low
er 5
0% [
€]
- 15,7%
- 39,3%
- 2,5%
- 18,7%
- 37,0%- 49,9%
- 32,8% - 28,3%
-100%-80%-60%-40%-20%
0%
20%40%60%80%
100%
Professions Entrepreneurs Employees OthersCh
ang
e in
Red
istr
ibu
tio
n G
ain
co
mp
ared
to
T
axb
ase
1995
[%]
Taxreform2000/2005
Taxproposal'Karlsruher Entwurf'
Source: Income Tax Statistic 1995, 10% Sample (n=3 Mio.), own computations

Merz/Stolze/Zwick: Microsimulation of the German Tax Reform 65/92
The tax reform alternatives affect the redistribution quite differently. Both systems decrease the 1995 redistributional impact, but by a different magnitude. For all occupational groups the “Karlsruhe proposal” reduces the taxbase redistribution the most with the smallest redistributional impact ranging from professions (k=-3 659; r=-3,2%) via employees (k=-1 230 €; R=-3,6%) to entrepreneurs (k=-4 993 €; R=-9,2%). Thus, the taxreform – and more pronounced the taxproposal – alters the redistribution the most for the self-employed (professions and entrepreneurs) with the most changes for the group of entrepreneurs.
Professions
The taxbase 1995 system situation for the professions’ subgroups is as follows: the largest redistribution (by the k amount) is given for legal and economic advisors with k=-7 615 € which is R=-9,3% of their pre tax mean income (Table 9 and Figure 15b). The picture is different if we regard the percentage value: due to the widely spread means of the five professional groups, the percentage base can be quite low resulting in a larger relative R-measure. So, journalist and artist professions have a redistributional impact of R=-10,2% but in absolute terms by k=-2 971 €.

Merz/Stolze/Zwick: Microsimulation of the German Tax Reform 66/92
Figure 15b: Alternative Tax Systems in Germany– Redistribution (k-Measure) and Changes Compared to Taxbase Professions
6 9157 615
6 112
2 4282 971
0
1000
2000
3000
4000
5000
6000
7000
8000
medical legal andeconomicadvisors
technicaland
scientific
pedagogicand
translating
publicisticand
artistical
Red
istr
ibu
tio
n G
ain
of
low
er 5
0% [
€]
- 21,5% - 15,7% - 11,3% - 10,7% - 11,0%
- 44,4%- 36,0% - 31,3% - 27,0% - 27,0%
-100%
-60%
-20%
20%
60%
100%
medical legal andeconomicadvisors
technicaland
scientific
pedagogicand
translating
publicisticand
artisticalCh
ang
e in
Red
istr
ibu
tio
n G
ain
co
mp
ared
to
T
axb
ase
1995
[%]
Taxreform2000/2005
Taxproposal'Karlsruher Entwurf'
Source: Income Tax Statistic 1995, 10% Sample (n=3 Mio.), own computations
As in the occupational group the further professions’ subgroup redistribution changes follows a similar picture with the least redistributional impacts by the “Karlsruhe proposal” followed by the taxreform and lastly, with the most redistribution impact, the taxbase 1995 system. According to the absolute values the “Karlsruhe proposal” has the highest impact on the medical professions (compared to the taxbase the redistributional amount is diminished by 44,4%).

Merz/Stolze/Zwick: Microsimulation of the German Tax Reform 67/92
Gender
Factual incidence shows some different redistributional effects for men (k=-2 331 €; R=-9,7%) and women (k=-1 487 €; r=-7,3%) (note: only one-person-tax-unit can be considered here). A higher mean disposable income for men (19 455 €) than for women (17 237 €) and the progressiveness of the taxbase system again is driving the redistributional differences (Table 9 and Figure 15c).
Figure 15c: Alternative Tax Systems in Germany– Redistribution (k-Measure) and Changes Compared to Taxbase Gender
2 331
1 487
0
500
1000
1500
2000
2500
Men Women
Red
istr
ibu
tio
n G
ain
of
low
er 5
0% [
€]
- 17,0% - 13,4%
- 27,3% - 23,0%
-100%-80%-60%-40%-20%
0%
20%40%60%80%
100%
Men WomenCh
ang
e in
Red
istr
ibu
tio
n G
ain
co
mp
ared
to
T
axb
ase
1995
[%]
Taxreform2000/2005
Taxproposal'Karlsruher Entwurf'
Source: Income Tax Statistic 1995, 10% Sample (n=3 Mio.), own computations
Merz/Stolze/Zwick: Microsimulation of the German Tax Reform 68/92
Regarding the changes due to the taxreform and the taxproposal, again the taxreform results in a higher redistribution than the taxproposal with an effect for men by k=-1 695 € (R=-7,1%) and for women by k=-1 145 € (R=-5,6%).
Family type
Regarding the family type, the redistributional impacts of the German taxbase system 1995 are different for singles and married couples and also differ according to the child-situation. The necessary amount every unit above the median had to transfer to the units below the median to achieve the same distributional measure before and after taxes is highest for married couples and even higher when families have children. This is naturally imposed by the child allowances: Table 9 and Figure 15d, however, provide the resulting redistribution.

Merz/Stolze/Zwick: Microsimulation of the German Tax Reform 69/92
Figure 15d: Alternative Tax Systems in Germany– Redistribution (k-Measure) and Changes Compared to Taxbase Family-Type
1 9382 336
4 398 4 4654 852
0
1000
2000
3000
4000
5000
6000
Single Single /wchildren
Marriedcouple
Marriedcouple
/w one child
Marriedcouple
/w two ormore
children
Red
istr
ibu
tio
n G
ain
of
low
er 5
0% [
€]
- 15,2% - 20,7% - 18,5% - 7,4%
- 3,7%
- 23,6%- 43,0%
- 25,2% - 22,2%- 35,4%
-140%-100%-60%-20%20%60%
100%140%
Single Single /wchildren
Marriedcouple
Marriedcouple /w onechild
Marriedcouple
/w two ormore
childrenCh
ang
e in
Red
istr
ibu
tio
n G
ain
co
mp
ared
to
T
axb
ase
1995
[%]
Taxreform2000/2005
Taxproposal'Karlsruher Entwurf'
Source: Income Tax Statistic 1995, 10% Sample (n=3 Mio.), own computations
When we have a look to the taxreform and taxproposal impacts, the smallest redistributional changes for any family type compared to the taxbase is given by the “Karlsruhe proposal”. Thus, the taxreform again is more redistributive than the taxproposal. Note, that the child-effect is more pronounced within the “Karlsruhe proposal”.

Merz/Stolze/Zwick: Microsimulation of the German Tax Reform 70/92
9 Conclusions
Concern
This paper quantifies the distributional and redistributional impacts of the current new German taxreform and the “Karlsruhe proposal” as a prominent discussed alternative. Again the microsimulation instrument – here our microsimulation model MICSIM with its distributional program subpackage - proved to be a particularly suitable instrument for distributional analyses based on a representative sample. A demanding micro data base is needed. For the first time in Germany we were able to use an outstanding data base for our microsimulation analyses: a 3 million sub sample of the Income Tax Statistic in its current 1995 micro level version. This data base is outstanding for two reasons: firstly with regard to the high degree of details for all the tax items, and secondly, with regard to covering the total income (tax) population with its self-employed in particular. Thus the groups of self-employed, (liberal) professions, entrepreneurs and the employees could be analysed with the help of a qualified database. Further socioeconomic groups we consider are gender and the family type. Though the discussion of the single taxreform alternatives have shown the differences in the taxation structure, only the microsimulation analysis could reveal the resulting actual effects for the population and their subgroups.
Overall Mean Effects
Overall, the taxpayers’ burden is relieved by approximately 60 billion € in both reform alternatives (taxreform and taxproposal). Main winners are families with children (slightly stronger within the “Karlsruhe proposal”). Next winners compared to the taxbase situation are entrepreneurs because of the explicit trade tax consideration within the actual taxreform 2000/2005, respectively because of the total cancellation of the trade tax within the “Karlsruhe proposal”.
Although couples without children win compared to the taxbase situation, however, they loose when the “Karlsruhe proposal” (compared to the taxreform 2000/2005) is regarded. The reason here is the cancellation of the splitting advantage (‘Splitting Vorteil’) which lowers the tax burden because only half of both incomes is due to the tax tariff.
Distributional and Redistributional Results
Overall the new German taxreform as well as the “Karlsruhe proposal” result in no distinctive distributional and redistributional impacts. However, there are remarkable impacts of the different alternatives when the analysis is deepened and single socio-economic groups are considered. We see different Gini-coefficients for the taxbase situation as well as for the tax reform alternatives. The tax reform 2000/20005 and the “Karlsruhe proposal” show similar tendencies in the sign of the respective effects, however, the “Karlsruhe proposal” impacts are more pronounced. This result holds true for the more in-depth analyses by decile shares, too.

Merz/Stolze/Zwick: Microsimulation of the German Tax Reform 71/92
For all socioeconomic groups, the two tax reform alternatives, in particular, increase the richest ten percent income decile share and correspondingly decrease the ninety percent below. Thus the rising inequality by the effective tax reform 2000/2005 as well as by the “Karlsruhe proposal” in particular is due to a relative increase of the richest ten percent and a relative decrease of the below ninety percent. Thus, at least the taxreform as well as the “Karlsruhe proposal” are not resulting in a possible symmetric picture about a central measure of location like the mean or the median.
For the socioeconomic breakdowns occupation, professions, gender and family type we quantify the taxreform impacts on the distribution and the redistributional impacts to their subgroups. The results indicate that it is very important to resist the temptation to only do an overall impact analysis but to look to the subgroups of interests. The effects of the taxreform and the taxproposal are quite different. The current taxreform is more redistributional than the “Karlsruhe proposal”; the paper delivers all the numeric results for the socio-economic breakdowns and their subgroups. Substantially responsible for the different tax alternative impacts are the family and children and trade tax treatment. Naturally, the different tax tariffs have their impacts, too.
Decomposition Results
In addition to the distributional and redistributional analyses and results sketched above, this paper is answering the question, which subgroup is responsible for the overall inequality picture of a socioeconomic breakdown, by a decomposition analysis. Measured by a generalized entropy approach via the Theil inequality index the analyses further disentangled the distributional picture for the breakdowns (subgroups) of a socioeconomic group. The shape of inequality is quite different in the according subgroups; the within group inequality share varies roughly from 80% to more than 95%.
One striking and uniform result has to be attributed to the „Karlsruhe proposal“: married couples without children are the relative losers with regard to the mean, distributional and redistributional impacts compared to the actual taxreform 2000/2005.
Political consequences
The new German tax reform implemented by the red/green government diminishes the individual tax burden remarkably by approx. 60 billion €. Our microsimulation analysis has shown the consequences of all the details of the new German taxreform to the income distribution for various socioeconomic groups of particular interest. Which group is gaining and which group is losing relative to the others is now quantified. These results can now form the basis of an informed political debate on the results and their desirability.
Further research
In addition to the new German taxreform’s distributional impacts we also quantified the distributional impacts of an important alternative discussed, the “Karlsruhe proposal”. Further
Merz/Stolze/Zwick: Microsimulation of the German Tax Reform 72/92
research when changing tax items now have a base for discussion and need to be quantified. Amongst others, more actual data is needed at least by aging the sample via the adjustment to demographic changes, since demographic changes with its children’s and family type’s consequences will alter the results.
Altogether
Microsimulation has again been shown as a successful and well-suited tool for targeted analyses and extremely informative with regard to distributional and redistributional impacts for diverse socioeconomic groups of interest. Microsimulation is extremely powerful if a suitable micro database - like ours – is at hand. First round effects are now transparent. Second round effects with possible behavioural changes due to changed conditions are not captured yet in our analysis. However, based on experiences of other studies, quantifying these second round effects is a hard job also because economic theory is still struggling with modelling and explaining e.g. labour market behaviour with its incentive/disincentive effects. Unfortunately, the Income Tax Statistic does not provide working hours and further socioeconomic breakdowns for an economic modelling for those incentives/disincentive effects based on labour supply analyses (but see the such behaviour analyses by Wagenhals 2001 based on survey data; an analysis at the expense of all the taxation details). However, and above all, our first round effect analysis is the base and foundation for further behaviour investigations.
Such quantitative analyses, based on the people affected by economic and social policy, are the best we can do to characterise the individual living conditions. The analyses are able to show policy impacts even before real world applications are done. They help to reduce cost and manpower expenses in the political and administrative planning process as well as for other researchers with showing a clear picture and transparent impacts, even though the results are still based on a simulation.

Merz/Stolze/Zwick: Microsimulation of the German Tax Reform 73/92
References
Atkinson, A.B. and H. Sutherland, Eds., 1988, Tax benefit models (London).
Bach, S. and B. Bartholmai, 2000, Möglichkeiten zur Modellierung hoher Einkommen auf Grundlage der Einkommensteuerstatistik, DIW Diskussionspapiere, Nr. 212, Berlin.
Blackburn, McL. L., 1989, Interpreting the magnitude of changes in measures of income inequality, in: Journal of Econometrics, 42, 21-25
Börstinghaus, V. and A. Weinelt, 2002, Steuerreform 2000 – Entlastungswirkungen und Investitionsanreize für Personenunternehmen gemessen an Alternativen, in: Perspektiven der Wirtschaftspolitik , Vol. 3(1), p. 105-116.
Brunner, J.K. and H.-G. Petersen, Eds., 1990, Simulation Models in Tax and Transfer Policy, Frankfurt.
Bundesgesetzblatt Nr.46, Teil1 vom 26. Oktober 2000, p. 1433.
Bundesministerium für Finanzen (BMF), 1995, Thesen der Einkommensteuer-Kommission zur Steuerfreistellung des Existenzminimums ab 1996 und zur Reform der Einkommensteuer; Schriftenreihe des Bundesministeriums der Finanzen, Heft 55, Bonn.
Büschges, G., 1989, 'Freie Berufe', in: Endruweit, G. and G. Trommsdorf (Eds.), Wörterbuch der Soziologie, Stuttgart.
Canto, V.A., Douglas, H.J. and A.B. Laffer, 1983, Foundations of Supply-Side Economics - Theory and Evidence, Academic Press, New York.
Cowell, F.A., 1995, Measuring Inequality, Philip Allan Publishers Limited: Oxford.
CDU, 1994, Grundsatzprogramm der CDU, beschlossen 1994 in Hamburg.
Citro, C.F. and E.A. Hanushek, Eds., 1991a, Improving Information for Social Policy Decisions, The Uses of Microsimulation Modeling: Review and Recommendations, Vol. I, National Research Council, Washington, D.C.
Citro, C.F. and E.A. Hanushek, Eds., 1991b, Improving Information for Social Policy Decisions, The Uses of Microsimulation Modeling: Technical Papers, Vol. II, National Research Council, Washington, D.C.
Deneke, J.F.V., 1956, Die freien Berufe , Stuttgart.
Deneke, J.F.V., 1986, Freie Berufe, in: Staatslexikon, Vol. 2, Freiburg, 675-678.
der freie beruf, 2002, Plädoyer für ein ‘mittelstandsfreundliches’ Steuerkonzept – Benachteiligungen für Personenunternehmen müssen beseitigt werden, in: der freie beruf, 12/29. Jahrgang, p. 15-16
Gupta, A. and V. Kapur, Eds., 2000, Microsimulation in Government Policy and Forecasting, North-Holland: Amsterdam – Tokyo.
Hancock, R. and H. Sutherland, Eds., 1992, Microsimulation Models for Public Policy Analysis: New Frontiers, Suntory-Toyota International Centre for Economics and Related Disciplines, London School of Economics and Political Science, London.
Harding, A., Ed., 1996, Microsimulation and Public Policy, North-Holland: Amsterdam.
http://ffb.uni-lueneburg.de/adjust.
Karlsruher Arbeitskreis, 2001, Karlsruher Entwurf zu einem vereinfachten Einkommensteuergesetzbuch, Müller Verlag: Karlsruhe.
Merz, J. and F. Plönnigs, 1997, DISTRI/MICSIM - A Softwaretool for Distributional Analyses and Microsimulation Models, FFB-Documentation No. 6, Research Institute on Professions (FFB), Department of Economics and Social Sciences, University of Lüneburg, Lüneburg.
Merz, J. and M. Zwick, 2001, Über die Analyse hoher Einkommen mit der Einkommensteuerstatistik – Eine methodische Erläuterung zum Gutachten „Hohe Einkommen, ihre Struktur und Verteilung“ zum ersten Armuts- und Reichtumsbericht der Bundesregierung, in: Wirtschaft und Statistik 7/2001, p. 513-523.
Merz, J., 1991, Microsimulation - A Survey of Principles. Developments and Applications, in: International Journal of Forecasting, 7, p. 77-104.

Merz/Stolze/Zwick: Microsimulation of the German Tax Reform 74/92
Merz, J., 1996, “MICSIM: Concept, Developments, And Applications of a PC Microsimulation Model for Research and Teaching”, in: Troitzsch, K. G., Mueller, U., Gilbert, N. and J. Doran (Eds), Social Science Microsimulation, Springer Verlag: Berlin/Tokyo.
Merz, J., 2000a, The Distribution of Income of Self-employed, Entrepreneurs and Professions as Revealed from Micro Income Tax Statistics in Germany, in: Hauser, R. and I. Becker (Eds.), The Personal Distribution of Income in an International Perspective, Springer Verlag: Heidelberg, p. 99-128.
Merz, J., 2000b, INEQ and DECOM - A SPSS program package for distributional analyses, Research Institute on Professions (FFB), Department of Economics and Social Sciences, University of Lüneburg, Lüneburg.
Merz, J., 2001, Hohe Einkommen, ihre Struktur und Verteilung, Lebenslagen in Deutschland, Der erste Armuts- und Reichtumsbericht der Bundesregierung, Bundesministerium für Arbeit und Sozialordnung, Bonn.
Merz, J., H. Stolze and S. Imme, 2001, Adjust for Windows Version 1.0 - A Program Package to Adjust Microdata by the Minimum Information Loss Principle: Program Manual, Lüneburg.
Merz, J., Rauberger, T. K. and A. Rönnau, 1994, Freie Berufe in Rheinland-Pfalz und in der Bundesrepublik Deutschland - Struktur, Entwicklung und wirtschaftliche Bedeutung , FFB-Schriftenreihe Band 7, Lüneburg.
Mitton, L, Sutherland, H. and M. Weeks, Eds., 2000, Microsimulation Modelling for Policy Analysis, Cambridge University Press: Cambridge.
Orcutt, G., 1957, A new type of socio-economic systems, The Review of Economics and Statistics, Vol.58, 773-797.
Orcutt, G., J. Merz and H. Quinke, Eds., 1986, Microanalytic simulation models to support social and financial policy, North Holland: Amsterdam.
Orcutt, G., S. Caldwell and R. Wertheimer II, 1976, Policy exploration through microanalytic simulation, The Urban Institute: Washington, D.C.
Sahner, H., 1989, Freie Berufe im Wandel, Arbeitsberichte des Fachbereichs Wirtschafts - und Sozialwissenschaften der Universität Lüneburg, Nr. 59, Lüneburg.
Shorrocks, A.F., 1980, The class of additively decomposable inequality measures, in: Econometrica, Vol. 48, No. 3, 613-625.
Shorrocks, A.F., 1984, Inequality decomposition by population subgroups, in: Econometrica, Vol. 52, No. 6, 1369-1385.
Spahn, P.B., Galler, H.P., Kaiser, H., Kassella, Th. and J. Merz, 1992, Mikrosimulation in der Steuerpolitik , Springer: Heidelberg.
SPD, 1998, Grundsatzprogramm der Sozialdemokratischen Partei Deutschlands, Berlin 1989 geändert auf dem Parteitag in Leipzig am 17.04.1998, p. 47.
SPD, 1959, Grundsatzprogramm der SPD , Bad Godesberg, p.16.
Wagenhals, G., 2001, Incentive and Redristribution Effects of the „Karlsruher Entwurf zur Reform des Einkommensteuergesetzes“. The Case of Married Couples. in: Schmollers Jahrbuch, Journal of Applied Social Science Studies, 121 Jahrgang, Heft 4, 625 – 637.
Zwick, M., 1998, Einzelmaterial und Stichproben innerhalb der Steuerstatistiken, in: Wirtschaft und Statistik , 7, p. 566-572.
Zwick, M. 2001, Individual tax statistics data and their evaluation possibilities for the scientific community, Schmollers Jahrbuch, Journal of Applied Social Science Studies, 121 Jahrgang, Heft 4, 639-648.
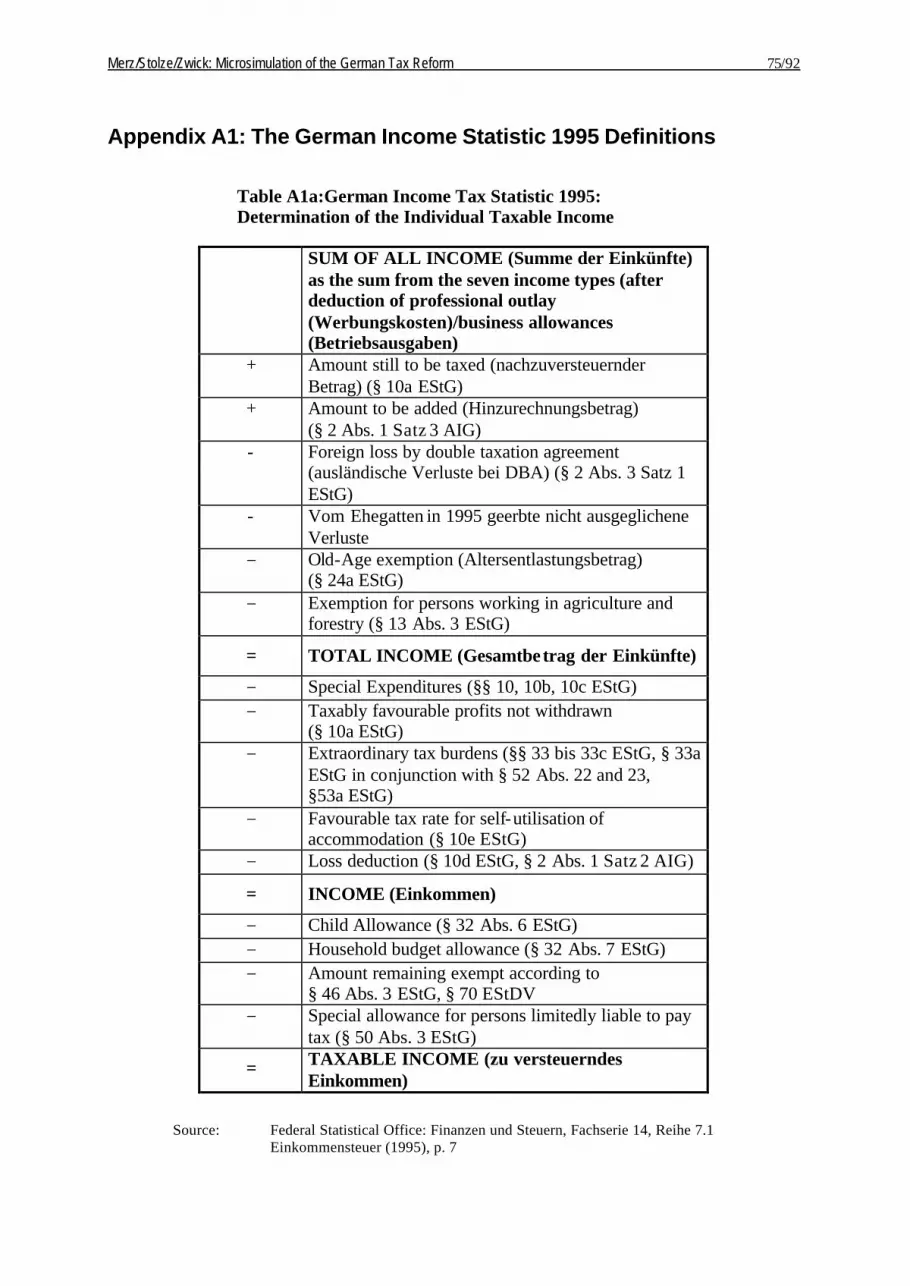
Merz/Stolze/Zwick: Microsimulation of the German Tax Reform 75/92
Appendix A1: The German Income Statistic 1995 Definitions
Table A1a:German Income Tax Statistic 1995: Determination of the Individual Taxable Income
SUM OF ALL INCOME (Summe der Einkünfte) as the sum from the seven income types (after deduction of professional outlay (Werbungskosten)/business allowances (Betriebsausgaben)
+ Amount still to be taxed (nachzuversteuernder Betrag) (§ 10a EStG)
+ Amount to be added (Hinzurechnungsbetrag) (§ 2 Abs. 1 Satz 3 AIG)
- Foreign loss by double taxation agreement (ausländische Verluste bei DBA) (§ 2 Abs. 3 Satz 1 EStG)
- Vom Ehegatten in 1995 geerbte nicht ausgeglichene Verluste
− Old-Age exemption (Altersentlastungsbetrag) (§ 24a EStG)
− Exemption for persons working in agriculture and forestry (§ 13 Abs. 3 EStG)
= TOTAL INCOME (Gesamtbetrag der Einkünfte)
− Special Expenditures (§§ 10, 10b, 10c EStG) − Taxably favourable profits not withdrawn
(§ 10a EStG) − Extraordinary tax burdens (§§ 33 bis 33c EStG, § 33a
EStG in conjunction with § 52 Abs. 22 and 23, §53a EStG)
− Favourable tax rate for self-utilisation of accommodation (§ 10e EStG)
− Loss deduction (§ 10d EStG, § 2 Abs. 1 Satz 2 AIG)
= INCOME (Einkommen)
− Child Allowance (§ 32 Abs. 6 EStG) − Household budget allowance (§ 32 Abs. 7 EStG) − Amount remaining exempt according to
§ 46 Abs. 3 EStG, § 70 EStDV − Special allowance for persons limitedly liable to pay
tax (§ 50 Abs. 3 EStG)
= TAXABLE INCOME (zu versteuerndes Einkommen)
Source: Federal Statistical Office: Finanzen und Steuern, Fachserie 14, Reihe 7.1 Einkommensteuer (1995), p. 7

Merz/Stolze/Zwick: Microsimulation of the German Tax Reform 76/92
Table A1b:German Income Tax Statistic 1995: Determination of the Fixed Income Tax
TAX AMOUNT According to basic table/splitting tables or according to the rate of taxation when applying the Progression Reservation (§ 32b EStG)
+ Tax on income which is subject to a reduced rate of taxation (§§ 34, 34b, 34c Abs. 4 EStG)
= TARIFF INCOME TAX (Tarifliche Einkommensteuer) (§ 32a Abs. 1 und 5 EStG)
- Amount of exoneration (Entlastungsbetrag § 32 c EStG
− Foreign taxes (§ 34c Abs. 1 und 6 EStG, § 12 AStG) − Tax reductions for persons working in agriculture
and forestry (§ 34e EStG) + Taxes according to § 34c Abs. 5 EStG − Child home building allowance (Baukindergeld)
(§ 34f EStG) − Tax reductions on expenses incurred in the support
of political parties, voting communities or membership fees (§ 34g EStG)
− Tax reductions on burdens as a result of Inheritance Tax (§ 35 EStG)
+ Supplementary tax according to §§ 30, 31 EStDV = FIXED INCOME TAX (Festzusetzende
Einkommensteuer) (§ 2 Abs. 6 EStG)
Source: Federal Statistical Office: Finanzen und Steuern, Fachserie 14, Reihe 7.1 Einkommensteuer (1995), p. 8

Merz/Stolze/Zwick: Microsimulation of the German Tax Reform 77/92
Appendix A2: Model for Sunday-, public holiday- and night work extra pay
The idea is to distribute the 3.8 billion DM that were granted as tax relief for Sunday-, public holiday- and night work extra pay (according to the state subsidy report (“Subventionsbericht”) of the federal government for 2002) according to § 3b EStG adequately on the 10% sample of the wage and income tax statistic 1995.
In a first step the stated amount had to be discounted with the cost-of-living price index to the year 1995 by the factor 109,6, resulting in the amount of 3.486 billion DM for 1995.
In the next step the ratio of Sunday and public holiday work as well as night work to the total gainful employment work is calculated with the help of the micro census 2000. The data was calculated and arranged according to age, basic- and splitting-table (Grund- und Splittingtabelle?) as well as net income. Because the ratios only had small variances as a simplification only one ratio could be respectively taken. The share of night work is 7% and Sunday work comprises 10% of the total gainful employment work.
The distribution of the tax relief on night work, Sunday- and public holiday work
From those gainfully employed who received Sunday-, public holiday- or night work extra pay 57% worked on Sundays or public holidays and 43% in the night. If one makes the assumption that night time work was done with a working time representing one whole normal working day and with about one fifth of a working day on Sundays and public holidays 16, then the following ratios result:
5/5 and 1/5 result, if standardised onto one, a share of 0,83 for night work and 0,17 for Sunday work. Multiplied with the respective share of Sunday- or night work of the total work of the gainfully employed and again standardised onto one 17, then the tax relief can be split up as follows:
Night work: 0,79 * 3.486 billion tax relief = 2.754 billion tax relief Sunday work: 0,21 * 3.486 billion tax relief = 732 million tax relief
From the tax relief to the individual income component of the § 3b EStG
Out of the 10% sample the tax payers with predominantly gainful employment were isolated. From this group two random samples emerge, one of 7% for the night time work and a 10% one for the Sunday work. 18 Each data set of these sub-sets receive a weight that is calculated
16 In the micro census those employees were recorded that worked always, or regularly, in the night or on
Sundays 17 0,83*0,43 and 0,17*0,57 standardised onto one give (0,79/ 0,21) 18 according to the respective share of the total work

Merz/Stolze/Zwick: Microsimulation of the German Tax Reform 78/92
out of the ration of the positive gainful employment income compared to the total gainful employment income19 of the relevant part of the population. According to these individual weights the total tax relief is divided onto the respective tax payer. With the individual average tax rate of the tax payer the underlying income share can be calculated out of the tax relief.
These steps are done in the “night sample” as well as in the “Sunday work sample”. The respective resulting income components are taken over in the 10% overall sample via the matching variable “serial number”
19 with consideration of the projection factor

Merz/Stolze/Zwick: Microsimulation of the German Tax Reform 79/92
Appendix 3
DISTRIBUTIONAL MEASURES
We concentrate ourselves on central and meaningful measures. For the theoretical foundation of the measurement of concentration, distribution and inequality we refer to the relevant literature, especially Atkinson 1970, 1987, Lüthi 1981, Cowell 1995 or Maasoumi 1999. Apart from the descriptive measures to describe a statistical mass like the arithmetic mean or the median (50% of the income receivers earn less as the median income) we use the following measures for the description of a distribution:
Gini-Coefficient
The Gini-Coefficient describes the inequality resp. equality of a distribution (corresponding with the area between the rectangular distribution line and the Lorenz curve). The smaller the coefficient is, the more the income is distributed equally. The Gini-coefficient is sensitive regarding the densely populated income region (middle area).
(1) 1 221
1 21 .....
n
i ni
G iy where y y yn n µ =
= + − ≤ ≤∑
where n =Population size, µ = Total average income, iy = Income of person i.
Atkinson Measure
The Atkinson Measure allows a normative assessment regarding the inequality aversion. With ε = 1 indicating a relative low and ε = 2 a relatively high risk aversion. The Atkinson Measure is sensitive regarding the lower section of the income distribution.
(2)
11 1
1
11 1
ni
i
yA for
n
ε ε
εµ
− −
=
= − ≠
∑ and
1
11 exp 1
ni
i
yA for
nε
µ=
= − =
∑
Theil Index
Based on the information theory the Theil Index is sensitive regarding the lower income bracket. We also use the index for the decomposition analysis (see below).
(3) I1 = 1/n Σi (yi/µ) log(yi/µ).

Merz/Stolze/Zwick: Microsimulation of the German Tax Reform 80/92
Percentiles (Deciles, Quintiles etc.)
Percentiles divide the population (here tax payers) according to a percentile (e.g. decile: 10%, quintile: 20% of the population). An income value is then attributed to each percentile. From these income values ordered according to size the income that e.g. 90% of the population maximally have can be calcula ted.
Percentile Shares
The percentile shares provide insight into the share of the total income that belongs to the percentile concerned. The decile shares e.g. show which share of the total income the poorest 10% earn, which share falls to the next 10% and so on until the richest 10% of the population.
Lorenz Curve
The Lorenz curve cumulates these income shares (percentile shares) from the respective percentiles/deciles of the tax payers (population share: x-axis, income share: y-axis). The magnitude of the area under the 45-degree line indicates the degree of inequality and corresponds with the Gini-Coefficient.
90/10 Relation
The 90/10 relation describes the relation between the income of the richest 10% to the poorest 10% of the population.
REDISTRIBUTIONAL MEASURES
An overall redistributional and easily interpretable measure is the k-measure by Blackburn. According to Blackburn’s (1989) simple redistributive scheme every income unit below the median level of income receives an equal-sized, lump-sum tax that is transferred from every unit above the median (and vice versa) resulting in the same pre- and post tax/transfer distribution.
The redistributional effect then is the value of the lump-sum as a percentage of the mean level of before tax income. As Blackburn has shown, the respective index partitioning is valid only for the Gini-coefficient resulting in
(4) R = k/ mean before tax = 2(Gini after tax - Gini before tax)
DECOMPOSITION OF INEQUALITY: THE CONTRIBUTION OF SUBGROUPS TO OVERALL INEQUALITY
A decomposition of the distributional measure can be used to establish which of the socio-demographic resp. socio-economic groups of a population are decisive for the level of inequality of a distribution. Such decomposition then shows the percentage share of the

Merz/Stolze/Zwick: Microsimulation of the German Tax Reform 81/92
inequality between the groups and within the groups. Such a decomposition is possible over / for a class of additive decomposable inequality measures (Shorrocks 1980, 1984) with
(5) Itotal,c = IW + IB = Σg IWg + IB = Σg wg Ic(yg) + IB = Σg pg
1-c νg
c Ic(yg) + IB = Σg (ng/n) (µg/µ)c Ic(yg) + IB
where IW describes the inequality within and IB the inequality between the groups (each group member is allotted with the same mean group income), g is the group index, µ is the general, resp. group specific (µg) mean value of the incomes, n is the number of observations, Ic(yg) is the group inequality index dependent on the group income yg. The group weights wg = pg
1-c
νgc = (ng/n) 1-c (µg/µ)c out of the population- (pg
1-c ) and the income share (νg
c) of the group g sum up to one only if c = 0 or c = 1.
Decomposition of the Theil Index
The only class of inequality measures with specific desirable properties (scale invariance of distributions with different means, additivity) belong to the class of the generalised entropy measures with
(6) Ic = (1/n) 1/[c-(c-1)] Σi [(yi/µ)c - 1] c ≠ 0 or 1.
We use the Theil index as overall and group specific inequality measure, which is given for c = 1:
(7) I1 = 1/n Σi (yi/µ) log(yi/µ).
To summarise: the Theil–decomposition from (2) and (4) provides the group-specific inequality contributions.
Inequality Shares
Inequality shares (%) are group specific percentages of Iw, the overall within group inequality part Iw. The between group inequality share (%) is calculated as IB as a percentage of the overall inequality index Itotal,c.

Appendix 4: Numerical Results
Occupation – All
Total in Bill. EURMean in EUR
Median in EUR
Gini-CoeffizientAktinson Index mit ε = 1Aktinson Index mit ε = 2
Theil Index
Decile shares in %and decile limits in EUR
1. Decile 0,9 6 793 1,0 6 707 1,0 6 777 1,0 6 7952. Decile 3,1 14 141 3,6 13 265 3,5 13 956 3,4 13 8193. Decile 4,9 19 694 5,5 17 694 5,4 18 710 5,3 18 7404. Decile 6,3 23 933 6,8 21 095 6,7 22 332 6,7 22 3885. Decile 7,5 27 924 8,0 24 422 7,9 26 012 7,9 25 9946. Decile 8,7 32 474 9,2 28 211 9,2 30 122 9,1 30 0627. Decile 10,2 38 521 10,7 32 976 10,7 35 158 10,6 35 5038. Decile 12,3 46 671 12,6 39 228 12,6 41 683 12,6 42 3969. Decile 15,3 60 508 15,3 49 578 15,2 52 262 15,3 53 004
10. Decile 30,8 - 27,3 - 27,9 28,1 -90/10 Relation
R (%)k(EUR)
0,3326 0,3423
- 2 037- 2 789-8,1
- 2 313-6,7 -5,9
0,38370,4172
30 749 25 994
0,38770,30090,8237
0,4080 0,3083
30 470 28 497
Redistribution
29,6
34 532 27 924 24 422 26 012
0,33140,3768
Disposable income "Karlsruhe proposal"
Disposable income Taxbase 2000/2005
Distribution
1 017 839 897 905
Measure Market incomeDisposable income Taxbase
1995
0,28690,8436 0,8151
0,29750,8072
--
27,0 29,336,3
Occupation – Professions
Total in Bill. EURMean in EUR
Median in EUR
Gini-CoeffizientAktinson Index mit ε = 1Aktinson Index mit ε = 2
Theil Index
Decile shares in %and decile limits in EUR
1. Decile 0,5 6 570 0,7 6 487 0,7 6 586 0,6 6 6042. Decile 1,4 12 682 1,7 11 821 1,7 12 500 1,6 12 3063. Decile 2,3 20 159 2,8 18 262 2,8 19 214 2,7 19 0384. Decile 3,5 28 939 4,1 25 541 4,1 26 891 3,9 26 5875. Decile 4,9 39 985 5,6 34 219 5,5 36 093 5,4 35 8206. Decile 6,7 54 693 7,5 45 315 7,4 47 638 7,2 47 7547. Decile 9,2 74 884 9,9 59 675 9,7 62 841 9,6 62 8918. Decile 12,6 103 327 13,0 78 410 12,8 82 987 12,6 83 5979. Decile 17,9 153 090 17,3 107 823 17,3 116 960 17,3 119 932
10. Decile 41,1 - 37,5 - 38,2 - 39,1 -90/10 Relation
R (%)k(EUR)
54,3
0,4434
0,8124 0,8103
- - 5 806 - 4 896 - 3 821- -8,3 -7,0 -5,5
Redistribution
58,8 61,1
0,9093 0,9139 0,9226
0,7997 0,8118
0,9352
79,0
34 219
0,4596
Distribution
0,5255 0,53200,56700,4995 0,4518
39 985
0,5397
36 093
Disposable income "Karlsruhe proposal"
24
Disposable income Taxbase 2000/2005
35 820
Measure Market incomeDisposable income Taxbase
1995
57 594 52 933 69 937 56 649 29 22 24

FFB-Publication list 83/106
Occupation – Entrepreneurs
Total in Bill. EURMean in EUR
Median in EUR
Gini-CoeffizientAktinson Index mit ε = 1Aktinson Index mit ε = 2
Theil Index
Decile shares in %and decile limits in EUR
1. Decile 0,6 6 117 0,8 5 972 0,7 6 081 0,7 6 1052. Decile 1,5 10 317 2,1 9 999 1,9 10 312 1,9 10 2333. Decile 2,3 14 690 3,1 13 814 2,8 14 419 2,8 14 2654. Decile 3,1 19 340 4,2 17 938 3,8 18 766 3,7 18 5955. Decile 4,0 24 757 5,3 22 610 4,8 23 825 4,7 23 4156. Decile 5,2 31 931 6,7 28 303 6,1 30 149 6,0 29 5057. Decile 6,8 42 105 8,4 36 061 7,8 38 496 7,6 38 1548. Decile 9,1 58 588 10,9 47 577 10,1 51 235 10,0 50 9739. Decile 13,6 95 745 15,1 70 410 14,3 78 453 14,0 78 082
10. Decile 53,7 - 43,4 - 47,6 - 48,7 -90/10 Relation
R (%)k(EUR)
1,1593 0,7619 0,9195 0,9638
- - 9 964 - 6 044 - 5 155- -18,4 -11,1 -9,5
Redistribution
88,1 64,3 65,851,6
0,93700,92910,5571 0,4911 0,49940,44890,9503 0,9343
Distribution
0,6392 0,5835 0,59170,5474
23 825 23 415 43 790 44 282
Disposable income "Karlsruhe proposal"
88 89
Disposable income Taxbase 2000/2005
Measure Market incomeDisposable income Taxbase
1995
24 757 22 610 54 293 37 958
109 76
Occupation – Employees
Total in Bill. EURMean in EUR
Median in EUR
Gini-CoeffizientAktinson Index mit ε = 1Aktinson Index mit ε = 2
Theil Index
Decile shares in %and decile limits in EUR
1. Decile 1,6 9 828 1,9 9 544 1,8 9 846 1,8 9 8312. Decile 4,1 17 160 4,5 15 543 4,5 16 530 4,4 16 4523. Decile 5,8 21 925 6,2 19 275 6,2 20 471 6,1 20 5604. Decile 7,0 25 665 7,3 22 379 7,3 23 825 7,3 23 8865. Decile 8,1 29 376 8,4 25 510 8,4 27 295 8,4 27 2856. Decile 9,3 33 785 9,6 29 158 9,6 31 186 9,6 31 1757. Decile 10,8 39 552 11,0 33 657 11,1 35 913 11,0 36 4008. Decile 12,7 47 071 12,8 39 433 12,8 41 920 12,9 42 7229. Decile 15,5 59 314 15,3 48 530 15,2 51 273 15,4 52 141
10. Decile 25,1 - 23,2 - 23,1 - 23,2 -90/10 Relation
R (%)k(EUR)
0,2205 0,1849 0,1869 0,1906
- - 1 832 - 1 785 - 1 545- -5,4 -5,3 -4,6
Redistribution
15,8 12,3 12,9 13,1
0,5055 0,50050,2195 0,1898 0,1935 0,19640,5567 0,4840
Distribution
0,3459 0,3189 0,3196 0,3231
27 295 27 285 30 281 30 549
Disposable income "Karlsruhe proposal"
739 746
Disposable income Taxbase 2000/2005
Measure Market incomeDisposable income Taxbase
1995
29 376 25 510 33 881 28 495
827 696

FFB-Publication list 84/106
Occupation – Others
Total in Bill. EURMean in EUR
Median in EUR
Gini-CoeffizientAktinson Index mit ε = 1Aktinson Index mit ε = 2
Theil Index
Decile shares in %and decile limits in EUR
1. Decile 0,2 517 0,2 512 0,2 509 0,2 5112. Decile 0,4 893 0,4 885 0,4 882 0,4 8853. Decile 0,6 1 560 0,7 1 539 0,7 1 532 0,7 1 5374. Decile 1,4 5 534 1,5 5 343 1,4 5 323 1,4 5 3665. Decile 4,4 11 319 5,0 11 173 4,8 11 227 4,8 11 2506. Decile 6,8 15 359 7,7 15 159 7,5 15 283 7,5 15 2777. Decile 8,8 19 239 9,9 18 932 9,7 19 140 9,6 19 1028. Decile 11,0 24 445 12,3 23 858 12,1 24 228 12,0 24 1139. Decile 14,9 36 182 16,3 34 311 16,2 35 221 16,0 34 814
10. Decile 51,6 - 46,2 - 47,0 - 47,4 -90/10 Relation
R (%)k(EUR)
1,1133 0,9123 0,9383 0,9679
- - 1 407 - 1 145 - 1 054- -7,2 -5,8 -5,4
Redistribution
322,6 256,4 276,7 279,0
0,9478 0,95170,7032 0,6736 0,6802 0,68110,9558 0,9475
Distribution
0,6687 0,6329 0,6396 0,6419
11 227 11 250 17 745 17 831
Disposable income "Karlsruhe proposal"
46 47
Disposable income Taxbase 2000/2005
Measure Market incomeDisposable income Taxbase
1995
11 319 11 173 19 641 17 250
51 45
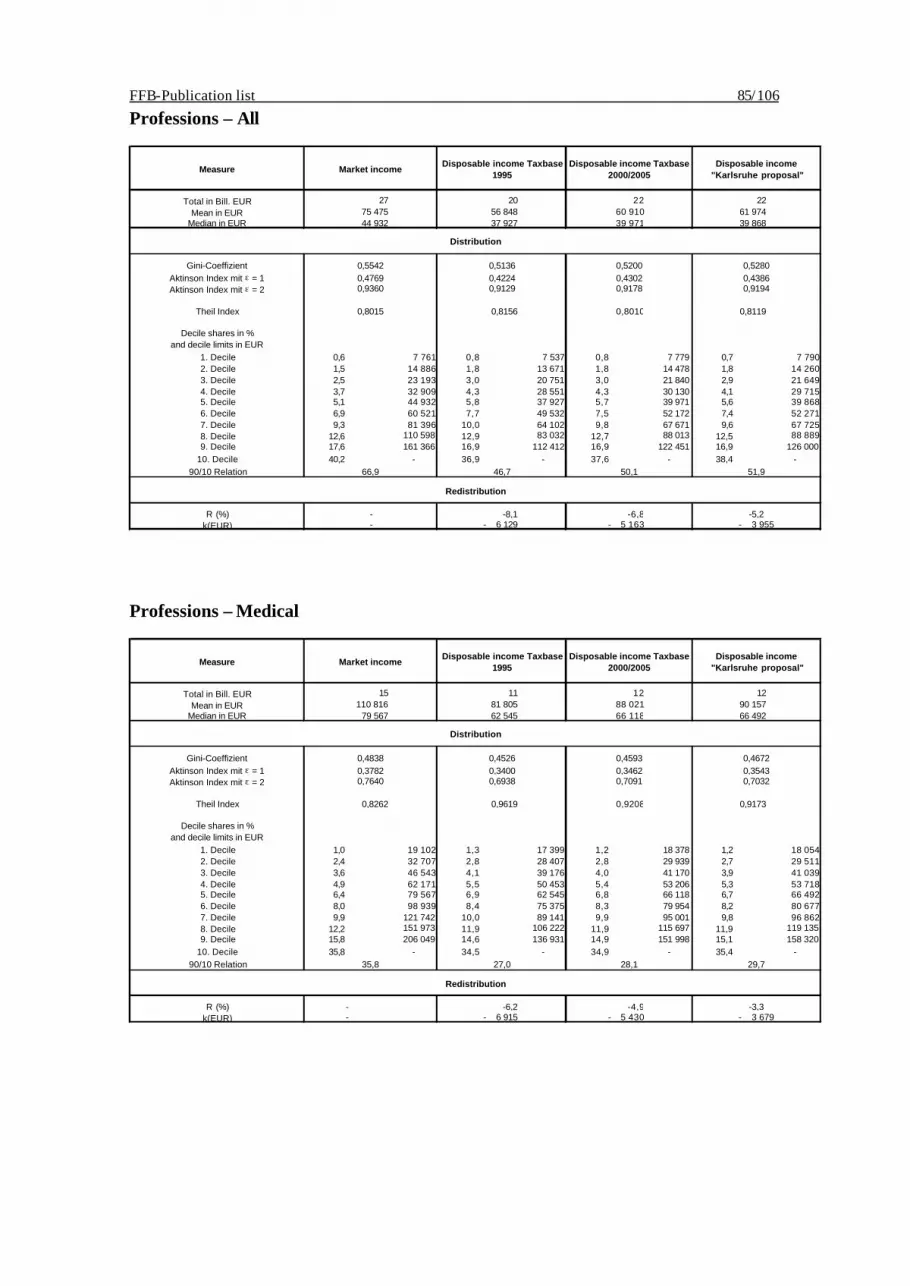
FFB-Publication list 85/106
Professions – All
Total in Bill. EURMean in EUR
Median in EUR
Gini-CoeffizientAktinson Index mit ε = 1Aktinson Index mit ε = 2
Theil Index
Decile shares in %and decile limits in EUR
1. Decile 0,6 7 761 0,8 7 537 0,8 7 779 0,7 7 7902. Decile 1,5 14 886 1,8 13 671 1,8 14 478 1,8 14 2603. Decile 2,5 23 193 3,0 20 751 3,0 21 840 2,9 21 6494. Decile 3,7 32 909 4,3 28 551 4,3 30 130 4,1 29 7155. Decile 5,1 44 932 5,8 37 927 5,7 39 971 5,6 39 8686. Decile 6,9 60 521 7,7 49 532 7,5 52 172 7,4 52 2717. Decile 9,3 81 396 10,0 64 102 9,8 67 671 9,6 67 7258. Decile 12,6 110 598 12,9 83 032 12,7 88 013 12,5 88 8899. Decile 17,6 161 366 16,9 112 412 16,9 122 451 16,9 126 000
10. Decile 40,2 - 36,9 - 37,6 - 38,4 -90/10 Relation
R (%)k(EUR)
61 974 39 868 37 927
60 910 39 971
-5,2
0,9178
50,1
0,5200 0,52800,43860,4302
Disposable income "Karlsruhe proposal"
Disposable income Taxbase 2000/2005
Measure Market incomeDisposable income Taxbase
1995
--
46,7
-8,1- 6 129
Redistribution
66,9
- 3 955- 5 163-6,8
20 22 22
0,5136
Distribution
0,5542
27 75 475 44 932
56 848
0,42240,9194
51,9
0,8015 0,8156 0,8010 0,8119
0,47690,9360 0,9129
Professions – Medical
Total in Bill. EURMean in EUR
Median in EUR
Gini-CoeffizientAktinson Index mit ε = 1Aktinson Index mit ε = 2
Theil Index
Decile shares in %and decile limits in EUR
1. Decile 1,0 19 102 1,3 17 399 1,2 18 378 1,2 18 0542. Decile 2,4 32 707 2,8 28 407 2,8 29 939 2,7 29 5113. Decile 3,6 46 543 4,1 39 176 4,0 41 170 3,9 41 0394. Decile 4,9 62 171 5,5 50 453 5,4 53 206 5,3 53 7185. Decile 6,4 79 567 6,9 62 545 6,8 66 118 6,7 66 4926. Decile 8,0 98 939 8,4 75 375 8,3 79 954 8,2 80 6777. Decile 9,9 121 742 10,0 89 141 9,9 95 001 9,8 96 8628. Decile 12,2 151 973 11,9 106 222 11,9 115 697 11,9 119 1359. Decile 15,8 206 049 14,6 136 931 14,9 151 998 15,1 158 320
10. Decile 35,8 - 34,5 - 34,9 - 35,4 -90/10 Relation
R (%)k(EUR)
0,7640
35,8
- 6 915-6,2
Redistribution
-4,9- 5 430
-3,3- 3 679
-
81 805 62 545
110 816 79 567
-
27,0 28,1 29,7
0,6938 0,7091 0,70320,3400 0,3462 0,35430,3782
66 118 66 492 88 021 90 157
Distribution
0,4526 0,4593 0,46720,4838
Disposable income "Karlsruhe proposal"
15 11 12 12
Measure Market incomeDisposable income Taxbase
1995Disposable income Taxbase
2000/2005
0,8262 0,9619 0,9208 0,9173

FFB-Publication list 86/106
Professions – Legal and Economic Advisors
Total in Bill. EURMean in EUR
Median in EUR
Gini-CoeffizientAktinson Index mit ε = 1Aktinson Index mit ε = 2
Theil Index
Decile shares in %and decile limits in EUR
1. Decile 0,9 12 994 1,2 12 209 1,1 12 876 1,1 12 6512. Decile 2,2 23 292 2,7 20 719 2,7 21 868 2,6 21 7313. Decile 3,5 33 272 4,1 28 802 4,0 30 312 3,9 29 8264. Decile 4,7 44 454 5,4 37 387 5,3 39 487 5,2 39 2485. Decile 6,2 57 322 6,9 47 151 6,8 49 690 6,7 49 5876. Decile 7,9 72 475 8,6 58 247 8,4 61 212 8,3 60 9347. Decile 9,9 90 670 10,5 70 632 10,3 74 533 10,2 74 3188. Decile 12,5 116 432 12,8 87 436 12,7 92 688 12,5 93 3269. Decile 16,8 165 856 16,4 117 393 16,4 126 757 16,4 129 292
10. Decile 35,4 - 31,6 - 32,4 - 33,3 -90/10 Relation
R (%)k(EUR) - - 7 615 - 6 420 - 5 011
Redistribution
- -9,3 -7,8 -6,1
39,4 28,9 30,527,5
0,8231 0,7805 0,79890,77550,3811 0,3311 0,34020,3230
Distribution
0,4876 0,4484 0,45700,4411
57 322 49 690 49 587 47 151 81 885 65 611 66 442 61 239
Disposable income "Karlsruhe proposal"
4 3 4 4
Measure Market incomeDisposable income Taxbase
1995Disposable income Taxbase
2000/2005
0,4394 0,3558 0,3675 0,3848
Professions – Technical and Scientific
Total in Bill. EURMean in EUR
Median in EUR
Gini-CoeffizientAktinson Index mit ε = 1Aktinson Index mit ε = 2
Theil Index
Decile shares in %and decile limits in EUR
1. Decile 0,8 9 627 1,0 9 073 1,0 9 596 1,0 9 5022. Decile 2,1 17 954 2,5 16 309 2,5 17 275 2,4 17 0343. Decile 3,3 25 454 3,8 22 592 3,8 23 793 3,7 23 5014. Decile 4,4 33 402 5,1 29 062 5,0 30 728 4,9 30 3125. Decile 5,7 42 345 6,4 36 265 6,4 38 208 6,2 38 0696. Decile 7,2 53 434 7,9 44 780 7,8 47 069 7,8 47 0377. Decile 9,1 68 029 9,8 55 352 9,7 58 304 9,6 58 1498. Decile 11,8 88 776 12,2 69 716 12,1 73 563 11,9 73 0909. Decile 16,0 129 742 16,0 96 283 15,8 102 646 15,7 102 978
10. Decile 39,6 - 35,3 - 36,0 - 36,9 -90/10 Relation
R (%)k(EUR) - - 6 112 - 5 425 - 4 432
Redistribution
- -9,2 -8,2 -6,7
48,2 33,9 36,0 37,2
0,9391 0,9220 0,9269 0,92700,4165 0,3596 0,3668 0,3741
Distribution
0,5203 0,4741 0,4793 0,4868
42 345 36 265 38 208 38 069 66 152 50 922 54 210 54 739
Disposable income "Karlsruhe proposal"
5 4 4 4
Measure Market incomeDisposable income Taxbase
1995Disposable income Taxbase
2000/2005
0,5759 0,4860 0,4939 0,5136

FFB-Publication list 87/106
Professions – Paedagogic and Translating
Total in Bill. EURMean in EUR
Median in EUR
Gini-CoeffizientAktinson Index mit ε = 1Aktinson Index mit ε = 2
Theil Index
Decile shares in %and decile limits in EUR
1. Decile 1,0 4 802 1,2 4 742 1,2 4 807 1,2 4 8172. Decile 2,2 7 500 2,6 7 252 2,5 7 518 2,5 7 5183. Decile 3,2 10 422 3,7 9 800 3,6 10 370 3,6 10 2584. Decile 4,4 14 083 4,9 12 959 4,9 13 750 4,8 13 5295. Decile 5,8 18 291 6,3 16 623 6,3 17 548 6,2 17 4296. Decile 7,3 23 160 8,0 20 863 7,9 21 996 7,9 21 8507. Decile 9,4 30 012 10,1 26 569 10,1 28 134 10,0 27 8058. Decile 12,3 39 962 12,9 34 477 12,9 36 510 12,8 36 3469. Decile 17,2 58 763 17,4 48 214 17,3 50 980 17,3 51 158
10. Decile 37,3 - 33,0 - 33,4 - 33,9 -90/10 Relation
R (%)k(EUR) - - 2 428 - 2 169 - 1 945
Redistribution
- -8,6 -7,7 -6,9
36,2 26,8 28,8 29,2
0,9125 0,8740 0,8809 0,88180,3958 0,3427 0,3509 0,3544
Distribution
0,5071 0,4639 0,4685 0,4725
18 291 16 623 17 548 17 429 28 102 23 377 24 784 24 806
Disposable income "Karlsruhe proposal"
1 1 1 1
Measure Market incomeDisposable income Taxbase
1995Disposable income Taxbase
2000/2005
0,4927 0,3870 0,4008 0,4129
Professions – Publicistic and Artistical
Total in Bill. EURMean in EUR
Median in EUR
Gini-CoeffizientAktinson Index mit ε = 1Aktinson Index mit ε = 2
Theil Index
Decile shares in %and decile limits in EUR
1. Decile 0,7 3 755 0,9 3 741 0,9 3 756 0,9 3 7652. Decile 1,7 5 910 2,1 5 827 2,0 5 931 2,0 5 9433. Decile 2,4 8 274 2,9 7 932 2,8 8 283 2,8 8 2854. Decile 3,3 11 259 3,9 10 485 3,9 11 174 3,8 10 9975. Decile 4,5 15 211 5,2 13 796 5,2 14 672 5,1 14 5476. Decile 6,0 20 097 6,8 18 082 6,8 18 986 6,7 18 9127. Decile 8,0 27 109 8,9 23 632 8,8 24 910 8,7 24 7388. Decile 10,9 37 871 11,7 31 948 11,6 33 722 11,5 33 5579. Decile 16,3 60 751 16,8 48 854 16,7 51 383 16,5 51 174
10. Decile 46,3 - 40,9 - 41,4 - 42,1 -90/10 Relation
R (%)k(EUR)
1 1 1 1 29 237 23 357 24 821 24 990 15 211 13 796 14 672 14 547
0,5901 0,5393 0,5449 0,55010,4976 0,4335 0,4420 0,4478
49,0
0,9400 0,9258 0,9290 0,9298
0,7455 0,5932 0,6069 0,6310
Redistribution
Measure Market incomeDisposable income Taxbase
1995Disposable income Taxbase
2000/2005Disposable income
"Karlsruhe proposal"
Distribution
63,4 44,9 48,2
- -10,2 -9,0 -8,0- - 2 970 - 2 643 - 2 339

FFB-Publication list 88/106
Gender – All
Total in Bill. EURMean in EUR
Median in EUR
Gini-CoeffizientAktinson Index mit ε = 1Aktinson Index mit ε = 2
Theil Index
Decile shares in %and decile limits in EUR
1. Decile 0,7 3 412 0,9 3 381 0,8 3 381 0,8 3 3882. Decile 2,7 8 276 3,2 8 157 3,0 8 257 3,0 8 2713. Decile 4,7 12 632 5,4 11 855 5,3 12 506 5,2 12 3354. Decile 6,6 16 682 7,3 15 051 7,3 16 029 7,2 15 8765. Decile 8,3 20 199 8,9 17 605 8,9 18 749 8,8 18 7796. Decile 9,7 23 202 10,2 19 825 10,2 21 066 10,1 21 1957. Decile 11,1 26 383 11,4 22 199 11,3 23 505 11,3 23 7388. Decile 12,7 30 557 12,8 25 287 12,8 26 687 12,8 27 0119. Decile 15,2 38 132 15,0 30 783 14,9 32 360 14,9 32 708
10. Decile 28,4 - 25,0 - 25,6 - 25,9 -90/10 Relation
R (%)k(EUR)
18 445 22 315
-7,4
20 199
0,40310,3335
17 605 18 749
0,3589
0,8488
Disposable income "Karlsruhe proposal"
Disposable income Taxbase 2000/2005
Distribution
316 261 278 280
Measure Market incomeDisposable income Taxbase
1995
18 779 19 768
0,81310,30150,3703
0,81970,29840,28670,3659
19 612
Redistribution
0,8300
40,0 29,4 32,4 32,7
0,3884 0,2825 0,3110 0,3206
- - 1 464- -6,6-8,8
- 1 660- 1 973
Gender – Men
Total in Bill. EURMean in EUR
Median in EUR
Gini-CoeffizientAktinson Index mit ε = 1Aktinson Index mit ε = 2
Theil Index
Decile shares in %and decile limits in EUR
1. Decile 0,9 4 146 1,1 4 114 1,0 4 113 1,0 4 1202. Decile 2,7 8 608 3,3 8 462 3,1 8 587 3,1 8 5913. Decile 4,5 13 178 5,3 12 302 5,2 13 004 5,1 12 8354. Decile 6,4 17 520 7,2 15 644 7,2 16 656 7,1 16 5695. Decile 8,1 21 131 8,7 18 235 8,7 19 415 8,6 19 4976. Decile 9,5 24 255 10,0 20 483 9,9 21 756 9,9 21 9497. Decile 10,8 27 529 11,1 22 867 11,1 24 229 11,1 24 5098. Decile 12,3 31 867 12,5 26 097 12,4 27 536 12,5 27 9219. Decile 14,9 40 443 14,8 32 191 14,6 33 871 14,6 34 315
10. Decile 29,9 - 26,0 - 26,8 - 27,1 -90/10 Relation
R (%)k(EUR)
0,8395
35,8
150 19 455 18 235
0,36370,27510,8140
24,8
0,4241
- - 2 332 - 1 934 - 1 695
Redistribution
- -9,7 -8,1 -7,1
27,3 27,7
0,8195 0,83930,2919
Distribution
0,3770
19 497 19 415
0,37200,2880
21 131
0,41240,3274
160 162 20 745 23 939
0,3012 0,3352 0,3468
Measure Market incomeDisposable income Taxbase
1995Disposable income Taxbase
2000/2005
20 967
Disposable income "Karlsruhe proposal"
185

FFB-Publication list 89/106
Gender – Women
Total in Bill. EURMean in EUR
Median in EUR
Gini-CoeffizientAktinson Index mit ε = 1Aktinson Index mit ε = 2
Theil Index
Decile shares in %and decile limits in EUR
1. Decile 0,6 2 573 0,7 2 553 0,6 2 551 0,6 2 5562. Decile 2,5 7 815 3,0 7 718 2,8 7 799 2,8 7 8173. Decile 4,9 12 050 5,6 11 395 5,5 11 996 5,4 11 8344. Decile 6,9 15 837 7,5 14 439 7,5 15 376 7,4 15 1655. Decile 8,6 19 136 9,1 16 915 9,2 18 011 9,1 17 9796. Decile 10,1 22 016 10,4 19 047 10,5 20 233 10,4 20 3017. Decile 11,5 25 015 11,7 21 333 11,7 22 602 11,7 22 7438. Decile 13,2 28 980 13,2 24 355 13,2 25 694 13,2 25 9159. Decile 15,7 35 525 15,4 29 279 15,3 30 747 15,4 31 029
10. Decile 26,0 - 23,4 - 23,7 - 23,9 -90/10 Relation
R (%)k(EUR)
19 136
- 1 288 - 1 145
0,38700,33610,8554
46,5
0,8107
35,4
-7,3
Redistribution
- - 1 487-6,3 -5,6-
38,3 38,6
0,8183 0,81720,3093
Distribution
0,3589
17 979 18 011
0,35540,3076
0,35050,2976
16 915 18 335
Disposable income "Karlsruhe proposal"
131 111 118 118 18 258 17 237 20 373
Measure Market incomeDisposable income Taxbase
1995Disposable income Taxbase
2000/2005
0,3307 0,2531 0,2735 0,2794

FFB-Publication list 90/106
Family-Type – All
Total in Bill. EURMean in EUR
Median in EUR
Gini-CoeffizientAktinson Index mit ε = 1Aktinson Index mit ε = 2
Theil Index
Decile shares in %and decile limits in EUR
1. Decile 0,9 6 793 1,0 6 707 1,0 6 777 1,0 6 7952. Decile 3,1 14 141 3,6 13 265 3,5 13 956 3,4 13 8193. Decile 4,9 19 694 5,5 17 694 5,4 18 710 5,3 18 7404. Decile 6,3 23 933 6,8 21 095 6,7 22 332 6,7 22 3885. Decile 7,5 27 924 8,0 24 422 7,9 26 012 7,9 25 9946. Decile 8,7 32 474 9,2 28 211 9,2 30 122 9,1 30 0627. Decile 10,2 38 521 10,7 32 976 10,7 35 158 10,6 35 5038. Decile 12,3 46 671 12,6 39 228 12,6 41 683 12,6 42 3969. Decile 15,3 60 508 15,3 49 440 15,2 52 262 15,3 53 004
10. Decile 30,8 - 27,3 - 27,9 - 28,1 -90/10 Relation
R (%)k(EUR)
0,8436
Redistribution
0,8151 0,8237
29,6
0,4080 0,3423
36,3 27,0 29,3
0,38770,3314 0,2869 0,2975 0,30090,4172 0,3768 0,3837
- - 2 037- -5,9-8,1
25 994 34 532 30 749 27 924
30 470
Disposable income "Karlsruhe proposal"
Disposable income Taxbase 2000/2005
Distribution
1 017 839 897 905
Measure Market income
26 012
Disposable income Taxbase 1995
- 2 790-6,7
- 2 314
28 497 24 422
0,8072
0,3083 0,3326
Family-Type – Single (without children)
Total in Bill. EURMean in EUR
Median in EUR
Gini-CoeffizientAktinson Index mit ε = 1Aktinson Index mit ε = 2
Theil Index
Decile shares in %and decile limits in EUR
1. Decile 0,7 3 066 0,8 3 052 0,8 3 059 0,7 3 0602. Decile 2,5 7 774 3,0 7 678 2,8 7 770 2,8 7 7743. Decile 4,5 12 142 5,3 11 409 5,1 12 047 5,1 11 9024. Decile 6,5 16 394 7,3 14 784 7,3 15 755 7,1 15 6175. Decile 8,3 20 021 8,9 17 432 8,9 18 562 8,8 18 5726. Decile 9,8 23 059 10,2 19 669 10,2 20 890 10,2 20 9907. Decile 11,2 26 234 11,5 22 038 11,4 23 326 11,4 23 4938. Decile 12,8 30 392 12,9 25 110 12,9 26 486 12,9 26 7199. Decile 15,3 37 941 15,1 30 556 15,0 32 123 15,0 32 339
10. Decile 28,6 - 25,1 - 25,7 - 25,9 -90/10 Relation
R (%)k(EUR)
0,3953 0,2885 0,3171 0,3264
Measure Market incomeDisposable income Taxbase
1995Disposable income Taxbase
2000/2005Disposable income
"Karlsruhe proposal"
283 234 248 250
18 562 18 572 19 321 19 435
0,2956 0,3071 0,3101
Distribution
0,3648 0,3715 0,37520,40880,3441
34,3 35,1
0,8119 0,8222 0,8217
- 1 643 - 1 480-- -7,5 -6,7
0,8451
- 1 938-8,8
18 172 17 432
22 025 20 021
Redistribution
43,3 31,8

FFB-Publication list 91/106
Family-Type – Single (with Children)
Total in Bill. EURMean in EUR
Median in EUR
Gini-CoeffizientAktinson Index mit ε = 1Aktinson Index mit ε = 2
Theil Index
Decile shares in %and decile limits in EUR
1. Decile 2,3 9 095 2,5 8 844 2,3 8 915 2,3 9 0492. Decile 4,4 12 818 5,1 12 331 4,9 12 732 4,7 12 4983. Decile 5,7 15 860 6,5 14 849 6,3 15 668 6,0 15 2884. Decile 6,9 18 852 7,5 17 030 7,5 18 152 7,3 18 1675. Decile 8,1 21 697 8,6 19 187 8,6 20 442 8,5 20 7266. Decile 9,2 24 580 9,6 21 315 9,6 22 705 9,5 23 2017. Decile 10,4 27 817 10,6 23 740 10,6 25 216 10,7 26 0598. Decile 11,8 32 048 11,9 26 924 11,9 28 496 12,1 29 6509. Decile 14,1 39 985 13,9 32 713 13,9 34 529 14,1 36 096
10. Decile 27,2 - 23,7 - 24,3 - 24,9 -90/10 Relation
R (%)k(EUR)
0,3215 0,2226 0,2498 0,2603
Measure Market incomeDisposable income Taxbase
1995Disposable income Taxbase
2000/2005Disposable income
"Karlsruhe proposal"
33 28 30 30 25 168 22 461 23 034 21 126 21 697 20 442 20 726 19 187
Distribution
0,3453 0,3085 0,31890,29890,2136 0,1995 0,20000,18450,8790 0,7788 0,88740,8224
12,0 10,6 10,79,4
Redistribution
- -9,3 -7,4 -5,3- - 2 336 - 1 852 - 1 329
Family-Type – Married Couple (without Children)
Total in Bill. EURMean in EUR
Median in EUR
Gini-CoeffizientAktinson Index mit ε = 1Aktinson Index mit ε = 2
Theil Index
Decile shares in %and decile limits in EUR
1. Decile 0,9 10 698 1,1 10 649 1,0 10 689 1,0 10 6892. Decile 3,7 19 609 4,4 19 157 4,2 19 590 4,3 19 5423. Decile 5,3 25 328 6,1 23 868 6,0 25 108 6,1 24 7944. Decile 6,6 30 130 7,3 27 736 7,3 29 410 7,3 28 8995. Decile 7,7 35 190 8,4 31 668 8,4 33 569 8,4 33 0216. Decile 9,0 40 925 9,6 35 864 9,5 38 021 9,6 37 3217. Decile 10,4 47 489 10,8 40 598 10,8 42 935 10,8 41 9078. Decile 12,2 55 872 12,3 46 730 12,2 49 229 12,1 47 7299. Decile 14,7 70 887 14,6 57 622 14,4 60 463 14,2 58 291
10. Decile 29,5 - 25,3 - 26,2 - 26,3 -90/10 Relation
R (%)k(EUR)
0,3637 0,2539 0,2829 0,2895
Measure Market incomeDisposable income Taxbase
1995Disposable income Taxbase
2000/2005Disposable income
"Karlsruhe proposal"
279 233 247 243 42 290 35 266 37 518 36 807 35 190 31 668 33 569 33 021
Distribution
0,3930 0,3410 0,3506 0,34870,3144 0,2641 0,2765 0,27490,8280 0,7977 0,8080 0,8049
32,7 23,5 25,7 25,3
Redistribution
- -10,4 -8,5 -8,9- - 4 398 - 3 586 - 3 747

FFB-Publication list 92/106
Family-Type – Married Couple (with one Child)
Total in Bill. EURMean in EUR
Median in EUR
Gini-CoeffizientAktinson Index mit ε = 1Aktinson Index mit ε = 2
Theil Index
Decile shares in %and decile limits in EUR
1. Decile 3,2 21 320 3,8 20 387 3,7 21 434 3,6 21 2682. Decile 5,2 26 854 5,8 24 537 5,8 26 509 5,7 26 5053. Decile 6,1 31 045 6,7 27 825 6,8 30 024 6,7 30 4744. Decile 7,0 35 300 7,6 31 038 7,6 33 355 7,6 34 1825. Decile 8,0 39 799 8,4 34 377 8,4 36 800 8,5 37 8706. Decile 8,9 44 573 9,3 37 952 9,3 40 448 9,4 41 5937. Decile 10,0 50 320 10,3 42 196 10,2 44 786 10,3 45 9128. Decile 11,4 58 067 11,5 47 888 11,4 50 649 11,5 51 5359. Decile 13,6 72 791 13,5 58 551 13,3 61 712 13,2 62 088
10. Decile 26,5 - 23,1 - 23,6 - 23,6 -90/10 Relation
R (%)k(EUR)
0,2502 0,1693 0,1846 0,1895
Measure Market incomeDisposable income Taxbase
1995Disposable income Taxbase
2000/2005Disposable income
"Karlsruhe proposal"
175 145 155 157 47 201 38 904 41 704 42 402 39 799 34 377 36 800 37 870
Distribution
0,3157 0,2684 0,2719 0,27350,1681 0,1265 0,1318 0,13370,4366 0,3442 0,3300 0,3539
8,3 6,1 6,5 6,5
Redistribution
- -9,5 -8,8 -8,4- - 4 465 - 4 135 - 3 984
Family-Type – Married Couple (with two or more Children)
Total in Bill. EURMean in EUR
Median in EUR
Gini-CoeffizientAktinson Index mit ε = 1Aktinson Index mit ε = 2
Theil Index
Decile shares in %and decile limits in EUR
1. Decile 3,2 22 254 3,8 20 969 3,7 22 528 3,6 22 3262. Decile 5,1 27 346 5,7 24 736 5,8 27 067 5,5 26 5863. Decile 5,9 31 124 6,5 27 654 6,6 30 183 6,2 29 6654. Decile 6,7 35 082 7,2 30 713 7,3 33 306 6,9 33 4415. Decile 7,5 39 549 8,0 34 037 8,0 36 713 7,9 38 1686. Decile 8,5 44 436 8,9 37 711 8,8 40 473 9,0 42 8617. Decile 9,6 50 427 9,9 42 185 9,8 45 063 10,0 48 0248. Decile 11,0 59 051 11,2 48 579 11,0 51 646 11,3 54 9779. Decile 13,4 76 062 13,3 60 707 13,1 64 315 13,4 67 633
10. Decile 29,2 - 25,5 - 26,0 - 26,2 -90/10 Relation
R (%)k(EUR)
0,3428 0,2519 0,2661 0,2770
- - 4 852 - 4 673 - 3 446- -9,8 -9,4 -7,0
Redistribution
9,1 6,8 7,0 7,3
0,5248 0,3289 0,3511 0,34330,1906 0,1462 0,1500 0,1585
Distribution
0,3396 0,2906 0,2924 0,3048
39 549 34 037 36 713 38 168 49 506 40 327 43 614 45 232
MeasureDisposable income
"Karlsruhe proposal"
246 201 217 225
Market incomeDisposable income Taxbase
1995Disposable income Taxbase
2000/2005

FFB-Publication list 93/106
Forschungsinstitut Freie Berufe (FFB), Universität Lüneburg Publikationen
1 FFB-Jahresberichte
FFB-Jahresbericht 2003/04, FFB-Jahresbericht 2001/02, FFB-Jahresbericht 1999/00, FFB-Jahresbericht 1997/98, FFB-Jahresbericht 1996, FFB-Jahresbericht 1995, FFB-Jahresbericht 1994, FFB-Jahresbericht 1993, FFB-Jahresbericht 1992, FFB-Jahresbericht 1991, FFB: 10 Jahre Forschung und Lehre 1989-1999, FFB-Forschung und Lehre 1989-1998, FFB-Forschung und Lehre 1989-1997, FFB-Forschung und Lehre 1989-1996.
2 FFB-Bücher in der FFB-Schriftenreihe
Ehling, M. und J. Merz, 2002, Neue Technologien in der Umfrageforschung, FFB-Schriften Nr. 14, 181 Seiten, ISBN 3-7890-8241-4, NOMOS Verlagsgesellschaft, Baden-Baden. Preis: € 31,--
Merz, J., 2002, Freie Berufe im Wandel der Märkte, FFB-Schriften Nr. 13, 168 Seiten, ISBN 3-7890-8107-8, NOMOS Verlagsgesellschaft, Baden-Baden. Preis: € 29,--
Merz, J., 2001, Existenzgründung 2 – Erfolgsfaktoren und Rahmenbedingungen, FFB-Schriften Nr. 12, 232 Seiten, ISBN 3-7890-7462-4, NOMOS Verlagsgesellschaft, Baden-Baden.
Preis: € 40,- / € 71,- (i. Vb. mit Band 1)
Merz, J., 2001, Existenzgründung 1 – Tips, Training und Erfahrung, FFB-Schriften Nr. 11, 246 Seiten, ISBN 3-7890-7461-6, NOMOS Verlagsgesellschaft, Baden-Baden.Preis: € 40,- / € 71,- (i. Vb. mit Band 2)
Merz, J. und M. Ehling, 1999, Time Use – Research, Data and Policy, FFB-Schriften Nr. 10, 571 Seiten, ISBN 3-7890-6244-8, NOMOS Verlagsgesellschaft, Baden-Baden. Preis: € 49 ,-
Herrmann, H. und J. Backhaus, 1998, Staatlich gebundene Freiberufe im Wandel, FFB-Schriften Nr. 9, 234 Seiten, ISBN 3-7890-5319-8, NOMOS Verlagsgesellschaft, Baden-Baden. Preis: € 34,-
Herrmann, H., 1996, Recht der Kammern und Verbände Freier Berufe, Europäischer Ländervergleich und USA, FFB-Schriften Nr. 8, 596 Seiten, ISBN 3-7890-4545-4, NOMOS Verlagsgesellschaft, Baden-Baden. Preis: € 56,-
Merz, J., Rauberger, T. K. und A. Rönnau, 1994, Freie Berufe in Rheinland-Pfalz und in der Bundes-republik Deutschland – Struktur, Entwicklung und wirtschaftliche Bedeutung, FFB-Schriften Nr. 7, 948 Seiten, ISBN 3-927816-27-2, Lüneburg. Preis: € 95,-
Forschungsinstitut Freie Berufe (FFB) (Hrsg.), erstellt vom Zentrum zur Dokumentation für Naturheil-verfahren e.V. (ZDN), 1992, 1993, Dokumentation der besonderen Therapierichtungen und natür-lichen Heilweisen in Europa, Bd. I, 1. Halbband, 842 Seiten, Bd. I, 2. Halbband, 399 Seiten, Bd. II, 590 Seiten, Bd. III, 272 Seiten, Bd. IV, 419 Seiten, Bd. V, 1. Halbband, 706 Seiten, Bd. V, 2. Halbband, 620 Seiten, ISBN 3-88699-025-7, Lüneburg (nur zu beziehen über das Zentrum zur Dokumentation für Naturheilverfahren e.V. ZDN, Hufelandstraße 56, 45147 Essen, Tel.: 0201-74551). Preis: € 385,-
Sahner, H. und A. Rönnau, 1991, Freie Heilberufe und Gesundheitsberufe in Deutschland, FFB-Schriften Nr. 6, 653 Seiten, ISBN 3-927816-11-6, Lüneburg. Preis: € 58,-
Burmester, B., 1991, Ausbildungsvergleich von Sprachtherapeuten, FFB-Schriften Nr. 5, 54 Seiten, ISBN 3-927816-10-8, Lüneburg. Preis: € 9,-
Sahner, H., 1991, Freie Berufe in der DDR und in den neuen Bundesländern, FFB-Schriften Nr. 4, 177 Seiten, ISBN 3-927816-09-4, Lüneburg. Preis: € 25,-
Trautwein, H.-M., Donner, H., Semler, V. und J. Richter, 1991, Zur tariflichen Berücksichtigung der Aus-bildung, der Bereitstellung von Spitzenlastreserven und der Absicherung von Beschäftigungs-risiken bei Seelotsen, mit dem Anhang Steuerliche Aspekte des tariflichen Normaleinkommens der Seelotsen, FFB-Schriften Nr. 3, 183 Seiten, ISBN 3-927816-07-8, Lüneburg. Preis: € 19,-

FFB-Publication list 94/106
Sahner, H. und F. Thiemann, 1990, Zukunft der Naturheilmittel in Europa in Gefahr? FFB-Schriften Nr. 2, 81 Seiten, ISBN 3-927816-06-X, Lüneburg. Preis: € 6,-
Sahner, H., Herrmann, H., Rönnau, A. und H.-M. Trautwein, 1989, Zur Lage der Freien Berufe 1989, Teil III, FFB-Schriften Nr. 1, 167 Seiten, ISBN 3-927816-04-3, Lüneburg. Preis: € 25,-
Sahner, H., Herrmann, H., Rönnau, A. und H.-M. Trautwein, 1989, Zur Lage der Freien Berufe 1989, Teil II, FFB-Schriften Nr. 1, 955 Seiten, ISBN 3-927816-02-7, Lüneburg.
Preis: € 20,- / € 35,- (i. Vb. mit Teil I)
Sahner, H., Herrmann, H., Rönnau, A. und H.-M. Trautwein, 1989, Zur Lage der Freien Berufe 1989, Teil I, FFB-Schriften Nr. 1, 426 Seiten, ISBN 3-927816-01-9, Lüneburg.
Preis: € 20,- / € 35,- (i. Vb. mit Teil II)
3 FFB-Bücher
Merz, J., D. Hirschel und M. Zwick, 2005, Struktur und Verteilung hoher Einkommen - Mikroanalysen auf der Basis der Einkommensteuerstatistik, Lebenslagen in Deutschland, Der zweite Armuts- und Reichtumsbericht der Bundesregierung, Bundesministerium für Gesundheit und Soziale Sicherung, Berlin (http://www.bmgs.bund.de/download/broschueren/A341.pdf)
Merz, J. und J. Wagner (Hrg.), 2004, Perspektiven der MittelstandsForschung – Ökonomische Analysen zu Selbständigkeit, Freien Berufen und KMU, Merz, J., Schulte, R. and J. Wagner (Series Eds.), Entrepreneuship, Professions, Small Business Economics, CREPS-Schriftenreihe Vol. 1, 520 Seiten, Lit Verlag, ISBN 3-8258-8179-2, Münster. Preis: € 39,90
Merz, J. und M. Zwick (Hrg.), 2004, MIKAS – Mikroanalysen und amtliche Statistik, Statistisches Bundesamt (Serie Editor), Statistik und Wissenschaft, Vol. 1, 318 Seiten, ISBN 3-8246-0725-5, Wiesbaden
Preis: € 24,80
Hirschel, D., 2004, Einkommensreichtum und seine Ursachen – Die Bestimmungsfaktoren hoher Arbeitseinkommen, Hochschulschriften Band 82, 416 Seiten, Metropolis -Verlag Marburg, ISBN 3-89518-441-1.
Merz, J., 2001, Hohe Einkommen, ihre Struktur und Verteilung, Lebenslagen in Deutschland, Der erste Armuts- und Reichtumsbericht der Bundesregierung, Bundesministerium für Arbeit und Sozial-ordnung, 128 Seiten, Bonn, zu beziehen über: Bundesanzeiger Verlagsgesellschaft mbH, Süd-straße 119, 53175 Bonn.
Ehling, M. und J. Merz u. a., 2001, Zeitbudget in Deutschland – Erfahrungsberichte der Wissenschaft, Band 17 der Schriftenreihe Spektrum Bundesstatistik, 248 Seiten, Metzler-Poeschel Verlag, ISBN 3-8246-0645-3, Stuttgart. Preis: € 16,-
Krickhahn, T., 1995, Die Verbände des wirtschaftlichen Mittelstands in Deutschland, 351 Seiten, DUV Deutscher Universitäts Verlag, ISBN 3-8244-0245-9, Wiesbaden. Preis: € 62,-
Spahn, P. B., Galler, H. P., Kaiser, H., Kassella, T. und J. Merz, 1992, Mikrosimulation in der Steuer-politik, 279 Seiten, Springer Verlag, ISBN 3-7908-0611-0, Berlin. Preis: € 45,-
4 FFB-Reprints
Merz, J., Kumulation von Mikrodaten – Konzeptionelle Grundlagen und ein Vorschlag zur Realisierung,; in: Allgemeines Statistisches Archiv, Issue 88, S. 451-472, 2004 FFB-Reprint Nr. 35
Merz, J., Einkommens-Reichtum in Deutschland - Mikroanalytische Ergebnisse der Einkommensteuer-statistik für Selbständige und abhängig Beschäftigte, in: Perspektiven der Wirtschaftspolitik, Vol. 5, Issue 2, S. 105-126, 2004 FFB-Reprint Nr. 34
Merz, J., Vorgrimler, D. und M. Zwick, Faktisch anonymisiertes Mikrodatenfile der Lohn- und Einkom-mensteuerstatistik 1998, in: Wirtschaft und Statistik, Issue 10, S. 1079-1091, 2004
FFB-Reprint Nr. 33

FFB-Publication list 95/106
Ackermann, D., Merz, J. and H. Stolze, Erfolg und Erfolgsfaktoren freiberuflich tätiger Ärzte – Ergebnisse der FFB-Ärzteumfrage für Niedersachsen, in: Merz, J. and J. Wagner (Eds.), Perspektiven der MittelstandsForschung – Ökonomische Analysen zu Selbständigkeit, Freien Berufen und KMU, Merz, J., Schulte, R. and J. Wagner (Series Eds.), Entrepreneuship, Professions, Small Business Economics, CREPS-Schriftenreihe Vol. 1, Lit Verlag, Münster, pp. 165-190, 2004 FFB-Reprint Nr. 32
Hirschel, D. und J. Merz, Was erklärt hohe Arbeitseinkommen Selbständiger – Eine Mikroanalyse mi Daten des Sozioökonomischen Panels, in: Merz, J. and J. Wagner (Eds.), Perspektiven der Mittel-standsForschung – Ökonomische Analysen zu Selbständigkeit, Freien Berufen und KMU, Merz, J., Schulte, R. and J. Wagner (Series Eds.), Entrepreneuship, Professions, Small Business Economics, CREPS-Schriftenreihe Vol. 1, Lit Verlag, Münster, pp. 265-285, 2004
FFB-Reprint Nr. 31
Burgert, D. und J. Merz, Wer arbeitet wann? – Arbeitszeitarrangements von Serlbständigen und abhängig Beschäftigten: Eine mikroökonometrische Analyse deutscher Zeitbudgetdaten, in: Merz, J. and J. Wagner (Eds.), Perspektiven der MittelstandsForschung – Ökonomische Analysen zu Selbständigkeit, Freien Berufen und KMU, Merz, J., Schulte, R. and J. Wagner (Series Eds.), Entrepreneuship, Professions, Small Business Economics, CREPS-Schriftenreihe Vol. 1, Lit Verlag, Münster, pp. 303-330, 2004 FFB-Reprint Nr. 30
Merz, J. und M. Zwick, Hohe Einkommen – Eine Verteilungsanalyse für Freie Berufe, Unternehmer und abhängige Beschäftigte, in: Merz, J. and M. Zwick (Eds.), MIKAS – Mikroanalysen und amtliche Statistik, Statistik und Wissenschaft, Vol. 1, pp. 167-193, 2004 FFB-Reprint Nr. 29
Merz, J., Schatz, C. and K. Kortmann, Mikrosimulation mit Verwaltungs- und Befragungsdaten am Beispiel ‚Altersvorsorge in Deutschland 1996’ (AVID ‚96), in: Merz, J. und M. Zwick (Hg.), MIKAS – Mikroanalysen und amtliche Statistik, Statistik und Wissenschaft, Vol. 1, S. 231-248, 2004 FFB-Reprint Nr. 28
Merz, J., Was fehlt in der EVS ? – Eine Verteilungsanalyse hoher Einkommen mit der verknüpften Ein-kommensteuerstatistik für Selbständige und abhängig Beschäftigte, in: Jahrbücher für Nationalökonomie und Statistik, Vol. 223/1, p. 58-90, 2003 FFB-Reprint Nr. 27
Merz, J. und M. Zwick, Verteilungswirkungen der Steuerreform 2000/2005 im Vergleich zum ‚Karlsruher Entwurf’ – Auswirkungen auf die Einkommensverteilung bei Selbständigen (Freie Berufe, Unternehmer) und abhängig Beschäftigte, in: Wirtschaft und Statistik, 8/2002, p. 729-740, 2002 FFB-Reprint Nr. 26
Merz, J., Time Use Research and Time Use Data – Actual Topics and New Frontiers, in: Ehling, M. and J. Merz (Eds.), Neue Technologien in der Umfrageforschung – Anwendungen bei der Erhebung von Zeitverwendung, p. 3-19, 2002 FFB-Reprint Nr. 25
Merz, J., 2002, Time and Economic Well-Being – A Panel Analysis of Desired versus Actual Working Hours, in: Review of Income and Wealth, Series 48, No. 3, p. 317-346, FFB-Reprint Nr. 24, Department of Economics and Social Sciences, University of Lüneburg, Lüneburg.
FFB-Reprint Nr. 24
Schatz, Ch., Kortmann, K. und J. Merz, 2002, Künftige Alterseinkommen - Eine Mikrosimulationsstudie zur Entwicklung der Renten und Altersvorsorge in Deutschland (AVID’96), in: Schmollers Jahr-buch, Journal of Applied Social Sciences, Zeitschrift für Wirtschafts- und Sozialwissenschaften, 122. Jahrgang, Heft 2, S. 227-260, FFB-Reprint Nr. 23, Fachbereich Wirtschafts- und Sozial-wissenschaften, Universität Lüneburg, Lüneburg. FFB-Reprint Nr. 23
Merz, J. und M. Zwick, 2001, Über die Analyse hoher Einkommen mit der Einkommensteuerstatistik – Eine methodische Erläuterung zum Gutachten „Hohe Einkommen, ihre Struktur und Verteilung“ zum ersten Armuts- und Reichtumsbericht der Bundesregierung, in: Wirtschaft und Statistik 7/2001, S. 513-523, FFB-Reprint Nr. 22, Fachbereich Wirtschafts - und Sozialwissenschaften, Universität Lüneburg, Lüneburg. FFB-Reprint Nr. 22

FFB-Publication list 96/106
Merz, J., 2001, Was fehlt in der EVS? Eine Verknüpfung mit der Einkommensteuerstatistik für die Verteilungsanalyse hoher Einkommen, in: Becker, I., Ott, N. und G. Rolf (Hrsg.), Soziale Siche-rung in einer dynamischen Gesellschaft, S. 278-300, Campus Verlag, Frankfurt/New York, FFB-Reprint Nr. 21, Fachbereich Wirtschafts - und Sozialwissenschaften, Universität Lüneburg, Lüne-burg. FFB-Reprint Nr. 21
Merz, J., 2001, 10 Jahre Forschungsinstitut Freie Berufe (FFB) der Universität Lüneburg – Forschungs-schwerpunkte und Perspektiven, in: Bundesverband der Freien Berufe (Hrsg.), Jahrbuch 2000/2001, der freie beruf, S. 158-174, Bonn, FFB-Reprint Nr. 20, Fachbereich Wirtschafts - und Sozialwissenschaften, Universität Lüneburg, Lüneburg. FFB-Reprint Nr. 20
Merz, J., 2000, The Distribution of Income of Self-employed, Entrepreneurs and Professions as Revealed from Micro Income Tax Statistics in Germany, in: Hauser, R. and I. Becker (eds.), The Personal Distribution of Income in an International Perspective, S. 99-128, Springer Verlag, Heidelberg, FFB-Reprint Nr.19, Department of Economics and Social Sciences, University of Lüneburg, Lüneburg. FFB-Reprint Nr. 19
Merz, J., 1998, Privatisierung, Deregulierung und staatlich gebundene Freie Berufe – Einige ökonomische Aspekte, in: Herrmann, H. und J. Backhaus (Hrsg.), Staatlich gebundene Freiberufe im Wandel, S. 67-114, FFB-Schriften Nr. 9, NOMOS Verlagsgesellschaft, Baden-Baden, FFB-Reprint Nr. 18, Fachbereich Wirtschafts- und Sozialwissenschaften, Universität Lüneburg, Lüneburg.
FFB-Reprint Nr. 18
Merz. J., 1997, Die Freien Berufe – Laudatio zur Verleihung der Ehrendoktorwürde des Fachbereiches Wirtschafts - und Sozialwissenschaften der Universität Lüneburg an Prof. J. F. Volrad Deneke, in: Bundesverband der Freien Berufe (Hrsg.), Jahrbuch 1997, der freie beruf, S. 133-151, Bonn, FFB-Reprint Nr. 17, Fachbereich Wirtschafts- und Sozialwissenschaften, Universität Lüneburg, Lüneburg. FFB-Reprint Nr. 17
de Kam, C. A., de Haan, J., Giles, C., Manresa, A., Berenguer, E., Calonge, S., Merz, J. and K. Venkatarama, 1996, Who pays the taxes? The Distribution of Effective Tax Burdens in Four EU Countries, in: ec Tax Review, p. 175-188, FFB-Reprint No. 16, Department of Economics and Social Sciences, University of Lüneburg, Lüneburg. FFB-Reprint Nr. 16
Merz, J., 1996, MICSIM – A PC Microsimulation Model for Research and Teaching: A Brief View on its’ Concept and Program Developments, SoftStat ’95 – Advances in Statistical Software 5, in: Faulbaum, F. and W. Bandilla (eds.), Stuttgart, p. 433-442, FFB-Reprint No. 15, Department of Economics and Social Sciences, University of Lüneburg, Lüneburg. FFB-Reprint Nr. 15
Burkhauser, R. V., Smeeding, T. M. and J. Merz, 1996, Relative Inequality and Poverty in Germany and the United States using Alternative Equivalence Scales, in: Review of Income and Wealth, Series 42, No. 4, p. 381-400, FFB-Reprint No. 14, Department of Economics and Social Sciences, University of Lüneburg, Lüneburg. FFB-Reprint Nr. 14
Merz, J. 1996, Schattenwirtschaft und Arbeitsplatzbeschaffung, in: Sadowski, D. und K. Pull (Hrsg.), Vorschläge jenseits der Lohnpolitik, S. 266-294, Frankfurt/New York, FFB-Reprint Nr. 13, Fachbereich Wirtschafts- und Sozialwissenschaften, Universität Lüneburg, Lüneburg. FFB-Reprint Nr. 13
Merz, J., 1996, MICSIM – Concept, Developments and Applications of a PC Microsimulation Model for Research and Teaching, in: Troitzsch, K. G., Mueller, U. Gilbert, G. N. and J. E. Doran (eds.), Social Science Microsimulation, p. 33-65, Berlin/New York, FFB-Reprint No. 12, Department of Economics and Social Sciences, University of Lüneburg, Lüneburg. FFB-Reprint Nr. 12
Merz, J., 1996, Market and Non-Market Labour Supply and the Impact of the Recent German Tax Reform – Incorporating Behavioural Response, in: Harding, A. (ed.), Microsimulation and Public Policy, p. 177-202, Amsterdam/Tokyo, FFB-Reprint No. 11, Department of Economics and Social Sciences, University of Lüneburg, Lüneburg. FFB-Reprint Nr. 11
Merz, J. und R. Lang, 1996, Alles eine Frage der Zeit!? – Bericht über ein FFB-Forschungsprojekt zum Thema 'Zeitverwendung in Erwerbstätigkeit und Haushaltsproduktion – Dynamische Mikroana-lysen mit Paneldaten', in: Uni Lüneburg – 50 Jahre Hochschule in Lüneburg, Jubiläums -Sonder-ausgabe, Heft 19/Mai 1996, S. 51-55, FFB-Reprint Nr. 10, Fachbereich Wirtschafts- und Sozial-wissenschaften, Universität Lüneburg, Lüneburg. FFB-Reprint Nr. 10

FFB-Publication list 97/106
Merz, J. und D. Kirsten, 1996, Freie Berufe im Mikrozensus – Struktur, Einkommen und Einkommens-verteilung in den neuen und alten Bundesländern, in: BFB Bundesverband der Freien Berufe (Hrsg.), Jahrbuch 1996, S. 40-79, Bonn, FFB-Reprint Nr. 9, Fachbereich Wirtschafts- und Sozial-wissenschaften, Universität Lüneburg, Lüneburg. FFB-Reprint Nr. 9
Deneke, J. F. V., 1995, Freie Berufe – Gestern, Heute, Morgen, in: BFB Bundesverband der Freien Berufe (Hrsg.), Jahrbuch 1995, S. 57-72, Bonn, FFB-Reprint Nr. 8, Fachbereich Wirtschafts- und Sozialwissenschaften, Universität Lüneburg, Lüneburg. FFB-Reprint Nr. 8
Merz, J. and J. Faik, 1995, Equivalence Scales Based on Revealed Preference Consumption Expenditures – The Case of Germany, in: Jahrbücher für Nationalökonomie und Statistik, Vol. 214, No. 4, p. 425-447, Stuttgart, FFB-Reprint No. 7, Department of Economics and Social Sciences, University of Lüneburg, Lüneburg. FFB-Reprint Nr. 7
Merz, J., 1993, Statistik und Freie Berufe im Rahmen einer empirischen Wirtschafts- und Sozial-forschung, in: BFB Bundesverband der Freien Berufe (Hrsg.), Jahrbuch 1993, S. 31-78, Bonn, FFB-Reprint Nr. 6, Fachbereich Wirtschafts- und Sozialwissenschaften, Universität Lüneburg, Lüneburg. FFB-Reprint Nr. 6
Merz, J., 1993, Wandel in den Freien Berufen – Zum Forschungsbeitrag des Forschungsinsituts Freie Berufe (FFB) der Universität Lüneburg, in: BFB Bundesverband der Freien Berufe (Hrsg.), Jahr-buch 1993, S. 164-173, Bonn, FFB-Reprint Nr. 5, Fachbereich Wirtschafts- und Sozialwissen-schaften, Universität Lüneburg, Lüneburg. FFB-Reprint Nr. 5
Merz, J. and K. G. Wolff, 1993, The Shadow Economy: Illicit Work and Household Production: A Microanalysis of West Germany, in: Review of Income and Wealth, Vol. 39, No. 2, p. 177-194, FFB-Reprint No. 4, Department of Economics and Social Sciences, University of Lüneburg, Lüneburg FFB-Reprint Nr. 4
Trautwein, H.-M. und A. Rönnau, 1993, Self-Regulation of the Medical Profession in Germany: A Survey, Faure, in: M., Finsinger, J., Siegers, J. und R. van den Bergh (eds.), Regulation of Profession, p. 249-305, ISBN 90-6215-334-8, MAKLU, Antwerpen, FFB-Reprint No. 3, Depart-ment of Economics and Social Sciences, University of Lüneburg, Lüneburg. FFB-Reprint Nr. 3
Herrmann, H., 1993, Regulation of Attorneys in Germany: Legal Framework and Actual Tendencies of Deregulation, in: Faure, M., Finsinger, J., Siegers, J. und R. van den Bergh (eds.), Regulation of Profession, p. 225-245, ISBN 90-6215-334-8, MAKLU, Antwerpen, FFB-Reprint No. 2, Depart-ment of Economics and Social Sciences, University of Lüneburg, Lüneburg. FFB-Reprint Nr. 2
Merz, J., 1991, Microsimulation – A Survey of Principles, Developments and Applications, in: Inter-national Journal of Forecasting 7, p. 77-104, ISBN 0169-2070-91, North-Holland, Amsterdam, FFB-Reprint Nr. 1, Department of Economics and Social Sciences, University of Lüneburg, Lüne-burg. FFB-Reprint Nr. 1
5 FFB-Diskussionspapiere, ISSN 0942-2595
Merz, J. und Paic, P., 2005, Start-up success of freelancers – New microeconometric evidence from the German Socio-Economic Panel. FFB-Diskussionspapier Nr. 56, Fachbereich Wirtschafts - und Sozialwissenschaften, Universität Lüneburg, Lüneburg. FFB-DP Nr. 56
Merz, J. und Paic, P., 2005, Erfolgsfaktoren freiberuflicher Existenzgründung – Neue mikroökonometrische Ergebnisse mit Daten des Sozio -ökonomischen Panels, FFB-Diskussionspapier Nr. 55, Fachbereich Wirtschafts- und Sozialwissenschaften, Universität Lüneburg, Lüneburg. FFB-DP Nr. 55
Merz, J. und Stolze, H., 2005, Representative Time Use Data and Calibration of the American Time Use Studies 1965-1999, FFB-Diskussionspapier Nr. 54, Fachbereich Wirtschafts- und Sozialwissenschaften, Universität Lüneburg, Lüneburg. FFB-DP Nr. 54
Paic, P. und Brand, H., 2005, Die Freien Berufe im Sozio-ökonomischen Panel - Systematische Berichtigung der kritischen Wechsel innerhalb der Selbständigengruppe, FFB-Diskussionspapier Nr. 53, Fachbereich Wirtschafts- und Sozialwissenschaften, Universität Lüneburg, Lüneburg.
FFB-DP Nr. 53

FFB-Publication list 98/106
Merz, J., und Paic, P., 2005, Zum Einkommen der Freien Berufe – Eine Ordered Probit-Analyse ihrer Determinanten auf Basis der FFB-Onlineumfrage, FFB-Diskussionspapier Nr. 52, Fachbereich Wirtschafts - und Sozialwissenschaften, Universität Lüneburg, Lüneburg. FFB-DP Nr. 52
Burgert, D., 2005, Schwellenwerte im deutschen Kündigungsschutzrecht – Ein Beschäftigungshindernis für kleine Unternehmen?, FFB-Diskussionspapier Nr. 50, Fachbereich Wirtschafts- und Sozialwissenschaften, Universität Lüneburg, Lüneburg. FFB-DP Nr. 51
Merz, J., Böhm P. und Burgert D., 2005, Arbeitsze itarrangements und Einkommensverteilung – Ein Treatment Effects Ansatz der Einkommensschätzung für Unternehmer, Freiberufler und abhängig Beschäftigte, FFB-Diskussionspapier Nr. 50, Fachbereich Wirtschafts - und Sozialwissenschaften, Universität Lüneburg, Lüneburg. FFB-DP Nr. 50
Burgert, D., 2005, The Impact of German Job Protection Legislation on Job Creation in Small Establis hments – An Application of the Regression Discontinuity Design, FFB-Diskussionspapier Nr. 49, Fachbereich Wirtschafts- und Sozialwissenschaften, Universität Lüneburg, Lüneburg.
FFB-DP Nr. 49
Merz, J. und D. Burgert, 2005, Arbeitszeitarrangements – Neue Ergebnisse aus der nationalen Zeit-budgeterhebung 2001/02 im Zeitvergleich, FFB-Diskussionspapier Nr. 46, Fachbereich Wirt-schafts - und Sozialwissenschaften, Universität Lüneburg, Lüneburg. FFB-DP Nr. 48
Merz, J., Böhm, P. und D. Burgert, 2005, Timing, Fragmentation of Work and Income Inequality – An Earnings Treatment Effects Approach, FFB-Diskussionspapier Nr. 47, Fachbereich Wirtschafts- und Sozialwissenschaften, Universität Lüneburg, Lüneburg. FFB-DP Nr. 47
Merz, J. und P. Paic, 2004, Existenzgründungen von Freiberuflern und Unternehmer – Eine Mikroanalyse mit dem Sozio-ökonomischen Panel, FFB-Diskussionspapier Nr. 46, Fachbereich Wirtschafts - und Sozialwissenschaften, Universität Lüneburg, Lüneburg. FFB-DP Nr. 46
Merz, J. und D. Burgert, 2004, Wer arbeitet wann? Arbeitszeitarrangements von Selbständigen und abhängig Beschäftigten – Eine mikroökonometrische Analyse deutscher Zeitbudgetdaten, FFB-Diskussionspapier Nr. 45, Fachbereich Wirtschafts- und Sozialwissenschaften, Universität Lüne-burg, Lüneburg FFB-DP Nr. 45
Hirschel, D. und J. Merz, 2004, Was erklärt hohe Arbeitseinkommen der Selbständigen – Eine Mikroana-lyse mit Daten des Sozio-ökonomischen Panels, FFB-Diskussionspapier Nr. 44, Fachbereich Wirt-schafts - und Sozialwissenschaften, Universität Lüneburg, Lüneburg. FFB-DP Nr. 44
Ackermann, D., Merz, J. und H. Stolze, 2004, Erfolg und Erfolgsfaktoren freiberuflich tätiger Ärzte – Er-gebnisse der FFB-Ärztebefragung für Niedersachsen, FFB-Diskussionspapier Nr. 43, Fachbereich Wirtschafts - und Sozialwissenschaften, Universität Lüneburg, Lüneburg. FFB-DP Nr. 43
Hirschel, D., 2003, Do high incomes reflect individual performance? The determinants of high incomes in Germany, FFB-Diskussionspapier Nr. 42, Department of Economics and Social Sciences, University of Lüneburg, Lüneburg. FFB-DP Nr. 42
Merz, J., and D. Burgert, 2003, Working Hour Arrangements and Working Hours – A Microeconometric Analysis Based on German Time Diary Data, FFB-Diskussionspapier Nr. 41, Department of Eco-nomics and Social Sciences, University of Lüneburg, Lüneburg. FFB-DP Nr. 41
Merz, J. und M. Zwick, 2002, Hohe Einkommen: Eine Verteilungsanalyse für Freie Berufe, Unternehmer und abhängig Beschäftigte, Eine Mikroanalyse auf der Basis der Einkommensteuerstatistik, FFB-Diskussionspapier Nr. 40, Fachbereich Wirtschafts- und Sozialwissenschaften, Universität Lüne-burg, Lüneburg. FFB-DP Nr. 40
Merz, J., and D. Hirschel, 2003, The distribution and re-distribution of income of self-employed as freelancers and entrepreneurs in Europe, FFB-Diskussionspapier Nr. 39, Department of Economics and Social Sciences, University of Lüneburg, Lüneburg. FFB-DP Nr. 39
Stolze, H. 2002, Datenbankbankgestützte Internetpräsenzen – Entwicklung und Realisation am Beispiel der Homepage des Forschungsinstituts Freie Berufe (FFB) der Universität Lüneburg http://ffb.uni-lueneburg.de, FFB-Diskussionspapier Nr. 38, Fachbereich Wirtschafts- und Sozialwissenschaften, Universität Lüneburg, Lüneburg. FFB-DP Nr. 38

FFB-Publication list 99/106
Merz, J., 2002, Zur Kumulation von Haushaltsstichproben, FFB-Diskussionspapier Nr. 37, Fachbereich Wirtschafts - und Sozialwissenschaften, Universität Lüneburg, Lüneburg. FFB-DP Nr. 37
Merz, J., 2002, Reichtum in Deutschland: Hohe Einkommen, ihre Struktur und Verteilung – Eine Mikro-analyse mit der Einkommensteuerstatistik für Selbständige und abhängig Beschäftigte, FFB-Dis -kussionspapier Nr. 36, Fachbereich Wirtschafts- und Sozialwissenschaften, Universität Lüneburg, Lüneburg. FFB-DP Nr. 36
Merz, J. und M. Zwick, 2002, Verteilungswirkungen der Steuerreform 2000/2005 im Vergleich zum ‚Karlsruher Entwurf Auswirkungen auf die Einkommensverteilung bei Selbständigen (Freie Berufe, Unternehmer und abhängig Beschäftigte), FFB-Diskussionspapier Nr. 35, Fachbereich Wirtschafts - und Sozialwissenschaften, Universität Lüneburg, Lüneburg. FFB-DP Nr. 35
Merz, J., Stolze, H. und M. Zwick, 2002, Professions, entrepreneurs, employees and the new German tax (cut) reform 2000 – A MICSIM microsimulation analysis of distributional impacts, FFB-Diskussionspapier Nr. 34, Department of Economics and Social Sciences, University of Lüneburg, Lüneburg. FFB-DP Nr. 34
Forschungsinstitut Freie Berufe, 2002, Freie Berufe im Wandel der Märkte - 10 Jahre Forschungsinstitut Freie Berufe (FFB) der Universität Lüneburg, Empfang am 4. November 1999 im Rathaus zu Lüneburg, FFB-Diskussionspapier Nr. 33, Fachbereich Wirtschafts - und Sozialwissenschaften, Universität Lüneburg, Lüneburg. FFB-DP Nr. 33
Merz, J., 2002, Time Use Research and Time Use Data – Actual Topics and New Frontiers, FFB-Discussion Paper No. 32, Department of Economics and Social Sciences, University of Lüneburg, Lüneburg. FFB-DP Nr. 32
Merz, J., 2001, Freie Berufe im Wandel der Arbeitsmärkte, FFB-Diskussionspapier Nr. 31, Fachbereich Wirtschafts - und Sozialwissenschaften, Universität Lüneburg, Lüneburg. FFB-DP Nr. 31
Merz, J., 2001, Was fehlt in der EVS? Eine Verteilungsanalyse hoher Einkommen mit der verknüpften Einkommensteuerstatistik für Selbständige und abhängig Beschäftigte, FFB-Diskussionspapier Nr. 30, Fachbereich Wirtschafts- und Sozialwissenschaften, Universität Lüneburg, Lüneburg.
FFB-DP Nr. 30
Merz, J., 2001, Informationsfeld Zeitverwendung – Expertise für die Kommission zur Verbesserung der informationellen Infrastruktur zwischen Wissenschaft und Statistik, FFB-Diskussionspapier Nr. 29, Fachbereich Wirtschafts- und Sozialwissenschaften, Universität Lüneburg, Lüneburg.
FFB-DP Nr. 29
Schatz, C. und J. Merz, 2000, Die Rentenreform in der Diskussion – Ein Mikrosimulationsmodell für die Altersvorsorge in Deutschland (AVID-PTO), FFB-Diskussionspapier Nr. 28, Fachbereich Wirt-schafts - und Sozialwissenschaften, Universität Lüneburg, Lüneburg. FFB-DP Nr. 28
Merz, J., 2000, The Distribution of Income of Self-employed, Entrepreneurs and Professions as Revealed from Micro Income Tax Statistics in Germany, FFB-Discussion Paper No. 27, Department of Economics and Social Sciences, University of Lüneburg, Lüneburg. FFB-DP Nr. 27
Merz, J., Loest, O. und A. Simon, 1999, Existenzgründung – Wie werde ich selbständig, wie werde ich Freiberufler? Ein Leitfaden, FFB-Diskussionspapier Nr. 26, Fachbereich Wirtschafts- und Sozial-wissenschaften, Universität Lüneburg, Lüneburg. FFB-DP Nr. 26
Merz, J. und D. Kirsten, 1998, Extended Income Inequality and Poverty Dynamics of Labour Market and Valued Household Acitivities – A Ten Years Panelanalysis for Professions, Entrepreneurs and Employees in Germany, FFB-Discussion Paper No. 25, Department of Economics and Social Sciences, University of Lüneburg, Lüneburg. FFB-DP Nr. 25
Merz, J., Quiel, T., und K. Venkatarama, 1998, Wer bezahlt die Steuern? – Eine Untersuchung der Steuerbelastung und der Einkommenssituation für Freie und andere Berufe, FFB-Diskussions-papier Nr. 24, Fachbereich Wirtschafts- und Sozialwissenschaften, Universität Lüneburg, Lüne-burg.
FFB-DP Nr. 24

FFB-Publication list 100/106
Merz, J. und R. Lang, 1997, Preferred vs. Actual Working Hours – A Ten Paneleconometric Analysis for Professions, Entrepreneurs and Employees in Germany, FFB-Discussion Paper No. 23, Depart-ment of Economics and Social Sciences, University of Lüneburg, Lüneburg. FFB-DP Nr. 23
Merz, J., 1997, Privatisierung und Deregulierung und Freie und staatlich gebundene Freie Berufe – Einige ökonomische Aspekte, FFB-Diskussionspapier Nr. 22, Fachbereich Wirtschafts - und Sozial-wissenschaften, Universität Lüneburg, Lüneburg. FFB-DP Nr. 22
de Kam, C. A., de Haan, J., Giles, C., Manresa, A., Berenguer, E., Calonge, S., Merz, J. and K. Venkatarama, 1996, The Distribution of Effetcive Tax Burdens in Four EU Countries, FFB-Discussion Paper No. 21, Department of Economics and Social Sciences, University of Lüneburg, Lüneburg. FFB-DP Nr. 21
Deneke, J. F. V., 1996, Freie Berufe und Mittelstand – Festrede zur Verleihung der Ehrendoktorwürde, FFB-Diskussionspapier Nr. 20, Fachbereich Wirtschafts- und Sozialwissenschaften, Universität Lüneburg, Lüneburg. FFB-DP Nr. 20
Merz, J., 1996, Die Freien Berufe – Laudatio zur Verleihung der Ehrendoktorwürde des Fachbereiches Wirtschafts - und Sozialwissenschaften der Universität Lüneburg an Prof. J. F. Volrad Deneke, FFB-Diskussionspapier Nr. 19, Fachbereich Wirtschafts- und Sozialwissenschaften, Universität Lüneburg, Lüneburg. FFB-DP Nr. 19
de Kam, C. A., de Haan, J., Giles, C., Manresa, A., Berenguer, E., Calonge, S. and J. Merz, 1996, Who pays the taxes?, FFB-Discussion Paper No. 18, Department of Economics and Social Sciences, University of Lüneburg, Lüneburg. FFB-DP Nr. 18
Merz, J., 1996, Schattenwirtschaft und ihre Bedeutung für den Arbeitsmarkt, FFB-Diskussionspapier Nr. 17, Fachbereich Wirtschafts- und Sozialwissenschaften, Universität Lüneburg, Lüneburg.
FFB-DP Nr. 17
Merz, J. und D. Kirsten, 1995, Freie Berufe im Mikrozensus II – Einkommen und Einkommensverteilung anhand der ersten Ergebnisse für die neuen und alten Bundesländer 1991, FFB-Diskussionspapier Nr. 16, Fachbereich Wirtschafts- und Sozialwissenschaften, Universität Lüneburg, Lüneburg.
FFB-DP Nr. 16
Merz, J. und D. Kirsten, 1995, Fre ie Berufe im Mikrozensus I – Struktur und quantitative Bedeutung anhand der ersten Ergebnisse für die neuen und alten Bundesländer 1991, FFB-Diskussionspapier Nr. 15, Fachbereich Wirtschafts- und Sozialwissenschaften, Universität Lüneburg, Lüneburg.
FFB-DP Nr. 15
Merz, J., 1995, MICSIM – Concept, Developments and Applications of a PC-Microsimulation Model for Research and Teaching, FFB-Discussion Paper No. 14, Department of Economics and Social Sciences, University of Lüneburg, Lüneburg. FFB-DP Nr. 14
Rönnau, A., 1995, Freie Berufe in der DDR, der Bundesrepublik Deutschland und im wiedervereinten Deutschland: Auswertungen von Berufstätigenerhebung und Arbeitsstättenzählung, FFB-Diskus-sionspapier Nr. 13, Fachbereich Wirtschafts - und Sozialwissenschaften, Universität Lüneburg, Lüneburg. FFB-DP Nr. 13
Burkhauser, R. V., Smeeding, T. M. and J. Merz, 1994, Relative Inequality and Poverty in Germany and the United States Using Alternative Equivalence Scales, FFB-Discussion Paper No. 12, Depart-ment of Economics and Social Sciences, University of Lüneburg, Lüneburg. FFB-DP Nr. 12
Widmaier, U., Niggemann, H. and J. Merz, 1994, What makes the Difference between Unsuccessful and Successful Firms in the German Mechanical Engineering Industry? A Microsimulation Approach Using Data from the NIFA-Panel, FFB-Discussion Paper No. 11, Department of Economics and Social Sciences, University of Lüneburg, Lüneburg. FFB-DP Nr. 11
Merz, J., 1994, Microdata Adjustment by the Minimum Information Loss Principle, FFB-Discussion Paper No. 10, Department of Economics and Social Sciences, University of Lüneburg, Lüneburg.
FFB-DP Nr. 10
Merz, J., 1994, Microsimulation – A Survey of Methods and Applications for Analyzing Economic and Social Policy, FFB-Discussion Paper No. 9, Department of Economics and Social Sciences, University of Lüneburg, Lüneburg. FFB-DP Nr. 9

FFB-Publication list 101/106
Merz, J., Garner, T., Smeeding, T. M., Faik, J. and D. Johnson, 1994, Two Scales, One Methodology – Expenditure Based Equivalence Scales for the United States and Germany, FFB-Discussion Paper No. 8, Department of Economics and Social Sciences, University of Lüneburg, Lüneburg.
FFB-DP Nr. 8
Krickhahn, T., 1993, Lobbyismus und Mittelstand: Zur Identifikation der Interessenverbände des Mittel-stands in der Bundesrepublik Deutschland, FFB-Diskussionspapier Nr. 7, Fachbereich Wirt-schafts - und Sozialwissenschaften, Universität Lüneburg, Lüneburg. FFB-DP Nr. 7
Merz, J., 1993, Market and Non-Market Labor Supply and Recent German Tax Reform Impacts – Behavioral Response in a Combined Dynamic and Static Microsimulation Model, FFB-Discussion Paper No. 6, Department of Economics and Social Sciences, University of Lüneburg, Lüneburg. FFB-DP Nr. 6
Merz, J., 1993, Microsimulation as an Instrument to Evaluate Economic and Social Programmes, FFB-Discussion Paper No. 5, Department of Economics and Social Sciences, University of Lüneburg, Lüneburg. FFB-DP Nr. 5
Merz, J., 1993, Statistik und Freie Berufe im Rahmen einer empirischen Wirtschafts- und Sozial-forschung, Antrittsvorlesung im Fachbereich Wirtschafts- und Sozialwissenschaften der Universi-tät Lüneburg, FFB-Diskussionspapier Nr. 4, Fachbereich Wirtschafts - und Sozialwissenschaften, Universität Lüneburg, Lüneburg. FFB-DP Nr. 4
Merz, J. and J. Faik, 1992, Equivalence Scales Based on Revealed Preference Consumption Expenditure Microdata – The Case of West Germany, FFB-Discussion Paper No. 3, Department of Economics and Social Sciences, University of Lüneburg, Lüneburg. FFB-DP Nr. 3
Merz, J., 1992, Time Use Dynamics in Paid Work and Household Activities of Married Women – A Panel Analysis with Household Information and Regional Labour Demand, FFB-Discussion Paper No. 2, Department of Economics and Social Sciences, University of Lüneburg, Lüneburg.
FFB-DP Nr. 2
Forschungsinstitut Freie Berufe, 1992, Festliche Einweihung des Forschungsinstituts Freie Berufe am 16. Dezember 1991 im Rathaus zu Lüneburg, FFB-Diskussionspapier Nr. 1, Fachbereich Wirtschafts- und Sozialwissenschaften, Universität Lüneburg, Lüneburg. FFB-DP Nr. 1
6 FFB-Dokumentationen, ISSN 1615-0376
Merz, J. und P. Paic, 2005, Die FFB-Onlineumfrage Freie Berufe – Beschreibung und Hochrechnung, FFB-Dokumentation Nr. 12, Fachbereich Wirtschafts- und Sozialwissenschaften, Universität Lüneburg, Lüneburg. FFB-Dok. Nr. 12
Stolze, H., 2004, Der FFB-Server mit Microsoft Windows Server 2003, FFB-Dokumentation Nr. 11, Fachbereich Wirtschafts- und Sozialwissenschaften, Universität Lüneburg, Lüneburg.
FFB-Dok. Nr. 11
Stolze, H., 2004, Zur Repräsentativität der FFB-Ärzteumfrage – Neue Hochrechnungen für Niedersachsen, Nordrhein und Deutschland, FFB-Dokumentation Nr. 10, Fachbereich Wirtschafts- und Sozialwissenschaften, Universität Lüneburg, Lüneburg. FFB-Dok. Nr. 10
Merz, J., Stolze, H. und S. Imme, 2001, ADJUST FOR WINDOWS – A Program Package to Adjust Microdata by the Minimum Information Loss Principle, Program-Manual, FFB-Documentation No. 9, Department of Economics and Social Sciences, University of Lüneburg, Lüneburg.
FFB-Dok. Nr. 9
Merz, J., Fink, F., Plönnigs, F. und T. Seewald, 1999, Forschungsnetz Zeitverwendung – Research Net-work on Time Use (RNTU), FFB-Documentation Nr. 8, Fachbereich Wirtschafts- und Sozial-wissenschaften, Universität Lüneburg, Lüneburg. FFB-Dok. Nr. 8
Merz, J., 1997, Zeitverwendung in Erwerbstätigkeit und Haushaltsproduktion – Dynamische Mikroanaly-sen mit Paneldaten, DFG-Endbericht, FFB-Dokumentation Nr. 7, Fachbereich Wirtschafts- und Sozialwissenschaften, Universität Lüneburg, Lüneburg. FFB-Dok. Nr. 7

FFB-Publication list 102/106
Merz, J. und F. Plönnigs, 1997, DISTRI/MICSIM – A Softwaretool for Microsimulation Models and Analyses of Distribution, FFB-Documentation No. 6, Department of Economics and Social Sciences, University of Lüneburg, Lüneburg. FFB-Dok. Nr. 6
Merz, J. und R. Lang, 1997, Neue Hochrechnung der Freien Berufe und Selbständigen im Sozio-ökono-mischen Panel, FFB-Dokumentation Nr. 5, Fachbereich Wirtschafts- und Sozialwissenschaften, Universität Lüneburg, Lüneburg. FFB-Dok. Nr. 5
Merz, J. und F. Plönnigs, 1995, Forschungsinstitut Freie Berufe – Datenschutz und Datensicherung, FFB-Dokumentation Nr. 4, Fachbereich Wirtschafts - und Sozialwissenschaften, Universität Lüne-burg, Lüneburg. FFB-Dok. Nr. 4
Merz, J., Hecker, M., Matusall, V. und H. Wiese, 1994, Forschungsinstitut Freie Berufe – EDV-Hand-buch, FFB-Dokumentation Nr. 3, Fachbereich Wirtschafts- und Sozialwissenschaften, Universität Lüneburg, Lüneburg. FFB-Dok. Nr. 3
Merz, J., 1993, Zeitverwendung in Erwerbstätigkeit und Haushaltsproduktion – Dynamische Mikroana-lysen mit Paneldaten, DFG-Zwischenbericht für die erste Phase (1992-1993), FFB-Dokumentation Nr. 2, Fachbereich Wirtschafts- und Sozialwissenschaften, Universität Lüneburg, Lüneburg.
FFB-Dok. Nr. 2
Merz, J. 1993, ADJUST – Ein Programmpaket zur Hochrechnung von Mikrodaten nach dem Prinzip des minimalen Informationsverlustes, Programm-Handbuch, FFB-Dokumentation Nr. 1, Fachbereich Wirtschafts - und Sozialwissenschaften, Universität Lüneburg, Lüneburg. FFB-Dok. Nr. 1
Available also in English as: Merz, J., 1994, ADJUST – A Program Package to Adjust Microdata by the Minimu m Information Loss
Principle, Program-Manual, FFB-Documentation No. 1e, Department of Economics and Social Sciences, University of Lüneburg, Lüneburg. FFB-Dok. Nr. 1e
7 Sonstige Arbeitsberichte, ISSN 0175-7275
Matusall, V., Kremers, H. und G. Behling, 1992, Umweltdatenbanken – vom Konzept zum Schema, Arbeitsbericht Nr. 112, Universität Lüneburg, Lüneburg. Mikrosimulation in der Steuerpolitik, 279 Seiten, Springer Verlag, ISBN 3-7908-0611-0, Berlin. Preis: € 6,-
Rönnau, A., 1989, Freie Berufe in Niedersachsen – Numerische und wirtschaftliche Entwicklung; Bedeu-tung als Arbeitgeber, Arbeitsbericht Nr. 60, Universität Lüneburg, Lüneburg. Mikrosimulation in der Steuerpolitik, 279 Seiten, Springer Verlag Berlin, ISBN 3-7908-0611-0, Berlin. Preis: € 6,-
Sahner, H., 1989, Freie Berufe im Wandel, Arbeitsbericht Nr. 59, Universität Lüneburg, Lüneburg. Mikrosimulation in der Steuerpolitik, 279 Seiten, Springer Verlag, ISBN 3-7908-0611-0, Berlin.
Preis: € 6,-
Sahner, H., 1988, Die Interessenverbände in der Bundesrepublik Deutschland – Ein Klassifikationssystem zu ihrer Erfassung, Arbeitsbericht Nr. 41, Universität Lüneburg, Lüneburg. Mikrosimulation in der Steuerpolitik, 279 Seiten, Springer Verlag, ISBN 3-7908-0611-0, Berlin. Preis: € 6,-


