Embed Size (px)
Citation preview
Project
Comparative analysis of consumption,saving and investment dynamics in
Lithuania.
Gritė ZaboraitėSabina Senkevič
Mantvydas Stulgaitis
International Business and Communication
2nd courseMicroeconomics
Lect.Inga MiliauskienėLect. Karina Kučaidzė
Vilnius 2012
ContentsIntroduction........................................................3Theoretical part....................................................3Consumption.......................................................3Investments.......................................................4Savings...........................................................5National savings................................................5Loanable funds..................................................6Private savings.................................................6Public savings..................................................6Savings and investment (how it is related)......................7
Summary of theoretical part.......................................7Practical part......................................................8Households........................................................8Disposable income...............................................82001-2002......................................................92005-2006......................................................92007-2008.....................................................10
Investments and savings of households..........................102001-2002.....................................................112005-2006.....................................................11
2007-2008.....................................................12Corporate Investments............................................13
2001-2002.....................................................132005-2006.....................................................142007-2008.....................................................14
Conclusion.........................................................15Reference:.........................................................15
Introduction
In this project we are going to compare three main macroeconomics elements Consumption savings and investment, which compose Gross Domestic Product. We chose 2001-2008 years period of time because we were interested inmacroeconomics situation in Lithuania before and in the beginning of crisis. During our work will make some conclusions and give some suggestions what might have been done.To make our work clearer and more precise we made a hypothesis, whichstates that during 2001 - 2008 period of time Lithuanian economy was unstable: consumption, investment and savings continually changed. In the first part of our work we will briefly explain in more detailwhat consumption, savings and investment are and what role they have in macroeconomics environment. In the second part of our work, we will analyze and make assumptions about consumption, investment and savings why and how they had been changing during 2001 - 2008 in Lithuania. In the end, after our analysis we will figure whether our hypothesis is true or false.
Theoretical part
Consumption
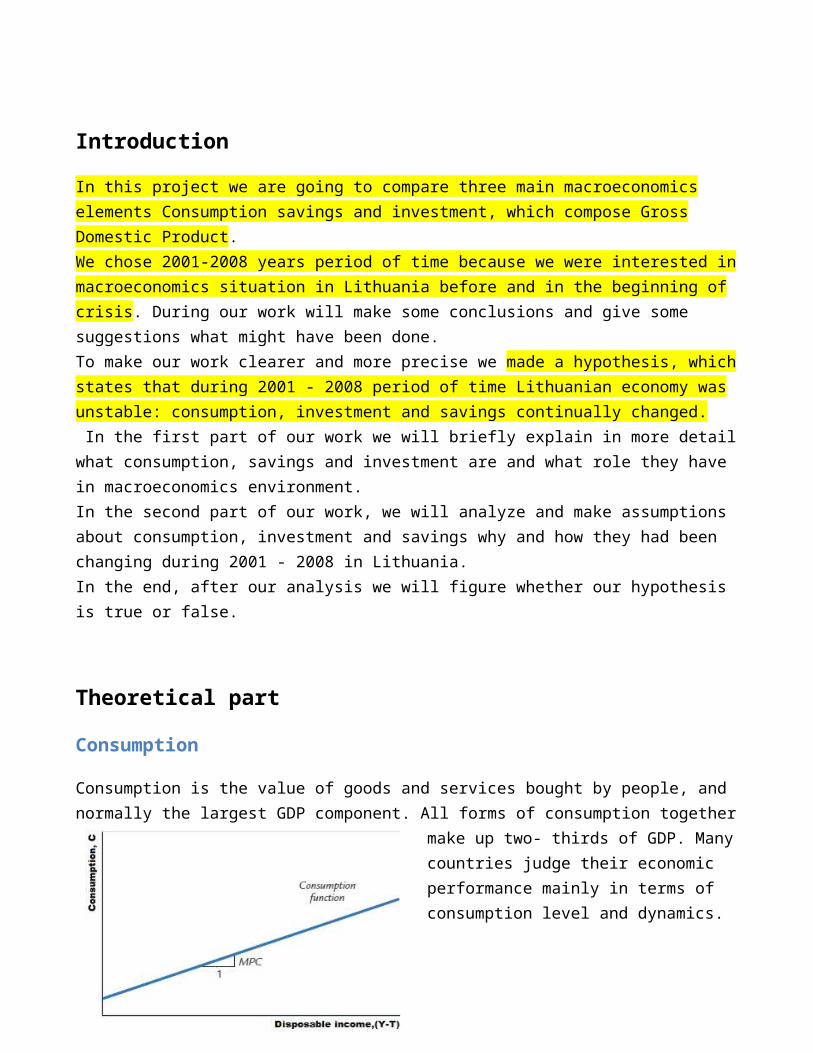
Consumption is the value of goods and services bought by people, and normally the largest GDP component. All forms of consumption together
make up two- thirds of GDP. Manycountries judge their economic performance mainly in terms of consumption level and dynamics.
The level of consumption depends directly on the level of disposable income: income after taxes (Y-T). The higher the disposable income, the greater the consumption. Consumption is a function of disposable income, and the relationship between consumption and disposable income is called the consumption function:
C = C (Y − T).
According to the graph, the amount by which consumption changes when disposable income increases by one dollar is called MPC (marginal propensity to consume).
The most relevant determinant of consumption is current income. Income comes from labor: employment and wages, capital: profits leading to dividends, rents, etc., and remittances from abroad. Also,there is may be the additional flow to available income, which is usually provided by consumer's cumulative bundle, including dividendsand interests on wealth.
Consumption may be divided according to the durability of the purchased objects into three subcategories:
durable goods - that last a long time, such as cars and TV’s non-durable goods - that last only a short time such as food and
clothing services - the work done for consumers by individuals and firms,
such as laundry, haircuts and doctor visits.
These three subcategories often show different paths of growth.
Moreover, consumption may be divided according to the needs it satisfies. For example: food, clothing and foot wear, housing, heating and energy, health, transport, etc.
People in different social stages in respect to their income have systematically different structures of consumption. Therefore the rich people have both higher levels of consumption and savings. In
differentiated product markets, the rich people can usually buy better goods than the poor one. This happens also because they tend to use different decision-making rules. In other words, consumption depends on social groups and their behaviors.
Talking about the impact of consumption, an increase of consumption rises GDP by the same amount, ceteris paribus. This impact we can seeaccording to the formula:
↑Y = ↑C + I + G +NX.
Investments
When you hear the term investment you probably think of buying stocksor bonds. This is not what economists consider as investment in theireconomic models. When you buy a stock or bond you are only transferring a claim of ownership on the firm's existing assets from one person to another. You are not increasing the productive capacityor the physical assets of the firm. Investment in economic models represents the flow of spending that adds to the physical stock of real capital. Businesses and corporations undertake investment activity that involves the purchase of goods which themselves assist in the production process.
The categories of investment are:
• Business Investment - this includes the actual purchases of goods used in the production process. Business investment includes the construction of new offices and factories, and the purchase of machinery, computers, and any other equipment used to assist labor inthe production of goods and services. Business investment counts as gross investment, which includes purchases of machinery to replace worn-out equipment. If a firm replaces one machine with another that
does not increase output, then nothing is added to the nation's economy. To correct for this, net investment can be used, which subtracts out depreciation of existing capital from the gross (total)business investment made by firms.
• Residential Construction - this part of overall investment tracks the actual construction of housing, not the sale of homes. A new homethat is built during a given year is counted in that year's GDP, while the purchase of a previously owned house has already been counted in the GDP of the year it was constructed. In this way, only those residences that add to the overall housing stock count towards GDP.
• Changes in inventories - firms invest in inventories, which are produced goods held in storage in anticipation of later sales. Firms also stockpile raw materials and intermediate goods used in the production process. Goods held in inventories are counted for the year produced, not the year sold.
Savings
National savings
National savings (also called savings and marked as letter S) is total saving of a nation or country. It is the output that remains after consumers and government demands have been satisfied. We can calculate national savings by subtracting consumption and government spending from output.
S=Y-C-G
National savings are divided to:
Private savings Public savings

National savings= Private savings+ National savings
S=(Y-T-C) + (T - G)
National savings depends on income Y and the fiscal - policy variables G and T. If Y, G and T are fixed, then S is also fixed.
Because government savings is a component of National savings, budgetdeficits and surpluses affect the market for loanable funds. The savings function is a vertical line because it does not depend on theinterest rate.
Loanable funds
Financial assets or money that are available for borrowing are calledloanable funds. It consists of household savings and bank loans. Graph look like a supply and demand diagram for a particular good. Saving and investment are interpreted in terms of supply and demand, and it's interest rate is the cost of demanding or borrowing as well as the rate of return from supplying or lending loanable funds. The equilibrium interest rate is found where saving and investment crosses.
Supply for loanable funds is saving— households lend their saving to investors or deposit their saving in a bank that then loans the funds
out. Demand for loanable funds is investment —investors borrow from the public directly by selling bonds (directly) or indirectly by borrowing from banks (indirectly).
Private savings
The income that a private citizen has left over after paying taxes and buying consumption goods.
Private savings depends on output, tax and consumption. And is calculated by subtracting tax and consumption from output
Private savings = Y-T-C
Within personal finance, money used to purchase shares, put in a collective investment scheme or used to buy any asset where there is an element of capital risk is called an investment. When investment is realized, investment risk can cause a capital loss, distinct cash savings - it is considered to have minimal risk.
Public savings
Government tax revenue left after spending.
Public saving = T - G
Public savings depend on collected tax and government spending. If government collects more taxes that spend on goods, then we have budget surplus, and if government spend more, that tax collected- we gave budget deficit.
T > G public savings increasing- budget surplus
T < G public savings decreases - budget deficit
Savings and investment (how it is related)
In many instances the terms saving and investment are used interchangeably. To determine if an asset is saving or an investment you should think where is your money invested. If it is cash then it is savings, if it is a type of asset it is investment. Basically, sooner or later you will invest your savings into necessary things. How does saving differ from investing? With savings, your main goal is to save and keep safe your money whereas being able to access it easily. With investing, your main goal is to expand and grow your savings and with investing you will have a bigger amount of risk.
Summary of theoretical part
To sum up all these three economy components we can say that they arerelated with GDP (gross domestic product) GDP is a measure of all economy components including all type of services and goods. There isa simple formula, which describes GDP.
Y = C + I + E + G ,
where
Y = GDP
C = Consumer Spending
I = Investment made by industry
E = Excess of Exports over Imports
G = Government Spending
GDP is one of the most important criteria in comparing consumption, investment and savings between years.
Practical part
Households
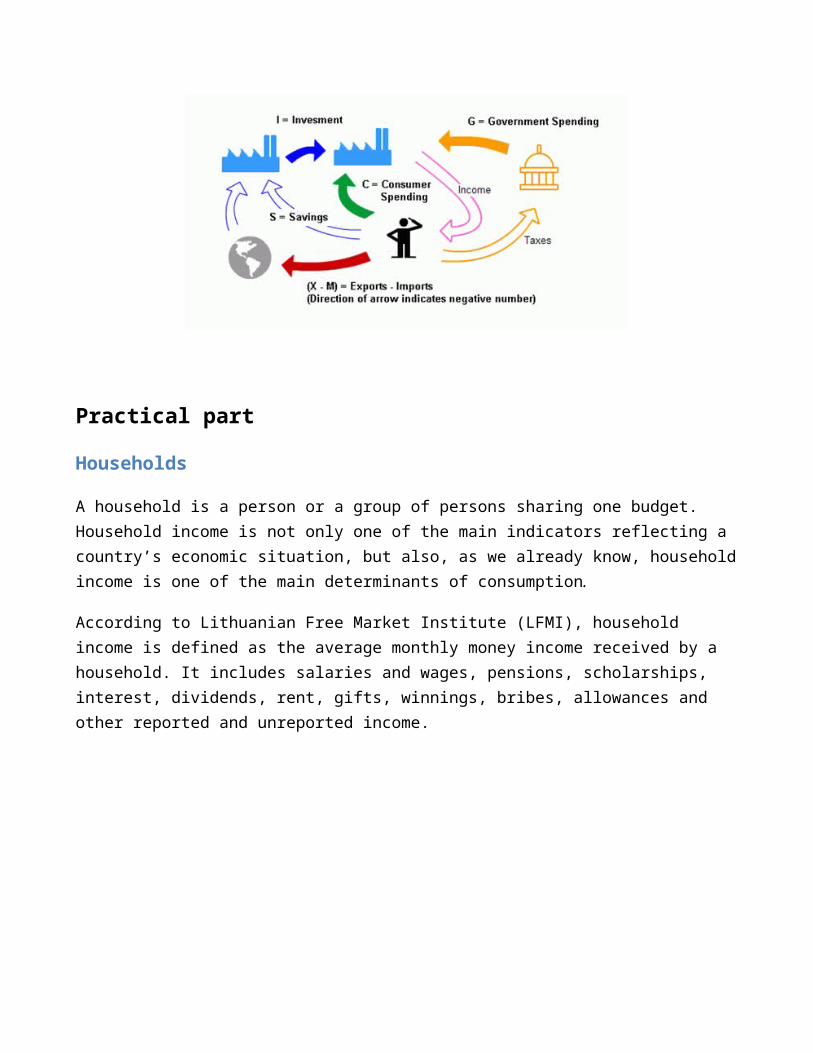
A household is a person or a group of persons sharing one budget. Household income is not only one of the main indicators reflecting a country’s economic situation, but also, as we already know, householdincome is one of the main determinants of consumption.
According to Lithuanian Free Market Institute (LFMI), household income is defined as the average monthly money income received by a household. It includes salaries and wages, pensions, scholarships, interest, dividends, rent, gifts, winnings, bribes, allowances and other reported and unreported income.
Disposable income
2001-2002
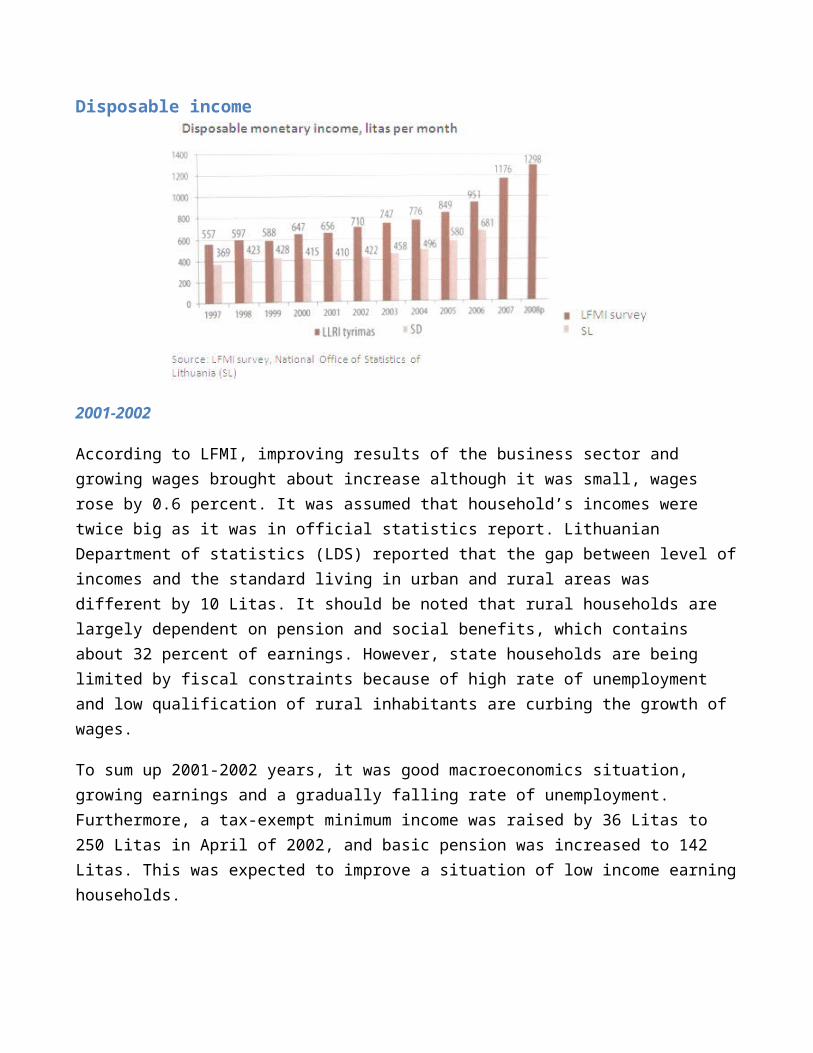
According to LFMI, improving results of the business sector and growing wages brought about increase although it was small, wages rose by 0.6 percent. It was assumed that household’s incomes were twice big as it was in official statistics report. Lithuanian Department of statistics (LDS) reported that the gap between level ofincomes and the standard living in urban and rural areas was different by 10 Litas. It should be noted that rural households are largely dependent on pension and social benefits, which contains about 32 percent of earnings. However, state households are being limited by fiscal constraints because of high rate of unemployment and low qualification of rural inhabitants are curbing the growth of wages.
To sum up 2001-2002 years, it was good macroeconomics situation, growing earnings and a gradually falling rate of unemployment. Furthermore, a tax-exempt minimum income was raised by 36 Litas to 250 Litas in April of 2002, and basic pension was increased to 142 Litas. This was expected to improve a situation of low income earninghouseholds.
2005-2006
According to the graph, disposable incomes grew up in 2005-2006. Average household income might grow up because payments (such as pension, various and numerous social assistance benefits) from the state budget also rose. Old-age pension were raised three times in 2004 and also increased till 2006. In 2005 pension was raised by 28 Litas to 200 Litas per month, insured income was increased by 94lt to1.084 Litas. Average old-age pension went up by 50 Litas. In the sameyear (2005) government decided to double the pensions to individuals injured during the tragic events in January 1991.
In 2005, 41million Litas were allocated to financial support for families, who has 3-7 aged children. There was provided 50 Litas per month for them. Moreover, increased social assistance payments as well as state pensions had started to be paid to mothers with 7 or more children. Also, at school year each child got 50 Litas educationallowance in 2005-2006.
Talking about social income, it was raised from 135 to 155 Litas per month in 2005. Moreover, number of people, who got compensation for heating and hot water increased. Once again, the social income was raised current year.
Financial situation of households continue to improve in 2005. Average households income grew by 12 percent. Market participants predicted, that unemployment in Lithuania continued to fall and employment earnings continued to grow.
The year of 2005 was fourth year in a row that "Sodra" budget ran a surplus. Moreover, revenues were 9 percent bigger than it was forecasted in 2005, and 14 percent higher than inflows in 2004.
2007-2008
According to the graph, we can see that disposable income (Y-T), in other words household income, fluctuated a little bit during 1997 – 2000 period and after that has been steadily rising since 2001.
The main reason why the household income might have increased is because of a significant decline in unemployment during these years, rising earnings and new opportunities for Lithuanians to earn money abroad. Therefore, employed in foreign countries Lithuanians also rose household income by sending or transferring some parts of their wages to family members.
Moreover, the average household income might also have grown because of payments from the state budget such as social assistance benefits to families and pensions. In 2008 the basic pension went up by 50 Litas, to 316 Litas per month. Therefore, according to “Sodra” on average pensions increased by about 17 percent.
Also, since 2007-2008 there was considered by the Government to increase social benefits to parents raising children. The Government decided to pay maternity allowances until the child reaches 2 years old and if family has more than one child, maternity allowance will be increased. Such financial support not only pushed up household income, but also helped to solve demographic problems – to increase birth rates.
In addition, according to the LFMI, the average monthly household income was 2,832 in 2007.
Investments and savings of households
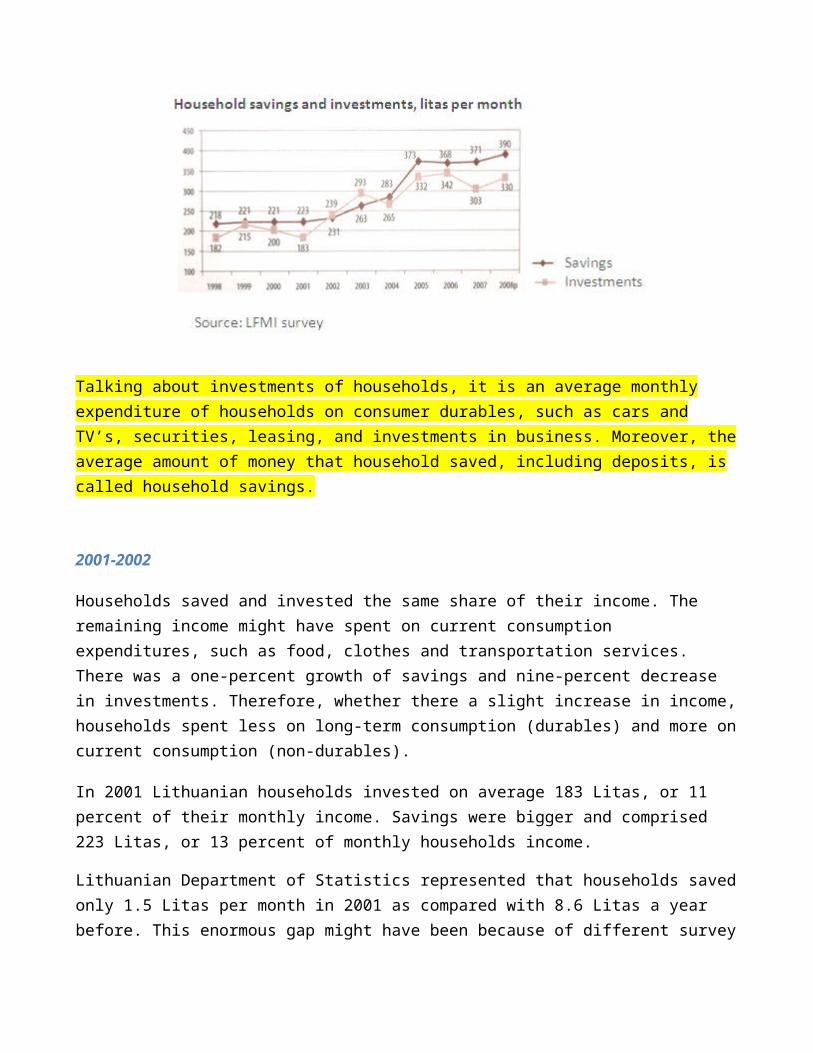
Talking about investments of households, it is an average monthly expenditure of households on consumer durables, such as cars and TV’s, securities, leasing, and investments in business. Moreover, theaverage amount of money that household saved, including deposits, is called household savings.
2001-2002
Households saved and invested the same share of their income. The remaining income might have spent on current consumption expenditures, such as food, clothes and transportation services. There was a one-percent growth of savings and nine-percent decrease in investments. Therefore, whether there a slight increase in income,households spent less on long-term consumption (durables) and more oncurrent consumption (non-durables).
In 2001 Lithuanian households invested on average 183 Litas, or 11 percent of their monthly income. Savings were bigger and comprised 223 Litas, or 13 percent of monthly households income.
Lithuanian Department of Statistics represented that households savedonly 1.5 Litas per month in 2001 as compared with 8.6 Litas a year before. This enormous gap might have been because of different survey
methodologies. LFMI respondents are asked to evaluate the situation of average Lithuanian households, while LSD survey participants reported of their own financial situation.
According to je LDS, only 24 percent can save and 14 percent live on loans.
What government had done to do better?
For household’s savings and investments to grow, it is important thatthe government keeps from increasing mandatory procurements such as mandatory third person liability vehicle insurance. This type of insurance can be viewed as a kind of tax, which can be represented with right to disposable their income.
2005-2006
In 2005 and 2006 household’s savings grow up by 16 percent, and according to LMFI, households saved more than invested. Overall, household savings accounted for 17 percent on household’s income and investments accounted for 15 percent (according to Lithuanian Department of Statistics).
Rising wages, land, and deposit compensations made impact on household savings. According to Lithuanian Securities Commission andby TNS Gallup, many Lithuanians have extra money left after all needed daily items are purchased, but they were not willing to invest. Situation is not changing, that might have been because of information, people unwillingness to risk, and their old habits (keeping their incomes in current account or save money at home). Moreover, people saved not only for unplanned purchase, but also for holidays, hobbies and other needs.
Consumption continued to boom despite the fact that people was afraidto invest and take a risk. According to Lithuanian Department of Statistics, the proportion of those who assessed saving prospects
negatively in 2005 was 40 percent bigger than those who have positiveattitude. According to Lithuanian Lease Association, the lease portfolio grew up by 37 percent and amounted to 5.32 billion Litas in2005, compared to 3.887 billion Litas in 2004.
Market growth of wages and other income, such as old-aged pensions was attributed to considerable upturn in household savings and investment, while at the same time households continued to boost consumption.
Also, we can't forget the boom of the real estate market, which has leased for several years. Real estate market was the most popular in Lithuania. The loan portfolio grew up by 2.5 over year, and swelled by 92 % over the year.
Borrowing risk arises when people don't evaluate ability to repay theloans and the impact of changing interest rate. For several, years banks tried to attract customers by minimizing their margins. But in 2006 they started to increase their prices and start to apply more strict criteria in assessing their clients.
Household investment increased because of growing interest in life insurance. The life insurance grew up to 289.2 million Litas in 2005, and this is 27.7 percent of the total insurance market. Moreover, insurance market rose by 20.9 percent.
There was expected that growing earnings and household income will continue to boost consumption and despite that household investments and savings will also rise after 2005.
Market participants predicted, that household savings will grow by 12.4 percent and household investment will increase by 12.7 percent in 2006. Also they expected that savings will be 419.45 Litas per month and investment will reach 374.12 Litas per month in 2006. As in2005 savings were accounted for 17% of household budgets, while investment constituted 15%.
2007-2008
According to the LFMI, average household saving was 371 Litas per month in 2007 and investment was about 302 Litas per month in 2007.
According to the graph, we can see that investments fluctuated during1998 – 2008 period but commonly savings and investments have been growing during this period. We assume, that stagnating household savings and declining household investments might have meant that people became less optimistic and more cautious about the economic situation. However, if household savings and investment grows, disposable income also grows.
From the graph, we can see that despite growing there was a decrease in investment in 2007. That might have happened because of situation in the real estate market. During this period prices of real estate were falling, therefore real estate became less attractive, as an object of investment, to households.
Moreover, people started to feel not very confident about Lithuanian economy because of that they started to invest very cautiously in thereal estate. Before investing a lot of households tend to wait to decide either to save or to buy goods of consumption that may get expensive.
According to Statistics Department of Lithuania, the indicator of consumer confidence was minus 6. As it was mentioned before, it meansthat households became less confident about the prospects of their financial situation and abilities to save. Therefore, despite rapidlyincreasing income (graph “Disposable and monetary income”), people started to reduce their consumption and investments.
Corporate Investments
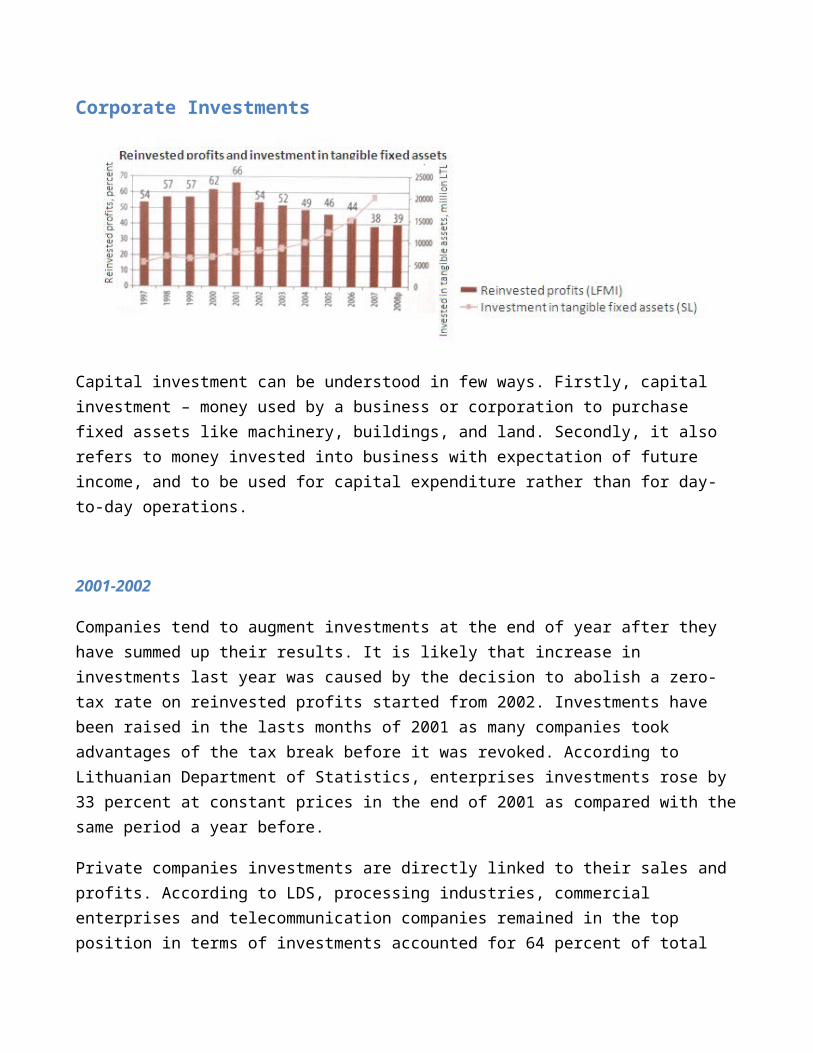
Capital investment can be understood in few ways. Firstly, capital investment – money used by a business or corporation to purchase fixed assets like machinery, buildings, and land. Secondly, it also refers to money invested into business with expectation of future income, and to be used for capital expenditure rather than for day-to-day operations.
2001-2002
Companies tend to augment investments at the end of year after they have summed up their results. It is likely that increase in investments last year was caused by the decision to abolish a zero-tax rate on reinvested profits started from 2002. Investments have been raised in the lasts months of 2001 as many companies took advantages of the tax break before it was revoked. According to Lithuanian Department of Statistics, enterprises investments rose by 33 percent at constant prices in the end of 2001 as compared with thesame period a year before.
Private companies investments are directly linked to their sales and profits. According to LDS, processing industries, commercial enterprises and telecommunication companies remained in the top position in terms of investments accounted for 64 percent of total
private investments, and for 43 percent of total state and private investments.
2005-2006
The proportion of reinvested profits went down from 49 percent (in 2004) to 46 percent in 2005. The reason why this happened is because of changes in taxation (applied profit tax to all investment) in 2002. When taxation laws had been changed and new tax started, the companies reinvested profits and have not recovered since. The biggest drop in 2005 was caused by solidarity tax, that might happen because companies had been already planned their finances. Companieslower shares of reinvestment in order to keep a fiscal balance.
Total capital investment in the country increased by 25 percent in 2005, compared to 2004. Moreover, Lithuania companies see European union as a great opportunity to invest abroad. Foreign direct investment (FDI) of Lithuanian companies rose by 74.4 percent to 1868.9 Litas and this is more that the investment growth in 2006. Also, reinvested profits shrank, but innovation processes did not slow down in 2005.
2007-2008
According to the statistics, in 2007 the most was invested in following sectors:
59.9% in social and personal service activities and utility 43.6% in public administration and defense, and mandatory social
insurance 35.1% in postal services and telecommunications
The major financial sources for investments were following:
51.4% own funds

18.7% bank loans 14% the State budget 9.9% the European Union support
According to the graph, we can see that investments in tangible fixedassets grew steadily with small fluctuations since 1997. Moreover, since 2001 reinvested profits might have started to fall because of new financial sources.
Conclusion
To sum up, in our project we analyzed three main macroeconomic components and made comparative analysis of investment, savings and consumption in Lithuania. According to our chosen period of time (2001-2008 years), graphs, information, and facts, we made assumptions. After deep analysis, we noticed that situation in economy of Lithuania from 2001 till 2008 did not fit our hypothesis, which stated that during 2001 - 2008 period of time Lithuanian economy was unstable: consumption, investment and savings continuallychanged. We observed that economy grew up gradually from 2001 till 2008, however, it had one setback in 2007 – it might happened becauseof the begging of financial crisis in 2007. During the period of financial crisis, people started to consume and invest less and save more. Moreover, from 2007 till 2008 economy started to recover.
Reference:
Jay Kaplan January 15, 1999http://www.colorado.edu/Economics/courses/econ2020/section6/GDP-components.html
Valentino Piana 2001 http://www.economicswebinstitute.org/glossary/cons.htm
Author Unknown February 24, 2004 http://www.mindtools.net/GlobCourse/formula.shtml
Mankiw, G. N. (2007). Macroeconomics, 6th edition. New York: Worth Publishers.
M.Kačinskienė, Žilvinas Šilėnas, Vytautas Žukauskas. Lietuvos laisvosios rinkos institutas, (2008). Lietuvos ekonomikos tyrimas 2007 - 2008 (2)

M.Kačinskienė. Lietuvos laisvosios rinkos institutas, (2006). Lietuvos ekonomikos tyrimas 2005 - 2006 (2)
Aneta Piasecka, Jurgita Senkuvienė. Lietuvos laisvosios rinkos institutas, (2002). Lietuvos ekonomikos tyrimas 2001 - 2002. Vilnius 2002
International Dictionary http://www.investorwords.com/16518/loanable_funds_theory.html
Unknown http://www.cliffsnotes.com/study_guide/Capital-Loanable-Funds-Interest-Rate.topicArticleId-9789,articleId-9787.html