Embed Size (px)
Citation preview
1
PROJECT: STDF/PG/460
Final regional report
Implementation of the International Standard on Phytosanitary Measures, ISPM
15 (Regulation of wood packaging material in international trade): An empirical
analysis of how the regulation affects the economy of a group of countries in
Africa
Elissaios PAPYRAKIS and Luca TASCIOTTI
2
PROJECT: STDF/PG/460
Final regional report
Implementation of the International Standard on Phytosanitary Measures, ISPM
15 (Regulation of wood packaging material in international trade): An empirical
analysis of how the regulation affects the economy of a group of countries in
Africa
Elissaios PAPYRAKIS a and Luca TASCIOTTI a , b, 1
08/09/2017
a International Institute of Social Studies (ISS), Erasmus University of Rotterdam, Kortenaerkade 12, 2518 AX The Hague, the
Netherlands. b School of Oriental and African Studies (SOAS), Thornhaugh Street, Russell Square, London WC1H 0XG, United Kingdom.
1 Corresponding author: Luca Tasciotti, International Institute of Social Studies, Erasmus University of Rotterdam,
Kortenaerkade 12, 2518 AX, the Hague, the Netherlands, tel.: +31 70 4260611, E-mail: [email protected].
3
Index
Table of Figures ............................................................................................................................................ 5
Tables ............................................................................................................................................................ 7
Acknowledgments ........................................................................................................................................ 9
Executive summary .................................................................................................................................... 12
1. Introduction ........................................................................................................................................ 19
1.1 Theoretical background .............................................................................................................. 19
1.2 ISPM 15 in a nutshell ................................................................................................................... 23
1.3 Quantitative evidence on ISPM 15 effects .................................................................................. 25
1.4 The importance of cost-benefit analysis ..................................................................................... 26
1.5 Beneficiaries and objectives of the study ................................................................................... 28
1.6 Combination of methodologies used .......................................................................................... 29
1.7 Limitations and challenges of this study ..................................................................................... 30
2. Context and Framework of the Analysis ............................................................................................... 32
2.1 Introduction ................................................................................................................................ 32
2.2 Implementation of Environmental or Trade Standards – Key Issues ......................................... 34
2.3 Economic and Non-Economic Impacts of Standards .................................................................. 35
2.4 Standards and Issues of Fairness ................................................................................................ 37
3 ISPM 15: introduction to the analysis..................................................................................................... 39
3.1 ISPM 15: introduction ....................................................................................................................... 39
3.2 The role played by the IPPC .............................................................................................................. 40
3.3 ISPM 15: rationale, origin and implementation ................................................................................ 43
3.4 Economic, social and environmental impacts of ISPM 15 ................................................................ 47
3.5 Evidence from IAPSC and from the NPPOs ....................................................................................... 49
3.6 Conclusions ....................................................................................................................................... 52
3.7 Figures ............................................................................................................................................... 54
4. ISPM 15: findings based on qualitative interviews ............................................................................... 59
4.1 Introduction to the field research in the four case-study countries................................................. 59
4.2 Field research in the participating countries .................................................................................... 60
4.2.1 Botswana ............................................................................................................................. 60
4.2.2 Cameroon ............................................................................................................................ 68
4.2.3 Mozambique ....................................................................................................................... 74
4.2.4 Kenya ................................................................................................................................... 80
4
4.3.1 Evidence from Controle de pragas Tratamentos fitossanitários (CCPU), Brazil ........................ 87
4.3.2 Evidence from Conlegno, Italy ................................................................................................... 87
4.3.3 Evidence from the Stichting Markering Houten Verpakkingen (SMHV, Foundation
implementing the Dutch Wood Marking Program), The Netherlands ............................................... 89
4.4 The role of the IAPSC .................................................................................................................. 89
4.5 Evidence from EPPO .................................................................................................................... 91
4.6 Policy implications and policy advice .......................................................................................... 92
4.7 Appendix ........................................................................................................................................... 96
5. ISPM 15: Findings based on Macroeconomic Data ............................................................................. 112
5.1 Description of Macroeconomic Analysis ................................................................................... 112
5.2 Description of Macroeconomic Data ........................................................................................ 115
5.3 Empirical Analysis ...................................................................................................................... 117
5.3.1. Kenya ....................................................................................................................................... 117
5.3.2. Botswana ................................................................................................................................. 129
5.3.3. Cameroon ................................................................................................................................ 141
5.3.4. Mozambique ........................................................................................................................... 153
6. ISPM 15: findings based on microdata ........................................................................................ 166
6.1 Introduction .............................................................................................................................. 166
6.2 Description of the survey tool................................................................................................... 168
6.3 Description of the respondents ................................................................................................ 170
6.4 Descriptive statistics ....................................................................................................................... 172
6.5 Analysis of the costs and of the revenues ...................................................................................... 181
6.6 Conclusions ..................................................................................................................................... 186
7. Conclusions ........................................................................................................................................... 189
7.1 Summary of the project results ...................................................................................................... 189
7.2 Qualitative results ........................................................................................................................... 189
7.3 Macroeconomic results ............................................................................................................ 192
7.4 Microeconomic results ............................................................................................................. 195
7.5 Policy recommendations .......................................................................................................... 196
7.6 Future research ......................................................................................................................... 198
8. References ............................................................................................................................................ 199
5
Table of Figures
Figure 1: Economic, social and environmental effects stemming from the ISPM 15 implementation and
its compliance ............................................................................................................................................. 54
Figure 2: Record of a HT used by an Italian WPM treatment facility ......................................................... 55
Figure 3: Record of a HT used by an Italian WPM treatment facility ......................................................... 56
Figure 4: Different procedures for removing the ISPM 15 mark from WPM ............................................. 57
Figure 5: Sample of the ISPM 15 Mark ....................................................................................................... 57
Figure 6: Examples of accepted (top images) and not-accepted marks (bottom images) ......................... 58
Figure 7: Flow chart of the ISPM 15 implementation process in Botswana ............................................... 65
Figure 8: Flow chart of the ISPM 15 implementation process in Cameroon .............................................. 71
Figure 9: Flow chart of the ISPM 15 implementation process in Mozambique ......................................... 80
Figure 10: Flow chart of the ISPM 15 implementation process in Kenya ................................................... 85
Figure 11: Import transit certificates .......................................................................................................... 96
Figure 12: WPM used by the Horticultural Market to export fruits and vegetables .................................. 97
Figure 13: Repaired WPM and parts of treated WPM ................................................................................ 97
Figure 14: WPM used by Kgalagadi Breweries Limited .............................................................................. 98
Figure 15: The stamp used by U-Mac Import& Export (PTY) LTD Extract ................................................... 98
Figure 16: WPM manufactured by Chep Pty Ltd ........................................................................................ 98
Figure 17: The stamp applied by U-Mac Import & Export (PTY) LTD Extract and found on two pieces of
WPM in the Botswana Horticultural Market .............................................................................................. 99
Figure 18: Extract of the Minader law 3/2008 ............................................... Error! Bookmark not defined.
Figure 19: ISPM 15 stamp applied to treated WPM ................................................................................. 101
Figure 20: MB stamps applied to WPM treated by SIC-COCOA................................................................ 101
Figure 21: Treatment certificate for untreated imported WPM, Cameroon ............................................ 102
Figure 22: Phytosanitary certificate for untreated imported wood material ........................................... 102
Figure 23: Yearly authorization certificate and authorization renewal released by KEPHIS to a WPM
treatment facility in Kenya ........................................................................................................................ 103
Figure 24: Report of an audit done by KEPHIS to a WPM treatment facility in Kenya ............................. 103
Figure 25: Iron sheets used to export flowers by air ................................................................................ 104
Figure 26: WPM heat treatment certificate issued by a WPM treatment facility in Kenya ..................... 105
Figure 27: Application form needed to obtain authorization to treat WPM in Kenya ............................. 106
Figure 28: ISPM 15 stamps applied on treated WPM by Woodtex .......................................................... 106
Figure 29: NPPO official communication on the introduction of ISPM 15 in Mozambique ..................... 107
Figure 30: First page of the inspection manual prepared by the NPPO in Mozambique ......................... 108
Figure 31: Number and geographical distribution of NPPO inspectors in Mozambique.......................... 109
Figure 32: Informal WPM repairer in Maputo .......................................................................................... 110
Figure 33: WPM used by Rioverde to export bananas ............................................................................. 111
Figure 34: WPM used by Beluzi to export bananas .................................................................................. 111
Figure 35: Distribution of ISPM 15 effects across all exporting sectors ................................................... 120
Figure 36: Distribution of only statistically significant ISPM 15 effects (exports) .................................... 121
Figure 37: Distribution of ISPM 15 effects across all importing sectors ................................................... 124
Figure 38: Distribution of only statistically significant ISMP 15 effects (imports) .................................... 125
Figure 39: Changes in values of exports/ imports/ trade balance in Kenya (in USD) ............................... 127
Figure 40: Distribution of ISPM 15 effects across all exporting sectors ................................................... 132
6
Figure 41: Distribution of only statistically significant ISPM 15 effects (exports) .................................... 133
Figure 42: Distribution of ISPM 15 effects across all importing sectors ................................................... 136
Figure 43: Distribution of only statistically significant ISPM 15 effects (imports) .................................... 137
Figure 44: Changes in values of exports/ imports/ trade balance in Botswana (USD) ............................. 139
Figure 45: Distribution of ISPM 15 effects across all exporting sectors ................................................... 144
Figure 46: Distribution of only statistically significant ISPM 15 effects (exports) .................................... 145
Figure 47: Distribution of ISPM 15 effects across all importing sectors ................................................... 148
Figure 48: Distribution of only statistically significant ISPM 15 effects (imports) .................................... 149
Figure 49: Changes in values of exports/ imports/ trade balance in Cameroon (USD) ............................ 152
Figure 50: Distribution of ISPM 15 effects across all exporting sectors ................................................... 156
Figure 51: Distribution of only statistically significant ISPM 15 effects (exports) .................................... 157
Figure 52: Distribution of ISPM 15 effects across all exporting sectors ................................................... 160
Figure 53: Distribution of only statistically significant ISPM 15 effects (imports) .................................... 161
Figure 54: Changes in values of exports/ imports/ trade balance in Mozambique (USD) ....................... 164
Figure 55: Amount of the average yearly fixed, variable, license and total costs for a WPM treatment
facility (in USD) .......................................................................................................................................... 183
Figure 56: Maximum number of WPM each facility can treat per year and actual numbers .................. 184
Figure 57: Cost for a treated (left) and non-treated (right) WPM (in USD) .............................................. 185
Figure 58: Flow Chart of an ideal implementation and compliance process ........................................... 192
7
Tables
Table 1: Classification of non-tariff barriers (NTBs) ..................................................................................... 20
Table 2: List of adopted standards .............................................................................................................. 41
Table 3: Timeline with all the events related to ISPM 15 definition ............................................................ 44
Table 4: Example of a treatment schedule that achieves the minimum required concentration-time (CT)
for WPM treated with MB ........................................................................................................................... 45
Table 5: List of activities arranged for the mission to Botswana ................................................................. 63
Table 6: List of activities arranged for the mission to Cameroon ................................................................ 70
Table 7: Share of imported WPM that the phytosanity inspectors should inspect ..................................... 76
Table 8: List of activities for the mission to Mozambique ........................................................................... 77
Table 9: Type of service and price offered by Kephis in relation to ISPM 15 compliance ........................... 81
Table 10: List of activities scheduled for the mission to Kenya ................................................................... 83
Table 11: Overview of the malpractices observed when implementing the ISPM 15 in the four case-study
countries ..................................................................................................................................................... 92
Table 12: Descriptive statistics - Kenya ..................................................................................................... 116
Table 13: Descriptive statistics - Botswana ............................................................................................... 116
Table 14: Descriptive statistics - Cameroon .............................................................................................. 117
Table 15: Descriptive statistics - Mozambique .......................................................................................... 117
Table 16: Kenyan exports of coffee, tea and spices .................................................................................. 118
Table 17: Kenyan exports of vegetables .................................................................................................... 119
Table 18: Kenyan imports of electronics ................................................................................................... 122
Table 19: Kenyan imports of machinery .................................................................................................... 123
Table 20: Change in export values per sector (in million USD) .................................................................. 126
Table 21: Change in import values per sector (in million USD) ................................................................. 127
Table 22: Exports of precious metals and stones (Botswana) ................................................................... 130
Table 23: Exports of nickel articles (Botswana) ......................................................................................... 131
Table 24: Imports of precious metals and stones (Botswana) ................................................................... 134
Table 25: Imports of machinery (Botswana) ............................................................................................. 135
Table 26: Change in export values per sector (in million USD) .................................................................. 138
Table 27: Change in import values per sector (in million USD) ................................................................. 139
Table 28: Cameroon exports of cocoa products ........................................................................................ 142
Table 29: Cameroon exports of wood articles ........................................................................................... 143
Table 30 : Imports of Machinery - Cameroon ............................................................................................ 146
Table 31: Imports of Cereals - Cameroon .................................................................................................. 147
Table 32: Change in export values per sector (in million USD) .................................................................. 150
Table 33: Change in import values per sector (in million USD) ................................................................. 151
Table 34: Exports of aluminum articles - Mozambique ............................................................................. 154
Table 35: Exports of tobacco - Mozambique ............................................................................................. 155
Table 36: Imports and medical and optical equipment - Mozambique ..................................................... 158
Table 37: Imports of machinery - Mozambique ........................................................................................ 159
Table 38: Change in export values per sector (in million USD) .................................................................. 162
Table 39: Change in import values per sector (in million USD) ................................................................. 163
Table 40: Costs and benefits related to the ISPM 15 implementation ...................................................... 167
8
Table 41: List of WPM treatment facilities for which microdata have been collected, divided by country
.................................................................................................................................................................. 170
Table 42: List of WPM manufacturers in Botswana for which microdata have been collected ................ 171
Table 43: List of WPM repairers for which microdata have been collected .............................................. 171
Table 44: Role of the people interviewed ................................................................................................. 173
Table 45: Requirements to be met to obtain authorization as a WPM treatment facility ........................ 174
Table 46: Requirements needed from the WPM treatment facilities to start treating ............................. 174
Table 47: Size of the WPM treatment facilities and impacts of ISPM 15 on the number of workers hired
.................................................................................................................................................................. 175
Table 48: Activities performed by the WPM treatment facilities .............................................................. 175
Table 49: Number of WPM treated and their use ..................................................................................... 176
Table 50: Treatment used and reasons behind that choice ...................................................................... 177
Table 51: Types of training received and agency organizing it .................................................................. 178
Table 52: Inspections to check the WPM treatment facilities ................................................................... 179
Table 53: How the WPM treatment facility checks the treatment ............................................................ 179
Table 54: Main social impacts ISPM 15 has had on the small wood processing facilities .......................... 180
Table 55: Main environmental impacts of ISPM 15 ................................................................................... 180
Table 56: Positive (p) and negative (n) impacts of ISPM 15....................................................................... 181
Table 57: Time needed for updating or purchasing equipment ................................................................ 182
Table 58: Average annual cost for the WPM treatment facilities, disaggregated by the source (in USD) . 182
Table 59: Maximum number of WPM the facility can treat per year and actual numbers ....................... 184
Table 60: Average total yearly costs, number of WPM treated with breakeven points and revenues, and
profit/loss .................................................................................................................................................. 186
Table 61: Cost-benefit analysis for the WPM treatment facilities ............................................................. 186
9
Acknowledgments The idea of this project came in 2008 when I first met Peter Kenmore, acting Secretary of the IPPC
Secretariat at the time. On several occasions, we talked about how to measure the costs and the
benefits of an International Standard for Phytosanitary Measures (ISPM), and, specifically, of ISPM 15 –
the subject of this report. I was a junior economist then doing little research on standards at that time.
I never abandoned the idea of studying the effects of ISPM 15. Many years have passed since I first
thought of this project, and these have provided ample opportunity for reflexions that helped me when
Lorenzo Pellegrini, at the International Institute for Social Studies (ISS), and I elaborated the project
preparation grant, which was submitted to the Standard for Trade and Development Facility (STDF) in
October 2013. The proposal did not meet the favours of the working group, and STDF reverted with
comments and an invitation to resubmit the proposal in the next round. We submitted a revised project
proposal to the working group in March 2014, which was approved.
Since then, and in between other research engagements, we have worked to collect and analyse data
benefitting from the generous contributions of many people along the way, who have all contributed to
making this project possible.
My regular conversations with Brent Larson, Standards Officer with the IPPC Secretariat, have helped
me understand the standard’s history and evolution, its nuances and technical wording. Lorenzo
Pellegrini has been a steady source of support in terms of technical ideas and logistic help. Ana Peralta,
the previous Capacity Development Officer with the IPPC Secretariat, and Orlando Sosa, Implementation
Facilitation Officer with the IPPC Secretariat, have been of great help with their technical expertise and
their knowledge in matters related to the STDF grant submission. René de Jong, external consultant,
worked free of charge as language editor of the project proposal. Kenza Le Mentec, who worked for the
STDF Secretariat at the time I prepared the proposal, provided helpful comments and encouragement.
Also other formal and less formal conversations with staff of the Food and Agriculture Organization of
the United Nations (FAO) have provided insight useful for the project: Marko Benovic, Dorota Buzon,
Nury Niyazi, David Nowell and Laura Pasetto.
The project deliverables – this report, the four country reports, the policy brief and the documentary –
have been prepared together with my colleague and friend Elissaios Papyrakis, Senior lecturer at ISS. We
worked together for two and half years on this project, travelling together to the countries, and splitting
the burden of transcribing the interviews, writing the project progress reports, developing the ideas and
the analyses. ISPM 15 has been the sole topic of our frequent telephone conversations and e-mail
exchanges for the past year.
This project was possible thanks to the support of the national plant protection organizations (NPPOs) of
the four countries targeted in this project, the Inter-African Phytosanitary Council (IAPSC) and the IPPC
Secretariat. For this reason, I wish to acknowledge the contributions of Jean Gerard Mezui-Mella,
Director of IAPSC, Hendrick Modiakgotla, Director of the NPPO of Botswana, Francis Leku Azenaku,
former Director of the NPPO of Cameroon who passed away suddenly, Esther Kimani, Director of the
NPPO of Kenya, Serafina Mangana, Director of the NPPO of Mozambique, and Yukio Yokoi, former IPPC
Secretary. All of them believed in the potentials of the project and in me, even if (or because) they had
not met me personally.
10
Cameroon was the first country we visited. Special thanks are therefore given to Francis Leku Azenaku,
Alice Ndikontar, Ekata Mvondo, Jean-Marie Bell Nyemb, Isaac Noe’ Mandong, Ebot Yvonne Agbor Araw,
Joseph Nguene Nteppe and Njieya Christian Dupleix. The data collection, in spite of many challenges,
was made possible thanks to the efforts of Edmond Bigueme and Apollinaire Toka. The mission to
Cameroon also gave us the possibility to meet the IAPSC representatives, Jean-Baptiste Bahama, Nana
Sani Flaubert and Joseph Zafack.
The mission to Botswana, organized by Simane Ranthoakgale, offered interesting conversations with
Galeitsiwe T. Ramokapane, Hendrick Modiakgotla, Patience Maware, Arthur Uglietti, Altimo Hagi, Ditiro
Motlhoiwa, Pontsho Motlhoiwa, Olebile Mokgwaela, Al Mazebedi, Jacob Kalake, Shirley Mmegwa, Buka
Ntopo, Dave Neill, Janet Selato, Balisi Gopolang, Kagiso Matsila. Data collection in Botswana was
expertly conducted by Simane Ranthoakgale.
For the mission to Kenya we wish to thank Faith Ndunge for the organization of the meetings and for
collecting the microeconomic data together with Phydes Nyaga. In addition, we wish to acknowledge
the contributions of Esther Kimani, Alessio Colussi, Josiah Syanda, Judy Matheka, Marie Matende,
Patrick Mwai, Joseph Mangoke, Salome Machua, Muendo, Lovens Robert Spoo, Tinus Kithikii, John Muli
and David Kabachia.
For the Mozambique mission, Antonio Come’ organized the meetings and collected the data. We had
the pleasure to meet and talk to Serafina Mangana, Anástacio Luίs, Delfina Moine, Jaime Comiche,
Leonardo Munguambe, Darlindo, Theresa Alves, Lucas Uamusse, Leonardo Sulila, Carlos Nunes, Nicola
Francescon, Colla Sono, Maluana and Paulo Nogueira.
The project also benefited of a number of interviews with the following ISPM 15 experts: Eric Allen,
Marco Bertussi, Alessandro Corso, Marie-Claude Forest, Thorwald Geuze, Wim Van Der Sande, Martin
Ward and Piotr Wlodarczyk.
In addition, we wish to thank the seven reviewers who have reviewed the project outputs: Khalid
Cassam, Maria Dafnomili, Molatlegi Modise, Alice Ndikontar, Faith Ndunge Shane Sela and Joseph
Zafack. Andrew Sherman, from the STDF, has kindly reviewed the report and provided us with additional
comments.
We would like to thank the participants of the project final meeting, which has been held in July 2017 at
the Kenyan NPPO, Kephis. The meeting benefitted of the constructive comments of the Botswana,
Cameroon, Kenya and Mozambique NPPO’s representatives, in addition to the FAO-IPPC and STDF
representatives.
This report has also benefited of the excellent work of Eva Clare Pearce Moeller, the English language
editor.
ISS, the implementing agency, has always given us and the project the support needed. ISS has been a
safe place to discuss ideas and methodologies, but always with a space that allowed us freely to decide
the best approach for the project. The budget holders of this project, initially – Joanna Baskot and then
Berhane Ghebretnsaie, - have taken great care of us from the financial point of view.
11
Last, but obviously not the least, we would wish to express our gratitude to the STDF for providing us
with the opportunity and the means for carrying out this project. Roshan Kahn, -the STDF representative
in charge of supervising this project, - has been a steady support from the start and has guided us with
technical and logistic answers, comments and ideas. The content of this report reflects her dedication to
the project too.
The views expressed in this report remain solely those of the authors.
12
Executive summary
Non-tariff barriers to trade
The international trade arena has recently witnessed the growing importance of non-tariff barriers
(NTBs) to trade. Some of those measures have been developed to correct trade market failures while
others have been necessary to regulate the quality of the imported or exported goods between two
trading countries. Other NTBs are meant to function as a trigger for growth of a given country’s
economy by protecting home industries from foreign competition. In the case of ISPM 15, which falls
into the non-technical measures category, NTBs can be considered a measure to safeguard health,
safety, and security of plants, human beings and animals, and a way to limit environmental pollution.
The trade, economic, social and environmental impacts of NTBs have been acknowledged, studied and
measured extensively in a developed-country context. However, there is limited evidence on the direct
and indirect effects of NTBs in a developing setting, despite the fact that the costs of implementing,
complying with and enforcing NTBs may represent a large share of the value of the total exports of each
country.
ISPM 15: Rationale and implementation
ISPM 15 was adopted by the contracting parties to the International Plant Protection Convention (IPPC)
in 2002 in response to a plant health threat posed by untreated wood packaging material (WPM) used in
international trade. Anecdotal evidence suggests that ISPM 15 at that time represented an unusual and
innovative standard, as it was the first non-conceptual standard having a focus on the material used for
trading commodities rather than on the traded commodities.
The objective of the international standard is to reduce significantly the risk of introduction and spread
of most quarantine pests that may be associated with WPM. The standard recognizes three treatments,
two heat treatments (heat and dielectric heating) and a fumigation treatment using methyl bromide
(MB) that, if correctly applied, should kill the pests in wood making it safe for the WPM to move
internationally. The use of MB is allowed only in few countries worldwide, because of its ozone layer
depleting substance, and when allowed this is normally only for quarantine purposes. All the facilities
treating WPM in the four countries targeted in this study either use MB (the majority) or heat. The main
disadvantage of the heat treatment is represented by its relatively high cost. Treated WPM should be
stamped by the characteristic ISPM 15 mark, which includes the IPPC symbol, a two letter country code
identifying the country in which the treatment has taken place, a number assigned to the WPM
treatment facility, and a two letter code for the treatment used. No other phytosanitary certification is
hereafter needed. The implementation of ISPM 15 in the four case-study countries did not stop the
detections of live pests being present in WPM. Detections still range between 0.1 and 0.4 percent of
inspected consignments, however, the compliance with the standard has contributed to reducing
significantly the share of WPM in which pests have been detected both in absolute and relative way.
Objectives of the project
Using various methodologies and several dataset, the project aims at analysing aspects related to the
implementation of ISPM 15 in four sub-Saharan countries: Botswana, Cameroon, Kenya and
Mozambique. The main objectives of this project are to:
13
i. Assess the magnitude of the effects that the ISPM 15 implementation has had on a number of micro-
and macroeconomic indicators. We will look at how the exports and imports flows have changed after
the implementation of the standard by analyzing time series on trade. In addition, we will measure the
economic feasibility of the WPM treatment facilities, describe their main bottlenecks and propose
remedies.
ii. Critically assess how each of the four countries is implementing the standard and discuss remedies.
We will see whether the regulations put in place by the countries for implementing the standard are
effective or whether they should be updated.
iii. Provide implementation and compliance guidelines, which can be used by the stakeholders located in
the four countries as well as by stakeholders of different countries facing similar challenges.
Methodology and data used
The project deliverables – a regional report, four country reports, a policy brief and a documentary –
and the research questions will rely on a mix of quantitative data (secondary and primary) and
qualitative information.
For what concerns the quantitative part, secondary data were collected for the following variables:
i. value of exports and imports across 86 commodity categories from/to any case-study country and
to/from any trading partner country
ii. GDP sizes of all trading partners
iii. geographical variables (e.g. distance between countries, existence of common borders)
iv. institutional and historical factors (e.g. levels of corruption, colonial ties, common language).
The data were compiled from multiple sources such as the UN Comtrade dataset, World Development
Indicators, World Governance Indicators.
Continuing with the quantitative data, a firm-level survey was designed and administered to WPM
treatment facilities in the four countries. The data obtained through this survey will be used to answer
questions related to the costs of implementing the standard (i.e. costs related to setting up a HT
chamber or for treating the WPM using MB) and the main challenges faced by the treatment facilities.
Qualitative information has been gathered by interviewing informed stakeholders in the four case-study
countries and from other countries (Brazil, Italy and the Netherlands). The stakeholders interviewed
have been different from country to country, though we have tried to cover the same areas of interest
in each country.
Qualitative results of the project
The interviews with the stakeholders and the analysis of the regulations put in place by the four
countries to implement the standard highlight a number of malpractices. These are either country
specific or (as is more frequently the case) commonly shared in the four countries. Misinterpretation of
ISPM 15 at a national regulatory level causes some of the malpractices. In other situation, NPPOs are
aware of the malpractice but do not have the necessary resources or the adequate level of knowledge
to mitigate the situation. Improvements in how ISPM 15 is implemented should come from several
directions, such as a better coordination among the public and private stakeholders, which is lacking in
most countries.
14
Macroeconomic results of the project
The macroeconomic analysis has allowed us to discern some visible differences in export and import
trends when comparing the periods before and after the implementation of ISPM 15. In Kenya, half of
the export sectors experienced an increase in export volumes, while in Botswana, Cameroon and
Mozambique the majority of the export sectors experienced an increase. In Kenya and Botswana, half of
the import sectors experienced an increase in import volumes, whereas in Cameroon and Mozambique
the majority of the import sectors experienced an increase. In Kenya and Cameroon, overall imports
increased far more than exports, resulting in a decrease of the trade balance. Mozambique also
experienced a deterioration of its trade balance, but this was a result of both a decline in overall exports
and an increase in total imports. In contrast, in Botswana overall exports increased by far more than
imports, hereby resulting in an improvement of the trade balance.
Microeconomic results of the project
The analysis of the microeconomic data collected by interviewing the WPM treatment facilities
operating in the four countries have highlighted a number of interesting issues. First, the type of
documents the NPPOs require to grant the facilities WPM treatment authorization. There is no
consistency in the types of documents requested, and this generates confusion among the applicants. At
times, the authorization process takes a long time, adding to the costs sustained by the facilities.
Second, and contrary to what many stakeholders seem to believe, the WPM treating facilities are
generally self-sustainable entities in the medium and long run (based on our cost-benefit analysis of the
financial data). The revenues, coming from the sale of treated WPM, offset fixed and variable costs.
Only the facilities in Mozambique display a deficit.
Main policy implications
The results of our empirical analysis pointed to three policy recommendations. From the qualitative
point of view, there is clearly room for the four countries to improve the way the standard is
implemented. Notwithstanding the differences among the countries, a number of malpractices have
been highlighted which are common for the four of them. The NPPOs have been unable to translate the
international standard into clear national regulation, and the consequences on the implementation
range from a misunderstanding of the WPM treatments allowed, the absence of structured audits, the
lack of inspections for some imported goods, to problems with the readability of the mark. To mitigate
this, the NPPO should invest more in the definition of rules (both for the public and private sectors) to
help ensure the correct implementation of the standard.
The macroeconomic analysis highlighted the differing performance across a wide range of export or
import sectors demonstrating that some sectors were more vulnerable, as suggested by a drop in trade
values after the implementation of ISPM 15. In some cases, this might be the result of poor
implementation of the standard and increased costs of compliance. Policymakers could design
interventions that allow firms (especially small-scale ones) to recover part of the costs related to the
implementation of the standard and to maintain access to global markets. Alternatively, they could
15
support those sectors that grew substantially, as long as these industries can expand further and
compensate for the value and employment loss that other sectors experienced.
Survey data of the WPM treatment facilities have confirmed qualitative results, mainly related to the
lack of a proper flow of information, and have shed some light on the economic viability of the standard,
from the perspective of the WPM treatment facility. That the implementation of the standard generates
high costs seems to be more a myth than the reality, as the surveyed WPM treatment facilities generally
seem to be able to create a positive economic revenue from this activity. However, NPPOs should
support the WPM treatment facilities in investing in treatments different from MB, which is still largely
used in the four countries but is being phased out.
Recipients of the project results
The results stemming from this project can be relevant for several stakeholders. The NPPOs of the four
countries are considered to be the main recipients of the results and they will get indications on how to
better implement ISPM 15, as well as an improved picture of the costs and of the benefits stemming
from the standard. IAPSC (the Regional Plant Protection Organization for the African countries) will also benefit from the
project results, as it may use the findings to improve its supervisory tasks. Representatives of NPPOs in
other countries may derive benefits from the findings of this project, because they may face some of
same challenges, and find help in the recommendations. Industry and producers should find the results
helpful to understand which the main bottlenecks they are facing are, and the economic viability of
WPM treatment facilities. The IPPC Secretariat and FAO (FAO-IPPC) will benefit from the project
outcomes that will point out inconsistencies and problems faced during the implementation process.
Lastly, development practitioners, academics, environmental specialists and economists may find the
discussion that will follow useful and interesting in light of the recent debate on international trade, its
limit and ways to regulate it.
Further studies
The macroeconomic analysis has been a first step in exploring the multifaceted relationship between
ISPM 15 implementation and changes in trade values across a wide range of sectors for the four case-
study countries. In the future, additional empirical endeavours may further aid our understanding of the
complex relationship between this standard and the performance of export/import sectors. Given the
broad focus of the project, the statistical analysis looked at general trends using an econometric model
uniformly applied across all export/import commodities. A follow-up analysis could examine in more
detail the specificities of particular sectors, with the collection of either qualitative or quantitative
information. This can complement the existing macroeconomic analysis by highlighting crucial sector-
specific factors that might have been omitted within the more generic framework of this analysis.
Furthermore, the project has concentrated on sub-Saharan African economies and we anticipate that
many government officials, specialists and practitioners would appreciate a follow-up study with a
broader geographical coverage. Such an analysis could also shed light on the possible larger institutional
differences that are often found within this geographical context (differences that can play a defining
role in terms of how the ISPM 15 standard is implemented and how this affects different sectors).
16
Summary and organization of the report
Chapter 1
Chapter 1 sets the theoretical background for the project. Here, the readers are introduced to the
growing importance that non-tariff barriers to trade have recently acquired as a consequence of the
exponential grow of the volume of the international trade. The rationale of ISPM 15 (which may be
considered a non-tariff barrier as it is a technical measure) is described briefly and the main body of
literature available on the standard is presented.
The importance of this project is also highlighted as it can be considered original in many ways A
comprehensive study on the implementation of ISPM 15, its costs and related benefits, represents a
novelty in a developing-country context, and particularly in the four case-study countries (Botswana,
Cameroon, Kenya and Mozambique). The mix of methodologies used and the rigor in handling and
analyzing the collected data have produced robust and consistent project results. Finally, challenges and
limitations of the project results are discussed and the recipients of the project are outlined.
Chapter 2
Chapter 2 contextualises the research undertaken by providing a reflection on the different types of
policy instruments that are available in the trade-environment domain. We explain how different policy
instruments attempt to impact on trade or environmental outcomes by either influencing prices or
quantities of associated commodities. In that context, we emphasise that there is a wide range of
criteria policymakers should have in mind when designing appropriate instruments. Effectiveness and
efficiency are often defining factors behind this selection. Any thoroughly conducted cost-benefit
analysis, though, should take into consideration many other additional socio-economic side effects
(positive or negative) that are associated with the implementation of the standard. Many of these often
indirect side effects might not be evident at first sight and can relate to employment gains or losses in
associated economic sectors and changes in competitiveness as a result of price distortions.
Increasingly, policymakers also place more emphasis on fairness and distributional aspects when looking
at the availability of different interventions.
Chapter 3
This chapter focuses on ISPM 15 by providing an introduction to the standard along with its rationale
and scope, with particular attention to the changes that standard had faced since it was first adopted in
2002. The chapter also describes the role and responsibilities of the IPPC, the standard setting
organization that facilitated the development of ISPM 15, as well as the core activities of the IPPC
Secretariat. The most relevant studies related to the implementation of the standard and its impacts at
the economic, social and environmental level are also presented. The chapter concludes with a brief
description and overview of how the four case-study countries have implemented the standard.
17
Chapter 4
Chapter 4 compares the standard with the regulation put in place by the four case-study countries to
implement the standard. The material used in this chapter derives from extensive qualitative interviews
carried in the four countries with several stakeholders involved in the implementation of and
compliance with ISPM 15. These include public-sector representatives (NPPO, ministries of agriculture,
industry and commerce, customs organizations) and representatives from the private sector (wood
packaging material (WPM) manufacturers, WPM treatment facilities, exporters). The evidence
presented also aims at highlighting the ISPM 15 implementing agencies’ malpractices. The findings are
triangulated with information and results coming from the macroeconomic (Chapter 5) and
microeconomic analysis (Chapter 6) to define policy guidelines for the countries to follow.
Chapter5
The purpose of the macroeconomic analysis is to estimate changes in trade volumes (exports/imports)
during the periods before and after implementation of ISPM 15 across multiple commodity sectors. The
adoption of ISPM 15 may harm some exporting sectors, assuming that compliance increases the costs of
WPM and, hence, of exported products, rendering them less competitive. Similarly, it may reduce the
volume of imports for specific commodities by permitting imports only from a reduced number of ISPM
15-compliant trading partners. The chapter estimates trade gravity models, which follow the
conventional methodological approach used for such purposes in the empirical trade literature. These
allow us to estimate simultaneously the statistical correlation (association) of these bilateral trade flows
with several socio-economic and geographical factors. Our analysis permits us to calculate the
percentage change in values across different sectors, as well as the overall change in trade balance for
the four countries.
Chapter 6
This chapter assesses one part of the costs and of the benefits related to the ISPM 15 implementation by
looking at the WPM treatment facilities. The available evidence suggests that the WPM treatment
facilities bear the greatest part of the implementation costs. With the use of a structured survey tool,
appropriately designed to capture a number of economic and social indicators, the expenditures and
revenues related to the WPM treatment are analysed. This helps to measure whether the facilities have
an incentive to stay in the WPM treatment business (i.e. the benefits are higher than the costs) or if the
implementation of ISPM 15 is such a costly activity that they are operating in deficit. The chapter also
matches the data gathered via the firm-level survey with the qualitative information gathered via
informal interviews. This exercise will help the reader to link the results previously presented with the
new ones, and will make the findings more robust.
Chapter 7
Chapter 7 offers concluding remarks and policy recommendations. The macroeconomic analysis allowed
us to discern some visible differences in export and import trends when comparing the periods before
and after ISPM 15 implementation. These differences vary between the case-study countries, but the
18
policy responses have similarities as some situations might be the result of poor implementation of the
standard, malpractices or increased costs of compliance. Policymakers could design interventions that
allow firms (especially small-scale ones) to recover part of the costs, implement the standard effectively
and maintain access to global markets. Alternatively, they could support those sectors that grew
substantially in the aftermath of ISPM 15 adoption, as long as these industries can expand further and
compensate for the value and employment loss that other contracting sectors experienced.
19
1. Introduction
The increase in global trade observed over the last 20 years – 100 percent between 2005 and 2015 – has
been accompanied by an increase in the movement of wood packaging materials, such as pallets, crates
and dunnage, which are commonly used to carry and support imported and exported goods (WTO,
2015). Wood packaging material (WPM) have become significant pathways by which bark and wood-
boring pests move between borders. Recognizing this as a threat, an international standard for the
treatment of wood packaging materials, International Standard for Phytosanitary Measures (ISPM 15),
was developed under the framework of the International Plant Protection Convention (IPPC), and has
been implemented in most countries around the globe since its adoption in 2002.
The rationale of ISPM 15 is to facilitate the trade of commodities associated with wood packaging
materials while reducing, if not eliminating, the risk of introduction and spread of plant pests that have a
negative economic, social and environmental impact. The adoption of ISPM 15 is considered to have
greatly reduced the movement of pests associated with wood, and has also resulted in the reduction in
the intensity of inspections of such materials, hereby avoiding delays in shipping.
However, how can we effectively calculate and measure the impact of ISPM 15? This report, which is the
culmination of an almost three-year long project, will try to assess exactly that through a thorough an
empirical analysis of how the regulation affects the economy of four case-study countries. The analysis,
as it will unveil in what follows, will assess the implementation policies set up at a national level to
comply with ISPM 15, to measure the costs of complying with this international standard from the WPM
treatment facilities’ perspective, and to evaluate the impacts ISPM 15 has had on export and import
flows. The analysis will be carried out for a selected group of sub-Saharan countries, namely Botswana,
Cameroon, Kenya and Mozambique. The ultimate objective of this study is to provide an economically
sound analysis of the implementation of ISPM 15; the results from which will help the countries involved
in the analysis to better understand the best practices to adopt and how to overcome any
implementation challenges they may face. The results of this study may also be used as a tool for other
countries located in the same region, or facing similar challenges, to better understand and better apply
ISPM 15. In addition, the analysis can be used as a benchmark by other countries interested in
comparing the losses and gains generated by implementing the standard.
The rest of this chapter is structured in the following way. The next section will set the scene for the rest
of the study, highlighting the theoretical background of the analysis. A very brief introduction to ISPM 15
is provided in Section 1.2, while Section 1.3 will discuss the main evidence related to the micro- and
macroeconomic effects the standard may have. After discussing the importance of having an
economically sound and rigorous cost-benefit analysis (Section 1.4), we will briefly enumerate and
discuss the main objectives this analysis aims at (Section 1.5) and the methodologies used (Section 1.6).
The limitations this study faced are disclosed in Section 1.7.
1.1 Theoretical background
In recent years, the international trade arena has witnessed the growing importance of non-tariff
barriers (NTBs) such as standards, regulations, conditions, policy measures and private sector business
practices.
20
The rationales behind the proliferation of the multitude of NTBs related to international trade among
countries are multiple, very often interlinked and, hence, difficult to disentangle. From one point of
view, some of the measures are taken to remedy failures related how trade markets have been
organized and function. From another point of view, NTBs are necessary to regulate the quality of the
imported and exported goods between two trading countries. In addition, NTBs are sometimes
supposed to facilitate the growth of a given country’s economy by protecting home industries from
foreign competition. Furthermore, and this is the case of ISPM 15, they are used to help prevent that
imported goods arrive in the importing country carrying pests that can have negative effects on the
environment, on the country’s economy and on food security. In this specific case, NTBs should be seen
as a measure to safeguard health, and security of plants, human beings and animals, and a way to
protect the environment and biodiversity.
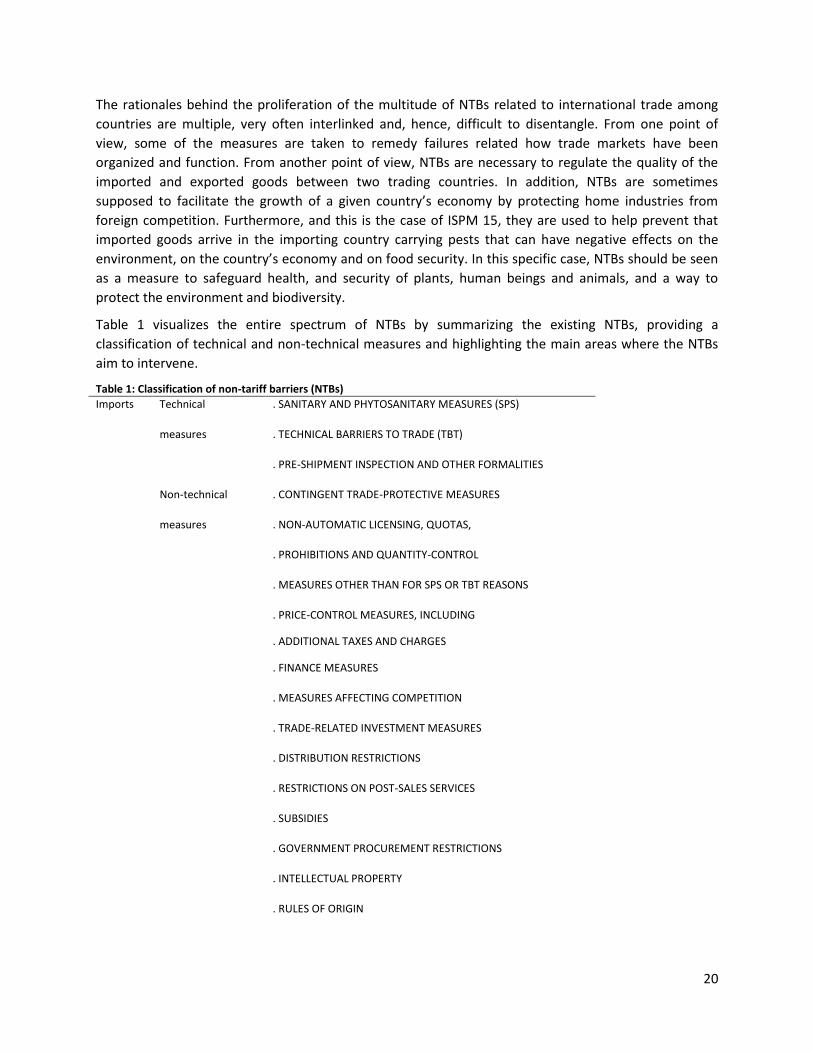
Table 1 visualizes the entire spectrum of NTBs by summarizing the existing NTBs, providing a
classification of technical and non-technical measures and highlighting the main areas where the NTBs
aim to intervene.
Table 1: Classification of non-tariff barriers (NTBs)
Imports Technical
measures
. SANITARY AND PHYTOSANITARY MEASURES (SPS)
. TECHNICAL BARRIERS TO TRADE (TBT)
. PRE-SHIPMENT INSPECTION AND OTHER FORMALITIES
Non-technical
measures
. CONTINGENT TRADE-PROTECTIVE MEASURES
. NON-AUTOMATIC LICENSING, QUOTAS,
. PROHIBITIONS AND QUANTITY-CONTROL
. MEASURES OTHER THAN FOR SPS OR TBT REASONS
. PRICE-CONTROL MEASURES, INCLUDING
. ADDITIONAL TAXES AND CHARGES
. FINANCE MEASURES
. MEASURES AFFECTING COMPETITION
. TRADE-RELATED INVESTMENT MEASURES
. DISTRIBUTION RESTRICTIONS
. RESTRICTIONS ON POST-SALES SERVICES
. SUBSIDIES
. GOVERNMENT PROCUREMENT RESTRICTIONS
. INTELLECTUAL PROPERTY
. RULES OF ORIGIN
21
Exports . EXPORT-RELATED MEASURES
Source: UNCTAD (2010).
The implementation of these measures, whether technical or non-technical, very often comes with a
number of direct and indirect effects – with the last generally referred to, in economics, as “spillover
effects”2 – affecting the countries’ economies at different levels. The discussion on the impacts that
those measures related to trade may have at the economic, environmental, social and political level is
nowadays at the forefront of the global policy debate.
That said, some of the measures bring relatively unimportant economic effects. For example, the
requirements around packaging and labelling, which are part of the SPS measures, could in theory
impede trade but, in practice, they do not affect the circulation of goods.3 For a number of other NTBs,
the effects they have on international trade are often very subtle, and consequences may manifest in
several indirect ways. In those cases, the spillover effects cannot be generalized, as they are very case or
country specific. As an example, the effects stemming from measures related to the control of prices are
relatively simple to account for, especially as regards anti-dumping and safeguards.4 However, while
some measures may present negligent effects, it is also true that there are intrinsic difficulties in
quantifying the whole range of indirect effects for most measures.
The analysis of the economic, social and environmental effects does not exhaust the totality of the costs
and benefits associated with the implementation of and compliance with a standard. If the objective is
to have a complete view of all the costs and benefits – both direct and indirect – a careful analysis of
how the standard is being implemented and of all the procedures set by the country to be in compliance
with the standard would be needed. The implementation, compliance and enforcement of NTBs lead to
the development of processes, laws and regulations, which can be complex and costly, depending on
the country’s socio-economic development. The high costs that implementation has, may present a
challenge to the country’s ability to comply with a standard. For developing countries, the process of
complying with international standards tends to be more expensive in both absolute and relative terms
because, for instance, they do not necessarily have the public resources to finance all of the components
of a national phytosanitary system, including national laboratories for testing. They also often do not
have the capability or the knowledge to develop their own standards, or the resources and know-how to
comply with international standards. An additional difficulty is that a significant portion of
implementation and certification costs needed to comply with the standards is transferred to individual
firms and farmers, with severe economic consequences for small and medium-sized companies
(Harrison and Hanson, 1999).
The limited evidence available suggests that the costs of implementing, complying with and enforcing
the NTBs represent a relatively large share of the value of the total exports of each country. The
magnitude of those costs is difficult to be estimated a priori as they vary. In general terms, the costs
2 In economics, “spillover effects” indicate those secondary effects (technically “the effects which spill over”) that follow from a
primary effect. 3 The labelling measure defines the information related to food safety, which should be provided to the consumer. As an
example, labels must specify the storage conditions such as “5 °C maximum” or potentially dangerous ingredients such as allergens. It is true that this measure – albeit not changing the value chain hugely – does require setting up regulations, for instance for inspection. 4 Price-control measures are implemented to control or affect the prices of imported goods in order to support the domestic
price of certain products.
22
depend on a number of factors related to: the development of legislation or regulations; building
capacities of industry and government officials; aligning the supply chain to the new legislation; setting
up effective inspections or delivering laboratories that test the commodity. These investment costs have
been estimated to exceed the total annual food exports of a country, for instance in Mozambique
(Shafaeddin, 2007). However, the lack of compliance with the NTBs might impede trade, which in turn
could result in even higher economic losses.
The difficulty in analysing the direct and indirect effects, as well as the quantification of all the costs,
related to the implementation of NTBs, is partly related to the lack of reliable data. The paucity of data
on NTB-related matters has been the main problem behind the lack of thorough studies on the
consequences – mostly economic and social – of NTBs. The reason behind the scarcity of quantitative
data is largely related to the difficulty of collecting those types of data and relating them to the presence
of NTBs. The fact that the number of NTBs used to regulate international trade is increasing makes the
urgency of proper data collection, the need of quantitative studies, and the availability of economic
reflections even more compelling.
To our knowledge, the trade, economic and social impacts of NTB measures have been widely
acknowledged, studied and measured in a developed-country context, despite the fact that NTB
measures may affect developing countries in a more drastic way. The majority of the studies undertaken
and available to this date have focused on the United States of America (US). As an example, the study
of Thornsbury et al. (1997) estimates the total impact of technical barriers on US exports of agricultural
products in a given period of time. Several studies have addressed NTB-related issues in regards to a
number of macro and micro indicators in developing countries’ economies with a focus on the
qualitative discussion of the potential impacts NTBs have, rather than on a quantitative assessment of
the actual impacts. New Zealand has a long history of cost-benefit analyses as part of a structured and
well-defined SPS decision-making framework (Mumford, 2002).
Other studies that focus on less-developed countries have analysed the costs and benefits of eradicating
pests, as in the case of Belize and the Pink hibiscus mealybug (Maconellicoccus hirsutus). The study was
meant to justify the government’s continued investments in its eradication (Kairo et al., 2000). Other
case studies have focused on the compliance costs. Cato (1998) assessed the costs of upgrading the
sanitary conditions in the Bangladesh frozen shrimp industry to comply with the European Union (EU)
and the US food safety standards. Conclusions suggest that approximately USD 19 million had been
spent overall to upgrade the production system, with the average expense per production plant being
approximately USD 2,384. Finger and Schuler (1999) estimated that the costs of achieving the disease-
free and pest-free status to enable Argentina to export meat, fruit and vegetables amounted to a total
of USD 88 million, distributed over the period 1991–1996. Henson et al. (2000) analysed the impact of
the EU hygiene requirements on Kenyan fish exports and computed that the expected costs for
modernizing the entire infrastructure and upgrading laboratories would cost a total of USD 7 million.
These costs, they argue, would be amortized by the increase in exports. Herath (2001) analysed the
impact of SPS requirements on beverages and spices in Sri Lanka finding that, due to the lower domestic
standards as compared to the international ones, the yearly loss of potential exports due to non-
compliance would be in the range of 30 percent of the total exports of spices and beverages.
From the brief literature review presented above – a more in-depth review of the literature will follow in
the next chapter – is clear that the majority of the empirical studies have looked at only one aspect of
23
NTBs, failing to give an overall picture of all the costs and benefits related to the implementation of
international standards. In many cases, the social costs for the community, a quantification of the
overall benefits and how any losses or gains are distributed among the stakeholders are not considered
in the overall analysis. The end result is that the economic evidence available for policymakers and
economic practitioners is partially biased and no clear guidance can be given to local governments. The
lack of evidence related to developing countries clashes with the fact that the share of trade involving
less developed countries represent 42 percent of the total trade worldwide (Milner et al., 2000;
Wacziarg and Welch, 2008).5
This study aims at filling the lack of quantitative studies having the economy of developing countries as
the main focus. It mainly looks at the direct and indirect effects at the macro- and microeconomic level
of one international standard only; ISPM 15. ISPM 15 falls into the category of SPS measures, a subgroup
of the NTBs.
The use of SPS measures is largely limited to agricultural sector products, and their existence is essential
for ensuring the health and well-being of consumers, and the protection of the environment (in
contrast, TBTs can be applied to a wider set of products and are found to be more uniformly applied
across economic sectors with peaks in textiles, footwear, processed food and chemicals. In addition,
TBTs set out specific characteristics of a product, such as its size, shape, design, functions, and
performance, or the way the product is labelled or packaged before it becomes a commercial good).
Technically, SPS measures are a subset of regulations that specifically aim at protecting:
i. human or animal life from risks arising from additives, contaminants, toxins or disease-causing
organisms in their food
ii. human health and life from plant or animal-carried diseases
iii. animal or plant life from the introduction of pests, diseases or disease causing organisms, and
iv. countries from damage caused by the entry, establishment or spread of pests.
One of the main problems related to SPS is represented by the fact that these measures may have
negative effects on the economic performance of the country as a consequence of the possibly negative
impact on trade. That happens as SPS may indirectly impose costs for all those producers and exporters
that have to comply with the standard. The final effect may be a loss in the competitiveness for the
producer or exporter with chain effects for the whole economy of that country. SPS measures do not
include environmental protection measures, consumer interests or animal welfare.
1.2 ISPM 15 in a nutshell
The World Trade Organization (WTO) originated in 1994 in the aftermath of the Uruguay Round of the
General Agreement on Tariffs and Trade, and it has set up rules for international trade for more than 20
years. In order to prevent the WTO member nations from using the phytosanitary measures for their
own interests (i.e. protect domestic producers from foreign competition by issuing protectionist
measures) the signatories have simultaneously agreed to adopt the SPS Agreement. In November 1997,
5 A more in-depth analysis of the available literature on the effects of the NTBs will be presented in Chapter 2.
24
the 46-year-old IPPC, which was originally formed to control plant pests and diseases and to prevent
their spread across national borders, was revised to align it with the SPS agreement (Woodroffe, 2010).
Under the SPS agreement between the WTO and the revised IPPC, the IPPC is the mandated framework
under which to develop internationally recognized standards for phytosanitary measures considered
necessary to protect global plant health, including wild fauna and flora.
Plant pests exotic to an area (also often referred to as “invasive alien species”) have been recognized to
be among the greatest threats to biodiversity and ecosystem stability in terms of loss of plants specific
to an area. They are considered responsible for great potential losses in agricultural yields and the cause
of the imposition of serious economic and social costs. Pests exotic to an area, for instance a country or
part of a country, and that if introduced may result in major damage, are normally considered
“regulated pests” (quarantine and regulated non-quarantine pests) by that country. The country will
therefore set import requirements to help ensure that the pest is not introduced through the
international movement of plants and plant products.6
Threats from plant pests are not always recognised worldwide. Several countries have not designed an
ad-hoc policy to help reduce or eliminate the entry of pests within their borders, and in addition, costs
associated to their presence have not been clearly estimated. Other countries, on the contrary, have
identified as a priority the necessity to “prevent the introduction of harmful alien organisms and
eliminate or reduce their adverse effects to acceptable levels” by “determining priorities for allocating
resources for the control of harmful alien organisms based on their impact on native biodiversity and
economic resources, and implementing effective control or, where possible, eradication measures”
(Biodiversity Convention Office, 1995).
In this context, ISPM 15 was developed in response to the pest risk represented by WPM (i.e. pallets,
crates, and dunnage). The WPM covered by this standard excludes wood packaging made from wood
processed in such a way that is free from pests (e.g. plywood) and from material made from thin wood
(six millimetres or less in thickness). Other processed wood material include barrels for wine and spirit
that have been heated during manufacturing, or gift boxes for commodities made from wood that has
been processed or manufactured in a way that render them free of pests.
WPM constitutes one of the most used products for exporting goods and has been recognized to be one
of the primary pathways by which bark- and wood-boring pests move across the world. As a response to
this threat, the contracting parties of the IPPC adopted ISPM 15 in 2002. The standard has been
designed ad-hoc to help reduce the risks from this threat, and it was later revised to “reduce the risk of
introduction and spread of quarantine pests associated with the movement in international trade of
wood packaging material made from raw wood”. During the adoption of the revised ISPM 15 in 2009,
the CPM recognized that WPM produced under the specifications of earlier versions of the standard (i.e.
that did not set specific requirements around debarking) continued to present only negligible risks for
the movement of pests and therefore should remain certified while in service. The content of an
international standard having the focus of regulating the international circulation of WPM as a way of
reducing the spread of pests was agreed upon back to the beginning of 2000 when experts met to
develop a draft ISPM.7
6 See also ISPM 5 (Glossary of phytosanitary terms).
7 Anecdotal facts about the history of the ISPM 15 are available at the following website (last accessed: 23/06/2017).
25
The first version of ISPM 15 was adopted by the CPM in March 2002 and in April 2009 a revised ISPM 15
was adopted. In 2013, the CPM adopted the revised “Annex 1 Approved treatments associated with
wood packaging material” and made consequential changes to Annex 2 “The mark and its application”
to include dielectric heating (DH) as an alternative treatment.
ISPM 15 sets requirements for the treatments that contracting parties to the IPPC apply to WPM used in
international trade. The necessity of defining an international standard for regulating WPM became
effective immediately after the exponential increase in trade. Most imported and exported goods are
accompanied by some sort of WPM, which may host pests that have a devastating environmental and
economic impact on forests. The standard was adopted remarkably quickly; only seven years after the
second detection of Emerald Ash Borer in the US raised the alarm. Since its first discovery in the US, it is
estimated that this pest has destroyed 40 million ash trees in Michigan state alone (USDA, 2017). Similar
consequences have been caused by the Asian long-horned beetle (Anoplophora glabripennis) since it
was discovered in 1996 in New York State, and by the Pine shoot beetle, believed to have come from
Europe. These pests’ establishment in the US has resulted in millions of USD worth of damage and
eradication efforts (Skrzycki, 2004).
1.3 Quantitative evidence on ISPM 15 effects
While the numbers of wood packaging shipments in which pests have been detected have been quite
low since the adoption of ISPM 15 (ranging from 0.1 to 0.4 percent of inspected shipments), concerns
remain.
First, an infestation rate of 0.1 percent of incoming shipments still means at least 70,000 infested
shipments moving globally each year. Second, highly damaging insects continue to be found in wood
packaging; the US intercepted five shipments containing Asian long-horned beetle in 2008. ISPM 15 was
strengthened in 2009 to limit how much bark may be present on the wood. Because many insects are
associated with bark, compliance with this new provision should further reduce the chances of wood
packaging carrying insects or diseases. However, no country currently collects interception data in a
manner that would allow a scientific evaluation of whether ISPM 15 has significantly reduced the
number of pests in WPM.
The difficulties of conducting rigorous economic analysis on the consequences of pests are compounded
by the scarcity of economic data, which are only available for perhaps 1–2 percent of pests and in a
circumscribed sample of countries. It is thus not possible to have an exact idea of the amount of
damages such pests have caused so far across the world. Existing estimates suggest that the losses in
agricultural yields caused by borer pests are greater than those caused by any other pest; consequences
of these pests’ establishments are even more severe than the numbers show because they are usually
irrevocable (the economic consequences of pests are dealt with in Chapter 3).
Concerning other areas of the world, there are very few published or on-going studies, and most of
them focus on European countries, New Zealand and the US. Given the many differences among those
areas and the countries located in Africa, most of the already known suggestions and conclusions cannot
be taken into account in our study. Nonetheless, we do believe that previous studies will help us in
26
defining the correct statistical analysis to employ, keeping in mind, naturally, the micro and macro
differences between African countries and those located in other areas.
Previous studies conducted in the US show how welfare, real gross national product (GDP) and real
trade impacts of ISPM 15 are small. Despite this, ISPM 15 implementation brought some major changes
such as a shift in the horticultural imports and other food preparation products away from South and
Central America, and mineral products from southern Europe, to Mexico, Canada and, to a lesser extent,
China. Such shifts in trading partners could have extremely interesting implications for the US pest risk
analyses. For example, horticultural imports from Mexico to the US have previously been identified as a
high-risk pathway for pests. The reduction in US imports of mineral products from southern Europe
should result in fewer borers being intercepted, given tiles and quarry products (e.g. marble and slate)
from this area have traditionally been a significant pest pathway (Haack, 2001; Haack, 2006).
In addition, the IPPC Secretariat (hereafter “FAO-IPPC”) has previously organized or co-organized
workshops on the practical application of ISPM 158. However, to our knowledge, a workshop seeking to
understand the real application of ISPM 15 and to build capacities by knowledge sharing has never taken
place in Sub-Saharan countries. The involvement of the Inter-African Phytosanitary Council (IAPSC) in
this current study will guarantee that all the countries in the Africa Union will benefit at different levels
from this study. In addition, the fact that this study is not constituted by pure research analysis but also
based on qualitative and quantitative data, we will be able to grasp the main challenges faced by the
involved countries in implementing the standard. Furthermore, this study will suggest a number of
procedures and best strategies to help countries fully understand the economic consequences of
implementing the standard.
1.4 The importance of cost-benefit analysis
Quantitative studies generally and cost-benefit analyses specifically constitute a weighting-scale
approach designed to help policymakers make the most appropriate business or economic decisions.
The idea behind the cost-benefit analysis is that all the pluses – i.e. the benefits – are put on one side of
the balance and all the minuses – i.e. the costs – are put on the other; whichever side weighs the
heavier wins. One of the main advantages of doing a cost-benefit analysis is that it is easy to understand
and, in most of the cases, to perform, as you are simply looking at whether the overall benefits outweigh
the overall costs.
Difficulties may arise when there are indirect costs and benefits (the aforementioned “spillover” effects)
to take into account. In other words, the choice of one given option may cause a number of other
phenomena to occur. In this specific case, all the benefits and costs related to the phenomenon have to
be taken into account and weighted. In addition, decisions cannot be made in isolation. There are
usually several competing options, and if one given option is not chosen, another one will be. Therefore,
it is important to analyse both scenarios to assess which is the most economical. To make things more
complicated, the analysis should consider not only the short term but also the long term. In most cases,
the results coming from the cost-benefit analysis exercise may vary depending on the time horizon;
what may seem not to be profitable in the short term might actually be so in the longer period, or vice
27
versa. The history of economic analysis supporting decision-making processes is rather long; economic
analysis is used to understand whether a program, of whatever kind, meets its objectives, for instance to
shed light on the effects of a taxation program or to assess how a reform affects different economic
strata of the population.
In this analysis, we will demonstrate that SPS measures do not necessarily present economic
inefficiencies, which are normally associated with the introduction of classical trade barriers. As a
consequence, the impact certain regulations may have is not always negative, nor would their removal
necessarily achieve efficiency gains that would exceed the losses from weaker regulation. In other
words, as we will clarify in the following chapters, SPS can be proved to provide substantial benefits to
the overall economic system.
Several countries, organizations and researchers have carried out a number of applied cost-benefit
economic analyses in SPS-relevant areas, such as the impacts of past and on-going investments in SPS
capacity building. New Zealand routinely implements cost-benefit analysis as part of a structured SPS
decision-making framework. Belize has analysed the costs and benefits of investing in control of the Pink
hibiscus healybug – a plant pest foreign to the country – to justify the continued economic
disbursements related to control its spread. The Philippines has assessed the financial returns on Foot
and Mouth Disease control. These and other experiences show that making systematic use of economic
analysis in SPS decision-making brings a number of benefits. It helps policymakers to make decisions,
which are based on data and economic analysis, and it reduces the risk of inefficient or ineffective
decisions. The use of economic analysis promotes better use of resources and it can also help to
determine the point along the value chain at which investments would generate the greatest or lowest
returns; this is essential information needed to design ad-hoc policies. Lastly, economic analysis
contributes to objectivity, consistency, transparency and accountability in decision-making.
For what concerns the analysis of the economic impacts related to ISPM 15, the costs relate to all the
expenses disbursed for the implementation of the standard and for a country to comply with it. The
benefits stems from the ability of a country, or rather the export companies present in the given
country, to trade with other countries. There are a number of indirect benefits to take into account too.
One of the main benefits from complying with the standard is limiting the entry of pest; which in turn
reduces the likelihood of environmental disasters, as well as decreases in agricultural yields and, as a
consequence, helps increase food supply. While those indirect benefits may be difficult to measure, they
play an important part when weighting the benefits against the costs. On the cost side, compliance with
the standard may determine that a number of WPM repairers should be more regulated, which may
have negative consequences on the employment rate. The whole range of costs and benefits that are
likely to stem from the standard’s implementation will be discussed in Chapter 3.
Understanding how SPS measures, and in this specific context ISPM 15, are formulated and how best to
implement them is essential to any country’s central government and its ministries dealing with trade
and agriculture. The cost-benefit analysis as it will be presented here is particularly suited for
understanding which priorities across different capacity building options should be set, and to better
and more effectively allocate the resources.
28
1.5 Beneficiaries and objectives of the study
This study is firstly intended to be used by a number of stakeholders in the four case-study countries,
from central governments, industries, smallholder farmers, to NPPO representatives, which are involved
in different stages of ISPM 15 implementation and compliance. Secondly, the results of this analysis can
theoretically be of worldwide interest to academics, policymakers and development practitioners, as the
conclusions will affect the environmental, social and economic sphere.
More specifically, the central government of a given country under analysis is considered to be the first
recipient of the results, as the latter will help to gain a deeper understanding of the major positive and
negative effects the standard has had in the short, medium and long term. The results may be used as
an economic basis needed to design ad-hoc policies; for example aimed at redistributing in a more even
way the benefits or losses ISPM 15 implementation has created, or by subsidizing relevant sectors of the
economy, if those have been penalized.
Furthermore, the recommendations and the policy implications stemming from this analysis will be used
by the NPPOs of the four case-study countries. The NPPOs are national-level public organizations whose
aim is to strengthen the national and global status of plant health by securing common and effective
action to prevent the movement, introduction and spread the of pests of plants and plant products. The
NPPOs are also ultimately responsible for the correct implementation of and compliance with ISPM 15.
In this context, the analysis will help NPPOs to understand some of the best practices for implementing
the standard by analyzing what went wrong so far, how to overcome bottlenecks and how to speed up
the implementation process. The results will help the NPPOs identify more efficient and less costly ways
to implement and comply with ISPM 15. Furthermore, other NPPOs – both within and outside the
African region – may derive benefits from the findings of this analysis.
The Regional Plant Protection Organization (RPPO) for the African countries, IAPSC, will benefit as well
from the analysis through the use of the policy recommendations for its supervisory tasks.
In addition, FAO-IPPC too will benefit from the outcomes of the analysis, as they will point out
inconsistencies and problems faced during the implementation process, which may be attributable to
the clarity of the standard, or to the ability of NPPOs to fully implement the measures required. The
analysis can thus then be seen as a way to gather information for when ISPM 15 will be revised in the
future, to help improve the standard in terms of facilitating implementation.
Lastly, development practitioners, academics, environmental specialists as well as economists may find
the discussion that will follow useful and interesting in light of the recent debate on international trade,
its limit and ways to regulate it, just as industry and producers may find the analysis beneficial to better
define their production or trade options, and to re-define internal policies.
The three main objective of this study are to:
i. assess the magnitude of the socio, economic and environmental effects ISPM 15 has on a number of
micro- and macroeconomic indicators of a given country (such as the magnitude of exports and imports,
or costs suffered by the WPM treatment facilities)
ii. analyse how each of the four case-study countries is implementing the standard from a logistic point
of view, and
29
iii. provide implementation guidelines, both for the countries involved in the analysis and for other
countries facing similar challenges.
These three broader objectives are divided in sub-objectives, which are often interlinked and
overlapping. As an example, the study will examine how the export performance of a country – a
macroeconomic indicator - has changed after the country started to implement the standard; the
indirect consequence of a change in the export will be a redistribution of the national wealth at the
microeconomic level. The three objectives will be analysed and further discussed in Chapter 3.
1.6 Combination of methodologies used
The economic effects stemming from the implementation of and compliance with ISPM 15 will be
analysed from several points of views, using different sets of data at micro- and macroeconomic level
and distinct statistical techniques, in order to capture the multitude of the spillover effects. The
macroeconomic impacts that ISPM 15 may have will be studied using gravity models, as these estimate
the dependence of bilateral trade flows on the size of trading partners’ economies, the distance
between them, and a set of other relevant explanatory variables (ISPM 15 implementation, institutional
and geographical factors etc.).9 The microeconomic impacts will be detected analyzing data collected
from interviewing WPM treatment facilities in the four case-study countries. The results from the micro-
and macroeconomic analysis will be integrated using qualitative data gathered during the several
interviews with local and international stakeholders. The combination of all this data will shed light on
the magnitude of the impacts and on the overall effect that ISPM 15 has on the economy of a given
country.
In order to fully understand the impacts of ISPM 15 at the country level, it is crucial to know all the
direct and indirect channels through which stakeholders may be affected by its implementation.
Contemporaneously, the cost-benefit analysis will determine the distributional outcomes of the
standard’s implementation at the value chain level, identifying the winners and the losers, and how
costs and profits (both in terms of income and value-added products), as well as the margins of
compliance, related to the implementation are distributed at various levels.
The research questions and the study deliverables will rely on a mix of quantitative data – both
secondary and primary – and qualitative information. For what concerns the quantitative part,
secondary data were obtained for several key variables, namely: (a) the value of exports and imports
across 86 commodity categories from and to any of the case-study countries (b) GDP sizes of all trade
partners; (c) several geographical variables (distance between countries, existence of common borders);
and, (d) institutional and historical factors (levels of corruption, colonial ties, common language). The
data are compiled from multiple sources including the UN Comtrade dataset, World Development
Indicators, and World Governance Indicators. A detailed description of all variables used in the
macroeconomic analysis is provided in Chapter 5.
In addition, a firm-level survey was designed and administered to WPM treatment facilities. The data
coming from the survey will be used to answer the questions related to the costs of implementing the
standard such as those related to operating a heat treatment (HT) chamber or treating WPM using
9 Gravity models are econometric techniques used to estimate the dependence of bilateral trade flows on the size of economies
of trade partners, the distance between them, and of other relevant explanatory variables.
30
methyl bromide (MB). It will also help present the main challenges faced by the treatment facilities. A
more detailed description of the survey is provided in Chapter 6.
Qualitative information has been gathered through interviews with informed stakeholders, both in the
four countries and from other countries. The stakeholders interviewed have been different from country
to country, although we have tried to cover the same area of interest in each country.
These three streams of data have been used separately and in combination. Qualitative data have been
used mainly to understand a number of standard-related issues, which have not been identified by any
other data sources. These include, for example, the criteria by which the NPPOs give the WPM
treatment facilities the license to operate and the number of inspections done every year of the facility,
how the NPPOs regulate customs inspections at both entry and exit level, the quarantine procedures,
etc. The main results stemming from the qualitative interviews are in Chapter 4.
The macroeconomic data have been used for the country-level econometric analysis (gravity models);
this allows estimating simultaneously the statistical correlation (association) of bilateral trade flows with
several socio-economic and geographical factors, including the timing of ISPM 15 adoption. Chapter 5
provides a more comprehensive description of the macroeconomic data, the sources of the data and of
the macroeconomic analysis.
Microdata has been used to measure the overall costs and overall benefits of the implementation of the
standard, with a particular focus on the WPM treatment facilities. The cost-benefit analysis consists of a
statistical analysis of the microdata, both at the pooled level (i.e. all the countries taken together) and at
the individual country level. A detailed list of economic indicators and conclusions stemming from the
microdata analysis can be found in Chapter 6.
The three types of data have been used both separately, as some of the research questions can be dealt
with only by using one or another source of data, and combined. This last use of the data has been to
triangulate the ranges of conclusions obtained. Triangulation is a common tool in economic analysis
used to verify how accurate one given result is by using another set of data of a different source of
information to do the same analysis. As an example, the conclusions around capacity development,
organized by the NPPO related to ISPM 15, can be checked by analysing the microdata in the survey and
the information gathered during the qualitative interview.
1.7 Limitations and challenges of this study
As stated before, the analysis will focus on four countries: Botswana, Cameroon, Kenya and
Mozambique. The countries will be analysed singularly to better understand the peculiarity of the
implementation and compliance processes, and will be taken together to derive common lessons and
policy implications. The original idea was to include several more sub-Saharan countries to make the
regional study more consistent and be able to generalize the conclusions and policy recommendations
to a vaster geographical area. A sub-optimal situation would have been to have enough countries to be
able to geographically represent the whole continent. For various reasons neither the original nor the
sub-optimal idea has materialized. One of the main impediments has been the unavailability of NPPOs
from other African countries to support the project. The implication of having only four observations
(i.e. four countries) is that the conclusions we reach and that we try to generalize to a broader African
context should to be taken with a grain of salt, as they may misrepresent the current situation in a
31
different country. Nevertheless, we are confident that the conclusions related to each of the countries
here analysed are economically solid, statistically robust, and the result of qualitative information, which
has been triangulated with micro- and macrodata available.
The first limitation of this analysis relates to the fact that ISPM 15 compliance and implementation can,
theoretically, have very broad ranges of indirect effects. These may relate to the macro indicators of a
country (e.g. the balance of trade with clear effects on the country’s GDP, the performance of the
exporting companies and that of the wood pallets manufacturers). Indirect effects may affect the micro
indicators as well (e.g. poverty share, distribution of welfare among strata of the population, work
participation between men and women). The environmental sphere in a wide sense may be influenced,
resulting in more or less pests in the country, damages caused by possible pests and all the related
impacts on the agricultural activities. Analysing, measuring and assessing how the implementation of
ISPM 15 has affected all these indicators may be a cumbersome job, and the final results and policy
recommendations may lose precision. To this regard, we acknowledge beforehand that the compliance
to an international standard may have a domino effect on a number of other economic, social and
environmental indicators and that measuring the whole spectrum of costs and benefits may be too
challenging in terms of data collection. For this reason, the analysis focuses on a restricted number of
indicators, which should help the NPPO and the central government representatives of the four
countries, as well as the international community, to understand whether complying with this standard
constitutes an economically profitable choice.
Second, the macroeconomic analysis has also limitations (which is a common limitation of any similar
country-level econometric analysis) as relates to inference and interpretation of results. The estimated
statistical models largely present statistical correlations between trade flows (exports or imports) and a
number of related socio-economic variables, rather than necessarily presenting causation. For this
reason, results need to be interpreted with some caution; one can estimate changes in trade following
ISPM 15 implementation, but it is impossible to attribute these changes entirely to the standard’s
adoption or any other explanatory variable.
The third challenge worth mentioning is represented by the collection of firm level data. First of all, the
survey instrument, largely similar in all the countries under analysis, has been adapted to the specificity
of each country. Nevertheless, this adaptation does not preclude any comparison among the countries;
only very few variables will be excluded from the comparison exercises as not present for all the
countries. Another challenge has been represented by the number of WPM treatment facilities that
participated in the survey. All the existing WPM treatment facilities in the four countries were contacted
to take part in the survey in some cases, especially in Cameroon, a significant number of the
respondents did not agree to participate. This aspect will be further discussed in Chapter 6. For what
concerns the quality of the microdata gathered, some of the respondents were not willing to release
necessary information concerning their production costs or profits. The lack of some of these financial
data made the cost-benefit analysis more problematic and the results less precise.
The collection of the qualitative information via non-structured interviews with the informed
stakeholders did not present particular challenges. This information has been checked and triangulated
with other sources, mostly with microeconomic data and country regulations.
32
2. Context and Framework of the Analysis
2.1 Introduction
There are many environmental measures nowadays that help us regulate the impact of a diverse range
of human activities on the environment. In many domains of environmental protection (such as air and
water quality, provision of ecosystem services, climate stability), markets are not sufficient alone to
regulate the extent of environmental degradation that affects welfare in a non-excludable and non-rival
manner. In other words, market mechanisms cannot reduce the extent of “public bads”, since it is often
prohibitively expensive to exclude certain individuals alone from the welfare costs of environmental
damage, while the disutility and displeasure experienced by any individual is independent of the one
experienced by others. These are typically referred to as the case of “missing markets”, where those
contributing to environmental damage and those demanding a reduction of it do not physically meet to
negotiate solutions to the problem, in the form of appropriate compensation mechanisms or other
implicit pricing. In such cases, negative environmental externalities often affect other individuals than
the ones generating them and policymakers need to intervene in order to limit environmental
degradation.
On many occasions, policymakers resort to market-based instruments to control for the levels of
environmental pollution and degradation (Pirard, 2012). This rather heterogeneous group of policy
instruments incorporate a price component that aims at incentivizing (or disincentivizing) certain
behaviors through the provision of financial rewards and penalties. Charges and taxes on pollution or
environmentally-destructive activities increase the price of goods and services that result in pollution or
excessive resource use. These can be applied per item (e.g. plastic bag levies) or based on measurable
environmental parameters (e.g. a tax linked to the carbon intensity of fuels). Using financial penalties is
a similar mechanism that goes a step further by implicitly “criminalizing” certain unsustainable
behaviors and imposing monetary penalties to those deviating from the pre-defined “status quo”.
Instead of imposing charges that limit but nevertheless legitimize a certain activity, financial penalties
treat non-compliant behavior as an environmental offence (e.g. a fine imposed on those discharging
waste in a water source or engaging in hunting during certain periods of the year). Tradable permits is a
form of policy mechanism that allows one to sell some entitled environmental rights that are not
exercised, such as carbon permits in the EU emission trading scheme where environmentally-conscious
companies may sell unused carbon allowances to firms that exceed their own quota (at a price
determined by the overall supply and demand of total carbon allowances).
Naturally, market-based instruments can also reward certain types of behavior, as in the case of
subsidies and fiscal incentives. For instance, several energy-saving technologies are subsidized at their
initial stages of development and adoption (e.g. solar panel technologies). Fiscal incentives can render
certain types of behavior more attractive to tax payers, for instance by exempting from income tax
accrued revenues from “green” investments. Policymakers, and increasingly so also private companies
and large investment funds, may also use positive discrimination in favor of public investment projects
and contracts that have a positive environmental impact.
33
On many occasions, governments resort to policy measures that restrict pollution more directly, rather
than through market price signals. These types of instruments are often referred to as command and
control regulatory measures (Engel et al., 2008) or, alternatively, as non-tariff or non-market barriers to
trade when the measures apply specifically to imports and exports of goods and services. Again, there is
a wide range of policy instruments that aim to directly influence the level of unsustainable activities
(rather than indirectly via distorting relative prices). Licenses and quotas regulate the level of trade
transactions (and hence amount of imports of certain commodities) through the issuance of permits and
quantitative restrictions. In extreme cases, embargoes can be imposed on the entire amount of a
particular commodity before reaching a destination market. Standards fall in this latter category of
command and control instruments that restrict the production or trade of certain commodities as they
often prescribe certain conditions that products need to meet in order to minimize health risks and
enhance consumer protection. Environmental standards specifically aim at products complying with
predefined processes that minimize or eliminate certain types of environmental damage. ISPM 15
addresses the need to treat wood packaging material thicker than 6 mm (to prevent the spread of pests
and resulting damage to the ecosystems of importing countries) and falls into this category of standards.
There are some important issues that need to be recalled when discussing the distinction between the
market-based and the command and control type of instruments (as in the case of phytosanitary
environmental standards; see Harrington and Morgenstern, 2007). First, command-and-control
measures directly regulate the extent of environmentally damage, rather than attempting to achieve
this indirectly by influencing relative prices across traded commodities. Taxes and charges, instead, try
to limit environmental damage by making environmentally-polluting products more expensive. While, in
practice, taxes and charges may achieve similar results as command and control measures, their success
depends on the underlying price elasticity. In other words, the decline in demand for an
environmentally-damaging commodity will depend on how consumers and firms respond to price
changes with respect to the initial level of prices. First, setting a tax at a very low level may result in a
minimal adjustment of behavior; similarly, setting a tax at a very high level may achieve the exact same
result that a more modest tax could have achieved. Second, charges and taxes do not only discourage
behavior that damages the environment (when fulfilling their role as a price signal) but also generate
public revenues. These additional public revenues can have multiple purposes. Governments, for
example, can decide to make use of them to finance green public investment that further improves
environmental quality. Thus, they can dedicate financial resources for the same purpose that the
original environmental tax was adopted in the first place. Alternatively, governments can view these
additional public revenues as a substitute for existing unpopular taxes. For example, environmental
taxes could allow governments to reduce income taxes, particularly for those economies suffering from
high unemployment rates. Environmental standards (and command and control measures more
broadly) have, in general, a neutral fiscal effect, although governments can still collect some fees
through issuing permits to those firms that are allowed to implement the standards. Historically,
market-based instruments (such as tariffs) played a much more important role in generating public
revenues, but the increasing prominence of other sources of taxable income (e.g. through sales or
income taxes), accompanied by the development of a sophisticated system to collect these, supported a
gradual transition towards non-trade barriers (and a gradual elimination of tariffs).
34
2.2 Implementation of Environmental or Trade Standards – Key Issues
There is a wide range of criteria policymakers need to have in mind when designing appropriate
instruments, including environmental or trade standards. Effectiveness is naturally a key criterion to
consider when selecting and designing policy instruments, which should grasp the extent to which the
desired outcome has been achieved (e.g. preventing the spread of plant pests and diseases in the
context of ISPM 15). In practice, policymakers and governments face multiple constraints when deciding
the appropriate policy (or policy-mix) response to an environmental problem and as a result of this,
multiple criteria are normally applied simultaneously. Efficiency is another critical factor that influences
decisions behind the optimal response and policy instrument to tackle some environmental concerns
this and primarily focuses on how well resources (public funds, human resources, etc.) have been
utilized to achieve a specific (environmental) objective. This is also where cost-benefit analyses (similar
to the one presented in Chapter 6) become handy, as they provide estimates on the country-specific net
benefits (associated with a specific instrument) translated in monetary terms.
Policy instruments can rank differently when assessed in effectiveness and efficiency terms (Oosterhuis
et al., 2014). While an instrument can be very effective in environmental protection, it may at the same
time be very costly (and inefficient), leaving few other resources available for other uses. Efficiency
becomes a more meaningful concept when trying to take into account any indirect (positive or negative
and often unintentional) effect that the policy instrument is likely to induce. Environmental standards,
for example, increase the cost of exports and may, hence, result in a considerable loss of
competitiveness. This effect is likely to be sector-specific (and is the focus of Chapter 5), depending on
the final change in consumer prices and producer profits, as well as the intensity of competition in
international markets. Some sectors, such an environmental improvement can, for this reason, come at
the expense of output loss and increased unemployment for the local population. For other sectors,
there can be an increase in employment and demand by allowing local firms to export to new markets
with more stringent environmental regulations. Furthermore, the increase in demand for
environmentally compliant materials could, for instance, also create additional employment for
treatment facilities, inspection agencies, and so forth.
Implementation costs of standards or other policy instruments are naturally an integral part of
efficiency. Some obvious direct costs of implementation (e.g. related to acquiring specialised equipment
to manage the standard, or training personnel) are straightforward to calculate in monetary terms.
Trade and environmental standards often involve multiple other, less direct, transaction costs that
would also need to be taken into consideration. These include:
i. Information costs. These relate to the information that is required to implement effectively the
standard. For example, awareness raising campaigns to sensitize the public or firms to the necessity of
the standard and its environmental benefits, or surveys to capture the expected responsiveness of
target groups to a change in price as a result of the implementation.
ii. Administrative costs. These can be substantial costs (both for the government and target groups)
when the standard entails detailed bureaucratic procedures with large numbers of individual firms or
households involved (e.g. processing and evaluation of forms, or sampling costs). For the government,
35
the costs also often involve planning and decision-making costs; for instance staff costs in policy-making
departments, as well as the cost of stakeholder consultations.
iii. Monitoring and enforcement costs. These depend on the complexity of the requirements and the
efforts involved in verifying compliance with the standard. These costs can be borne either by the
government or by the target groups. Corruption is often one of the key constraining factors (particularly
in developing countries) behind enforcement of standards and it is often perceived as a separate cost
itself.
iv. Judicial procedures. A standard will be less costly in this respect if its provisions and conditions are
clearly specified and unambiguous. Nevertheless, legislative amendments, required to support
implementation, can involve substantial costs and may delay implementation.
In addition to these costs, a number of other situation-specific considerations play a role in terms of
identifying how successfully a trade or environmental standard is implemented:
i. The scale and nature of associated environmental benefits. It is likely that the legitimacy and social
acceptance of a standard will be higher (as a means to ensure some environmental benefits, such as
pest control in the case of ISPM 15) when the public sees a close link between the standard’s
implementation and its intended environmental services.
ii. The number of actors involved. The larger the number of government departments and companies
involved, the higher the associated transaction costs described above are likely to be. The spatial
distribution of actors can also be relevant; costs are for instance likely to be higher when the monitoring
and enforcement process of a standard takes place in multiple locations.
iii. Financial constraints of the local government or institutions. This is particularly relevant in the case
of developing countries where the successful implementation of the standard might be hindered by the
availability of resources. Even when these resources become available, they might come at the expense
of the provision of another public good.
iv. Social and cultural conditions. Customs, habits and traditions can affect the acceptance of a specific
standard. Misconceptions and the spread of inaccurate information can hinder the acceptance and
enforceability of a standard. This is also likely to happen when the standard is at odds with established
social norms and common practices. In such cases, there is often much resistance to change, when a
new (potentially beneficial) instrument is introduced. Consequently, low social acceptance will typically
lead to infringements and this, in turn, to reduced effectiveness and high enforcement costs.
2.3 Economic and Non-Economic Impacts of Standards
Any thoroughly conducted cost-benefit analysis needs to take into consideration all these additional
socio-economic side effects (positive or negative) that are associated with the implementation of a
standard. Many of these, often indirect, side effects might not be evident at first sight. The
implementation of a standard, for example, can create employment gains or losses in associated
economic sectors and changes in competitiveness as a result of price distortions.
36
In the case of trade standards with an environmental objective (as ISPM 15), the expected
environmental benefits associated with the standard’s implementation also need to be monetized and
contrasted against costs. There is a wide array of benefits that need to be incorporated into such an
analysis (Born et al., 2005), specifically:
i. Direct use values, which can for instance be (a) consumptive use values when the standard aims to
preserve an environmental asset that will be consumed in the future (timber, food, etc.); (b) recreational
use values, which indicate the environmental asset preserved (e.g. forest) that is valuable to individuals
for recreational purposes (for walks, camping, etc.); (c) aesthetic use values, as evident from the price
premium associated property in the vicinity of the environmental assets. In addition, for specific (often
indigenous) communities, environmental assets can also provide significant spiritual values and
fulfillment.
ii. Indirect use values, which include preserving an environmental asset (e.g. forest) through which also
additional environmental services are safeguarded. For example, forests provide ancillary ecosystem
services to local communities in the form of flood protection, improved erosion control, protection of
water resources and biodiversity, and more, as well as benefits in the form of carbon sequestration for
the global community.
iii. Option values, which relate to the value of potential (i.e. as of yet an undiscovered potential for use
in the future). For example, the preservation of a particular species may allow the development of some
future medical breakthroughs.
iv. Non-use existence values, which concern the satisfaction of continued existence of an environmental
asset, even when there are no immediate tangible benefits associated. People might value the
continued existence of a particular tropical forest or natural habitat, even if they never visited or intend
to visit it in the future.
v. Non-use bequest values, which relate to the satisfaction one receives by ensuring that the
environmental assets remain available to future generations. This is an issue of intergenerational equity
and fairness where current individuals wish to safeguard the possible (yet unknown) satisfaction of
future generations.
vi. Non-use altruistic values, which are those attached to a resource being available to others in the
current generation. This captures the issues associated with intragenerational equity and fairness;
although we might not be directly affected by a certain loss of an environmental asset, we value that
this environmental asset is available for other communities and individuals (many of whom might have
limited opportunities to substitute such an environmental asset with another one).
Any comprehensive cost-benefit analysis associated with a trade standard with an environmental
objective should attempt to incorporate as many of these values as possible. Naturally, attaching
monetary values to all the benefits discussed above is a formidable task that, in most cases, allows us
only to approximate the real value of a particular environmental asset. Furthermore, this largely remains
an anthropocentric approach to the benefits of environmental assets, given that the latter are directly or
indirectly measured through human preferences.
37
2.4 Standards and Issues of Fairness
Fairness is another important dimension that policymakers should consider when designing a new
standard (Gross, 2007). Environmental standards, for instance, are often designed with an emphasis on
the attainment of certain environmental targets, with little consideration given to how certain groups
(e.g. low income groups, women, indigenous people, small-scale firms) may be disadvantaged or
proportionately less favoured in the process. Small firms may be unintentionally excluded from the
implementation of a new standard because of budget constraints due to initial transaction costs, or
simply through informational barriers. Much literature points to multiple barriers (financial,
informational, discriminatory) that particularly women often disproportionately face when they attempt
to engage in new business practices (Brindley, 2005; Pehrsson, 2009). There is also evidence pointing to
a lower participation of small firms in many new environmental initiatives, often as a result of limited
access to capital and skills or due to higher transaction costs compared to their income. Small firms may
also be less willing to align their production methods to a new standard, when this adjustment entails
uncertain financial returns given their high discount rates and relatively high risk aversion. This also
concerns perceptions of typically disadvantaged groups regarding whether they feel that their voice is
heard in the design and implementation of a standard. This type of fairness is often referred to as
“procedural justice”.
Another important aspect of fairness relates to the so-called “distributive justice”; the distribution of
benefits (and costs) when the standard is implemented. Distributional justice can be examined at
multiple levels. It might be that the costs of implementation of a particular standard affect small-scale
firms disproportionately negatively (that subsequently struggle to maintain a positive profit margin and
hence remain in production), or that firms that comply with the standard experience little improvement
in the demand they face (and, hence, lose competitiveness with non-compliant producers). Fairness also
relates to the distributional aspects of any anticipated benefits. It may be, for example, that any
additional employment opportunities stemming from the implementation of the standard, only benefit
specific groups of employees. In the case of trade standards with an environmental objective, the
associated environmental benefits might largely accrue to others than those paying for the costs of
implementation, and in many cases the beneficiaries might be located in other areas or even countries
compared to those who bear the costs of implementation.
There are multiple ways to address issues of distributive injustice. In some cases, it might be possible
that the additional cost initially borne by the implementing actor of the standard can be passed on to
the ones ultimately enjoying the benefits accruing from the standard. This is not always easy, given that
even in the case of agreed higher prices (e.g. passed to the final consumer), depending on the price
elasticity of demand, those implementing the standard can face a substantially lower demand for their
product and consequently a drastic reduction in profits. In other instances, the government or an
international agency can compensate those who lose out from the implementation of the standard.
Perceptions of fairness, as to participation and distribution of benefits and costs, are often instrumental
in the success of the implementation of and compliance with a standard. The legitimacy of new
standards can, for this reason, depend on the following factors: (a) how involved actors are approached
and how actively they become engaged in the process; and (b) the distribution of involved costs and

38
benefits, and compensatory schemes. In this sense, fairness perceptions are likely to relate to how
involved actors reflect on the entire implementation process, from the beginning when the standard is
designed extending to the stage when it is advertised, administered and monitored.
39
3 ISPM 15: introduction to the analysis
3.1 ISPM 15: introduction
The globalization process has dramatically increased the magnitude of the international trade. Today,
the sum of the exports among countries equals 50 percent of global production, and trade growth in the
period 1800–2010 roughly followed an exponential path. The rise in the movements of goods around
the globe came with consequences, as it is considered to be the major cause for the spread of pests,
carried by WPM.
Many non-native species introduced outside their natural territories do not necessarily cause problems
in their new locations (Williamson, 1997). Some species have positive consequences on the production
systems – agriculture, fisheries, aquaculture, forestry – and may provide considerable benefits for local
and national economies (Weijden et al., 2007). However, many of those introduced species that do
become established and proliferate are now known to be highly destructive for the environment and for
the biodiversity of the whole country.
The introduction of ISPMs represent an attempt, coordinated by the Commission on Phytosanitary
Measures (CPM), the governing body of the IPPC, to propose standardized international measures for
countries to harmonize their phytosanitary measures, which are intended to protect the environment
and its biodiversity from pests (Clarke, 2004). Tracing the origin of each of the 41 ISPMs – ISPM 15 is part
of them – currently available and the motivations behind them represent a challenge. From the logistic
point of view, topics for ISPMs, as well as the ISPMs themselves, are proposed and adopted by
consensus by the contracting parties. The reasons for proposing a topic will be detailed in the
submission made, but as these reasons may often be representative of one region only, discussions
follow in other subsidiary bodies of the CPM to decide on the need for a specific standard. The lengthy
standard setting process (minimum five years from conception to adoption) also makes tracing the
individual steps challenging.
Regarding ISPM 15, its importance is underlined by the sheer number of WPM being moved
internationally each day. Recent statistics – albeit anecdotal – suggest that between 50 and 80 percent
of the world’s merchandise trade is moved using WPM. Available statistics on the WPM industry in the
US suggest that more than 15 million cubic metres of solid wood was used in 1999 for the construction
of WPM (Haack et al., 2014).
The correlation between the increase in the use of WPM for trade and the introduction of new pests has
been reported as significant (Ciesla, 2004), and as the European interception data for the period 1995–
2004 suggest WPM account for 73 percent of the pathways by which pests are introduced into new
areas (Roques, 2007). It is claimed that Europe has been less affected by pests than North America,
Australia and New Zealand (Niemelä and Mattson, 1996), but European countries have experienced
increasing introductions of pests too (Santini et al., 2013). Two studies, from Roques et al. (2010) and
Desprez-Loustau (2009), pointed out that the number of pests entering each year in Europe has
increased twofold between 1950 and 2009.
The annual global environmental damage and related economic costs spent to overcome the negative
consequences of pest introductions are estimated to reach trillions of USD (Klapwijk et al., 2016; Leal et
al., 2010). To be more specific, environmental damages caused by invasive tree borers cost about USD 2
40
million annually to the US economy (Aukema et al. 2011); the yearly damages occurring in Europe are
even more alarming, as the total annual costs related to the presence of pests have been estimated to
be close to USD 11,900 million (Kettunen et al., 2009).
As Leal et al. (2010) stated, forest products could potentially introduce and cause pest risks posing
environmental threats for the importing countries. Hence, the introduction and establishment of new
pests alters the forest ecosystems causing adverse impacts on the environment (Haack et al., 2014).
To reduce the risk of pest introductions, the IPPC community formulated and adopted ISPM 15. The
international standard states that WPM must be heat treated or fumigated with methyl bromide, and
stamped with a compliance mark before being used for international trade. Soon after the ISPM 15
came into effect, the infestation rates in the US dropped 36–52 percent to 0.11 percent (Haack et al.,
2014). A recent evaluation, which uses data on the number of live pests arriving in the Canada, shows
that insects were found in 2 percent of the WPM arriving from abroad (Strutt et al., 2013). A number of
studies have demonstrated that the net economic benefits of ISPM 15 consist in a potential reduction in
pest infestations of at least 50 percent.
The rest of this chapter is structured in the following way. The next section highlights the roles played by
the IPPC and the procedures by which ISPMs are discussed and issued. A description of ISPM 15 follows
in Section 3.3. A brief summary of the main economic and environmental consequences related to the
ISPM 15 is presented in Section 3.4. Existing evidence on ISPM 15 coming from the four countries
involved in the project can be found in section 3.5, followed by Conclusions.
3.2 The role played by the IPPC
The whole concept of international plant protection dates back to 1881; the year when five countries
signed an agreement to control the spread of grape phylloxera (Daktulosphaira vitifoliae), a North
American aphid that was accidentally introduced into Europe few years before that (in 1865) and that
was considered the main cause of the problems, which had affected much of Europe’s grape production.
The next major step was the International Convention for the Protection of Plants, signed in Rome in
1929, followed in 1951 by the adoption of the IPPC by the Conference of the Food and Agriculture
Organization of the United Nations (FAO).10
The IPPC was established in 1951 to protect cultivated and wild plants by preventing the introduction
and spread of pests (Feitshans, 2015). In 1989, the IPPC was officially recognized by the Uruguay Round
of the General Agreement on Tariffs and Trade as a standard setting organization under the SPS
Agreement. The IPPC is the only standard setting organization in the world, which sets plant health
related standards. In 1992, the IPPC Secretariat was established at FAO headquarters in Rome and
began its international standard setting program.
IPPC contracting parties requested revision of the Convention in 1995 to reflect contemporary
phytosanitary concepts and the role of the IPPC in relation to the Uruguay Round Agreements of the
WTO, particularly the SPS Agreement. The same year the FAO Conference approved the first three
ISPMs; formal, binding agreements to help protect the world’s plants and plant industries by controlling
10 The source of the information presented in this section is: https://www.ippc.int/en/history-of-the-ippc/ (last accessed: 20/06/2017).
41
the spread of plant pests. Under the SPS Agreement, the IPPC provides international standards for
phytosanitary measures implemented by governments to protect their plant resources from harmful
pests, while ensuring that these measures are justified and are not used as unjustified barriers to
international trade.
The IPPC is implemented by the CPM, which facilitates the cooperation between contracting parties to
protect plants from pests, while not jeopardizing the movement of goods and people. The CPM's core
activities are identified in its yearly meeting and all decisions are made by consensus. All activities have
associated measures of success to enable progress with achievement to be monitored. The core IPPC
activities include: (i) governance, (ii) standard setting, (iii) information exchange, (iv) dispute settlement,
(v) capacity development and (vi) reviewing the global status of plant protection. In what follows, we
will briefly describe these core activities, with most emphasis on standard setting, as this activity relates
concretely to the content of the current analysis and demonstrates the consultative process to set
standards.
Governance
The IPPC is governed by 183 IPPC contracting parties through the annual CPM meeting and a number of
additional CPM subsidiary and oversight bodies. These include the CPM Bureau, the seven-member
elected executive body of the CPM that provides guidance to the IPPC Secretariat and the CPM on
strategic direction, cooperation, financial and operational management; the Standards Committee (SC),
which is the oversight body for the standard setting process; the Subsidiary Body for Dispute Settlement
that oversees the dispute avoidance and settlement system; the Capacity Development Committee that
oversees the capacity development programme; and the National Reporting Obligations Advisory Group,
which is the oversight body for the National Reporting Obligations programme.
Standard setting
ISPMs are the standards adopted by the CPM (a full list of the ISPMs currently adopted is available in
Table 2). The standards are recognized as the basis for phytosanitary measures applied in trade by the
WTO members under the SPS Agreement. Standards by definition are not regulatory instruments, but
come into force when countries establish requirements within their national legislation or regulation.
Table 2: List of adopted standards
ISPMs Title of the measure ISPMs Title of the measure
ISPM 01 Phytosanitary principles for the
protection of plants and the application
of phytosanitary measures in
international trade
ISPM 22 Requirements for the establishment of areas
of low pest prevalence
ISPM 02 Framework for pest risk analysis ISPM 23 Guidelines for inspection
ISPM 03 Guidelines for the export, shipment,
import and release of biological control
agents and other beneficial organisms
ISPM 24 Guidelines for the determination and
recognition of equivalence of phytosanitary
measures
ISPM 04 Requirements for the establishment of
pest free areas
ISPM 25 Consignments in transit
ISPM 05 Glossary of phytosanitary terms:
multilingual index of phytosanitary
terms
ISPM 26 Establishment of pest free areas for fruit flies
(Tephritidae)
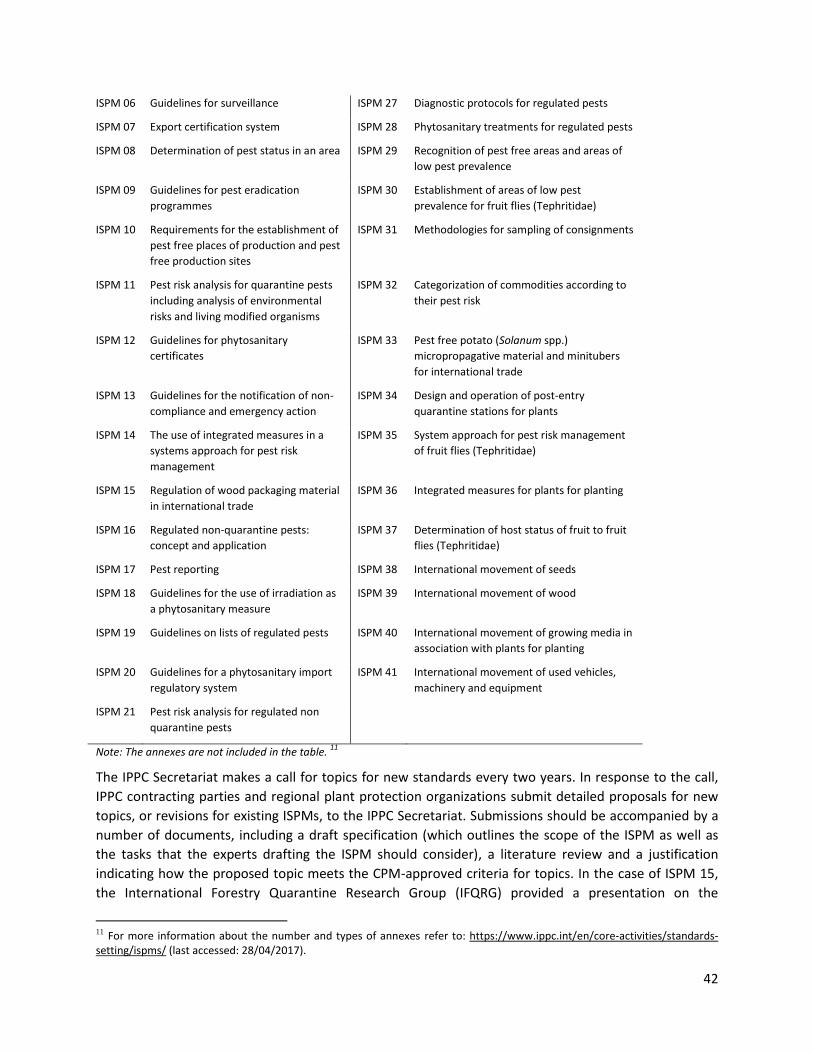
42
ISPM 06 Guidelines for surveillance ISPM 27 Diagnostic protocols for regulated pests
ISPM 07 Export certification system ISPM 28 Phytosanitary treatments for regulated pests
ISPM 08 Determination of pest status in an area ISPM 29 Recognition of pest free areas and areas of
low pest prevalence
ISPM 09 Guidelines for pest eradication
programmes
ISPM 30 Establishment of areas of low pest
prevalence for fruit flies (Tephritidae)
ISPM 10 Requirements for the establishment of
pest free places of production and pest
free production sites
ISPM 31 Methodologies for sampling of consignments
ISPM 11 Pest risk analysis for quarantine pests
including analysis of environmental
risks and living modified organisms
ISPM 32 Categorization of commodities according to
their pest risk
ISPM 12 Guidelines for phytosanitary
certificates
ISPM 33 Pest free potato (Solanum spp.)
micropropagative material and minitubers
for international trade
ISPM 13 Guidelines for the notification of non-
compliance and emergency action
ISPM 34 Design and operation of post-entry
quarantine stations for plants
ISPM 14 The use of integrated measures in a
systems approach for pest risk
management
ISPM 35 System approach for pest risk management
of fruit flies (Tephritidae)
ISPM 15 Regulation of wood packaging material
in international trade
ISPM 36 Integrated measures for plants for planting
ISPM 16 Regulated non-quarantine pests:
concept and application
ISPM 37 Determination of host status of fruit to fruit
flies (Tephritidae)
ISPM 17 Pest reporting ISPM 38 International movement of seeds
ISPM 18 Guidelines for the use of irradiation as
a phytosanitary measure
ISPM 39 International movement of wood
ISPM 19 Guidelines on lists of regulated pests ISPM 40 International movement of growing media in
association with plants for planting
ISPM 20 Guidelines for a phytosanitary import
regulatory system
ISPM 41 International movement of used vehicles,
machinery and equipment
ISPM 21 Pest risk analysis for regulated non
quarantine pests
Note: The annexes are not included in the table. 11
The IPPC Secretariat makes a call for topics for new standards every two years. In response to the call,
IPPC contracting parties and regional plant protection organizations submit detailed proposals for new
topics, or revisions for existing ISPMs, to the IPPC Secretariat. Submissions should be accompanied by a
number of documents, including a draft specification (which outlines the scope of the ISPM as well as
the tasks that the experts drafting the ISPM should consider), a literature review and a justification
indicating how the proposed topic meets the CPM-approved criteria for topics. In the case of ISPM 15,
the International Forestry Quarantine Research Group (IFQRG) provided a presentation on the
11 For more information about the number and types of annexes refer to: https://www.ippc.int/en/core-activities/standards-setting/ispms/ (last accessed: 28/04/2017).
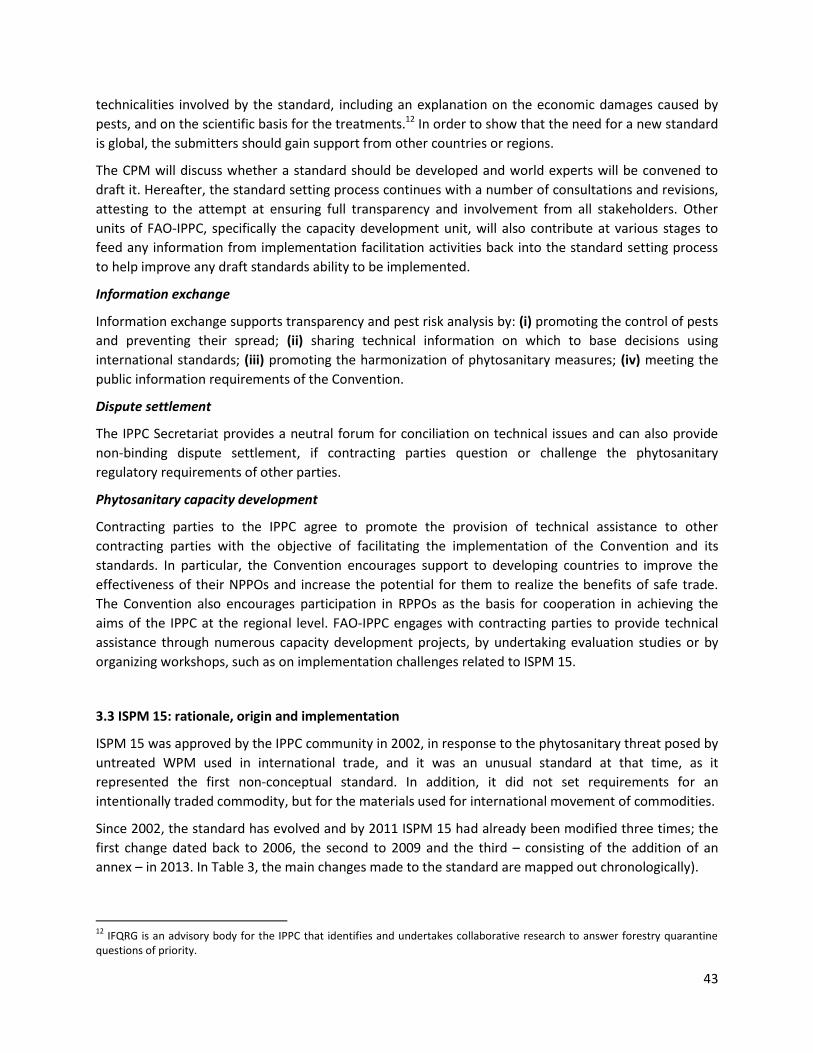
43
technicalities involved by the standard, including an explanation on the economic damages caused by
pests, and on the scientific basis for the treatments.12 In order to show that the need for a new standard
is global, the submitters should gain support from other countries or regions.
The CPM will discuss whether a standard should be developed and world experts will be convened to
draft it. Hereafter, the standard setting process continues with a number of consultations and revisions,
attesting to the attempt at ensuring full transparency and involvement from all stakeholders. Other
units of FAO-IPPC, specifically the capacity development unit, will also contribute at various stages to
feed any information from implementation facilitation activities back into the standard setting process
to help improve any draft standards ability to be implemented.
Information exchange
Information exchange supports transparency and pest risk analysis by: (i) promoting the control of pests
and preventing their spread; (ii) sharing technical information on which to base decisions using
international standards; (iii) promoting the harmonization of phytosanitary measures; (iv) meeting the
public information requirements of the Convention.
Dispute settlement
The IPPC Secretariat provides a neutral forum for conciliation on technical issues and can also provide
non-binding dispute settlement, if contracting parties question or challenge the phytosanitary
regulatory requirements of other parties.
Phytosanitary capacity development
Contracting parties to the IPPC agree to promote the provision of technical assistance to other
contracting parties with the objective of facilitating the implementation of the Convention and its
standards. In particular, the Convention encourages support to developing countries to improve the
effectiveness of their NPPOs and increase the potential for them to realize the benefits of safe trade.
The Convention also encourages participation in RPPOs as the basis for cooperation in achieving the
aims of the IPPC at the regional level. FAO-IPPC engages with contracting parties to provide technical
assistance through numerous capacity development projects, by undertaking evaluation studies or by
organizing workshops, such as on implementation challenges related to ISPM 15.
3.3 ISPM 15: rationale, origin and implementation
ISPM 15 was approved by the IPPC community in 2002, in response to the phytosanitary threat posed by
untreated WPM used in international trade, and it was an unusual standard at that time, as it
represented the first non-conceptual standard. In addition, it did not set requirements for an
intentionally traded commodity, but for the materials used for international movement of commodities.
Since 2002, the standard has evolved and by 2011 ISPM 15 had already been modified three times; the
first change dated back to 2006, the second to 2009 and the third – consisting of the addition of an
annex – in 2013. In Table 3, the main changes made to the standard are mapped out chronologically).
12
IFQRG is an advisory body for the IPPC that identifies and undertakes collaborative research to answer forestry quarantine questions of priority.
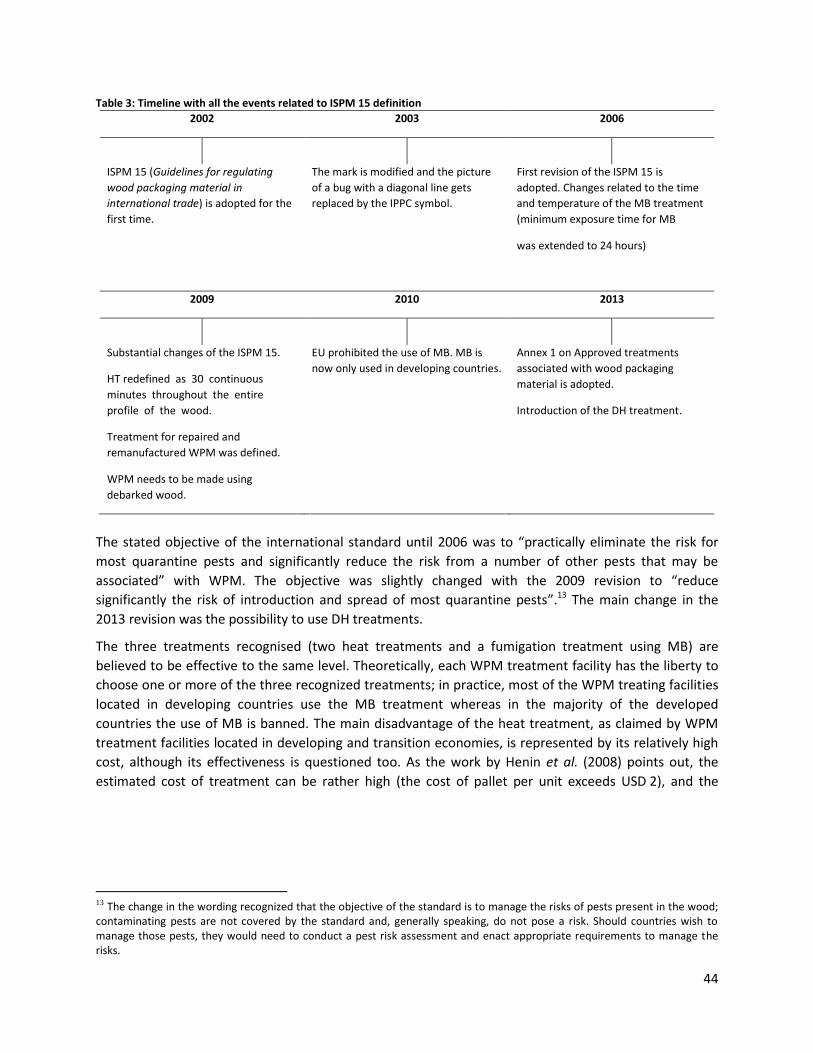
44
Table 3: Timeline with all the events related to ISPM 15 definition
2002 2003 2006
ISPM 15 (Guidelines for regulating
wood packaging material in
international trade) is adopted for the
first time.
The mark is modified and the picture
of a bug with a diagonal line gets
replaced by the IPPC symbol.
First revision of the ISPM 15 is
adopted. Changes related to the time
and temperature of the MB treatment
(minimum exposure time for MB
was extended to 24 hours)
2009 2010 2013
Substantial changes of the ISPM 15.
HT redefined as 30 continuous
minutes throughout the entire
profile of the wood.
Treatment for repaired and
remanufactured WPM was defined.
WPM needs to be made using
debarked wood.
EU prohibited the use of MB. MB is
now only used in developing countries.
Annex 1 on Approved treatments
associated with wood packaging
material is adopted.
Introduction of the DH treatment.
The stated objective of the international standard until 2006 was to “practically eliminate the risk for
most quarantine pests and significantly reduce the risk from a number of other pests that may be
associated” with WPM. The objective was slightly changed with the 2009 revision to “reduce
significantly the risk of introduction and spread of most quarantine pests”.13 The main change in the
2013 revision was the possibility to use DH treatments.
The three treatments recognised (two heat treatments and a fumigation treatment using MB) are
believed to be effective to the same level. Theoretically, each WPM treatment facility has the liberty to
choose one or more of the three recognized treatments; in practice, most of the WPM treating facilities
located in developing countries use the MB treatment whereas in the majority of the developed
countries the use of MB is banned. The main disadvantage of the heat treatment, as claimed by WPM
treatment facilities located in developing and transition economies, is represented by its relatively high
cost, although its effectiveness is questioned too. As the work by Henin et al. (2008) points out, the
estimated cost of treatment can be rather high (the cost of pallet per unit exceeds USD 2), and the
13 The change in the wording recognized that the objective of the standard is to manage the risks of pests present in the wood; contaminating pests are not covered by the standard and, generally speaking, do not pose a risk. Should countries wish to manage those pests, they would need to conduct a pest risk assessment and enact appropriate requirements to manage the risks.
45
effectiveness of the treatment is uncertain as it is difficult to ensure whether a piece of wood or a pallet
is effectively treated without the appropriate equipment.14
The HT, as prescribed in 2002 version of ISPM 15, called for a minimum temperature of 56 °C to be
reached and held for 30 minutes as measured at the core of each piece of wood. The scientific base for
the choice of that temperature lies in the fact that exposure to high temperatures (50–60 °C) has been
proven to be lethal to most living organisms. No changes were made to the HT in the 2006 revision, but
in 2009 the required time of heating was changed to “30 continuous minutes” throughout the entire
profile of the wood, including the core. This change was made because other technologies were being
developed for heating wood, such as microwave technology, in which heating occurs from the core of
the wood outwards (Hoover et al., 2010). This revision means that WPM must be heated so that the
core of the wood attains a minimum temperature of 56 °C (132.8 °F) for a minimum of 30 minutes.
Since the 1930s, MB has been widely used for quarantine treatment purposes due to its capacity to kill
pests rapidly with supposedly limited contamination of commodities (Fields and White, 2002; Henin et
al., 2008). As reported by Fields and White (2002), “[MB] acts rapidly, controlling insects in less than 48
hours”. However, the use of MB treatments is declining due to the depleting effect it has on the ozone
layer (Fields and White, 2002). The use of this chemical has been banned in several countries but in
developing countries its use has been granted for quarantine purposes under the Montreal Protocol.
With respect to the use of MB, ISPM 15 from 2002 required an exposure time of at least 16 hours, but
this was extended to 24 hours in 2006. Evidence suggests that exposure to MB is lethal for most living
organisms, although treatment success is highly dependent on proper application. Examples of how to
schedule an MB treatment, concentration of the chemical and duration of the treatment can be seen in
Table 4. Several studies, both published and unpublished, had been used to support the change made in
the 2006 revision of the standard. The need for this change came about primarily from studies of the
Pinewood nematode (Bursaphelenchus xylophilus), which showed that some nematodes were able to
survive a 16-hours exposure period, whereas complete control was generally reported with exposure
times of 24 hours (Soma et al., 2003); in addition, research by Barak et al. (2005), indicated that a 24-
hours exposure period to MB was to be considered adequate to kill Asian long-horned beetle, another
pest that may be present in WPM
Table 4: Example of a treatment schedule that achieves the minimum required concentration-time (CT) for WPM treated with MB
Temperature (°C) Dosage (g/m3) Minimum concentration (g/m
3) at:
2 hours 4 hours 12 hours 24 hours
21.0 or above 48 36 31 28 24
16.0 – 20.9 56 42 36 32 28
10.0 – 15.9 64 48 42 36 32
Source: ISPM 15 (adopted 2013; published 2016).
The DH treatment was added by CPM in 2013 and further new treatments have also been submitted for
consideration and may be included in the future. For example, sulphuric fluoride is being considered by
14
The effectiveness of the treatment is not difficult to ensure if sufficient measuring devices are used in the treatment chamber. The issue is that measurements are expensive and require technical skills, which are not generally available in developing countries.
46
the IPPC Technical Panel for Phytosanitary Treatments. Other alternative chemical treatment solutions
are also being considered to replace MB, such as phosphine and carbonyl sulphide, in order to give
implementing countries more alternatives and to stop the use of MB.
Treatment facilities are required to maintain treatment records and receive inspections by the auditing
agency, which is represented by the NPPO (or a delegated entity), to ensure compliance with ISPM 15
(Figure 2 and Figure 3 show examples of HT records kept by Italian WPM treating facilities). During an
inspection, which may be scheduled or unannounced, the inspector samples a sufficient amount of the
facility's products to determine if they have been properly treated and correctly marked.15 When a
sample indicates that the product was not in compliance with ISPM 15, the lot is withheld for correction.
The manner in which bark was considered has also changed between the ISPM 15 revisions. In 2002, no
specific limitations were placed on the use of non-debarked wood, however, countries could require
that imported WPM be made from debarked wood provided they had a technical justification. The
revised ISPM 15 requires all WPM to be made of debarked wood, regardless of the method of treatment
chosen. The bark must be removed before an MB treatment, and may be removed either before or after
heat treatment. The decision to implement this requirement had been debated since the original ISPM
15 was adopted in 2002. Requiring the use of debarked wood will greatly increase the effectiveness of
the treatments.
The revised ISPM 15 specifically lists WPM that is exempt from the requirements laid out in the
standard, because their pest risk is sufficiently low. WPM made entirely of thin wood with a thickness of
six millimetres or less, WPM made entirely with processed woods – such as plywood, wood shavings,
sawdust, or wood wool – are included in this list of exemptions.
An important part of the requirements set out in the standard has always been related to treated WPM,
which are broken and need repair. WPM for which one third or less of the wood has been replaced is
referred to as “repaired WPM”. If treated wood alone is used for the repair, no further treatment is
required, but the ISPM 15 mark must be added to each new component. The mark of the original
certification of the unit should also remain on the unit, unless the entire unit is retreated. However,
NPPOs should consider the fact that multiple marks may make determining the origin of the unit difficult
in case of interception of pests. WPM for which more than one third of components have been changed
needs to be retreated, all previous marks removed and the WPM stamped again (Figure 4).
NPPOs should carefully evaluate whether demanding re-treatment of entire units of repaired WPM is an
appropriate use of energy or chemicals, and whether it may encourage those conducting repairs to
operate fraudulently outside of the certification system. Careful review of the provisions for repair
should be undertaken by the NPPO in consultation with the WPM repair sector to determine the
appropriate procedures to meeting the standard.
Treated WPM should be marked with a symbol to show it has undergone one of the approved treatment
methods. The ISPM 15 marking must include the IPPC symbol, a two letter country code which identifies
the country where the treatment has taken place, the number assigned by the NPPO to the WPM
treating facility, and a two letter code for the treatment used. The marking must be legible, permanent
15 ISPM 15 does not specify the content of the inspections; this should be determined by the auditors. The requirements foresee that the treatment provider keeps records of the treatments and calibrations for a period of time specified by the NPPO. For more information about the inspections, the verification procedures and the auditing process, reference is made to ISPM 23 (Guidelines for inspection).
47
and not transferable, and placed in a visible location, preferably on at least two opposite sides of the
wood packaging unit (Figure 5 shows the information the stamp should display.
Figure 6 shows examples of regular and irregular stamps). FAO has ownership of the symbol and should
be contacted if the symbol is used in fraudulent circumstances. As of June 2014, FAO had registered the
IPPC symbol in 114 countries. The application of the mark makes the use of a phytosanitary certificate
unnecessary, as the mark indicates that the internationally accepted phytosanitary measure has been
applied. Therefore, treated WPM should be accepted at the point of entry without further specific
requirements.
3.4 Economic, social and environmental impacts of ISPM 15
Soaring international trade is believed to be responsible for the introduction of several non-native pests
in several parts of the globe; many of which have become highly invasive with a devastating economic,
social and environmental effect.
In response to this trend, ISPM 15 was put forward and adopted remarkably quickly. ISPM 15 help
greatly to reduce pest introductions and spread and, as a consequence, a number of negative spillover
effects are unlikely to manifest. Nevertheless, the implementation of ISPM 15 did not fully stop the
detections of harmful pests in WPM; since the adoption of ISPM 15 detections range between 0.1 and
0.4 percent of inspected shipments.
Generally speaking, there are several studies investigating the economic rather than the ecological and
social impacts of pest incursions. Due to the fact that these impacts are more easily perceived, these are
immediately reported by stakeholders and, as such, can be assessed and measured more easily. The
environmental impacts may seem more trivial in the short term and require a large quantity and good
quality of data, which is seldom available, to be fully assessed. Similarly, the social costs stemming from
the presence of pests may be visible only much later, and are very difficult to attribute to a unique
cause. In what follows, we try to summarize the literature available related to the costs and benefits
associated with implementation of ISPM 15. Rigorous economic analysis in related issues can be
economically challenging, as little data are currently collected and available for use. It is important to
keep in mind that most of the analyses interested in assessing the monetary consequences of pests have
focused on single species establishment (Leung et al., 2012). Although most non-native species cause
low or intermediate impacts when entering into a new host country, the combination of those costs can
be rather high. Figure 1 provides a complete snapshot of the economic, social and environmental effects
the introduction of the ISPM 15 may have in a given country.
Available economic studies have focused on linking the introduction and spread of pests with the
reduction in the value and volume of forest products, as a consequence of tree death or of a reduction
in timber quality (Krcmar-Nozic et al., 2000). Even where a pest has infested only a circumscribed area, it
may have a high probability of expanding its range to neighbouring areas and its spread may bear severe
consequences in terms of trying to eradicate it. The economic costs and benefits associated with pest
introductions are attracting the attention of increasing numbers of pest specialists and economists. A
growing body of evidence suggests that pests can have, and indeed have had, significant negative
economic impacts that can also be measured in monetary terms.
48
Soliman et al. (2012) have estimated that the cumulative value of lost forestry stock over a period of 22
years – from 2008 to 2030 – assuming no regulatory control measures, will be approximately USD 26
billion. On the same line, a study conducted by Mumford (2002) shows that roughly 4,500 new pests
were introduced into US between 1900 and 1991, with losses of at least USD 103 billion (Windle, 1997)
caused by the negative effects on the agricultural and the industrial sectors. Some of those pests have
been identified as the reason at the base of the ISPM 15: the Pinewood nematode, the Asian long-
horned beetle, bark beetles and weevils.
Probably the best-known studies on pests was conducted in Australia, Brazil, India, South Africa, United
Kingdom (UK) and the US in 2001, and followed up by one four years later (Pimentel et al., 2001,
Pimentel et al., 2005). The authors computed that pest introductions cost the countries approximately
USD 256 per capita per year. Assuming similar costs worldwide, Pimentel et al. (2001) estimated that
damage from pests would cost more than USD 1.4 trillion per year, representing nearly five percent of
the world GDP at that time. No equivalent studies have been carried out in Europe or in developing
countries.
The societal impact is expected to extend well beyond the time horizon of the analysis, and long after
the spread of a pest has been controlled. A related stream of research has focused on the increment of
environmental welfare costs and monetary disbursements needed to eradicate and control pests
(Coluatti et al., 2006). Studies on the economic assessment of costs and benefits associated with the
implementation of ISPM 15 may have created a focus on the link between the phytosanitary measures
and the size of the trade flow between countries. General results suggest that the size of the trade flow
between an exporting country, which has not implemented the standard, and an importing country,
which has implemented the standard, drastically stops. The trade flow between the two countries starts
again when the exporting country starts implementing the standard. The potential benefits of
implementing ISPM 15 are not limited at trade credibility but include an increase in transparency and a
reduction in all the transaction and paper-work costs associated with exports to countries with
divergent SPS measures (Henson et al., 2000).
Human well-being may be indirectly affected by some pests too, as there are species that can negatively
affect human health either because they are vectors for diseases or by causing allergies. Furthermore,
an increase in mortality due to cardiovascular diseases has been measured in areas infested with the
Emerald ash borer (Agrilus planipennis) (Pimentel et al., 2005).
Concerning the costs, there is an ongoing debate regarding the assumption that ISPM 15, just as other
ISPMs, may be a way to protect internal goods from foreign countries’ competition. The international
standard creates challenges especially for developing countries, as they have to implement the standard
while having limited resources and knowledge about it. Major challenges faced by developing countries
include the lack of clear information, proper awareness and full understanding of the international
standard, technical expertise and appropriate technologies, limited access to compliance resources,
existence of incompatible production systems, and logistic problems (Henson et al., 2000). As an
example, the implementation of ISPM 15 is believed to increase the cost with approximately USD 0.6 per
single WPM (100 percent more than the cost of a non-treated WPM). Exporters are concerned with this
additional cost, due to the treatment of WPM, while still maintaining market competency and
customers’ preferences (Hassler et al., 2010). However, the WPM treatment costs, estimated at USD 0.6
per WPM, are likely passed on from the treatment facilities to the exporters, then to the importers of
49
commodities and finally to the final consumers of those imported goods. In other words, the final
consumers are the ones paying for the implementation of the standard.
A similar field of research believes that ISPM 15 modifies the structure of the comparative advantages
between countries. The application of the standard increases the cost of treatment that adds to the
packaging and transportation cost of the commodity. Therefore, the treatment will provide for rises in
production costs for those goods that are transported using WPM. Compliance with ISPM 15 increases
the costs for exporters, and this cost can be considered as equivalent to trade tax (Beghin and Bureau,
2001). This could also affect the price importers pay for commodities and that which final consumers
pay, as it increases the price of goods.
Developing countries argue that the environmental policies and regulations create barriers to the
sectors in which they have a comparative advantage (Fontagne et al., 2005). In general, the application
of SPS measures is strict in developed countries compared to the application in developing ones. In
addition, in certain developing countries the SPS requirements are incompatible with existing
production and marketing systems (Henson et al., 2000). Particular concerns are that developed
countries do not take into account the needs of developing countries when setting SPS requirements,
the time given between notification and implementation of SPS requirements is insufficient, and the
technical assistance given to developing countries is inadequate (Henson et al., 2000). In certain
circumstances, when the products do not comply with SPS requirements they may face rejection at the
point of entry or the supplier may need to pay for the treatment cost. In repetitive cases, the supplier
could possibly be prevented from exporting those products.
Products that are exempted from ISPM 15 treatment requirements, such as plastic and processed wood
products, may be considered as alternatives to WPM (Hassler et al., 2010). Nevertheless, the exporting
industry’s acceptance of ISPM 15 has helped the WPM industry to fight off competition from alternative
materials, such as plastic pallets and slip sheets. It was assumed that when ISPM 15 was introduced, the
use of alternative packing materials would increase from 10 to 15 percent of the total market, whereas
in reality those packaging materials are not widely used.
To conclude, there are still many gaps in the ecological and economic information available. The studies
on the social and economic effects of pests and how the implementation of ISPM 15 has impacted the
spread of pests are still at an early stage. Therefore, the overall picture remains rather incomplete,
especially when we refer to developing areas of the world. This analysis will represent an attempt to
quantify the costs related to the implementation of the standard and the benefits stemming from it.
3.5 Evidence from IAPSC and from the NPPOs16
IAPSC
IAPSC has not yet carried out any specific activity related to ISPM 15, despite the fact that its mandate is
to strengthen Africa's capacity to implement international and regional phytosanitary measures.
NPPO in Botswana
16
The section related to the IAPSC has been written by Mr Zafack Joseph, the one on Botswana by Mr Modise Molathlegi, the one on Cameroon by Ms Alice Ndikontar, the one on Mozambique by Mr Khlaid Cassam and the one on Kenya by Ms Faith Ndunge.
50
The Government of Botswana has put in place two legislations related to the management of plant
pests; the Plant Protection Act, emanated in 2009, and the Agrochemicals Act, from 2000. Although
Botswana has had proper regulations in place for several years, the lack of resources has inhibited the
enforcement of the legislations on several aspects on a practical level.
The local NPPO, which is part of the Ministry of Agriculture and Food Security, is the organization
responsible for the management of plant pests and for setting up the procedures needed for the
implementation of ISPM 15. In practice, NPPO actions have been limited. As an example, the inspections
of consignments entering into the country, as well as of those leaving the country, are rarely done. If the
inspections do happen, they are carried out completely at random as there is no manual that may guide
the inspectors.
The primary reason why Botswana decided to implement and comply with ISPM 15 was to protect the
country against the introduction of foreign pests. However, while this was the primary reason, the NPPO
depended on customs for inspections at points of entry and only recently posted phytosanitary
inspectors to inspect consignments coming into the country.
Since ISPM 15 was implemented in 2006, only one WPM treating facility has been operating in the
country. The facility treats WPM using MB, and there is no plan in place as to what will happen when
MB will be banned for quarantine purposes too. The NPPO is obliged to inspect the facility regularly, just
as it is responsible for ensuring that inspections are carried out, but none of those controls are
effectively enforced by the NPPO.
NPPO in Cameroon
The Cameroon Ministry of Agriculture and Rural Development in 2006 signed the order number
003/06/A/MINADER/SG/DRCQ/SDRSQV/SQV17 laying down the procedures for processing and stamping
WPM used for international trade in compliance with the ISPM 15.
The Minister of Agriculture and Rural Development is the organization responsible for issuing the license
for the WPM treatment facilities. This license has a duration of five years, with a possibility of renewal.
The license, as well as its renewal, is issued after the facility passes an inspection done by the NPPO. The
inspection, as stated in the “Inspection protocol for phytosanitary treatment facilities”, aims at assessing
the ability of the structure to safely and efficiently conduct phytosanitary treatments.18 It consists of
checking the premises, the correct installation of the equipment used for treating WPMs, and the safety
of the equipment. All those controls are done at the applicant's expense. Furthermore, the NPPO makes
sure that personnel safety is guaranteed, and that the workers are knowledgeable about fumigants and
how to handle them. The license may be withdrawn in the event of non-compliance. The protocol does
not mention that facilities’ records should be checked to understand whether treatments have been
applied in accordance with ISPM 15.
The NPPO should carry out yearly audits, but this is rarely enforced and WPM treatment facilities are
therefore not regularly inspected. In addition, the phasing out of MB was to take effect in 2015, even for
quarantine purposes. Even though the last batch of MB was imported in 2014, some WPM treatment
17
A copy of the document is available upon request. 18
A copy of the “Inspection protocol for phytosanitary treatment facilities” is available upon request.
51
facilities are still using this chemical. The text N°A218/d/SG/PM of 18 May 2017, emanated by the Prime
Minister’s Office, has stressed the fact that the use of MB is now prohibited in the country.
For what concerns the manuals for import and export inspections, a phytosanitary inspection guideline
has just been finalized by the NPPO and to be released soon. The guideline document is meant to cover
the inspection procedures for both imported, transit and exported consignments.
NPPO in Kenya
Kenya has been implementing ISPM 15 since 2006. The implementation process is explained in the Plant
Protection act (CAP 324) and in the Kenya Plant Health Inspectorate Service (KEPHIS) Act number 54 of
2012. Currently a new draft regulation having legal power is under consideration; the objective of the
regulation is to ensure proper enforcement of the standard.19
The process for implementing ISPM 15 includes authorising treatment facilities, as well as inspecting
imports and exports at entry and exit points for compliance with the standard. The process of
authorising WPM treatment facilities (for which a manual is not yet available) begins with an application
sent to KEPHIS. The application dossier includes a certified copy of the company’s registration
certificate, certificate of registration for using approved chemicals by the authorised agency, and details
of the location of facility. Any company or person registered for business in Kenya can apply to KEPHIS
for authorisation as a treatment facility. This also includes WPM manufacturers and other interested
parties that are active in the sector. Upon satisfactory appraisal, a certificate of authorisation is issued.
The authorization, which lasts for one year, is renewable upon satisfactory performance.
During KEPHIS inspections, the following is checked: the source and species of wooden material used,
the operational methods used (i.e. HT or MB), the volume of WPM being treated, and the buyers of
those treated WPM. KEPHIS also checks whether treated WPM are kept is storage areas separated by at
least five metres from untreated WPM. KEPHIS has not written an inspection manual yet, and the
inspectors currently only use guidelines.
For what concerns import inspections, the CAP 324 regulation sets up rules for imports by specifying for
instance that “a person shall not import plant, plant product and regulated article […]”, without
specifying the type of inspection needed for imported WPM.
NPPO in Mozambique
The local NPPO is the organization in charge of implementing ISPM 15. It receives help, in terms of
knowledge and resources, by the Plant Protection department, Ministry of Agriculture.
There are currently four WPM treatment facilities in the country. Fumigation Internacional Lda, which
was the first facility to be registered, is based in Beira. The second company registered was Chazeira de
Moçambique, based in Gurue, in the Zambézia province. This is a tea producer and export company, and
in order to reduce the costs of purchasing already treated WPM, it decided to manufacture and to treat
its own WPM. The facility also sells treated WPM to third parties.
19
The previous regulation did not have any legal status and it was therefore impossible for KEPHIS to enforce its content. Copies of the “CAP 324” and of the “KEPHIS Act number 54” documents are available upon request.
52
The third company –ITFC– is based in Gurue, Zambézia province. This is a forest company, whose core
business is to cut trees and sell timber. The company later decided to manufacture and treat WPM too,
as the initial investment cost was not too high. In the history of Mozambique, ITFC represents the first
facility to treat WPM for the sole purpose of selling them to other companies. As they are located far
from Maputo, its main customers are exporters located in the north of the country. The company is
planning to extend its business by selling the treated WPM in the neighbouring country, Malawi. The
fourth company is based in Maputo and serves all the exporting companies located in and around the
capital.
The NPPO was recently contacted by two potential facilities, both located in Beira, and the process of
registration will be initiated soon. The registration process formally starts with the facility filling a
request with the local office of the NPPO; the request has to be accompanied by the official license
released by the Ministry of Trade and Industry, and by documentation of the design of the facility, which
should include a description of the available equipment and an explanation of all the processes needed
for treating WPM. An NPPO team, composed of one technician from the quarantine sector and one from
the agrochemicals registration and control sector, visits the facility and conducts an inspection aimed at
verifying that ISPM 15 is observed. If the facility passes the inspection, it is then granted the use of the
ISPM 15 mark.
One of the main challenges the country is currently facing in terms of ISPM 15 is the notification of non-
compliance from other countries. The NPPO is working on improving the inspection process.
3.6 Conclusions
Globalization is the main cause for the increase in the volume of international trade. The rise in trade
comes accompanied by a dramatic increase in the international movement of pests. WPM constitutes
one of the high risk pathways for the introduction of wood pests. Numerous bark- and wood-infesting
insects have been introduced to importing countries from their exporting counterparts, and some have
caused severe environmental and economic damage. The damages sustained by the US due to invasive
tree borers amounted to approximately USD 2 million on average annually (Aukema et al., 2011) while
estimation of the costs related to the introduction of regulated pests in Europe is close to USD 11,920
million (Kettunen et al., 2009).
The international recognition of this risk resulted in the adoption of ISPM 15 in 2002, which provides
treatment standards for WPM used in international trade. ISPM 15 was originally developed to
“practically eliminate the risk” associated with the international movement of most bark and wood
pests via WPM, and then later amended to “reduce the risk”. ISPM 15 requires all countries
implementing the standard to set up programs that ensure all WPM is treated before export, hereby
reducing the possibility of spread and introduction of pests. DH, HT and MB are the three approved
treatment options in place today. Most of the WPM treating facilities located in developed countries still
use MB even if its use for fumigation purposes is only possible in those areas of the world for which HT
still represents a costly option. Its use may be completely prohibited in the future.
ISPM 15 was arguably a practical and effective solution to a global problem, but it has not proven to be
perfect. The original version of ISPM 15 presented some flaws, for instance by allowing the use of non-
debarked wood. It was since discovered that the bark would act as a barrier to the heat and MB
53
treatments, leaving pests alive within the wood even after treatment. The revised versions of the ISPM
15, adopted respectively in 2006, 2009 and 2013, require the complete debarking of all wood before
treatment. The regulation is constantly changing as a consequence of new treatments discovered to be
as effective as previous ones, as was the case for DH, or due to improvements in the treatment
equipment, allowing for instance the heating time to be reduced to 30 continuous minutes.
Despite the fact that ISPM 15 was elaborated more than 15 years ago, there are still issues related to its
proper implementation and compliance. As an example, ISPM 15 is considered as implemented if a
given country decides to do so. In this case, the given country will communicate its decision via national
legislation, which describes the implementation of and compliance with the standard. A Standard and
Development Trade Facility (STDF) project aimed at assisting developing countries in the
implementation of ISPM 15 (STDF project 37) pointed out that several countries still do not have such
law or program in place aimed at regulating the activities related to the standard.20 Another issue is
represented by the cost of compliance. These costs may be relatively high in relation to the volume of
goods the country exports. A study pointed out that in Mozambique, the initial investments for WPM
treatment facilities equalled seven percent of the export earnings measured in 2002, and in the case of
Guinea, the investment costs even exceeded the total food exports (Hailu, 2016).
When implementing ISPM 15, a given country should take into account the possible consequences that
will derive from the lack of compliance. There are cases in which the lack of conformity has cost the
implementing country severe penalties in the form of temporary bans, or more frequent and closer
inspections in the importing country.
The last section of this chapter introduced some facts about the regulations put in place by the NPPOs in
the four target countries to implement the standard. In most cases, the available regulations are not
precise and they offer an interpretation of ISPM 15. As an example, the ISPM 15 clearly indicates the
objective of the inspections that the local NPPO should carry out on a yearly basis. While ISPM 15 does
not specify the content of the inspections (this is covered by another ISPM), it does mention that “the
treatment provider keeps records of heat treatments and calibrations for a period of time specified by
the NPPO”. This piece of information is missing from the case-study countries’ regulations, and the
NPPOs do not proceed with the verification of the treatment records. Furthermore, the NPPOs do not
offer clear guidelines on the documents needed by the WPM treating facilities to be licensed, and the
requirements the NPPOs set lack precision and leave room for personal interpretation. All these aspects
– regulations, policies, inspections, audits, readability of the stamp, etc. – which are only briefly
presented here, will be discussed in more depth in the next chapter, where the material from the
qualitative interviews will be presented. In particular, Chapter 4 will look at how the four countries’
NPPOs have translated ISPM 15 into actions, which are their main challenges, and the known
malpractices.
20
For more information about the project, see http://www.standardsfacility.org/PG-037 (last accessed: 23/06/2017).
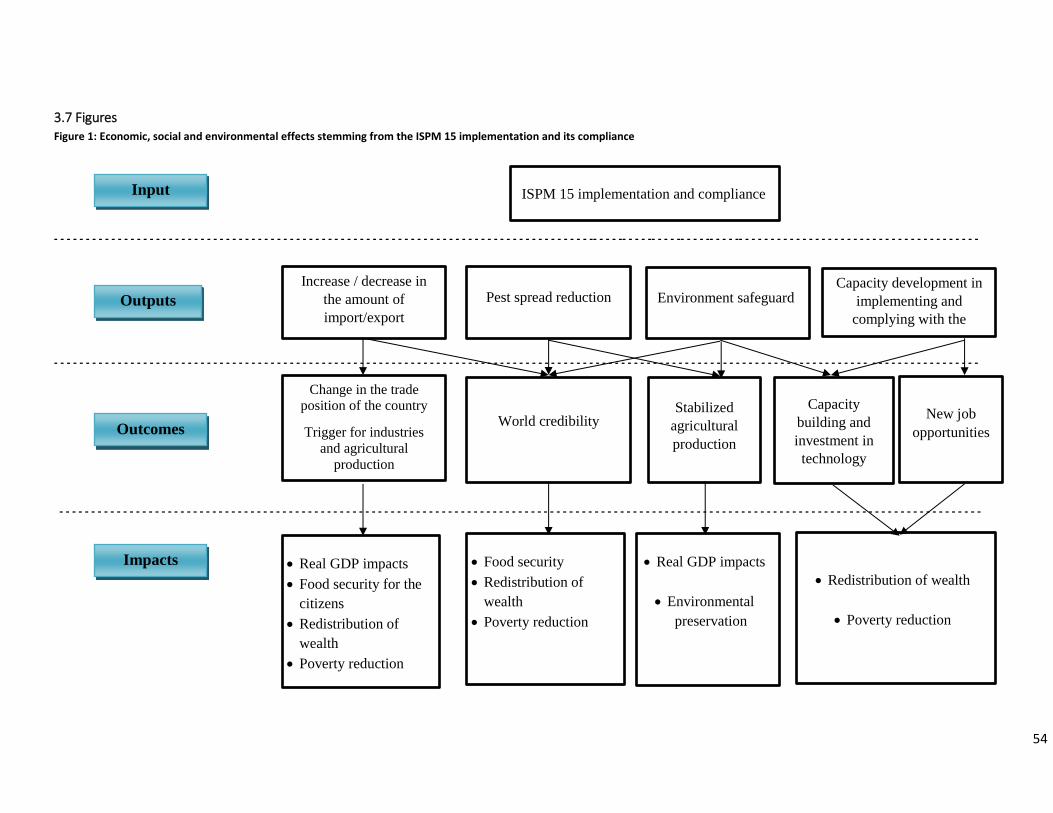
54
3.7 Figures Figure 1: Economic, social and environmental effects stemming from the ISPM 15 implementation and its compliance
- - - - - - - - - - - - - - - - - - - - - - - - - - - - - - - - - - - - - - - - - - - - - - - - - - - - - - - - - - - - - - - - - - - - - - - - - - - - - - - - - - - - -- - - - -- - - - -- - - - -- - - - -- - - - -- - - - - - - - - - - - - - - - - - - - - - - - - - - - - - - - - - - - - -
- - - - - - - - - - - - - - - - - - - - - - - - - - - - - - - - - - - - - - - - - - - - - - - - - - - - - - - - - - - - - - - - - - - - - - - - - - - - - - - - - - - - - - - - - - - - - - - - - - - - - - - - - - - - - - - - - - - - - - - - - - - - - - - - - - - - - - - - - - - - - - - - -
- - - - - - - - - - - - - - - - - - - - - - - - - - - - - - - - - - - - - - - - - - - - - - - - - - - - - - - - - - - - - - - - - - - - - - - - - - - - - - - - - - - - - - - - - - - - - - - - - - - - - - - - - - - - - - - - - - - - - - - - - - - - - - - - - - - - - - - - - - - - - - - - -
ISPM 15 implementation and compliance Input
Outputs
Increase / decrease in
the amount of
import/export
Pest spread reduction
Environment safeguard
Capacity development in
implementing and
complying with the
ISPM 15
Change in the trade
position of the country
Trigger for industries
and agricultural
production
World credibility
Stabilized
agricultural
production
Capacity
building and
investment in
technology
New job
opportunities
Impacts
Real GDP impacts
Food security for the
citizens
Redistribution of
wealth
Poverty reduction
Outcomes
Food security
Redistribution of
wealth
Poverty reduction
Real GDP impacts
Environmental
preservation
Redistribution of wealth
Poverty reduction
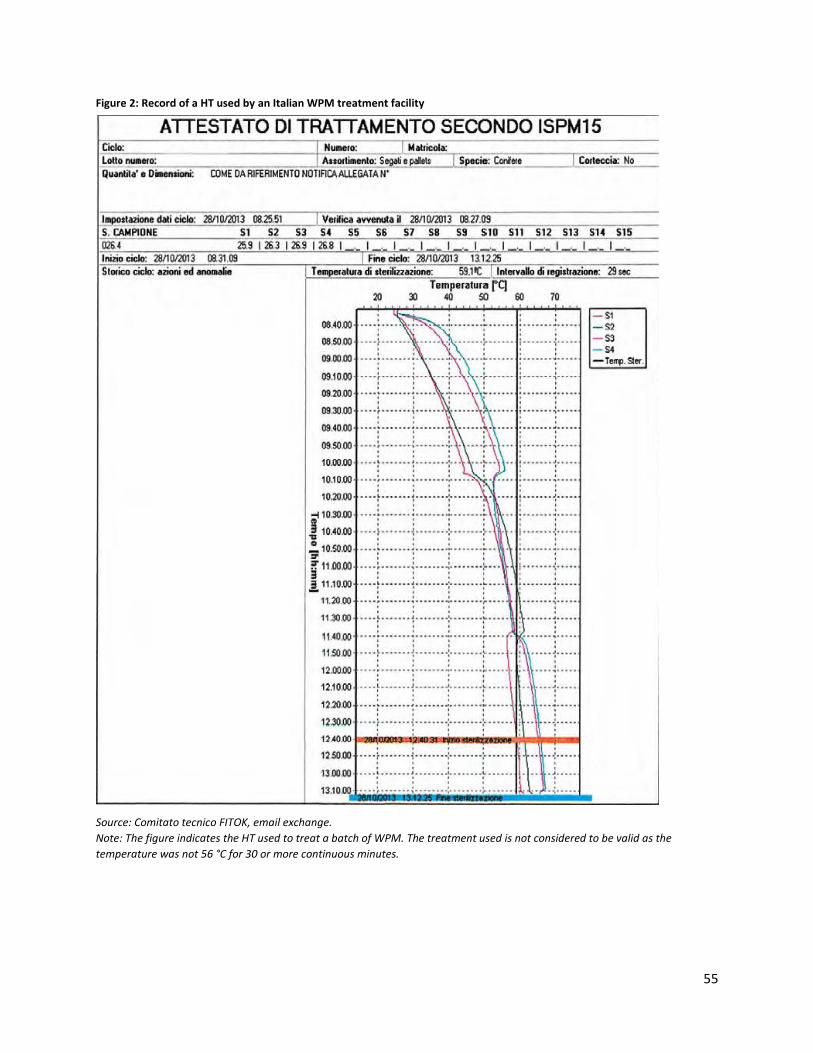
55
Figure 2: Record of a HT used by an Italian WPM treatment facility
Source: Comitato tecnico FITOK, email exchange.
Note: The figure indicates the HT used to treat a batch of WPM. The treatment used is not considered to be valid as the
temperature was not 56 °C for 30 or more continuous minutes.
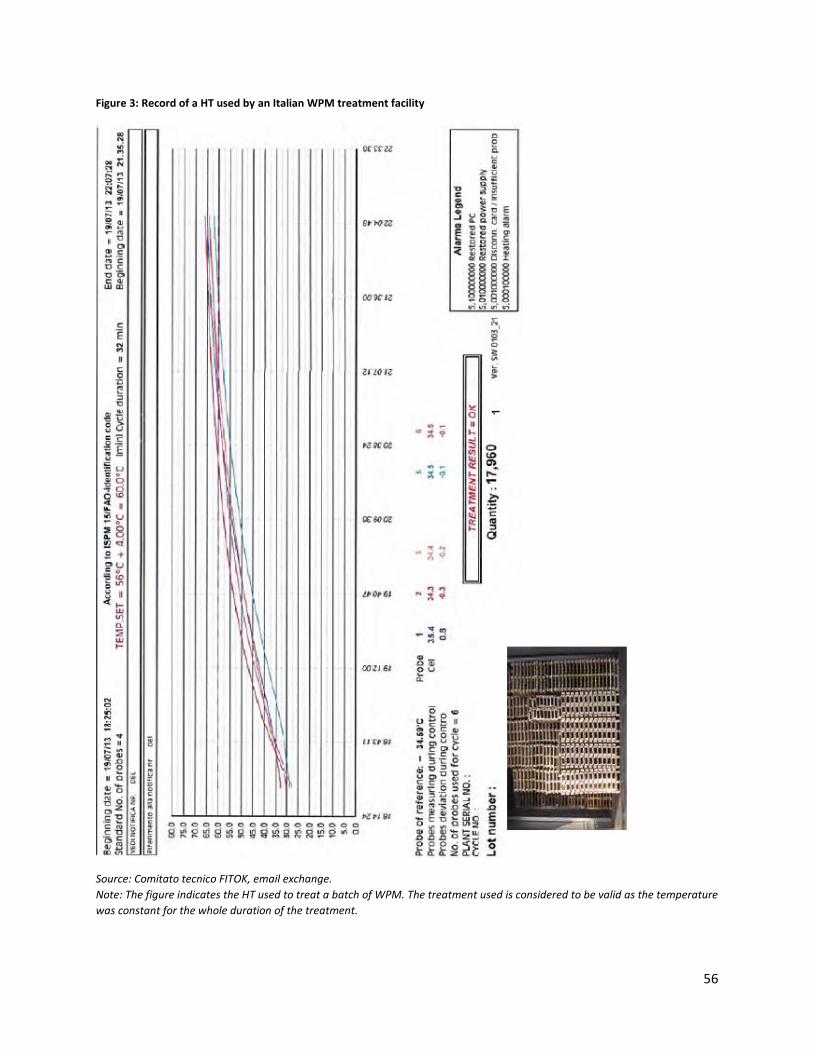
56
Figure 3: Record of a HT used by an Italian WPM treatment facility
Source: Comitato tecnico FITOK, email exchange.
Note: The figure indicates the HT used to treat a batch of WPM. The treatment used is considered to be valid as the temperature
was constant for the whole duration of the treatment.
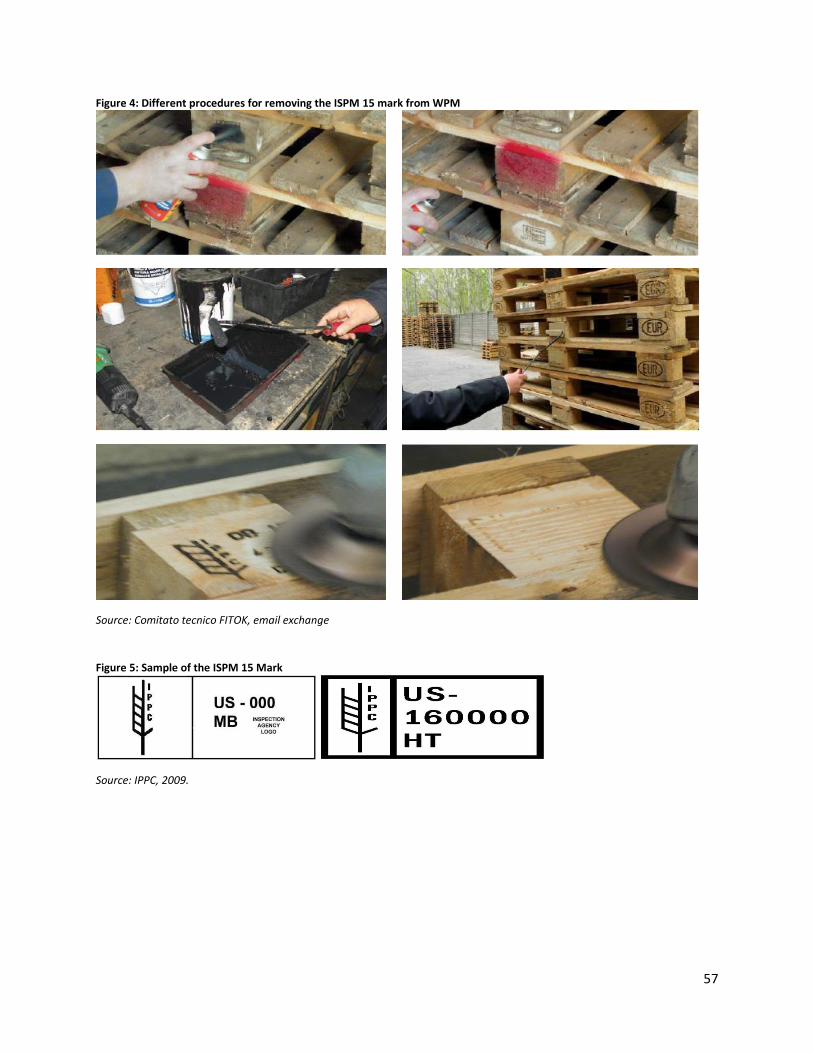
57
Figure 4: Different procedures for removing the ISPM 15 mark from WPM
Source: Comitato tecnico FITOK, email exchange
Figure 5: Sample of the ISPM 15 Mark
Source: IPPC, 2009.
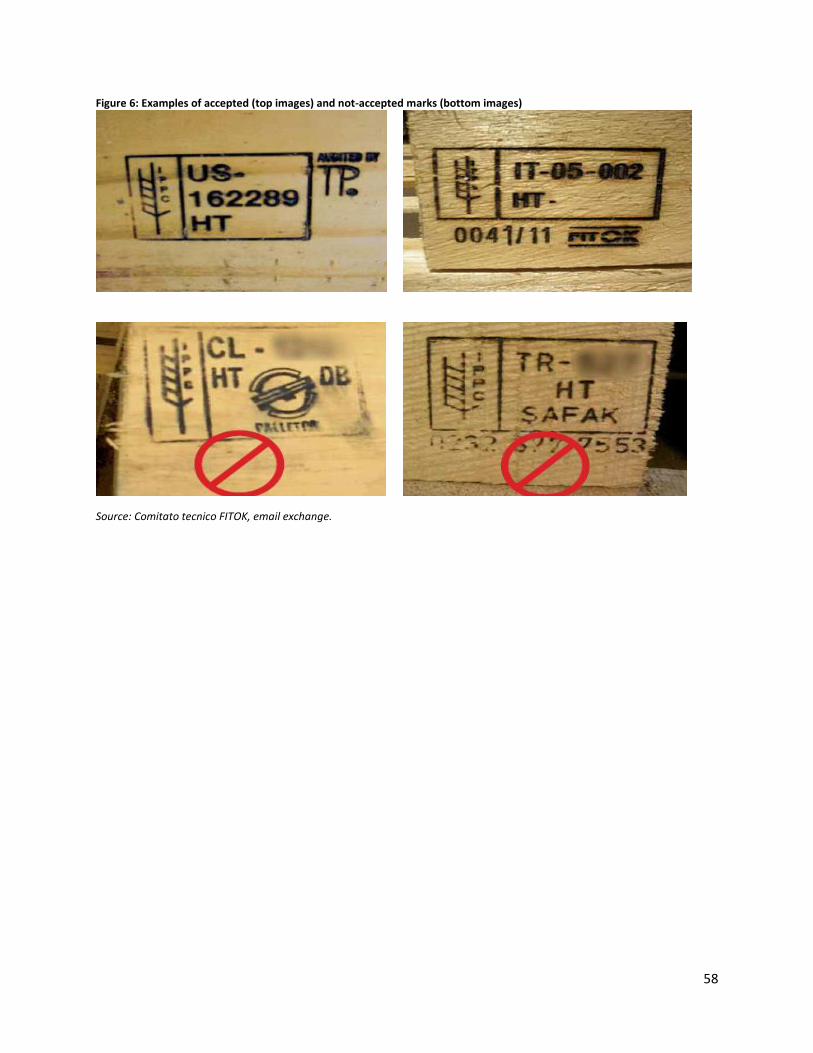
58
Figure 6: Examples of accepted (top images) and not-accepted marks (bottom images)
Source: Comitato tecnico FITOK, email exchange.
59
4. ISPM 15: findings based on qualitative interviews
4.1 Introduction to the field research in the four case-study countries
This chapter will describe and critically analyse all the procedures put in place by the NPPOs of the four
case-study countries to implement and comply with ISPM 15. The material used in this chapter derives
from qualitative interviews with a number of stakeholders involved in the ISPM 15 implementation and
compliance, such as exporters and importers, inspectors, and WPM treatment facility personnel.
Through our descriptions of our field research in each of the four countries we will highlight the
malpractices adopted by the ISPM 15 implementing agencies. Malpractices put in place by other
agencies or organizations, either public or private, and that affect the correct implementation of ISPM
15, will be discussed too. Some of the malpractices are country-specific, but in most cases they are
common among countries.
The policy implications stemming from our qualitative analysis – presented at the end of this chapter –
will be used and triangulated with the information and results stemming from the macro- and
microeconomic analysis (Chapters 5 and 6, respectively).
A recent report titled “Findings of the general survey of the International Plant Protection Convention
and its standards”, prepared by FAO-IPPC and published in 2016 presented the results of a European
Commission funded project aimed at discussing the role of compliance in relation to all ISPMs. To
achieve the objective, FAO-IPPC prepared a general survey, directed at NPPOs, that sought to
understand the overall implementation of ISPMs, as well as whether NPPOs prioritized the
implementation of specific ISPMs. The report introduced a number of useful points.
As an example, the NPPO representatives interviewed for this project stressed the importance of ISPM
15 in guaranteeing trade opportunities and safeguarding the environment. These points were also
highlighted in the General survey report, according to which the majority of the survey respondents
consider the ISPMs that set requirements for regulation of import and export as high priority standards
(e.g. the standards that concern phytosanitary certification systems, phytosanitary certificates, or
inspection).
There are also similarities between the conclusions from the General survey and the qualitative
interviews in terms of the overall challenges in implementing the ISPMs. Country respondents and
interviewed stakeholders have reported difficulties regarding staff development and training within
their NPPOs, pointing out that the implementation process is knowledge intensive and involves a steep
learning curve. In addition, the presence of small and scattered companies (WPM manufacturers, WPM
treatment facilities, and exporters) and the lack of proper information dissemination increase the
implementation challenges in the four case-study countries.
Another similarity relates to inspections at import. The General survey found that 79 percent of the
survey respondents were fully implementing the inspection of consignments of plants or plant products.
However, when the consignments are not plants or plant products, only customs inspections were
carried out. The survey respondents are aware of this problem, which relates to the way in which
countries have established their plant health legislation. The legislation is usually focused on the
commodity, and not the conveyance and, therefore, the country does not have the authority to inspect
goods other than agricultural. Similar conclusions were pointed out by the interviewed stakeholders.
60
There are a number of other implementation challenges worth mentioning. The implementation and the
compliance process require that all the actors have the same set of available information and that they
plan activities together. The government (NPPO, ministries dealing with trade, industry, agriculture and
rural development, customs) and the private sector (manufacturers, treatment facilities, import and
export companies) should work together and coordinate their activities to ensure correct
implementation. However, this coordination rarely happens and this enhances the challenges caused by
the asymmetric information available to the stakeholders. In many cases, the ministries are not aware of
the existence of ISPM 15 and, very often, the custom organization does not interact with the NPPO
when it comes to inspecting the imported goods. Furthermore, the NPPOs often lack a number of key
information such as up-to-date lists of the official WPM treatment facilities.
The magnitude and the types of compliance costs represent another challenge. The majority of the
interviewees pointed out how the costs of implementation in combination with those of compliance
may represent a barrier to the implementation process. The high costs pair up with the lack of relevant
knowledge and expertise such that needed to apply the WPM treatments correctly. At the same time,
the respondents understood well the consequences, which may derive from a lack of compliance such
as delay in exports or rejection of the consignment by the importing country.
The rest of the chapter is organized in the following way. The next section will describe the field
research undertaken in the four target countries; first we introduce the missions followed by a brief
description of the interviews carried out with the stakeholders and an elaboration of the main findings.
The introduction of the missions will be followed by a brief summary of how three NPPOs outside Africa
operate on matters related to ISPM 15 implementation, to provide grounds for a comparison that will
help suggest recommendations for best practices applicable to the four countries. Similarly, after
introducing the key activities undertaken by IAPSC we introduce the modus operandi of the European
and Mediterranean Plant Protection Organization (EPPO) and examples from the Brazilian and Dutch
NPPOs. This comparison will help understand how IAPSC can help increase the implementation of the
ISPM 15. The policy implications of our findings and the main recommendations are summarized and
discussed in the last section, whereas the appendix shows photos taken during the missions to help
illustrate the issues discussed in this chapter.
4.2 Field research in the participating countries
The missions had the objectives to (i) gather information and documentation on how the local NPPO has
implemented ISPM 15; (ii) understand the procedures the local NPPO has put in place to comply with
the international standard; (iii) understand the level of awareness of different stakeholders of ISPM 15;
and (iv) to organize the data collection process to understand the costs and benefits for the WPM
treatment facilities.
4.2.1 Botswana
Introduction
The mission to Gaborone, Botswana, took place from 25 to 31 October 2015.
61
Botswana is a relatively small inland country and most imported consignments arrive via South Africa. In
2012, Botswana and South Africa signed a memorandum of understanding to promote trade and
investment between the two countries. In addition, Botswana is part of the Southern African Customs
Union (SACU) together with Lesotho, Namibia, South Africa and Swaziland, which allows the duty-free
movement of goods within the SACU. It is not clear whether this agreement extends to the free
circulation of WPM, which would then not require any type of controls at the customs. For what
concerns exports, Botswana exports a limited amount of goods, of which only a limited percentage to
countries other than the neighbouring ones.
Interviews with the stakeholders
The first interview was with Mr Ranthoakgale, a former NPPO employee, who was also the contact point
for all logistics related to this project and for the data collection process. A complete list of the
interviewed stakeholders can be consulted in Table 5.
The meetings with Mr Modiakgotla, Director of the NPPO, and with Ms Mawere, second in command in
the NPPO, were helpful in understanding the reason why Botswana decided to implement and comply
with ISPM 15, notwithstanding the country’s relatively low levels of exports. The NPPO believes that
implementing the international standard will help the country develop a solid export sector in the
medium and long term. Botswana’s main exports are currently represented by precious stones and
nickel articles, but the country plans to increase the agricultural production and exports.
Previously there were 15 WPM treatment facilities in Botswana, but 14 facilities stopped their activities
as the market was not profitable, and only one facility exists now. The lack of profitability is evident
because the average demand for WPM treatments seems to be extremely low (about 200 pieces a
month) and very variable over time. HT is not used in Botswana as it is considered too expensive both in
absolute terms, in relation to the purchase of the HT chamber and the use of electricity, and in relative
terms, compared to the MB treatment costs. In addition, the NPPO discourages the use of HT claiming it
does not prevent the reinfestation of the WPM previously treated (although ISPM 15 clearly states that
treated WPM, whether by heat or other approved treatment, does not need to be re-treated).
The NPPO has not launched a surveillance program to validate the impact of the standard by comparing
the pre-ISPM 15 information with the post-ISPM 15 data. The lack of a proper data collection system
prevents the country from understanding whether the implementation of the international standard has
diminished the entry and establishment of pests. On a positive note, the NPPO is not aware of any pest
interceptions by importing countries, which should indicate that the WPM leaving Botswana has been
free from pests.21 Despite the fact that Botswana has officially implemented ISPM 15, the NPPO does
not inspect imported WPM directly nor has it instructed customs how to verify that the WPM is in
compliance with ISPM 15. This questions how well the country complies with the standard at the import
level.22
21
It is possible that countries may have intercepted pests, but they have not reported this to Botswana. 22
The NPPO has currently posted inspectors at the borders with the objective to inspect whether imported WPM comply with
ISPM 15. To date, these inspectors have not been given an inspection manual.
62
Mr Uglietti is the Manager of the U-Mac Import & Export (PTY) LTD, the only facility in Botswana
authorized to treat WPM using MB. The facility treats approximately 200 pieces of WPM per month,
even though the number may vary.
The quality of the stamp applied to WPM from this facility is debatable. According to ISPM 15, the stamp
should be “sufficient to be both visible and legible to inspectors without the use of a visual aid”, but this
is not always the case for the stamps used on the WPM treated by U-Mac Import & Export (PTY) LTD
(see
Figure 12).
However, more importantly, this facility has never been audited by an NPPO inspector, despite the fact
that the ISPM 15 prescribes that “treatment and application of the mark must always be under the
authority of the NPPO. NPPOs that authorize the use of the mark should supervise (or, as a minimum,
audit or review) […]”.
Shakinah Investments is a company that manufactures and sells WPM. The company trained one
employee to carry out MB treatments of WPM, in accordance to the ISPM 15, but then decided against
undertaking treatments because MB is intended to be phased out in the country and thus there would
not be a return on investments. At the same time, the company carried out a cost-benefit analysis for
setting up an HT facility, but realized that the break-even point against the investment would be reached
after treating at least 300 pallets a day, which would be way beyond the amount of WPM the company
is selling nowadays.
Both Mr Gopolang and Ms Selato, representatives of the Meteorological Services, brought up the issue
of phasing out MB even for uses connected to the treatment of WPM. The “National Meteorological
Service Act” published in 2014 and related to ozone depleting substances states that the use of MB has
been phased out from 2010, but that it can still be used when a substitute is not available, as in the case
of treating WPM (HT facilities do not exist in the country). When looking closer at the regulation
imposed by the Meteorological Services some questions arise, such as why only one company – U-Mac
Import & Export (PTY) LTD – can buy MB although other companies are interested in purchasing it. The
Meteorological Services acknowledges the importance of stopping the use of MB, but does not have any
resources to subsidize the transition from MB to heat treatments.
63
Botswana, as the other three countries involved in the project, has a number of facilities that repair
WPM. In total, there are around 50 in the whole country; 25 in Gaborone, 13 in Francistown, four in
Maun, four in Lobatse, two in Kanye and one in Selibe Phikwe. We visited two facilities – GP Pallets and
Isaac Upholstery – located in the outskirts of Gaborone. Both these facilities buy broken WPM, which
are either manufactured in Botswana or outside the country, repair the broken parts and reassemble
the WPM. Their main customers are companies located in Botswana that use the repaired WPM mainly
for moving goods within the country. The main problem related to the presence of repaired WPM is that
although they consist of partially untreated WPM, they may appear to have treated WPM, as the stamp
is present and legible.
The Botswana Unified Revenue Services is the institution in charge of conducting customs inspections. Being a landlocked Being a landlocked country, imports arrive mainly via South Africa. During the interview with Mr Mokgwaela, the Principal Mr Mokgwaela, the Principal Customs Officer, it was clear that customs lacks overall awareness about pest risk stemming pest risk stemming from WPM entering the country and that the timber would need to be treated. While customs inspects to While customs inspects to verify that timber arriving in Botswana has been treated there are no specific inspections carried inspections carried out on WPM. It seems there is an unwritten rule that commodities arriving in Botswana from South Botswana from South Africa need a phytosanitary permit stating that the commodity is free of bacteria and fungi, but there is no clear indication from the local NPPO on inspecting WPM (
Figure 7Error! Reference source not found.).
The confusion on how to properly implement ISPM 15, has been confirmed by Mr Mazebedi, Director of
the Horticultural Market. The market is organized as a cooperative of several farmers and is formally
owned by the Government of Botswana. The market sells fruits and vegetables to Botswana’s
neighbouring countries, mainly Namibia and Zimbabwe. Mr Mazebedi is aware of ISPM 15, but noted
that in practice the NPPO does not enforce its implementation. As an example, the board in charge of
regulating the Horticultural Market never received any indication from the NPPO on matters related to
ISPM 15 and how to implement it correctly. To partially prove what Mr Mazebedi disclosed,
Figure 12 shows the WPM used to export fruits and vegetables. In the first case, the WPM used had a
readable stamp while in the second the WPM displays a non-readable stamp.
Table 5: List of activities arranged for the mission to Botswana
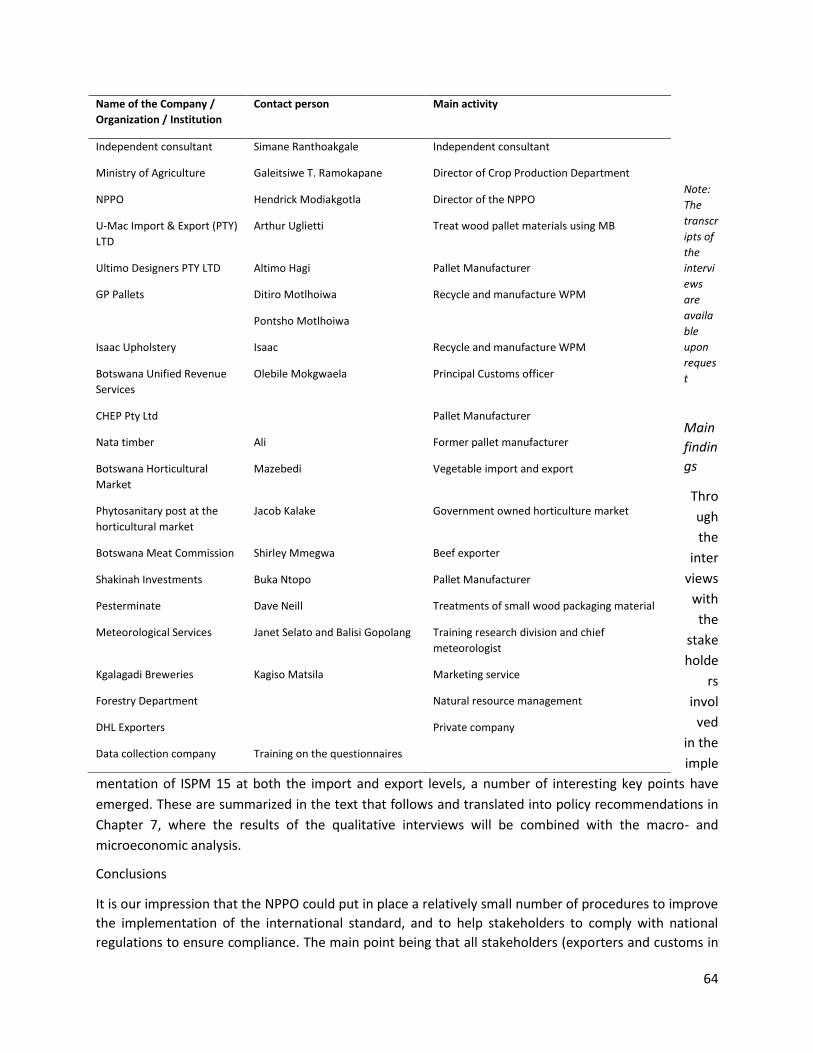
64
Note:
The
transcr
ipts of
the
intervi
ews
are
availa
ble
upon
reques
t
Main
findin
gs
Thro
ugh
the
inter
views
with
the
stake
holde
rs
invol
ved
in the
imple
mentation of ISPM 15 at both the import and export levels, a number of interesting key points have
emerged. These are summarized in the text that follows and translated into policy recommendations in
Chapter 7, where the results of the qualitative interviews will be combined with the macro- and
microeconomic analysis.
Conclusions
It is our impression that the NPPO could put in place a relatively small number of procedures to improve
the implementation of the international standard, and to help stakeholders to comply with national
regulations to ensure compliance. The main point being that all stakeholders (exporters and customs in
Name of the Company /
Organization / Institution
Contact person Main activity
Independent consultant Simane Ranthoakgale Independent consultant
Ministry of Agriculture Galeitsiwe T. Ramokapane Director of Crop Production Department
NPPO Hendrick Modiakgotla Director of the NPPO
U-Mac Import & Export (PTY)
LTD
Arthur Uglietti Treat wood pallet materials using MB
Ultimo Designers PTY LTD Altimo Hagi Pallet Manufacturer
GP Pallets Ditiro Motlhoiwa
Pontsho Motlhoiwa
Recycle and manufacture WPM
Isaac Upholstery Isaac Recycle and manufacture WPM
Botswana Unified Revenue
Services
Olebile Mokgwaela Principal Customs officer
CHEP Pty Ltd Pallet Manufacturer
Nata timber Ali Former pallet manufacturer
Botswana Horticultural
Market
Mazebedi Vegetable import and export
Phytosanitary post at the
horticultural market
Jacob Kalake Government owned horticulture market
Botswana Meat Commission Shirley Mmegwa Beef exporter
Shakinah Investments Buka Ntopo Pallet Manufacturer
Pesterminate Dave Neill Treatments of small wood packaging material
Meteorological Services Janet Selato and Balisi Gopolang Training research division and chief
meteorologist
Kgalagadi Breweries Kagiso Matsila Marketing service
Forestry Department Natural resource management
DHL Exporters Private company
Data collection company Training on the questionnaires
65
particular) should be made appropriately aware of the national legislation in respect to ISPM 15, the
trade agreements Botswana has with other countries and the potential consequences of these
agreements, as well as how they relate to phytosanitary issues.
Furthermore, the NPPO should supervise the WPM treatment facility, for instance through regular
audits, but there was no such mechanism in place, and that clearly poses a number of questions as to
validity of the treatments, just as it is not in compliance with ISPM 15, which states that “treatment and
application of the mark must always be under the authority of the NPPO. NPPOs that authorize the use
of the mark should supervise (or, as a minimum, audit or review) the application of the treatments, use
of the mark and its application, as appropriate, by producer/treatment providers and should establish
inspection or monitoring and auditing procedures”.
In addition, there is only one WPM treatment facility operating in the country. The facility uses MB
although this chemical will be soon phased out for WPM treating purposes. It would be advisable that
the NPPO encourages setting up a heat treatment facility for it to be operative when it will be no longer
possible to use MB.
Finally, there are several facilities that repair WPM but that do not treat it. This means that some parts
of the newly assembled WPM have not been treated, providing additional pest risks.
Figure 7 shows how the country as a whole and the NPPO in particular have organized the
implementation process.
Figure 7: Flow chart of the ISPM 15 implementation process in Botswana
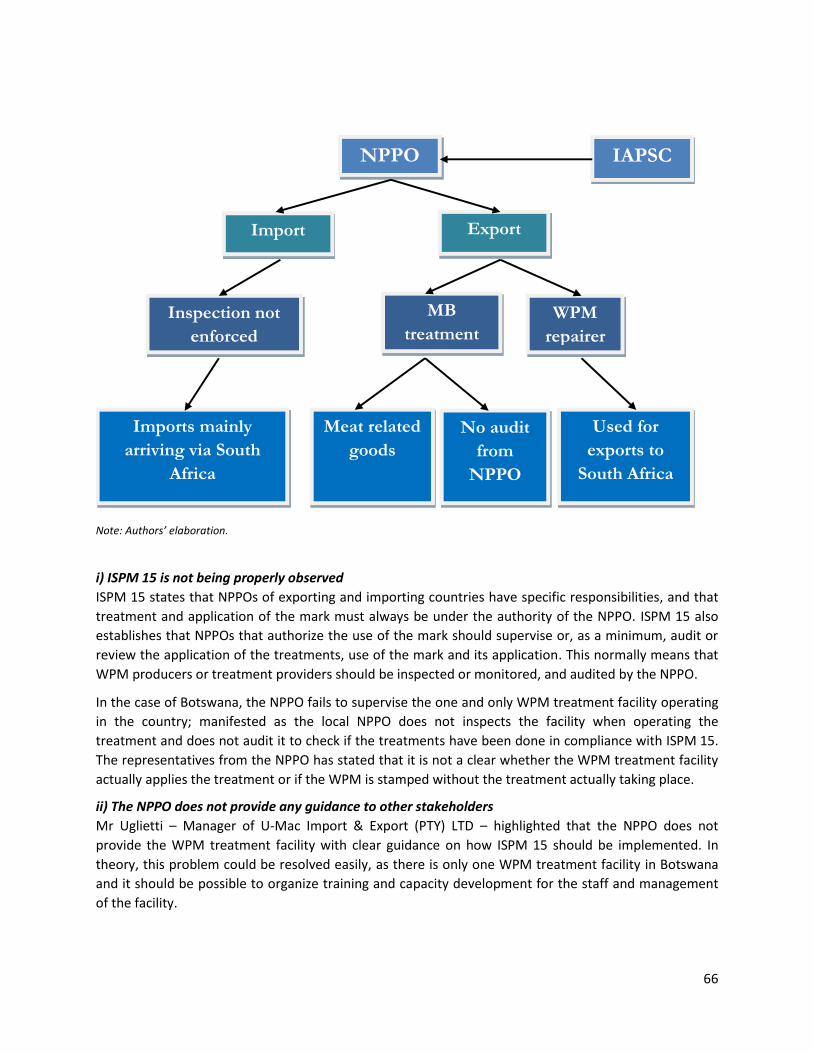
66
Note: Authors’ elaboration.
i) ISPM 15 is not being properly observed
ISPM 15 states that NPPOs of exporting and importing countries have specific responsibilities, and that
treatment and application of the mark must always be under the authority of the NPPO. ISPM 15 also
establishes that NPPOs that authorize the use of the mark should supervise or, as a minimum, audit or
review the application of the treatments, use of the mark and its application. This normally means that
WPM producers or treatment providers should be inspected or monitored, and audited by the NPPO.
In the case of Botswana, the NPPO fails to supervise the one and only WPM treatment facility operating
in the country; manifested as the local NPPO does not inspects the facility when operating the
treatment and does not audit it to check if the treatments have been done in compliance with ISPM 15.
The representatives from the NPPO has stated that it is not a clear whether the WPM treatment facility
actually applies the treatment or if the WPM is stamped without the treatment actually taking place.
ii) The NPPO does not provide any guidance to other stakeholders
Mr Uglietti – Manager of U-Mac Import & Export (PTY) LTD – highlighted that the NPPO does not
provide the WPM treatment facility with clear guidance on how ISPM 15 should be implemented. In
theory, this problem could be resolved easily, as there is only one WPM treatment facility in Botswana
and it should be possible to organize training and capacity development for the staff and management
of the facility.
NPPO
Import Export
IAPSC
Inspection not
enforced
MB
treatment
WPM
repairer
Imports mainly
arriving via South
Africa
Used for
exports to
South Africa
Meat related
goods
No audit
from
NPPO
67
iii) Should capacity building and training come from above?
The NPPO pointed out that it never received any training or capacity building to carry out its duties as
supervising body. The NPPO felt that either the FAO-IPPC or IASPC should have organized a workshop on
ISPM 15 in the country. However, it should be noted that the NPPO was unaware of capacity building
material or opportunities provided in the past, such as, an explanatory document posted publicly,23 and
several workshops on ISPM 15 that have been held, the most notable being in 2005, in Vancouver.
iv) ISPM 15 is not enforced at the import level
For what concerns imports, ISPM 15 has not been enforced so far. This means that neither custom nor
the NPPO inspect commodities arriving in the country. The local NPPO claims that there is no such need
due to the agreement between Botswana and South Africa. In practical term, the agreement translates
into a sort of a waiver by which commodities can travel freely between the two countries without
having compliant WPM. A very superficial inspection of the trucks arriving at the Botswana border from
South Africa demonstrated that the imported commodities arrived on both WPM that had the ISPM 15
mark and on WPM that did not have any stamp.
While it is reasonable that two countries that have a very similar environmental setting, and thus
relatively low risk of being invaded by pests from the other country, develop such agreements, it would
be expected that customs inspectors were at least aware of the existence of ISPM 15.
v) ISPM 15 is not always enforced at the export level
There are instances of export using non-treated WPM, such as the case of a brewery that exports beer
to the neighbouring countries, mainly to South Africa, on non-treated WPM.
Figure 14 shows the use of treated and non-treated WPM in the beer sector.
vi) Facilities repairing WPM without re-treating them
There are quite a number of facilities repairing WPM in Botswana. The main problem with the repaired
WPM is that it looks exactly like treated WPM although some wooden components of this new WPM
may have never been treated (Figure 13). ISPM 15 allows for reparation of broken WPM as far as each
added component will be treated and marked in accordance with the standard.
The newly assembled WPM may present no ISPM 15 stamp, when none of the parts used had a stamp,
or it may have one or more stamps, when one or more parts had stamps. In the first case, the WPM is
not compliant, and should not be exported whereas in the other case, where the WPM presents all the
23
For more information on the explanatory note, see http://www.afsca.be/exportthirdcountries/plants/_documents/2017-01-03_Annexe1ispm_15_explanatorydocument_withannexes_2014-04-30.pdf (last accessed: 27/06/2017).
68
features of a treated WPM, it might be exported (although, effectively, the WPM is not compliant). It
should be noted that the amount of repaired WPM, which looks like it has been treated although it is
not the case, is marginal in Botswana. The country has a limited export industry and one of the few
companies exporting outside the African continent – Botswana Meat Commission – only uses new
pallets.
vii) Existence of only one WPM treatment facility
In Botswana, there is only one WPM treatment facility; U-Mac Import & Export (PTY) LTD. This facility
buys all the MB Botswana is allowed to use yearly, and there is therefore no competition in the WPM
treatment industry given the fact that no other facility can operate without MB. This WPM treatment
facility’s unique identifier is “100” (Figure 15Error! Reference source not found.). There are several
other facilities, such as Chep Pty Ltd, producing WPM that is not treated, which are then used for the
internal market or for exporting commodities (Figure 16).
There are no HT facilities in Botswana, and the local NPPO should consider the opportunity of
subsidizing such treatment facilities considering that MB will soon be phased out, and Botswana-based
companies may otherwise have to import treated WPM from neighbouring countries, if any local
company wishes to export.
The opportunity to use solar energy to power a WPM treatment facility could be investigated, as the
average temperature in Gaborone is between 30 °C and 35 °C throughout the year.
viii) Is the stamp readable?
According to ISPM 15, the mark must be legible, durable and not transferable. This requirement
constitutes a challenge as the WPMs produced in loco as well as those received with imported
consignments generally do not present a legible mark (
Figure 12 and Figure 13).
ix) Does the MB treatment expire?
Botswana Meat Commission represents one of the largest exporting companies in Botswana, with its
meat reaching several markets in Europe (mostly UK) and Middle East. The company buys brand-new
WPM from U-Mac Import & Export (PTY) LTD each time there is an overseas order. Botswana Meat
Commission never uses second-hand treated WPM thinking that second-hand WPM, which has been
69
treated some time ago, may have been reinfested. This is not the correct understanding, as ISPM 15
prescribes that treated WPM does not need to be re-treated.
Conclusions
It is our impression that the NPPO could put in place a relatively small number of procedures to improve
the implementation of the international standard, and to help stakeholders to comply with national
regulations to ensure compliance. The main point being that all stakeholders (exporters and customs in
particular) should be made appropriately aware of the national legislation in respect to ISPM 15, the
trade agreements Botswana has with other countries and the potential consequences of these
agreements, as well as how they relate to phytosanitary issues.
Furthermore, the NPPO should supervise the WPM treatment facility, for instance through regular
audits, but there was no such mechanism in place, and that clearly poses a number of questions as to
validity of the treatments, just as it is not in compliance with ISPM 15, which states that “treatment and
application of the mark must always be under the authority of the NPPO. NPPOs that authorize the use
of the mark should supervise (or, as a minimum, audit or review) the application of the treatments, use
of the mark and its application, as appropriate, by producer/treatment providers and should establish
inspection or monitoring and auditing procedures”.
In addition, there is only one WPM treatment facility operating in the country. The facility uses MB
although this chemical will be soon phased out for WPM treating purposes. It would be advisable that
the NPPO encourages setting up a heat treatment facility for it to be operative when it will be no longer
possible to use MB. Finally, there are several facilities that repair WPM but that do not treat it. This
means that some parts of the newly assembled WPM have not been treated, providing additional pest
risks.
4.2.2 Cameroon
Introduction
The mission to Cameroon took place in Yaoundé and Douala from 4 to 11 July 2015. A complete list of
the interviewed stakeholders can be consulted in
Table 6.
Cameroon’s key exports (excluding crude petroleum) consist of cocoa products (USD 676 million in
2014) and wood articles (USD 525 million in 2014), while machinery (USD 683 million USD in 2014) and
cereals (USD 488 million in 2014) constitute its two major import sectors. The top export destinations of
Cameroon are China, India, the Netherlands, France and Spain. The top import origins are China, France,
India, Nigeria and the US. Over the last five years, the value of exports has remained quite stable (close
to USD 5 billion), while the value of imports rose from about USD 5 billion to approximately USD 6
billion, resulting in a large trade deficit.
Compared to the case of Botswana, Cameroon is a larger country in terms of size, population, number of
industries and agricultural production value, and the export sector is relatively well developed too.
There are around 20 WPM treatment facilities operating in the country, and due to this Cameroon faces
70
a higher degree of complexity when it comes to the implementation and compliance with ISPM 15.
Cameroon initiated the implementation of ISPM 15 in 2005. However, 12 years after the NPPO is still
struggling with a number of challenges.
Interviews with the stakeholders
The research team first met with the Director of the NPPO, Mr Leku-Azenaku, who provided a general
overview of the ISPM 15 implementation in Cameroon. Cameroon began implementing the standard in
2005 and soon after 26 facilities applied to become authorized WPM treatment facilities. Nowadays, a
facility may both produce and treat WPM, but the NPPO wishes to separate those two functions to avoid
confusion, overlapping roles, and problems with two licenses.
While it is quite straightforward applying to become a WPM treatment facility, the licence may be
withdrawn if a failure in applying ISPM 15 is detected. To obtain a license the facility needs to be a legal
entity, have a warehouse to store the WPM, comply with health and safety requirements, and be
insured. The license is valid for five years and, in order to get the license renewed, the facility needs to
provide the NPPO with all the records of past treatments, although there is no indication that the local
NPPO will actually scrutinize these records to check the modus operandi of the facility.
WPM treatment facilities operating in Cameroon use MB and HT and the NPPO Director indicated that
the use of MB for treatment purposes would be phased out by the end of 2015.24 The NPPO had not
received any guidelines in terms of how to correctly implement the standard by neither the FAO-IPPC
nor IAPSC.
Similarly to the other case-study countries, the local NPPO does not collect any data related to the entry
of pests. The lack of a proper data collection system influences Cameroon’s ability to properly
understand whether the implementation of ISPM 15 has been beneficial. As to the WPM leaving
Cameroon over the past few years, only a handful of pest interceptions have been detected in foreign
countries.
The interview with Mr Ekata, Director of the Phytosanitary Police Post, mainly focused on how
Cameroon implements ISPM 15 at the import level. Most imports arrive in Cameroon via the port
located in Douala. The inspections of fruits and vegetables (approximately worth USD 11.5 million in
2014) arriving in the country are done randomly by the Phytosanitary Police Post, and there are no
specific protocol regarding which commodities should be inspected more closely. At the same time, and
differently from what happens in countries outside Africa (see section 7), consignments from any
country may be inspected, and Cameroon does therefore not focus its inspection on imports from any
particular country.
For what concerns the inspections of imported goods, which are not fruits and vegetables, the
Phytosanitary Police Post did not know whether they arrive on WPM or material that cannot harbour
pests. This means that the Phytosanitary Police Post does not inspect any potential WPM. Normally,
customs working in the port of Douala does not inform the Phytosanitary Police Post of the presence of
WPM and this lack of coordination between the two entities may lead to the entry of pests.
24
As stated in Chapter 3, the text N°A218/d/SG/PM of 18 May 2017, emanated by the Prime Minister’s Office, stressed the fact that the use of MB is now prohibited in the country.
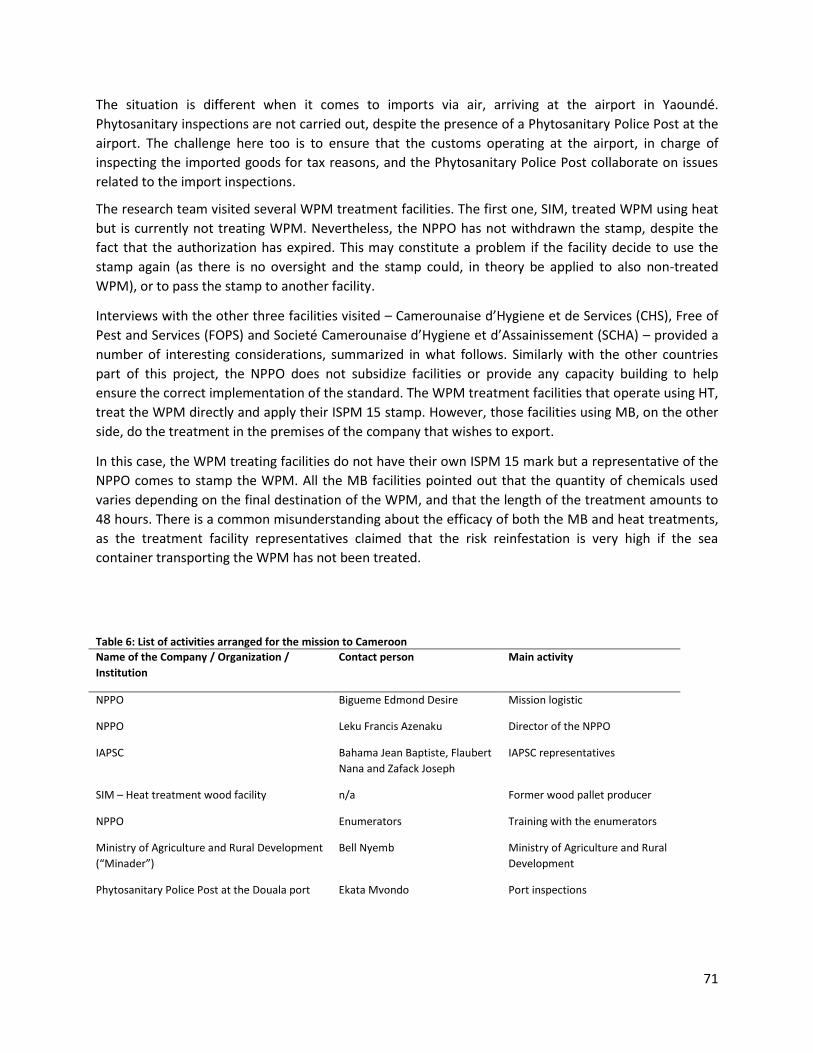
71
The situation is different when it comes to imports via air, arriving at the airport in Yaoundé.
Phytosanitary inspections are not carried out, despite the presence of a Phytosanitary Police Post at the
airport. The challenge here too is to ensure that the customs operating at the airport, in charge of
inspecting the imported goods for tax reasons, and the Phytosanitary Police Post collaborate on issues
related to the import inspections.
The research team visited several WPM treatment facilities. The first one, SIM, treated WPM using heat
but is currently not treating WPM. Nevertheless, the NPPO has not withdrawn the stamp, despite the
fact that the authorization has expired. This may constitute a problem if the facility decide to use the
stamp again (as there is no oversight and the stamp could, in theory be applied to also non-treated
WPM), or to pass the stamp to another facility.
Interviews with the other three facilities visited – Camerounaise d’Hygiene et de Services (CHS), Free of
Pest and Services (FOPS) and Societé Camerounaise d’Hygiene et d’Assainissement (SCHA) – provided a
number of interesting considerations, summarized in what follows. Similarly with the other countries
part of this project, the NPPO does not subsidize facilities or provide any capacity building to help
ensure the correct implementation of the standard. The WPM treatment facilities that operate using HT,
treat the WPM directly and apply their ISPM 15 stamp. However, those facilities using MB, on the other
side, do the treatment in the premises of the company that wishes to export.
In this case, the WPM treating facilities do not have their own ISPM 15 mark but a representative of the
NPPO comes to stamp the WPM. All the MB facilities pointed out that the quantity of chemicals used
varies depending on the final destination of the WPM, and that the length of the treatment amounts to
48 hours. There is a common misunderstanding about the efficacy of both the MB and heat treatments,
as the treatment facility representatives claimed that the risk reinfestation is very high if the sea
container transporting the WPM has not been treated.
Table 6: List of activities arranged for the mission to Cameroon
Name of the Company / Organization /
Institution
Contact person Main activity
NPPO Bigueme Edmond Desire Mission logistic
NPPO
IAPSC
Leku Francis Azenaku
Bahama Jean Baptiste, Flaubert
Nana and Zafack Joseph
Director of the NPPO
IAPSC representatives
SIM – Heat treatment wood facility
NPPO
n/a
Enumerators
Former wood pallet producer
Training with the enumerators
Ministry of Agriculture and Rural Development
(“Minader”)
Bell Nyemb Ministry of Agriculture and Rural
Development
Phytosanitary Police Post at the Douala port Ekata Mvondo
Port inspections
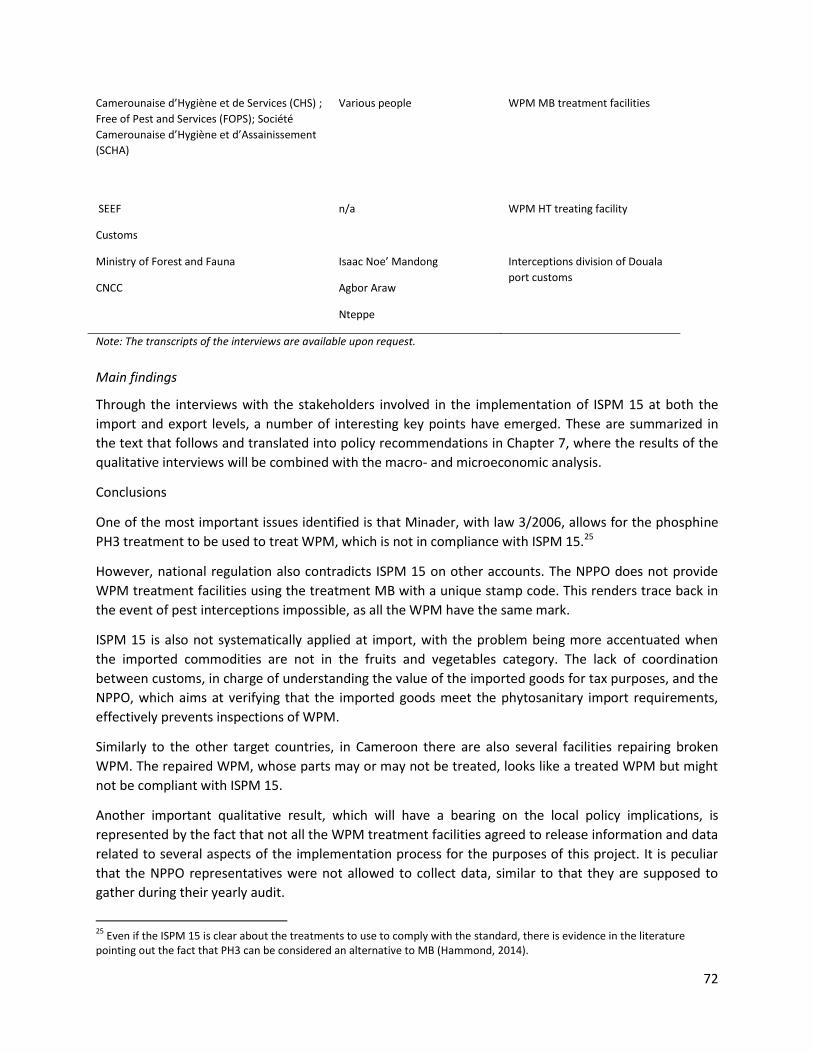
72
Camerounaise d’Hygiène et de Services (CHS) ;
Free of Pest and Services (FOPS); Société
Camerounaise d’Hygiène et d’Assainissement
(SCHA)
Various people
WPM MB treatment facilities
SEEF
Customs
Ministry of Forest and Fauna
CNCC
n/a
Isaac Noe’ Mandong
Agbor Araw
Nteppe
WPM HT treating facility
Interceptions division of Douala
port customs
Note: The transcripts of the interviews are available upon request.
Main findings
Through the interviews with the stakeholders involved in the implementation of ISPM 15 at both the
import and export levels, a number of interesting key points have emerged. These are summarized in
the text that follows and translated into policy recommendations in Chapter 7, where the results of the
qualitative interviews will be combined with the macro- and microeconomic analysis.
Conclusions
One of the most important issues identified is that Minader, with law 3/2006, allows for the phosphine
PH3 treatment to be used to treat WPM, which is not in compliance with ISPM 15.25
However, national regulation also contradicts ISPM 15 on other accounts. The NPPO does not provide
WPM treatment facilities using the treatment MB with a unique stamp code. This renders trace back in
the event of pest interceptions impossible, as all the WPM have the same mark.
ISPM 15 is also not systematically applied at import, with the problem being more accentuated when
the imported commodities are not in the fruits and vegetables category. The lack of coordination
between customs, in charge of understanding the value of the imported goods for tax purposes, and the
NPPO, which aims at verifying that the imported goods meet the phytosanitary import requirements,
effectively prevents inspections of WPM.
Similarly to the other target countries, in Cameroon there are also several facilities repairing broken
WPM. The repaired WPM, whose parts may or may not be treated, looks like a treated WPM but might
not be compliant with ISPM 15.
Another important qualitative result, which will have a bearing on the local policy implications, is
represented by the fact that not all the WPM treatment facilities agreed to release information and data
related to several aspects of the implementation process for the purposes of this project. It is peculiar
that the NPPO representatives were not allowed to collect data, similar to that they are supposed to
gather during their yearly audit.
25
Even if the ISPM 15 is clear about the treatments to use to comply with the standard, there is evidence in the literature pointing out the fact that PH3 can be considered an alternative to MB (Hammond, 2014).
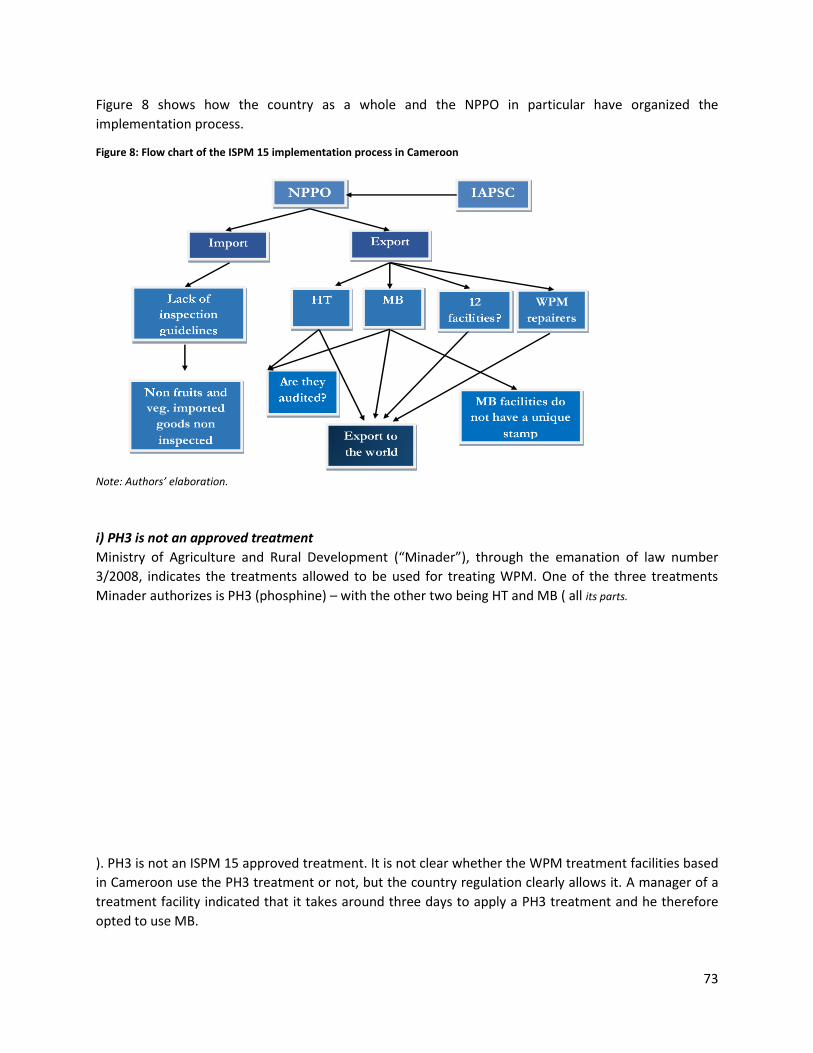
73
Figure 8 shows how the country as a whole and the NPPO in particular have organized the
implementation process.
Figure 8: Flow chart of the ISPM 15 implementation process in Cameroon
Note: Authors’ elaboration.
i) PH3 is not an approved treatment
Ministry of Agriculture and Rural Development (“Minader”), through the emanation of law number
3/2008, indicates the treatments allowed to be used for treating WPM. One of the three treatments
Minader authorizes is PH3 (phosphine) – with the other two being HT and MB ( all its parts.
). PH3 is not an ISPM 15 approved treatment. It is not clear whether the WPM treatment facilities based
in Cameroon use the PH3 treatment or not, but the country regulation clearly allows it. A manager of a
treatment facility indicated that it takes around three days to apply a PH3 treatment and he therefore
opted to use MB.
74
ii) The producer/treatment provider code is not unique
The facilities treating WPM using MB do not have their own ISPM 15 stamps, instead the NPPO provides
the mark directly. This fact per se does not contradict the requirements set out in ISPM 15; the NPPO is
entitled to keep all the stamps and apply them upon completed treatment. However, it is a major issue
that the NPPO stamps all WPM, treated by different facilities, with the very same mark without
distinguishing the producer or treatment provider. This poses a problem in case of pest interception, as
trace back will be impossible. In addition, this contradicts not only ISPM 15 but also the Minader law
number 3/2008, which states that the producer/treatment provider code should be unique for each of
the authorized WPM treatment facility.
iii) The ISPM 15 stamp is not always readable
The stamps applied by the NPPO to the treated WPM are, in some cases, partly or fully illegible (Figure
19).
iv) Essential and inessential components of the stamp
ISPM 15 clearly describes the essential requisites of the stamp (“A mark indicating that wood packaging
material has been subjected to approved phytosanitary treatment in accordance with this standard
comprises the following required components: the symbol, a country code, a producer/treatment
provider code, a treatment code using the appropriate abbreviation according to Annex 1”). As Figure 20
shows, it is very frequent in Cameroon to see additional components in the mark, for instance “DB”,
which stands for debarked wood. This additional component is not a requisite of ISPM 15 and is
unnecessary as, by default, only debarked wood should be used to produce WPM.
v) Minader law does not reflect ISPM 15
The misunderstanding regarding the information needed on the stamp may derive from Minader’s
misinterpretation of the international regulation. The Minader Order number 003/2006 states that the
stamp should have, among others, the date of the treatment, the code of the institution in charge of
stamping and the number of the batch (see all its parts.
). All these features are not required by ISPM 15.
vi) Customs inspections
Several representatives of the customs phytosanitary service, the group carrying out phytosanitary
inspections, have pointed out that inspections of WPM are not carried out with a systematic frequency.
75
The lack of inspections of the WPM entering Cameroon is due to the fact that the import permits
accompanying consignments do not report the type of packaging material they are transported on. The
Phytosanitary service representatives stressed that it is extremely difficult for customs to guess what
type of packaging material is used for all consignments, and therefore only inspects those carrying fruits
and vegetables26 because the inspectors expect the presence of WPM. A possible solution to this issue
could be improved communication between the inspectors working at customs and those performing
phytosanitary inspections, because although this communication is actually foreseen, in reality there is
no functioning mechanism to ensure it.
vii) Quantity of chemical used and length of the treatment
Several WPM treatment facilities using MB have stated that the amount of MB used for the treatment
varies depending on the country the treated WPM is moved to. According to ISPM 15, any approved
treatment may be applied with equal effect, and irrespective of the importing country. For what
concerns the length of the MB treatment, ISPM 15 only sets minimum exposure time (“not less than 24
hours”). Some facilities treat the WPM with MB for about 48 hours. However, it is not possible to know
whether such exposure time ensures the required level of efficacy, as no records related to the
concentration of the gas used are kept. In this regard, the NPPO should examine the treatment records
and advice on the procedures adopted.
viii) Not all the WPM treatment facilities have accepted to be interviewed
The research team had planned to interview the 26 WPM treatment facilities present in Cameroon, but
only 14 of them accepted to be interviewed. Nine of them refused to allow the local NPPO enumerators
to enter their premises and three of them had closed down at the time of the data collection. The
problems related to the lack of data from 12 WPM treating facilities will be discussed more thoroughly
in Chapter 6. Nevertheless, we note that the NPPO was unaware that three WPM treating facilities had
closed down, although it is responsible for authorizing the treatment facilities. Apparently, the NPPO
does not keep a list of which facilities are operating, which is also severe because the closed facilities
continue having the ISPM 15 stamp, and could, potentially, use it to mark untreated WPM. It is also
acknowledged that the facilities are not willing to share any type of information about their business
cycle with the local NPPO, although the NPPO should have a supervisory function. This poses problems
in terms of transparency and accuracy of the treatments carried out.
Conclusions
One of the most important issues identified is that Minader, with law 3/2006, allows for the phosphine
PH3 treatment to be used to treat WPM, which is not in compliance with ISPM 15. However, national
regulation also contradicts ISPM 15 on other accounts. The NPPO does not provide WPM treatment
facilities using the treatment MB with a unique stamp code. This renders trace back in the event of pest
interceptions impossible, as all the WPM have the same mark.
ISPM 15 is also not systematically applied at import, with the problem being more accentuated when
the imported commodities are not in the fruits and vegetables category. The lack of coordination
26
This communication challenge exists in many other countries too, some of which overcome it by establishing a database of commodities most likely to be associated with WPM. Customs then targets these commodities and the NPPO inspects the WPM.
76
between customs, in charge of understanding the value of the imported goods for tax purposes, and the
NPPO, which aims at verifying that the imported goods meet the phytosanitary import requirements,
effectively prevents inspections of WPM.
Similarly to the other target countries, in Cameroon there are also several facilities repairing broken
WPM. The repaired WPM, whose parts may or may not be treated, looks like a treated WPM but might
not be compliant with ISPM 15.
Another important qualitative result, which will have a bearing on the local policy implications, is
represented by the fact that not all the WPM treatment facilities agreed to release information and data
related to several aspects of the implementation process for the purposes of this project. It is peculiar
that the NPPO representatives were not allowed to collect data, similar to that they are supposed to
gather during their yearly audit.
4.2.3 Mozambique
Introduction
The mission to Maputo, Mozambique, took place from 31 January and 5 February 2016. A complete list
of the interviewed stakeholders can be consulted in Table 8.
Mozambique is located in the South-East part of Africa. Its location is strategic in terms of trade, as its
ports are used by neighbouring and land-locked countries –Malawi, Zambia and Zimbabwe- to import
and export goods. The implementation of the ISPM 15 in the country has been advertised in the national
gazette. Despite that, there are several stakeholders –both private and public- whose knowledge of the
international standard is still limited. The NPPO has prepared a manual for the import inspection, which
is lacking in the other countries part of the project. The major challenge is represented by the fact that
there is a limited number of WPM treating facilities; out of the existing 4 companies, only one is located
in the Maputo area which is the one where most of the exporting businesses are concentrated and
where the main commercial port is.
Interviews with the stakeholders
The Director of the NPPO, Ms Mangana, explained that the country started to implement ISPM 15 in
2007 (Figure 29 shows the first page of the official gazette where information about the implementation
of ISPM 15 was given). The first WPM treatment company was officially registered during the same year,
and there are currently three authorized WPM treatment facilities, all located in the northern part of the
country, and one that has applied for authorization, located just outside Maputo. The application
process foresees alone a request letter from the company and a visit from the NPPO to verify that the
company has all the necessary equipment needed to treat WPM. No further paperwork is needed (e.g.
regards training of employees, status of the workers in the company and of the company). Both the
license and the renewal are free of charge. The NPPO audits all the facilities once a year, mainly to check
the treatment records. The NPPO is considering increasing the inspections to two per year. The NPPO is
currently not offering any training to the facilities.
Ms Mangana pointed out several challenges that the NPPO is struggling to address, such as the
inadequate flow of communication (partly due to the absence of awareness policies) between the NPPO
on one side and customs, several ministries and exporters on the other. This lack of communication may
77
lead to some inefficiencies in the short and long term and often mean that no entry inspections are
carried out for the WPM used to transport non-fruit or non-vegetable products. Lack of awareness
about the existence of ISPM 15 is reflected in the fact that there is no WPM treatment facility in
Maputo, where most of the industries are located and where the port is.
Regarding capacity development, the NPPO took part in a quarantine course organized by the FAO-IPPC
in Zambia in 2015, and one NPPO representative participated in an ISPM 15 workshop in Vancouver in
200527. IAPSC used to organize some training workshops on phytosanitary measures but has reduced its
activities in the last years.
Mr Luis and Ms Francisco work for the pesticide registration unit within the Ministry of Agriculture. Part
of the Ministry’s mandate is to register the use of MB, which can now be used only for quarantine
purposes. Despite the fact that MB is allowed for treating WPM, there are no WPM treatment facilities
using this chemical as it is common knowledge in the country that the use of MB has been phased out
for all uses. As a result, Mozambique is not importing any MB at the moment. Neither Mr Luis nor
Ms Francisco is aware of the international standard. Mr Sulila, who is the country focal point for
compliance with the Montreal protocol, confirmed that the use of MB stopped in 2015. United Nations
Industrial Development Organization (UNIDO) has the mandate to gradually reduce, with the purpose of
eliminating, the use of MB at an international level, as UNIDO promotes industrialization in developing
and transition economies, and helps the central governments to comply with the Montreal protocol.
Also the UNIDO representative, Mr Comiche, pointed out that the relation between the international
organizations and the central government is not very strong and the communication between them
lacks. As an example, Mr Comiche highlighted that the agricultural production in Mozambique
decreased when the ban to use MB for agricultural-related purposes was issued, but the Ministry of
Agriculture never contacted UNIDO to find possible alternatives to MB in agriculture.
The meeting with the Agriculture Forest Resources Department, represented by Ms Alves, was useful to
understand that this research division has recently started to take actions regarding pest control.
Specifically, they recently launched a survey with the aim to record all the different types of pests in the
country. The emphasis of the survey is on pests such as the Lue gum chalcid wasp (Leptocybe invasa),
Gum lerp psyllid (Glycaspis brimblecombei) and Bronze bug (Thausmastocoris peregrinus), and when the
pests have been recorded, there will be an effort to identify the pests’ natural enemies, which can be
used to eliminate or control them. As to ISPM 15, Ms Alves said that her team is not aware of this
international standard.
The lack of awareness on matters related to ISPM 15 is shared with the Ministry of Trade, represented
by Mr Mavila, head of the Market Division. Despite the fact that his team daily deals with issues related
to exports and they help exporting companies in accessing new foreign markets, he has never come
across ISPM 15.
Mr Uamusse, head of Maputo Phytosanitary Inspection Division, receives directions from the NPPO.
Mr Uamusse is aware of ISPM 15 and he and his team inspect the imported agriculture goods coming by
sea – about 40 percent of the total imports. Inspections are also carried out on exported goods to make
27
For more information about the workshop held in Vancouver, see https://www.ippc.int/en/core-activities/capacity-development/ippc-workshop-practical-application-ispm-no-15vancouver-canada-28-february-4-march-2005/ (last accessed: 22/06/2017).
78
sure that the WPM used by the exporting companies in Mozambique is complying with the international
standard.
Inspections are conducted following the guidelines given by the NPPO and reported in a booklet (Figure
30). The share of the WPM inspected by the phytosanitary inspection division is reported in Table 7. No
record is kept of cases of ISPM 15 non-compliance. Similarly to what has been reported in other
countries, non-agricultural imported consignments are not inspected for compliance with IPSM 15.
Those consignments are inspected by customs to verify that taxes have been paid. Mr Uamusse also
stressed that Mozambique’s neighbouring landlocked countries (Malawi, Zambia and Zimbabwe) use the
port of Maputo for importing and exporting goods. The volume of the goods entering into Mozambique
via the port (imported by and exported to three mentioned countries) is too high for the inspectors to
be able to conduct the necessary inspections.28 The NPPO has requested the central government to
supply additional 72 inspectors (
Figure 31).
Table 7: Share of imported WPM that the phytosanity inspectors should inspect
Number of imported WPM Share of imported WPM to be inspected
>10 Inspect all the units
11–100 10% or 5 units minimum
101–1000 2% or 10 units minimum
>1000 1% or 20 units minimum
Notes: This summary table constitutes an extract of the “Manual Pratico para Inspector Fitossanitario”.
Mr Macuacua, representative of customs, confirmed that the organization is aware of ISPM 15. Contrary
to what the NPPO inspectors had said, Mr Macuacua highlighted that customs inspectors have the duty
to call the NPPO inspectors every time they are about to inspect a consignment that is transported on
WPM; failure to do so may result in the withdrawal of the permission to import. Nevertheless,
Mr Macuacua suggested that there is some confusion as to which institution is supposed to conduct the
inspections and that clearer areas of responsibility between them would ease the process. He also
28
According to the transit standard (ISPM 25) consignments in transit are subject to the same requirements as imports.
79
stressed the need for awareness campaigns on ISPM 15, as many stakeholders are not familiar with the
standard.
One of the major issues the NPPO is currently facing relates to the non-authorized WPM treatment
facility called IMMOGROUP. This facility, which opened in 2013, has requested the license to treat WPM
in accordance with ISPM 15 but the NPPO has not granted the license yet because it is not satisfied that
the scheme IMMOGROUP will adopt is in accordance with ISPM 15; IMMOGROUP wishes to purchase
treated timber from Swaziland, manufacture the WPM and stamp it with the ISPM 15 mark without
treating it further. This impasse is deleterious for a number of stakeholders; the IMMOGROUP cannot
start its treatment business, the NPPO is struggling to find a suitable solution, and all the exporting
companies located in Maputo and its surroundings are forced to buy treated WPM from other
countries.29
Woodland is a WPM manufacturer with eight full-time staff and a production of approximately 300
pieces of WPM per day. The eucalyptus timber used by this company comes from South Africa as the
timber reserves in Mozambique are too far from Maputo and it would be too costly to transport timber
from the north of the country. Its main customers are beer exporters, which use the WPM for both the
national and international movement.
As for the other countries, also Mozambique has the problem of WPM repairer facilities. Just outside of
Maputo a number of WPM repairers are located (
29
ISPM 15 refers to “producers” who are those manufacturing the WPM and that may apply the mark to appropriately treated
WPM), and to “treatment providers” who are those applying the approved treatments and that may apply the mark to
appropriately treated wood packaging material. WPM subjected to the approved measures shall be identified by application of
an official mark in accordance with Annex 2.
80
Figure 32). The main threat these facilities pose in relation to ISPM 15, is the same as in the other
countries, namely that treated WPM is repaired using non-treated wood and resold as treated WPM.
The price of repaired WPM is between 150 and 300 MZN, which is half the price of what a newly
manufactured WPM would cost. The NPPO is aware of the problem but is not monitoring the facilities’
activities.
The research team also visited two banana producers that export internationally. Rioverde has branches
in four districts of Mozambique – Maputo (the one the research team visited), Boane, Moamba and
Namacha. The company buys treated WPM from South Africa and uses it for both national and
international movement. The company has tried to buy treated WPM from Mozambique-based facilities,
but the cost was higher than that offered by their counterparts in South Africa. The WPM they use for
transporting bananas returns to the company, which then repairs it if necessary – but no additional
treatment will be applied – or displaces it. None of the WPM has had pest interceptions. However, the
fact that the WPM is marked with a South African mark, repaired with untreated WPM in Mozambique
and then re-shipped, means that any non-compliance notification would go to South Africa and not to
Mozambique.
A similar story was told by Beluzi, another banana producer and exporter, that buys treated WPM from
South African (Figure 33). The company purchased about 17,000 treated pieces of WPM in 2013 and
about 25,000 in 2014. There are several other banana exporting companies in the area and they seem to
all purchase treated WPM from South Africa.
Table 8: List of activities for the mission to Mozambique Name of the Company /
Organization / Institution
Contact person Main activity
NPPO Armand Come NPPO representative
NPPO Serafina Mangana NPPO director
MASA/DINas Luis Francisco Treat wood pallet materials using MB
UNIDO Leonildo Munguambe and jaime
Comiche
United Nations
Ministry of Forestry Darlindo Government
Ministry of Agriculture Alves Government
Custom Organization Macuacua Customs
Port Inspectors Lucas Uamusse Phytosanitary inspectorate
MITADER Leonardo Manuel Sulila Ministry of Land, Environment and Rural
Development
IMMOGROUP Nicola Francescon WPM producer and treating facility
Agrifocus Lizi Mabate Marrengula Company importing pesticides
Ministry of trade Mavila Government
81
Note:
Transcri
pts of the interviews are available upon request.
Main findings
Through the interviews with the stakeholders involved in the implementation of ISPM 15 at both the
import and export levels, a number of interesting key points have emerged. These are summarized in
the text that follows and translated into policy recommendations in Chapter 7, where the results of the
qualitative interviews will be combined with the macro- and microeconomic analysis.
Figure 9 shows how the country as a whole and the NPPO in particular have organized the
implementation process.
i) ISPM 15 awareness
The NPPO would need support to increase stakeholder awareness about ISPM 15; currently, there are
several representatives of various ministries of relevance to the implementation of the standard that are
not aware of it and this hinders coordination of activities. In addition, the Ministry of Agriculture is not
aware of the possibility of using MB for WPM treatment purposes.
ii) Inspections of imported goods
Similarly to what has been concluded in the other countries involved in the project, also in Mozambique
the NPPO inspectors inspect only WPM used to import fruit and vegetables. Other imports are inspected
by customs and they do not check WPM for compliance with ISPM 15.
iii) Inspections for goods to and from neighboring countries
Related to the point raised above, the NPPO is aware of a high volume of traffic of informal or unofficial
exports from Mozambique to neighboring and land-locked countries but the NPPO is not able to address
this problem due to lack of resources.
iv) Land-locked neighboring countries and their exports
The land-locked neighboring countries (Malawi, Zambia and Zimbabwe) all use the port in Maputo to
import and export commodities. The consignments that are imported by these countries are regularly
inspected, whereas those exported are not. The main reason for this is the lack of inspectors (see Figure
31 to see the number of available inspectors operating in Mozambique and the number of inspectors
the country needs).
v) Lack of WPM treatment facilities in Mozambique
There are only four operating WPM treatment facilities in Mozambique and all of them are located in
the North of the country, wherefore most of the Maputo-based export companies have to buy treated
WPM from South Africa or Swaziland as less costly. This may represent a loss for the national economy.
One WPM treatment facility located in Maputo area has requested authorization to treat WPM for two
years but the license has not yet been granted.
WPM repairer n/a WPM manufacturer
Woodland Colla Sono WPM manufacturer
Rioverde banana exporter Jose’ Maluana Exporter
Beluzi banana exporter Paulo Nogueira Exporter
82
vi) WPM repair facilities
There is an area of Maputo where there are approximately 50 small companies repairing broken WPM,
where the WPM is reassembled by using parts of treated and un-treated WPM. The NPPO is aware of
these businesses but is not addressing the risk this WPM represents.
vii) Is one treatment better than the other?
One exporting company stated that some importing countries refused WPM that had been treated using
heat.
viii) More about the perceived efficacy of the two treatments
Related to the point raised above, WPM treatment facilities are skeptical about stopping the use of MB
in favor of HT, as exporting companies fear that importers may refuse their consignment when moved
on heat treated WPM. This idea clashes with the understanding several stakeholders have, namely that
the Montreal protocol has banned MB for all purposes.
ix) Training and capacity building
The NPPO has not offered any type of ISPM 15 training to the representatives of treatment facilities
based in Mozambique. Likewise, IAPSC has not offered training to the NPPO despite the common
perception that IAPSC should have a stronger impact on the NPPO. NPPO representatives did receive
training from FAO-IPPC in 2008.
x) Solar energy?
The NPPO has never thought of designing or using an HT chamber that runs on solar energy, although
the average temperature in many areas of Mozambique is 38–39 °C, with temperatures reaching also
47 °C in December.
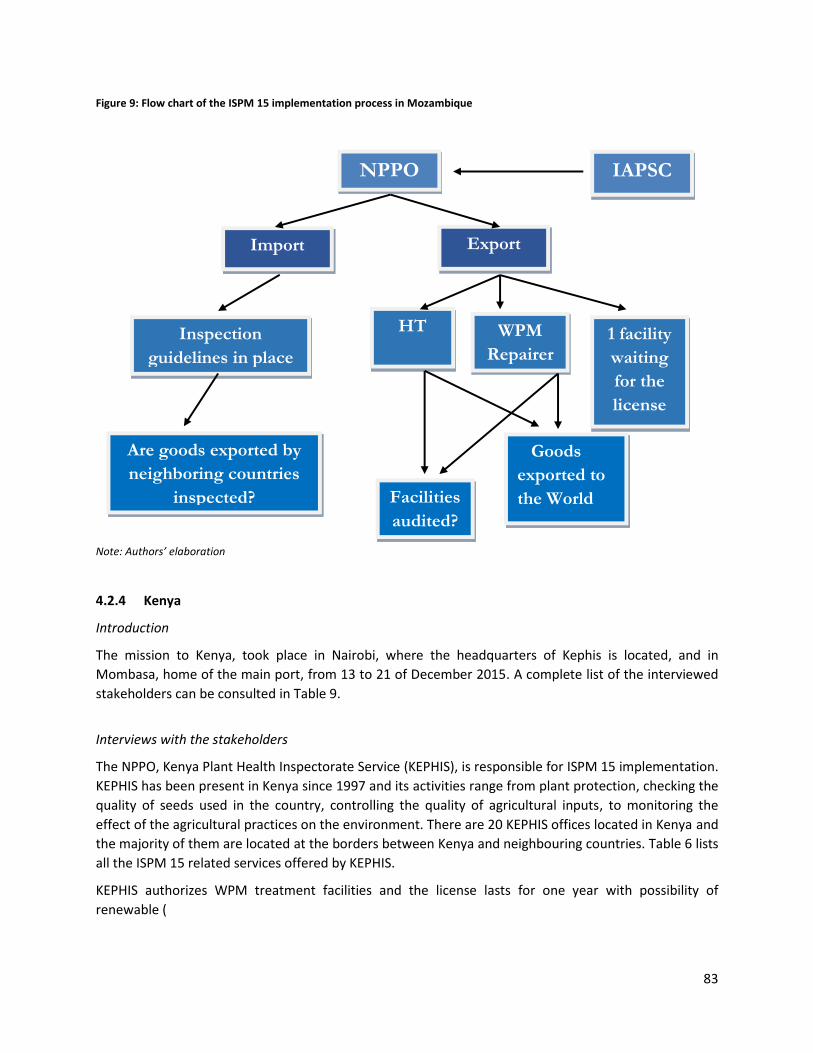
83
Figure 9: Flow chart of the ISPM 15 implementation process in Mozambique
Note: Authors’ elaboration
4.2.4 Kenya
Introduction
The mission to Kenya, took place in Nairobi, where the headquarters of Kephis is located, and in
Mombasa, home of the main port, from 13 to 21 of December 2015. A complete list of the interviewed
stakeholders can be consulted in Table 9.
Interviews with the stakeholders
The NPPO, Kenya Plant Health Inspectorate Service (KEPHIS), is responsible for ISPM 15 implementation.
KEPHIS has been present in Kenya since 1997 and its activities range from plant protection, checking the
quality of seeds used in the country, controlling the quality of agricultural inputs, to monitoring the
effect of the agricultural practices on the environment. There are 20 KEPHIS offices located in Kenya and
the majority of them are located at the borders between Kenya and neighbouring countries. Table 6 lists
all the ISPM 15 related services offered by KEPHIS.
KEPHIS authorizes WPM treatment facilities and the license lasts for one year with possibility of
renewable (
NPPO
Import Export
IAPSC
Inspection
guidelines in place
HT WPM
Repairer
Are goods exported by
neighboring countries
inspected? Facilities
audited?
Goods
exported to
the World
1 facility
waiting
for the
license
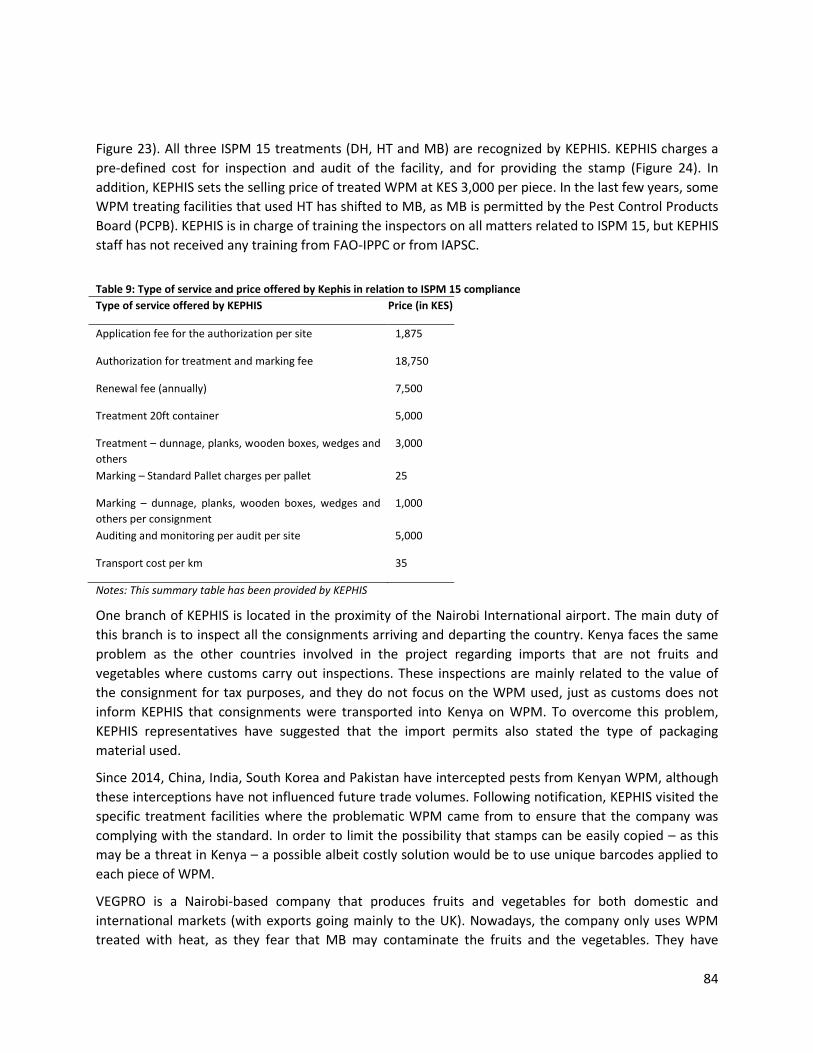
84
Figure 23). All three ISPM 15 treatments (DH, HT and MB) are recognized by KEPHIS. KEPHIS charges a
pre-defined cost for inspection and audit of the facility, and for providing the stamp (Figure 24). In
addition, KEPHIS sets the selling price of treated WPM at KES 3,000 per piece. In the last few years, some
WPM treating facilities that used HT has shifted to MB, as MB is permitted by the Pest Control Products
Board (PCPB). KEPHIS is in charge of training the inspectors on all matters related to ISPM 15, but KEPHIS
staff has not received any training from FAO-IPPC or from IAPSC.
Table 9: Type of service and price offered by Kephis in relation to ISPM 15 compliance
Type of service offered by KEPHIS Price (in KES)
Application fee for the authorization per site 1,875
Authorization for treatment and marking fee 18,750
Renewal fee (annually) 7,500
Treatment 20ft container 5,000
Treatment – dunnage, planks, wooden boxes, wedges and
others
3,000
Marking – Standard Pallet charges per pallet 25
Marking – dunnage, planks, wooden boxes, wedges and
others per consignment
1,000
Auditing and monitoring per audit per site 5,000
Transport cost per km 35
Notes: This summary table has been provided by KEPHIS
One branch of KEPHIS is located in the proximity of the Nairobi International airport. The main duty of
this branch is to inspect all the consignments arriving and departing the country. Kenya faces the same
problem as the other countries involved in the project regarding imports that are not fruits and
vegetables where customs carry out inspections. These inspections are mainly related to the value of
the consignment for tax purposes, and they do not focus on the WPM used, just as customs does not
inform KEPHIS that consignments were transported into Kenya on WPM. To overcome this problem,
KEPHIS representatives have suggested that the import permits also stated the type of packaging
material used.
Since 2014, China, India, South Korea and Pakistan have intercepted pests from Kenyan WPM, although
these interceptions have not influenced future trade volumes. Following notification, KEPHIS visited the
specific treatment facilities where the problematic WPM came from to ensure that the company was
complying with the standard. In order to limit the possibility that stamps can be easily copied – as this
may be a threat in Kenya – a possible albeit costly solution would be to use unique barcodes applied to
each piece of WPM.
VEGPRO is a Nairobi-based company that produces fruits and vegetables for both domestic and
international markets (with exports going mainly to the UK). Nowadays, the company only uses WPM
treated with heat, as they fear that MB may contaminate the fruits and the vegetables. They have
85
purchased treated WPM from various facilities, such as Woodtext, but now buys most of the treated
WPM from Mbbao & Allied, which is not actually a registered WPM treating facility anymore. To
appropriately inform export companies, KEPHIS will publish a list of authorized WPM treating facilities
online. In some cases, especially when Vegpro exports via air, it prefers to use iron sheets (Figure 25).
Woodtex is a WPM treatment facility which is specialized in HT. When KEPHIS granted them the license
(Figure 27), they received training from the NPPO. The company now produces between 3,000 and
4,000 pieces of WPM per month but there has been no increase in the number of WPM manufactured
after Kenya started to comply with the standard. The company has never had an interception.
The company has not faced any issues with fraud with the stamp. A year ago, it started to use a heat
stamp which is more expensive than the ink one but faster to apply and easier seen. The company
confirmed the common understanding that the WPM treatment is valid for 90 days and that after that
period it will need to be re-treated. The company does not fix any broken WPM, and it is generally rare
in Kenya to find facilities that repair broken WPM.
Figure 28 shows two WPM pieces stamped in a non-comprehensible way by Woodtex, and many other
similar examples were seen by the research team.
Kayjay is a WPM production and treatment facility using HT since 2009. The company produces and
treats a total of 120 pieces of WPM per month, and it does not charge regular customers extra for WPM
that has been treated. In addition, as company claims the HT treated WPM needs to be used within a
period of three months from the treatment to avoid re-treatment, it provides the exporters with a three
- month HT certificate.
Kakuzi and Kenyawood are two other WPM treatment facilities. Both companies produce avocados for
export to Europe and facilitate the export they manufacture and treat WPM. Both companies have
about 300 employees but only a tenth of them work in the wood processing and treatment division. The
companies have sustainable forests and, hence, never buy timber elsewhere. They produce
approximately 7,000 units of WPM per year and they are exclusively used by the companies themselves.
The companies noted that it was not complicated obtaining the KEPHIS license and that the NPPO
performs one scheduled audit of the facilities per year, although it may also come unannounced on
other occasions. The companies learned about ISPM 15 and about MB being phased out (except for
quarantine purposes) through the media. Both the companies issue HT certificates in the rare cases that
the treated WPM are sold to other companies (Figure 26).
Mr Manyeki, Deputy Director of Forest Conservation in the Ministry of Environment, Water and Natural
Resources, stated that the Ministry does not carry out any form of pest analysis although he was aware
of the presence of some pests that he assumed entered the country through the international
movement of goods, and knows that some farmers lost their reserves of cypress. He was not aware of
the fact that some pests may affect crops and thus affect the livelihoods of rural households.
Mr Odua, Assistant Director of Industries to Principal Secretary, in the Ministry of Industrialization and
Enterprise Development, works to promote the industrial development of agricultural and industrial
companies. The Ministry is not aware of ISPM 15 but he noted the Kenyan exports have increased over
the past years and that the export companies do not need subsidies from the central government to
comply with the international regulation.
86
Ms Machua, Deputy Director in the National Environment Management Authority, works closely with
PCPB on issues regarding the provision and use of chemicals and pesticides in the country. The agency
knows who imports MB and to whom MB is distributed to. This agency also knows that MB is allowed
only for quarantine purposes. Kenya has an allowance of two metric tons of MB per year, and this
quantity has not been used yet.
The representatives of PCPB, which is the company giving the authorization for importing MB, stated
that they were aware that the use of MB has been restricted but they were not convinced that the
restriction did not apply to quarantine purposes as well. They only sell MB to large companies that can
certify how the chemical is used.
The KEPHIS office in Mombasa is mainly responsible for inspecting imported and exported consignments
moved via sea. The exports mainly involve produce such as tea, cotton, grains and coffee. KEPHIS
inspects the consignments on a monthly basis to ensure the WPM is in compliance with ISPM 15. For
what concerns imports, KEPHIS only inspects WPM used for the movement of horticultural goods.
Normally, KEPHIS runs random checks of the WPM but when one instance of non-compliant WPM is
found, all the other WPM in the same consignment is inspected. Mr Muli, KWPHIS representative in the
Mombasa office, remembers only one such case from a few years ago, where a consignment from China
arrived on WPM that had not been stamped; KEPHIS burned the whole consignment.
Representatives of Finlays, Mr Kabachia and Mr Khayo stated that the company only buys new WPM as
second-hand WPM does not meet the company’s high quality standards. In addition, some importing
countries may not be satisfied with second-hand WPM, which is the case for Japan. Finlays
acknowledges that this practice may have some serious implications in terms of forest depletion. The
WPM used for exports do not return to Finlays. The price of the WPM has been incorporated into the
final price of their products (tea), which has increased slightly after the introduction of ISPM 15. Finlays
representatives confirmed that KEPHIS inspectors do inspect their facility once or twice a month.
The visit to the company POLUCON aimed at seeing how it stamps the WPM after treating them. The
company also conducts laboratory tests, pest control analysis, qualitative and quantitative inspections,
and analyses of samples of water and grains to detect infestation.
For what concerns the WPM treatment, the POLUCON started implementing ISPM 15 in 2010 using MB,
but switched to HT in 2012 because of MB unavailability. The company preferred using MB for both
logistic reasons (it was easy to treat the WPM directly at the export company’s facility) and efficiency
reasons, as they believe MB is a superior treatment compared to HT. The company treats a maximum of
600 pallets per month on average. The company uses a heat chamber, which is heated using briquettes
and there is no plan of switching to solar panels although the temperatures in Mombasa in summer time
reaches 40 °C. The company, contrary to what happens in other WPM treatment facilities, does not
issue a certificate with an expiry date. POLUCON complies with ISPM 15, although they believe that the
risk of reinfestation after treatment is extremely high.
Table 10: List of activities scheduled for the mission to Kenya
Name of the Company / Organization / Institution Contact person Main activity
KEPHIS Faith Ndunge NPPO
KEPHIS Esther Kimani NPPO
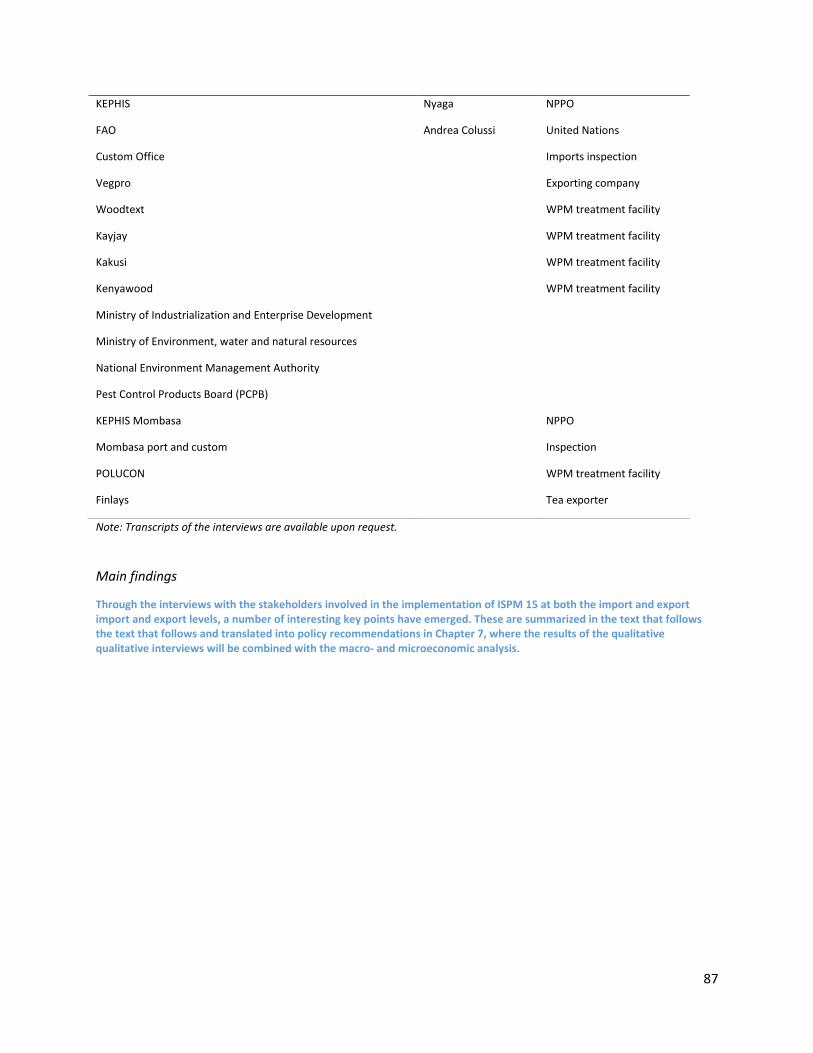
87
Note: Transcripts of the interviews are available upon request.
Main findings
Through the interviews with the stakeholders involved in the implementation of ISPM 15 at both the import and export import and export levels, a number of interesting key points have emerged. These are summarized in the text that follows the text that follows and translated into policy recommendations in Chapter 7, where the results of the qualitative qualitative interviews will be combined with the macro- and microeconomic analysis.
KEPHIS Nyaga NPPO
FAO Andrea Colussi United Nations
Custom Office Imports inspection
Vegpro Exporting company
Woodtext WPM treatment facility
Kayjay WPM treatment facility
Kakusi WPM treatment facility
Kenyawood WPM treatment facility
Ministry of Industrialization and Enterprise Development
Ministry of Environment, water and natural resources
National Environment Management Authority
Pest Control Products Board (PCPB)
KEPHIS Mombasa NPPO
Mombasa port and custom Inspection
POLUCON WPM treatment facility
Finlays Tea exporter
88
Figure 10 shows how the country as a whole and the NPPO in particular have organized the
implementation process.
Figure 10: Flow chart of the ISPM 15 implementation process in Kenya
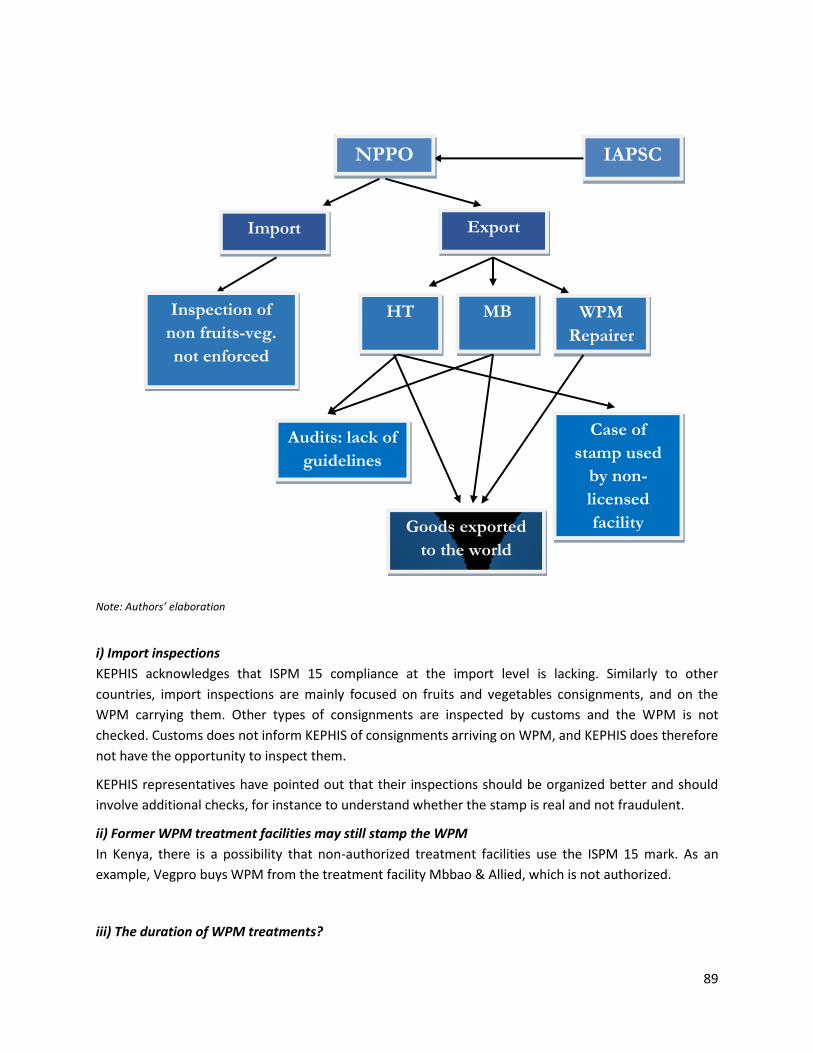
89
Note: Authors’ elaboration
i) Import inspections
KEPHIS acknowledges that ISPM 15 compliance at the import level is lacking. Similarly to other
countries, import inspections are mainly focused on fruits and vegetables consignments, and on the
WPM carrying them. Other types of consignments are inspected by customs and the WPM is not
checked. Customs does not inform KEPHIS of consignments arriving on WPM, and KEPHIS does therefore
not have the opportunity to inspect them.
KEPHIS representatives have pointed out that their inspections should be organized better and should
involve additional checks, for instance to understand whether the stamp is real and not fraudulent.
ii) Former WPM treatment facilities may still stamp the WPM
In Kenya, there is a possibility that non-authorized treatment facilities use the ISPM 15 mark. As an
example, Vegpro buys WPM from the treatment facility Mbbao & Allied, which is not authorized.
iii) The duration of WPM treatments?
Import Export
IAPSC
HT MB WPM
Repairer
Inspection of
non fruits-veg.
not enforced
Case of
stamp used
by non-
licensed
facility
Audits: lack of
guidelines
Goods exported
to the world
NPPO
90
KEPHIS representatives think that the WPM treatment will last no more than three months and that,
after that, the WPM should be treated again. Several other stakeholders share this view, which is not in
accordance with ISPM 15 and which bears significant environmental impacts.
iv) The ISPM 15 stamp is too easy to replicate
KEPHIS representatives think that FAO-IPPC should address the fact that the ISPM 15 stamp is easy to
replicate. For instance, the size of the stamp is not standard which makes it easier to replicate as all sizes
are accepted.
v) Audits of the WPM treatment facilities
KEPHIS carries out inspections and audits of WPM treatment facilities twice a year but those audits do
not seem to be structured; the impression is that the inspectors do not look at the data related to the
treatment applied. The inspection procedures should be formalized and a protocol should be used.
vi) Guidelines
KEPHIS claimed they had prepared some awareness material (flyers and brochures) on ISPM 15
implementation and compliance. However, Vegpro was not aware of any such material.
vii) Environmental hazard
In Kenya, no companies repair WPM and instead they use new wood for the WPM. This may pose an
environmental hazard for future generations in terms of deforestation.
viii) Certification of the treatment
Some importing countries require that the consignments should be moved on WPM that is treated with
a specific ISPM 15 treatment, instead of allowing the export country determine the treatment (i.e. some
require that the WPM is treated using HT whereas others only wish to import consignments on WPM
treated using MB). Furthermore, KEPHIS has been asked by some importing countries to issue a
certificate stating that the treated and stamped WPM had been treated. This additional requirement is
not in compliance with ISPM 15.
Conclusions
It is the authors’ consideration that KEPHIS could put in place a relatively small number of procedures to
enhance implementation of ISPM 15 and to help stakeholders comply with the deriving regulations.
Specifically, it would be beneficial to inform exporters and customs of ISPM 15 about what the
implications of the standard are, although it was the overall impression that also the NPPO would
benefit from capacity development to increase their knowledge on what the current trade agreements
they have imply in terms of phytosanitary-related standards.
91
4.3 Evidence from other NPPOs or organizations acting on behalf of the NPPO
4.3.1 Evidence from Controle de pragas Tratamentos fitossanitários (CCPU), Brazil30
When the Brazilian government decided to implement ISPM 15 in 2004, it delegated the
implementation process to Associação Brasileira das Empresas de Tratamento Fitossanitário e
Quarentenário (ABRAFIT), which was part of the Controle de pragas Tratamentos fitossanitários (CCPU).
That the choice fell on a private company, was because the government wished to create a bridge
between the public sector, the regulator, and the private businesses, which would need to comply with
the standard. ABRAFIT was fully responsible for organizing capacity building workshops and training
material (all training material is publicly available on the ABRAFIT website), and is still responsible for
inspecting the WPM treatment facilities.
The number of WPM treatment facilities operating in Brazil has increased dramatically over the last ten
years, from 15 in 2004 to 600 today. Brazilian export companies buy treated WPM exclusively from
Brazilian WPM treatment facilities. The treatment facilities are located across the Brazilian country, with
a higher density in the major ports. These latter facilities are used by export companies that do not have
a WPM treatment facility close by, or by import companies whose goods arrive in the country with non-
treated WPM.
Five percent of the WPM treatment facilities still use MB. The initial investment required for MB
equipment amounts to approximately USD 4,768 whereas for HT it amounts to USD 28,600. However,
one MB treatment costs USD 89 while one HT operation costs USD 30. The advantage of using HT
extends to the fact that the facility can treat up to 300 WPM per operation.
For what concerns the stamp, each treatment facility receives an unique stamp code; if a facility has
more branches across the country, each of those branches receive an unique stamp code. The stamp
code of a treatment facility that has closed down will not be reassigned. In this way, each WPM can be
traced back exactly to the facility which treated it.
Each WPM treatment facility is inspected randomly four times a year where the auditor checks all the
previous operations, including documentation and equipment used.31 As a rule of thumb, every time the
facility is in the process of executing a treatment of WPM, it should communicate that to the CCPU.
4.3.2 Evidence from Conlegno, Italy32 Conlegno is a private consortium, which has been delegated by the Italian NPPO to deal with matters
related to ISPM 15. Conlegno manages the Italian ISPM 15 mark (i.e. FITOK), and is responsible for
auditing the WPM treatment facilities.
30
For more information about how CCPU works, see http://ccpu.com.br/ (last accessed: 05/04/2017). The information about
CCPU was provided by Mr Bertussi.
31 The documents the WPM treatment facilities need to present to the inspectors are listed in the phytosanitary manual
produced by the Ministry of Agriculture (Manual de procedimentos de tratamentos fitossanitários com fins quarentenários – mptf produced by the Ministério da Agricultura, Pecuária e Abastecimento – mapa secretaria de defesa agropecuária - sda). 32
For more information about how Conlegno works, see http://www.conlegno.eu/it/ (last accessed: 05/04/2017). The information on how Conlegno operates in respect to the ISPM 15 was provided by Mr Corso.
92
In Italy, there are about 950 WPM treatment facilities, and a list of them is publicly available on
Conlegno’s website.33 About one third of them treat WPM using HT whereas the remaining facilities buy
timber already treated and then mark it.
The stamp numbers are unique for the individual facility and if a facility stops operating, the number is
not re-assigned unless a new company buys the existing facility and takes on the responsibility of the old
business.
Conlegno has never received training from FAO-IPPC. However, when the standard was approved by the
Italian Government and Conlegno received the mandate to supervise the implementation of it. Conlegno
wrote an implementation manual for dissemination in the facilities. Conlegno periodically receives
updates from the Italian Ministry about changes in the standard. All the updates and the manual are
publicly available on the company’s website.
When a new facility opens, Conlegno trains the employees at the facility. This will be the only “known”
visit, as Conlegno only inspects facilities without prior notice.
A second visit will be carried out a few months after the training has taken place to see whether the new
facility is working according to the guidelines. Conlegno normally performs two–four audits of one
facility per year. The standard number of visits is two, which can increase to four if Conlegno finds
something not working properly during a visit. In such a case the problem may be “secondary”, which
means that it is not critical, and the facility has maximum one week to correct it. However, if the
problem is a “primary”, the facility may be suspended for a minimum of two days or the license be taken
away.
Conlegno is informed about the number and types of pest interceptions of Italian treated WPM by the
facilities. When Italian WPM is intercepted, the facility may request assistance from Conlegno, as he
offers an insurance policy to cover any costs of interception. Unfortunately, if the facility does not
require any sort of assistance, it may not inform Conlegno.
The Conlegno representative suggested that ISPM 15 should be improved because there is too much
room for different implementation options. As an example, when Italian companies buy semi-finished
WPM from abroad, it may be difficult for those facilities to get the documents necessary for Conlegno to
pass the inspection. As an example, heat treatment efficacy can be verified either by measuring inside
the wood or measuring the air temperature, the temperature may vary (70 °C in Italy and France
compared to 75 °C in Switzerland and Austria, as may the number of temperature measurers inside the
chamber that may range from two to four.
33
For a list of authorized WPM treatment facilities, see http://www.conlegno.eu/tool/home.php?s=0,1,30,306,254&IDSite=1 (last accessed: 05/04/2017).
93
4.3.3 Evidence from the Stichting Markering Houten Verpakkingen (SMHV, Foundation implementing
the Dutch Wood Marking Program), The Netherlands34
The Netherlands started to implement ISPM 15 in 2005 and the Ministry of Economic Affairs delegated
The Netherlands Food and Consumer Product Safety Authority (NVWA) the implementation of the
standard. NVWA has, in turn, delegated this responsibility to the company SMHV.
There are about 100 companies registered to treat WPM in The Netherlands and may also repair and
manufacture WPM using treated wood. All of the treatment facilities use HT, as the DH option is still too
expensive.
What concerns inspections, SMHV does not carry out inspections of the WPM for exports. Around 20
times per year, exported consignments are placed in quarantine in the importing country. Most are due
to pest interceptions in the US and China. The causes of the interceptions are diverse and do not seem
to have any regularities between them.
Import inspections are more regulated. SMHV has put a system in place, which flags whether the
imported goods may represent a threat. This system depends on the nature of the consignment or the
exporting country, which means that some countries may be assessed as less accurate in implementing
ISPM 15, and that consignments coming from these countries are likely to be inspected. Flagged
consignments are sampled and inspected. Almost all inspections, carried out by a team of 30 inspectors,
take place at the Rotterdam port because consignments arriving via air are likely to arrive on iron
sheets. In case of interception, the inspectors normally check whether an infestation has already
occurred; if not the consignment will be treated at the expenses of the importing company. In case of
infestation, the consignment will be destroyed. Interceptions happen rather regularly, about 40 times a
year. SMHV faces the same problem as the African NPPOs; when the consignments are not fruits and
vegetables, the inspectors do not know what sort of packaging material the goods will arrive on.
However, differently from the four African examples, customs cooperate with the SMHV inspectors to
overcome this challenge.
WPM treatment facilities are audited more than twice a year and the Ministry of Economics inspects the
auditors.
4.4 The role of the IAPSC
IAPSC is one of the nine RPPOs worldwide. It started to operate in 1951, following FAO
recommendations to decentralize its activities in Africa in the field of plant protection. IAPSC acts as a
coordinator for 55 African member countries in the domain of plan protection.
The objective of IAPSC is to coordinate all plant protection related procedures in all the African Union
member countries, to ensure that sufficient, safe and quality food and feed is available to all people. In
summary, the objectives of the IAPSC are to:
i. promote safe, efficient and sustainable plant protection techniques and methods
ii. develop regional strategies against the introduction and spread of plant pests
34
For more information about how SMHV works, see http://www.smhv.nl/en (last accessed: 05/04/2017). The information on
how SMHV operates in respect to the ISPM 15 was provided by Mr Geutze.
94
iii. enhance harmonization of African phytosanitary legislations, plant quarantine, pesticides
homologation and encourage capacity building of NPPOs
iv. keep plant protection organizations informed through publications of a phytosanitary news
bulletin.
The activities to achieve those objectives range from coordinating plant protection activities, organizing
training on phytosanitary matters (e.g. pest risk analysis, plant quarantine, pesticides management, seed
pathology, integrated pest management), to updating pest lists to help and guide inspections. In
addition, IAPSC helps NPPOs to undertake awareness campaigns on phytosanitary issues and to enhance
cross-country collaboration to help member countries find solutions to common problems related to
phytosanitary standards.35
IASPC representatives have pointed out that IAPSC is not playing the role it has set up for itself on
phytosanitary matters and specifically in regards to ISPM 15. A number of activities IASPC should
undertake are listed in the text that follows, and are suggested to help the RPPO and the member
countries have a better understanding of ISPM 15.
In terms of the activities related to pest risk analysis, IAPSC does not keep an updated record of which
pests are present in the member countries. The RPPO should encourage NPPOs in the region to
undertake surveillance activities and to coordinate the sharing of this information.36 IASPC should also
try to interact with other RPPOs to triangulate and exchange available information (e.g. EPPO compiles a
list of all pests present in the African countries).37
In terms of developing regional strategies against the introduction and spread of pests (objective ii.
stated above), there is no clear procedure for how NPPOs should notify IASPC of the introduction of a
pest or of pest interceptions. As an example, when a pest interception occurs in a WPM – either in an
African country or as a consequence of an African WPM – IAPSC is very seldom informed. The NPPOs
involved in the interception (the country where the interception occurred and the country where the
WPM was treated) will solve the controversy among themselves. A flow of information between the
African NPPOs and IASPC would be desirable, to keep the RPPO informed on matters related to ISPM 15
and to inform NPPOs on potential pest risks.
In terms of “organizing training on phytosanitary related matters”, IASPC is not financially able to do this
for any of the many ISPMs (41 core standards as of 2017); the number of necessary trainings would be
too costly for IAPSC. Generally, IAPSC suggests NPPOs to contact the FAO-IPPC.
Regarding ISPM 15, IAPSC does not keep a track of when each member country started to implement
the standard, information that could be helpful to derive statistics on the situation in the 55 member
countries. IAPSC does not have a clear understanding of whether the standard has been beneficial to the
35
For more information about the role and the objectives the IAPSC, see https://webcache.googleusercontent.com/search?q=cache:eZRWmR21f0sJ:https://www.ippc.int/static/media/files/publication/en/2015/03/1157727847831_African_Presentation.doc+&cd=3&hl=it&ct=clnk&gl=uk&client=firefox-b-ab (last accessed: 04/04/2017). 36
IAPSC representatives have stressed that the pest lists each country keeps are obsolete and need to be updated. IAPSC has organized workshops in the past aimed at establishing a harmonized system of information collection for pests but no major improvements in the collection system has been manifested yet. 37
See examples of such lists at https://gd.eppo.int/rppo/IAPSC (select the country of interest and click on “Organism present”) (last accessed: 04/04/2017).
95
countries. For example, it is unknown whether the trading position of member countries improved after
the international standard was implemented.
In terms of “enhancing harmonization of African phytosanitary legislation […]”, IASPC does not provide
any guidelines about applicable wood treatments to comply with ISPM 15. The lack of guidelines affects
the inspections as well. IAPSC acknowledges that member countries are more likely to implement the
standard for export reasons, and less inclined to inspect at import, however, IAPSC does not advise
member countries on the severity of the consequences that the lack of inspections may lead to in terms
of crop losses and environmental impacts.
4.5 Evidence from EPPO
EPPO is an intergovernmental organization responsible for cooperation and harmonization in plant
protection within the European and Mediterranean region, and it is the RPPO for Europe. Founded in
1951, EPPO has grown from 15 to 51 member countries, and now includes nearly every country in
Europe (EPPO and IASPC have similar numbers of members they coordinate).
EPPO’s objectives are:
i. encouraging the harmonization of phytosanitary regulations and all other areas of official plant
protection action
ii. promoting the use of modern, safe, and effective pest control methods
iii. providing a documentation service on plant protection
iv. setting regional standards for phytosanitary measures and plant protection products.
In addition, EPPO actively participates in phytosanitary activities coordinated or organized by the FAO-
IPPC, and often organizes international conferences or workshops for plant protection researchers,
managers of plant protection organizations, or phytosanitary inspectors.
The objectives and the activities of EPPO are similar to those set out by IASPC, and the modus operandi
of the two RPPOs is similar for what concerns some of their activities.
Regarding ISPM 15, EPPO provides guidance to NPPOs on the choice of the treatment, the number of
audits to organize and the type of documents to request to grant authorization to a WPM treatment
facility. However, EPPO does not organize any capacity building workshops (on ISPM 15 or other ISPMs)
because they have not received a formal request to do this from any member country. Similarly to
IAPSC, EPPO does not keep a record of when member countries have started to implement the
standard. This information would be useful if triangulated with the data EPPO has collected on pests
present in various countries and the year of detection.38 This dataset could be a resourceful tool in
understanding if the number of pests increased or decreased after ISPM 15 was implemented.
38
For more information, see http://archives.eppo.int/EPPOReporting/Reporting_Archives.htm (last accessed: 04/04/2017). The
information on how EPPO operates was provided by Mr Martin Ward.
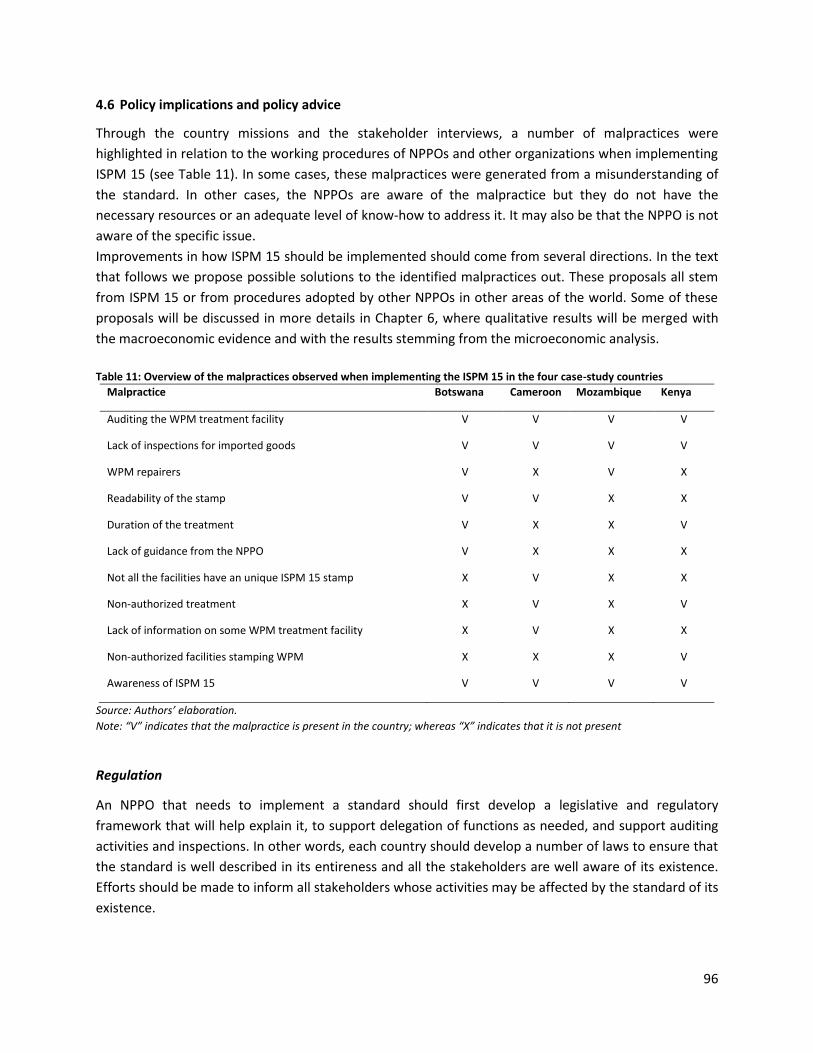
96
4.6 Policy implications and policy advice
Through the country missions and the stakeholder interviews, a number of malpractices were
highlighted in relation to the working procedures of NPPOs and other organizations when implementing
ISPM 15 (see Table 11). In some cases, these malpractices were generated from a misunderstanding of
the standard. In other cases, the NPPOs are aware of the malpractice but they do not have the
necessary resources or an adequate level of know-how to address it. It may also be that the NPPO is not
aware of the specific issue.
Improvements in how ISPM 15 should be implemented should come from several directions. In the text
that follows we propose possible solutions to the identified malpractices out. These proposals all stem
from ISPM 15 or from procedures adopted by other NPPOs in other areas of the world. Some of these
proposals will be discussed in more details in Chapter 6, where qualitative results will be merged with
the macroeconomic evidence and with the results stemming from the microeconomic analysis.
Table 11: Overview of the malpractices observed when implementing the ISPM 15 in the four case-study countries
Malpractice Botswana Cameroon Mozambique Kenya
Auditing the WPM treatment facility V V V V
Lack of inspections for imported goods V V V V
WPM repairers V X V X
Readability of the stamp V V X X
Duration of the treatment V X X V
Lack of guidance from the NPPO V X X X
Not all the facilities have an unique ISPM 15 stamp X V X X
Non-authorized treatment X V X V
Lack of information on some WPM treatment facility X V X X
Non-authorized facilities stamping WPM X X X V
Awareness of ISPM 15 V V V V
Source: Authors’ elaboration.
Note: “V” indicates that the malpractice is present in the country; whereas “X” indicates that it is not present
Regulation
An NPPO that needs to implement a standard should first develop a legislative and regulatory
framework that will help explain it, to support delegation of functions as needed, and support auditing
activities and inspections. In other words, each country should develop a number of laws to ensure that
the standard is well described in its entireness and all the stakeholders are well aware of its existence.
Efforts should be made to inform all stakeholders whose activities may be affected by the standard of its
existence.
97
In the countries studied in this project, this legislative support is lacking and when present (Cameroon) it
portrays the wrong information (the use of PH3 as an authorized treatment and the information the
mark should contain). In another case (Mozambique), the legislative base exists but covers only a part of
the needed information (i.e. only a manual on how to conduct inspections on imported goods). The
legislative support should explain all the steps needed to implement and to comply with the standard,
and should therefore, among others, explain the approved treatments adopted and how to certify their
uses, how WPM treatment facilities obtain license to operate, how to carry out audits, how to inspect
imported consignments and how to disincentive fraud.
In what follows we try to enumerate all the information the legislative tool should have and we propose
interactions and exchange of information between the public and the private sector.
Coordination
Awareness campaigns should be organized and informative brochures be prepared to promote the
existence of the standard. As it stands several important stakeholders are still not aware of ISPM 15,
including ministries regulating trade, agricultural activities, or in charge of safeguarding the
environment.
It should be clear that the correct implementation of and compliance with the standard is not the
responsibility of the NPPOs alone, but a joint effort of all the stakeholders, both public and private.
Import control
Since WPM is associated with almost all shipments, including those that are not the target of
phytosanitary inspections, cooperation with custom agencies is a sine-qua-non requirement for a correct
implementation of the standard. The way inspections for imported goods are organized are similar in
the four countries; the NPPOs inspect plant-related imports, while customs inspect all imports for tax
purposes. As there is no exchange of information between these organizations as to the arrival of
consignments, which are not plant related, the WPM associated with these consignments are rarely
inspected. Cooperation between customs and NPPOs should be reviewed to ensure effectiveness in
detecting potential non-compliance of WPM.
In this chapter we mentioned that other countries overcome this challenge by establishing a database of
commodities that are most likely to be associated with WPM. Customs then targets these commodities
and the NPPO inspects the WPM. Overall, an inspection manual should be prepared to inform inspectors
on the share of imports to be inspected and based on what principle, and which actions should be taken
when cases of non-compliance occur. It should for instance be decided whether to inspect randomly or
according to assessment of risks based on the exporting country or type of consignment.
Continuous training of all staff (customs and NPPO inspectors, port employees) should be organized. A
number of countries rely on paper documentations to track consignments. This challenges sharing of
knowledge and the identification of pest risks, as the data is not easily analysed. All steps of the
implement process should be computerized (lessons should be drawn from the ePhyto system).39
Definition of all those measures related to the non-compliance at the point of entry
39
For more information on the ePhyto project see http://www.standardsfacility.org/PG-504 (last accessed: 28/06/2017).
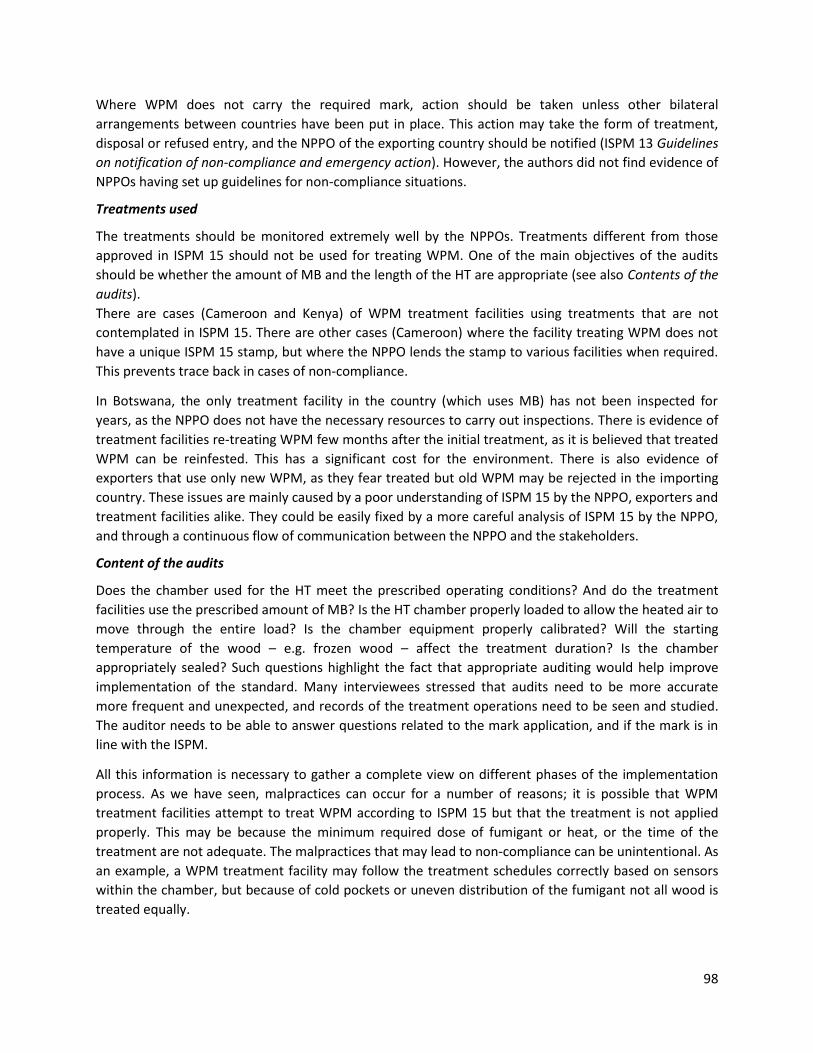
98
Where WPM does not carry the required mark, action should be taken unless other bilateral
arrangements between countries have been put in place. This action may take the form of treatment,
disposal or refused entry, and the NPPO of the exporting country should be notified (ISPM 13 Guidelines
on notification of non-compliance and emergency action). However, the authors did not find evidence of
NPPOs having set up guidelines for non-compliance situations.
Treatments used
The treatments should be monitored extremely well by the NPPOs. Treatments different from those
approved in ISPM 15 should not be used for treating WPM. One of the main objectives of the audits
should be whether the amount of MB and the length of the HT are appropriate (see also Contents of the
audits).
There are cases (Cameroon and Kenya) of WPM treatment facilities using treatments that are not
contemplated in ISPM 15. There are other cases (Cameroon) where the facility treating WPM does not
have a unique ISPM 15 stamp, but where the NPPO lends the stamp to various facilities when required.
This prevents trace back in cases of non-compliance.
In Botswana, the only treatment facility in the country (which uses MB) has not been inspected for
years, as the NPPO does not have the necessary resources to carry out inspections. There is evidence of
treatment facilities re-treating WPM few months after the initial treatment, as it is believed that treated
WPM can be reinfested. This has a significant cost for the environment. There is also evidence of
exporters that use only new WPM, as they fear treated but old WPM may be rejected in the importing
country. These issues are mainly caused by a poor understanding of ISPM 15 by the NPPO, exporters and
treatment facilities alike. They could be easily fixed by a more careful analysis of ISPM 15 by the NPPO,
and through a continuous flow of communication between the NPPO and the stakeholders.
Content of the audits
Does the chamber used for the HT meet the prescribed operating conditions? And do the treatment
facilities use the prescribed amount of MB? Is the HT chamber properly loaded to allow the heated air to
move through the entire load? Is the chamber equipment properly calibrated? Will the starting
temperature of the wood – e.g. frozen wood – affect the treatment duration? Is the chamber
appropriately sealed? Such questions highlight the fact that appropriate auditing would help improve
implementation of the standard. Many interviewees stressed that audits need to be more accurate
more frequent and unexpected, and records of the treatment operations need to be seen and studied.
The auditor needs to be able to answer questions related to the mark application, and if the mark is in
line with the ISPM.
All this information is necessary to gather a complete view on different phases of the implementation
process. As we have seen, malpractices can occur for a number of reasons; it is possible that WPM
treatment facilities attempt to treat WPM according to ISPM 15 but that the treatment is not applied
properly. This may be because the minimum required dose of fumigant or heat, or the time of the
treatment are not adequate. The malpractices that may lead to non-compliance can be unintentional. As
an example, a WPM treatment facility may follow the treatment schedules correctly based on sensors
within the chamber, but because of cold pockets or uneven distribution of the fumigant not all wood is
treated equally.
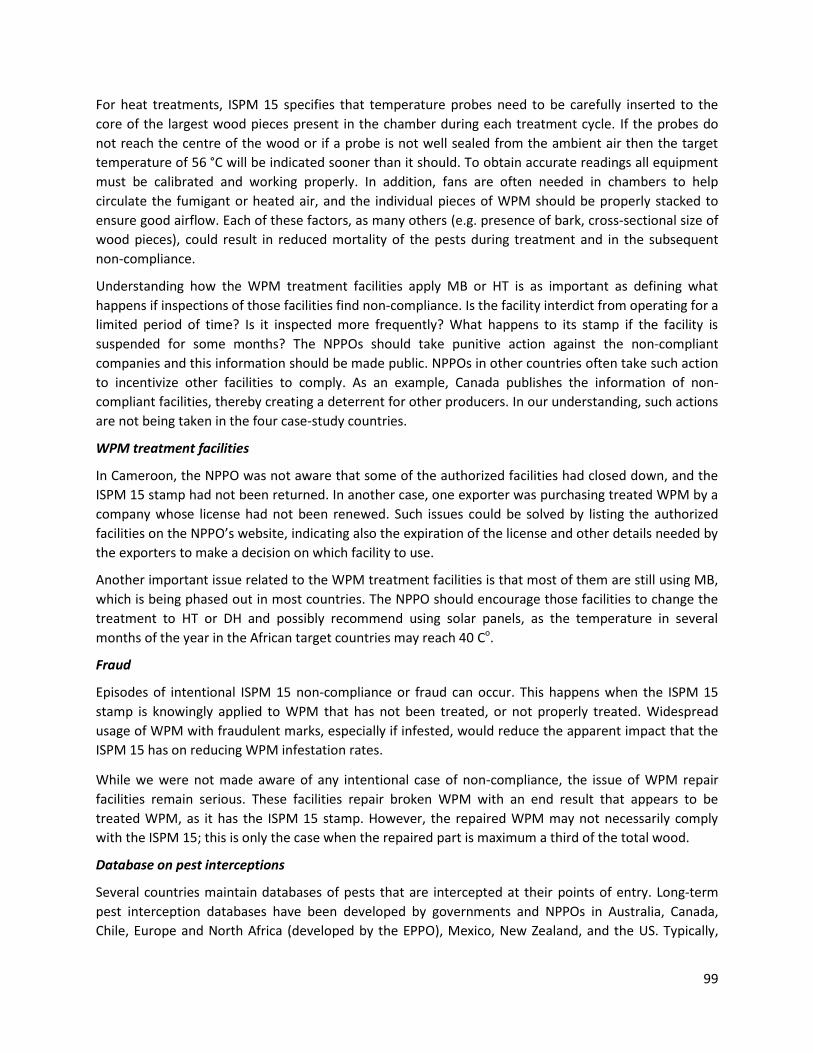
99
For heat treatments, ISPM 15 specifies that temperature probes need to be carefully inserted to the
core of the largest wood pieces present in the chamber during each treatment cycle. If the probes do
not reach the centre of the wood or if a probe is not well sealed from the ambient air then the target
temperature of 56 °C will be indicated sooner than it should. To obtain accurate readings all equipment
must be calibrated and working properly. In addition, fans are often needed in chambers to help
circulate the fumigant or heated air, and the individual pieces of WPM should be properly stacked to
ensure good airflow. Each of these factors, as many others (e.g. presence of bark, cross-sectional size of
wood pieces), could result in reduced mortality of the pests during treatment and in the subsequent
non-compliance.
Understanding how the WPM treatment facilities apply MB or HT is as important as defining what
happens if inspections of those facilities find non-compliance. Is the facility interdict from operating for a
limited period of time? Is it inspected more frequently? What happens to its stamp if the facility is
suspended for some months? The NPPOs should take punitive action against the non-compliant
companies and this information should be made public. NPPOs in other countries often take such action
to incentivize other facilities to comply. As an example, Canada publishes the information of non-
compliant facilities, thereby creating a deterrent for other producers. In our understanding, such actions
are not being taken in the four case-study countries.
WPM treatment facilities
In Cameroon, the NPPO was not aware that some of the authorized facilities had closed down, and the
ISPM 15 stamp had not been returned. In another case, one exporter was purchasing treated WPM by a
company whose license had not been renewed. Such issues could be solved by listing the authorized
facilities on the NPPO’s website, indicating also the expiration of the license and other details needed by
the exporters to make a decision on which facility to use.
Another important issue related to the WPM treatment facilities is that most of them are still using MB,
which is being phased out in most countries. The NPPO should encourage those facilities to change the
treatment to HT or DH and possibly recommend using solar panels, as the temperature in several
months of the year in the African target countries may reach 40 Co.
Fraud
Episodes of intentional ISPM 15 non-compliance or fraud can occur. This happens when the ISPM 15
stamp is knowingly applied to WPM that has not been treated, or not properly treated. Widespread
usage of WPM with fraudulent marks, especially if infested, would reduce the apparent impact that the
ISPM 15 has on reducing WPM infestation rates.
While we were not made aware of any intentional case of non-compliance, the issue of WPM repair
facilities remain serious. These facilities repair broken WPM with an end result that appears to be
treated WPM, as it has the ISPM 15 stamp. However, the repaired WPM may not necessarily comply
with the ISPM 15; this is only the case when the repaired part is maximum a third of the total wood.
Database on pest interceptions
Several countries maintain databases of pests that are intercepted at their points of entry. Long-term
pest interception databases have been developed by governments and NPPOs in Australia, Canada,
Chile, Europe and North Africa (developed by the EPPO), Mexico, New Zealand, and the US. Typically,
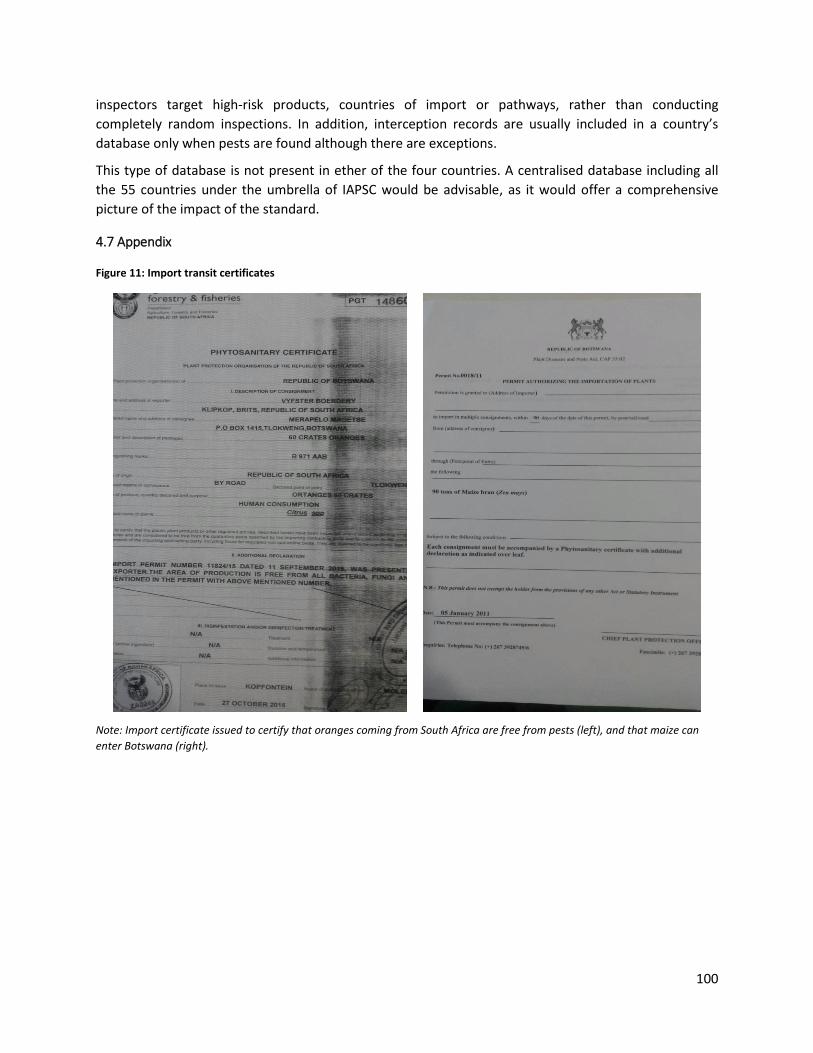
100
inspectors target high-risk products, countries of import or pathways, rather than conducting
completely random inspections. In addition, interception records are usually included in a country’s
database only when pests are found although there are exceptions.
This type of database is not present in ether of the four countries. A centralised database including all
the 55 countries under the umbrella of IAPSC would be advisable, as it would offer a comprehensive
picture of the impact of the standard.
4.7 Appendix
Figure 11: Import transit certificates
Note: Import certificate issued to certify that oranges coming from South Africa are free from pests (left), and that maize can
enter Botswana (right).
101
Figure 12: WPM used by the Horticultural Market to export fruits and vegetables
Note: The marks on the WPM used by the Horticultural Market are sometimes readable (left), sometimes not (right).
Figure 13: Repaired WPM and parts of treated WPM
Note: Reassembled WPM, which probably has non-treated parts but the presence of the stamp makes the WPM compliant with
ISPM 15 (left). Treated, disassembled WPM that will be used to repair broken WPM (right).
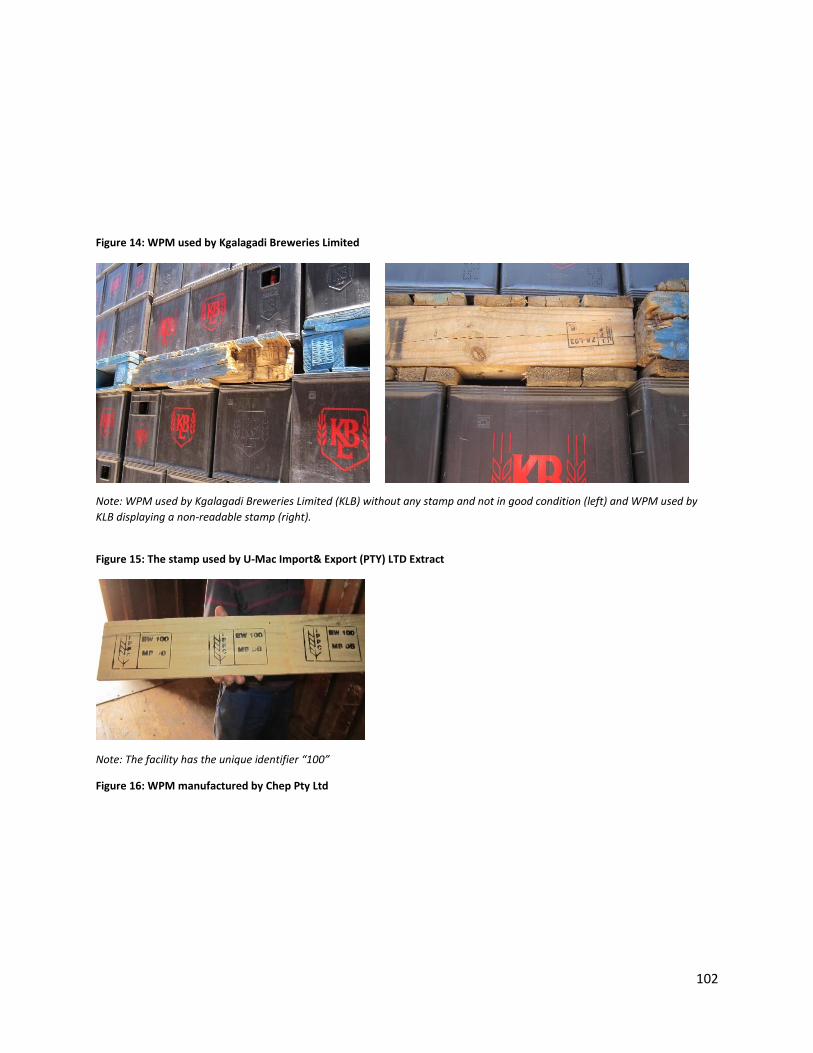
102
Figure 14: WPM used by Kgalagadi Breweries Limited
Note: WPM used by Kgalagadi Breweries Limited (KLB) without any stamp and not in good condition (left) and WPM used by
KLB displaying a non-readable stamp (right).
Figure 15: The stamp used by U-Mac Import& Export (PTY) LTD Extract
Note: The facility has the unique identifier “100”
Figure 16: WPM manufactured by Chep Pty Ltd
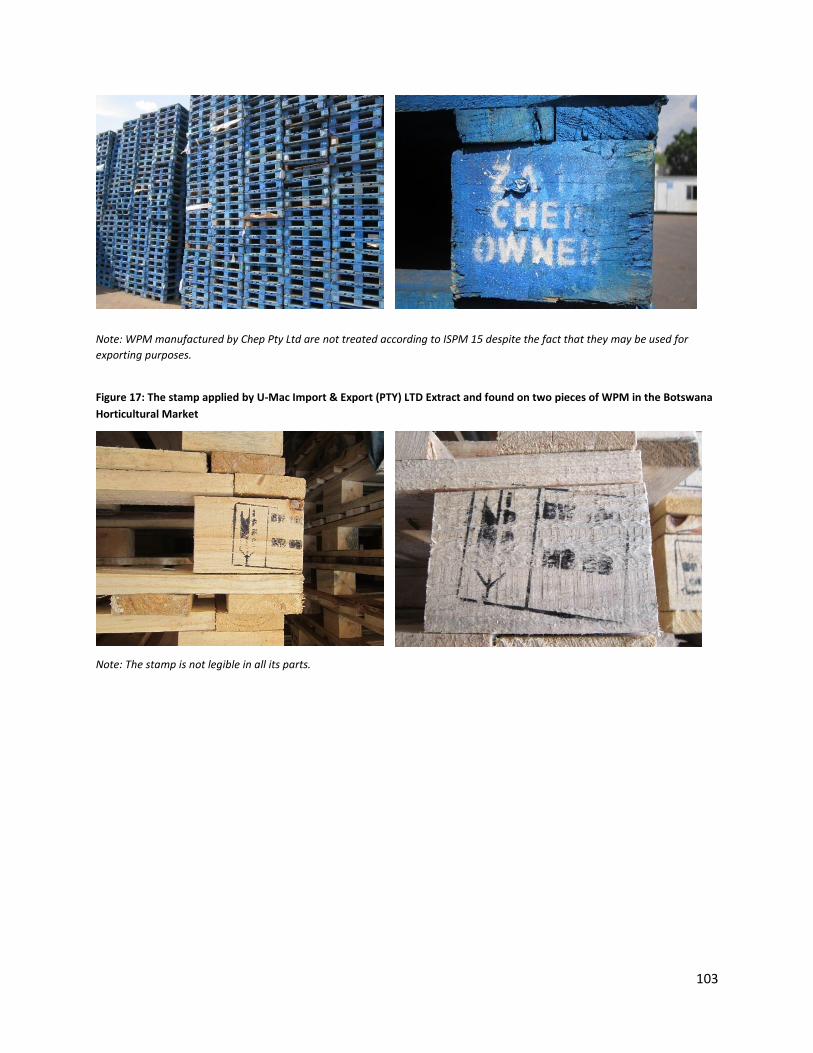
103
Note: WPM manufactured by Chep Pty Ltd are not treated according to ISPM 15 despite the fact that they may be used for
exporting purposes.
Figure 17: The stamp applied by U-Mac Import & Export (PTY) LTD Extract and found on two pieces of WPM in the Botswana
Horticultural Market
Note: The stamp is not legible in all its parts.
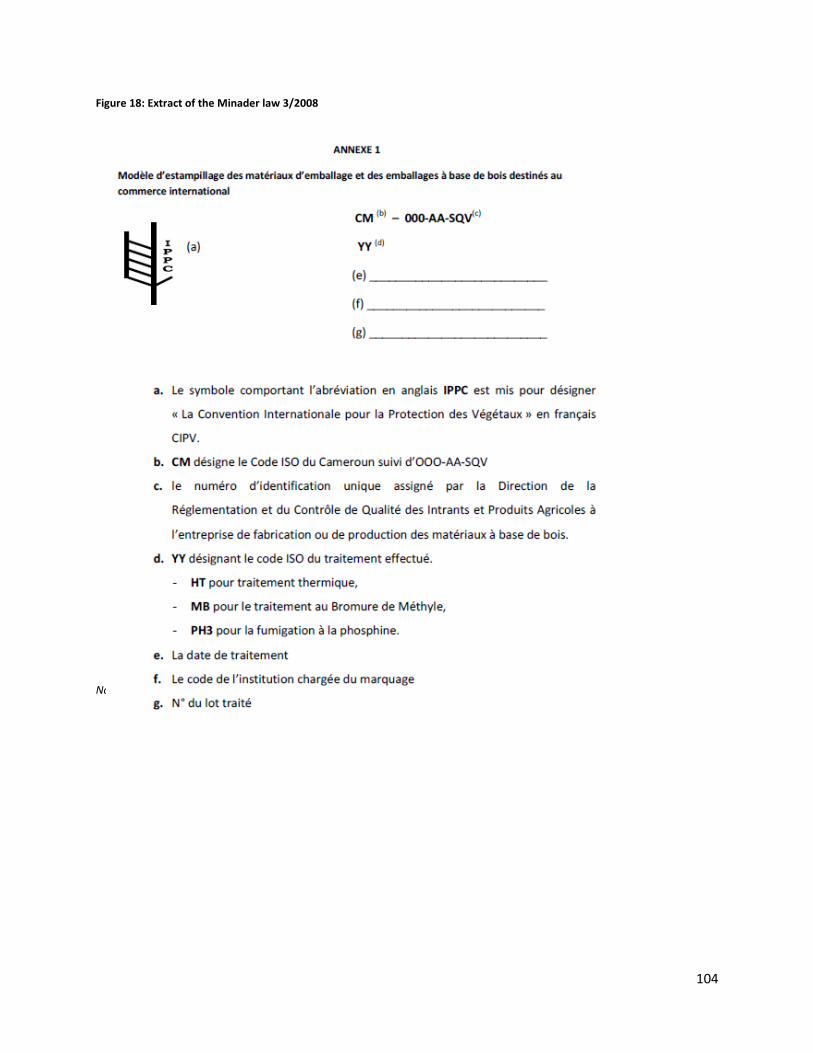
104
Figure 18: Extract of the Minader law 3/2008
Note: A copy of the Minader law is available upon request.
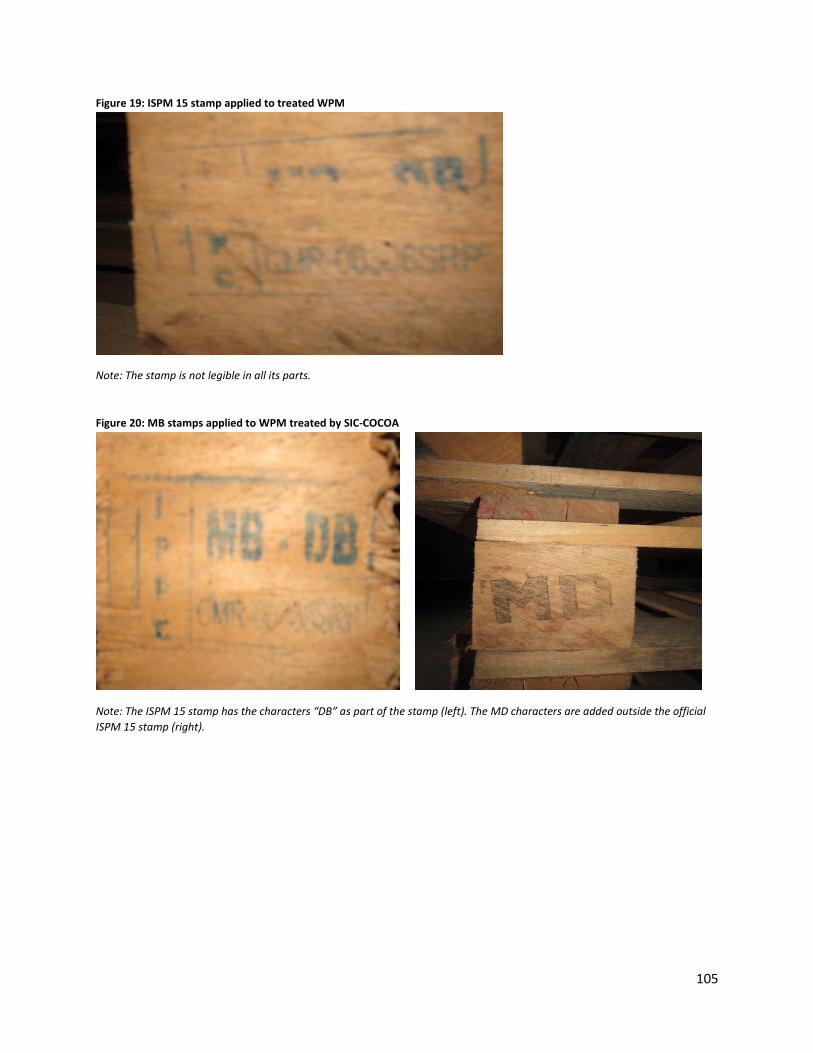
105
Figure 19: ISPM 15 stamp applied to treated WPM
Note: The stamp is not legible in all its parts.
Figure 20: MB stamps applied to WPM treated by SIC-COCOA
Note: The ISPM 15 stamp has the characters “DB” as part of the stamp (left). The MD characters are added outside the official
ISPM 15 stamp (right).
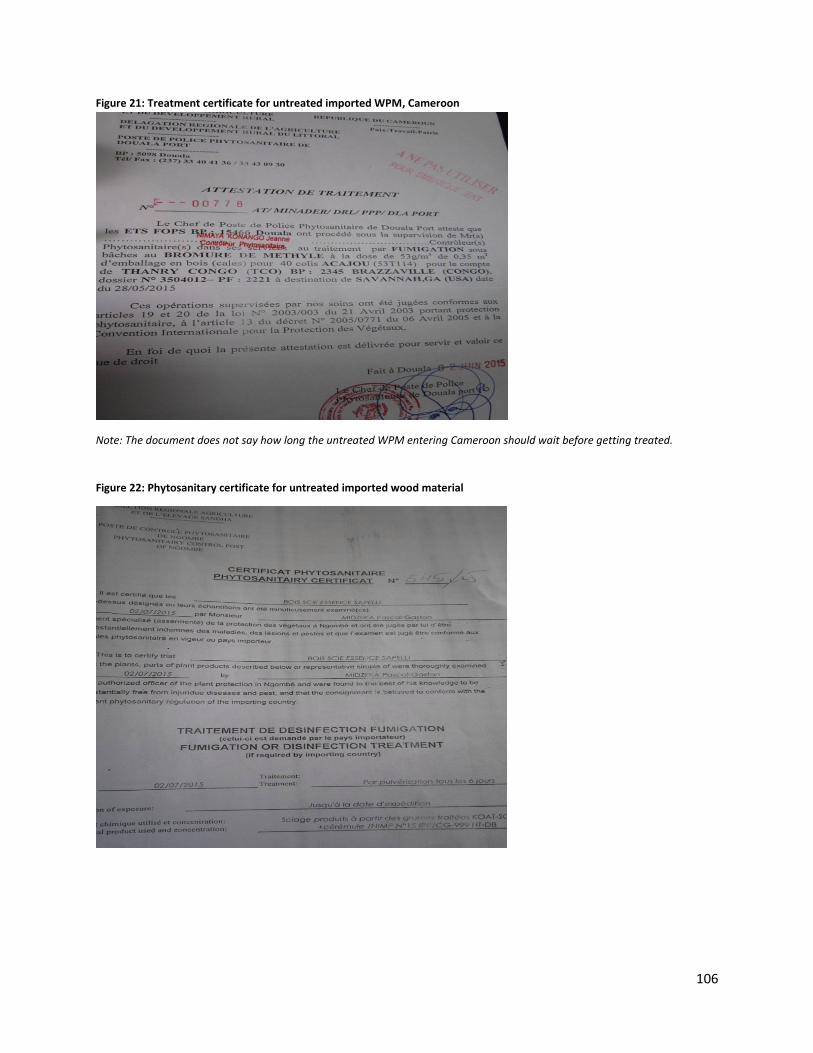
106
Figure 21: Treatment certificate for untreated imported WPM, Cameroon
Note: The document does not say how long the untreated WPM entering Cameroon should wait before getting treated.
Figure 22: Phytosanitary certificate for untreated imported wood material
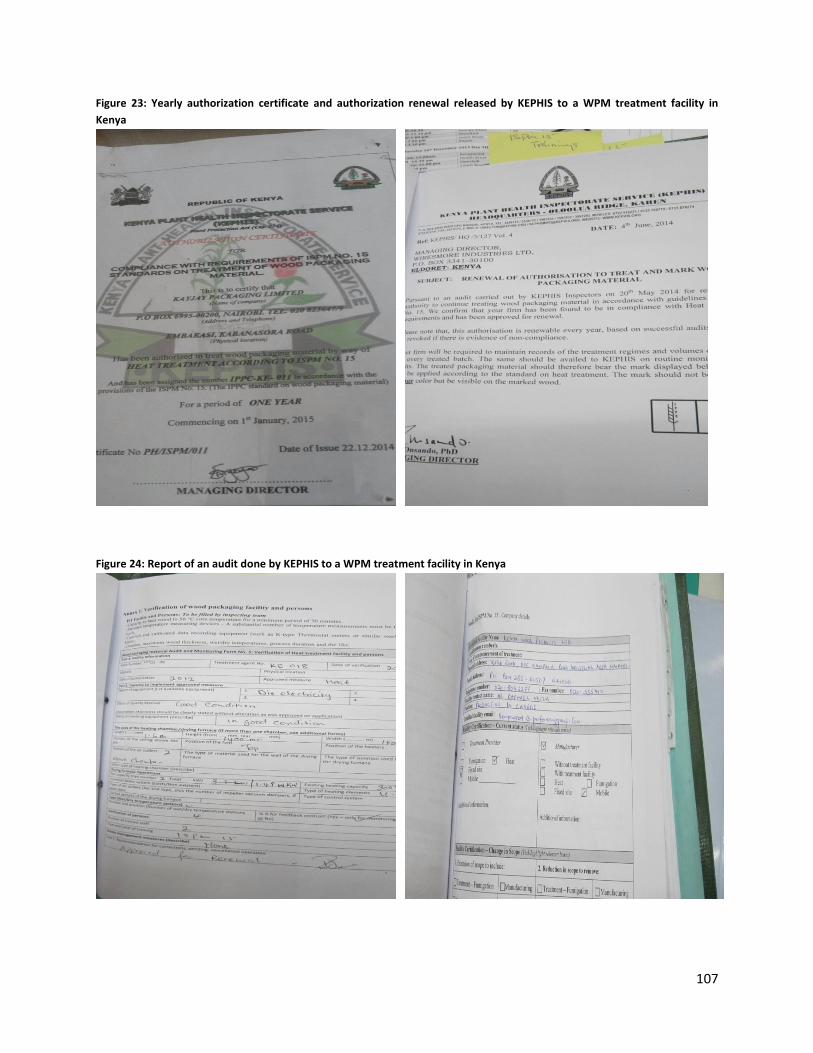
107
Figure 23: Yearly authorization certificate and authorization renewal released by KEPHIS to a WPM treatment facility in
Kenya
Figure 24: Report of an audit done by KEPHIS to a WPM treatment facility in Kenya
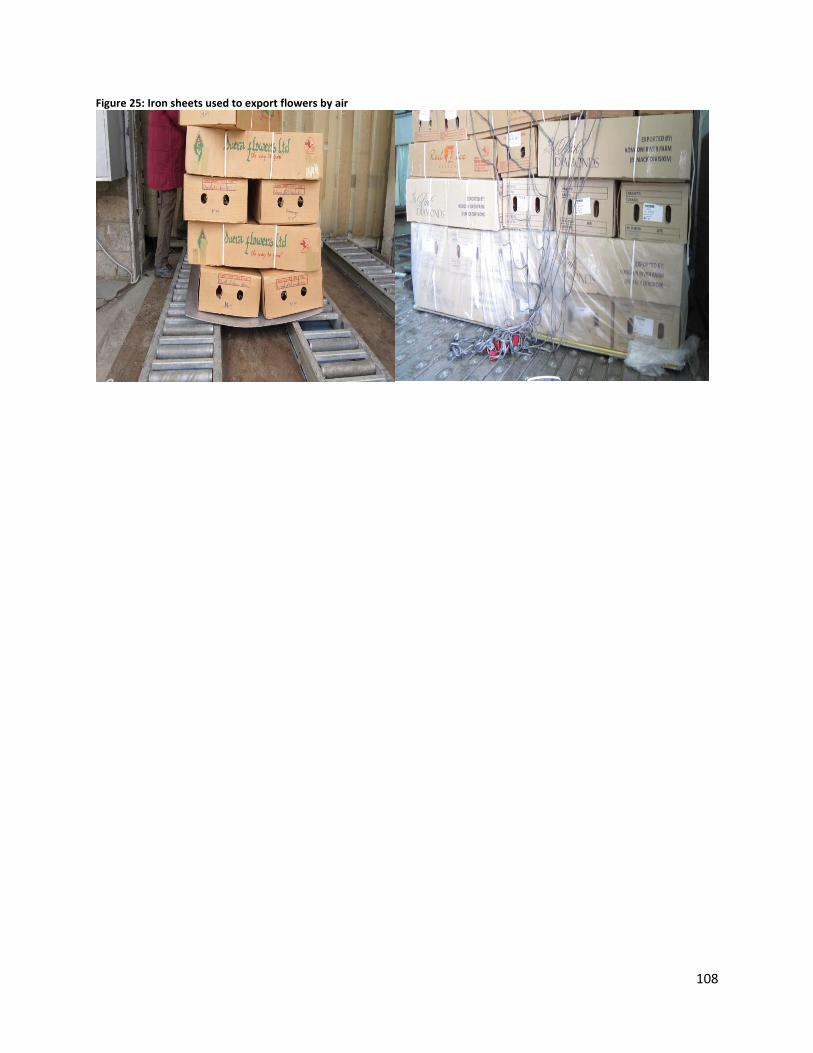
108
Figure 25: Iron sheets used to export flowers by air
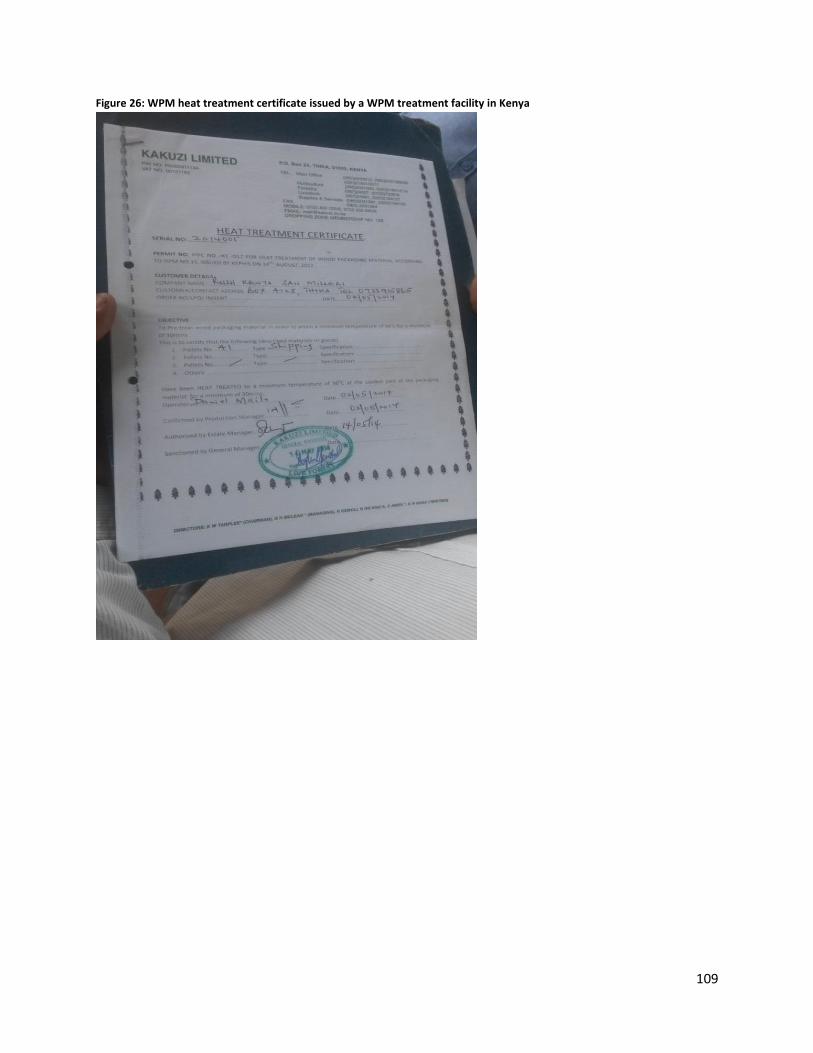
109
Figure 26: WPM heat treatment certificate issued by a WPM treatment facility in Kenya
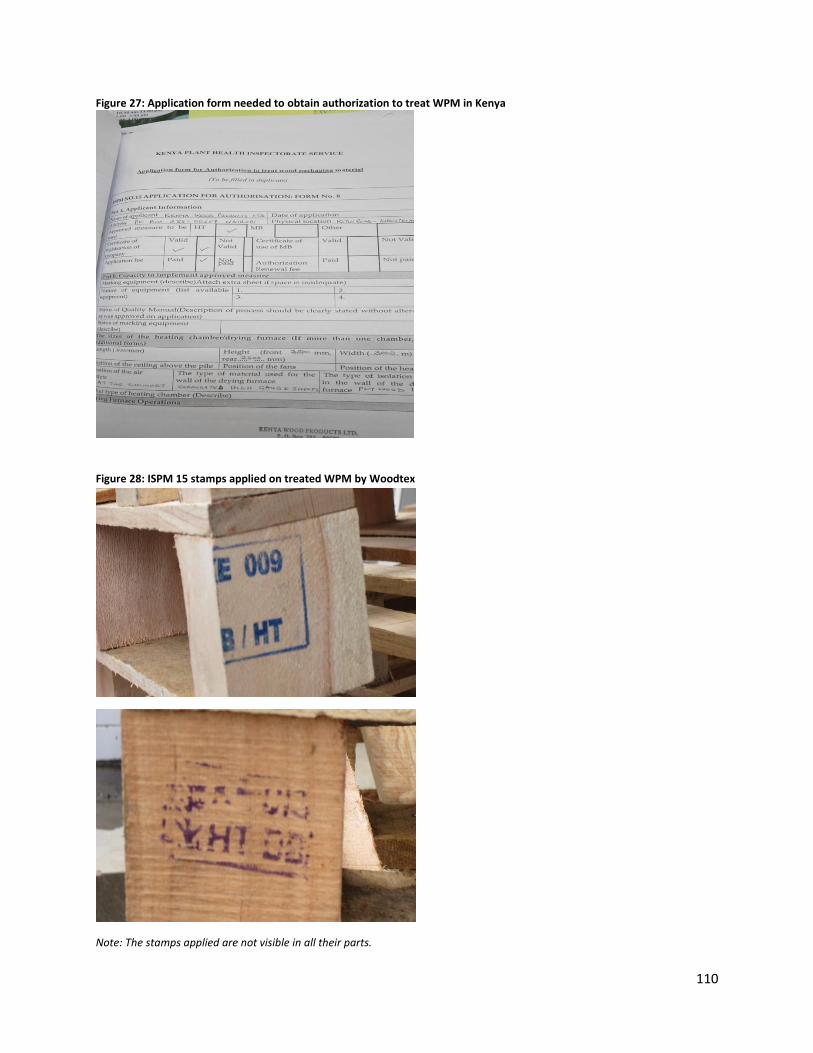
110
Figure 27: Application form needed to obtain authorization to treat WPM in Kenya
Figure 28: ISPM 15 stamps applied on treated WPM by Woodtex
Note: The stamps applied are not visible in all their parts.
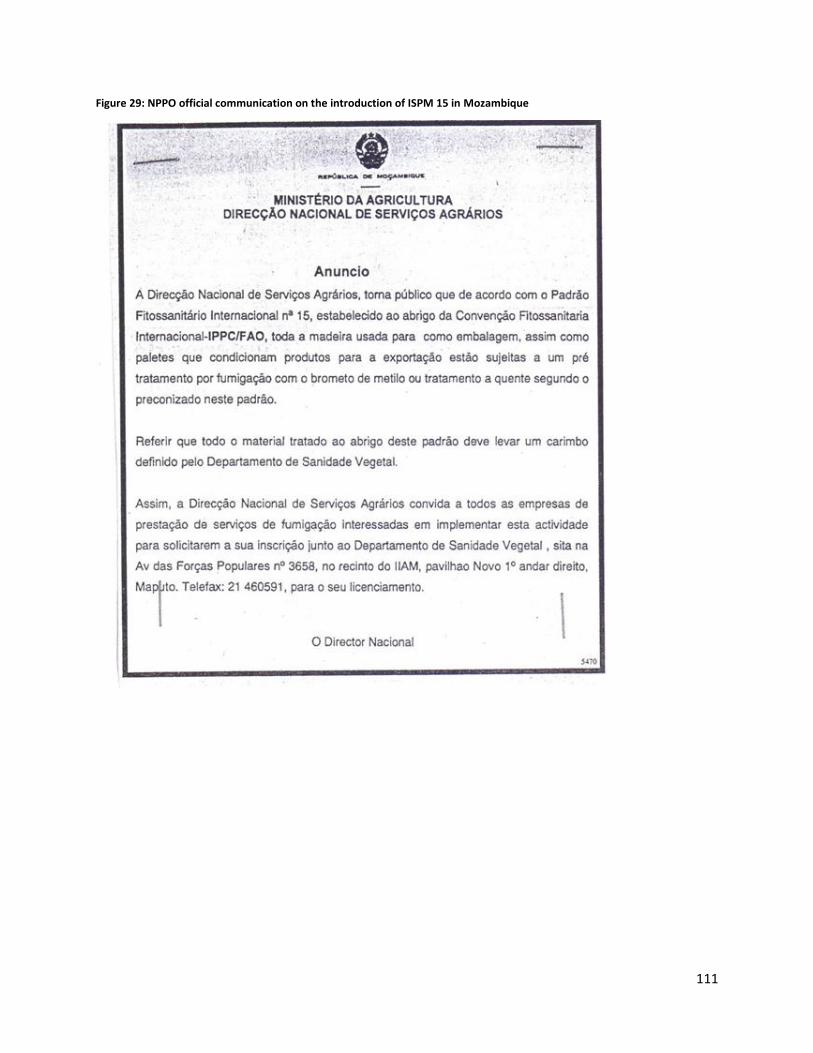
111
Figure 29: NPPO official communication on the introduction of ISPM 15 in Mozambique
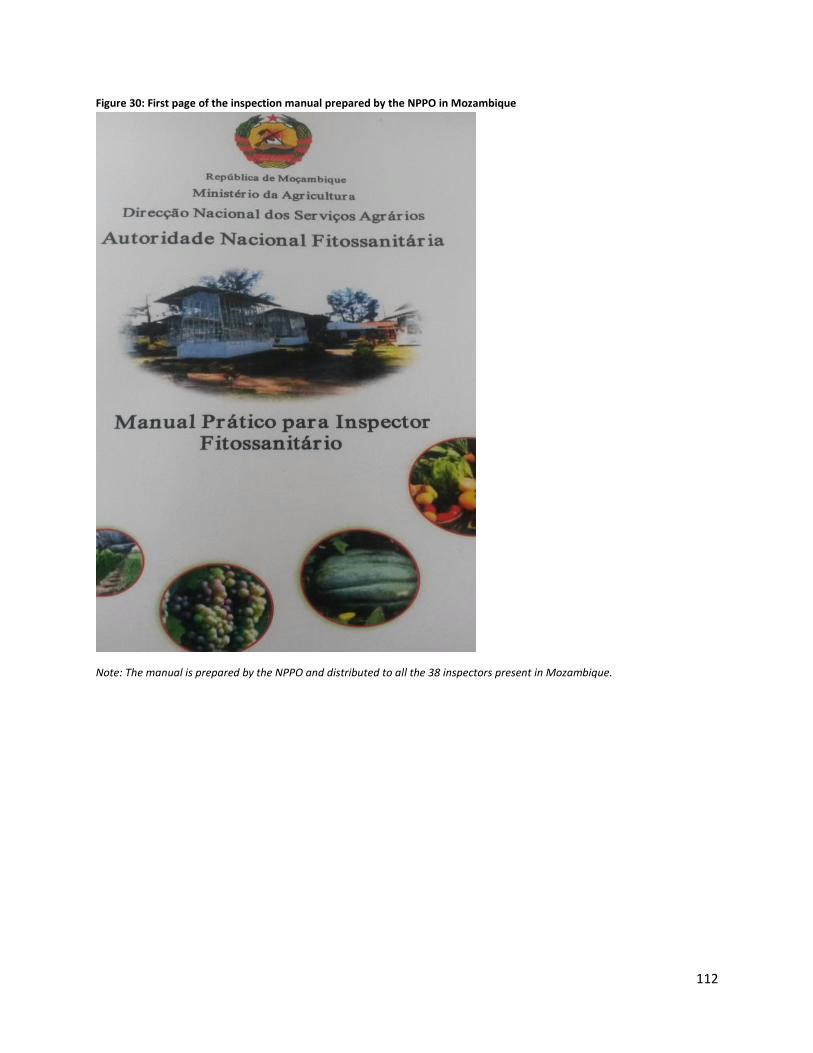
112
Figure 30: First page of the inspection manual prepared by the NPPO in Mozambique
Note: The manual is prepared by the NPPO and distributed to all the 38 inspectors present in Mozambique.
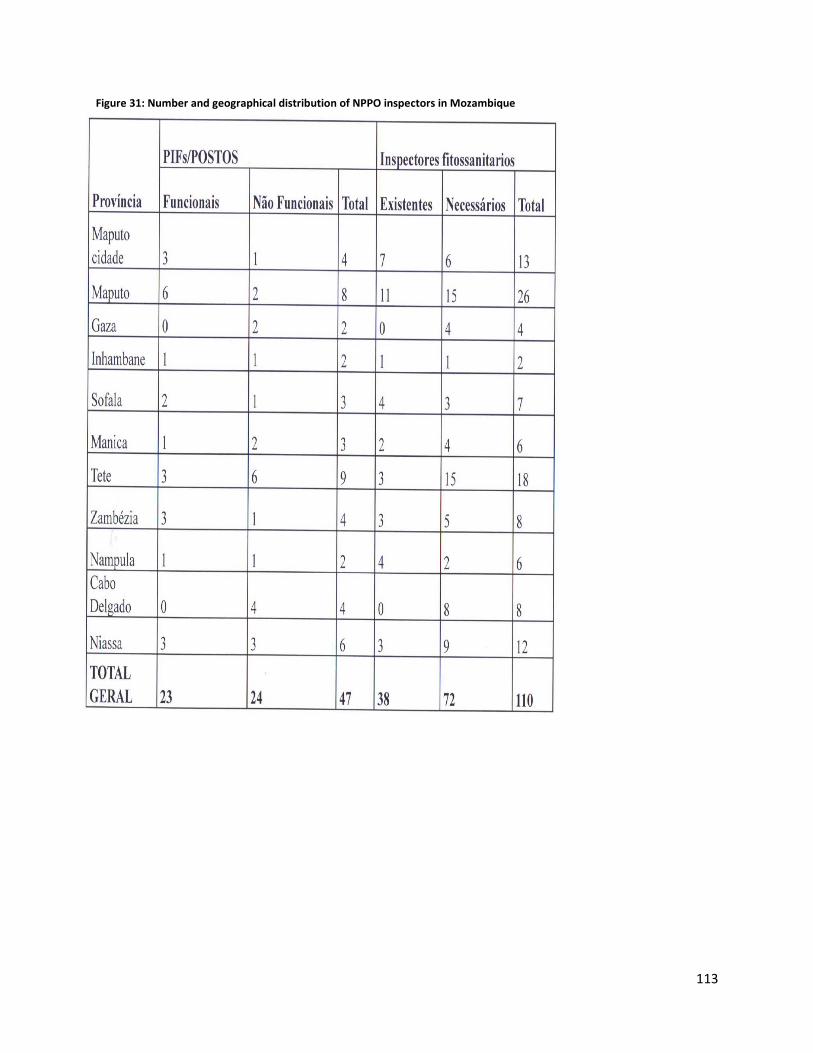
113
Figure 31: Number and geographical distribution of NPPO inspectors in Mozambique
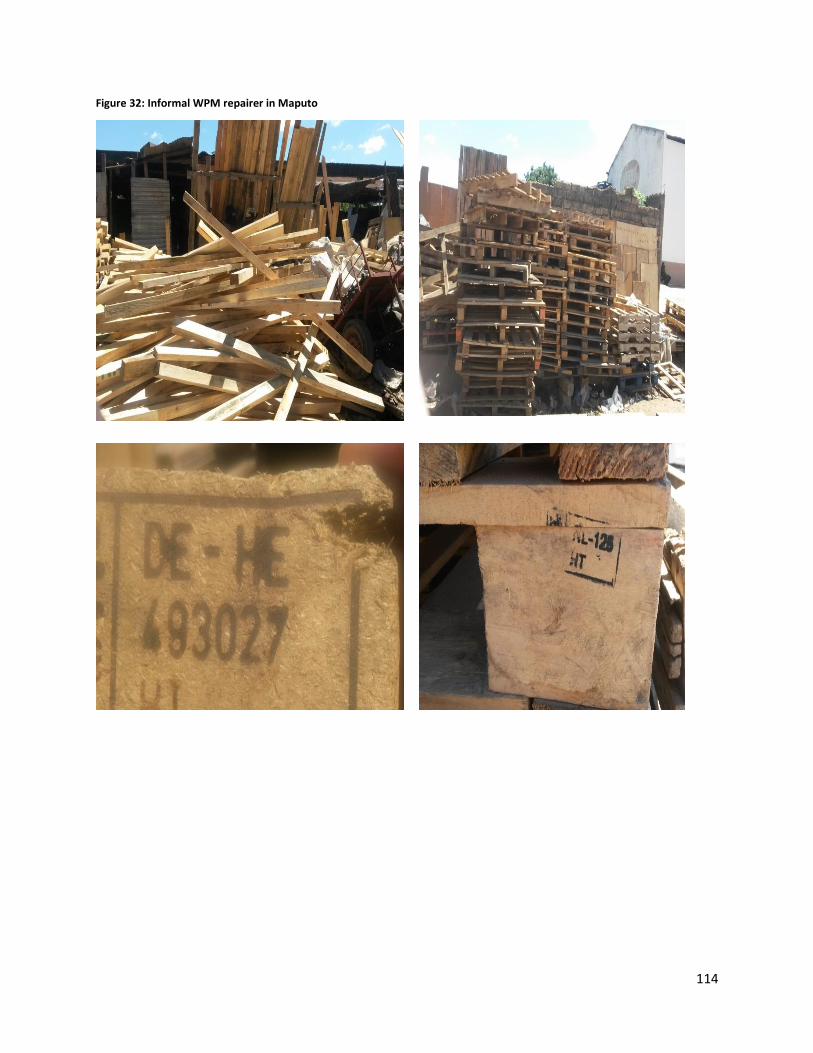
114
Figure 32: Informal WPM repairer in Maputo
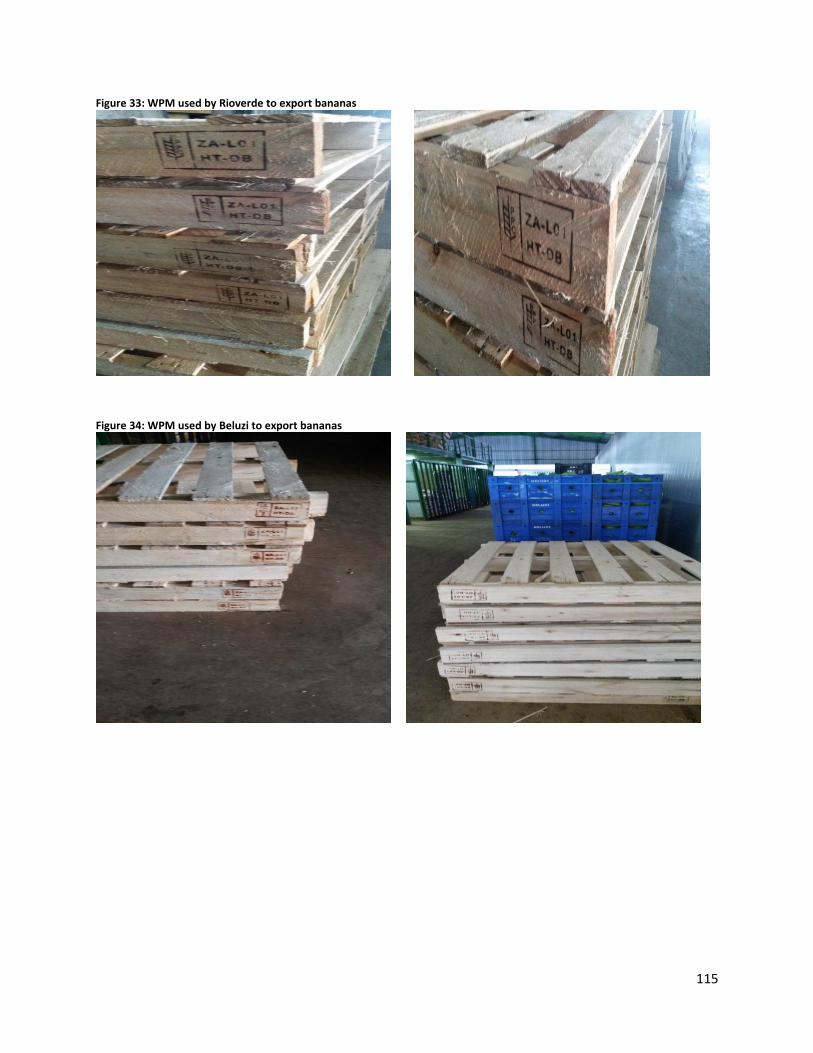
115
Figure 33: WPM used by Rioverde to export bananas
Figure 34: WPM used by Beluzi to export bananas
116
5. ISPM 15: Findings based on Macroeconomic Data
The purpose of the macroeconomic analysis is to estimate changes in trade volumes (exports/imports)
during the periods before and after the implementation of ISPM 15 across multiple commodity sectors.
Implementation of ISPM 15 may harm some export sectors, assuming that compliance increases the
costs of pallets and, hence, of exported products, rendering them less competitive on international
markets. Similarly, it can reduce the volume of imports for specific commodities by permitting imports
from a reduced number of ISPM 15-compliant trading partners. Such a reduction in imports can be the
combined result of reduced competition and higher import prices, of fewer trading partners to meet
demands, of the higher pallet costs that increase the price of the final product, or due to higher
administrative (e.g. inspection) costs of the importing country. It may also be the case that the ISPM 15
implementation has the opposite effect, for instance by creating opportunities for an increase in trade
volumes by allowing access to markets with stringent plant protection regulations (e.g. to other
countries that have already adopted the trade standard). Differences across exports/imports, as well as
across sectors, might also possibly reflect discrepancies in terms of how strictly the standard is enforced
and monitored for specific commodities. The sign and magnitude of the effect will be the focus of our
empirical analysis.
There is currently little empirical evidence on the trade effects of the implementation of ISPM 15, as
discussed in Section 3.4. The macroeconomic country level component of the project complements the
microeconomic cost-benefit analysis (Chapter 4) that probes into the effects of ISPM 15 compliance at
the firm level. It also complements the qualitative analysis of Chapter 3 that looks at the effectiveness of
implementation of the standard across the four case-study countries (Botswana, Cameroon, Kenya,
Mozambique). For example, the reduction in export volumes for certain sectors after the
implementation of the standard can be the combined result of (a) the increased cost of implementation
(and reduced competitiveness), (b) limited capacity to implement the standard effectively and (c) the
decision of some earlier exporters to abstain from using WPM that conforms to ISPM 15 requirements.
This chapter looks at the overall effect at the sectorial level but providing more in-depth information
regarding the underlying country-specific causes than Chapters 3 and 4.
5.1 Description of Macroeconomic Analysis
The macroeconomic analysis employs econometric methods to assess changes in trade volumes (for a
wide range of sectors) after the implementation of ISPM 15. We follow the conventional methodological
approach used for such purposes in the empirical trade literature, which is the estimation of trade
gravity models (see Clougherty and Grajek, 2014; De Santis, 2012). These allow estimating
simultaneously the statistical correlation (association) of these bilateral trade flows with several socio-
economic and geographical factors. Three gravity models were estimated for 86 different types of
commodities and for each of the case-study countries:
1. A parsimonious (simple) “fixed effects” model, which can be summarized by the following
specification:
Vijkt = b0 + b1 Incomeijt + b2 ISPM 15it + ijt , (1)
117
where Vijkt refers to the value of trade (imports/exports) in product type k from/to any case-study
country i to/from any trade partner country j at time t, Incomeijt captures the real GDP size of both
trading partners i and j (which, hence, controls for the fact that trade tends to expand in accordance
with the increasing size of both exporting and importing economies), and ISPM 15it is a time dummy
taking the value of 1 for the years corresponding to the year case-study country implemented the
standard. ijt captures the unexplained component of the estimated statistical relationship (i.e. the part
of the variation in the dependent variable, the sector-specific trade volume, that cannot be explained by
either). All the b’s correspond to the estimated coefficients that capture the size of the correlation
between trade flows and other explanatory variables. Fixed effect estimators control for the effects of
time invariant variables (in other words, fixed effects models impose time independent effects for each
entity, i.e. country combination, that are possibly correlated with the explanatory variables) and are
typically the preferred analytical tool in econometric analysis, since they are able to control for often
important (but often unobservable and hence omitted) time invariant factors (e.g. cultural
characteristics).
Particular attention will be given to the coefficient b2, which measures changes in trade volumes during
the periods before and after implementation of ISPM 15. We hypothesize that the sign of this coefficient
can be either positive or negative, dependent on a number of factors. Implementation of ISPM 15 can
harm some exporting sectors, assuming that compliance increases the costs of pallets and, hence, of
exported products, rendering them less competitive in international markets. It can also be the case that
the implementation has the opposite effect, for instance by creating opportunities for an increase in
export volumes by allowing access to markets with stringent plant protection regulations. It can also
reduce the volume of imports for specific commodities by permitting imports only from a reduced
number of ISPM 15-compliant trading partners. Such a reduction in imports can be the combined result
of reduced competition and higher import prices, of fewer trading partners to meet demands, of the
higher WPM costs passed on to the price of the final product, or due to higher administrative (e.g.
inspection) costs of the importing country. All trade volumes will be measured in a natural logarithmic
scale, and, therefore, the b2 coefficient will capture the percentage change between the periods before
and after ISPM 15 implementation.
2. A richer “fixed effects” model, which includes a more sophisticated specification with
additional explanatory factors:
Vijkt = b0 + b1 Incomeijt + b2 ISPM 15it + b3 Xjt + ijt , (2)
where again, the volume of bilateral trade will depend on (a) the size of economic activity (Income); (b)
ISPM 15 implementation of the case-study country and a vector X of additional control variables. These
additional explanatory factors include: (c) an interaction variable that examines how non-
implementation of ISPM 15 in the case-study country can interact with ISPM 15 implementation in the
export country to potentially reduce export volumes (variable: ISPM 15 partner). For the case of exports,
this variable takes a value of 1 for the years when the trading partner implemented ISPM 15 but the
case-study country had not done so. For the case of imports, the corresponding variable takes a value of
118
1 when the case-study country implemented ISPM 15 but the trading partner had not done so. Last, this
richer model includes an institutional variable that relates to the extent of corruption in the export
country (Transparency). The institutional variable aims to capture whether the case-study countries
prefer to trade with countries characterized by higher levels of transparency in transactions (see
Anderson and Marcouiller, 2002). Again, the fixed effect estimators control for the effects of time
invariant variables (in other words, fixed effects models impose time independent effects for each entity
(country combination) that are possibly correlated with the explanatory variables).
3. A random effects model, that includes, in addition to the variables of Model 2, an additional
set of time-invariant factors:
Vijkt = b0 + b1 Incomeijt + b2 ISPM 15it + b3 Xjt + b4 Zijt + ijt , (3)
where the vector Z captures the additional time-invariant variables, namely: (a) Distance which is a
variable capturing distance between countries (distance between capital cities in km) – we expect
distance to correlate negatively with trade flows, as a result of larger transportation costs; (b) a dummy
variable taking a value of 1 when the case-study country and trade partner share borders (variable
Borders) (we expect countries with common borders to trade more with one another, other things
equal); (c) a dummy variable taking a value of 1 when trade partners share a common language as this
may facilitate trade (variable Language); and (d) a dummy variable taking a value of 1 in cases of
historical links between colonies and colonial powers, which may increase trade for involved parties
(variable Colony). For gravity models using similar geographical variables see the papers by Gómez-
Herrera (2013) and Lohmann (2013). All the other explanatory variables appearing in Model 2 (fixed
effects richer model) are also included in the random effects model. Contrary to fixed effects estimators,
random effects models do not impose time-independent effects for each entity (country combination)
that are possibly correlated with the explanatory variables. In other words, we assume that variation in
the explanatory variables arises from random causes and is not systematically related to the country-
combinations over time.
The second model (fixed effects richer specification) provides the most reliable estimators (although
results are shown also for the more parsimonious fixed effects and random effects specifications for key
export and import commodities). Random effects estimations are based on the assumption that
individual-specific effects are uncorrelated with independent variables, an assumption that is often
violated in panel data settings (in other words, the corresponding Hausman tests conducted are in
favour of the fixed effects estimators). The first model is likely to provide biased estimators as a result of
an omitted variable bias (i.e. a restricted model with few variables is likely to omit key explanatory
factors and, hence, bias either downwards or upwards of the estimated coefficients of the included
variables). All models make use of robust standard errors that correct for any heteroscedasticity effects
on statistical significance.
119
5.2 Description of Macroeconomic Data
The research team has compiled data from multiple sources such as UN Comtrade dataset, World
Development Indicators, and World Governance Indicators. Below is a detailed description of all
variables used in the macroeconomic analysis.
Trade flows: These have been captured by the value of imports and exports across 86 commodity
categories from/to any case-study country and to/from any trade partner country. These bilateral
annual trade flows are expressed in a natural logarithmic scale and are available for the years: 1992–
2013 for Kenya, 1994–2013 for Mozambique, 1995–2013 for Cameroon, and 2000–2013 for Botswana.
All data are available from the UN International Trade Statistics Database, commonly known as the
Comtrade website (https://comtrade.un.org).
ISPM 15: Data on ISPM 15 implementation for all countries. The ISPM 15 variable is a time dummy
taking the value of 1 for the years corresponding to the implementation year of the standard by each
case-study country. The variable ISPM 15(partner) is an interaction variable that examines how non-
implementation of ISPM 15 in the case-study country can interact with ISPM 15 implementation in the
export country to potentially reduce export volumes. For the case of exports, this variable takes a value
of 1 for the years when the trading partner implemented ISPM 15 but the case-study country had not
done so. For the case of imports, the corresponding variable takes a value of 1 when the case-study
country adopted ISPM 15 standard but the trading partner had not done so.
Income: Data on real GDP in 2010 constant prices. In all regressions, the natural logarithm of the
product of the GDP size (of pairs of trading partners) has been used. Data are available from the World
Development Indicators (http://data.worldbank.org/data-catalog/world-development-indicators).
Transparency: An institutional variable that relates to the extent of corrupt practices in the export
partner economy. This is a control of corruption index that captures perceptions of the extent to which
public power is exercised for private gain, including both petty and grand forms of corruption, as well as
"capture" (appropriation) of the state by elites and private interests. It is measured in a −2.5 to 2.5 scale
where 2.5 corresponds to the lowest level of corruption and −2.5 corresponds to the highest level of
corruption. Data are available from the Worldwide Governance Indicators (www.govindicators.org).
Borders: A dummy variable taking a value of 1 when the case-study country and trading partner share
borders.
Language: A dummy variable taking a value of 1 when the trading partners share a common language.
Distance: A variable capturing distance between the capital cities of partner countries (expressed in km
and logarithmic scale).
Colony: A dummy variable taking a value of 1 in cases of historical links between colonies and colonial
powers.
The descriptive statistics for all variables according to case-study country are available in Table 12 -
Table 15.
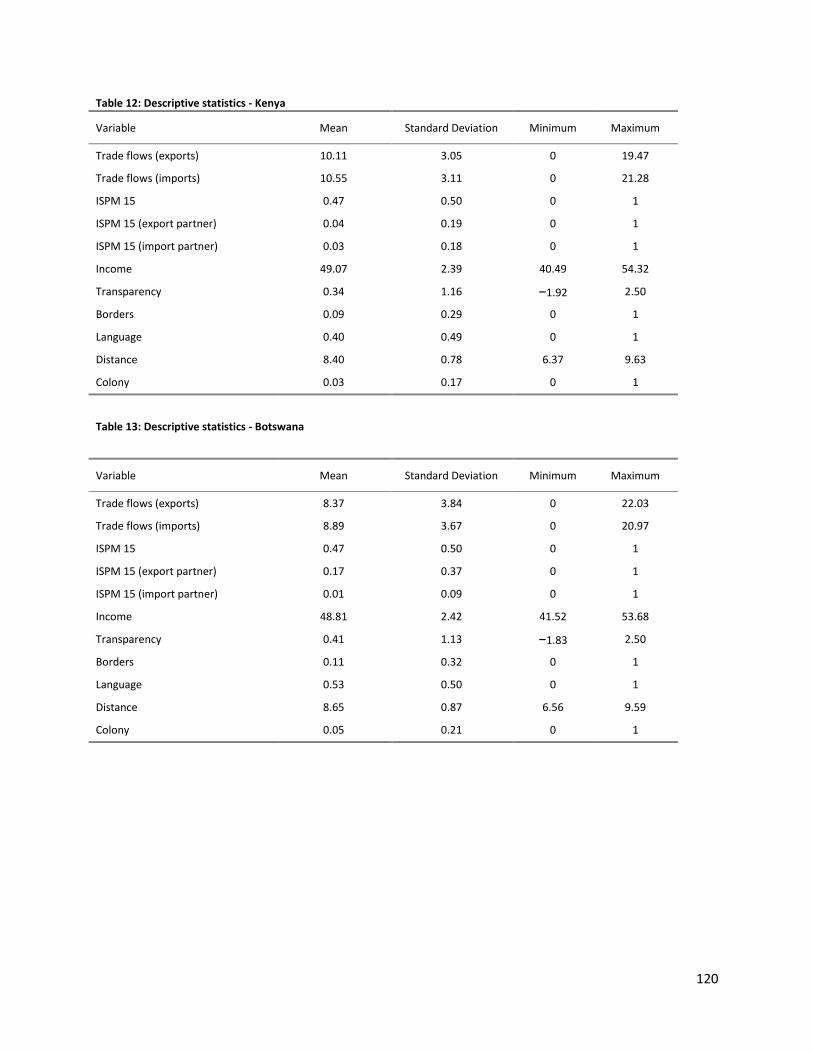
120
Table 12: Descriptive statistics - Kenya
Variable Mean Standard Deviation Minimum Maximum
Trade flows (exports) 10.11 3.05 0 19.47
Trade flows (imports) 10.55 3.11 0 21.28
ISPM 15 0.47 0.50 0 1
ISPM 15 (export partner) 0.04 0.19 0 1
ISPM 15 (import partner) 0.03 0.18 0 1
Income 49.07 2.39 40.49 54.32
Transparency 0.34 1.16 −1.92 2.50
Borders 0.09 0.29 0 1
Language 0.40 0.49 0 1
Distance 8.40 0.78 6.37 9.63
Colony 0.03 0.17 0 1
Table 13: Descriptive statistics - Botswana
Variable Mean Standard Deviation Minimum Maximum
Trade flows (exports) 8.37 3.84 0 22.03
Trade flows (imports) 8.89 3.67 0 20.97
ISPM 15 0.47 0.50 0 1
ISPM 15 (export partner) 0.17 0.37 0 1
ISPM 15 (import partner) 0.01 0.09 0 1
Income 48.81 2.42 41.52 53.68
Transparency 0.41 1.13 −1.83 2.50
Borders 0.11 0.32 0 1
Language 0.53 0.50 0 1
Distance 8.65 0.87 6.56 9.59
Colony 0.05 0.21 0 1
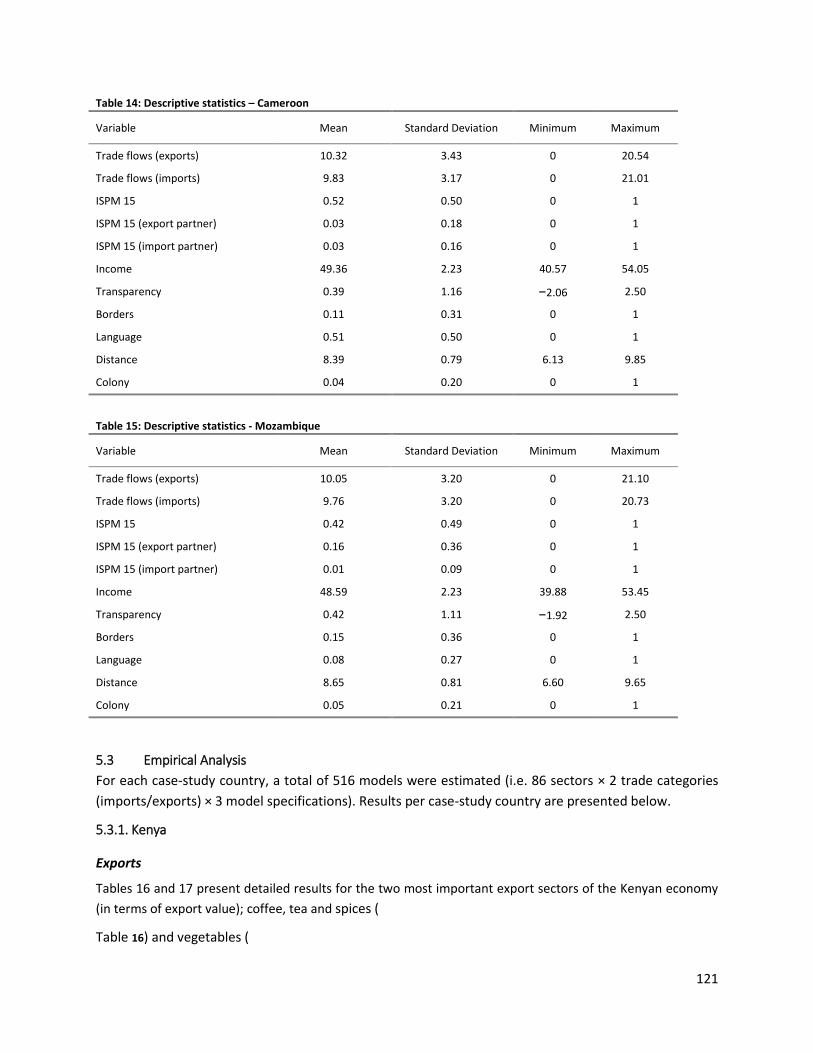
121
Table 14: Descriptive statistics – Cameroon
Variable Mean Standard Deviation Minimum Maximum
Trade flows (exports) 10.32 3.43 0 20.54
Trade flows (imports) 9.83 3.17 0 21.01
ISPM 15 0.52 0.50 0 1
ISPM 15 (export partner) 0.03 0.18 0 1
ISPM 15 (import partner) 0.03 0.16 0 1
Income 49.36 2.23 40.57 54.05
Transparency 0.39 1.16 −2.06 2.50
Borders 0.11 0.31 0 1
Language 0.51 0.50 0 1
Distance 8.39 0.79 6.13 9.85
Colony 0.04 0.20 0 1
Table 15: Descriptive statistics - Mozambique
Variable Mean Standard Deviation Minimum Maximum
Trade flows (exports) 10.05 3.20 0 21.10
Trade flows (imports) 9.76 3.20 0 20.73
ISPM 15 0.42 0.49 0 1
ISPM 15 (export partner) 0.16 0.36 0 1
ISPM 15 (import partner) 0.01 0.09 0 1
Income 48.59 2.23 39.88 53.45
Transparency 0.42 1.11 −1.92 2.50
Borders 0.15 0.36 0 1
Language 0.08 0.27 0 1
Distance 8.65 0.81 6.60 9.65
Colony 0.05 0.21 0 1
5.3 Empirical Analysis
For each case-study country, a total of 516 models were estimated (i.e. 86 sectors × 2 trade categories
(imports/exports) × 3 model specifications). Results per case-study country are presented below.
5.3.1. Kenya
Exports
Tables 16 and 17 present detailed results for the two most important export sectors of the Kenyan economy
(in terms of export value); coffee, tea and spices (
Table 16) and vegetables (
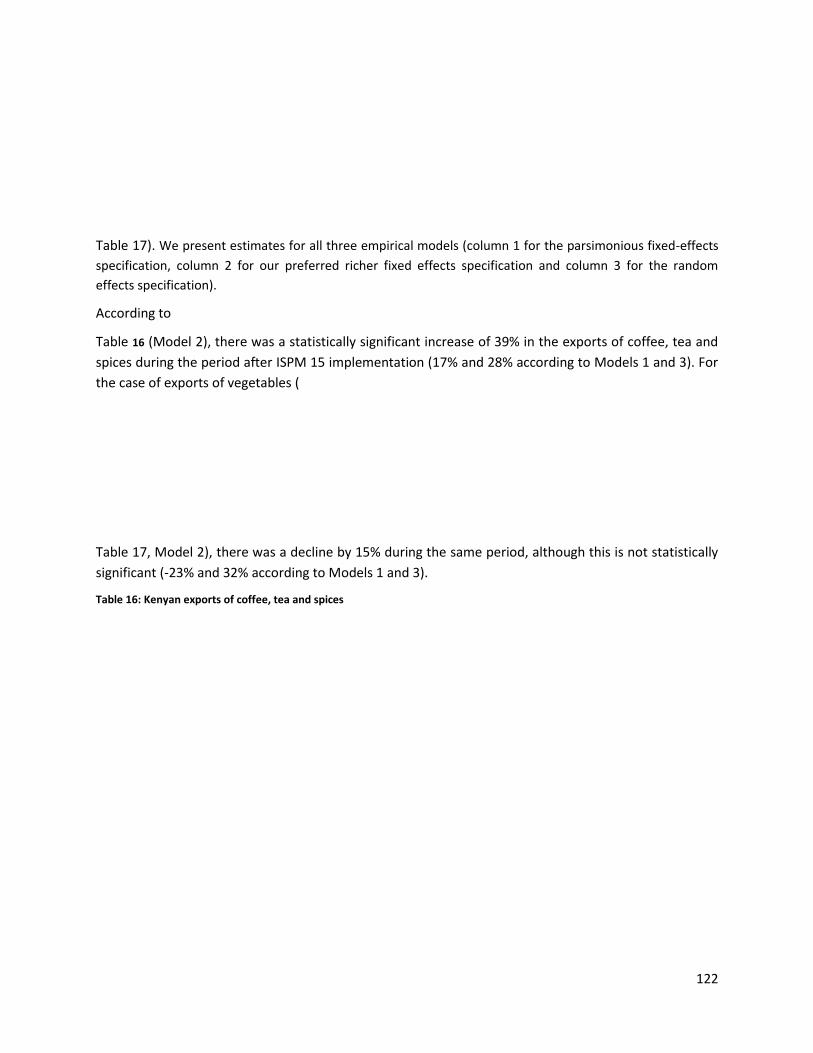
122
Table 17). We present estimates for all three empirical models (column 1 for the parsimonious fixed-effects
specification, column 2 for our preferred richer fixed effects specification and column 3 for the random
effects specification).
According to
Table 16 (Model 2), there was a statistically significant increase of 39% in the exports of coffee, tea and
spices during the period after ISPM 15 implementation (17% and 28% according to Models 1 and 3). For
the case of exports of vegetables (
Table 17, Model 2), there was a decline by 15% during the same period, although this is not statistically
significant (-23% and 32% according to Models 1 and 3).
Table 16: Kenyan exports of coffee, tea and spices
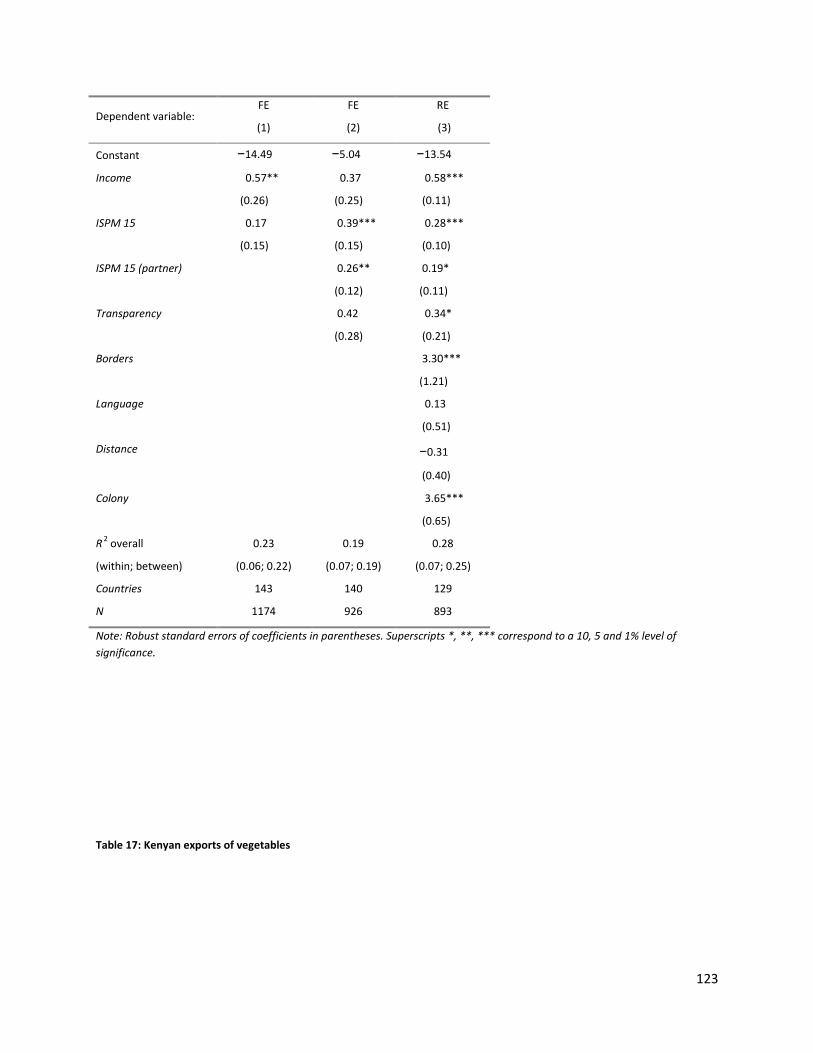
123
Dependent variable: FE
(1)
FE
(2)
RE
(3)
Constant −14.49 −5.04 −13.54
Income
0.57**
(0.26)
0.37
(0.25)
0.58***
(0.11)
ISPM 15
0.17
(0.15)
0.39***
(0.15)
0.28***
(0.10)
ISPM 15 (partner)
0.26**
(0.12)
0.19*
(0.11)
Transparency
0.42
(0.28)
0.34*
(0.21)
Borders
3.30***
(1.21)
Language
0.13
(0.51)
Distance
−0.31
(0.40)
Colony
3.65***
(0.65)
R2 overall
(within; between)
0.23
(0.06; 0.22)
0.19
(0.07; 0.19)
0.28
(0.07; 0.25)
Countries 143 140 129
N 1174 926 893
Note: Robust standard errors of coefficients in parentheses. Superscripts *, **, *** correspond to a 10, 5 and 1% level of
significance.
Table 17: Kenyan exports of vegetables
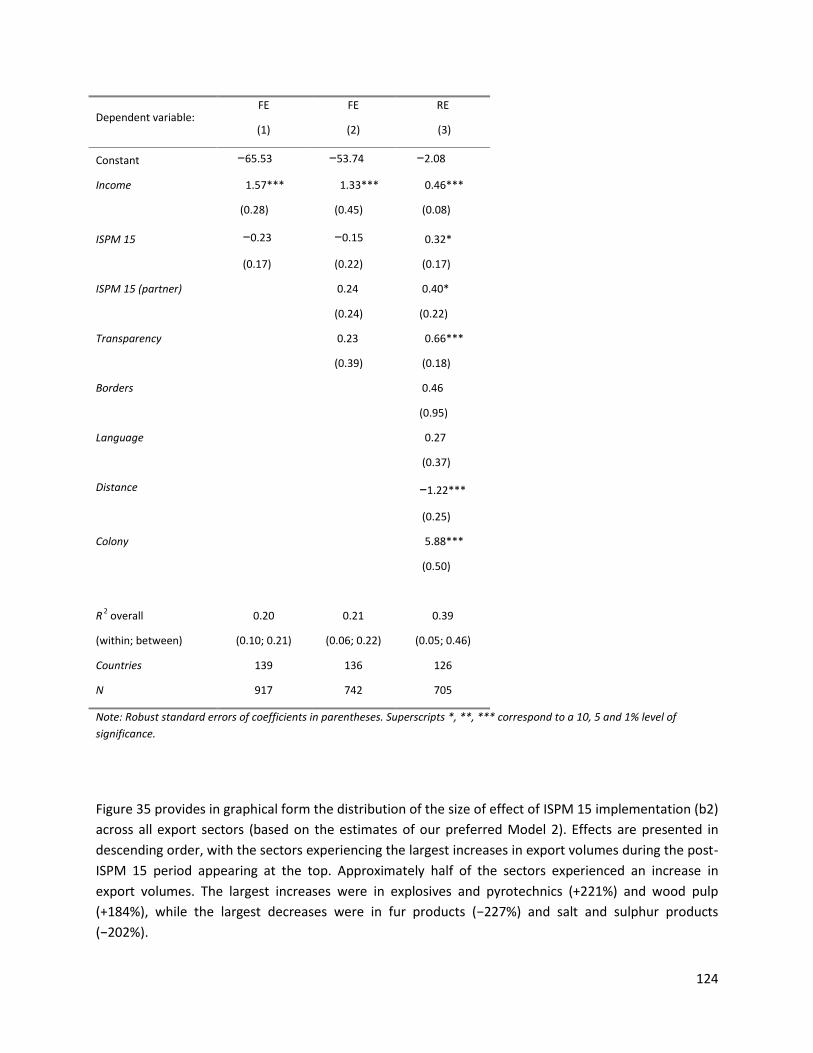
124
Dependent variable: FE
(1)
FE
(2)
RE
(3)
Constant −65.53 −53.74 −2.08
Income
1.57***
(0.28)
1.33***
(0.45)
0.46***
(0.08)
ISPM 15
−0.23
(0.17)
−0.15
(0.22)
0.32*
(0.17)
ISPM 15 (partner)
0.24
(0.24)
0.40*
(0.22)
Transparency
0.23
(0.39)
0.66***
(0.18)
Borders
0.46
(0.95)
Language
0.27
(0.37)
Distance
−1.22***
(0.25)
Colony
5.88***
(0.50)
R2 overall
(within; between)
0.20
(0.10; 0.21)
0.21
(0.06; 0.22)
0.39
(0.05; 0.46)
Countries 139 136 126
N 917 742 705
Note: Robust standard errors of coefficients in parentheses. Superscripts *, **, *** correspond to a 10, 5 and 1% level of
significance.
Figure 35 provides in graphical form the distribution of the size of effect of ISPM 15 implementation (b2)
across all export sectors (based on the estimates of our preferred Model 2). Effects are presented in
descending order, with the sectors experiencing the largest increases in export volumes during the post-
ISPM 15 period appearing at the top. Approximately half of the sectors experienced an increase in
export volumes. The largest increases were in explosives and pyrotechnics (+221%) and wood pulp
(+184%), while the largest decreases were in fur products (−227%) and salt and sulphur products
(−202%).
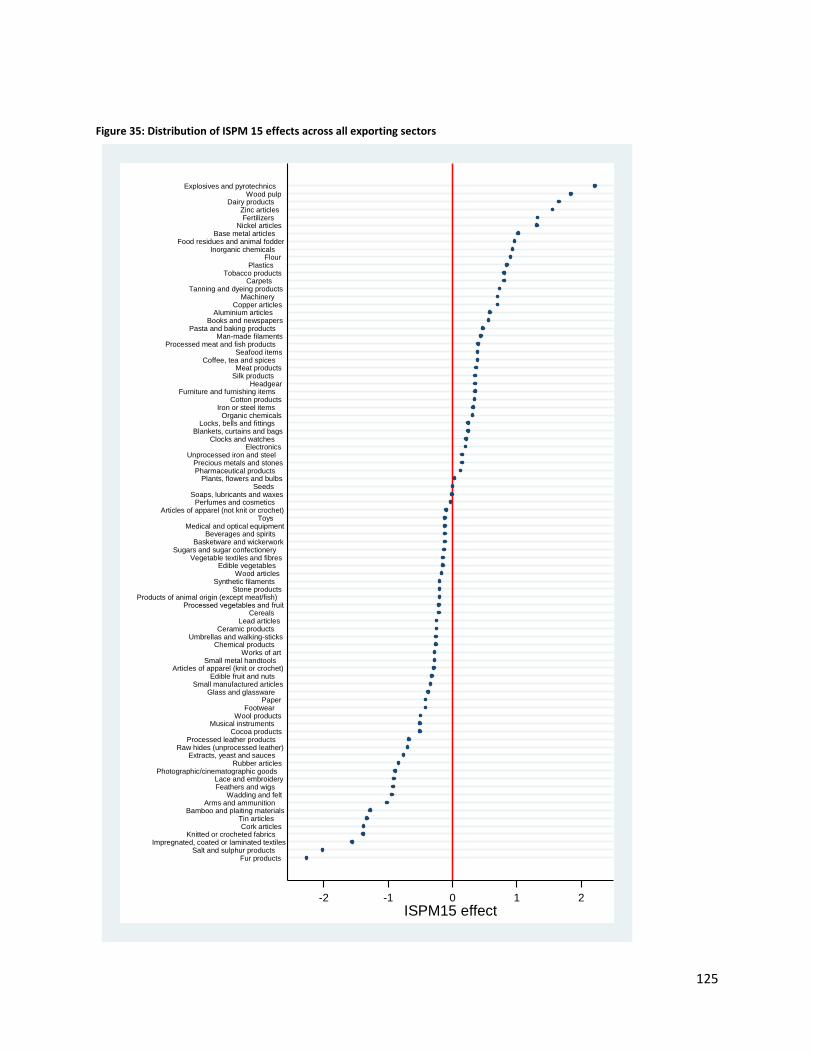
125
Figure 35: Distribution of ISPM 15 effects across all exporting sectors
-2 -1 0 1 2
ISPM15 effect
Fur productsSalt and sulphur products
Impregnated, coated or laminated textilesKnitted or crocheted fabrics
Cork articlesTin articles
Bamboo and plaiting materialsArms and ammunition
Wadding and feltFeathers and wigsLace and embroidery
Photographic/cinematographic goodsRubber articles
Extracts, yeast and saucesRaw hides (unprocessed leather)
Processed leather productsCocoa products
Musical instrumentsWool products
FootwearPaper
Glass and glasswareSmall manufactured articles
Edible fruit and nutsArticles of apparel (knit or crochet)
Small metal handtoolsWorks of art
Chemical productsUmbrellas and walking-sticks
Ceramic productsLead articles
Cereals Processed vegetables and fruit
Products of animal origin (except meat/fish)Stone products
Synthetic filamentsWood articles
Edible vegetablesVegetable textiles and fibres
Sugars and sugar confectioneryBasketware and wickerwork
Beverages and spiritsMedical and optical equipment
ToysArticles of apparel (not knit or crochet)
Perfumes and cosmeticsSoaps, lubricants and waxes
SeedsPlants, flowers and bulbs
Pharmaceutical productsPrecious metals and stones
Unprocessed iron and steelElectronics
Clocks and watchesBlankets, curtains and bags
Locks, bells and fittingsOrganic chemicals
Iron or steel itemsCotton products
Furniture and furnishing itemsHeadgear
Silk productsMeat products
Coffee, tea and spicesSeafood items
Processed meat and fish productsMan-made filaments
Pasta and baking productsBooks and newspapers
Aluminium articles Copper articles
MachineryTanning and dyeing products
Carpets Tobacco products
PlasticsFlour
Inorganic chemicalsFood residues and animal fodder
Base metal articlesNickel articles
FertilizersZinc articles
Dairy productsWood pulp
Explosives and pyrotechnics
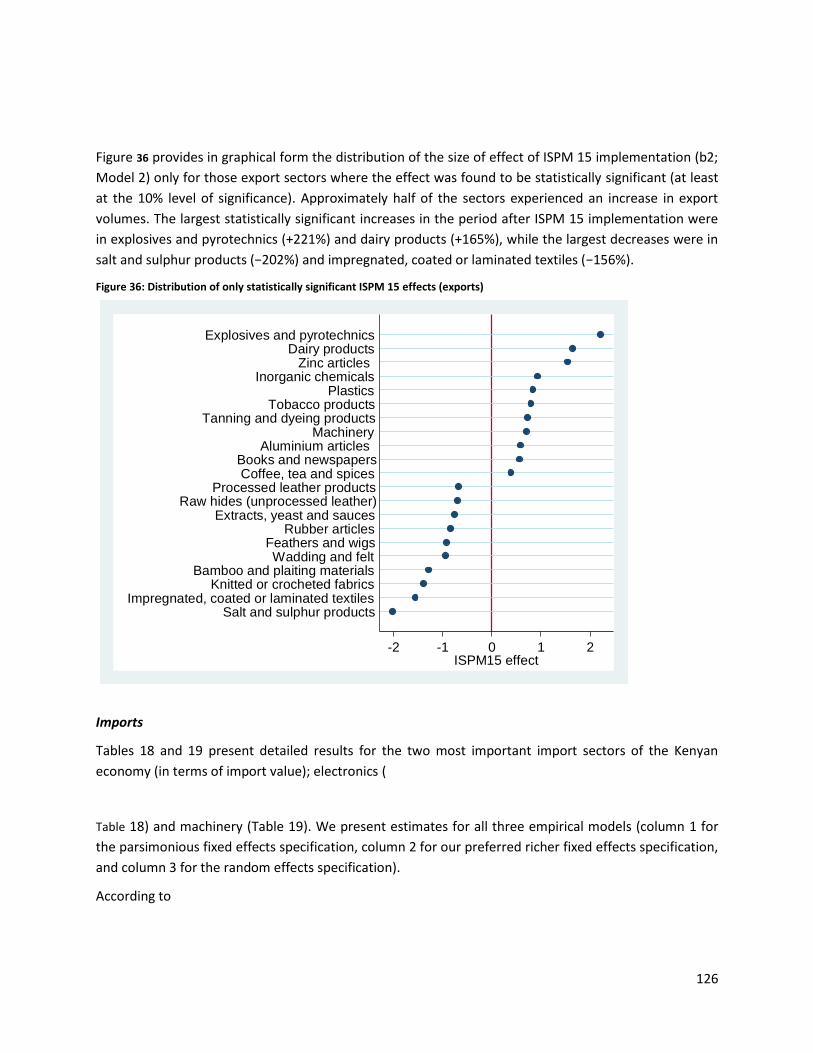
126
Figure 36 provides in graphical form the distribution of the size of effect of ISPM 15 implementation (b2;
Model 2) only for those export sectors where the effect was found to be statistically significant (at least
at the 10% level of significance). Approximately half of the sectors experienced an increase in export
volumes. The largest statistically significant increases in the period after ISPM 15 implementation were
in explosives and pyrotechnics (+221%) and dairy products (+165%), while the largest decreases were in
salt and sulphur products (−202%) and impregnated, coated or laminated textiles (−156%).
Figure 36: Distribution of only statistically significant ISPM 15 effects (exports)
Imports
Tables 18 and 19 present detailed results for the two most important import sectors of the Kenyan
economy (in terms of import value); electronics (
Table 18) and machinery (Table 19). We present estimates for all three empirical models (column 1 for
the parsimonious fixed effects specification, column 2 for our preferred richer fixed effects specification,
and column 3 for the random effects specification).
According to
-2 -1 0 1 2ISPM15 effect
Salt and sulphur productsImpregnated, coated or laminated textiles
Knitted or crocheted fabricsBamboo and plaiting materials
Wadding and feltFeathers and wigs
Rubber articlesExtracts, yeast and sauces
Raw hides (unprocessed leather)Processed leather products
Coffee, tea and spicesBooks and newspapers
Aluminium articles Machinery
Tanning and dyeing productsTobacco products
PlasticsInorganic chemicals
Zinc articles Dairy products
Explosives and pyrotechnics
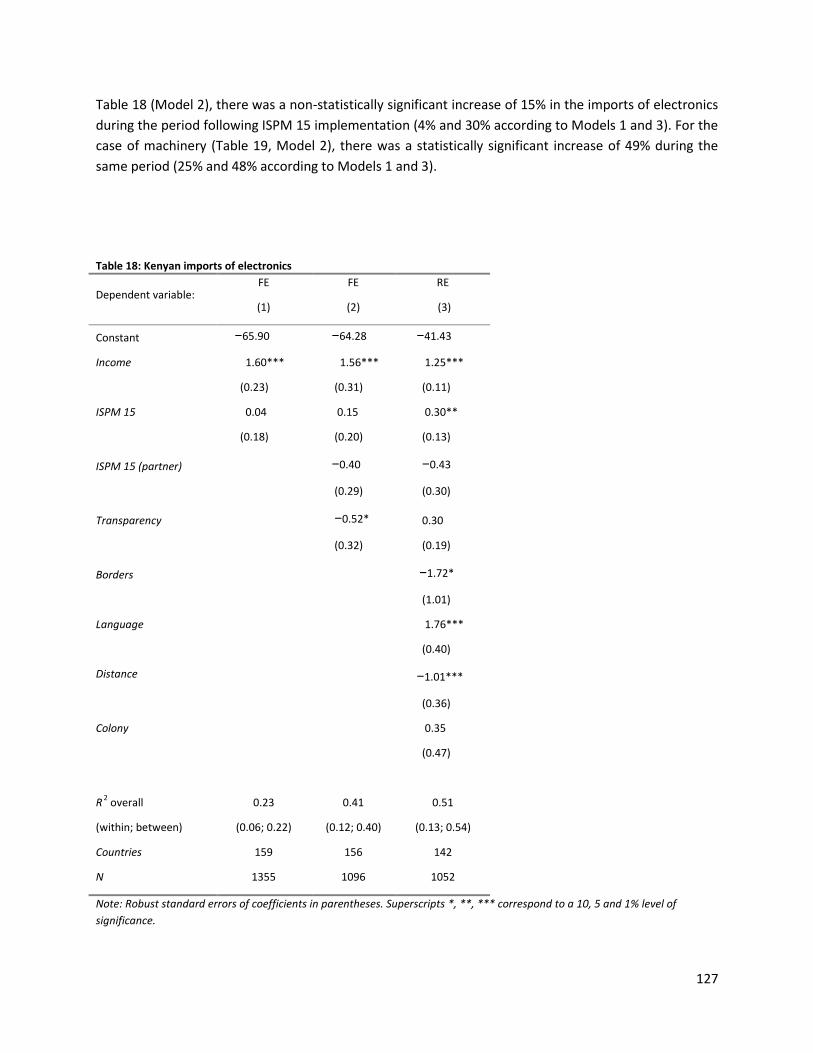
127
Table 18 (Model 2), there was a non-statistically significant increase of 15% in the imports of electronics
during the period following ISPM 15 implementation (4% and 30% according to Models 1 and 3). For the
case of machinery (Table 19, Model 2), there was a statistically significant increase of 49% during the
same period (25% and 48% according to Models 1 and 3).
Table 18: Kenyan imports of electronics
Dependent variable: FE
(1)
FE
(2)
RE
(3)
Constant −65.90 −64.28 −41.43
Income
1.60***
(0.23)
1.56***
(0.31)
1.25***
(0.11)
ISPM 15
0.04
(0.18)
0.15
(0.20)
0.30**
(0.13)
ISPM 15 (partner)
−0.40
(0.29)
−0.43
(0.30)
Transparency
−0.52*
(0.32)
0.30
(0.19)
Borders
−1.72*
(1.01)
Language
1.76***
(0.40)
Distance
−1.01***
(0.36)
Colony
0.35
(0.47)
R2 overall
(within; between)
0.23
(0.06; 0.22)
0.41
(0.12; 0.40)
0.51
(0.13; 0.54)
Countries 159 156 142
N 1355 1096 1052
Note: Robust standard errors of coefficients in parentheses. Superscripts *, **, *** correspond to a 10, 5 and 1% level of
significance.
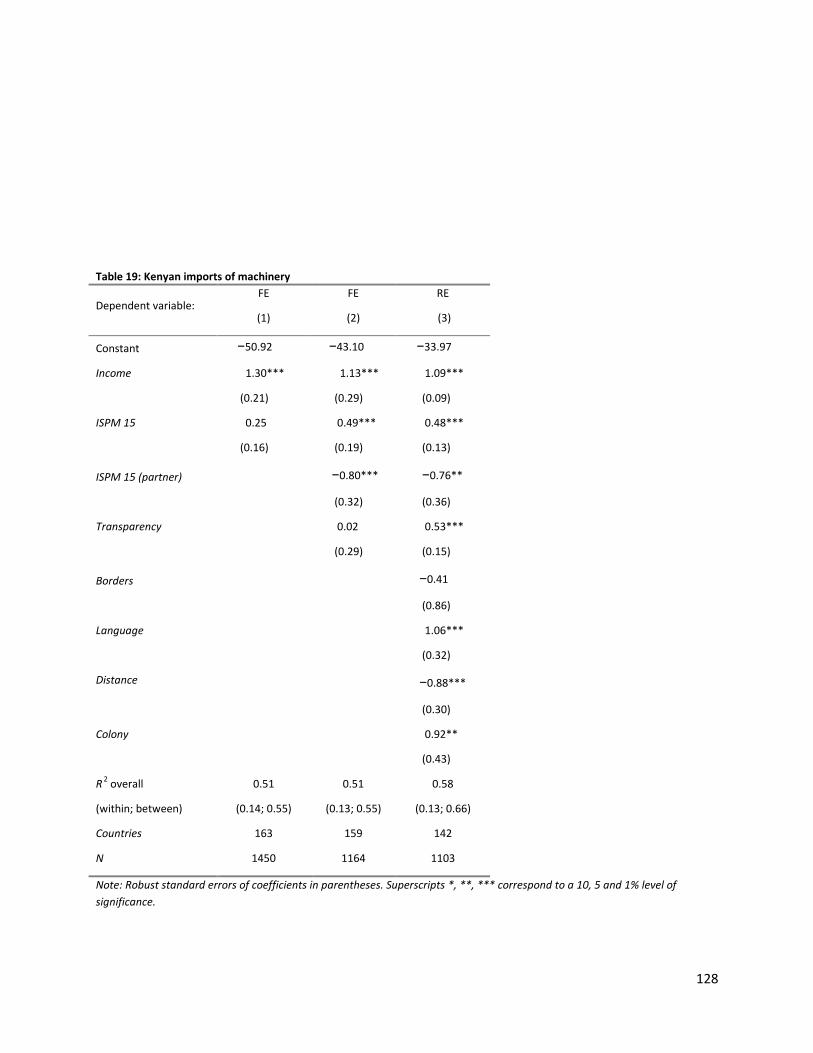
128
Table 19: Kenyan imports of machinery
Dependent variable: FE
(1)
FE
(2)
RE
(3)
Constant −50.92 −43.10 −33.97
Income
1.30***
(0.21)
1.13***
(0.29)
1.09***
(0.09)
ISPM 15
0.25
(0.16)
0.49***
(0.19)
0.48***
(0.13)
ISPM 15 (partner)
−0.80***
(0.32)
−0.76**
(0.36)
Transparency
0.02
(0.29)
0.53***
(0.15)
Borders
−0.41
(0.86)
Language
1.06***
(0.32)
Distance
−0.88***
(0.30)
Colony
0.92**
(0.43)
R2 overall
(within; between)
0.51
(0.14; 0.55)
0.51
(0.13; 0.55)
0.58
(0.13; 0.66)
Countries 163 159 142
N 1450 1164 1103
Note: Robust standard errors of coefficients in parentheses. Superscripts *, **, *** correspond to a 10, 5 and 1% level of
significance.
129
Figure 37 provides in graphical form the distribution of the size of effect of ISPM 15 implementation (b2)
across all import sectors (based on the estimates of our preferred Model 2). Effects are presented in
descending order, with the sectors experiencing the largest increases in import volumes during the post-
ISPM 15 period appearing at the top. Approximately a third of all sectors experienced an increase in
export volumes. The largest increases were in pasta and baking products (+72%) and aluminium articles
(+62%), while the largest decreases were in vegetable textiles and fibres (−218%) and arms and
ammunition (−130%).
Figure 37: Distribution of ISPM 15 effects across all importing sectors
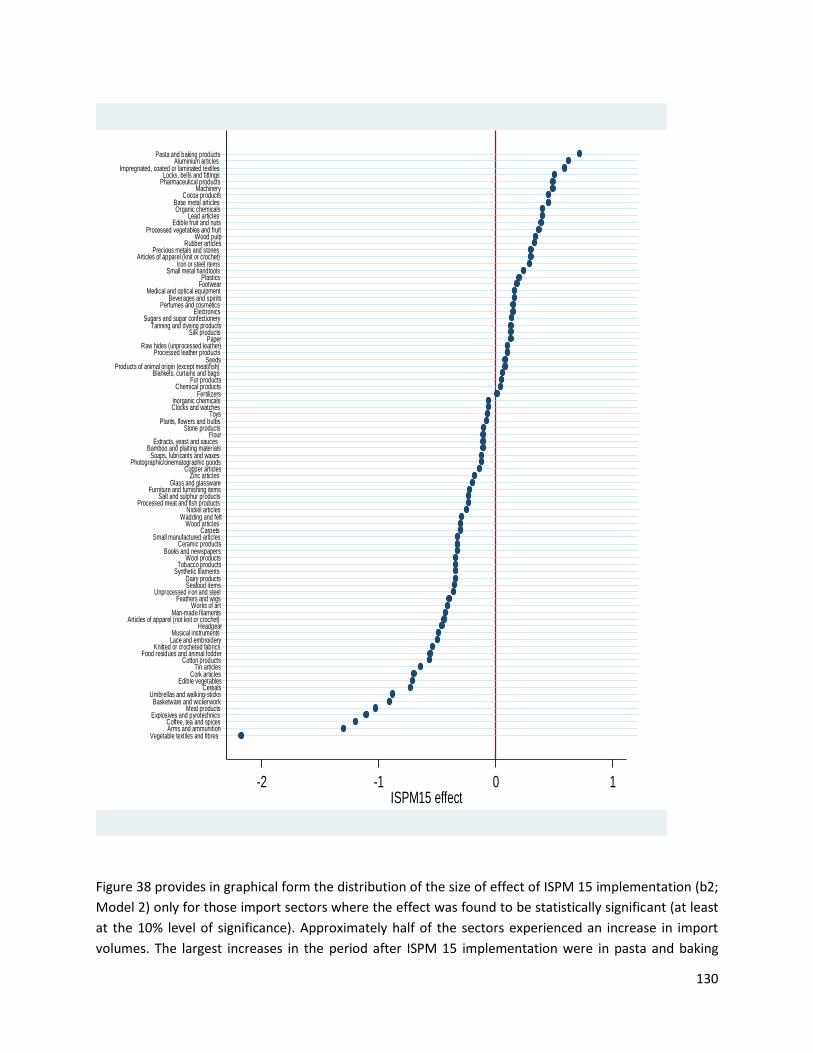
130
Figure 38 provides in graphical form the distribution of the size of effect of ISPM 15 implementation (b2;
Model 2) only for those import sectors where the effect was found to be statistically significant (at least
at the 10% level of significance). Approximately half of the sectors experienced an increase in import
volumes. The largest increases in the period after ISPM 15 implementation were in pasta and baking
-2 -1 0 1ISPM15 effect
Vegetable textiles and fibres Arms and ammunitionCoffee, tea and spices
Explosives and pyrotechnicsMeat products
Basketware and wickerworkUmbrellas and walking-sticks
CerealsEdible vegetables
Cork articlesTin articles
Cotton productsFood residues and animal fodder
Knitted or crocheted fabricsLace and embroideryMusical instruments
HeadgearArticles of apparel (not knit or crochet)
Man-made filamentsWorks of art
Feathers and wigsUnprocessed iron and steel
Seafood itemsDairy products
Synthetic filamentsTobacco products
Wool productsBooks and newspapers
Ceramic productsSmall manufactured articles
Carpets Wood articles
Wadding and feltNickel articles
Processed meat and fish productsSalt and sulphur products
Furniture and furnishing itemsGlass and glassware
Zinc articles Copper articles
Photographic/cinematographic goodsSoaps, lubricants and waxes
Bamboo and plaiting materialsExtracts, yeast and sauces
FlourStone products
Plants, flowers and bulbsToys
Clocks and watchesInorganic chemicals
FertilizersChemical products
Fur productsBlankets, curtains and bags
Products of animal origin (except meat/fish)Seeds
Processed leather productsRaw hides (unprocessed leather)
PaperSilk products
Tanning and dyeing productsSugars and sugar confectionery
ElectronicsPerfumes and cosmetics
Beverages and spiritsMedical and optical equipment
FootwearPlastics
Small metal handtoolsIron or steel items
Articles of apparel (knit or crochet)Precious metals and stones
Rubber articlesWood pulp
Processed vegetables and fruitEdible fruit and nuts
Lead articles Organic chemicals
Base metal articlesCocoa products
MachineryPharmaceutical productsLocks, bells and fittings
Impregnated, coated or laminated textilesAluminium articles
Pasta and baking products
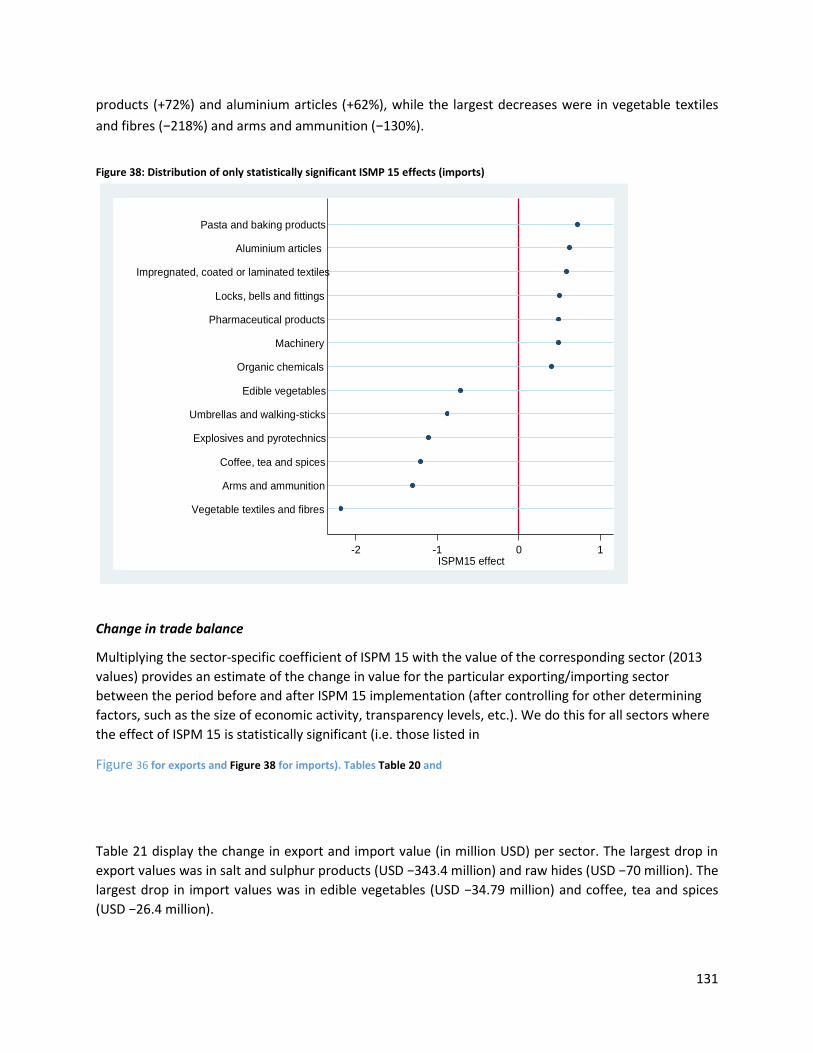
131
products (+72%) and aluminium articles (+62%), while the largest decreases were in vegetable textiles
and fibres (−218%) and arms and ammunition (−130%).
Figure 38: Distribution of only statistically significant ISMP 15 effects (imports)
Change in trade balance
Multiplying the sector-specific coefficient of ISPM 15 with the value of the corresponding sector (2013
values) provides an estimate of the change in value for the particular exporting/importing sector
between the period before and after ISPM 15 implementation (after controlling for other determining
factors, such as the size of economic activity, transparency levels, etc.). We do this for all sectors where
the effect of ISPM 15 is statistically significant (i.e. those listed in
Figure 36 for exports and Figure 38 for imports). Tables Table 20 and
Table 21 display the change in export and import value (in million USD) per sector. The largest drop in
export values was in salt and sulphur products (USD −343.4 million) and raw hides (USD −70 million). The
largest drop in import values was in edible vegetables (USD −34.79 million) and coffee, tea and spices
(USD −26.4 million).
-2 -1 0 1ISPM15 effect
Vegetable textiles and fibres
Arms and ammunition
Coffee, tea and spices
Explosives and pyrotechnics
Umbrellas and walking-sticks
Edible vegetables
Organic chemicals
Machinery
Pharmaceutical products
Locks, bells and fittings
Impregnated, coated or laminated textiles
Aluminium articles
Pasta and baking products
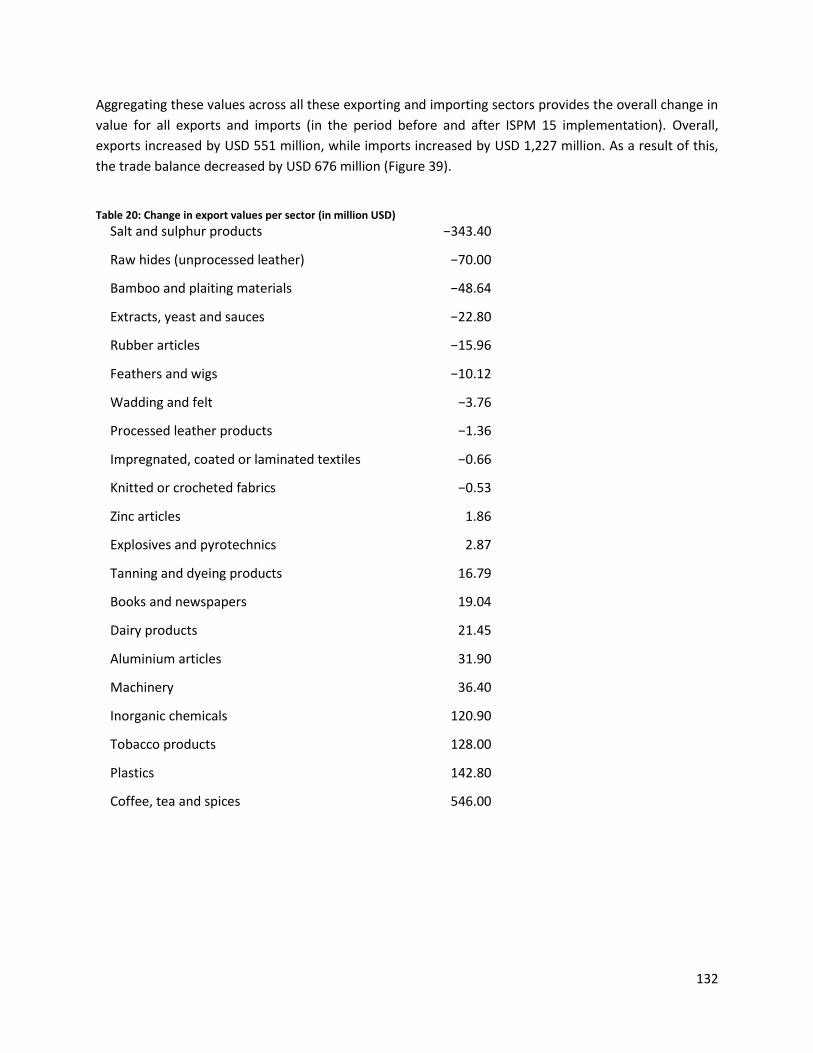
132
Aggregating these values across all these exporting and importing sectors provides the overall change in
value for all exports and imports (in the period before and after ISPM 15 implementation). Overall,
exports increased by USD 551 million, while imports increased by USD 1,227 million. As a result of this,
the trade balance decreased by USD 676 million (Figure 39).
Table 20: Change in export values per sector (in million USD)
Salt and sulphur products −343.40
Raw hides (unprocessed leather) −70.00
Bamboo and plaiting materials −48.64
Extracts, yeast and sauces −22.80
Rubber articles −15.96
Feathers and wigs −10.12
Wadding and felt −3.76
Processed leather products −1.36
Impregnated, coated or laminated textiles −0.66
Knitted or crocheted fabrics −0.53
Zinc articles 1.86
Explosives and pyrotechnics 2.87
Tanning and dyeing products 16.79
Books and newspapers 19.04
Dairy products 21.45
Aluminium articles 31.90
Machinery 36.40
Inorganic chemicals 120.90
Tobacco products 128.00
Plastics 142.80
Coffee, tea and spices 546.00
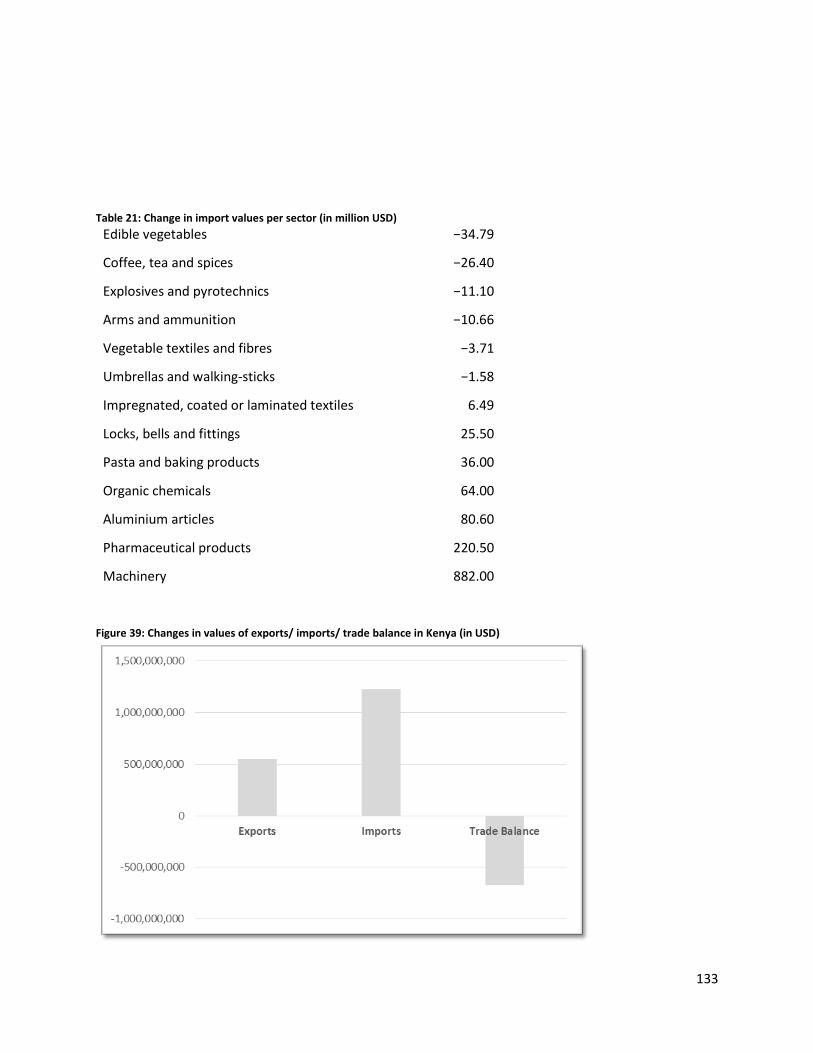
133
Table 21: Change in import values per sector (in million USD)
Edible vegetables −34.79
Coffee, tea and spices −26.40
Explosives and pyrotechnics −11.10
Arms and ammunition −10.66
Vegetable textiles and fibres −3.71
Umbrellas and walking-sticks −1.58
Impregnated, coated or laminated textiles 6.49
Locks, bells and fittings 25.50
Pasta and baking products 36.00
Organic chemicals 64.00
Aluminium articles 80.60
Pharmaceutical products 220.50
Machinery 882.00
Figure 39: Changes in values of exports/ imports/ trade balance in Kenya (in USD)
134
Summary of Findings
The purpose of this macroeconomic analysis is to estimate changes in trade volumes (exports/imports)
during the periods before and after ISPM 15 implementation across multiple commodity sectors. We
followed the conventional methodological approach used for such purposes in the empirical trade
literature, which is the estimation of trade gravity models. These allow estimating simultaneously the
statistical correlation (association) of these bilateral trade flows with several socio-economic and
geographical factors. Overall, we found that:
Approximately half of the sectors experienced an increase in export volumes. The largest
statistically-significant increases in the aftermath of the implementation of ISPM 15 were in
explosives and pyrotechnics (+221%) and dairy products (+165%), while the largest decreases
concerned in salt and sulphur products (−202%) and impregnated, coated or laminated textiles
(−156%).
Approximately half of the sectors experienced an increase in import volumes. The largest
increases in the aftermath of ISPM 15 implementation were in pasta and baking products
(+72%) and aluminium articles (+62%), while the largest decreases were in vegetable textiles
and fibres (−218%) and arms and ammunition (−130%).
Overall, exports increased by USD 551,000,000, while imports increased by USD 1,226,850,000.
As a result of this, the trade balance decreased by USD 675,850,000.
Policy Recommendations
Given the unequal distribution of effects across sectors, the Kenyan authorities should pay attention to
those sectors that experienced an economic contraction in the aftermath of the implementation of ISPM
15. The export sectors with the largest percentage decreases were: salt and sulphur products (−202%)
and impregnated, coated or laminated textiles (−156%). In total, six export sectors experienced a
statistically significant drop in export revenues (
Figure 36). A more qualitative-based analysis per sector needs to identify the extent to which the drop in
export revenues for each sector was associated with the administrative burden and costs associated
with the implementation of ISPM 15 in combination with other underlying internal and external factors
(e.g. changes in prices locally and globally, emergence of new competitors, constraints in domestic
productive capacity, or exchange rate volatility). The same should also apply in the context of import
sectors.
In Kenya, the ISPM 15 implementation appears to be associated with an overall increase in both exports
and imports. Overall, exports increased by USD 551,000,000, while imports increased by much more
(USD 1,226,850,000). As a result of this, the trade balance decreased by USD 675,850,000. This is an
135
issue of concern, given that Kenya has been running an overall trade deficit in the last five years.
Supporting those exporting industries that experienced a contraction in the aftermath of ISPM 15
implementation could at least partly offset these persistent trade deficits. Alternatively the government
could support those sectors that grew substantially in the period after the implementation of ISPM 15,
as long as these industries can expand further and compensate for the value and employment loss that
other sectors experienced.
5.3.2. Botswana
Exports
Tables 22 and 23 present detailed results for the two most important export sectors in Botswana (in
terms of export value); precious metals and stones (
136
Table 22) and nickel articles (
Table 23). We present estimates for all three empirical models (column 1 for the parsimonious fixed
effects specification, column 2 for our preferred richer fixed effects specification, and column 3 for the
random effects specification).
According to
Table 22 (Model 2), there was a (non-statistically significant) increase by 112% in the exports of precious
metals and stones during the period after the implementation of ISPM 15 (101% and 173% according to
Models 1 and 3). For what concerns nickel articles (
137
Table 23, Model 2), there was a statistically significant increase in export value by 185% during the same
period (101% and 109% according to Models 1 and 3).
Table 22: Exports of precious metals and stones (Botswana)
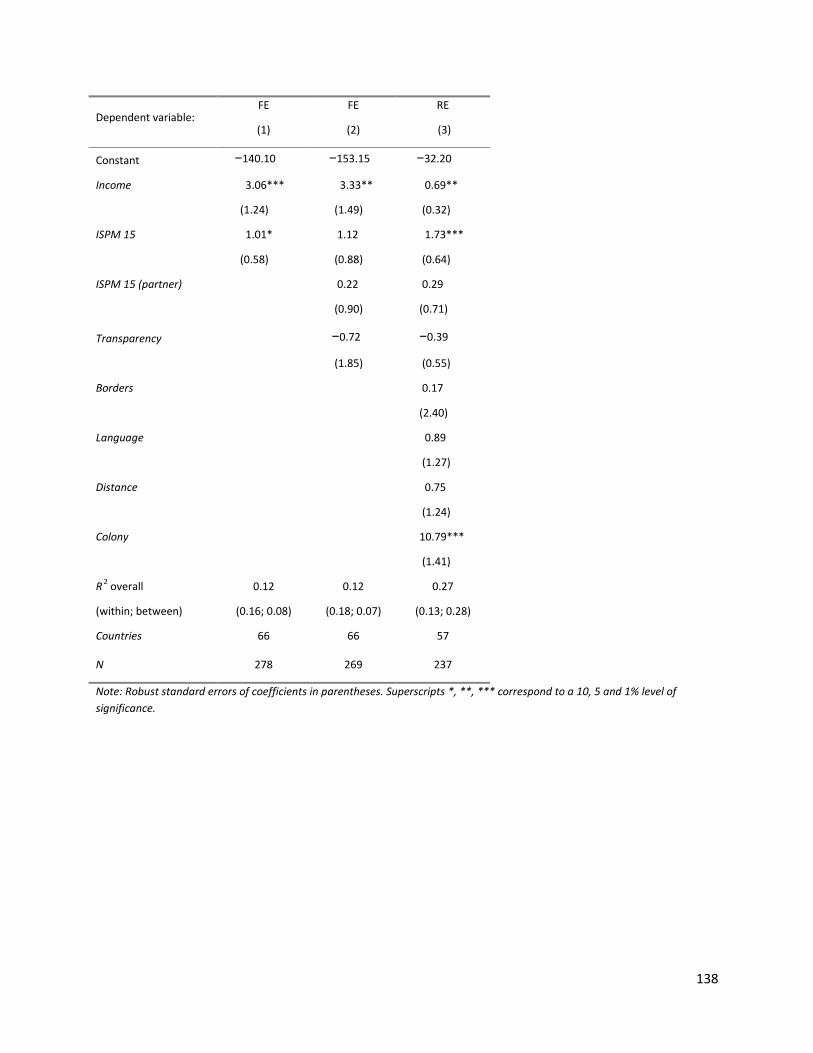
138
Dependent variable: FE
(1)
FE
(2)
RE
(3)
Constant −140.10 −153.15 −32.20
Income
3.06***
(1.24)
3.33**
(1.49)
0.69**
(0.32)
ISPM 15
1.01*
(0.58)
1.12
(0.88)
1.73***
(0.64)
ISPM 15 (partner)
0.22
(0.90)
0.29
(0.71)
Transparency
−0.72
(1.85)
−0.39
(0.55)
Borders
0.17
(2.40)
Language
0.89
(1.27)
Distance
0.75
(1.24)
Colony
10.79***
(1.41)
R2 overall
(within; between)
0.12
(0.16; 0.08)
0.12
(0.18; 0.07)
0.27
(0.13; 0.28)
Countries 66 66 57
N 278 269 237
Note: Robust standard errors of coefficients in parentheses. Superscripts *, **, *** correspond to a 10, 5 and 1% level of
significance.
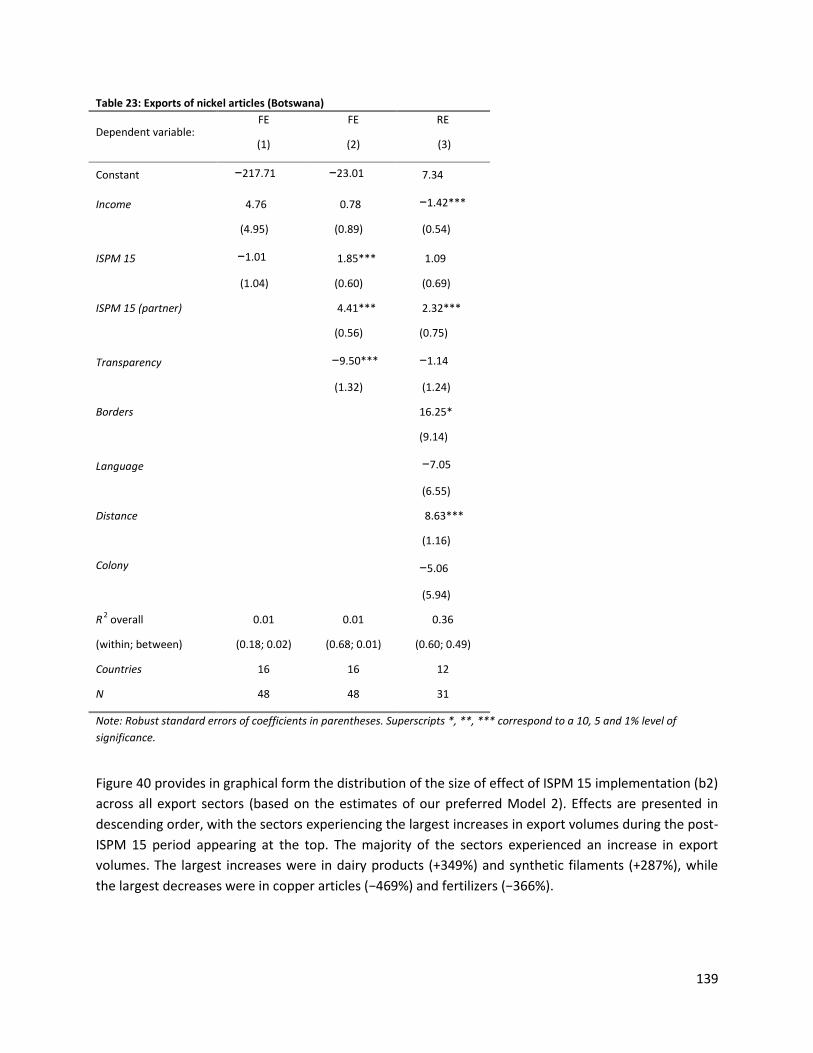
139
Table 23: Exports of nickel articles (Botswana)
Dependent variable: FE
(1)
FE
(2)
RE
(3)
Constant −217.71 −23.01 7.34
Income
4.76
(4.95)
0.78
(0.89)
−1.42***
(0.54)
ISPM 15
−1.01
(1.04)
1.85***
(0.60)
1.09
(0.69)
ISPM 15 (partner)
4.41***
(0.56)
2.32***
(0.75)
Transparency
−9.50***
(1.32)
−1.14
(1.24)
Borders
16.25*
(9.14)
Language
−7.05
(6.55)
Distance
8.63***
(1.16)
Colony
−5.06
(5.94)
R2 overall
(within; between)
0.01
(0.18; 0.02)
0.01
(0.68; 0.01)
0.36
(0.60; 0.49)
Countries 16 16 12
N 48 48 31
Note: Robust standard errors of coefficients in parentheses. Superscripts *, **, *** correspond to a 10, 5 and 1% level of
significance.
Figure 40 provides in graphical form the distribution of the size of effect of ISPM 15 implementation (b2)
across all export sectors (based on the estimates of our preferred Model 2). Effects are presented in
descending order, with the sectors experiencing the largest increases in export volumes during the post-
ISPM 15 period appearing at the top. The majority of the sectors experienced an increase in export
volumes. The largest increases were in dairy products (+349%) and synthetic filaments (+287%), while
the largest decreases were in copper articles (−469%) and fertilizers (−366%).
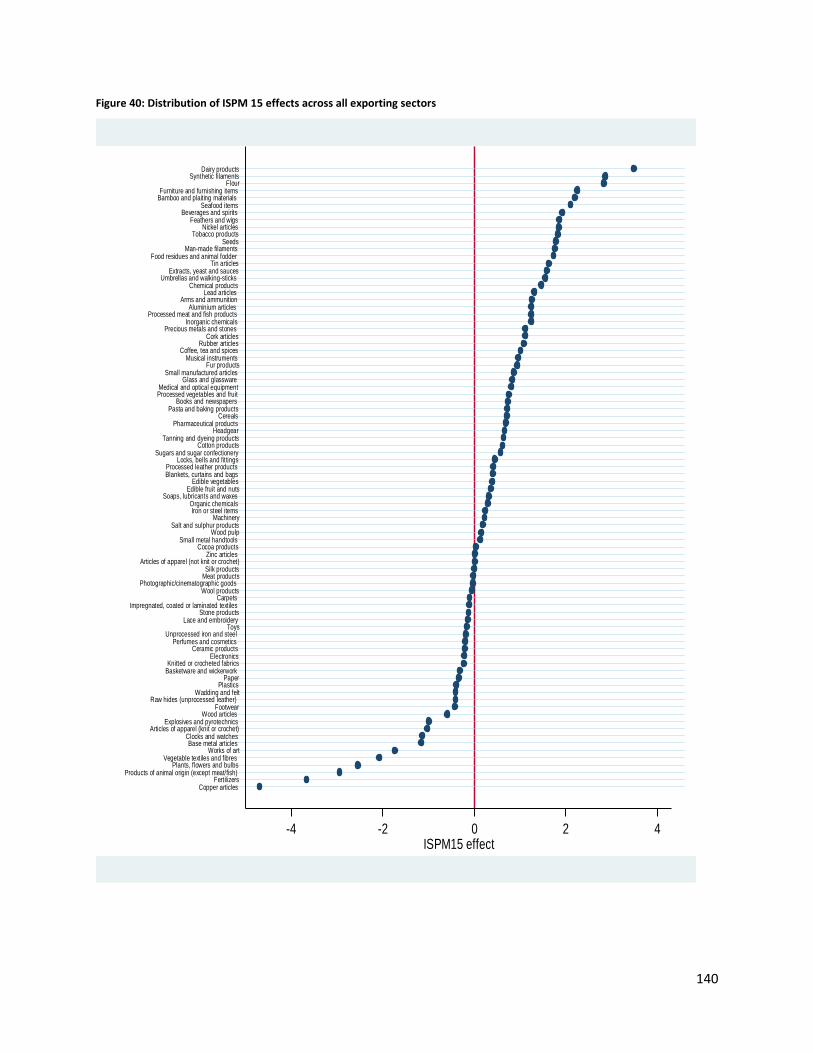
140
Figure 40: Distribution of ISPM 15 effects across all exporting sectors
-4 -2 0 2 4ISPM15 effect
Copper articlesFertilizers
Products of animal origin (except meat/fish)Plants, flowers and bulbs
Vegetable textiles and fibres Works of art
Base metal articlesClocks and watches
Articles of apparel (knit or crochet)Explosives and pyrotechnics
Wood articles Footwear
Raw hides (unprocessed leather)Wadding and felt
PlasticsPaper
Basketware and wickerworkKnitted or crocheted fabrics
ElectronicsCeramic products
Perfumes and cosmeticsUnprocessed iron and steel
ToysLace and embroidery
Stone productsImpregnated, coated or laminated textiles
Carpets Wool products
Photographic/cinematographic goodsMeat productsSilk products
Articles of apparel (not knit or crochet)Zinc articles
Cocoa productsSmall metal handtools
Wood pulpSalt and sulphur products
MachineryIron or steel items
Organic chemicalsSoaps, lubricants and waxes
Edible fruit and nutsEdible vegetables
Blankets, curtains and bagsProcessed leather products
Locks, bells and fittingsSugars and sugar confectionery
Cotton productsTanning and dyeing products
HeadgearPharmaceutical products
CerealsPasta and baking products
Books and newspapersProcessed vegetables and fruitMedical and optical equipment
Glass and glasswareSmall manufactured articles
Fur productsMusical instruments
Coffee, tea and spicesRubber articles
Cork articlesPrecious metals and stones
Inorganic chemicalsProcessed meat and fish products
Aluminium articles Arms and ammunition
Lead articles Chemical products
Umbrellas and walking-sticksExtracts, yeast and sauces
Tin articlesFood residues and animal fodder
Man-made filamentsSeeds
Tobacco productsNickel articles
Feathers and wigsBeverages and spirits
Seafood itemsBamboo and plaiting materialsFurniture and furnishing items
FlourSynthetic filaments
Dairy products
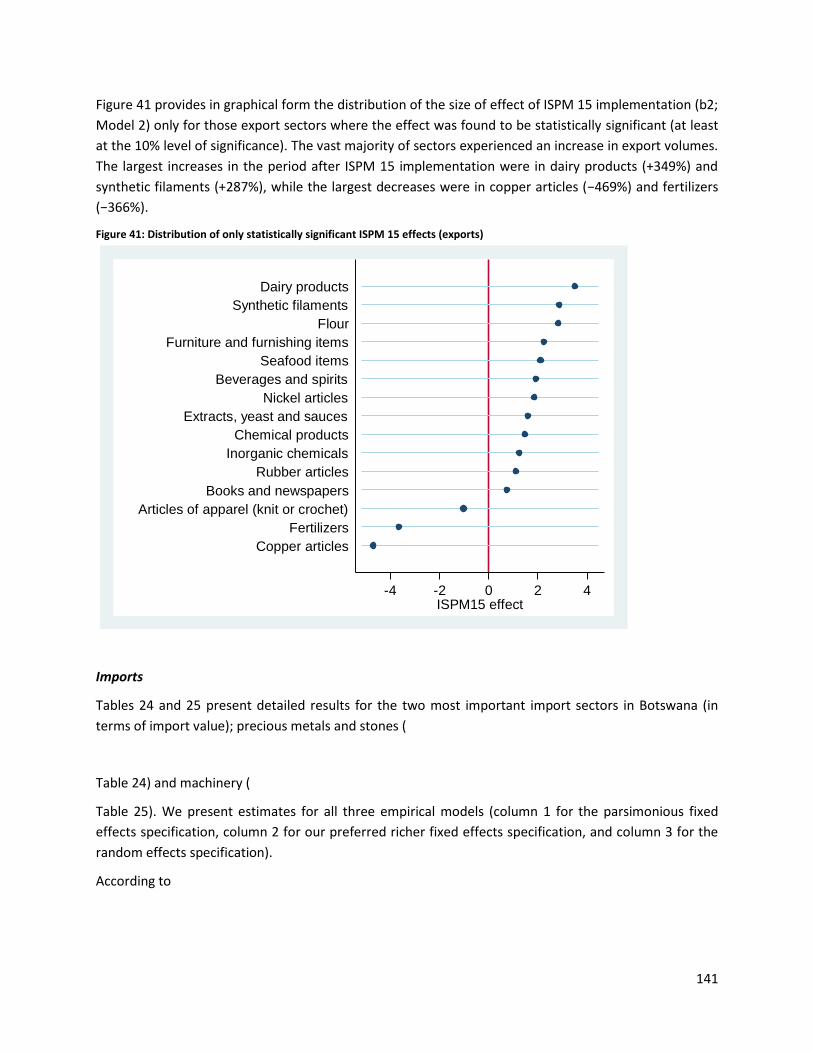
141
Figure 41 provides in graphical form the distribution of the size of effect of ISPM 15 implementation (b2;
Model 2) only for those export sectors where the effect was found to be statistically significant (at least
at the 10% level of significance). The vast majority of sectors experienced an increase in export volumes.
The largest increases in the period after ISPM 15 implementation were in dairy products (+349%) and
synthetic filaments (+287%), while the largest decreases were in copper articles (−469%) and fertilizers
(−366%).
Figure 41: Distribution of only statistically significant ISPM 15 effects (exports)
Imports
Tables 24 and 25 present detailed results for the two most important import sectors in Botswana (in
terms of import value); precious metals and stones (
Table 24) and machinery (
Table 25). We present estimates for all three empirical models (column 1 for the parsimonious fixed
effects specification, column 2 for our preferred richer fixed effects specification, and column 3 for the
random effects specification).
According to
-4 -2 0 2 4ISPM15 effect
Copper articles
Fertilizers
Articles of apparel (knit or crochet)
Books and newspapers
Rubber articles
Inorganic chemicals
Chemical products
Extracts, yeast and sauces
Nickel articles
Beverages and spirits
Seafood items
Furniture and furnishing items
Flour
Synthetic filaments
Dairy products
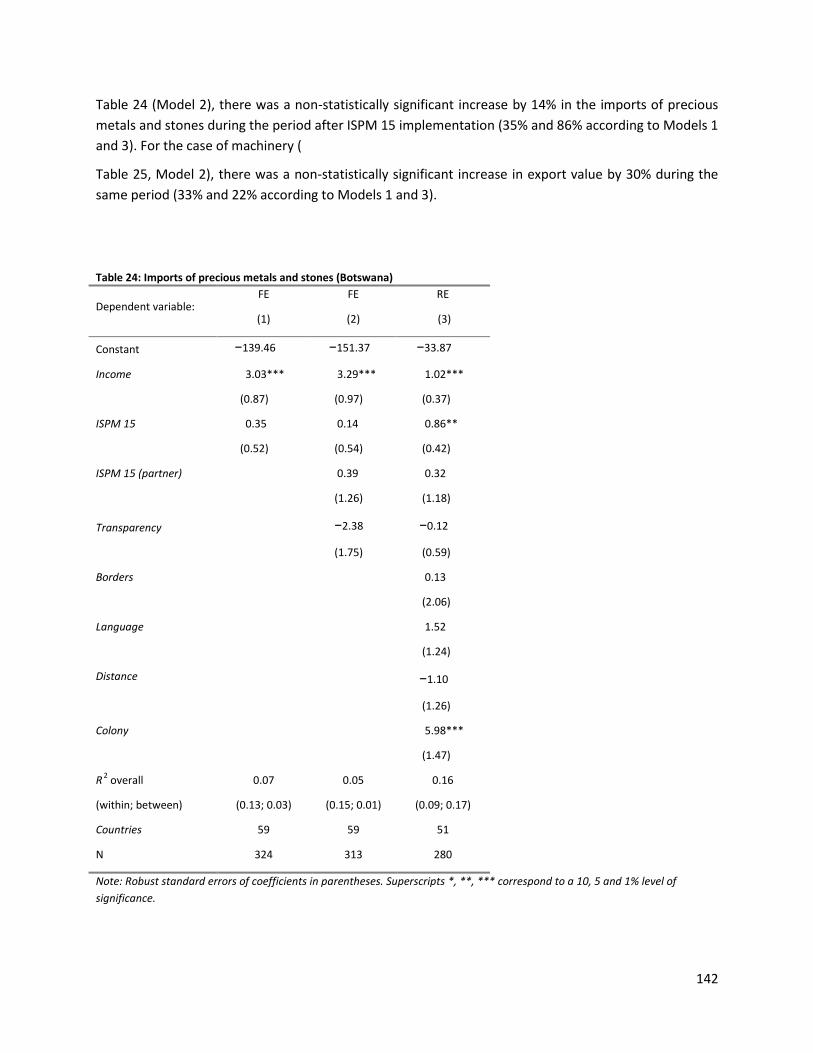
142
Table 24 (Model 2), there was a non-statistically significant increase by 14% in the imports of precious
metals and stones during the period after ISPM 15 implementation (35% and 86% according to Models 1
and 3). For the case of machinery (
Table 25, Model 2), there was a non-statistically significant increase in export value by 30% during the
same period (33% and 22% according to Models 1 and 3).
Table 24: Imports of precious metals and stones (Botswana)
Dependent variable: FE
(1)
FE
(2)
RE
(3)
Constant −139.46 −151.37 −33.87
Income
3.03***
(0.87)
3.29***
(0.97)
1.02***
(0.37)
ISPM 15
0.35
(0.52)
0.14
(0.54)
0.86**
(0.42)
ISPM 15 (partner)
0.39
(1.26)
0.32
(1.18)
Transparency
−2.38
(1.75)
−0.12
(0.59)
Borders
0.13
(2.06)
Language
1.52
(1.24)
Distance
−1.10
(1.26)
Colony
5.98***
(1.47)
R2 overall
(within; between)
0.07
(0.13; 0.03)
0.05
(0.15; 0.01)
0.16
(0.09; 0.17)
Countries 59 59 51
N 324 313 280
Note: Robust standard errors of coefficients in parentheses. Superscripts *, **, *** correspond to a 10, 5 and 1% level of
significance.
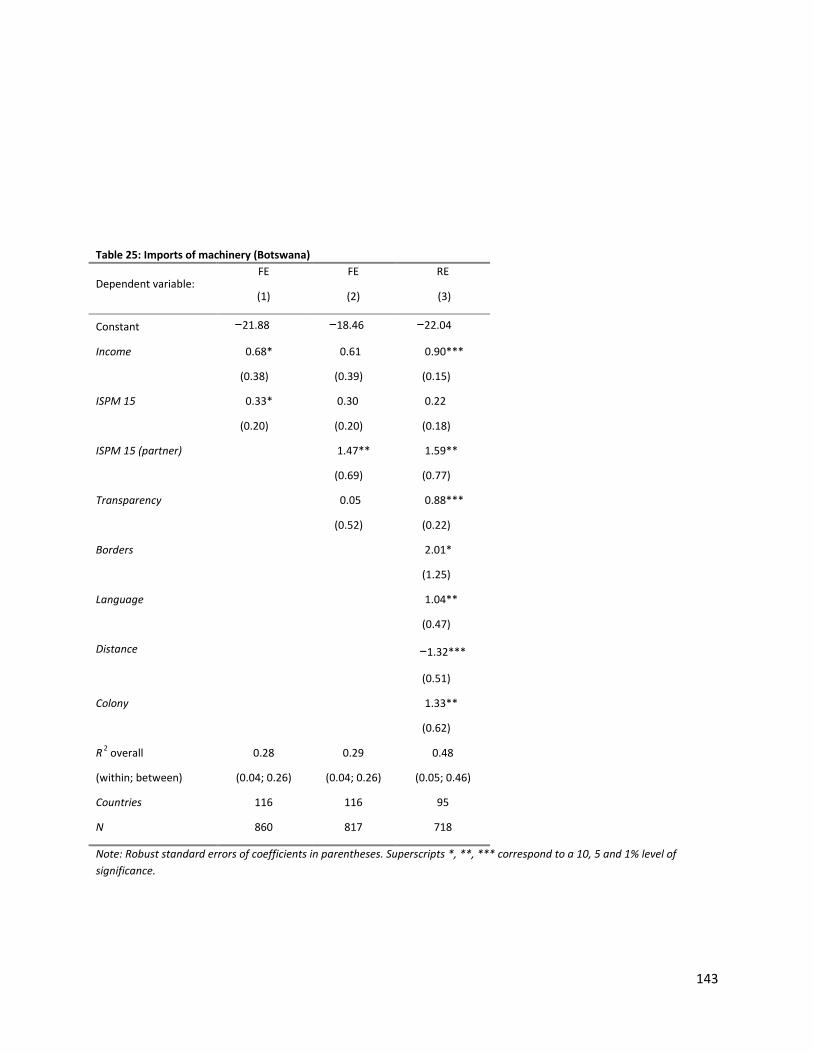
143
Table 25: Imports of machinery (Botswana)
Dependent variable: FE
(1)
FE
(2)
RE
(3)
Constant −21.88 −18.46 −22.04
Income
0.68*
(0.38)
0.61
(0.39)
0.90***
(0.15)
ISPM 15
0.33*
(0.20)
0.30
(0.20)
0.22
(0.18)
ISPM 15 (partner)
1.47**
(0.69)
1.59**
(0.77)
Transparency
0.05
(0.52)
0.88***
(0.22)
Borders
2.01*
(1.25)
Language
1.04**
(0.47)
Distance
−1.32***
(0.51)
Colony
1.33**
(0.62)
R2 overall
(within; between)
0.28
(0.04; 0.26)
0.29
(0.04; 0.26)
0.48
(0.05; 0.46)
Countries 116 116 95
N 860 817 718
Note: Robust standard errors of coefficients in parentheses. Superscripts *, **, *** correspond to a 10, 5 and 1% level of
significance.
144
Figure 42 provides in graphical form the distribution of the size of effect of ISPM 15 implementation (b2)
across all import sectors (based on the estimates of our preferred Model 2). Effects are presented in
descending order, with the sectors experiencing the largest increases in import volumes during the
period after ISPM 15 implementation appearing on the top. Approximately half of all sectors
experienced an increase in import volumes. The largest increases in the aftermath of ISPM 15
implementation were in cereals (+184%) and tobacco products (+174%), while the largest decreases
were in explosives and pyrotechniques (−219%) and fertilizers (−165%).
Figure 42: Distribution of ISPM 15 effects across all importing sectors
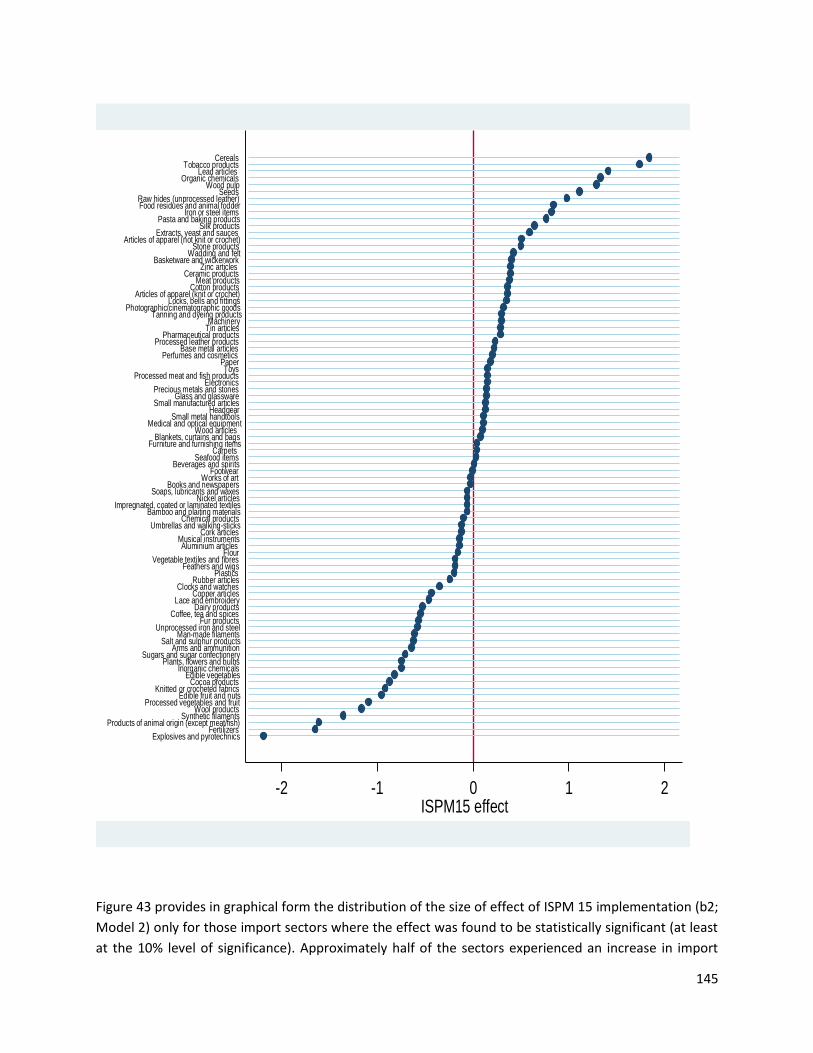
145
Figure 43 provides in graphical form the distribution of the size of effect of ISPM 15 implementation (b2;
Model 2) only for those import sectors where the effect was found to be statistically significant (at least
at the 10% level of significance). Approximately half of the sectors experienced an increase in import
-2 -1 0 1 2ISPM15 effect
Explosives and pyrotechnicsFertilizers
Products of animal origin (except meat/fish)Synthetic filaments
Wool productsProcessed vegetables and fruit
Edible fruit and nutsKnitted or crocheted fabrics
Cocoa productsEdible vegetables
Inorganic chemicalsPlants, flowers and bulbs
Sugars and sugar confectioneryArms and ammunition
Salt and sulphur productsMan-made filaments
Unprocessed iron and steelFur products
Coffee, tea and spicesDairy products
Lace and embroideryCopper articles
Clocks and watchesRubber articles
PlasticsFeathers and wigs
Vegetable textiles and fibres Flour
Aluminium articles Musical instruments
Cork articlesUmbrellas and walking-sticks
Chemical productsBamboo and plaiting materials
Impregnated, coated or laminated textilesNickel articles
Soaps, lubricants and waxesBooks and newspapers
Works of artFootwear
Beverages and spiritsSeafood items
Carpets Furniture and furnishing items
Blankets, curtains and bagsWood articles
Medical and optical equipmentSmall metal handtools
HeadgearSmall manufactured articles
Glass and glasswarePrecious metals and stones
ElectronicsProcessed meat and fish products
ToysPaper
Perfumes and cosmeticsBase metal articles
Processed leather productsPharmaceutical products
Tin articlesMachinery
Tanning and dyeing productsPhotographic/cinematographic goods
Locks, bells and fittingsArticles of apparel (knit or crochet)
Cotton productsMeat products
Ceramic productsZinc articles
Basketware and wickerworkWadding and felt
Stone productsArticles of apparel (not knit or crochet)
Extracts, yeast and saucesSilk products
Pasta and baking productsIron or steel items
Food residues and animal fodderRaw hides (unprocessed leather)
SeedsWood pulp
Organic chemicalsLead articles
Tobacco productsCereals
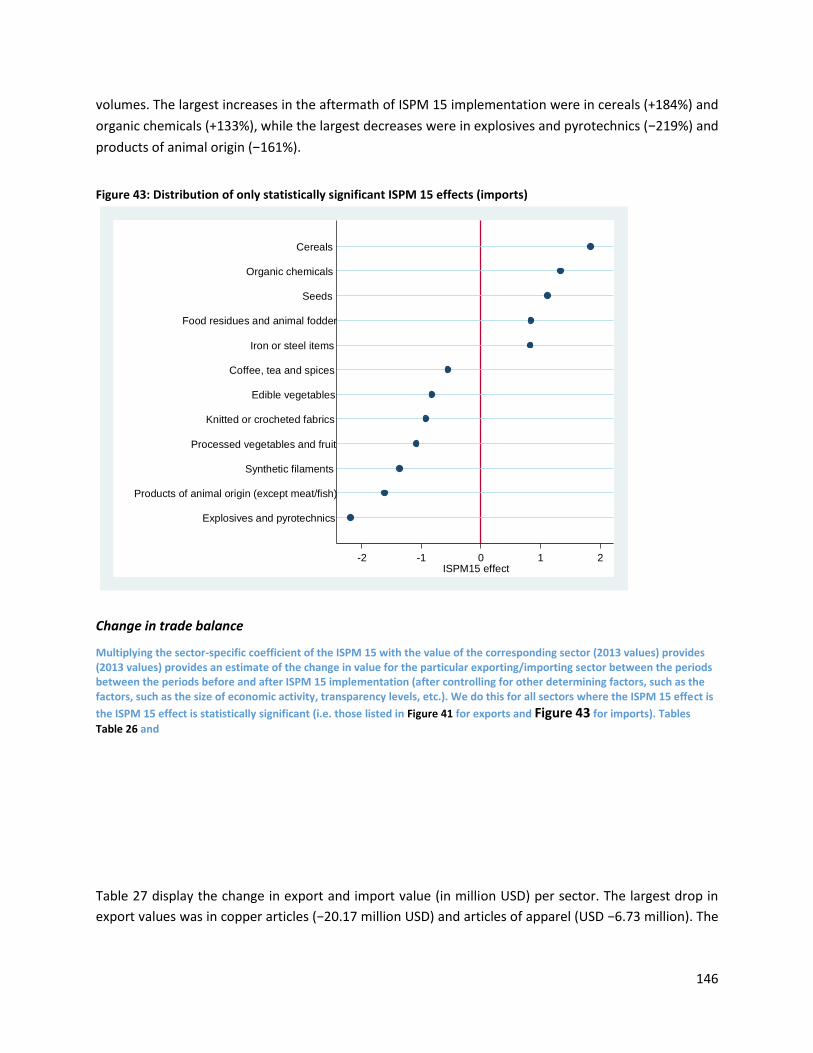
146
volumes. The largest increases in the aftermath of ISPM 15 implementation were in cereals (+184%) and
organic chemicals (+133%), while the largest decreases were in explosives and pyrotechnics (−219%) and
products of animal origin (−161%).
Figure 43: Distribution of only statistically significant ISPM 15 effects (imports)
Change in trade balance
Multiplying the sector-specific coefficient of the ISPM 15 with the value of the corresponding sector (2013 values) provides (2013 values) provides an estimate of the change in value for the particular exporting/importing sector between the periods between the periods before and after ISPM 15 implementation (after controlling for other determining factors, such as the factors, such as the size of economic activity, transparency levels, etc.). We do this for all sectors where the ISPM 15 effect is
the ISPM 15 effect is statistically significant (i.e. those listed in Figure 41 for exports and Figure 43 for imports). Tables
Table 26 and
Table 27 display the change in export and import value (in million USD) per sector. The largest drop in
export values was in copper articles (−20.17 million USD) and articles of apparel (USD −6.73 million). The
-2 -1 0 1 2ISPM15 effect
Explosives and pyrotechnics
Products of animal origin (except meat/fish)
Synthetic filaments
Processed vegetables and fruit
Knitted or crocheted fabrics
Edible vegetables
Coffee, tea and spices
Iron or steel items
Food residues and animal fodder
Seeds
Organic chemicals
Cereals
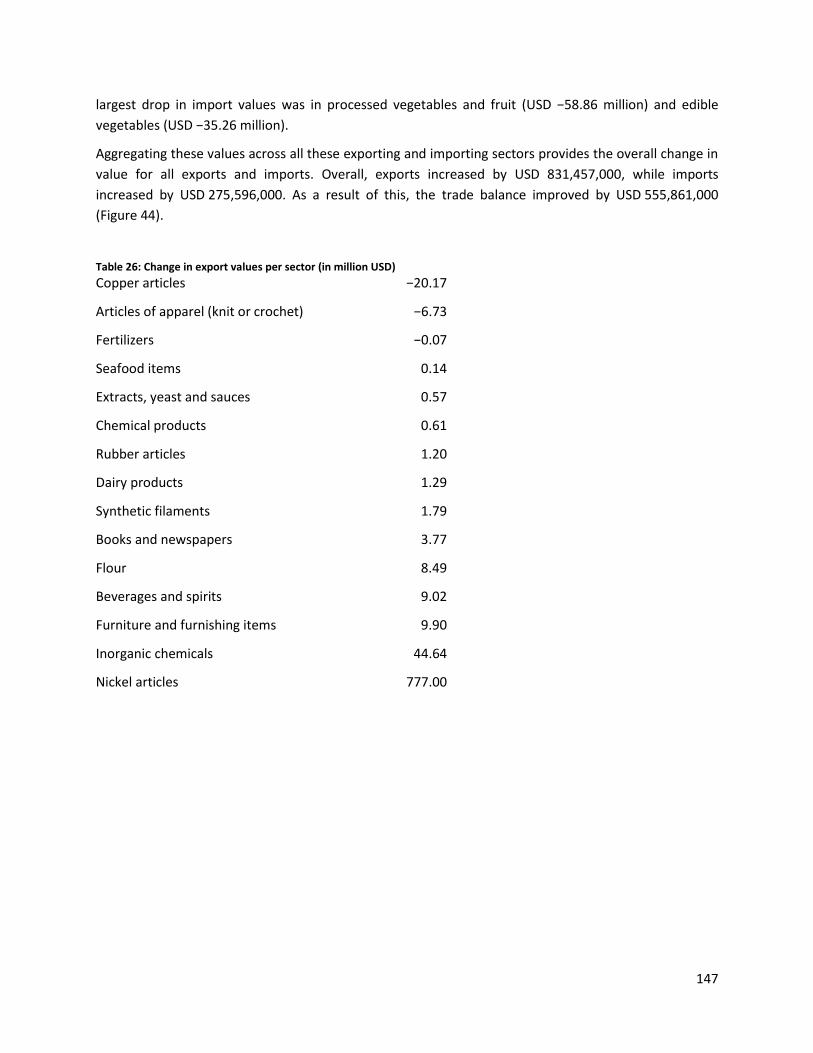
147
largest drop in import values was in processed vegetables and fruit (USD −58.86 million) and edible
vegetables (USD −35.26 million).
Aggregating these values across all these exporting and importing sectors provides the overall change in
value for all exports and imports. Overall, exports increased by USD 831,457,000, while imports
increased by USD 275,596,000. As a result of this, the trade balance improved by USD 555,861,000
(Figure 44).
Table 26: Change in export values per sector (in million USD)
Copper articles −20.17
Articles of apparel (knit or crochet) −6.73
Fertilizers
−0.07
Seafood items 0.14
Extracts, yeast and sauces 0.57
Chemical products 0.61
Rubber articles 1.20
Dairy products 1.29
Synthetic filaments 1.79
Books and newspapers 3.77
Flour
8.49
Beverages and spirits 9.02
Furniture and furnishing items 9.90
Inorganic chemicals 44.64
Nickel articles 777.00
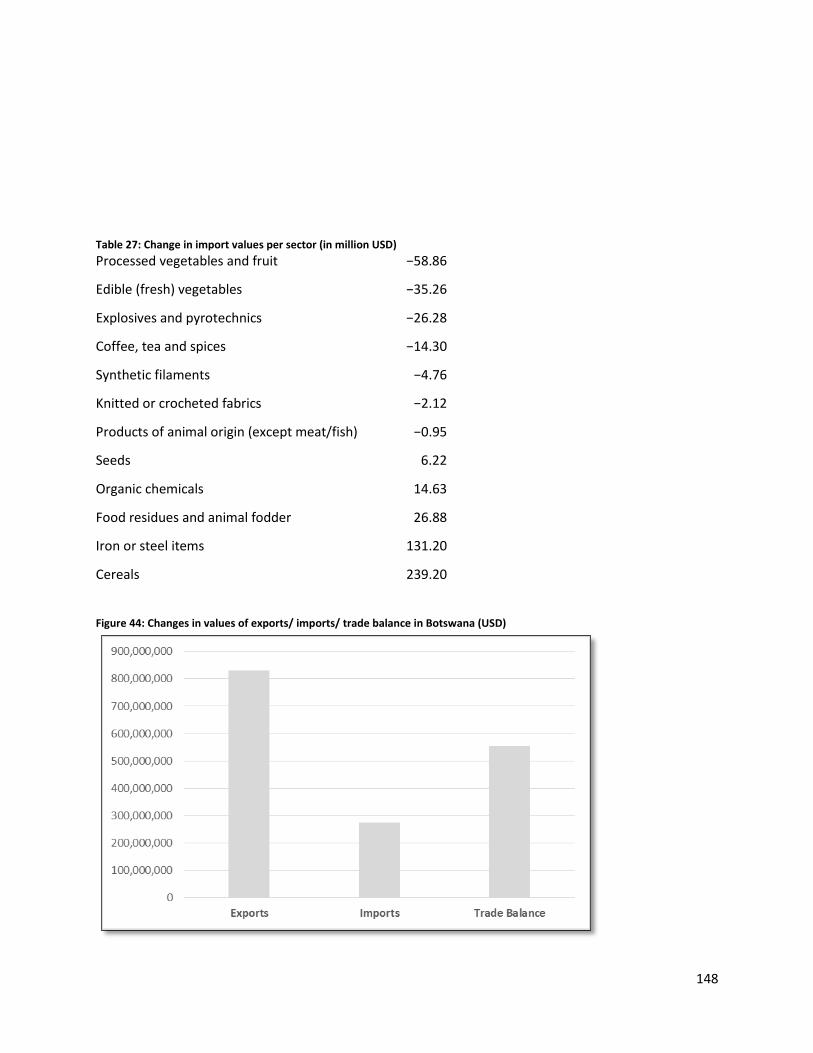
148
Table 27: Change in import values per sector (in million USD)
Processed vegetables and fruit −58.86
Edible (fresh) vegetables −35.26
Explosives and pyrotechnics −26.28
Coffee, tea and spices −14.30
Synthetic filaments −4.76
Knitted or crocheted fabrics −2.12
Products of animal origin (except meat/fish) −0.95
Seeds 6.22
Organic chemicals 14.63
Food residues and animal fodder 26.88
Iron or steel items 131.20
Cereals 239.20
Figure 44: Changes in values of exports/ imports/ trade balance in Botswana (USD)
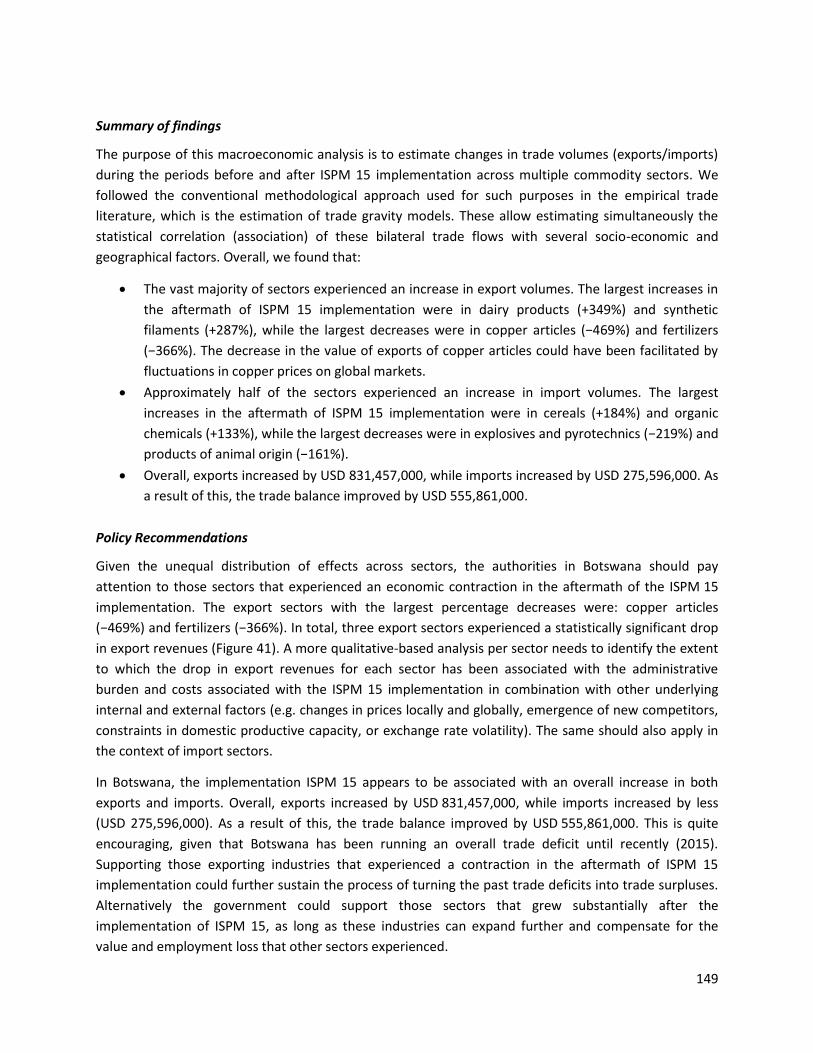
149
Summary of findings
The purpose of this macroeconomic analysis is to estimate changes in trade volumes (exports/imports)
during the periods before and after ISPM 15 implementation across multiple commodity sectors. We
followed the conventional methodological approach used for such purposes in the empirical trade
literature, which is the estimation of trade gravity models. These allow estimating simultaneously the
statistical correlation (association) of these bilateral trade flows with several socio-economic and
geographical factors. Overall, we found that:
The vast majority of sectors experienced an increase in export volumes. The largest increases in
the aftermath of ISPM 15 implementation were in dairy products (+349%) and synthetic
filaments (+287%), while the largest decreases were in copper articles (−469%) and fertilizers
(−366%). The decrease in the value of exports of copper articles could have been facilitated by
fluctuations in copper prices on global markets.
Approximately half of the sectors experienced an increase in import volumes. The largest
increases in the aftermath of ISPM 15 implementation were in cereals (+184%) and organic
chemicals (+133%), while the largest decreases were in explosives and pyrotechnics (−219%) and
products of animal origin (−161%).
Overall, exports increased by USD 831,457,000, while imports increased by USD 275,596,000. As
a result of this, the trade balance improved by USD 555,861,000.
Policy Recommendations
Given the unequal distribution of effects across sectors, the authorities in Botswana should pay
attention to those sectors that experienced an economic contraction in the aftermath of the ISPM 15
implementation. The export sectors with the largest percentage decreases were: copper articles
(−469%) and fertilizers (−366%). In total, three export sectors experienced a statistically significant drop
in export revenues (Figure 41). A more qualitative-based analysis per sector needs to identify the extent
to which the drop in export revenues for each sector has been associated with the administrative
burden and costs associated with the ISPM 15 implementation in combination with other underlying
internal and external factors (e.g. changes in prices locally and globally, emergence of new competitors,
constraints in domestic productive capacity, or exchange rate volatility). The same should also apply in
the context of import sectors.
In Botswana, the implementation ISPM 15 appears to be associated with an overall increase in both
exports and imports. Overall, exports increased by USD 831,457,000, while imports increased by less
(USD 275,596,000). As a result of this, the trade balance improved by USD 555,861,000. This is quite
encouraging, given that Botswana has been running an overall trade deficit until recently (2015).
Supporting those exporting industries that experienced a contraction in the aftermath of ISPM 15
implementation could further sustain the process of turning the past trade deficits into trade surpluses.
Alternatively the government could support those sectors that grew substantially after the
implementation of ISPM 15, as long as these industries can expand further and compensate for the
value and employment loss that other sectors experienced.
150
5.3.3. Cameroon
Exports
Tables 28 and 29 present detailed results for the two most important export sectors of Cameroon (in
terms of export value); cocoa products (
Table 28) and wood articles (
Table 29). We present estimates for all three empirical models (column 1 for the parsimonious fixed
effects specification, column 2 for our preferred richer fixed effects specification and column 3 for the
random effects specification).
According to
Table 28 (Model 2), there was a non-statistically significant increase by 56% in the exports of cocoa
products during the period after the implementation of ISPM 15 (60% and 92% according to Models 1
and 3). For the case of wood articles (
Table 29, Model 2), there was a non-statistically significant increase by 8% during the same period (9%
and 4% according to Models 1 and 3).

151
Table 28: Cameroon exports of cocoa products
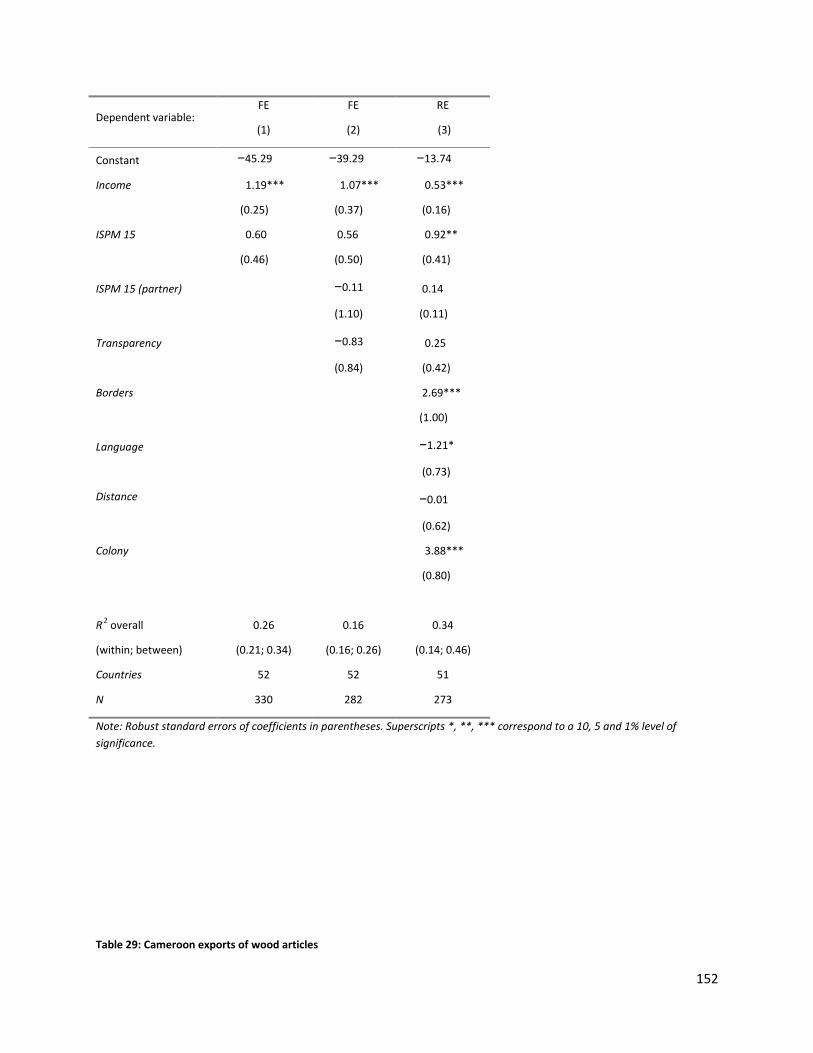
152
Dependent variable: FE
(1)
FE
(2)
RE
(3)
Constant −45.29 −39.29 −13.74
Income
1.19***
(0.25)
1.07***
(0.37)
0.53***
(0.16)
ISPM 15
0.60
(0.46)
0.56
(0.50)
0.92**
(0.41)
ISPM 15 (partner)
−0.11
(1.10)
0.14
(0.11)
Transparency
−0.83
(0.84)
0.25
(0.42)
Borders
2.69***
(1.00)
Language
−1.21*
(0.73)
Distance
−0.01
(0.62)
Colony
3.88***
(0.80)
R2 overall
(within; between)
0.26
(0.21; 0.34)
0.16
(0.16; 0.26)
0.34
(0.14; 0.46)
Countries 52 52 51
N 330 282 273
Note: Robust standard errors of coefficients in parentheses. Superscripts *, **, *** correspond to a 10, 5 and 1% level of
significance.
Table 29: Cameroon exports of wood articles
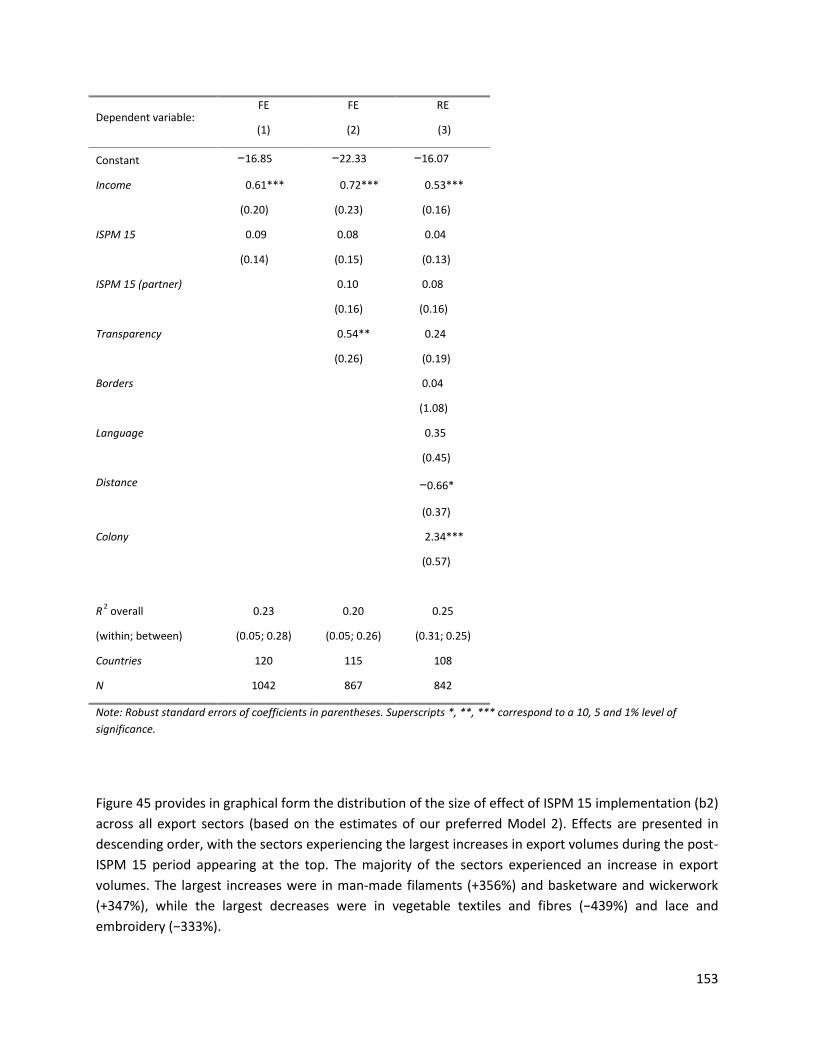
153
Dependent variable: FE
(1)
FE
(2)
RE
(3)
Constant −16.85 −22.33 −16.07
Income
0.61***
(0.20)
0.72***
(0.23)
0.53***
(0.16)
ISPM 15
0.09
(0.14)
0.08
(0.15)
0.04
(0.13)
ISPM 15 (partner)
0.10
(0.16)
0.08
(0.16)
Transparency
0.54**
(0.26)
0.24
(0.19)
Borders
0.04
(1.08)
Language
0.35
(0.45)
Distance
−0.66*
(0.37)
Colony
2.34***
(0.57)
R2 overall
(within; between)
0.23
(0.05; 0.28)
0.20
(0.05; 0.26)
0.25
(0.31; 0.25)
Countries 120 115 108
N 1042 867 842
Note: Robust standard errors of coefficients in parentheses. Superscripts *, **, *** correspond to a 10, 5 and 1% level of
significance.
Figure 45 provides in graphical form the distribution of the size of effect of ISPM 15 implementation (b2)
across all export sectors (based on the estimates of our preferred Model 2). Effects are presented in
descending order, with the sectors experiencing the largest increases in export volumes during the post-
ISPM 15 period appearing at the top. The majority of the sectors experienced an increase in export
volumes. The largest increases were in man-made filaments (+356%) and basketware and wickerwork
(+347%), while the largest decreases were in vegetable textiles and fibres (−439%) and lace and
embroidery (−333%).
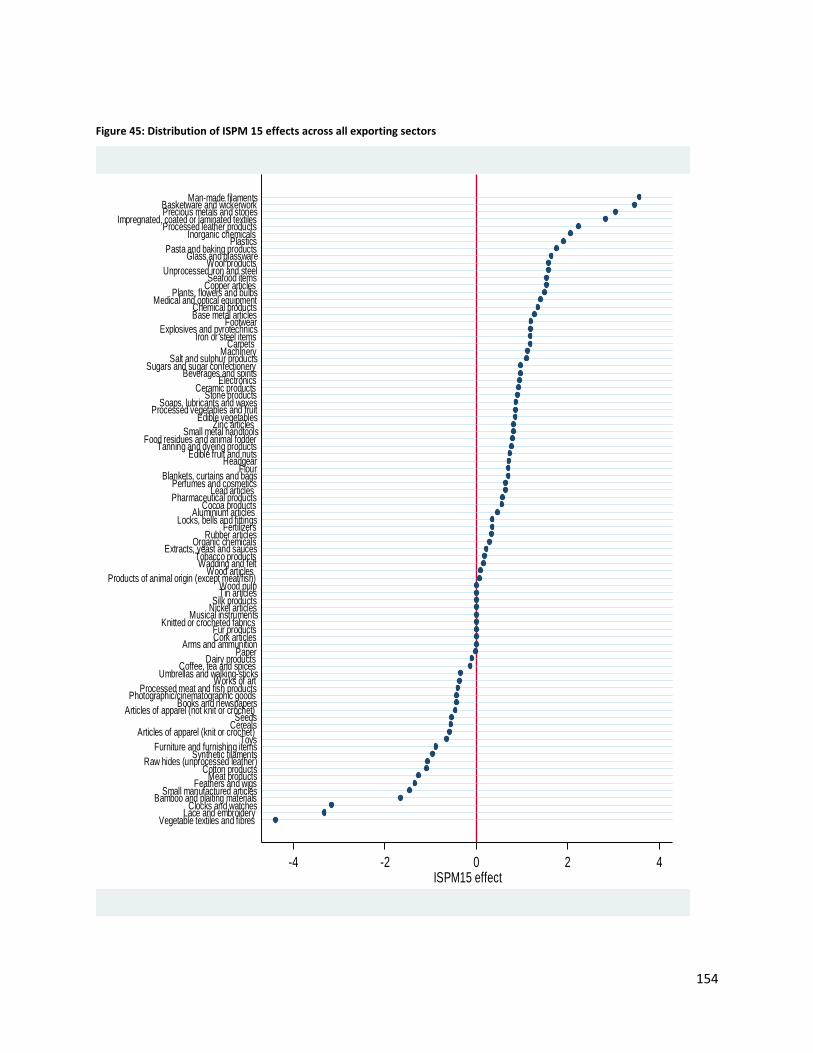
154
Figure 45: Distribution of ISPM 15 effects across all exporting sectors
-4 -2 0 2 4ISPM15 effect
Vegetable textiles and fibres Lace and embroidery
Clocks and watchesBamboo and plaiting materials
Small manufactured articlesFeathers and wigs
Meat productsCotton products
Raw hides (unprocessed leather)Synthetic filaments
Furniture and furnishing itemsToys
Articles of apparel (knit or crochet)Cereals
SeedsArticles of apparel (not knit or crochet)
Books and newspapersPhotographic/cinematographic goods
Processed meat and fish productsWorks of art
Umbrellas and walking-sticksCoffee, tea and spices
Dairy productsPaper
Arms and ammunitionCork articlesFur products
Knitted or crocheted fabricsMusical instruments
Nickel articlesSilk products
Tin articlesWood pulp
Products of animal origin (except meat/fish)Wood articles
Wadding and feltTobacco products
Extracts, yeast and saucesOrganic chemicals
Rubber articlesFertilizers
Locks, bells and fittingsAluminium articles
Cocoa productsPharmaceutical products
Lead articles Perfumes and cosmetics
Blankets, curtains and bagsFlour
HeadgearEdible fruit and nuts
Tanning and dyeing productsFood residues and animal fodder
Small metal handtoolsZinc articles
Edible vegetablesProcessed vegetables and fruit
Soaps, lubricants and waxesStone products
Ceramic productsElectronics
Beverages and spiritsSugars and sugar confectionery
Salt and sulphur productsMachinery
Carpets Iron or steel items
Explosives and pyrotechnicsFootwear
Base metal articlesChemical products
Medical and optical equipmentPlants, flowers and bulbs
Copper articlesSeafood items
Unprocessed iron and steelWool products
Glass and glasswarePasta and baking products
PlasticsInorganic chemicals
Processed leather productsImpregnated, coated or laminated textiles
Precious metals and stonesBasketware and wickerwork
Man-made filaments
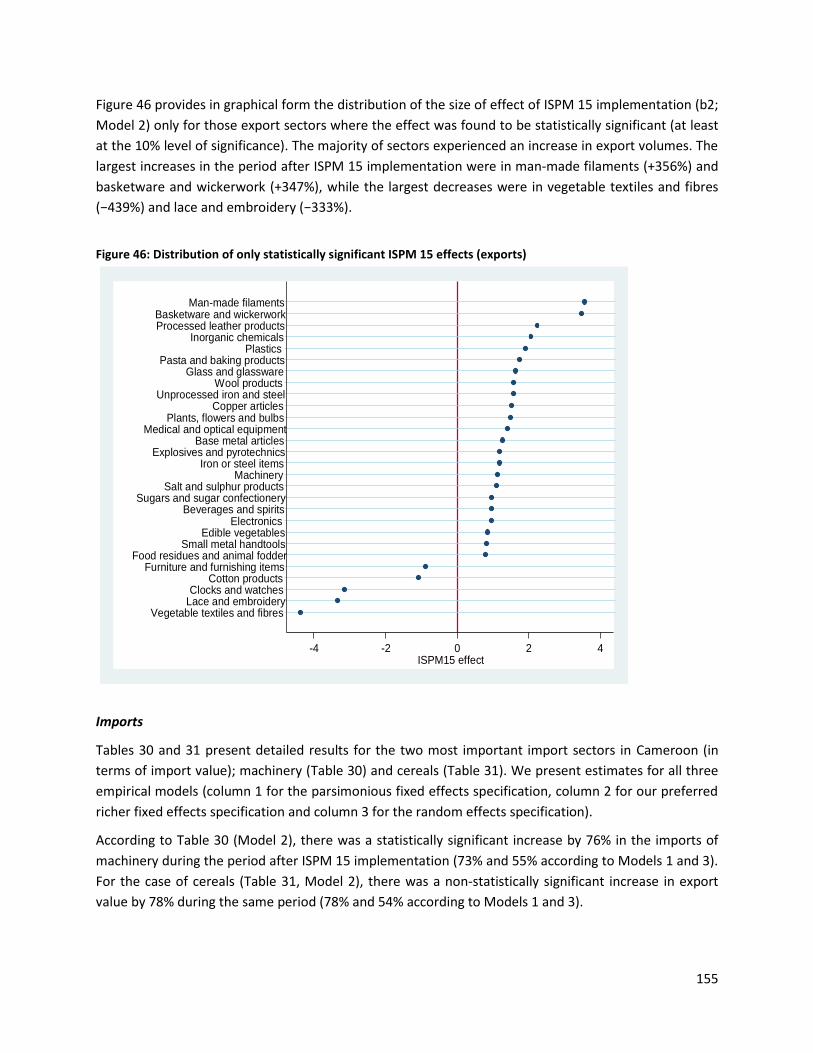
155
Figure 46 provides in graphical form the distribution of the size of effect of ISPM 15 implementation (b2;
Model 2) only for those export sectors where the effect was found to be statistically significant (at least
at the 10% level of significance). The majority of sectors experienced an increase in export volumes. The
largest increases in the period after ISPM 15 implementation were in man-made filaments (+356%) and
basketware and wickerwork (+347%), while the largest decreases were in vegetable textiles and fibres
(−439%) and lace and embroidery (−333%).
Figure 46: Distribution of only statistically significant ISPM 15 effects (exports)
Imports
Tables 30 and 31 present detailed results for the two most important import sectors in Cameroon (in
terms of import value); machinery (Table 30) and cereals (Table 31). We present estimates for all three
empirical models (column 1 for the parsimonious fixed effects specification, column 2 for our preferred
richer fixed effects specification and column 3 for the random effects specification).
According to Table 30 (Model 2), there was a statistically significant increase by 76% in the imports of
machinery during the period after ISPM 15 implementation (73% and 55% according to Models 1 and 3).
For the case of cereals (Table 31, Model 2), there was a non-statistically significant increase in export
value by 78% during the same period (78% and 54% according to Models 1 and 3).
-4 -2 0 2 4ISPM15 effect
Vegetable textiles and fibres Lace and embroideryClocks and watches
Cotton productsFurniture and furnishing items
Food residues and animal fodderSmall metal handtools
Edible vegetablesElectronics
Beverages and spiritsSugars and sugar confectionery
Salt and sulphur productsMachinery
Iron or steel itemsExplosives and pyrotechnics
Base metal articlesMedical and optical equipment
Plants, flowers and bulbsCopper articles
Unprocessed iron and steelWool products
Glass and glasswarePasta and baking products
PlasticsInorganic chemicals
Processed leather productsBasketware and wickerwork
Man-made filaments
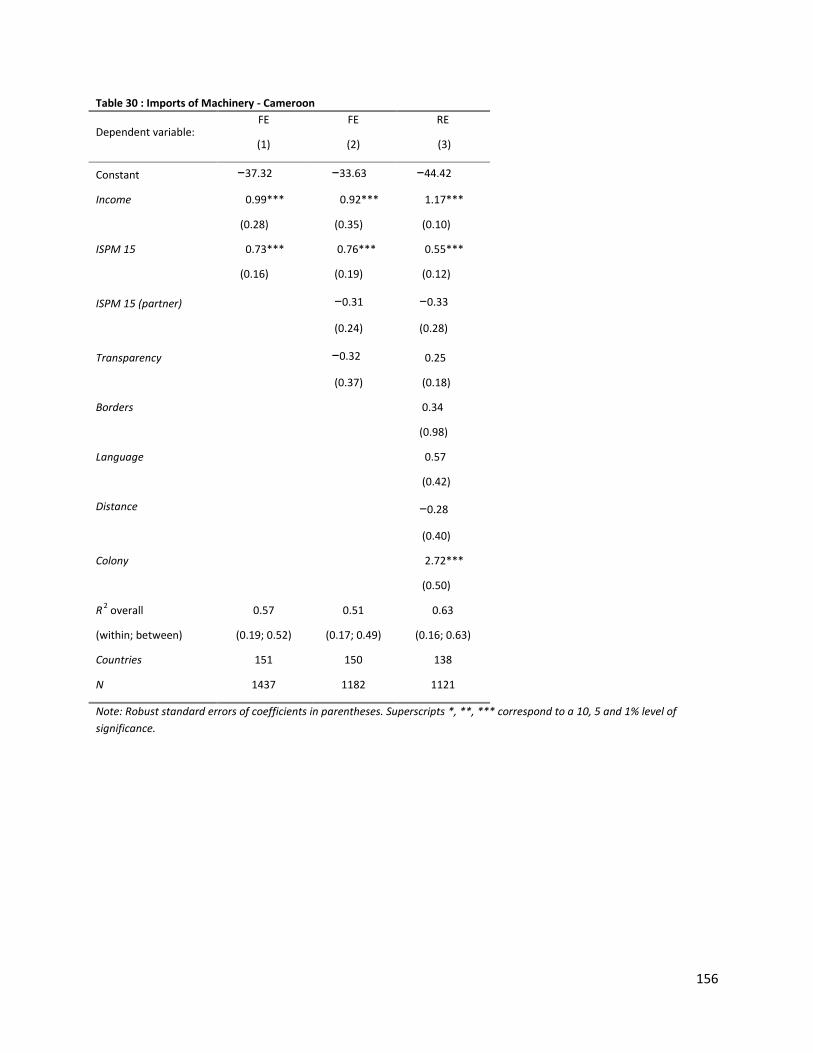
156
Table 30 : Imports of Machinery - Cameroon
Dependent variable: FE
(1)
FE
(2)
RE
(3)
Constant −37.32 −33.63 −44.42
Income
0.99***
(0.28)
0.92***
(0.35)
1.17***
(0.10)
ISPM 15
0.73***
(0.16)
0.76***
(0.19)
0.55***
(0.12)
ISPM 15 (partner)
−0.31
(0.24)
−0.33
(0.28)
Transparency
−0.32
(0.37)
0.25
(0.18)
Borders
0.34
(0.98)
Language
0.57
(0.42)
Distance
−0.28
(0.40)
Colony
2.72***
(0.50)
R2 overall
(within; between)
0.57
(0.19; 0.52)
0.51
(0.17; 0.49)
0.63
(0.16; 0.63)
Countries 151 150 138
N 1437 1182 1121
Note: Robust standard errors of coefficients in parentheses. Superscripts *, **, *** correspond to a 10, 5 and 1% level of
significance.
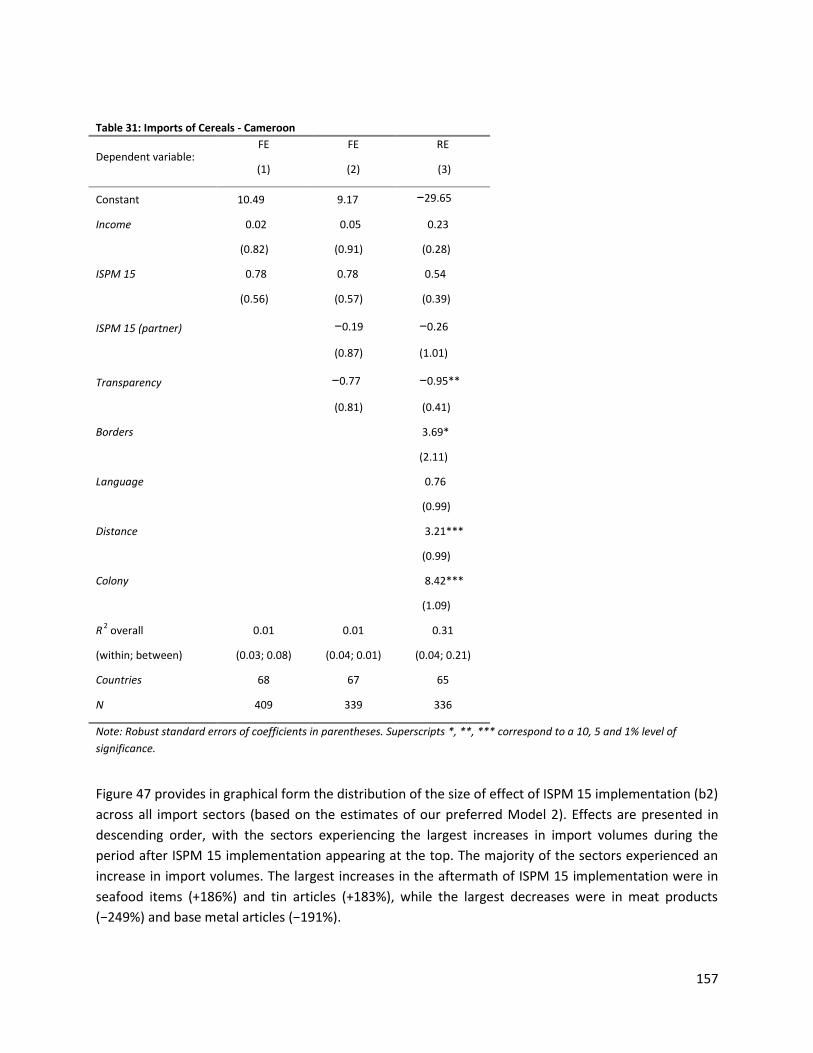
157
Table 31: Imports of Cereals - Cameroon
Dependent variable: FE
(1)
FE
(2)
RE
(3)
Constant 10.49 9.17 −29.65
Income
0.02
(0.82)
0.05
(0.91)
0.23
(0.28)
ISPM 15
0.78
(0.56)
0.78
(0.57)
0.54
(0.39)
ISPM 15 (partner)
−0.19
(0.87)
−0.26
(1.01)
Transparency
−0.77
(0.81)
−0.95**
(0.41)
Borders
3.69*
(2.11)
Language
0.76
(0.99)
Distance
3.21***
(0.99)
Colony
8.42***
(1.09)
R2 overall
(within; between)
0.01
(0.03; 0.08)
0.01
(0.04; 0.01)
0.31
(0.04; 0.21)
Countries 68 67 65
N 409 339 336
Note: Robust standard errors of coefficients in parentheses. Superscripts *, **, *** correspond to a 10, 5 and 1% level of
significance.
Figure 47 provides in graphical form the distribution of the size of effect of ISPM 15 implementation (b2)
across all import sectors (based on the estimates of our preferred Model 2). Effects are presented in
descending order, with the sectors experiencing the largest increases in import volumes during the
period after ISPM 15 implementation appearing at the top. The majority of the sectors experienced an
increase in import volumes. The largest increases in the aftermath of ISPM 15 implementation were in
seafood items (+186%) and tin articles (+183%), while the largest decreases were in meat products
(−249%) and base metal articles (−191%).
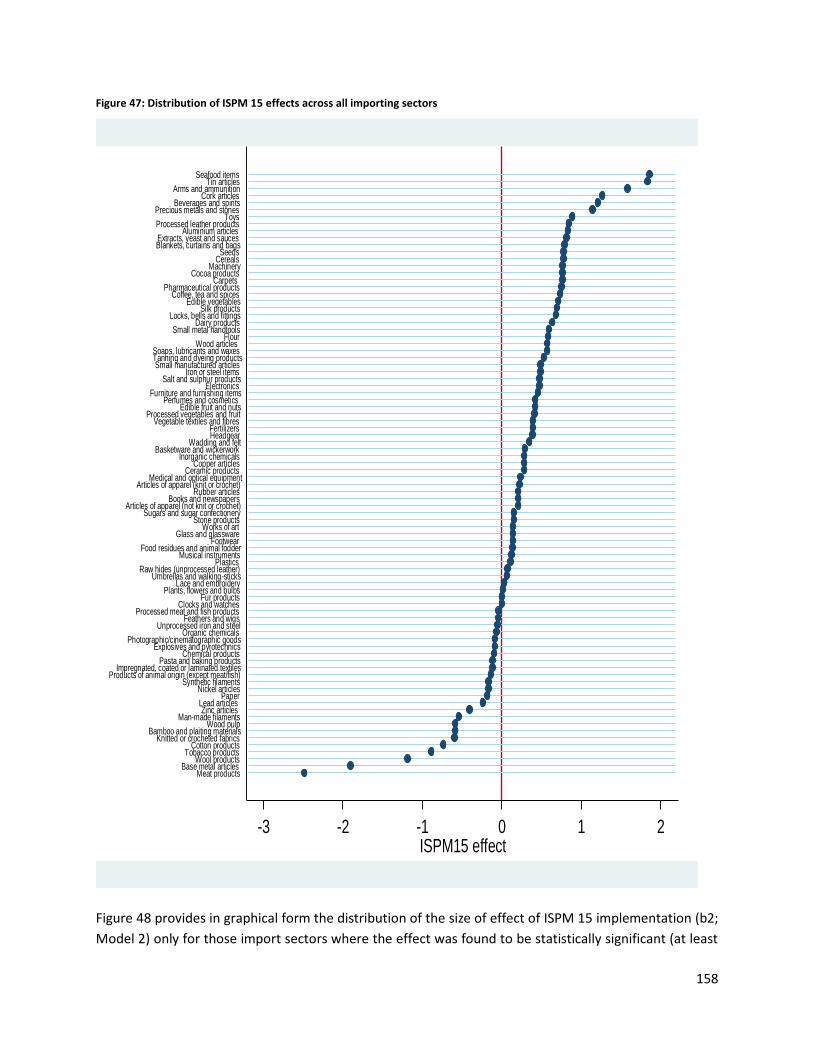
158
Figure 47: Distribution of ISPM 15 effects across all importing sectors
Figure 48 provides in graphical form the distribution of the size of effect of ISPM 15 implementation (b2;
Model 2) only for those import sectors where the effect was found to be statistically significant (at least
-3 -2 -1 0 1 2ISPM15 effect
Meat productsBase metal articles
Wool productsTobacco products
Cotton productsKnitted or crocheted fabrics
Bamboo and plaiting materialsWood pulp
Man-made filamentsZinc articles
Lead articles Paper
Nickel articlesSynthetic filaments
Products of animal origin (except meat/fish)Impregnated, coated or laminated textiles
Pasta and baking productsChemical products
Explosives and pyrotechnicsPhotographic/cinematographic goods
Organic chemicalsUnprocessed iron and steel
Feathers and wigsProcessed meat and fish products
Clocks and watchesFur products
Plants, flowers and bulbsLace and embroidery
Umbrellas and walking-sticksRaw hides (unprocessed leather)
PlasticsMusical instruments
Food residues and animal fodderFootwear
Glass and glasswareWorks of art
Stone productsSugars and sugar confectionery
Articles of apparel (not knit or crochet)Books and newspapers
Rubber articlesArticles of apparel (knit or crochet)
Medical and optical equipmentCeramic products
Copper articlesInorganic chemicals
Basketware and wickerworkWadding and felt
HeadgearFertilizers
Vegetable textiles and fibres Processed vegetables and fruit
Edible fruit and nutsPerfumes and cosmetics
Furniture and furnishing itemsElectronics
Salt and sulphur productsIron or steel items
Small manufactured articlesTanning and dyeing productsSoaps, lubricants and waxes
Wood articles Flour
Small metal handtoolsDairy products
Locks, bells and fittingsSilk products
Edible vegetablesCoffee, tea and spices
Pharmaceutical productsCarpets
Cocoa productsMachinery
CerealsSeeds
Blankets, curtains and bagsExtracts, yeast and sauces
Aluminium articles Processed leather products
ToysPrecious metals and stones
Beverages and spiritsCork articles
Arms and ammunitionTin articles
Seafood items
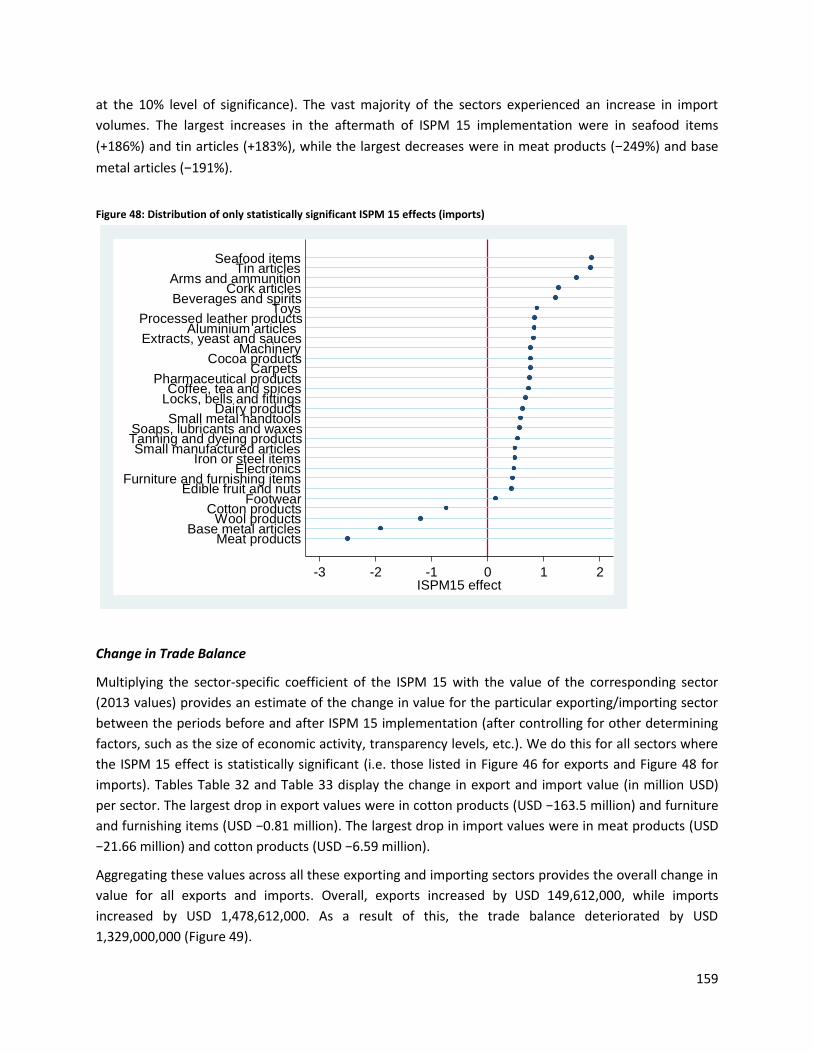
159
at the 10% level of significance). The vast majority of the sectors experienced an increase in import
volumes. The largest increases in the aftermath of ISPM 15 implementation were in seafood items
(+186%) and tin articles (+183%), while the largest decreases were in meat products (−249%) and base
metal articles (−191%).
Figure 48: Distribution of only statistically significant ISPM 15 effects (imports)
Change in Trade Balance
Multiplying the sector-specific coefficient of the ISPM 15 with the value of the corresponding sector
(2013 values) provides an estimate of the change in value for the particular exporting/importing sector
between the periods before and after ISPM 15 implementation (after controlling for other determining
factors, such as the size of economic activity, transparency levels, etc.). We do this for all sectors where
the ISPM 15 effect is statistically significant (i.e. those listed in Figure 46 for exports and Figure 48 for
imports). Tables Table 32 and Table 33 display the change in export and import value (in million USD)
per sector. The largest drop in export values were in cotton products (USD −163.5 million) and furniture
and furnishing items (USD −0.81 million). The largest drop in import values were in meat products (USD
−21.66 million) and cotton products (USD −6.59 million).
Aggregating these values across all these exporting and importing sectors provides the overall change in
value for all exports and imports. Overall, exports increased by USD 149,612,000, while imports
increased by USD 1,478,612,000. As a result of this, the trade balance deteriorated by USD
1,329,000,000 (Figure 49).
-3 -2 -1 0 1 2ISPM15 effect
Meat productsBase metal articles
Wool productsCotton products
FootwearEdible fruit and nuts
Furniture and furnishing itemsElectronics
Iron or steel itemsSmall manufactured articles
Tanning and dyeing productsSoaps, lubricants and waxes
Small metal handtoolsDairy products
Locks, bells and fittingsCoffee, tea and spices
Pharmaceutical productsCarpets
Cocoa productsMachinery
Extracts, yeast and saucesAluminium articles
Processed leather productsToys
Beverages and spiritsCork articles
Arms and ammunitionTin articles
Seafood items
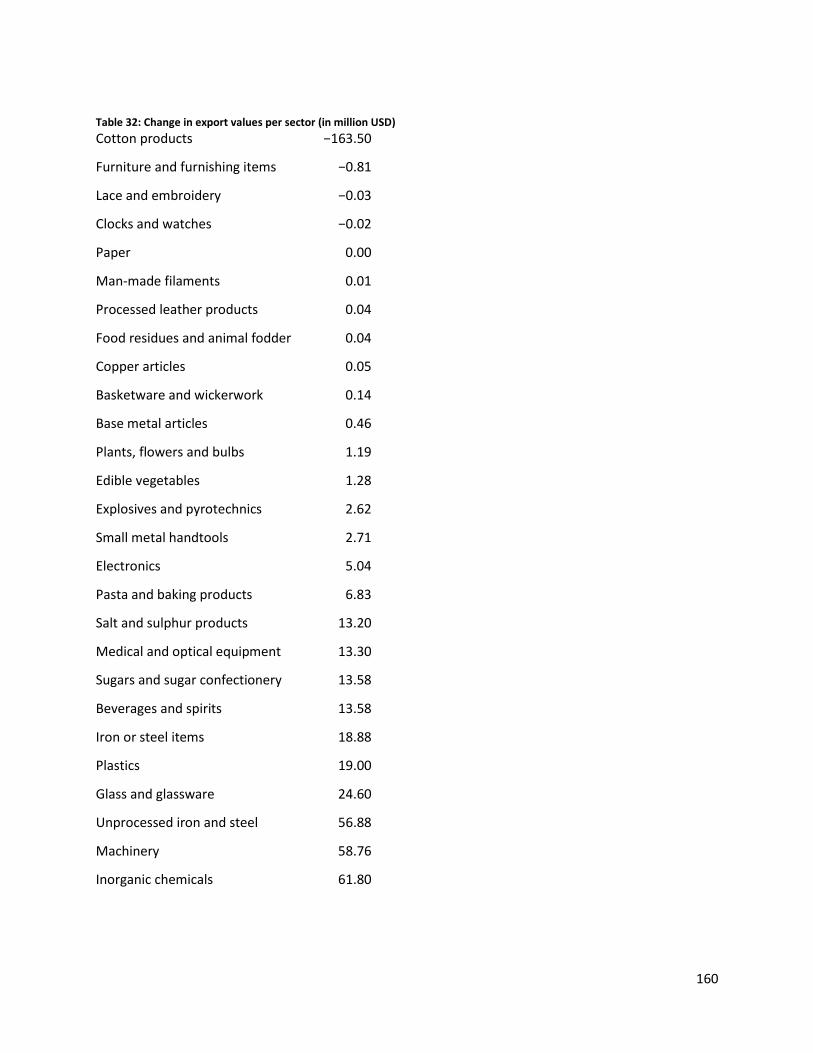
160
Table 32: Change in export values per sector (in million USD)
Cotton products −163.50
Furniture and furnishing items −0.81
Lace and embroidery −0.03
Clocks and watches −0.02
Paper 0.00
Man-made filaments 0.01
Processed leather products 0.04
Food residues and animal fodder 0.04
Copper articles 0.05
Basketware and wickerwork 0.14
Base metal articles 0.46
Plants, flowers and bulbs 1.19
Edible vegetables 1.28
Explosives and pyrotechnics 2.62
Small metal handtools 2.71
Electronics 5.04
Pasta and baking products 6.83
Salt and sulphur products 13.20
Medical and optical equipment 13.30
Sugars and sugar confectionery 13.58
Beverages and spirits 13.58
Iron or steel items 18.88
Plastics 19.00
Glass and glassware 24.60
Unprocessed iron and steel 56.88
Machinery 58.76
Inorganic chemicals 61.80
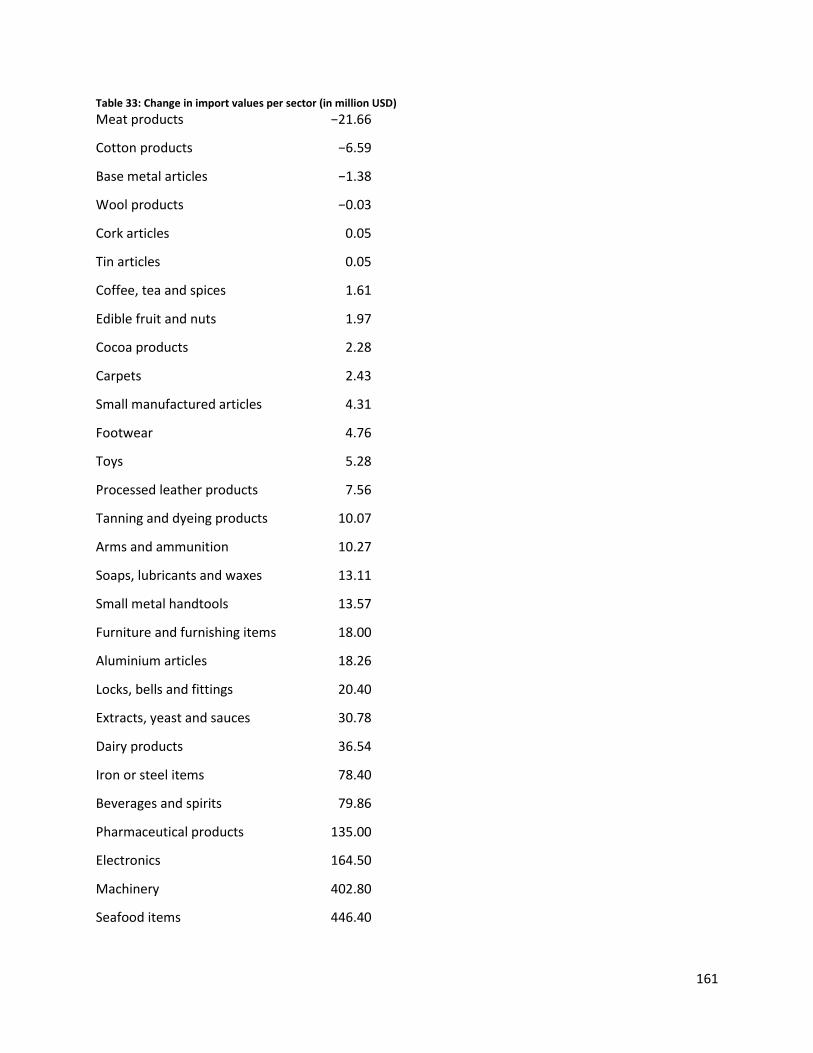
161
Table 33: Change in import values per sector (in million USD)
Meat products −21.66
Cotton products −6.59
Base metal articles −1.38
Wool products −0.03
Cork articles 0.05
Tin articles 0.05
Coffee, tea and spices 1.61
Edible fruit and nuts 1.97
Cocoa products 2.28
Carpets 2.43
Small manufactured articles 4.31
Footwear 4.76
Toys 5.28
Processed leather products 7.56
Tanning and dyeing products 10.07
Arms and ammunition 10.27
Soaps, lubricants and waxes 13.11
Small metal handtools 13.57
Furniture and furnishing items 18.00
Aluminium articles 18.26
Locks, bells and fittings 20.40
Extracts, yeast and sauces 30.78
Dairy products 36.54
Iron or steel items 78.40
Beverages and spirits 79.86
Pharmaceutical products 135.00
Electronics 164.50
Machinery 402.80
Seafood items 446.40
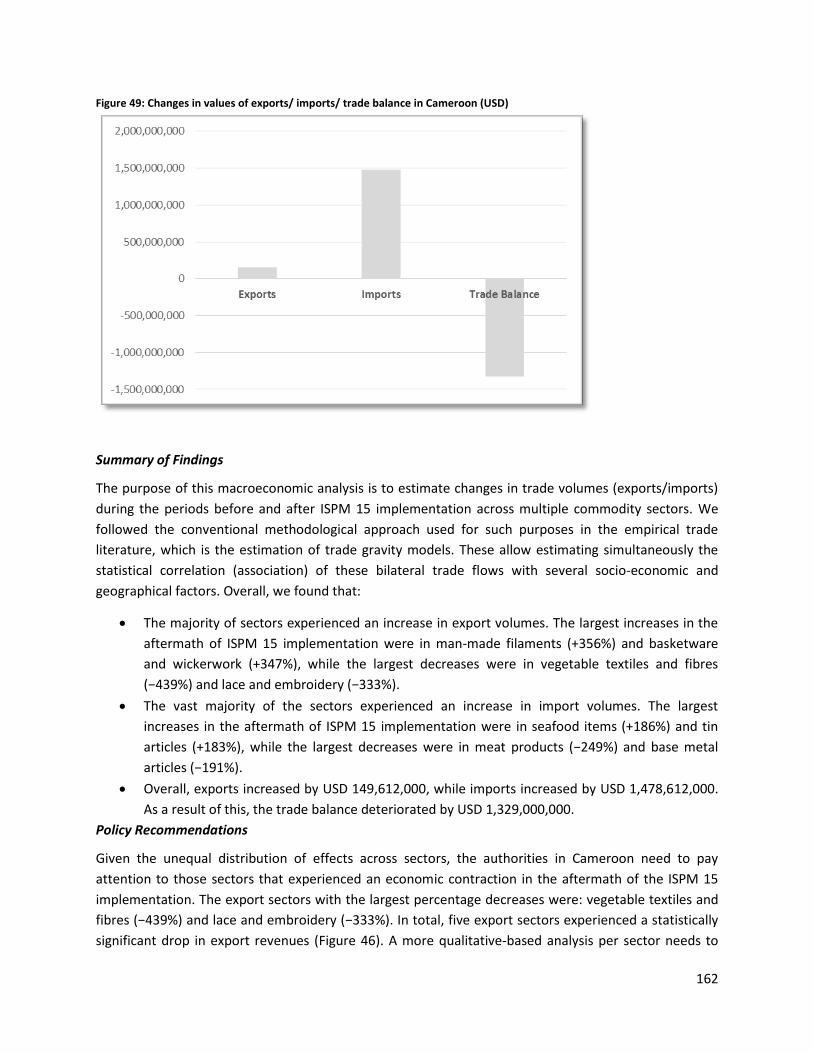
162
Figure 49: Changes in values of exports/ imports/ trade balance in Cameroon (USD)
Summary of Findings
The purpose of this macroeconomic analysis is to estimate changes in trade volumes (exports/imports)
during the periods before and after ISPM 15 implementation across multiple commodity sectors. We
followed the conventional methodological approach used for such purposes in the empirical trade
literature, which is the estimation of trade gravity models. These allow estimating simultaneously the
statistical correlation (association) of these bilateral trade flows with several socio-economic and
geographical factors. Overall, we found that:
The majority of sectors experienced an increase in export volumes. The largest increases in the
aftermath of ISPM 15 implementation were in man-made filaments (+356%) and basketware
and wickerwork (+347%), while the largest decreases were in vegetable textiles and fibres
(−439%) and lace and embroidery (−333%).
The vast majority of the sectors experienced an increase in import volumes. The largest
increases in the aftermath of ISPM 15 implementation were in seafood items (+186%) and tin
articles (+183%), while the largest decreases were in meat products (−249%) and base metal
articles (−191%).
Overall, exports increased by USD 149,612,000, while imports increased by USD 1,478,612,000.
As a result of this, the trade balance deteriorated by USD 1,329,000,000.
Policy Recommendations
Given the unequal distribution of effects across sectors, the authorities in Cameroon need to pay
attention to those sectors that experienced an economic contraction in the aftermath of the ISPM 15
implementation. The export sectors with the largest percentage decreases were: vegetable textiles and
fibres (−439%) and lace and embroidery (−333%). In total, five export sectors experienced a statistically
significant drop in export revenues (Figure 46). A more qualitative-based analysis per sector needs to
163
identify the extent to which the drop in export revenues for each sector has been associated with the
administrative burden and costs associated with the implementation of ISPM 15 in combination with
other underlying internal and external factors (e.g. changes in prices locally and globally, emergence of
new competitors, constraints in domestic productive capacity, or exchange rate volatility). The same
should also apply in the context of import sectors.
In Cameroon, the ISPM 15 implementation appears to be associated with an overall increase in both
exports and imports. Overall, exports increased by USD 149,612,000, while imports increased by much
more (USD 1,478,612,000). As a result of this, the trade balance deteriorated by USD 1,329,000,000. This
is an issue of concern, given that Cameroon has been running an overall trade deficit since 2008.
Supporting those exporting industries that experienced a contraction in the aftermath of ISPM 15
implementation could at least partly offset these persistent trade deficits. Alternatively the government
could support those sectors that grew substantially after the implementation of ISPM 15, as long as
these industries can expand further and compensate for the value and employment loss that other
contracting sectors experienced.
5.3.4. Mozambique
Exports
Tables 34 and 35 present detailed results for the two most important export sectors of Mozambique (in
terms of export value); aluminium articles (
Table 34) and tobacco products (
Table 35). We present estimates for all three empirical models (column 1 for the parsimonious fixed
effects specification, column 2 for our preferred richer fixed effects specification and column 3 for the
random effects specification).
164
According to
Table 34 (Model 2), there was a non-statistically significant decline by 64% in the exports of aluminium
articles during the period after ISPM 15 implementation (−86% and −5% according to Models 1 and
3). For the case of tobacco (
Table 35, Model 2), there was a non-statistically significant increase by 144% during the same period
(3% and 232% according to Models 1 and 3).
Table 34: Exports of aluminum articles - Mozambique
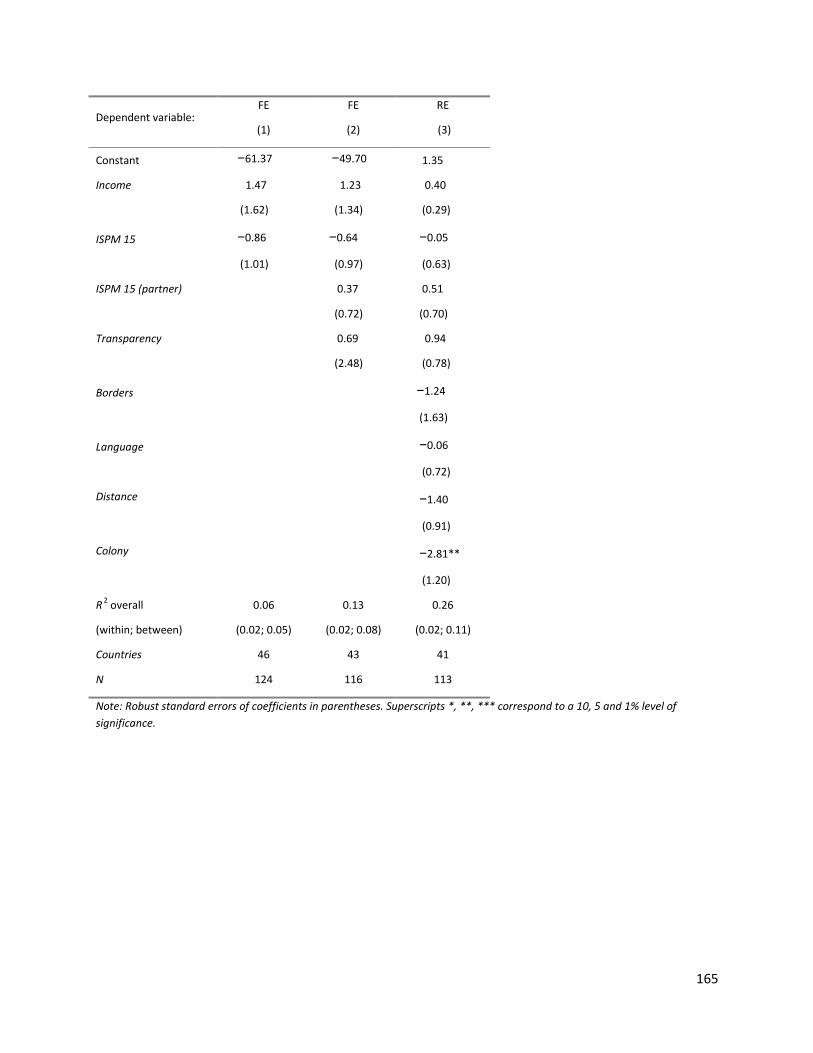
165
Dependent variable: FE
(1)
FE
(2)
RE
(3)
Constant −61.37 −49.70 1.35
Income
1.47
(1.62)
1.23
(1.34)
0.40
(0.29)
ISPM 15
−0.86
(1.01)
−0.64
(0.97)
−0.05
(0.63)
ISPM 15 (partner)
0.37
(0.72)
0.51
(0.70)
Transparency
0.69
(2.48)
0.94
(0.78)
Borders
−1.24
(1.63)
Language
−0.06
(0.72)
Distance
−1.40
(0.91)
Colony
−2.81**
(1.20)
R2 overall
(within; between)
0.06
(0.02; 0.05)
0.13
(0.02; 0.08)
0.26
(0.02; 0.11)
Countries 46 43 41
N 124 116 113
Note: Robust standard errors of coefficients in parentheses. Superscripts *, **, *** correspond to a 10, 5 and 1% level of
significance.
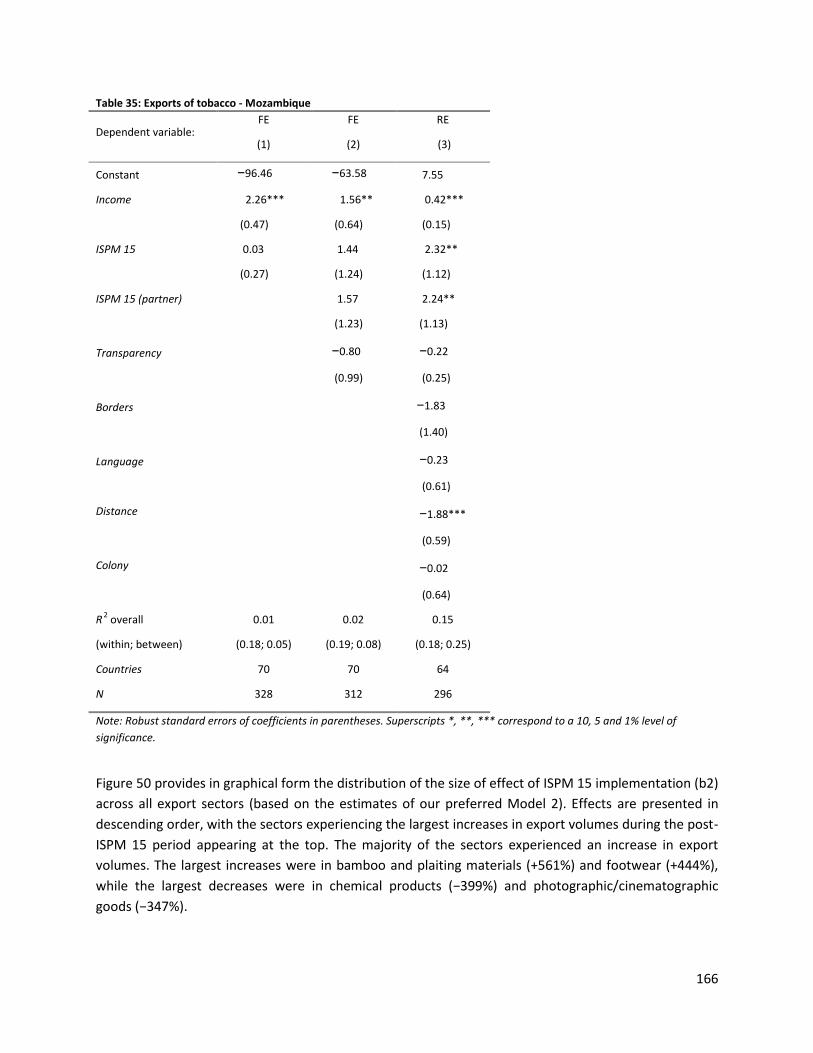
166
Table 35: Exports of tobacco - Mozambique
Dependent variable: FE
(1)
FE
(2)
RE
(3)
Constant −96.46 −63.58 7.55
Income
2.26***
(0.47)
1.56**
(0.64)
0.42***
(0.15)
ISPM 15
0.03
(0.27)
1.44
(1.24)
2.32**
(1.12)
ISPM 15 (partner)
1.57
(1.23)
2.24**
(1.13)
Transparency
−0.80
(0.99)
−0.22
(0.25)
Borders
−1.83
(1.40)
Language
−0.23
(0.61)
Distance
−1.88***
(0.59)
Colony
−0.02
(0.64)
R2 overall
(within; between)
0.01
(0.18; 0.05)
0.02
(0.19; 0.08)
0.15
(0.18; 0.25)
Countries 70 70 64
N 328 312 296
Note: Robust standard errors of coefficients in parentheses. Superscripts *, **, *** correspond to a 10, 5 and 1% level of
significance.
Figure 50 provides in graphical form the distribution of the size of effect of ISPM 15 implementation (b2)
across all export sectors (based on the estimates of our preferred Model 2). Effects are presented in
descending order, with the sectors experiencing the largest increases in export volumes during the post-
ISPM 15 period appearing at the top. The majority of the sectors experienced an increase in export
volumes. The largest increases were in bamboo and plaiting materials (+561%) and footwear (+444%),
while the largest decreases were in chemical products (−399%) and photographic/cinematographic
goods (−347%).
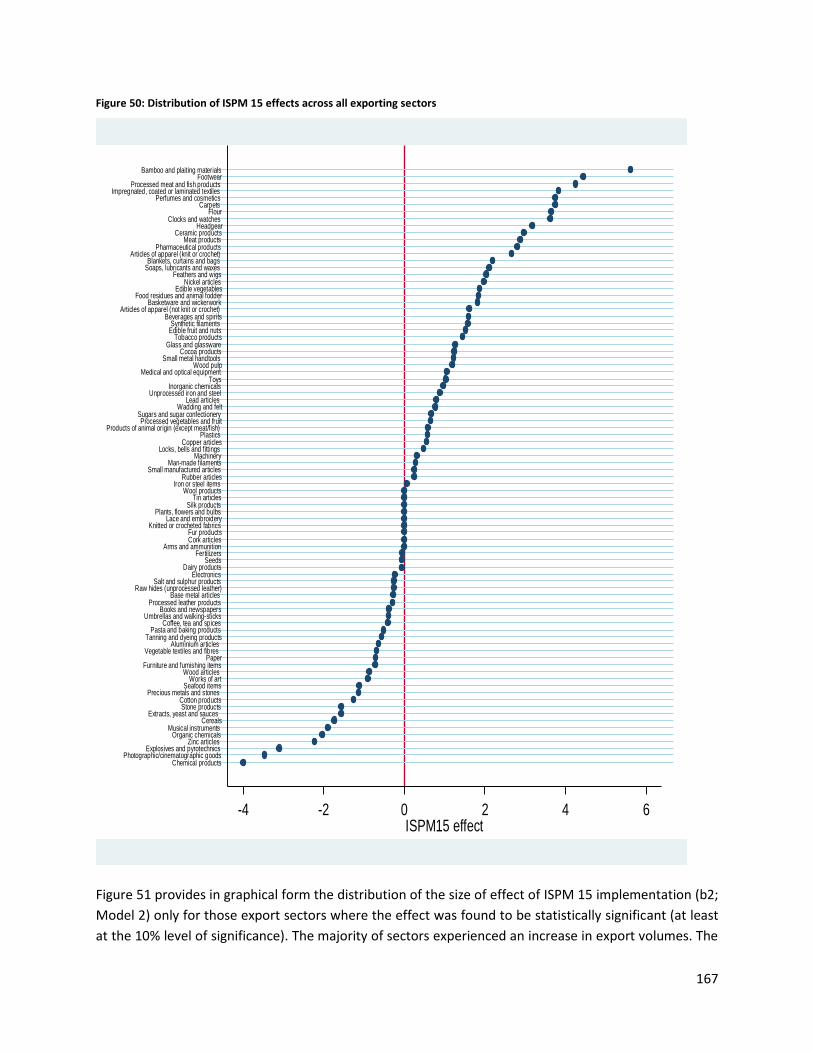
167
Figure 50: Distribution of ISPM 15 effects across all exporting sectors
Figure 51 provides in graphical form the distribution of the size of effect of ISPM 15 implementation (b2;
Model 2) only for those export sectors where the effect was found to be statistically significant (at least
at the 10% level of significance). The majority of sectors experienced an increase in export volumes. The
-4 -2 0 2 4 6ISPM15 effect
Chemical productsPhotographic/cinematographic goods
Explosives and pyrotechnicsZinc articles
Organic chemicalsMusical instruments
CerealsExtracts, yeast and sauces
Stone productsCotton products
Precious metals and stonesSeafood items
Works of artWood articles
Furniture and furnishing itemsPaper
Vegetable textiles and fibres Aluminium articles
Tanning and dyeing productsPasta and baking products
Coffee, tea and spicesUmbrellas and walking-sticks
Books and newspapersProcessed leather products
Base metal articlesRaw hides (unprocessed leather)
Salt and sulphur productsElectronics
Dairy productsSeeds
FertilizersArms and ammunition
Cork articlesFur products
Knitted or crocheted fabricsLace and embroidery
Plants, flowers and bulbsSilk products
Tin articlesWool products
Iron or steel itemsRubber articles
Small manufactured articlesMan-made filaments
MachineryLocks, bells and fittings
Copper articlesPlastics
Products of animal origin (except meat/fish)Processed vegetables and fruit
Sugars and sugar confectioneryWadding and felt
Lead articles Unprocessed iron and steel
Inorganic chemicalsToys
Medical and optical equipmentWood pulp
Small metal handtoolsCocoa products
Glass and glasswareTobacco products
Edible fruit and nutsSynthetic filaments
Beverages and spiritsArticles of apparel (not knit or crochet)
Basketware and wickerworkFood residues and animal fodder
Edible vegetablesNickel articles
Feathers and wigsSoaps, lubricants and waxesBlankets, curtains and bags
Articles of apparel (knit or crochet)Pharmaceutical products
Meat productsCeramic products
HeadgearClocks and watches
FlourCarpets
Perfumes and cosmeticsImpregnated, coated or laminated textiles
Processed meat and fish productsFootwear
Bamboo and plaiting materials
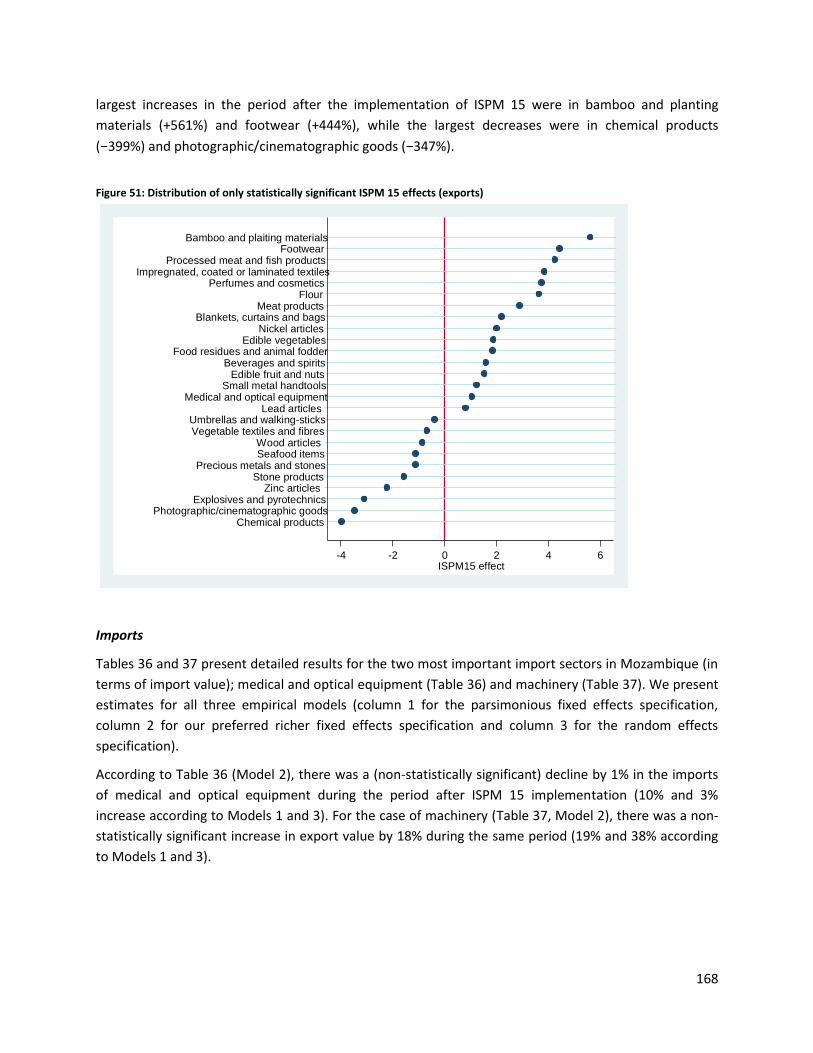
168
largest increases in the period after the implementation of ISPM 15 were in bamboo and planting
materials (+561%) and footwear (+444%), while the largest decreases were in chemical products
(−399%) and photographic/cinematographic goods (−347%).
Figure 51: Distribution of only statistically significant ISPM 15 effects (exports)
Imports
Tables 36 and 37 present detailed results for the two most important import sectors in Mozambique (in
terms of import value); medical and optical equipment (Table 36) and machinery (Table 37). We present
estimates for all three empirical models (column 1 for the parsimonious fixed effects specification,
column 2 for our preferred richer fixed effects specification and column 3 for the random effects
specification).
According to Table 36 (Model 2), there was a (non-statistically significant) decline by 1% in the imports
of medical and optical equipment during the period after ISPM 15 implementation (10% and 3%
increase according to Models 1 and 3). For the case of machinery (Table 37, Model 2), there was a non-
statistically significant increase in export value by 18% during the same period (19% and 38% according
to Models 1 and 3).
-4 -2 0 2 4 6ISPM15 effect
Chemical productsPhotographic/cinematographic goods
Explosives and pyrotechnicsZinc articles
Stone productsPrecious metals and stones
Seafood itemsWood articles
Vegetable textiles and fibres Umbrellas and walking-sticks
Lead articles Medical and optical equipment
Small metal handtoolsEdible fruit and nuts
Beverages and spiritsFood residues and animal fodder
Edible vegetablesNickel articles
Blankets, curtains and bagsMeat products
FlourPerfumes and cosmetics
Impregnated, coated or laminated textilesProcessed meat and fish products
FootwearBamboo and plaiting materials

169
Table 36: Imports and medical and optical equipment - Mozambique
Dependent variable: FE
(1)
FE
(2)
RE
(3)
Constant −22.55 −34.58 −17.90
Income
0.68***
(0.22)
0.92***
(0.31)
0.81***
(0.11)
ISPM 15
0.10
(0.18)
−0.01
(0.21)
0.03
(0.16)
ISPM 15 (partner)
−0.47
(1.32)
−0.95
(1.43)
Transparency
0.42
(0.43)
0.52***
(0.17)
Borders
−0.06
(1.32)
Language
1.15
(0.79)
Distance
−1.32***
(0.40)
Colony
3.61***
(0.77)
R2 overall
(within; between)
0.29
(0.04; 0.30)
0.32
(0.05; 0.31)
0.43
(0.05; 0.47)
Countries 128 124 103
N 882 785 725
Note: Robust standard errors of coefficients in parentheses. Superscripts *, **, *** correspond to a 10, 5 and 1% level of
significance.
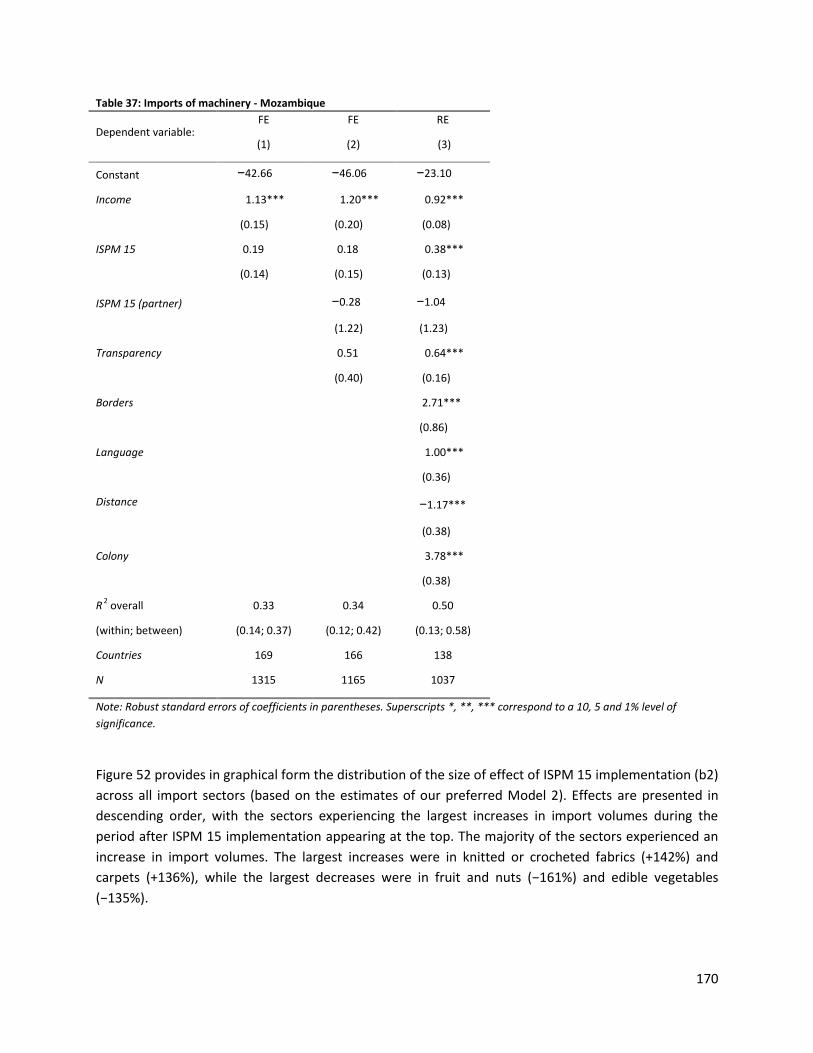
170
Table 37: Imports of machinery - Mozambique
Dependent variable: FE
(1)
FE
(2)
RE
(3)
Constant −42.66 −46.06 −23.10
Income
1.13***
(0.15)
1.20***
(0.20)
0.92***
(0.08)
ISPM 15
0.19
(0.14)
0.18
(0.15)
0.38***
(0.13)
ISPM 15 (partner)
−0.28
(1.22)
−1.04
(1.23)
Transparency
0.51
(0.40)
0.64***
(0.16)
Borders
2.71***
(0.86)
Language
1.00***
(0.36)
Distance
−1.17***
(0.38)
Colony
3.78***
(0.38)
R2 overall
(within; between)
0.33
(0.14; 0.37)
0.34
(0.12; 0.42)
0.50
(0.13; 0.58)
Countries 169 166 138
N 1315 1165 1037
Note: Robust standard errors of coefficients in parentheses. Superscripts *, **, *** correspond to a 10, 5 and 1% level of
significance.
Figure 52 provides in graphical form the distribution of the size of effect of ISPM 15 implementation (b2)
across all import sectors (based on the estimates of our preferred Model 2). Effects are presented in
descending order, with the sectors experiencing the largest increases in import volumes during the
period after ISPM 15 implementation appearing at the top. The majority of the sectors experienced an
increase in import volumes. The largest increases were in knitted or crocheted fabrics (+142%) and
carpets (+136%), while the largest decreases were in fruit and nuts (−161%) and edible vegetables
(−135%).
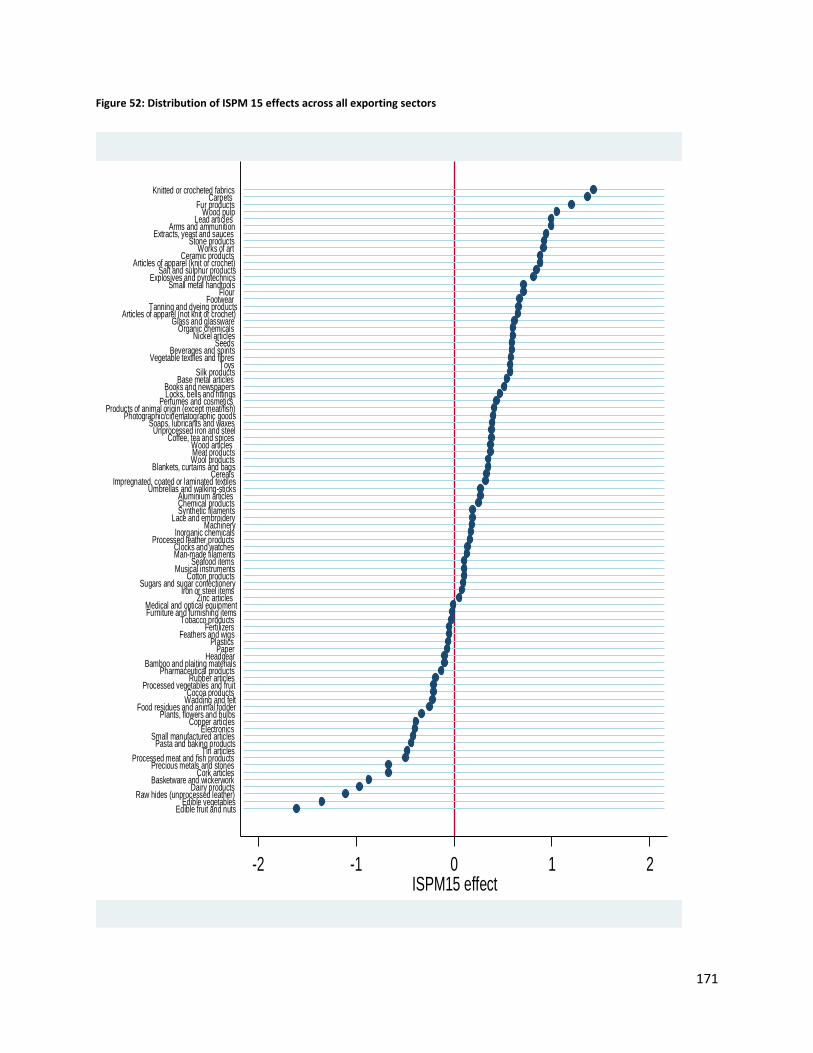
171
Figure 52: Distribution of ISPM 15 effects across all exporting sectors
-2 -1 0 1 2ISPM15 effect
Edible fruit and nutsEdible vegetables
Raw hides (unprocessed leather)Dairy products
Basketware and wickerworkCork articles
Precious metals and stonesProcessed meat and fish products
Tin articlesPasta and baking products
Small manufactured articlesElectronics
Copper articlesPlants, flowers and bulbs
Food residues and animal fodderWadding and feltCocoa products
Processed vegetables and fruitRubber articles
Pharmaceutical productsBamboo and plaiting materials
HeadgearPaper
PlasticsFeathers and wigs
FertilizersTobacco products
Furniture and furnishing itemsMedical and optical equipment
Zinc articles Iron or steel items
Sugars and sugar confectioneryCotton products
Musical instrumentsSeafood items
Man-made filamentsClocks and watches
Processed leather productsInorganic chemicals
MachineryLace and embroidery
Synthetic filamentsChemical productsAluminium articles
Umbrellas and walking-sticksImpregnated, coated or laminated textiles
CerealsBlankets, curtains and bags
Wool productsMeat productsWood articles
Coffee, tea and spicesUnprocessed iron and steel
Soaps, lubricants and waxesPhotographic/cinematographic goods
Products of animal origin (except meat/fish)Perfumes and cosmetics
Locks, bells and fittingsBooks and newspapers
Base metal articlesSilk products
ToysVegetable textiles and fibres
Beverages and spiritsSeeds
Nickel articlesOrganic chemicals
Glass and glasswareArticles of apparel (not knit or crochet)
Tanning and dyeing productsFootwear
FlourSmall metal handtools
Explosives and pyrotechnicsSalt and sulphur products
Articles of apparel (knit or crochet)Ceramic products
Works of artStone products
Extracts, yeast and saucesArms and ammunition
Lead articles Wood pulp
Fur productsCarpets
Knitted or crocheted fabrics
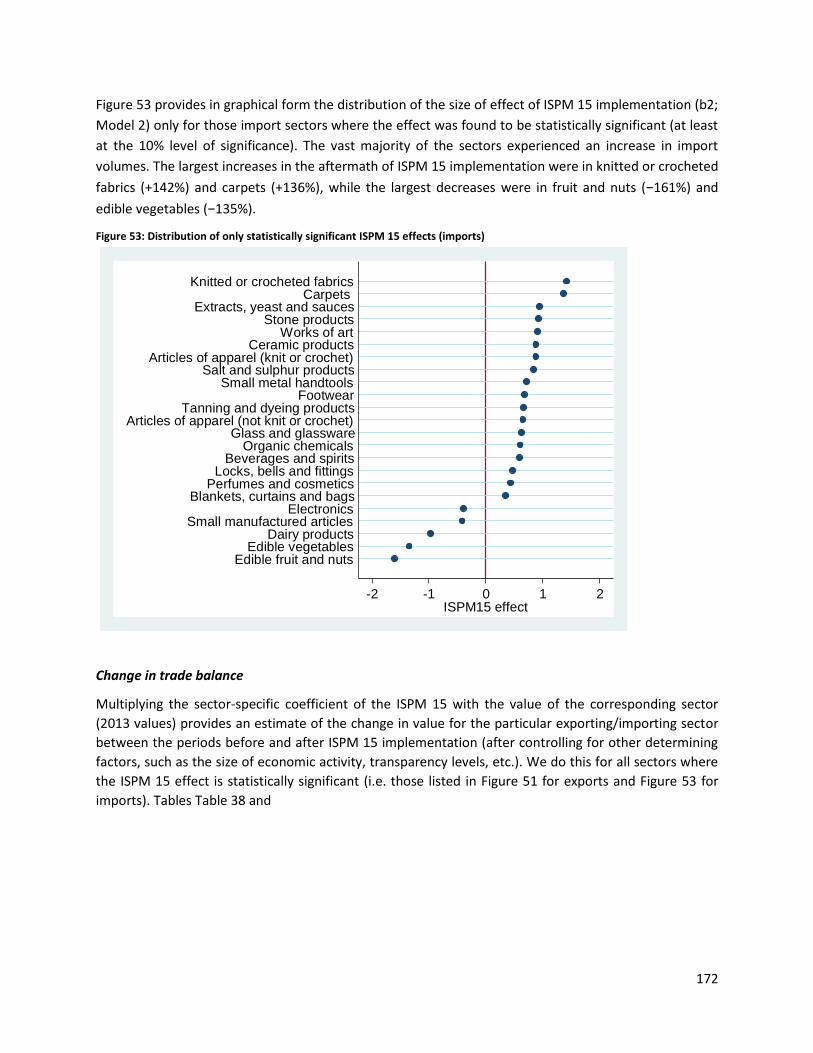
172
Figure 53 provides in graphical form the distribution of the size of effect of ISPM 15 implementation (b2;
Model 2) only for those import sectors where the effect was found to be statistically significant (at least
at the 10% level of significance). The vast majority of the sectors experienced an increase in import
volumes. The largest increases in the aftermath of ISPM 15 implementation were in knitted or crocheted
fabrics (+142%) and carpets (+136%), while the largest decreases were in fruit and nuts (−161%) and
edible vegetables (−135%).
Figure 53: Distribution of only statistically significant ISPM 15 effects (imports)
Change in trade balance
Multiplying the sector-specific coefficient of the ISPM 15 with the value of the corresponding sector
(2013 values) provides an estimate of the change in value for the particular exporting/importing sector
between the periods before and after ISPM 15 implementation (after controlling for other determining
factors, such as the size of economic activity, transparency levels, etc.). We do this for all sectors where
the ISPM 15 effect is statistically significant (i.e. those listed in Figure 51 for exports and Figure 53 for
imports). Tables Table 38 and
-2 -1 0 1 2ISPM15 effect
Edible fruit and nutsEdible vegetables
Dairy productsSmall manufactured articles
ElectronicsBlankets, curtains and bags
Perfumes and cosmeticsLocks, bells and fittings
Beverages and spiritsOrganic chemicals
Glass and glasswareArticles of apparel (not knit or crochet)
Tanning and dyeing productsFootwear
Small metal handtoolsSalt and sulphur products
Articles of apparel (knit or crochet)Ceramic products
Works of artStone products
Extracts, yeast and saucesCarpets
Knitted or crocheted fabrics
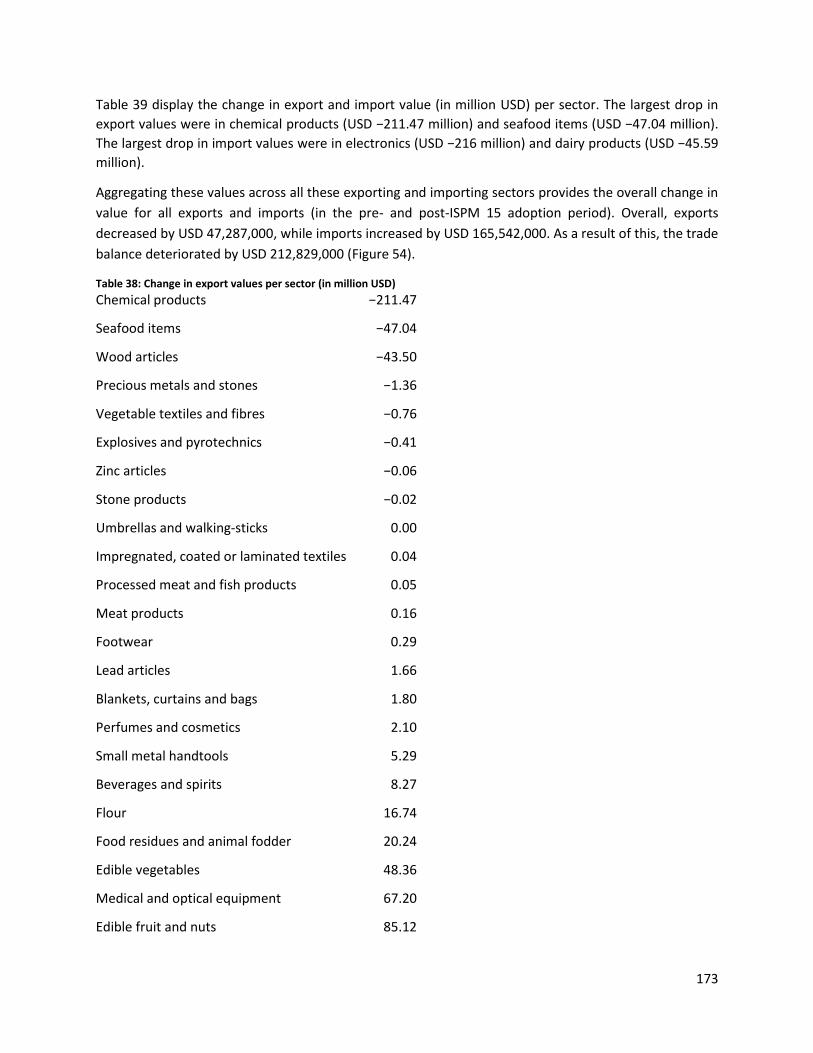
173
Table 39 display the change in export and import value (in million USD) per sector. The largest drop in
export values were in chemical products (USD −211.47 million) and seafood items (USD −47.04 million).
The largest drop in import values were in electronics (USD −216 million) and dairy products (USD −45.59
million).
Aggregating these values across all these exporting and importing sectors provides the overall change in
value for all exports and imports (in the pre- and post-ISPM 15 adoption period). Overall, exports
decreased by USD 47,287,000, while imports increased by USD 165,542,000. As a result of this, the trade
balance deteriorated by USD 212,829,000 (Figure 54).
Table 38: Change in export values per sector (in million USD)
Chemical products −211.47
Seafood items −47.04
Wood articles −43.50
Precious metals and stones −1.36
Vegetable textiles and fibres −0.76
Explosives and pyrotechnics −0.41
Zinc articles −0.06
Stone products −0.02
Umbrellas and walking-sticks 0.00
Impregnated, coated or laminated textiles 0.04
Processed meat and fish products 0.05
Meat products 0.16
Footwear
0.29
Lead articles 1.66
Blankets, curtains and bags 1.80
Perfumes and cosmetics 2.10
Small metal handtools 5.29
Beverages and spirits 8.27
Flour
16.74
Food residues and animal fodder 20.24
Edible vegetables 48.36
Medical and optical equipment 67.20
Edible fruit and nuts 85.12
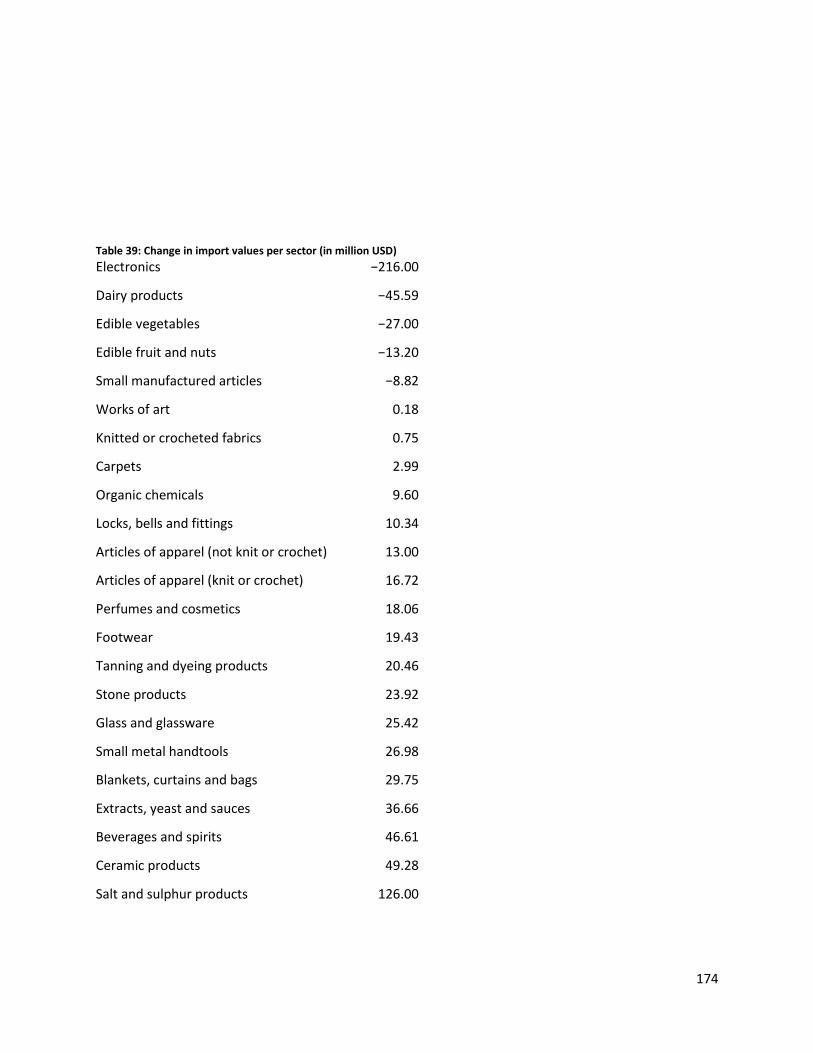
174
Table 39: Change in import values per sector (in million USD)
Electronics −216.00
Dairy products −45.59
Edible vegetables −27.00
Edible fruit and nuts −13.20
Small manufactured articles −8.82
Works of art 0.18
Knitted or crocheted fabrics 0.75
Carpets
2.99
Organic chemicals 9.60
Locks, bells and fittings 10.34
Articles of apparel (not knit or crochet) 13.00
Articles of apparel (knit or crochet) 16.72
Perfumes and cosmetics 18.06
Footwear
19.43
Tanning and dyeing products 20.46
Stone products 23.92
Glass and glassware 25.42
Small metal handtools 26.98
Blankets, curtains and bags 29.75
Extracts, yeast and sauces 36.66
Beverages and spirits 46.61
Ceramic products 49.28
Salt and sulphur products 126.00
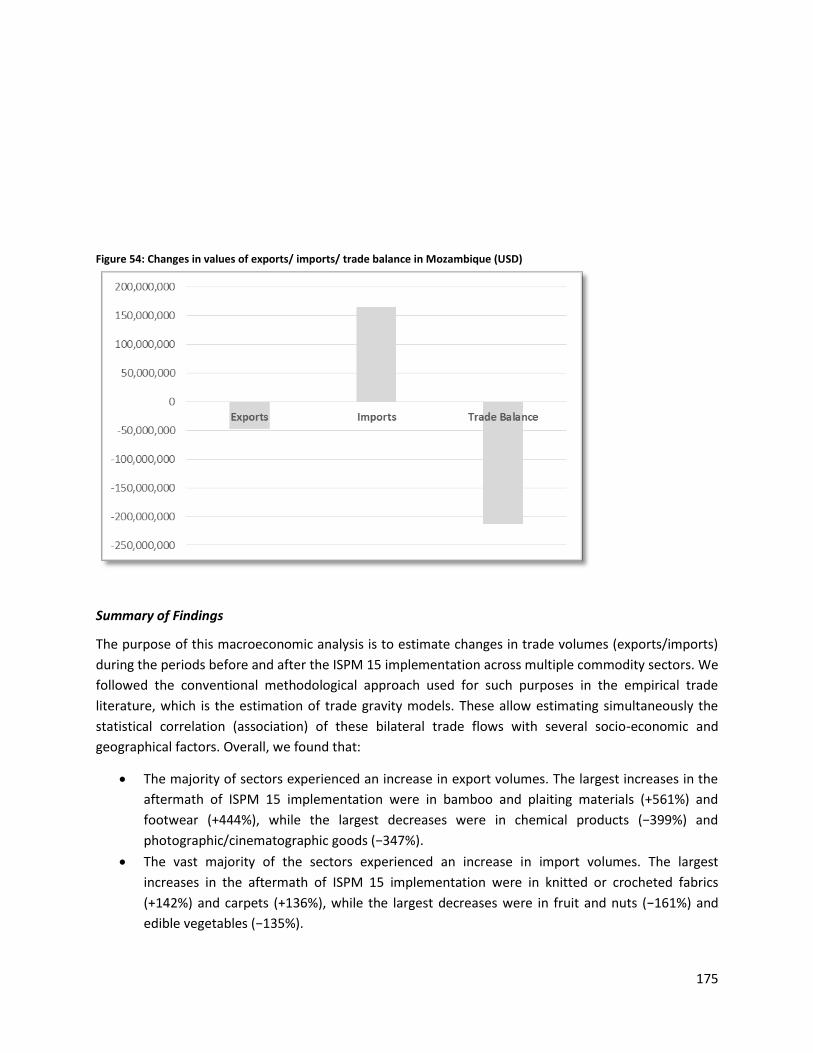
175
Figure 54: Changes in values of exports/ imports/ trade balance in Mozambique (USD)
Summary of Findings
The purpose of this macroeconomic analysis is to estimate changes in trade volumes (exports/imports)
during the periods before and after the ISPM 15 implementation across multiple commodity sectors. We
followed the conventional methodological approach used for such purposes in the empirical trade
literature, which is the estimation of trade gravity models. These allow estimating simultaneously the
statistical correlation (association) of these bilateral trade flows with several socio-economic and
geographical factors. Overall, we found that:
The majority of sectors experienced an increase in export volumes. The largest increases in the
aftermath of ISPM 15 implementation were in bamboo and plaiting materials (+561%) and
footwear (+444%), while the largest decreases were in chemical products (−399%) and
photographic/cinematographic goods (−347%).
The vast majority of the sectors experienced an increase in import volumes. The largest
increases in the aftermath of ISPM 15 implementation were in knitted or crocheted fabrics
(+142%) and carpets (+136%), while the largest decreases were in fruit and nuts (−161%) and
edible vegetables (−135%).
176
Overall, exports decreased by USD 47,287,000, while imports increased by USD 165,542,000. As
a result of this, the trade balance deteriorated by USD 212,829,000.
Policy Recommendations
Given the unequal distribution of effects across sectors, the authorities in Mozambique should pay
attention to those sectors that experienced an economic contraction in the aftermath of the ISPM 15
implementation. The export sectors with the largest percentage decreases were: chemical products
(−399%) and photographic/cinematographic goods (−347%). In total, ten export sectors experienced a
statistically significant drop in export revenues (Figure 51). A more qualitative-based analysis per sector
needs to identify the extent to which the drop in export revenues for each sector has been associated
with the administrative burden and costs associated with the implementation of ISPM 15 in combination
with other underlying internal and external factors (e.g. changes in prices locally and globally,
emergence of new competitors, constraints in domestic productive capacity, or exchange rate volatility).
The same should also apply in the context of import sectors.
In Mozambique, the implementation of ISPM 15 appears to be associated with a decrease in overall
exports and an increase in overall imports. Overall, exports decreased by USD 47,287,000, while imports
increased by USD 165,542,000. As a result of this, the trade balance deteriorated by USD 212,829,000.
This is an issue of concern, given that Mozambique has been running an overall trade deficit since 2008.
Supporting those exporting industries that experienced a contraction in the aftermath of ISPM 15
implementation could at least partly offset these persistent trade deficits. Alternatively the government
could support those sectors that grew substantially after the implementation of ISPM 15, as long as
these industries can expand further and compensate for the value and employment loss that other
contracting sectors experienced.
177
6. ISPM 15: findings based on microdata
6.1 Introduction
The precise assessment of the costs and the benefits related to implementation of ISPM 15 does not
constitute an easy task. Available studies on the subject have not been able to go beyond rough
estimates, as a number of hypothetical and sometimes unquantifiable factors are often involved. There
are no studies, to our understanding, trying to quantify the costs and the benefits related to the
implementation of ISPM 15 in developing countries, which makes the present research of particular
importance for its contribution to the subject matter.
The available evidence – mostly based on country case studies and regional assessments conducted in
developed areas of the world – suggests that:
i. The burden of the compliance cost is imposed on exporting countries.
ii. WPM treatment facilities (i.e. private businesses) have to bear the implementation costs.
Those costs are later transferred to the exporters and to the final consumers via the
importers.
iii. The cost of compliance is relatively high if put in relation to the income level of the low
income and least developed countries.
iv. While the cost of compliance is high, the short- and long-term costs related to the lack of
compliance is enormous, in terms of potential foregone export, income and employment.
v. The cost and efficiency of the compliance depend, inter alia, on the organization of the
supply chain.
Although the implementation and compliance costs relate to both imports and exports, the majority of
the costs burden the exporter. For this reason, this chapter will assess the costs and the burden of
compliance from the perspective of the WPM treatment facilities, which were very likely to experience a
number of new fixed and variable costs and benefits since implementation of ISPM 15 became
compulsory in the country.
Implementation of and compliance with ISPM 15 may, however, also generate costs on stakeholders
other than the WPM treatment facilities. For instance, the NPPO may incur additional costs related to
the organization of training courses, or there may be the need for additional phytosanitary inspectors
(Table 40).
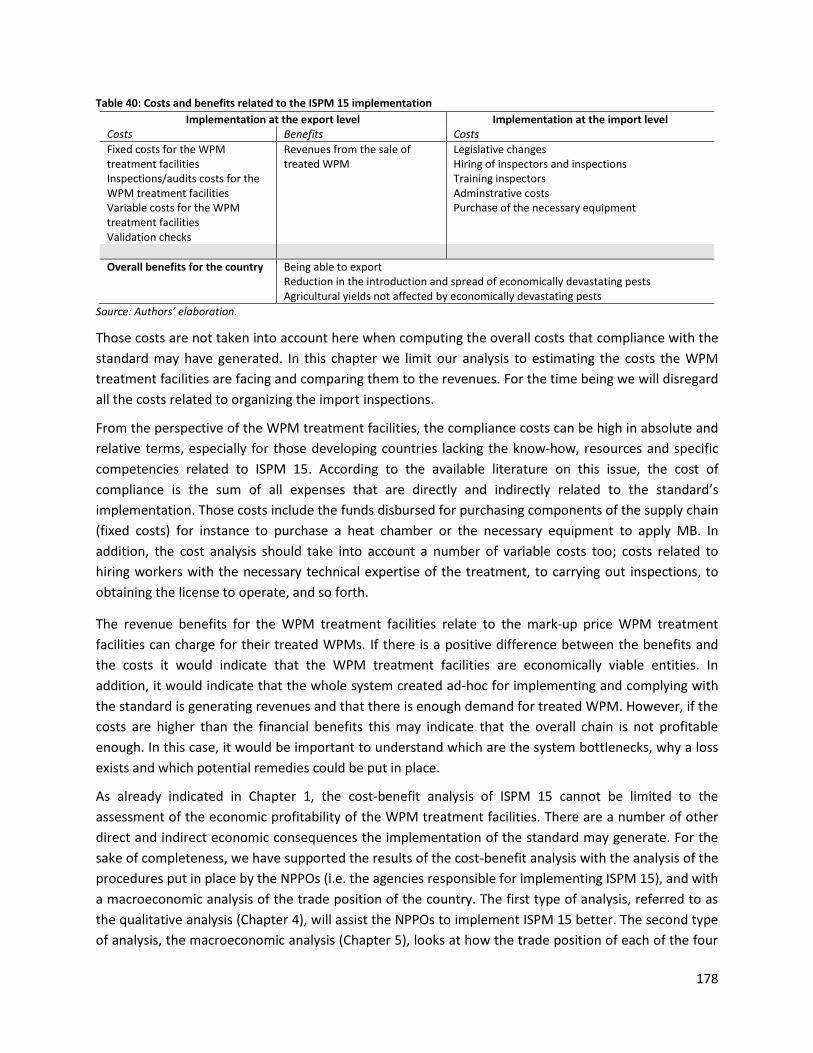
178
Table 40: Costs and benefits related to the ISPM 15 implementation
Implementation at the export level Implementation at the import level Costs Benefits Costs
Fixed costs for the WPM treatment facilities
Revenues from the sale of treated WPM
Legislative changes Hiring of inspectors and inspections
Inspections/audits costs for the WPM treatment facilities
Training inspectors Adminstrative costs
Variable costs for the WPM treatment facilities Validation checks
Purchase of the necessary equipment
Overall benefits for the country Being able to export Reduction in the introduction and spread of economically devastating pests Agricultural yields not affected by economically devastating pests
Source: Authors’ elaboration.
Those costs are not taken into account here when computing the overall costs that compliance with the
standard may have generated. In this chapter we limit our analysis to estimating the costs the WPM
treatment facilities are facing and comparing them to the revenues. For the time being we will disregard
all the costs related to organizing the import inspections.
From the perspective of the WPM treatment facilities, the compliance costs can be high in absolute and
relative terms, especially for those developing countries lacking the know-how, resources and specific
competencies related to ISPM 15. According to the available literature on this issue, the cost of
compliance is the sum of all expenses that are directly and indirectly related to the standard’s
implementation. Those costs include the funds disbursed for purchasing components of the supply chain
(fixed costs) for instance to purchase a heat chamber or the necessary equipment to apply MB. In
addition, the cost analysis should take into account a number of variable costs too; costs related to
hiring workers with the necessary technical expertise of the treatment, to carrying out inspections, to
obtaining the license to operate, and so forth.
The revenue benefits for the WPM treatment facilities relate to the mark-up price WPM treatment
facilities can charge for their treated WPMs. If there is a positive difference between the benefits and
the costs it would indicate that the WPM treatment facilities are economically viable entities. In
addition, it would indicate that the whole system created ad-hoc for implementing and complying with
the standard is generating revenues and that there is enough demand for treated WPM. However, if the
costs are higher than the financial benefits this may indicate that the overall chain is not profitable
enough. In this case, it would be important to understand which are the system bottlenecks, why a loss
exists and which potential remedies could be put in place.
As already indicated in Chapter 1, the cost-benefit analysis of ISPM 15 cannot be limited to the
assessment of the economic profitability of the WPM treatment facilities. There are a number of other
direct and indirect economic consequences the implementation of the standard may generate. For the
sake of completeness, we have supported the results of the cost-benefit analysis with the analysis of the
procedures put in place by the NPPOs (i.e. the agencies responsible for implementing ISPM 15), and with
a macroeconomic analysis of the trade position of the country. The first type of analysis, referred to as
the qualitative analysis (Chapter 4), will assist the NPPOs to implement ISPM 15 better. The second type
of analysis, the macroeconomic analysis (Chapter 5), looks at how the trade position of each of the four
179
case-study countries has evolved after the implementation of ISPM 15, and which sectors have
benefited the most. The third, the microeconomic analysis, will be discussed in this chapter.
The stakeholders of ISPM 15 implementation, and especially the NPPOs, should take the results of the
three types of analysis into consideration to increase their understanding of the effects the standard has
generated. Therefore, the three analyses may be read as stand-alone or as three different components
of the same phenomena. The concluding remarks (Chapter 7) will combine the results stemming from
these three different components with the purpose of providing a more complete picture of the
economic effects ISPM 15 may have generated.
The rest of this chapter is organized in the following way. The next section introduces and describes the
survey tool used for the data collection process. The questionnaire, as it will be presented in section 6.2,
was given to all the WPM treatment facilities in the four countries, and the rate of responsiveness, any
missing data problems as well as data quality will be discussed too. The presentation of the descriptive
statistics is presented in Section 6.4, followed by the cost-benefit analysis in Section 6.5 and the
conclusions in Section 6.6.
6.2 Description of the survey tool
There are many ways to conduct a cost-benefit analysis related to the implementation of ISPM 15. One
way could be to examine all the expenditures the central government faced to guarantee the correct
implementation of the standard. Those costs may relate to the research needed to understand and
correctly apply the treatments, to the change in the regulation adopted by the country in matters
related to trade and in the management of the “new” supply chain, or to the hiring of phytosanitary
inspectors. Another strategy could be to assess the aforementioned costs and compare them with the
number of pests that have been introduced in the country before and after the standard was
implemented; this comparison would help quantifying the funds saved as a consequence of the
reduction of such pests. This analysis would also help understanding the impact the standard has had at
the phytosanitary level and, possibly, on the agricultural yield and productivity. Data for assessing these
costs and impacts are scarce, if not completely lacking.40 As previously discussed, the activity of keeping
up-to-date records of pests in the country is not conducted in any of the four case-study countries.
In what follows, we will assess the costs WPM treatment facilities have faced, and if the costs will
outcast the benefits coming from the sale of the treated WPM. For this purpose, we prepared a survey
tool consisting of a detailed questionnaire directed at the WPM treatment facilities operating in each of
the four case-study countries. The questionnaire comprises several different sections, each of which
relates to different aspects of the WPM treatment facilities’ business cycle.41 The seven sections the
questionnaire are composed as following:
40
The lack of data is related to the fact that it is extremely difficult to know, with a high degree of certainty, that a particular species was introduced by a particular commodity. Usually, such information is largely based on assumptions. Furthermore, it is computationally complicated to assess the economic and environmental impact of the pest in a particular region. 41
The questionnaires used in the four countries differ slightly to reflect country-specific situations. However, the content of the four questionnaires, as well as the data collected, are in any case comparable. A copy of the master questionnaire, which was developed before the country missions, is attached to this study. Copies of the four country-specific questionnaires are available upon request.
180
i. Section 1: Questions regarding the wood treatment facility
ii. Section 2: Wood treatment facility: general information
iii. Section 3: Wood treatment information
iv. Section 4: Wood treatment training
v. Section 5: Costs related to the wood treatment
vi. Section 6: Benefits related to the wood treatment
vii. Section 7: General comments.
Section 1 includes general questions about the respondent and its role within the facility, the year the
facility started to operate as a treatment facility, and all the requirements needed to obtain the license
to operate. The section also queries the number of employees and whether there was an increase in the
number of employees following the implementation of the standard.
The second section, investigates the main activities performed by the facility. For instance, whether the
facility also manufactures the WPM it will later treat, or if it repairs broken WPM. Given some types of
packaging material is made of different materials, the section also queries if the facility only produces
WPM or also other packaging material. Also the capacity of the facility in terms of number of treated
WPM per year is queried, as are details as to potential repetition of treatments, and which companies
buy the final product and for what purpose. In other words, the section aims at understanding the core
businesses of the facilities and their capacity.
The third section poses questions regarding the wood treatments used. We query which treatment the
facility uses and the main reasons for choosing that instead of another treatment. We also query
whether the facility is planning to invest in another treatment and the reasons behind that choice.
Lastly, we inquire about any cases where their ISPM 15 mark has been used by other facilities without
them knowing.
Section 4 outlines questions regarding the training received by the WPM treatment facility. In this
section, we gather information about the type of training received and the organization offering the
training, to understand if guidelines have been given to the treatment facility. Furthermore, we ask
whether the treatment facilities receive updates on how to comply with ISPM 15 considering its various
revisions. The section also seeks information on the time the facility spent purchasing new equipment or
adapting old equipment for implementing the international standard. This part tries to assess whether
the implementation process is time consuming, for instance in terms of permits required. The section
then moves on to gather information on the audits the NPPO does of the facility; the frequency and the
type of audit, whether they are done unexpected, and the result of the audits.
Section 5 gathers a series of financial data related to the costs the facility has to cover every year in
order to run the treatment business. These are the fixed costs (e.g. investment costs, costs for
equipment, license cost) and the variable costs (costs of labour, energy, maintenance, timber, and
administration). We also query if the company received any Government subsidy.
Section 6 examines the sources of revenues of the facilities. In this section we gather data on the pieces
of treated WPM sold, the unit price and the amount of the unit price for each WPM before ISPM 15 was
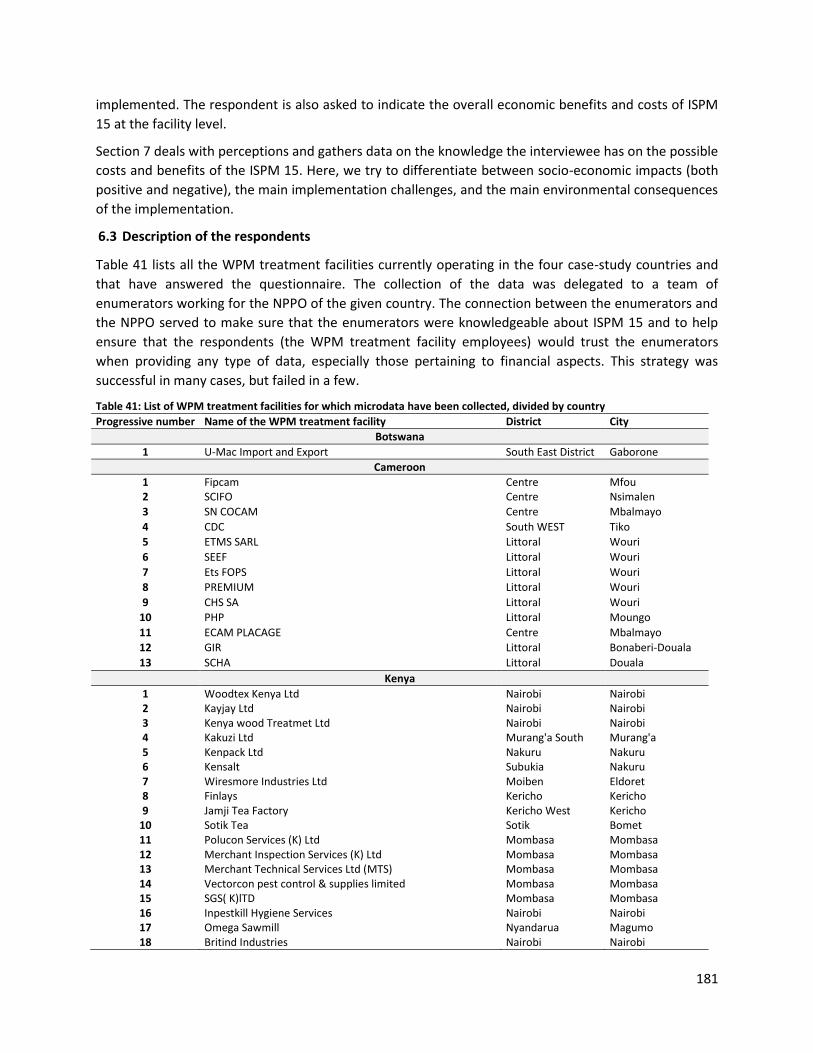
181
implemented. The respondent is also asked to indicate the overall economic benefits and costs of ISPM
15 at the facility level.
Section 7 deals with perceptions and gathers data on the knowledge the interviewee has on the possible
costs and benefits of the ISPM 15. Here, we try to differentiate between socio-economic impacts (both
positive and negative), the main implementation challenges, and the main environmental consequences
of the implementation.
6.3 Description of the respondents
Table 41 lists all the WPM treatment facilities currently operating in the four case-study countries and
that have answered the questionnaire. The collection of the data was delegated to a team of
enumerators working for the NPPO of the given country. The connection between the enumerators and
the NPPO served to make sure that the enumerators were knowledgeable about ISPM 15 and to help
ensure that the respondents (the WPM treatment facility employees) would trust the enumerators
when providing any type of data, especially those pertaining to financial aspects. This strategy was
successful in many cases, but failed in a few.
Table 41: List of WPM treatment facilities for which microdata have been collected, divided by country
Progressive number Name of the WPM treatment facility District City
Botswana
1 U-Mac Import and Export South East District Gaborone
Cameroon
1 Fipcam Centre Mfou 2 SCIFO Centre Nsimalen
3 SN COCAM Centre Mbalmayo
4 CDC South WEST Tiko
5 ETMS SARL Littoral Wouri
6 SEEF Littoral Wouri
7 Ets FOPS Littoral Wouri
8 PREMIUM Littoral Wouri
9 CHS SA Littoral Wouri
10 PHP Littoral Moungo
11 ECAM PLACAGE Centre Mbalmayo
12 GIR Littoral Bonaberi-Douala
13 SCHA Littoral Douala
Kenya
1 Woodtex Kenya Ltd Nairobi Nairobi 2 Kayjay Ltd Nairobi Nairobi 3 Kenya wood Treatmet Ltd Nairobi Nairobi 4 Kakuzi Ltd Murang'a South Murang'a 5 Kenpack Ltd Nakuru Nakuru 6 Kensalt Subukia Nakuru 7 Wiresmore Industries Ltd Moiben Eldoret 8 Finlays Kericho Kericho 9 Jamji Tea Factory Kericho West Kericho
10 Sotik Tea Sotik Bomet 11 Polucon Services (K) Ltd Mombasa Mombasa 12 Merchant Inspection Services (K) Ltd Mombasa Mombasa 13 Merchant Technical Services Ltd (MTS) Mombasa Mombasa 14 Vectorcon pest control & supplies limited Mombasa Mombasa 15 SGS( K)lTD Mombasa Mombasa 16 Inpestkill Hygiene Services Nairobi Nairobi 17 Omega Sawmill Nyandarua Magumo 18 Britind Industries Nairobi Nairobi
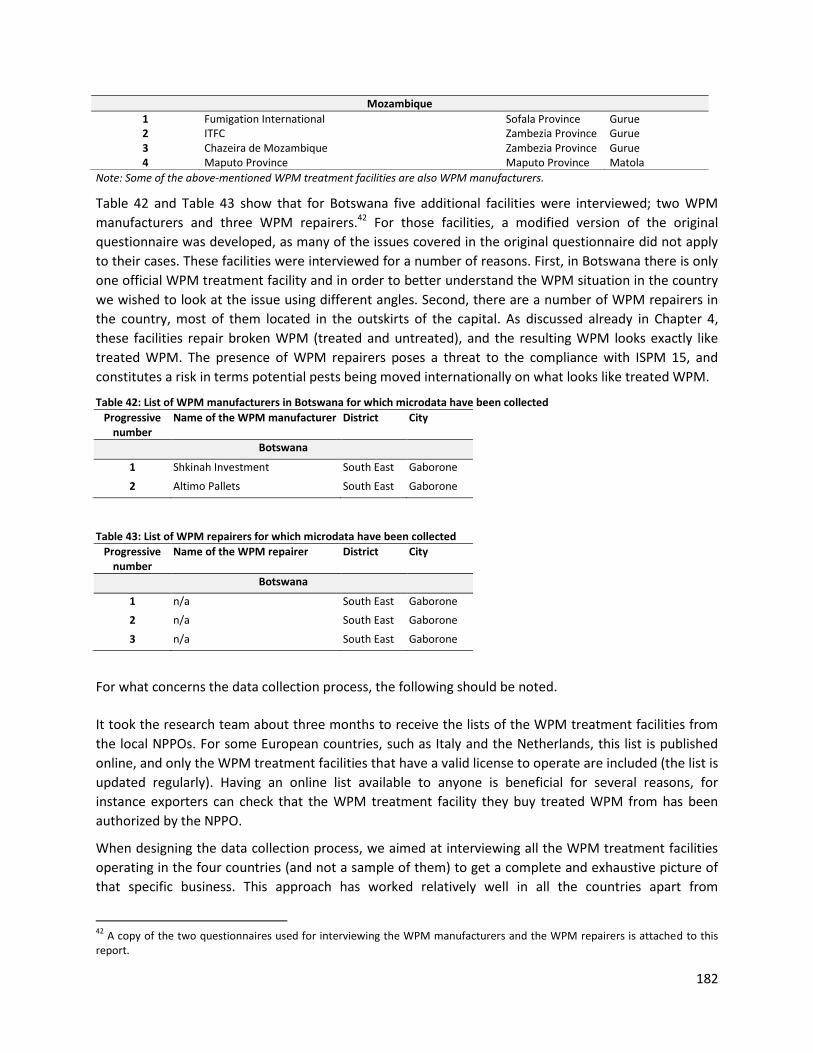
182
Note: Some of the above-mentioned WPM treatment facilities are also WPM manufacturers.
Table 42 and Table 43 show that for Botswana five additional facilities were interviewed; two WPM
manufacturers and three WPM repairers.42 For those facilities, a modified version of the original
questionnaire was developed, as many of the issues covered in the original questionnaire did not apply
to their cases. These facilities were interviewed for a number of reasons. First, in Botswana there is only
one official WPM treatment facility and in order to better understand the WPM situation in the country
we wished to look at the issue using different angles. Second, there are a number of WPM repairers in
the country, most of them located in the outskirts of the capital. As discussed already in Chapter 4,
these facilities repair broken WPM (treated and untreated), and the resulting WPM looks exactly like
treated WPM. The presence of WPM repairers poses a threat to the compliance with ISPM 15, and
constitutes a risk in terms potential pests being moved internationally on what looks like treated WPM.
Table 42: List of WPM manufacturers in Botswana for which microdata have been collected
Progressive number
Name of the WPM manufacturer District City
Botswana
1 Shkinah Investment South East Gaborone
2 Altimo Pallets South East Gaborone
Table 43: List of WPM repairers for which microdata have been collected
Progressive number
Name of the WPM repairer District City
Botswana
1 n/a South East Gaborone
2 n/a South East Gaborone
3 n/a South East Gaborone
For what concerns the data collection process, the following should be noted.
It took the research team about three months to receive the lists of the WPM treatment facilities from
the local NPPOs. For some European countries, such as Italy and the Netherlands, this list is published
online, and only the WPM treatment facilities that have a valid license to operate are included (the list is
updated regularly). Having an online list available to anyone is beneficial for several reasons, for
instance exporters can check that the WPM treatment facility they buy treated WPM from has been
authorized by the NPPO.
When designing the data collection process, we aimed at interviewing all the WPM treatment facilities
operating in the four countries (and not a sample of them) to get a complete and exhaustive picture of
that specific business. This approach has worked relatively well in all the countries apart from
42
A copy of the two questionnaires used for interviewing the WPM manufacturers and the WPM repairers is attached to this report.
Mozambique
1 Fumigation International Sofala Province Gurue 2 ITFC Zambezia Province Gurue 3 Chazeira de Mozambique Zambezia Province Gurue 4 Maputo Province Maputo Province Matola
183
Cameroon, where out of the 26 facilities contacted, only 14 facilities provided responses. For various
reasons, ten of the facilities refused to receive the NPPO enumerators, despite the fact that they had
been previously alerted about the survey and a copy of the questionnaire had been sent to them before
the visit. They did not motivate their refusal but it is assumed that the facilities feared disclosing any
financial data, thinking perhaps that this information could be used for tax purposes. It seems
contradictory, and highly peculiar, that the NPPO, which authorizes the WPM treatment facilities and is
in charge of auditing them at least once a year, is denied access to those facilities. In addition, there
were two cases in Cameroon where the facilities were no longer active. This poses questions as to the
authorization process, since the NPPO was not aware of the closure. It also provides for possible fraud,
as the ISPM 15 stamp might still be with the closed facility (in the case of HT, as for MB treatments the
NPPO keeps the stamp).
It is also crucial to highlight a few things about the quality of the data collected by the enumerators. The
overall rate of responsiveness was relatively good. The questionnaires were well compiled by the
enumerators and well answered by the respondents. However, the section, aimed at gathering data on
the financial disbursements of the facilities, presented some issues, as in some cases respondents were
not willing to disclose their costs and their revenues. This in spite of making it very clear to all the
interviewed facilities that data would have been used in an anonymous way. This is particularly true for
the facilities located in Cameroon and for the facility located in Botswana. On the contrary, those in
Mozambique and in Kenya showed greater interest in participating at the survey.
Some of the questions in the survey presented missing values where the respondents did not give an
answer. In those situations we have not imputed the missing value but continued the analysis without
that particular data point. In several cases the information gathered via the survey tool has been
triangulated with the qualitative information collected during the country missions or with other
information or data coming from third sources. This check has been necessary to verify the correctness
of some of the microdata, and in some cases, the data collected tell a different story than that told in
the qualitative interviews. As an example, the manager of the WPM treatment facility located in
Botswana, mentioned that he had never been audited by the NPPO whereas the data collected using the
questionnaire reports that he is audited once a year. We cannot always determine which version reflects
the reality, and can therefore only make the reader aware of such inconsistency. However, most of the
data collected is in line with data collected by third parties and published in academic publications,
which underpins the quality of the data and of the analysis presented here.
6.4 Descriptive statistics
Nineteen out of the 36 respondents were managers of the interviewed facilities, and the rest were
directors, owners or other employees at the management level (Table 44). The majority of them have
started working in the facility well before 2011, which attests to the level of knowledge they have about
the facility. About half of the facilities have started their WPM treatment business only after 2011, being
thus relatively new on the market.
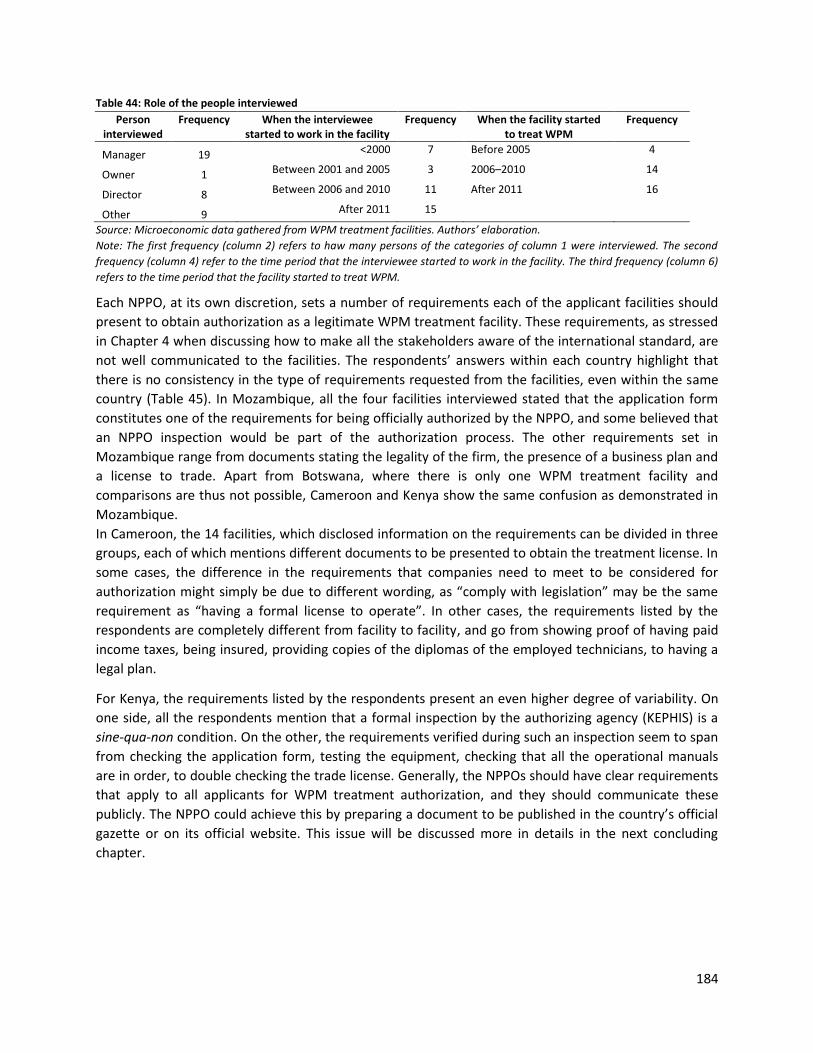
184
Table 44: Role of the people interviewed Person
interviewed Frequency When the interviewee
started to work in the facility Frequency When the facility started
to treat WPM Frequency
Manager 19 <2000 7 Before 2005 4
Owner 1 Between 2001 and 2005 3 2006–2010 14
Director 8 Between 2006 and 2010 11 After 2011 16
Other 9 After 2011 15
Source: Microeconomic data gathered from WPM treatment facilities. Authors’ elaboration.
Note: The first frequency (column 2) refers to haw many persons of the categories of column 1 were interviewed. The second
frequency (column 4) refer to the time period that the interviewee started to work in the facility. The third frequency (column 6)
refers to the time period that the facility started to treat WPM.
Each NPPO, at its own discretion, sets a number of requirements each of the applicant facilities should
present to obtain authorization as a legitimate WPM treatment facility. These requirements, as stressed
in Chapter 4 when discussing how to make all the stakeholders aware of the international standard, are
not well communicated to the facilities. The respondents’ answers within each country highlight that
there is no consistency in the type of requirements requested from the facilities, even within the same
country (Table 45). In Mozambique, all the four facilities interviewed stated that the application form
constitutes one of the requirements for being officially authorized by the NPPO, and some believed that
an NPPO inspection would be part of the authorization process. The other requirements set in
Mozambique range from documents stating the legality of the firm, the presence of a business plan and
a license to trade. Apart from Botswana, where there is only one WPM treatment facility and
comparisons are thus not possible, Cameroon and Kenya show the same confusion as demonstrated in
Mozambique.
In Cameroon, the 14 facilities, which disclosed information on the requirements can be divided in three
groups, each of which mentions different documents to be presented to obtain the treatment license. In
some cases, the difference in the requirements that companies need to meet to be considered for
authorization might simply be due to different wording, as “comply with legislation” may be the same
requirement as “having a formal license to operate”. In other cases, the requirements listed by the
respondents are completely different from facility to facility, and go from showing proof of having paid
income taxes, being insured, providing copies of the diplomas of the employed technicians, to having a
legal plan.
For Kenya, the requirements listed by the respondents present an even higher degree of variability. On
one side, all the respondents mention that a formal inspection by the authorizing agency (KEPHIS) is a
sine-qua-non condition. On the other, the requirements verified during such an inspection seem to span
from checking the application form, testing the equipment, checking that all the operational manuals
are in order, to double checking the trade license. Generally, the NPPOs should have clear requirements
that apply to all applicants for WPM treatment authorization, and they should communicate these
publicly. The NPPO could achieve this by preparing a document to be published in the country’s official
gazette or on its official website. This issue will be discussed more in details in the next concluding
chapter.
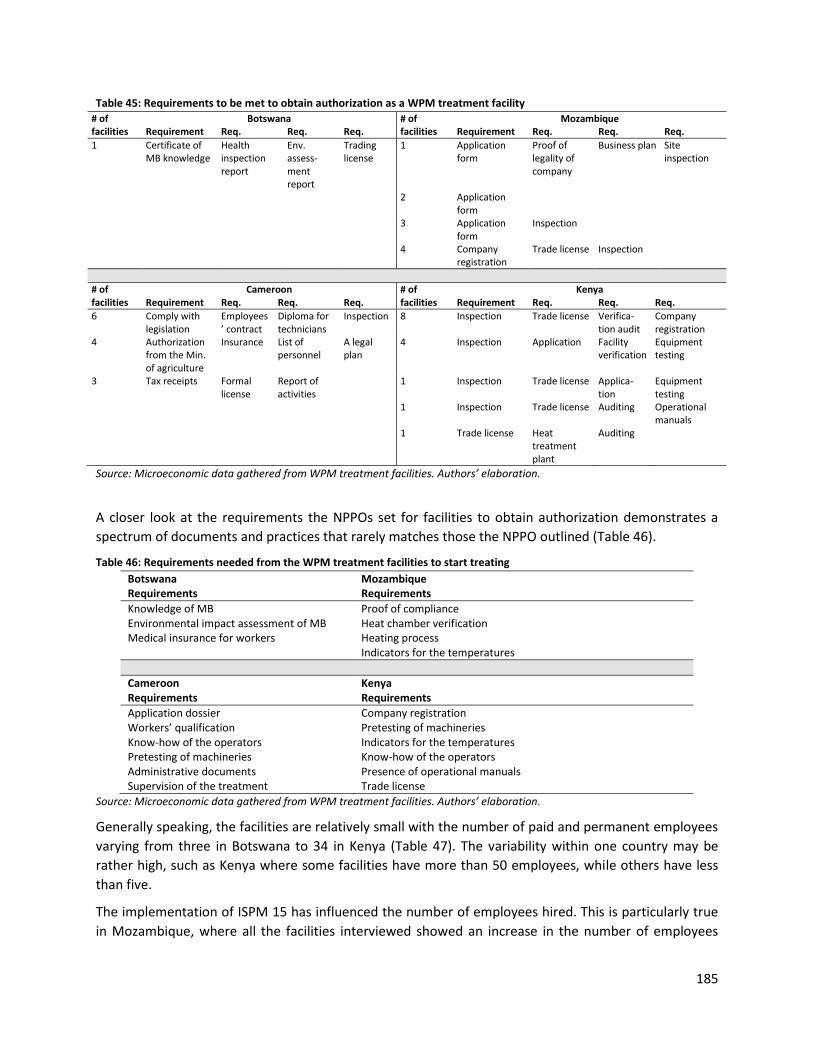
185
Table 45: Requirements to be met to obtain authorization as a WPM treatment facility
# of facilities
Botswana # of facilities
Mozambique Requirement Req. Req. Req. Requirement Req. Req. Req.
1 Certificate of MB knowledge
Health inspection report
Env. assess-ment report
Trading license
1 Application form
Proof of legality of company
Business plan Site inspection
2 Application form
3 Application form
Inspection
4 Company registration
Trade license Inspection
# of facilities
Cameroon # of facilities
Kenya Requirement Req. Req. Req. Requirement Req. Req. Req.
6 Comply with legislation
Employees’ contract
Diploma for technicians
Inspection 8 Inspection Trade license Verifica-tion audit
Company registration
4 Authorization from the Min. of agriculture
Insurance List of personnel
A legal plan
4 Inspection Application Facility verification
Equipment testing
3 Tax receipts Formal license
Report of activities
1 Inspection Trade license Applica-tion
Equipment testing
1 Inspection Trade license Auditing Operational manuals
1 Trade license Heat treatment plant
Auditing
Source: Microeconomic data gathered from WPM treatment facilities. Authors’ elaboration.
A closer look at the requirements the NPPOs set for facilities to obtain authorization demonstrates a
spectrum of documents and practices that rarely matches those the NPPO outlined (Table 46).
Table 46: Requirements needed from the WPM treatment facilities to start treating
Source: Microeconomic data gathered from WPM treatment facilities. Authors’ elaboration.
Generally speaking, the facilities are relatively small with the number of paid and permanent employees
varying from three in Botswana to 34 in Kenya (Table 47). The variability within one country may be
rather high, such as Kenya where some facilities have more than 50 employees, while others have less
than five.
The implementation of ISPM 15 has influenced the number of employees hired. This is particularly true
in Mozambique, where all the facilities interviewed showed an increase in the number of employees
Botswana Mozambique Requirements Requirements
Knowledge of MB Proof of compliance Environmental impact assessment of MB Heat chamber verification Medical insurance for workers Heating process Indicators for the temperatures
Cameroon Kenya Requirements Requirements
Application dossier Company registration Workers’ qualification Pretesting of machineries Know-how of the operators Indicators for the temperatures Pretesting of machineries Know-how of the operators Administrative documents Presence of operational manuals Supervision of the treatment Trade license
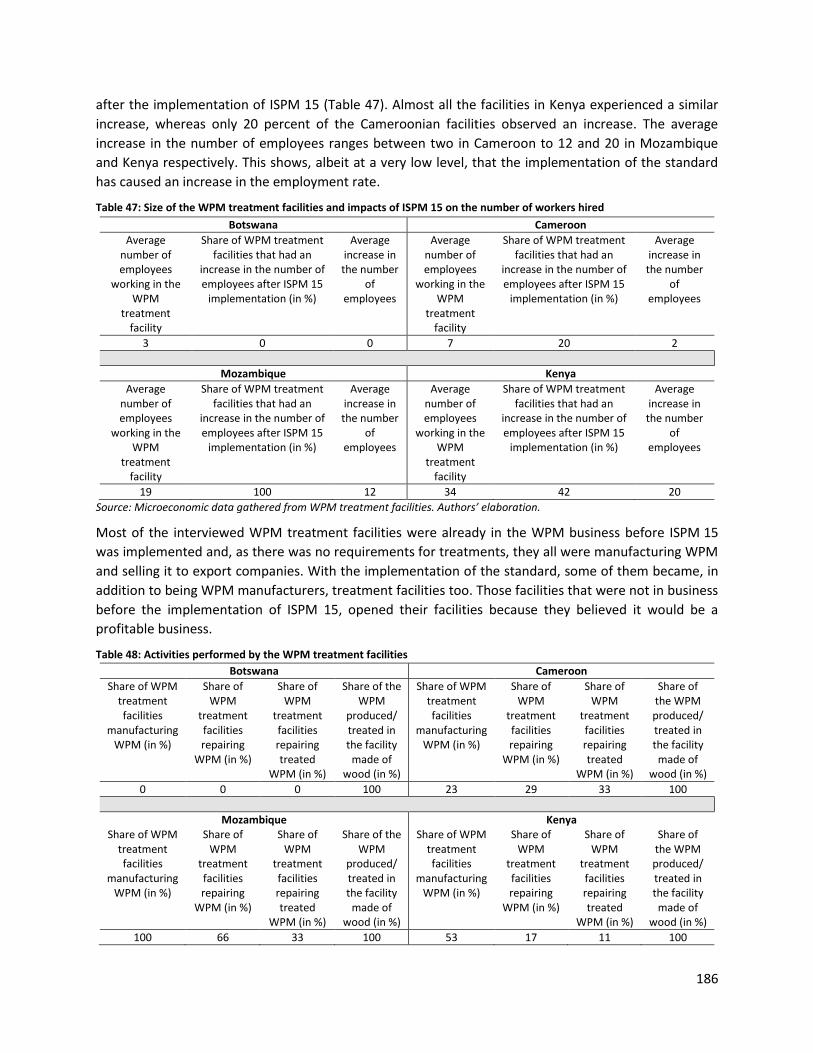
186
after the implementation of ISPM 15 (Table 47). Almost all the facilities in Kenya experienced a similar
increase, whereas only 20 percent of the Cameroonian facilities observed an increase. The average
increase in the number of employees ranges between two in Cameroon to 12 and 20 in Mozambique
and Kenya respectively. This shows, albeit at a very low level, that the implementation of the standard
has caused an increase in the employment rate.
Table 47: Size of the WPM treatment facilities and impacts of ISPM 15 on the number of workers hired
Botswana Cameroon
Average number of employees
working in the WPM
treatment facility
Share of WPM treatment facilities that had an
increase in the number of employees after ISPM 15
implementation (in %)
Average increase in the number
of employees
Average number of employees
working in the WPM
treatment facility
Share of WPM treatment facilities that had an
increase in the number of employees after ISPM 15
implementation (in %)
Average increase in the number
of employees
3 0 0 7 20 2
Mozambique Kenya
Average number of employees
working in the WPM
treatment facility
Share of WPM treatment facilities that had an
increase in the number of employees after ISPM 15
implementation (in %)
Average increase in the number
of employees
Average number of employees
working in the WPM
treatment facility
Share of WPM treatment facilities that had an
increase in the number of employees after ISPM 15
implementation (in %)
Average increase in the number
of employees
19 100 12 34 42 20
Source: Microeconomic data gathered from WPM treatment facilities. Authors’ elaboration.
Most of the interviewed WPM treatment facilities were already in the WPM business before ISPM 15
was implemented and, as there was no requirements for treatments, they all were manufacturing WPM
and selling it to export companies. With the implementation of the standard, some of them became, in
addition to being WPM manufacturers, treatment facilities too. Those facilities that were not in business
before the implementation of ISPM 15, opened their facilities because they believed it would be a
profitable business.
Table 48: Activities performed by the WPM treatment facilities
Botswana Cameroon
Share of WPM treatment facilities
manufacturing WPM (in %)
Share of WPM
treatment facilities repairing
WPM (in %)
Share of WPM
treatment facilities repairing treated
WPM (in %)
Share of the WPM
produced/ treated in the facility
made of wood (in %)
Share of WPM treatment facilities
manufacturing WPM (in %)
Share of WPM
treatment facilities repairing
WPM (in %)
Share of WPM
treatment facilities repairing treated
WPM (in %)
Share of the WPM produced/ treated in the facility made of
wood (in %)
0 0 0 100 23 29 33 100
Mozambique Kenya Share of WPM
treatment facilities
manufacturing WPM (in %)
Share of WPM
treatment facilities repairing
WPM (in %)
Share of WPM
treatment facilities repairing treated
WPM (in %)
Share of the WPM
produced/ treated in the facility
made of wood (in %)
Share of WPM treatment facilities
manufacturing WPM (in %)
Share of WPM
treatment facilities repairing
WPM (in %)
Share of WPM
treatment facilities repairing treated
WPM (in %)
Share of the WPM produced/ treated in the facility made of
wood (in %)
100 66 33 100 53 17 11 100
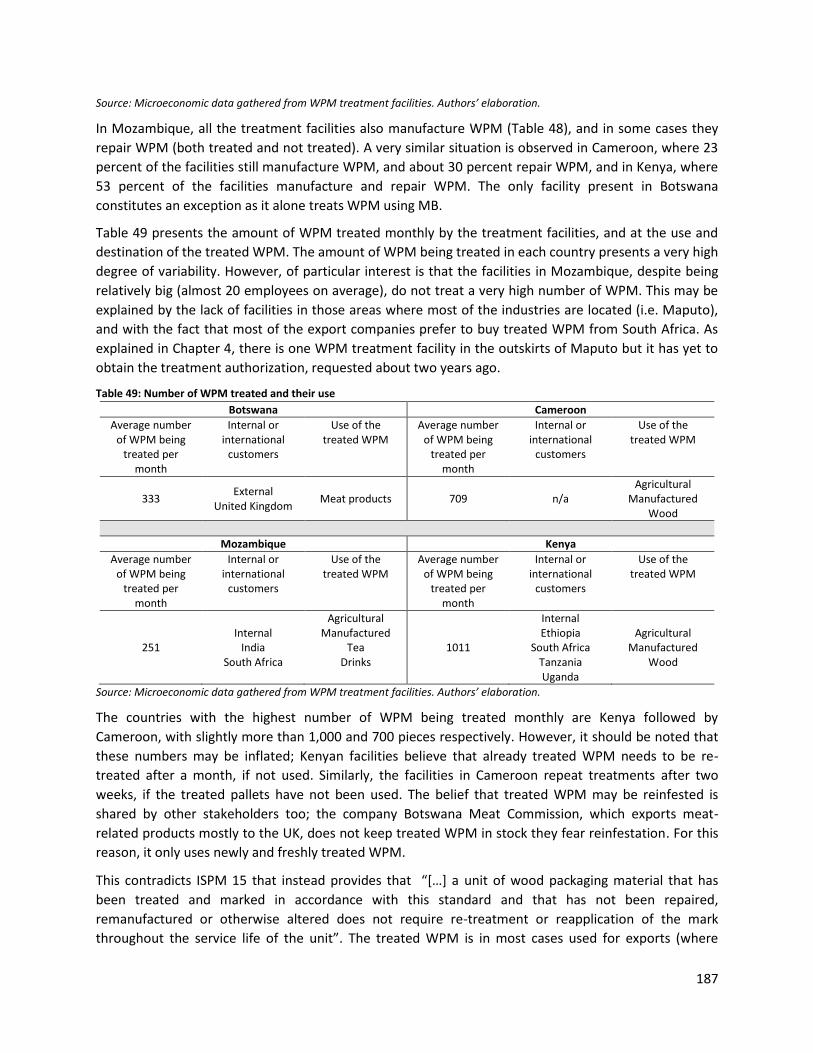
187
Source: Microeconomic data gathered from WPM treatment facilities. Authors’ elaboration.
In Mozambique, all the treatment facilities also manufacture WPM (Table 48), and in some cases they
repair WPM (both treated and not treated). A very similar situation is observed in Cameroon, where 23
percent of the facilities still manufacture WPM, and about 30 percent repair WPM, and in Kenya, where
53 percent of the facilities manufacture and repair WPM. The only facility present in Botswana
constitutes an exception as it alone treats WPM using MB.
Table 49 presents the amount of WPM treated monthly by the treatment facilities, and at the use and
destination of the treated WPM. The amount of WPM being treated in each country presents a very high
degree of variability. However, of particular interest is that the facilities in Mozambique, despite being
relatively big (almost 20 employees on average), do not treat a very high number of WPM. This may be
explained by the lack of facilities in those areas where most of the industries are located (i.e. Maputo),
and with the fact that most of the export companies prefer to buy treated WPM from South Africa. As
explained in Chapter 4, there is one WPM treatment facility in the outskirts of Maputo but it has yet to
obtain the treatment authorization, requested about two years ago.
Table 49: Number of WPM treated and their use Botswana Cameroon
Average number of WPM being
treated per month
Internal or international
customers
Use of the treated WPM
Average number of WPM being
treated per month
Internal or international
customers
Use of the treated WPM
333 External
United Kingdom Meat products 709 n/a
Agricultural Manufactured
Wood
Mozambique Kenya
Average number of WPM being
treated per month
Internal or international
customers
Use of the treated WPM
Average number of WPM being
treated per month
Internal or international
customers
Use of the treated WPM
251 Internal
India South Africa
Agricultural Manufactured
Tea Drinks
1011
Internal Ethiopia
South Africa Tanzania Uganda
Agricultural Manufactured
Wood
Source: Microeconomic data gathered from WPM treatment facilities. Authors’ elaboration.
The countries with the highest number of WPM being treated monthly are Kenya followed by
Cameroon, with slightly more than 1,000 and 700 pieces respectively. However, it should be noted that
these numbers may be inflated; Kenyan facilities believe that already treated WPM needs to be re-
treated after a month, if not used. Similarly, the facilities in Cameroon repeat treatments after two
weeks, if the treated pallets have not been used. The belief that treated WPM may be reinfested is
shared by other stakeholders too; the company Botswana Meat Commission, which exports meat-
related products mostly to the UK, does not keep treated WPM in stock they fear reinfestation. For this
reason, it only uses newly and freshly treated WPM.
This contradicts ISPM 15 that instead provides that “[…] a unit of wood packaging material that has
been treated and marked in accordance with this standard and that has not been repaired,
remanufactured or otherwise altered does not require re-treatment or reapplication of the mark
throughout the service life of the unit”. The treated WPM is in most cases used for exports (where
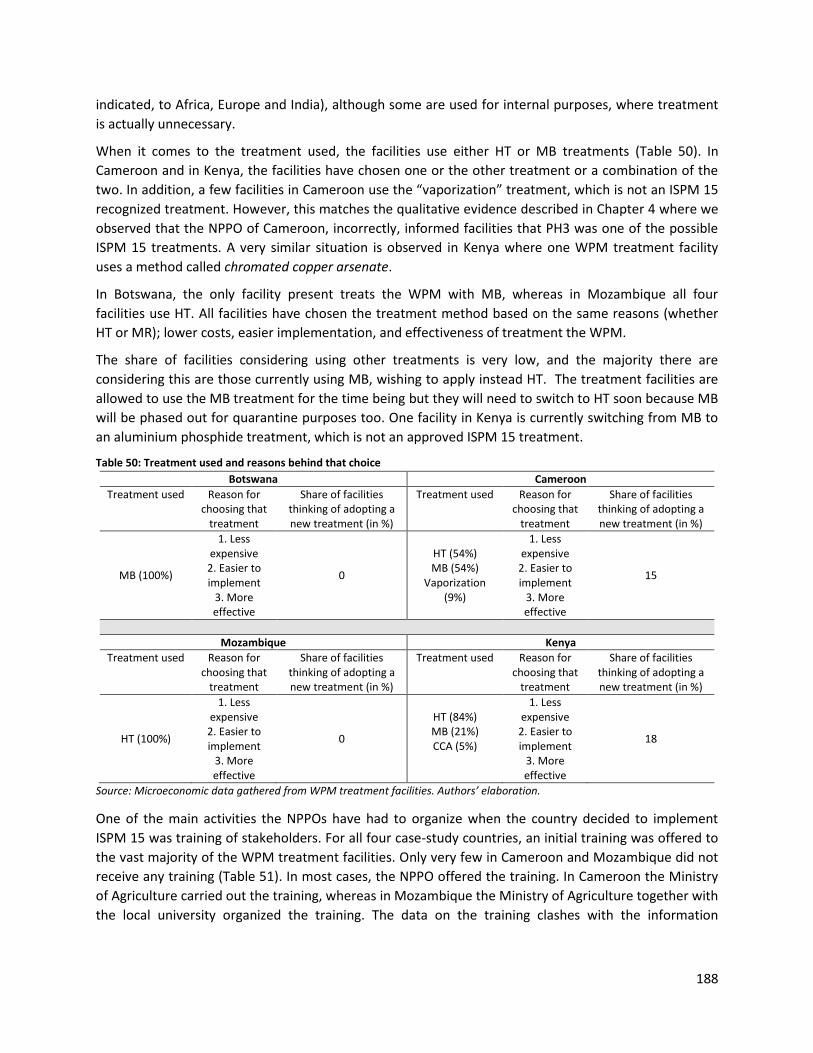
188
indicated, to Africa, Europe and India), although some are used for internal purposes, where treatment
is actually unnecessary.
When it comes to the treatment used, the facilities use either HT or MB treatments (Table 50). In
Cameroon and in Kenya, the facilities have chosen one or the other treatment or a combination of the
two. In addition, a few facilities in Cameroon use the “vaporization” treatment, which is not an ISPM 15
recognized treatment. However, this matches the qualitative evidence described in Chapter 4 where we
observed that the NPPO of Cameroon, incorrectly, informed facilities that PH3 was one of the possible
ISPM 15 treatments. A very similar situation is observed in Kenya where one WPM treatment facility
uses a method called chromated copper arsenate.
In Botswana, the only facility present treats the WPM with MB, whereas in Mozambique all four
facilities use HT. All facilities have chosen the treatment method based on the same reasons (whether
HT or MR); lower costs, easier implementation, and effectiveness of treatment the WPM.
The share of facilities considering using other treatments is very low, and the majority there are
considering this are those currently using MB, wishing to apply instead HT. The treatment facilities are
allowed to use the MB treatment for the time being but they will need to switch to HT soon because MB
will be phased out for quarantine purposes too. One facility in Kenya is currently switching from MB to
an aluminium phosphide treatment, which is not an approved ISPM 15 treatment.
Table 50: Treatment used and reasons behind that choice Botswana Cameroon
Treatment used Reason for choosing that
treatment
Share of facilities thinking of adopting a new treatment (in %)
Treatment used Reason for choosing that
treatment
Share of facilities thinking of adopting a new treatment (in %)
MB (100%)
1. Less expensive
2. Easier to implement
3. More effective
0
HT (54%) MB (54%)
Vaporization (9%)
1. Less expensive
2. Easier to implement
3. More effective
15
Mozambique Kenya
Treatment used Reason for choosing that
treatment
Share of facilities thinking of adopting a new treatment (in %)
Treatment used Reason for choosing that
treatment
Share of facilities thinking of adopting a new treatment (in %)
HT (100%)
1. Less expensive
2. Easier to implement
3. More effective
0
HT (84%) MB (21%) CCA (5%)
1. Less expensive
2. Easier to implement
3. More effective
18
Source: Microeconomic data gathered from WPM treatment facilities. Authors’ elaboration.
One of the main activities the NPPOs have had to organize when the country decided to implement
ISPM 15 was training of stakeholders. For all four case-study countries, an initial training was offered to
the vast majority of the WPM treatment facilities. Only very few in Cameroon and Mozambique did not
receive any training (Table 51). In most cases, the NPPO offered the training. In Cameroon the Ministry
of Agriculture carried out the training, whereas in Mozambique the Ministry of Agriculture together with
the local university organized the training. The data on the training clashes with the information
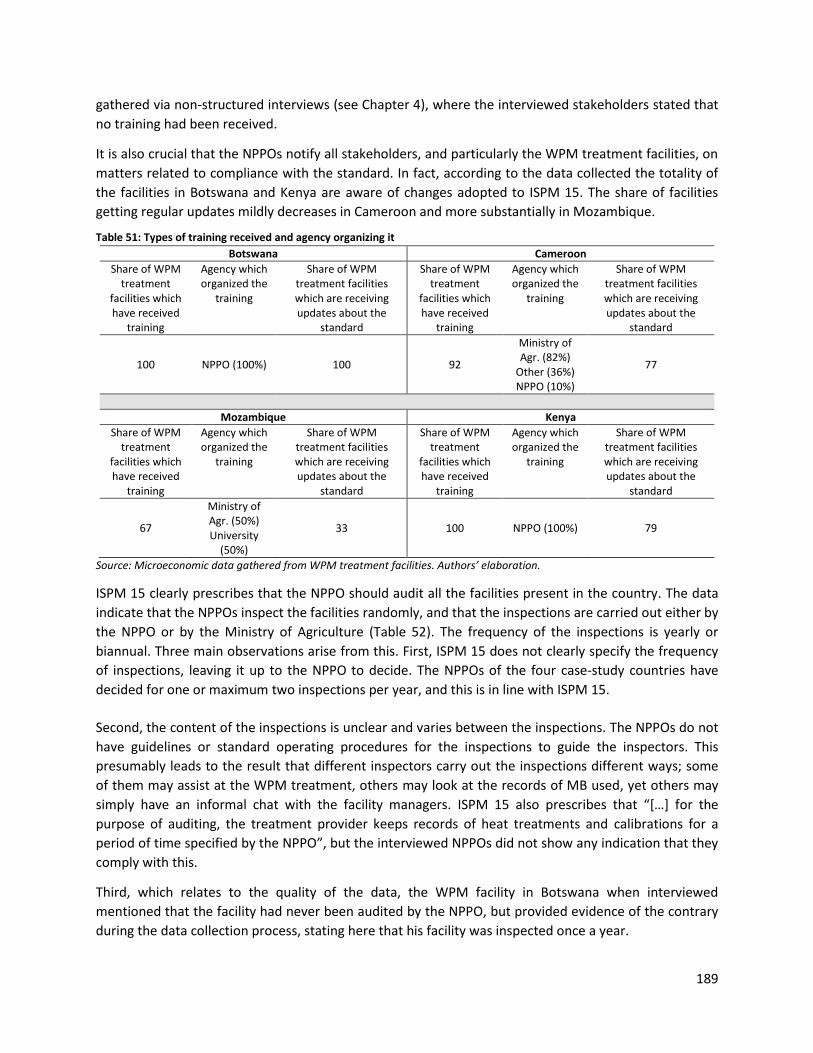
189
gathered via non-structured interviews (see Chapter 4), where the interviewed stakeholders stated that
no training had been received.
It is also crucial that the NPPOs notify all stakeholders, and particularly the WPM treatment facilities, on
matters related to compliance with the standard. In fact, according to the data collected the totality of
the facilities in Botswana and Kenya are aware of changes adopted to ISPM 15. The share of facilities
getting regular updates mildly decreases in Cameroon and more substantially in Mozambique.
Table 51: Types of training received and agency organizing it Botswana Cameroon
Share of WPM treatment
facilities which have received
training
Agency which organized the
training
Share of WPM treatment facilities which are receiving updates about the
standard
Share of WPM treatment
facilities which have received
training
Agency which organized the
training
Share of WPM treatment facilities which are receiving updates about the
standard
100 NPPO (100%) 100 92
Ministry of Agr. (82%)
Other (36%) NPPO (10%)
77
Mozambique Kenya
Share of WPM treatment
facilities which have received
training
Agency which organized the
training
Share of WPM treatment facilities which are receiving updates about the
standard
Share of WPM treatment
facilities which have received
training
Agency which organized the
training
Share of WPM treatment facilities which are receiving updates about the
standard
67
Ministry of Agr. (50%) University
(50%)
33 100 NPPO (100%) 79
Source: Microeconomic data gathered from WPM treatment facilities. Authors’ elaboration.
ISPM 15 clearly prescribes that the NPPO should audit all the facilities present in the country. The data
indicate that the NPPOs inspect the facilities randomly, and that the inspections are carried out either by
the NPPO or by the Ministry of Agriculture (Table 52). The frequency of the inspections is yearly or
biannual. Three main observations arise from this. First, ISPM 15 does not clearly specify the frequency
of inspections, leaving it up to the NPPO to decide. The NPPOs of the four case-study countries have
decided for one or maximum two inspections per year, and this is in line with ISPM 15.
Second, the content of the inspections is unclear and varies between the inspections. The NPPOs do not
have guidelines or standard operating procedures for the inspections to guide the inspectors. This
presumably leads to the result that different inspectors carry out the inspections different ways; some
of them may assist at the WPM treatment, others may look at the records of MB used, yet others may
simply have an informal chat with the facility managers. ISPM 15 also prescribes that “[…] for the
purpose of auditing, the treatment provider keeps records of heat treatments and calibrations for a
period of time specified by the NPPO”, but the interviewed NPPOs did not show any indication that they
comply with this.
Third, which relates to the quality of the data, the WPM facility in Botswana when interviewed
mentioned that the facility had never been audited by the NPPO, but provided evidence of the contrary
during the data collection process, stating here that his facility was inspected once a year.
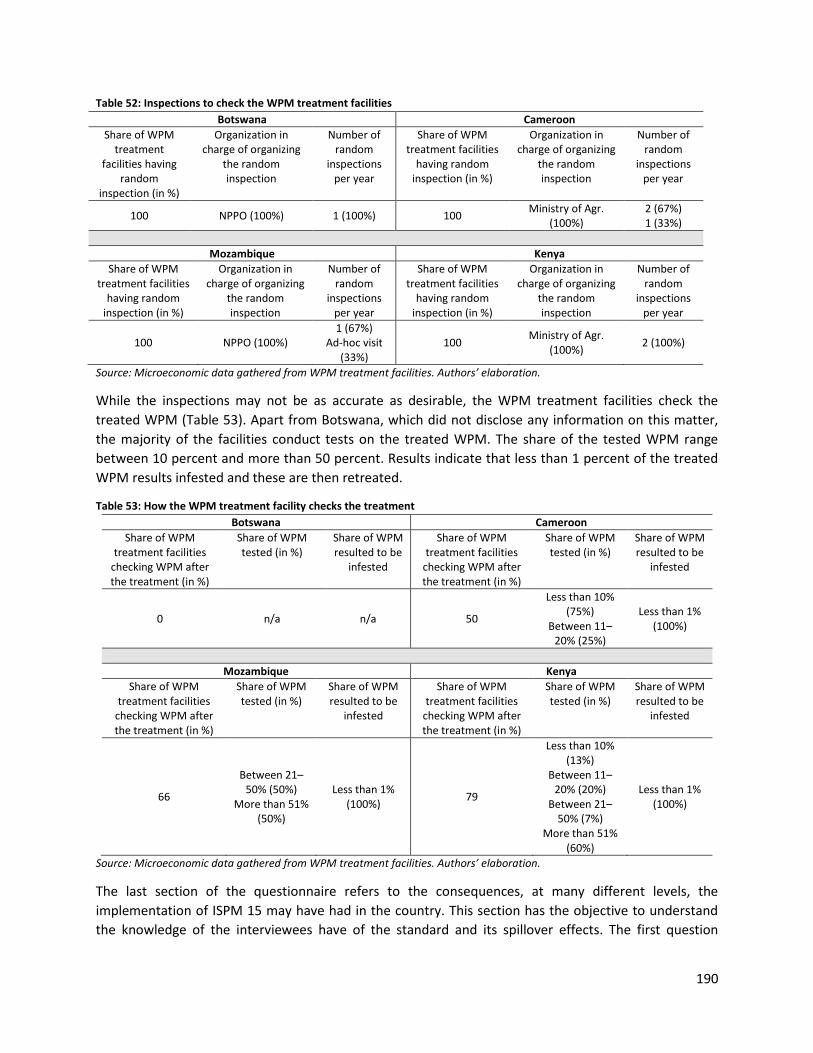
190
Table 52: Inspections to check the WPM treatment facilities Botswana Cameroon
Share of WPM treatment
facilities having random
inspection (in %)
Organization in charge of organizing
the random inspection
Number of random
inspections per year
Share of WPM treatment facilities
having random inspection (in %)
Organization in charge of organizing
the random inspection
Number of random
inspections per year
100 NPPO (100%) 1 (100%) 100 Ministry of Agr.
(100%) 2 (67%) 1 (33%)
Mozambique Kenya
Share of WPM treatment facilities
having random inspection (in %)
Organization in charge of organizing
the random inspection
Number of random
inspections per year
Share of WPM treatment facilities
having random inspection (in %)
Organization in charge of organizing
the random inspection
Number of random
inspections per year
100 NPPO (100%) 1 (67%)
Ad-hoc visit (33%)
100 Ministry of Agr.
(100%) 2 (100%)
Source: Microeconomic data gathered from WPM treatment facilities. Authors’ elaboration.
While the inspections may not be as accurate as desirable, the WPM treatment facilities check the
treated WPM (Table 53). Apart from Botswana, which did not disclose any information on this matter,
the majority of the facilities conduct tests on the treated WPM. The share of the tested WPM range
between 10 percent and more than 50 percent. Results indicate that less than 1 percent of the treated
WPM results infested and these are then retreated.
Table 53: How the WPM treatment facility checks the treatment Botswana Cameroon
Share of WPM treatment facilities
checking WPM after the treatment (in %)
Share of WPM tested (in %)
Share of WPM resulted to be
infested
Share of WPM treatment facilities
checking WPM after the treatment (in %)
Share of WPM tested (in %)
Share of WPM resulted to be
infested
0 n/a n/a 50
Less than 10% (75%)
Between 11–20% (25%)
Less than 1% (100%)
Mozambique Kenya
Share of WPM treatment facilities
checking WPM after the treatment (in %)
Share of WPM tested (in %)
Share of WPM resulted to be
infested
Share of WPM treatment facilities
checking WPM after the treatment (in %)
Share of WPM tested (in %)
Share of WPM resulted to be
infested
66
Between 21–50% (50%)
More than 51% (50%)
Less than 1% (100%)
79
Less than 10% (13%)
Between 11–20% (20%)
Between 21–50% (7%)
More than 51% (60%)
Less than 1% (100%)
Source: Microeconomic data gathered from WPM treatment facilities. Authors’ elaboration.
The last section of the questionnaire refers to the consequences, at many different levels, the
implementation of ISPM 15 may have had in the country. This section has the objective to understand
the knowledge of the interviewees have of the standard and its spillover effects. The first question
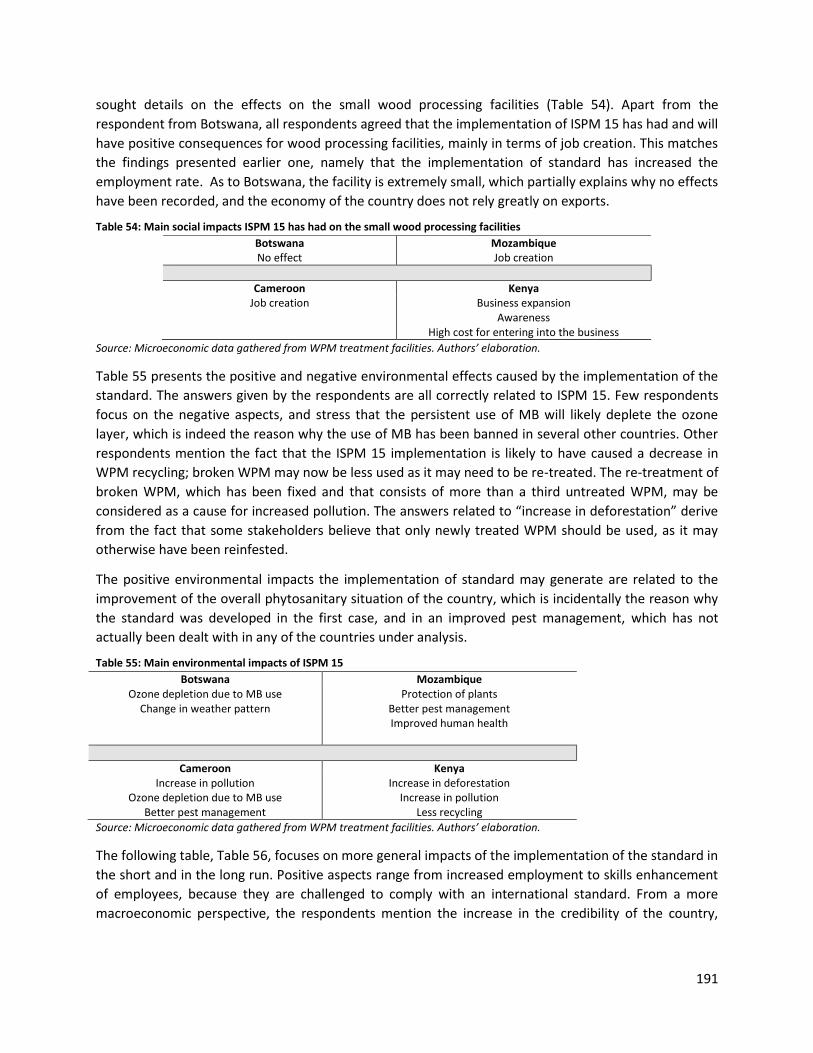
191
sought details on the effects on the small wood processing facilities (Table 54). Apart from the
respondent from Botswana, all respondents agreed that the implementation of ISPM 15 has had and will
have positive consequences for wood processing facilities, mainly in terms of job creation. This matches
the findings presented earlier one, namely that the implementation of standard has increased the
employment rate. As to Botswana, the facility is extremely small, which partially explains why no effects
have been recorded, and the economy of the country does not rely greatly on exports.
Table 54: Main social impacts ISPM 15 has had on the small wood processing facilities
Source: Microeconomic data gathered from WPM treatment facilities. Authors’ elaboration.
Table 55 presents the positive and negative environmental effects caused by the implementation of the
standard. The answers given by the respondents are all correctly related to ISPM 15. Few respondents
focus on the negative aspects, and stress that the persistent use of MB will likely deplete the ozone
layer, which is indeed the reason why the use of MB has been banned in several other countries. Other
respondents mention the fact that the ISPM 15 implementation is likely to have caused a decrease in
WPM recycling; broken WPM may now be less used as it may need to be re-treated. The re-treatment of
broken WPM, which has been fixed and that consists of more than a third untreated WPM, may be
considered as a cause for increased pollution. The answers related to “increase in deforestation” derive
from the fact that some stakeholders believe that only newly treated WPM should be used, as it may
otherwise have been reinfested.
The positive environmental impacts the implementation of standard may generate are related to the
improvement of the overall phytosanitary situation of the country, which is incidentally the reason why
the standard was developed in the first case, and in an improved pest management, which has not
actually been dealt with in any of the countries under analysis.
Table 55: Main environmental impacts of ISPM 15
Source: Microeconomic data gathered from WPM treatment facilities. Authors’ elaboration.
The following table, Table 56, focuses on more general impacts of the implementation of the standard in
the short and in the long run. Positive aspects range from increased employment to skills enhancement
of employees, because they are challenged to comply with an international standard. From a more
macroeconomic perspective, the respondents mention the increase in the credibility of the country,
Botswana Mozambique No effect Job creation
Cameroon Kenya Job creation Business expansion
Awareness High cost for entering into the business
Botswana Mozambique Ozone depletion due to MB use
Change in weather pattern Protection of plants
Better pest management Improved human health
Cameroon Kenya Increase in pollution
Ozone depletion due to MB use Better pest management
Increase in deforestation Increase in pollution
Less recycling
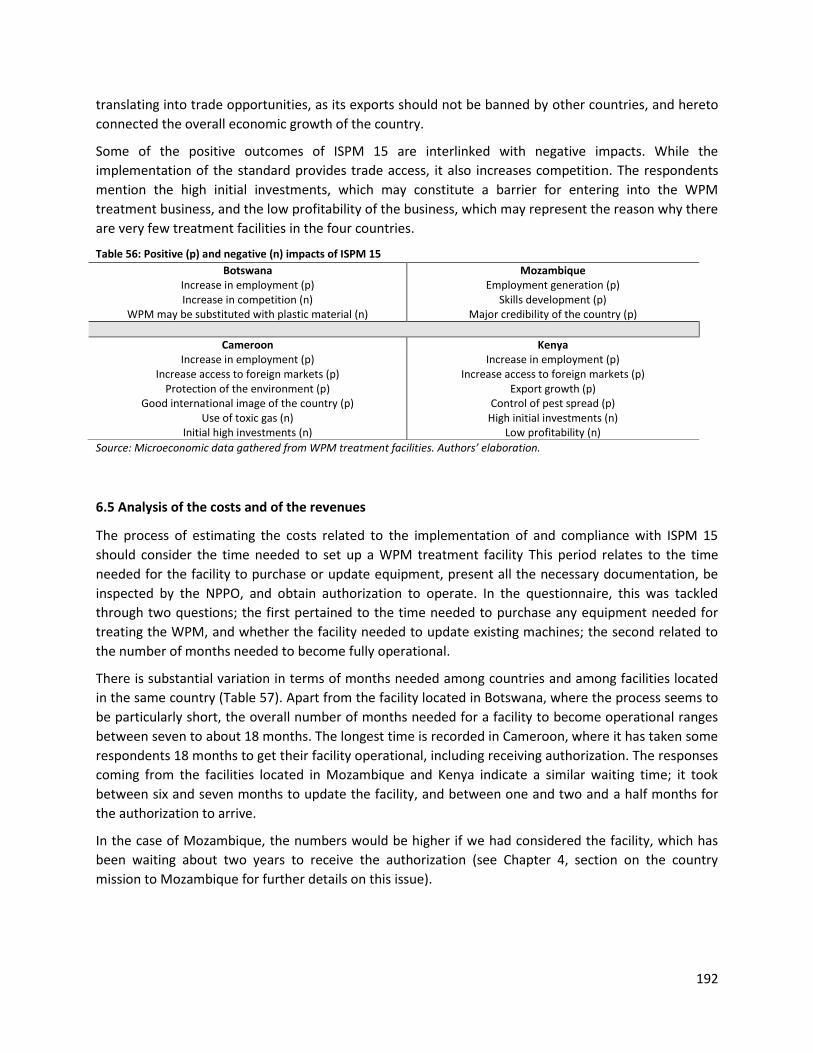
192
translating into trade opportunities, as its exports should not be banned by other countries, and hereto
connected the overall economic growth of the country.
Some of the positive outcomes of ISPM 15 are interlinked with negative impacts. While the
implementation of the standard provides trade access, it also increases competition. The respondents
mention the high initial investments, which may constitute a barrier for entering into the WPM
treatment business, and the low profitability of the business, which may represent the reason why there
are very few treatment facilities in the four countries.
Table 56: Positive (p) and negative (n) impacts of ISPM 15
Source: Microeconomic data gathered from WPM treatment facilities. Authors’ elaboration.
6.5 Analysis of the costs and of the revenues
The process of estimating the costs related to the implementation of and compliance with ISPM 15
should consider the time needed to set up a WPM treatment facility This period relates to the time
needed for the facility to purchase or update equipment, present all the necessary documentation, be
inspected by the NPPO, and obtain authorization to operate. In the questionnaire, this was tackled
through two questions; the first pertained to the time needed to purchase any equipment needed for
treating the WPM, and whether the facility needed to update existing machines; the second related to
the number of months needed to become fully operational.
There is substantial variation in terms of months needed among countries and among facilities located
in the same country (Table 57). Apart from the facility located in Botswana, where the process seems to
be particularly short, the overall number of months needed for a facility to become operational ranges
between seven to about 18 months. The longest time is recorded in Cameroon, where it has taken some
respondents 18 months to get their facility operational, including receiving authorization. The responses
coming from the facilities located in Mozambique and Kenya indicate a similar waiting time; it took
between six and seven months to update the facility, and between one and two and a half months for
the authorization to arrive.
In the case of Mozambique, the numbers would be higher if we had considered the facility, which has
been waiting about two years to receive the authorization (see Chapter 4, section on the country
mission to Mozambique for further details on this issue).
Botswana Mozambique Increase in employment (p) Increase in competition (n)
WPM may be substituted with plastic material (n)
Employment generation (p) Skills development (p)
Major credibility of the country (p)
Cameroon Kenya Increase in employment (p)
Increase access to foreign markets (p) Protection of the environment (p)
Good international image of the country (p) Use of toxic gas (n)
Initial high investments (n)
Increase in employment (p) Increase access to foreign markets (p)
Export growth (p) Control of pest spread (p)
High initial investments (n) Low profitability (n)
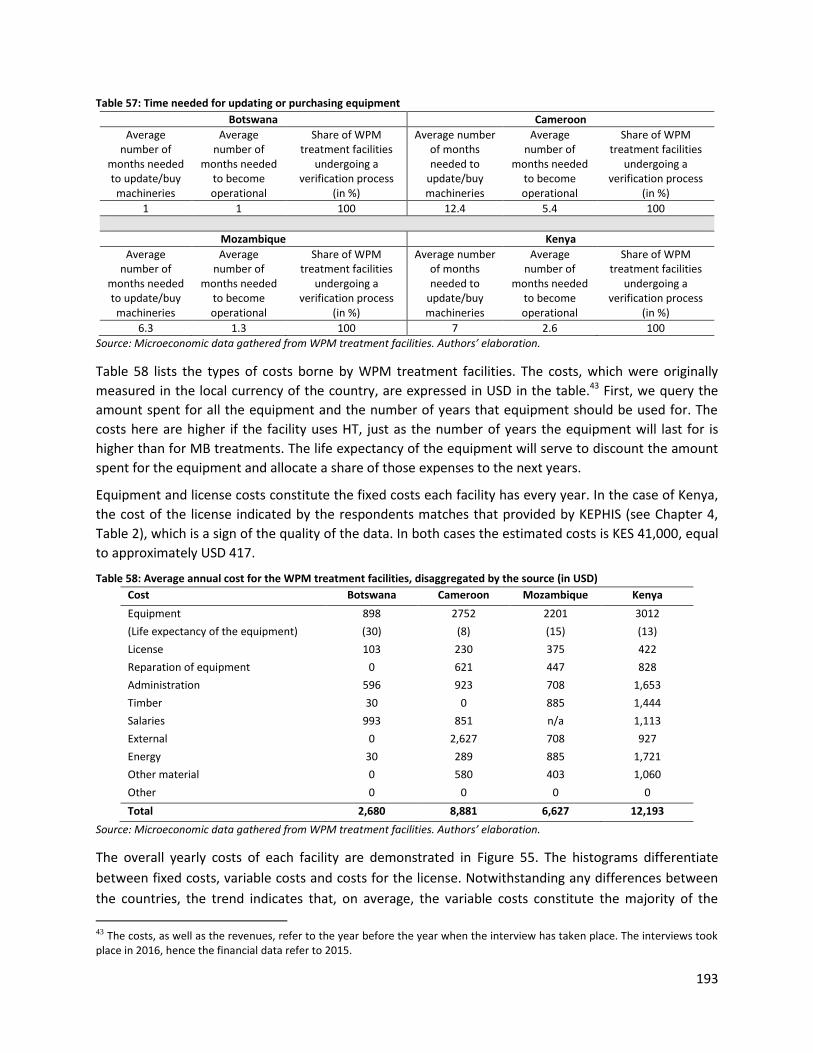
193
Table 57: Time needed for updating or purchasing equipment Botswana Cameroon
Average number of
months needed to update/buy
machineries
Average number of
months needed to become operational
Share of WPM treatment facilities
undergoing a verification process
(in %)
Average number of months needed to
update/buy machineries
Average number of
months needed to become operational
Share of WPM treatment facilities
undergoing a verification process
(in %)
1 1 100 12.4 5.4 100
Mozambique Kenya
Average number of
months needed to update/buy
machineries
Average number of
months needed to become operational
Share of WPM treatment facilities
undergoing a verification process
(in %)
Average number of months needed to
update/buy machineries
Average number of
months needed to become operational
Share of WPM treatment facilities
undergoing a verification process
(in %)
6.3 1.3 100 7 2.6 100
Source: Microeconomic data gathered from WPM treatment facilities. Authors’ elaboration.
Table 58 lists the types of costs borne by WPM treatment facilities. The costs, which were originally
measured in the local currency of the country, are expressed in USD in the table.43 First, we query the
amount spent for all the equipment and the number of years that equipment should be used for. The
costs here are higher if the facility uses HT, just as the number of years the equipment will last for is
higher than for MB treatments. The life expectancy of the equipment will serve to discount the amount
spent for the equipment and allocate a share of those expenses to the next years.
Equipment and license costs constitute the fixed costs each facility has every year. In the case of Kenya,
the cost of the license indicated by the respondents matches that provided by KEPHIS (see Chapter 4,
Table 2), which is a sign of the quality of the data. In both cases the estimated costs is KES 41,000, equal
to approximately USD 417.
Table 58: Average annual cost for the WPM treatment facilities, disaggregated by the source (in USD) Cost Botswana Cameroon Mozambique Kenya
Equipment 898 2752 2201 3012
(Life expectancy of the equipment) (30) (8) (15) (13)
License 103 230 375 422
Reparation of equipment 0 621 447 828
Administration 596 923 708 1,653
Timber 30 0 885 1,444
Salaries 993 851 n/a 1,113
External 0 2,627 708 927
Energy 30 289 885 1,721
Other material 0 580 403 1,060
Other 0 0 0 0
Total 2,680 8,881 6,627 12,193
Source: Microeconomic data gathered from WPM treatment facilities. Authors’ elaboration.
The overall yearly costs of each facility are demonstrated in Figure 55. The histograms differentiate
between fixed costs, variable costs and costs for the license. Notwithstanding any differences between
the countries, the trend indicates that, on average, the variable costs constitute the majority of the
43 The costs, as well as the revenues, refer to the year before the year when the interview has taken place. The interviews took place in 2016, hence the financial data refer to 2015.
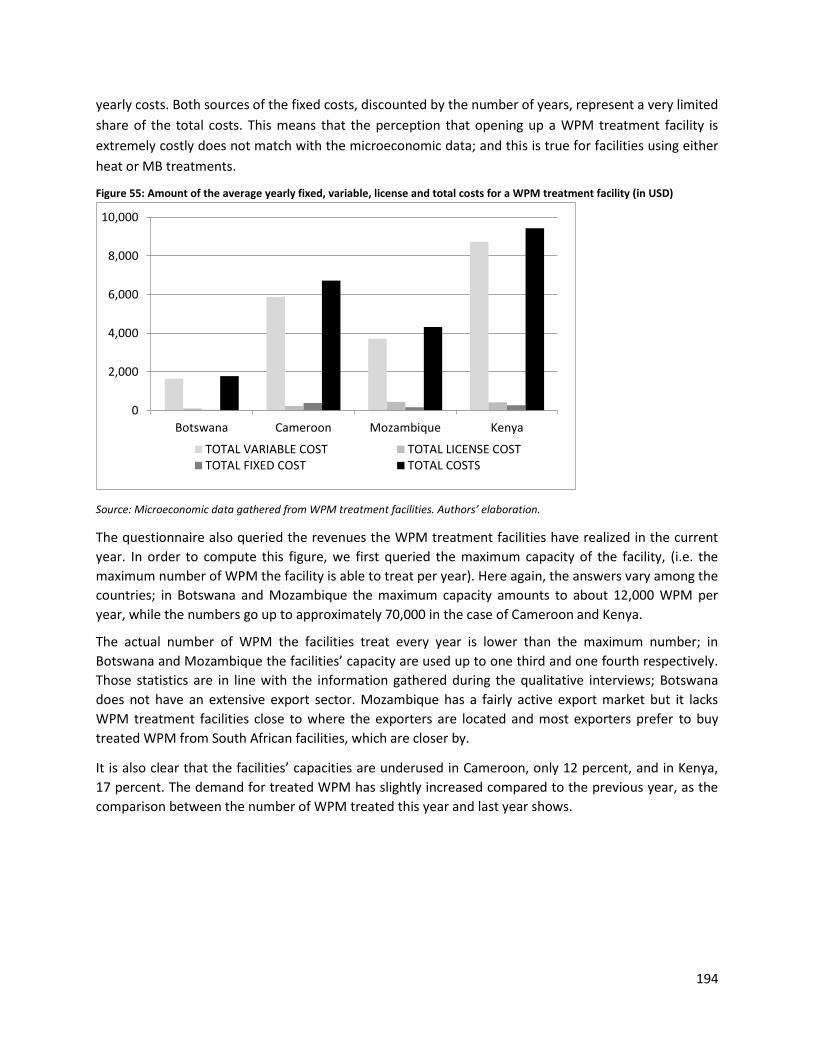
194
yearly costs. Both sources of the fixed costs, discounted by the number of years, represent a very limited
share of the total costs. This means that the perception that opening up a WPM treatment facility is
extremely costly does not match with the microeconomic data; and this is true for facilities using either
heat or MB treatments.
Figure 55: Amount of the average yearly fixed, variable, license and total costs for a WPM treatment facility (in USD)
Source: Microeconomic data gathered from WPM treatment facilities. Authors’ elaboration.
The questionnaire also queried the revenues the WPM treatment facilities have realized in the current
year. In order to compute this figure, we first queried the maximum capacity of the facility, (i.e. the
maximum number of WPM the facility is able to treat per year). Here again, the answers vary among the
countries; in Botswana and Mozambique the maximum capacity amounts to about 12,000 WPM per
year, while the numbers go up to approximately 70,000 in the case of Cameroon and Kenya.
The actual number of WPM the facilities treat every year is lower than the maximum number; in
Botswana and Mozambique the facilities’ capacity are used up to one third and one fourth respectively.
Those statistics are in line with the information gathered during the qualitative interviews; Botswana
does not have an extensive export sector. Mozambique has a fairly active export market but it lacks
WPM treatment facilities close to where the exporters are located and most exporters prefer to buy
treated WPM from South African facilities, which are closer by.
It is also clear that the facilities’ capacities are underused in Cameroon, only 12 percent, and in Kenya,
17 percent. The demand for treated WPM has slightly increased compared to the previous year, as the
comparison between the number of WPM treated this year and last year shows.
0
2,000
4,000
6,000
8,000
10,000
Botswana Cameroon Mozambique Kenya
TOTAL VARIABLE COST TOTAL LICENSE COSTTOTAL FIXED COST TOTAL COSTS
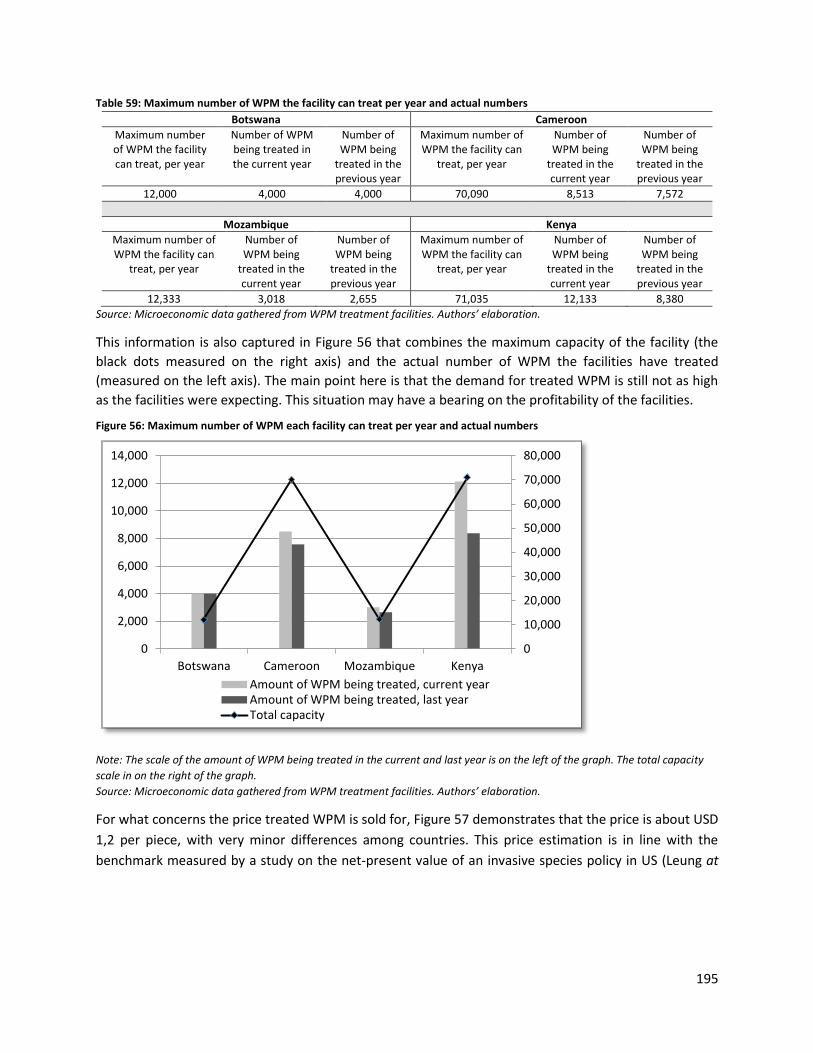
195
Table 59: Maximum number of WPM the facility can treat per year and actual numbers Botswana Cameroon
Maximum number of WPM the facility can treat, per year
Number of WPM being treated in the current year
Number of WPM being
treated in the previous year
Maximum number of WPM the facility can
treat, per year
Number of WPM being
treated in the current year
Number of WPM being
treated in the previous year
12,000 4,000 4,000 70,090 8,513 7,572
Mozambique Kenya
Maximum number of WPM the facility can
treat, per year
Number of WPM being
treated in the current year
Number of WPM being
treated in the previous year
Maximum number of WPM the facility can
treat, per year
Number of WPM being
treated in the current year
Number of WPM being
treated in the previous year
12,333 3,018 2,655 71,035 12,133 8,380
Source: Microeconomic data gathered from WPM treatment facilities. Authors’ elaboration.
This information is also captured in Figure 56 that combines the maximum capacity of the facility (the
black dots measured on the right axis) and the actual number of WPM the facilities have treated
(measured on the left axis). The main point here is that the demand for treated WPM is still not as high
as the facilities were expecting. This situation may have a bearing on the profitability of the facilities.
Figure 56: Maximum number of WPM each facility can treat per year and actual numbers
Note: The scale of the amount of WPM being treated in the current and last year is on the left of the graph. The total capacity
scale in on the right of the graph.
Source: Microeconomic data gathered from WPM treatment facilities. Authors’ elaboration.
For what concerns the price treated WPM is sold for, Figure 57 demonstrates that the price is about USD
1,2 per piece, with very minor differences among countries. This price estimation is in line with the
benchmark measured by a study on the net-present value of an invasive species policy in US (Leung at
0
10,000
20,000
30,000
40,000
50,000
60,000
70,000
80,000
0
2,000
4,000
6,000
8,000
10,000
12,000
14,000
Botswana Cameroon Mozambique Kenya
Amount of WPM being treated, current yearAmount of WPM being treated, last yearTotal capacity
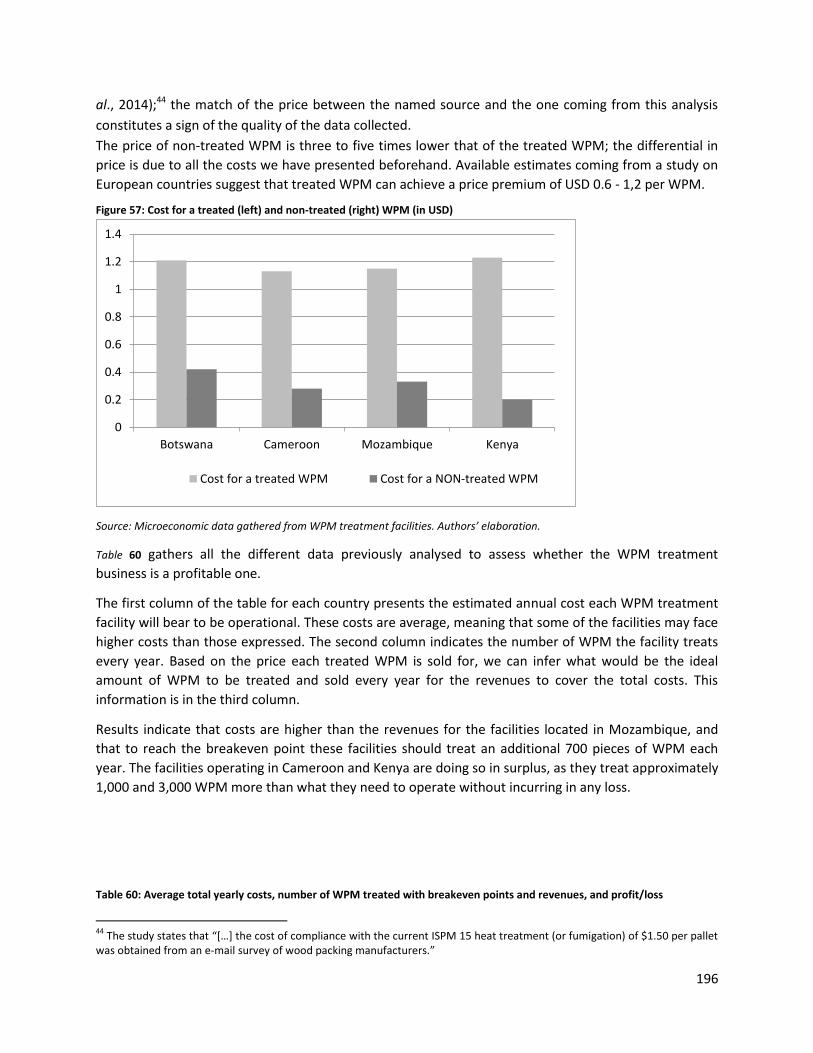
196
al., 2014);44 the match of the price between the named source and the one coming from this analysis
constitutes a sign of the quality of the data collected.
The price of non-treated WPM is three to five times lower that of the treated WPM; the differential in
price is due to all the costs we have presented beforehand. Available estimates coming from a study on
European countries suggest that treated WPM can achieve a price premium of USD 0.6 - 1,2 per WPM.
Figure 57: Cost for a treated (left) and non-treated (right) WPM (in USD)
Source: Microeconomic data gathered from WPM treatment facilities. Authors’ elaboration.
Table 60 gathers all the different data previously analysed to assess whether the WPM treatment
business is a profitable one.
The first column of the table for each country presents the estimated annual cost each WPM treatment
facility will bear to be operational. These costs are average, meaning that some of the facilities may face
higher costs than those expressed. The second column indicates the number of WPM the facility treats
every year. Based on the price each treated WPM is sold for, we can infer what would be the ideal
amount of WPM to be treated and sold every year for the revenues to cover the total costs. This
information is in the third column.
Results indicate that costs are higher than the revenues for the facilities located in Mozambique, and
that to reach the breakeven point these facilities should treat an additional 700 pieces of WPM each
year. The facilities operating in Cameroon and Kenya are doing so in surplus, as they treat approximately
1,000 and 3,000 WPM more than what they need to operate without incurring in any loss.
Table 60: Average total yearly costs, number of WPM treated with breakeven points and revenues, and profit/loss
44
The study states that “[…] the cost of compliance with the current ISPM 15 heat treatment (or fumigation) of $1.50 per pallet was obtained from an e-mail survey of wood packing manufacturers.”
0
0.2
0.4
0.6
0.8
1
1.2
1.4
Botswana Cameroon Mozambique Kenya
Cost for a treated WPM Cost for a NON-treated WPM
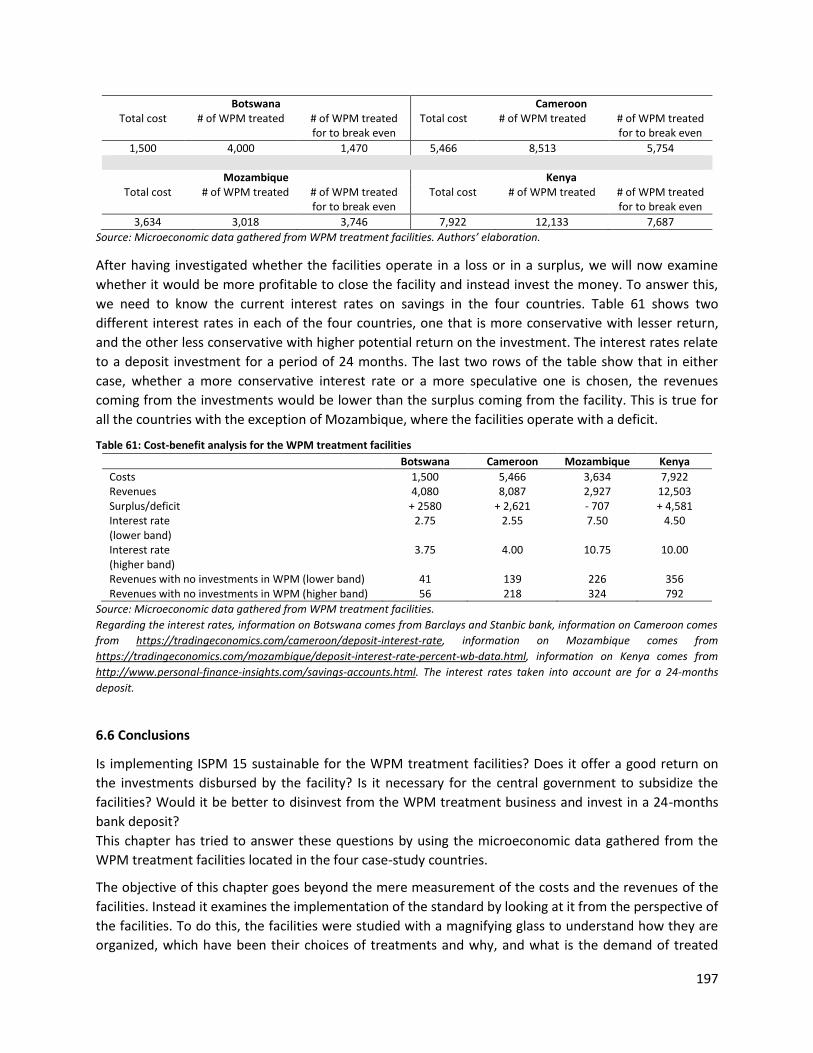
197
Botswana Cameroon Total cost # of WPM treated # of WPM treated
for to break even Total cost # of WPM treated # of WPM treated
for to break even
1,500 4,000 1,470 5,466 8,513 5,754
Mozambique Kenya Total cost # of WPM treated # of WPM treated
for to break even Total cost # of WPM treated # of WPM treated
for to break even
3,634 3,018 3,746 7,922 12,133 7,687
Source: Microeconomic data gathered from WPM treatment facilities. Authors’ elaboration.
After having investigated whether the facilities operate in a loss or in a surplus, we will now examine
whether it would be more profitable to close the facility and instead invest the money. To answer this,
we need to know the current interest rates on savings in the four countries. Table 61 shows two
different interest rates in each of the four countries, one that is more conservative with lesser return,
and the other less conservative with higher potential return on the investment. The interest rates relate
to a deposit investment for a period of 24 months. The last two rows of the table show that in either
case, whether a more conservative interest rate or a more speculative one is chosen, the revenues
coming from the investments would be lower than the surplus coming from the facility. This is true for
all the countries with the exception of Mozambique, where the facilities operate with a deficit.
Table 61: Cost-benefit analysis for the WPM treatment facilities Botswana Cameroon Mozambique Kenya
Costs 1,500 5,466 3,634 7,922 Revenues 4,080 8,087 2,927 12,503 Surplus/deficit + 2580 + 2,621 - 707 + 4,581 Interest rate (lower band)
2.75 2.55 7.50 4.50
Interest rate (higher band)
3.75 4.00 10.75 10.00
Revenues with no investments in WPM (lower band) 41 139 226 356 Revenues with no investments in WPM (higher band) 56 218 324 792
Source: Microeconomic data gathered from WPM treatment facilities.
Regarding the interest rates, information on Botswana comes from Barclays and Stanbic bank, information on Cameroon comes
from https://tradingeconomics.com/cameroon/deposit-interest-rate, information on Mozambique comes from
https://tradingeconomics.com/mozambique/deposit-interest-rate-percent-wb-data.html, information on Kenya comes from
http://www.personal-finance-insights.com/savings-accounts.html. The interest rates taken into account are for a 24-months
deposit.
6.6 Conclusions
Is implementing ISPM 15 sustainable for the WPM treatment facilities? Does it offer a good return on
the investments disbursed by the facility? Is it necessary for the central government to subsidize the
facilities? Would it be better to disinvest from the WPM treatment business and invest in a 24-months
bank deposit?
This chapter has tried to answer these questions by using the microeconomic data gathered from the
WPM treatment facilities located in the four case-study countries.
The objective of this chapter goes beyond the mere measurement of the costs and the revenues of the
facilities. Instead it examines the implementation of the standard by looking at it from the perspective of
the facilities. To do this, the facilities were studied with a magnifying glass to understand how they are
organized, which have been their choices of treatments and why, and what is the demand of treated
198
WPM. Furthermore, we wished to understand whether the information the facilities get from the NPPOs
is clear, if any training is provided and what the overall level of knowledge the facilities have of ISPM 15
is.
With this in mind, we designed a facility-level questionnaire with questions ranging from the
documentation needed to be presented when requesting authorization from the NPPO to operate in the
WPM business, the employment rate of those facilities, the treatments the facilities use, to the training
organized to instruct the facility appropriate in how to comply with ISPM 15. In addition, we asked the
respondents to elaborate on possible effects – environmental, social and economic – they feel ISPM 15
may have caused. Lastly, an entire section of the survey tool looked at the financial costs the facilities
bear when operating, and at their annual revenues. We looked at all the costs related to the treatment
process, both fixed and variable costs, and after assessing the costs related to the equipment, to
obtaining authorization, and to salaries and energy, we compared them with the revenues from the sale
of the treated WPM.
The analysis highlighted a number of interesting key points. First, there is no homogenous approach to
what is requested from applicants wishing to obtain authorization as a WPM treatment facility. While
ISPM 15 does not set requirements around this, there should be clarity within the country on the
documentation requested from the applicant facilities to provide for transparency, equality and
efficiency, and help ensure that the facilities meet all the requirements for operating the treatments set
out in ISPM 15.
The authorization process may in some cases be extraordinary long. Overall the process from purchasing
all the necessary equipment to receiving the license may take up to one and half year. The NPPOs should
improve the process by providing clearer indications and ad-hoc training. For what concerns the
treatments used, some facilities used HT while others MB. However, the main issue related to the
treatments is that some facilities use treatments that are not recognized by ISPM 15. This is a problem
when WPM is stamped with the ISPM 15 mark, while not complying with the standard, and it is primarily
due to misinterpretation of the contents of the standard.
On the financial side, the content of this chapter, discussed in combination with the qualitative evidence
and the macroeconomic analysis, will help understand the overall costs and benefits of implementing
the standard. There has recently been controversy over whether it is economically viable to implement
and comply with the standard. Those in disagreement with the standard presents the argument that
most introduced pests are innocuous whereas ISPM 15 implementation is costly and usually only delays
pest introductions, rather than eliminating them.
This chapter demonstrates that WPM treatment facilities are self-sustainable and that the costs are off-
set by the revenues from the sale of treated WPM. Only in Mozambique, the four facilities interviewed
(on average) display a negative surplus, meaning that the sales are lower than the operational costs. In
the specific case of Mozambique, the issue is more strategic than anything else as the WPM treatment
facilities are not located close to export companies, and this negatively affects the volumes of sale.
We also presented the hypothetical scenario in which the average investment spent on a facility would
be put in the bank for two years. This hypothesis demonstrated that investing in the facilities is more
profitable than investing in a bank. The exercise shows the viability of the WPM treatment business in
the four countries, and that the costs related to implementing the standard at the export level are off-
set by the revenues. In the next and concluding chapter, we will incorporate the results from all the
199
different analyses to offer a more complete view on the sustainability of the international standard,
considering here also other benefits, such as the possibility to export to countries implementing the
standard, which have not been considered in this chapter.
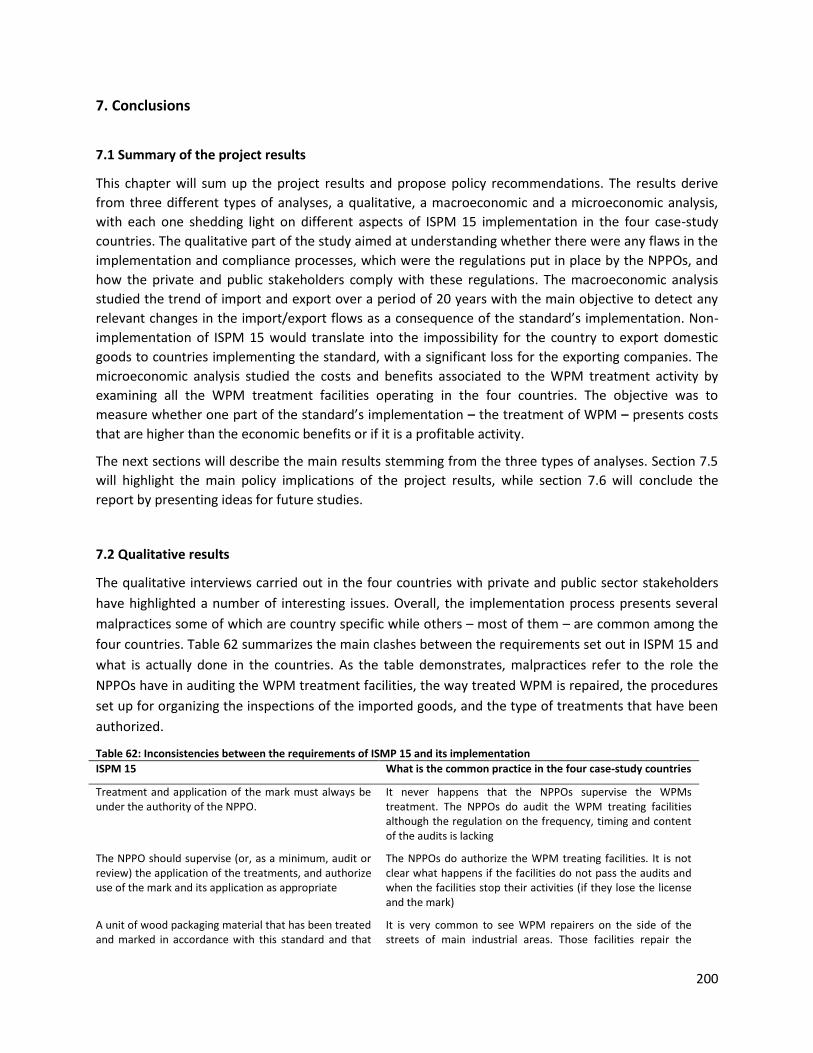
200
7. Conclusions
7.1 Summary of the project results
This chapter will sum up the project results and propose policy recommendations. The results derive
from three different types of analyses, a qualitative, a macroeconomic and a microeconomic analysis,
with each one shedding light on different aspects of ISPM 15 implementation in the four case-study
countries. The qualitative part of the study aimed at understanding whether there were any flaws in the
implementation and compliance processes, which were the regulations put in place by the NPPOs, and
how the private and public stakeholders comply with these regulations. The macroeconomic analysis
studied the trend of import and export over a period of 20 years with the main objective to detect any
relevant changes in the import/export flows as a consequence of the standard’s implementation. Non-
implementation of ISPM 15 would translate into the impossibility for the country to export domestic
goods to countries implementing the standard, with a significant loss for the exporting companies. The
microeconomic analysis studied the costs and benefits associated to the WPM treatment activity by
examining all the WPM treatment facilities operating in the four countries. The objective was to
measure whether one part of the standard’s implementation – the treatment of WPM – presents costs
that are higher than the economic benefits or if it is a profitable activity.
The next sections will describe the main results stemming from the three types of analyses. Section 7.5
will highlight the main policy implications of the project results, while section 7.6 will conclude the
report by presenting ideas for future studies.
7.2 Qualitative results
The qualitative interviews carried out in the four countries with private and public sector stakeholders
have highlighted a number of interesting issues. Overall, the implementation process presents several
malpractices some of which are country specific while others – most of them – are common among the
four countries. Table 62 summarizes the main clashes between the requirements set out in ISPM 15 and
what is actually done in the countries. As the table demonstrates, malpractices refer to the role the
NPPOs have in auditing the WPM treatment facilities, the way treated WPM is repaired, the procedures
set up for organizing the inspections of the imported goods, and the type of treatments that have been
authorized.
Table 62: Inconsistencies between the requirements of ISMP 15 and its implementation
ISPM 15 What is the common practice in the four case-study countries
Treatment and application of the mark must always be under the authority of the NPPO.
It never happens that the NPPOs supervise the WPMs treatment. The NPPOs do audit the WPM treating facilities although the regulation on the frequency, timing and content of the audits is lacking
The NPPO should supervise (or, as a minimum, audit or review) the application of the treatments, and authorize use of the mark and its application as appropriate
The NPPOs do authorize the WPM treating facilities. It is not clear what happens if the facilities do not pass the audits and when the facilities stop their activities (if they lose the license and the mark)
A unit of wood packaging material that has been treated and marked in accordance with this standard and that
It is very common to see WPM repairers on the side of the streets of main industrial areas. Those facilities repair the
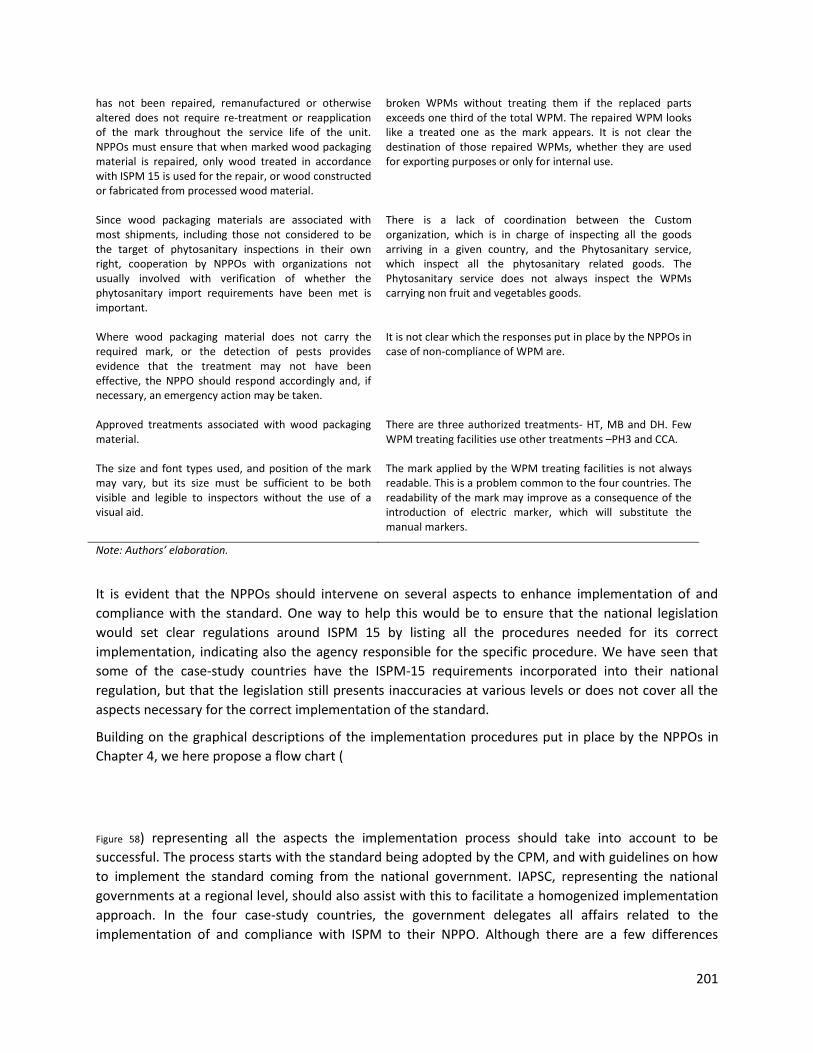
201
has not been repaired, remanufactured or otherwise altered does not require re-treatment or reapplication of the mark throughout the service life of the unit. NPPOs must ensure that when marked wood packaging material is repaired, only wood treated in accordance with ISPM 15 is used for the repair, or wood constructed or fabricated from processed wood material.
broken WPMs without treating them if the replaced parts exceeds one third of the total WPM. The repaired WPM looks like a treated one as the mark appears. It is not clear the destination of those repaired WPMs, whether they are used for exporting purposes or only for internal use.
Since wood packaging materials are associated with most shipments, including those not considered to be the target of phytosanitary inspections in their own right, cooperation by NPPOs with organizations not usually involved with verification of whether the phytosanitary import requirements have been met is important.
There is a lack of coordination between the Custom organization, which is in charge of inspecting all the goods arriving in a given country, and the Phytosanitary service, which inspect all the phytosanitary related goods. The Phytosanitary service does not always inspect the WPMs carrying non fruit and vegetables goods.
Where wood packaging material does not carry the required mark, or the detection of pests provides evidence that the treatment may not have been effective, the NPPO should respond accordingly and, if necessary, an emergency action may be taken.
It is not clear which the responses put in place by the NPPOs in case of non-compliance of WPM are.
Approved treatments associated with wood packaging material.
There are three authorized treatments- HT, MB and DH. Few WPM treating facilities use other treatments –PH3 and CCA.
The size and font types used, and position of the mark may vary, but its size must be sufficient to be both visible and legible to inspectors without the use of a visual aid.
The mark applied by the WPM treating facilities is not always readable. This is a problem common to the four countries. The readability of the mark may improve as a consequence of the introduction of electric marker, which will substitute the manual markers.
Note: Authors’ elaboration.
It is evident that the NPPOs should intervene on several aspects to enhance implementation of and
compliance with the standard. One way to help this would be to ensure that the national legislation
would set clear regulations around ISPM 15 by listing all the procedures needed for its correct
implementation, indicating also the agency responsible for the specific procedure. We have seen that
some of the case-study countries have the ISPM-15 requirements incorporated into their national
regulation, but that the legislation still presents inaccuracies at various levels or does not cover all the
aspects necessary for the correct implementation of the standard.
Building on the graphical descriptions of the implementation procedures put in place by the NPPOs in
Chapter 4, we here propose a flow chart (
Figure 58) representing all the aspects the implementation process should take into account to be
successful. The process starts with the standard being adopted by the CPM, and with guidelines on how
to implement the standard coming from the national government. IAPSC, representing the national
governments at a regional level, should also assist with this to facilitate a homogenized implementation
approach. In the four case-study countries, the government delegates all affairs related to the
implementation of and compliance with ISPM to their NPPO. Although there are a few differences
202
between the countries, the NPPO is, generally speaking, the agency in charge of developing a legislative
framework and of setting up the procedures necessary to implement the standard. One of the important
aspects of handling the implementation process is to publish the regulation in the national gazette.
However, out of the four case-study countries, only Cameroon did this although the national gazette did
not portray the correct information. The lack of communication may create problems in terms of
coordinating efforts to comply with the standard. Chapter 4 provides examples of such challenges for
instance those created because of the lack of communication between the phytosanitary service and the
customs organization in regards to inspecting consignments at import. Another point of improvement
for the countries of study would be to create synergies between the NPPO and the national ministry of
industry to increase an understanding of which economic sectors benefit the most from the
implementation of the standard and which would need subsidies.
The activities related to the implementation of and the compliance with the standard should also take
into account the know-how present in the country and, if necessary, how training would be provided.
Chapter 4 evidenced a number of examples of misunderstandings regarding the treatments allowed
under ISPM 15, which may create cases of non-compliance. WPM treatment facilities must use one of
the three approved treatments (HT, MB or DT), applied according to the standard’s requirements, but
this is not always the case.
The NPPO has the obligation to inspect the WPM treatment facilities on a regular basis. The NPPOs of
the case-study countries do inspect and audit the facilities, but the frequency and the content of the
audits are debatable, as the inspectors do not always check the treatment records and, in most of the
cases, records are handwritten and not computer recorded.
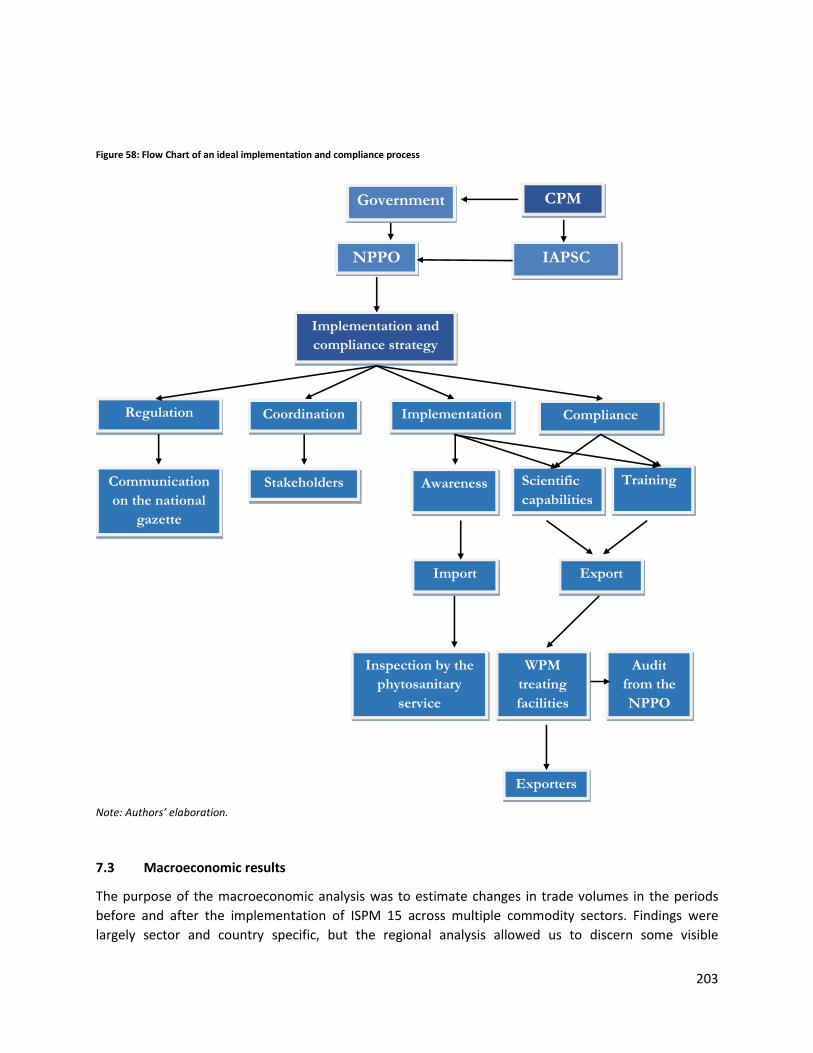
203
Figure 58: Flow Chart of an ideal implementation and compliance process
Note: Authors’ elaboration.
7.3 Macroeconomic results
The purpose of the macroeconomic analysis was to estimate changes in trade volumes in the periods
before and after the implementation of ISPM 15 across multiple commodity sectors. Findings were
largely sector and country specific, but the regional analysis allowed us to discern some visible
NPPO
Implementation and
compliance strategy
Strategy
IAPSC
Regulation Coordination
CPM
Implementation Compliance
Communication
on the national
gazette
Stakeholders Awareness Scientific
capabilities
Training
Import Export
Inspection by the
phytosanitary
service
WPM
treating
facilities
Audit
from the
NPPO
Exporters
Government
204
differences in export and import trends. In Kenya, half of the export sectors experienced an increase in
export volumes, whereas in Botswana, Cameroon and Mozambique the majority of the export sectors
experienced an increase. In Kenya and Botswana, half of the import sectors experienced an increase in
import volumes, whereas in Cameroon and Mozambique the majority of the import sectors experienced
an increase. In Kenya and Cameroon, overall imports increased by far more than exports, resulting in a
decrease of the trade balance. Mozambique also experienced a deterioration of its trade balance, but
this was a result of both a decline in overall exports and an increase in total imports. In contrast, in
Botswana overall exports increased by far more than exports, resulting in an improvement of the trade
balance.
These changes in overall and sector-specific exports and imports are likely to be linked to factors
associated with the ISPM 15 implementation. For example, the reduction in export volumes for certain
sectors after the adoption of the standard can be the combined result of (a) the increased cost of
implementation (and reduced competitiveness), (b) limited capacity to implement the standard
effectively and (c) the decision of some exporters to abstain from using packaging material that
conforms to ISPM 15 regulations. Wherever our analysis points to a statistically significant increase in
the export value of a particular sector, this potentially signifies that corresponding exports have been
largely compliant with the ISPM 15 regulations (assuming that, otherwise, a constrained access to other
markets with stringent environmental regulations would have created a more subdued outcome).
Naturally, the macroeconomic analysis allows us to derive some general trends in terms of changes in
volumes of trade. A more qualitative-based analysis per sector would need to identify the extent to
which the drop in export revenues for each sector was associated with the administrative burden and
costs associated with the implementation of ISPM 15 in combination with other underlying internal and
external factors (e.g. changes in prices locally and globally, emergence of new competitors, constraints
in domestic productive capacity, or exchange rate volatility). Some of the factors would also likely be
sector-specific and therefore not be easily incorporated in a macroeconomic cross-sector analysis. The
same should also apply in the context of import sectors.
Governments can support those exporting industries that experienced a contraction in the aftermath of
ISPM 15 implementation. When the contraction might be the result of poor implementation of the
standard and increased costs of compliance, policymakers can design interventions that allow
companies (especially small-scale ones) to recover part of the costs, implement the standard effectively
and maintain access to global markets. Alternatively they can support those sectors that grew
substantially in the aftermath of ISPM 15 implementation, as long as these industries can expand further
and compensate for the value and employment loss that other contracting sectors experienced.
Kenya
Approximately half of the sectors experienced an increase in export volumes following the
implementation of ISPM 15. The largest statistically significant were in explosives and pyrotechnics
(+221%) and dairy products (+165%), while the largest decreases were in salt and sulphur products
(−202%) and impregnated, coated or laminated textiles (−156%). The largest drop in export values were
in salt and sulphur products (−343.4 million USD) and raw hides (−70 million USD).
Approximately half of the sectors experienced an increase in import volumes. The largest increases in
the period after the implementation of ISPM 15 were in pasta and baking products (+72%) and
205
aluminium articles (+62%), while the largest decreases were in vegetable textiles and fibres (−218%) and
arms and ammunition (−130%). The largest drop in import values were in edible vegetables (−34.79
million USD) and coffee, tea and spices (−26.4 million USD).
Overall, exports increased by USD 551,000,000, while imports increased by USD 1,226,850,000. As a
result of this, the trade balance decreased by USD 675,850,000.
Botswana
The vast majority of sectors experienced an increase in export volumes following the implementation of
ISPM 15. The largest increases were in dairy products (+349%) and synthetic filaments (+287%), while
the largest decreases were in copper articles (−469%) and fertilizers (−366%). The largest drop in export
values were in copper articles (−20.17 million USD) and articles of apparel (−6.73 million USD). The
decrease in the value of exports of copper articles may have also been facilitated by fluctuations in
copper prices in global markets.
Approximately half of the sectors experienced an increase in import volumes in the same period. The
largest increases were in cereals (+184%) and organic chemicals (+133%), while the largest decreases
were in explosives and pyrotechnics (−219%) and products of animal origin (−161%). The largest drop in
import values were in processed vegetables and fruit (−58.86 million USD) and edible vegetables (−35.26
million USD).
Overall, exports increased by USD 831,457,000, while imports increased by USD 275,596,000. As a result
of this, the trade balance improved by USD 555,861,000.
Cameroon
The majority of sectors experienced an increase in export volumes in the period following the
implementation of ISPM 15. The largest increases were in man-made filaments (+356%) and basketware
and wickerwork (+347%), while the largest decreases were in vegetable textiles and fibres (−439%) and
lace and embroidery (−333%). The largest drop in export values were in cotton products (−163.5 million
USD) and furniture and furnishing items (−0.81 million USD).
The vast majority of sectors experienced an increase in import volumes in the same period. The largest
increases were in seafood items (+186%) and tin articles (+183%), while the largest decreases were in
meat products (−249%) and base metal articles (−191%). The largest drop in import values were in meat
products (−21.66 million USD) and cotton products (−6.59 million USD).
Overall, exports increased by USD 149,612,000, while imports increased by USD 1,478,612,000. As a
result of this, the trade balance deteriorated by USD 1,329,000,000.
Mozambique
The majority of sectors experienced an increase in export volumes in the period after the
implementation of ISPM 15. The largest increases were in bamboo and plaiting materials (+561%) and
footwear (+444%), while the largest decreases were in chemical products (−399%) and
photographic/cinematographic goods (−347%). The largest drop in export values were in chemical
products (−211.47 million USD) and seafood items (−47.04 million USD).
206
The vast majority of the sectors experienced an increase in import volumes in the same period. The
largest increases were in knitted or crocheted fabrics (+142%) and carpets (+136%), while the largest
decreases were in fruit and nuts (−1.61%) and edible vegetables (−135%). The largest drop in import
values were in electronics (−216 million USD) and dairy products (−45.59 million USD).
Overall, exports decreased by USD 47,287,000, while imports increased by USD 165,542,000. As a result
of this, the trade balance deteriorated by USD 212,829,000.
7.4 Microeconomic results
The microeconomic analysis looked at whether implementing the standard represents an economically
viable option for the four case-study countries. The cost-benefit analysis proposed in Chapter 6 looked
specifically at the WPM treatment facilities. ISPM 15 implementation causes a country to face a number
of costs, and in return to get a number of benefits, at multiple levels. As an example, the government
will have to create a legislative framework and the NPPO will have to set up procedures for inspections
of consignments at import and export. At the same time, the NPPO should guide the WPM treatment
facilities on how to correctly apply treatments and they should audit the facilities regularly. All these
activities – setting up the rules, providing training and auditing – come with a cost.
The analysis helps us understanding whether implementing the ISPM 15 is a viable economic activity for
the WPM treatment facilities, which in turn helps the governments in the case-study countries
understand whether the WPM treatment businesses would need to be subsidized.
The analysis used microeconomic data gathered from all WPM treatment facilities located in the four
countries (in total 36 facilities). The questionnaire looked at a number of issues, extending beyond
financial questions, related to how the WPM treatment facilities implement the standard. Questions
ranged from the documents needed to obtain authorization to operate, the employment rates, the
types of treatment used, to whether trainings to instruct the facility had been organized. As we wanted
to assess the respondents’ knowledge of ISPM 15, the interviewees were asked to elaborate on possible
effects – at the environmental, social and economic level – the ISPM 15 may have caused.
For what concerns the costs and benefits analysis, an entire section of the survey tool collected
information on the expenses related to treating WPM, and on the revenues the facilities may have.
Specifically, we looked at all the costs related to the marking process, recording both fixed and variable
costs, including those related to the equipment, obtaining authorization, salaries and energy
consumption. We then compared them with the revenues coming from the sale of the treated WPM.
This comparison sheds light on the profitability of the business.
The microeconomic analysis pointed out a number of interesting key points.
First, the types of documents the NPPOs require from the WPM treatment facilities to grant
authorization differ between the licence requests. As also highlighted in other circumstances, the lack of
transparent communication between the NPPO and the WPM treatment facilities means that the
facilities do not have clarity around the documentation needed to obtain the license. Notwithstanding
that countries have the liberty to request any documentation they deem necessary, and thus that there
may be differences between countries, there should be clarity within a given country on the
requirements that a potential WPM treatment facility needs to meet to be able to obtain authorization.
207
Second, the authorization process may be very long. This is particularly true when the time the facilities
have spent on getting the treatment equipment ready is also factored into the calculation. Overall, the
whole process – from purchasing all the necessary equipment to receiving the license – may take up to
18 months. The NPPOs should make the process smoother and provide clearer indication of the
requirements, just as they should provide ad-hoc training, as the 18 months’ period of inactivity
represents a loss for the business.
Third, for what concerns the treatment applied, about half of the interviewed facilities apply HT and the
other half MB (there are no facilities using DH). The main issue pertaining to the treatments is
represented by the fact that some facilities use treatments that are not recognized under ISPM 15, as
observed in Cameroon where PH3 is authorized as a potential treatment, or in Kenya where one facility
uses the chromated copper arsenate (CCA) treatment.
Fourth, further to the costs and benefits, there has recently been debates as to whether the
implementation of and the compliance with the standard is an economically viable operation. The
analysis and the results presented in Chapter 6 demonstrate that the WPM treatment facilities are self-
sustainable. All the costs they face are off-set by the revenues, which come from sale of treated WPM.
Only in Mozambique, did the four interviewed facilities (on average) display a negative surplus
suggesting that the sales are lower than the operational costs. However, in the case of Mozambique, the
lack of profitability is due to a strategic issue more than anything else, as the WPM treatment facilities
are not located next to exporting companies, which impacts the sales volumes negatively.
We further hypothesized that the average money spent by the facilities would be invested in the bank
for a period of two years with the conclusion that this was less profitable than investing the same funds
in the facilities. This exercise demonstrated the viability of the WPM treatment business and that the
costs related to implementing the standard at the export level are off-set by the revenues.
7.5 Policy recommendations
This section aims at combining all the results of the project and translating them into policy
recommendations. The recipients of these recommendations are mainly the four NPPOs involved in the
project, but other NPPOs facing the same or similar challenges may also find them useful. The main
recommendations, which have been discussed with representatives of the four NPPOs during the final
project meeting45, are listed below. Part of these will also be submitted by NPPO representatives at the
“Successes and Challenges” session during the CPM session to be held in 2018.
i. The government should develop national legislation to support the correct implementation of ISPM 15
that is sufficiently broad and flexible to incorporate any future changes to ISPM 15. In this context, it
would be advisable to harmonize the national legislations of the countries belonging to the African
Union. IAPSC should take a coordinating role in this, facilitating drafting a common legislation for all the
countries to help ensure harmonization and transparency.
45
The final project meeting was held at the Kephis Inspectorate Centre, Nairobi (Kenya), 20–21 July 2017. Eight representatives from the four NPPOs involved in the project attended, as well as one representative from STDF and from FAO-IPPC, respectively.
208
ii. Each NPPO should prepare, distribute and advertise policy documents on what is needed for the
implementation of and compliance with the standard. The policy documents should clarify the
requirements each potential WPM treatment facilities need to meet to become authorized. This
information – for the sake of clarity and transparency – should be publicly available on the NPPO’s
website.
iii. Once the requirements are clarified and made available (see ii), the NPPO should prepare policy
guidelines on the content of the audits, to be able to verify in a consistent manner whether the WPM
treatment facilities are operating in compliance with the standard. The following should be indicated in
the guidelines: (a) frequency of the audits according to best practices; (b) whether the audit should be
announced or not; (c) what to audit (i.e. the specific proof of compliance); (d) the actions NPPOs may
take (e.g. fines or suspension) in case of malpractice; and (e) penalties to impose on facilities refusing
audits or for critical non-compliance (e.g. repeated instances of incorrect implementation of ISPM 15).
iv. A list of all authorized WPM treatment facilities in the country should be made publicly available
(possibly on the NPPO’s website). The list should also display the license expiry date to enhance
transparency, as this information may be relevant to exporters when choosing a WPM treatment facility.
v. The NPPO may decide to put in place a cost-recovery mechanism for the audits for instance by
charging the WPM treatment facilities for the audits. The drawback is that the mechanism may have
negative spillover effects and may generate some undesirable corruption mechanisms.
vi. There may be a need for alternative WPM treatments, considering that MB has been or is being
phased out in the case-study (and many other) countries.
vii. The NPPO should clarify that there are only three ISPM-15 treatments applicable to WPM (HT, MB
and DH) and that no other treatments should be used under any circumstance.
vii). The NPPO should stress that the ISPM-15 treatments are equivalent in terms of efficacy. This to help
deconstruct the myth, believed by both private and public stakeholders, that one or the other is more
efficient.
ix. Questions arising from the qualitative interviews such as whether the HT/DH/MB treatments have an
expiry date or a validity of three months, whether WPM may be free of pest after being stored for six
months in a dry place, should be addressed. As they are not answered in ISPM 15, they have been
submitted to the International Forest Quarantine Research Group for further study.
x. The NPPO should help ensure that the mark is applied correctly and in conformity with ISPM 15.
Visible marks is crucial for the correct implementation of ISPM 15, and also eases the inspectors’ job.
xi. The NPPO should investigate the compliance of informal WPM repair facilities. These facilities repair
broken WPM without retreating the newly assembled WPM. The destination of the WPM is unclear
(whether for use domestically only or also for exports). The NPPO should clarify when retreatment for
repaired WPM is required according to ISPM 15.
xii. The NPPOs should prepare import inspection guidelines that apply to consignments of fruit and
vegetables as well as other goods. The guidelines should suggest how to intensify the communication
between phytosanitary and customs inspectors.
xiii. All the above recommendations should be discussed at a regional level with the oversight of IAPSC.
209
7.6 Future research
Existing research on ISPM 15 is still at the anecdotal stage and additional research is needed. There are
many areas relating to the implementation of and the compliance with the standard that would benefit
from further study. In addition, there is a lack of comparative studies on how various countries located
in different areas of the world and in different developing stages implement the standard. Such a
comparative study would help practitioners understand best practices and allow for an analysis of
whether those practices could be transferred to other realities.
Future research should not be limited to comparative studies but extend to the inclusion of additional
phytosanitary treatments, beyond those currently adopted under ISPM 15, to provide for alternatives to
MB treatments.
Another high-priority area of research would be to address the instruments by which the NPPO auditors
can verify that WPM was indeed subject to treatment. Currently, auditors cannot actually verify that a
specific piece of WPM was heat treated to ISPM 15 standards, except for verifying the facility’s
documentation. For HT, perhaps a temperature-sensitive solution could be invented that, when applied
to the wood or to the mark, would change colour depending on the temperature it had been exposed
to. This research could help improve and strengthen ISPM 15 and consequently further reduce the pest
risk posed by WPM in international trade.
In addition, this project calls for more regular analyses of interception data. Such analyses would be
useful to evaluate pathway risks and the effects that phytosanitary measures have in mitigating the risks
of introductions and spread of harmful pests. In the absence of other information on pests being
introduced through international movement of goods, it would be desirable to enhance the recording of
inspection and interception data, and ideally in such a way that the data are more amenable to
statistical analysis and interpretation. There are excellent opportunities for international collaboration
and sharing of data that would benefit all stakeholders. As a case study of the effects of a phytosanitary
policy, the analysis of the benefits and costs of ISPM 15 demonstrated that it is worthwhile
implementing and complying with the standard.
210
8. References
Anderson, J.E. & Marcouiller, D. 2002. Insecurity and the pattern of trade: An empirical investigation.
Review of Economics and Statistics, 84: 342–352.
Aukema, J.E., Leung, B., Kovacs, K. Chivers, C., Britton, K.O., Englin, J., Frankel, S.J., Haight, R.G., Holmes,
T.P., Liebhold, A.M., McCullough, D.G. & Von Holle, B. 2011. Economic impacts of non-native forest
insects in the Continental United States. PLoS ONE, 6: e24587.
Barak, A.V., Wang, Y., Xu, L., Rong, Z., Hang, X. & Zhan, G. 2005. Methyl Bromide as a quarantine
treatment for Anoplophora glabripennis (Coleoptera: Cerambycidae) in regulated wood packing
material. Journal of Economic Entomology, 98: 1911–1916.
Beghin, J.C. & Bureau, J. 2001. Quantitative policy analysis of sanitary, phytosanitary and technical
barriers to trade. Économie international, 3: 107–130.
Born, W., Rauschmayer, F. & Bräuer, I. 2005. Economic evaluation of biological invasions—a survey.
Ecological Economics, 55: 321–336.
Brindley, C. 2005. Barriers to women achieving their entrepreneurial potential: Women and risk.
International Journal of Entrepreneurial Behavior and Research, 11: 144–161.
Cato, J. 1998. Economic issues associated with seafood and implementation of seafood HACCP,
Programmes. Food and Agriculture Organization of the United Nations (FAO), Rome, Italy.
Ciesla, W.M. 2004. Wood and wood products as pathways for introduction of exotic bark, beetles and
woodborers. Crop Protection Compendium. Wallingford, UK, Cabi.
Clarke, M. 2004. Phytosanitary measures: preventing the introduction of exotic pests and pathogens
occurring from the global trade of wood products. Finish Forest Research Institute, Helsinki, Finland.
Clougherty, J.A. and Grajek, M. 2014. International standards and international trade: Empirical
evidence from ISO 9000 diffusion. International Journal of Industrial Organization, 36: 70–82.
Colautti, R.I., Grigorovich, I.A. & MacIsaac, H.J. 2006. Propagule pressure: a null model for biological
invasions. Biological Invasions, 8: 1023–1037.
De Santis, R., 2012. Impact of environmental regulations on trade in the main EU countries: Conflict or
synergy? World Economy, 35: 799–815.
Desprez-Loustau, M.L. 2009. Alien fungi of Europe. In: W. Nentwig, P. Hulme, P. Pysek & M. Vila, eds.
Handbook of Alien Species in Europe. The Netherlands, Springer.
Engel, S., Pagiola, S. & Wunder, S. 2008. Designing payments for environmental services in theory and
practice: An overview of the issues. Ecological Economics, 65: 663–674.
Feitshans, T.A. 2015. Agricultural and agribusiness law: An introduction for non-lawyers. Routledge,
Abingdon, United Kingdom. 332 pp.
211
Fields, P.G. & White, N.D. 2002. Alternatives to methyl bromide treatments for stored-product and
quarantine insects. Annual Review of Entomology, 47(1): 331–359.
Finger, J.M. & Schuler, P. 1999. Implementation of Uruguay round commitments: The development
challenge. World Bank, Blackwell Publishers Ltd 2001, USA.
Fontagné, L., Mimouni, M. & Pasteels, J. 2005. Estimating the impact of environmental SPS and TBT on
international trade. Integration and Trade Journal, 22(3): 7–37.
Gómez-Herrera, E. 2012. Comparing alternative methods to estimate gravity models of bilateral trade.
Empirical Economics, 44: 1087–1111.
Gross, C. 2007. Community perspectives of wind energy in Australia: The application of a justice and
community fairness framework to increase social acceptance. Energy Policy, 35: 2727–2736.
Haack, R.A. 2001. Intercepted Scolytidae (Coleoptera) at U.S. ports of entry: 1985-2000. Integrated Pest
Management Reviews, 6: 253–282.
Haack, R.A. 2006. Exotic bark and wood-boring Coleoptera in the United States: recent establishments
and interceptions. Canadian Journal of Forest Research, 36: 269–288.
Haack, R. & Brockerhoff, E.G. 2011. ISPM No. 15 and the incidence of wood pests: recent findings, policy
changes, and current knowledge gaps. Conference paper, International Research Group on Wood
Protection, IRG 42. Stockholm, Sweden. Available at
https://www.researchgate.net/publication/265876080_
ISPM_No_15_and_the_incidence_of_wood_pests_recent_findings_policy_changes_and_current_knowl
edge_gaps (last accessed: 12 June 2017).
Haack, R.A., Britton, K.O., Brockerhoff, E.G., Cavey, J.F., Garrett, L.J., Kimberley, M., Lowenstein, F.,
Nuding, A., Olsen, L.J., Turner, J. & Vasilaky, K.N. 2014. Effectiveness of the international phytosanitary
standard ISPM no. 15 on reducing wood borer infestation rates in wood packaging material entering the
United States. PLoS ONE, 9(5): e96611.
Hailu, M. E. 2016. The impact of ISPM 15 on trade performance: (The case of: Botswana, Cameroon,
Ethiopia, Kenya and Mozambique). The Hague, International Institute of Social Studies (Research paper).
Hammond, D. 2014. Heat treatment for insect control: developments and applications. Elsevier.
Harrison, A. & Hanson, G. 1999. Who gains from trade reform? Some remaining puzzles. Journal of
development Economics, 59(1): 125–154.
Harrington, W. & Morgenstern, R. 2007. Economic incentives versus command and control: What's the
best approach for solving environmental problems? in: G.R. Visgilio & D.M. Whitelaw, eds. pp. 233-240.
Acid in the Environment. Berlin, Springer.
Hassler, C.C., Grushecky, S., Slahor, J.J. & Turk, P. 2010. An assessment of the impacts of a domestic
phytosanitary treatment regulation for wood packaging material manufacturers. Forest Products
Journal, 60(4): 309.
212
Henin, J., Charron, S., Luypaert, P.J., Jourez, B. & Hebert, J. 2008. Strategy to control the effectiveness of
microwave treatment of wood in the framework of the implementation of ISPM 15. Forest Products
Journal, 58(12): 75.
Henson, S., Brouder, A. & Mitullah, W. 2000. Food safety requirements and food exports from
developing countries: The case of fish exports from Kenya to the European Union. American Journal of
Agricultural Economics, 82(5): 1159–1169.
Herath A. 2001. Cost of compliance of sanitary and phytosanitary requirements in beverages and spices
in Sri Lanka. Economics Research Unit, Department of Export Agriculture, Colombo, Sri Lanka.
Hoover, K., Uzunovic, A., Gething, B., Dale, A., Leung, K., Ostiguy, N. & Janowiak, J.J. 2010. Lethal
temperature for pinewood nematode, Bursaphelenchus xylophilus, in infested wood using microwave
energy. Journal of Nematology, 42: 101–110.
Kairo, M.T.K., Pollard, G.V., Peterkin, D.D. & Lopez, V.F. 2000. Biological control of the hibiscus
mealybug, Maconellicoccus hirsutus Green (Hemiptera: Pseudococcidae) in the Caribbean. Integrated
Pest Management Reviews, 5(4): 241–254.
Kettunen, M., Genovesi, P., Gollasch, S., Pagad, S., Starfinger, U., ten Brink, P. & Shine, C. 2009. Technical
support to EU strategy on invasive alien species (IAS) - Assessment of the impacts of IAS in Europe and
the EU (Final draft report for the European Commission). Institute for European Environmental Policy
(IEEP), Brussels, Belgium. 44 pp plus annexes.
Klapwijk, M.J., Hopkins, A.J.; Eriksson, L.; Pettersson, M.; Schroeder, M.; Lindelöw, Å.; Rönnberg, J.;
Keskitalo, C.H. & Kenis, M. 2016. Reducing the risk of invasive forest pests and pathogens: combining
legislation, targeted, management and public awareness. Ambio, 45(2): 223–234.
Krcmar-Nozic, E., Wilson, W.R. & Arthur, L. 2000. The potential impacts of exotic forest pests in North
America: a synthesis of research. Information Report BC-X-387. Natural Resources Canada, Canadian
Forest Service, Pacific Forestry Centre, Victoria, BC.
Leung, B., Roura- Pascual, N., Bacher, S., Heikkilä, J., Brotons, L., Burgman, M.A., Dehnen-Schmutz, K.,
Essl, F., Hulme, P.E., Richardson, D.M., Sol, D. & Vilà, M. 2012. TEASIng apart alien species risk
assessments: a framework for best practices. Ecology Letters, 15(12): 1475–1493.
Lohmann, J. 2013. Do language barriers affect trade? Economics Letters, 110: 159–162.
Milner, C., Morrissey, O. & Rudaheranwa, N. 2000. Policy and non-policy barriers to trade and implicit
taxation of exports in Uganda. Journal of Development Studies, 37(2): 67–90.
Mumford, J.D. 2002. Economic issues related to quarantine in international trade. European Review of
Agricultural Economics, 29(3): 329–348.
Niemelä, P. & Mattson, W.J. 1996. Invasion of North American forests by European phytophagous
insects: legacy of the European crucible? BioScience, 46: 741–753.
Pehrsson, A. 2009. Barriers to entry and market strategy: a literature review and a proposed model.
European Business Review, 21: 64–77.
213
Pimentel, D., McNair, S., Janecka, J., Wightman, J., Simmonds, C., O'Connell, C., Wong, E., Russel, L.,
Zern, J., Aquino, T. & Tsomondo, T. 2001. Economic and environmental threats of alien plant, animal,
and microbe invasions. Agriculture, Ecosystems and Environment, 84: 1–20.
Pimentel, D. Zuniga, R. & Morrison, D. 2005. Update on the environmental and economic costs,
associated with alien-invasive species in the United States. Ecological Economics, 52(3): 273–288.
Pirard, R. 2012. Market-based instruments for biodiversity and ecosystem services: A lexicon.
Environmental Science and Policy, 19–20: 59–69.
Oosterhuis, F., Papyrakis, E. & Boteler, B. 2014. Economic instruments and marine litter control. Ocean
and Coastal Management, 102: 47–54.
Santini, A,. Ghelardini, L., Pace, C.D., Desprez-Loustau, M.L., Capretti, P., Chandelier, A.,Cech, T., Chira,
D., Diamandis, S., Gaitniekis, T., Hantula, J., Holdenrieder, O., Jankowsky, L., Jung, T., Jurc, D., Kirisits, T.,
Kunca, A., Lygis, V., Malecka, M., Marcais, B., Schmitz, S., Schumacher, J., Solheim, H., Solla, A., Szabò, I.,
Tsopelas, P, Vannini, A., Vettraino, A.M., Webber, J., Woodward, S. & Stenlid, J. 2013. Biogeographical
patterns and determinants of invasion by forest pathogens in Europe. New Phytologist, 197(1):238–250.
Shafaeddin, M. 2007. Who does bear the costs of compliance with sanitary and phytosanitary measures
in poor countries? MPRA Paper 6646, University Library of Munich, Germany. Available at
http://mpra.ub.unimuenchen.de/6646/MPRA (last accessed: 20 April 2017).
Skrzycki, C. 2004. USDA rule on pallets and pests leaves some fuming. Washington Post, 12 October
2004, at E01. Available at http://www.washingtonpost.com/wpdyn/articles/A25720-20040ct11.html
(last accessed: 19 April 2017).
Soliman, T., Mourits, M.C,M., Werf, W. van der, Hengeveld, G.M., Robinet, C. & Oude Lansink, A.G.J.M.
2012. Framework for Modelling Economic Impacts of Invasive Species, Applied to Pine Wood Nematode
in Europe. PLoS One, 7(9): e45505.
Soma, Y., Goto, M., Naito, H., Ogawa, N., Kawakami, F., Hirata, K., Komatsu, H. & Matsumoto, Y. 2003.
Effects of some fumigants on mortality of pine wood nematode, Bursaphelenchus xylophilus infecting
wooden packages. Mortality and fumigation standards for pine wood nematode by methyl bromide.
Research Bulletin of the Plant Protection Service Japan, 39: 7–14.
Strutt, A., Turner, J. A., Haack, R. A. & Olson, L. 2013. Evaluating the impacts of an international
phytosanitary standard for wood packaging material: Global and United States trade implications. Forest
policy and economics, 27:54–64.
Thornsbury, S., Roberts, D., Deremer, K. & Orden, D. 1997. A first step in understanding technical
barriers to agricultural trade. Conference paper, XIII International Conference of Agricultural
Economists, August 10–16, Sacramento, California.
UNCTAD (United Nations Conference on Trade and Development). 2010. Non-tariff measures: Evidence
from selected developing countries and future research agenda. (UNCTAD/DITC/TAB/2009/3), New York,
United States of America, and Geneva, Switzerland.
214
United States Department of Agriculture (USDA), Animal & Plant Health Inspection Service. Plant Health:
Pine Shoot Beetle, Background. Available at http://www.aphis.usda.gov/plant health/plantpest
info/psb/index.shtml (last accessed: 19 April 2017).
Wacziarg, R. & Welch, K.H. 2008. Trade liberalization and growth: New evidence. The World Bank
Economic Review, 22(2): 187–231.
Weijden, W.J. van der, Marcelis, R.A.L. & Reinhold, W. 2007. Invasions of vector-borne diseases driven
by transportation and climate change. In W. Takken, B.G.J. Knols, eds. Emerging pests and vector-borne
diseases in Europe. Wageningen Academic Publishers, Wageningen.
Williamson, M. 1997. Biological Invasions. Chapman and Hall, London, United Kingdom.
Windle, J. 1997. Remoteness and rural development: economic impacts of rural roads on upland farmers
in Sarawak, Malaysia. Asia Pacific Viewpoint, 38(1): 37–53.
Woodroffe, N. 2010. Analysis of ISPM 15 and its impact on the wood pallet industry. Drake Journal of
Agriculture Law, 15: 199.
WTO (World Trade Organization). 2015. World Trade Report 2015. Geneva, Switzerland.


