Embed Size (px)
Citation preview
Bryan JonesCUNY Institute for Demographic ResearchNational Center for Atmospheric Research
Projecting Future Exposure to Climate Related Hazards: Extreme
Heat
Outline
1) Project overview2) The North American Regional
Climate Change Assessment Program (NARCCAP)
3) Spatially explicit future population scenarios
4) Projecting and decomposing exposure to extreme heat
5) Conclusions and ongoing work
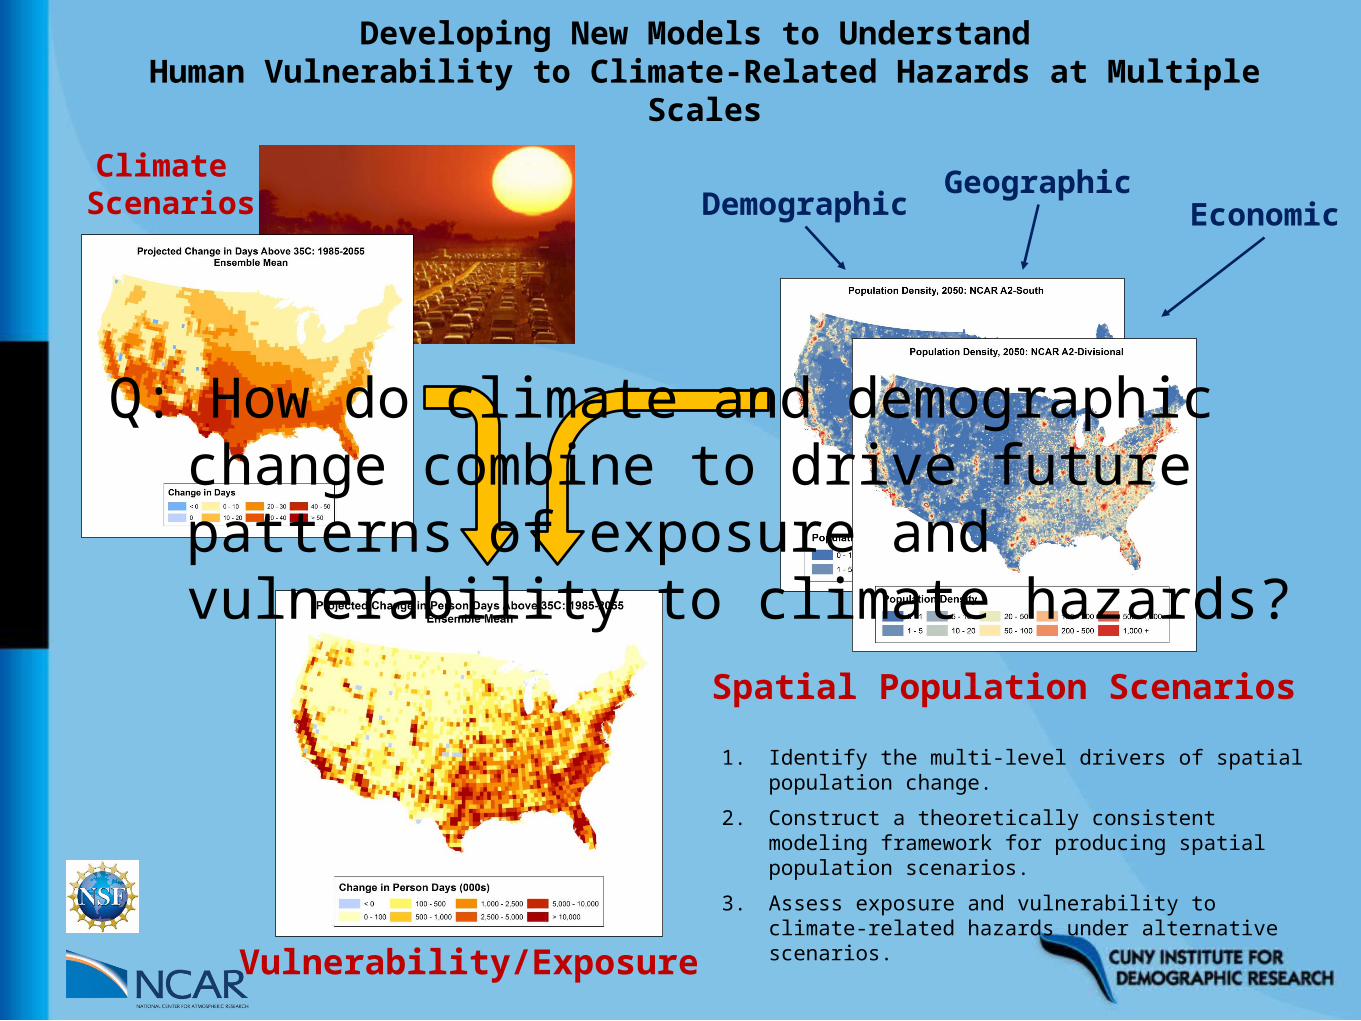
Developing New Models to Understand Human Vulnerability to Climate-Related Hazards at Multiple
ScalesClimate Scenarios
Spatial Population Scenarios
EconomicGeographicDemographic
Vulnerability/Exposure
1. Identify the multi-level drivers of spatial population change.
2. Construct a theoretically consistent modeling framework for producing spatial population scenarios.
3. Assess exposure and vulnerability to climate-related hazards under alternative scenarios.
Q: How do climate and demographic change combine to drive future patterns of exposure and vulnerability to climate hazards?
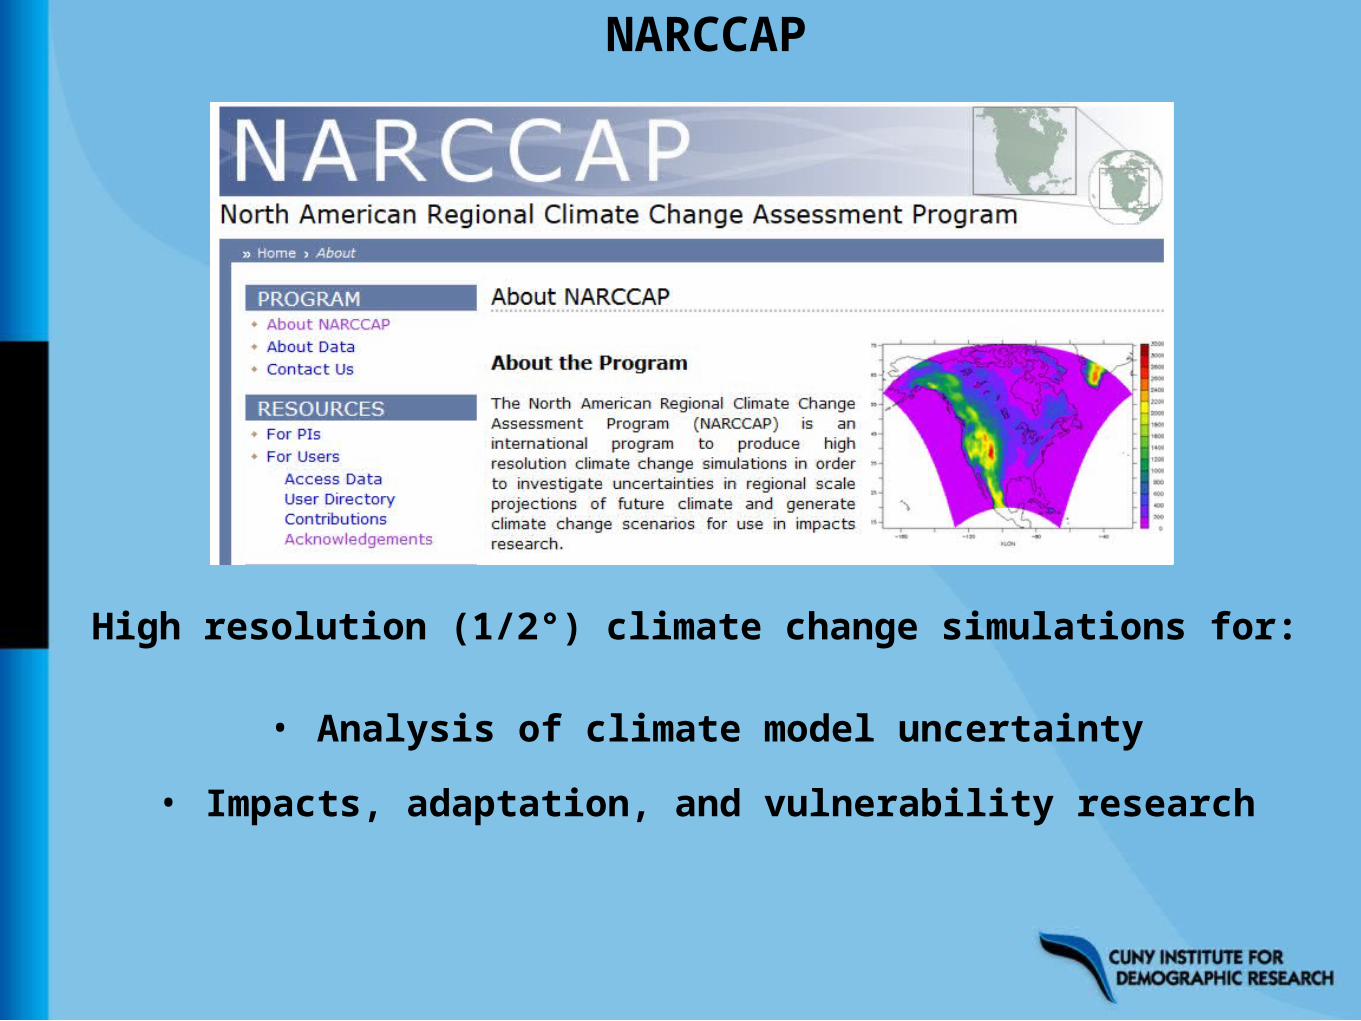
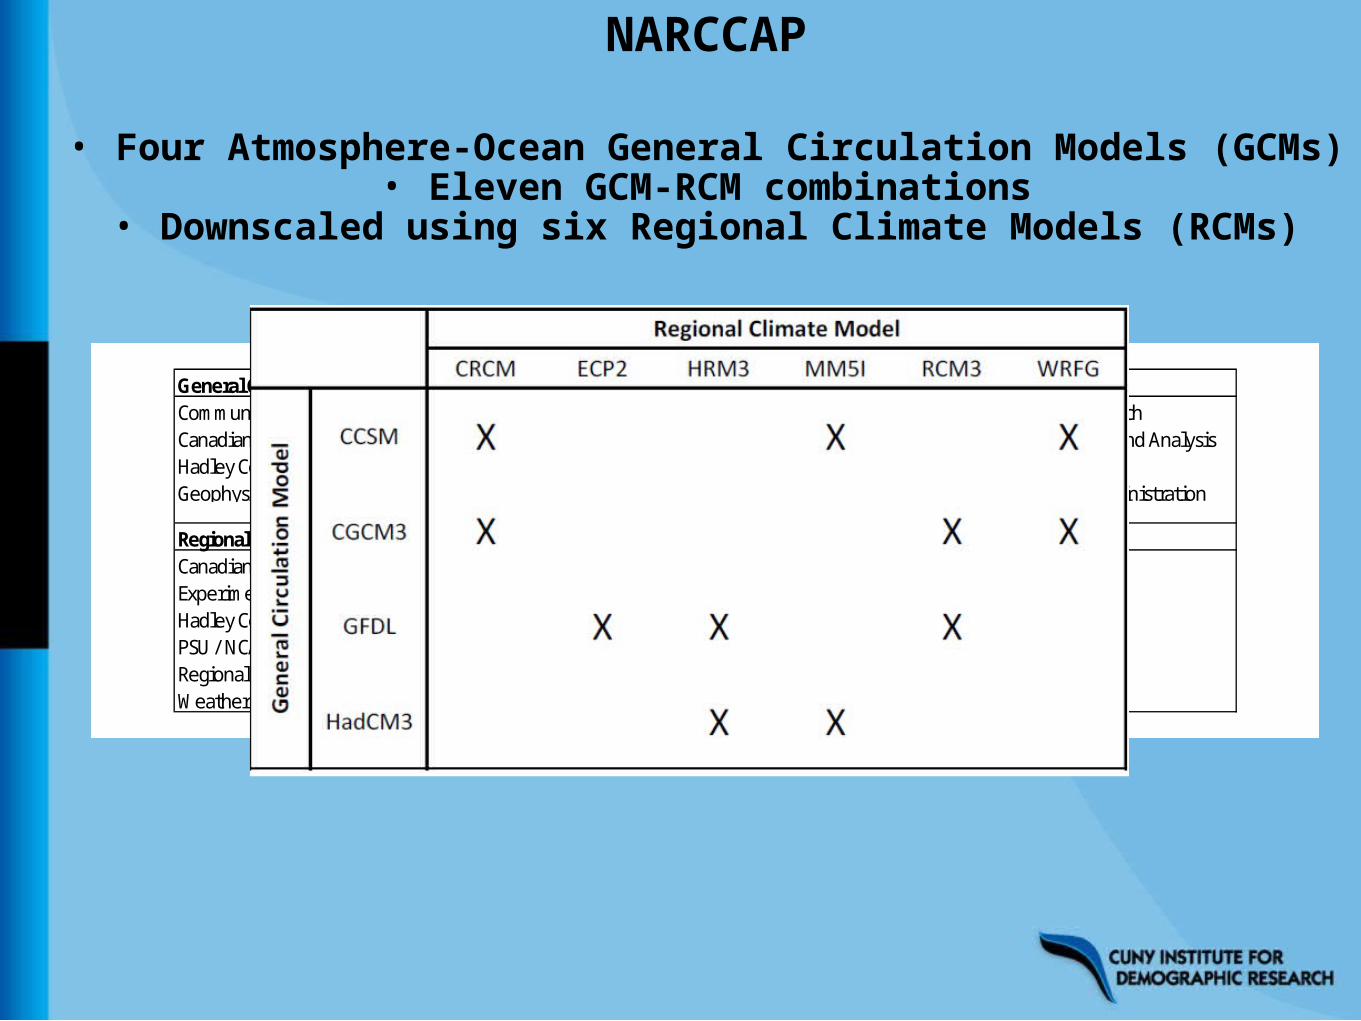
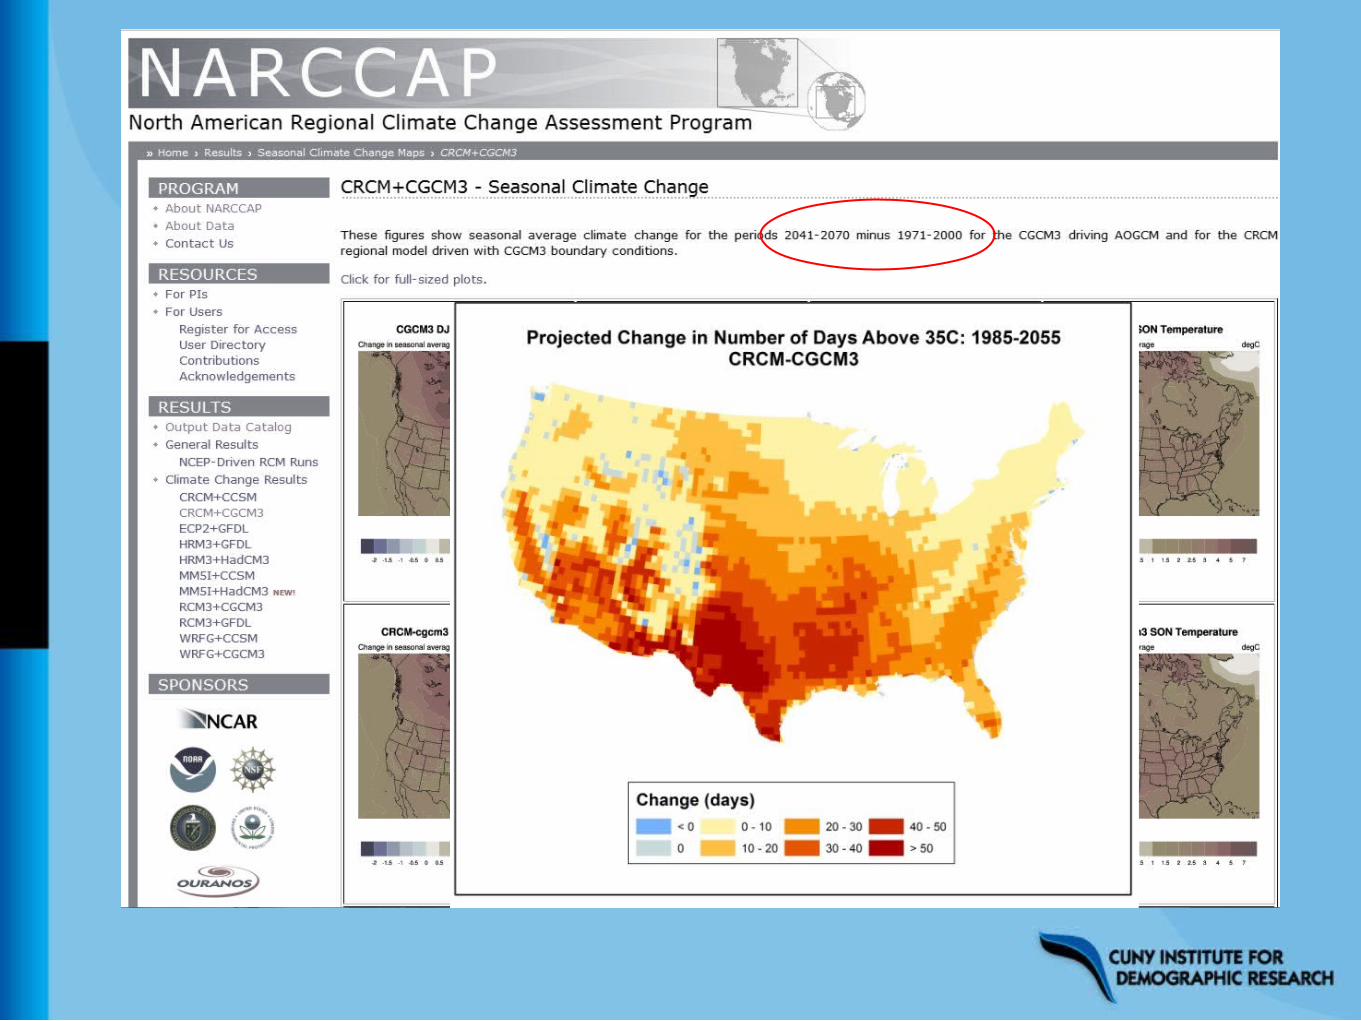
NARCCAP
High resolution (1/2°) climate change simulations for:
• Analysis of climate model uncertainty• Impacts, adaptation, and vulnerability research
NARCCAP
General Circulation M odel (GCM ) Acronym SponsorCom m unity Clim ate System M odel v3 [4] CCSM National Center for Atm ospheric ResearchCanadian Global Clim ate M odel v3 [5] CGCM 3 Canadian Center for Clim ate M odeling and AnalysisHadley Centre Clim ate M odel v3 [6] HadCM 3 Hadley CentreGeophysical Fluid Dynam ics Laboratory Global Clim ate M odel [7] GFDL National Oceanic and Atm ospheric Adm inistration
Regional Clim ate M odel (RCM ) Acronym M odeling GroupCanadian Regional Clim ate M odel CRCM OURANOS / UQAMExperim ental Clim ate Prediction Center Regional Spectral M odel ECP2 UC San Diego / ScrippsHadley Centre Regional M odel v3 HRM 3 Hadley CentrePSU / NCAR M esoscale M odel M M 5I Iowa State UniversityRegional Clim ate M odel v3 RCM 3 UC Santa CruzW eather Research and Forecasting M odel W RFG Pacific Northwest National Lab
• Four Atmosphere-Ocean General Circulation Models (GCMs)
• Downscaled using six Regional Climate Models (RCMs)• Eleven GCM-RCM combinations
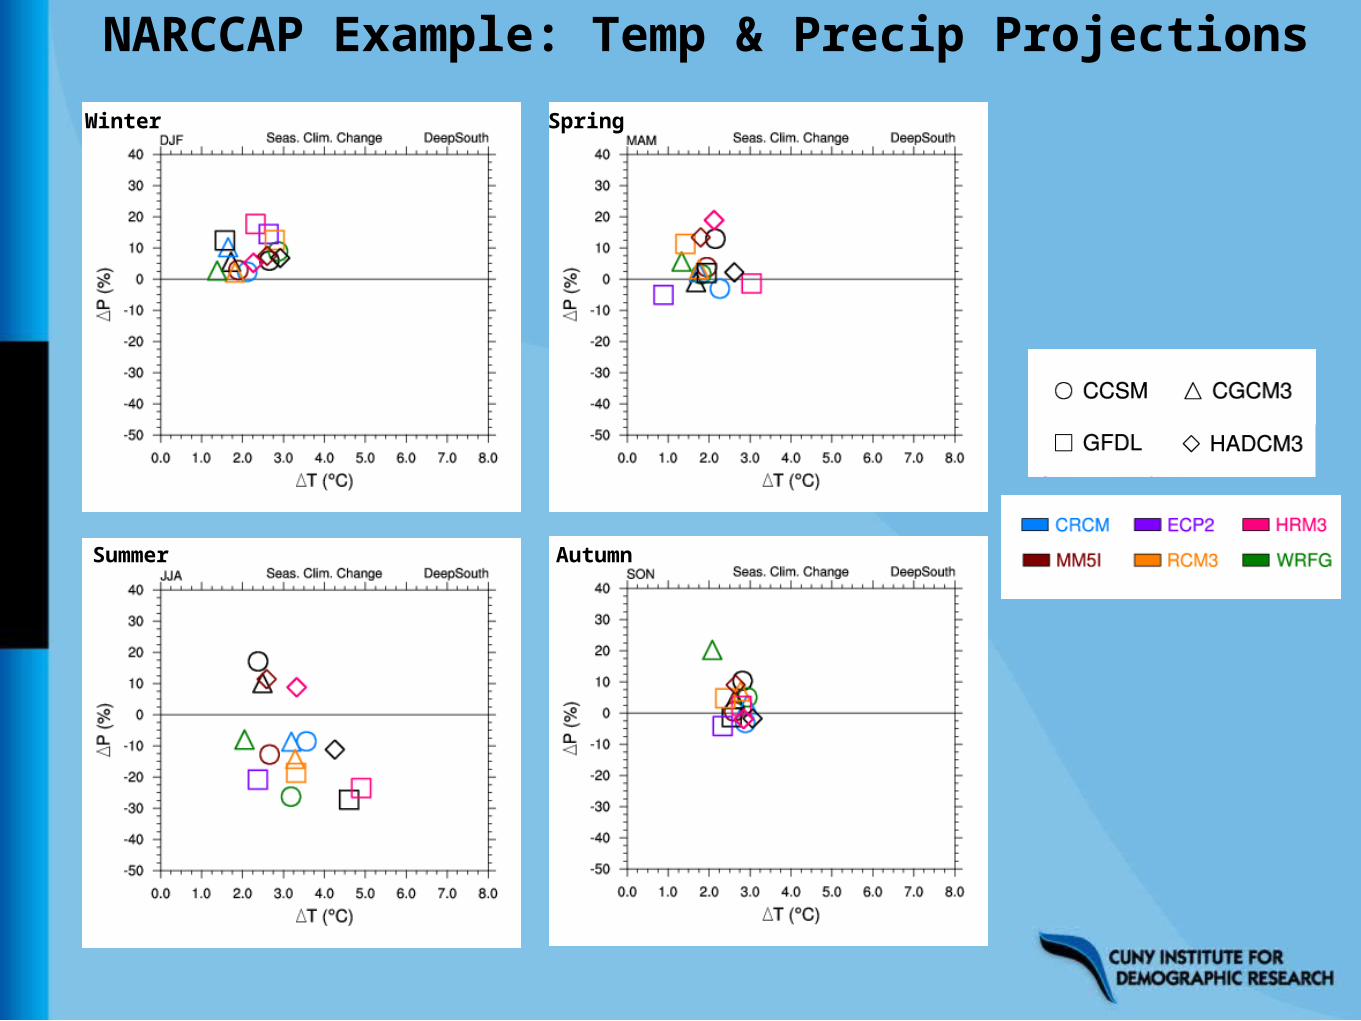
NARCCAP Example: Temp & Precip ProjectionsWinter Spring
Summer Autumn
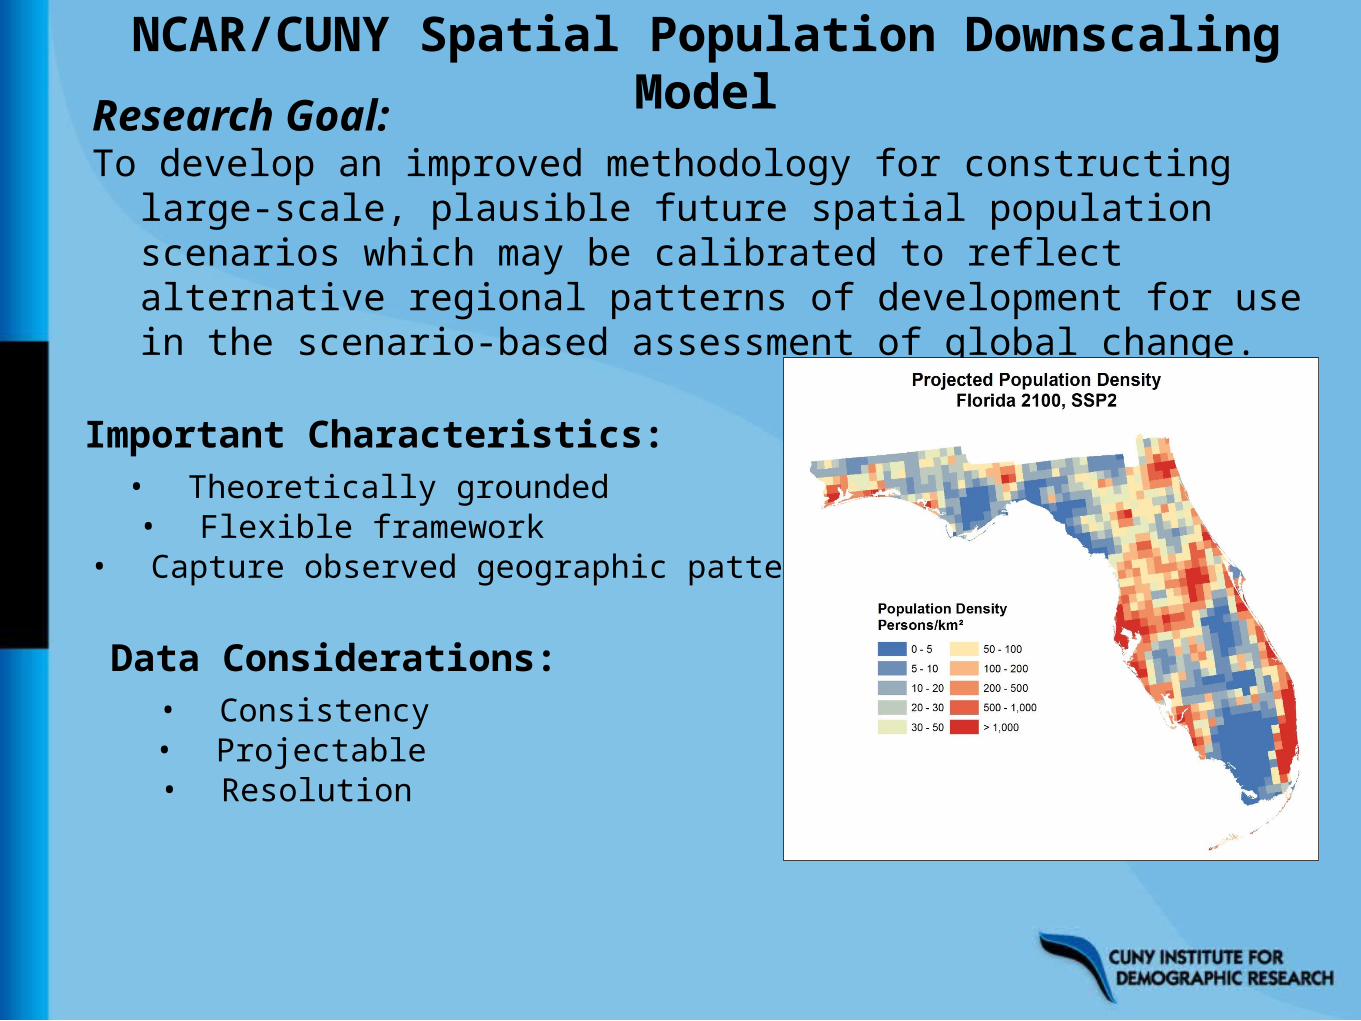
NCAR/CUNY Spatial Population Downscaling ModelResearch Goal:
To develop an improved methodology for constructing large-scale, plausible future spatial population scenarios which may be calibrated to reflect alternative regional patterns of development for use in the scenario-based assessment of global change.
Important Characteristics:
• Capture observed geographic patterns• Flexible framework• Theoretically grounded
Data Considerations:
• Resolution• Projectable• Consistency
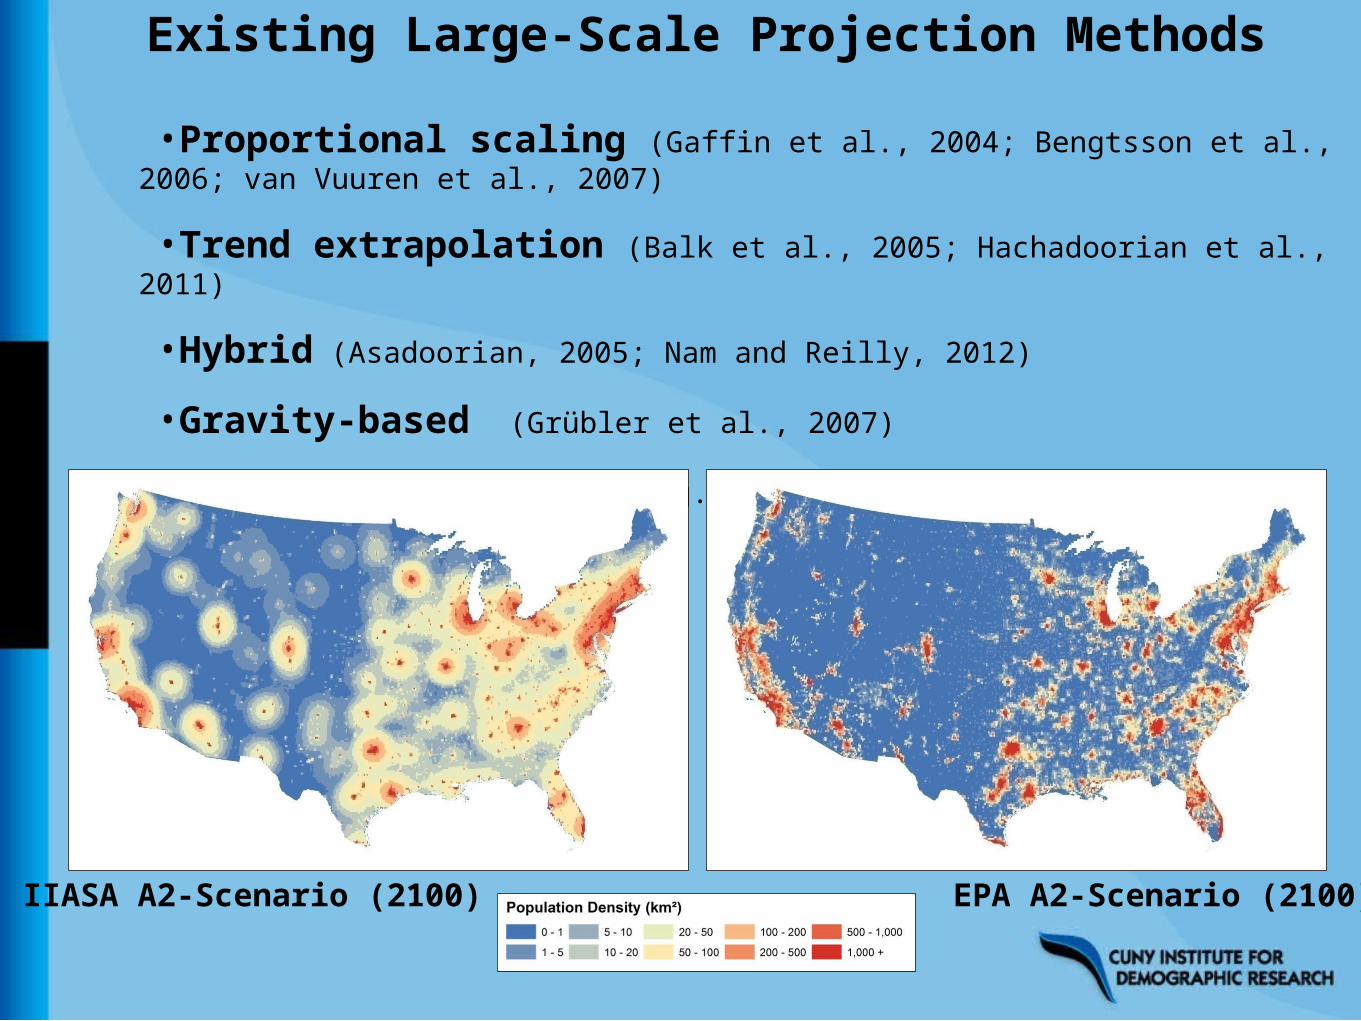
Existing Large-Scale Projection Methods
•Proportional scaling (Gaffin et al., 2004; Bengtsson et al., 2006; van Vuuren et al., 2007)
•Trend extrapolation (Balk et al., 2005; Hachadoorian et al., 2011)
•Hybrid (Asadoorian, 2005; Nam and Reilly, 2012)•Gravity-based (Grübler et al., 2007)•Smart Interpolation (e.g., EPA, 2010)
EPA A2-Scenario (2100)IIASA A2-Scenario (2100)
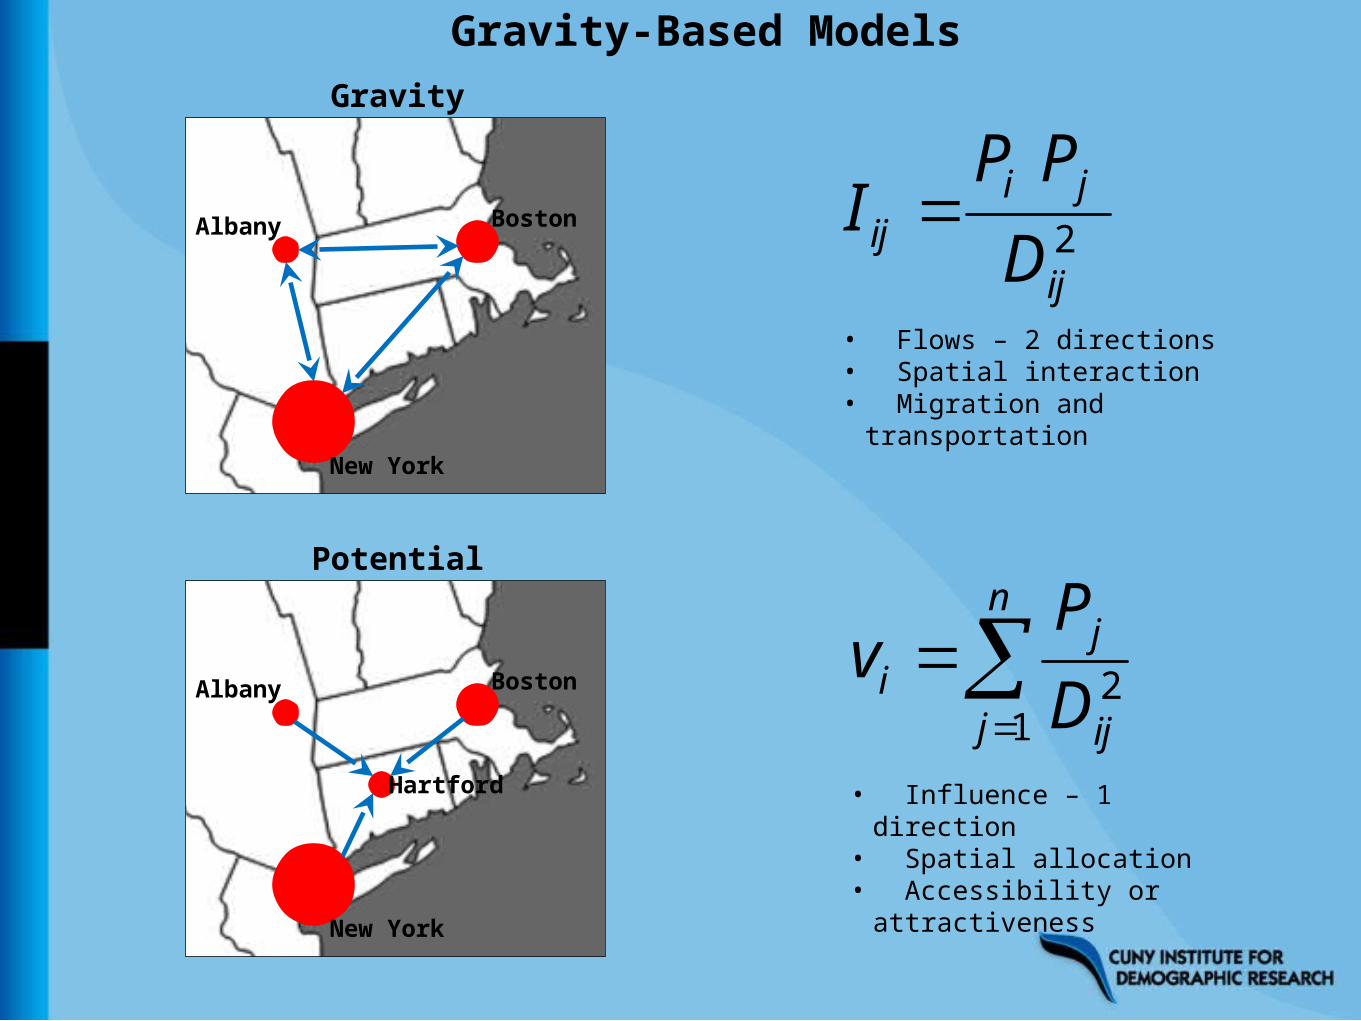
Gravity-Based Models
Boston
New York
Albany
Boston
New York
Albany
Hartford
• Flows – 2 directions• Spatial interaction• Migration and transportation
• Influence – 1 direction
• Spatial allocation• Accessibility or attractiveness
Gravity
Potential
2ij
jiij D
PPI
n
j ij
ji D
Pv1
2
•Population agglomeration is a proxy for the socio-economic characteristics of “attractive” places
•Spatial choice informed by accessibility
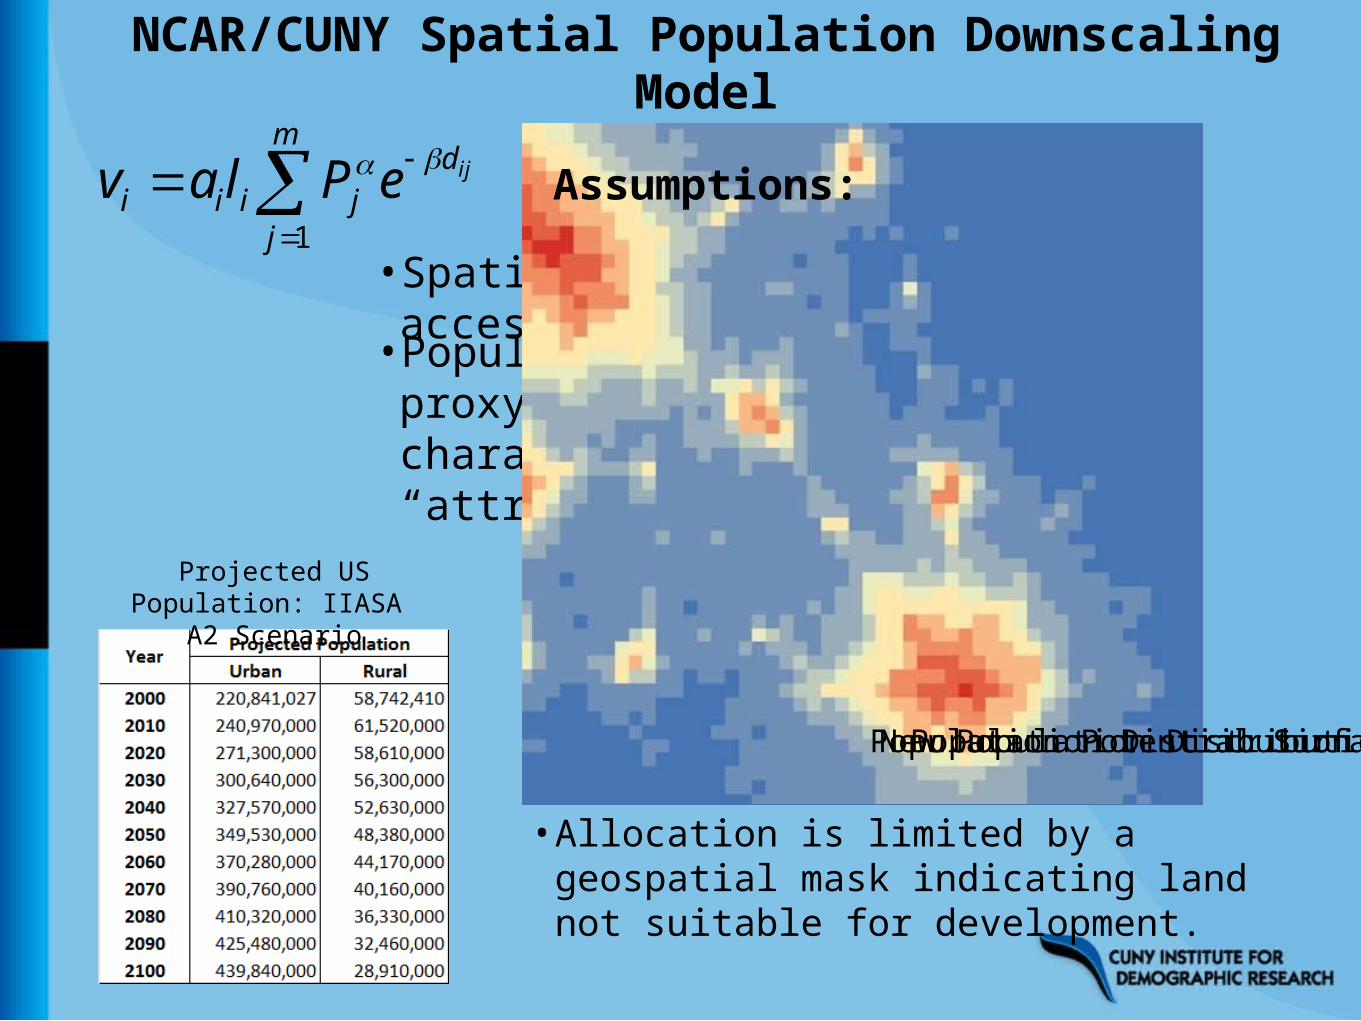
Projected US Population: IIASA
A2 Scenario
Assumptions:
Population Potential SurfaceNew Population DistributionPopulation Distribution
NCAR/CUNY Spatial Population Downscaling Model
•Allocation is limited by a geospatial mask indicating land not suitable for development.
m
j
djiii
ijePlav1
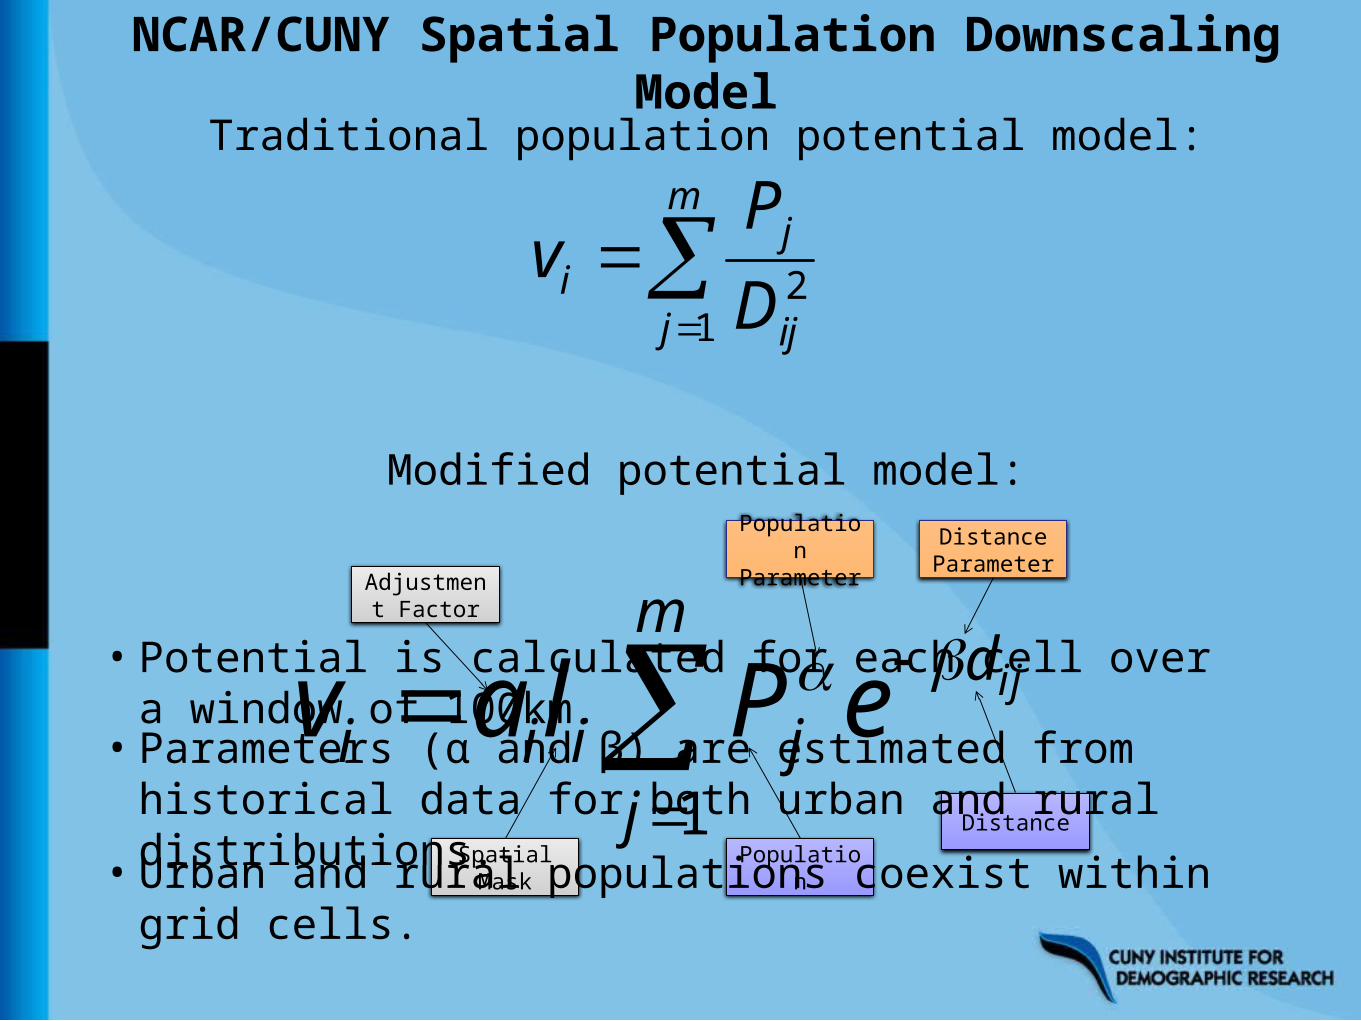
Traditional population potential model:
Modified potential model:
Spatial Mask
Adjustment Factor
Population
ParameterDistanceParameter
Population
Distance
• Urban and rural populations coexist within grid cells.
• Parameters (α and β) are estimated from historical data for both urban and rural distributions.
• Potential is calculated for each cell over a window of 100km.
NCAR/CUNY Spatial Population Downscaling Model
m
j ij
ji D
Pv1
2
m
j
djiii
ijePlav1
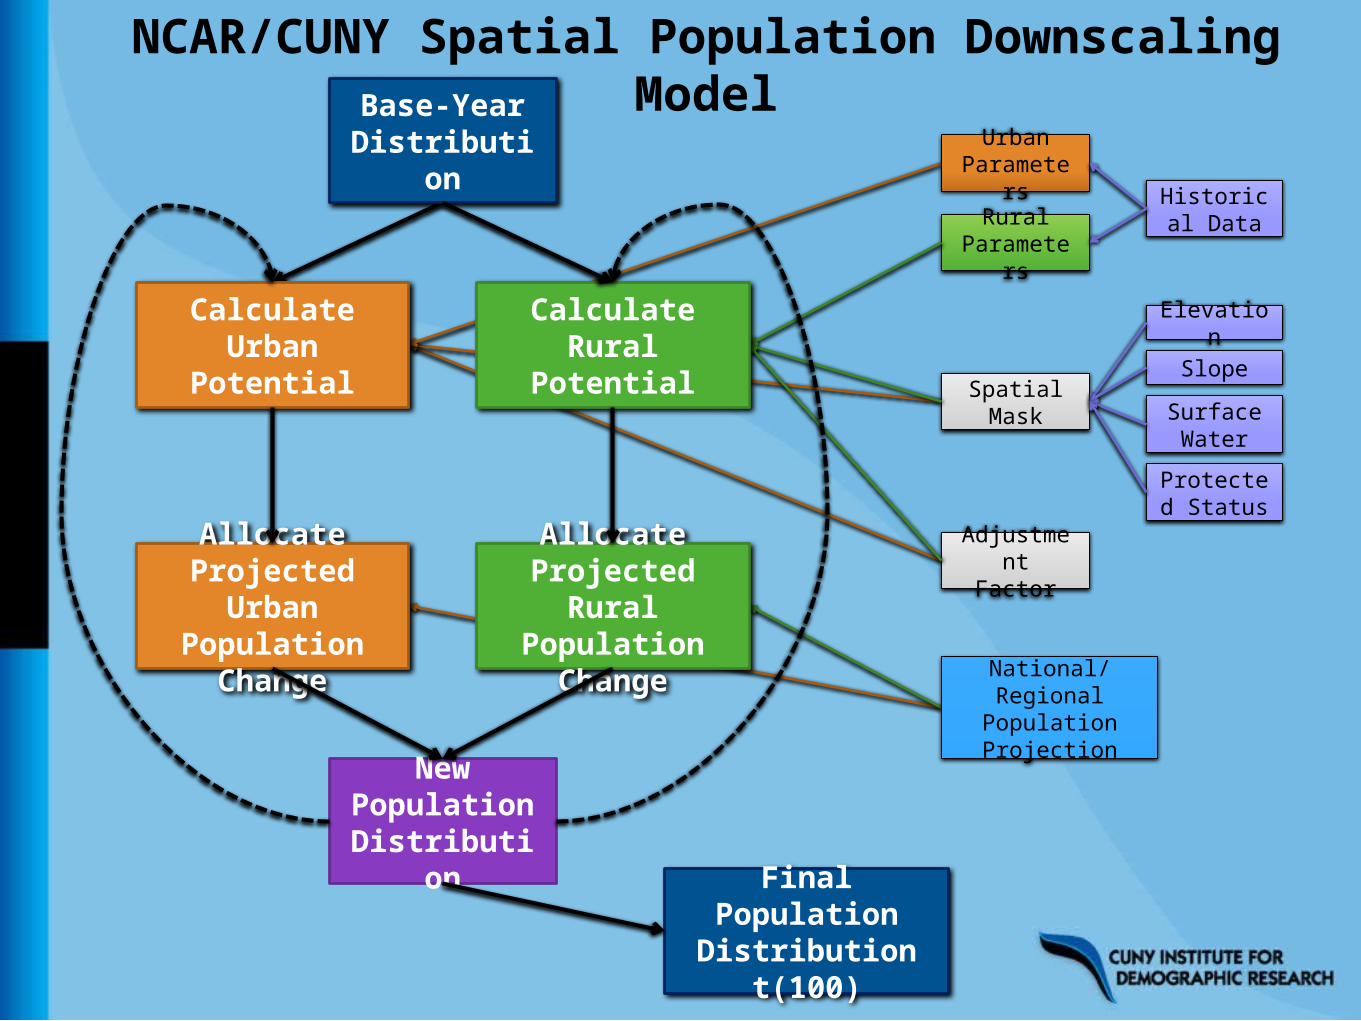
Base-Year Distributi
on
Calculate Urban
Potential
UrbanParamete
rs
Spatial Mask
Adjustment
Factor
Historical Data
Elevation
SlopeSurface Water
Protected Status
Allocate Projected
Rural Population
Change
Allocate Projected
Urban Population Change
New Population Distributi
on
RuralParamete
rsCalculate
Rural Potential
Final Population Distribution
t(100)
NCAR/CUNY Spatial Population Downscaling Model
National/Regional Population Projection
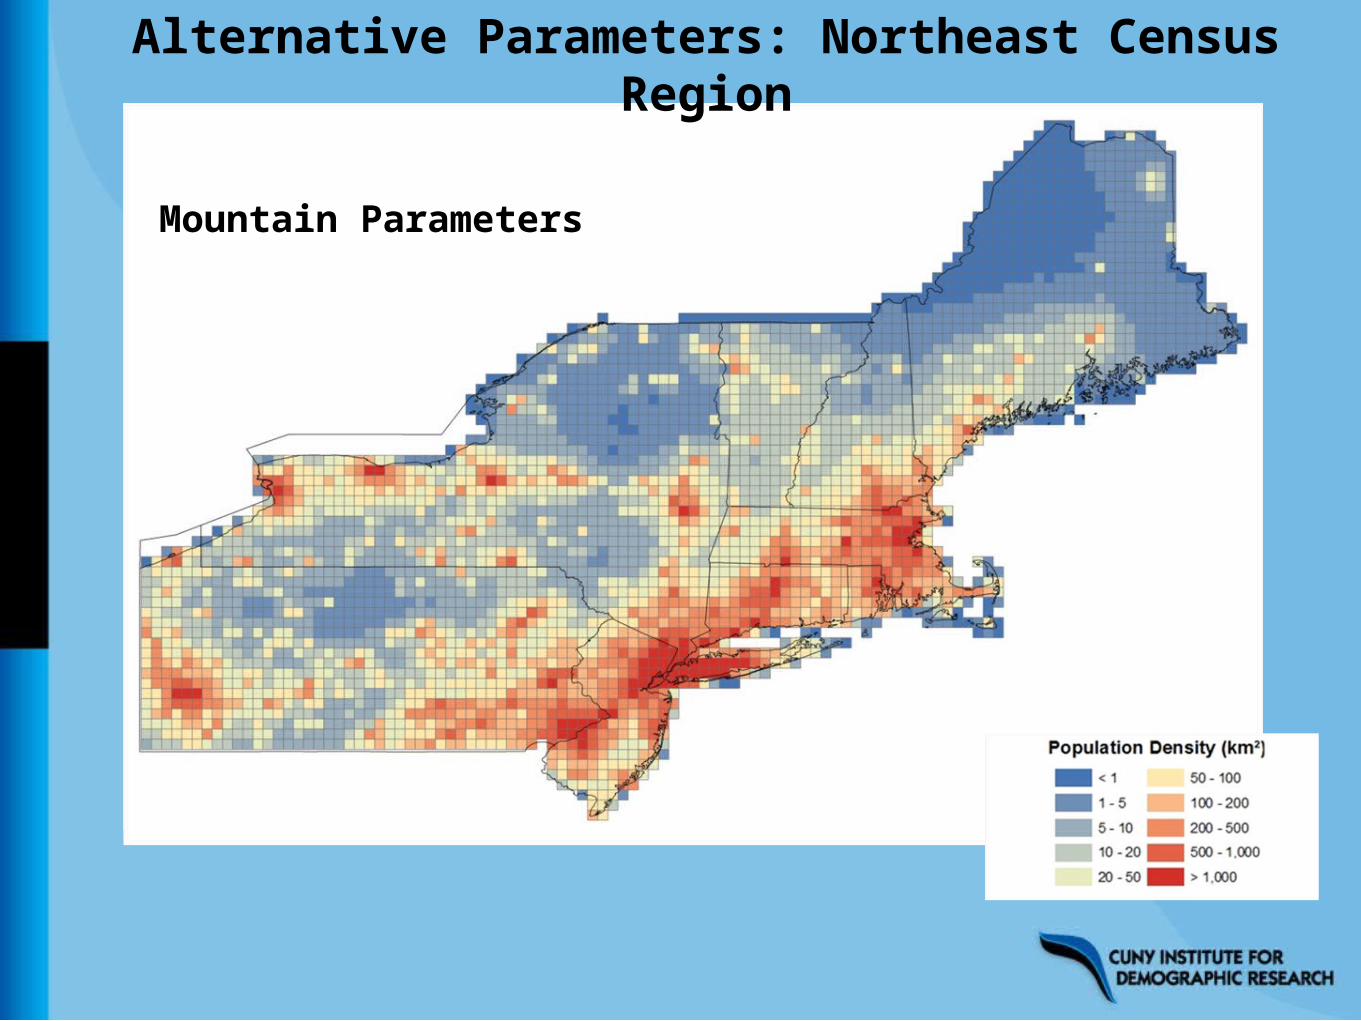
Northeast ParametersSouth ParametersMountain Parameters
Alternative Parameters: Northeast Census Region
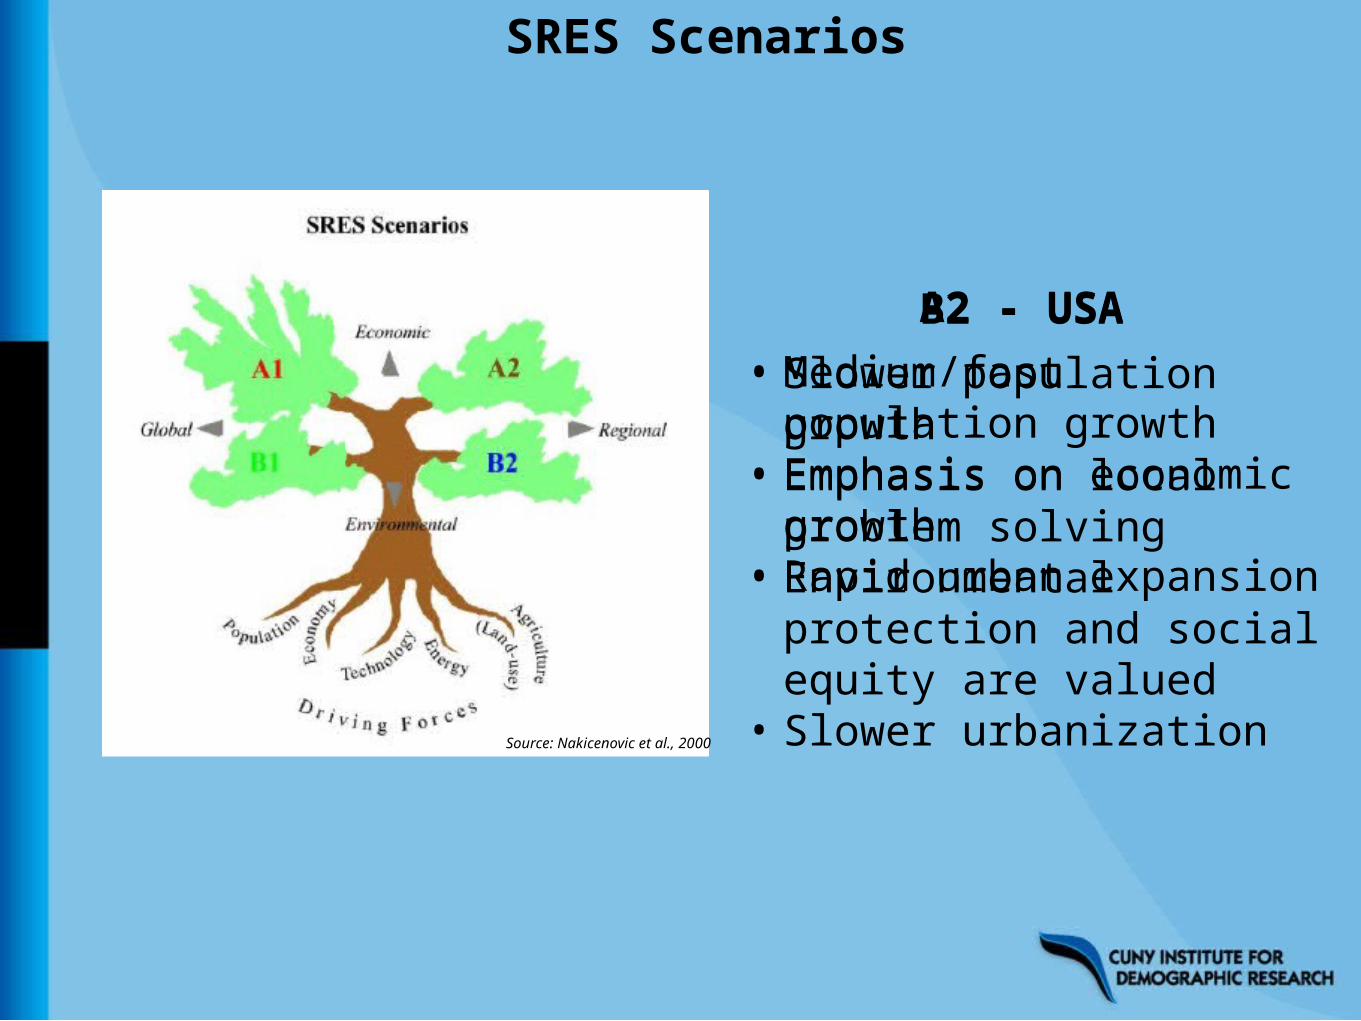
SRES Scenarios
A2 - USA• Medium/fast population growth
• Emphasis on economic growth
• Rapid urban expansion
B2 - USA• Slower population growth
• Emphasis on local problem solving
• Environmental protection and social equity are valued
• Slower urbanizationSource: Nakicenovic et al., 2000
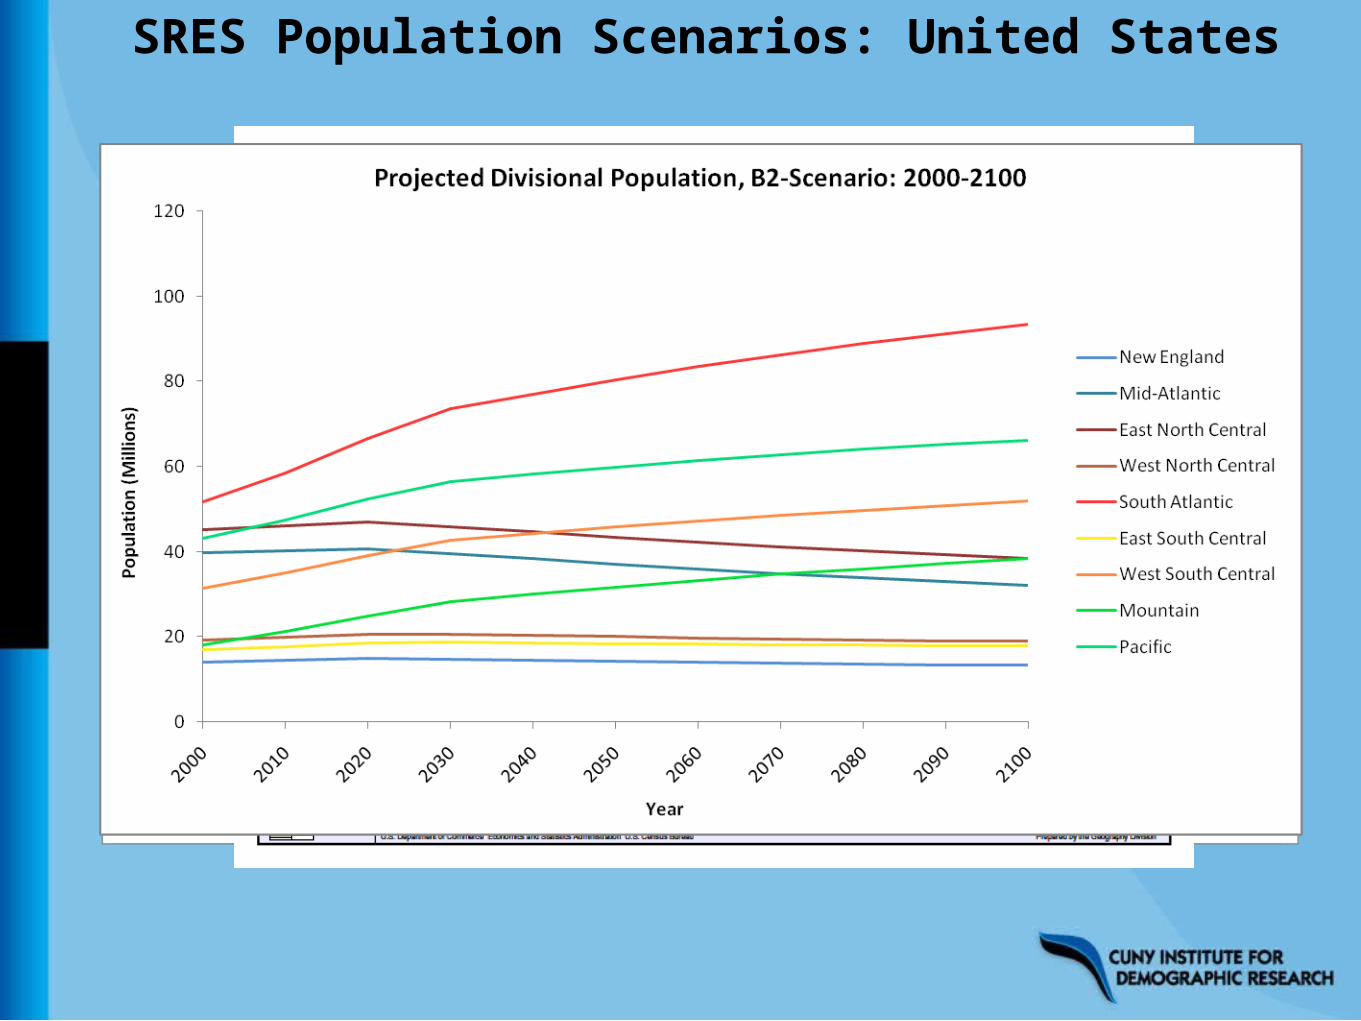
SRES Population Scenarios: United States
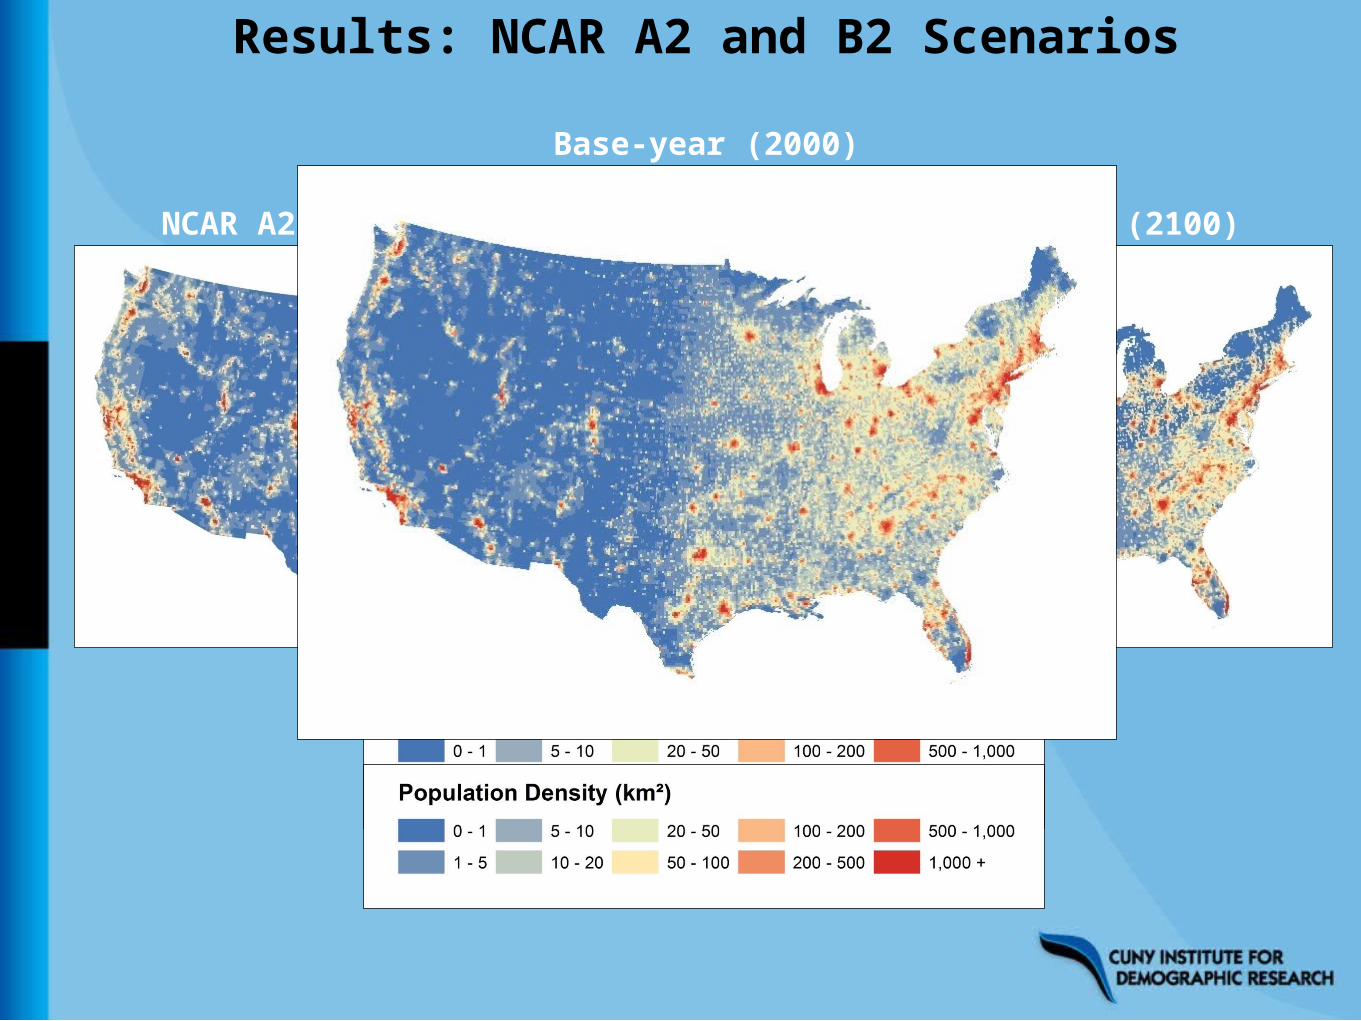
NCAR A2-Scenario (2100) NCAR B2-Scenario (2100)
Base-year (2000)
Results: NCAR A2 and B2 Scenarios
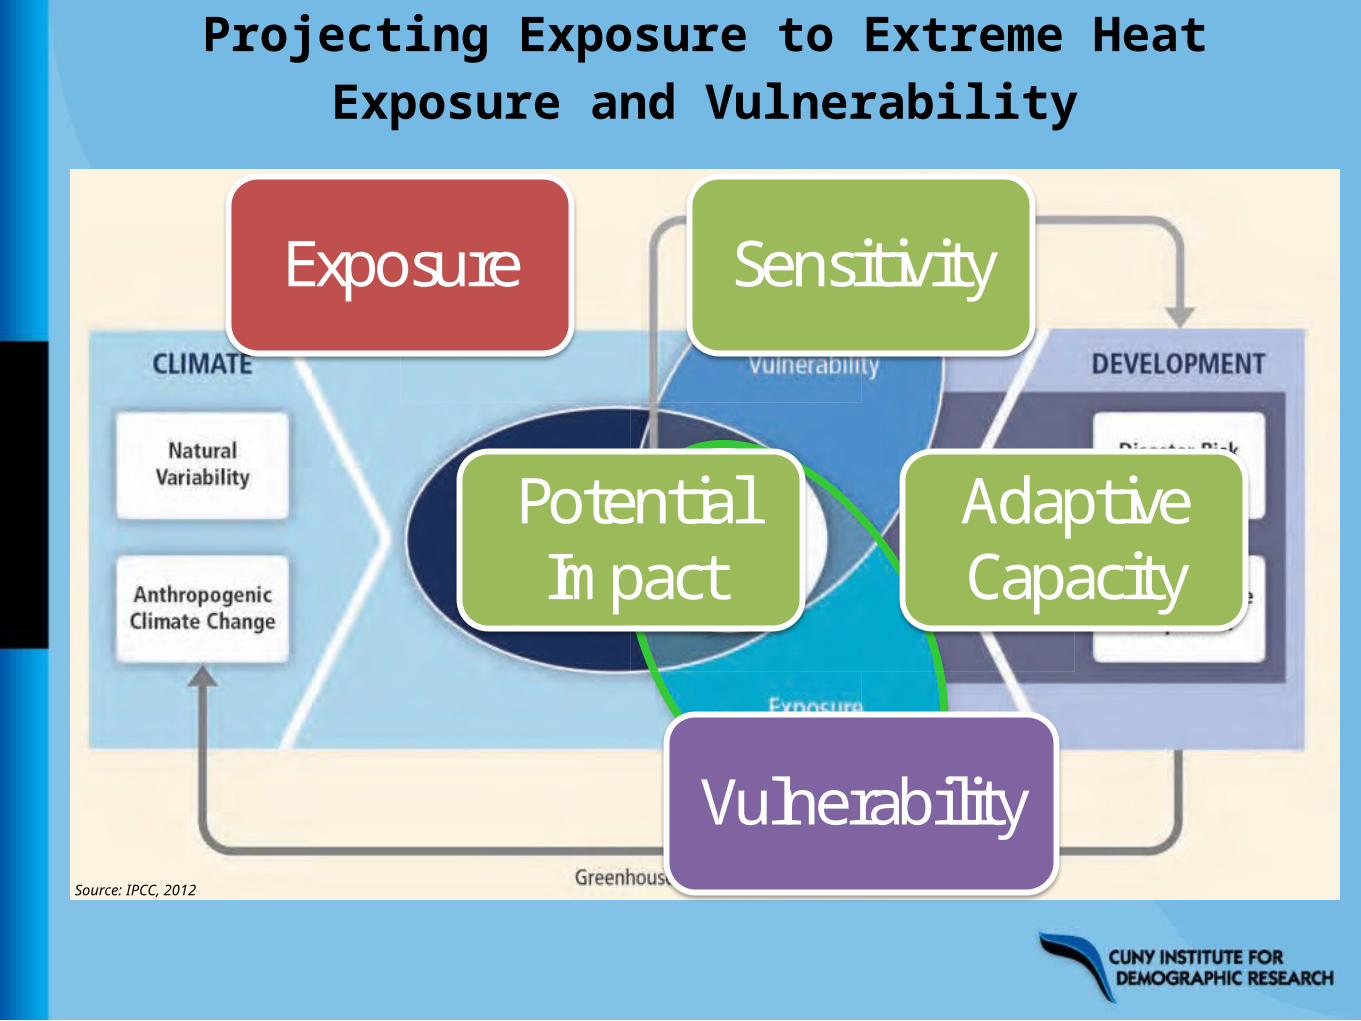
Source: IPCC, 2012
Exposure Sensitivity
Potential Im pact
Adaptive Capacity
Vulnerability
Projecting Exposure to Extreme HeatExposure and Vulnerability
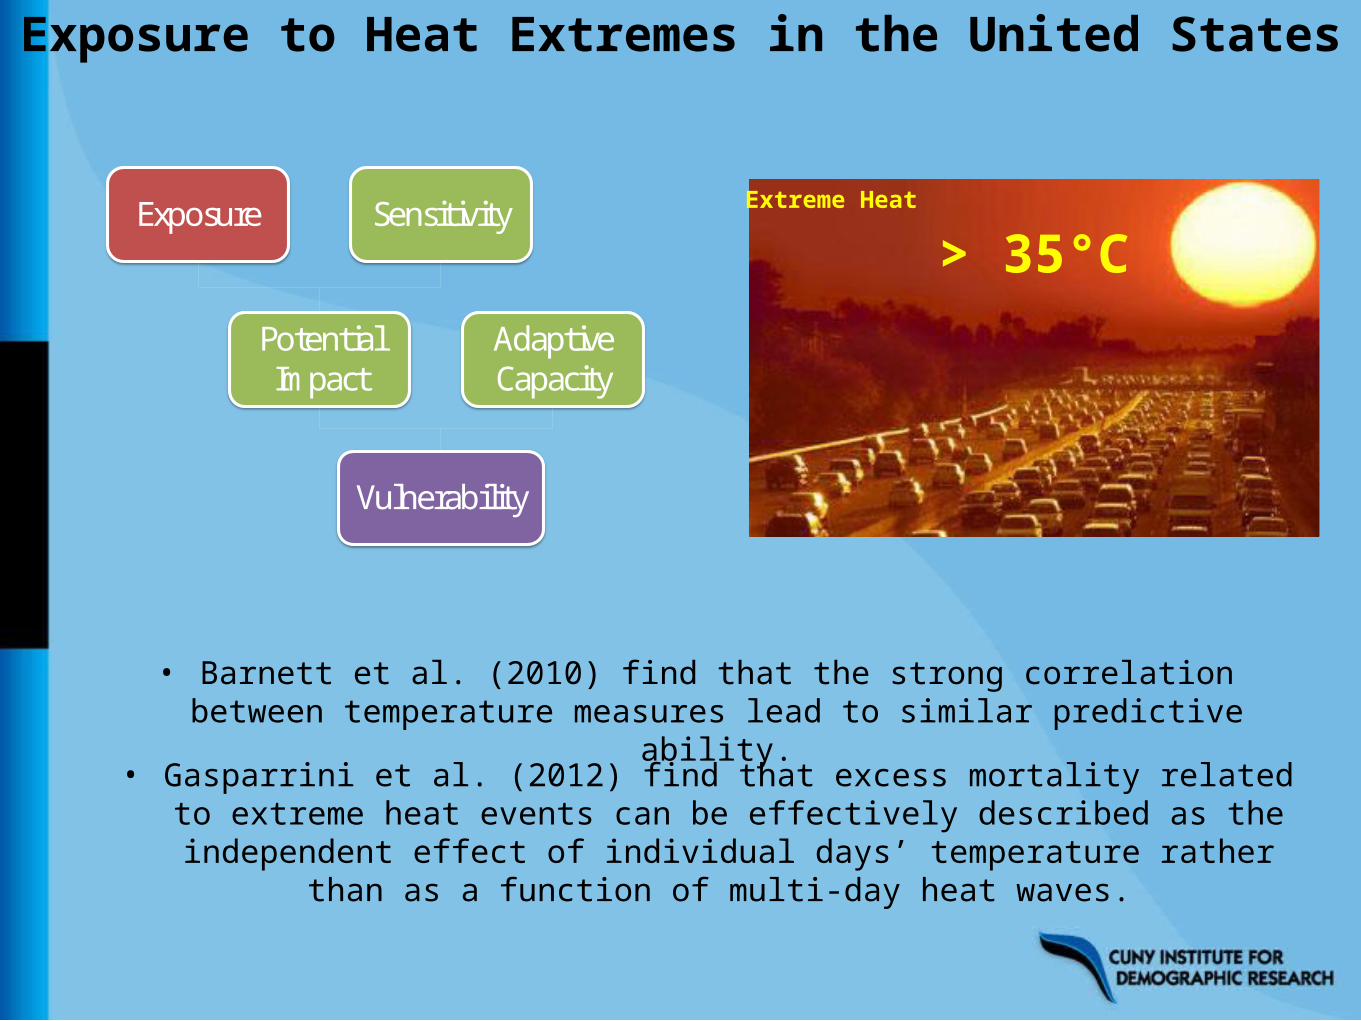
• Barnett et al. (2010) find that the strong correlation between temperature measures lead to similar predictive
ability.• Gasparrini et al. (2012) find that excess mortality related to extreme heat events can be effectively described as the independent effect of individual days’ temperature rather
than as a function of multi-day heat waves.
Extreme Heat
> 35°C
Exposure to Heat Extremes in the United States
Exposure Sensitivity
Potential Im pact
Adaptive Capacity
Vulnerability
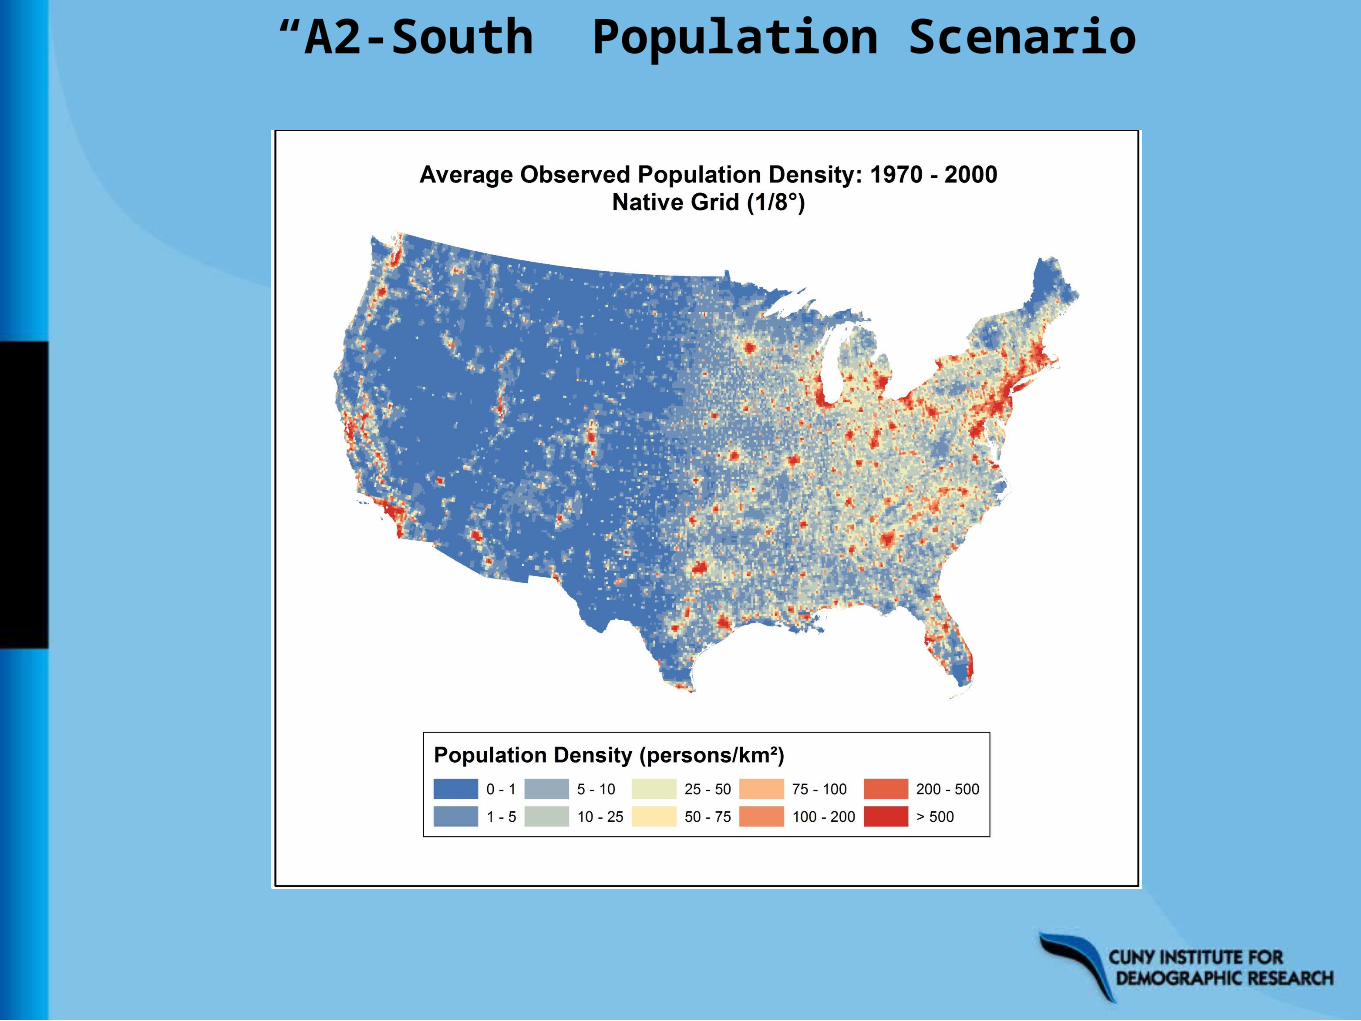
“A2-South” Population Scenario
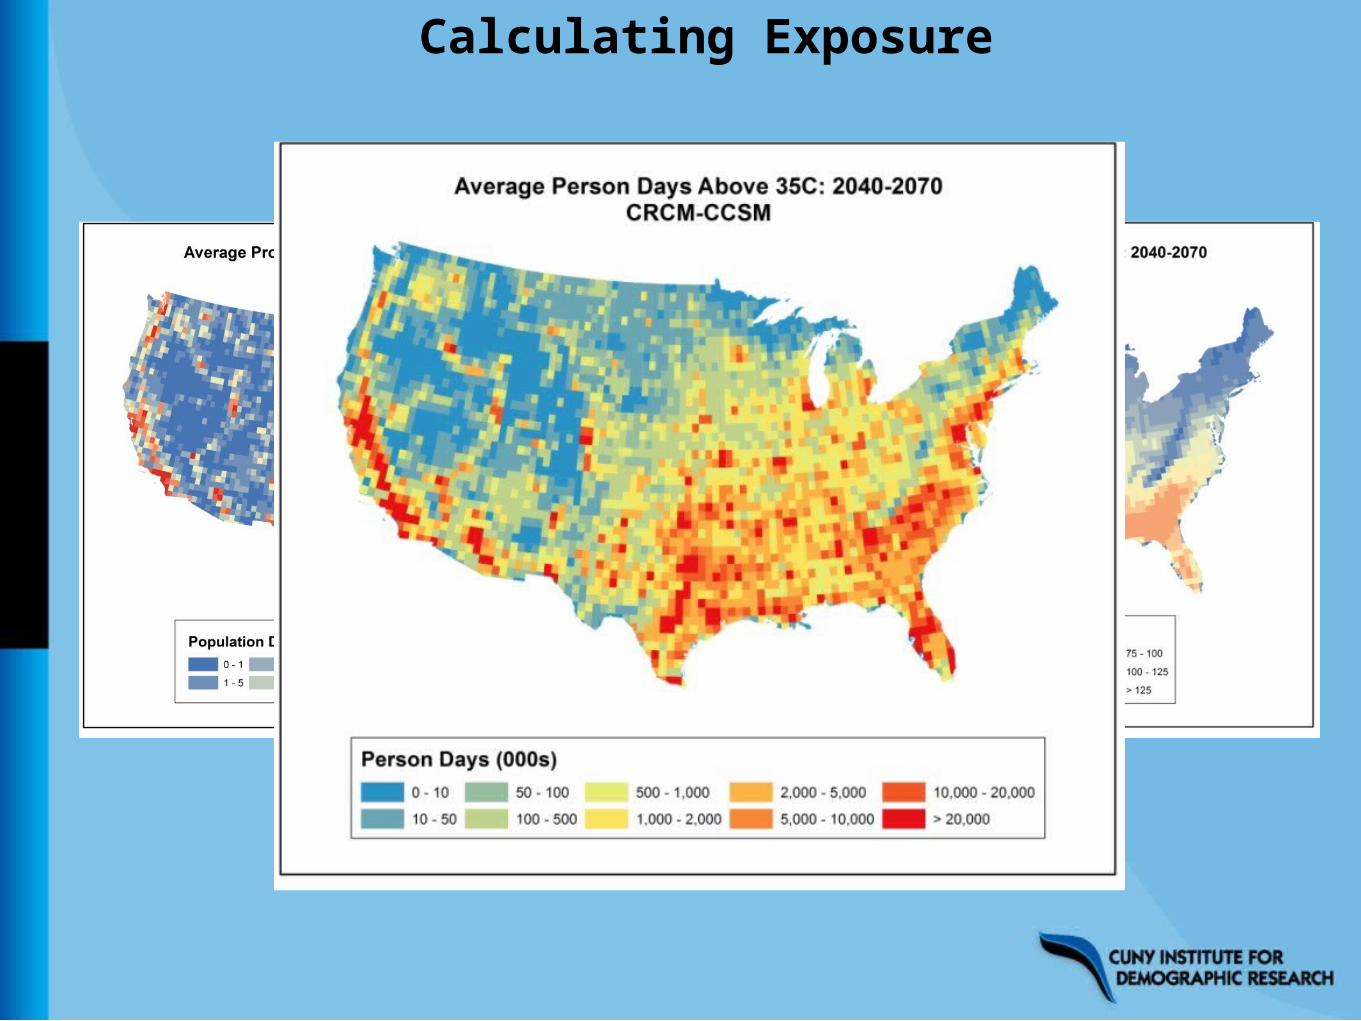
Calculating Exposure
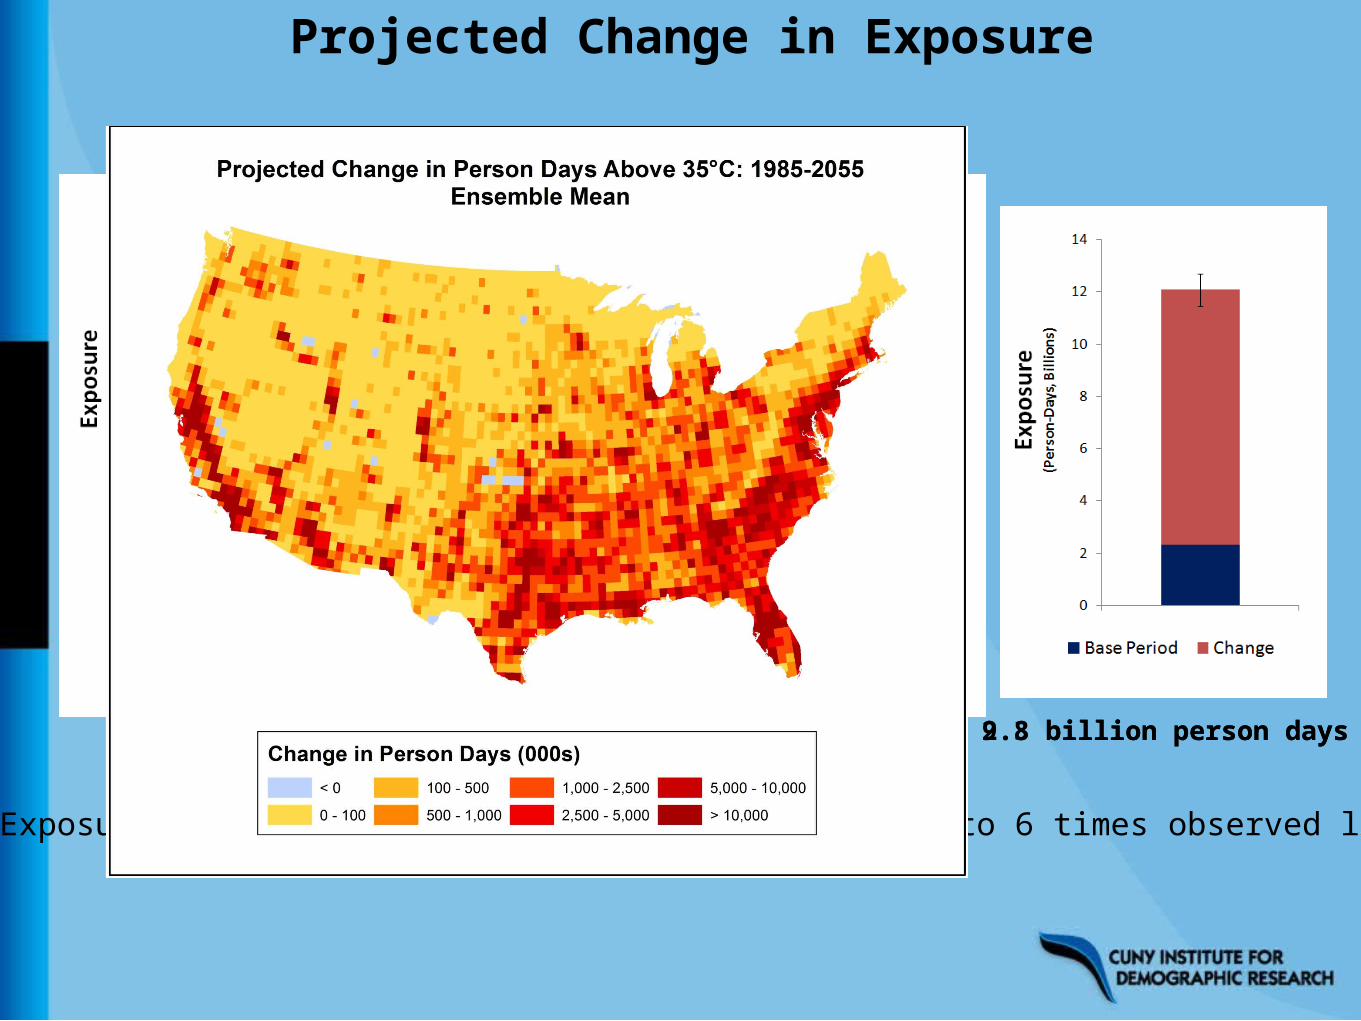
Projected Change in Exposure
2.3 billion person days
• Exposure is projected to increase anywhere from 4 to 6 times observed levels
9.8 billion person days
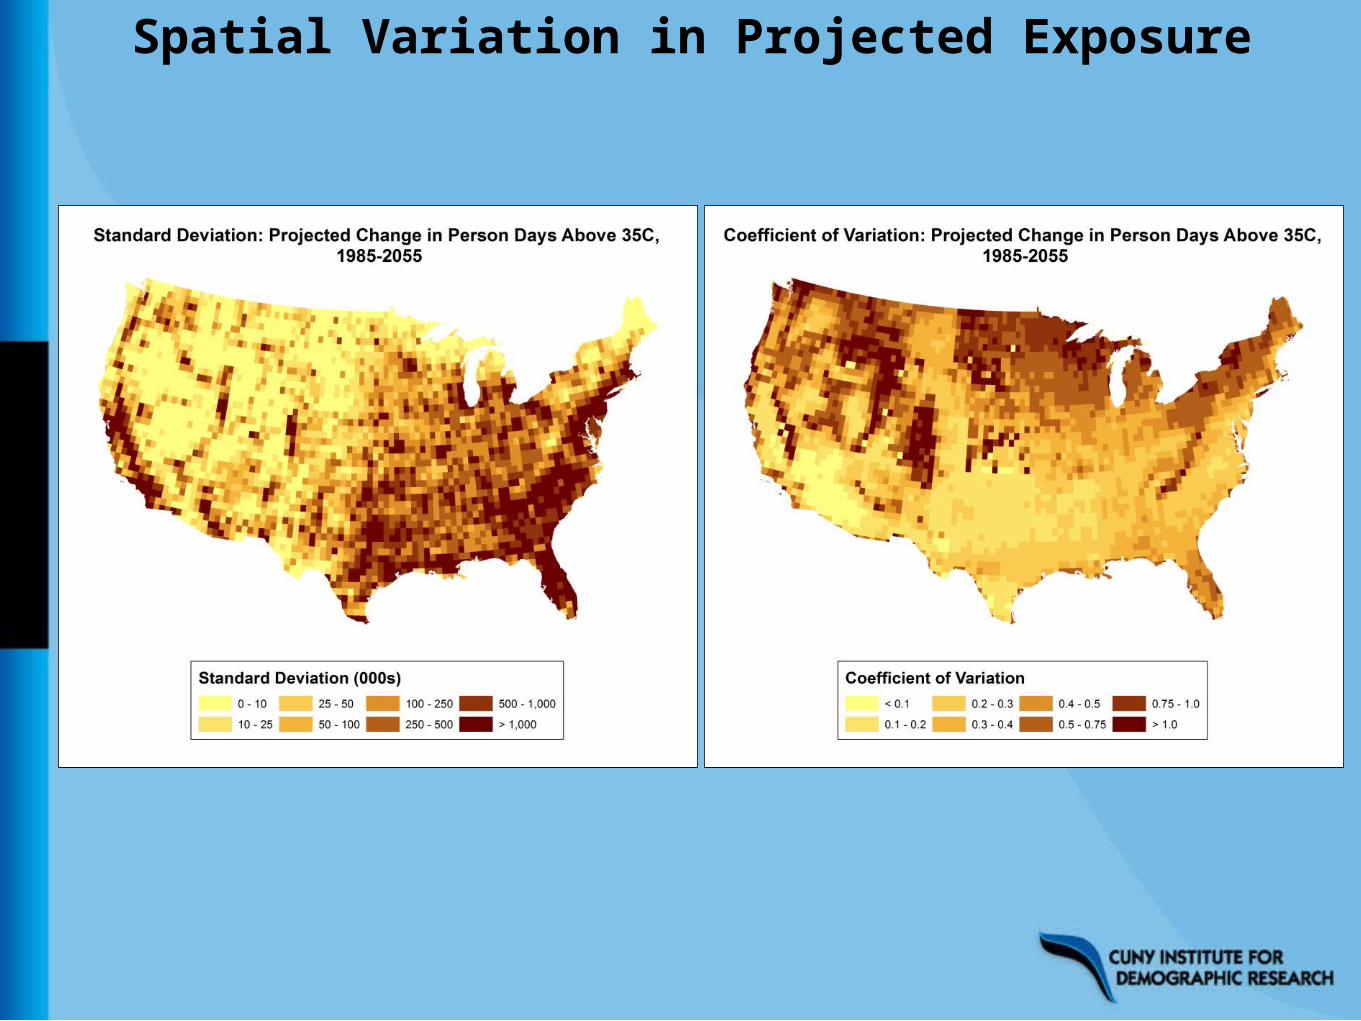
Spatial Variation in Projected Exposure
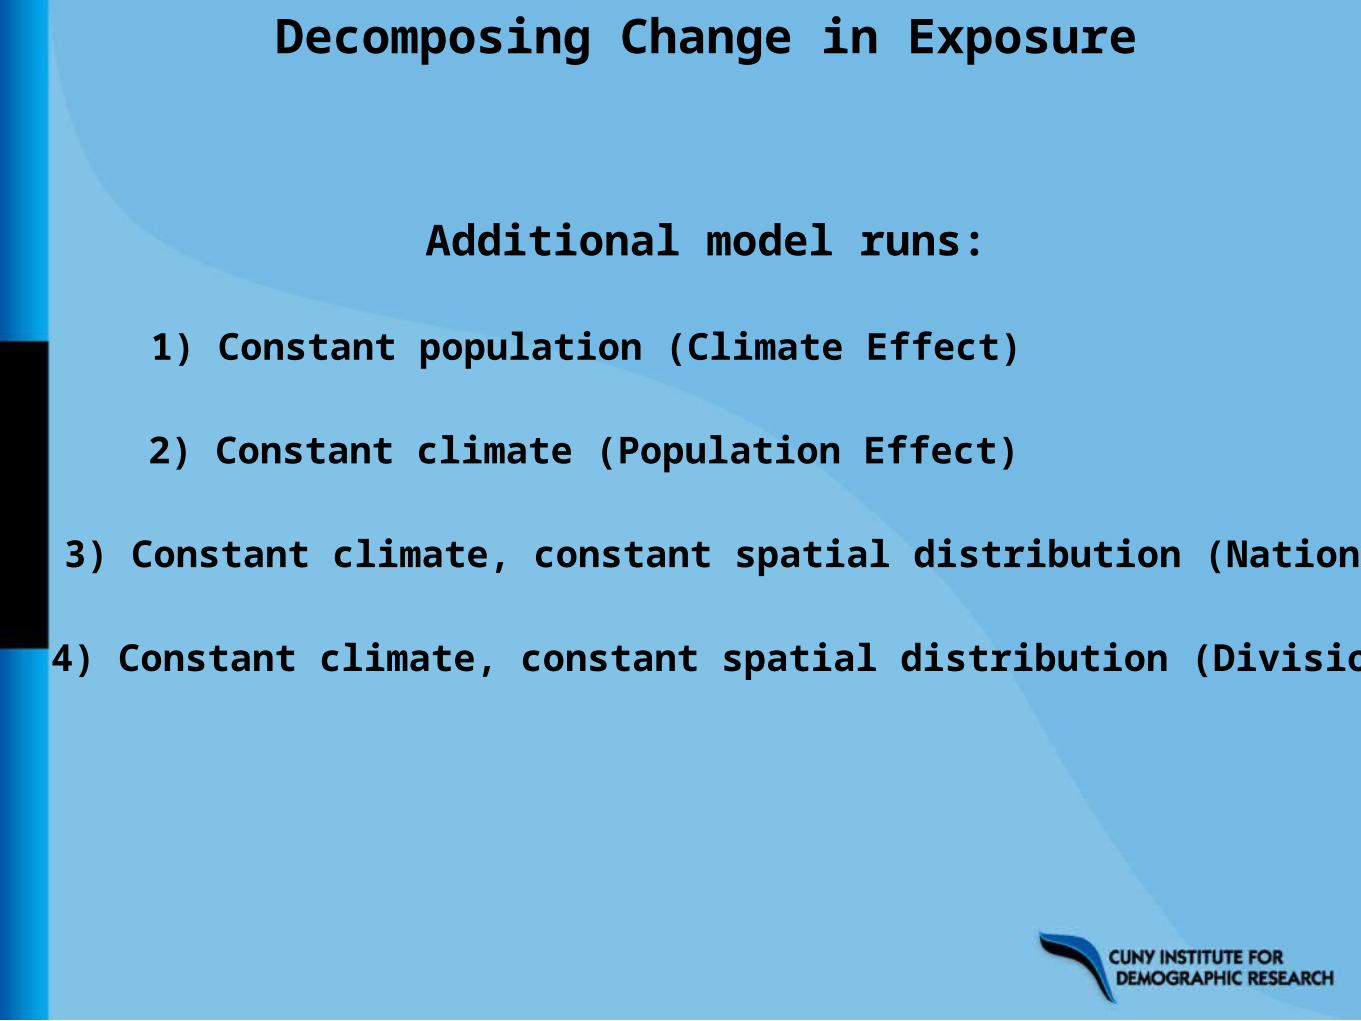
Decomposing Change in Exposure
Additional model runs:
1) Constant population (Climate Effect)
2) Constant climate (Population Effect)
3) Constant climate, constant spatial distribution (National)
4) Constant climate, constant spatial distribution (Divisional)
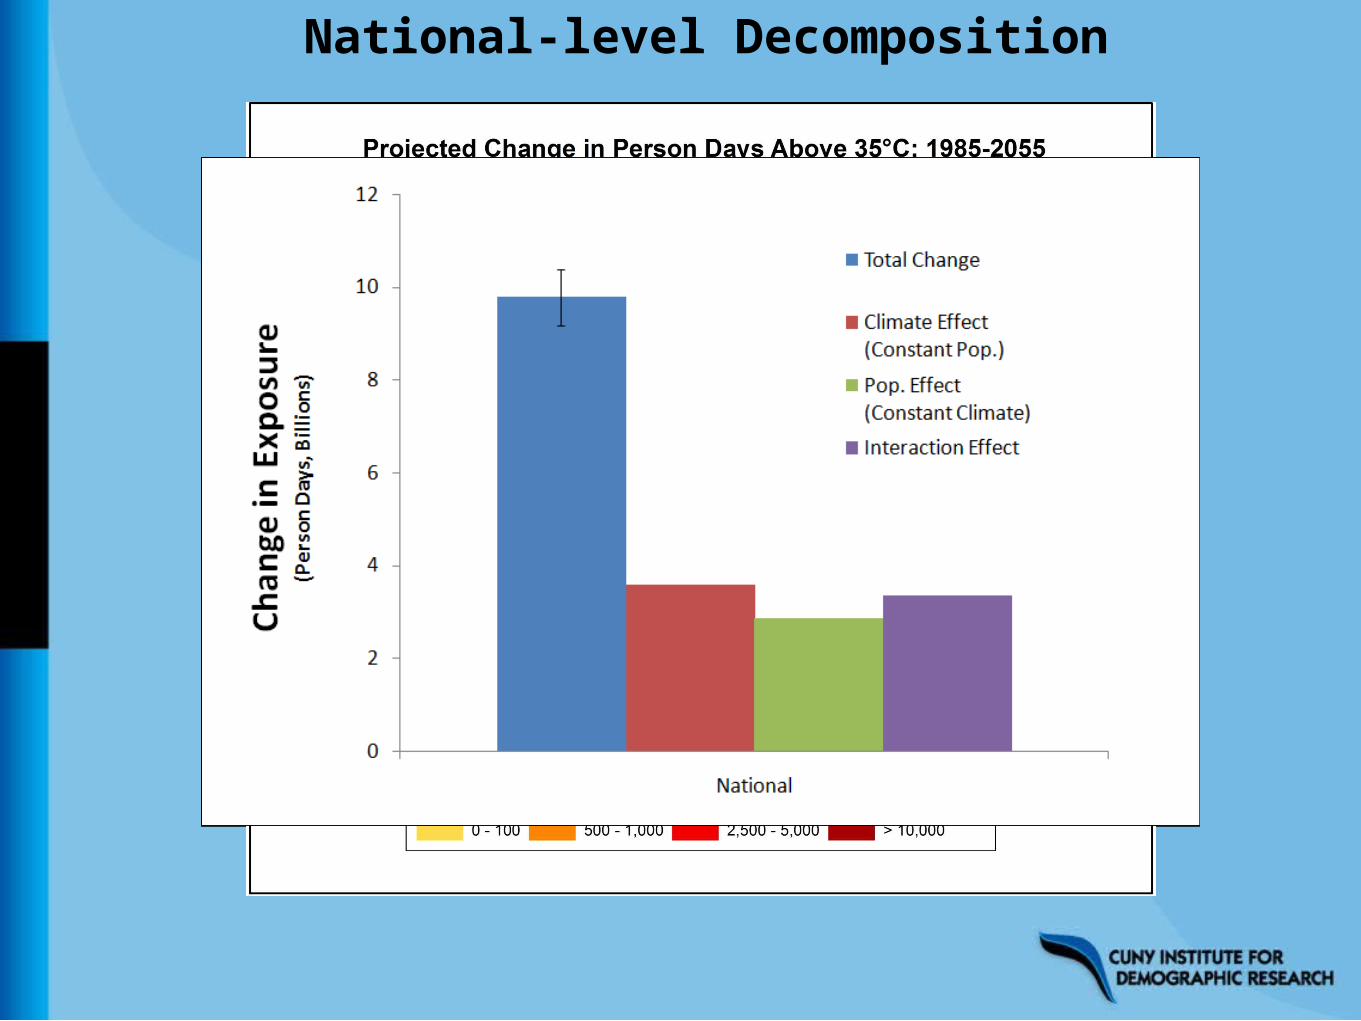
National-level Decomposition
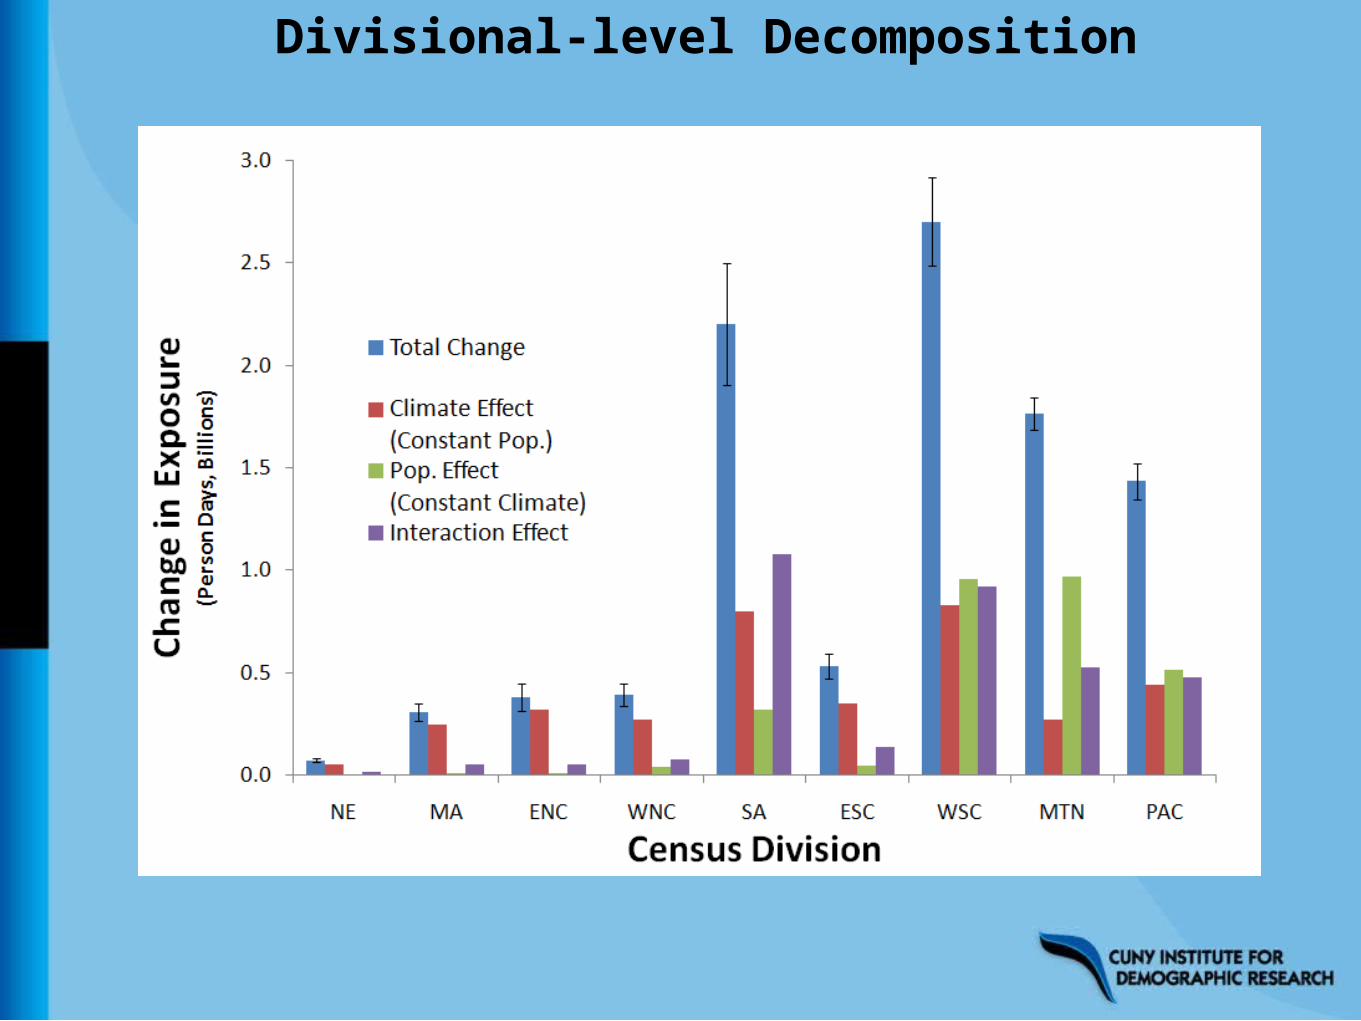
Divisional-level Decomposition
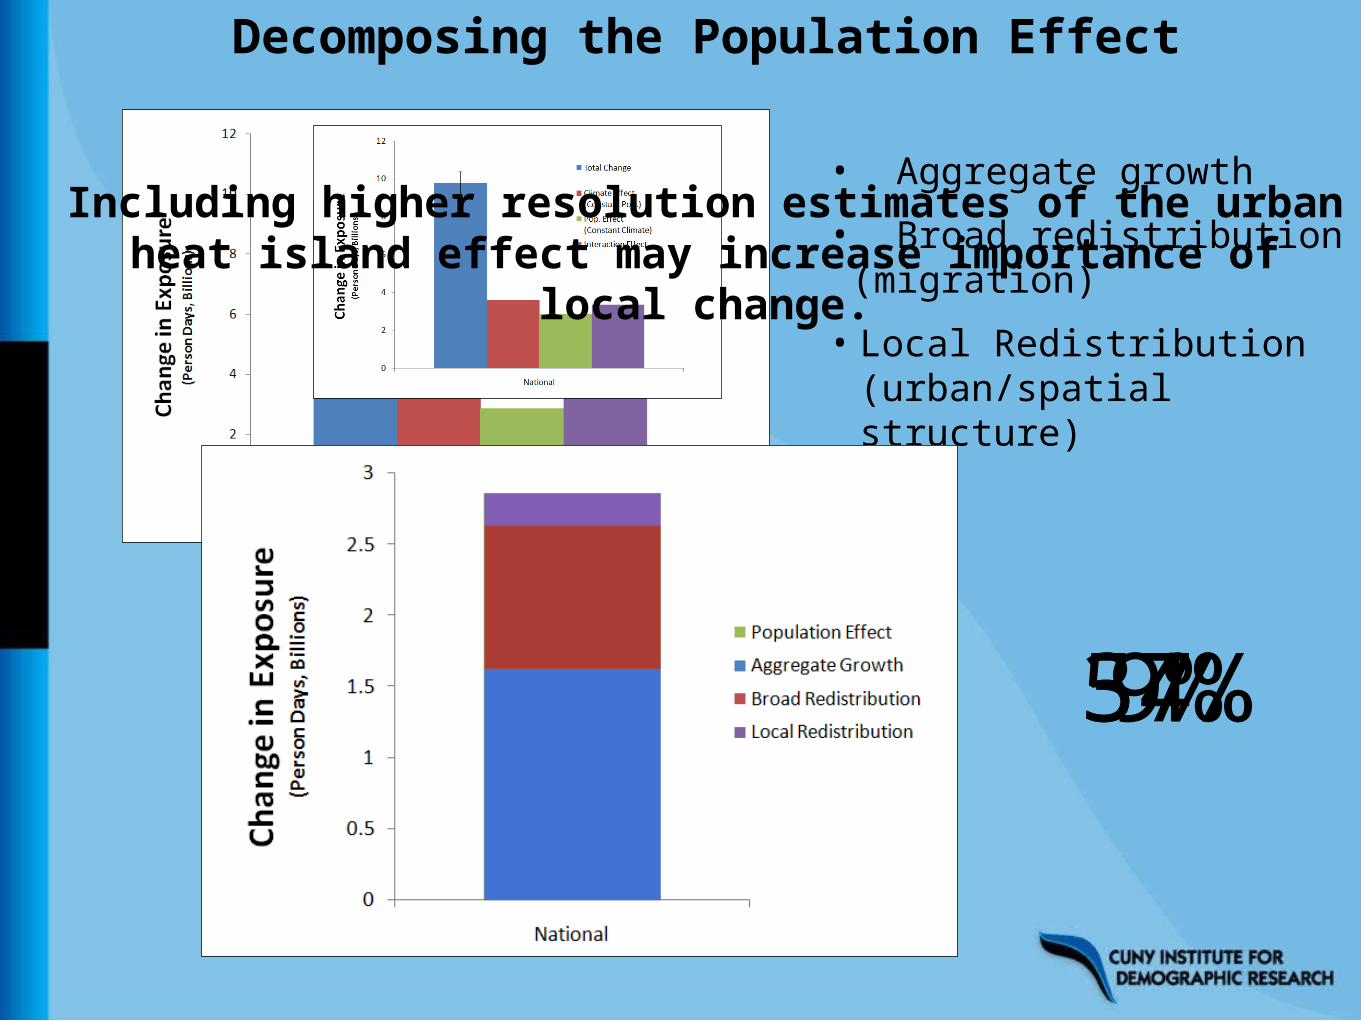
Decomposing the Population Effect
• Aggregate growth• Broad redistribution (migration)
• Local Redistribution (urban/spatial structure)
57%34%9%
Including higher resolution estimates of the urban heat island effect may increase importance of
local change.
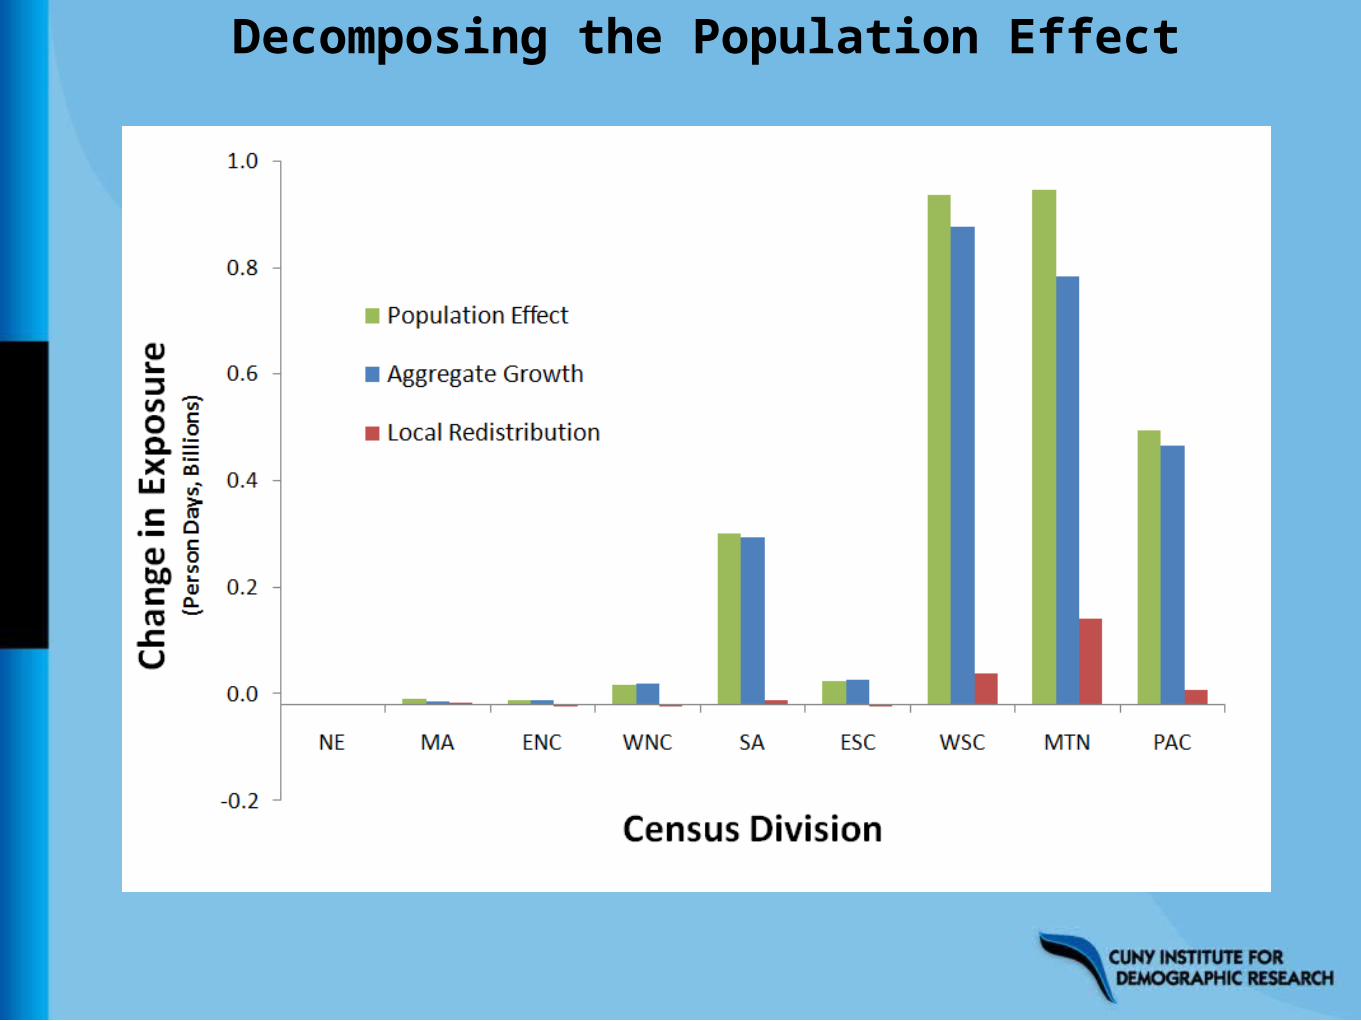
Decomposing the Population Effect
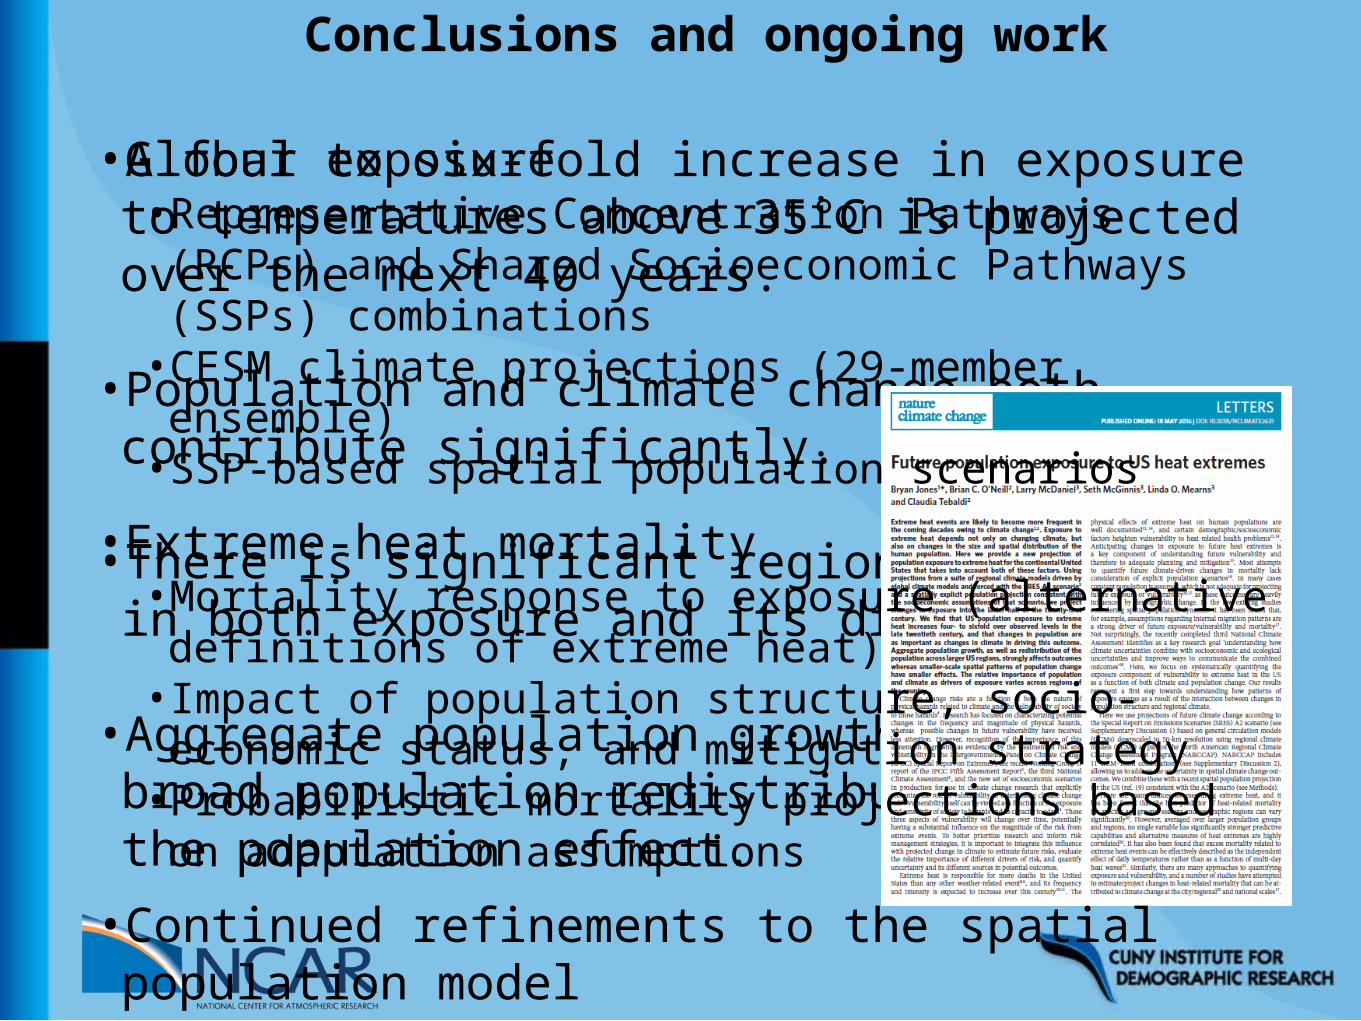
•A four to six-fold increase in exposure to temperatures above 35°C is projected over the next 40 years.
•Population and climate change both contribute significantly.
•There is significant regional variation in both exposure and its drivers.
•Aggregate population growth and broad population redistribution drive the population effect.
Conclusions and ongoing work
•Global exposure•Representative Concentration Pathways (RCPs) and Shared Socioeconomic Pathways (SSPs) combinations•CESM climate projections (29-member ensemble)•SSP-based spatial population scenarios
•Extreme-heat mortality•Mortality response to exposure (alternative definitions of extreme heat)•Impact of population structure, socio-economic status, and mitigation strategy•Probabilistic mortality projections based on adaptation assumptions
•Continued refinements to the spatial population model
ResourcesNARCCAP: http://www.narccap.ucar.edu/index.html
RCP Database: http://tntcat.iiasa.ac.at/RcpDb/dsd?Action=htmlpage&page=welcome
SSP Database: https://secure.iiasa.ac.at/web-apps/ene/SspDb/dsd?Action=htmlpage&page=about
IPCC 5th Assessment Report: http://www.ipcc.ch/report/ar5/index.shtml
Climate and Socioeconomic Scenarios: http://climate4impact.eu/impactportal/downscaling/downscalingdocs.jsp?q=Scenarios
http://www.ipcc.ch/pdf/supporting-material/expert-meeting-ts-scenarios.pdf
http://www2.cgd.ucar.edu/sites/default/files/iconics/Boulder-Workshop-Report.pdf


