Embed Size (px)
Citation preview

Property Rights Protection and FirmHorizontal Scope�
Julan Dua, Yi Lub, and Zhigang Taoba Chinese University of Hong Kong
b University of Hong Kong
This Version: December 2007
Abstract
Horizontally diversi�ed �rms in related or unrelated industries areprevalent in many emerging economies. While it has been argued thatdiversi�ed �rms may thrive in situations of poor market institutions,much research is needed to substantiate this idea. In this paper, us-ing a survey data set of private enterprises in China, we examine how�rm scope varies with respect to property rights protection, and how�rm performance changes in the degree of property rights protection.We �nd that the horizontal scope of �rms increases in the severity ofproperty rights expropriation, and that �rm performance decreases inproperty rights expropriation but this negative impact decreases withthe horizontal scope of the �rm. Our �ndings are robust to the use ofalternative measures of �rm scope, di¤erent indices of property rightsprotection, and two alternative instrumental variables for the prop-erty rights protection indices to control for the potential endogeneityproblems.
�Corresponding author: Zhigang Tao, Faculty of Business and Economics, The Univer-sity of Hong Kong, Pokfulam Road, Hong Kong. Tel: 852-2857-8223; Fax: 852-2858-5614;Email: [email protected]. We thank Oliver Hart and Ivan Png for their commentsand suggestions. Financial supports from CERG and University of Hong Kong are alsogreatly acknowledged.
1

1 Introduction
Horizontally diversi�ed �rms in related or unrelated industries are prevalentin many emerging economies (Khanna and Palepu, 1997; Ghemawat andKhanna, 1998). Studies have shown that they achieve better performancein emerging economies (e.g., Khanna and Palepu, 2000; Khanna and Yafeh,2005). This is in contrast to the trend in developed economies where �rmsadopt focused strategies for their businesses. Indeed a voluminous litera-ture has documented the existence of diversi�cation discount in corporatevaluation in developed countries, especially, the detriment of the unrelatedcorporate diversi�cation strategy to shareholder value.1
Why are diversi�ed strategies prevalent in emerging economies but not indeveloped economies? A fundamental di¤erence between these two types ofeconomies is the existence of sound economic institutions, including propertyrights protection, contract enforcement, and sophisticated markets for variousinputs in those economies. Indeed, it has been suggested that diversi�ed �rmsmay overcome the obstacles caused by the lack of economic institutions inemerging economies (Khanna and Palepu, 1997; Ghemawat and Khanna,1998). However, there is limited empirical support for this argument.2 To �llin the gap, this paper empirically investigates the e¤ects of property rightsprotection on the horizontal scope of �rms.Protection of private properties is arguably the most central aspect of
economic institutions in the emerging economies. Numerous studies haveshown that property rights protection provides incentives for investment(e.g., Besley, 1995), and plays a key role in promoting economic develop-ment (e.g., Acemoglu, Johnson, and Robinson, 2001, 2002). In studying theimpacts of property rights protection on the horizontal scope of �rms, thispaper focuses on the case of private enterprises for two reasons. First, unlikestate-owned or collectively-owned enterprises that conduct business underthe auspices of national and regional governments, private enterprises areparticularly disadvantaged by poor institutional environments and they haveto �ght for their survival and growth. Second, the overwhelming majorityof private �rms in China are individually-owned ventures or partnerships or
1See, for example, among others, Lang and Stulz, 1994; Berger and Ofek, 1995; Com-ment and Jarrell, 1995; Servaes, 1996; Lins and Servaes, 1999; Laeven and Levine, 2007.Recent studies controlling for �rm and industry heterogeneity often fail to �nd signi�cantdiscount e¤ects (Campa and Kedia, 2002; Graham, Lemmon, and Wolf, 2002; Maksimovicand Phillips, 2002).
2One exception is that of Fan, Huang, Oberholzer-Gee, and Zhao (2007), which usesdata on China�s publicly traded �rms to examine how political connections may in�uencethe horizontal scope of �rms.
2

individual- or family-controlled limited liability companies (Asian Develop-ment Bank, 2003). Compared with these private �rms, much of the corpo-rate diversi�cation of publicly listed �rms in both emerging and developedeconomies is driven by agents whose interests could be divergent from thoseof shareholders.3 Our focus on private �rms allows us to isolate the e¤ectsof property rights protection on �rm horizontal scope.4
When private properties are not securely protected, private �rms may besubject to expropriation by government agencies and related parties. It isoften the case that bureaucrats expropriate a set of industries through regu-lations in the name of enhancing public interests. Bureaucrats often justifytheir discriminatory regulations of di¤erent industries, i.e., impose informallevies on certain industries and grant favors to others, on the grounds of en-hancing economic e¢ ciency and ensuring public interest such as upgradingindustrial structure, promoting industrial policy to support certain promisingstrategic industries, stabilizing product prices, protecting environment, etc.However, these regulations often lead to government expropriation of privateproperty, bureaucratic corruption and private entrepreneurs�rent-seeking ac-tivities (see, for example, Shleifer and Vishny, 1994; Ades and Di Tella, 1997;Rodrik, 2004). To the extent that the risk of expropriation is independentacross industries, private �rms may therefore reduce the risk of expropriationby diversifying in related or unrelated businesses.Using data of China�s private enterprises, we investigate empirically the
impacts of property rights protection on the horizontal scope of �rms. Chinais a large country with substantial variations in institutional strength acrossregions. Although China is a unitary state with uniform legal codes, the defacto institutional quality varies tremendously from region to region. ThusChina o¤ers us a good setting to study the impact of property rights protec-tion on organizational forms.Following the literature on economic institutions (Johnson, McMillan,
and Woodru¤, 2002; Cull and Xu, 2005), we measure the property rightsprotection as the risk of expropriations by government agencies and relatedparties. Speci�cally, it is constructed based on the opinions of private entre-preneurs regarding the severity of informal levies and extra-legal payments in
3For example, corporate managers may seek to diversify in order to build empiresfor their personal compensation (Jensen and Murphy, 1990), enhance their power andprestige (Jensen, 1986), and make their positions more secure (Shleifer and Vishny, 1989).Corporate diversi�cation may in turn lead to agency problems among division managers(e.g., Rajan, Servaes and Zingales, 2000; Scharfstein and Stein, 2000).
4Aside from su¤ering agency costs, listed companies in China face less imminent riskof government expropriation because they were mostly converted from state-owned enter-prises by the governments.
3

the regions where their businesses are operated. We �nd that �rms reportinga higher degree of expropriation are more diversi�ed. This result, however,should be interpreted with caution for there may exist some endogeneityproblems, i.e., reversed causality and omitted variables. To alleviate thisconcern, we aggregate the �rm-level index for expropriation to the regionallevel, and �nd that our results still hold. To further address the potentialendogeneity problems, we use the instrumental variables (IV) method. Fol-lowing the recent literature on economic institutions (see Levine, 2005 fora review), we choose the number of merchants in China�s various regions in1912 and the number of banks in China�s regions in 1937 as the instrumentalvariables for property rights protection. The IV estimation results reinforceour �ndings that �rms are more diversi�ed in regions with poorer propertyrights protection.Moreover, we look at the performance implications of the �rm horizontal
scope in environments of poor property rights protection. We �nd that �rmperformance is negatively correlated with the severity of expropriation. Itis further found that, given the severity of expropriation, �rms that choosemore diversi�ed scope enjoy higher performance.This paper is related to the large and growing literature on economic
institutions. Numerous cross-country and within-country studies have shownthat a high quality of economic institutions contributes to a good economicperformance, e.g., Besley (1995), Knack and Keefer (1995, 1997), Mauro(1995), Hall and Jones (1999), La Porta, Lopez-De-Silanes, Shleifer, andVishny (1999), and Acemoglu, Johnson, and Robinson (2001, 2002). Thefocus of this paper is to understand how economic institutions a¤ect thecorporate decision making such as the horizontal scope of �rms. A recentstudy in the same direction is that of Laeven and Woodru¤ (2007), which isabout the impacts of legal systems on the �rm size measured by employment.The rest of the paper proceeds as follows. Data and variables are pre-
sented in Section 2. Estimation strategies including the description of instru-mental variables are in Section 3. The main empirical �ndings are discussedin Section 4. The paper concludes with Section 5.
2 Data and Variables
The dataset we use in this paper is from the Survey of China�s Private En-terprises conducted in 2000. The Survey is conducted jointly by the UnitedFront Work Department of the Central Committee of the Communist Partyof China, the All China Industry and Commerce Federation, and the ChinaSociety of Private Economy at the Chinese Academy of Social Sciences. To
4

achieve a balanced representation across all regions and industries in China,the Survey used multi-stage strati�ed random sampling method. The totalnumber of private enterprises to be surveyed was determined. After that, sixcities/counties were selected from each of the 31 regions (i.e., 22 provinces,4 province-level municipalities and 5 minority autonomous regions), whichincluded the capital city of the region, one district-level city, one county-level city, and three counties. Next, the number of private enterprises to besurveyed in each region was determined by the product of the percentage ofthe region�s share of private enterprises in the national total and the totalnumber of private enterprises in the survey. The same method was used todetermine the number of sample �rms in every city/county and industry.Finally, private enterprises were randomly chosen for each sub-sample. Thedataset contains 3,073 initial observations, about 0.2 percent of the totalnumber of private enterprises in China by the end of 1999. After deletingthose observations with no industry code, we obtain the �nal sample with2,798 observations.The dependent variable in this study is the horizontal scope of �rms or
�rm scope. One question in the Survey asks the entrepreneurs what are theprimary industry and secondary industries they are engaged in. The clas-si�cation of industries in the Survey is as follows: (1) agriculture, forestry,animal husbandry, and �shing; (2) mining; (3) manufacturing; (4) electricityand gases; (5) construction; (6) geology and irrigation works; (7) transporta-tion; (8) commerce and restaurant services; (9) �nance and insurance; (10)real estate; (11) social services; (12) public health and sports; (13) educationand culture; (14) science and technology; (15) others. Clearly this classi�ca-tion is very broad, and it is even broader than that of two-digit SIC codes inChina. This allows us to maximize the likelihood of capturing the degree ofhorizontal scope rather than vertical scope.5
Of all 2,798 observations, 1,864 �rms have only one business segment,703 �rms have two business lines, 144 �rms have three business segments,and the remaining 87 are engaged in four businesses. A dummy variableFIRM SCOPE is constructed, which takes value one if the entrepreneur isengaged in more than one industries and value zero otherwise. Alternatively,a categorical variable FIRM SCOPE1 is constructed, which takes value zero,one, two and three if the entrepreneur has one, two, three and four businesslines, respectively.Our key explanatory variable is the index for property rights protection.
Following Johnson, McMillan and Woodru¤ (2002) and Cull and Xu (2005),
5Focusing on horizontal scope could minimize the possibility of corporate diversi�cationas a result of the natural integration of di¤erent phases of a production process.
5

we measure property rights protection as the risks of expropriation in theforms of informal levies and extralegal payments by government agenciesand related parties. There are two relevant questions in the Survey. First,the entrepreneur is asked whether the problem of extralegal payment to thegovernment (Tan Pai in Chinese) in his or her region is severe according tohis or her knowledge. The answer is a number that ranges from 1 to 3 witha higher value indicating a less severe problem. Second, one question asksthe entrepreneur whether the problem of informal levies (Za Fei in Chinese),such as various kinds of fees charged by the government other than taxes, issevere. Again the answer ranges from 1 to 3, where a higher value indicates aless severe problem. Since the correlation of these two answers for any given�rm/entrepreneur is very high, we use the principal component method tocombine them and generate a single index, called PROPERTY RIGHTS (seealso Svensson, 2003). This variable will be used at the �rm level to examinethe impacts of property rights protection on �rm scope, and it will also beaggregated to the regional level as a way of controlling for the problem ofreversed causality. As a robustness check, we also employ the subindex ofproperty rights protection in the NERI Index of Marketization of China�sProvinces compiled and published by Fan, Wang and Zhu (2003).In this study, we also analyze the interrelationship between �rm scope,
property rights protection and the economic performance of �rms. We usethe logarithm of output per worker to measure FIRM PERFORMANCE .This is consistent with the convention in the literature studying the impactsof the quality of institutions on economic performance and economic growth.For example, Hall and Jones (1999) use the logarithm of output per workerto study the e¤ects of social infrastructures, i.e., institutions and govern-ment policies, on the cross-country di¤erences in economic performances.Later studies such as Bockstette, Chanda, and Putterman (2002) and Mas-ters and McMillan (2002) follow suit. Acemoglu, Johnson and Robinson(2001, 2002) use logarithm of GDP per capita, which is similar in natureto the variable used here but at a more aggregate level, to study the e¤ectsof institutional quality on economic growth. Subsequent studies includingAlcala and Ciccone (2004), Glaeser, La Porta, Lopez-de-Silanes and Shleifer(2004), Acemoglu and Johnson (2005) adopt the same country-level perfor-mance variable. Panda and Udry (2004) provide a good summary of the useof variables in this area.6
6Though many other studies also use pro�ts per worker or return on assets (ROA) togauge the performance of �rms, we are constrained by our dataset because there are quitea lot of missing information on pro�t. Generally speaking, in China, pro�ts data reportedby private �rms could be seriously manipulated and distorted because private �rms havea strong motivation to hide pro�ts to avoid being expropriated by predatory government
6

Though we are mainly concerned with the relationship between propertyrights protection and �rm scope, we control for characteristics of entrepre-neurs and �rms.AGE is the age of an entrepreneur by the end of 1999.EDUCATION is measured by the number of years entrepreneurs had in
formal education. It is zero for those respondents who are illiterate, six forthose who had primary school education, nine for those with junior highschool education, twelve for those with senior high school education or thoserespondents who had technical school education (Zhongzhuan in Chinese),�fteen for those with polytechnics education (Dazhuan in Chinese), sixteenfor those respondents who had college education, and �nally, nineteen forthose with graduate school education. MANAGERIAL EXPERIENCE ismeasured by the number of years an entrepreneur had held a managerialposition before he or she started his or her own business. Education back-ground and experience, which constitute human capital endowment, maya¤ect the ability of entrepreneurs to enter new industries in response to newdevelopments of di¤erent industries.Private entrepreneurs can improve their social status through political
participation. Here political participation includes membership of the Chi-nese People�s Congress (CPC), i.e., the legislature that is the highest organof state power in China, or the Chinese People�s Political Consultative Con-ference (CPPCC), the advisory organ to the Chinese People�s Congress andthe government. Two variables are constructed accordingly. One is CPCMEMBER, which takes the value of one if an entrepreneur is a member ofthe People�s Congress and zero otherwise, and the other dummy variableis CPPCC MEMBER, which takes the value of one if an entrepreneur is amember of the Chinese People�s Political Consultative Conference and zerootherwise.GOVERNMENT CADRE is a dummy variable that takes value one if an
entrepreneur used to be a government o¢ cial, and zero otherwise. SOECADRE is a dummy variable de�ned similarly, with the criterion beingwhether an entrepreneur used to be a Communist Party leader in a state-owned enterprise. These variables re�ect the political connections and politi-cal capital that entrepreneurs possess, which might facilitate their entry intonew business lines by going through smoothly business entry regulations ofgovernment agencies.FIRM AGE is de�ned as the logarithm of the number of years a �rm
has been established as of 1999. We include this variable to incorporate theconsideration that a �rm would naturally diversify its business scope when
agencies.
7

it grows over time.We also consider imperfections in external �nance and legal system that
may cause �rms to diversify as argued by Khanna and Palepu (1997). Inthe Survey, one question directly asks the entrepreneurs how di¢ cult it is forthem to secure bank loans. The answer ranges from 1 to 5 with a higher valuerepresenting less di¢ culty in obtaining loans, and the variable of EXTER-NAL FINANCE is de�ned accordingly. In the Survey, there is also a questionasking whether the entrepreneur resorts to courts in resolving business dis-putes. We de�ne a dummy variable called LEGAL SYSTEM taking valueone if the entrepreneur uses the court and zero otherwise. It should be thatthese two variables are constructed based on the opinions of entrepreneurs,which could be shaped by their personal characteristics (such as politicalparticipations and prior experiences) as outlined above, and the estimatedcoe¢ cients of these two variables will be interpreted with caution.When examining the impacts of �rm scope on �rm performance, we in-
troduce a few more control variables. They are: (i) LOCAL MARKET DE-MAND de�ned as the logarithm of GDP per capita in a region; (ii) LOCALINFRASTRUCTURE de�ned as the logarithm of railway and highway den-sity, i.e., the length of railway and highway per square kilometer in a region;and (iii) FIRM SIZE de�ned as the logarithm of the number of employeesin each �rm.Descriptive statistics of all key variables are given in Table 1.
3 Estimation Strategy
In the empirical analysis of this study, we investigate two questions. First,does weaker property rights protection promote the occurrence of multi-segment diversi�ed �rms? Second, does diversi�cation strategy achieve bettereconomic performance in regions with weaker property rights protection?To answer the �rst question, we start by regressing FIRM SCOPE on
PROPERTY RIGHTS, measured at the �rm level, with control for entrepre-neur, �rm and regional characteristics, that is,
FIRM SCOPEij = �+ �PROPERTY RIGHTSij +Xij0 + "ij (1)
where FIRM SCOPEij measures the scope of �rm i in region j, PROPERTYRIGHTSij is the perception regarding the degree of property rights protec-tion by �rm i in region j, Xij0 is a vector of control variables, and "ij is arandom error term.It is possible that the perception of property rights protection by individ-
ual �rms could be biased due to varying �rm and entrepreneur characteristics,
8

and it may not re�ect the regional environment of property rights protection.To alleviate this concern, we aggregate the responses from the individual en-trepreneurs to the regional level, PROPERTY RIGHTSj, and re-examinethe impacts of property rights protection on �rm scope, i.e.,
FIRM SCOPEij = �+ �PROPERTY RIGHTSj +Xij0 + "ij (2)
One potential concern with our regressions is the endogeneity issue dueto reversed causality or omitted variables. For instance, it could be thatthe existence of diversi�ed �rms with good economic performance providesthe regional government with a good opportunity to expropriate these privatebusinesses, leading to a worsening of property rights protection in the region.There could also exist some uncontrolled variables that a¤ect both propertyrights protection and �rm scope, which causes spurious negative correlationbetween the two variables. To deal with these problems, we adopt an in-strumental variable approach. Inspired by Acemoglu et al. (2001, 2002),we choose the historical proxies of regional institutions as instrumental vari-ables. In particular, we use the number of merchants in China�s region in1912 and the number of banks in China�s region in 1937 as two alternativeinstrumental variables for property rights protection. We will discuss thesetwo variables in details in Section 3.1.For robustness check, we use an alternative measure for �rm scope. It
is FIRM SCOPE1, a cardinal number depending on how many businesses acompany has. Accordingly, by replacing FIRM SCOPE by FIRM SCOPE1,we re-run the regression analyses of equations (1) and (2), and the instru-mental variable analysis. In addition, we use an alternative index of propertyrights protection (subindex of property rights protection in the NERI Indexof Marketization of China�s Provinces compiled and published by Fan, Wangand Zhu (2003)).To see whether more diversi�ed �rms achieve better economic perfor-
mance in regions with weaker property rights protection, we regress �rmperformance on �rm scope, property rights protection (measured at the �rmlevel or aggregated to the regional level), and their interaction term.
yij = �+ �FIRM SCOPEij + �PROPERTY RIGHTSij (3)
+ FIRM SCOPEij � PROPERTY RIGHTSij + Zij0� + "ij
yij = �+ �FIRM SCOPEij + �PROPERTY RIGHTSj (4)
+ FIRM SCOPEij � PROPERTY RIGHTSj + Zij0� + "ij
9

where yij is the logarithm of output per worker in �rm i in region j, FIRMSCOPEij is the measure of �rm i� scope, PROPERTY RIGHTSij isthe degree of property rights protection in region j perceived by �rm i,PROPERTY RIGHTSj is the regional index of property rights protectionfor region j, Z 0ij is a vector of control variables.
3.1 Instrumental variables for property rights protec-tion
3.1.1 Cross-region distribution of merchants in 1912
We use the distribution of merchants across China�s regions in 1912 as an in-strumental variable for property rights protection. The data is available fromthe second national statistical survey on farmers, workers, and merchants bythe Republic of China (Ma, 1995, p. 107). Compared to the situations inthe early 1990s, a few changes have taken place in the classi�cation of ad-ministrative regions in China. For example, Shanghai is now a province-levelmunicipality but was included in Jiangsu province in 1912. We adjust thedistribution of merchants in 1912 according to the current classi�cation ofthe administrative regions. The Appendix provides the details on the con-struction of this instrumental variable.In the late Qing Dynasty (1840-1911), China was forced to open its door
to foreign capital following its failures in the two opium wars and the Sino-Japanese War of 1894-95. Bureaucrats at that time realized the dominance ofthe West in science and technology. They attempted to introduce, to a lim-ited degree, modern industries based on modern science and technology intoChina so as to strengthen the power of the Dynasty. However, the centralgovernment of the Imperial Qing Dynasty held deep suspicion and distrustof the development of private capitalists in fear of having their feudal sys-tem jeopardized. It con�ned the experiment with capitalism to bureaucraticcapital. As a result, in the Westernization Movement, many state-owned,state-private-cooperative and state-supervised-private-run enterprises wereestablished, covering the industries ranging from mining and textile to shipbuilding and telecommunications.Under these circumstances, the domestic private capital had been sub-
ject to severe expropriations by government agencies and related parties. Thecentral government and especially regional governments often imposed taxesand various kinds of extralegal or informal fees to seek rents from the privatecapitalists (Zhang, 1982). Meanwhile, state-owned or semi-state-owned en-terprises tried to maintain their monopoly positions by lobbying for policiesthat restricted and strictly controlled the development of domestic private
10

capital. For example, the entry of private capital into those pro�table indus-tries such as shipping and textile industries was barred with the in�uence ofbureaucratic capital.In that period, private entrepreneurs grew in the absence of formal prop-
erty rights protection. Any growth and development of private entrepre-neurs could have been due to some informal institutional arrangements thatrestricted the expropriation of private property rights (Wu, 1981). Thus,regions with a larger number of merchants in 1912 were typically those withrelatively good property rights protection in the last decade of the ruling ofthe Qing Dynasty.The state of private entrepreneurship at the end of the imperial China and
the beginning of the Republic of China bears some striking resemblance tothat in the 1980-1990s when private entrepreneurship re-emerged in China�seconomic transition from a central planning economy to a market economy.China started its economic reform because of the economic disasters causedby central planning. In reforming its economy, however, the Chinese govern-ment was wary of development of private entrepreneurship, as it is at oddswith the ideology of the socialist economy. Hence, the reform was mainly fo-cused on introducing foreign capital (foreign direct investment) and restruc-turing state-owned enterprises, while maintaining many strict restrictions onprivate capital and private entrepreneurs. Even after the political standingof private entrepreneurs was raised substantially in 1997 by allowing privateentrepreneurs to join the ruling Communist Party, the business environmentfaced by private entrepreneurs has not changed fundamentally. Accordingto Asian Development Bank (2003), private enterprises are often disturbedwith the capricious and discretionary taxes and levies imposed by regionalgovernments. They were often treated as the ATM machines for regionalgovernments.It is documented that the development of entrepreneurship is fairly strongly
related to the local culture, beliefs, ideologies and informal institutions. Asshown by, among others, Fu (2003) and Zhu (2001), the development of indus-try and commerce in China�s di¤erent regions in the late Qing Dynasty wasclosely associated with the regional culture and informal institutions. Mer-chants from the same region often established mutually cooperative businessassociations, which bears some similarity to guilds in Europe, on the basisof emotional ties, and they shared the same regional business culture. As aresult, some distinct regional merchant groups and regional business cultureemerged, some prominent examples of which are Shanxi group, Anhui group,Zhejiang group and Shanghai group. It is also found that those regions hav-ing more active business activities a century ago exhibit stronger inclinationand ability to transit toward a market economy in recent decades after China
11

started economic reforms. It is widely agreed that the historical heritage ofregional business culture plays an instrumental role in this process. Due tothe persistence of the local informal institutions and culture, the fundamen-tal factors shaping the cross-region distribution of merchants in 1912 maywell exert the same impacts in the 1990s and 2000s.7 Therefore, we use themerchant distribution in 1912 as an instrumental variable for property rightsprotection in 1999. Figure 1 gives a scatter plot between regional distribu-tion of merchant in 1912 and the regional index of property rights protectionin 1999, where we can clearly observe a positive relation between the twovariables.
3.1.2 Cross-region distribution of banks in 1937
We choose the distribution of domestic banks across China�s regions in 1937as an alternative instrumental variable for property rights protection. Wecompile this data from the Chinese Bank Yearbook 1936-1937. It lists thenumbers of domestic banks existing in various provinces and cities. Theclassi�cation of administrative districts in China in the 1930s was di¤erentfrom that in the contemporary China. We adjust the distribution of banks in1937 according to the current classi�cation of the administrative regions. Seethe Appendix for details on the construction of this instrumental variable.The development of domestic banks in the period 1912-1937 in China
was not a natural outcome of the development of domestic industry as wasthe case in many currently developed countries. According to Wu (1955),it largely resulted from the following demand-pull factors. The �rst factoris the international trade businesses conducted by foreign capital. Foreigncapital was mainly involved in trade rather than industry in China in theearly twentieth century (Wu, 1981). The trade-related �nancial activitiesgave a boost to the development of domestic banks as well as foreign banks.The second factor is the central and regional governments��scal needs. Bankstypically became the treasuries of governments. Governments enlisted banksto issue government bonds and bank notes to �nance their �scal needs (Peng,1987). Third, the unstable political situations in China led wealth to movefrom the countryside and the inland areas to the cities and the coastal regions.
7There are a variety of studies showing the persistence of informal institutions. Young(1994, p. 283) wrote "although we commonly described the independent polities as "newstates", in reality they were successors to the colonial regime, inheriting its structures, itsquotidian routines and practices, and its more hidden normative theories of governance";Acemoglu, Johnson and Robinson (2001) discussed three mechanisms that will lead tothe institutional persistence; La Porta, Lopez-de-Silanes, and Shleifer (2007) argues thatcultures, religions and ideologies are likely to persist over time in spite of regime changes.
12
This spurred the development of banks including domestic banks. Amongthese three demand-pull factors, the latter two are most closely related tothe role of the variation in property rights protection in determining bankdistribution across regions.Consider �rst the relationship between governments and banks. Prior to
the year 1928 when the Chinese central bank was established, the domesticbanks were mostly provincial banks and private commercial banks. Provin-cial banks were set up by regional governments to take care of regional �scalrevenue and provide �nancial services to the region. Many private com-mercial banks also gained protection and support from governments in theform of "supervised by government o¢ cials and run by private businessmen".Bank capital in most of these banks was raised by taxation and mandatoryfee payments through government coercive power (Xu and Wu, 2003). In theperiod 1912-1927, although the Beijing government was the central govern-ment, it only had nominal power and the country was virtually divided byNorthern warlords. Incessant civil wars took place between those Northernwarlords that occupied di¤erent regions. Both provincial and private com-mercial banks were forced to issue bank notes and public bonds or provideloans to �nance the military expenditure of warlords. This inevitably led tomassive bank credit crises and bankruptcies (Chinese Bank Yearbook, 1937).The period 1928-37 saw the emergence of a two-tier banking system in
China, i.e., the central bank led the banking system composed of variousbanks and �nancial institutions. However, the function of domestic banksto �nance governments largely remained intact. The bureaucratic capitalistspenetrated deeply into the banking system by holding shares or even control-ling various commercial banks. In this period, many commercial banks wereforced by the central and regional governments to �nance the wars againstthe Communist guerillas. The largest business category that domestic com-mercial banks were engaged in was to provide loans to governments (Xu andWu, 2003). This suggests that banks were heavily expropriated by govern-ments in that politically unstable period. In a large sense, the survival rate ofbanks in a region is a good barometer of regional property rights protection.Next, we look at the wealth transfer between regions. This is a particu-
larly important factor for banking development in the period 1928-37. Thecivil war between the Nationalist government and the Communist guerillas,the invasion of Japan into the three Northeastern provinces (starting in 1931)and the impending expansion of Japan�s occupation of China posed substan-tial uncertainty and instability to the daily life of people. The relativelywealthy families moved from the countryside to cities and from the war-ridden regions to peaceful ones. This led to the congregation of the wealthypeople and the agglomeration of social wealth in certain peaceful cities and
13

regions with reasonably secure property rights protection. In response to thegrowing demand for wealth management, more domestic banks were set upand the banking sector saw a boom in those regions. For instance, Shang-hai absorbed a large amount of funds that moved from the countryside andwarring areas (Chinese Bank Yearbook, 1937).Thus, the domestic banking sector development across regions in the mid-
1930s can largely re�ect the regional property rights protection at that time.Across China�s regions, though political regimes changed dramatically andrepeatedly over the 20th century, many of the fundamental regional culture,informal institutions, and customs remain largely unchanged. Therefore, weuse the bank distribution in China in 1937 as an alternative instrumentalvariable for property rights protection in 1999. Figure 2 presents a scat-ter plot illustrating the positive correlation between regional distribution ofbanks in 1937 and the regional index of property rights protection in 1999.
4 Regression Results
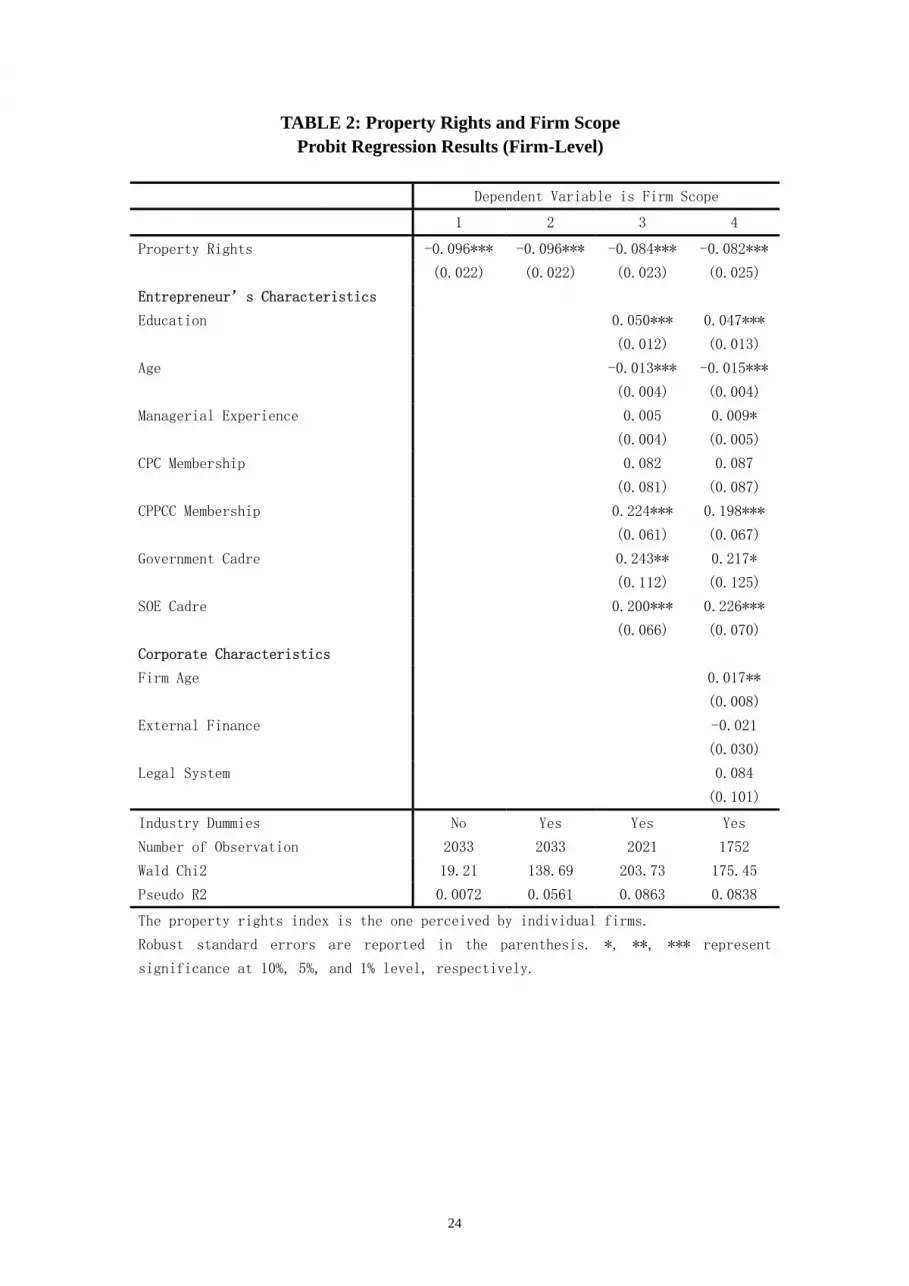
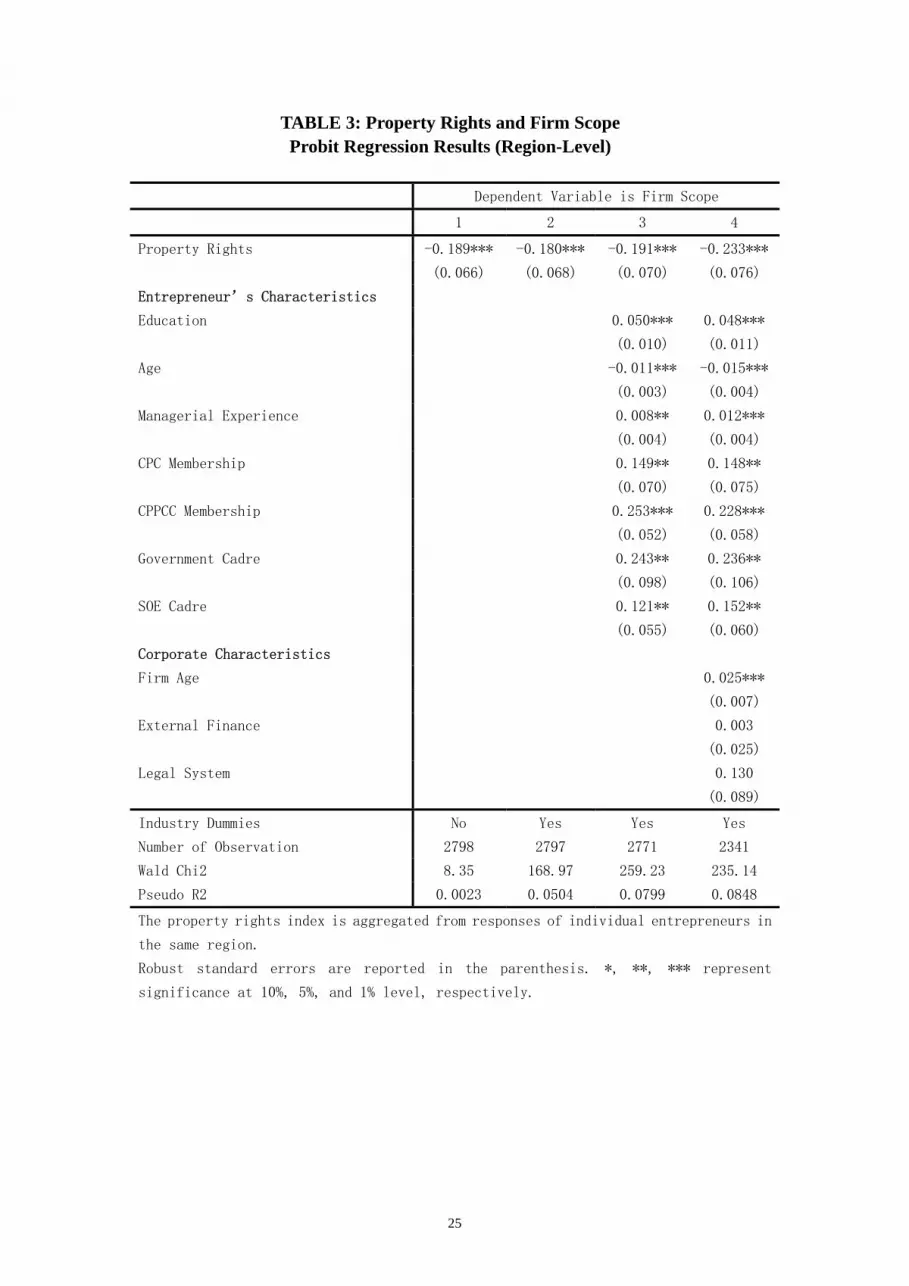
We �rst present the estimation results regarding the impacts of propertyrights protection on �rm scope. Table 2 summarizes the results of probitregression (1) where the independent variable, PROPERTY RIGHTS, is theone perceived by individual �rms. As shown in column 1 of Table 2, propertyrights protection has a negative and statistically signi�cant impact on �rmscope, implying that �rms are more diversi�ed when facing more severe prop-erty rights expropriation. This result is robust to the introduction of industrydummies and control variables (columns 2-4 of Table 2). The estimated co-e¢ cients of the control variables also make economic sense. For example,entrepreneurs with better education and more managerial experiences havemore diversi�ed businesses, suggesting that people with strong human capitalendowment could leverage their advantage onto many businesses. Entrepre-neurs with membership in Chinese People�s Congress or Chinese People�sPolitical Consultative Conference, and those with prior working experiencesin government or state-owned enterprises are found to have more diversi�edbusinesses. This is because government intervention remains signi�cant inthe Chinese economy and people with political connections could leveragetheir strength into many businesses. Older �rms are found to have morediversi�ed businesses, though the impacts of external �nancing constraintsand quality of legal system are limited. Table 3 summarizes the results ofprobit regression (2) where the independent variable, PROPERTY RIGHTS,is aggregated from responses of individual entrepreneurs in the same regions.Here the results are very similar to what is reported in Table 2. In particu-
14

lar, it is found that �rms are more diversi�ed in regions with poorer propertyrights protection.Table 4 summarizes the probit IV estimation results when the logarithm
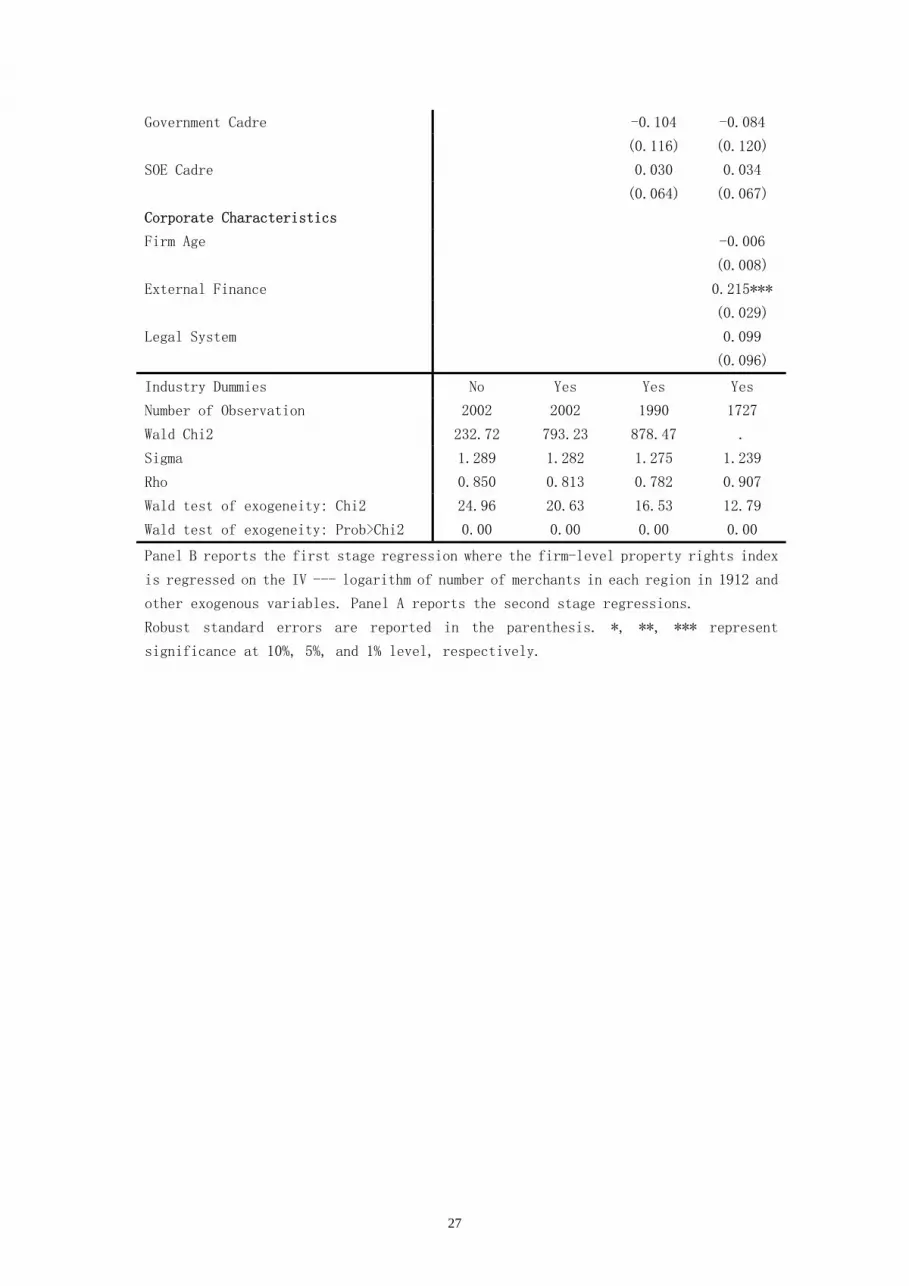
of number of merchants in China�s regions in 1912 is used as an instrumentalvariable for the �rm-level property rights protection index. Panel B of Table4 presents the results of the �rst-stage analysis in the probit IV estimation ofmodel (1). Consistent with our argument in section 3.1.1, the instrumentalvariable has a high correlation with the �rm-level property rights protectionindex. The second-stage regressions (shown in Panel A of Table 4) demon-strate that the instrumented �rm-level property rights index casts consis-tently signi�cant and negative impacts on the likelihood of diversi�ed �rms.Table 5 summarizes the probit IV estimation results when the logarithm ofnumber of banks in China�s regions in 1937 is used as an instrumental vari-able for the �rm-level property rights protection index. Similar to what isreported in Table 4, the logarithm of number of banks in China�s regions in1937 is highly correlated with the �rm-level property rights index, and theinstrumented �rm-level property rights index has a signi�cant and negativeimpact on �rm scope. Tables 6 and 7 summarize the probit IV estimationresults when the property rights protection index �measured at the regionallevel �is instrumented by the logarithm of number of merchants in China�sregions in 1912, and the logarithm of number of banks in China�s regions in1937 respectively. These results are similar to those reported in Tables 4 and5. Overall, the results of Tables 4-7 suggest that property rights protectionhas a negative impact on �rm scope even when the potential endogeneityproblems are controlled for, and they substantiate our earlier �ndings of Ta-bles 2 and 3.For a robustness check, we use a categorical measure of �rm scope, FIRM
SCOPE1, and re-estimate the equations (1) and (2) with ordered probit re-gressions and two-stage-least-square (2SLS) regressions with the two instru-mental variables proposed in Section 3.3. Table 8 summarizes the estimationresults. The �rst four columns report the results when the property rightsprotection index is measured at the �rm level and the next four columnsreport the results when the property rights protection is measured at theregion level. The ordered probit estimation results are reported in Columns1-2 and Columns 5-6, and the 2SLS estimation results with the logarithm ofnumber of merchants in China�s regions in 1912 as the instrumental variableare shown in Columns 3-4 and Columns 7-8. Table 9 shows the 2SLS esti-mation results with the logarithm of number of banks in China�s regions in1937 as the instrumental variable. The results resemble the estimation re-sults of Tables 2-7, and further con�rm our �ndings that the �rms are morediversi�ed when the property rights expropriation is more severe.
15

As another robustness test, we employ the alternative NERI propertyrights protection index (compiled by Fan, Wang, and Zhu (2003)) as the keyindependent variable in Tables 10 and 11. We use the binary variable of �rmscope as the dependent variable in Table 10 to conduct probit estimation andthe categorical �rm scope variable as the dependent variable in Table 11 tocarry out ordered probit estimation. Tables 10 and 11 also report the regres-sion results using the two alternative instrumental variables for the NERIproperty rights protection index. The results are consistent with our pre-vious �ndings and statistically signi�cant, suggesting that weaker propertyrights protection leads to a higher level of diversi�cation.Finally, we examine the performance implications of �rm scope and prop-
erty rights protection. The analysis is conducted in three steps. In the �rststep, we look at the impact of the diversi�cation strategy on economic perfor-mance. As reported in Column 1 of Table 12, we see that the �rm scope, asthe sole independent variable, has positive and statistically signi�cant e¤ectson �rm performance. Column 2 of Table 12 shows that the impact of �rmscope on �rm performance remains though statistically insigni�cant, whenvarious entrepreneurial, corporate and regional characteristics are controlledfor. In the second step, we analyze how �rm-level property rights protectionindex, �rm scope and their interaction term a¤ect �rm performance. Col-umn 3 of Table 12 shows that property rights protection has a positive andsigni�cant e¤ect on the �rm performance. More interestingly, in Column4 of Table 12, the interaction term between the property rights protectionindex and �rm scope exhibits signi�cant negative e¤ects. This suggests that�rms, in face of weaker property rights protection, could bene�t (i.e., achiev-ing better performance) by being more diversi�ed. In the third step, wesubstitute the �rm-level property rights protection index with the regionalproperty rights protection index, and Columns 6-8 of Table 12 show resultsequivalent to those in Columns 3-5. Overall, these results suggest that ex-propriation of property rights dampens �rm performance in China, and the(negative) marginal impact of expropriation on �rm performance decreaseswith the �rm scope.
5 Conclusion
Diversi�ed �rms have been found to be very popular in developing countries.This is in contrast to the practices in developed countries, and it is alsoagainst the research �ndings using data of publicly listed �rms that diversi�-cation has a negative impact on �rm performance (diversi�cation discount).While it has been argued that diversi�ed �rms may thrive in situations of
16

poor market institutions, much research is needed to substantiate this idea.In this paper, using a survey data set of private enterprises in China, we
�nd that weaker property rights protection causes �rms to be more divisi�ed.We also �nd that �rm performance decreases in property rights expropria-tion but this negative impact decreases with the horizontal scope of the �rm.Our �ndings are robust to the use of alternative measures of �rm scope, dif-ferent indices of property rights protection, and two alternative instrumentalvariables for the property rights protection indices.
ReferencesAcemoglu, Daron and Simon Johnson (2005) "Unbundling Institutions",Journal of Political Economy 113, 949-995.Acemoglu, Daron, Simon Johnson, and James A. Robinson (2001) "TheColonial Origins of Comparative Development: An Empirical Investigation",American Economic Review 91, 1369-1401.Acemoglu, Daron, Simon Johnson, and James A. Robinson (2002) "Reversalof Fortune: Geography and Institutions in the Making of the Modern WorldIncome Distribution", Quarterly Journal of Economics 117, 1231-1294.Ades, Alberto and Rafael Di Tella (1997) "National Champions and Corrup-tion: Some Unpleasant Interventionist Arithmetic", Economic Journal, 107:1023-1042.Alcalá, Francisco and Antonio Ciccone (2004) "Trade and Productivity",Quarterly Journal of Economics 119, 613-646.Asian Development Bank (2003) "The Development of Private Enterprisesin the People�s Republic of China", Asian Development Bank Publication,March.Berger, Philip G. and Eli Ofek (1995) "Diversi�cation�s e¤ect on �rm value",Journal of Financial Economics 37 (1), 39-65.Besley, Timothy (1995) "Property Rights and Investment Incentives: Theoryand Evidence from Ghana", Journal of Political Economy 103, 903-937.Bockstette, Valerie, Areendam Chanda, and Louis Putterman (2002) "Statesand Markets: The Advantage of an Early Start", Journal of EconomicGrowth 7, 347-369.Campa, Jose Manuel and Simi Kedia (2002) "Explaining the Diversi�cationDiscount", Journal of Finance 57 (4), 1731-1762.Comment, Robert and Gregg A. Jarrell (1995) "Corporate focus and stockreturns", Journal of Financial Economics 37 (1), 67-87.Cull, Robert, and Lixin Colin Xu (2005) "Institutions, Ownership, and Fi-nance: the Determinant of Pro�t Reinvestment among Chinese Firms", Jour-nal of Financial Economics 77, 117-146.
17

Fan, Joseph P.H., Jun Huang, Felix Oberholzer-Gee, and Mengxin Zhao(2007) "Corporate Diversi�cation in China: Causes and Consequences", Work-ing paper, Chinese University of Hong Kong.Fan, Gang, Xiaolu Wang, and Henpeng Zhu (2003) Reports on the RelativeProgress of Marketization in Di¤erent Regions in China, Economic SciencePublishing House, China.Fu, Yunsheng (2003) "Business Culture Tradition and Regional EconomicDevelopment Analysis", Economist (JINGJIXUEJIA, a Chinese journal),No. 5.Glaeser, Edward, Rafael La Porta, Florencio Lopez-de-Silanes, and AndreiShleifer (2004) "Do Institutions Cause Growth", Journal of Economic Growth9, 271-303.Graham, John R., Michael L. Lemmon, and Jack G. Wolf (2002) "DoesCorporate Diversi�cation Destroy Value?", Journal of Finance 57 (2), 695-720.Ghemawat, Pankaj and Tarun Khanna (1998) "The nature of diversi�edbusiness group: a research design and two case studies", Journal of IndustrialEconomics 46 (1), 35-61.Hall, Robert E., and Charles I. Jones (1999) "Why Do Some Countries Pro-duce So Much More Output per Worker than Others?", Quarterly Journalof Economics 114, 83-116.Jensen, Michael C (1986) "Agency costs of free cash �ow, corporate �nance,and takeovers", American Economic Review 76 (2), 323-329.Jensen, Michael C. and Kevin J. Murphy (1990) "Performance pay and topmanagement incentives", Journal of Political Economy 98 (2), 225-265.Johnson, Simon, John McMillan, and Christopher Woodru¤ (2002) "Prop-erty Rights and Finance", American Economic Review, 22 (6), 1335-1356.Knack, Stephen, and Philip Keefer (1995) "Institutions and Economic Per-formance: Cross-Country Tests Using Alternative Institutional Measures",Economics and Politics 7, 207-227.Knack, Stephen, and Philip Keefer (1997) "Dose Social Capital Have anEconomic Payo¤? A Cross-Country Investigation", Quarterly Journal ofEconomics 112, 1251-1288.Khanna, Tarun and Krishna Palepu (1997) "Why focused strategies may bewrong for emerging markets", Harvard Business Review 75 (4), 41-51.Khanna, Tarun and Krishna Palepu (2000) "Is group membership pro�tablein emerging markets? An analysis of diversi�ed Indian business groups",Journal of Finance 55 (2), 867-891Khanna, Tarun and Yishay Yafeh (2005) "Business groups and risk sharingaround the world", Journal of Business 78 (1), 301-340.
18

La Porta, Raael, Florencio Lopez-de-Silanes, Andrei Shleifer and RobertVishny (1999) "The Quality of Government", Journal of Law, Economicsand Organization 15, 222-279.La Porta, Raael, Florencio Lopez-de-Silanes, and Andrei Shleifer (2007) "TheEconomics Consequences of Legal Origin", working paper, Harvard Univer-sity.Laeven, Luc and Ross Levine (2007) "Is there a Diversi�cation Discount inFinancial Conglomerates?�, Journal of Financial Economics, forthcoming.Laeven, Luc and Christopher Woodru¤ (2007) �The Quality of the LegalSystem and Firm Size�, Review of Economics and Statistics, forthcoming.Lang, Larry H. P. and René M. Stulz (1994) "Tobin�s q, Corporate Diver-si�cation, and Firm Performance", Journal of Political Economy 102 (6),1248-1280.Levine, Ross (2005) "Law, Endowments, and Property Rights�, Journal ofEconomic Perspectives 19, 61-88.Lins, Karl and Henri Servaes (1999) "International Evidence on the Value ofCorporate Diversi�cation", Journal of Finance 54 (6), 2215-2239.Levine, Ross (2005) �Law, Endowments, and Property Rights�, Journal ofEconomic Perspectives 19 (3), 61-88.Ma, Ming (1995) Between the Government O¢ cials and Merchants. Tianjin,China: Tianjin People�s Press.Maksimovic, Vojislav and Gordon Phillips (2002) "Do Conglomerate FirmsAllocate Resources Ine¢ ciently across Industries? Theory and Evidence",Journal of Finance 57 (2), 721-767.Masters, William A. and Margaret S. McMillan (2001) "Climate and Scalein Economic Growth", Journal of Economic Growth 6, 167-186.Mauro, Paolo (1995) "Corruption and Growth", Quarterly Journal of Eco-nomics 110, 681-712.Pande, Rohini and Christopher Udry (2005) "Institutions and Development:A View from Below", Working paper, Yale University.Peng, Yuxin (1987) "A Short Review of China�s Modern History of Gov-ernment Finance", in Jian Sun ed. A Collection of Papers on the ChineseEconomic History, People�s University of China Press.Rajan, Raghuram, Henri Servaes, and Luigi Zingales (2000) "The Cost ofDiversity: Diversi�cation Discount and Ine¢ cient Investment", Journal ofFinance 55 (1), 35-80.Rodrik, Dani (2004) "Industrial Policy for the Twenty-First Century", work-ing paper, Harvard University.Scharfstein, David S. and Jeremy C. Stein (2000) "The Dark Side of Inter-nal Capital Markets: Divisional Rent-Seeking and Ine¢ cient Investment",Journal of Finance 55 (6), 2537-2564.
19

Servaes, Henri (1996) "The Value of Diversi�cation During the ConglomerateMerger Wave", Journal of Finance 51 (4), 1201-1225.Shleifer, Andrei and Robert Vishny (1989) �Managerial entrenchment: thecase of manager speci�c investments", Journal of Financial Economics 25(1), 123-139.Shleifer, Andrei and Robert Vishny (1994) "Politicians and Firms", QuarterlyJournal of Economics, 109(4): 995-1025.Svensson, Jakob (2003) "Who Must Pay Bribes and How Much? Evidencefrom a Cross-Section of Firms", Quarterly Journal of Economics 118, 207-230.Wu, Chengming (1981) "Overview of the Development of Capitalism inChina", Collection of Academic Papers on China Studies (ZHONGHUAXUESHU LUNWENJI), November.Wu, Jiang (1955) "Some Characteristics of China�s Capitalist Economic De-velopment", Journal of Economic Research (JINGJI YANJIU, a Chinesejournal), No. 5.Xu, Dixin and Chengming Wu (2003) History of the Development of Capi-talism in China, People�s Press, China.Young, Crawford (1994) The African Colonial State in Comparative Perspec-tive. Connecticut: Yale University Press.Zhang, Guohui (1982) "The Development of Capitalism in China Before theRevolution of 1911", Studies of Modern History (XIANDAISHI YANJIU, aChinese journal), No. 2.Zhu, Ying (2001) Merchants and Society in Modern China, Hubei EducationPress, China.
20

Figure 1: Property Rights Protection in 1999 and Merchants in 1912

Figure 2: Property Rights Protection in 1999 and Banks in 1937

23
TABLE 1: Property Rights and Firm Scope Descriptive Statistics
Variable Obs Mean Std. Dev. Min Max
Firm Scope 2798 0.447 0.733 0.000 3.000 Firm Scope1 2798 0.334 0.472 0.000 1.000 Property Rights 2033 0.000 1.296 -2.608 1.509 Education 2793 12.601 2.854 0.000 19.000 Age 2777 43.429 8.347 22.000 75.000 Managerial Experience 2795 4.279 7.272 0.000 61.000 CPC Membership 2798 0.158 0.365 0.000 1.000 CPPCC Membership 2798 0.407 0.491 0.000 1.000 Government Cadre 2798 0.075 0.264 0.000 1.000 SOE Cadre 2798 0.364 0.481 0.000 1.000 Firm Age 2535 1.652 0.714 0.000 3.045 External Finance 2607 2.237 1.096 1.000 5.000 Legal System 2798 0.103 0.304 0.000 1.000 Firm Performance 2458 1.856 1.267 -4.605 6.908 Size 2653 4.073 1.344 0.000 9.903
24
TABLE 2: Property Rights and Firm Scope Probit Regression Results (Firm-Level)
Dependent Variable is Firm Scope
1 2 3 4
Property Rights -0.096*** -0.096*** -0.084*** -0.082***
(0.022) (0.022) (0.023) (0.025)
Entrepreneur’s Characteristics
Education 0.050*** 0.047***
(0.012) (0.013)
Age -0.013*** -0.015***
(0.004) (0.004)
Managerial Experience 0.005 0.009*
(0.004) (0.005)
CPC Membership 0.082 0.087
(0.081) (0.087)
CPPCC Membership 0.224*** 0.198***
(0.061) (0.067)
Government Cadre 0.243** 0.217*
(0.112) (0.125)
SOE Cadre 0.200*** 0.226***
(0.066) (0.070)
Corporate Characteristics
Firm Age 0.017**
(0.008)
External Finance -0.021
(0.030)
Legal System 0.084
(0.101)
Industry Dummies No Yes Yes Yes
Number of Observation 2033 2033 2021 1752
Wald Chi2 19.21 138.69 203.73 175.45
Pseudo R2 0.0072 0.0561 0.0863 0.0838
The property rights index is the one perceived by individual firms.
Robust standard errors are reported in the parenthesis. *, **, *** represent
significance at 10%, 5%, and 1% level, respectively.
25
TABLE 3: Property Rights and Firm Scope Probit Regression Results (Region-Level)
Dependent Variable is Firm Scope
1 2 3 4
Property Rights -0.189*** -0.180*** -0.191*** -0.233***
(0.066) (0.068) (0.070) (0.076)
Entrepreneur’s Characteristics
Education 0.050*** 0.048***
(0.010) (0.011)
Age -0.011*** -0.015***
(0.003) (0.004)
Managerial Experience 0.008** 0.012***
(0.004) (0.004)
CPC Membership 0.149** 0.148**
(0.070) (0.075)
CPPCC Membership 0.253*** 0.228***
(0.052) (0.058)
Government Cadre 0.243** 0.236**
(0.098) (0.106)
SOE Cadre 0.121** 0.152**
(0.055) (0.060)
Corporate Characteristics
Firm Age 0.025***
(0.007)
External Finance 0.003
(0.025)
Legal System 0.130
(0.089)
Industry Dummies No Yes Yes Yes
Number of Observation 2798 2797 2771 2341
Wald Chi2 8.35 168.97 259.23 235.14
Pseudo R2 0.0023 0.0504 0.0799 0.0848
The property rights index is aggregated from responses of individual entrepreneurs in
the same region.
Robust standard errors are reported in the parenthesis. *, **, *** represent
significance at 10%, 5%, and 1% level, respectively.

26
TABLE 4: Property Rights and Firm Scope IV Regression Results (Firm-level)
1 2 3 4
Panel A: Dependent Variable is Firm Scope
Property Rights -0.704*** -0.682*** -0.657*** -0.760***
(0.046) (0.057) (0.070) (0.052)
Entrepreneur’s Characteristics
Education 0.025* 0.015
(0.013) (0.014)
Age -0.002 0.002
(0.004) (0.005)
Managerial Experience -0.004 -0.008
(0.004) (0.005)
CPC Membership -0.043 -0.150*
(0.073) (0.077)
CPPCC Membership 0.085 -0.040
(0.064) (0.069)
Government Cadre 0.095 0.033
(0.112) (0.112)
SOE Cadre 0.132** 0.109
(0.063) (0.068)
Corporate Characteristics
Firm Age 0.002
(0.008)
Finance 0.152***
(0.031)
Legal System 0.099
(0.081)
Panel B: Dependent Variable is Property Rights
Log_Merchant_1912 0.089*** 0.093*** 0.093*** 0.056**
(0.020) (0.021) (0.021) (0.022)
Entrepreneur’s Characteristics
Education -0.009 -0.006
(0.012) (0.012)
Age 0.011*** 0.012***
(0.004) (0.004)
Managerial Experience -0.011*** -0.015***
(0.004) (0.005)
CPC Membership -0.177** -0.265***
(0.077) (0.080)
CPPCC Membership -0.081 -0.158**
(0.059) (0.062)
27
Government Cadre -0.104 -0.084
(0.116) (0.120)
SOE Cadre 0.030 0.034
(0.064) (0.067)
Corporate Characteristics
Firm Age -0.006
(0.008)
External Finance 0.215***
(0.029)
Legal System 0.099
(0.096)
Industry Dummies No Yes Yes Yes
Number of Observation 2002 2002 1990 1727
Wald Chi2 232.72 793.23 878.47 .
Sigma 1.289 1.282 1.275 1.239
Rho 0.850 0.813 0.782 0.907
Wald test of exogeneity: Chi2 24.96 20.63 16.53 12.79
Wald test of exogeneity: Prob>Chi2 0.00 0.00 0.00 0.00
Panel B reports the first stage regression where the firm-level property rights index
is regressed on the IV --- logarithm of number of merchants in each region in 1912 and
other exogenous variables. Panel A reports the second stage regressions.
Robust standard errors are reported in the parenthesis. *, **, *** represent
significance at 10%, 5%, and 1% level, respectively.

28
TABLE 5: Property Rights and Firm Scope with another IV IV Regression Results (Firm-level)
1 2 3 4
Panel A: Dependent Variable is Firm Scope
Property Rights -0.541*** -0.515*** -0.453*** -0.486***
(0.082) (0.091) (0.115) (0.052)
Entrepreneur’s Characteristics
Education 0.040*** 0.037***
(0.013) (0.006)
Age -0.007 -0.008
(0.005) (0.006)
Managerial Experience -0.000 0.001
(0.005) (0.006)
CPC Membership 0.017 -0.023
(0.081) (0.096)
CPPCC Membership 0.153** 0.096
(0.067) (0.080)
Government Cadre 0.194* 0.165
(0.117) (0.123)
SOE Cadre 0.180*** 0.206***
(0.065) (0.070)
Corporate Characteristics
Firm Age 0.011
(0.008)
External Finance 0.068
(0.045)
Legal System 0.112
(0.094)
Panel B: Dependent Variable is Property Rights
Log_Bank_1937 0.152*** 0.152*** 0.146*** 0.123***
(0.023) (0.024) (0.024) (0.025)
Entrepreneur’s Characteristics
Education -0.008 -0.005
(0.012) (0.012)
Age 0.010*** 0.011***
(0.004) (0.004)
Managerial Experience -0.011*** -0.015***
(0.004) (0.005)
CPC Membership -0.129* -0.220***
(0.077) (0.081)

29
CPPCC Membership -0.089 -0.166**
(0.059) (0.062)
Government Cadre -0.049 -0.055
(0.116) (0.119)
SOE Cadre 0.053 0.071
(0.063) (0.066)
Corporate Characteristics
Firm Age -0.005
(0.008)
External Finance 0.200***
(0.029)
Legal System 0.073
(0.092)
Industry Dummies No Yes Yes Yes
Number of Observation 2019 2019 2007 1741
Wald Chi2 43.72 282.74 336.15 2146.98
Sigma 1.282 1.276 1.271 1.235
Rho 0.610 0.569 0.493 0.524
Wald test of exogeneity: Chi2 15.16 11.89 6.92 5.42
Wald test of exogeneity: Prob>Chi2 0.00 0.00 0.01 0.02
Panel B reports the first stage regression where the firm-level property rights index
is regressed on the IV --- logarithm of number of banks in each region in 1937 and other
exogenous variables. Panel A reports the second stage regressions.
Robust standard errors are reported in the parenthesis. *, **, *** represent
significance at 10%, 5%, and 1% level, respectively.

30
TABLE 6: Property Rights and Firm Scope IV Regression Results (Region-level)
1 2 3 4
Panel A: Dependent Variable is Firm Scope
Property Rights -1.115*** -1.104*** -1.023*** -1.146***
(0.172) (0.181) (0.193) (0.217)
Entrepreneur’s Characteristics
Education 0.047*** 0.045***
(0.010) (0.011)
Age -0.012*** -0.016***
(0.003) (0.004)
Managerial Experience 0.007** 0.011***
(0.004) (0.004)
CPC Membership 0.154** 0.143**
(0.067) (0.072)
CPPCC Membership 0.195*** 0.164***
(0.053) (0.059)
Government Cadre 0.273*** 0.269**
(0.100) (0.107)
SOE Cadre 0.125** 0.148**
(0.055) (0.060)
Corporate Characteristics
Firm Age 0.023***
(0.007)
External Finance 0.032
(0.026)
Legal System 0.155*
(0.086)
Panel B: Dependent Variable is Property Rights
Log_Merchant_1912 0.087*** 0.085*** 0.086*** 0.080***
(0.004) (0.007) (0.004) (0.005)
Entrepreneur’s Characteristics
Education 0.002 0.002
(0.003) (0.003)
Age -0.000 -0.001
(0.001) (0.001)
Managerial Experience -0.000 0.000
(0.001) (0.001)
CPC Membership 0.010 -0.000
(0.017) (0.017)
CPPCC Membership -0.028** -0.024
(0.013) (0.015)

31
Government Cadre 0.034 0.040
(0.023) (0.026)
SOE Cadre 0.015 0.015
(0.014) (0.015)
Corporate Characteristics
Firm Age 0.001
(0.002)
External Finance 0.022***
(0.007)
Legal System 0.034
(0.021)
Industry Dummies No Yes Yes Yes
Number of Observation 2740 2739 2713 2292
Wald Chi2 41.89 238.34 328.64 2358.93
Sigma 0.345 0.341 0.341 0.337
Rho 0.355 0.352 0.315 0.345
Wald test of exogeneity: Chi2 25.98 23.73 17.51 16.55
Wald test of exogeneity: Prob>Chi2 0.00 0.00 0.00 0.00
Panel B reports the first stage regression where the region-level property rights index
is regressed on the IV --- logarithm of number of merchants in each region in 1912 and
other exogenous variables. Panel A reports the second stage regressions.
Robust standard errors are reported in the parenthesis. *, **, *** represent
significance at 10%, 5%, and 1% level, respectively.

32
TABLE 7: Property Rights and Firm Scope with another IV IV Regression Results (Region-level)
1 2 3 4
Panel A: Dependent Variable is Firm Scope
Property Rights -0.752*** -0.743*** -0.631*** -0.622***
(0.139) (0.146) (0.151) (0.174)
Entrepreneur’s Characteristics
Education 0.050*** 0.048***
(0.010) (0.011)
Age -0.011*** -0.015***
(0.003) (0.004)
Managerial Experience 0.007** 0.011***
(0.004) (0.004)
CPC Membership 0.162** 0.162**
(0.069) (0.074)
CPPCC Membership 0.232*** 0.213***
(0.052) (0.058)
Government Cadre 0.258*** 0.249**
(0.098) (0.106)
SOE Cadre 0.116** 0.146**
(0.056) (0.060)
Corporate Characteristics
Firm Age 0.024***
(0.007)
External Finance 0.012
(0.026)
Legal System 0.144
(0.088)
Panel B: Dependent Variable is Property Rights
Log_Bank_1937 0.137*** 0.135*** 0.146*** 0.129***
(0.007) (0.007) (0.024) (0.007)
Entrepreneur’s Characteristics
Education 0.003 0.003
(0.003) (0.003)
Age -0.000 -0.001
(0.001) (0.001)
Managerial Experience 0.000 0.001
(0.001) (0.001)
CPC Membership 0.046*** 0.037**
(0.016) (0.017)
CPPCC Membership -0.013 -0.018
(0.013) (0.014)

33
Government Cadre 0.039* 0.037
(0.023) (0.025)
SOE Cadre 0.015 0.019
(0.013) (0.014)
Corporate Characteristics
Firm Age 0.003*
(0.002)
External Finance 0.019***
(0.006)
Legal System 0.036*
(0.019)
Industry Dummies No Yes Yes Yes
Number of Observation 2780 2779 2753 2328
Wald Chi2 29.11 199.55 282.62 2872.42
Sigma 0.329 0.324 0.323 0.321
Rho 0.223 0.221 0.170 0.147
Wald test of exogeneity: Chi2 17.71 16.05 9.16 5.42
Wald test of exogeneity: Prob>Chi2 0.00 0.00 0.01 0.02
Panel B reports the first stage regression where the region-level property rights index
is regressed on the IV --- logarithm of number of banks in each region in 1937 and other
exogenous variables. Panel A reports the second stage regressions.
Robust standard errors are reported in the parenthesis. *, **, *** represent
significance at 10%, 5%, and 1% level, respectively.

34
TABLE 8: Property Rights and Firm Scope Robustness Check (Alternative Measure of Firm Scope)
1 2 3 4 5 6 7 8
Firm-Level Region-Level
Ordered Probit 2SLS Ordered Probit 2SLS
Property Rights -0.106*** -0.093*** -0.106*** -0.093*** -0.154** -0.183*** -0.425*** -0.286***
(0.021) (0.021) (0.021) (0.021) (0.061) (0.070) (0.088) (0.100)
Entrepreneur’s Characteristics
Education 0.059*** 0.034*** 0.057*** 0.036***
(0.012) (0.007) (0.011) (0.006)
Age -0.017*** -0.007** -0.016*** -0.009***
(0.004) (0.003) (0.004) (0.002)
Managerial Experience 0.009** 0.001 0.011*** 0.006***
(0.004) (0.003) (0.004) (0.002)
CPC Membership 0.127 0.028 0.196*** 0.137***
(0.082) (0.063) (0.071) (0.045)
CPPCC Membership 0.178*** 0.048 0.217*** 0.110***
(0.062) (0.044) (0.054) (0.031)
Government Cadre 0.173 0.087 0.239** 0.164**
(0.113) (0.078) (0.097) (0.068)
SOE Cadre 0.206*** 0.110*** 0.158*** 0.082**
(0.065) (0.040) (0.056) (0.033)
Corporate Characteristics
Firm Age 0.020*** 0.008* 0.027*** 0.015***
(0.008) (0.005) (0.007) (0.004)

35
Finance -0.015 0.042 0.005 0.009
(0.027) (0.033) (0.023) (0.014)
Legal System 0.087 0.078 0.099 0.064
(0.096) (0.059) (0.081) (0.048)
Industry Dummies No Yes No Yes No Yes No Yes
Number of Observation 2033 1754 2019 1741 2798 2345 2780 2329
Wald Chi2 25.51 258.36 - 6.43 2652.96 - -
F-Test - - 41.86 8.92 - - 23.11 14.91
The dependent variable is FIRM SCOPE1 that takes values 0, 1, 2, and 3 when a firm has 1, 2, 3, and 4 businesses. Columns 1-4 employ firm-level
property rights index, while columns 5-8 the region-level one. Columns 1-2 and 5-6 conduct ordered probit estimation, while Columns 3-4 and 7-8
conduct IV estimation with the logarithm of number of merchants in China’s regions in 1912 as the IV.
Robust standard errors are reported in the parenthesis. *, **, *** represent significance at 10%, 5%, and 1% level, respectively.

36
TABLE 9: Property Rights and Firm Scope with another IV Robustness Check (Alternative Measure of Firm Scope)
1 2 3 4
Firm-Level Region-Level
2SLS 2SLS
Property Rights -0.760*** -0.941** -0.678*** -0.619***
(0.215) (0.429) (0.130) (0.151)
Entrepreneur’s Characteristics
Education 0.031** 0.038***
(0.013) (0.006)
Age 0.001 -0.010***
(0.007) (0.002)
Managerial Experience -0.009 0.007***
(0.008) (0.002)
CPC Membership -0.151 0.133***
(0.141) (0.046)
CPPCC Membership -0.066 0.089***
(0.099) (0.033)
Government Cadre 0.020 0.176**
(0.137) (0.072)
SOE Cadre 0.119* 0.087**
(0.070) (0.034)
Corporate Characteristics
Firm Age 0.005 0.015***
(0.009) (0.004)
Finance 0.194* 0.021
(0.102) (0.015)
Legal System 0.139 0.075
(0.105) (0.049)
Industry Dummies No Yes No Yes
Number of Observation 2002 1727 2740 2293
F-Test 12.56 3.63 27.14 14.75
The dependent variable is FIRM SCOPE1 that takes values 0, 1, 2, and 3 when a firm
has 1, 2, 3, and 4 businesses. Columns 1-2 employ firm-level property rights index,
while columns 3-4 the region-level one. The property rights index is instrumented by
the logarithm of number of banks in China’s regions in 1937.
Robust standard errors are reported in the parenthesis. *, **, *** represent
significance at 10%, 5%, and 1% level, respectively.

37
TABLE 10: Property Rights and Firm Scope Robustness Check (Alternative Measure of Property Rights Protection)
1 2 3 4 5 6
Probit Probit+IVa Probit+IVb
Property Rights (Fan-Wang-Zhu) -0.031* -0.038** -0.573*** -0.501*** -0.350*** -0.265***
(0.017) (0.019) (0.046) (0.065) (0.053) (0.068)
Entrepreneur’s Characteristics
Education 0.051*** 0.047*** 0.053***
(0.011) (0.010) (0.011)
Age -0.015*** -0.009** -0.012***
(0.004) (0.003) (0.003)
Managerial Experience 0.011*** 0.008** 0.010**
(0.004) (0.004) (0.004)
CPC Membership 0.146* -0.018 0.082
(0.075) (0.075) (0.077)
CPPCC Membership 0.222*** -0.001 0.135**
(0.058) (0.067) (0.063)
Government Cadre 0.241** 0.253*** 0.257**
(0.106) (0.096) (0.101)
SOE Cadre 0.170*** 0.271*** 0.227***
(0.060) (0.054) (0.060)
Corporate Characteristics
Firm Age 0.024*** 0.015** 0.022***
(0.007) (0.007) (0.007)
Finance -0.005 0.012 -0.001
(0.025) (0.023) (0.025)
Legal System 0.122 0.158* 0.155*

38
(0.089) (0.083) (0.088)
Industry Dummies No Yes No Yes No Yes
Number of Observation 2791 2335 2740 2289 2780 2325
Wald Chi2 3.37 226.04 151.96 544.15 43.16 276.37
Pseudo R2 0.0010 0.0824 - - - -
Wald Test of Exogeneity: Chi2 - - 32.73 22.21 27.26 10.01
Wald Test of Exogeneity: Prob>Chi2 - - 0.0000 0.0000 0.0000 0.0016
The property rights index is the subindex from the NERI China’s Marketization Process Indices constructed by Fan, Wang and Zhu (2003).
The dependent variable is the dummy variable FIRM SCOPE. Columns 1-2 carry out probit estimation, column 3-4 probit estimation with logarithm
of merchants in 1912 as IV, and columns 5-6 probit estimation with logarithm of banks in 1937 as IV.
Robust standard errors are reported in the parenthesis. *, **, *** represent significance at 10%, 5%, and 1% level, respectively. a: IV used is the logarithm of Merchants in 1912. b: IV used is the logarithm of Banks in 1937

39
TABLE 11: Property Rights and Firm Scope Robustness Check (Alternative Measure of Property Rights Protection and Alternative Measure of Firm Scope)
1 2 3 4 5 6
Ordered Probit 2SLSa 2SLSb
Property Rights (Fan-Wang-Zhu) -0.035** -0.041** -0.542*** -0.348*** -0.220*** -0.131***
(0.016) (0.018) (0.128) (0.093) (0.046) (0.045)
Entrepreneur’s Characteristics
Education 0.060*** 0.045*** 0.039***
(0.011) (0.007) (0.006)
Age -0.016*** -0.007*** -0.008***
(0.004) (0.002) (0.002)
Managerial Experience 0.011*** 0.007*** 0.006***
(0.004) (0.003) (0.002)
CPC Membership 0.197*** 0.047 0.103**
(0.072) (0.058) (0.048)
CPPCC Membership 0.209*** 0.001 0.077**
(0.054) (0.050) (0.035)
Government Cadre 0.245** 0.205*** 0.173**
(0.097) (0.078) (0.068)
SOE Cadre 0.173*** 0.195*** 0.126***
(0.056) (0.046) (0.035)
Corporate Characteristics
Firm Age 0.026*** 0.013*** 0.014***
(0.007) (0.005) (0.004)
Finance -0.003 0.012 0.003
(0.023) (0.016) (0.014)

40
Legal System 0.097 0.099* 0.072
(0.081) (0.059) (0.049)
Industry Dummies No Yes No Yes No Yes
Number of Observation 2791 2339 2740 2293 2780 2329
Wald Chi2 4.72 3638.38 - - - -
Pseudo R2 0.0010 0.0732 - - - -
F-Test - - 17.86 11.36 23.16 14.88
The property rights index is the subindex from the NERI China’s Marketization Process Indices constructed by Fan, Wang and Zhu (2004).
The dependent variable is FIRM SCOPE1 that takes values 0, 1, 2, and 3 when a firm has 1, 2, 3, and 4 businesses. Columns 1-2 carry out ordered
probit estimation, column 3-4 ordered probit estimation with logarithm of merchants in 1912 as IV, and columns 5-6 ordered probit estimation
with logarithm of banks in 1937 as IV.
Robust standard errors are reported in the parenthesis. *, **, *** represent significance at 10%, 5%, and 1% level, respectively. a: IV used is the logarithm of Merchants in 1912. b: IV used is the logarithm of Banks in 1937

41
TABLE 12: Property Rights, Firm Scope and Performance Dependent Variable is Log_Output_per_Worker
Firm-Level Region-Level
1 2 3 4 5 6 7 8
Firm Scope 0.110** 0.066 0.170*** 0.157*** 0.058 0.127** 0.112** 0.052
(0.054) (0.057) (0.060) (0.060) (0.064) (0.054) (0.053) (0.057)
Property Rights 0.047** 0.106*** 0.060** 0.344*** 0.507*** 0.406***
(0.023) (0.028) (0.030) (0.069) (0.084) (0.095)
Firm Scope * Property Rights -0.177*** -0.142*** -0.522*** -0.621***
(0.046) (0.047) (0.147) (0.149)
Entrepreneur’s Characteristics
Education 0.074*** 0.088*** 0.074***
(0.011) (0.012) (0.011)
Age -0.007** -0.007* -0.007**
(0.003) (0.004) (0.003)
Managerial Experience 0.003 0.003 0.003
(0.004) (0.005) (0.004)
CPC Membership 0.158** 0.147* 0.132*
(0.071) (0.077) (0.071)
CPPCC Membership 0.154*** 0.140** 0.154***
(0.056) (0.064) (0.056)
Government Cadre 0.134 0.091 0.131
(0.108) (0.124) (0.107)
SOE Cadre 0.175*** 0.154** 0.183***

42
(0.059) (0.066) (0.059)
Corporate Characteristics
Firm Size -0.111*** -0.117*** -0.111***
(0.025) (0.028) (0.025)
Firm Age -0.001 0.004 -0.001
(0.007) (0.008) (0.007)
Finance 0.173*** 0.179*** 0.165***
(0.025) (0.028) (0.025)
Legal System 0.218** 0.182* 0.214**
(0.091) (0.099) (0.092)
Regional Characteristics
Market Potential 0.365*** 0.352*** 0.315***
(0.057) (0.065) (0.060)
Transportation Costs -0.062 -0.091* -0.059
(0.045) (0.052) (0.045)
Number of Observation 2458 2099 1870 1870 1630 2458 2458 2099
R-squared 0.0017 0.0915 0.0059 0.0134 0.1063 0.0112 0.0159 0.1011
The dependent variable is logarithm of output per worker. Columns 3-5 employ the firm-level property rights index, and Columns 6-8 use the
region-level property rights index. Models are estimated by OLS.
Robust standard errors are reported in the parenthesis. *, **,*** represent significance at 10%, 5%, and 1% level, respectively.

43
APPENDIX The number of merchants in China’s regions in 1912 comes from the second national statistical survey on farmers, workers, and merchants conducted by the Republic of China (Ma, 1995, p. 107).
However, compared to the situations in the early 1990s, a few changes have taken place in the classification of administrative districts in China. Specifically, in 1912, Shanghai was included in the Jiangsu Province, Tianjin was included in the Hebei Province, Chongqing was included in the Sichuan Province, Gansu and Qinghai were included in the Ningxia Province, while data from Inner Mongolia was missing. We adjust the distribution of merchants in 1912 according to the current classification of the administrative regions. To do this, we first compiled the data from these regions (i.e., Shanghai, Tianjin, Chongqing, Gansu, Qinghai, Ningxia, and Inner Mongolia) from other resources:
Shanghai: Zhang, Yapei, Records of Business Administration Association in Shanghai, Shanghai, China: Shanghai Academy of Social Science Press,
2001, p. 227 Tianjin: Tianjin Chorography: Business Administration Volume, ed. by Tianjin chorography committee and Tianjin Business Administrative Bureau, Tianjin, China: Tianjin Academy of Social Science Press, 2001, p. 45. Chongqing: Chen Yintao, Modern Urban History of Chongqing, Chengdu, China: Sichuan University Press, 1991, p. 415. Gansu: Gansu Chorography: Business Administration Volume, ed. by Gansu chorography committee and Gansu Business Administrative Bureau, Gansu, China: Tianjin People’s Press, 1991, p. 23. Qinghai: Cui, Yonghong, Dezhu Zhang, and Changshun Du, Qinghai Chorography, Qinghai, China: Qinghai People’s Press, 1999, p. 678 Ningxia: Hu, Shuping, Ningxia in Republic of China 1929-1949, Taiwan: Taiwan Student Press, 1987, p. 256
Inner Mongolia: Inner Mongolia Chorography: Business Volume, ed. by Inner Mongolia Chorography Committee, Inner Mongolia, China: Inner Mongolia People’s Press, 1998, p. 421
We then excluded the number of merchants in these regions from the number in their upper administrative districts to get the final number of these upper
administrative districts.
The number of banks in China’s regions in 1937 comes from China Bank Yearbook 1936-1937. Still the classification of administrative districts in China at that time was different from that in contemporary China. However, the China Bank Yearbook 1936-1937 has details of the distribution of banks in cities within each region at that time. This enables us to easily construct the distribution of banks in 1937 based on the current classification of administrative districts.


