Embed Size (px)
Citation preview

This article was downloaded by: [79.133.239.8]On: 29 October 2014, At: 22:36Publisher: RoutledgeInforma Ltd Registered in England and Wales Registered Number: 1072954 Registeredoffice: Mortimer House, 37-41 Mortimer Street, London W1T 3JH, UK
Economic Research-EkonomskaIstraživanjaPublication details, including instructions for authors andsubscription information:http://www.tandfonline.com/loi/rero20
Proposing a new methodology forprioritising the investment strategies inthe private sector of IranAbdolreza Yazdani-Chamzinia, Shahram Shariatib, Siamak HajiYakhchalic & Edmundas Kazimieras Zavadskasd
a Young Researchers and Elite Club, South Tehran Branch, IslamicAzad University, Tehran, Iranb Department of Geology, Islamic Azad University, Sari Branch,Sari, Iranc Department of Industrial Engineering, College of Engineering,University of Tehran, Tehran, Irand Faculty of Civil Engineering, Vilnius Gediminas TechnicalUniversity, Vilnius, LithuaniaPublished online: 25 Sep 2014.
To cite this article: Abdolreza Yazdani-Chamzini, Shahram Shariati, Siamak Haji Yakhchali &Edmundas Kazimieras Zavadskas (2014) Proposing a new methodology for prioritising the investmentstrategies in the private sector of Iran, Economic Research-Ekonomska Istraživanja, 27:1, 320-345,DOI: 10.1080/1331677X.2014.947150
To link to this article: http://dx.doi.org/10.1080/1331677X.2014.947150
PLEASE SCROLL DOWN FOR ARTICLE
Taylor & Francis makes every effort to ensure the accuracy of all the information (the“Content”) contained in the publications on our platform. Taylor & Francis, our agents,and our licensors make no representations or warranties whatsoever as to the accuracy,completeness, or suitability for any purpose of the Content. Versions of publishedTaylor & Francis and Routledge Open articles and Taylor & Francis and Routledge OpenSelect articles posted to institutional or subject repositories or any other third-partywebsite are without warranty from Taylor & Francis of any kind, either expressedor implied, including, but not limited to, warranties of merchantability, fitness for aparticular purpose, or non-infringement. Any opinions and views expressed in this articleare the opinions and views of the authors, and are not the views of or endorsed byTaylor & Francis. The accuracy of the Content should not be relied upon and should be

independently verified with primary sources of information. Taylor & Francis shall not beliable for any losses, actions, claims, proceedings, demands, costs, expenses, damages,and other liabilities whatsoever or howsoever caused arising directly or indirectly inconnection with, in relation to or arising out of the use of the Content. This article may be used for research, teaching, and private study purposes. Terms &Conditions of access and use can be found at http://www.tandfonline.com/page/terms-and-conditions It is essential that you check the license status of any given Open and OpenSelect article to confirm conditions of access and use.
Dow
nloa
ded
by [
79.1
33.2
39.8
] at
22:
36 2
9 O
ctob
er 2
014

Proposing a new methodology for prioritising the investmentstrategies in the private sector of Iran
Abdolreza Yazdani-Chamzinia, Shahram Shariatib, Siamak Haji Yakhchalic andEdmundas Kazimieras Zavadskasd*
aYoung Researchers and Elite Club, South Tehran Branch, Islamic Azad University, Tehran, Iran;bDepartment of Geology, Islamic Azad University, Sari Branch, Sari, Iran; cDepartment ofIndustrial Engineering, College of Engineering, University of Tehran, Tehran, Iran; dFaculty ofCivil Engineering, Vilnius Gediminas Technical University, Vilnius, Lithuania
(Received 23 October 2013; accepted 6 March 2014)
This article proposes a systematic and organised approach for group decision-mak-ing in the presence of the uncertainty involved in expert judgments as used inmulti-criteria decision-making (MCDM) issues. This procedure comprises the selec-tion of the optimum alternative with respect to the evaluation criteria under consid-eration, in particular to select the strategy of investing. However, the selection ofthe investment strategy is difficult on account of considering the numerous quanti-tative and qualitative parameters like benefits, opportunities, costs, and risks. How-ever, it is possible that these parameters have a significant influence on each other.A decision-making trial and evaluation laboratory (DEMATEL), used to define theinfluential network of elements, can be employed to construct a network relation-ship map (NRM). On the other hand, according to whether the information isincomplete or unavailable, uncertainty is an inseparable part of making decision forsolving the MCDM problems. Therefore, this article proposes a new hybrid modelbased on analytic hierarchical process (AHP), DEMATEL, and Technique for Orderof Preference by Similarity to Ideal Solution (TOPSIS) techniques under fuzzyenvironment to evaluate the problem of the selection of the investment strategy. Toachieve the aim, a three-step process is presented to solve a sophisticated problem.First, the AHP method is employed to break down the investment problem intosimple structure and calculate the importance weights of criteria by using a pair-wise comparison process. Second, the DEMATEL technique is applied for consider-ing interdependence and dependencies and computing the global weights of benefit,opportunities, cost, and risk (BOCR) factors. Finally, the fuzzy TOPSIS methodol-ogy is used for prioritising the possible alternatives. To demonstrate the potentialapplication of the proposed model, a numerical example is illustrated and investi-gated. The results show that the proposed model has a high ability to prioritise thestrategies of investing.
Keywords: investment strategy; multi-criteria decision-making (MCDM); decision-making trial and evaluation laboratory (DEMATEL); fuzzy logic; technique for orderof preference by similarity to ideal solution (TOPSIS)
JEL classification: O16, C44, C51, D81
*Email: [email protected]
© 2014 The Author(s). Published by Routledge.This is an Open Access article distributed under the terms of the Creative Commons Attribution License http://creativecommons.org/licenses/by/3.0/, which permits unrestricted use, distribution, and reproduction in any medium, provided the originalwork is properly cited. The moral rights of the named author(s) have been asserted.
Economic Research-Ekonomska Istraživanja, 2014Vol. 27, No. 1, 320–345, http://dx.doi.org/10.1080/1331677X.2014.947150
Dow
nloa
ded
by [
79.1
33.2
39.8
] at
22:
36 2
9 O
ctob
er 2
014

1. Introduction
The increasing process of globalisation and the changing market are the main factorsdetermining the importance of effective development, management and purchasing ofcommercial property as well as investment activities associated with these objects(Zavadskas Ustinovichius & Stasiulionis, 2004). In the last few decades, coinciding witha widespread move to globalisation and market-oriented strategies, a large number ofcountries provided comprehensive programmes to make a reliable environment for pri-vate investment. A clear consensus seems to have emerged on the positive effect ofaggregate investment (public and private) on economic growth, both in developing anddeveloped economies (Munthali, 2012).
A study conducted by the World Bank shows significant differences in the shares ofprivate and public investment in national outputs of high, medium and low-incomecountries (World Bank, 2006). This study shows that there is a positive correlationbetween growth of national incomes and private investment ratios (Munthali, 2012).Beyond this, the various studies of cross-country equations show that private investmenthas a higher positive effect on economic growth in comparison with public investment(Erden, 2002). Therefore, according to the critical role of private investment, governorsfacilitate the flow of private capital by producing a climate of constancy and certaintyfor investment and business activity.
According to the key importance of investing, different models are developed to pro-vide investors with enough information for making investment decisions. These methodscan be grouped into two main classes including real options and traditional valuationmethods. However, the traditional valuation models employing discounted cash flows(DCF) do not take into account some of the intrinsic attributes of the asset or investmentopportunity (Mun, 2002). Based on the basic concepts of the DCF models, the expectedvalue of cash flows comprises the unknown future cash flows (Uçal & Kahraman, 2009).These models use a discounting process based on the opportunity cost of capital to transferthe equity of an investment into a present value. However, the DCF techniques cannotproperly handle the operating flexibility and strategic value aspects of various investmentson account of their discretionary asymmetric nature and their dependence on future eventsthat are uncertain at the time of the initial decision (Trigeorgis, 1996).
On the other hand, real options have a number of shortcomings. The main disadvan-tages of real options is its reliance on quantitative data and on the existence of a portfo-lio capable of replicating the cash flows associated with a given strategic decision,which can be very difficult to compute1. Likewise, this technique is less of a standardto guide future operations and the assumptions may be hidden, preventing managementfrom effectively evaluating the assumption (Pengfei & Yimin, 2000).
However, the process of the investment strategy selection comprises an exhaustiveanalysis of different aspects of the parameters influencing the investment. This process,a challenging decision-making problem, is a critical and key procedure for the investorsto obtain helpful knowledge on the resources of the investment to select the optimumresource of investment because they continually follow maximum benefit and minimumcost. Beyond the points mentioned, investors who can expand their imaginations to seea wider range of possible futures will be much better positioned to take advantage ofthe unexpected opportunities that will come along.
Moreover, investment decisions are complex and not taken as frequently as otherdecisions, precluding the formation of rules-of-thumb (Azzoni & Kalatzis, 2010); so thatinvestors are always faced with a sophisticated problem and they should select the most
Economic Research-Ekonomska Istraživanja 321
Dow
nloa
ded
by [
79.1
33.2
39.8
] at
22:
36 2
9 O
ctob
er 2
014

appropriate option for investment among a pool of alternatives. On the other hand, themulti-criteria decision-making (MCDM) techniques are capable of modelling complexand sophisticated systems.
Technique for order of preference by similarity to ideal dolution (TOPSIS), one of themost popular methods of the MCDM techniques, is capable of prioritising alternativeswith respect to the criteria under consideration. This technique is recently employed bydifferent research to model the MCDM problems (Azimi, Yazdani-Chamzini, Fouladgar,Zavadskas, & Basiri, 2011; Balezentis, Balezentis, & Misiunas, 2012; Ghorabi & Attari,2013; Kalibatas, Zavadskas, & Kalibatiene, 2011; Ramezani, Bashiri, & Atkinson, 2011;Sadeghzadeh & Salehi, 2011; Staniūnas, Medineckienė, Zavadskas, & Kalibatas, 2013;Zolfani & Antucheviciene, 2012; Zolfani, Rezaeiniya, & Saparauskas, 2012). This tech-nique is widely applied by a large number of studies for the following reasons (Dadelo,Turskis, Zavadskas, & Dadeliene, 2013; Ginevičius, Podvezko, Novotny, & Komka,2012; Lashgari, Fouladgar, Yazdani-Chamzini, & Skibniewski, 2011; Palevicius, Paliulis,Venckauskaite, & Vengrys, 2013; Simanaviciene, Liaudanskiene, & Ustinovichius 2012;Tamosaitiene, Sipalis, Banaitis, & Gaudutis, 2013; Streimikiene & Balezentiene, 2012;Streimikiene, 2013; Yazdani-Chamzini & Yakhchali, 2012; Yazdani-Chamzini, Fouladgar,Zavadskas, & Haji Moini, 2013; Zavadskas, Turskis, Volvaciovas, & Kildiene 2013;Zavadskas, Susinskas, Daniunas, Turskis, & Sivilevicius, 2012): (1) TOPSIS logic isrational and understandable; (2) the computation processes are straightforward; and (3)the concept permits the pursuit of best alternatives for each criterion depicted in a simplemathematical form.
As previously mentioned, the investment problems are sophisticated and require suf-ficient amounts of information to find the solution to the problem. A problem associatedwith this type of evaluation is that it is difficult to specify exact numerical estimates,especially when criteria are qualitative (Sotirov & Krasteva, 1994). In many situations,this information may be immeasurable and ill-defined that leads to the necessity ofusing expert judgments. In order to reflect the qualitative character of the information,the data are linguistically expressed. Much of the theoretical work on uncertainty andinvestment has been developed in the framework of risk-neutrality (Okoli et al., 2007).Therefore, it is necessary to develop new models to accurately prioritise and select thestrategies of the private investment. Fuzzy logic is a powerful tool to handle the inher-ent uncertainty and complexity involved in real world problems. The combination offuzzy logic and TOPSIS, called fuzzy TOPSIS, can take into account all aspects of adecision-making problem and can improve the results of the decision analysis(Büyüközkan & Çifçi, 2012).
However, the main weakness of the fuzzy TOPSIS technique is to assume that thecriteria are independence. Whereas, the evaluation criteria are usually interdependenceand indirect. Therefore, using the robust techniques taking into account the mutual rela-tionships between criteria can be useful and the results will be more accurate. The Deci-sion-Making Trial and Evaluation Laboratory (DEMATEL), a robust technique informulating the sophisticated structures, can model the interdependence relations withina set of criteria under consideration. This method can provide a visual structural modelby converting the relationships between cause and effect of the evaluation criteria(Gabus & Fontela, 1972, 1973; Fontela & Gabus, 1976). This helps authorities to for-mulate the complex relationship into weights of relationship.
On the other hand, in the case of complex problems, it is usually better to use opin-ions of a group of experts because it is difficult for a single person to possess knowl-edge and experience in all details of the problem (Sotirov & Krasteva, 1994).
322 A. Yazdani-Chamzini et al.
Dow
nloa
ded
by [
79.1
33.2
39.8
] at
22:
36 2
9 O
ctob
er 2
014

Analytic hierarchy process (AHP) is an appropriate technique for calculating theimportance weights of the criteria. This technique is widely applied by differentresearchers to analyse a wide spectrum of engineering and management problems. Themain reasons for using an AHP-based decision analysis approach are (Fouladgar,Yazdani-Chamzini, Zavadskas, Yakhchali, & Ghasempourabadi, 2012d): (1) AHP canmeasure all tangible and intangible criteria in the model; (2) AHP is a relatively simple,intuitive approach that can be accepted by managers and other decision-makers; (3)AHP allows for more complex relationship among the decision levels and attributes bydeconstructing the problem into a hierarchical structure; and (4) AHP employs atwo-by-two comparison process to conveniently model a complex problem.
On the other hand, solving a sophisticated problem in the framework of benefit, oppor-tunity, cost, and risk (BOCR) factors is a structured and organised methodology that hasbeen successfully employed in many different fields (Bobylev, 2011; Chen, Lee, & Kang,2010; Yazgan, Boran, & Goztepe, 2010; Lee, Chen, & Kang, 2011). However, taking intoaccount the aspects of the BOCR of an alternative, including the positive and negative cri-teria all together, helps decision-makers to fulfil a more comprehensive way in real worldproblems (Fouladgar, Yazdani-Chamzini, Zavadskas, & Haji Moini, 2012a).
Since the AHP, DEMATEL, and fuzzy TOPSIS techniques have a large number ofadvantages, this study applies a robust model based on an integrated AHP, DEMATEL,and fuzzy TOPSIS methodology to help authorities to model the complex and multi-criteria problems in order to make an appropriate decision with regard to the evaluationcriteria under consideration. Therefore, there are four main advantages to propose thismethodology: (1) all types of the relationships including interdependence and indepen-dence among criteria can be taken into account and the problem of ranking is com-pletely logical; (2) the process applied for modelling the problem is simple andstraightforward; (3) the proposed model employs an easy mathematical form instead ofthe conventional complex forms like analytic network process (ANP) to solve the prob-lem of decision-making; and (4) the interdependence relationship weights are incorpo-rated into the comparison processes.
The main aim of this article is to propose a new integrated approach based on AHP,DEMATEL, and TOPSIS under fuzzy environment to provide a powerful framework forprioritising the investment strategies in the private sector of Iran. The proposedapproach incorporates mutual relationship into decision-making process. This techniquecan help authorities to accurately make decisions. To validate the proposed model, a realcase study is illustrated and the conclusions derived from the model are illustrated.
The article is organised as follows. Section 2 presents a brief overview of the AHPmethodology. Section 3 explains the process of modelling the DEMATEL technique.Section 4 explains the basic concepts of fuzzy logic and goes one step beyond andexamines the steps of the TOPSIS technique under fuzzy environment. The proposedmodel is clearly presented in section 5. An application of the proposed model is illus-trated in section 6. Finally, conclusions are discussed in the last section.
2. Analytic hierarchy process
AHP, first introduced by Saaty (1980), is an effective and robust technique to model thesophisticated decision problems. This method solves a complex problem by deconstructingit into several simple sub-problems by using the hierarchical levels, in which the goal issituated in the top level, the second and third levels contain of main and sub-criteria,respectively, the feasible alternatives are located in the last level. The AHP method is a
Economic Research-Ekonomska Istraživanja 323
Dow
nloa
ded
by [
79.1
33.2
39.8
] at
22:
36 2
9 O
ctob
er 2
014

multi-criteria method of analysis based on an additive weighting process, in which severalrelevant attributes are represented through their relative importance (Chou, Sun, & Yen,2012). This technique uses a process of pair-wise comparisons to obtain the relativeimportance of the attributes, in which the importance of the attributes is acquired by a two-by-two comparison that are quantified using 1–9 scales given in Table 1. Three principalconcepts of the AHP method are (Lashgari, Yazdani–Chamzini, Fouladgar, Zavadskas,Shafiee, & Abbate, 2012): (1) defining the analytical hierarchy process; (2) determiningpriorities; and (3) the logical consistency of the assumptions.
The inconsistency rate of the AHP model is determined by adopting the followingsteps:
Step 1: The weighted sum vector (WSV ) should be analysed by multiplying a pairedcomparison matrix by the relative weight vector:
WSV ¼ D�W (1)
Step 2: The Consistency Vector (CV ) should be analysed by dividing the elementsof the WSV by the relative weights vector.
Step 3: Determining the maximum eigenvector of pair-wise comparison matrixðkmaxÞ.For achieving this aim, it is needed to determine the average of the CV factors.
Step 4: Determining the second Inconsistency Index (II) using following equation:
II ¼ kmax � n
n� 1(2)
where n is the number of comparisons.Step 5: Determining the consistency rate (CR) from the following equation:
IR ¼ II
RCI(3)
RCI is a random consistency index which is derived from Table 2. This table is basedon the simulations that Saaty (1980) provided with the average consistencies (RCIval-ues) of randomly generated matrices (up to size 11 × 11) for a sample size of 500.
When the consistency rate is smaller or equal to 0.1, pair-wise comparisons are con-sistent and the process can be continued; otherwise, the decision-maker should recon-sider pair-wise comparisons.
3. Decision-Making Trial and Evaluation Laboratory
The DEMATEL technique was first developed by Gabus and Fontela (1972) to formu-late the interdependent relationships among the evaluation criteria and the strength of
Table 1. Pair-wise comparison scale and example (Saaty, 1980).
Intensity Definition
1 Equal importance3 Moderate importance of one over another5 Essential or strong importance7 Very strong importance9 Extreme importance2, 4, 6, 8 Intermediate valuesReciprocals Reciprocals for inverse comparison.
Source: Author’s calculations.
324 A. Yazdani-Chamzini et al.
Dow
nloa
ded
by [
79.1
33.2
39.8
] at
22:
36 2
9 O
ctob
er 2
014

interdependence. Visualising the structure of complicated causal relationships withmatrices or digraphs is useful and valuable for decision-makers (Tseng, 2011). Thesedigraphs or matrices depict the relations among the elements of the decision matrixthrough a number representing the strength of influence.
According to the unique capabilities of the DEMATEL method, it has been widelyemployed in a spread spectrum of applications like e-learning (Tzeng, Chiang, & Li,2007), knowledge management (Wu, 2008), service quality (Tseng, 2009), portfolioselection (Ho, Tsai, Tzeng, & Fang, 2011), model development (Tsai & Hsu, 2010),web-advertising (Wei, Huang, Tzeng, & Wu, 2010), risk evaluation (Chang & Cheng,2011; Yang, Shieh, & Tzeng, 2013), manufacturing & logistics systems (Tzeng &Huang, 2012), intersection safety factors (Zhou, Sun, Li, & Yang, 2013), and urbanregeneration project (Liao, Ye, Fu, & Ma, 2012). The merit of using the DEMATELtechnique is to model a system including a set of criteria C ¼ fC1;C2; . . .;Cngand thecertain relations by a mathematical formula. The DEMATEL technique can be definedas follows:
Step 1: Determine the direct-influence matrix by scores. The evaluator team isrequired to indicate the degree of direct influence that factor i will have on factor j asindicated byaij. It is supposed that the comparison scales, 0, 1, 2, 3 and 4, stand for fivelevels including no influence, very low influence, low influence, medium influence, highinfluence, and very high influence, respectively. From any group of direct matrices ofevaluators, an average matrix A ¼ ½aij�n�ncan be derived, in which each element beingthe mean of the same elements in the various direct matrices of the evaluators (Hsu,Wang, & Tzeng, 2012). The average matrix A for all expert opinions by averaging theH experts’ scores can be computed as follows:
A:aij ¼ 1
H
XHk¼1
xkij (4)
Therefore, an initial direct-influence matrix is resulted from the result of this compari-son. The initial direct-influence matrix A is an n� n matrix, where aijis denoted as thedegree to which the ith criterion affects the jth criterion. The average matrix A is shownby the following equation:
A ¼ ½
a11 � � � a1j � � � a1n... ..
. ...
ai1 � � � aij � � � ain... ..
. ...
an1 � � � anj � � � ann
� (5)
Step 2: Calculate the normalised direct-influence matrixS. The normalised direct-influence matrix is obtained by standardising the matrixA through Equations (6) and (7):
S ¼ m � A (6)
Table 2. Random consistency index table.
n 1 2 3 4 5 6 7 8 9 10
RCI 1.51 1.45 1.41 1.32 1.24 1.12 0.9 0.58 0 0
Source: Author’s calculations.
Economic Research-Ekonomska Istraživanja 325
Dow
nloa
ded
by [
79.1
33.2
39.8
] at
22:
36 2
9 O
ctob
er 2
014

m ¼ min1
maxi
Pnj¼1 jaijj
;1
maxj
Pni¼1 jaijj
24
35 (7)
Step 3: Measure the total-influence matrix T . After calculating the normalised direct-influence matrix, The network relationship map (NRM) can be obtained by using Equa-tion (8), in which I denotes the identity matrix; i.e. a continuous decrease of the indirecteffects of problems along the powers ofX , e.g. X 2;X 3; � � � ;Xqand lim
q!1X q ¼ ½0�n�n,
where X ¼ ½xij�n�n, 0 6 xij 6 1, 0\Pn
j¼1 xij 6 1and 0\Pn
i¼1 xij 6 1. If at least one
row or column of summation is equal to 1, but not all, then limq!1Xq ¼ ½0�n�n(Hung,
Chou, & Tzeng, 2011). The total-influence matrix can be defined as presented in thefollowing formula:
T ¼ X þ X 2 þ � � � þ Xq ¼ X ðI þ X þ X 2 þ � � � þ X q�1ÞðI � X ÞðI � X Þ�1
¼ X ðI � X qÞðI � X Þ�1 (8)
when q ! 1, Xq ¼ ½0�n�n, then
ðT ¼ X ðI � X Þ�1Þwhere T ¼ ½tij�n�n, i; j ¼ 1; 2; � � � ; n:
Step 4: Compute the values of influence and relation. In this step, the NRM is con-structed based on the vectors r and s representing the sums of rows and columns respec-tively. These vectors are described as Equations (9) and (10).
r ¼ ½ri�n�1 ¼Xnj¼1
tij
" #n�1
(9)
s ¼ ½sj�n�1 ¼Xni¼1
tij
" #0
1�n
(10)
where ridenote the sum of the ith row and the sum of the jth column in matrix T ,respectively. ri displays the sum of direct and indirect effects of criterion jon anothercriteria. As well as, %ri þ sii effects that criterion j has received from another criteria.Levels of influence on others and the strength of the central role that factor ri þ si playsin the problem are calculated with the help of the values of and. If is positive, it showsthat other factors are influenced by factor ri � si(Ho, Tsai, Tzeng, & Fang, 2011). Viceversa, if ri � si is negative, factor is influenced by other factors. The value of indicatesthe strength of the central role; so that, the criteria having higher values of have strongerrelationships with other criteria, while those having lower values of ri þ si have less ofa relationship with others (Tsai, Chou, & Lai, 2010). Therefore, the NRM can be estab-lished and a causal graph can be obtained by mapping the data-set. This helps authori-ties to make a decision more correctly, surely, and reliably.
4. Fuzzy TOPSIS
4.1. Fuzzy set theory
Fuzzy set theory was developed by Zadeh (1965) to take into account the inherentuncertainty and complexity involved in process of modelling a real world problem.
326 A. Yazdani-Chamzini et al.
Dow
nloa
ded
by [
79.1
33.2
39.8
] at
22:
36 2
9 O
ctob
er 2
014

Fuzzy theory enables decision-makers to simply formulate a sophisticated problem byusing the linguistic terms instead of precise and strict values. Fuzzy sets are defined bymembership function, which shows the grade of belongings to the set under consider-ation. If an element x fully belongs to a set, lAðxÞ ¼ 1, and if an element x does notbelong to the set under consideration, lAðxÞ ¼ 0 (Yazdani-Chamzini & Yakhchali,2012). The higher is the membership value, the greater is the belongingness of an ele-mentxto the set A.
A fuzzy number ~Acan be shown as ~A ¼ ða; b; cÞ that ~A is defined as a triangularfuzzy number (TFN). Where a, b, and c are crisp numbers and a > b > c, so that; aand c represent fuzzy probabilities between the lower and upper boundaries of evalua-tion information.
If assume two TFNs ~A ¼ ða1; b1; c1Þ; ~B ¼ ða2; b2; c2Þ:then mathematical operationscan be defined as given in the following:
~A� ~B ¼ ða1; b1; c1Þ � ða2; b2; c2Þ ¼ ða1 þ a2; b1 þ b2; c1 þ c2 (11)
~A� ~B ¼ ða1; b1; c1Þ � ða2; b2; c2Þ¼ ða1a2; b1b2; c1c2Þ for a1; a2 [ 0; b1; b2 [ 0; c1; c2 [ 0 (12)
~A� ~B ¼ ða1; b1; c1Þ � ða2; b2; c2Þ ¼ ða1 � c2; b1 � b2; c1 � a2 (13)
~A� ~B ¼ ða1; b1; c1Þ � ða2; b2; c2Þ ¼ ða1=c2; b1=b2; c1=a2Þ (14)
~A�1 ¼ ða1; b1; c1Þ�1 ¼ ð1=c1; 1=b1; 1=a1Þ for a1 [ 0; b1 [ 0; c1 [ 0 (15)
The vertex method to calculate the distance between ~A; ~B is defined as follows:
dð~A; ~BÞ ¼ffiffiffiffiffiffiffiffiffiffiffiffiffiffiffiffiffiffiffiffiffiffiffiffiffiffiffiffiffiffiffiffiffiffiffiffiffiffiffiffiffiffiffiffiffiffiffiffiffiffiffiffiffiffiffiffiffiffiffiffiffiffiffiffiffiffiffiffiffiffiffiffiffiffi1
3½ða1 � a2Þ2 þ ðb1 � b2Þ þ ðc1 � c2Þ�
r(16)
4.2. Fuzzy linguistic variable
The fuzzy linguistic variable is a variable that whose values are words or sentences in anatural language (Fouladgar, Yazdani-Chamzini, & Zavadskas, 2012b). It helps expertsto evaluate the importance of the criteria and to rate the alternatives with respect to vari-ous criteria. These variables can be defined as different linguistic values. A 5-point scalefor defining the rating of alternatives is deliberately adopted as presented in Table 3 andFigure 1.
Table 3. Membership function of linguistic scale.
Linguistic value Fuzzy number
Very poor (VP) (0.0,1.0,2.5)Poor (P) (1.5,3.0,4.5)Fair (F) (3.5,5.0,6.5)Good (G) (5.5,7.0,8.5)Very good (VG) (7.5,9.0,10)
Source: Author’s calculations.
Economic Research-Ekonomska Istraživanja 327
Dow
nloa
ded
by [
79.1
33.2
39.8
] at
22:
36 2
9 O
ctob
er 2
014

4.3. Fuzzy TOPSIS methodology
The problem of selecting plays a significant role in the process of decision-making.According to the importance of selecting, a number of techniques are developed toevaluate and select the best alternative among a pool of alternatives. These techniquescan be grouped into several main methods, including expert systems, Delphi decision-making process, paired comparison, grid analysis, influence diagram, pro/con approach,decision tree, game theory, cost/benefit analysis, multi-voting technique, linear program-ming, trial and error approach, MCDM analysis, and affinity diagrams (Lashgari et al.,2011).
In the previous section, the method of calculating the relative weights of main andsub-factors using the ANP technique is illustrated. However, it should be noted that theANP methodology would have been employed for prioritising the feasible alternativesprovided that a small number of alternatives are taken into account. According to thenumber of the alternatives applied in this study, it is not logical to form a huge numberof the pair-wise comparison matrices on account of taking a numerous amount of time.Therefore, TOPSIS, a branch of the MCDM methods, is applied to rank the feasiblealternatives. This technique is a robust method for ranking the feasible alternatives withrespect to the evaluation criteria under consideration. The TOPSIS methodology, intro-duced by Hwang and Yoon (1981), uses the basic concept of positive and negative idealsolution in which the alternative chosen should have the shortest distance from the posi-tive ideal solution and the farthest distance from the negative ideal solution (Fouladgar,Yazdani-Chamzini, & Zavadskas, 2011; Yazdani-Chamzini & Yakhchali, 2012).
However, the TOPSIS method is criticised for handling the inherent uncertainty andcomplexity involved in the process of modelling real-life problems. As well as, it isvery difficult for the evaluators to express the preferences using exact numerical valuesand this result more desirable for the researchers to use fuzzy logic evaluation (Tseng,2011). Fuzzy logic is a powerful and robust tool for formulating the uncertainty that hasdemonstrated its capabilities and effectiveness as a practical problem-solving tool in thedifferent areas of science, engineering, and management. Table 4 lists a number of thestudies using fuzzy TOPSIS to model different problems.
Fuzzy TOPSIS solves a problem with m alternatives A1, A2, A3, . . . ., Am, evalu-ated based on n dimensions, C1, C2, . . ., Cn. To form fuzzy TOPSIS matrix, first ajudgment matrix is constructed as C1 C2 … Cn
Figure 1. Linguistic variables for preference rating of each alternative.Source: Author’s calculations.
328 A. Yazdani-Chamzini et al.
Dow
nloa
ded
by [
79.1
33.2
39.8
] at
22:
36 2
9 O
ctob
er 2
014
½
~x11 ~x12 � � � ~x1n~x21 ~x22 � � � ~x2n
..
. ... . .. ..
.
~xm1 ~xm2 ~xmn
�A1
A2
..
.
Am
(17)
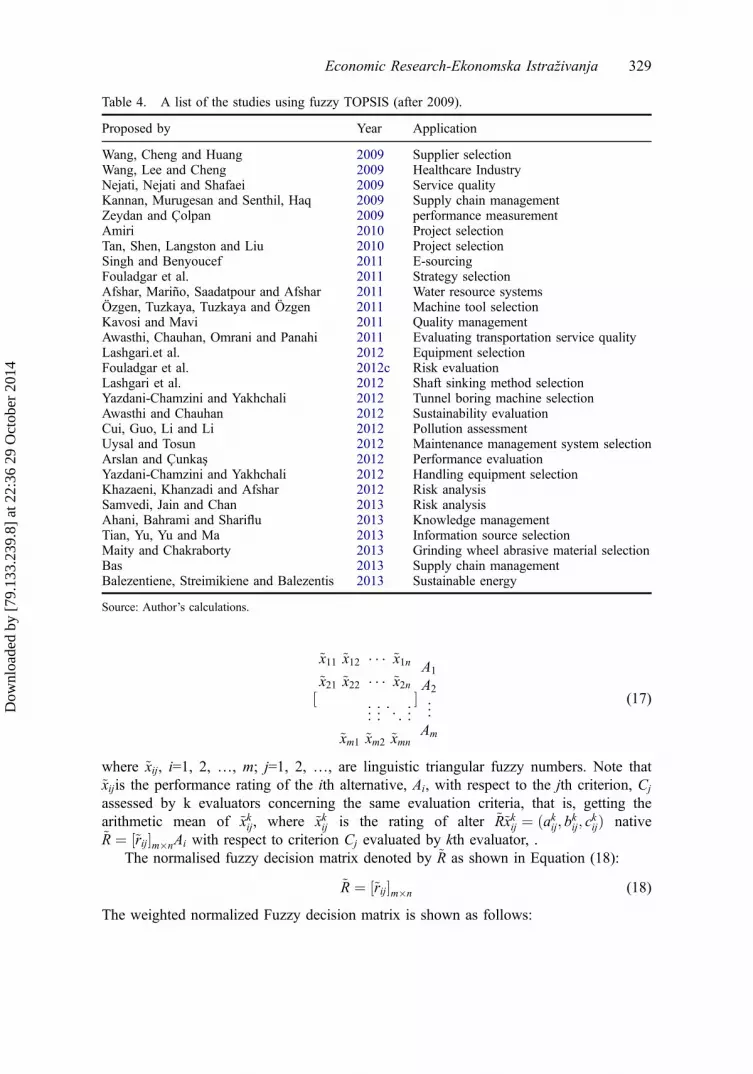
where ~xij, i=1, 2, …, m; j=1, 2, …, are linguistic triangular fuzzy numbers. Note that~xijis the performance rating of the ith alternative, Ai, with respect to the jth criterion, Cj
assessed by k evaluators concerning the same evaluation criteria, that is, getting thearithmetic mean of ~xkij, where ~xkij is the rating of alter ~R~xkij ¼ ðakij; bkij; ckijÞ native~R ¼ ½~rij�m�nAi with respect to criterion Cj evaluated by kth evaluator, .
The normalised fuzzy decision matrix denoted by ~R as shown in Equation (18):
~R ¼ ½~rij�m�n (18)
The weighted normalized Fuzzy decision matrix is shown as follows:
Table 4. A list of the studies using fuzzy TOPSIS (after 2009).
Proposed by Year Application
Wang, Cheng and Huang 2009 Supplier selectionWang, Lee and Cheng 2009 Healthcare IndustryNejati, Nejati and Shafaei 2009 Service qualityKannan, Murugesan and Senthil, Haq 2009 Supply chain managementZeydan and Çolpan 2009 performance measurementAmiri 2010 Project selectionTan, Shen, Langston and Liu 2010 Project selectionSingh and Benyoucef 2011 E-sourcingFouladgar et al. 2011 Strategy selectionAfshar, Mariño, Saadatpour and Afshar 2011 Water resource systemsÖzgen, Tuzkaya, Tuzkaya and Özgen 2011 Machine tool selectionKavosi and Mavi 2011 Quality managementAwasthi, Chauhan, Omrani and Panahi 2011 Evaluating transportation service qualityLashgari.et al. 2012 Equipment selectionFouladgar et al. 2012c Risk evaluationLashgari et al. 2012 Shaft sinking method selectionYazdani-Chamzini and Yakhchali 2012 Tunnel boring machine selectionAwasthi and Chauhan 2012 Sustainability evaluationCui, Guo, Li and Li 2012 Pollution assessmentUysal and Tosun 2012 Maintenance management system selectionArslan and Çunkaş 2012 Performance evaluationYazdani-Chamzini and Yakhchali 2012 Handling equipment selectionKhazaeni, Khanzadi and Afshar 2012 Risk analysisSamvedi, Jain and Chan 2013 Risk analysisAhani, Bahrami and Shariflu 2013 Knowledge managementTian, Yu, Yu and Ma 2013 Information source selectionMaity and Chakraborty 2013 Grinding wheel abrasive material selectionBas 2013 Supply chain managementBalezentiene, Streimikiene and Balezentis 2013 Sustainable energy
Source: Author’s calculations.
Economic Research-Ekonomska Istraživanja 329
Dow
nloa
ded
by [
79.1
33.2
39.8
] at
22:
36 2
9 O
ctob
er 2
014

~V ¼~v11 ~v12 � � � ~v1n~v21 ~v22 � � � ~v2n... ..
. . .. ..
.
~vm1 ~vm2 ~vmn
26664
37775 ¼
w1~r11 w2~r12 � � � wn~r1nw1~r21 w2~r22 � � � wn~r2n... ..
. . .. ..
.
w1~rm1 w2~rm2 wn~rmn
26664
37775 (19)
wherewjis the weight of the jth criterion.Fuzzy TOPSIS is summarised as follows:Step 1. Choose the linguistic rating~xij: i=1, 2, . . .,m; j=1, 2, . . ., n for alternatives
with respect to criteria and the proper linguistic variables ~wj: j=1, 2, . . ., n for weightof the criteria.
Step 2. Form the weighted normalised fuzzy decision matrix:~v:by Equation (19).Step 3. Identify the positive ideal solution A+ and the negative ideal solution A-.
The fuzzy positive ideal solution (FPIS) and the fuzzy negative ideal solution (FNIS)can be obtained through Equations (20) and (21).
A ¼ ð~vþ1 ;~vþ2 ;~vþ3 ; :::;~vþn Þ ¼ fmaxi
vijði ¼ 1; 2; :::; nÞg (20)
A� ¼ ð~v�1 ;~v�2 ;~v�3 ; :::;~v�n Þ ¼ fmini
vijði ¼ 1; 2; :::; nÞg (21)
Step 4. The distance of each alternative from the positive ideal solution A+ and the neg-ative ideal solution A- can be calculated using Equations (22) and (23).
dþi ¼Xnj¼1
dð~vij;~vþj Þ , i ¼ 1; 2; :::;m (22)
d�i ¼Xnj¼1
dð~vij;~v�j Þ , i ¼ 1; 2; :::;m (23)
Step 5. Calculate the closeness coefficient. This step solves the closeness coefficient byEquation (24).
CCi ¼ d�i
d�i þ di(24)
5. The proposed model
The proposed model can be defined as presented in the following steps:Step 1: Identify the evaluation criteria and classify them based on the BOCR fac-
tors.Step 2: Construct pair-wise comparison matrices based on the scale given in Table 1
for calculating the importance weights of the main and sub-factors. Assume that there isno dependence among the BOCR factors (i.e. construct the AHP model). The localweights of sub-factors arise from this step.
Step 3: Visualise the structure of complicated causal relationships with matrices ordigraphs and obtain the central role of each factor (i.e. construct the DEMATEL model).The interdependent weights of the factors are derived from this step.
Step 4: Calculate the global weights of the BOCR factors by multiplying theweights resulted from step 2 and the interdependent weights derived from step 3.
330 A. Yazdani-Chamzini et al.
Dow
nloa
ded
by [
79.1
33.2
39.8
] at
22:
36 2
9 O
ctob
er 2
014

Step 5: Calculate the global weights of the evaluation indicators by multiplying theweights of the sub-factors obtained in step 2 with those of the factors to which itbelongs that is acquired in the previous step.
Step 6: Define a linguistic scale for describing the preference ratings of the alterna-tives.
Step 7: Aggregate the fuzzy values resulted from the previous step.Step 8: Obtain the preference ratings of the alternatives by using the fuzzy TOPSIS
technique based on the global weights yield in step 5 and the ratings obtained from theprevious step.
Step 9: Prioritise the investment strategies in descending order and select the highestrank as the first choice.
Schematic diagram of the proposed model for selecting the optimal working strategyis provided in Figure 2.
5.1. An implementation of the proposed model in the private sector
In order to demonstrate the potential application of the proposed model a case study isillustrated. For achieving the aim, selection of the investment strategy in the private sec-tor of Iran is evaluated and explained. Based on the Iranian Constitution, the economyof Iran consists of three sectors: private, cooperative, and state. The private sector
Rank the investment strategies
Compute the performance ratings of the investment strategies
Define linguistic terms of the ratings
Compute the global weights for the evaluation indicators
Determine the inner dependence matrix
Determine the local weights of BOCR factors and evaluation indicators
Construct the hierarchical structure
Identify the evaluation indicators
Select the best strategy
DEMATEL
Fuzzy TOPSIS
Aggregate the preference ratings
AHP
Figure 2. Schematic diagram of the proposed model.Source: Author’s calculations.
Economic Research-Ekonomska Istraživanja 331
Dow
nloa
ded
by [
79.1
33.2
39.8
] at
22:
36 2
9 O
ctob
er 2
014

consists of those activities concerned with construction, agriculture, animal husbandry,industry, trade, and services that supplement the economic activities of the state andcooperative sectors (Alfoneh, 2013). According to the World Bank report published in2010, the Domestic credit to private sector (% of GDP) in Iran was 36.66 in 20092. Thescenarios employed in this study are system scenarios where both tangible and intangi-ble parameters are considered. As previously mentioned, this article proposes a modelfor selecting the optimum investment strategy based on a novel hybrid methodologytaking into account the mutual relationships of the criteria and proposes a strategy forinvesting in the private sector of Iran.
According to the importance of the investment, a decision-making team is estab-lished, including 15 experts with a minimum of five years experience and a strong back-ground in the field of investing. For achieving the aim, the interview technique isutilised in which evaluators are asked to mention all factors they regard as relevant tothe selection of the optimum investment strategy. Also the feasible alternatives forinvesting in the private sector of Iran are identified. After several revisions, the final listcomprising 13 evaluation criteria is extracted. These factors can be classified into fourmain parts: BOCR. The ultimate list including factors (main criteria) and sub-factors(sub-criteria) are presented in Table 5. Consequently, the structure of the problem ofselecting the best strategy for investing is depicted in Figure 3.
Assuming that there is no dependence among the BOCR factors, the importanceweights of the evaluation criteria are computed. To this end, a questionnaire using theAHP questionnaire format is constructed, and then experts are asked to fill the judgmentmatrix based on the scale given in Table 1. For instance, in the process of interviewwith one of the experts, the benefit factor (B) and risk factor (C) are compared by ask-ing ‘How important is “B” when it is compared with “R”?’ and the answer ‘3’ isreceived. This number is located in the relevant cell against the relative weights. Thecomputations of the consistency rate show that this rate is smaller than 0.1; as a result,
Table 5. Final list of the main and sub-criteria.
Goal Main criteria Sub-criteria Alternatives
Selecting the bestinvestment strategy
Benefit factors(B)
Profitability (C1) Petrochemicals, oil, andgas (A1)
Efficiency (C2) Utilities (A2)Exchangeability (C3) Telecommunication
(A3)Credit (C4) Transport (A4)
Opportunityfactors (O)
Reliability (C5) Mines & Metals (A5)Sustainability (C6) Banking and insurance
(A6)Robustness (C7) Nonequity securities
(A7)Cost factors (C) Initial capital cost
(C8)Foreign currency (A8)
Tax (C9) Stocks (A9)Existence ofcompetition (C10)
Coin (A10)
Risk factors (R) Sociopolitical (11) Manufacturing (A11)Security (C12)Regret (C13)
Source: Author’s calculations.
332 A. Yazdani-Chamzini et al.
Dow
nloa
ded
by [
79.1
33.2
39.8
] at
22:
36 2
9 O
ctob
er 2
014

the questionnaires are valid. The final comparison matrix is obtained by the geometricmean to the individual responses be transferred into the group comparison matrix. Thefinal comparison matrix acquired by the evaluator team is shown in Table 6. In order tovalid the final questionnaire, the group consistency ratio (GCR) is computed by usingEquation (25), as listed in the last row of the matrix.
GCI ¼ ðkmax � nÞ=n (25)
The importance weights of the main and sub-criteria are computed by the process of theAHP methodology and the results are presented in Table 7.
Then, the interdependence relationships among the BOCR factors are virtualisedwith the aid of the DEMATEL method. This step is developed to find all aspects of theinterdependence and dependence relationships between the BOCR factors. For this aim,the DEMATEL analysis based on the impact-relation maps is conducted to calculate thekey role of each factor. First, the direct-influence matrix Afor criteria is establishedbased on the expert’s knowledge. Then, the normalised direct-influence matrix for crite-ria is computed. Third, the total relation matrix is computed as presented in Table 8.For example, benefit factor (B) will directly impact opportunity factor (O) with animpact level of 0.509. Likewise, benefit factor (B) will impact itself with an impactlevel of 0.306. Finally, the NRM is formed by the r and s as the total direct-influencematrix listed in the last column and row of Table 8.
After determining the total relation matrix, the quantitative values of ri � si andri þ siare derived from this matrix as shown in Table 9. The ri+si value indicates how
Opportunity factors(O)
Benefit factors (B)
Profitability (C1)
Utilities (A2)
Telecommunication(A3)
Petrochemicals, oil, and gas (A1)
Efficiency (C2)
Cost factors (C)
Risk factors (R)
Sel
ecti
ng th
e be
st in
vest
men
t str
ateg
yExchangeability (C3)
Reliability (C5)
Sustainability (C6)
Robustness (C7)
Initial capital cost (C8)
Tax (C9)
Existence of competition (C10)
Sociopolitical (11)
Security (C12)
Regret (C13)
Transport (A4)
Mines & Metals (A5)
Banking and insurance (A6)
Nonequity securities (A7)
Industry (A11)
Foreign currency(A8)
Stocks (A9)
Coin (A10)
Credit (C4)
Figure 3. Structure of the investment problem.Source: Author’s calculations.
Economic Research-Ekonomska Istraživanja 333
Dow
nloa
ded
by [
79.1
33.2
39.8
] at
22:
36 2
9 O
ctob
er 2
014

important a criterion is, while the level of the direct impact of this criterion on other cri-teria is assigned by the ri � sivalue. Therefore, a high and positive value for ri � siindi-cates that this criterion have a significant impact on other criteria.
Moreover, risk (R), with the highest value of ri þ si, has the most relationships withother criteria. Whereas, opportunity (O) is located in the second place.
Table 6. Final comparison matrix.
B O C R
B 1.00 3.56 1.33 3.16O 0.28 1.00 0.45 0.36C 0.75 2.24 1.00 2.00R 0.32 2.78 0.50 1.00GCR 0.03
C1 C2 C3 C4 C5 C6 C7 C8 C9 C10 C11 C12 C13
C1 1.00 1.12 2.65 3.77C2 0.89 1.00 2.32 2.89C3 0.38 0.43 1.00 2.12C4 0.27 0.35 0.47 1.00C5 1.00 1.32 2.24C6 0.76 1.00 2.17C7 0.45 0.46 1.00C8 1.00 7.45 4.53C9 0.13 1.00 0.32C10 0.22 3.12 1.00C11 1.00 5.34 3.21C12 0.19 1.00 0.30C13 0.31 3.34 1.00GCR 0.008 0.002 0.017 0.02
Source: Author’s calculations.
Table 7. Local weights of criteria.
Criteria Local weights obtained by AHP
B 0.422O 0.104C 0.291R 0.183C1 0.394C2 0.338C3 0.167C4 0.100C5 0.447C6 0.368C7 0.184C8 0.719C9 0.080C10 0.201C11 0.644C12 0.098C13 0.258
Source: Author’s calculations.
334 A. Yazdani-Chamzini et al.
Dow
nloa
ded
by [
79.1
33.2
39.8
] at
22:
36 2
9 O
ctob
er 2
014

In order to make a strong decision analysis, a discussion with the evaluator team isconducted to determine the appropriate threshold value. It should be noted that r-s thereis not a standard and systematic process for obtaining the threshold value. Therefore,the threshold value is obtained based on the knowledge of the expert team. For this rea-son the threshold value for this problem is 0.72; so that, the values above these thresh-olds are merely taken into account in the process of modelling the decision problem.Therefore, the influence relation map can be acquired by mapping a dataset of (r + s, r - s),as seen in Figure 4. From the figure, it can be evident that O and R are the positively-affected criteria. Whereas, B and C are the negatively-affected criteria. Moreover, it canbe evident that opportunity (O), with the highest value of r-s is the most effective factorfor the problem under consideration (master sender). Whereas, cost (C), with lowestvalue of r � s, is the least effective factor (master receiver).
Table 8. The total relation matrix for the BOCR factors.
B O C R r
B 0.306 0.509 0.495 0.521 1.830O 0.775 0.563 1.032 1.135 3.506C 0.426 0.443 0.509 0.701 2.078R 0.731 0.690 1.142 0.742 3.305s 2.238 2.205 3.178 3.099
Source: Author’s calculations.
Table 9. The influences given/received for factors.
s r ri þ si ri � si
B 2.238 1.830 4.068 −0.407O 2.205 3.506 5.711 1.301C 3.178 2.078 5.257 −1.099R 3.099 3.305 6.404 0.206
Source: Author’s calculations.
( )r s(Relation)
( )r s(Influence)
O
R
B
C
1.5
1.5
0.5
0
-0.5
-1.0
-1.5
0 1 2 3 4
B
5 6 7
Figure 4. The influence relation map.Source: Author’s calculations.
Economic Research-Ekonomska Istraživanja 335
Dow
nloa
ded
by [
79.1
33.2
39.8
] at
22:
36 2
9 O
ctob
er 2
014

In next step, the values of are multiplied with the relative weights obtained by theAHP technique to take into account the central role of the BOCR factors. The values cal-culated are listed in Table 10. Then, these values are normalised as shown in Table 10. It
Table 10. Global weights of criteria.
CriteriaWeights derived fromDEMATEL technique
Weights obtained from combination ofDEMATEL and AHP
Globalweights
B 4.068 1.717 0.342O 5.711 0.594 0.119C 5.257 1.53 0.305R 6.404 1.172 0.234
Source: Author’s calculations.
Table 11. Global weights of the indicators.
Criteria Importance weights Global weights
B 0.342 -O 0.119 -C 0.305 -R 0.234 -C1 0.394 0.135C2 0.338 0.116C3 0.167 0.057C4 0.100 0.034C5 0.447 0.053C6 0.368 0.044C7 0.184 0.022C8 0.719 0.219C9 0.080 0.024C10 0.201 0.061C11 0.644 0.151C12 0.098 0.023C13 0.258 0.060
Source: Author’s calculations.
Figure 5. Global weights of the indicators.Source: Author’s calculations.
336 A. Yazdani-Chamzini et al.
Dow
nloa
ded
by [
79.1
33.2
39.8
] at
22:
36 2
9 O
ctob
er 2
014

can be seen that the global weights obtained from the proposed model is significantly dif-ferent from the output of the AHP technique. It is due to the fact that the proposed modelconsiders the interdependence relations among the evaluation criteria.
This step includes calculating the global weights of the evaluation criteria by multi-plying the local weights obtained by the AHP model with the final interdependenceweights of the factor to which it belongs. The results obtained from this step are listedin Table 11. Figure 5 schematically shows the importance weights of the evaluationindicators.
After calculating the relative weights of the evaluation criteria, a linguistic scale fordescribing the preference ratings of the feasible alternatives is proposed as shown inTable 3. The expert team employs these linguistic terms to form the decision matrices.A sample of questionnaire filled by team expert is depicted in Table 12. Then, theaggregated decision matrix is calculated by the following equation as presented inTable 13.
~xij ¼ ðxij1; xij2; xij3Þ; k ¼ 1; 2; :::;K (26)
xij1 ¼ 1
K
Xkk¼1
xijk1 (27)
xij2 ¼ 1
K
Xkk¼1
xijk2
xij3 ¼ 1
K
Xkk¼1
xijk3
xkijis the rating of alternative Aiwith respect to the jth criterion assessed by,kth decision-maker.
After determining the importance ratings of alternatives, normalisation of these val-ues is made by converting the aggregated values in the closed interval [0,1] with the aid
Table 12. A sample of questionnaire filled.
A1 A2 A3 A4 A5 A6 A7 A8 A9 A10 A11
C1 VG G G G VG VG G VG G VG GC2 G VG G F G G F G G G GC3 P F P F VP F G VG F VG PC4 G F G G F VG G VG F VG FC5 G P F G F G F G VG G GC6 F F F F F F F G G G GC7 G P F G P F P VG P G GC8 VG F F G VG G VP P P F VGC9 F F P P P P P VG P F GC10 F P P F P G G G F F GC11 G VP VP F F F G G G G FC12 G P F P VP G F G VP G PC13 P F P F P P F G F VG F
Source: Author’s calculations.
Economic Research-Ekonomska Istraživanja 337
Dow
nloa
ded
by [
79.1
33.2
39.8
] at
22:
36 2
9 O
ctob
er 2
014

Table
13.
Agg
regateddecision
matrix.
A1
A2
A3
A4
A5
A6
C1
(6.04,
7.54
,8.78
)(4.76,
6.26
,7.64
)(4.56,
6.06
,7.50
)(4.76,
6.26
,7.63
)(6.57,
8.07
,9.52
)(6.32,
7.82
,9.09
)C2
(5.25,
6.75
,8.25
)(6.54,
8.04
,9.35
)(4.87,
6.37
,7.78
)(3.18,
4.68
,6.18
)(2.89,
4.39
,5.89
)(4.78,
6.28
,7.74
)C3
(1.12,
2.55
,4.05
)(3.11,
4.61
,6.11)
(0.89,
2.07
,3.57
)(2.92,
4.42
,5.92
)(0.34,
1.55
,3.05
)(3.11,
4.61
,6.11)
C4
(4.87,
6.37
,7.87
)(2.58,
4.08
,5.58
)(4.15,
5.65
,7.11)
(4.56,
6.06
,7.48
)(2.76,
4.26
,5.76
)(6.14,
7.64
,8.98
)C5
(5.93,
7.43
,8.76
)(1.06,
2.41
,3.91
)(2.67,
4.17
,5.67
)(5.02,
6.52
,7.94
)(3.12,
4.62
,6.12
)(5.21,
6.71
,8.17
)C6
(2.53,
4.03
,5.53
)(3.22,
4.72
,6.22
)(3.21,
4.71
,6.21
)(2.53,
4.03
,5.53
)(3.24,
4.74
,6.24
)(2.86,
4.36
,5.86
)C7
(5.24,
6.74
,8.19
)(1.36,
2.82
,4.32
)(2.94,
4.44
,5.94
)(3.97,
5.47
,6.94
)(1.43,
2.88
,4.38
)(3.22,
4.72
,6.22
)C8
(6.86,
8.36
,9.51
)(3.43,
4.93
,6.43
)(3.42,
4.92
,6.42
)(4.21,
5.71
,7.14
)(5.87,
7.37
,8.82
)(4.26,
5.76
,7.19
)C9
(3.03,
4.53
,6.03
)(3.29,
4.79
,6.29
)(1.12,
2.47
,3.97
)(1.04,
2.39
,3.89
)(1.23,
2.65
,4.15
)(1.43,
2.89
,4.39
)C10
(2.69,
4.19
,5.69
)(1.11,
2.61
,4.11)
(1.43,
2.71
,4.21
)(3.24,
4.74
,6.24
)(2.03,
3.53
,5.03
)(5.05,
6.55
,7.99
)C11
(4.74,
6.24
,7.67
)(0.34,
1.84
,3.34
)(0.14,
1.26
,2.76
)(3.36,
4.86
,6.36
)(3.56,
5.06
,6.56
)(3.34,
4.84
,6.34
)C12
(5.24,
6.74
,8.15
)(0.96,
2.46
,3.96
)(2.26,
3.76
,5.26
)(1.12,
2.43
,3.93
)(0.62,
1.87
,3.37
)(4.79,
6.29
,7.76
)C13
(1.03,
2.28
,3.78
)(2.87,
4.37
,5.87
)(1.22,
2.64
,4.14
)(3.47,
4.97
,6.47
)(1.21,
2.55
,4.05
)(1.23,
2.66
,4.16
)
A7
A8
A9
A10
A11
C1
(4.56,
6.06
,7.52
)(6.43,
7.93
,9.10
)(4.23,
5.73
,7.23
)(7.04,
8.54
,9.64
)(4.77,
6.27
,7.71
)C2
(3.12,
4.62
,6.12
)(5.13,
6.63
,8.06
)(4.46,
5.96
,7.42
)(5.26,
6.76
,8.08
)(5.07,
6.57
,8.01
)C3
(4.67,
6.17
,7.60
)(6.21,
7.71
,9.07
)(3.21,
4.71
,6.21
)(6.78,
8.28
,9.45
)(1.23,
2.64
,4.14
)C4
(5.21,
6.71
,8.12
)(5.89,
7.39
,8.80
)(3.42,
4.92
,6.42
)(6.34,
7.84
,9.20
)(3.32,
4.82
,6.32
)C5
(3.34,
4.84
,6.34
)(5.21,
6.71
,8.16
)(6.78,
8.28
,9.43
)(4.57,
6.07
,7.54
)(5.31,
6.81
,8.19
)C6
(3.52,
5.02
,6.52
)(5.34,
6.84
,8.29
)(4.74,
6.24
,7.74
)(4.78,
6.28
,7.73
)(5.09,
6.59
,7.99
)C7
(1.43,
2.86
,4.36
)(6.78,
8.28
,9.41
)(1.58,
3.08
,4.58
)(5.13,
6.63
,8.04
)(5.11,
6.61
,8.04
)C8
(0.23,
1.39
,2.89
)(1.05,
2.41
,3.91
)(1.21,
2.56
,4.06
)(1.23,
2.58
,4.08
)(7.21,
8.71
,9.78
)C9
(1.53,
2.99
,4.49
)(6.32,
7.82
,9.22
)(1.43,
2.88
,4.38
)(3.46,
4.96
,6.46
)(5.13,
6.63
,8.00
)C10
(4.65,
6.15
,7.61
)(4.56,
6.06
,7.48
)(3.24,
4.74
,6.24
)(3.06,
4.56
,6.06
)(4.79,
6.29
,7.71
)C11
(5.05,
6.55
,7.97
)(5.22,
6.72
,8.06
)(4.85,
6.35
,7.78
)(4.78,
6.28
,7.71
)(3.32,
4.82
,6.32
)C12
(3.23,
4.73
,6.23
)(4.78,
6.28
,7.63
)(0.24,
1.39
,2.89
)(5.12,
6.62
,8.02
)(1.76,
3.26
,4.76
)C13
(3.41,
4.91
,6.41
)(4.95,
6.45
,7.82
)(3.45,
4.95
,6.45
)(6.59,
8.09
,9.40
)(3.08,
4.58
,6.08
)
Sou
rce:
Autho
r’scalculations.
338 A. Yazdani-Chamzini et al.
Dow
nloa
ded
by [
79.1
33.2
39.8
] at
22:
36 2
9 O
ctob
er 2
014

Table
14.
Weigh
teddecision
matrix.
A1
A2
A3
A4
A5
A6
C1
(0.05,
0.08
,0.11)
(0.01,
0.05
,0.09
)(0.01,
0.05
,0.08
)(0.01,
0.05
,0.08
)(0.06,
0.10
,0.13
)(0.05,
0.09
,0.12
)C2
(0.04,
0.07
,0.10
)(0.07,
0.09
,0.12
)(0.04,
0.06
,0.09
)(0.01,
0.03
,0.06
)(0.00,
0.03
,0.05
)(0.03,
0.06
,0.09
)C3
(0.00,
0.01
,0.02
)(0.02,
0.03
,0.04
)(0.00,
0.01
,0.02
)(0.02,
0.03
,0.03
)(0.00,
0.01
,0.02
)(0.02,
0.03
,0.04
)C4
(0.01,
0.02
,0.03
)(0.00,
0.01
,0.02
)(0.01,
0.02
,0.02
)(0.01,
0.02
,0.03
)(0.00,
0.01
,0.02
)(0.02,
0.03
,0.03
)C5
(0.03,
0.04
,0.05
)(0.00,
0.01
,0.02
)(0.01,
0.02
,0.03
)(0.03,
0.03
,0.04
)(0.01,
0.02
,0.03
)(0.03,
0.04
,0.05
)C6
(0.00,
0.01
,0.02
)(0.01,
0.02
,0.03
)(0.01,
0.02
,0.03
)(0.00,
0.01
,0.02
)(0.01,
0.02
,0.03
)(0.00,
0.01
,0.03
)C7
(0.01,
0.01
,0.02
)(0.00,
0.00
,0.01
)(0.00,
0.01
,0.01
)(0.01,
0.01
,0.02
)(0.00,
0.00
,0.01
)(0.01,
0.01
,0.01
)C8
(0.01,
0.03
,0.07
)(0.08,
0.11,
0.15
)(0.08,
0.11,
0.15
)(0.06,
0.09
,0.13
)(0.02,
0.06
,0.09
)(0.06,
0.09
,0.13
)C9
(0.01,
0.01
,0.02
)(0.01,
0.01
,0.02
)(0.02,
0.02
,0.02
)(0.02,
0.02
,0.02
)(0.01,
0.02
,0.02
)(0.01,
0.02
,0.02
)C10
(0.02,
0.03
,0.05
)(0.03,
0.05
,0.06
)(0.03,
0.05
,0.06
)(0.02,
0.03
,0.04
)(0.03,
0.04
,0.05
)(0.00,
0.01
,0.03
)C11
(0.01,
0.03
,0.06
)(0.09,
0.12
,0.15
)(0.10,
0.13
,0.15
)(0.03,
0.06
,0.09
)(0.03,
0.06
,0.09
)(0.03,
0.06
,0.09
)C12
(0.00,
0.00
,0.01
)(0.01,
0.02
,0.02
)(0.01,
0.01
,0.02
)(0.01,
0.02
,0.02
)(0.01,
0.02
,0.02
)(0.00,
0.01
,0.01
)C13
(0.04,
0.05
,0.06
)(0.03,
0.04
,0.05
)(0.04,
0.05
,0.06
)(0.02,
0.03
,0.04
)(0.04,
0.05
,0.06
)(0.04,
0.05
,0.06
)
A7
A8
A9
A10
A11
C1
(0.01,
0.05
,0.08
)(0.05,
0.09
,0.12
)(0.00,
0.04
,0.07
)(0.07,
0.11,
0.14
)(0.01,
0.05
,0.09
)C2
(0.00,
0.03
,0.06
)(0.04,
0.07
,0.09
)(0.03,
0.06
,0.08
)(0.04,
0.07
,0.09
)(0.04,
0.07
,0.09
)C3
(0.03,
0.04
,0.05
)(0.04,
0.05
,0.05
)(0.02,
0.03
,0.04
)(0.04,
0.05
,0.06
)(0.01,
0.01
,0.02
)C4
(0.01,
0.02
,0.03
)(0.02,
0.02
,0.03
)(0.00,
0.01
,0.02
)(0.02,
0.03
,0.03
)(0.00,
0.01
,0.02
)C5
(0.01,
0.02
,0.03
)(0.03,
0.04
,0.04
)(0.04,
0.05
,0.05
)(0.02,
0.03
,0.04
)(0.03,
0.04
,0.05
)C6
(0.01,
0.02
,0.03
)(0.02,
0.03
,0.04
)(0.02,
0.03
,0.04
)(0.02,
0.03
,0.04
)(0.02,
0.03
,0.04
)C7
(0.00,
0.00
,0.01
)(0.01,
0.02
,0.02
)(0.00,
0.00
,0.01
)(0.01,
0.01
,0.02
)(0.01,
0.01
,0.02
)C8
(0.16,
0.19
,0.22
)(0.13,
0.17
,0.20
)(0.13,
0.17
,0.20
)(0.13,
0.17
,0.20
)(0.00,
0.02
,0.06
)C9
(0.01,
0.02
,0.02
)(0.00,
0.00
,0.01
)(0.01,
0.02
,0.02
)(0.01,
0.01
,0.02
)(0.00,
0.01
,0.01
)C10
(0.00,
0.02
,0.03
)(0.00,
0.02
,0.03
)(0.02,
0.03
,0.04
)(0.02,
0.03
,0.04
)(0.00,
0.02
,0.03
)C11
(0.00,
0.03
,0.06
)(0.00,
0.03
,0.05
)(0.01,
0.03
,0.06
)(0.01,
0.03
,0.06
)(0.03,
0.06
,0.09
)C12
(0.01,
0.01
,0.01
)(0.00,
0.01
,0.01
)(0.02,
0.02
,0.02
)(0.00,
0.00
,0.01
)(0.01,
0.01
,0.02
)C13
(0.02,
0.03
,0.04
)(0.01,
0.02
,0.03
)(0.02,
0.03
,0.04
)(0.00,
0.01
,0.02
)(0.02,
0.03
,0.05
)
Sou
rce:
Autho
r’scalculations.
Economic Research-Ekonomska Istraživanja 339
Dow
nloa
ded
by [
79.1
33.2
39.8
] at
22:
36 2
9 O
ctob
er 2
014
of the linear scale transformation functions defined as presented in the following equa-tions to establish the normalised fuzzy matrix:
The larger, the better type, rij ¼ ½xij �minfxijg�½maxfxijg �minfxijg� (28)
The smaller, the better type, rij ¼ ½maxfxijg � xij�½maxfxijg �minfxijg� (29)
Then, by multiplying each value with their weights, weighted normalised A� matrix isformed as depicted in Table 14.
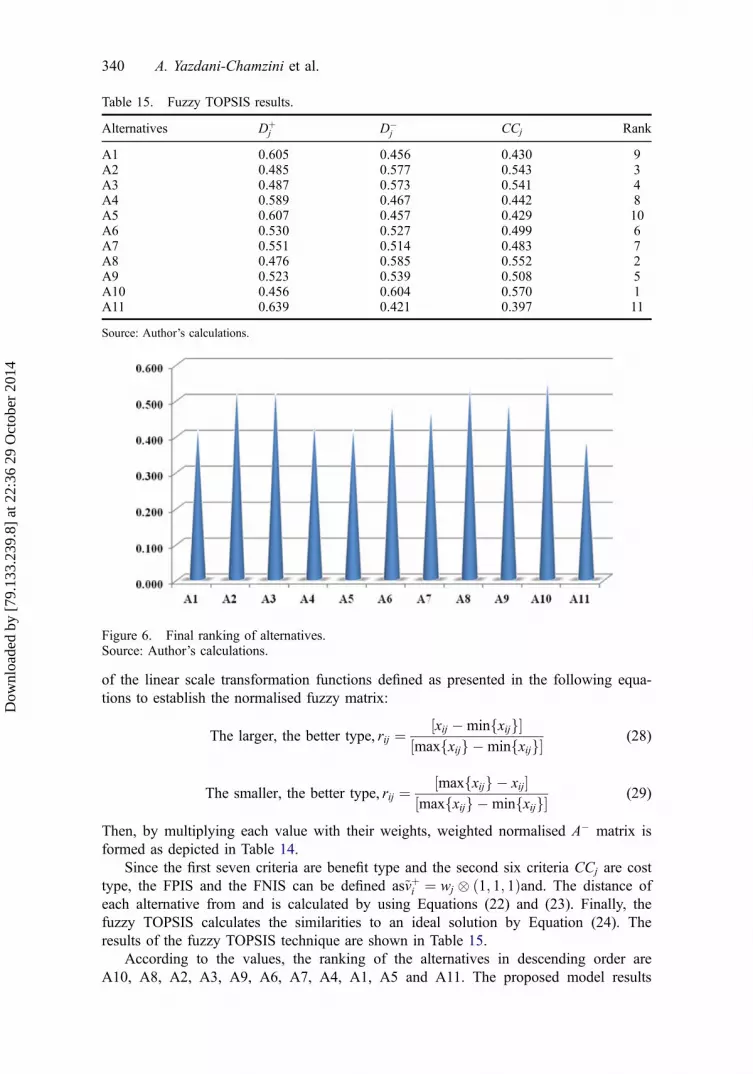
Since the first seven criteria are benefit type and the second six criteria CCj are costtype, the FPIS and the FNIS can be defined as~vþi ¼ wj � ð1; 1; 1Þand. The distance ofeach alternative from and is calculated by using Equations (22) and (23). Finally, thefuzzy TOPSIS calculates the similarities to an ideal solution by Equation (24). Theresults of the fuzzy TOPSIS technique are shown in Table 15.
According to the values, the ranking of the alternatives in descending order areA10, A8, A2, A3, A9, A6, A7, A4, A1, A5 and A11. The proposed model results
Table 15. Fuzzy TOPSIS results.
Alternatives Dþj D�
j CCj Rank
A1 0.605 0.456 0.430 9A2 0.485 0.577 0.543 3A3 0.487 0.573 0.541 4A4 0.589 0.467 0.442 8A5 0.607 0.457 0.429 10A6 0.530 0.527 0.499 6A7 0.551 0.514 0.483 7A8 0.476 0.585 0.552 2A9 0.523 0.539 0.508 5A10 0.456 0.604 0.570 1A11 0.639 0.421 0.397 11
Source: Author’s calculations.
Figure 6. Final ranking of alternatives.Source: Author’s calculations.
340 A. Yazdani-Chamzini et al.
Dow
nloa
ded
by [
79.1
33.2
39.8
] at
22:
36 2
9 O
ctob
er 2
014

indicate that A10 is the best alternative with CC value of 0.57. Rankings of risksaccording to CCi values are depicted in Figure 6.
6. Discussion
According to the results derived from the empirical study, the researchers make the fol-lowing discussions. From Figure 4, the impact-relation map gives an important message.If a decision-maker wishes to invest in the private sector of Iran, opportunity factor (O)should be taken into account first. Because this criterion is influenced by the other crite-ria least and influences the other criteria most. This demonstrates the key role of oppor-tunities in the process of investing in the private sector of Iran.
The proposed model based on three methods AHP, DEMATEL, and fuzzy TOPSIShas several advantages. First, according to the importance weights of the BOCR factorsand sub-factors, investors can recognise the importance of main and sub-criteria andhow they can influence the investment strategies without taking into account the interde-pendence relations among the criteria under consideration. Contrary to what ismotioned, another scenario can be taken into account by the information resulted fromthe DEMATEL technique. This technique considers direct and indirect effects to handlethe cause-effect relationships involved in the criteria. This can result in a better perfor-mance in the process of investing.
On the other hand, the TOPSIS technique is a robust method to rank the feasible alter-natives under a systematic approach. This technique takes shorter time for the process ofranking in comparison with other techniques like AHP and ANP. As well as, the merit ofusing fuzzy logic is to model a complex system by using linguistic terms. The advantagesof both techniques can be obtained in the form of the fuzzy TOPSIS technique.c
7. Conclusions
In this article, an integrated model based on four techniques including AHP andDEMATEL, TOPSIS, and fuzzy methods to evaluate different investment strategies inorder to select the best one. Since different indicators have a significant influence on theprocess of selection the best strategy for investing, using a BOCR framework to groupthe sub-criteria into the BOCR factors.
However, the results of the AHP model can be applied for calculating the relativeweights of main and sub-criteria while the relationships among criteria are independent.For selecting the most appropriate investment strategy under terms of the interdepen-dence among the criteria, it is better to use the techniques that can model the cause-effect relations among the evaluation criteria. The DEMATEL method is one of themost commonly used methods in handling the cause-effect relations. After applyingthe DEMATEL method, the weights of the indicators are significantly different from theweights obtained by the AHP model. This shows that the proposed model is moreadapted with real-life problems. This leads to model a sophisticated problem more effec-tively. Results of the proposed approach shows that the strategy A10 (investing in coin)outperforms other strategies. It is suggested to investigate more studies to uncoverinvaluable new study problems.
Notes1. www.essec.edu2. data.worldbank.org.
Economic Research-Ekonomska Istraživanja 341
Dow
nloa
ded
by [
79.1
33.2
39.8
] at
22:
36 2
9 O
ctob
er 2
014

ReferencesAfshar, A., Mariño, M. A., Saadatpour, M., & Afshar, A. (2011). Fuzzy TOPSIS multi-criteria deci-
sion analysis applied to karun reservoirs system. Water Resources Management, 25, 545–563.Ahani, M., Bahrami, H. R., & Shariflu, B. (2013). Determining the dimension of knowledge man-
agement implementation by utilizing a fuzzy TOPSIS method. International Journal of Busi-ness Administration, 4, 113–123.
Alfoneh, A. (2013). Iran Unveiled: How the revolutionary guards is transforming iran from the-ocracy into military dictatorship. Washington, DC: American Enterprise Institute for PublicPolicy Research.
Amiri, M. P. (2010). Project selection for oil-fields development by using the AHP and fuzzyTOPSIS methods. Expert Systems with Applications, 37, 6218–6224.
Arslan, M., & Çunkaş, M. (2012). Performance evaluation of sugar plants by fuzzy Technique forOrder Performance by Similarity to Ideal Solution (TOPSIS). Cybernetics and Systems, 43,529–548.
Awasthi, A., & Chauhan, S. S. (2012). A hybrid approach integrating Affinity Diagram, AHP and fuzzyTOPSIS for sustainable city logistics planning. Applied Mathematical Modelling, 36, 573–584.
Awasthi, A., Chauhan, S. S., Omrani, H., & Panahi, A. (2011). A hybrid approach based onSERVQUAL and fuzzy TOPSIS for evaluating transportation service quality. Computers &Industrial Engineering, 61, 637–646.
Azimi, R., Yazdani-Chamzini, A., Fouladgar, M. M., Zavadskas, E. K., & Basiri, M. H. (2011).Ranking the strategies of mining sector through ANP and TOPSIS in a SWOT framework.Journal of Business Economics and Management, 12, 670–689.
Azzoni, C. R., & Kalatzis, A. E. G. (2010). Incorporating demand-side aspects into regional pol-icy: variations in the importance of private investment decision factors across regions. TheAnnals of Regional Science, 44, 69–82.
Balezentiene, L., Streimikiene, D., & Balezentis, T. (2013). Fuzzy decision support methodologyfor sustainable energy crop selection. Renewable and Sustainable Energy Reviews, 17, 83–93.
Baležentis, A., Baležentis, T., & Misiunas, A. (2012). An integrated assessment of Lithuanian eco-nomic sectors based on financial ratios and fuzzy MCDM methods. Technological and Eco-nomic Development of Economy, 18, 34–53.
Bas, E. (2013). The integrated framework for analysis of electricity supply chain using an inte-grated SWOT-fuzzy TOPSIS methodology combined with AHP: The case of Turkey. Interna-tional Journal of Electrical Power & Energy Systems, 44, 897–907.
Bobylev, N. (2011). Comparative analysis of environmental impacts of selected underground con-struction technologies using the analytic network process. Automation in Construction, 20,1030–1040.
Büyüközkan, G., & Çifçi, G. (2012). A novel hybrid MCDM approach based on fuzzy DEMA-TEL, fuzzy ANP and fuzzy TOPSIS to evaluate green suppliers. Expert Systems with Applica-tions, 39, 3000–3011.
Chang, K. H., & Cheng, C. H. (2011). Evaluating the risk of failure using the fuzzy OWA andDEMATEL method. Journal of Intelligent Manufacturing, 22, 113–129.
Chen, H. H., Lee, A. H. I., & Kang, H. Y. (2010). A model for strategic selection of feeder man-agement systems: a case study. International Journal of Electrical Power & Energy Systems,32, 421–427.
Chou, Y. C., Sun, C. C., & Yen, H. Y. (2012). Evaluating the criteria for human resource for sci-ence and technology (HRST) based on an integrated fuzzy AHP and fuzzy DEMATELapproach. Applied Soft Computing, 12, 64–71.
Cui, S., Guo, L., Li, J., & Li, Y. F. (2012). Fuzzy TOPSIS model for pollution assessment ofunintentional produced polychlorinated biphenyls in China. Advanced Materials Research,573-574, 8–13.
Dadelo, S., Turskis, Z., Zavadskas, E. K., & Dadeliene, R. (2013). Integrated multi-criteria deci-sion making model based on wisdom-of-crowds principle for selection of the group of elitesecurity guards. Archives of Budo, 9, 135–147.
Erden, L. (2002). The impact of public capital investment on private investment under uncer-tainty: A panel data analysis of developing countries. (Dissertation). Florida State University:College of Social Sciences.
Fontela, E., & Gabus, A. (1976). The DEMATEL observer, DEMATEL 1976 Report, BattelleGeneva Research Centre, Switzerland, Geneva.
342 A. Yazdani-Chamzini et al.
Dow
nloa
ded
by [
79.1
33.2
39.8
] at
22:
36 2
9 O
ctob
er 2
014

Fouladgar, M. M., Yazdani-Chamzini, A., & Zavadskas, E. K. (2011). An integrated model forprioritizing strategies of the Iranian mining sector. Technological and Economic Developmentof Economy, 17, 459–483.
Fouladgar, M. M., Yazdani-Chamzini, A., Zavadskas, E. K., & Haji Moini, S. H. (2012a). A newhybrid model for evaluating the working strategies: case study of construction company.Technological and Economic Development of Economy, 18, 164–188.
Fouladgar, M. M., Yazdani-Chamzini, A., & Zavadskas, E. K. (2012b). Risk evaluation of tunnel-ing projects. Archives of Civil and Mechanical Engineering, 12, 1–12.
Fouladgar, M. M., Yazdani-Chamzini, A., Zavadskas, E. K., Yakhchali, S. H., & Ghasempouraba-di, M. H. (2012d). Project portfolio selection using Fuzzy AHP and VIKOR Techniques.Transformations in Business & Economics, 11, 213–231.
Gabus, A., & Fontela, E. (1972). World problems, an invitation to further thought within theframework of DEMATEL. Battelle Geneva Research Centre, Switzerland, Geneva.
Gabus, A., & Fontela, E. (1973). Perceptions of the world problematique: communication proce-dure. Communicating with Those Bearing Collective Responsibility, Battelle Geneva ResearchCentre, Switzerland, Geneva.
Ghorabi, M. J. O. A., & Attari, M. (2013). Advancing environmental evaluation in cement indus-try in Iran. Journal of Cleaner Production, 41, 23–30.
Ginevičius, R., Podvezko, V., Novotny, M., & Komka, A. (2012). Comprehensive quantitativeevaluation of the strategic potential of an enterprise. Economic computation and economiccybernetics studies and research, 46, 65–84.
Ho, W. R. J., Tsai, C. L., Tzeng, G. H., & Fang, S. K. (2011). Combined DEMATEL techniquewith a novel MCDM model for exploring portfolio selection based on CAPM. Expert Systemswith Applications, 38, 16–25.
Hsu, C. H., Wang, F. K., & Tzeng, G. H. (2012). The best vendor selection for conducting therecycled material based on a hybrid MCDM model combining DANP with VIKOR.Resources, Conservation and Recycling, 66, 95–111.
Hung, Y. H., Chou, S. C. T., & Tzeng, G. H. (2011). Knowledge management adoption andassessment for SMEs by a novel MCDM approach. Decision Support Systems, 51, 270–291.
Hwang, C. L., & Yoon, K. (1981). Multiple attribute decision making-methods and applications.Heidelberg: Springer-Verlag.
Kalibatas, D., Zavadskas, E. K., & Kalibatiene, D. (2011). The concept of the ideal indoor envi-ronment in multi-attribute assessment of dwelling-houses. Archives of Civil and MechanicalEngineering, 11, 89–101.
Kannan, G., Murugesan, P., Senthil, P., & Haq, A. N. (2009). Multicriteria group decision makingfor the third party reverse logistics service provider in the supply chain model using fuzzyTOPSIS for transportation services. International Journal of Services Technology and Man-agement, 11, 162–181.
Kavosi, M., & Mavi, R. K. (2011). Fuzzy quality functiondeployment approach using TOPSISand analytic hierarchy process methods. International Journal of Productivity and QualityManagement, 7, 304–324.
Khazaeni, G., Khanzadi, M., & Afshar, A. (2012). Optimum risk allocation model for constructioncontracts: Fuzzy TOPSIS approach. Canadian Journal of Civil Engineering, 39, 789–800.
Lashgari, A., Fouladgar, M. M., Yazdani-Chamzini, A., & Skibniewski, M. J. (2011). Using anintegrated model for shaft sinking method selection. Journal of Civil Engineering and Man-agement, 17, 569–580.
Lashgari, A., Yazdani-Chamzini, A., Fouladgar, M. M., Zavadskas, E. K., Shafiee, S., & Abbate,N. (2012). Equipment selection using fuzzy multi criteria decision making model: Key studyof gole gohar iron mine. Inzinerine Ekonomika-Engineering Economics, 23, 125–136.
Lee, A. H. I., Chen, H. H., & Kang, H. Y. (2011). A model to analyze strategic products forphotovoltaic silicon thin-film solar cell power industry. Renewable and Sustainable EnergyReviews, 15, 1271–1283.
Liao, Y. J., Ye, K. H., Fu, H. Y., & Ma, L. (2012). Evaluation of urban regeneration project planswith an integrated model based on analytic network process. Applied Mechanics and Materi-als, 253-255, 102–105.
Maity, S. R., & Chakraborty, S. (2013). Grinding wheel abrasive material selection using fuzzytopsis method. Materials and Manufacturing Processes, 28, 408–417.
Economic Research-Ekonomska Istraživanja 343
Dow
nloa
ded
by [
79.1
33.2
39.8
] at
22:
36 2
9 O
ctob
er 2
014
Mun, J. (2002). Real option analysis tools and techniques for valuing strategic investments anddecisions. USA: John Wiley & Sons.
Munthali, T. C. (2012). Interaction of public and private investment in Southern Africa: Adynamic panel analysis. International Review of Applied Economics, 26, 597–622.
Nejati, M., Nejati, M., & Shafaei, A. (2009). Ranking airlines’ service quality factors using afuzzy approach: study of the Iranian society. International Journal of Quality & ReliabilityManagement, 26, 247–260.
Okoli, R. O., Onah, F. E., Amalaha, R. O., & Nwosu, O. C. (2007). Domestic macroeconomicpolicies and private fixed capital formation in Nigeria: a VAR approach. Retrieved from www.hull.ac.uk/php/ecskrb/.../Obiora.19324.1183224825.
Özgen, A., Tuzkaya, G., Tuzkaya, U. R., & Özgen, D. (2011). A multi-criteria decision makingapproach for machine tool selection problem in a fuzzy environment. International Journal ofComputational Intelligence Systems, 4, 431–445.
Palevičius, V., Paliulis, G. M., Venckauskaite, J., & Vengrys, B. (2013). Evaluation of the require-ment for passenger car parking spaces using multi-criteria methods. Journal of Civil Engineer-ing and Management, 19, 49–58.
Pengfei, H., & Yimin, H. (2000). Real option valuation in high-tech firm. Retrieved from gupea.ub.gu.se/bitstream/2077/2490/1/Pengfei_1999_14.PDF.
Ramezani, M., Bashiri, M., & Atkinson, A. C. (2011). A goal programming-TOPSIS approach tomultiple response optimization using the concepts of non-dominated solutions and predictionintervals. Expert Systems with Applications, 38, 9557–9563.
Saaty, T. L. (1980). The analytic hierarchy process. New York, NY: McGraw-Hill.Sadeghzadeh, K., & Salehi, M. B. (2011). Mathematical analysis of fuel cell strategic technologies
development solutions in the automotive industry by the TOPSIS multi-criteria decision mak-ing method. International Journal of Hydrogen Energy, 36, 13272–13280.
Samvedi, A., Jain, V., & Chan, F. T. S. (2013). Quantifying risks in a supply chain through inte-gration of fuzzy AHP and fuzzy TOPSIS. International Journal of Production Research, 51,2433–2442.
Simanaviciene, R., Liaudanskiene, R., & Ustinovichius, L. (2012). A new synthesis method ofstructural, technological and safety decisions (SyMAD-3). Journal of Civil Engineering andManagement, 18, 265–276.
Singh, R. K., & Benyoucef, L. (2011). A fuzzy TOPSIS based approach for e-sourcing. Engineer-ing Applications of Artificial Intelligence, 24, 437–448.
Sotirov, G. R., & Krasteva, E. B. (1994). An approach to group decision making under uncer-tainty with application to project selection. Annals of Operations Research, 51, 115–126.
Staniūnas, M., Medineckienė, M., Zavadskas, E. K., & Kalibatas, D. (2013). To modernize or not:Ecological–economical assessment of multi-dwelling houses modernization. Archives of Civiland Mechanical Engineering, 14, 114–121.
Streimikiene, D. (2013). Assessment of road transport technologies based on GHG emissionreduction potential and costs. Transformations in Business & Economics, 12, 138–147.
Streimikiene, D., & Balezentiene, L. (2012). Assessment of electricity generation technologiesbased on GHG emission reduction potential and costs. Transformations in Business & Eco-nomics, 11, 333–343.
Tamošaitienė, J., Šipalis, J., Banaitis, A., & Gaudutis, E. (2013). Complex model for the assess-ment of the location of high-rise buildings in the city urban structure. International Journal ofStrategic Property Management, 17, 93–109.
Tan, Y., Shen, L., Langston, C., & Liu, Y. (2010). Construction project selection using fuzzyTOPSIS approach. Journal of Modelling in Management, 5, 302–315.
Tian, J., Yu, D., Yu, B., & Ma, S. (2013). A fuzzy TOPSIS model via chi-square test for informa-tion source selection. Knowledge-Based Systems, 37, 515–527.
Trigeorgis, L. (1996). Real options managerial flexibility and strategic in resource allocation.London: The MIT Press Cambridge.
Tsai, W. H., Chou, W. C., & Lai, C. W. (2010). An effective evaluation model and improvementanalysis for national park websites: A case study of Taiwan. Tourism Management, 31,936–952.
Tsai, W. H., & Hsu, W. (2010). A novel hybrid model based on DEMATEL and ANP for select-ing cost of quality model development. Total Quality Management & Business Excellence, 21,439–456.
344 A. Yazdani-Chamzini et al.
Dow
nloa
ded
by [
79.1
33.2
39.8
] at
22:
36 2
9 O
ctob
er 2
014

Tseng, M. L. (2009). Using the extension of DEMATEL to integrate hotel service quality perceptionsinto a cause-effect model in uncertainty. Expert Systems with Applications, 36, 9015–9023.
Tseng, M. L. (2011). Using hybrid MCDM to evaluate the service quality expectation in linguisticpreference. Applied Soft Computing, 11, 4551–4562.
Tzeng, G. H., Chiang, C. H., & Li, C. W. (2007). Evaluating intertwined effects in e-learning pro-grams: A novel hybrid MCDM model based on factor analysis and DEMATEL. Expert Sys-tems with Applications, 32, 1028–1044.
Tzeng, G. H., & Huang, C. Y. (2012). Combined DEMATEL technique with hybrid MCDMmethods for creating the aspired intelligent global manufacturing & logistics systems. Annalsof Operations Research, 197, 159–190.
Uçal, İ., & Kahraman, C. (2009). Fuzzy real options valuation for oil investments. Technologicaland Economic Development of Economy, 15, 646–669.
Uysal, F., & Tosun, Ö. (2012). Fuzzy TOPSIS-based computerized maintenance management sys-tem selection. Journal of Manufacturing Technology Management, 23, 212–228.
Wang, J. W., Cheng, C. H., & Huang, K. C. (2009). Fuzzy hierarchical TOPSIS for supplier selec-tion. Applied Soft Computing, 9, 377–386.
Wang, T. C., Lee, H. D., & Cheng, P. H. (2009). Applying fuzzy TOPSIS approach for evaluatingRFID system suppliers in healthcare industry. new advances in intelligent decision technolo-gies. Studies in Computational Intelligence, 199, 519–526.
Wei, P. L., Huang, J. H., Tzeng, G. H., & Wu, S. I. (2010). Causal modeling of web-advertisingeffects by improving SEM based on DEMATEL technique. International Journal of Informa-tion Technology & Decision Making, 9, 799–829.
World Bank. (2006). World development indicators. ESDS International: University of Manchester.Wu, W. W. (2008). Choosing knowledge management strategies by using a combined ANP and
DEMATEL approach. Expert Systems with Applications, 35, 828–835. www.essec.edu, www.tradingeconomics.com.
Yang, Y. P. O., Shieh, H. M., & Tzeng, G. H. (2013). A VIKOR technique based on DEMATEL andANP for information security risk control assessment. Information Sciences, 232, 482–500.
Yazdani-Chamzini, A., Fouladgar, M. M., Zavadskas, E. K., & Moini, S. H. (2013). Selecting theoptimal renewable energy using multi criteria decision making. Journal of Business Econom-ics and Management, 14, 957–978.
Yazdani-Chamzini, A., & Yakhchali, S. H. (2012). Handling equipment selection in open pitmines by using an integrated model based on group decision making. International Journal ofIndustrial Engineering Computations, 3, 907–924.
Yazdani-Chamzini, A., & Yakhchali, S. H. (2012). Tunnel Boring Machine (TBM) selection usingfuzzy multicriteria decision making methods. Tunnelling and Underground Space Technology,30, 194–204.
Yazgan, H. R., Boran, S., & Goztepe, K. (2010). Selection of dispatching rules in FMS: ANPmodel based on BOCR with choquet integral. The International Journal of AdvancedManufacturing Technology, 49, 785–801.
Zadeh, L. A. (1965). Fuzzy sets. Information and Control, 8, 338–353.Zavadskas, E. K., Turskis, Z., Volvaciovas, R., & Kildiene, S. (2013). Multi-criteria assessment
model of technologies. Studies in Informatics and Control, 22, 249–258.Zavadskas, E. K., Ustinovichius, L., & Stasiulionis, A. (2004). Multicriteria valuation of commer-
cial construction projects for investment purposes. Journal of Civil Engineering and Manage-ment, 10, 151–166.
Zavadskas, E. K., Sušinskas, S., Daniūnas, A., Turskis, Z., & Sivilevičius, H. (2012). Multiplecriteria selection of pile-column construction technology. Journal of Civil Engineering andManagement, 18, 834–842.
Zeydan, M., & Çolpan, C. (2009). A new decision support system for performance measurementusing combined fuzzy TOPSIS/DEA approach. International Journal of Production Research,47, 4327–4349.
Zhou, S., Sun, J., Li, K., & Yang, X. (2013). Development of a root cause degree procedure formeasuring intersection safety factors. Safety Science, 51, 257–266.
Zolfani, S. H., Rezaeiniya, N., & Saparauskas, J. (2012). Selecting the best multi-role artist ofrock bands of Iran 2000s by applying ANP and TOPSIS grey. Economic Computation andEconomic Cybernetics Studies And Research, 46, 193–211.
Economic Research-Ekonomska Istraživanja 345
Dow
nloa
ded
by [
79.1
33.2
39.8
] at
22:
36 2
9 O
ctob
er 2
014


![[Demographic analysis of illiteracy in Iran] L'analyse demographique de l'analphabetisme en Iran](https://img.pdfslide.net/doc/110x75/6331f4db8d2c463a5800a317/demographic-analysis-of-illiteracy-in-iran-lanalyse-demographique-de-lanalphabetisme.jpg)


