Embed Size (px)
Citation preview

New Developments in Peritoneal Dialysis

© Trijntje Tjitske Cnossen, Maastricht 2012
Layout: Tiny Wouters
Cover: Jeannot Driedonkx
Production: Datawyse Maastricht
ISBN: 978-94-6159-127-2
/ Universitaire Pers

New Developments in Peritoneal Dialysis
PROEFSCHRIFT
Ter verkrijging van de graad van doctor aan de Universiteit Maastricht,
op gezag van de Rector Magnificus, Prof. mr. G.P.M.F. Mols,
volgens het besluit van het College van Decanen, in het openbaar te verdedigen
op donderdag 29 maart 2012 om 14.00 uur
door
Trijntje Tjitske Cnossen
Geboren op 19 maart 1975 te Sneek
UNIVERSITAIREPERS MAASTRICHT
U P
M

Promotor Prof. dr. K.M.L. Leunissen Co-Promotores Dr. J.P. Kooman Dr. C.J.A.M. Konings, Catharina Ziekenhuis, Eindhoven Beoordelingscommissie Prof. dr. A.P. Gorgels (voorzitter) Prof. dr. T. Delhaas
Dr. B. Lindholm, Karolinska University Hospital, Stockholm, Zweden Prof. dr. C.D.A. Stehouwer
Dr. D.G. Struijk, Academisch Medisch Centrum, Amsterdam
Financial support by the Dutch Heart Foundation for the publication of this
thesis is gratefully acknowledged.

Voor mijn ouders
Aan Geert,
Jelle, Wybe en ♥


Contents
Chapter 1 General introduction and outline of the thesis 9
Part I: Monitoring of peritoneal transport 23 Chapter 2 Influence of the preceding dwell time on the peritoneal 25
equilibration test with 3.86% glucose solution in automated peritoneal dialysis
Chapter 3 Quantification of free water transport during the peritoneal 35
equilibration test Part II: Treatment prescription 45
Chapter 4 Comparison of outcomes on continuous ambulatory 47 peritoneal dialysis versus automated peritoneal dialysis: results from a USA database
Chapter 5 Fluid state and blood pressure control; no differences 59 between automated and continuous ambulatory peritoneal dialysis
Chapter 6 The influence of Physioneal® on advanced glycation 71 end-products and inflammatory markers in plasma and dialysate in patients on CAPD
Part III: Peritoneal dialysis in heart failure 81 Chapter 7 Peritoneal dialysis in patients with congestive heart failure 83
Chapter 8 Retrospective analysis of peritoneal dialysis in patients 91 with primary cardiac failure complicated by renal failure Chapter 9 Prospective study on the clinical effects of renal replacement 105
therapy in treatment-resistant congestive heart failure Chapter 10 General discussion and summary 119
Samenvatting 133
Dankwoord 145 Curriculum vitae 149
Publications 153


9
Chapter 1 General introduction

10Chapter 1

General introduction11
Introduction
Peritoneal dialysis (PD) is the second most commonly used modality of renal replacement therapy. Other modalities of renal replacement therapy are hemodialysis and transplantation. The utilization of PD worldwide varies greatly between various countries1. Whereas it is by far the most commonly used dialysis modality in Hong Kong and Mexico (above 80%), in other countries such as Germany, the USA or Japan, only a relatively small percentage patients (<5%) are treated with PD. In 2010, there were in the Netherlands 6292 patients treated with dialysis, of which 5155 (82%) were on hemodialysis and only 1137 (18%) were treated with PD (www.renine.nl). These differences in PD utilization rate appear to be mainly related to local or national preferences, or factors such as patient education or reimbursement, but not to large differences in outcome between hemodialysis and PD2. There is even circumstantial evidence that the outcome of patients, especially non-diabetics, is superior during the first years on PD compared to hemodialysis. This is probably because a better preservation of residual renal function (RRF)3−6. In 1976, Popovich and Moncrief introduced PD as a new therapy in end-stage renal disease7, which is based upon the removal of excess of waste products and water using the peritoneum as a biological dialysis membrane. Today, PD has become a fully accepted treatment modality. Despite its long-term experience, there are still several unresolved issues in PD therapy, some of which will be described in this chapter. Among others, these issues are related to monitoring of peritoneal transport, the prescription of the PD treatment itself, and the use of PD in emerging indications, notably heart failure complicated by severe renal disease. This thesis is subdivided in 3 parts, in which some of these unresolved issues in PD are addressed.
Monitoring of peritoneal transport
With PD, the blood is cleansed by means of instillation of sterile dialysis fluid in the peritoneal cavity through an abdominal catheter, leading to exchange of fluid and solutes between the peritoneal cavity and capillaries of the peritoneal membrane. Movement of solutes are based on diffusion and convection over the peritoneal membrane, whereas fluid is removed (ultrafiltered) by a crystalloid osmotic pressure gradient induced (in conventional dialysis solutions) by the hyperosmotic dialysis solutions, usually different glucose based concentrations (1.36%/1.5%, 2.27%/2.5% or 3.86%/4.25% glucose)5. Solute and fluid transport is size-selective (intrinsic permeability) and occurs through a system of pores, the so-called three-pore model. According this model, fluid and low molecular weight solutes transport occurs primarily through a large number of small pores with radii of about 40 Å, whereas

12Chapter 1
macromolecular solutes transport occurs through a small number of large pores with a size >150 Å. Though the ultrasmall transcellular pores with radii <5 Å are exclusively permeable to water and not to solutes. These ultrasmall pores are identified as aquaporin-1 channels in peritoneal capillaries and venules of humans and rats8 and are responsible for the solute-free water transport. The resistance of the small pores (expressed as the reflection coefficient) for passage of glucose, is relatively low (0.03). The efficacy of glucose (diameter 1 nm) to act as an osmotic agent is mainly dependent upon the high reflection coefficient (1.0) of the aquaporin channels5. Transport properties of the peritoneal membrane can be measured to characterize the functional status of the membrane during follow-up of PD treatment by performing a peritoneal equilibration test (PET). The PET was in 1987 introduced by Twardowski et al. and originally performed during a 4-hour dwell with a 2.27%/2.5% glucose solution9. The dialysate-to-plasma ratio (D/P) of creatinine at the end of the PET and the dialysate-to-initial dialysate ratio of glucose at 240 minutes (D240/D0) are calculated and used as parameters of solute transport. Drained volume is also measured at the end of the test. Today, according the International Society of Peritoneal Dialysis (ISPD) Committee on ultrafiltration, a 3.86%/4.25% glucose solution is standardized for the PET10. A test with 3.86%/4.25% glucose provides better information on ultrafiltration failure because the larger drained volume compared to the 2.27%/2.5% glucose solution makes the result less subject to measurement errors and is more sensitive for detecting clinically significant ultrafiltration failure. In addition, in the initial phase of the more hypertonic glucose solution, 3.86%/4.25% glucose, free water transport is induced by the hypertonic glucose solution. Free water transport is especially marked during the first hour of a hypertonic dwell. This results in a decrease in the sodium concentration in the dialysate through dilution by water present due to free water transport. This phenomenon is called sodium sieving11. The maximum dip in dialysate sodium is often reached after one hour. Sodium sieving is less pronounced with the use of the glucose polymer icodextrin (average molecular weight 18kD in contrast to 180D for glucose), which stimulates sodium and water transport through the small pores by an oncotic pressure gradient8,11,12. In addition, free water transport occurs through the intracellular aquaporin-1 channels and accounts for almost 35-40% of total ultrafiltration during the first hour of a 3.86%/4.25% glucose dwell, but can vary between 15% and 80%13,14. Free water transport decreases to 20% after 4 hours due to absorption of glucose14. During treatment with PD, morphological alterations of the peritoneal membrane may lead to impaired aquaporin function, which will result in loss of

General introduction13
free water transport and consequently in loss of sodium sieving. Impaired free water transport may contribute to especially long-term ultrafiltration failure in PD. A reduced peritoneal ultrafiltration is one of the predominant parameters for the failure of PD treatment12,15−18. It may lead to overhydration19, especially in anuric patients, which is a high risk factor for cardiovascular morbidity and mortality17,18. Reduced ultrafiltration is mainly related to a fast transport capacity of the peritoneal membrane for low molecular weight solutes, leading to rapid glucose absorption from the dialysate and a decline in the osmotic gradient. The fast transport status is acquired in the majority of patients, but may also be present at the start of PD treatment5, which is called late ultrafiltration failure20. Ultrafiltration failure is defined as an ultrafiltration volume below 400 ml after 4 hours of a standardized 3.86%/4.25% glucose PET, during which at least ultrafiltration volume, as well as D/P creatinine ratio and D/Do glucose is measured as a marker of the transport rate for small solutes. However, also the preceding dwell might theoretically effects the ultrafiltration volume during PET. E.g. if ultrafiltration during the preceding dwell was high, the ultrafiltration volume during PET might be lower. This might for instance be of concern during automated PD (APD). Ultrafiltration per time unit during short dwells might be higher as compared to long dwells, and therefore results of PETs might be affected. This issue was addressed in chapter 2, in which the results of PET testing with long or short preceding dwells were compared. If the diagnosis of ultrafiltration failure is made, it is important to distinguish between the two main types of ultrafiltration failure, which have a different pathophysiology and prognosis. The first is the so-called early ultrafiltration failure, which is present at the initiation of dialysis treatment and generally associated with a good prognosis. The pathophysiology of this entity has not yet been completely elucidated, but is possibly related to an increase in mesothelial cell mass and an increase in the peritoneal surface available for diffusion5. This leads to a rapid diffusive transport of small solutes, such as glucose and a rapid dissipation of the osmotic gradient. In addition, the lymphatic absorption is increased. Free water transport is not impaired, as shown by a high D/P gradient, showing that water can be removed without concomitant removal of sodium. Although, as will be discussed later, sodium sieving during actual treatment is in general not a favourable phenomenon, its presence after a 1-hour dwell using the so-called mini-peritoneal equilibration test (mini-PET) points at intact free water transport mechanisms21. In contrast, so-called late ultrafiltration failure is associated with vascular abnormalities in the peritoneal membrane and increased fibrosis, and often related to co-morbidity. This form of ultrafiltration failure is associated with an adverse prognosis17 and may be a risk factor for encapsulating peritoneal sclerosis, a dreaded complication of PD with a high mortality22. Using the

14Chapter 1
standardized PET with a 3.86%/4.25% glucose solution, it is not possible to differentiate between the two types of ultrafiltration failure, as ultrafiltration volume during a standard 4-hour dwell is below 400 ml in both types. La Milia et al. developed the mini-PET to calculate the free water clearance after a 1-hour dwell period performed with a 3.86%/4.25% glucose solution21. Using this mini-PET with a dwell time of 1-hour, the presence of a low D/P ratio, pointing at impaired free water transport, is much higher in the late ultrafiltration group5. A problem in clinical practice is to combine the mini-PET, which gives an indication of free water transport, but no reliable data with regard to the presence of ultrafiltration failure or the D/P creatinine ratio, with those of the standardized PET. A potential solution could be a temporary drainage of the peritoneal cavity after 1-hour sample taking in order to estimate free water transport, followed by reinfusion and performance of the PET after 4 hours. However, it is not known whether this procedure has an impact on the results of the 4-hour PET results. Therefore, in chapter 3, the results of a temporary drainage and dialysate sampling, followed by reinfusion, for calculation of free water transport, of the standardized PET were compared with a standardized PET without a temporary drainage with regard to the D/P ratio of creatinine and Dt/D0 ratio of glucose.
Treatment prescription in peritoneal dialysis
The second part of the thesis focuses on different modalities of PD treatment. In general, two treatment modalities are available for the patient in PD. The first is continuous ambulatory PD (CAPD) in which the exchanges are performed manually by the patient or a caretaker. The second modality is APD, in which the exchanges are performed automatically by a device. The most commonly performed APD modality is continuous cyclic PD (CCPD) with automated exchanges during nighttimes and, in general, a single dwell during daytime. In general, the automatic exchanges are performed more rapidly as compared to CAPD, resulting in shorter dwell times. An important advantage of APD is the larger freedom of the patient during daytime. Therefore, this modality is often preferred by patients for lifestyle reasons23. In addition24, in patients with high peritoneal transport rates of the peritoneal membrane (more permeable), more rapid exchanges would theoretically lead to improved fluid removal, as the influx of glucose from the dialysate to the peritoneal capillaries reduced due to the shorter dwell times. However, especially in patients with slower transport rates of the peritoneum, rapid exchanges may also have a theoretical drawback, as the removal of sodium (through the small pores) from dialysate to patient may lag behind the transport of water (through the ultrasmall pores), which is also called sodium sieving. The tendency for plasma sodium to increase may lead to increased thirst and possibly volume overload. Indeed,

General introduction15
some studies showed a reduced sodium removal and a higher incidence of hypertension in patients treated with APD25−27. Although in another study, no relation between sodium removal and blood pressure control was observed28. However, also given the relation between daily sodium removal and mortality in PD, these observations may be clinically relevant29. In addition, possibly due to more rapid fluid exchanges during APD and the need for more hypertonic glucose exchanges, as compared to the more gradual fluid removal profile during CAPD, RRF was shown to decrease more rapidly in APD patients as compared to CAPD patients27,30,31. However, most of these studies have been performed before the use of icodextrin for the long dwell. Icodextrin is a glucose polymer with a prolonged and more gradual ultrafiltration and an improved sodium removal as compared to standard hypertonic glucose solutions, which makes it suitable for use during long dwells. The use of icodextrin was shown to result in an improvement in fluid status and left ventricular hypertrophy in patients on PD32,33. However, after the introduction of icodextrin, only few studies have compared sodium removal, fluid status and blood pressure control between CAPD and APD patients34. The PD modality may also have an effect on other clinically relevant parameters. One of the most common complications of PD treatment is peritonitis, most often due to contamination with skin-born bacteria, which may be introduced by connection and disconnection of the tubing connections from the catheter35. The reduced number of connections with APD might theoretically result in a reduced peritonitis rate. Indeed, several small randomized trials showed a reduction in peritonitis rates, but results from large registry data are not unequivocal36-38. Whether the different characteristics of APD and CAPD result in differences in technique and patient survival has not been definitely established. A recent systematic review of randomized trials did not show significant differences in patient or technique survival between APD and CAPD patients36, although the power of the included trials was limited. Also, in several observational studies no difference in outcome between CAPD and APD was observed39,40. However, in one large registry study from the USA a reduction in technique failure was observed with the use of APD41, whereas in a Mexican study patient survival was improved in APD patients42. Summarizing, because of the differences in results in various reports, there is still a need for comparative studies between APD and CAPD patients with regard to important clinical and outcome parameters. In chapter 4, course of RRF, patient and technique survival were compared between APD and CAPD treatment in a large cohort study. In chapter 5, sodium removal, volume status and blood pressure control was compared between patients treated with APD and CAPD.

16Chapter 1
Apart from the treatment modality, also the prescription of dialysis fluid has an impact on the treatment of PD patients. Long-term PD results in adverse effects on the peritoneal membrane, such as mesothelial cell damage, peritoneal membrane thickening and vascular abnormalities, and may as such be a pivotal contributor to ultrafiltration failure, as discussed in the first parapgraph43. In recent years, the use of dialysis solutions with low concentrations of so called glucose degradation products (GDP) has increased. In contrast to conventional glucose-containing single-compartment dialysis solutions, GDP formation is greatly reduced in multi-compartment dialysis solutions44, because the glucose-containing compartment can be sterilized at a lower pH without the other components. Moreover, in some newer PD solutions bicarbonate has (partly) replaced lactate as buffer, which reduced the acidity of the solutions. All these changes are suggested to result in an improved biocompatibility as compared to standard glucose solutions45. Various in vitro studies have shown positive effects of low GDP solutions on peritoneal membrane integrity45. Clinical data are less unequivocal. In randomized studies, an increase in CA-125 (as a marker of mesothelial cell mass) and a reduction in IL-6 (as a marker of peritoneal inflammation) was observed in peritoneal effluent with the use of low GDP solutions46,47. Somewhat surprisingly, a reduction in ultrafiltration volume was observed with the use of low GDP solutions in the Euro-Balance trial48, a phenomenon which was not observed in another randomized trial49. Two retrospective surveys have suggested a survival benefit of low GDP solutions50,51. However, due to the observational nature and methodological concerns, these data should be interpreted with some caution. One of the factors which may play a role in peritoneal membrane damage is accumulation of advanced glycation end-products (AGEs), which may be stimulated by GDPs52. Accumulation of AGEs in the peritoneal membrane was observed in patients with ultrafiltration failure53. Several AGE products have been identified. Well characterized AGE products with potential patho-physiological significance are N-(carboxyethyl)lysine (CEL) and N-(carboxymethyl)lysine (CML)54,55. Until now, the effects of more biocompatible PD solutions on CEL and CML levels have not been compared. In chapter 6, the effect of low GDP versus standard glucose-containing solutions on CML and CEL levels in peritoneal effluent was assessed in a randomized study.
Peritoneal dialysis in heart failure
Apart from the use of PD in end-stage renal failure per se, the possibility for gradual fluid removal may also be of use for patients with cardiac failure. As reviewed recently, cardiac failure and chronic renal failure frequently coincide

General introduction17
in which the disturbance in function of both organs may lead to adverse and self-perpetuating interactions. Recently, the term cardiorenal syndrome (CRS) was adopted and defined as “a pathophysiological disorder of the heart and kidneys whereby acute or chronic dysfunction in one organ may induce acute or chronic dysfunction in the other organ”. For instance, kidney damage due to reduced renal perfusion may compromise fluid and sodium removal, which in itself may worsen cardiac function and initiate a self-perpetuating cycle56,57. In the literature, 5 different subtypes of the CRS are distinguished56 (Table 1.1). Table 1.1 Classification of cardiorenal syndrome.
Type Definition CRS type 1 (acute cardiorenal syndrome)
Acute worsening of cardiac function leading to acute kidney injury
CRS type 2 (chronic cardiorenal syndrome)
Chronic abnormalities in cardiac function (e.g. chronic congestive heart failure) causing progressive and potentially permanent chronic kidney disease
CRS type 3 (acute renocardiac syndrome)
Acute worsening of renal function causing acute cardiac dysfunction
CRS type 4 (chronic renocardiac syndrome)
Chronic kidney disease contributing to progressive cardiac dysfunction
CRS type 5 (secondary cardiorenal syndrome)
Systemic conditions causing simultaneous cardiac and renal dysfunction
This part of the thesis focuses mainly on the CRS type 2. The pathogenesis of this entity is complex and not yet completely elucidated. An important factor is most likely the reduction in cardiac output, leading to chronic hypoperfusion of the kidney and subsequent renal fibrosis and sclerosis. However, not only a reduction in systolic function, but also diastolic dysfunction is related to kidney disease. No difference between left ventricular ejection fraction (LVEF) and renal function was observed in patients with heart failure58. Possibly, also other factors than chronic hypoperfusion are related to chronic kidney dysfunction in heart failure, such as endothelial dysfunction and excessive production of vasoconstrictors such as endothelin. A reduction in glomerular filtration rate below 45 ml/min was shown to be an independent predictor for mortality in patients with heart failure59. Also in another study, a decline in renal function was an independent predictor of outcome58. Treatment of patients with CRS is notoriously difficult60. The most important of treatment is the support of cardiac function and relieve of symptoms due to

18Chapter 1
fluid overload, for instance with loop diuretics. However, especially in patients with severe cardiac failure, this may be difficult to achieve and diuretic-resistance may ensue, in which even treatment with high dose loop diuretics is unable to result in sufficient relief. In these patients, frequent hospitalization is often required, together resulting in a reduction in quality of life. The prognosis of these patients, i.e. patients with severe and diuretic unresponsive cardiac failure who are not eligible for heart transplantation is in general dismal. In one study, a 1-year mortality rate of 74% was observed in patients with end-stage heart failure treated with conservative therapy61. In patients with primary cardiac failure complicated by severe renal failure, extracorporeal therapies may be the only method to correct fluid status. However, in clinical practice, this is not always applied due to the dismal prognosis of the patients and the difficulties in achieving adequate fluid removal. For instance, when intermittent dialysis therapies are used, the rapid fluid shifts in combination with the impaired cardiac function, patients may be at high risk for hypotension62 and cardiac ischemia63. In patients with acute heart failure and moderately disturbed renal function (CRS type 1), continuous venovenous or peripheral ultrafiltration resulted in an improvement volume removal, translating in a reduced number of readmissions64. However, this treatment is, at least in the Netherlands, not yet available for the home setting. Moreover, with peripheral ultrafiltration, adequate removal of uremic waste solutes or the correction of electrolyte and acid base disturbances cannot be achieved in patients with end-stage renal disease. Gradual fluid removal, as well as (partial) correction of the uremic milieu can also be achieved with PD. Several small studies have shown that PD may be useful in the treatment of CRS type 2. In most studies, an improvement of the functional status and a reduction in hospitalization was observed compared to historical data65-68. However, given the small number of included patients and the absence of prospective data, there is a need for further studies on the effect of PD on important clinical outcome parameters such as cardiac function, functional status, and outcome. Chapter 7 comprises of a literature review on the experience with PD in the treatment of patients with treatment-resistant congestive heart failure. In chapter 8, a retrospective analysis is described on the treatment of chronic resistant heart failure, complicated by severe renal failure (CRS type 2), from a local perspective. In chapter 9, patients known with treatment-resistant congestive heart failure were prospectively followed after initiation of dialysis, and the effects on quality of life, functional status and cardiac function were assessed. In chapter 10 were the results of the thesis put into perspective with data from the literature.

General introduction19
References
1. Lo WK. Peritoneal dialysis utilization and outcome: what are we facing? Perit Dial Int 2007;27(Suppl 2):S42-47.
2. Jiwakanon S, Chiu YW, Kalantar-Zadeh K, Mehrotra R. Peritoneal dialysis: an underutilized modality. Curr Opin Nephrol Hypertens 2010;19:573-577.
3. Krediet RT, Boeschoten EW, Dekker FW. Why is the evidence favoring hemodialysis over peritoneal dialysis misleading? Semin Dial 2007;20:205-208.
4. Korevaar JC, Feith GW, Dekker FW, van Manen JG, Boeschoten EW, Bossuyt PM, Krediet RT; NECOSAD Study Group. Effect of starting with hemodialysis compared with peritoneal dialysis in patients new on dialysis treatment: a randomized controlled trial. Kidney Int 2003;64:2222-2228.
5. Coester AM, Smit W, Struijk DG, Krediet RT. Peritoneal function in clinical practice: the importance of follow-up and its measurement in patients. Recommendations for patient information and measurement of peritoneal function. NDT Plus 2009;2:104-110.
6. Van den Wall Bake AWL, Kooman JP, Lange JM, Adequacy of peritoneal dialysis and the importance of preservingresidual renal function. Nephrol Dial Transplant 2006;21(Suppl 2); 2:34-37.
7. Popovich RP, Moncrief JW, Decherd JF, Bomar JF, Pyle WK. The definition of a novel/wearable equilibrium peritoneal dialysis technique. Am J Artif Organs 1976;5:64-68.
8. García–López E, Lindholm B. Icodextrin metabolites in peritoneal dialysis. Perit Dial Int 2009;29:370-376.
9. Twardowski ZJ, Nolph KD, Khanna R, Prowant BF, Ryan LP, Moore HL, et al. Peritoneal equilibration test. Periton Dial Bull 1987;7:138-147.
10. Mujais S, Nolph K, Gokal R, Blake P, Burkart J, Coles G, Kawaguchi Y, Kawanishi H, Korbet S, Krediet R, Lindholm B, Oreopoulos D, Rippe B, Selgas R. Evaluation and management of ultrafiltration problems in peritoneal dialysis. International Society of Peritoneal Dialysis ad hoc committee on ultrafiltration management in peritoneal dialysis. Perit Dial Int 2000;20(Suppl 4):S5-21.
11. Ho-dac-Pannekeet MM, Schouten N, Langendijk MJ, Hiralall JK, de Waart DR, Struijk DG, Krediet RT. Peritoneal transport characteristics with glucose polymer based dialysate. Kidney Int 1996:50:979-986.
12. Nishimura K, Kamiya Y, Miyamoto K, Nomura S, Horiuchi T. Molecular weight of polydisperse icodextrin effects its oncotic contribution to water transport. Journal of Artificial Organs 2008;11;165-169.
13. Smit W, Struijk DG, Ho-Dac-Pannekeet MM, Krediet RT. Quantification of free water transport in peritoneal dialysis. Kidney Int 2004;66:849-854.
14. Parikova A, Smit W, Struijk DG, Zweers MM, Krediet RT. The contribution of free water transport and small pore transport to the total fluid removal in peritoneal dialysis. Kidney Int 2005;68:1849-1856.
15. Lin X, Lin A, Ni Z, Yao Q, Zhang W, Yan Y, Fang W, Gu A, Axelsson J, Qian J. Daily peritoneal ultrafiltration predicts patient and technique survival in anuric peritoneal dialysis patients. Nephrol Dial Transplant 2010;25:2322-2327.
16. Ates K, Nergizoglu G, Keven K et al. Effect of fluid and sodium removal on mortality in peritoneal dialysis patients. Kidney Int 2001;60:767-776.
17. Brown EA, Davies SJ, Rutherford P et al. Survival of functionally anuric patients on automated peritoneal dialysis: the European APD Outcome Study. J Am Soc Nephrol 2003;14:2948-2957.
18. Jansen MA, Termorshuizen F, Korevaar JC et al. Predictors of survival in anuric peritoneal dialysis patients. Kidney Int 2005;68:1199-1205.
19. Konings CJ, Kooman JP, Schonck M, Struijk DG, Gladziwa U, Hoorntje SJ, van der Wall Bake AW, van der Sande FM, Leunissen KM. Fluid status in CAPD patients is related to peritoneal transport and residual renal function: evidence from a longitudinal study. Nephrol Dial Transplant 2003;18:797-803.

20Chapter 1
20. Smit W, Parikova A. The difference in causes of early and late ultrafiltration failure in peritoneal dialysis. Perit Dial Int 2005;25(Suppl 3):S41-45.
21. La Milia V, Di Filippo S, Crepaldi M, Del Vecchio L, Dell'Oro C, Andrulli S, Locatelli F. Mini-peritoneal equilibration test: a simple and fast method to assess free water and small solute transport across the peritoneal membrane; Kidney Int 2005;68:840-846.
22. Sampimon DE, Coester AM, Struijk DG, Krediet RT. The time course of peritoneal transport parameters in peritoneal dialysis patients who develop encapsulating peritoneal sclerosis. Nephrol Dial Transplant 2011;26:291-298.
23. Wilson J, Nissenson AR: Determinants in APD selection. Semin Dial 2002;15:388-392. 24. Diaz-Buxo J. Continuous cycling peritoneal dialysis, PD plus, and high-flow automated
peritoneal dialysis: a spectrum of therapies. Perit Dial Int 2000;20(Suppl 2):93-97. 25. Rodriguez-Carmona A, Fontan MP: Sodium removal in patients undergoing CAPD and
automated peritoneal dialysis. Perit Dial Int 2002;22:705-713. 26. Ortega O, Gallar P, Carreno A, Gutierrez M, Rodriguez I, Oliet A, Vigil A, Gimenez E:
Peritoneal sodium mass removal in continuous ambulatory peritoneal dialysis and automated peritoneal dialysis: Influence on blood pressure control. Am J Nephrol 2001;21:189-193.
27. Rodriguez-Carmona A, Perez-Fontan M, Garca-Naveiro R, Villaverde P, Peteiro J: Compared time profiles of ultrafiltration, sodium removal, and renal function in incident CAPD and automated peritoneal dialysis patients. Am J Kidney Dis 2004;44:132-145.
28. Boudville NC, Cordy P, Millman K, Fairbairn L, Sharma A, Lindsay R, Blake PG. Blood pressure, volume, and sodium control in an automated peritoneal dialysis population. Perit Dial Int 2007;27:537-543.
29. Ateş K, Nergizoğlu G, Keven K, Sen A, Kutlay S, Ertürk S, Duman N, Karatan O, Ertuğ AE. Effect of fluid and sodium removal on mortality in peritoneal dialysis patients. Kidney Int 2001;60:767-776.
30. Selby NM, Fonseca S, Hulme L, Fluck RJ, Taal MW, McIntyre CW: Automated peritoneal dialysis has significant effects on systemic hemodynamics. Perit Dial Int 2006;26:328-335.
31. Hufnagel G, Michel C, Queffeulou G, Skhiri H, Damieri H, Mignon F. The influence of automated peritoneal dialysis on the decrease in residual renal function. Nephrol. Dial Transplant 1999;14:1224-1228.
32. Konings CJ, Kooman JP, Schonck M, Gladziwa U, Wirtz J, van den Wall Bake AW, Gerlag PG, Hoorntje SJ, Wolters J, van der Sande FM, Leunissen KM. Effect of icodextrin on volume status, blood pressure and echocardiographic parameters: a randomized study Kidney Int 2003;63:1556-1563.
33. Davies SJ, Woodrow G, Donovan K, Plum J, Williams P, Johansson AC, Bosselmann HP, Heimbürger O, Simonsen O, Davenport A, Tranaeus A, Divino Filho JC. Icodextrin improves the fluid status of peritoneal dialysis patients: results of a double-blind randomized controlled trial. J Am Soc Nephrol 2003;14:2338-2344.
34. Davison SN, Jhangri GS, Jindal K, Pannu N. Comparison of volume overload with cycler-assisted versus continuous ambulatory peritoneal dialysis. Clin J Am Soc Nephrol 2009;4:1044-1050.
35. Monteón F, Correa-Rotter R, Paniagua R, Amato D, Hurtado ME, Medina JL, Salcedo RM, García E, Matos M, Kaji J, Vázquez R, Ramos A, Schettino MA, Moran J. Prevention of peritonitis with disconnect systems in CAPD: a randomized controlled trial. The Mexican Nephrology Collaborative Study Group. Kidney Int 1998;54:2123-2128.
36. Rabindranath KS, Adams J, Ali TZ, Daly C, Vale L, Macleod AM. Automated vs continuous ambulatory peritoneal dialysis: a systematic review of randomized controlled trials. Nephrol Dial Transplant 2007;22:2991-2998.
37. Holley JL, Bernardini J, Piraino B. Continuous cycling peritoneal dialysis is associated with lower rates of catheter infections than continuous ambulatory peritoneal dialysis. Am J Kidney Dis 1990;16:133-136.
38. Piraino B, Sheth H. Peritonitis - does peritoneal dialysis modality make a difference? Blood Purif 2010;29:145-149.

General introduction21
39. Michels WM, Verduijn M, Boeschoten EW, Dekker FW, Krediet RT; for the NECOSAD Study Group. Similar Survival on Automated Peritoneal Dialysis and Continuous Ambulatory Peritoneal Dialysis in a Large Prospective Cohort. Clin J Am Soc Nephrol 2009;4:943-949.
40. Badve SV, Hawley CM, McDonald SP, Mudge DW, Rosman JB, Brown FG, Johnson DW. Automated and continuous ambulatory peritoneal dialysis have similar outcomes. Kidney Int 2008;73:480-488.
41. Mujais S, Story K. Peritoneal dialysis in the US: evaluation of outcomes in contemporary cohorts. Kidney Int Suppl 2006:103:S21-26.
42. Sanchez AR, Madonia C, Rascon-Pacheco RA. Improved patient/technique survival and peritonitis rates in patients treated with automated peritoneal dialysis when compared to continuous ambulatory peritoneal dialysis in a Mexican PD center. Kidney Int Suppl 2008;(108):S76-80.
43. Davies SJ, Phillips L, Naish PF, Russell GI: Peritoneal glucose exposure and changes in membrane solute transport with time on peritoneal dialysis. J Am Soc Nephrol 2001;12:1046-1051.
44. Posthuma N, ter Wee PM, Niessen H, Donker AJ, Verbrugh HA, Schalkwijk CG. Amadori albumin and advanced glycation end-product formation in peritoneal dialysis using icodextrin. Perit Dial Int 2001;21:43-51.
45. Chaudhary K, Khanna R. Biocompatible peritoneal dialysis solutions: do we have one? Clin J Am Soc Nephrol 2010;5:723-732.
46. Pajek J, Kveder R, Bren A, Gucek A, Ihan A, Osredkar J, Lindholm B: Short-term effects of a new bicarbonate/lactate-buffered and conventional peritoneal dialysis fluid on peritoneal and systemic inflammation in CAPD patients: A randomized controlled study. Perit Dial Int 2008;28:44-52.
47. Choi HY, Kim DK, Lee TH, Moon SJ, Han SH, Lee JE, Kim BS, Park HC, Choi KH, Ha SK, Han DS, Lee HY: The clinical usefulness of peritoneal dialysis fluids with neutral pH and low glucose degradation product concentration: An open randomized prospective trial. Perit Dial Int 2008;28:174-182.
48. Williams JD, Topley N, Craig KJ, Mackenzie RK, Pischetsrieder M, Lage C, Passlick-Deetjen J: The Euro-Balance Trial. The effect of a new biocompatible peritoneal dialysis fluid (balance) on the peritoneal membrane. Kidney Int 2004;66:408-418.
49. Szeto CC, Chow KM, Lam CW, Leung CB, Kwan BC, Chung KY, Law MC, Li PK. Clinical biocompatibility of a neutral peritoneal dialysis solution with minimal glucose degradation products–a 1-year randomized control trial. Nephrol Dial Transplant 2007;22:552-559.
50. Lee HY, Choi HY, Park HC, Seo BJ, Do JY, Yun SR, Song HY, Kim YH, Kim YL, Kim DJ, Kim YS, Kim MJ, Shin SK. Changing prescribing practice in CAPD patients in Korea: Increased utilization of low GDP solutions improves patient outcome. Nephrol Dial Transplant 2006;21:2893-2899.
51. Lee HY, Park HC, Seo BJ, Do JY, Yun SR, Song HY, Kim YH, Kim YL, Kim DJ, Kim YS, Ahn C, Kim MJ, Shin SK. Superior patient survival for CAPD patients treated with a peritoneal dialysis fluid with neutral pH and low glucose degradation product concentration (BALANCE). Perit Dial Int 2005;25:248-255.
52. Weiss MF, Erhard P, Kader-Attia FA, Wu YC, Deoreo PB, Araki A, Glomb MA, Monnier VM. Mechanisms for the formation of glycoxidation products in end-stage renal disease. Kidney Int 2000;57:2571-2585.
53. Honda K, Nitta K, Horita S, Yumura W, Nihei H, Nagai R, Ikeda K, Horiuchi S: Accumulation of advanced glycation end products in the peritoneal vasculature of continuous ambulatory peritoneal dialysis patients with low ultrafiltration. Nephrol Dial Transplant 1999;14:1541-1549.
54. Degenhardt TP, Grass L, Reddy S, Thorpe SR, Diamandis EP, Baynes JW. The serum concentration of the advanced glycation end-product N epsilon-(carboxymethyl)lysine is increased in uremia. Kidney Int 1997;52:1064-1067.
55. Ahmed MU, Brinkmann Frye E, Degenhardt TP, Thorpe SR, Baynes JW. N-epsilon-(carboxyethyl)lysine, a product of the chemical modification of proteins by methylglyoxal, increases with age in human lens proteins. Biochem J 1997;324:565-570.

22Chapter 1
56. Ronco C, Chionh C, Haapio M, Anavekar NS, House A, Bellomo R. The cardiorenal syndrome. Blood Purif 2009;27:114-126
57. Ronco C, Haapio M, House AA, Anavekar N, Bellomo R. Cardiorenal syndrome. J AmColl Cardiol 2008;52:1527-1539
58. Bhatia RS, Tu JV, Lee DS, et al. Outcome of heart failure with preserved ejection fraction in a population-based study. N Engl J Med 2006;355:260-269.
59. Hillege HL, Nitsch D, Pfeffer MA, et al. Renal function as a predictor of outcome in a broad spectrum of patients with heart failure. Circulation 2006;113:671-678.
60. House AA, Haapio M, Lassus J, Bellomo R, Ronco C. Therapeutic strategies for heart failure in cardiorenal syndromes. Am J Kidney Dis 2010;56:759-773.
61. Rose EA, Gelijns AC, Moskowitz AJ, Heitjan DF, Stevenson LW, Dembitsky W, Long JW, Ascheim DD, Tierney AR, Levitan RG, Watson JT, Meier P, Ronan NS, Shapiro PA, Lazar RM, Miller LW, Gupta L, Frazier OH, Desvigne-Nickens P, Oz MC, Poirier VL; Randomized Evaluation of Mechanical Assistance for the Treatment of Congestive Heart Failure (REMATCH) Study Group. Long-term use of a left ventricular assist device for end-stage heart failure. N Engl J Med 2001;345:1435-1443.
62. Van der Sande FM, Mulder AW, Hoorntje SJ, Peels KH, van Kuijk WH, Kooman JP, Leunissen KM. The hemodynamic effect of different ultrafiltration rates in patients with cardiac failure and patients without cardiac failure: comparison between isolated ultrafiltration and ultrafiltration with dialysis. Clin Nephrol 1998;50:301-308.
63. Selby NM, McIntyre CW. The acute cardiac effects of dialysis. Semin Dial 2007;20:220–228. 64. Costanzo MR. Ultrafiltration in the management of heart failure. Curr Opin Crit Care
2008;14:524-530. 65. Rubin J, Ball R. Continuous ambulatory peritoneal dialysis as a treatment of severe
congestive heart failure in the face of chronic renal failure. Report of eight cases. Arch Intern Med 1986;146:533-535.
66. Mehrotra R, Khanna R. Peritoneal ultrafiltration for chronic congestive heart failure: rationale, evidence and future. Cardiology 2001;96:177-182.
67. Ryckelynck JP, Lobbedez T, Valette B, Le Goff C, Mazouz O, Levaltier B, Potier JC, Hurault de Ligny B. Peritoneal ultrafiltration and refractory congestive heart failure. Adv Perit Dial 1997;13:93-97.
68. Stegmayr BG, Banga R, Lundberg L, Wikdahl AM, Plum-Wirell M. PD treatment for severe congestive heart failure. Perit Dial Int 1996;32:132-135.

23
Part I Monitoring of peritoneal transport


25
Chapter 2 Influence of the preceding dwell time on the
peritoneal equilibration test with 3.86%
glucose solution in automated peritoneal
dialysis
Trijntje T. Cnossen Charles H. Beerenhout
Constantijn J.A.M. Konings Watske Smit
Jeroen P. Kooman Karel M. Leunissen
Raymond T. Krediet
Perit Dial Int 2010;30:95-98.

26Chapter 2
Abstract
Objective The peritoneal equilibration test (PET) using 3.86% glucose solution is preceded by a long dwell with 3.86% glucose solution. A point of concern in patients treated with automated peritoneal dialysis (APD) is the influence of the preceding short nightly dwells on the results of a standardized PET. The aim of the study was to compare net ultrafiltration, small solute transport, sodium sieving and solute transport type between a PET preceded by a long night dwell and one preceded by short (APD) dwells. Patients and methods 13 stable APD patients (mean age 60 ± 15 years; mean duration of peritoneal dialysis 31 ± 15 months) underwent 2 PETs: 1 preceded by short nightly dwells (PET A) and 1 preceded by a long night dwell (PET B). Results Both PETs were performed within a mean period of 8 (range 5-11) days. Mean total ultrafiltration of PET A was 626 ± 218 ml and PET B was 644 ± 223 ml (NS). The 4-hour results of both tests for dialysate-to-plasma (D/P) ratios of creatinine and urea, Dt/D0 ratios of glucose, and the dip in D/P sodium (sodium sieving) were similar. Classification of transport categories was identical for 10 of 13 patients. Conclusion In APD, the preceding dwell time of a 3.86% glucose PET does not influence fluid transport, solute transport, or transport type.

Influence of preceding dwell 27
Introduction
The transport properties of the peritoneal membrane can be measured to characterize the functional status of the membrane in the follow-up of peritoneal dialysis (PD) patients. The peritoneal equilibration test (PET) was originally performed during a 4-hour dwell with a 2.27%/2.5% glucose dialysis solution1. The International Society for Peritoneal Dialysis (ISPD) committee on ultrafiltration failure has proposed performing peritoneal function tests with a 3.86%/4.25% glucose solution to provide better information on ultrafiltration because the larger drained volume makes the result less subject to measurement errors and is more sensitive in detecting clinically relevant ultrafiltration failure2. In addition, the phenomenon of sodium sieving, associated with a hypertonic glucose solution, offers an assessment of free water transport3. In the initial phase of a dwell with the most hypertonic solution, a decrease of the dialysate sodium concentration by dilution with water is present due to free water transport induced by this solution. The maximum dip in the dialysate sodium concentration is often reached after one hour. The PET was originally developed for continuous ambulatory peritoneal dialysis (CAPD). Part of the standardization for PET was that it had to be preceded by a long dialysis dwell. The use of automated peritoneal dialysis (APD) has increased in many countries. Consequently, the duration of the exchange preceding the PET dwell is usually 2-3 hours. It is unknown whether this could influence the 3.86%/4.25% glucose PET results. Therefore, we compared the results for fluid transport and solute transfer of two PETs in APD patients: one after a nightly APD scheme with short exchanges (PET A) and one after a long night dwell (PET B).
Patients and methods
Thirteen stable APD patients (11 men and 2 women, mean age 60 15 years) treated in the Maxima Medical Center, Veldhoven, and the Catharina Hospital, Eindhoven, The Netherlands, between March 2006 and February 2007, were enrolled in the study. Median duration of PD was 31 15 (range 4-50) months. The patients were peritonitis free at the test, during the 4 weeks preceding the first test, and between the tests. All patients used commercially available dialysis solutions (Baxter Healthcare, IRL, Dublin, Ireland). No patient had any clinical sign of overhydration.

28Chapter 2
All patients gave their written informed consent. The study protocol was approved by the Ethics Committee of the Catharina Hospital, Eindhoven, The Netherlands.
Procedure
Two standardized 3.86% glucose PETs of 4 hours (PET A and PET B) were performed in all patients. The sequence of the tests was randomized. All tests were done using a 3.86% glucose dialysis solution (Physioneal, Baxter Healthcare). The volume was 2 l in all patients and the same volume was used in both tests in every patient. PET A was preceded by a long day dwell (more than eight hours) using 3.86% glucose solution the day before and a nightly APD scheme with short dwells of less than three hours. PET B was performed after a long night dwell of more than eight hours using a 3.86% glucose solution. Urea, creatinine, and sodium were measured in plasma and in dialysate. Glucose was assessed in dialysate. Dialysate samples were taken before instillation of the dialysate and after 60, 120 and 240 minutes. Blood samples were obtained before inflow and at 60 minutes. Ultrafiltration volumes and dialysate-to-plasma (D/P) ratios of the two tests were compared.
Measurements
Plasma and dialysate creatinine, urea, sodium, and glucose were analyzed using an Advia 1650 (Siemens Medical Solutions Diagnostics, San Francisco, CA, USA); the sodium concentrations in plasma and dialysate were analyzed with an ion selective electrode using an indirect method. Urea and glucose were analyzed by enzymatic methods and creatinine by a compensated alkaline picrate method.
Calculations
The ratio of dialysate glucose concentrations was calculated by dividing the dialysate glucose concentration at the start and after 60 and 240 minutes (Dt) by the dialysate glucose concentration at the start (D0). The D/P ratios of creatinine, urea, and sodium were calculated by dividing the concentrations in dialysate at the start and after 60 and 240 minutes by the concentrations in plasma at the same moments (D/P0, D/P60, and D/P240). The dip in the D/P ratio of sodium at 60 minutes was calculated as follows: Dip Na (mmol/l) = NaDialysate In / NaPlasma – NaDialysate Out / NaPlasma,
Influence of preceding dwell 29
where “Dialysate In” is the peritoneal dialysate sodium concentration in millimoles per liter at the start; “Dialysate Out” is the peritoneal dialysate sodium concentration after 60 minutes; and NaPlasma is the plasma sodium concentration in millimoles per liter.
Statistical analyses
Results are expressed as mean values and standard deviations (SD). The Student’s paired t-test was used for comparison of the D/P ratios of both PETs. A P value <0.05 was considered significant. All the statistical analyses were made using SPSS statistical software (release 15.0; SPSS Inc., An IBM Company, Chicago, IL, USA).
Results
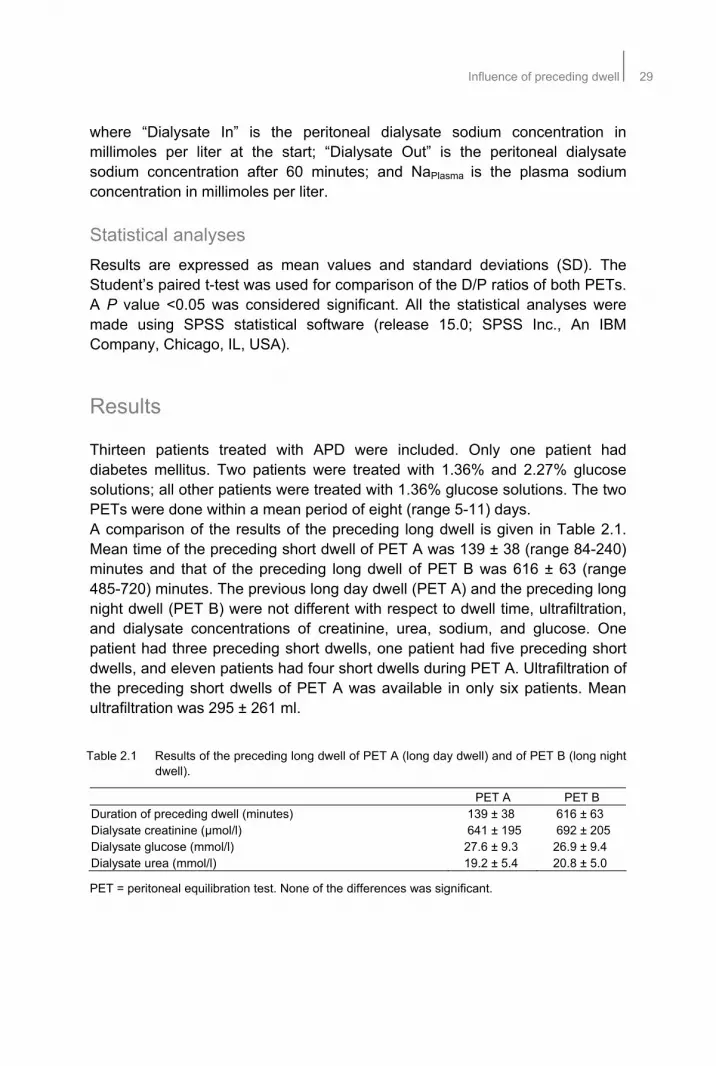
Thirteen patients treated with APD were included. Only one patient had diabetes mellitus. Two patients were treated with 1.36% and 2.27% glucose solutions; all other patients were treated with 1.36% glucose solutions. The two PETs were done within a mean period of eight (range 5-11) days. A comparison of the results of the preceding long dwell is given in Table 2.1. Mean time of the preceding short dwell of PET A was 139 ± 38 (range 84-240) minutes and that of the preceding long dwell of PET B was 616 ± 63 (range 485-720) minutes. The previous long day dwell (PET A) and the preceding long night dwell (PET B) were not different with respect to dwell time, ultrafiltration, and dialysate concentrations of creatinine, urea, sodium, and glucose. One patient had three preceding short dwells, one patient had five preceding short dwells, and eleven patients had four short dwells during PET A. Ultrafiltration of the preceding short dwells of PET A was available in only six patients. Mean ultrafiltration was 295 ± 261 ml.
Table 2.1 Results of the preceding long dwell of PET A (long day dwell) and of PET B (long night dwell).
PET A PET B Duration of preceding dwell (minutes) 139 ± 38 616 ± 63 Dialysate creatinine (μmol/l) 641 ± 195 692 ± 205 Dialysate glucose (mmol/l) 27.6 ± 9.3 26.9 ± 9.4 Dialysate urea (mmol/l) 19.2 ± 5.4 20.8 ± 5.0
PET = peritoneal equilibration test. None of the differences was significant.

30Chapter 2
A comparison of the results of both PETs is given in Table 2.2. Mean total ultrafiltration of PET A was 626 ± 218 ml and of PET B 644 ± 223 ml (NS). Also, no significant differences were found for parameters of solute transport or free water transport, estimed as dip D/P sodium after 60 minutes. Classification of transport categories was identical for 10 of 13 patients (Figure 2.1). Ultrafiltration failure was detected in one patient after PET A and in one other patient after PET B (380 ml and 365 ml respectively). These patients were treated with PD during 50 (PET A) and 26 months (PET B). Table 2.2 Results of PET A (preceded by short night dwells) and PET B (preceded by a long
night dwell).
PET A PET B Ultrafiltration after 4 hours (mL) 626 ± 218 644 ± 223 D/P sodium after 1 hour 0.88 ± 0.022 0.89 ± 0.021 D/P sodium after 2 hours 0.88 ± 0.028 0.88 ± 0.028 D/P creatinine after 1 hour 0.38 ± 0.096 0.40 ± 0.085 D/P creatinine after 2 hours 0.51 ± 0.105 0.54 ± 0.902 D/P creatinine after 4 hours 0.67 ± 0.101 0.71 ± 0.086 Dt/D0 glucose after 1 hour 0.63 ± 0.110 0.65 ± 0.110 Dt/D0 glucose after 2 hours 0.48 ± 0.900 0.47 ± 0.103 Dt/D0 glucose after 4 hours 0.31 ± 0.066 0.30 ± 0.062 D/P urea after 1 hour 0.56 ± 0.088 0.56 ± 0.070 D/P urea after 2 hours 0.73 ± 0.078 0.75 ± 0.069 D/P urea after 4 hours 0.89 ± 0.043 0.90 ± 0.048
PET = peritoneal equilibration test; D/P = dialysate-to-plasma ratio; Dt/D0 = dialysate glucose concentration after t/dialysate glucose concentration at start. None of the differences was significant.
Figure 2.1 Classification of peritoneal membrane transport categories of PET A (preceded by
short night dwells) and PET B (preceded by a long night dwell).
0
1
2
3
4
5
6
7
F FA SA S
PET A
PET B
0
1
2
3
4
5
6
7
F FA SA S
PET A
PET B

Influence of preceding dwell 31
Discussion
Use of the 3.86%/4.25% glucose PET has become the standard for evaluation of peritoneal membrane transport and ultrafiltration failure. However, since the PET with a 2.27%/2.5% glucose solution has been the most widely used test for years to assess peritoneal transport in PD, some concern has been raised about the interpretation of the results when a solution with a different tonicity would be used. In different previous studies comparing “PET parameters” obtained with 1.36%/1.5%, 2.27%/2.5% and 3.86%/4.25% glucose dialysate, no effect of the glucose concentration on D/P creatinine was found4-6. Also reference values for the 3.86%/4.25% glucose PET in a large number of stable PD patients have been published7. Another point of concern has been the influence of the preceding dwell on PET results. When most patients were on CAPD, the prior exchange was approximately eight hours, but with the growing number of patients treated with some form of APD this is no longer the case. Several groups have investigated the influence of a nightly APD scheme compared to a long CAPD dwell on transport parameters in the 2.27%/2.5% PET. Figueiredo et al. found no significant differences for D/P creatinine and Dt/D0 glucose8. Twardowski et al. also investigated the influence of the preceding dwell time in the short 2.27%/2.5% glucose PET9. It appeared that only miniscule differences were present for small solute transport between a preceding dwell time of three or eight hours. However, the D/P ratios for proteins tended to be higher with the longer preceding exchange. This has been ascribed to a higher content of proteins in the residual volume, owing to the longer equilibration time. No information in these studies has been given on net ultrafiltration. Also, the possible influence of the preceding exchange on free water transport, estimated using the maximum dip in D/P sodium in the first phase of the dwell, has not been examined before. In the present study all patients underwent two PETs preceded by different dwell times. Net ultrafiltration and values in dialysate of the preceding long dwell were similar. Parameters of solute transport such as D/P creatinine and urea and the values of Dt/D0 of glucose obtained after 60, 120 and 240 minutes were also not different. This indicates that the duration of the preceding dwell does not influence solute transport or time to equilibration in patients treated with APD. These data of solute transport are supportive of those in previous publications8,9. A 3.86%/4.25% glucose PET is useful in the evaluation of sodium sieving and ultrafiltration failure6. Free water transport occurs through transcellular aquaporin-1 channels and creates a dip in D/P sodium. No influence of the preceding dwell time was found on free water transport or on net ultrafiltration. In addition, classification of the patients as fast, fast average, slow average and

32Chapter 2
slow transporters based on the values of D/P creatinine obtained after both 3.86%/4.25% glucose PETs showed a good agreement of categorization between the two tests. The observed disagreement in three patients shifted them only one peritoneal transport category. In conclusion, the preceding dwell time does not influence peritoneal membrane transport during a standardized 3.86%/4.25% PET. Any preceding dwell time can be used.

Influence of preceding dwell 33
References
1. Twardowski ZJ, Nolph KD, Khanna R, Prowant BF, Ryan LP, Moore HL, Nielsen MP. Peritoneal equilibration test. Perit Dial Bull 1987;7:138-47.
2. ISPD ad hoc committee on ultrafiltration management in peritoneal dialysis. Perit Dial Int 2000;20(Suppl 4):S3-S4.
3. Krediet RT, Lindholm B, Rippe B. Pathophysiology of peritoneal membrane failure. Perit Dial Int 2000;20(Suppl 4):S22-S42.
4. Smit W, Langedijk MJ, Schouten N, van den Berg N, Struijk DG, Krediet RT. A comparison between 1.36% and 3.86% glucose dialysis solution for the assessment of peritoneal membrane function. Perit Dial Int 2000;20:734-741.
5. Pride ET, Gustafson J, Graham A, Spainhour L, Mauck V, Brown P, Burkart J. Comparison of a 2.5% and 4.25% dextrose peritoneal equilibration test. Perit Dial Int 2002;22:365-370.
6. Cara M, Virga G, Mastrosimone S, Girotto A, Rossi V, D'Angelo A, Bonfante L. Comparison of peritoneal equilibration test with 2.27% and 3.86% glucose dialysis solution. J Nephrol 2005;18:67-71.
7. Smit W, Van Dijk P, Langendijk M, Schouten N, van den Berg N, Struijk DG, Krediet RT. Peritoneal function and assessment of reference values using a 3.86% glucose solution. Perit Dial Int 2003;23:440-449.
8. Figueiredo AF, Conti A, Poli-de-Figueiredo C. Influence of preceding exchange on peritoneal equilibration test results. Adv Perit Dial 2002;18:775-777.
9. Twardowski ZJ, Prowant BF, Moore HL, Lou LC, White E, Farris K. Short peritoneal equilibration test: impact of preceding dwell time. Adv Perit Dial 2003;19:53-58.


35
Chapter 3 Quantification of free water transport
during the peritoneal equilibration test
Trijntje T. Cnossen Watske Smit
Constantijn J.A.M. Konings Jeroen P. Kooman Karel M. Leunissen
Raymond T. Krediet
Perit Dial Int 2009;29(5):523-527

36Chapter 3
Abstract
Objective Free water transport (FWT) can be calculated after a dwell of one hour with a 3.86% glucose solution using sodium kinetics (mini-PET, as developed by LaMilia et al.). This requires measurement of the intraperitoneal volume after drainage of the abdomen. Since valuable information of a 4-hour peritoneal equilibration test (PET) may be lost, the aim of the present study was to investigate whether temporary drainage of the peritoneal cavity after 1 hour and re-instillation thereafter would influence the results of the 4-hour PET. Methods Two PETs were performed in 10 stable peritoneal dialysis (PD) patients (mean age 59 ± 13 years, mean duration on PD 33 ± 15 months) within a mean period of 54 (range 13-104) days: one standardised 4-hour-PET using 3.86% glucose (PET A) and one with drainage after one hour followed by re-instillation (PET B). Results Mean total ultrafiltration (UF) of PETs A and B was 667 ± 210 ml and 621 ± 206 ml (NS). Mean FWT at 60 minutes was 164 ± 74 ml and mean UF through the small pores was 204 ± 181 ml; FWT correlated well with total UF (r = 0.720, P = 0.019). Classification of transport categories was identical for nine of the ten patients. Comparison of 1-hour and 4-hour results in test B showed a good correlation between dialysate-to-plasma ratios (D/P) of creatinine and urea and Dt/D0 ratios of glucose. Conclusion A 4-hour 3.86% glucose PET, including temporary drainage after one hour for assessment of FWT, does not influence the results of D/P creatinine and Dt/D0 glucose and gives essential additional information on aquaporin function.
Quantification of free water transport during the peritoneal equilibration test 37
Introduction
The transport properties of the peritoneal membrane can be measured to characterize the functional status of the membrane during the follow up of peritoneal dialysis (PD) patients. The peritoneal equilibration test (PET) was originally performed during a 4-hour dwell with a 2.27%/2.3% glucose dialysis solution1. The dialysate-to-plasma ratio (D/P) of creatinine at the end of the procedure and the dialysate-to-initial dialysate ratio of glucose at 240 minutes (D240/D0) are calculated and used as parameters of solute transport. Drained volume is also measured. The International Society for Peritoneal Dialysis (ISPD) committee on ultrafiltration (UF) failure proposed performance of peritoneal function tests with 3.86%/4.25% glucose solution instead of 2.27%/2.5% glucose, as was common practice during the previous decade2. A test with 3.86%/4.25% glucose solution provides better information on UF because the larger drained volume makes the result less subject to measurement errors and is more sensitive for detecting clinically significant UF failure. In addition, the phenomenon of sodium sieving associated with a hypertonic glucose solution offers an assessment of aquaporin-mediated water transport3. In the initial phase of the more hypertonic solution, 3.86%/4.25% glucose, there is a decrease in dialysate sodium concentration through dilution by water present due to free water transport induced by the hypertonic glucose solution. The maximum dip in the dialysate sodium concentration is often reached after one hour. Osmotically induced water transport occurs through small interendothelial pores and through intracellular water channels (aquaporin-1) present in the endothelium of peritoneal capillaries and venules4. Free water transport occurs through those channels and is especially marked during the first hour of a hypertonic dwell. Free water transport accounts for almost half of the UF in this first phase of a hypertonic dwell and correlates well with the maximum dip in D/P sodium5. Impaired aquaporin function will result in loss of free water transport and consequently in loss of sodium sieving. LaMilia et al. developed a simple and fast method to asses free water and small solute transport across the peritoneal membrane6. Free water transport is calculated after a dwell of one hour with 3.86%/4.25% glucose using the kinetics of sodium transport; however, this requires measurement of intraperitoneal volume after one hour. In the present study we investigated whether temporary drainage of the peritoneal cavity after one hour to measure the intraperitoneal volume, followed by reinfusion, would influence the results of the 4-hour PET.

38Chapter 3
Patients and methods
Ten stable PD patients (5 men, 5 women; mean age 59 ± 13 years) were enrolled in the study. The duration of PD was 33 ± 15 (range 4-52) months. The patients were peritonitis free during the 4 weeks preceding the first test, during the tests, and between the two tests. All patients used commercially available dialysis solutions (Baxter Healthcare, IRL, Dublin, Ireland). No patient had any clinical sign of overhydration. All patients gave their written informed consent. The Ethics Committee of the Catharina Hospital, Eindhoven, The Netherlands, approved the study protocol.
Procedure
Two standardized 4-hour 3.86% glucose PETs (PET A and PET B) were performed in all patients. The sequence of the tests was randomized. All tests were done with Physioneal (Baxter Healthcare) and the volume was 2 l in each patient. During PET A, the dialysis solution was continuously in the intraperitoneal cavity during the four hours. The volume of the dialysis solution was determined by weight between flushing and infusion. Blood samples were taken after complete infusion of the dialysis solution and after 60 and 240 minutes (P0, P60 and P240, respectively). During the first minute after complete infusion of 2 l dialysis solution and after 60 and 240 minutes, 10 ml of peritoneal dialysate (D0, D60 and D240, respectively) was sampled. After 240 minutes, the drained volume was collected and weighed. During PET B, an additional measurement of UF volume after one hour was performed by total drainage of the peritoneal cavity; the volume was reinfused immediately. Blood and dialysate samples were taken at instillation of the dialysate and after 60 and 240 minutes. Urea, creatinine, and sodium were measured in plasma and in dialysate. Glucose was assessed in dialysate. Ultrafiltration volumes and D/P ratios from the two PETs were compared.
Measurements
Plasma and dialysate creatinine, urea, sodium, and glucose were analyzed using a Advia 1650 (Siemens Medical Solutions Diagnostics, San Francisco, CA, USA); sodium concentrations in plasma and dialysate were analyzed with an ion-selective electrode using an indirect method. Urea and glucose were analyzed with enzymatic methods and creatinine with a compensated alkaline picrate method.

Quantification of free water transport during the peritoneal equilibration test 39
Calculations
Ratios of dialysate glucose concentrations were calculated by dividing the dialysate glucose concentration at the start and after 60 and 240 minutes (Dt) by the dialysate glucose concentration at the start (D0). The D/P ratios of creatinine, urea, and sodium were calculated by dividing the concentrations obtained at the start and after 60 and 240 minutes in dialysate by the concentrations in plasma at the same moments (D/P0, D/P60, D/P240). The dip in D/P sodium was calculated as
Dip D/P sodium = NaDialysate in/ NaPlasma 0 – NaDialysate out / NaPlasma t ’
where “Dialysate in” is the peritoneal dialysate sodium concentration at the start and “Dialysate out” is the peritoneal dialysate sodium concentration at 60 minutes or at the end of the PET; NaPlasma 0 is the plasma sodium concentration at start and NaPlasma t is the plasma sodium concentration at time point 60 minutes or 240 minutes. Ultrafiltration through small pores during the first 60 minutes of a dwell was calculated from the amount of sodium transported during that period. Assuming that the small pore system provides no hindrance to the transport of sodium, UF can be calculated as
Amount of sodium transported Plasma sodium concentration
Where the amount of sodium transported is the difference between the amount of sodium in the drained volume after 60 minutes (volume x NaDialysate out) and the instilled amount (volume x NaDialysate in). Free water transport is the difference between total UF at 60 minutes and small pore fluid transport. Its contribution to total fluid transport is expressed as a percentage of total UF.
Statistical analyses
Results are expressed as mean values and standard deviations (SD). The Student’s paired t-test was used for comparison of the D/P ratios for the two PETs. Correlation analyses were used to investigate possible relationships between free water transport and total UF, between D/P ratios of creatinine and urea after 60 minutes and 240 minutes, and between Dt/D0 ratios of glucose after 60 minutes and 240 minutes. A P value >0.05 was considered significant. All statistical analyses were made using SPSS 12.0 (SPSS Inc., Chicago, IL, USA).

40Chapter 3
Results
Five patients treated with continuous ambulatory PD and 5 patients treated with automated PD were included. The two PETs were done within a mean period of 53 days (median 58 days, range 13-104 days). A comparison of the two PETs is given in Table 3.1. No significant differences were found for drained volume after 4 hours or for parameters of solute transport. Classification of transport categories was identical for nine of the ten patients. Table 3.1 Results of PET A (no temporary drainage) and PET B (with temporary drainage of the
intraperitoneal volume after 60 minutes).
PET A PET B Total UF after four hours (ml) 667 ± 210 621 ± 206 Dip D/P sodium 0.873 ± 0.0287 Small-pore transport after 60 minutes (ml) NA 204 ± 181 Free water transport after 60 minutes (ml) NA 164 ± 74 Free water transport (%) NA 49.7 ± 20.8 D/P creatinine after four hours 0.637 ± 0.095 0.636 ± 0.100 Dt/D0 glucose after four hours 0.420 ± 0.102 0.368 ± 0.0909 D/P urea after four hours 0.922 ± 0.0569 0.925 ± 0.0586 None of the differences was significant.
(PET = peritoneal equilibration test; UF = ultrafiltration; D/P = dialysate-to-plasma ratio; Dt/D0 = dialysate-to-initial dialysate ratio of glucose at time t; NA = not assessed)
Free water transport was related to total UF after four hours (Figure 3.1). Relationships between values at 60 minutes and 240 minutes for D/P creatinine, D/P urea and Dt/D0 glucose are shown in Figure 3.2.
Figure 3.1 Correlation of free water transport after 60 minutes and net ultrafiltration after 240
minutes (r = 0.720, P = 0.019).
50 100 150 200 250 300
Free Water Transport 60 minutes (ml)
400
500
600
700
800
900
1000
1100
Net
Ultr
aFilt
ratio
n24
0 m
inu
tes
R Sq Linear = 0,509
50 100 150 200 250 300
Free Water Transport 60 minutes (ml)
400
500
600
700
800
900
1000
1100
Net
Ultr
aFilt
ratio
n24
0 m
inu
tes
R Sq Linear = 0,509

Quantification of free water transport during the peritoneal equilibration test 41
D/P creatinine 60 minutes0,600,550,500,450,400,350,30
D/P
crea
tin
ine
240
min
ute
s
0,80
0,75
0,70
0,65
0,60
0,55
0,50
R Sq Linear = 0,785
0,45 0,50 0,55 0,60 0,65 0,70 0,75
D/P urea 60 minutes
0,80
0,85
0,90
0,95
1,00
D/P
ure
a24
0 m
inu
tes
R Sq Linear = 0,788
0,550 0,600 0,650 0,700 0,750 0,800 0,850
Dt/D0 glucose 60 minutes
0,250
0,300
0,350
0,400
0,450
0,500
0,550
Dt/
D0
glu
cose
240
min
ute
s
R Sq Linear = 0,905
D/P creatinine 60 minutes0,600,550,500,450,400,350,30
D/P
crea
tinin
e24
0 m
inut
es
0,80
0,75
0,70
0,65
0,60
0,55
0,50
R Sq Linear = 0,785
0,45 0,50 0,55 0,60 0,65 0,70 0,75
D/P urea 60 minutes
0,80
0,85
0,90
0,95
1,00
D/P
ure
a24
0 m
inut
esR Sq Linear = 0,788
0,550 0,600 0,650 0,700 0,750 0,800 0,850
Dt/D0 glucose 60 minutes
0,250
0,300
0,350
0,400
0,450
0,500
0,550
Dt/D
0 gl
ucos
e 24
0 m
inut
es
R Sq Linear = 0,905
D/P creatinine 60 minutes0,600,550,500,450,400,350,30
D/P
crea
tin
ine
240
min
ute
s
0,80
0,75
0,70
0,65
0,60
0,55
0,50
R Sq Linear = 0,785
0,45 0,50 0,55 0,60 0,65 0,70 0,75
D/P urea 60 minutes
0,80
0,85
0,90
0,95
1,00
D/P
ure
a24
0 m
inu
tes
R Sq Linear = 0,788
0,550 0,600 0,650 0,700 0,750 0,800 0,850
Dt/D0 glucose 60 minutes
0,250
0,300
0,350
0,400
0,450
0,500
0,550
Dt/
D0
glu
cose
240
min
ute
s
R Sq Linear = 0,905
D/P creatinine 60 minutes0,600,550,500,450,400,350,30
D/P
crea
tinin
e24
0 m
inut
es
0,80
0,75
0,70
0,65
0,60
0,55
0,50
R Sq Linear = 0,785
0,45 0,50 0,55 0,60 0,65 0,70 0,75
D/P urea 60 minutes
0,80
0,85
0,90
0,95
1,00
D/P
ure
a24
0 m
inut
esR Sq Linear = 0,788
0,550 0,600 0,650 0,700 0,750 0,800 0,850
Dt/D0 glucose 60 minutes
0,250
0,300
0,350
0,400
0,450
0,500
0,550
Dt/D
0 gl
ucos
e 24
0 m
inut
es
R Sq Linear = 0,905
A B C Figure 3.2 Correlations between dialysate-to-plasma (D/P) ratios of creatinine (A) and urea (B),
and Dt/D0 ratios of glucose (C) after 60 minutes and 240 minutes during peritoneal equilibration test B.
Discussion
Fluid transport induced by a crystalloid osmotic pressure gradient during PD is composed of small pore fluid transport and free water transport3,7. The latter occurs through aquaporin-1 8. The contribution of both pathways can be calculated by comparing the transport of sodium and water4,6. The first hour of a dialysis dwell is the preferred time because UF rates are high and effects of confounding factors, such as lymphatic absorption and diffusion of sodium, are small. However, for the calculation of sodium transport, the intraperitoneal volume after one hour is required. The present study showed that a temporary drainage of the peritoneal cavity to allow measurement of the drained volume and for dialysate sampling, followed by reinfusion, allows the calculation of free water transport without influencing UF or solute transport after four hours. The results obtained for free water transport were in line with those of LaMilia et al.6 and with the results obtained in studies using a volume marker9. It could be argued that measurement of peritoneal function should only be done using a dwell of one hour, but this would have a profound effect on solute transport rates. The present study and others10 showed good correlation between D/P creatinine after one and four hours, but the one hour value was always markedly higher than the expected one calculated from a 4-hour dwell10,11. This has been found previously for mass transfer area coefficients. The highest values were found during the first hour of a dwell, due probably to a non-specific effect of instillation of the dialysis fluid12. It follows from these

42Chapter 3
findings that a 4-hour dwell is the best way to measure peritoneal solute transport. Why is assessment of free water transport important? A number of studies have suggested or shown that impaired free water transport as a contributing cause of UF failure is especially present in long-term PD patients13-16 and probably indicates more severe membrane damage than neo-angiogenesis only. This is supported by the relationship between free water transport and osmotic conductance to glucose16. Early detection of a decrease in free water transport might identify patients at risk for the development of severe membrane alterations but much more data are necessary to substantiate this hypothesis. The method investigated in the present study makes it feasible to obtain them also in routine clinical practice. It can be concluded that measurement of free water transport after one hour is possible during a 3.86%/4.25% glucose PET. It is a valuable addition to current methods for assessment of the peritoneum as a dialysis membrane.

Quantification of free water transport during the peritoneal equilibration test 43
References
1. Twardowski ZJ, Nolph KD, Khanna R, Prowant BF, Ryan LP, Moore HL, et al. Peritoneal equilibration test. Perit Dial Bull 1987;7:138-147.
2. ISPD ad hoc committee on ultrafiltration management in peritoneal dialysis. Perit Dial Int 2000;20(Suppl 4):S3-4.
3. Krediet RT, Lindholm B, Rippe B. Pathophysiology of peritoneal membrane failure. Perit Dial Int 2000;20(Suppl 4):S22-42.
4. Smit W, Struijk DG, Ho-dac-Pannekeet MM, Krediet RT. Quantification of free water transport in peritoneal dialysis. Kidney Int 2004;66:849-854.
5. Pannekeet MM, Mulder JB, Weening JJ, Struijk DG, Zweers MM, Krediet RT. Demonstration of aquaporin-CHIP in peritoneal tissue of uremic and CAPD patients. Perit Dial Int 1996;16(Suppl 1):S54-7.
6. LaMilia V, Di Filippo S, Crepaldi M, Del Vecchio L, Dell’oro C, Andrulli S et al. Mini-peritoneal equilibration test: A simple and fast method to assess free water and small solute transport across the peritoneal membrane. Kidney Int 2005;68:840-846.
7. Parikova A, Smit W, Zweers MM, Struijk DG, Krediet RT. Free water transport, small pore transport and the osmotic gradient. Nephrol Dial Transplant 2008;23:2350-2365.
8. Ni J, Verbavatz JM, Rippe A, Boisdé I, Moulin P, Rippe B et al. Aquaporin-1 plays an essential role in water permeability and ultrafiltration during peritoneal dialysis. Kidney Int 2006; 69:1518-1525.
9. Parikova A, Smit W, Struijk DG, Zweers MM, Krediet RT. The contribution of free water transport and small pore transport to the total fluid removal in peritoneal dialysis. Kidney Int 2005;68:1849-1856.
10. Rodriguez AS, Silva S, Bravo F, Oliveira JC, Fonseca I, Cabrita A, Krediet RT. Peritoneal membrane evaluation in routine clinical practice. Blood Purif 2007;25:497-504.
11. Waniewski J, Heimburger O, Werynski A, Lindholm B. Diffusive mass transport coefficients are not constant during a single exchange in continuous ambulatory peritoneal dialysis. ASAIO J 1996;42:518-523.
12. Imholtz ALT, Koomen GCM, Struijk DG, Arisz L, Krediet RT. Fluid and solute transport in CAPD patients using ultralow sodium dialysate. Kidney Int 1994;46:333-340.
13. Davies SJ. Longitudinal relationship between solute transport and ultrafiltration capacity in peritoneal dialysis patients. Kidney Int 2004;66:2437-2445.
14. Smit W, Schouten N, van den Berg N, Langedijk M, Struijk DG, Krediet RT et al. Analysis of the prevalence and causes of ultrafiltration failure during long term peritoneal dialysis: a cross sectional study. Perit Dial Int 2004;24:562-570.
15. Smit W, Parikova A, Struijk DG, Krediet RT. The difference in causes of early and late ultrafiltration failure in peritoneal dialysis. Perit Dial Int 2005;25(Suppl 3):S41-45.
16. Parikova A, Smit W, Struijk DG, Krediet RT. Analysis of fluid transport pathways and their determinants in peritoneal dialysis patients with ultrafiltration failure. Kidney Int 2006;70: 1988-1994.


45
Part II Treatment prescription


47
Chapter 4 Comparison of outcomes on continuous
ambulatory peritoneal dialysis versus
automated peritoneal dialysis: results from a
USA database
Trijntje T. Cnossen
Len Usvyat Peter Kotanko
Frank M. van der Sande Jeroen P. Kooman
Mary Carter Karel M. L. Leunissen
Nathan W. Levin
Perit Dial Int 2011;31:679-684.

48Chapter 4
Abstract
Background and objective Automated peritoneal dialysis (APD) is being increasingly used as an alternative to continuous ambulatory peritoneal dialysis (CAPD). However, there has been concern regarding reduced sodium removal leading to hypertension and resulting in a faster decline in residual renal function (RRF). The objective of the present study was to compare patient and technique survival and other relevant parameters between patients treated with APD and patients treated with CAPD. Methods Data for incident patients were retrieved from the database of the Renal Research Institute, New York. Treatment modality was defined 90 days after the start of dialysis treatment. In addition to technique and patient survival, RRF, blood pressure, and laboratory parameters were also compared. Results 179 CAPD and 441 APD patients were studied. Mean as-treated survival was 1407 days [95% confidence interval (CI) 1211 - 1601] in CAPD patients and 1616 days [95% CI 1478 - 1764] in APD patients. Adjusted hazard ratio (HR) for mortality was 1.31 in CAPD compared to APD [95% CI 0.76 - 2.25, NS]. Unadjusted as-treated technique survival was lower in CAPD as compared to APD, with HR of 2.84 [95% CI 1.65 - 4.88, P = 0.002]; adjusted HR was 1.81 [95% CI 0.94 - 3.57, P = 0.08]. Peritonitis rate was 0.3 episodes/patient-year for CAPD and APD; exit-site/tunnel infection rate was 0.1 and 0.3 episodes/patient-year for CAPD and APD respectively [NS]. Conclusions Patient survival was not significantly different between APD and CAPD patients, whereas technique survival appeared to be higher in APD patients and could not be explained by differences in infectious complications. No difference in blood pressure control or in decline in RRF was observed between the 2 modalities. Based on these results, APD appears to be an acceptable alternative for CAPD, although technique prescription should always follow individual judgment.

Comparison of outcomes on CAPD versus APD: results from a USA database 49
Introduction
Automated peritoneal dialysis (APD) is an attractive alternative to continuous ambulatory peritoneal dialysis (CAPD), because it provides more freedom to the patients since most exchanges can take place during nighttime. The most frequently used APD modality is continuous cycling peritoneal dialysis (CCPD). Moreover, especially in patients with a high transport status, which is characterized by a rapid absorption of glucose and water during a dwell, the more frequent exchanges with APD might be beneficial for fluid management1. On the other hand, the short dwells with APD might lead to reduced sodium removal (“sodium sieving”)2, this might have clinical significance as sodium removal in peritoneal dialysis (PD) patients was found to be related to hypertension control3 and even survival4. In addition, some studies have found a faster decline in residual renal function (RRF) with the use of APD5,6. On the other hand, the incidence of peritonitis was found to be lower with CCPD7. Whether these differences affect outcome is uncertain. A systematic review of three small randomized trials with a total of 139 patients did not show differences in survival between APD and CAPD patients1,8. Recently, in the NECOSAD database, no difference in outcome between CAPD and APD was observed, although only 87 patients on APD could be studied9. Comparable results were reported by the Australia and New Zealand Dialysis and Transplant Registry10, in which no differences in adjusted mortality or technique failure between APD and CAPD patients were observed. In contrast, in US patients a reduced technique failure was observed with the use of APD11,12, whereas improved patient survival in APD patients was observed in a Mexican study13. Apart from the Baxter database reports11,12, limited data on US patients are available. However, due to the increasing use of APD in the US11, more data on potential differences between both modalities would be useful. The objectives of the present study were to compare treatment outcome between CAPD and CCPD patients, and to analyze potential differences in important surrogate outcome parameters such as blood pressure control, serum albumin levels and RRF.
Methods
This is a retrospective cohort study from the Renal Research Institute (RRI, New York) database that includes all patients who started PD treatment from 2001 to 2008. RRI peritoneal dialysis patients are treated in 21 clinical centers primarily concentrated in New York State with some additional clinics in Connecticut, North Carolina, California, Michigan, and Illinois. Except three clinics, all clinics have both in-center hemodialysis patients and PD programs.

50Chapter 4
PD programs vary in size from as small as 2 patients to as large as 80 patients. PD population represents about seven percent of all patients treated within RRI clinics. However, about 33% of the patients studied were treated in PD-only programs. It is the decision of the nephrologist to choose between either CAPD or APD. The vast majority of APD patients have a daytime dwell, generally with dextrose but some with icodextrin (Baxter®). The nephrologist may also decide what solutions (Fresenius® or Baxter®) to use for PD. In general no low GDP solutions are used, about 30% of patients use icodextrin (Baxter®). In this study data from 887 patients with dialysis treatment are available. Of these patients, only those who were treated with PD treatment from 90 days after the start of chronic dialysis treatment were included (n = 620). In agreement with the NECOSAD cohort, the 90 days period was chosen because patient outcome or switch to another therapy is more likely to be due to the initial health status of the patient. The PD treatment modality (CAPD or APD) was defined three months after the start of (any) dialysis treatment. Patients were censored for renal transplantation, switch to any other treatment modality for a period longer than 90 days, death, or loss of follow-up.
Description RRI database
Baseline data were collected as averaged values for the first 90 days after the start of chronic dialysis and laboratory and adequacy parameters were expressed as time-averaged values from three months after the start of dialysis treatment until the time of censoring for comparison between CAPD and APD. Laboratory examinations were performed monthly, while data on dialysis adequacy and RRF were assessed every three months. Peritonitis is reviewed monthly in the CQI meetings. If for one reason, peritonitis would not have been registered, it would be a random error and not be expected to affect differences between CAPD and APD. Technique survival was assessed as the switch from CAPD or APD to hemodialysis treatment. Unlike the NECOSAD approach, but in agreement with Badve et al.10, we did not define treatment switches from APD to CAPD or vice versa as technique failure, as these switches are not due to failure of PD therapy per se. Blood pressure values were only available for 30% of patients (CAPD patients 27%, APD patients 23%).
Statistical analysis
Survival analysis was performed using both on an as-treated basis (patients who remained on the original treatment until the censoring date), and as an
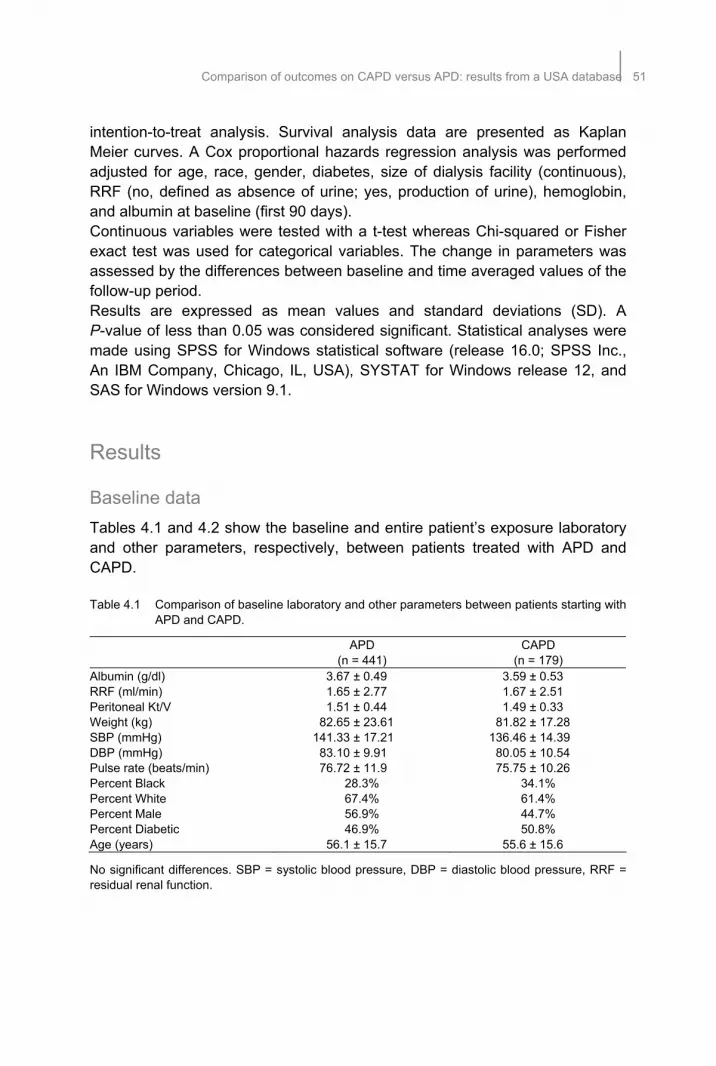
Comparison of outcomes on CAPD versus APD: results from a USA database 51
intention-to-treat analysis. Survival analysis data are presented as Kaplan Meier curves. A Cox proportional hazards regression analysis was performed adjusted for age, race, gender, diabetes, size of dialysis facility (continuous), RRF (no, defined as absence of urine; yes, production of urine), hemoglobin, and albumin at baseline (first 90 days). Continuous variables were tested with a t-test whereas Chi-squared or Fisher exact test was used for categorical variables. The change in parameters was assessed by the differences between baseline and time averaged values of the follow-up period. Results are expressed as mean values and standard deviations (SD). A P-value of less than 0.05 was considered significant. Statistical analyses were made using SPSS for Windows statistical software (release 16.0; SPSS Inc., An IBM Company, Chicago, IL, USA), SYSTAT for Windows release 12, and SAS for Windows version 9.1.
Results
Baseline data
Tables 4.1 and 4.2 show the baseline and entire patient’s exposure laboratory and other parameters, respectively, between patients treated with APD and CAPD. Table 4.1 Comparison of baseline laboratory and other parameters between patients starting with
APD and CAPD.
APD (n = 441)
CAPD (n = 179)
Albumin (g/dl) 3.67 ± 0.49 3.59 ± 0.53 RRF (ml/min) 1.65 ± 2.77 1.67 ± 2.51 Peritoneal Kt/V 1.51 ± 0.44 1.49 ± 0.33 Weight (kg) 82.65 ± 23.61 81.82 ± 17.28 SBP (mmHg) 141.33 ± 17.21 136.46 ± 14.39 DBP (mmHg) 83.10 ± 9.91 80.05 ± 10.54 Pulse rate (beats/min) 76.72 ± 11.9 75.75 ± 10.26 Percent Black 28.3% 34.1% Percent White 67.4% 61.4% Percent Male 56.9% 44.7% Percent Diabetic 46.9% 50.8% Age (years) 56.1 ± 15.7 55.6 ± 15.6
No significant differences. SBP = systolic blood pressure, DBP = diastolic blood pressure, RRF = residual renal function.

52Chapter 4
Table 4.2 Comparison of entire patients’ exposure laboratory and other parameters between APD and CAPD.
APD (n = 441)
CAPD (n = 179)
Albumin (g/dl) 3.61 ± 0.44 3.51 ± 0.51 RRF (ml/min) 0.97 ± 1.84 1.01 ± 1.9 Peritoneal Kt/V 1.6 ± 0.45 1.52 ± 0.36 Weight (kg) 84.25 ± 24.51 82.33 ± 18.33 SBP (mmHg) 132.25 ± 18.65 132.82 ± 18.76 DBP (mmHg) 79.88 ± 10.51 80.44 ± 11.85 Pulse rate (beats/min) 79.23 ± 11.14 77.04 ± 11.17
* P < 0.05. RRF = residual renal function, SBP = systolic blood pressure, DBP = diastolic blood pressure.
Patient survival
Duration of follow-up period
179 CAPD and 441 APD patients were studied. During the as-treated follow-up period (Figure 4.1), 25 CAPD and 76 APD patients died. Mean as-treated survival in CAPD patients was 1407 days [95% CI 1211-1601] and 1616 days in CCPD patients [95% CI 1478-1764]. In the as-treated analysis, adjusted HR for mortality was 1.31 in CAPD [95% CI 0.76-2.25, NS]. In the intention-to-treat analysis, mean survival was 1872 days in CAPD [95% CI 1725-2220] and 1776 days in APD patients [95% CI 1659-1894]. In the intention-to-treat analysis, the adjusted HR for mortality in CAPD patients was 0.87 compared to APD [95% CI 0.51-1.5, NS]. Figure 4.1 Patient survival between treatment modalities of peritoneal dialysis (CCPD = cycling
continuous peritoneal dialysis and CAPD = continuous ambulatory peritoneal dialysis).
0%
20%
40%
60%
80%
100%
120%
3 mns 6 mns 12 mns 18 mns
Pe
rcen
t o
f pts
on
the
sam
em
oda
lity
CAPD
APD
0%
20%
40%
60%
80%
100%
120%
3 mns 6 mns 12 mns 18 mns
Pe
rcen
t o
f pts
on
the
sam
em
oda
lity
CAPD
0%
20%
40%
60%
80%
100%
120%
3 mns 6 mns 12 mns 18 mns
Pe
rcen
t o
f pts
on
the
sam
em
oda
lity
CAPD
APD
0%
20%
40%
60%
80%
100%
120%
3 mns 6 mns 12 mns 18 mns
Pe
rcen
t o
f pts
on
the
sam
em
oda
lity
CAPD

Comparison of outcomes on CAPD versus APD: results from a USA database 53
Technique survival
Of 179 CAPD patients, 42 switched to APD (23%), 23 switched to hemodialysis (13%) (Figure 4.2). Of the 441 APD patients, 5 switched to CAPD (1%), and 31 switched to hemodialysis (7%). Technique survival (as-treated) was lower in CAPD as compared to APD [HR = 2.84, 95% CI 1.65-4.88, P = 0.002]; adjusted HR was 1.81 [95% CI 0.94-3.57, P = 0.08]. Figure 4.2 Technique survival between treatment modalities of peritoneal dialysis (CCPD =
cycling continuous peritoneal dialysis and CAPD = continuous ambulatory peritoneal dialysis).
Peritonitis rates
Peritonitis rate for both CAPD and APD was 0.3 episodes/patient year. Exit site/tunnel infection rate was 0.1 for CAPD and 0.3 episodes/patient year for APD [P = 0.6].
RRF and laboratory parameters
Baseline serum albumin levels were lower in CAPD patients, and remained so during the follow-up period it remained significantly lower. No difference in time averaged RRF was observed between treatment modalities (Figure 4.3). Systolic blood pressures did not differ significantly between APD and CAPD patients.

54Chapter 4
Figure 4.3 Residual renal function during follow-up between treatment modalities (CCPD = cycling
continuous peritoneal dialysis and CAPD = continuous ambulatory peritoneal dialysis).
Discussion
In the US, the use of APD in PD is steadily increasing despite higher treatment costs1,11,12. However, data from observational trials regarding the effect of APD on treatment outcome as compared to CAPD are conflicting. A recent systematic review of controlled trials did not show a difference in patient survival between APD and CAPD1. In the present study, survival in incident patients treated with APD and CAPD was comparable and similar to the above mentioned review. Our results on survival are also in agreement with the survival data observed in the NECOSAD database using incident9, or the Australia and New Zealand Dialysis and Transplant Registry, which includes both incident and prevalent patients10. In contrast, survival was better in incident APD patients in a Mexican database13. In a large cohort of incident patients, more than 30.000 patients, from the US Baxter database11, mortality during the first six months of therapy was lower in APD as compared to CAPD patients, although survival differences were restricted to this time period. A difference from the NECOSAD cohort, the study of Badve et al.10 and the US Baxter database study11, which also only included incident patients, is the much higher percentage of APD patients in the present study period. Two-year survival in the present study was 89%, and thus comparable to the two-year survival data in the NECOSAD study of 77%14, the Baxter database studies11,12 and the Badve study10 at about 75%.
0
0.5
1
1.5
2
2.5
3
3.5
4
4.5
5
Mon
th3
Mon
th4
Mon
th5
Mon
th6
Mon
th7
Mon
th8
Mon
th9
Mon
th10
Mon
th11
Mon
th12
Mon
th13
Mon
th14
Mon
th15
Months from start of dialysis
RR
F
CAPD
CCPD
0
0.5
1
1.5
2
2.5
3
3.5
4
4.5
5
Mon
th3
Mon
th4
Mon
th5
Mon
th6
Mon
th7
Mon
th8
Mon
th9
Mon
th10
Mon
th11
Mon
th12
Mon
th13
Mon
th14
Mon
th15
Months from start of dialysis
RR
F
CAPD
APD
0
0.5
1
1.5
2
2.5
3
3.5
4
4.5
5
Mon
th3
Mon
th4
Mon
th5
Mon
th6
Mon
th7
Mon
th8
Mon
th9
Mon
th10
Mon
th11
Mon
th12
Mon
th13
Mon
th14
Mon
th15
Months from start of dialysis
RR
F
CAPD
CCPD
0
0.5
1
1.5
2
2.5
3
3.5
4
4.5
5
Mon
th3
Mon
th4
Mon
th5
Mon
th6
Mon
th7
Mon
th8
Mon
th9
Mon
th10
Mon
th11
Mon
th12
Mon
th13
Mon
th14
Mon
th15
Months from start of dialysis
RR
F
CAPD
APD

Comparison of outcomes on CAPD versus APD: results from a USA database 55
An important message from the present study is that the potential disadvantages of APD, such as an increased risk of sodium sieving, did not translate into impaired patient outcome in a large database. Although in a recent study, no differences were observed in volume state and blood pressure in patients treated with CAPD or APD15. Indeed, no study so far has found a lower patient survival in APD as compared to CAPD patients. Also the results of the present study appear to support the recommendations of the European Best Practice Guidelines for APD as a general alternative for CAPD16. However, in individual patients, potential differences in sodium and fluid removal between CAPD and APD, especially in patients with so-called “high transport” status, should be a focus of attention as these patients appeared to be at higher risk for sodium retention during short dwells5. Technique failure appeared to be lower in the present study with APD patients (13%) as compared to CAPD patients (7%). Reasons for this difference, which is in agreement with the US Baxter database report11, cannot be deduced from the present study, as the cause of technique failure is not documented in the RRI database. These results are at variance with the NECOSAD and ANTZAS data, of which the NECOSAD differs from the present database by the low number of APD patients (5.1%). Two-year technique survival was 64%, and three-year technique survival was 53% in the NECOSAD study14. It is interesting that differences in technique failure between APD and CAPD was only different in the US studies11. Factors such as treatment satisfaction, and patient and physician preference might play an important role in the differences between the various studies, but remain hypothetical as a potential cause. Peritonitis rates, which could be an important determinant of technique failure, have been found to be different between APD and CAPD in various studies7,17,18. In a systematic review of 3 randomized studies it was shown that APD patients had significantly lower peritonitis rates1. In the present database, no difference in peritonitis rate or rate of exit-site/tunnel infection was observed, which is a strong argument against infectious complications being a cause for the differences in technique failure. Thus peritonitis rates were lower in APD patients and social circumstances such as significantly more time for work, family and social activities, appeared to be improved1,8. Although in this study, time averaged albumin levels were lower in CAPD patients, this is likely due to existing differences at the baseline period, as the change in albumin levels from baseline to the exposure time was not significantly different between CAPD and APD patients. As such, the differences might be due to case-mix, although also differences in inflammatory or hydration status might play a role19. A recent study suggested that peritoneal albumin loss might even be somewhat higher in APD as compared to CAPD patients20 although no differences in protein loss or serum albumin levels were observed when patients were changed from CAPD to APD21.

56Chapter 4
Earlier studies22 did not show differences in biochemical parameters between APD and CAPD patients, although a Spanish multicentre study observed a significant increase in hemoglobin after switching from CAPD to APD15,21. However, data on EPO dose was not mentioned in the later study. No differences were observed in blood pressure levels between CAPD and APD patients in this study, although data on blood pressure were only available for a subset of patients. The comparable results on blood pressure control are in agreement with earlier data from Wang et al.21,22, although in this study the prevalence of left ventricular hypertrophy was increased in APD patients, caused by volume overload. Data on LVM or detailed parameters of fluid state are not available in the present database. Ortega et al. observed slightly improved blood pressure control in CAPD patients3. In contrast, Rodriguez-Carmona et al. even observed a higher blood pressure in CAPD patients despite higher sodium removal, although this might be due to the higher age in their CAPD population2. Preservation of RRF in peritoneal dialysis is very important as it has been shown to be a predictor for patient survival24. In our study, no differences were observed in time averaged RRF between CAPD and APD. In contrast, earlier reports showed a faster decline in RRF in APD as compared to CAPD patients2,6. One reason for the faster decline in RRF in APD patients might be more intensive ultrafiltration during shorter dwell times during APD as compared to the more gradual fluid removal during CAPD6. Surprisingly, in the study of Rodriguez Carmona et al.2, the decline in RRF with APD was faster as compared to CAPD despite a lower ultrafiltration volume (APD 1067 ml/day versus CAPD 1310 ml/day). This study comprises one of the larger studies comparing APD and CAPD. However, in the largest database studies regarding this topic10,12; no detailed data on surrogate outcome parameters such as blood pressure and RRF are available. On the other hand, the present database also has its limitations, most importantly the absence of data on peritoneal transport status and peritoneal fluid removal. Moreover, this study suffers from the general limitations of observational studies and results should thus be interpreted with caution. Indeed, the divergent results between the different observational studies are strongly supportive for the importance of case mix and possibly treatment prescription in determining patient outcome and other relevant clinical and treatment parameters. In conclusion, in the present observational study, no differences in patient survival were observed in APD versus CAPD patients, although technique survival appeared to be higher in APD patients, which could not be explained by differences in infectious complications. No difference in RRF or dialysis adequacy was observed. Based on these results, APD appears to be an acceptable alternative for CAPD with specific advances.

Comparison of outcomes on CAPD versus APD: results from a USA database 57
References
1. Rabindranath KS, Adams J, Ali TZ, Daly C, Vale L, Macleod AM. Automated versus continuous ambulatory peritoneal dialysis: a systematic review of randomized controlled trials. Nephrol Dial Transplant 2007;22:2991-2998.
2. Rodríguez-Carmona A, Fontán MP. Sodium removal in patients undergoing CAPD and automated peritoneal dialysis. Perit Dial Int 2002;22:705-713.
3. Ortega O, Gallar P, Carreño A, Gutierrez M, Rodriguez I, Oliet A, Vigil A, Gimenez E. Peritoneal sodium mass removal in continuous ambulatory peritoneal dialysis and automated peritoneal dialysis: influence on blood pressure control. Am J Nephrol 2001;21:189-193.
4. Ateş K, Nergizoğlu G, Keven K, Sen A, Kutlay S, Ertürk S, Duman N, Karatan O, Ertuğ AE. Effect of fluid and sodium removal on mortality in peritoneal dialysis patients. Kidney Int 2001;60:767-776.
5. Rodriguez-Carmona A, Pérez-Fontán M, Garca-Naveiro R, Villaverde P, Peteiro J. Compared time profiles of ultrafiltration, sodium removal, and renal function in incident CAPD and automated peritoneal dialysis patients. Am J Kidney Dis 2004;44:132-145.
6. Hufnagel G, Michel C, Queffeulou G, Skhiri H, Damieri H, Mignon F. The influence of automated peritoneal dialysis on the decrease in residual renal function. Nephrol Dial Transplant 1999;14:1224-1228.
7. Holley JL, Bernardini J, Piraino B. Continuous cycling peritoneal dialysis is associated with lower rates of catheter infections than continuous ambulatory peritoneal dialysis. Am J Kidney Dis 1990;16:133-136.
8. Rabindranath KS, Adams J, Ali TZ, MacLeod AM, Vale L, Cody J, Wallace SA, Daly C. Continuous ambulatory peritoneal dialysis versus automated peritoneal dialysis for end-stage renal disease. Cochrane Database Syst Rev 2007;18:CD006515.
9. Michels WM, Verduijn M, Boeschoten EW, Dekker FW, Krediet RT; NECOSAD Study Group. Similar survival on automated peritoneal dialysis and continuous ambulatory peritoneal dialysis in a large prospective cohort. Clin J Am Soc Nephrol 2009;4:943-949.
10. Badve SV, Hawley CM, McDonald SP, Mudge DW, Rosman JB, Brown FG, Johnson DW. Automated and continuous ambulatory peritoneal dialysis have similar outcomes. Kidney Int 2008;73:480-488.
11. Guo A, Mujais S. Patient and technique survival on peritoneal dialysis in the United States: evaluation in large incident cohorts. Kidney Int Suppl 2003;(88):S3-S12.
12. Mujais S, Story K. Peritoneal dialysis in the US: evaluation of outcomes in contemporary cohorts. Kidney Int Suppl 2006;S21-S26.
13. Sanchez AR, Madonia C, Rascon-Pacheco RA. Improved patient/technique survival and peritonitis rates in patients treated with automated peritoneal dialysis when compared to continuous ambulatory peritoneal dialysis in a Mexican PD center. Kidney Int Suppl 2008;(108):S76-S80.
14. Jager KJ, Merkus MP, Dekker FW, Boeschoten EW, Tijssen JG, Stevens P, Bos WJ, Krediet RT; NECOSAD Study Group. Mortality and technique failure in patients starting chronic peritoneal dialysis: results of The Netherlands Cooperative Study on the Adequacy of Dialysis. Kidney Int 1999;55:1476-1485.
15. Davidson SN, Jhangri GS, Jindal K, Pannu N. Comparison of volume overload with cycler-assisted versus continuous ambulatory peritoneal dialysis. Clin J Am Soc Nephrol 2009;4:1044-1050.
16. European Best Practice Guidelines Working Group in Peritoneal Dialysis. European Best Practice Guidelines for Peritoneal Dialysis: Automated Peritoneal Dialysis. Nephrol Dial Transplant 2005;20(Suppl 9):ix21-ix23.
17. Huang JW, Hung KY, Yen CJ, Wu KD, Tsai TJ. Comparison of infectious complications in peritoneal dialysis patients using either a twin-bag system or automated peritoneal dialysis. Nephrol Dial Transplant 2001;16:604-607.

58Chapter 4
18. Rodriguez-Carmona A, Perez FM, Garcia FT, Fernandez RC, Valdes F. A comparative analysis on the incidence of peritonitis and exit-site infection in CAPD and automated peritoneal dialysis. Perit Dial Int 1999;19:253-258.
19. Jones CH, Wells L, Stoves J, Farquhar F, Woodrow G. Can a reduction in extracellular fluid volume result in increased serum albumin in peritoneal dialysis patients? Am J Kidney Dis 2002;39:872-875.
20. Westra WM, Kopple JD, Krediet RT, Appell M, Mehrotra R.Dietary protein requirements and dialysate protein losses in chronic peritoneal dialysis patients. Perit Dial Int 2007;27:192-195.
21. Rodríguez AM, Díaz NV, Cubillo LP, Plana JT, Riscos MA, Delgado RM, Herrera CM, Ribes EA, Molina FT, Heras MM, González AT, Cantón CG, Fernández AR, Laborda EB, Zurita MN, Girón FF, Santana PS. Automated peritoneal dialysis: a Spanish multicentre study. Nephrol Dial Transplant 1998;13:2335-2340.
22. Bro S, Bjorner JB, Tofte-Jensen P, Klem S, Almtoft B, Danielsen H, Meincke M, Friedberg M, Feldt-Rasmussen B. A prospective, randomized multicenter study comparing CCPD and CAPD treatment. Perit Dial Int 1999;19:526-533.
23. Wang MC, Tseng CC, Tsai WC, Huang JJ. Blood pressure and left ventricular hypertrophy in patients on different peritoneal dialysis regimens. Perit Dial Int 2001;21:36-42.
24. Bargman JM, Thrope KE, Churchill DN for the CANUSA peritoneal dialysis study group. The importance of residual renal function for survival in patients on peritoneal dialysis. J Am Soc Nephrol 1997;8:185a.
59
Chapter 5 Fluid state and blood pressure
control; no differences between
automated and continuous
ambulatory peritoneal dialysis
Trijntje T. Cnossen Constantijn J.A.M. Konings
Wouter J. Fagel Frank M. van der Sande
Koos van Geel Karel L.M. Leunissen
Jeroen P. Kooman
ASAIO Journal in press.

60Chapter 5
Abstract
Objective To compare fluid state, ambulatory blood pressure and sodium removal in automated peritoneal dialysis (APD) and continuous ambulatory peritoneal dialysis (CAPD). Design Observational cross-sectional study. Patients Twenty APD and 24 CAPD patients, mean duration on peritoneal dialysis of 30 ± 26 and 21 ± 23 months, respectively. 64% of patients were treated with icodextrin. Methods 24-hrs dialysate and urine collections, standardized 3.86% glucose PET, bioimpedance analysis and 24-hrs ambulatory blood pressure monitoring. Results Extracellular water (ECW) corrected for body weight was 0.23 ± 0.03 l/kg both in APD and CAPD patients. The slope normovolemia value according to Chamney was 0.0 ± 0.2 l/kg in APD patients and 0.0 ± 0.05 l/kg in CAPD patients (NS). Mean SBP and DBP were respectively 132 ± 25 and 79 ± 8 mmHg in APD and 129 ± 16 and 76 ± 11 mmHg in CAPD patients (NS). Sodium concentration in dialysate was respectively, 129.5 ± 3.5 mmol/l in APD and 132.4 ± 4.1 mmol/l in CAPD (P=0.017). Dialysate sodium removal was 80.6 ± 78.4 mmol/24-hrs in APD and 108.7 ± 96.8 mmol/24-hrs in CAPD patients (NS). Natriuresis was respectively, in APD 76.6 ± 65.5 mmol/24-hrs and in CAPD 93.5 ± 61.7 mmol/24-hrs (NS). Total sodium removal was 149.5 ± 76.6 mmol/24-hrs in APD and 198.4 ± 75.0 mmol/24-hrs in CAPD (P = 0.039). Conclusion Despite a higher daily sodium removal in CAPD patients, fluid state and blood pressure were not different between APD and CAPD. In general, volume status and blood pressure appeared to be reasonably controlled in this unselected population.

Fluid state and blood pressure control61
Introduction
Fluid and sodium balance are crucial for the management of patients on peritoneal dialysis (PD). Inadequate fluid and sodium removal by dialysis are potential risk factors for overhydration, which is significantly related to hypertension, left ventricular hypertrophy, and higher cardiovascular morbidity and mortality in PD patients1-4. In clinical practice, PD patients are either treated with continuous ambulatory peritoneal dialysis (CAPD) or automated peritoneal dialysis (APD), in the latter usually with more rapid exchange cycles during night-time followed by a daytime dwell. Whereas previously, APD was primarily used to treat patients with a high membrane transport status, it has become increasingly popular with patients for life style reasons. Due to the shorter dwell times in APD sodium sieving, possibly resulting in a reduced sodium removal, is more pronounced. Consequently, a higher prevalence of overhydration and hypertension was suggested in APD patients5,6, although the use of icodextrin for the long dwell might improve sodium removal in CAPD as well in APD patients7-9. However, there are few studies which compared fluid and sodium balance, as well as blood pressure and volume control between APD and CAPD patients after the widespread introduction of new dialysis solutions such as icodextrin10. The hypothesis of the study that sodium and daily fluid removal is significantly lower, whereas extracellular volume is significantly higher in patients with a low transport status treated with APD compared to CAPD, whereas in patients with a high transport status of the peritoneal membrane, extracellular volume is significantly lower and fluid removal significantly higher in patients treated with APD. The aim of the present study was to compare fluid state, ambulatory blood pressure and sodium removal between patients treated with APD and CAPD.
Patients and methods
Study design
In this multi-centre study 44 patients were included from 3 dialysis centres (Medical Centre Leeuwarden, Catharina Hospital Eindhoven and Maastricht University Medical Centre+, The Netherlands). Fluid state, peritoneal transport, residual renal function (RRF), peritoneal ultrafiltration volume, urine volume and blood pressure were compared in a cross-sectional design between patients treated with APD and CAPD. Exclusion criteria were acute intercurrent

62Chapter 5
infection and peritonitis during the 4 weeks preceding the peritoneal equilibration test (PET).
Patients
Totally 44 stable patients (26 men, 18 women; mean age 60.2 ± 13.7 yrs) were enrolled in the study. The causes of renal insufficiency were diabetes mellitus (n = 14), glomerulonephritis (n = 6), ADPKD (n = 4), IgA glomerulonephritis (n = 4), athero/glomerulosclerosis (n = 7), urological disorder (n = 2), ANCA-associated vasculitis (n = 2), Good Pasture syndrome (n = 1), multiple myeloma (n = 1), stenosis of renal artery (n = 1), syndrome of Alagille (n = 1) and unknown origin (n = 1). The mean duration of PD was 25.0 ± 24.8 (range 2-129) months. Mean diuresis was 1172 ± 808 ml/24-hrs and RRF 6.7 ± 5.0 ml/min. Patients were treated with APD or CAPD according to the preference of the patient and/or treating physician based on PET results (Table 5.1). All patients used commercially available dialysis solutions (Baxter Healthcare, IRL, Dublin, Ireland). Dialysis prescription was at the discretion of the treating physician. All patients were advised to follow a sodium restricted diet (2000 milligrams sodium per day) by dietary counselling.
Study protocol
Patients came to their own dialysis centre to perform a standardized 3.86% glucose PET of 4 hrs. First, the overnight PD fluid was drained and fluid status was measured by multifrequency bioimpedance analysis. Thereafter, the abdomen was filled with 3.86% glucose solution to perform the PET. Hereafter, 24-hrs ambulatory blood pressure measurements were performed. The day before the PET, 24-hrs dialysate and urine collections were performed. The Ethics Committee of the Catharina Hospital, Eindhoven, The Netherlands, primarily approved the study protocol, followed by approval of the Institutional Review Boards of the other participating centres. All patients gave their written informed consent.
Study parameters
Peritoneal transport characteristics
The transport characteristics of the peritoneal membrane were characterized using a standardized PET after a 4-hrs dwell with a 3.86% glucose solution. Dialysis adequacy, determined by Kt/V urea and weekly creatinine clearance normalized to body surface area was calculated using PD Adequest 2.0 (Baxter Healthcare).

Fluid state and blood pressure control63
Fluid state
Fluid state was assessed with a multifrequency bioimpedance measurement. Two different devices were used; 35 patients were measured by Xitron 4200 (Xitron Technologies Inc, San Diego, USA) and 9 patients by whole body bioimpedance spectroscopy (BCM -- Fresenius Medical Care D GmbH). Measurements were performed in a standard fashion while the patient was lying supine on a flat, non-conductive bed and with an empty abdomen. Multifrequency (5-500 kHz), alternating currents were introduced at distal electrodes on the hands (just proximal to the phalangeal-metacarpal joint in the middle of the dorsal side of the hand) and the feet (proximal to the transverse (metatarsal) arch on the superior side of the foot), and resistances were measured by proximal electrodes (to the wrist midway between the styloid process, to the ankle midway between the malleoli). ECW assessed by Xitron 4200, was predicted from a general mixture theory (Cole-Cole model): water compartments were directly calculated from resistance values, assuming specific resistances of ECV provided by the manufacturer. ECV assessed by BCM, was determined using a recently modified equation developed by Moissl et al.11,12. Whole body ECW (wECV) and ICV (wICV) measured by the BCM were recalculated by Xitron using equations 1, 2 and 3, respectively13
wECV = ((ρECV * KB * H2 * √W) / (1025 * RE))⅔ (1)
wICV = wECV * (((ρMIX * (RI + RE))/( ρECV * RI)) ⅔ -1) (2)
ρMIX = ρICV – (ρICV - ρECV) * (RI/(RI + RE)) ⅔ (3)
where RE and RI are extra- and intracellular resistances in Ω, H is body height in cm and W is body weight in kg. The resistivity constants in ECV calculation (ρECV) were 40.5 Ω * cm for males and 39.0 Ω * cm for females; and in ICV calculation (ρICV) were 273.9 Ω * cm and 264.9 Ω * cm respectively. KB is a constant factor (KB = 4.3), correcting whole body measurements by relating the relative proportions of the leg, arm, trunk and height. Overhydration was expressed by the slope normovolemia model, described by Chamney14. The slope normovolemia is calculated as ECW:BW with 0.239 L/kg in males and 0.214 L/kg in females as the slop levels for normovolemia14.
24-hrs Ambulatory blood pressure
In all patients, 24-hrs blood pressure measurements were performed using a Spacelabs Oscillometric Blood Pressure Monitor (Redmond, WA). Blood pressure was measured every 20 minutes from 8 a.m. until 22 p.m. and every 60 minutes from 22 p.m. until 8 a.m.

64Chapter 5
Measurements in plasma and dialysate
Plasma and dialysate creatinine, urea, sodium and glucose were analyzed using an Advia 1650 (Siemens Medical Solutions Diagnostics, San Francisco, CA, USA); sodium concentrations in plasma and dialysate were analyzed with an ion-selective electrode using an indirect method. Urea and glucose were analyzed with enzymatic methods and creatinine with a compensated alkaline picrate method. NT-proBNP was measured using the proBNP assay for the
Elecsys 2010.
Statistical analyses
Results are expressed as mean values and standard deviations (SD). The Student’s t-test was used for differences between APD and CAPD. Mann–Whitney U-tests were used where appropriate. All statistical analyses were made using SPSS 16.0 (SPSS Inc., Chicago, IL, USA). P values less than 0.05 were considered significant. The study was powered to detect a difference in ECV of 0.03 L/kg body weight between APD and CAPD patients, assuming a SD of 0.03 L/kg15. In order to show this difference a sample size of 16 patients per group would be needed (α = 0.05, power 80%).
Results
Twenty patients (12 men; 8 women) treated with APD and 24 patients (14 men; 10 women) treated with CAPD were included. Baseline characteristics of patients treated with APD and CAPD are given in Table 5.1. Mean systolic (SBP) and diastolic blood pressure (DBP) were comparable between APD and CAPD patients (Table 5.1) (NS). 72.7% of patients used one or more antihypertensive and/or cardio-protective agents (excluding diuretics). Mean number of antihypertensive drugs was not significantly different between APD and CAPD patients, although there appeared to be some differences in the classes of antihypertensive drugs used between both groups (Table 5.2). Patients treated with APD had a lower sodium concentration in dialysate, although dialysate sodium removal was not significantly different between both groups (Table 5.2). However total daily removal of sodium was lower in APD as compared to CAPD patients (P = 0.039). Parameters of fluid state of patients treated with APD and CAPD are shown in Table 5.3. There were no significant differences between patients treated with both modalities. Also NT-pro BNP levels were not significantly different between both groups. The median value

Fluid state and blood pressure control65
in APD patients was 188 pmol/l [interquartile range 79-366] and was 248 pmol/l [interquartiles range 93-884] in CAPD patients (NS). When comparing patients (combining APD and CAPD) treated with (n = 28) and without icodextrin (n = 16) no significant differences in fluid status (-0.01 ± 0.05 versus 0.0 ± 0.02 l/kg respectively), despite a lower urinary sodium removal in patients treated with icodextrin (68 ± 41 versus 112 ± 182 mmol/24-hrs). Dialysate sodium removal (111 ± 90 versus 70 ± 83 mmol/24-hrs) and peritoneal ultrafiltration (854 ± 705 versus 577 ± 648 ml/24-hrs) were not significantly different between patients treated with icodextrin and those who were not. Table 5.1 Comparison of laboratory and other parameters between patients treated with
automated peritoneal dialysis (APD) and continuous ambulatory peritoneal dialysis (CAPD).
APD
(n = 20) CAPD
(n = 24) Age (years) 59.9 ± 13.2 60.5 ± 14.4 Men (%) 12 (60) 14 (58) Diabetes (%) 6 (30) 10 (42) Time on PD (months) 30 ± 26 21 ± 23 Weight (kg) 80.1 ± 15.8 78.5 ± 11.0 BMI (kg/m2) 26.6 ± 4.4 27.5 ± 4.5 24-hrs SBP (mmHg) 132 ± 25 129 ± 16 24-hrs DBP (mmHg) 79 ± 8 76 ± 11 Icodextrin use (%) 14 (70) 13 (54) RRF (ml/min) 5.6 ± 4.2 7.7 ± 5.5 Hemoglobin (mmol/l) 7.8 ± 0.8 7.7 ± 0.7 Albumin (g/l) 34.9 ± 5.0 34.7 ± 6.5 Weekly Kt/Vurea 2.46 ± 0.63 2.71 ± 0.71 Weekly creatinine clearance (l/week/1,73m2) 90.71 ± 38.22 116.29 ± 51.24 D/P creatinine 0.75 ± 0.08 0.74 ± 0.10
None of the differences was significant. (BMI = body mass index, SBP = systolic blood pressure, DBP = diastolic blood pressure, RRF = residual renal function, D/P = dialysate-to-plasma ratio).
Table 5.2 Use of anti-hypertensives/cardioprotective agents and diuretics in automated peritoneal dialysis (APD) and continuous ambulatory peritoneal dialysis (CAPD).
APD (n = 20)
CAPD (n = 24)
Diuretics (%) 10 (50) 9 (38) Calcium-antagonists (%) 4 (20) 9 (38) Beta-blocking agents (%) 7 (35) 16 (67) Inhibitors of the renin-angiotensin system (%) 10 (50) 17 (71) Central acting drugs (%) 3 (15) 2 (8) Number of anti-hypertensives 1.15 ± 0.37 1.79 ± 0.36

66Chapter 5
Table 5.3 Sodium removal in automated peritoneal dialysis (APD) and continuous ambulatory peritoneal dialysis (CAPD).
APD (n = 20)
CAPD (n = 24)
Serum sodium concentration (mmol/l) 137.5 ± 2.7 138.7± 4.0 Urine volume (ml/24-hrs) 1097 ± 949 1234 ± 683 Urine sodium removal (mmol/24-hrs) 76.6 ± 65.5 93.52 ± 61.7 Ultrafiltration volume (ml/24-hrs) 661 ± 609 834 ± 754 Dialysate sodium concentration (mmol) 129.5 ± 3.5* 132.4 ± 4.1* Dialysate sodium removal (mmol/24-hrs) 80.6 ± 78.4 108.7 ± 96.8 Total sodium removal (mmol/24-hrs) 149.5 ± 76.6** 198.4 ± 75.0**
* Difference was significant (P = 0.017), ** Difference was significant (P = 0.039). Table 5.4 Fluid state and NT-pro-BNP in automated peritoneal dialysis (APD) and continuous
peritoneal dialysis (CAPD).
APD (n = 20)
CAPD (n = 24)
Total body water (l) 39.8 ± 10.7 38.0 ± 7.6 ECW (l) 18.9 ± 4.5 18.2 ± 3.1 ICW (l) 20.9 ± 6.8 19.8 ± 5.2 ECW/TBW ratio 0.49 ± 0.05 0.48 ± 0.05 ECW/weight (l/kg) 0.23 ± 0.03 0.23 ± 0.03 Slope normovolemia (l) 0.0059 ± 0.022 -0.00625 ± 0.050 NT-pro-BNP (pmol/l)* 644.6 ± 1192 703 ± 1170
No significant differences; * for median and interquartile range of NT-pro-BNP (please see text) (ECW = extracellular water, ICW = intracellular water).
Discussion
The main findings of the present study are the fact that blood pressure control, assessed by ambulatory blood pressure measurements, and fluid state were not significantly different between patients treated with APD and CAPD. These findings are in line with the study of Boudville, which studied only APD patients but observed an acceptable volume and blood pressure control in APD patients with a liberal use of icodextrin8. In the more recent papers of Davison et al. and Van Biesen et al., also no difference in fluid status or blood pressure control between APD and CAPD was observed10,16. In those studies, also a majority of patients were treated with icodextrin, whereas in the study of Davison, significantly more APD patients used icodextrin as compared to the CAPD group, whereas in our study, the percentage was not significantly different. Dialysate sodium concentration was lower in APD patients, possibly reflecting increased sodium sieving, but possibly due to the higher ultrafiltration volume, dialysate sodium removal was not significantly different between both groups. Nevertheless, total daily sodium removal was higher in CAPD as compared to

Fluid state and blood pressure control67
APD patients. Possibly, the higher daily sodium removal in our CAPD patients is due to a combination of higher dialysate sodium removal, which might not have reached significance due to the relatively small sample size and a higher urinary sodium removal. In the study of Davison, dialysate sodium removal was lower in APD compared to CAPD patients without evidence for differences in volume status or blood pressure control. Still, in view of the relation between sodium removal and mortality, observed by Ates17, these differences should not be neglected, although the causal relationship remains uncertain. Comparing our patient population with that of Davison et al. and Boudville et al., volume state, which was assessed by Xitron 4200BIS in all three studies, was reasonably comparable. ECW:TBW ratio, which was the sole marker of fluid state in the study of Davison10, was somewhat lower in our study, which might also be related to the higher residual renal function in our patients18. Indeed, total sodium removal was higher in our study population as compared to the patients of Davison, whereas dialysate sodium removal was comparable. In the EuroBCM in PD study, 63.7% of the total study cohort used icodextrin, which was associated with less overhydration and more underhydration16. More than 25% of the study cohort was severely fluid overloaded. Although it is difficult to compare results of previous studies1-4 with the result of the present study, as the computational model between the Xitron 4000 and 4200 is not entirely comparable, volume status in PD patients appeared to be relatively well controlled in most recent studies. In our study, the mean normalized overhydration index according to the Chamney approach, was around zero14. Also blood pressure in the patient populations of Boudville and Davison, as well as in the present study, was reasonably well controlled, in contrast to earlier observations19. Whether the improvement in volume and blood pressure control in more recent studies is due to the more liberal use of icodextrin, or to an increased awareness for volume status in general in PD patients cannot be deduced from the present study. In the present study, the slope normovolemia level developed by Chamney, which corrects for sex, was used as the parameter for volume status14. The reason that we did not use the ECW:TBW ratio as the prime marker of overhydration, despite the recent establishment of normalized values20, is the fact that this ratio might be increased either by overhydration, by a reduction in lean body mass due to malnutrition, or by both. Until now, undisputed cut-off levels and normalizing techniques for overhydration by the Xitron 4002 have not been definitively established. The best validated normal values in bioimpedance technology in dialysis patients so far have been developed for the Body Composition Monitor11,12, which was derived from Xitron technology but with an improved mathematical model. In addition to the comparable fluid
68Chapter 5
status, also NT-pro BNP levels, which were found to be related to cardiac load in previous studies21, were not significantly different between both groups. Icodextrin use was widespread in all three studies. Previous studies9,22 showed a beneficial effect of icodextrin on fluid status In the study of Boudville8, normalized extracellular volume was lower in the patients treated with icodextrin, whereas in the present study no difference in volume status was observed between patients treated with icodextrin and those who were not. However, urine sodium removal was significantly lower in those patients treated with icodextrin, and therefore the absence of differences might be explained by confounding by indication. Drawbacks of the present study are the observational nature, cross-sectional design and relatively small peritoneal dialysis population. However, the group of APD and CAPD patients appeared to be reasonably well matched. Moreover, detailed analysis of fluid state, natriuretic peptides, and 24-hrs ambulatory blood pressure measurements were available in our patients. Concluding, in this cross-sectional study, fluid state and ambulatory blood pressure measurements were comparable between patients treated with CAPD or APD despite a lower total daily sodium removal in the latter group. In general, in agreement with recent studies, fluid status and blood pressure appeared to be reasonably well controlled in both APD and CAPD patients.

Fluid state and blood pressure control69
References
1. Plum J, Schoenicke G, Kleophas W, Kulas W, Steffens F, Azem A, Grabensee B. Comparison of body fluid distribution between chronic haemodialysis and peritoneal dialysis patients as assessed by biophysical and biochemical methods. Nephrol Dial Transplant 2001;16:2378-2385.
2. Lameire N, van BIesen W. Importance of blood pressure and volume control in peritoneal dialysis patients. Perit Dial Int 2001;21:206-211.
3. Enia G, Mallamaci F, Benedetto FA, Panuccio V, Parlongo S, Cutrupi S, Giacone G, Cottini E, Tripepi G, Malatino LS, Zoccali C. Long-term CAPD patients are volume expanded and display more severe left ventricular hypertrophy than haemodialysis patients. Nephrol Dial Transplant 2001;16:1459-1464.
4. Konings CJ, Kooman JP, Schonck M, Dammers R, Cheriex E, Palmans Meulemans AP, Hoeks AP, van Kreel B, Gladziwa U, van der Sande FM, Leunissen KM. Fluid status, blood pressure, and cardiovascular abnormalities in patients on peritoneal dialysis. Perit Dial Int 2002;22:477-487.
5. Rodriguez-Carmona A, Perez-Fontan M, Garca-Naveiro R, Villaverde P, Peteiro J. Compared time profiles of ultrafiltration, sodium removal, and renal function in incident CAPD and automated peritoneal dialysis patients. Am J Kidney Dis 2004;44:132-145.
6. Ortega O, Gallar P, Carreño A, Gutierrez M, Rodriguez I, Oliet A, Vigil A, Gimenez E.Peritoneal sodium mass removal in continuous ambulatory peritoneal dialysis and automated peritoneal dialysis: influence on blood pressure control. Am J Nephrol 2001;21:189-193.
7. Rodriguez-Carmona A, Fontan MP. Sodium removal in patients undergoing CAPD and automated peritoneal dialysis. Perit Dial Int 2002;22:705-713.
8. Boudville NC, Cordy P, Millman K, Fairbairn L, Sharma A, Lindsay R, Blake PG. Blood pressure, volume, and sodium control in an automated peritoneal dialysis population. Perit Dial Int 2007;27:537-543.
9. Davies SJ, Woodrow G, Donovan K, Plum J, Williams P, Johansson AC, Bosselmann HP, Heimbürger O, Simonsen O, Davenport A, Tranaeus A, Divino Filho JC. Icodextrin improves the fluid status of peritoneal dialysis patients: results of a double-blind randomized controlled trial. J Am Soc Nephrol 2003;14:2338-2344.
10. Davison SN, Jhangri GS, Jindal K, Pannu N. Comparison of volume overload with cycler-assisted versus continuous ambulatory peritoneal dialysis. Clin J Am Soc Nephrol 2009;4:1044-1050.
11. Moissl UM, Wabel P, Chamney PW, Bosaeus I, Levin NW, Bosy-Westphal A, Korth O, Müller MJ, Ellegård L, Malmros V, Kaiwatcharachai C, Kuhlmann MK, Zhu F, Fuller NJ. Body fluid volume determination via body composition spectroscopy in health and disease. Physiol Meas 2006;27:921-933.
12. Wabel P, Moissl U, Chamney P, Jirka T, Machek P, Ponce P, Taborsky P, Tetta C, Velasco N, Vlasak J, Zaluska W, Wizemann V. Towards improved cardiovascular management: the necessity of combining blood pressure and fluid overload. Nephrol Dial Transplant 2008;23:2965-2971.
13. Liu L, Rimann J, Sipahioglu MH, Zhu F, Kotanko P, Levin NW. Comparison of different equations for whole body bioimpedance measurements to estimate body fluid volumes in hemodialysis patients. Blood Purif 2010;29:230-242.
14. Chamney PW, Kramer M, Rode C, Kleinekofort W, Wizemann V. A new technique for establishing dry weight in hemodialysis patients via whole body bioimpedance. Kidney Int 2002;61:2250-2258.
15. Van de Kerkhof J, Hermans M, Beerenhout C, Konings C, van der Sande FM, Kooman JP. Reference values for multifrequency bioimpedance analysis in dialysis patients. Blood Purif 2004;22:301-306.

70Chapter 5
16. Van Biesen W, Williams JD, Covic AC, Fan S, Claes K, Lichodziejewska-Niemierko M, Verger C, Steiger J, Schoder V, Wabel P, Gauly A, Himmele R; EuroBCM Study Group. Fluid status in peritoneal dialysis patients: the European Body Composition Monitoring (EuroBCM) study cohort. PLoS One 2011;6:e17148.
17. Ateş K, Nerglizoğlu G, Keven K, Sen A, Kutlay S, Ertürk S, Duman N, Karatan O, Ertuğ AE. Effect of fluid and sodium removal on mortality in peritoneal dialysis patients. Kidney Int 2001;60:767-776.
18. Konings CJ, Kooman JP, Schonck M, Struijk DG, Gladziwa U, Hoorntje SJ, van der Wall Bake AW, van der Sande FM, Leunissen KM. Fluid status in CAPD patients is related to peritoneal transport and residual renal function: evidence from a longitudinal study. Nephrol Dial Transplant 2003;18:797-803.
19. Cocchi R, Esposti ED, Fabbri A, Lucatello A, Sturani A, Quarello F, Boero R, Bruno M, Dadone C, Favazza A, Scanziani R, Tommasi A, Giangrande A. Prevalence of hypertension in patients on peritoneal dialysis: results of an Italian multicentre study. Nephrol Dial Transplant 1999;14:1536-1540.
20. Lindley E, Devine Y, Hall L, Cullen M, Cuthbert S, Woodrow G, Lopot F. A ward-based procedure for assessment of fluid status in peritoneal dialysis patients using bioimpedance spectroscopy. Perit Dial Int 2005;Suppl 3:S46-48.
21. David S, Kümpers P, Seidler V, Biertz F, Haller H, Fliser D. Diagnostic value of N-terminal pro-B-type natriuretic peptide (NT-proBNP) for left ventricular dysfunction in patients with chronic kidney disease stage 5 on haemodialysis. Nephrol Dial Transplant 2008;23: 1370-1377.
22. Konings CJ, Kooman JP, Schonck M, Gladziwa U, Wirtz J, van den Wall Bake AW, Gerlag PG, Hoorntje SJ, Wolters J, van der Sande FM, Leunissen KM. Effect of icodextrin on volume status, blood pressure and echocardiographic parameters: a randomized study. Kidney Int 2003;63:1556-1563.

71
Chapter 6 The influence of Physioneal® on
advanced glycation end-products
and inflammatory markers in plasma
and dialysate in patients on CAPD
Trijntje T. Cnossen Ulrich Gladziwa
Jos J. van de Kerkhof Casper G. Schalkwijk
Jean Scheijen Jolanda van Amersfoort
Karin Moret Charles H. Beerenhout
Jeroen P. Kooman
Perit Dial Int 2011;31:189-193.

72Chapter 6
Abstract
Objective Accumulation of advanced glycation end-products (AGE) may be involved in the pathogenesis of peritoneal membrane dysfunction. As glycoxidation may play an important role in AGE formation, peritoneal dialysis fluids with low levels of glucose degradation products (GDPs) might result in a reduction in AGE concentration in the peritoneal effluent. The aim of this study was to compare the effects of conventional glucose-containing dialysis solutions and low level GDP fluids on the concentration of the AGEs N-(carboxymethyl)lysine (CML) and N-(carboxyethyl)lysine (CEL) in peritoneal effluent. Design Prospective randomized control study. Methods 23 patients were treated with either conventional glucose-containing fluid (n = 11, group A) or low level GDP fluid (n = 12, group B) during a period of 12 weeks. Before and after this period, CML and CEL were measured in the peritoneal effluent. Results In groups A and B there were changes in CML concentrations [respectively 13.7 17.0 and -16.0 46.0 nmol/l (NS)] and CEL concentrations [respectively 20.3 26.6 and -8.8 18.9 nmol/l (P = 0.015). Residual renal function (RRF) in groups A and B was, respectively, 6.8 and 6.1 ml/min (NS). CML, but not CEL, in the peritoneal effluent was inversely related to RRF (r = -0.67, P < 0.05). Conclusion CEL, and not CML, in the peritoneal effluent appears to be influenced by the prescription of low GDP level fluid, probably due to the highly reduced concentration of methylglyoxal, which is needed for formation of CEL. CML is primarily influenced by RRF.

The influence of Physioneal® on AGEs and inflammatory markers in CAPD73
Introduction
Glucose degradation products (GDP) in peritoneal dialysis (PD) fluids lead to damage of the peritoneal membrane. These alterations may be mediated in part through formation and accumulation of advanced glycation end product (AGE), such as N-(carboxyethyl)lysine (CEL) and N-(carboxymethyl)lysine (CML)1-4, since GDPs are major precursors in the formation of AGEs. In contrast to the very high formation of GDPs in conventional glucose-containing lactate-buffered PD fluids by heat sterilization, GDP formation is greatly reduced in multicompartment bicarbonate/lactate-buffered PD fluids, such as Physioneal (Baxter Healthcare, IRL, Dublin, Ireland), due to sterilization of the glucose-containing compartment at a lower pH5. Consequently, the concentrations of the GDPs glyoxal (GO) and methylglyoxal (MGO) are much lower in bicarbonate/lactate-buffered PD fluids6. In clinical and experimental studies, Physioneal was associated with a reduction in inflammatory markers and vascular endothelial growth factor formation in peritoneal effluent compared to conventional glucose-containing lactate-buffered PD fluids7,8. The use of another low GDP-containing PD fluid resulted in a reduction in oxidative stress compared with conventional glucose-containing PD fluids3. However, the effect of more biocompatible and low GDP-containing PD fluids on the levels of the AGEs CEL and CML in effluents has not been compared. This effect might be different as CEL and CML formation is dependent upon different pathways6. The aim of the present study was to assess levels of CEL and CML in peritoneal effluent during the use of glucose-containing bicarbonate/lactate buffered low GDP-containing PD fluids in comparison with conventional glucose-containing lactate-buffered dialysis solutions containing high concentrations of GDPs.
Patients and methods
Study design
Effluent levels of CEL and CML were compared in patients treated with conventional glucose-containing lactate-buffered dialysis solutions (Dianeal®) and glucose-containing bicarbonate/lactate buffered dialysis solutions (Physioneal) in a prospective randomized controlled study design. CML and CEL levels were measured at the beginning and at the end of the follow-up period of 12 weeks. Exclusion criteria were acute intercurrent infection, use of 1.1% amino acids (Nutrineal, Baxter Healthcare) (use of this solution may have an independent effect on AGE formation21,22), and treatment with automated PD. Patients were

74Chapter 6
randomized to either continuation of Dianeal or to treatment with Physioneal. For clinical reasons, the prescription of glucose concentration was changed in 3 patients during this study period (1 patient of the Dianeal group, 2 patients of the Physioneal group). However, prescription of 7.5% icodextrin (Extraneal, Baxter Healthcare) was not changed during the study period. The study protocol was approved by the local Institutional Review Board. All patients gave their written informed consent.
Patients
Twenty-six stable patients treated with continuous ambulatory PD in the Maxima Medical Center, Veldhoven, The Netherlands, and the Kuratorium für Heimdialyse, Würselen, Germany, were enrolled in the study. No patient had any clinical sign of overhydration. Twenty-three patients (17 men, 6 women; mean age 58.3 ± 14.3 years) completed the study. Mean duration of PD was 638 ± 647 (range 105-2058) days. Reasons for dropout were renal transplantation (n = 1), peritonitis (n = 1), and refusal of second measurement (n = 1).
Study parameters
Peritoneal glucose prescription and absorption
At the beginning and at the end of the follow-up period, 24-hour collections of peritoneal effluent and urine were performed. The CML and CEL concentrations were measured in pooled dialysis solutions. The 24-hour peritoneal glucose dosage prescription was calculated from the volume and glucose concentration of the prescribed PD fluid. Residual renal function (RRF) was assessed by estimation of the residual glomerular filtration rate, expressed as the mean of the urea and creatinine clearances obtained from 24-hour urine collections. Adequacy of PD was determined by Kt/V urea and weekly creatinine clearance normalized to body surface area using PD Adequest 2.0 (Baxter Healthcare).
Laboratory parameters
Detection of CML and CEL was done by liquid chromatography/mass spectrometry, as described previously9.
Statistical analysis
Repeated measurements ANOVA were used for inter- and intragroup comparisons, whereas correlation analyses were performed by Pearson test. A

The influence of Physioneal® on AGEs and inflammatory markers in CAPD75
P-value < 0.05 was considered significant. All the statistical analyses were done using SPSS statistical software (release 16.0; SPSS Inc., An IBM Company, Chicago, IL, USA).
Results
Table 6.1 shows the baseline characteristics. Patients randomized to the Physioneal group used 7.5% icodextrin more frequently (P = 0.034). Table 6.1 Patient demographics and study parameters.
Glucose-containing lactate buffered
fluid (n = 11)
Glucose-containing bicarbonate/lactate buffered
fluid (n = 12)
Male (female) 10 (1) 9 (3) Age (years) 55.3 15.6 70.0 13.1 Weight (kg) 74.6 13.3 72.8 10.3 Time on PD (months) 15.5 19.6 12.0 24.0 Diabetes 2 (18%) 2 (17%) Use of 7.5% icodextrin 1 (9%)* 6 (50%)* Weekly Kt/V urea 2.29 0.27 2.46 0.56 Weekly creatinine clearance (l/week/1,73m2)
102.2 25.7 92.5 26.1
Peritoneal fill volume (ml) 7550 1753 7363 1220 RRF (ml/min) 6.8 2.4 6.1 3.7 Peritoneal glucose dosage prescription (mmol/l)
533 116 488 81
NPCR 0.88 0.17 0.96 0.15 Serum albumin (g/l) 35.3 4.9 35.6 3.0 CRP (mg/l) 21.2 23.3 6.7 5.6 Haemoglobin (mmol/l) 7.4 0.7 7.6 1.0
RRF = residual renal function, D/P = dialysate-to-plasma ratio, nPCR = normalized protein catabolic rate, CRP = C-reactive protein, CML = Nε-(carboxymethyl)lysine, CEL = Nε-(carboxyethyl)lysine). * Difference is significant (P = 0.034)
The results of the measurements of concentrations of CML and CEL at baseline and after 3 months of PD treatment are shown in Table 6.2. The change in CEL concentrations, but not in CML concentrations, in effluent after 3 months of treatment with Dianeal and Physioneal was significantly different (P = 0.015; Figures 6.1 and 6.2). The CEL concentrations, but not CML concentrations, in effluents after 3 months of dialysis with Physioneal were significantly lower compared to Dianeal (76.4 ± 34.9 and 117.1 ± 44.3 nmol/l, respectively; P = 0.034). CML, but not CEL, in the peritoneal effluent was

76Chapter 6
inversely related to RRF (r = -0.67, P = 0.000) (Figure 6.3). Peritoneal glucose prescription was not related to CML or CEL in peritoneal effluent.
Table 6.2 Comparison of the concentrations of Nε-(carboxymethyl)lysine (CML) and Nε-(carboxyethyl)lysine (CEL) in peritoneal effluent, respectively at baseline and after 3 months of treatment with conventional glucose-containing lactate buffered dialysis solution (Dianeal®) and glucose-containing bicarbonate/lactate buffered dialysis solution (Physioneal®).
Glucose-containing lactate buffered
fluid (n = 11)
Glucose-containing bicarbonate/lactate buffered
fluid (n = 12) CML in effluent (nM) T = 0
93.9 28.1
110.6 58.7
CEL in effluent (nM) T = 0
96.8 ± 32.7
5.3 ± 29.1
CML in effluent (nM) T = 3 months
107.6 ± 40.1
94.6 ± 34.2
CEL in effluent (nM) T = 3 months
117.1 ± 44.3*
76.4 ± 34.9*
* Difference is significant (P = 0.034)
Figure 6.1 Change of Nε-(carboxymethyl)lysine (CML) concentrations in peritoneal effluent of the
Dianeal®-treated and Physioneal®-treated group (NS)

The influence of Physioneal® on AGEs and inflammatory markers in CAPD77
Figure 6.2 Change of Nε-(carboxyethyl)lysine (CEL) concentrations in peritoneal effluent of the
Dianeal®-treated and Physioneal®-treated group (P = 0.015).
Figure 6.3 Correlation between Nε-(carboxymethyl)lysine (CML) concentration in peritoneal
effluent and residual renal function (RRF) at baseline (Spearman’s Rho).
Discussion
The present study has two important findings: First, CEL in the peritoneal effluent appears to be influenced by the prescription of glucose-containing bicarbonate/lactate-buffered dialysis solution, whereas the effect on CML levels appeared to be less pronounced. Second, CML, but not CEL, in the peritoneal effluent was inversely related to RRF.

78Chapter 6
In our study, changes in CEL levels in the peritoneal effluent were significantly different in Physioneal compared with Dianeal. CEL is formed mainly by the reaction of MGO with lysine, whereas CML is a reaction adduct of GO and lysine. Earlier studies showed that the concentration of MGO is 90% reduced in Physioneal in comparison with Dianeal, while the concentration of GO is only 50% reduced in Physioneal in comparison to Dianeal. This might explain the fact that the prescription of Physioneal had a larger effect on levels of the MGO-derived AGE product CEL compared to the GO-derived AGE product CML. Another explanation for the nonsignificant change in CML levels could be the small size of the study population and it could be considered a type 2 error (false negative). In accordance with earlier observations, CML level in the peritoneal effluent was inversely related to RRF, whereas for CEL the relation with RRF was less strong. In contrast, Schmitt et al. did not find a relation between CML levels and RRF10. However, their study concerned a pediatric population with different treatment prescription and RRF compared to our population and the population studied by Van de Kerkhof et al.9.This confirms that CML levels in peritoneal effluent as well as in serum are significantly related with the RRF16. The present study is a randomized prospective trial with some drawbacks. Although AGEs may have an effect on peritoneal membrane as well as on vascular complications in patients with renal failure11; the present study was not designed to study the effect of prescription of more biocompatible PD solutions on these complications. The observed parameters and the sample size were limited. More patients randomized to the Physioneal group used 7.5% icodextrin. Although this might have an effect on CML levels at baseline, it is not likely that it interfered with the changes observed during the present study, as treated prescription of 7.5% icodextrin was not altered during the study. The clinical relevance of our findings should be the subject of further study. However, given the possible effects of AGE formation on peritoneal membrane abnormalities, the lower CEL concentrations in the peritoneal effluent might be a further argument for the improved biocompatibility of low-GDP solutions.
Conclusion
Levels of CEL in peritoneal effluent were lowered by the prescription of low-level GDP dialysis solution as compared to conventional dialysis solutions, whereas CML levels appeared to be less affected. In contrast, CML is primarily influenced by RRF. Further studies are needed in long-term trials to investigate the effect of low-GDP dialysis fluids in preventing peritoneal membrane failure.

The influence of Physioneal® on AGEs and inflammatory markers in CAPD79
References
1. Henle T, Deppisch R, Beck W, Hergesell O, Hansch GM, Ritz E. Advanced glycated end-products (AGE) during haemodialysis treatment: discrepant results with different methodologies reflecting the heterogeneity of AGE compounds. Nephrol Dial Transplant 1999;14:1968-1975.
2. Degenhardt TP, Grass L, Reddy S, Thorpe SR, Diamandis EP, Baynes JW. The serum concentration of the advanced glycation end-product N epsilon-(carboxymethyl)lysine is increased in uremia. Kidney Int 1997;52:1064-1067.
3. Weiss MF, Erhard P, Kader-Attia FA, Wu YC, Deoreo PB, Araki A, Glomb MA, Monnier VM. Mechanisms for the formation of glycoxidation products in end-stage renal disease. Kidney Int 2000;57:2571-2585.
4. Ahmed MU, Brinkmann Frye E, Degenhardt TP, Thorpe SR, Baynes JW. N-epsilon-(carboxyethyl)lysine, a product of the chemical modification of proteins by methylglyoxal, increases with age in human lens proteins. Biochem J 1997;324:565-570.
5. Posthuma N, ter Wee PM, Niessen H, Donker AJ, Verbrugh HA, Schalkwijk CG. Amadori albumin and advanced glycation end-product formation in peritoneal dialysis using icodextrin. Perit Dial Int 2001;21:43-51.
6. Schalkwijk CG, ter Wee PM, Teerlink T. Reduced 1,2-dicarbonyl compounds in bicarbonate/lactate-buffered peritoneal dialysis (PD) fluids and PD fluids based on glucose polymers or amino acids. Perit Dial Int. 2000;20(6):796-798.
7. Cooker LA, Luneburg P, Holmes CJ, Jones S, Topley N; Bicarbonate/Lactate Study Group. Interleukin-6 levels decrease in effluent from patients dialyzed with bicarbonate/ lactate-based peritoneal dialysis solutions. Perit Dial Int 2001;21(Suppl 3):S102-S107.
8. Ha H, Cha MK, Choi HN, Lee HB. Effects of peritoneal dialysis solutions on the secretion of growth factors and extracellular matrix proteins by human peritoneal mesothelial cells. Perit Dial Int 2002;22:171-177.
9. Van de Kerkhof J, Schalkwijk C, Konings C, Cheriex E, van der Sande F, Scheffer P, ter Wee P, Leunissn K, Kooman J. Nε-(carboxymethyl)lysine, Nε-(carboxyethyl)lysine and vascular cell adhesion molecule-1 (VCAM-1) in relation to peritoneal glucose prescription and residual renal function; a study in peritoneal dialysis patients. Nephrol Dial Transplant 2004;19: 910-916.
10. Schmitt PC, Von Heyl D, Rieger S, Arbeiter K, Bonzel KE, Fishbach M, Misselwitz J, Pieper AK, Schaefer F. Reduced systemic advanced glycation end products in children receiving peritoneal dialysis with low glucose degradation product content. Nephrol Dial Transplant 2007;22:2038-2044.
11. Miyata T, van Ypersele de Strihou C, Kurokawa K, Baynes JW. Alterations in nonenzymatic biochemistry in uremia: origin and significance of "carbonyl stress" in long-term uremic complications. Kidney Int 1999;55:389-399.


81
Part III Peritoneal dialysis in heart failure


83
Chapter 7 Peritoneal dialysis in patients with
congestive heart failure
Trijntje T. Cnossen Jeroen P. Kooman
Constantijn J.A.M. Konings Jan-Melle van Dantzig
Frank M. van der Sande Karel M. Leunissen
Nephrol Dial Transplant 2006;21 Suppl 2:ii63-ii66.

84Chapter 7
Abstract
Background Peritoneal dialysis (PD) may be a useful technique in the treatment of patients with congestive heart failure (CHF), both with and without primary end-stage renal disease (ESRD). Methods In the treatment of patients with ESRD and CHF, PD has theoretical advantages compared with hemodialysis (HD), such as the absence of an arteriovenous fistula and the more gradual fluid removal. In cohort studies, the incidence of heart failure was less as compared with HD, however, randomized studies on this aspect are lacking. Results As an acute rescue treatment of patients with treatment refractory heart failure, functional improvement has been observed with the use of PD. However, fluid removal is less predictable compared with continuous hemofiltration therapies. Conclusions As a long-term option for patients with treatment refractory CHF without ESRD, various case series showed improved functional performance and a reduction in hospitalization with the use of PD. However, also with the use of PD, median survival is still limited in these patients. Randomized studies are needed to establish the potential role of PD for this indication.

Peritoneal dialysis in patients with congestive heart failure85
Introduction
Fluid state has to be regulated between narrow margins in patients with congestive heart failure (CHF). In patients with concomitant end-stage renal disease (ESRD), hypovolaemia may lead to hypotension that may exacerbate cardiac and cerebral ischaemia, whereas overhydration may lead to pulmonary oedema. In heart failure patients without ESRD, it may be very difficult and sometimes impossible to maintain the balance between pre-renal failure and clinical signs of fluid overload. Peritoneal dialysis (PD) provides the opportunity to remove excess fluid in a gradual manner. Whereas PD is a well-established technique in patients with ESRD and CHF, there is discussion about the relative advantages and disadvantages of PD for this patient category compared with haemodialysis (HD). For patients with CHF without ESRD, data are much scarcer, although case series showed promising results. In this short review, the role of PD in the chronic treatment of patients with ESRD and CHF, its role as a rescue therapy in patients with CHF, and also in the long-term treatment of patients with CHF without ESRD will be discussed.
PD in patients with ESRD and CHF
The HEMO study found that the incidence of CHF in dialysis is >30% 1. This is in line with USRDS data in incident patients2. In the HEMO study, symptoms of CHF improved in 16% of the patients after the start of dialysis, but also developed de novo during dialysis therapy in 17% of the patients. Patients with CHF and ESRD have a far worse prognosis than patients without heart failure. In a study by Parfrey and Foley3, the 5-year survival of patients with systolic dysfunction of the heart was <10%. In a study, in incident patients by the same group, 5-year survival in patients with cardiac failure at the start of dialysis was virtually zero4. Data on the effect of PD in patients with CHF are scarce. Hebert et al.5 followed 17 patients with a LVEF below 35%, of which 13 had clinical signs of CHF NYHA III or IV. Survival at 24 months was 64%. Ten of these patients had a second measurement of LVEF during the follow-up period, which increased from 23 ± 9 to 30 ± 8%. There are no randomized studies which compared HD and PD in patients with CHF. Theoretical advantages of PD are the gradual fluid removal and the absence of an arteriovenous access, which may, especially in case of a high flow fistula, exacerbate or cause signs of heart failure. Potential disadvantages of PD are the less predictable and, in case of peritoneal membrane failure, inadequate fluid removal6. In a large cohort study7, hospitalization for heart failure was less in PD

86Chapter 7
compared with HD. However, due to their uncontrolled nature, it is difficult to make solid conclusions from these observations. Theoretically, the use of icodextrin would appear promising in patients with CHF due to its prolonged and gradual effect on peritoneal ultrafiltration8,9. However, icodextrin and standard glucose solutions have not been formally compared in PD patients with CHF. To conclude, patients with CHF and ESRD have in general a limited life expectancy Although, PD has theoretical advantages over HD in this patient population, the effect of both treatment modalities on outcome has not been compared in clinical studies. From a theoretical point of view, icodextrin appears promising, but has not yet been compared with standard glucose solutions in this patient population.
PD as a rescue therapy in patients with CHF without ESRD
A consequence of the reduction in renal perfusion due to forward failure in patients with heart failure is an increased activation of the renin-angiotensin and sympathetic nervous systems. This leads to renal vasoconstriction and increased proximal tubular sodium and water reabsorption. In turn, these phenomena cause a reduced distal sodium and water delivery, resistance to the effects of atrial natriuretic peptide and increased sensitivity of the distal nephron to the actions of aldosterone10. These mechanisms explain the occurrence of diuretic resistance. The concomitant fluid accumulation may lead to further reduction in cardiac output due to the Frank-Starling mechanism or a reduction in left ventricular inflow due to an increase in right ventricular diastolic volume11. Extracorporeal fluid removal may aid in the acute management of patients with severe CHF with insufficient response to diuretics. Theoretical advantages of these therapies are an improvement in cardiac output due to the Frank-Starling mechanism, an increased left ventricular diastolic inflow, and an improvement in lung compliance after removal of the excess fluid11,12. Moreover, a potential advantage above fluid removal by diuretics is the near-isotonic fluid removal with extracorporeal therapies compared with the hypotonic fluid removal with diuretics13. PD, isolated ultrafiltration or continuous hemofiltration have been used in the acute treatment of patients with CHF13,14. In various studies, the use of PD resulted in a reduction in plasma volume, improvement of hyponatremia, an improvement in diuretic responsiveness and improvement in glomerular filtration15,16. Clinical improvement has also been obtained with the use of isolated ultrafiltration and continuous haemofiltration13,17. A theoretical

Peritoneal dialysis in patients with congestive heart failure87
advantage of PD above isolated ultrafiltration is the more gradual fluid removal, although this advantage also holds true for continuous filtration therapies. Moreover fluid removal is less predictable with PD compared with continuous hemofiltration. Yet, no controlled studies have compared the effectiveness of these different treatment modalities in the acute treatment of patients with acute cardiac failure. A potential disadvantage of the use of PD in an acute situation is the occurrence of leaks. There are only few data on the occurrence of leaks after an acute start of PD, although early start of PD is usually considered a risk factor for pericatheter leaks12,18. In a study in 13 patients with CHF, in which PD was started immediately with low exchange volumes, no leaks occurred19 No further data with regard to the relation between pericatheter leaks and early start or filling volume are available in patients who used PD as an acute treatment modality for PD. In the acute treatment prescription of patients with CHF, most often initial small volume (500-1000 ml) hypertonic glucose solutions with short dwell times (1-2 h), possibly through a cycler14,15 are advocated, later on incrementally followed by larger exchange volumes (which will lead to more effective removal). With these treatment prescriptions, an hourly fluid removal of 67-568 ml/h was reportedly achieved14,15. Yet, data on the effect of PD as an acute treatment of cardiac failure on the long-term prognosis are very limited, which also holds true for other extracorporeal therapies. In 18 patients, unresponsive to diuretics and inotropic agents who were treated with isolated ultrafiltration, 78% showed an improvement in clinical status, but only 22% could be discharged from the hospital and 22% died after one session17. Summarizing, the use of extracorporeal treatment modalities, including PD, may result in clinical improvement in the acute treatment of patients with severe heart failure without ESRD, although its use so far is only supported by case series. However, the effect of extracorporeal treatment on the often dismal prognosis of these patients is not known and the experience still rather limited.
Long-term management of patients with CHF without ESRD
For the same reasons as previously mentioned, PD may also be useful in the chronic treatment of patients with CHF without ESRD. With more than 100 patients reported in the literature, the experience with PD as a chronic treatment for heart failure is larger compared with the acute situation14,15,20-28. Although, all the evidence available all has to be derived from case series, the large majority of patients treated with PD and reported in the literature

88Chapter 7
experienced an improvement in functional status and in three of the four reports which addressed this parameter, also retrospectively a reduction in hospitalization was observed. Mean serum creatinine in these reports ranged from 1.7 to 4.4 mg/dl, although not in all reports, detailed data on renal function at baseline were provided14,15. Despite clinical improvement, the median survival of patients treated with PD in the reports available appears to be <1-2 years. Therefore, a definite beneficial effect of PD on outcome in these patients remains as yet to be shown. Moreover, despite the theoretical advantages above intermittent extracorporeal therapies, no comparative data are available. Comparable results, with an improvement in functional status and reduction in hospitalization compared with the previous period, were also reported with intermittent ultrafiltration on an outpatient basis. It is difficult to propose selection criteria for the initiation of PD in patients with treatment refractory CHF. Mousson et al.20 were not able to define the criteria for the success or failure of PD as a chronic treatment in patients with CHF, although patients with cardio-thoracic ratio >70% or patients with prior need for ventilatory support fared worse. PD in patients with CHF without ESRD is most commonly prescribed as an intermittent treatment with 1-3 exchanges/day, with glucose concentrations prescribed on an individual basis, although in most series hypertonic solutions were used14,15,19,21. No data on the use of icodextrin are yet available. To summarize, positive experience with PD as a chronic treatment for patients with treatment refractory CHF is reported in the literature. However, all evidence has to be derived from case series. No comparative data of PD with other extracorporeal treatment modalities are available in these patients.
Conclusion
In patients with heart failure and ESRD, there is a wide experience with the use of PD, which has theoretical advantages compared with HD, although there are no comparative data on the effects of outcome and/or functional status between these two therapies. For the acute treatment of heart failure in patients without ESRD, experience with PD is limited, although in most series, functional improvement was shown. However, potential disadvantages of PD compared to continuous filtration therapies are the less predictable fluid removal and the possibility of early leaks. As a long-term option in patients with CHF without ESRD, the use of PD reportedly resulted in an improvement in clinical symptomatology and a reduction in hospitalization. However, as yet, the only evidence has to be derived from case series and should be confirmed in randomized trials.

Peritoneal dialysis in patients with congestive heart failure89
References
1. Cheung AK, Sarnak MJ, Yan G, Berkoben M, Heyka R, Kaufman A, Lewis J, Rocco M, Toto R, Windus D, Ornt D, Levey AS; HEMO Study Group. Cardiac diseases in maintenance hemodialysis patients: results of the HEMO Study. Kidney Int 2004;65:2380-2389.
2. Levin A, Foley RN. Cardiovascular disease in chronic renal insufficiency. Am J Kidney Dis 2000;36(Suppl 6):S24-S30.
3. Parfrey PS, Foley RN. The clinical epidemiology of cardiac disease in chronic renal failure. J Am Soc Nephrol 1999;10:1606-1615.
4. Foley RN, Parfrey PS, Harnett JD, Kent GM, Martin CJ, Murray DC, Barre PE. Clinical and echocardiographic disease in patients starting end-stage renal disease therapy. Kidney Int 1995;47:1861-1892.
5. Hebert MJ, Falardeau M, Pichette V, Houde M, Nolin L, Cardinal J, Quimet D. Continuous ambulatory peritoneal dialysis for patients with severe left ventricular systolic dysfunction and end-stage renal disease. Am J Kidney Dis 1995;25:761-768.
6. Enia G, Mallamaci F, Benedetto FA, Panuccio V, Parlongo S, Cutrupi S, Giacone G, Cottini E, Tripepi G, Malatino LS, Zoccali C. Long-term CAPD patients are volume expanded and display more severe left ventricular hypertrophy than haemodialysis patients. Nephrol Dial Transplant 2001;16:1459-1464.
7. Trespalacios FC, Taylor AJ, Agocca LY, Bakris GL, Abbott KC. Heart failure as a cause for hospitalisation in chronic dialysis patients. Am J Kidney Dis 2003;41:1267-1277.
8. Konings CJ, Kooman JP, Schonck M Gladziwa U, Wirtz J, van den Wall Bake AW, Gerlag PG, Hoorntje SJ, Wolters J, van der Sande FM, Leunissen KM. Effect of icodextrin on volume status, blood pressure and echocardiographic parameters: a randomized study. Kidney Int 2003;63:1556-1563.
9. Davies SJ, Woodrow G, Donovan K, Plum J, Williams P, Johansson AC, Bosselmann HP, Heimburger O, Simonsen O, Davenport A, Tranaeus A, Divino Filho JC. Icodextrin improves the fluid status of peritoneal dialysis patients: results of a double-blind randomized controlled trial. J Am Soc Nephrol 2003;14:2338-2344.
10. Cadnapaphornchai MA, Gurevich AK, Weinberger HD, Schrier RW. Pathophysiology of sodium and water retention in heart failure. Cardiology 2001;96:122-31.
11. Bargman JM. Nonuremic indications for peritoneal dialysis. Perit Dial Int 1993;13(Suppl 2): S159-S164.
12. Alpert MA, Huting J, Twardowski ZJ, Khanna R, Nolph KD. Continuous ambulatory peritoneal dialysis and the heart. Perit Dial Int 1995;15:6-11.
13. Ronco C, Ricci Z, Bellomo R, Bedogni F. Extracorporeal ultrafiltration for the treatment of overhydration and congestive heart failure. Cardiology 2001;96:155-168.
14. Mehrorta R, Khanna R. Peritoneal ultrafiltration for chronic congestive heart failure: rationale, evidence and future. Cardiology 2001;96:177-182.
15. Mehorta R. Peritoneal dialysis in adult patients without end-stage renal disease. Adv Perit Dial 2000;16:67-71.
16. Shilo S, Slotki IN, Iaina A. Improved renal function following acute peritoneal dialysis in patients with intractable congestive heart failure. Isr J Med Sci 1987;23:821-824.
17. Sheppard R, Panyon J, Pohwani AL, Kapoor A, Macgowan G, McNamara D, Mathier M, Johnston JR, Murali S. Intermittent outpatient ultrafiltration for the treatment of severe refractory congestive heart failure. J Card Fail 2004;10:380-383.
18. Leblanc M, Ouimet D, Pichette V. Dialysate leaks in peritoneal dialysis. Semin Dial 2001;14:50-54.
19. König PS, Lhotta K, Kronenberg F, Joannidis M, Herold M. CAPD; a successful treatment in patients suffering from therapy-resistant congestive heart failure. Adv Perit Dial 1991;7: 97-101.
20. Mousson C, Tanter Y, Chalopin JM, Rebibou JM, Dentan G, Morelon P, Rifle G. Traitement de línsufficance cardiaque congestive au stade terminal par dialyse peritoneale continue. Presse Med 1988;17:1617-1620.

90Chapter 7
21. Tormey V, Conlon PJ, Farrell J, Horgan J, Walshe JJ. Long-term successful management of refractory congestive heart failure by intermittent ambulatory peritoneal ultrafiltration. Quart J Med 1996;89:681-683.
22. Rubin J, Ball R. Continuous ambulatory peritoneal dialysis in treatment of severe congestive heart failure in the face of chronic renal failure. Arch Int Med 1986;146:1533-1535.
23. Robson M, Biro A, Knobel B, Schai G, Ravid M. Peritoneal dialysis in refractory congestive cardiac failure part II: Continuous ambulatory peritoneal dialysis. Perit Dial Bull 1983;3: 133-134.
24. Kim D, Khanna R, Wu G, Fountas P, Druch M, Oreopoulos DG. Succesful use of continuous ambulatory peritoneal dialysis in refractory heart failure. Perit Dial Bull 1985;5:127-130.
25. McKinnie JJ, Bourgeois RJ, Husserl FE. Long term therapy for heart failure with continuous ambulatory peritoneal dialysis. Arch Intern Med 1985;145:1128-1129.
26. Elhalel-Dranitzki M, Rubinger D, Moscovici A, Haviv YS, Friedlaender MM, Silver J, Popovster MM. CAPD to improve quality of life in patients with refractory heart failure. Nephrol Dial Transpl 1998;13:3041-3042.
27. Stegmayr BG, Banga R, Lundberg L, Wikdahl AM, Plum-Wirell M. PD treatment for severe congestive heart failure. Perit Dial Int 1996;16(Suppl 1):S231-S235.
28. Ryckelynck JP, Lobbedez T, Valette B, Le Goff C, Mazouz O, Levaltier B, Potier JC, Hurault de Ligny B. Peritoneal ultrafiltration and treatment-resistant heart failure. Nephrol Dial Transpl 1998;13(Supp 4):56-59.

91
Chapter 8 Retrospective analysis of peritoneal
dialysis in patients with primary
cardiac failure complicated by
renal failure
Trijntje T. Cnossen Jeroen P. Kooman
Constantijn J.A.M. Konings Nicole H.M.K. Uszko-Lencer
Karel M. Leunissen Frank M. van der Sande
Blood Purif 2010;30:146-152 .

92Chapter 8
Abstract
Background/Aims Clinical outcome in cardiorenal syndrome type 2 and treated with peritoneal dialysis (PD). Methods Retrospective analysis over a period of 10 years. Results Twenty-four patients with mean age at start of dialysis of 67 10 years and had mean survival on dialysis of 1.03 0.84 years (median survival 1.0 year). The number of hospitalizations for cardiovascular causes were reduced (13.7 26.5 predialysis versus 3.5 8.8 days/patient/month postdialysis, P = 0.001). Patients who survived longer than the median survival time (n = 12) also had a reduced number of hospitalizations for all causes (3.7 3.8 predialysis versus 1.4 2.1 days/patient/month postdialysis, P = 0.041), a lower age (62 10 versus 71 8 years, P = 0.013) and fewer had diabetes (2 versus 7 patients, P = 0.039), but left ventricular ejection fraction was not different. Conclusion After starting PD for cardiorenal syndrome, hospitalizations for cardiovascular causes were reduced for all patients. Survival after starting PD is highly variable. Age and diabetes seem to be significant prognostic factors, but not left ventricular ejection fraction.

PD in patients with primary cardiac failure complicated by renal failure93
Introduction
The incidence of congestive heart failure (CHF) is increasing due to a growing number of cardiovascularly compromised patients. Treatment of hypervolemic patients with treatment-resistant CHF complicated by progressive and permanent chronic renal insufficiency, also known as the cardiorenal syndrome (CRS) type 21, is notoriously difficult. Ambulant intermittent treatment with intravenous diuretics has been a rational option2-4. However, diuretic resistance may lead to recurrent episodes of pulmonary congestion and edema. The purpose of peritoneal dialysis (PD) is gradual fluid and excess sodium removal. PD offers potential advantages in patients with CRS type 2, even when not complicated by end-stage renal failure5-25. Several small studies have shown that PD may be useful in the treatment of CRS type 25-24. In the majority of the patients, an improvement of the functional status6,7,9,14-19, 21-23 and a reduction in hospitalization was observed compared to historical data13-15,20-23. The aim of the present retrospective study was to investigate the outcome of PD in patients known with CRS type 2. Secondly, the effect of PD on hospitalization during the first year after starting dialysis was compared with the last year before starting dialysis. Thirdly, potential prognostic factors for survival were studied.
Patients and methods
All patients treated with PD in our centre between August 1, 1997, and January 1, 2008, were screened for the primary cause of severe renal failure. Data on patients with CRS type 21 were retrieved from patient charts in the medical archive. The end of the follow-up period was January 1, 2009. Generally, in our hospital, we use PD primarily as a treatment option for CRS only in patients with severe renal failure, and not as a routine option in patients with less advanced stages of renal failure. All patients used commercially available glucose- and non-glucose-containing (e.g. icodextrin) dialysis solutions (Baxter Healthcare, IRL, Dublin, Ireland). Data were collected on co-morbidity, laboratory investigations, renal function, body weight, C-reactive protein (CRP), left ventricular ejection fraction (LVEF) on echocardiography and medication, duration and reasons of hospitalization, and causes of mortality. Blood laboratory investigations included hemoglobin, serum albumin, plasma urea and plasma creatinine. Residual glomerular filtration rate (GFR) was calculated using Modification of Diet in Renal Disease (MDRD) formula.

94Chapter 8
Adequacy of PD, determined by Kt/V urea was assessed from the 24-hour peritoneal effluent and urine collections, and calculated using PD Adequest 2.0 for Windows (Baxter Healthcare). The study was approved by the Ethical Committee of the Maastricht University Medical Center+, Maastricht, The Netherlands.
Statistical analysis
Results are expressed as mean values and standard deviations. Because the data of our study population are asymmetrically distributed, nonparametric tests as the Mann-Whitney U and Wilcoxon signed rank tests, were used to analyze the differences before and after starting dialysis and the outcome between patients who survived less and longer than the median survival time. Survival was assessed by Kaplan-Meier survival analysis. Due to the limited number of patients, Cox regression analysis was not used. A P-value of < 0.05 was considered significant. All of the statistical analyses were made using SPSS for Windows statistical software (release 16.0).
Results
Over a period of 10 years, 24 patients (6 women and 18 men) known with primary treatment-resistant CHF complicated by severe renal failure (CRS type 2) were treated by (incremental) chronic ambulatory PD. Six patients (25%) started initially with 1 dwell per day (incremental continuous ambulatory PD). The other patients started with 4 dwells of 2000 ml per 24 h. The underlying cause of renal failure was mainly chronic glomerulosclerosis/atherosclerosis. In absence of hematuria or significant proteinuria, kidney biopsies were in general not performed. Commercially available glucose and non-glucose containing (e.g. icodextrin) solutions were used. Ten patients (42%) started first with intermittent hemodialysis (IHD) and switched later to PD. Mean time on IHD was 35 60 days. Twelve patients (50%) with a hypervolemic status due to treatment-resistant CHF started with dialysis in an acute setting (CRS type 1). At the end of the follow-up period 3 patients were still treated for more than 12 months. Mean duration of dialysis was 1.03 0.84 years (median survival time 1.0 years; range 10 days to 41 months). The cumulative survival after starting dialysis is shown in a Kaplan-Meier curve (Figure 8.1). Mean age at start of dialysis was 67 10 years. Mean diuresis before start of dialysis was 1403 756 ml per 24 h, and mean GFR was 14.8 12.1 ml/min. Eleven patients (46%) did not have ESRD (highest GFR was 52.2 ml/min). Eight patients had heart failure because of ischemic cardiomyopathy, 12 patients had a dilated cardiomyopathy and 4 patients had a dilated ischemic
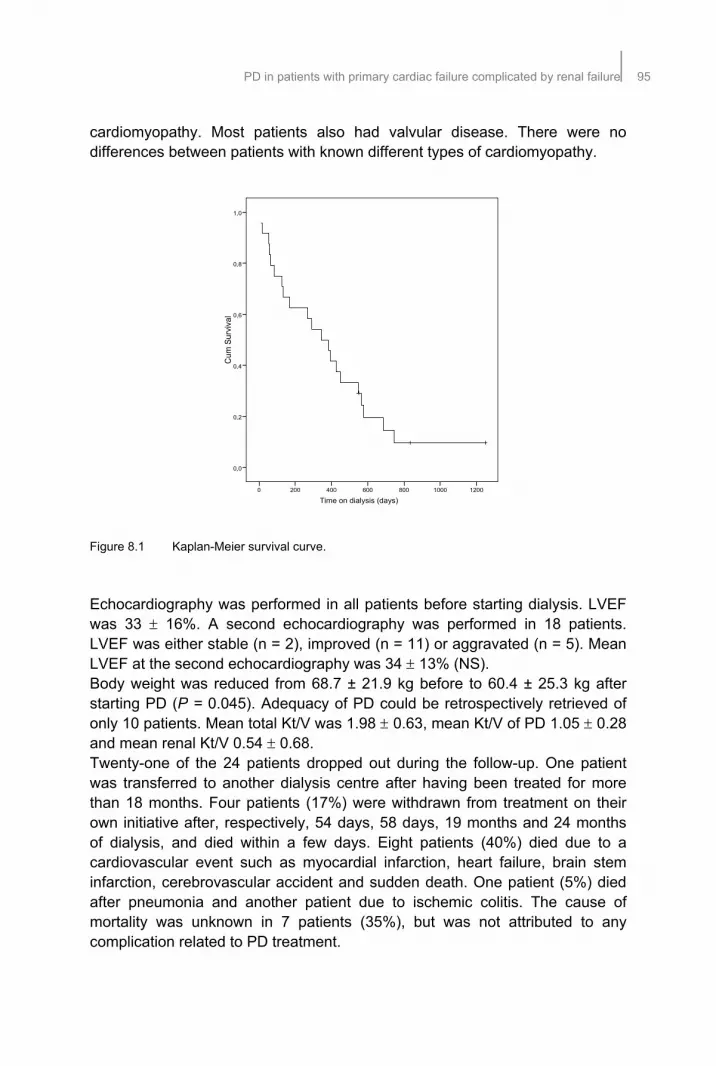
PD in patients with primary cardiac failure complicated by renal failure95
cardiomyopathy. Most patients also had valvular disease. There were no differences between patients with known different types of cardiomyopathy. Figure 8.1 Kaplan-Meier survival curve.
Echocardiography was performed in all patients before starting dialysis. LVEF was 33 16%. A second echocardiography was performed in 18 patients. LVEF was either stable (n = 2), improved (n = 11) or aggravated (n = 5). Mean LVEF at the second echocardiography was 34 13% (NS). Body weight was reduced from 68.7 ± 21.9 kg before to 60.4 ± 25.3 kg after starting PD (P = 0.045). Adequacy of PD could be retrospectively retrieved of only 10 patients. Mean total Kt/V was 1.98 0.63, mean Kt/V of PD 1.05 0.28 and mean renal Kt/V 0.54 0.68. Twenty-one of the 24 patients dropped out during the follow-up. One patient was transferred to another dialysis centre after having been treated for more than 18 months. Four patients (17%) were withdrawn from treatment on their own initiative after, respectively, 54 days, 58 days, 19 months and 24 months of dialysis, and died within a few days. Eight patients (40%) died due to a cardiovascular event such as myocardial infarction, heart failure, brain stem infarction, cerebrovascular accident and sudden death. One patient (5%) died after pneumonia and another patient due to ischemic colitis. The cause of mortality was unknown in 7 patients (35%), but was not attributed to any complication related to PD treatment.
Cum
Sur
viva
l
1,0
0,8
0,6
0,4
0,2
0,0
120010008006004002000
Time on dialysis (days)

96Chapter 8
Hospitalization, expressed as the number of hospitalization days per patient per month, was compared between the last year before starting dialysis and the first year after starting dialysis. For all patients, the hospitalization time for all causes was 14.0 26.4 days/patient/month before and 7.4 10.5 days/patient/month after starting dialysis (NS). Reasons for hospitalization were umbilical hernia, diabetic foot, implantation of pacemaker or internal cardiac defibrillator, gastric perforation, pulmonary embolus and infections as peritonitis (n = 4), pneumonia and catheter sepsis during temporary IHD (n = 1). Hospitalization time for cardiovascular causes was 13.7 26.5 days/patient/month before and 3.5 8.8 days/patient/month after starting dialysis (P = 0.001), equivalent to a 74% reduction. Patients who survived less than the median survival time (group A; n = 12) were compared with patients who survived longer than the median survival time (group B; Table 8.1). In group B, there were fewer patients with diabetes mellitus (17% in group B versus 58% in group A; P = 0.039). There were no differences between both groups in other co-morbidities such as cerebrovascular accident, coronary artery bypass graft, peripheral arterial disease or chronic obstructive pulmonary disease. Mean age at start of PD in group B was lower than in group A (62 10 years in group B versus 71 8 years in group A; P = 0.013). LVEF at start was not significantly different between both groups. Use of medications as angiotensin-converting enzyme and angiotensin II inhibitors, diuretics, beta-blockers, statins and anticoagulation, was not different between both groups. Table 8.1 Characteristics of patients in groups A and B.
Group A Group B Patients 12 12 Men (%) 11 (92) 7 (58) Diabetes (%)* 7 (58) 2 (17) Start in acute setting (%) 7 (58) 5 (42) Initial treatment with IHD 5 5 Use of icodextrin (%) 5 (42) 8 (67) Age at start PD (years)** 71.3 ± 8.0 61.5 ± 9.6 Mean body weight (kg)*** 74.9 ± 13.0 64.8 ± 25.9 Time on IHD (days) 18 ± 36 52 ± 75 Mean MDRD (ml/min/1.73m2) 15.0 ± 9.0 15.3 ± 10.7 Mean hemoglobin (mmol/l)@ 6.8 ± 0.99 6.7 ± 0.78 Mean diuresis (ml/24 h) 928 ± 878 1333 ± 552 Mean GFR (ml/min) 15.7± 9.6 14.3 ± 13.7 Mean serum albumin (g/l) 34.4 ± 6.1 34.2 ± 7.5 Mean CRP (mg/l) 9.0 ± 10.2 26.1 ± 31.5 LVEF predialysis (%) 32 ± 17 34 ± 16
* P = 0.039, ** P = 0.013, *** P = 0.000. @ Correction factor: 1 mmol/l is equivalent to 1.611 g/l

PD in patients with primary cardiac failure complicated by renal failure97
Body weight at start was lower in group B than in group A (64.8 ± 25.9 kg versus 74.9 ± 13.0 kg; P = 0.000). Adequacy of PD was not different between patients who survived less or more than 1 year. Hospitalization for all causes was compared for groups A and B between the last year before starting dialysis and the first year after starting dialysis (Table 8.2A). Hospitalization time for all causes was lower in group B than in group A before starting dialysis (3.7 ± 3.8 versus 24.3 ± 34.8 days/patient/month, respectively; P = 0.040) and after starting dialysis (1.4 ± 2.1 versus 13.3 ± 12.2 days/patient/month, respectively; P = 0.003). In group B, hospitalization for all causes was decreased from 3.7 3.8 days/patient/month before dialysis to 1.4 2.1 days/patient/month after starting dialysis (P = 0.041), equivalent to a 62% reduction. Also hospitalization for cardiovascular causes was compared for both groups (Table 8.2B). Patients in group B were less frequently hospitalized for cardiovascular causes before starting dialysis (3.1 3.9 days/patient/month in group B and 24.2 34.9 days/patient/month in group A; P = 0.026). In both groups, the hospitalization time for cardiovascular causes reduced after starting dialysis [group A: 24.2 34.9 before versus 6.7 11.9 days/patient/month after starting dialysis (P = 0.013), equivalent to a 72% reduction, and in group B: 3.3 3.9 before versus 0.3 0.5 days/patient/month after starting dialysis (P = 0.008), equivalent to a 91% reduction]. Table 8.2 Hospitalization (number of days/patient/month) for all causes and cardiovascular
causes before and after starting dialysis.
A. All causes Before start After start All patients (n = 24) 14.0 ± 26.4 7.4 ± 10.5 Group A (n = 12) 24.3 ± 34.8** 13.3 ± 12.2***
Group B (n = 12) 3.7 ± 3.8*, ** 1.4 ± 2.1*, ***
* P = 0.041, ** P = 0.040, *** P = 0.003.
B. Cardiovascular causes Before start After start All patients (n = 24) 13.7 ± 26.5* 3.5 ± 8.8* Group A (n = 12) 24.2 ± 34.9**, # 6.7 ± 11.9** Group B (n = 12) 3.3 ± 3.9***, # 0.3 ± 0.5***
* P = 0.001, ** P = 0.013, *** P = 0.008, # P = 0.026.
Further, patients who started dialysis in an acute setting (during hospitalization; n = 12) were compared with patients who started in the outpatient setting. Patients in the outpatient setting started more frequently with PD (83%), whereas patients in the acute setting were more frequently (67%, P = 0.015)

98Chapter 8
and longer treated with IHD, (57 versus 13 days, respectively; P = 0.020). Patients with diabetes started less frequently in an acute setting (17 versus 58%, respectively; P = 0.039). Mean level of hemoglobin was higher in patients starting dialysis in the out-patient setting (7.1 0.8 versus 6.4 0.8 mmol/l, respectively; P = 0.045). Hospitalization for cardiovascular causes was reduced for patients in the acute setting (18.0 29.1 before and 6.9 11.7 days/patient/month after dialysis, P = 0.041, equivalent to a 62% reduction), as well for patients in the outpatient setting (9.5 24.2 before and 0.04 0.12 days/patient/month after dialysis, P = 0.003, equilvalent to a 99% reduction; Table 8.3). But hospitalization time was lower for all causes and cardiovascular causes after starting dialysis in the outpatient setting (2.4 4.1 versus 12.3 12.7 days/patient/month for all causes, P = 0.035, and 0.04 0.12 versus 6.9 11.7 days/patient/month for cardiovascular causes, P = 0.000; Table 8.3). Table 8.3 Hospitalization (number of days/patient/month) for patients starting dialysis in acute
versus outpatient setting.
Acute setting
(n = 12) Outpatient setting
(n = 12) Hospitalization time for all causes Before dialysis 18.2 ± 29.0 9.7 ± 24.1 After dialysis 12.3 ± 12.7* 2.4 ± 4.1* Hospitalization time for cardiovascular causes Before dialysis 18.0 ± 29.1# 9.5 ± 24.2##
After dialysis 6.9 ± 11.7**, # 0.04 ± 0.12**, ##
* P = 0.035, ** P = 0.000, # P = 0.041, ## P = 0.003.
Hospitalization times of group A patients who started dialysis in an acute and an outpatient setting were not different compared to group B (Tables 8.4A, 8.4B). Although, hospitalization of group B patients who started dialysis in the outpatient setting was reduced for all causes (2.5 0.8 before versus 0.9 1.1 days/patient/month after starting dialysis, P = 0.028, equivalent to a 64% reduction) and for cardiovascular causes (2.1 0.8 before and 0.1 0.2 days/patient/month after starting dialysis, P = 0.018, equivalent to a 95% reduction; Table 8.4B). There were no differences between first starting with IHD and first starting with PD with respect to mean age, mean diuresis, mean GFR, mean body weight, mean hemoglobin, mean CRP, mean serum albumin, LVEF predialysis, number of hospitalizations for all and cardiovascular causes and survival. Complications related to PD technique (17%) were pericatheter leakage (n = 1), recurrent peritonitis (n = 2) and umbilical hernia (n = 1). Complications
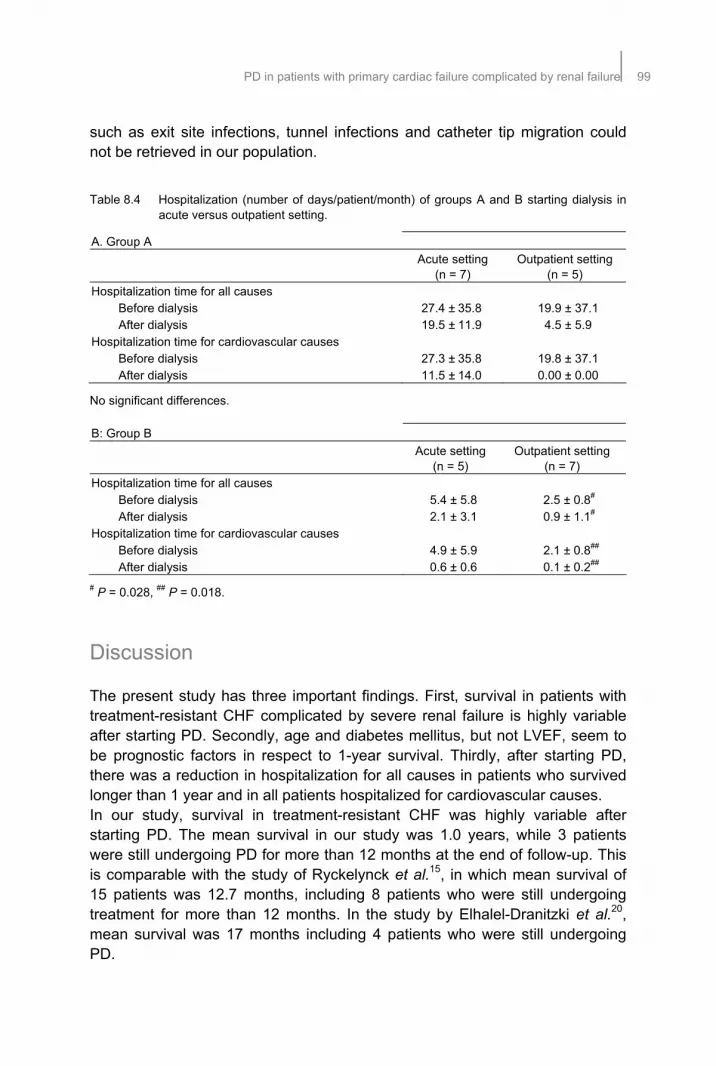
PD in patients with primary cardiac failure complicated by renal failure99
such as exit site infections, tunnel infections and catheter tip migration could not be retrieved in our population. Table 8.4 Hospitalization (number of days/patient/month) of groups A and B starting dialysis in
acute versus outpatient setting.
A. Group A
Acute setting
(n = 7) Outpatient setting
(n = 5) Hospitalization time for all causes Before dialysis 27.4 ± 35.8 19.9 ± 37.1 After dialysis 19.5 ± 11.9 4.5 ± 5.9 Hospitalization time for cardiovascular causes Before dialysis 27.3 ± 35.8 19.8 ± 37.1 After dialysis 11.5 ± 14.0 0.00 ± 0.00
No significant differences.
B: Group B
Acute setting
(n = 5) Outpatient setting
(n = 7) Hospitalization time for all causes Before dialysis 5.4 ± 5.8 2.5 ± 0.8#
After dialysis 2.1 ± 3.1 0.9 ± 1.1#
Hospitalization time for cardiovascular causes Before dialysis 4.9 ± 5.9 2.1 ± 0.8##
After dialysis 0.6 ± 0.6 0.1 ± 0.2##
# P = 0.028, ## P = 0.018.
Discussion
The present study has three important findings. First, survival in patients with treatment-resistant CHF complicated by severe renal failure is highly variable after starting PD. Secondly, age and diabetes mellitus, but not LVEF, seem to be prognostic factors in respect to 1-year survival. Thirdly, after starting PD, there was a reduction in hospitalization for all causes in patients who survived longer than 1 year and in all patients hospitalized for cardiovascular causes. In our study, survival in treatment-resistant CHF was highly variable after starting PD. The mean survival in our study was 1.0 years, while 3 patients were still undergoing PD for more than 12 months at the end of follow-up. This is comparable with the study of Ryckelynck et al.15, in which mean survival of 15 patients was 12.7 months, including 8 patients who were still undergoing treatment for more than 12 months. In the study by Elhalel-Dranitzki et al.20, mean survival was 17 months including 4 patients who were still undergoing PD.

100Chapter 8
The patients in our study who survived longer than the median survival time were younger at starting PD, had lower prevalence of diabetes and were less hospitalized before starting dialysis. Probably they were in a better functional (and cardiovascular) condition than those who survived less than the median survival time. Also, in the first year after start of dialysis those patients had a significant reduction in hospitalizations for all causes and cardiovascular causes. We could not reveal any correlation between LVEF at the beginning of dialysis and survival time after starting dialysis, as was earlier described by Hebert et al.26. Survival rate is usually correlated with LVEF at the beginning of treatment, but in our study mean LVEF assessed by echocardiography was not significantly higher in patients who survived longer than the median survival time. During follow-up, only 10 of the 18 patients who had a second echocardiography showed an improvement in LVEF. Probably due to intercurrent diseases and co-morbidities as diabetes, which could influence the (cardiovascular) condition and survival prognosis, LVEF does not always increase after starting dialysis. In the study of Kim et al.6, 2 patients showed an improvement in LVEF, 1 patient had a stable LVEF and 1 patient had a deterioration in LVEF, although all patients exhibited a functional improvement by 1 or 2 NYHA classes after starting PD. Mehrotra and Kathuria analyzed 7 studies, and concluded that >90% of the patients improved in functional status after starting dialysis24. An important limitation of our retrospective study is that the change in functional status could not be retrieved. In the present study, a reduction of hospitalization after starting dialysis for cardiovascular causes was observed in all patients. A reduction in hospitalization for all causes was only observed in patients who were treated longer than the median survival time. This finding is consistent with earlier studies13-15,20-23. Hospitalization for cardiovascular causes was reduced for patients starting in the acute as well in the outpatient setting. In patients who survived longer than the median survival time and starting dialysis in an outpatient setting, hospitalization for all and cardiovascular causes was significantly reduced. Probably patients starting dialysis in the outpatient setting were in a better functional and more stable (cardiovascular) condition. They started more frequently with PD, had a higher mean hemoglobin concentration and more frequently diabetes. In contrast, in our study the number of hospitalization days for all causes did not increase in patients who were treated shorter than the median survival time, which did not appear to be primarily related to complications of PD treatment, but rather to a worsening of the general (cardiovascular) status of the patients. Also in the study performed by Rubin and Ball, hospitalization
PD in patients with primary cardiac failure complicated by renal failure101
rates failed to improve due to dialysis complications and underlying heart disease27. In our study, patients who survived less than 1 year were significantly older and had significantly greater prevalence of diabetes mellitus. Older age and diabetes are important prognostic factors for survival in patients known with treatment-resistant CHF complicated by severe renal failure and treatment with PD. This finding is consistent with earlier studies. A reduction in hospitalization and an improvement in functional status after starting PD in treatment-resistant CHF, could consequently lead to an improvement in quality of life. In only two observational studies was the quality of life assessed. First, in the study of Stegmayr et al., 16 patients with known CHF were treated with PD, and within 1 month all patients improved in functional status and also in quality of life18. In the study by Bertoli et al., only 2 patients with known CHF were treated with a single nocturnal exchange with icodextrin. After at least 12 months of treatment, a reduction in morbidity and hospitalization was seen, as well as a significant improvement in quality of life in both patients25. More studies are needed to confirm these data. Use of icodextrin, a glucose polymer, might be particularly interesting in patients with hypervolemic treatment-resistant CHF because of the ability to generate sustained ultrafiltration over periods of long dwells and to allow euvolemia by a single nocturnal exchange. It may reduce ECF volume, TBW and BW due to better ultrafiltration and sodium losses28-32. Furthermore, it contains a lower concentration of glucose degradation products than conventional PD fluids. In the present study, only 13 of the 24 patients (54%) used icodextrin. This number of patients was too small in order to reveal any correlation with outcome parameters. Further, body weight was significantly reduced after starting PD. This may reflect the increased sodium removal and results in a reduced number of hospitalizations. Patients who survived less than 1 year had a significantly higher body weight at start of dialysis. Probably, these patients were more hypervolemic before starting dialysis and consequently in a worse (cardial) condition. This may suggest that dialysis should be started in time in patients with CRS and progressive chronic renal insufficiency. Limitations of the present study are its retrospective design, the limited number of patients over a relatively long observation period and the absence of detailed information on functional status, quality of life and fluid status. Prospective studies are needed to know more about the effect and outcome of dialysis in patients with known treatment-resistant CHF.

102Chapter 8
Conclusion
In our opinion, based on the results in literature and our own clinical experience, PD is a feasible therapy in a selected group of patients with treatment-resistant CHF complicated by severe renal failure. However, after starting PD we observed a reduction in hospitalization for cardiovascular causes for all patients, but a reduction in hospitalization for all causes was only observed in patients who survived longer than the median survival time. Age and diabetes mellitus, but not LVEF, appeared to be important prognostic factors with respect to survival. However, patient selection remains difficult. Further investigations are needed to clearly define the criteria for starting PD in CRS type 2.

PD in patients with primary cardiac failure complicated by renal failure103
References
1. Ronco C, Chionh C, Haapio M, Anavekar NS, House A, Bellomo R. The cardiorenal syndrome. Blood Purif 2009;27:114-126.
2. Riley DJ, Weir M, Bakris GL. Renal adaptation to the failing heart: Avoiding a ‘therapeutic misadventure’. Postgrad Med 1994;95:153-164.
3. Ellison DH. Diuretic drugs and the treatment of edema: from clinic to bench and back again. Am J Kidney Dis 1994;23:623-643.
4. Elisson DH. Diuretic combinations in the treatment of edema: rationale and recommendations. Drug Ther 1994;24:23-33.
5. Robson M, Biro A, Kobel B, Schai G, Ravid M. Peritoneal dialysis in congestive heart failure I-continuous ambulatory peritoneal dialysis. Per Dial Bull 1983;3:133-136.
6. Kim D, Khanna R, Wu G, Fountas P, Druck N, Oreopoulos DG. Successful use of continuous ambulatory peritoneal dialysis in congestive heart failure. Per Dial Bull 1983;3:133-134.
7. Konig P, Geissler D, Lechleitner P, Spielberg M, Dottarch P. Improved management of congestive heart failure. Use of continuous ambulatory peritoneal dialysis. Arch Intern Med 1987;147:1031-1034.
8. Nakajima U, Suga T, Ishida K, Successful use of continuous ambulatory peritoneal dialysis (CAPD) in the treatment of patients with renal and cardiac failure. Tokai J Exp Clin Med 1986;11:774-783.
9. Rubin J, Ball R. Continuous ambulatory peritoneal dialysis as a treatment of severe congestive heart failure in the face of chronic renal failure. Report of eight cases. Arch Intern Med 1986;146:533-535.
10. Stegmayr BG, Lundberg L, Widahl AM, Wirell-Plum M. Severe heart failure (sHF): an indication for ultrafiltration by peritoneal dialysis techniques. Perit Dial Int 1994;14:S62.
11. Van der Sande FM, Kho L, Leunissen KML. Effects of continuous ambulatory peritoneal dialysis in the treatment of patients with therapy-resistant congestive heart failure and (pre)renal failure (personal observations, 1996).
12. Bertoli S, Ciurlino D, Martino S, Maccario M, Ballabeni C. Ultrafiltrative peritoneal treatment in patients with severe congestive heart failure (NYHA class III-IV) and Moderate to severe chronic renal insufficiency (CRI). Perit Dial Int 2004;24:S31.
13. Mehrotra R, Khanna R. Peritoneal ultrafiltration for chronic congestive heart failure: rationale, evidence and future. Cardiology 2001;96:177-182.
14. Ortiz AM, Acosta PA, Corbalan R, Jalil JE. Long-term automated peritoneal dialysis in patients with refractory congestive heart failure. Adv Perit Dial 2003;19:77-80.
15. Ryckelynck JP, Lobbedez T, Valette B, Le Goff C, Mazouz O, Levaltier B, Potier JC, Hurault de Ligny B. Peritoneal ultrafiltration and refractory congestive heart failure. Adv Perit Dial 1997;13:93-97.
16. McKinnie JJ, Bourgeois RJ, Husserl FE. Long-term therapy for heart failure with continuous ambulatory peritoneal dialysis. Arch Intern Med 1985;145:1128-1129.
17. Mousson C, Tanter Y, Chalopin JM, Rebibou JM, Dentam G, Morelon P, Rifle G. Treatment of refractory congestive cardiac insufficiency by continuousperitoneal dialysis. Long-term course. Presse Med 1988;17:1617-1620.
18. Stegmayr BG, Banga R, Lundberg L, Wikdahl AM, Plum-Wirell M. PD treatment for severe congestive heart failure. Perit Dial Int 1996; 6 : 1- .
19. Bilora F, Petrobelli F, Boccioletti V, Pomerri F. Treatment of heart failure and ascites with ultrafiltration in patients with intractable alcoholic cardiomyopathy. Panminerva Med 2002;44(1):23-25.
20. Elhalel-Dranitzki M, Rubinger D, Moscovici A, Haviv YS, Friedlaender MM, Silver J, Popovtzer MM. CAPD to improve quality of life in patients with refractory heart failure. Nephrol Dial Transplant 1998;13(12):3041-3042.
21. Freida P, Ryckelynck JP, Potier J, Hurault de Ligny B, Mazouz O, Al Halabi A. Place de l’ultrafiltration péritonéale dans le traitement médical de l’insuffisance cardiaque au stade IV de la NYHA. Bull Dial Perit 1995;5:7-18.
1 Suppl 1 S23 235

104Chapter 8
22. Tormey V, Conlon PJ, Farrell J, Horgan J, Walshe JJ. Long-term successful management of refractory congestive cardiac failure by intermittent ambulatory peritoneal ultrafiltration. 1996;89:681-683.
23. Gotloib L, Fudin R, Yakubovich M, Vienken J. Peritoneal dialysis in refractory end-stage congestive heart failure: a challenge facing a no-win situation. Nephrol Dial Transplant 2005;20:32-36.
24. Mehrotra R, Kathuria P. Place of peritoneal dialysis in the management of treatment-resistant congestive heart failure. Kidney Int 2006;70:67-71.
25. Bertoli SV, Ciurlino D, Maccario M, Martino S, Bigatti G, Traversi L, Procaccio M, Buzzi L. Home peritoneal ultrafiltration in patients with severe congestive heart failure without end-stage renal disease. Adv Perit Dial 2005;21:123-127.
26. Hebert MJ, Falardeau M, Pichette V, Houde M, Nolin L, Cardinal J, Ouimet D. Continuous ambulatory peritoneal dialysis for patients with severe left ventricular systolic dysfunction and end-stage renal disease. Am J Kidney Dis 1995;25:761-768.
27. Rubin J, Ball R. Continuous ambulatory peritoneal dialysis as treatment of severe congestive heart failure in the face of chronic renal failure. Report of eight cases. Arch Intern Med 1986;146:1533-1535.
28. Plum J, Gentile S, Verger C, Brunkhorst R, Bahner U, Faller B, Peeters J, Freida P, Struijk DG, Krediet RT, Grabensee B, Tranaeus A, Filho JC. Efficacy and safety of a 7.5% icodextrin peritoneal dialysis solution in patients treated with automated peritoneal dialysis. Am J Kidney Dis 2002;39:862-871.
29. Woodrow G, Oldroyd B, Stables G, Gibson J, Turney JH, Brownjohn AM.Effects of icodextrin in automated peritoneal dialysis on blood pressure and bioelectrical impedance analysis. Nephrol Dial Transplant 2000;15:862-866.
30. Davies SJ, Woodrow G, Donovan K, Plum J, Williams P, Johansson AC, Bosselmann HP, Heimburger O, Simonsen O, Davenport A, Tranaeus A, Divino Filho JC. Icodextrin improves the fluid status of peritoneal dialysis patients: results of a double-blind randomized controlled trial. J Am Soc Nephrol 2003;14:2338-2344.
31. Konings CJ, Kooman JP, Schonck M, Gladziwa U, Wirtz J, van den Wall Bake AW, Gerlag PG, Hoorntje SJ, Wolters J, van der Sande FM, Leunissen KM. Effect of icodextrin on volume status, blood pressure and echocardiographic parameters: a randomized study. Kidney Int 2003;63:1556-1563.
32. Boudville NC, Cordy P, Millman K, Fairbairn L, Sharma A, Lindsay R, Blake PG. Blood pressure, volume, and sodium control in an automated peritoneal dialysis population. Perit Dial Int 2007;27:537-543.
JMQ

105
Chapter 9 Prospective study on clinical effects
of renal replacement therapy in
treatment-resistant congestive
heart failure
Trijntje T. Cnossen Jeroen P. Kooman Harmen P. Krepel
Constantijn J.A.M. Konings Nicole H.M.K. Uszko-Lencer
Karel M. Leunissen Frank M. van der Sande
Nephrol Dial Transplant in press.

106Chapter 9
Abstract
Background/Aims Clinical outcome in cardiorenal syndrome (CRS) type 2 and treatment with dialysis. Methods Prospective observational non-randomized study. Results Twenty-three patients were included, mean age 66 21 years. Twelve (52%) patients were treated with peritoneal dialysis (PD) and 11 (48%) with intermittent hemodialysis (IHD). Median survival time after start of dialysis was 16 months. Hospitalizations for cardiovascular causes were reduced (1.4 ± 0.6 predialysis versus 0.4 ± 0.6 days/patient/month postdialysis, P = 0.000), without significant changes in hospitalization for all causes (1.8 ± 1.6 versus 2.1 ± 2.9 days/patient/month). New York Heart Association (NYHA) class (3.8 ± 0.4 at start versus 2.4 ± 0.7 after 4 months, P = 0.000, versus 2.7 ± 0.9 after 8 months, P = 0.001) and quality of life tended to improve (63 ± 21 at start, versus 41 ± 20 after 4 months, versus 51 ± 25 after 8 months; P = 0.056)). Left ventricular ejection fraction did not change. The number of technical complications associated with dialysis therapy was relatively high in this population. Conclusion After starting dialysis for CRS, hospitalizations for cardiovascular causes were reduced, but not hospitalizations for all causes. Functional NYHA class improved and quality of life tended to improve, without evidence for a change in cardiac function. In this small study, no differences between IHD and PD were observed.

Renal replacement therapy in treatment-resistant congestive heart failure107
Introduction
The incidence of congestive heart failure (CHF) is still increasing. Continuous improvement of cardiac care has resulted in more people surviving acute cardiac diseases and consequently living longer to develop finally heart failure. Treatment of hypervolemic patients with CHF complicated by progressive and permanent chronic renal insufficiency, also known as the cardiorenal syndrome (CRS) type 2, is notoriously difficult1. Patients may develop diuretic-resistance leading to recurrent episodes of pulmonary congestion and oedema2-4. In patients with acute decompensated heart failure, continuous ultrafiltration resulted in a reduction in rehospitalization during a 90-day follow-up period5. However, this treatment modality is less suitable for chronic treatment of diuretic-resistance, such as may occur during CRS type 2. Peritoneal dialysis (PD) has as main characteristics of gradual fluid removal and extra sodium loss and offers potential advantages in patients with CRS type 2, even when not complicated by severe renal failure6-24. Several small studies have shown that extracorporeal treatment may be useful in the treatment of CRS type 27-25. In the majority of these patients, an improvement of functional status11-22,25 and a reduction in hospitalization was observed compared to historical data18-25. Recently, we performed a retrospective analysis in patients with CRS type 2 and treated with PD26. Survival time after starting PD was highly variable and the number of hospitalizations for cardiovascular causes was reduced after starting PD. Age and diabetes appeared to be significant prognostic factors, but not left ventricular ejection fraction (LVEF). However, despite the possible advantages of PD in the treatment of diuretic-resistant CHF, in our clinics, also intermittent hemodialysis (IHD) and (daily) isolated ultrafiltration are offered if PD is either not feasible or based on patient preference. The aim of our study was to investigate the outcome of renal replacement therapy in patients’ known with hypervolemic treatment-resistant CHF complicated by renal impairment. Secondly, the effect of renal replacement therapy on hospitalization after starting dialysis was compared with the last 2 years before starting dialysis. Thirdly, functional status, echocardiographic parameters and quality of life were evaluated.
Patients and methods
In this prospective observational non-randomized study, 23 patients with CRS type 2 were treated with PD or IHD based on clinical indication. Only patients with severe congestive heart failure accompanied by renal failure resistant to

108Chapter 9
high dose of intravenous diuretics were included. These were all patients in whom conservative therapy had failed to control their symptoms. Patients were included between 1 February 2008 and 1 August 2009. The end of the follow-up period was 1 April 2011. Patient characteristics at baseline are displayed in Table 9.1. Mean age at start of dialysis was 66 21 years. Mean glomerular filtration rate (GFR) at baseline was 14.6 12.1 ml/min (95% CI 0 - 28.5 ml/min). Fourteen patients had chronic kidney disease (CKD) Stage V, 7 patients had CKD IV and 2 patients had CKD III. According to clinical charts, renal failure was related to nephro-angiosclerosis (n = 7), reduced renal perfusion due to hypotension (n = 14) and diabetic nephropathy (n = 2). In the absence of hematuria or significant proteinuria, kidney biopsies were in general not performed. Charlson’s co-morbidity index was 4.9 ± 1.2 (range 3-7). Table 9.1 Characteristics of the patients at baseline.
Peritoneal dialysis (%) 12 (52) Gender (% men) 17 (74) Age (years) 66.1 ± 21.9 Diabetes (%) 12 (52) Weight (kg) 81.6 ± 12.4 Systolic blood pressure (mmHg) 117.2 ± 31.2 Diastolic blood pressure (mmHg) 63.7 ± 15.9 Diuresis (ml/24 hours) 1062 ± 567 GFR (ml/min) 14.6 ± 12.1 Hemoglobin (g/dll)* 11.3 ± 1.5 Sodium (mmol/l) 138 ± 4 Urea (mmol/l) 29.5 ± 11.5 Creatinine (µmol/l) 369 ± 168 Serum albumin (g/l) 33.2 ± 4.2 CRP (g/l) 22.8 ± 24.5 NT-proBNP (pmol/l) 2411 ± 2857 Charlson’s co-morbidity index 4.9 ± 1.2
Values displayed as mean ± SD. * Hemoglobin correction factor: 0.62 g/dl = 1 mmol/l
Fifteen patients had CHF because of ischemic cardiomyopathy, 5 patients had a dilated cardiomyopathy, 1 patient had a reumatic cardiomyopathy, 1 patient had a restrictive cardiomyopathy and 1 patient had a metabolic cardiomyopathy due to diabetes. Most patients also had valvular disease. There were no differences between patients with different types of cardiomyopathy. At the start of dialysis, all patients were receiving bumetanide (mean dose 8.1 ± 2.7

Renal replacement therapy in treatment-resistant congestive heart failure109
mg/day), 2 received spironolactone, 10 angiotensin-converting enzyme inhibitors and 15 used beta-blocking agents. The choice for PD or hemodialysis (HD) was based on patient preference and clinical indication. However, in those patients who had to start acutely with dialysis treatment, HD was used as the starting therapy. Generally, in our hospital, we use dialysis as a treatment option for CRS only in patients with severe renal failure and not as a routine option in patients with less advanced stages of renal failure. Eleven patients (48%) were treated with IHD and were dialyzed during 4 hours for three times per week. Twelve patients (52%) were treated with PD. If the GFR was >10 ml/min, only icodextrin was used. In others, the combination of glucose-containing dialysis fluids and icodextrin was used. Nine patients started initially with one single night dwell of icodextrin (incremental PD) and three patients started immediately with continuous ambulatory PD. All patients used commercially available glucose- and non-glucose-containing (e.g. icodextrin) dialysis solutions (Baxter Healthcare, IRL, Dublin, Ireland). According to the design of the study, at the start of dialysis and after 4 and 8 months, data were collected for laboratory investigations, renal function, functional status [according to the New York Heart Association (NYHA) classification] and LVEF and left ventricular end-diastolic diameter (LVEDD) by echocardiography and quality of life. Quality of life was evaluated by using the Minnesota Living with Heart failure Questionnaire because all included patients are known with primary heart failure. Other parameters collected were co-morbidity and causes of mortality. Time of dialysis, duration and causes of hospitalization and complications of dialysis were registered till the end of the follow-up period of the study. Laboratory investigations included hemoglobin, serum albumin, plasma urea and plasma creatinine, serum C-reactive protein and NT-pro Brain Natriuretic Peptide (NT-proBNP). GFR was calculated by calculating creatinine clearance using 24-hours urine collection. The study was approved by the Ethical Committee of the Catharina Hospital Eindhoven and the other participating centres (Maastricht University Medical Center and Franciscus Hospital Roosendaal). All patients provided written informed consent.
Statistical analysis
Results are expressed as mean values and standard deviations (SD) or median and range, where appropriate. Survival was assessed by Kaplan-Meier survival analysis. Due to the limited number of patients, Cox regression analysis was used with only a limited number of elementary variables at baseline (age, dialysis modality, Charlson’s

110Chapter 9
co-morbidity index, GFR and LVEF). Parameters at baseline and after 4 and 8 months were compared using repeated measures analysis of variance (ANOVA) and, if significant, further analysed by a paired Student’s t-test. In case of data which were not normally distributed, the related-samples Friedman’s analysis was used. A P-value of <0.05 was considered significant. All of the statistical analyses were made using SPSS for Windows statistical software (release 18.0).
Results
Over a period of 18 months, 23 patients (6 women and 17 men) with primary treatment-resistant CHF complicated by renal impairment were included and started with dialysis. Fourteen patients (61%) started with HD in an acute setting. Some of the patients chose to maintain on HD and others switched to PD. Eventually, 11 patients (48%) were treated with IHD and 12 patients (52%) with PD. The cumulative survival after starting dialysis is shown in a Kaplan-Meier survival curve (Figure 9.1). The median estimated survival time was 16.0 months. At the end of the follow-up period, five patients were still treated for >20 months. The cumulative survival of HD versus PD is shown in Figure 9.2. There were no significant differences observed between HD and PD.
Figure 9.1 Kaplan-Meier survival curve.

Renal replacement therapy in treatment-resistant congestive heart failure111
Figure 9.2 Kaplan-Meier survival curve for PD versus HD patients.
Nine of the 23 patients (39%) dropped out within the follow-up period of 8 months. Seven patients (30%) died during the study period. Reasons of death were end-stage heart failure (n = 3; 13%), sudden death (n = 1; 4%), pulmonary carcinoma (n = 1; 4%), complications of diabetic foot (n = 1; 4%) and one patient developed a cardiac arrest during an IHD session (n = 1; 4%). Two patients (9%) were transferred to other dialysis centres, but duration and reasons of hospitalizations of those patients were registered throughout the total follow-up period of the study. Hospitalization, expressed as the number of hospitalization days per patient per month, was compared between the last 2 years before starting dialysis and throughout the follow-up period (Table 9.2). The absolute number of hospitalization days is presented for all patients. The corrected number was not calculated in patients who survived <1 month after the start of dialysis therapy. Hospitalization time for all causes was 1.8 1.6 days/patient/month before and 2.1 2.9 days/patient/month after starting dialysis (P = 0.54). Reasons for hospitalization were creation of arteriovenous fistula (AVF) (n = 4), thrombectomy of AVF, occlusion of AVF, diabetic foot followed by amputation (n = 2), hip fracture (n = 2), sigmoid carcinoma, transient ischemic attack, necrotic peripheral vascular disease, intra-abdominal bleeding after PD catheter insertion, replacement of PD catheter (n = 3), fever of unknown origin (n = 2), and infections as primary peritonitis (n = 3), diverticulitis with secondary

112Chapter 9
peritonitis, pneumonia and post-obstruction pneumonia due to pulmonary carcinoma. Hospitalization time for cardiovascular causes declined from 1.4 0.6 days/patient/month before to 0.4 0.6 days/patient/month after starting dialysis (P = 0.004) (Table 9.2). Table 9.2 Hospitalization during the last 2 years before dialysis and after start of dialysis.
Predialysis Postdialysis All causes (days/patient/month) 1.8 ± 1.6 2.1 ± 2.9 Cardiovascular causes (days/patient/month)* 1.4 ± 0.6 0.4 ± 0.6 All causes (number of hospitalizations) 0.27 ± 0.29 0.23 ± 0.23 Cardiovascular causes (number of hospitalizations)** 0.19 ± 0.25 0.03 ± 0.06
*Difference is significant (P < 0.001); **Difference is significant (P < 0.001)
Complications related to PD technique were pericatheter leakage, vaginal leakage, peritonitis (n = 3), recurrent peritonitis, secondary peritonitis due to diverticulitis, abscess near insertion of catheter and migration of catheter tip (n = 3) (Table 9.3). Table 9.3 Adverse effects of dialysis during the study.
PD-related HD-related Intra-abdominal bleeding after catheter insertion dislocation of catheter (n = 3) Primary peritonitis (n = 3) Recurrent peritonitis Secondary peritonitis due to diverticulitis Pericatheter leakage Vaginal leakage Abscess near catheter insertion place
Occlusion of arteriovenous fistula (AVF) Thrombectomy of AVF
According to the NYHA classification, at baseline 19 patients were in functional Class IV and 4 in Class III. NYHA class changed significantly during the follow-up period (P < 0.001). After 4 months, 14 (82%) of 17 patients improved in their functional status (P = 0.000), 11 (65%) patients improved two classes, the rest one class in the NYHA scale. After 8 months, there was still a significant improvement of functional status in 8 (73%) of 11 patients compared to start of dialysis (P = 0.001) (Table 9.4). Quality of life was evaluated by using the Minnesota Living with Heart failure Questionnaire where a lower score is related with a higher quality of life. Quality of life tended to improve after starting renal replacement therapy

Renal replacement therapy in treatment-resistant congestive heart failure113
(P = 0.056 by repeated measures ANOVA). Quality of life improved after 4 months in 12 of 16 patients. After 8 months, quality of life was still better in 7 of 11 patients than before starting dialysis (Table 9.4). Table 9.4 Parameters at start of dialysis and after 4 and 8 months.
start 4 months 8 months
NYHA class 3.8 ± 0.4 2.4 ± 0.7* 2.7± 0.9**
Quality of life 63 ± 21 41 ± 20 51 ± 25
Echocardiography
LVEF (%) 37 ± 20 38 ± 20 36 ± 13
LVEDD (mm) 56 ± 6 54 ± 6 55 ± 5
Diuresis (ml/24hours) 1134 ± 535 803 ± 807 456 ± 473***
* Difference is significant (P=0.000); ** Difference is significant (P = 0.001); *** Difference is significant (P = 0.011). (NYHA=New York Heart Association, QoL=Quality of life, LVEF=Left Ventricular Ejection Fraction, LVEDD=Left Ventricular End-Diastolic Diameter).
Echocardiography was performed in all patients before starting dialysis. Mean LVEF was 37 20%. After 4 months a second echocardiography was performed in 11 patients. The LVEF was either stable (n = 1), improved (n = 6) or aggravated (n = 4). Mean LVEF at the second echocardiography was 38 20% (P = 0.68). After 8 months a third echocardiography was performed in 6 patients. Mean LVEF at the third echocardiography was 36 13% (P = 0.99). LVEDD did not change after the start of dialysis (Table 9.4). NT-proBNP levels also changed not significantly during the observational period (2411 ± 2600 pmol/l at baseline; 1247 ± 979 pmol/l at 4 months and 5537 ± 9629 pmol/l at 8 months; P = 0.46). Mean daily ultrafiltration (extrapolated in IHD patients according to total ultrafiltration and treatments per week) was 1332 ± 922 ml, which was in general well tolerated. There were no significant changes in body weight during follow-up (81.6 ± 12.2 kg at baseline, 78.4 ± 10.8 kg after 4 months versus 79.1 ± 11.2 kg after 8 months; P = 0.20). Urine production changed during follow-up (P = 0.03 by repeated measures ANOVA) (1134 ± 535 ml/day at baseline versus 803 ± 807 ml/day after 4 months; P = 0.08, versus 456 ± 473 ml/day after 8 months; P = 0.011) (Table 9.4). GFR remained stable throughout the study (14.6 ± 12.1 ml/min at baseline versus 17.8 ± 21.1 ml/min after 4 months versus 11.7 ± 15.2 ml/min after 8 months; P = 0.23).

114Chapter 9
In Cox regression analysis, age, dialysis modality, Charlson’s co-morbidity index, GFR and LVEF at baseline were evaluated. No significant relation with outcome was observed.
Discussion
The present prospective observational study has three important findings. Firstly, survival in patients with CRS type 2 and treated with dialysis was highly variable. Secondly, hospitalization for cardiovascular causes, but not for all causes, was reduced. Thirdly, improvements in quality of life and functional status were observed after starting dialysis. In our study, survival in CRS type 2 was highly variable after starting dialysis. The median survival time was 16 months, including five patients who were still undergoing dialysis for >20 months. This may be longer than expected given the fact that the mean Charlson’s co-morbidity index in our population was 4.9. However, we admit that this observation is not a solid argument for a potential beneficial effect of renal replacement therapy on survival, as a randomized controlled trial with a sufficient number of patients would be needed to evaluate this aspect. The survival in our present study (median 16 months) was comparable with the data of Elhalel-Dranitzki et al., in which the mean survival was 17.3 months, including four patients who were still undergoing PD24, and somewhat higher as compared to our retrospective analysis in which the median survival was 12 months26. In the study by Ryckelynck et al., the mean survival was 12.7 months, including eight patients who were still treated with PD for >12 months22. Gotloib et al. treated 20 patients with CRS type 2 with comparable mean age and GFR20. Mean survival was 16 months and also longer than expected according to the mean Charlson’s co-morbidity index of 7.8 at the start of dialysis. In our study, we did not observe significant differences between HD and PD due to insufficient power. However, when looking to both survival curves in detail, a higher mortality appeared to be present for HD patients at the start of treatment. This is possibly due to the fact that if dialysis had to be started in an acute setting, HD was used. In the present study, a reduction of hospitalization for cardiovascular causes after starting dialysis was observed. This finding is consistent with earlier published studies18-26. In contrast, in our study, the number of hospitalization days for all causes did not change. Hospitalizations for non-cardiovascular causes appeared to be especially pronounced in patients who were already

Renal replacement therapy in treatment-resistant congestive heart failure115
hospitalized at the start of dialysis and were in general not related to complications of the treatment. In the study performed by Rubin and Ball, all-cause hospitalization rates failed to improve due to dialysis complications and underlying heart disease27. After starting dialysis, the majority of the study population showed an improvement of the functional status during the follow-up period. Almost 62% increased two NYHA classes after 4 months of dialysis. This finding is also consistent with earlier studies7,22,23,25,26. Mehrotra and Kathuria analysed seven studies and concluded that >90% of the patients improved in functional status after starting dialysis7. In the study of Sanchez et al., even all patients improved one or two classes in functional status25. In the study of Kim et al.11, all patients exhibited a functional improvement by one or two NYHA classes after starting PD, although in only two patients, an improvement of LVEF was observed. In our study, only 11 patients had a second echocardiography and 6 patients showed an improvement of LVEF, but changes were not significant. The same held true for changes in NT-proBNP. Thus, it appears that the effect of increased fluid removal by extracorporeal therapy has a significant effect on functional status, but likely not on cardiac function per se. A reduction in hospitalization for cardiovascular causes and an improvement in functional status after starting dialysis in CRS type 2 could consequently lead to an improvement in quality of life. Quality of life improved in 75% of the patients included in this study, whereas the scores on the Minnesota Living with Heart failure Questionnaire declined, although differences on repeated measures ANOVA did just not reach significance. This finding is consistent with the study of Stegmayr et al., where 16 patients with CHF and treated with PD, improved all within 1 month in functional status and also in quality of life16. In the study of Bertoli et al., two CHF patients were treated with a single nocturnal exchange with icodextrin6. After at least 12 months of treatment, an improvement in quality of life in both patients was observed. Sanchez et al. treated 17 patients known with treatment-resistant CHF with PD. Quality of life was increased, which was positively correlated with a better functional status, less hospitalizations and higher survival rate25. Thus, the results of the present study and those of others suggest that extracorporeal treatment may lead to a significant improvement in quality of life. However, admittedly, also in our study, the follow-up time was relatively short and limited to 8 months. Moreover, the incidence of technical complications associated with the dialysis therapy was relatively high, and far greater as compared to our “standard” dialysis population. In some cases, this resulted in hospitalization. We hypothesize that this might be due to the fact it concerns a

116Chapter 9
sick and relatively old population with multiple co-morbidities, making the patients more prone for complications28. Notably, in contrast to hospitalizations for cardiovascular causes, the number of all-cause hospitalizations did not decrease significantly. Diuresis decreased throughout the follow-up period, whereas mean GFR remained stable. In the study by Sanchez et al., urine production did not change throughout the study period of 12 months25. However, mean daily ultrafiltration was higher in our study, whereas we also included patients on IHD in our study. In this prospective study we could not detect any prognostic factors for survival in patients known with treatment-resistant CHF complicated by severe renal failure and starting dialysis. This is in contrast to the results of our retrospective study in which age and diabetes were prognostic poor factors for survival. We did not observe a significant effect of elementary baseline variables such as age, GFR, Charlson’s co-morbidity index and LVEF on outcome, nor a significant difference between PD and IHD in Cox regression analysis. However, we admit that the number of patients in our analysis is too small to draw firm conclusions on this subject. Limitations of the present study are the limited number of patients, relative short follow-up time with regard to functional status and quality of life measurements and incomplete measurements with regard to cardiac function. Patients were treated with both PD and IHD. More prospective studies are needed in order to assess effect and outcome of dialysis in patients with treatment-resistant CHF.
Conclusions
In our opinion, based on the results in literature and our own clinical experience, extracorporeal treatment is a feasible therapy in a selected group of patients with treatment-resistant CRS type 2 complicated with severe renal insufficiency. After starting dialysis, a reduction in hospitalizations for cardiovascular causes was observed, but not in hospitalizations for all causes. The number of technical complications related to the dialysis therapy in this population was relatively high. In this study, we could not detect a prognostic factor for survival. Therefore, patient selection remains difficult. Further investigations are needed to define well the criteria for starting renal replacement therapy in treatment-resistant CHF.

Renal replacement therapy in treatment-resistant congestive heart failure117
References
1. Ronco C, Chionh C, Haapio M, Anavekar NS, House A, Bellomo R. The cardiorenal syndrome. Blood Purif 2009; 27:114-126.
2. Riley DJ, Weir M, Bakris GL. Renal adaptation to the failing heart: Avoiding a ‘therapeutic misadventure’. Postgrad Med 1994; 95:153-164.
3. Ellison DH. Diuretic drugs and the treatment of edema: from clinic to bench and back again. Am J Kidney Dis 1994; 23:623-643.
4. Elisson DH. Diuretic combinations in the treatment of edema: rationale and recommendations. Drug Ther 1994; 24:23-33.
5. Costanzo MR, Guglin ME, Saltzberg MT, Jessup ML, Bart BA, Teerlink JR, Jaski BE, Fang JC, Feller ED, Haas GJ, Anderson AS, Schollmeyer MP, Sobotka PA, UNLOAD Trial Investigators: Ultrafiltration versus intravenous diuretics for patients hospitalized for acute decompensated heart failure. J Am Coll Cardiol 2007; 49:675–683.
6. Bertoli SV, Ciurlino D, Maccario M, Martino S, Bigatti G, Traversi L, Procaccio M, Buzzi L. Home peritoneal ultrafiltration in patients with severe congestive heart failure without end-stage renal disease. Adv Perit Dial 2005; 21:123-127.
7. Mehrotra R, Kathuria P. Place of peritoneal dialysis in the management of treatment-resistant congestive heart failure. Kidney Int 2006: 70;67-71.
8. Robson M, Biro A, Kobel B, Schai G, Ravid M. Peritoneal dialysis in congestive heart failure I-continuous ambulatory peritoneal dialysis. Per Dial Bull 1983;3:133-136.
9. Nakajima U, Suga T, Ishida K, Successful use of continuous ambulatory peritoneal dialysis (CAPD) in the treatment of patients with renal and cardiac failure. Tokai J Exp Clin Med 1986; 11:774-783.
10. Stegmayr BG, Lundberg L, Widahl AM, Wirell-Plum M. Severe heart failure (sHF): an indication for ultrafiltration by peritoneal dialysis techniques. Perit Dial Int 1994; 14:S62.
11. Kim D, Khanna R, Wu G, Fountas P, Druck N, Oreopoulos DG. Successful use of continuous ambulatory peritoneal dialysis in congestive heart failure. Per Dial Bull 1983; 3:133-134.
12. Konig P, Geissler D, Lechleitner P, Spielberg M, Dottarch P. Improved management of congestive heart failure. Use of continuous ambulatory peritoneal dialysis. Arch Intern Med 1987; 147:1031-1034.
13. Rubin J, Ball R. Continuous ambulatory peritoneal dialysis as a treatment of severe congestive heart failure in the face of chronic renal failure. Report of eight cases. Arch Intern Med 1986; 146:533-535.
14. McKinnie JJ, Bourgeois RJ, Husserl FE. Long-term therapy for heart failure with continuous ambulatory peritoneal dialysis. Arch Intern Med 1985; 145:1128-1129.
15. Mousson C, Tanter Y, Chalopin JM, Rebibou JM, Dentam G, Morelon P, Rifle G. Treatment of refractory congestive cardiac insufficiency by continuousperitoneal dialysis. Long-term course. Presse Med 1988; 17:1617-1620.
16. Stegmayr BG, Banga R, Lundberg L, Wikdahl AM, Plum-Wirell M. PD treatment for severe congestive heart failure. Perit Dial Int 1996; 16 Suppl 1:231-235.
17. Bilora F, Petrobelli F, Boccioletti V, Pomerri F. Treatment of heart failure and ascites with ultrafiltration in patients with intractable alcoholic cardiomyopathy. Panminerva Med 2002; 44:23-25.
18. Freida P, Ryckelynck JP, Potier J, Hurault de Ligny B, Mazouz O, Al Halabi A. Place de l’ultrafiltration péritonéale dans le traitement médical de l’insuffisance cardiaque au stade IV de la NYHA. Bull Dial Perit 1995; 5:7-18.
19. Tormey V, Conlon PJ, Farrell J, Horgan J, Walshe JJ. Long-term successful management of refractory congestive cardiac failure by intermittent ambulatory peritoneal ultrafiltration. QJM 1996; 89:681-683.
20. Gotloib L, Fudin R, Yakubovich M, Vienken J. Peritoneal dialysis in refractory end-stage congestive heart failure: a challenge facing a no-win situation. Nephrol Dial Transplant 2005; 20:32-36.

118Chapter 9
21. Ortiz AM, Acosta PA, Corbalan R, Jalil JE. Long-term automated peritoneal dialysis in patients with refractory congestive heart failure. Adv Perit Dial 2003; 19:77-80.
22. Ryckelynck JP, Lobbedez T, Valette B, Le Goff C, Mazouz O, Levaltier B, Potier JC, Hurault de Ligny B. Peritoneal ultrafiltration and refractory congestive heart failure. Adv Perit Dial 1997; 13:93-97.
23. Mehrotra R, Khanna R. Peritoneal ultrafiltration for chronic congestive heart failure: rationale, evidence and future. Cardiology 2001; 96:177-182.
24. Elhalel-Dranitzki M, Rubinger D, Moscovici A, Haviv YS, Friedlaender MM, Silver J, Popovtzer MM. CAPD to improve quality of life in patients with refractory heart failure. Nephrol Dial Transplant 1998; 13:3041-3042.
25. Sánchez JE, Ortega T, Rodríguez C, Díaz-Molina B, Martín M, Garcia-Cueto C, Vidau P, Gago E, Ortega F. Efficacy of peritoneal ultrafiltration in the treatment of refractory congestive heart failure. Nephrol Dial Transplant 2010; 25:605-610.
26. Cnossen TT, Kooman JP, Konings CJ, Uszko-Lencer NH, Leunissen KM, van der Sande FM. Peritoneal dialysis in patients with primary cardiac failure complicated by renal failure. Blood Purif 2010; 30:146-152.
27. Rubin J, Ball R. Continuous ambulatory peritoneal dialysis as treatment of severe congestive heart failure in the face of chronic renal failure. Report of eight cases. Arch Intern Med 1986; 146:1533-1535.
28. Ho LC, Wang HH, Chiang CK, Hung KY, Wu KD. Malnutrition-inflammation score independently determined cardiovascular and infection risk in peritoneal dialysis patients. Blood Purif. 2010; 29:308-16.
119
Chapter 10 General discussion and summary

120Chapter 10
General discussion121
Discussion
Peritoneal dialysis (PD) is a commonly used modality of renal replacement therapy besides hemodialysis and renal transplantation. PD is based upon the removal of excess of waste products and water using the peritoneal membrane as a semi-permeable dialysis filter. Through an abdominal catheter sterile dialysis solutions are installed in and drained from the peritoneal cavity in repeated cycles. Excess of fluid is removed (ultrafiltered) by an osmotic gradient induced by glucose in the dialysis solutions, whereas removal of solutes is based on diffusion and convection over the membrane. Long-term PD may be complicated by an impaired functioning of the peritoneal membrane, especially with regard to fluid removal, which may be hampered by rapid transport of glucose from the dialysis solution into the capillaries of the peritoneal membrane, leading to rapid dissipation of the osmotic gradient. Regular monitoring of the functional status of the peritoneal membrane transport during follow-up is pivotal for optimal prescription of dialysis solutions. Several relevant aspects regarding the monitoring of peritoneal transport properties are addressed in the first part of the thesis. The second part focuses on factors regarding the treatment prescription of PD, for which various choices are available. The first regards the prescription of PD modalities, which is most commonly a choice between continuous ambulatory peritoneal dialysis (CAPD), by which the cycles of drainage and installation of the dialysis solutions are performed manually by the patient, and automated peritoneal dialysis (APD), by which these cycles are performed automatically. Patient preference, but also potential differences in fluid and sodium removal, as well as risk of peritonitis are important factors in treatment decisions regarding the prescription of these modalities. However, more data are needed in order to help the patient and the treatment team in a rational choice for either mortality. The same holds true for the prescription of dialysis solutions. Recently, new solutions have become available with a lower concentration of glucose degradation products (GDP) as compared to conventional dialysis solutions. This might result in an improved biocompatibility and lower formation of advanced glycation end-products (AGE), which might in turn improve the membrane integrity for the long-term. However, the evidence of the potential beneficial effects of these novel peritoneal solutions on the peritoneal membrane is still increasing. The third part of this thesis focuses on the use of PD in emerging indications, notably treatment-resistant congestive heart failure complicated by a severe renal insufficiency. Worldwide there is an increasing incidence and prevalence of patients with heart failure due to a growing number of cardiovascular compromised patients due to risk factors as ageing, diabetes, hypertension, hypercholesterolemia and nicotine abusus, but also to the higher survival rates
122Chapter 10
after cardiac incidents due to continuous development of new medications and better treatment techniques. Heart failure is a progressive disease and with the progress of the disease hospitalizations become usually frequent. PD is a simple choice for daily ultrafiltration. Due to the gradual and continuous fluid removal with PD, the use of this technique for hypervolemic treatment-resistant congestive heart failure would appear a rational option for the long-term treatment. Other arguments for PD in this indication are the hemodynamic instability during hemodialysis and the impact of an arteriovenuous fistula on the cardiac performance. However, at the moment only limited data are available on the clinical effects of PD on functional status, quality of life, and factors such as hospitalization in this patient group.
Monitoring of peritoneal transport
Monitoring of the peritoneal membrane function is of utmost importance during the follow-up of PD patients. In everyday practice, a standardized 4-hour peritoneal equilibration test (PET) with a 3.86%/4.25% glucose solution is performed to measure the dialysate-to-plasma ratio (D/P) of creatinine and the dialysate-to-initial-dialysate ratio (Dt/D0) of glucose at the end of the test for monitoring small solute transport1. The ultrafiltration volume is also measured to detect ultrafiltration failure, defined as an ultrafiltration volume of less than 400 ml after a 4-hour PET with a 3.86%/4.25% glucose solution. Ultrafiltration failure often associated with high transport rate of small solutes due to peritoneal membrane damage and neovascularisation in the peritoneal membrane. Since the introduction of the PET by Twardowksi et al. in 19872, it is a very commonly used test in daily practice, but there are still some issues remaining. One issue concerns the preceding dwell. In 2001, the International Society of Peritoneal Dialysis proposed to perform a standardized PET with a 3.86%/4.25% glucose solution instead of a 2.27%/2.5% glucose solution1. A test with a 3.86%/4.25% glucose solution provides better information on ultrafiltration failure. Part of the standardization of the PET was that it had to be preceded by a long dwell of 8 to 12 hours with the same hyperosmotic glucose solution. This standardized PET was originally developed for patients treated with CAPD. However, with the increasing use of APD, the test is also commonly used for monitoring of the functional status of the peritoneal membrane in APD. Due to the frequent exchanges during night-time, the dwell times in APD are usually 1.5 to 3 hours. Consequently, the preceding dwell times before performance of the PET are significantly shorter in APD than in CAPD. The question arises whether the preceding dwells indeed have a significant influence on the results of the PET, as the continuation of the daily

General discussion123
prescription of APD treatment would be more convenient for the patient. However, from a theoretical point of view, differences in ultrafiltration during the preceding dwell might influence ultrafiltration during the PET due to effects on volume status3. In chapter 2 this issue was investigated. In a study on 13 patients, the net ultrafiltration, small solute transport, sodium sieving and solute transport between a PET preceded by a long night dwell and one preceded by short dwells were compared. The preceding dwell time did not influence the results of the PET, indicating that the duration of the preceding dwell has no/little effect on the interpretation of the PET results and suggesting that the standard treatment prescription in APD could be continued. In the future, the effect of icodextrin as preceding dwell instead of 3.86%/4.25% glucose solution on the results of a standardized PET could be investigated in CAPD. Whereas the PET provides invaluable information in monitoring PD treatment, it may be insufficiently sensitive for monitoring subtle changes in peritoneal membrane transport. For example, the standardized 4-hour PET does not provide information on free water clearance and as such, no information on the free water transport rate through the ultrasmall pores or aquaporin-1 channels in the peritoneal capillaries. However, a loss of free water clearance may be an early warning sign for the development of peritoneal sclerosis or ultrafiltration failure in long-term PD4. The mini-PET was developed by La Milia et al. in order to calculate the free water transport through the aquaporin channels and is based on the sodium kinetics of peritoneal membrane transport5. With a healthy peritoneal membrane, 35-45% of the total ultrafiltration volume after one hour occurs through the ultrasmall pores, leading to a temporary decrease in the dialysate sodium concentration through dilution by water present by free water transport, and consequently to a decrease of the ratio between dialysate and plasma sodium6. This is known as sodium sieving and indicates adequate free water transport. The maximum dip in dialysate sodium is often reached after one hour induced by the hypertonic glucose solution7. The mini-PET of La Milia et al. requires drainage of the peritoneal cavity after 1-hour to measure the ultrafiltration volume and calculate the free water transport through the aquaporin channels. In order to assess also the free water transport, basically 2 PETs should be performed, which is not convenient for the patient or the dialysis staff. In chapter 3, it was investigated whether a combination of the standardized and the mini-PET would lead to compatible results as the standard approach. In 10 patients two standardized PETs of 4 hours were performed with a 3.86% glucose solution. One PET was performed with a temporary drainage of the intraperitoneal cavity after 1 hour to determine the ultrafiltration volume at that time by weighing. After taking a dialysate sample, the drained volume was reinfused and left for another 3 hours. No differences were found for net

124Chapter 10
ultrafiltration and small solute transport compared with the standardized PET without drainage. This suggests that a combination of the mini-PET and standardized PET is indeed feasible. In the new national guideline for monitoring PD treatment by the National Federation of Nephrology in the Netherlands, it is advised to measure the free water transport during the PET.
Treatment prescription in peritoneal dialysis
In this part of the thesis two aspects of PD treatment were investigated. The first aspect concerned a comparison between APD and CAPD, and the second the use of peritoneal fluids with low concentrations of GDP. Possible advantages of the use of APD, apart from the convenience for the patient, are the reduction in disconnection procedures, possibly leading to a reduced risk of peritonitis, and the possibility for shorter dwell periods, which may be especially indicated for patients with a high transport capacity of the peritoneal membrane. However, in patients with a low transport rate of the peritoneal membrane, more rapid exchanges might lead to an increase in sodium sieving, in turn resulting in an increase in plasma sodium, thirst, and finally overhydration. Overhydration could lead to an increased risk for cardiovascular death, especially in anuric patients8,9. Moreover, a faster decline in residual renal function (RRF) has been observed with APD treatment in some studies. Some studies showed a higher incidence in hypertension with APD, while others did not10-14. As discussed in the introduction, data on the literature on peritonitis rate and technique survival between APD and CAPD are inconclusive as well15-21. In chapter 4, a comparison between APD and CAPD was performed in a large database in collaboration with the Renal Research Institute in New York. In this chapter, treatment survival was higher in APD versus CAPD treated patients, with no differences in blood pressure control, peritonitis rate and decline in RRF. The difference in technique survival between CAPD and APD is in agreement with the US Baxter database report22, but are at variance with the NECOSAD and ANTZAS databases in which no difference in technique survival was observed23,24. The reason for the differences in technique survival between both modalities observed in chapter 4, which are unlikely to be due to differences in infectious complications, could not be deduced definitely from the present data. It cannot be excluded that patient or physician preference, which was not recorded, might play a role in this aspect. Given the magnitude of the database, the data in the chapter 4 add to the literature given the ongoing controversy on this subject. However, for more definite proof, large randomized trials on this subject would be needed, given the fact that available randomized trials are inconclusive as yet given the small number of patients included25.

General discussion125
Importantly, in the study in chapter 4 no difference in blood pressure control were observed between APD and CAPD patients, although no detailed data on volume status were available. This aspect was addressed in more detail in chapter 5. Overhydration is still a major problem in PD patients, 25% of patients being defined as severely overhydrated according to bioimpedance techniques in a recent European observational study26. In chapter 5, volume status and blood pressure control were compared between CAPD and APD patients in a cross-sectional study, using bioimpedance techniques and biochemical markers, as well as ambulatory blood pressure measurements. Despite a tendency to higher sodium removal in CAPD, no differences in volume status or blood pressure regulation were observed between APD and CAPD treatment. This is in agreement with the data of Davison et al., who also did not observe differences in volume control between CAPD and APD patients despite a lower sodium removal in patients treated with the latter treatment modality27. In the study of van Biesen, even a tendency to a lower corrected extracellular volume was observed in APD patients26. Why the tendency towards a reduced sodium removal does not translate in impaired volume control remains enigmatic. However, overhydration in PD patients is multifactorially determined, important factors being fluid and sodium intake, peritoneal transport ratio, prescription of polyglucose solutions versus standard glucose solutions, as well as residual diureses26,28,29. Drawbacks of the studies in the present thesis, but also of other studies in the literature is that no clear separation in different groups according to peritoneal transport status could be made, in chapter 4 due to a lack of information on PET test in the database, in chapter 5 due to the relatively small sample size. Therefore, more detailed studies are still needed to definitely address the drawbacks and advantages of APD and CAPD in different patient categories, separated according to peritoneal membrane status. Apart from the treatment modality, also the prescription of the PD fluids may have important effects on PD treatment. Glucose degradation products (GDP) may have a direct effect on the long-term integrity of the peritoneal membrane, for instance by an effect on the production of AGE, which may contribute to damage of the peritoneal membrane, possibly mediated by RAGE expression and NFkappaB binding activity30. The formation of AGEs such as N-(carboxymethyl)lysine (CML) and N-(carboxyethyl)lysine (CEL) may be stimulated by GDP products such as methylglyoxal and glyoxal. Also residual renal function has a pronounced effect on the concentration of AGE products such as CML, as shown previously31. Treatment with low GDP fluids might be more biocompatible for the peritoneal membrane, and lead to a lesser

126Chapter 10
formation of AGE products as compared to standard glucose solutions. However, comparative data on AGE formation between standard and low GDP solutions are limited. In a randomized study, described in chapter 6, the concentrations of the AGE products CML and CEL were compared between standard and low GDP solutions. Effluent levels of CEL declined with the use of low GDP solutions. However, the change in CML, which was more strongly related to RRF, was less pronounced with the use of low GDP solutions, suggesting different pathways in the formation of these products. The results of this study suggest that low GDP fluids may influence AGE levels in the peritoneal cavity. Whether this translates in increased levels of AGE in plasma was not addressed in the present study, but not unlikely given the significant relation between peritoneal and plasma levels of CML and CEL observed in a previous study31 and the fact that in children treated with low GDP solutions, reduced systemic AGE products were observed32. Interestingly, recently a relation between tissue AGE levels and peritoneal glucose exposure was observed, which would be congruent with this hypothesis33. Given the possible relation between peritoneal and plasma AGE levels, it would be interesting to study potential differences in endothelial function between patients treated with low GDP and conventional solutions, given the fact that advanced oxidation products were associated with endothelial dysfunction in peritoneal dialysis patients34. It should be noted that in the study reported in chapter 5, as well as in previous studies31 a significant inverse relationship was observed between AGE products and residual renal function. Therefore, the synthesis of AGEs, which admittedly was not assessed directly in this study, is to be expected a multi-factorial process with probable an important role for the uremic milieu per se. Future studies are needed to focus on the effect of low GDP solutions on membrane integrity and technique survival.
Peritoneal dialysis in heart failure
The last part of the thesis focused on the use of PD treatment in emerging indications, especially the use of PD in patients with treatment-resistant congestive heart failure complicated by progressive and potentially permanent chronic kidney disease, also known as the cardiorenal syndrome (CRS) type 235. This concerns a very difficult to treat patient group with a very poor prognosis, frequent hospital admissions and high mortality. In chapter 7, a short review of the literature is given on the use of PD in congestive heart failure. Although in several studies, mostly case series concerning small patient groups (and retrospective), an improvement in functional status and a reduction in hospitalization rate was suggested. In general, median survival time was

General discussion127
between only 12 and 15 months. At the moment there are no comparative studies with continuous or isolated ultrafiltration techniques available. In chapter 8, the results of a retrospective analysis on the experience in patients with CRS type 2 treated with PD are described. Data of 24 patients could be retrieved. Mean age at start was 67 ± 10 years and mean GFR 15.4 ± 9.6 ml/min. In patients who survived longer than the median survival time of 12 months, a reduction in hospitalization was observed. Age and diabetes, but not left ventricular ejection fraction, were suggested as prognostic poor factors for survival. The median survival rate is comparable to data from the literature25. This relatively poor outcome likely reflects the severity of the underlying cardiac disease, given the fact that in a study in patients with end-stage heart failure which were conservatively treated a 1-year mortality rate of 74% was observed37. In the retrospective analysis, no data on functional quality and quality of life were available. Nevertheless, these data are pivotal when prescribing a relatively complicated and invasive treatment to patients with a general dismal prognosis. In chapter 9 the results of a prospective observational study on the clinical outcome in 23 patients with CRS type 2, treated with either hemodialysis or peritoneal dialysis described. Mean age at start was 66 ± 21 years, mean GFR 14.6 ± 12.1 ml/min and mean Charlson’s co-morbidity index 4.9 ± 2.1. After starting dialysis, the median estimated survival was 16 months, which was longer than expected according the mean Charlson’s co-morbidity index at start, but patient survival was still highly variable. No differences were detected between PD and intermittent hemodialysis, but given the small sample size, no firm conclusions can be made in this regard. A recent observational study showed a higher mortality in incident dialysis patients with associated congestive heart failure following treatment with PD as compared to intermittent hemodialysis38. In this study, congestive heart failure was defined on clinical grounds only, whereas the primary cause of renal failure in this cohort was due to other causes than heart failure, most commonly renal vascular disease. Therefore, the patient population appears not to be comparable to that of the CRS type 2 patients in the present study, and extrapolation of the results of this to patients with CRS type 2 may be hazardous. Moreover, if defined on clinical grounds only, it may be difficult to differentiate between overhydration at the start of dialysis or associated cardiac disease. Hospitalization time after start of dialysis was compared with the 2 years before start of dialysis. A significant reduction in hospitalization time was observed for cardiovascular causes, but not for all-causes. Moreover, an improvement of functional status and a tendency in improvement of quality of life was observed, but LVEF did not change during the follow-up period. Moreover, diuresis decreased significantly after 8 months of follow-up, but GFR remained stable.

128Chapter 10
The results of our studies suggest that renal replacement therapy may be a feasible therapy for a selected group of patients known with CRS type 2. However the number of technical complications associated with the dialysis therapy was relatively high in our population, and greater as compared to our “standard” dialysis population. Probably this might be due to the fact it concerns a sick and relatively old population with multiple co-morbidities, making the patients more prone for complications. Moreover, it should be recognized that patient selection for this indication remains difficult. The outcome of our prospective study is in line with the results of the one other published prospective study performed by Sanchez et al., in which 17 patients with CRS type 2 were treated with PD39. Mean age at start was 64 ± 9 years, mean GFR 35 ml/min and mean Charlson’s co-morbidity index 6.9 ± 1.7. Despite the same mean age at start, but higher mean GFR and Charlson’s co-morbidity index than in our study, the mean survival was also 16 months. Drawbacks of our studies are the limited number of patients and the relative short follow-up period. In the future, more research is needed on this subject. Especially prospective randomized controlled studies with a larger study population should be performed to compare renal replacement therapy with optimal standardized treatment, and to define well the criteria for starting renal replacement therapy in patients with CRS type 2.

General discussion129
References 1. Mujais S, Nolph K, Gokal R, Blake P, Burkart J, Coles G, Kawaguchi Y, Kawanishi H, Korbet
S, Krediet R, Lindholm B, Oreopoulos D, Rippe B, Selgas R. Evaluation and management of ultrafiltration problems in peritoneal dialysis. International Society of Peritoneal Dialysis ad hoc committee on ultrafiltration management in peritoneal dialysis. Perit Dial Int 2000;20(Suppl 4): S5-21.
2. Twardowski ZJ, Nolph KD, Khanna R, Prowant BF, Ryan LP, Moore HL, Nielsen MP. Peritoneal equilibration test. Periton Dial Bull 1987;7:138-147.
3. Selby NM, Fialova J, Burton JO, McIntyre CW. The haemodynamic and metabolic effects of hypertonic-glucose and amino-acid-based peritoneal dialysis fluids. Nephrol Dial Transplant 2007;22:870-879.
4. Coester AM, Smit W, Struijk DG, Krediet RT. Peritoneal function in clinical practice: The importance of follow-up and its measurement in patients. Recommendations for patient information and measurement of peritoneal function. NDT Plus 2009;2:104-110.
5. La Milia V, Di Filippo S, Crepaldi M, Del Vecchio L, Dell'Oro C, Andrulli S, Locatelli F. Mini-peritoneal equilibration test: a simple and fast method to assess free water and small solute transport across the peritoneal membrane; Kidney Int 2005;68:840-846.
6. Zweers MM, Imholz AL, Struijk DG, Krediet RT. Correction of sodium sieving for diffusion from the circulation. Adv Perit Dial 1999;15:65-72.
7. Smit W, Struijk DG, Ho-Dac-Pannekeet MM, Krediet RT. Quantification of free water transport in peritoneal dialysis. Kidney Int 2004;66:849-854.
8. Brown EA, Davies SJ, Rutherford P, Meeus F, Borras M, Riegel W, Divino Filho JC, Vonesh E, van Bree M; EAPOS Group. Survival of functionally anuric patients on automated peritoneal dialysis: the European APD Outcome study. J Am Soc Nephrol 2003;14:2948-2957.
9. Jansen MA, Termorshuizen F, Korevaar JC, Dekker FW, Boeschoten E, Krediet RT; NECOSAD Study Group. Predictors of survival in anuric peritoneal dialysis patients. Kidney Int 2005;68:1199-1205.
10. Rodríguez-Carmona A, Fontán MP. Sodium removal in patients undergoing CAPD and automated peritoneal dialysis. Perit Dial Int 2002;22:705-713.
11. Ortega O, Gallar P, Carreno A, Gutierrez M, Rodriguez I, Oliet A, Vigil A, Gimenez E: Peritoneal sodium mass removal in continuous ambulatory peritoneal dialysis and automated peritoneal dialysis: Influence on blood pressure control. Am J Nephrol 2001;21:189-193.
12. Boudville NC, Cordy P, Millman K, Fairbairn L, Sharma A, Lindsay R, Blake PG. Blood pressure, volume, and sodium control in an automated peritoneal dialysis population. Perit Dial Int 2007;27:537-543.
13. Ateş K, Nergizoğlu G, Keven K, Sen A, Kutlay S, Ertürk S, Duman N, Karatan O, Ertuğ AE. Effect of fluid and sodium removal on mortality in peritoneal dialysis patients. Kidney Int 2001;60:767-776.
14. Wang T, Waniewski J, Heimbürger O, Werynski A, Lindholm B. A quantitative analysis of sodium transport and removal during peritoneal dialysis. Kidney Int 1997;52:1609-1616.
15. Rabindranath KS, Adams J, Ali TZ, Daly C, Vale L, Macleod AM. Automated vs continuous ambulatory peritoneal dialysis: a systematic review of randomized controlled trials. Nephrol Dial Transplant 2007;22:2991-2998.
16. Holley JL, Bernardini J, Piraino B. Continuous cycling peritoneal dialysis is associated with lower rates of catheter infections than continuous ambulatory peritoneal dialysis. Am J Kidney Dis 1990;16:133-136.
17. Piraino B, Sheth H. Peritonitis - does peritoneal dialysis modality make a difference? Blood Purif 2010;29:145-149.
18. Michels WM, Verduijn M, Boeschoten EW, Dekker FW, Krediet RT; for the NECOSAD Study Group. Similar Survival on Automated Peritoneal Dialysis and Continuous Ambulatory Peritoneal Dialysis in a Large Prospective Cohort. Clin J Am Soc Nephrol 2009;4:943-949.
19. Badve SV, Hawley CM, McDonald SP, Mudge DW, Rosman JB, Brown FG, Johnson DW. Automated and continuous ambulatory peritoneal dialysis have similar outcomes. Kidney Int 2008;73:480-488.

130Chapter 10
20. Mujais S, Story K. Peritoneal dialysis in the US: evaluation of outcomes in contemporary cohorts. Kidney Int Suppl 2006;103:S21-26.
21. Sanchez AR, Madonia C, Rascon-Pacheco RA. Improved patient/technique survival and peritonitis rates in patients treated with automated peritoneal dialysis when compared to continuous ambulatory peritoneal dialysis in a Mexican PD center. Kidney Int Suppl 2008;108:S76-80.
22. Guo A, Mujais S. Patient and technique survival on peritoneal dialysis in the United States: evaluation in large incident cohorts. Kidney Int Suppl 2003;88:S3-12.
23. Michels WM, Verduijn M, Boeschoten EW, Dekker FW, Krediet RT; NECOSAD Study Group. Similar survival on automated peritoneal dialysis and continuous ambulatory peritoneal dialysis in a large prospective cohort. Clin J Am Soc Nephrol 2009;4:943-949.
24. Ateş K, Nergizoğlu G, Keven K, Sen A, Kutlay S, Ertürk S, Duman N, Karatan O, Ertuğ AE. Effect of fluid and sodium removal on mortality in peritoneal dialysis patients. Kidney Int 2001;60:767-776.
25. Rabindranath KS, Adams J, Ali TZ, Daly C, Vale L, Macleod AM. Automated versus continuous ambulatory peritoneal dialysis: a systematic review of randomized controlled trials. Nephrol Dial Transplant 2007;22:2991-2998.
26. Van Biesen W, Williams JD, Covic AC, Fan S, Claes K, Lichodziejewska-Niemierko M, Verger C, Steiger J, Schoder V, Wabel P, Gauly A, Himmele R; EuroBCM Study Group. Fluid status in peritoneal dialysis patients: the European Body Composition Monitoring (EuroBCM) study cohort. PLoS One 2011;6:e17148.
27. Davison SN, Jhangri GS, Jindal K, Pannu N. Comparison of volume overload with cycler-assisted versus continuous ambulatory peritoneal dialysis. Clin J Am Soc Nephrol 2009;4:1044-1050.
28. Konings CJ, Kooman JP, Schonck M, Gladziwa U, Wirtz J, van den Wall Bake AW, Gerlag PG, Hoorntje SJ, Wolters J, van der Sande FM, Leunissen KM. Effect of icodextrin on volume status, blood pressure and echocardiographic parameters: a randomized study. Kidney Int 2003;63:1556-1563.
29. Quan L, Xu Y, Luo SP, Wang L, LeBlanc D, Wang T. Negotiated care improves fluid status in diabetic peritoneal dialysis patients. Perit Dial Int 2006;26:95-100.
30. Kihm LP, Wibisono D, Müller-Krebs S, Pfisterer F, Morath C, Gross ML, Morcos M, Seregin Y, Bierhaus A, Nawroth PP, Zeier M, Schwenger V. RAGE expression in the human peritoneal membrane. Nephrol Dial Transplant 2008;23:3302-3306.
31. Van de Kerkhof J, Schalkwijk CG, Konings CJ, Cheriex EC, van der Sande FM, Scheffer PG, ter Wee PM, Leunissen KM, Kooman JP. Nepsilon-(carboxymethyl)lysine, Nepsilon-(carboxyethyl)lysine and vascular cell adhesion molecule-1 (VCAM-1) in relation to peritoneal glucose prescription and residual renal function; a study in peritoneal dialysis patients. Nephrol Dial Transplant 2004;19:910-916.
32. Schmitt CP, von Heyl D, Rieger S, Arbeiter K, Bonzel KE, Fischbach M, Misselwitz J, Pieper AK, Schaefer F; for the Mid European Pediatric Peritoneal Dialysis Study Group (MEPPS). Reduced systemic advanced glycation end products in children receiving peritoneal dialysis with low glucose degradation product content. Nephrol Dial Transplant 2007;22:2038-2044.
33. McIntyre NJ, Chesterton LJ, John SG, Jefferies HJ, Burton JO, Taal MW, Fluck RJ, McIntyre CW. Tissue-advanced glycation end-product concentration in dialysis patients. Clin J Am Soc Nephrol 2010;5:51-55.
34. Kocak H, Gumuslu S, Sahin E, Ceken K, Gocmen YA, Yakupoglu G, Ersoy FF, Tuncer M. Advanced oxidative protein products are independently associated with endothelial function in peritoneal dialysis patients. Nephrology (Carlton) 2009;14:273-280.
35. Ronco C, Chionh C, Haapio M, Anavekar NS, House A, Bellomo R. The cardiorenal syndrome. Blood Purif 2009;27:114-126.
36. Ryckelynck JP, Lobbedez T, Valette B, Le Goff C, Mazouz O, Levaltier B, Potier JC, Hurault de Ligny B. Peritoneal ultrafiltration and refractory congestive heart failure. Adv Perit Dial 1997;13:93-97.

General discussion131
37. Rose EA, Gelijns AC, Moskowitz AJ, Heitjan DF, Stevenson LW, Dembitsky W, Long JW, Ascheim DD, Tierney AR, Levitan RG, Watson JT, Meier P, Ronan NS, Shapiro PA, Lazar RM, Miller LW, Gupta L, Frazier OH, Desvigne-Nickens P, Oz MC, Poirier VL. Randomized Evaluation of Mechanical Assistance for the Treatment of Congestive Heart Failure (REMATCH) Study Group. Long-term use of a left ventricular assist device for end-stage heart failure. N Engl J Med 2001;345:1435-1443.
38. Sens F, Schott-Pethelaz AM, Labeeuw M, Colin C, Villar E. Survival advantage of hemodialysis relative to peritoneal dialysis in patients with end-stage renal disease and congestive heart failure. Kidney Int. 2011 Jul 20. Epub ahead of print.
39. Sanchez JE, Ortega T, Rodríguez C, Díaz-Molina B, Martín M, Garcia-Cueto C, Vidau P, Gago E, Ortega F. Efficacy of peritoneal ultrafiltration in the treatment of refractory congestive heart failure. Nephrol Dial Transplant 2010;25:605-610.


133
Samenvatting

134

Samenvatting135
Samenvatting
Dit proefschrift gaat over enkele nieuwe ontwikkelingen op het gebied van peritoneale dialyse. Eerst zal ik kort toelichten wat peritoneale dialyse is. Daarna zal ik uiteenzetten waar dit proefschrift over gaat.
Wat is peritoneale dialyse?
De nier heeft verschillende belangrijke functies, onder andere het verwijderen van afvalstoffen en overtollig lichaamsvocht. Indien door de nieren onvoldoende afvalstoffen en/of water worden uitscheiden (‘nierfalen’), is nierfunctievervangende behandeling noodzakelijk. Hiervoor bestaan drie mogelijkheden: hemodialyse, peritoneale dialyse en niertransplantatie. Bij hemodialyse wordt het bloed gezuiverd van afvalstoffen en overtollig vocht met behulp van een kunstnier. Bij peritoneale dialyse, ook wel buikvliesspoeling genoemd, kunnen afvalstoffen en overtollig vocht via het buikvlies (‘peritoneum’) uit het lichaam worden verwijderd. Het buikvlies bekleedt de buikholte en bedekt alle buikorganen. Het buikvlies zelf is bedekt met veel kleine bloedvaten (‘capillairen’) en kan daardoor functioneren als een semipermeabel membraan (‘peritoneale membraan’).
Figuur 1: Een patiënt die wordt behandeld met peritoneale dialyse.
Voor deze behandeling wordt in de buikholte van de patiënt een slangetje (‘catheter’) geplaatst, waarlangs meerdere malen per dag steriele vloeistof de buikholte kan in- en uitlopen (Figuur 1). Tussen de ingelopen steriele vloeistof en de bloedvaten van het buikvlies vindt uitwisseling van verschillende stofjes plaats. De overtollige hoeveelheid lichaamsvocht wordt verwijderd door middel

136
van een osmotische gradiënt geïnduceerd door de aanwezigheid van glucose in de dialysevloeistof (‘ultrafiltratie’), waarbij verwijdering van afvalstoffen plaatsvindt op basis van diffusie en convectie over het buikvlies. Momenteel worden in Nederland ongeveer 1100 (18%) patiënten met nierfalen behandeld met peritoneale dialyse. Langdurige behandeling met peritoneale dialyse kan worden gecompliceerd door achteruitgang van de kwaliteit van het buikvlies, waarbij in het bijzonder de vloeistofverwijdering wordt belemmerd door het snelle transport van glucose uit de dialysevloeistof naar de capillairen van het buikvlies, welke leidt tot een snelle daling van de osmotische gradiënt. Regelmatige monitoring van de kwaliteit van het transport over het buikvlies gedurende de behandeling is essentieel voor een optimaal behandelvoorschrift van de te gebruiken dialysevloeistoffen. In deel I van dit proefschrift worden verschillende aspecten betreffende de monitoring van het transport over het buikvlies beschreven. Deel II handelt over verschillende factoren die van belang zijn voor het behandelvoorschrift bij peritoneale dialyse, waarbij verschillende mogelijk-heden beschikbaar zijn. Eerst is gekeken naar de twee belangrijkste vormen van peritoneale dialyse; enerzijds de handmatige continue peritoneale dialyse (‘CAPD’), waarbij alle vloeistofwisselingen handmatig worden uitgevoerd door de patiënt, en anderzijds de automatische peritoneale dialyse (‘APD’), waarbij vloeistofwisselingen automatisch worden uitgevoerd met behulp van een machine. De voorkeur van de patiënt, maar ook mogelijke verschillen in water- en zout (‘natrium’) verwijdering, als ook het risico op een buikvliesontsteking (‘peritonitis’) zijn belangrijke factoren in de keuze van peritoneale dialyse. Op dit moment is er meer onderzoek noodzakelijk om de patiënt en het behandelteam te helpen om een juiste keuze te kunnen maken tussen de twee genoemde vormen van peritoneale dialyse. Dit geldt ook voor het gebruik van de dialysevloeistoffen. Sinds enkele jaren zijn er nieuwe dialysevloeistoffen beschikbaar met een lagere concentratie aan glucose afbraakproducten in vergelijking met de conventionele dialysevloeistoffen. Dit kan mogelijk resulteren in een verbetering van de biocompatibiliteit en minder vorming van advanced glycation end-products (AGE), waardoor de integriteit van het buikvlies mogelijk langer behouden blijft. Er is toenemend bewijs voor de potentiële gunstige effecten op het buikvlies van deze nieuwe dialyse-vloeistoffen. In het derde deel van dit proefschrift wordt de toepassing van peritoneale dialyse in acute situaties, in het bijzonder bij therapieresistent congestief hartfalen gecompliceerd door een ernstig verminderde nierfunctie, beschreven. Wereldwijd is er een toename van het aantal patiënten met hartfalen vanwege een toename van hart- en vaatziekten als gevolg van risicofactoren zoals vergrijzing, suikerziekte, hoge bloeddruk, verhoogd cholesterol en roken, maar

Samenvatting137
ook als gevolg van de toegenomen overleving na een hartprobleem vanwege de continue ontwikkeling van nieuwe medicijnen en verbeterde behandelings-technieken. Daarnaast is hartfalen een progressieve ziekte, waarbij de frequentie van ziekenhuisopnames toeneemt naarmate de ernst van hartfalen. Peritoneale dialyse is een relatief eenvoudige manier om dagelijks overtollig lichaamsvocht te verwijderen. Als gevolg van de geleidelijke en continue vochtonttrekking bij peritoneale dialyse, lijkt deze vorm van dialyse voor patiënten met therapieresistent congestief hartfalen een potentiële behandeloptie voor de langere termijn. Andere argumenten om peritoneale dialyse te starten bij deze patiëntenpopulatie zijn de bloeddrukdalingen die hemodialyse kan veroorzaken en de impact van een arterioveneuze fistel op de pompfunctie van het hart. Op dit moment is er relatief weinig informatie beschikbaar over de klinische effecten van peritoneale dialyse bij congestief hartfalen op de lichamelijke conditie, kwaliteit van leven en andere factoren zoals ziekenhuisopnames.
Monitoring van peritoneale membraan transport
Monitoren van de functie van het buikvlies is zeer essentieel tijdens de behandeling met peritoneale dialyse. In de dagelijkse praktijk wordt hiervoor een gestandaardiseerde 4 uur durende test gebruikt, de zogenaamde peritoneale equilibratie test (PET). De PET wordt met behulp van een 3,86%/4,25% glucose houdende dialysevloeistof uitgevoerd. Hierbij worden dialysaat-plasma ratio (D/P) van kreatinine en dialysaat-initiële dialysaat ratio (Dt/D0) van glucose aan het einde van de PET gemeten om het transport van de kleinere deeltjes over het buikvlies te meten. De hoeveelheid onttrokken vloeistof (‘ultrafiltratie’) wordt ook gemeten aan het einde van de test om ultrafiltratiefalen te kunnen vaststellen. Dit wordt gedefinieerd als een ultrafiltratievolume van minder dan 400 ml na 4 uren bij gebruik van een 3.86%/4,25% glucose oplossing. Ultrafiltratiefalen is dikwijls geassocieerd met een snel transport van de kleine deeltjes over het buikvlies ten gevolge van schade en bloedvatnieuwvorming van het buikvlies. Ondanks dat sinds de introductie van de PET door Twardowski et al. in 1987 deze test zeer veel wordt gebruikt in de dagelijkse praktijk, zijn er nog enkele onbegrepen aspecten aan deze test. Een van de vraagstukken betreft het gebruik van de vloeistof voorafgaand aan de test. In 2001 heeft de International Society of Peritoneal Dialysis (ISPD) voorgesteld om de gestandaardiseerde test uit te voeren met een 3,86%/4,25% glucose vloeistof in plaats van een 2,27%/2,3% glucose vloeistofoplossing. Een PET met een 3,86%/4,25% glucose oplossing biedt meer informatie over ultrafiltratiefalen. Hierbij werd geadviseerd voorafgaand aan de PET eenzelfde hyperosmolaire glucose oplossing met een verblijfsduur van 8 tot 12 uren te gebruiken. Deze PET was oorspronkelijk ontwikkeld voor patiënten welke werden behandeld met
138
handmatige peritoneale dialyse. Aangezien er een toenemend aantal patiënten wordt behandeld met automatische peritoneale dialyse, wordt deze test ook gebruikt voor monitoring van het transport over het buikvlies bij deze laatste patiëntengroep. Als gevolg van de frequente wisselingen tijdens de nacht, zijn de verblijftijden van de dialysevloeistof gewoonlijk slechts 1,5 tot 3 uren bij automatische peritoneale dialyse. Als gevolg hiervan zijn de verblijftijden voorafgaand aan de uitvoer van een PET significant korter bij automatische dan bij handmatige peritoneale dialyse. De vraag is of de verschillen in verblijftijden voorafgaand aan de PET een significante invloed hebben op de resultaten van de PET, aangezien het continueren van het voorschrift van de behandeling voor automatische peritoneale dialyse veel prettiger voor de patiënt is. Theoretisch gezien zullen de verschillen in ultrafiltratie gedurende de voorafgaande vloeistofwisseling mogelijk de ultrafiltratie gedurende de PET kunnen beïnvloeden vanwege de effecten van de volumestatus. In hoofdstuk 2 is dit vraagstuk onderzocht. In een studie van 13 patiënten, was de netto ultrafiltratie, kleine deeltjes transport, ‘sodium sieving’ en deeltjes transport van een PET voorafgegaan door een lange nachtelijke verblijftijd vergeleken met een PET voorafgegaan door kortere verblijftijden. De voorafgaande verblijftijd lijkt niet de resultaten van de PET te beïnvloeden, waaruit geconcludeerd kan worden dat de verblijftijd van de vloeistof voorafgaand aan de PET de resultaten niet significant beïnvloed. Dit suggereert dat het standaard behandelvoorschrift bij automatische peritoneale dialyse kan worden gecontinueerd. In de toekomst zou het effect van icodextrin als voorafgaande dialysevloeistof, in plaats van een 3,86%/4,25% glucose oplossing, op de resultaten van de PET kunnen worden onderzocht. Hoewel de PET waardevolle informatie geeft voor monitoring van de behandeling met peritoneale dialyse, is deze test onvoldoende sensitief voor het monitoren van subtiele veranderingen in het transport over het buikvlies. De gestandaardiseerde 4 uur durende PET geeft bijvoorbeeld geen informatie over vrij water klaring en als gevolg hiervan geen informatie over het vrij watertransport door de waterkanalen (‘aquaporine-1’) in de haarvaten van het buikvlies. Afname van de vrij water klaring kan een vroegtijdige waarschuwing zijn voor het ontwikkelen van peritoneale sclerose of ultrafiltratiefalen bij langdurige behandeling met peritoneale dialyse. Door LaMilia et al. is de mini-PET ontwikkeld met als doel het vrije water transport door de aquaporine kanalen te kunnen berekenen. Deze berekening is gebaseerd op de kinetica van het natriumtransport over het buikvlies. Over een gezond buikvlies wordt over een periode van een uur 35 - 45% van het totale ultrafiltratievolume door de aquaporine kanalen getransporteerd. Hierdoor ontstaat een tijdelijke daling van de natriumconcentratie in de dialysevloeistof als gevolg van verdunning door water, en vervolgens een daling van de verhouding tussen de

Samenvatting139
natriumconcentratie in de dialysevloeistof in de buikvliesholte en het plasmanatrium. Dit wordt ‘sodium sieving’ genoemd en duidt op adequaat vrij watertransport. De maximale daling in de natriumconcentratie bij een hypertone glucose oplossing wordt na ongeveer een uur bereikt en wordt ‘sodium dip’ genoemd. De mini-PET van LaMilia et al. vereist een drainage van de buikvliesholte na een uur om het ultrafiltratievolume te kunnen meten en vervolgens het vrije watertransport door de aquaporine kanalen te kunnen berekenen. Om het vrije watertransport te kunnen monitoren, zouden 2 PETs uitgevoerd moeten worden. Dit is erg belastend voor zowel patiënten als dialyse-verpleegkundigen. Daarom is in hoofdstuk 3 gekeken naar de mogelijkheid om de gestandaardiseerde PET en de mini-PET te kunnen combineren. In 10 patiënten zijn 2 gestandaardiseerde PETs uitgevoerd met een 3,86%/4,25% glucose oplossing. Een PET is uitgevoerd met een tijdelijke drainage van de buikholte na een uur om het ultrafiltratievolume te kunnen vaststellen. Na afname van een vloeistofmonster, is de gedraineerde vloeistof terug in de buikholte gelopen en daar nog 3 uren verbleven. Er zijn geen verschillen aangetoond wat betreft ultrafiltratievolume en kleine deeltjes transport in vergelijking met de gestandaardiseerde PET zonder een tijdelijke drainage. Dit suggereert dat de combinatie van de mini-PET en de gestandaardiseerde PET inderdaad mogelijk is. In de nieuwste richtlijn voor “Monitoring adequaatheid en membraanfunctie bij PD”, opgesteld door de Nederlandse Federatie voor Nefrologie in 2009, wordt nu ook geadviseerd het vrije watertransport te meten tijdens de PET middels een extra drainage.
Behandelvoorschrift
In deel II worden twee aspecten van behandeling met PD onderzocht. Ten eerste zijn de twee belangrijkste vormen van peritoneale dialyse, de continue handmatige en de automatische peritoneale dialyse, met elkaar vergeleken. Ten tweede zijn dialysevloeistoffen met een lage concentratie glucose afbraakproducten onderzocht. Potentiële voordelen van automatische peritoneale dialyse, onafhankelijk van het comfort voor de patiënt, zijn ten eerste een gereduceerd aantal connecties (aansluitmomenten), die kunnen leiden tot een verminderd aantal buikvliesontstekingen (‘peritonitis’), en ten tweede de mogelijkheid voor korte verblijftijden, die vooral geïndiceerd is voor patiënten met een snel transport over het buivlies. Echter kortere verblijftijden kunnen vooral bij patiënten met een langzame transportsnelheid over het buikvlies leiden tot een toename in ‘sodium sieving’, zodat er een stijging is van het plasmanatrium, en uiteindelijk dorst en overvulling ontstaan. Overvulling kan leiden tot een verhoogd cardiovasculair risico, in het bijzonder voor patiënten zonder

140
urineproductie. Verder is in enkele studies aangetoond dat bij automatische peritoneale dialyse de restnierfunctie sneller afneemt, hoewel andere studies dit tegenspreken. Ook zijn er enkele studies waarin is aangetoond dat hypertensie meer zou voorkomen bij automatische peritoneale dialyse, terwijl in andere studies dit weer niet is geobserveerd. Zoals eerder genoemd, zijn de gegevens uit de literatuur over frequentie van buikvliesontstekingen en techniek falen voor handmatige en automatische peritoneale dialyse ook inconclusief. In hoofdstuk 4 zijn de automatische en handmatige peritoneale dialyse met elkaar vergeleken aan de hand van gegevens afkomstig uit de database van het Renal Research Institute (RRI) in New York. De overleving na starten van automatische peritoneale dialyse was hoger dan met handmatige peritoneale dialyse. Er waren geen verschillen in bloeddruk, incidentie van peritonitis en afname van de gemiddelde restnierfunctie. De verschillen in techniekfalen tussen handmatige en automatische peritoneale dialyse komen overeen met de US Baxter database report, maar zijn verschillend aan die van de NECOSAD en ANTZAS databases waarin geen verschillen in techniek falen zijn aangetoond. De redenen voor de verschillen in techniek falen in hoofdstuk 4, lijken niet infectieus te zijn, echter welke reden wel ten grondslag ligt is niet duidelijk uit de RRI database. Mogelijk dat de behandelende arts met eigen voorkeuren hierin ook een belangrijke rol speelt. Gezien de omvang van de database dragen de resultaten beschreven in hoofdstuk 4 bij aan de continue controversiteit van dit onderwerp in de literatuur. Grote gerandomiseerde studies over dit onderwerp zijn nodig, aangezien de momenteel beschikbare gerandomiseerde studies inconclusief zijn vanwege het gering aantal geïncludeerde patiënten. Belangrijk is dat de studie in hoofdstuk 4 geen verschillen aantoont in bloeddrukcontrole tussen automatische en handmatige peritoneale dialyse, hoewel geen gedetailleerde gegevens over de volumestatus beschikbaar waren. Dit aspect is nog meer bestudeerd in hoofdstuk 5. Overvulling blijft een belangrijk probleem in patiënten die worden behandeld met peritoneale dialyse. In een recente observationele Europese studie is met behulp van bio-impedantie metingen aangetoond dat 25% van de patiënten die behandeld worden met peritoneale dialyse, ernstig overvuld zijn. In hoofdstuk 5 zijn volumestatus en bloeddrukregulatie vergeleken tussen handmatige en automatische peritoneale dialyse in een cross-sectionele studie. Hiervoor zijn bio-impedantie metingen uitgevoerd, biochemische markers bepaalt en ambulante bloeddrukregistraties verricht. Ondanks een tendens tot een hogere natriumverwijdering bij handmatige peritoneale dialyse, zijn geen verschillen aangetoond tussen beide behandelingen. Deze bevindingen komen overeen met de resultaten van een studie uitgevoerd door Davison et al., waarin ook geen verschillen in volumestatus tussen handmatige

Samenvatting141
en automatische peritoneale dialyse konden worden aangetoond ondanks het feit dat er een lagere hoeveelheid natrium werd verwijderd bij patiënten die behandeld werden met automatische peritoneale dialyse. In de studie van Van Biesen et al. was ook een tendens tot een lager gecorrigeerd extracellulair volume bij patiënten die werden behandeld met automatische peritoneale dialyse. Waarom deze tendens van verminderde natriumverwijdering niet duidelijk leidt tot minder goede volumecontrole blijft tot op heden onvoldoende verklaard. Overvulling in patiënten die worden behandeld met peritoneale dialyse is multifactorieel bepaald waarbij vocht- en zoutinname, transport over het buikvlies, gebruik van polyglucose houdende vloeistoffen versus standaard glucose houdende vloeistoffen, als ook de resterende urineproductie belangrijke factoren zijn. Tekortkomingen aan de studies beschreven in de hoofdstukken 4 en 5 van dit proefschrift, maar ook in andere studies uit de literatuur, zijn dat er geen duidelijke scheiding in verschillende groepen volgens de transportsnelheid over het buikvlies kon worden gemaakt; in hoofdstuk 4 ten gevolge van te weinig beschikbare informatie met betrekking tot de PETs in de database, en in hoofdstuk 5 vanwege de relatief kleine studiepopulatie. Vanwege deze reden zijn meer gedetailleerde studies nog steeds nodig om de voor- en nadelen van handmatige versus automatische peritoneale dialyse te bestuderen voor de verschillende patiëntencategorieën ingedeeld volgens de transportsnelheid over het buikvlies. Naast de behandelingsmodaliteit is ook het behandelvoorschrift van de dialysevloeistoffen van groot belang in de behandeling met peritoneale dialyse. Glucose afbraakproducten kunnen op de langere termijn een direct effect hebben op de integriteit van het buikvlies, bijvoorbeeld door vorming van versuikerde eiwitten, ook wel advanced glycation end-products (AGE) genoemd, welke kunnen bijdragen aan schade van het buikvlies. De vorming van AGEs zoals N-(carboxymethyl)lysine (CML) en N-(carboxyethyl)lysine (CEL) kan worden gestimuleerd door glucose afbraakproducten zoals methylglyoxal en glyoxal. Zoals eerder is aangetoond heeft ook de restnierfunctie een uitgesproken effect op de concentratie AGE producten zoals CML. Behandeling met vloeistoffen met een lage concentratie glucose afbraakproducten zullen waarschijnlijk beter zijn voor het buikvlies, en leiden waarschijnlijk tot minder productie van AGE producten in vergelijking met standaard glucose houdende dialysevloeistoffen. Op dit moment zijn er beperkte vergelijkende gegevens beschikbaar over AGE vorming tussen de standaardvloeistoffen en dialysevloeistoffen met een lage concentratie glucose afbraakproducten. In een gerandomiseerde studie, beschreven in hoofdstuk 6, zijn de concentraties van de AGE producten CML en CEL vergeleken tussen standaardvloeistoffen en dialysevloeistoffen met een lage concentratie glucose afbraakproducten. De concentratie van CEL daalde bij gebruik van vloeistoffen

142
met een lage concentratie glucose afbraakproducten. De verandering in CML concentratie was enerzijds sterker gerelateerd aan de restnierfunctie en anderzijds minder uitgesproken bij gebruik van vloeistoffen met lage concentraties glucose afbraakproducten. Dit suggereert dat de vorming van deze producten via verschillende manieren kan plaatsvinden. De resultaten van deze studie suggereren dat vloeistoffen met een lage concentratie glucose afbraakproducten de hoeveelheid AGE in de buikholte kunnen beïnvloeden. Of deze bevinding zich vertaalt naar een toegenomen AGE concentratie in het plasma kunnen we met deze studie niet aantonen, maar is niet onwaarschijnlijk gezien de significante relatie tussen concentraties CML en CEL in het dialysaat en plasma aangetoond in eerdere studie en het feit dat bij kinderen die behandeld werden met lage glucose afbraakproducten vloeistoffen, een gereduceerde hoeveelheid aan systemische AGE producten werden geobserveerd. Recent werd een relatie aangetoond tussen weefsel AGE en blootstelling van het buikvlies aan glucose, welke congruent is met deze hypothese. Gezien de significante omgekeerde relatie tussen AGE producten en restnierfunctie, zou verwacht kunnen worden dat de verhoging van AGEs, ook aanwezig in de dialysevloeistof, welke niet direct in deze studie werden gemeten, waarschijnlijk verklaard wordt door meerdere factoren met mogelijk een belangrijke rol voor de uremie zelf, naast het effect van de dialysevloeistof. Toekomstige studies zijn noodzakelijk om het effect van dialysevloeistoffen met lage concentratie glucose afbraakproducten te beoordelen op de integriteit van het buikvlies en techniek survival.
Hartfalen en peritoneale dialyse
In deel III van dit proefschrift is gekeken naar de toepassing van peritoneale dialyse in noodsituaties, in het bijzonder bij patiënten met therapieresistent congestief hartfalen, gecompliceerd door een progressieve en potentieel permanente chronische nierinsufficiëntie. Dit wordt in de literatuur het cardiorenaal syndroom type 2 genoemd. Het betreft meestal ernstig zieke patiënten met een slechte prognose, frequente ziekenhuisopnames en een hoge mortaliteit. In hoofdstuk 7 is een overzicht gegeven over wat er in de literatuur bekend is over het gebruik van peritoneale dialyse bij therapieresistent congestief hartfalen. Ondanks de schaarste aan informatie in de literatuur, wordt een verbetering van de functionele toestand en een afname in het aantal ziekenhuisopnames gesuggereerd. De mediane overleving is slechts 12 tot 15 maanden. Op dit moment zijn er geen studies beschikbaar die de resultaten van peritoneale dialyse hebben vergeleken met continue of geïsoleerde ultrafiltratietechnieken.

Samenvatting143
In hoofdstuk 8 worden de resultaten van een retrospectieve studie beschreven naar de toepassing van peritoneale dialyse bij patiënten met cardiorenaal syndroom type 2. Er zijn 24 patiënten geanalyseerd. De gemiddelde leeftijd was 67 jaar en de gemiddelde restnierfunctie 15,4 ml/min. De mediane overleving was 12 maanden. Patiënten die langer dan 12 maanden overleefden toonden een significante afname van het aantal ziekenhuis-opnames. Leeftijd en aanwezigheid van diabetes, en niet de pompfunctie van het hart, bij aanvang van de peritoneale dialyse bleken negatief voorspellende factoren te zijn voor de overleving. De mediane overleving is vergelijkbaar met resultaten van andere kleine studies in de literatuur. De relatieve slechte resultaten van deze analyse reflecteren de ernst van het onderliggend hartfalen, waarbij een conservatieve behandeling leidt tot een mortaliteit van 74% na 1 jaar. In onze analyse ontbraken de gegevens betreffende de functionele toestand en kwaliteit van leven. In hoofdstuk 9 worden de resultaten beschreven van 23 patiënten welke prospectief zijn behandeld met hemodialyse of peritoneale dialyse vanwege het cardiorenale syndroom type 2. Gemiddelde leeftijd was 66 jaar, gemiddelde restnierfunctie 14,6 ml/min en gemiddelde Charlson’s co-morbidity index 4,9. De mediane overleving na starten van dialyse was 16 maanden, wat volgens de Charlson’s co-morbidity index langer was dan verwacht. Ondanks de gemiddelde overlevingsperiode was de individuele overleving erg variabel. In deze studie konden geen significante verschillen tussen hemodialyse en peritoneale dialyse worden aangetoond, maar aangezien het een kleine studiegroep betreft kunnen aan deze studie geen harde conclusies worden ontleend. Een recente observationele Franse studie toonde een hogere mortaliteit bij patiënten met congestief hartfalen na behandeling met peritoneale dialyse in vergelijking met hemodialyse. Echter in deze studie werd congestief hartfalen uitsluitend gedefinieerd op basis van klinische criteria, en extrapolatie van de resultaten naar patiënten met het cardiorenaal syndroom is moeilijk. Aangezien op basis van klinische criteria alleen patiënten werden geincludeerd, is het zeer lastig om in de Franse studie te differentiëren tussen overvulling bij aanvang van de dialyse dan wel geassocieerd cardiaal lijden. Ziekenhuisopnames na het starten van dialyse werden vergeleken met de twee jaren voorafgaand aan de dialyse. Er was een significante afname van de ziekenhuisopnames voor cardiovasculaire redenen, echter niet voor alle oorzaken. Tevens werd er een verbetering van de functionele conditie en een trend tot verbetering in kwaliteit van leven waargenomen. De pompfunctie van het linker ventrikel veranderde niet tijdens de follow-up periode. Verder werd er een significante afname waargenomen in de diurese na 8 maanden, echter de renale klaring bleef ongewijzigd. De resultaten van de studies beschreven in hoofdstukken 8 en 9 suggereren dat dialyse geschikt is voor een selecte groep patiënten bekend met

144
cardiorenaal syndroom type 2. Het aantal technische complicaties geassocieerd aan de dialyse behandeling was in onze populatie relatief hoog en meer dan in de ‘standaard’ dialyse populatie. Waarschijnlijk is dit gerelateerd aan het feit dat het een ernstige zieke en relatieve oude patiëntenpopulatie betreft met een hoge co-morbiditeit, waardoor zij meer gevoelig zijn voor complicaties. Daarbij komt dat de patiëntenselectie voor deze indicatie ook zeer lastig blijft. De uitkomsten van deze prospectieve studie komt overeen met de resultaten van een andere recente studie uitgevoerd door Sanchez et al., waarin 17 patiënten met het cardiorenale syndroom type 2 werden behandeld met peritoneale dialyse. De gemiddelde leeftijd was 64 jaar, gemiddelde renale klaring 35 ml/min en gemiddelde Charlson’s co-morbidity index 6,9. Ondanks dezelfde leeftijd bij aanvang van dialyse, maar een hogere gemiddelde restnierfunctie en Charlson’s co-morbidity index dan in onze studie, was de gemiddelde overleving ook 16 maanden. Nadelen van onze studies zijn de beperkte patiëntenaantallen en de relatieve korte follow up duur. Er is zeker veel meer onderzoek nodig. In het bijzonder is er behoefte aan prospectieve gerandomiseerde gecontroleerde studies met grotere patiëntenpopulaties om nierfunctievervangende behandelingen te kunnen vergelijken en om criteria te kunnen definiëren voor het starten van nierfunctievervangende behandeling bij patiënten met het cardiorenale syndroom type 2.
Epicrise
Ten slotte wordt in hoofdstuk 10 de in voorgaande hoofdstukken vergaarde kennis geïntegreerd en bezien in het licht van de recente literatuur.

Dankwoord
145
146
Dankwoord
Onderzoek doe je samen, en daarom is het zo leuk! Bij het tot stand komen van dit proefschrift hebben veel mensen een bijdrage geleverd. Ik wil hierbij dan ook iedereen hartelijk danken die de afgelopen jaren een steentje heeft bijgedragen. Een aantal mensen wil ik in het bijzonder even noemen. Allereerst wil ik alle patiënten bedanken voor hun deelname aan de studies. Jullie waren steeds weer bereid om vragenlijsten in te vullen, een extra buisje bloed af te laten nemen en zelfs een extra ritje naar het ziekenhuis was nooit een probleem. Zonder jullie medewerking hadden we geen studies kunnen doen en had dit boekje niet geschreven kunnen worden! Mijn oprechte dank daarvoor! Prof. dr. K.M.L. Leunissen, beste Karel, al tijdens mijn sollicitatie voor het aandachtsgebied nefrologie heb ik aangegeven wetenschappelijk onderzoek te willen doen. Hartelijk dank voor de mogelijkheden die je daarvoor hebt geboden. Ik heb het als zeer verrijkend ervaren en heb het altijd met veel plezier gedaan. Dr. J.P. Kooman, beste Jeroen, hartelijk dank voor de prettige samenwerking. Je hebt mij met grote deskundigheid begeleid. Tesamen met je snelheid en enthousiasme was dit voor mij altijd zeer motiverend! Dr. C.J.A.M. Konings, beste Stijn, jij was degene die mij enthousiast hebt gemaakt voor de PD en gestimuleerd om wetenschappelijk onderzoek te gaan doen. Je was altijd geïnteresseerd naar de vorderingen van het onderzoek en reisde mee naar alle symposia en congressen. Heel hartelijk dank daarvoor! De leden van de beoordelingscommissie bestaande uit prof. dr. Gorgels, prof. dr. Delhaas, prof. dr. Stehouwer, dr. Struijk, wil ik hartelijk danken voor hun bereidheid om mijn proefschrift te beoordelen. Prof. dr. B. Lindholm, from the Karolinska Institute in Stockholm, thank you very much for reading the manuscript. It’s a pleasure for me to have you today in Maastricht! Thank you very much. Prof. dr. R.T. Krediet, beste Ray, ik vond het een eer om onderzoek met je te mogen doen! Bedankt voor je snelle en kritische, maar steeds waardevolle reacties op de manuscripten.
Dankwoord147
Dr. W. Smit, beste Watske, bedankt voor je adviezen bij de PET studies. Ik vond het prettig om met je samen te werken en hoop dat onze samenwerking in het Brabantse land nog lang voort zal gaan! Dr. C.H. Beerenhout, dr. W. Fagel, dr. H.P. Krepel, beste Charles, Wouter en Harmen, bedankt dat jullie bereid waren om mijn onderzoeken op jullie dialyse afdelingen te kunnen uitvoeren. Zonder jullie medewerking had de inclusie veel langer geduurd! Verpleegkundigen van de PD afdelingen uit Eindhoven, Leeuwarden, Maastricht, Roosendaal en Veldhoven. Allemaal heel hartelijk bedankt voor jullie ondersteuning en voortdurende belangstelling voor de vorderingen van de studies. Nooit deed ik een tevergeefs beroep op jullie. Altijd waren jullie bereid mij te helpen! Zonder jullie inzet was het niet mogelijk geweest om de klinische studies uit te voeren. Student geneeskunde, Koos van Geel, bedankt voor het invoeren van de data van de CAPD-APD studie. Veel succes met je verdere carrière! Dr. N. Lencer beste Nicole, bedankt voor je hulp bij het includeren van patiënten voor onze hartfalen studie. Mede door jouw enthousiasme hebben we in relatief korte tijd zoveel patiënten kunnen includeren. Piet en Paul, het technisch duo van de dialyse afdeling Maastricht. Bedankt dat ik jullie talloze malen mocht lastig vallen. Jullie waren altijd weer bereid mij te helpen. Mijn collega’s uit Maastricht tijdens de opleiding nefrologie: Karlijn Bartelet, Roy van den Berg, Nicole Heitink ter Braak, Harold Hom, Jeroen Huitema, Vikash Marapin, Frank Stifft en Renate Wijering, ondertussen hebben we allemaal in de periferie een eigen plekje gevonden verspreid over het land, maar het is altijd weer bijzonder aangenaam om elkaar te ontmoeten. Ik wil jullie bedanken voor de prettige samenwerking tijdens de opleiding, jullie belangstelling en support voor mijn onderzoeken. Tiny Wouters, beste Tiny, aan het einde van de ‘survival’ in de wetenschappelijke wereld kwam jij in beeld. Het gaf een gevoel van rust en het einde kwam snel in zicht. Ik wil je graag bedanken voor de prachtige lay-out en goede tips!

148
Maatschap interne geneeskunde en maag, darm- en leverziekten van het Amphia te Breda, beste collega’s, dank voor jullie interesse in de vorderingen van mijn boekje (en voor enkelen de spanning rondom de datum!). Alexander, Marianne en Rinske, heel veel succes met de laatste loodjes voor jullie promotie! Mijn paranimphen, Jos van de Kerkhof en Vanessa Menting, bedankt dat jullie vandaag naast mij willen staan. Beste Jos, ik heb je leren kennen in het Eindhovense. Ondertussen hebben we een waardevolle vriendschap opgebouwd. Bedankt voor jullie prettige vriendschap, belangstelling en steun! Lieve Vanessa, je bent een zeer betrokken vriendin. Ik ben blij dat je ook vandaag naast mij staat! En ik hoop dat we samen nog veel leuke dingen zullen ondernemen! Mijn zussen, zwager en schoonzus, Pytrich en Niels, Wybrich, Katrien, ik ben dankbaar voor de goede band die wij hebben! Bedankt voor jullie interesse in mijn ‘hobby’ en alle steun tijdens de afgelopen jaren. Wybrich, ook jij veel succes met de afronding van je onderzoeken en promotie! Kop der foar, nea de moedfearren hingje litte! Mijn schoonouders, Jan en Liesbeth, wil ik bedanken voor hun steun en interesse in mijn werk. Myn âlden, ús leave heit en mem, betanke foar de grûnslach dy’t jimme lein hawwe foar myn bestean en foar alle kânsen dy’t jimme my joegen om my yn it libben te ûntjaan. Ik koe my altiten droegen fiele troch jimme stipe en soarch. Dit proefskrift is opdroegen oan jimme, want dat ik it hjir hjoed ferdigenje mei en kin komt mei troch jimme leafde en ynset foar my. Ik wol it graach sjen as in bekroaning fan dy ynset. Lieve Jelle en Wybe, jullie zijn van onschatbare waarde. Jullie vrolijkheid maken van iedere dag een feestdag en hebben voor de nodige relativering gezorgd. Het boekje van mama is nu eindelijk af! Ik hoop dat jullie met ons en het nieuwe broertje of zusje heel gelukkig worden in Breda en een prachtige toekomst tegemoet gaan. Ik ben trots op jullie! Ten slotte mijn echtgenoot, lieve Geert, als partner van een promoverende en werkende moeder werd de afgelopen jaren ook van jou het een en ander gevraagd. Dank voor je onvoorwaardelijke steun en vertrouwen.

149
Curriculum vitae

150

Curriculum vitae151
Curriculum vitae
Nynke Cnossen werd geboren op 19 maart 1975 te Sneek. In 1993 behaalde zij het Gymnasium B diploma aan het Bogerman College te Sneek. Nadien ging zij geneeskunde studeren aan de Universitaire Instelling Antwerpen, eerst 3 kandidaatsjaren en nadien 4 doctoraatsjaren. In september 2000 begon zij als arts-assistent niet-in-opleiding bij de interne geneeskunde in het Catharina Ziekenhuis te Eindhoven. In juni 2001 startte zij met de opleiding tot internist (opleider dr. S.J. Hoorntje, later dr. B. Bravenboer). Van juni 2005 tot en met maart 2006 heeft zij zich full time bezig gehouden met het opstarten van klinisch wetenschappelijk onderzoek op het gebied van peritoneale dialyse, waaruit de studies beschreven in dit boekje zijn voortgekomen. In april 2006 werd de opleiding tot internist voortgezet in het Maastricht Universitair Medisch Centrum+ (MUMC+) (opleider prof. dr. C.D.A. Stehouwer) en gestart met het aandachtsgebied nefrologie (opleider prof. dr. K.M.L. Leunissen). In april 2008 werd zij geregistreerd als internist-nefroloog en heeft zij als staflid gewerkt bij de afdeling Interne Geneeskunde, onderafdelingen Nefrologie en Acute Interne Geneeskunde, van het MUMC+. Sinds mei 2010 is zij werkzaam als internist-nefroloog in het Amphia Ziekenhuis te Breda. Nynke is getrouwd met Geert Beullens. Zij hebben twee zonen; Jelle (2004) en Wybe (2007). In mei 2012 verwachten zij hun derde kindje.


153
Publications

154

Publications155
Publications
FM van der Sande, TT Cnossen, T Cornelis, KML Leunissen, JP Kooman. Peritoneal dialysis in patients with heart failure. Minerva Urol Nefrol in press. TT Cnossen, JP Kooman, HP Krepel, CJAM Konings, NHMK Uszko-Lencer, KML Leunissen, FM van der Sande. Prospective study on clinical effects of renal replacement therapy in treatment-resistant congestive heart failure. Nephrol Dial Transplant in press. TT Cnossen, CJAM Konings, W Fagel, JP Kooman, FM van der Sande, KML Leunissen. Differences in fluid status and blood pressure between CAPD and APD. ASAIO in press. TT Cnossen, Usvyat L, Kotanko P, FM van der Sande, JP Kooman, Carter M, KML Leunissen, N Levin. Comparison of outcomes on continuous ambulatory peritoneal dialysis versus automated peritoneal dialysis: results from a USA database. Perit Dial Int 2011;31(6):679-684. TT Cnossen, U Gladziwa, JJ van de Kerkhof, CG Schalkwijk, K Moret, CH Beerenhout, FM van der Sande, KML Leunissen, JP Kooman. The influence of Physioneal on advanced glycation end-products and inflammatory markers in plasma and dialysate in patients on CAPD. Perit Dial Int 2011;31(2):189-193. TT Cnossen, JP Kooman, CJAM Konings, NH Uszko-Lencer, KML Leunissen, FM van der Sande. Retrospective analysis of peritoneal dialysis in patients with primary cardiac failure complicated by renal failure. Blood Purif 2010;30(2):146-152. TT Cnossen, CH Beerenhout, CJAM Konings, JP Kooman, KM Leunissen, W Smit, RT Krediet. Influence of the preceding dwell time on the peritoneal equilibration test with 3.86% glucose in automated peritoneal dialysis.
TT Cnossen, W Smit, CJAM Konings, JP Kooman, KM Leunissen, RT Krediet. Quantification of free water transport during the peritoneal equilibration test. Perit Dial Int 2009;29(5):523-527.
Perit Dial Int 2010;30(1):95-98.
156
TT Cnossen, JP Kooman, FM van der Sande, CJAM Konings, KML Leunissen. Clinical effects of icodextrin in peritoneal dialysis. NDT Plus 2008;1(4):18-22. R van den Berg, TT Cnossen, CJAM Konings, JP Kooman, FM van der Sande, KML Leunissen. Different treatment options in peritoneal dialysis. NDT Plus 2008;1(4):14-17. Van Leusen R, Adang RP, de Vries RA, Cnossen TT, Konings CJ, Schalm SW, Tan AC. Pegylated Interferon Alfa-2a (40 kD) and ribavirin in haemodialysis patients with chronic hepatitis C. Nephrol Dial Transplant 2008;23(2):721-725. JP Kooman, N Cnossen, CJ Konings, FM van der Sande, KM Leunissen. Is there a competition between urine volume and peritoneal ultrafiltration in peritoneal dialysis patients? Contrib Nephrol 2006;150:111-118. N Cnossen, JP Kooman, CJ Konings, JM van Dantzig, FM van der Sande, K Leunissen. Peritoneal dialysis in patients with congestive heart failure. Nephrol Dial Transplant 2006;21(Suppl 2):ii63-ii66. TT Cnossen, CJAM Konings, JP Kooman, B Lindholm. Peritoneal sclerosis -- aetiology, diagnosis, treatment and prevention. Nephrol Dial Transplant 2006;21(Suppl 2):ii38-ii41. GJ Boland, N Cnossen, T van Bommel, A Rulos-van den Berg, JP van den Berg, AM van Loon, J van Hattum. Molecular diversity of hepatitis C in the Batam region. Adv Exp Med Biol 2003;531:211-217.

Publications157

158

159
Additional financial support for publication of this thesis was generously supported by:
Abbott B.V.
Amgen B.V.
Astellas Pharma B.V.
Fresenius Medical Care Nederland B.V.
Genzyme, a Sanofi Company
Novartis Pharma B.V.
Roche Nederland B.V.
Shire Pharmaceuticals – Benelux
Performance of the studies in chapters 2, 3 and 6 was financially supported by Baxter B.V.
Performance of the study in chapter 5 was financially supported by Roche Nederland B.V.


