Embed Size (px)
Citation preview
Protecting North Carolina’s freshwater systems: A state-wide assessment of biodiversity, condition and opportunity
The Nature Conservancy · North Carolina Chapter
Catherine Burns, Chuck Peoples, Margaret Fields and Analie Barnett
Black River. Photograph by Dan Griffin.
2
This report was made possible by grants from
the Z. Smith Reynolds Foundation
and Dr. Malcolm Brown
©2012 The Nature Conservancy
4705 University Drive, Suite 290
Durham, NC 27707
919-403-8558
http://www.nature.org/ourinitiatives/regions/northamerica/unitedstates/northcarolina/index.htm
Suggested citation: Burns CE, C Peoples, M Fields, A Barnett. 2012. Protecting North Carolina’s
freshwater systems: A state-wide assessment of biodiversity, condition and opportunity.
The Nature Conservancy.
3
EXECUTIVE SUMMARY
North Carolina is home to an incredible
diversity of plants and animals that live in and
rely on its expansive freshwater resources. The
World Wildlife Fund has placed most of the
state in its highest priority class for freshwater
biodiversity conservation (Abell et al. 2000).
North Carolina is also home to nearly 10 million
human residents, and is the 6th fastest growing
state in the country with an 18.5% increase in
population size since 2000 (US Census Bureau
2010). Statewide, freshwater systems are being
impacted by a wide range of factors, including
land cover and land use change associated with
a growing human population, flow alteration
from increasing numbers of dams and elevated
water withdrawals to support human needs,
and a number of other factors.
Concerted efforts to protect and restore the
state’s freshwater systems are underway, as a
result of extensive work led by state and federal
agencies, environmental organizations,
academic institutions, and many other groups.
We conducted this assessment in an effort to
identify areas commonly agreed upon as top
priority conservation sites, to synthesize
freshwater research and on the ground actions
conducted to date, and to identify opportunities
for freshwater conservation and information
gaps that need to be filled.
Included in this report is a literature review
summarizing published articles, reports,
dissertations, and book chapters that assessed
patterns of freshwater biodiversity and
condition, and/or identified freshwater
conservation priorities for all or part of North
Carolina. We found significant agreement
among the sources we reviewed, leading to a
robust picture of the status and needs of
freshwater systems across the state.
We also present results of an original analysis
conducted by The Nature Conservancy’s North
Carolina Chapter and North Carolina’s Natural
Heritage Program, in which we quantified the
distribution of freshwater conservation targets
and the condition of lands and waters
surrounding them to generate a set of priorities
for freshwater preservation, restoration, and
further exploration. This analysis was
conducted in an effort to bring together
information on species distribution patterns as
well as landscape connections which we felt
were not fully explored in any of the sources we
reviewed.
Each of these components was reviewed during
two expert workshop sessions, in which 38
representatives from 17 organizations
participated, and was also refined as a result of
numerous internal and external peer
evaluations over the course of the project’s
development.
We provide a blueprint for freshwater
conservation in North Carolina that represents
the work of many people and many institutions
over the course of decades. However, this is
not an exhaustive assessment of all work
previously or currently being conducted on
North Carolina’s freshwater systems, nor have
we included all of the important species and
threats in our original analysis. We have sought
to capture the most comprehensive works
conducted to date, and to quantify the most
pressing threats to many species that are of
conservation concern and that span taxonomic
groups and the vast geography of the state.
4
ACKNOWLEDGMENTS
Funding for this project was provided by a
generous gift from the Z. Smith Reynolds
Foundation to The Nature Conservancy. We
would especially like to thank Hawley Truax and
Leslie Winner for their interest in freshwater
conservation and the long-term sustainable
management of North Carolina’s freshwater
resources.
The analyses that generated the data shown on
the distribution of freshwater targets
throughout North Carolina were conducted in
close partnership with the Natural Heritage
Program. This crucial part of our assessment
was generated through NHP’s Conservation
Planning Tool. Special thanks go to Linda
Pearsall for her enthusiastic support of this
collaborative effort, and to Judy Ratcliffe,
Allison Weakley and Steve Hall for their
willingness to devote significant amounts of
time to this project, for their advice and all of
their hard work to bring this project together
quickly.
The flow alteration metrics that we have used
were graciously shared by the Southeast
Aquatic Resources Partnership, who
commissioned these analyses to be conducted
by The Nature Conservancy’s Analie Barnett.
Many thanks go to Mary Davis for her
willingness to share this information with us
when it was hot off the presses.
Thanks to Kathleen Hoenke from Duke
University, and Lynnette Batt from American
Rivers, for their hard work in identifying the
locations of dams across North Carolina, and for
their willingness to share the barrier dataset
and the results of their own analyses with us.
Don Rayno with North Carolina’s Department of
Environment and Natural Resources’ Division of
Water Resources provided data on water
withdrawals and assisted us in their
interpretation.
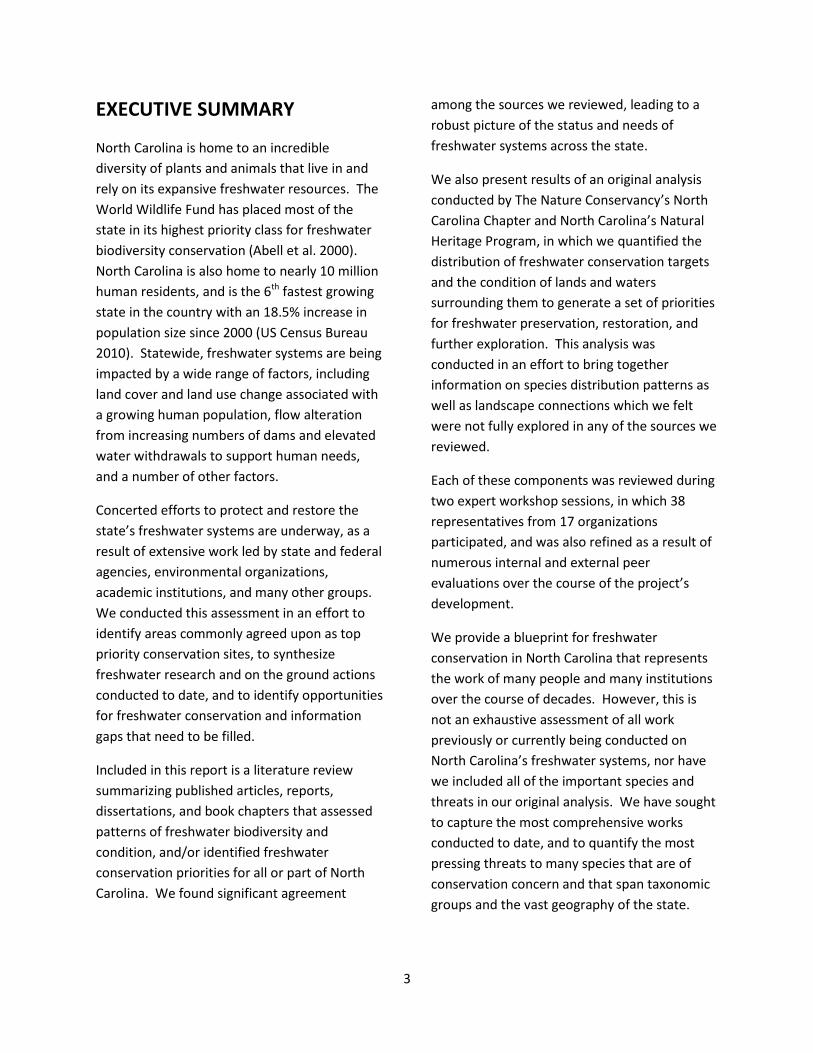
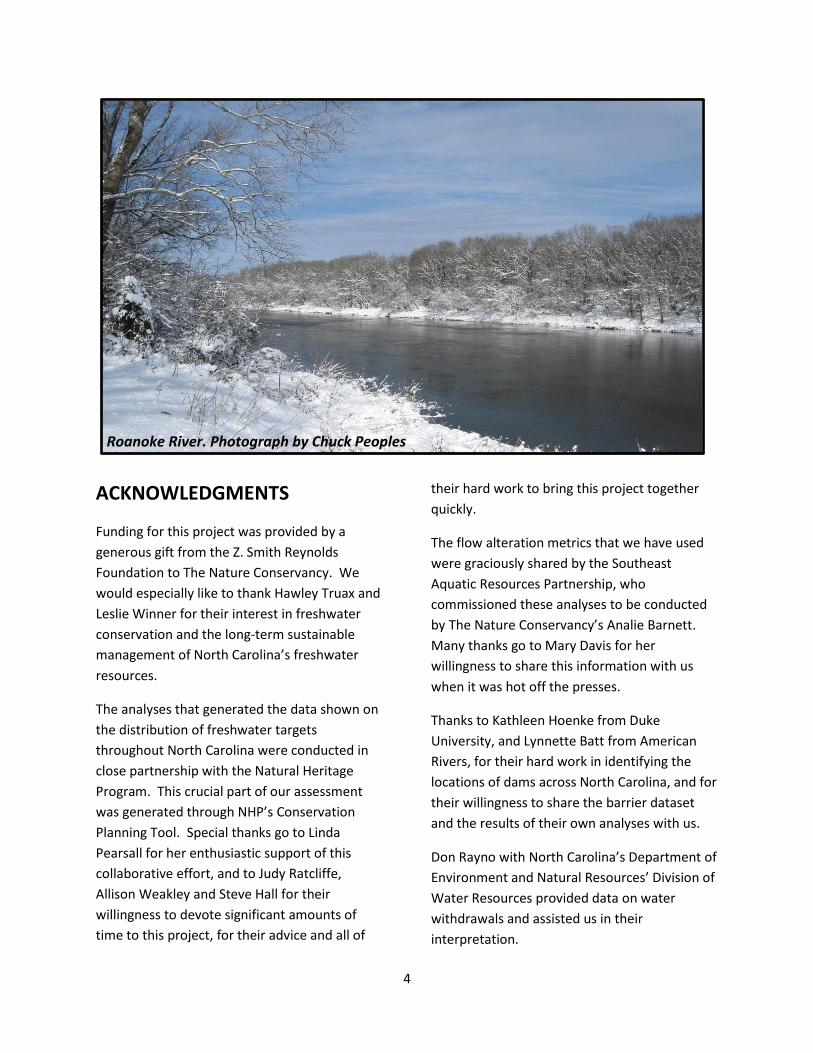
Roanoke River. Photograph by Chuck Peoples
5
This work would not have been possible
without the input of many freshwater experts
from across the Southeast US over the course of
two full day workshops in November 2011, one
in Raleigh and one in Asheville. Each of these
participants brought unique skills and
knowledge to the table, including knowledge of
freshwater ecology, the distribution of
freshwater species and communities, flow
alteration and ecosystem flow needs,
conservation planning, as well as information
on the threats and opportunities for freshwater
conservation across North Carolina. Many of
these participants also assisted after the
workshops in providing input to fine-tune our
analyses, peer reviewing previous drafts of this
report, and providing additional information as
needed. Thank you very much to the following
individuals for all of their help during and after
the workshops:
Paul Angermeier, Virginia Polytechnic Institute
and State University
Kevin Barnett, NC Division of Water Quality,
Department of Environment and Natural
Resources
Lynnette Batt, River Restoration Program,
American Rivers
Tyler Black, NC Wildlife Resources Commission
Art Bogan, North Carolina Museum of Natural
Sciences
Bob Butler, US Fish & Wildlife Service
Larry Cahoon, University of North Carolina at
Wilmington
Mark Cantrell, US Fish & Wildlife Service
Cindy Carr, NC Wildlife Resources Commission
Nancy Daly, NC Ecosystem Enhancement
Program
Mary Davis, Southeast Aquatic Resources
Partnership
Amy Edge, Tar River Land Conservancy
John Ellis, US Fish & Wildlife Service
Mark Endries, US Fish & Wildlife Service
Steve Fraley, NC Wildlife Resources Commission
Paul Freeman, The Nature Conservancy,
Alabama Chapter
John Fridell, US Fish & Wildlife Service
Chris Goudreau, NC Wildlife Resources
Commission
Derek Halberg, Tar River Land Conservancy
Jeff Hall, NC Wildlife Resources Commission
Ryan Heise, NC Wildlife Resources Commission
Eric Krueger, The Nature Conservancy, South
Carolina Chapter
Wilson Laney, US Fish & Wildlife Service
Dave Lenat, Division of Water Quality,
Department of Environment and Natural
Resources
Andrea Leslie, NC Ecosystem Enhancement
Program
Mike Mallin, University of North Carolina at
Wilmington
Jason Mays, US Fish & Wildlife Service
Brian McCrodden, HydroLogics
Sarah McRae, US Fish & Wildlife Service
Jim Mead, Division of Water Resources,
Department of Environment and Natural
Resources
Linda Pearsall, NC Natural Heritage Program,
Department of Environment and Natural
Resources
Sam Pearsall, Environmental Defense Fund
Judy Ratcliffe, NC Natural Heritage Program,
Department of Environment and Natural
Resources
Don Rayno, Division of Water Resources,
Department of Environment and Natural
Resources
Don Riley, Natural Resources Conservation
Service
Angie Rodgers, NC Natural Heritage Program,
Department of Environment and Natural
Resources
Tim Savidge, The Catena Group
6
Win Taylor, Equinox Environmental
Mike Wicker, US Fish & Wildlife Service
Ed Williams, Division of Water Quality,
Department of Environment and Natural
Resources
We also would like to acknowledge the
contributions of several staff of The Nature
Conservancy, without whose help this project
would not have happened. Jodie LaPoint
frequently offered her skills – both as Excel
genius as well as brainstorming partner. Molly
Bishop was instrumental in carrying out the
literature review, and maintained attention to
detail that was truly impressive after reading
several thousand pages. Kathleen McCole
Hoenke, a Duke Masters student during the
period of this project, contributed significantly
to our understanding of linear connectivity in
NC’s freshwater systems. Liz Kalies provided
expert assistance in reviewing and interpreting
data from several sources in this report. Jodie
LaPoint, Rick Studenmund and David Ray
worked with us to ensure that each of the
workshops went off without a hitch. Many
thanks to each of you for your involvement in
this project and your enthusiastic participation.
The following individuals provided helpful
feedback on a previous draft of this report: Dan
Ryan, Ryan Elting, Hervey McIver, Kat Hoenke,
Kimberly Meitzen, and Colin Apse (TNC); Judy
Ratcliffe, Linda Pearsall and Allison Weakley (NC
NHP); Sarah McRae and Mark Endries (US FWS);
and Chris Goudreau and Ryan Heise (NC WRC).
Boone Fork Creek, Grandfather Mountain. Photograph by Hugh Morton
7
TABLE OF CONTENTS
Introduction to North Carolina’s freshwater systems 8
Goals of this assessment 10
Previous efforts to identify freshwater conservation priorities in North Carolina 11
Novel analysis of freshwater targets, condition, and priorities 22
Identifying conservation targets using the Conservation Planning Tool 24
Identifying watershed condition 27
Generating a set of priorities 39
Further uses of this information 42
Comparison of results with previous assessments 43
Threats to North Carolina’s freshwater systems 45
Key strategies and opportunities 52
Information gaps and research needs 56
Conclusions 58
Accessing electronic data used in this report 59
References 60
Appendices
Appendix 1. Technical documentation for the development of freshwater 63 conservation priorities based on the NC Conservation Planning Tool (CPT) Appendix 2. Species list used in NHP Conservation Planning Tool analysis 67
Appendix 3. Active River Area (ARA) and NLCD 2006 Composition Metrics: 72 HUC6, HUC8, HUC12, and NHDPlus catchments, description and metadata
Appendix 4. Flow alteration calculations 81
Appendix 5. Strategies and opportunities at the basin and sub-basin scale, 83 identified by workshop participants
Appendix 6. Current freshwater conservation initiatives in each basin 84
Supplemental Information 92
8
Introduction to North Carolina’s freshwater systems
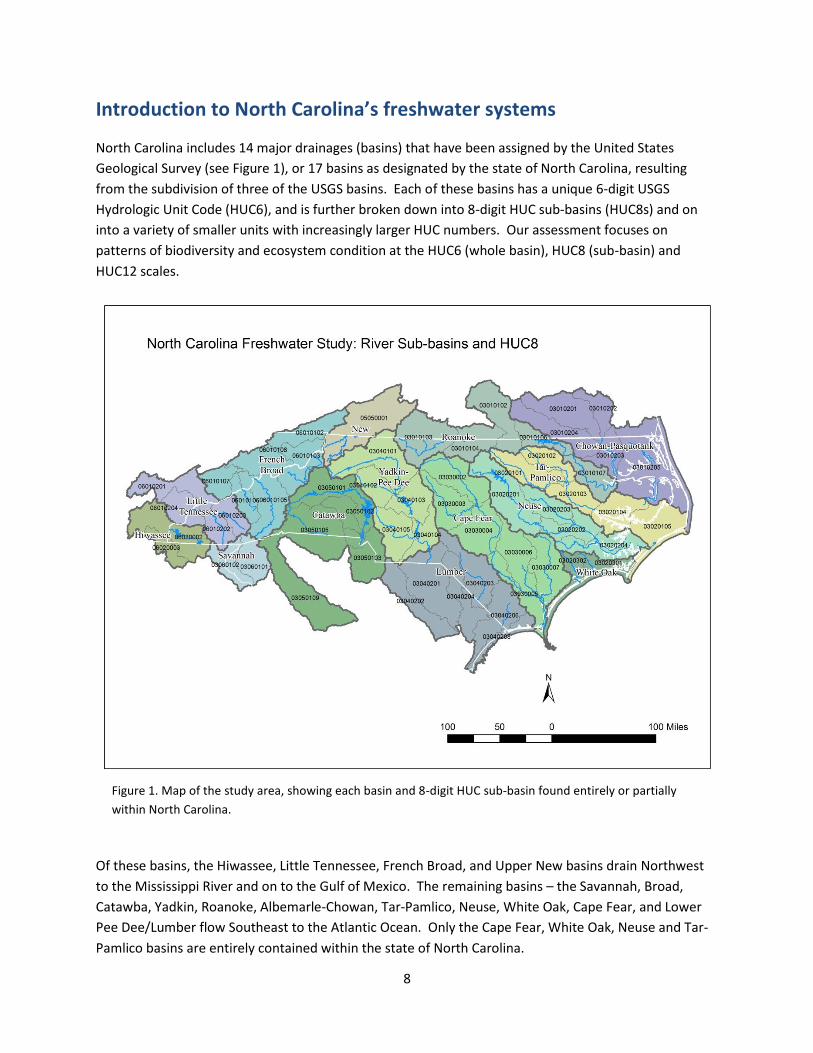
North Carolina includes 14 major drainages (basins) that have been assigned by the United States
Geological Survey (see Figure 1), or 17 basins as designated by the state of North Carolina, resulting
from the subdivision of three of the USGS basins. Each of these basins has a unique 6-digit USGS
Hydrologic Unit Code (HUC6), and is further broken down into 8-digit HUC sub-basins (HUC8s) and on
into a variety of smaller units with increasingly larger HUC numbers. Our assessment focuses on
patterns of biodiversity and ecosystem condition at the HUC6 (whole basin), HUC8 (sub-basin) and
HUC12 scales.
Of these basins, the Hiwassee, Little Tennessee, French Broad, and Upper New basins drain Northwest
to the Mississippi River and on to the Gulf of Mexico. The remaining basins – the Savannah, Broad,
Catawba, Yadkin, Roanoke, Albemarle-Chowan, Tar-Pamlico, Neuse, White Oak, Cape Fear, and Lower
Pee Dee/Lumber flow Southeast to the Atlantic Ocean. Only the Cape Fear, White Oak, Neuse and Tar-
Pamlico basins are entirely contained within the state of North Carolina.
Figure 1. Map of the study area, showing each basin and 8-digit HUC sub-basin found entirely or partially
within North Carolina.
9
The World Wildlife Fund found that the southeast United States has the highest diversity of freshwater
mussel and crayfish species in the world, and the highest species diversity and endemism of fishes,
mussels and crayfish found in North America (Abell et al. 2000). As a result, North Carolina’s freshwater
systems are some of the most biologically diverse in the country, and they span diverse geographic
regions from the Appalachian Mountains through the piedmont to the coastal plain. The state supports
more than 240 fish species, 45 crayfish species, and 125 mollusk species (NCWRC 2005), which
encompasses over 90% of the mollusk diversity found in the southeast, and 95% of the crayfish species
of North America (Neves et al. 1997; NCWRC 2005; Butler 2002).
These natural systems are increasingly threatened as a result of a rapidly growing state population and
accompanying development, agriculture, and other changes in land use that have a strong impact on
freshwater community composition and ecosystem function. Changes in climate have already been
observed (DeWan et al. 2010), and these and future climate changes will have additional impacts on
North Carolina’s freshwater systems, as precipitation patterns become more variable and air and water
temperatures become warmer. An excerpt from the 2005 State Wildlife Action Plan provides ample
support for the urgency and the challenges of freshwater conservation in North Carolina.
The number of imperiled freshwater fishes in the southeast (84) is greater than any other region in the country and the percentage of imperiled species is second only to the western United States (Minckley and Deacon 1991, Warren and Burr 1994). Twenty-eight percent of southeastern freshwater and diadromous fishes have a status of extinct, endangered, threatened, or vulnerable, which represents a 125% increase in 20 years (Warren et al. 2000). North Carolina ranks third among southeastern states in number (21) and percentage (11.5%) of imperiled fishes (Warren et al. 1997). Freshwater mollusks are suffering even greater declines. Thirty-six mussel species and 26 snail species that formerly occurred in the southeast (13% of all United States mussel species and 8% of southeastern snails) are presumed extinct (Neves et al. 1997). By state, between 34% and 71% (mean = 58%) of mussel species, or populations of species, are imperiled in the southeast, which represents 98% of all rare mussel species in the United States (Neves et al. 1997). Fifty-nine percent of freshwater mussel species in North Carolina are imperiled (Neves et al. 1997). Among crustaceans listed as endangered or threatened in the United States, 54% are from the southeast (Schuster 1997). Twelve species (26%) of North Carolina crayfish are listed as species of concern or rare in the state (Clamp 1999, LeGrand et al. 2004). Causes of declines among all aquatic taxa are widely attributed to habitat destruction and degradation, and the introduction of nonindigenous species (Williams et al. 1993, Taylor et al. 1996, Etnier 1997, Warren et al. 1997). Fishes inhabiting medium-sized rivers and creeks rely on coarse substrates that are relatively silt-free; however, these streams are often heavily impounded and have altered substrates. Habitat alteration from nonpoint source pollution and flow alteration (i.e., impoundments) are the primary cause of population declines for 72% of southeastern fishes considered imperiled (Etnier 1997). Not surprisingly, nonpoint source pollution and the effects of dams and impoundments are also the leading historic and current threats to freshwater mollusks (Bogan 1993, Neves et al. 1997, Richter et al. 1997). The complex life cycles and habitat requirements of mussels make them especially vulnerable to these perturbations (Adams 1990, Bogan 1993, Neves et al. 1997). The small native range of many crayfish species is a primary factor in their vulnerability to habitat loss and competition (Clamp
10
1999, Taylor et al. 1996). Threats to crayfish include pollution and impoundment, but competition with nonindigenous species is also a primary threat to many species (Taylor et al. 1996).
Goals of this assessment
A successful plan for protecting North Carolina’s freshwater systems must rely not only on protecting
and restoring these systems, but on identifying ways to do this within the context of an ever-increasing
human population. Over the past decade, North Carolina’s population has grown nearly 20%, and this
trajectory is expected to continue, with the greatest rates of development expected in the piedmont.
This rapid growth brings increasing demands for water, accelerated conversion of natural land cover,
increasing numbers of barriers to the movement of aquatic organisms, and declining water quality due
to point and non-point source pollution. Finding a balance between the needs of people and the needs
of nature will be necessary to achieve lasting success for both.
The primary goal of this study is to provide, through synthesis and analysis, a set of freshwater
conservation priorities for North Carolina that can be used by The Nature Conservancy and other groups
to identify locations and strategies for freshwater conservation. We seek to identify conservation
priorities that include areas for preservation as well as areas for restoration and to locate areas where
further assessment is merited. We accomplished this goal through several objectives:
1. Assess the distribution of freshwater targets (species and systems) across North Carolina. To
accomplish this objective, we: a) identified, reviewed and summarized existing reports on the
distribution of target species and systems, and on recommended conservation priority areas in
North Carolina, and b) employed the Natural Heritage Program’s Conservation Planning Tool to
generate a quantitative assessment of the distribution of freshwater targets across the state.
2. Assess the condition of freshwater systems across North Carolina. To accomplish this objective,
we: a) estimated the intactness of the floodplain by quantifying natural land cover within the
Active River Area, b) estimated linear connectivity (overall impacts of dams and road crossings)
using barrier and road datasets, c) quantified the dominant land cover and recent rates of
change in land cover across each basin and sub-basin, d) estimated the degree of flow alteration
that has occurred across the state, and e) worked with partners to identify and quantify other
current and future threats to the condition of each basin.
3. Identify ongoing initiatives, opportunities and key strategies for conservation in each basin
through literature review and discussion with other groups working on freshwater issues.
4. Identify gaps in our knowledge and areas for new or continued investigation.
This work is not a product of The Nature Conservancy working alone. We worked closely with many
individuals and organizations to carry out each component of this assessment. Notably, the staff of the
Natural Heritage Program worked with us to generate the values for the freshwater conservation targets
using NHP’s Conservation Planning Tool, which we hope in and of itself will serve the broader purposes
of the conservation community. We worked closely with the Wildlife Resources Commission in an effort
11
to learn from and compare results with the current Wildlife Action Plan, and with the Department of
Environment and Natural Resources’ Divisions of Water Resources and Water Quality to identify the
state’s priorities with respect to water quality and to identify patterns of water use across North
Carolina. The US Fish and Wildlife Service provided us with up-to-the-minute data resulting from their
recent analysis of freshwater biodiversity in North Carolina, from which we have learned a great deal. In
addition to these collaborations, we incorporated peer reviews into each phase of this project, through
individual conversations and during two workshops in which our approach and preliminary findings were
vetted with experts in freshwater ecology and conservation. These individuals are listed in our
acknowledgments, and their insights greatly informed this assessment.
Previous efforts to identify freshwater conservation priorities in North
Carolina
Literature review
We conducted a review of the published peer-reviewed literature as well as reports relevant to
freshwater biodiversity and conservation in North Carolina. We searched the literature by using the
scientific database Web of Science, by contacting freshwater experts across the state of North Carolina
to obtain additional materials, and by investigating papers that were listed in the reference sections of
key publications. Through these avenues, we identified many articles and reports that were pertinent to
an evaluation of freshwater conservation priorities in North Carolina. This is undoubtedly a subset of all
works related to the issue, but based on our review, we felt these comprised the critical pieces of
literature. Insights from these sources are integrated into this report where appropriate, and a full list
of citations is provided in the references.
From here forward in the review, we detail six state-wide assessments that describe patterns of
biodiversity, differences in threats and condition across the state, and/or use various types of
information to determine conservation priorities for North Carolina’s freshwater systems. These
include: 1) The Nature Conservancy’s Southeastern Biodiversity Assessment (Smith et al. 2002), 2) North
Carolina’s State Wildlife Action Plan (NCWRC 2005), 3) a recent analysis of statewide patterns of
freshwater biodiversity, as predicted through Maxent modeling (Endries 2011), 4) North Carolina’s
Division of Water Quality’s Basinwide Water Quality Plans, 5) the North Carolina Ecosystem
Enhancement Program’s Restoration Plan, and 6) an assessment of patterns of linear connectivity and
the distribution of dams across the state (Hoenke 2012). Each of these assessments uses a different set
of methods to identify priorities for freshwater conservation, though in many cases there is partial
overlap in the data used (e.g., Natural Heritage Program data on species occurrences were used in
each). Our review also identified a seventh statewide assessment of conservation priorities, the Natural
Heritage Program’s Conservation Planning Tool (NC NHP 2011). This online tool provides information on
the distribution of terrestrial conservation targets, and contains the data to assess separately the
distribution of freshwater conservation targets. We do not review this tool here, as it is thoroughly
12
described later in this report in sections relating to our own analyses which use this tool to identify
locations of freshwater conservation targets.
1. The Nature Conservancy’s Southeast Biodiversity Assessment (2002)
The main objective of this assessment was to identify the most important areas for freshwater
biodiversity in the Southeast, by assessing distribution and needs of specific species targets, ecosystem
types, threats and a variety of quality/condition attributes. A multi-step approach was employed,
including: 1) stratify regions into ecological drainage units [HUC 8], 2) select conservation targets
(species and systems), 3) set conservational goals for targets, 4) identify viable occurrences of targets,
and 5) identify data gaps and research needs. Data were compiled on the threats to biodiversity,
urgency of need for conservation efforts, probability of success of conservation efforts, existing
conservation partners and managed areas, and initial suggestions for conservation strategies.
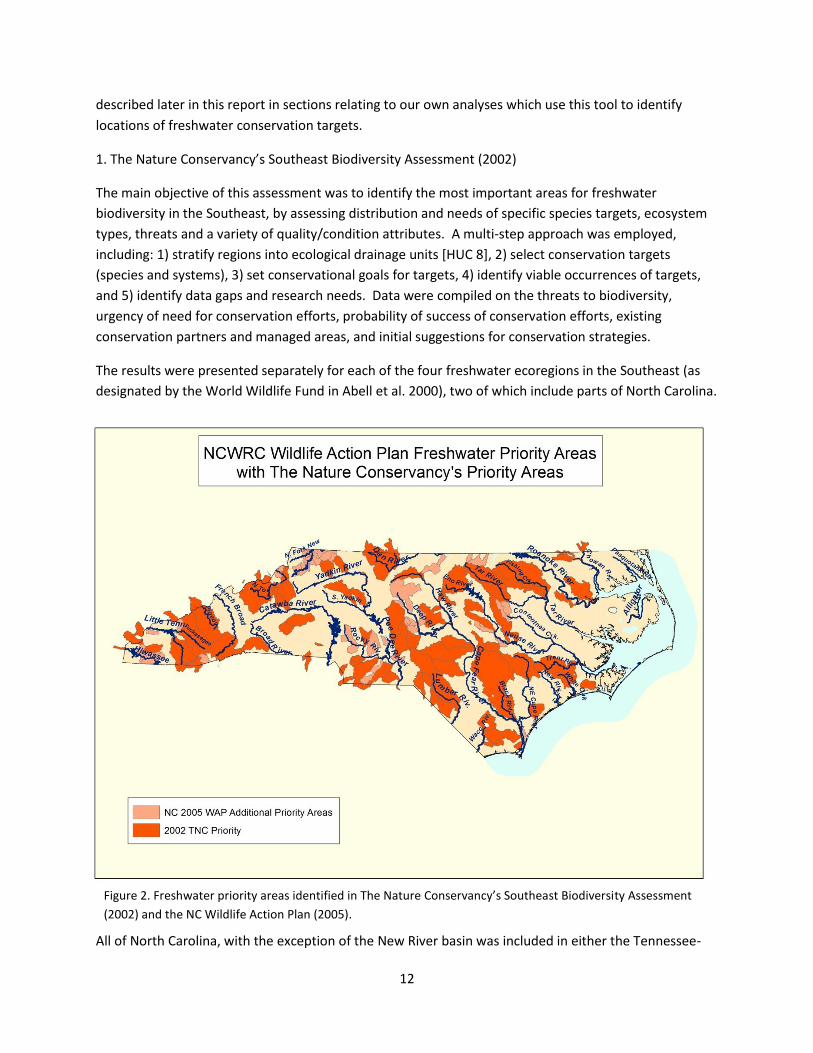
The results were presented separately for each of the four freshwater ecoregions in the Southeast (as
designated by the World Wildlife Fund in Abell et al. 2000), two of which include parts of North Carolina.
All of North Carolina, with the exception of the New River basin was included in either the Tennessee-
Figure 2. Freshwater priority areas identified in The Nature Conservancy’s Southeast Biodiversity Assessment
(2002) and the NC Wildlife Action Plan (2005).
13
Cumberland or the South Atlantic freshwater ecoregion. Within the Tennessee-Cumberland, 135
species targets and 120 aquatic systems (including 8 large rivers, 10 medium, 20 small, and 82
headwaters/creeks) were identified, and 70 conservation areas were delineated by experts. The report
indicated that if these areas were conserved, the vast majority of the region’s freshwater biodiversity
would remain viable. The report did not distinguish between opportunities for protection and areas
with restoration potential. Within the South Atlantic, which drains the Blue Ridge Mountains, the
Piedmont Plateau and the Atlantic Coastal Plain, 176 aquatic systems, 118 species targets, and 3 notable
centers of endemism (i.e., Lake Waccamaw, Altamaha River, and Upper Tar River) were identified. 107
conservation areas were delineated by experts, with 58 in the Piedmont and Blue Ridge foothills and 49
in the Atlantic Coastal Plain. These priority areas are shown in Figure 2 in dark orange.
2. North Carolina State Wildlife Action Plan (2005)
North Carolina’s State Wildlife Action Plan reviews each of the state’s 17 basins in depth, and provides
information on the number of priority species in each basin, the location and condition of each basin,
and the problems affecting species and habitats. The Plan also identifies priority research, survey and
monitoring efforts needed in each basin, as well as addressing necessary specific conservation actions.
The Plan adopted the TNC 2002 assessment priorities and, based on expert review, identified additional
priority areas for freshwater conservation. These areas are shown in lighter orange in Figure 2. The
Plan provided useful, detailed information on each basin, much of which will be presented later in this
report when we discuss threats, data gaps, and requisite actions.
3. Aquatic species mapping using Maxent (2011)
Using a sophisticated modeling approach, Mark Endries of USFWS assessed aquatic species distributions
across North Carolina (http://www.fws.gov/asheville/htmls/Maxent/Maxent.html; Endries 2011). His
approach created predictive habitat maps for 226 different aquatic species using a geographic
information system (GIS) and maximum entropy (Maxent) modeling. These maps were derived by
comparing known species occurrences with a suite of stream or land cover derived environmental
variables. Maxent uses a set of species occurrences and their associated environmental variables from
defined locations to estimate the probability of species occurrences in other geographic areas with
similar environmental conditions. The resulting map shows a statewide prioritization of streams based
on species Global Ranks (NatureServe 2011).
Aquatic species occurrence data was limited to that collected since the year 2000 to satisfy the need for
temporal correspondence between occurrence locations and the environmental variables at each
location. The land cover map used to create many of the environmental variables was based on satellite
imagery from 2000. Aquatic species point occurrence data was used from 6 sources: 1) North Carolina
Natural Heritage Program Element Occurrence Dataset, 2) North Carolina Museum of Natural Sciences’
Research and Collections Section Dataset, 3) North Carolina Wildlife Resources Commission Priority
Species Monitoring Dataset, 4) North Carolina Wildlife Resources Commission Trout Distribution
Dataset, 5) North Carolina Division of Water Quality Benthos Macroinvertebrate Assessment Data, and
6) North Carolina Division of Water Quality Stream Fish Community Assessment Program Data.
14
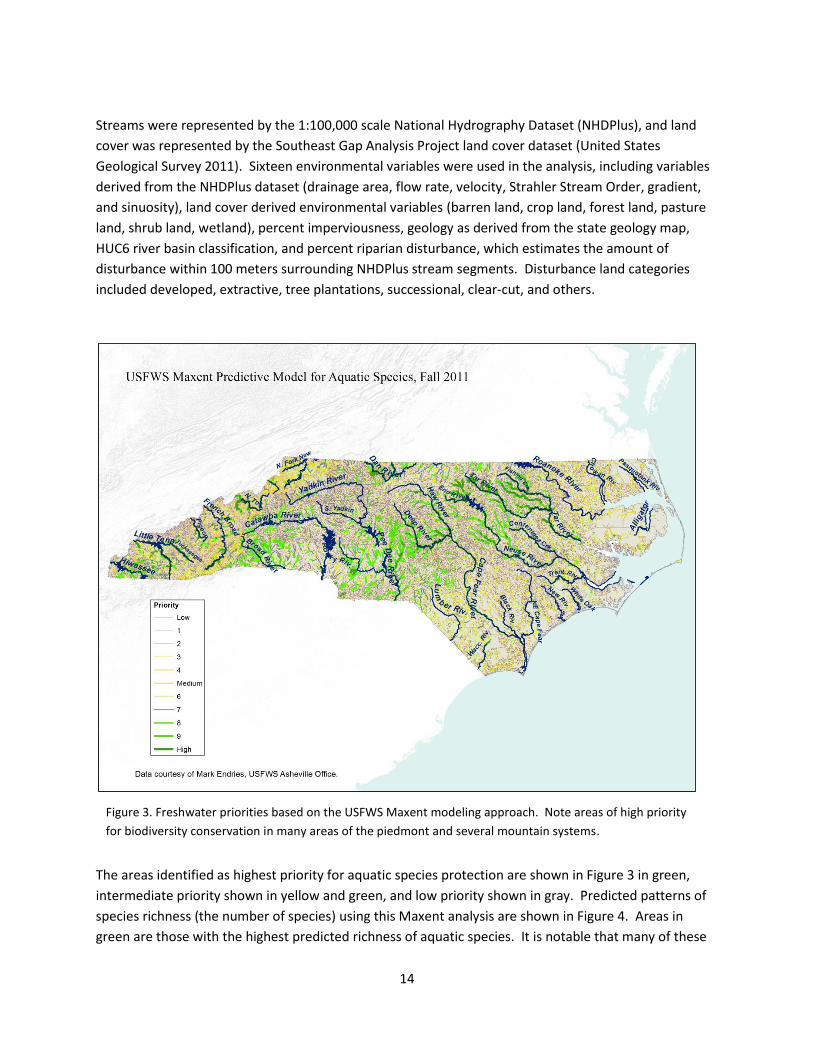
Streams were represented by the 1:100,000 scale National Hydrography Dataset (NHDPlus), and land
cover was represented by the Southeast Gap Analysis Project land cover dataset (United States
Geological Survey 2011). Sixteen environmental variables were used in the analysis, including variables
derived from the NHDPlus dataset (drainage area, flow rate, velocity, Strahler Stream Order, gradient,
and sinuosity), land cover derived environmental variables (barren land, crop land, forest land, pasture
land, shrub land, wetland), percent imperviousness, geology as derived from the state geology map,
HUC6 river basin classification, and percent riparian disturbance, which estimates the amount of
disturbance within 100 meters surrounding NHDPlus stream segments. Disturbance land categories
included developed, extractive, tree plantations, successional, clear-cut, and others.
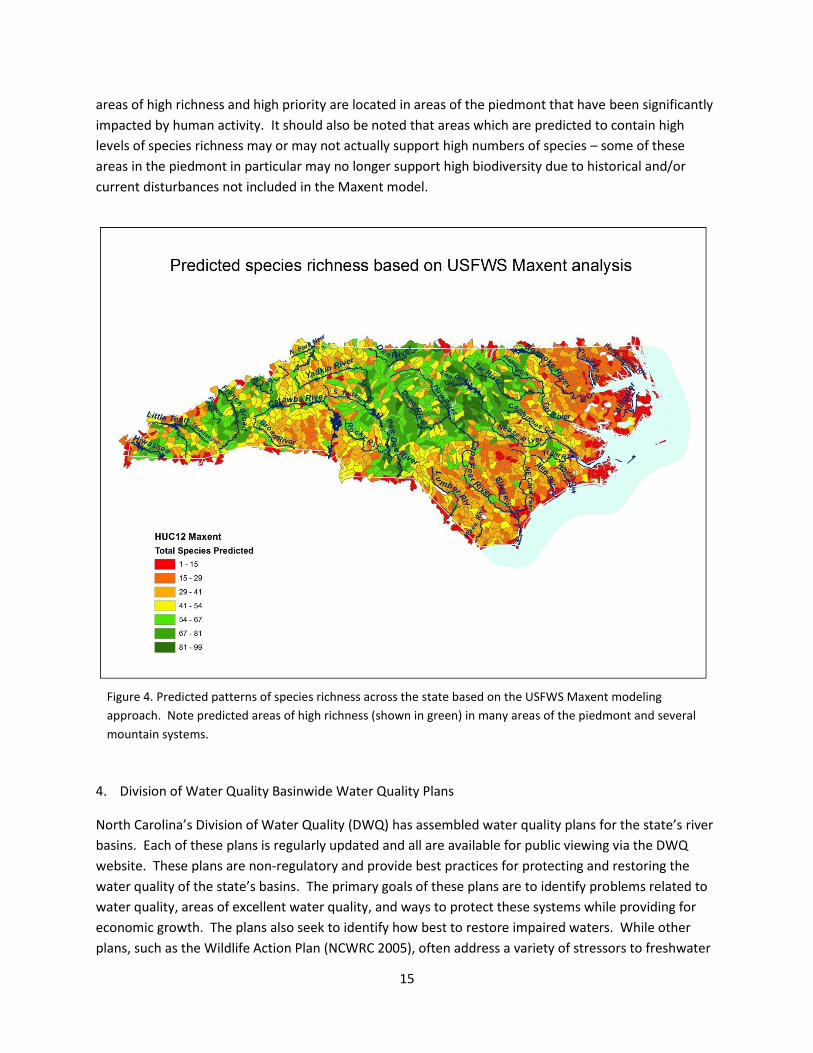
The areas identified as highest priority for aquatic species protection are shown in Figure 3 in green,
intermediate priority shown in yellow and green, and low priority shown in gray. Predicted patterns of
species richness (the number of species) using this Maxent analysis are shown in Figure 4. Areas in
green are those with the highest predicted richness of aquatic species. It is notable that many of these
Figure 3. Freshwater priorities based on the USFWS Maxent modeling approach. Note areas of high priority
for biodiversity conservation in many areas of the piedmont and several mountain systems.
15
areas of high richness and high priority are located in areas of the piedmont that have been significantly
impacted by human activity. It should also be noted that areas which are predicted to contain high
levels of species richness may or may not actually support high numbers of species – some of these
areas in the piedmont in particular may no longer support high biodiversity due to historical and/or
current disturbances not included in the Maxent model.
4. Division of Water Quality Basinwide Water Quality Plans
North Carolina’s Division of Water Quality (DWQ) has assembled water quality plans for the state’s river
basins. Each of these plans is regularly updated and all are available for public viewing via the DWQ
website. These plans are non-regulatory and provide best practices for protecting and restoring the
water quality of the state’s basins. The primary goals of these plans are to identify problems related to
water quality, areas of excellent water quality, and ways to protect these systems while providing for
economic growth. The plans also seek to identify how best to restore impaired waters. While other
plans, such as the Wildlife Action Plan (NCWRC 2005), often address a variety of stressors to freshwater
Figure 4. Predicted patterns of species richness across the state based on the USFWS Maxent modeling
approach. Note predicted areas of high richness (shown in green) in many areas of the piedmont and several
mountain systems.
16
systems, the DWQ Basinwide Plans specifically focus on issues related to water quality. These include
sedimentation, loss of instream vegetation and microhabitats, loss of riparian vegetation,
impoundments, channelization, levels of bacteria, chlorophyll, dissolved oxygen, pH, temperature and
turbidity, metals and other substances, as well as nutrients and effluents.
We reviewed each of the Basinwide Plans, and in later sections will refer to this information in our
description of the primary threats to water quality within the freshwater systems of the state’s basins,
and in identifying current initiatives to restore and protect water quality within each basin. Further,
each plan identifies the Outstanding Resource Waters and High Quality Waters found in each basin.
High Quality Waters are those rated as Excellent based on DWQ’s chemical and biological sampling, and
include streams designated as wild trout waters (formerly called native or special native trout waters) by
WRC, as well as waters designated as primary nursery areas or other functional nursery areas by the
Division of Marine Fisheries. Outstanding Resource Waters are those that include one or more of the
following: 1) an outstanding fisheries resource, 2) a high level of water-based recreation, 3) a special
designation such as National Wild and Scenic River or a National Wildlife Refuge, 4) are within a state or
national park or forest, or 5) have special ecological or scientific significance. Streams with these ratings
were incorporated into the Wildlife Action Plan, as well as into our original analyses described below.
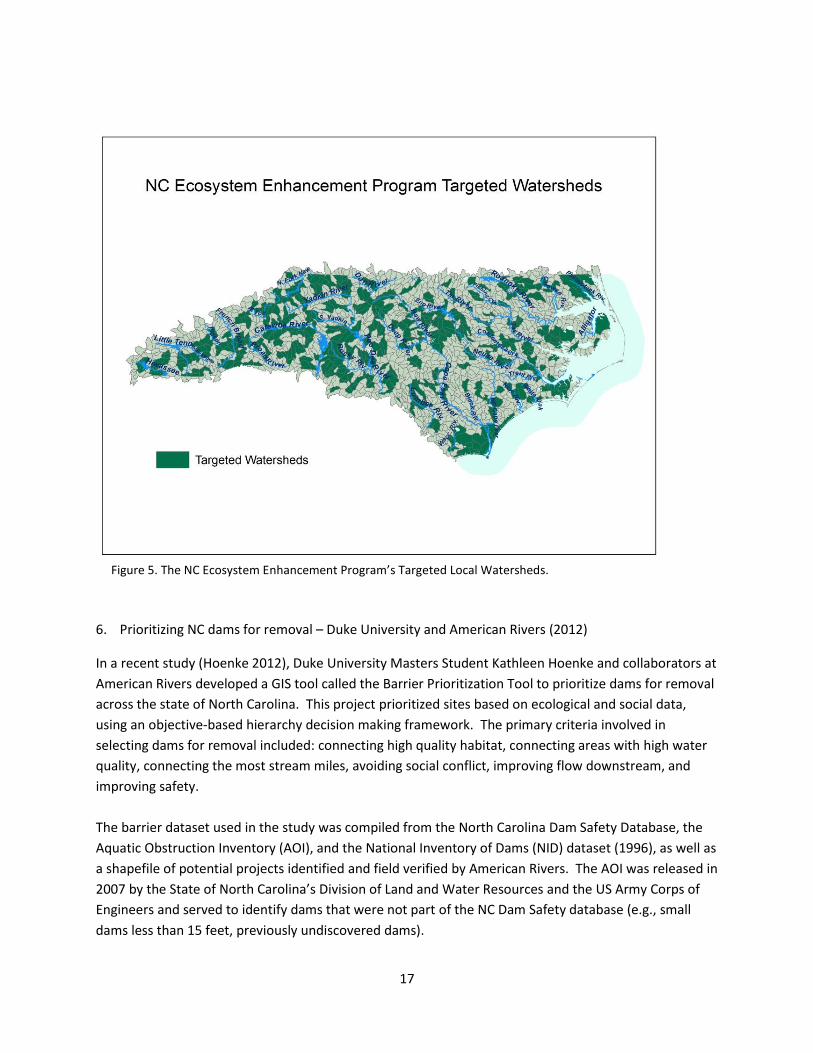
5. Ecosystem Enhancement Program Restoration Plan
North Carolina’s Ecosystem Enhancement Program (EEP) has assembled a restoration plan for each of
the state’s basins and sub-basins. These plans include an overview of the basin, identification of primary
stressors in each basin, and restoration goals. These goals represent specific recommendations for new
initiatives or continued support for ongoing work to restore each basin or sub-basin. They also list
Targeted Local Watersheds (TLW) within each basin, which are used to focus restoration efforts (and
dollars) of the EEP on opportunities specific to 14 digit HUCs. Selected priority TLWs are those that
“demonstrate a balance of challenges and assets, and that represent the best opportunity for watershed
improvement.” These TLWs are shown in Figure 5.
17
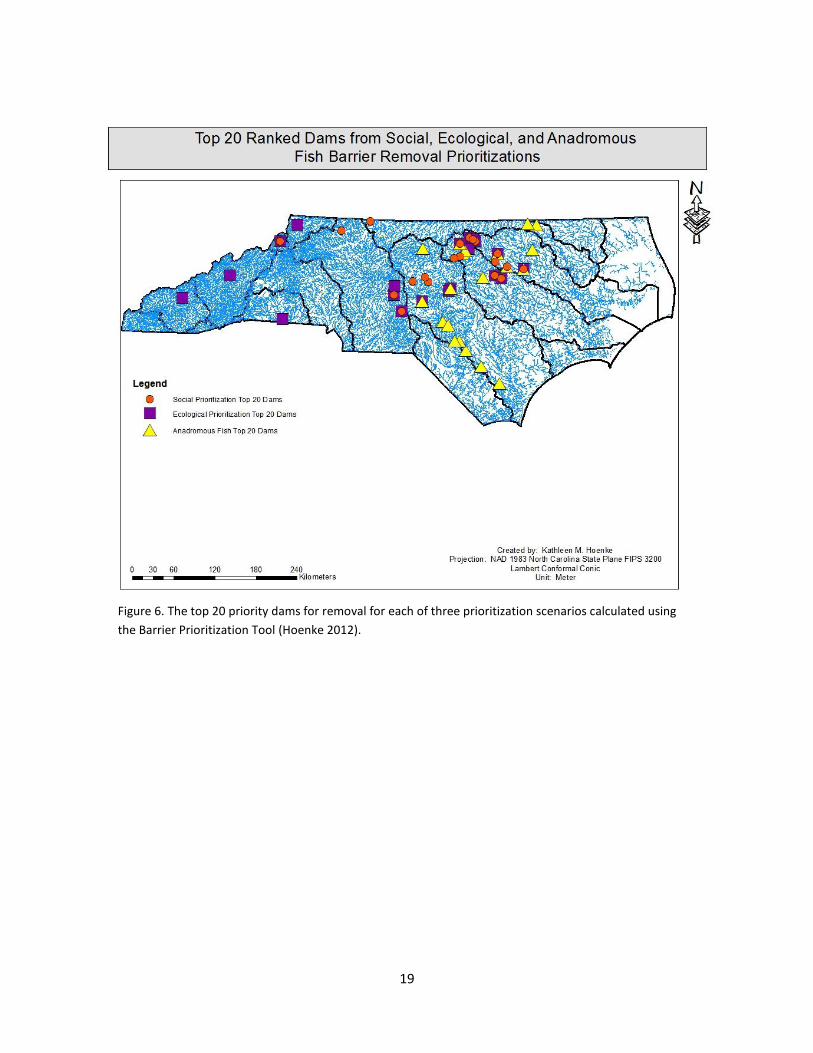
6. Prioritizing NC dams for removal – Duke University and American Rivers (2012)
In a recent study (Hoenke 2012), Duke University Masters Student Kathleen Hoenke and collaborators at
American Rivers developed a GIS tool called the Barrier Prioritization Tool to prioritize dams for removal
across the state of North Carolina. This project prioritized sites based on ecological and social data,
using an objective-based hierarchy decision making framework. The primary criteria involved in
selecting dams for removal included: connecting high quality habitat, connecting areas with high water
quality, connecting the most stream miles, avoiding social conflict, improving flow downstream, and
improving safety.
The barrier dataset used in the study was compiled from the North Carolina Dam Safety Database, the
Aquatic Obstruction Inventory (AOI), and the National Inventory of Dams (NID) dataset (1996), as well as
a shapefile of potential projects identified and field verified by American Rivers. The AOI was released in
2007 by the State of North Carolina’s Division of Land and Water Resources and the US Army Corps of
Engineers and served to identify dams that were not part of the NC Dam Safety database (e.g., small
dams less than 15 feet, previously undiscovered dams).
Figure 5. The NC Ecosystem Enhancement Program’s Targeted Local Watersheds.

18
Connectivity metrics, such as downstream and upstream barrier density, distance to mouth of river, and
functional upstream and downstream network length, were calculated using The Nature Conservancy’s
Barrier Assessment Tool (BAT) and methods were based in part on those used in The Nature
Conservancy’s Northeast Aquatic Connectivity Assessment Project
(http://rcngrants.org/content/northeast-aquatic-connectivity). The Barrier Prioritization Tool was
created in ArcGIS Model Builder and uses a series of add field and calculate field functions to create
criteria fields and a final rank field. Weights for different scenarios were then put into the model and
the tool calculated a rank for each dam. Three prioritizations were conducted as part of this project
specifically for American Rivers. These included: 1) a prioritization based solely on ecological criteria
(e.g., water quality, connectivity, presence of Aquatic Significant Natural Heritage Areas), 2) a
prioritization including both ecological and social criteria (e.g., patterns of land ownership, recreational
use, presence of mill ponds, safety ratings), and 3) a prioritization focusing on anadromous fish (e.g.,
distance to spawning areas, number of downstream dams, rates of flow).
This statewide study assesses one primary threat to freshwater systems – loss of linear connectivity –
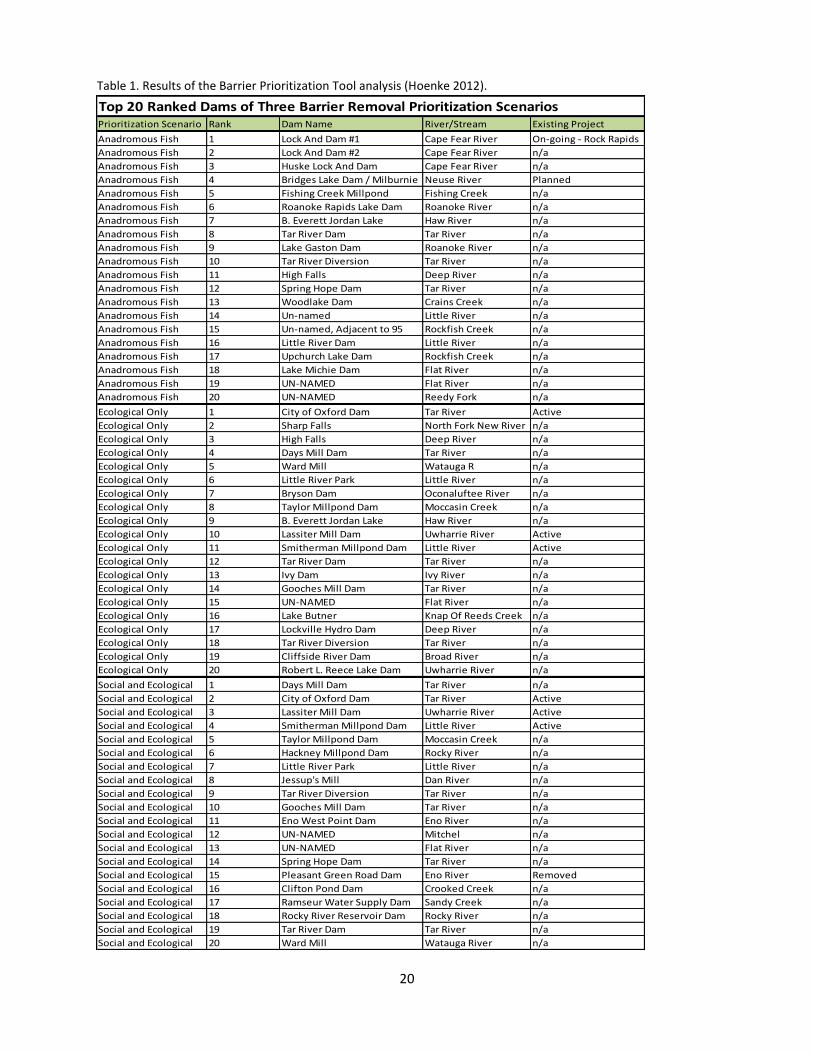
and identifies the best opportunities to restore connectivity through dam removal. In Figure 6 and Table
1 below, we show the dam removal priorities for each of the three scenarios based on the Barrier
Prioritization Tool. The top 20 dams prioritized for removal are shown. Note that these model results
do not provide the final word on whether a dam should or will be removed. Each dam will require
additional investigation to determine feasibility for removal or fish passage, including verification of the
dam's use/purpose and the land ownership. We will return to these findings when we discuss threats to
freshwater systems as well as restoration opportunities.
19
Figure 6. The top 20 priority dams for removal for each of three prioritization scenarios calculated using
the Barrier Prioritization Tool (Hoenke 2012).
20
Top 20 Ranked Dams of Three Barrier Removal Prioritization ScenariosPrioritization Scenario Rank Dam Name River/Stream Existing Project
Anadromous Fish 1 Lock And Dam #1 Cape Fear River On-going - Rock Rapids
Anadromous Fish 2 Lock And Dam #2 Cape Fear River n/a
Anadromous Fish 3 Huske Lock And Dam Cape Fear River n/a
Anadromous Fish 4 Bridges Lake Dam / Milburnie Neuse River Planned
Anadromous Fish 5 Fishing Creek Millpond Fishing Creek n/a
Anadromous Fish 6 Roanoke Rapids Lake Dam Roanoke River n/a
Anadromous Fish 7 B. Everett Jordan Lake Haw River n/a
Anadromous Fish 8 Tar River Dam Tar River n/a
Anadromous Fish 9 Lake Gaston Dam Roanoke River n/a
Anadromous Fish 10 Tar River Diversion Tar River n/a
Anadromous Fish 11 High Falls Deep River n/a
Anadromous Fish 12 Spring Hope Dam Tar River n/a
Anadromous Fish 13 Woodlake Dam Crains Creek n/a
Anadromous Fish 14 Un-named Little River n/a
Anadromous Fish 15 Un-named, Adjacent to 95 Rockfish Creek n/a
Anadromous Fish 16 Little River Dam Little River n/a
Anadromous Fish 17 Upchurch Lake Dam Rockfish Creek n/a
Anadromous Fish 18 Lake Michie Dam Flat River n/a
Anadromous Fish 19 UN-NAMED Flat River n/a
Anadromous Fish 20 UN-NAMED Reedy Fork n/a
Ecological Only 1 City of Oxford Dam Tar River Active
Ecological Only 2 Sharp Falls North Fork New River n/a
Ecological Only 3 High Falls Deep River n/a
Ecological Only 4 Days Mill Dam Tar River n/a
Ecological Only 5 Ward Mill Watauga R n/a
Ecological Only 6 Little River Park Little River n/a
Ecological Only 7 Bryson Dam Oconaluftee River n/a
Ecological Only 8 Taylor Millpond Dam Moccasin Creek n/a
Ecological Only 9 B. Everett Jordan Lake Haw River n/a
Ecological Only 10 Lassiter Mill Dam Uwharrie River Active
Ecological Only 11 Smitherman Millpond Dam Little River Active
Ecological Only 12 Tar River Dam Tar River n/a
Ecological Only 13 Ivy Dam Ivy River n/a
Ecological Only 14 Gooches Mill Dam Tar River n/a
Ecological Only 15 UN-NAMED Flat River n/a
Ecological Only 16 Lake Butner Knap Of Reeds Creek n/a
Ecological Only 17 Lockville Hydro Dam Deep River n/a
Ecological Only 18 Tar River Diversion Tar River n/a
Ecological Only 19 Cliffside River Dam Broad River n/a
Ecological Only 20 Robert L. Reece Lake Dam Uwharrie River n/a
Social and Ecological 1 Days Mill Dam Tar River n/a
Social and Ecological 2 City of Oxford Dam Tar River Active
Social and Ecological 3 Lassiter Mill Dam Uwharrie River Active
Social and Ecological 4 Smitherman Millpond Dam Little River Active
Social and Ecological 5 Taylor Millpond Dam Moccasin Creek n/a
Social and Ecological 6 Hackney Millpond Dam Rocky River n/a
Social and Ecological 7 Little River Park Little River n/a
Social and Ecological 8 Jessup's Mill Dan River n/a
Social and Ecological 9 Tar River Diversion Tar River n/a
Social and Ecological 10 Gooches Mill Dam Tar River n/a
Social and Ecological 11 Eno West Point Dam Eno River n/a
Social and Ecological 12 UN-NAMED Mitchel n/a
Social and Ecological 13 UN-NAMED Flat River n/a
Social and Ecological 14 Spring Hope Dam Tar River n/a
Social and Ecological 15 Pleasant Green Road Dam Eno River Removed
Social and Ecological 16 Clifton Pond Dam Crooked Creek n/a
Social and Ecological 17 Ramseur Water Supply Dam Sandy Creek n/a
Social and Ecological 18 Rocky River Reservoir Dam Rocky River n/a
Social and Ecological 19 Tar River Dam Tar River n/a
Social and Ecological 20 Ward Mill Watauga River n/a
Table 1. Results of the Barrier Prioritization Tool analysis (Hoenke 2012).
21
Comparing statewide assessments
In the statewide assessments (Smith et al. 2002, NCWRC 2005, Endries 2011) that focused on mapping
patterns of biodiversity distribution, we found many areas of agreement, particularly in the mountains
and piedmont. Each identified parts of the Hiwassee River, the Little Tennessee River, the Tuckasegee
River, the Pigeon River, and the Cane and Toe Rivers as top freshwater conservation priorities in the
mountains. The Wildlife Action Plan additionally included the New River headwaters as a high priority,
though the TNC 2002 and USFWS Maxent assessments did not. In the piedmont, all assessments agreed
that the top priorities included the Dan River, Fishing Creek, the upper Tar River, the Eno River, the Deep
River, parts of the Haw River, and portions of the Pee Dee River. The primary area of difference
observed among the statewide assessments was found in the coastal plain, and most distinctly in the
Southeastern portion of the state. While the 2002 TNC report and the Wildlife Action Plan identified
significant portions of the Lumber River, the lower Cape Fear River, the Black River, and the Trent and
White Oak Rivers as high priority, the USFWS Maxent analysis did not. Similarly, the 2002 TNC report
and the Wildlife Action Plan identified the Roanoke River and Cashie Rivers in the northeastern portion
of the state as high priority, but the USFWS Maxent analysis did not. These differences are likely largely
due to the fact that for the Maxent analysis most of the Roanoke and Cashie Rivers, as well as many
coastal rivers in the southeastern portion of the state, were excluded from the analysis because some of
the environmental variables needed were not available in the NHDPlus dataset. The author of the
Maxent report presumes that this lack of information is due to the tidal influence in these coastal
regions, and acknowledged that the effect was likely to decrease scores in some of the coastal areas of
the state (M. Endries, pers. comm.).
Interpreting differences
Though we found similarities in several of the statewide assessments, as previously mentioned, there
were also differences between identified priorities. These differences appear to result in large part from
variation in methodology and/or variation in the focus of each of the studies. For example, each study
focused on different sets of species and communities, on different elements of the condition of the
surrounding landscape (or did not include condition at all), and many used different scales of analysis.
Some assessments were conducted at the scale of a single basin or sub-basin, while others were
conducted for a larger portion of North Carolina or the whole state. For these reasons, we must be
cautious not to over-interpret areas of divergence in the priorities resulting from these assessments and
instead focus on areas of agreement.
Putting the pieces together
Each of these studies offers incredibly important information on a variety of fronts, from the distribution
of conservation targets across the state, to the condition of habitat for freshwater organisms, to system
threats and opportunities for restoration and preservation. We have only represented a fraction of the
valuable information contained in each of these works. In spite of this wealth of data, however, we did
not find a comprehensive statewide analysis that merged information on the distribution of freshwater
organisms with information on the conditions of the lands and waters on which they depend, to
22
generate a set of priorities for protection and restoration. As such, we decided it imperative to conduct
an analysis of this type as part of our current assessment, and our methods and results are described
below.
Novel analysis of freshwater targets, condition, and priorities
The efforts described above provide much useful information on the distribution of conservation targets
as well as on the threats facing these targets in North Carolina. However, our ultimate aim is to identify
priorities for conservation efforts, and to do this it is important to combine information on the
distribution of targets with the condition of the area surrounding the targets. This approach allows us to
begin to evaluate the functionality of these systems, and therefore can be considered a watershed
condition-based analysis. To accomplish this connection of condition and distribution, and to build upon
the work previously conducted by TNC and others as described above, we conducted a novel analysis
that gives us a picture of where the prime opportunities are for freshwater preservation, restoration,
and where further investigation is needed.
In addition to the primary goal of identifying areas for freshwater preservation, restoration and future
investigation, we aim to provide information useful by a diverse set of NC freshwater conservation
stakeholders in ways that are easy to interpret and use. For this reason, we will present data on each
component of our analysis separately, and then will describe our findings for the combined set of data.
Different users may be more interested in one particular component; for example, where the priorities
are for restoring stream flow conditions in high-biodiversity locations. In providing each component
separately, we enable others to use the data in ways that are most informative to them.
Our analyses were carried out at multiple spatial scales, in an effort to inform conservation activities
that inevitably take place at very local scales and yet are part of a larger functional landscape. We
focused our analyses at two primary spatial scales: the HUC12 and HUC8. HUC12s are small-scale units
comprised of a group of local catchments, and average 21,000 acres in size. There are 1,725 HUC12s in
North Carolina, so this analysis allows us to assess patterns of distribution and condition at a fairly fine
scale. HUC8s are collections of HUC12s, averaging 930,000 acres. There are 56 HUC8s in North Carolina,
which gives us a coarser view of patterns across the state, but is more helpful in identifying broad
patterns with regional significance. For these analyses, we present in the main body of the report
results from the HUC12 scale analysis and provide maps and values for the HUC8 scale analysis in the
Supplemental Information and electronic materials. We gathered data from all HUC12s that are
included entirely or partially within the borders of the state of North Carolina. For HUC12s that spanned
the border of North Carolina and another state (VA, TN, GA, SC), when data permitted, we included data
from both North Carolina and the bordering state. For the data on conservation targets calculated using
the Conservation Planning Tool and for the data on the Active River Area, data were limited to the state
of North Carolina.
23
We quantified the distribution of freshwater targets using data from the NC Natural Heritage Program’s
Conservation Planning Tool. Using other datasets, we also assessed variation in the condition of
freshwater systems in four ways. These included quantifying: 1) land cover within the entire HUC, 2)
land cover within the Active River Area – the portion of the terrestrial environment that regularly
interacts with the aquatic environment, 3) flow alteration, and 4) barriers to movement of aquatic
organisms, including barrier density and road crossing density. Each of the methods and results from
these analyses are described in detail below.
To standardize the values for these attributes, which is critical for comparison across different data sets
and different geographies, we took several steps. First, for each attribute, we tested for a normal
distribution. If values of the attribute were not normally distributed, we used the appropriate
transformation (typically natural log or log10) so that the attribute adhered to assumptions of normality.
We then calculated z-scores for each attribute. Z-scores are a standardization process that identifies
each value of an attribute as a certain number of standard deviations below or above the mean of the
group. For example, if a HUC12 in the vicinity of Wilmington had a z-score of +2 for the road crossings
data set, this would indicate that this location had a much higher road crossing density than most other
HUCs in the state, and to be precise, that this HUC was 2 standard deviations above the mean for road
crossing density when compared with all other HUCs. Z-scores were calculated for the data on target
distributions as well as for the condition attributes. Use of z-scores provides a standardized comparison
within the range of existing conditions, and does not compare observed values against a hypothetical
unaltered condition. As a result, the “best” locations for condition metrics such as road crossing density,
are not untouched (e.g., roadless) areas, but are those that ranked the highest when compared with all
other HUCs. Though rare, observed z-scores sometimes exceeded 3 standard deviations above or below
the mean. These outliers were truncated to a score of ± 3.0 (3 standard deviations from the mean) to
avoid the potential for these values to strongly bias interpretation of overall patterns.
First, we calculated z-scores by comparing all HUCs across the state, and these are the primary results
discussed in this report. For all figures within the main text of this report, we show the results of the
statewide comparisons. We also parsed the HUCs into ecoregions (coastal plain, piedmont and
mountains), and computed z-scores for HUCs within each ecoregion. This geographic parsing allows us a
better view of the “best places in the coastal plain,” for example. This standardization procedure was
also carried out for each basin, to identify the priority locations within each basin. Please see the
Supplemental Material for maps based on ecoregional comparisons, and the electronic database for
basin comparisons (information on accessing this information electronically is provided at the end of this
report).
24
Identifying the distribution of conservation targets using the Conservation
Planning Tool
We partnered with the Department of Environment and Natural Resources’ Natural Heritage Program
(NHP) to generate data on the distribution of conservation targets across North Carolina. To do this, we
worked with NHP’s Conservation Planning Tool (CPT), specifically with the Biodiversity/Wildlife Habitat
Assessment module. In brief, every 30 x 30 meter grid cell across the state is assigned a score from 1-10
for each of a variety of components (described below). These components describe known locations of
species of conservation interest as well as information about important community/habitat types. To
generate the raster data used in our analysis, the CPT then assigned each 30 x 30 meter cell with a final
score that represents the highest score of any of the components for a given cell. For example, if the
highest score assigned to a given grid cell was a five because of a reported Element Occurrence, and all
other components scored below a five, that grid cell was assigned a final value of five. The scores for all
30 meter grid cells within each HUC12 and HUC8 that had a CPT value of greater than zero were
averaged to yield the CPT score for that HUC unit.
The components included in this analysis were a subset selected from the full set of CPT data, and were
chosen based on their relevance to freshwater ecosystems. We provide a brief description here, and
further details can be found in Appendix 1, or in the CPT materials located online at
http://www.onencnaturally.org/pages/ConservationPlanningTool.html. The scores described below are
relative, and are based on many factors, which are fully described in Chapter 4 of the CPT online
materials. If a grid cell did not have any of the components below represented within it, but was
contained within an aquatic system, it was assigned a score of one. This distinguished these cells from
terrestrial cells, which scored a zero if they did not contain any of the components listed below.
Aquatic Significant Natural Heritage Areas (ASNHAs): ASNHAs are designated by NHP. Those of
national or state significance were given a score of 10, those with regional significance a value of 8, and
those with local significance a score of 6.
Element occurrences (EOs): These scores were based on NHP data for all aquatic species except those
with an EO ranking of X, F, H, or D, those that were last observed more than 30 years ago, or those with
an accuracy rating of very low or low. Species included in this analysis are listed in Appendix 2. An EO
rank of X indicates that the EO is known to have been destroyed, a rank of F indicates the EO failed to be
found during recent surveys, a rank of H indicates that there is no recent survey data on the occurrence,
and a rank of D indicates the EO has a poor chance of persisting for an extended period. Cells with a
reported EO meeting the criteria above were given a score of 5 for high ranking species, and a 4 for
other species (see Appendix 1).
Wetlands: Data from the North Carolina Coastal Region Evaluation of Wetland Systems (NC-CREWS)
and the National Wetlands Inventory (NWI) were used to identify important wetland systems. NC-
CREWS wetlands with exceptional ranking were scored a 7, those with substantial ranking were scored a
6, and those with beneficial ranking scored a 2. The NWI sites were scored a 5.
25
Guilds: Landscape Habitat Indicator Guilds were established by NHP with the intent of identifying high
quality examples of natural communities that can serve as a coarse filter for species about which little is
known (such as many invertebrates). Mapped guilds represent high quality and/or rare, unfragmented
habitat based on the occurrence of indicator species and digitized aerial photography. More
information on this process can be found in the CPT’s online documentation, particularly in Chapter 4
and Appendix D. Each guild in an individual location was scored from 1-10. Guild scores were included
for all cells within a 300 foot buffer of all rivers and streams, but were not evaluated outside of this area
to ensure a strong focus on riparian biota.
In-stream community assemblages: Data was obtained from the Division of Water Quality’s stream
surveys which seek to quantify invertebrate and select vertebrate community composition to identify
those systems with high water quality (e.g., those with diverse assemblages of native fauna). These
data were then used to assign BioClass rankings and to inform designations of Outstanding Resource
Waters and High Quality Waters. Outstanding Resource Waters were assigned a score of 10, DWQ
Stream BioClass rankings of excellent were assigned a score of 9, High Quality Waters a score of 8, DWQ
Stream BioClass rankings of Good a score of 7, and all other streams were assigned a value of 1.
Fish Habitat and Nursery Areas: Important fish habitat was identified in several ways. Locations with
known occurrences of Wild Brook Trout were obtained from the NC Wildlife Resources Commission, and
were scored a 9. Locations of known Anadromous Fish Spawning Areas (AFSAs) were identified from NC
Division of Marine Fisheries (DMF) records, and were given a score of 8. Fish Nursery Areas (FNAs) were
likewise identified by DMF and were given a score of 8. Submerged Aquatic Vegetation (SAV) provides
important shelter and foraging areas for many species, so inland stream areas with SAV were identified
by DMF, and were scored a 6.
Important watersheds: Important watersheds were identified by NHP as those containing federally
listed threatened or endangered species, or those draining to locations with EOs of threatened and
endangered species. Locations meeting these qualifications were scored a 7. Additionally, locations
within watersheds that had previously been identified by NHP (e.g., those draining to ASNHAs) or others
(NCWRC 2005, Smith et al. 2002) in statewide assessments of freshwater conservation priorities were
scored a 3.
Results
After averaging the values of each 30 meter grid cell across each HUC12, and computing the z-scores for
all HUCs across the state of North Carolina, we found considerable differences in the distribution and
value of freshwater conservation targets (see Figure 7). We also compared HUCs within each ecoregion,
to identify areas with higher than average scores when compared with others in its ecoregion (e.g., the
piedmont). See the Supplemental Information at the end of this report for ecoregional comparisons and
for statewide patterns shown at the HUC8 scale. For each of the following figures, green HUCs are those
with Excellent to Good scores, when compared with other HUCs across the state. Average scores are
shown in yellow, and below average in orange and red.
26
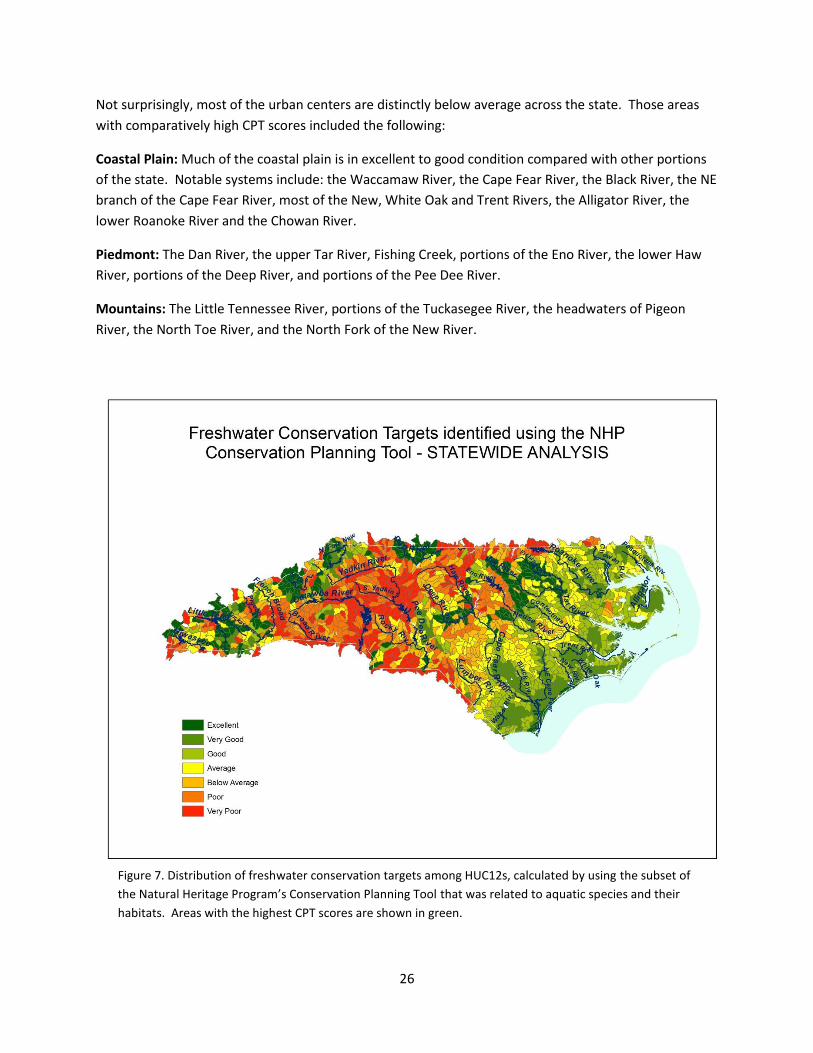
Not surprisingly, most of the urban centers are distinctly below average across the state. Those areas
with comparatively high CPT scores included the following:
Coastal Plain: Much of the coastal plain is in excellent to good condition compared with other portions
of the state. Notable systems include: the Waccamaw River, the Cape Fear River, the Black River, the NE
branch of the Cape Fear River, most of the New, White Oak and Trent Rivers, the Alligator River, the
lower Roanoke River and the Chowan River.
Piedmont: The Dan River, the upper Tar River, Fishing Creek, portions of the Eno River, the lower Haw
River, portions of the Deep River, and portions of the Pee Dee River.
Mountains: The Little Tennessee River, portions of the Tuckasegee River, the headwaters of Pigeon
River, the North Toe River, and the North Fork of the New River.
Figure 7. Distribution of freshwater conservation targets among HUC12s, calculated by using the subset of
the Natural Heritage Program’s Conservation Planning Tool that was related to aquatic species and their
habitats. Areas with the highest CPT scores are shown in green.
27
Identifying watershed condition
We quantified the condition of each HUC in a variety of ways, to capture the primary components of the
landscape and waters that are likely to impact freshwater biota. These attributes included land cover
within the surrounding watershed and within the Active River Area (ARA; see below for detailed
description), flow alteration, and dam density and road crossing density. Each of these attributes was
assessed at the HUC12 and HUC8 scales (with the exception of dam density, which was assessed only at
the HUC8 scale as many HUC12s had no dams and therefore meaningful comparison across a range of
values was limited). Values were combined to yield an overall condition rating. Below, we present our
findings for each of these attributes, and for the combined condition rating, based on comparing all
HUCs across the entire state. In the Supplemental Information we also provide maps showing the
results for the analyses when HUCs are only compared with others in their ecoregion (e.g., coastal
plain). This gives an estimate of the best (and worst) locations within an ecoregion. We also calculated
several attributes that we decided not to use in our overall condition rating because of concerns
regarding data quality or redundancy with our primary condition attributes. These include patterns of
water use across the state, rates of land cover change, and the patchiness of natural cover within the
Active River Area. It should be noted that conditions upstream can have impacts on conditions
downstream, and with the exception of flow alteration, these are not explicitly incorporated into our
analysis. We describe the methods used in each of these assessments below, and provide the data,
summarized at the HUC12 scale, in the electronic materials.
Land cover within the surrounding watershed
Our primary goal with this attribute was to capture the departure from natural land cover of each HUC.
The closer to natural conditions, the better the condition of freshwater systems within a particular HUC
is likely to be. It has been well-documented that non-natural land cover, and in particular impervious
surface, is strongly correlated with declines in water quality and consequently biotic integrity (Weijters
et al. 2009, Sala et al. 2000, Miller et al. 1989). Here, we sought to assess patterns of land cover at a
fairly large scale – for the entire HUC. We also assessed patterns of land cover within the Active River
Area, a more narrowly defined area flanking each stream reach. The Active River Area analysis is
detailed in a later section.
To assess land cover across the HUC, we used land cover data from the 2006 National Land Cover
Dataset, at the scale of 30 meter grid cells. Each grid cell within the NLCD data was assigned a land
cover type (e.g., mixed forest, pasture, etc.), and we grouped these types into four major categories:
natural (including NLCD designations of open water, deciduous, mixed and evergreen forest, shrub
scrub, herbaceous and wetlands), agriculture (including hay, pasture and cultivated crop designations),
light development (low and medium intensity development designations) and heavy development (high
intensity development designation). Each cell was classified based on the predominant land cover type
in that cell. In addition, we parsed industrial forests from the natural forest cover by consulting
statewide parcel data and selecting industrial forest landowners. These forests are predominantly
loblolly pine monocultures, and represent significant departure from natural conditions in species
composition.
28
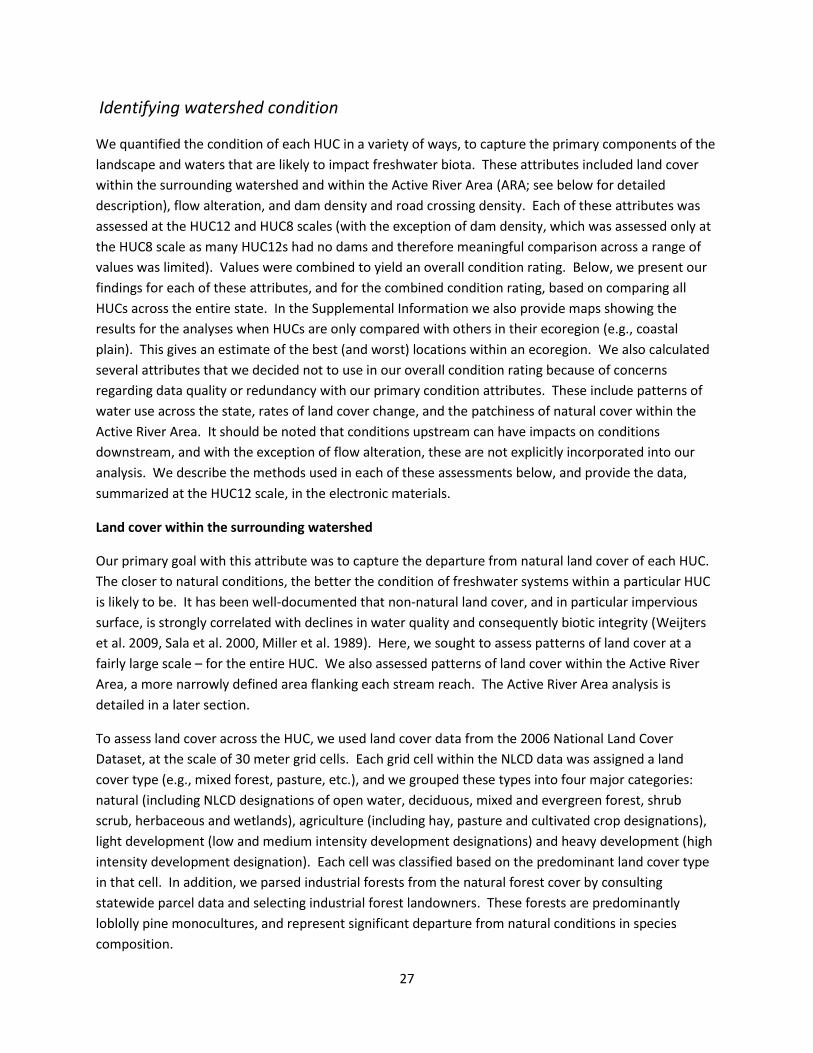
This yielded a total of five categories of land cover type. Each category was assigned a numerical value
to indicate relative departure from natural conditions. Natural land cover was given a value of 0.0,
industrial forests 0.1, agriculture 0.25, light development 0.5, and heavy development 1.0. The
designation of “light” versus “heavy” development was taken from the NLCD 2006 designations for
these land cover types. The scoring system we used was based on previous work by The Nature
Conservancy to document watershed condition in the Northeast and Mid-Atlantic regions of the United
States and was refined based on expert opinion. This allowed us to compute a single dataset that
quantified departure from natural conditions that took into account each of these land cover types.
Once each grid cell was assigned a numeric value, we averaged the values for each HUC to generate a
single departure from natural value for the HUC. These values were then transformed and standardized
using the z-score method described above. For this and all analyses, low z-scores indicate areas of
better than average condition, and high z-scores indicate areas of worse than average condition. Figure
8 shows the results of this analysis, with clear patterns of land cover differences across the state.
Figure 8. Departure from natural land cover for HUC12s across North Carolina. Areas in green indicate those
closest to natural land cover conditions, and those in red are the most altered.
29
Land cover within the Active River Area
In addition to the analysis of land cover over the entire HUC, we assessed patterns of land cover within
the Active River Area. In this analysis, we focused on natural cover only, assuming that different types
of non-natural cover that are within the Active River Area and consequently regularly interacting with
the freshwater systems directly have a similar negative impact. Below we describe the Active River Area
framework, developed by The Nature Conservancy, as well as our specific methods for this portion of
the study.
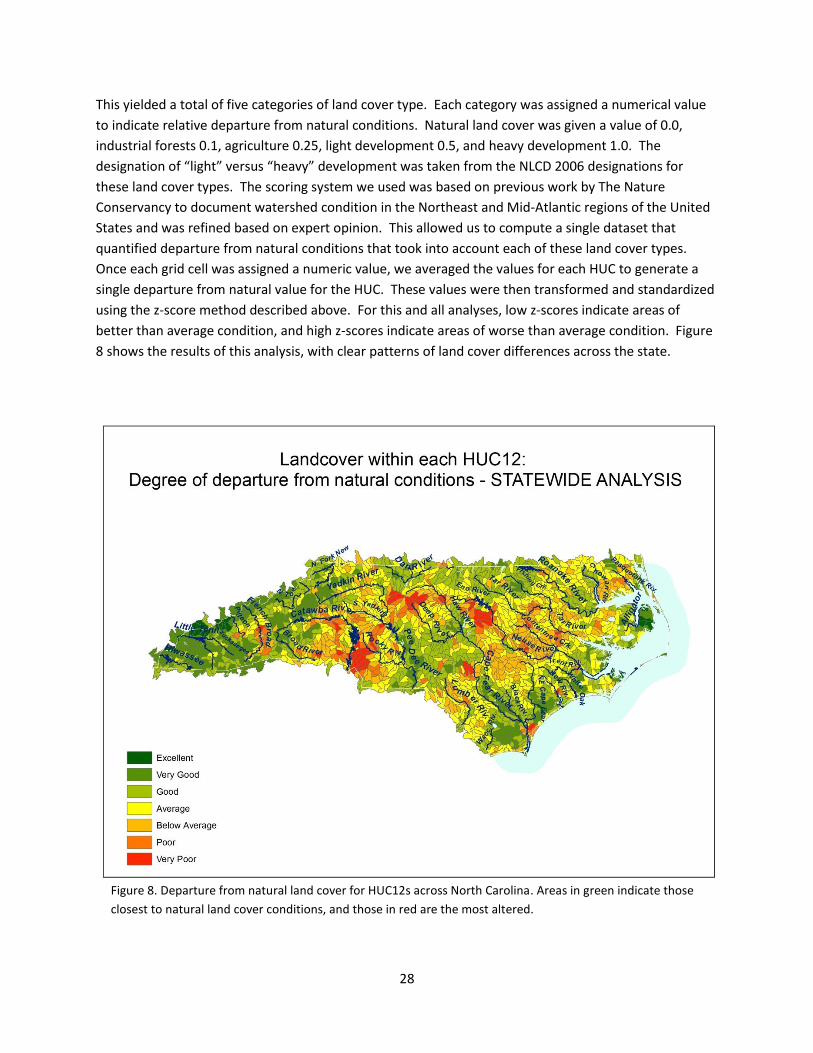
Active River Area – General description: The Active River Area (ARA) conservation framework provides a
conceptual and spatially explicit basis for the assessment, protection, management, and restoration of
freshwater and riparian ecosystems. The ARA framework is based upon dominant processes and
disturbance regimes to identify areas within which important physical and ecological processes of the
river or stream occur (Smith et al. 2008, and very similar to the definition for “riparian” as defined by the
National Research Council (2002). The framework identifies five key subcomponents of the active river
area: 1) material contribution zones, 2) meander belts, 3) riparian wetlands, 4) floodplains and 5)
terraces (Figure 9). These areas are defined by the major physical and ecological processes associated
and explained in the context of the continuum from the upper, mid and lower watershed (Smith et al.
2008). The framework provides a spatially explicit manner for accommodating the natural ranges of
Figure 9. The Active River Area. From Smith et al. 2008.
30
variability to system hydrology, sediment transport, processing and transport of organic materials, and
key biotic interactions.
GIS techniques allow delineation of the ARA using readily available spatial data including a Digital
Elevation Model (DEM), stream hydrography, and ancillary data such as wetlands and soils. A slope grid
is first generated from the DEM and then a cost distance surface is created to model how far water is
likely to travel from a stream based on the surrounding topography and the size of the stream (i.e.,
larger river will have more flooding power than a small stream). The cost distance output is thresholded
to create a riparian base zone that is generally calibrated to approximate the FEMA 100-year floodplain,
but may extend beyond this area as FEMA floodplain maps consider flood control infrastructure. The
base riparian zone is expected to include the meander belts, riparian wetlands, 100-year floodplains,
and lower terraces, but these components are generally not distinguished due to data resolution
limitations. An additional 90-m buffer on each side of the input stream cells is generated for those
streams and rivers that do not already have a base riparian zone. This buffer area is referred to as the
material contribution zone and is expected to include additional near stream habitat that is at a higher
slope than the base riparian zone. While this area may be less subject to overbank flows, it plays an
important role in riverine processes through the provision of habitat, shading, nutrients, sediment, and
woody debris inputs. The ARA riparian base zone and the riparian material contribution zone are often
further mapped as occurring on either “wetflats” or “non-wetflat” landforms, with longer-term
floodwater storage expected for those areas identified as wetflats. As a conservation zone, the ARA
Riparian zone seeks to represent the more natural state of river processes and thus an even larger
potential zone of influence/extent around all rivers and streams.
The ARA delineation and conceptual framework can be used to inform conservation planning, the
establishment of protected area networks, the development and implementation of management
policies and programs, and river restoration projects. Protection of the ARA provides benefits to aquatic
and terrestrial species that rely on instream, riparian and floodplain habitat to carry out their life cycles.
An intact ARA also offers a wide range of benefits to society including the reduction of flood and erosion
hazards, protecting water quality, and providing the many subsistence, commercial, recreational and
economic benefits associated with healthy freshwater systems. For a detailed description of the ARA
including examples, please refer to Smith et al. 2008, which can be downloaded at the following web
site: http://conserveonline.org/workspaces/freshwaterbooks/documents/active-river-area-a-
conservation-framework-for/view.html
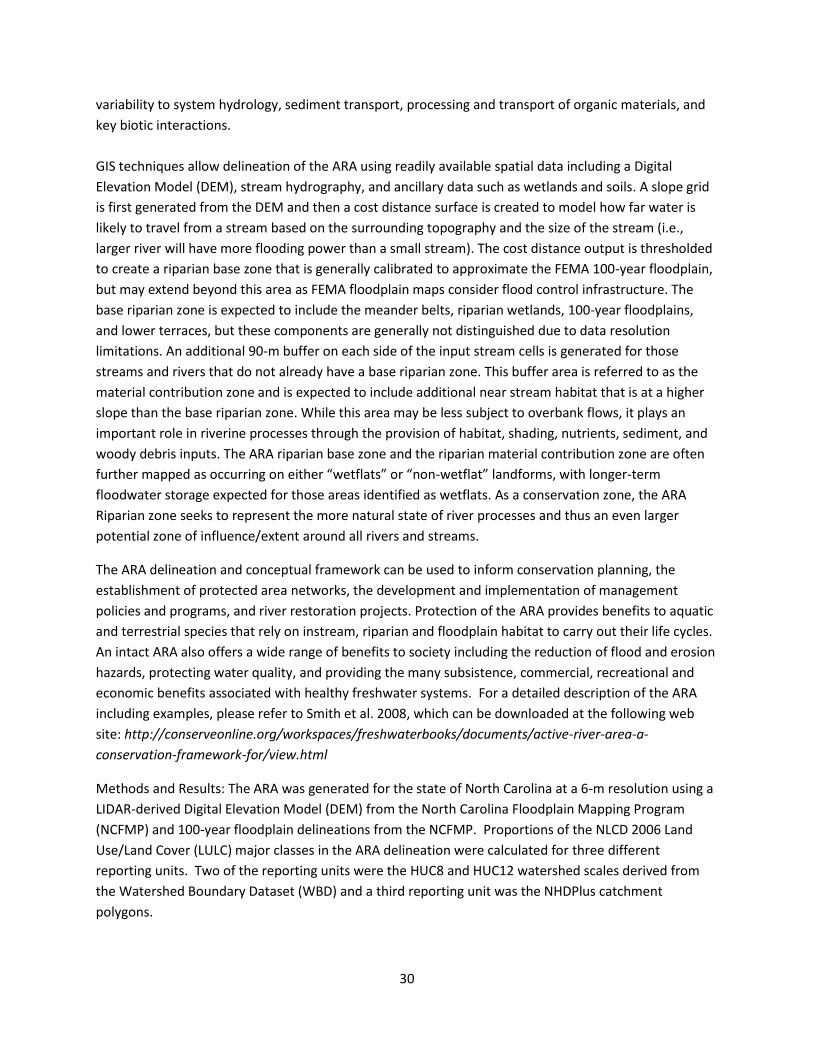
Methods and Results: The ARA was generated for the state of North Carolina at a 6-m resolution using a
LIDAR-derived Digital Elevation Model (DEM) from the North Carolina Floodplain Mapping Program
(NCFMP) and 100-year floodplain delineations from the NCFMP. Proportions of the NLCD 2006 Land
Use/Land Cover (LULC) major classes in the ARA delineation were calculated for three different
reporting units. Two of the reporting units were the HUC8 and HUC12 watershed scales derived from
the Watershed Boundary Dataset (WBD) and a third reporting unit was the NHDPlus catchment
polygons.
31
The ARA was delineated and then combined with the North Carolina Floodplain Mapping Program
(NCFMP) 100-year floodplain data to create the North Carolina Active River Area delineation. Details on
the delineation of the NC-ARA can be found in Appendix 3. A grid of the 2006 NLCD 30-m raster data re-
classed into seven major land use types was obtained from TNC’s North Carolina Field Office. The NLCD
grid was then re-sampled to a 6-m resolution and snapped to the 6-m ARA raster grid. The re-sampled
NLCD 2006 grid was then extracted by the ARA grid. The ARA area of each major land cover class was
calculated for each HUC. The percentage of each land cover type within the ARA was then calculated for
each HUC. See Figure 10 for a visual representation of this process. Values for all land cover types are
reported in the electronic supplemental materials; however, the score used for our analysis of condition
focused on natural cover only. From this data, we assessed normality and found that no transformation
was needed, so z-scores were directly computed from the data (see Figure 11 for results).
Figure 10. Calculations of land cover within the Active River Area.
32
Flow alteration due to dams
The degree of flow alteration a system experiences can have a dramatic impact on in-stream biota and
system function. To gauge this component of condition, we obtained data from the Southeast Aquatic
Resources Partnership (SARP), in which they developed a proxy for flow alteration that was based on the
extent of lake/reservoir acreage within and upstream of each catchment in the NHDPlus dataset. The
percent waterbody area was used as a proxy for flow alteration since most lakes in the Southeast are
not natural and represent a reservoir or impoundment of some type. Estimates of flow alteration that
include assessment of differences in current versus historic flow regimes would be a more accurate way
of quantifying this aspect of watershed condition. However, this information was not available at the
time of our analysis.
SARP used the NHDPlus high resolution waterbody data and pulled out the lakes/ponds and reservoirs
polygons, after taking into account a coastal exclusion zone where natural lakes are likely to occur as
well as excluding all known natural lakes in North Carolina. The area of the NHDPlus catchment that was
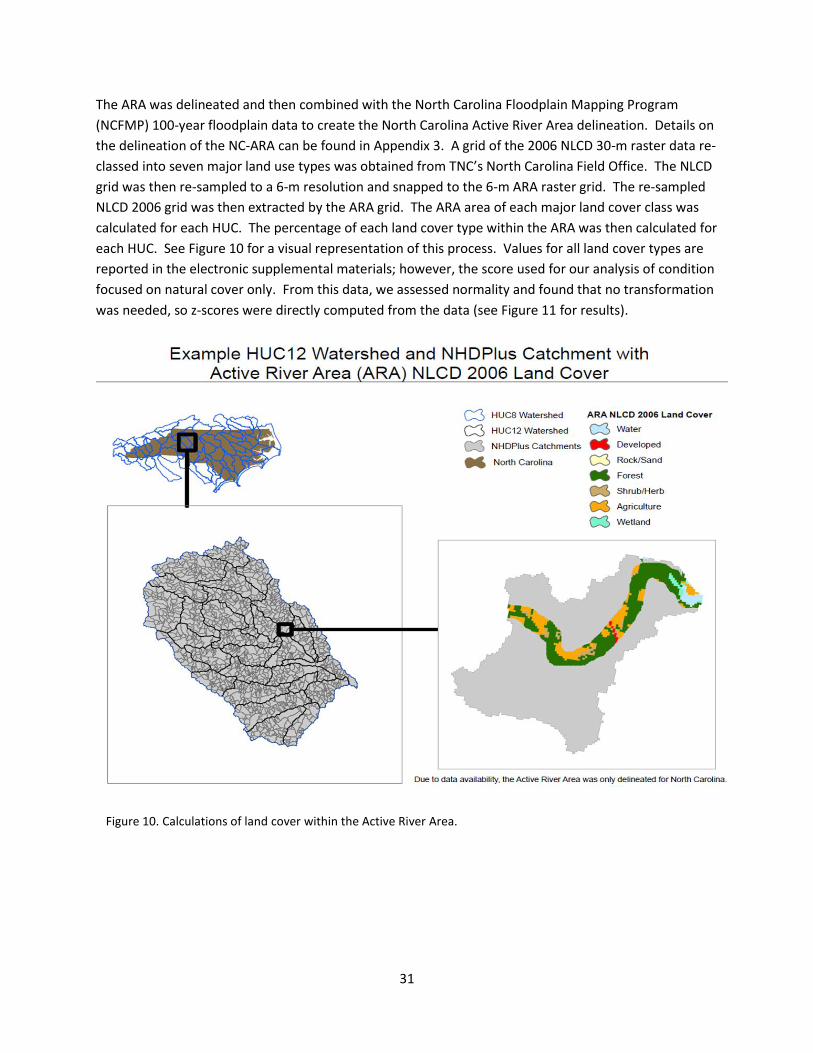
Figure 11. Natural land cover within the Active River Area at the HUC12 scale. Areas with the highest proportion
of natural land cover within the ARA are shown in green.
33
comprised of these waterbody polygons was calculated and then the area of the entire upstream
network (i.e., network catchment) that was comprised of these waterbody polygons was calculated.
The percent cover of these waterbodies (relative to the total area of land and water combined) was
calculated for the upstream network to give an estimate of flow alteration. The percent waterbody for
the local and network catchments was spatially summarized at the HUC12 and HUC8 scales. Further
details of this analysis are provided in Appendix 4. Flow alteration values were transformed to adhere
to assumptions of normality, and z-scores were calculated. Some areas of the coastal plain have a high
density of ditches and canals used to drain soils for agriculture and other uses. These ditching networks
also represent considerable flow alteration, but quantifying the effects of ditching on freshwater flows
was outside the scope of our study. To minimize errors in our estimate of flow alteration, we elected
not to include flow alteration estimates for 58 out of 1,725 HUC12s where the freshwater mileage was
dominated (over 50%) by ditches and canals.
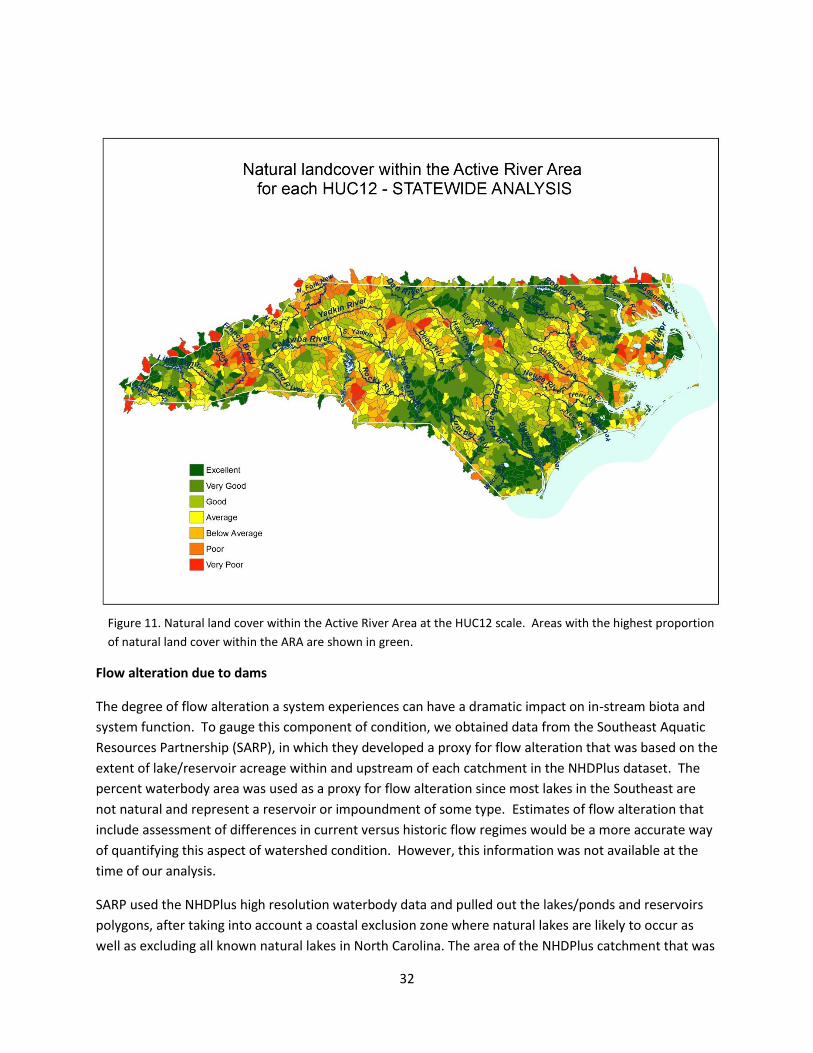
Figure 12. Estimated flow alteration due to dams within each HUC12. Areas with more altered flows are shown
in red, and those with more natural flows are shown in green. Areas where flow was not calculated due to a
high intensity of ditching are shown in beige.
34
The results of this analysis are shown in Figure 12. Not surprisingly, some of the locations with the least
flow alteration are found in the Southern Blue Ridge Mountains, whereas many of the rivers in the
central portion of the state are substantially altered. In particular, the main-stems of most of the state’s
largest rivers show heavy impacts of flow alteration. The eastern portion of the Coastal Plain shows
minimal flow alteration, particularly in places like the Albemarle Peninsula, and far northeastern North
Carolina. It should be noted that for this area in particular there is, in general, a substantial network of
ditches that may alter flows, but the impacted area did not exceed 50% of the total stream mileage as
explained above.
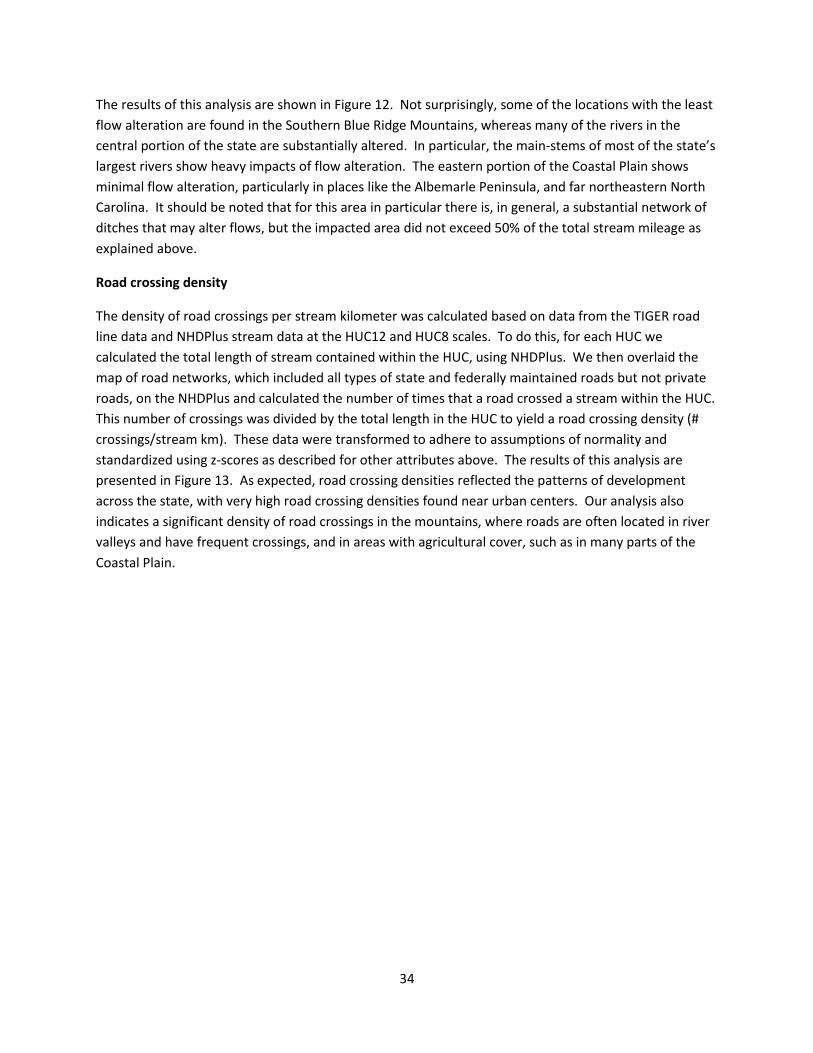
Road crossing density
The density of road crossings per stream kilometer was calculated based on data from the TIGER road
line data and NHDPlus stream data at the HUC12 and HUC8 scales. To do this, for each HUC we
calculated the total length of stream contained within the HUC, using NHDPlus. We then overlaid the
map of road networks, which included all types of state and federally maintained roads but not private
roads, on the NHDPlus and calculated the number of times that a road crossed a stream within the HUC.
This number of crossings was divided by the total length in the HUC to yield a road crossing density (#
crossings/stream km). These data were transformed to adhere to assumptions of normality and
standardized using z-scores as described for other attributes above. The results of this analysis are
presented in Figure 13. As expected, road crossing densities reflected the patterns of development
across the state, with very high road crossing densities found near urban centers. Our analysis also
indicates a significant density of road crossings in the mountains, where roads are often located in river
valleys and have frequent crossings, and in areas with agricultural cover, such as in many parts of the
Coastal Plain.
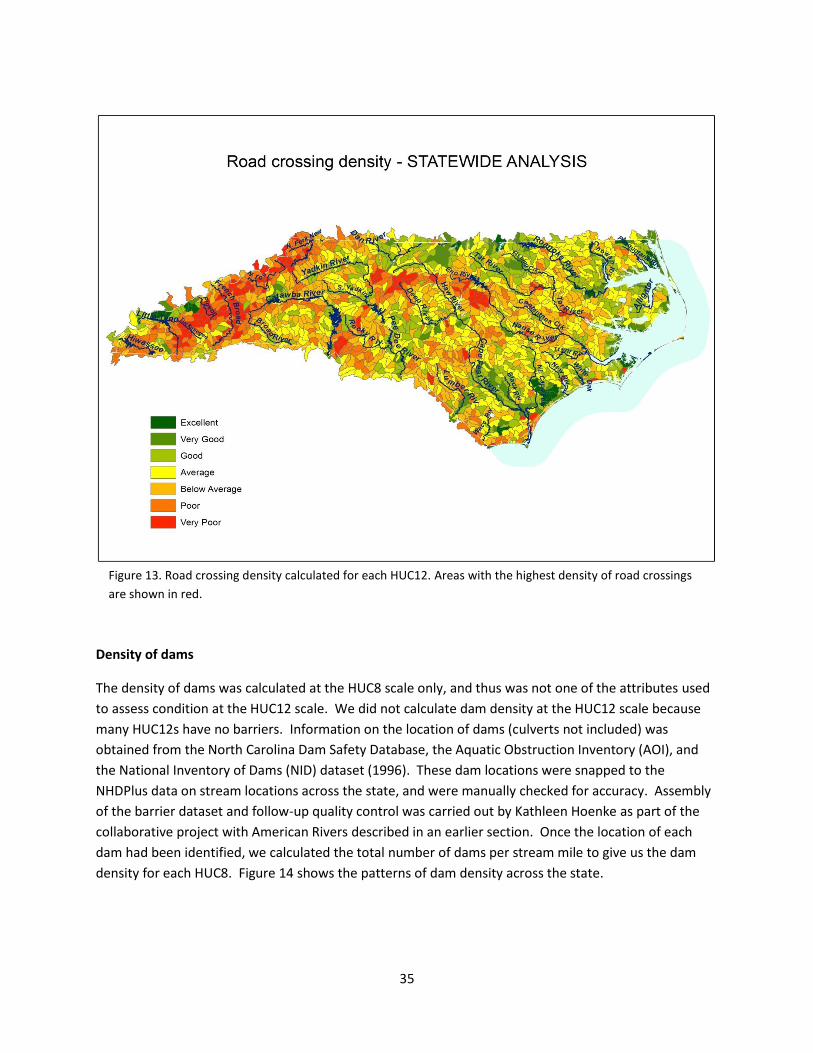
35
Density of dams
The density of dams was calculated at the HUC8 scale only, and thus was not one of the attributes used
to assess condition at the HUC12 scale. We did not calculate dam density at the HUC12 scale because
many HUC12s have no barriers. Information on the location of dams (culverts not included) was
obtained from the North Carolina Dam Safety Database, the Aquatic Obstruction Inventory (AOI), and
the National Inventory of Dams (NID) dataset (1996). These dam locations were snapped to the
NHDPlus data on stream locations across the state, and were manually checked for accuracy. Assembly
of the barrier dataset and follow-up quality control was carried out by Kathleen Hoenke as part of the
collaborative project with American Rivers described in an earlier section. Once the location of each
dam had been identified, we calculated the total number of dams per stream mile to give us the dam
density for each HUC8. Figure 14 shows the patterns of dam density across the state.
Figure 13. Road crossing density calculated for each HUC12. Areas with the highest density of road crossings
are shown in red.
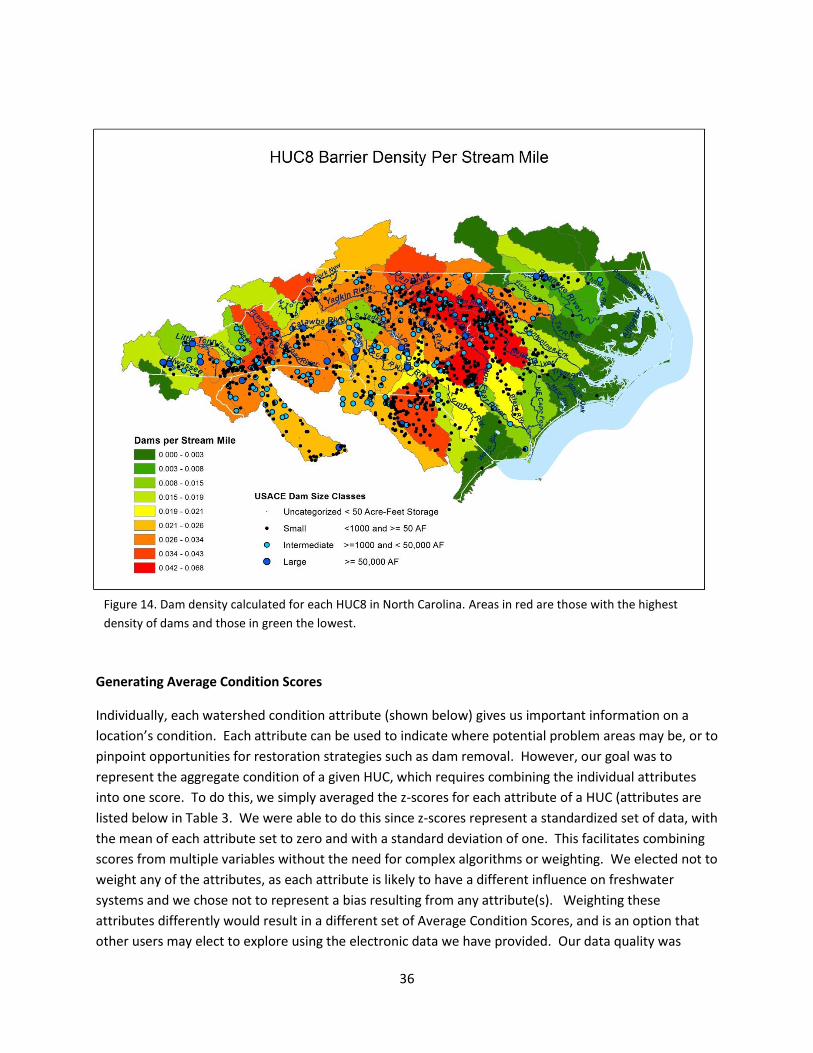
36
Generating Average Condition Scores
Individually, each watershed condition attribute (shown below) gives us important information on a
location’s condition. Each attribute can be used to indicate where potential problem areas may be, or to
pinpoint opportunities for restoration strategies such as dam removal. However, our goal was to
represent the aggregate condition of a given HUC, which requires combining the individual attributes
into one score. To do this, we simply averaged the z-scores for each attribute of a HUC (attributes are
listed below in Table 3. We were able to do this since z-scores represent a standardized set of data, with
the mean of each attribute set to zero and with a standard deviation of one. This facilitates combining
scores from multiple variables without the need for complex algorithms or weighting. We elected not to
weight any of the attributes, as each attribute is likely to have a different influence on freshwater
systems and we chose not to represent a bias resulting from any attribute(s). Weighting these
attributes differently would result in a different set of Average Condition Scores, and is an option that
other users may elect to explore using the electronic data we have provided. Our data quality was
Figure 14. Dam density calculated for each HUC8 in North Carolina. Areas in red are those with the highest
density of dams and those in green the lowest.
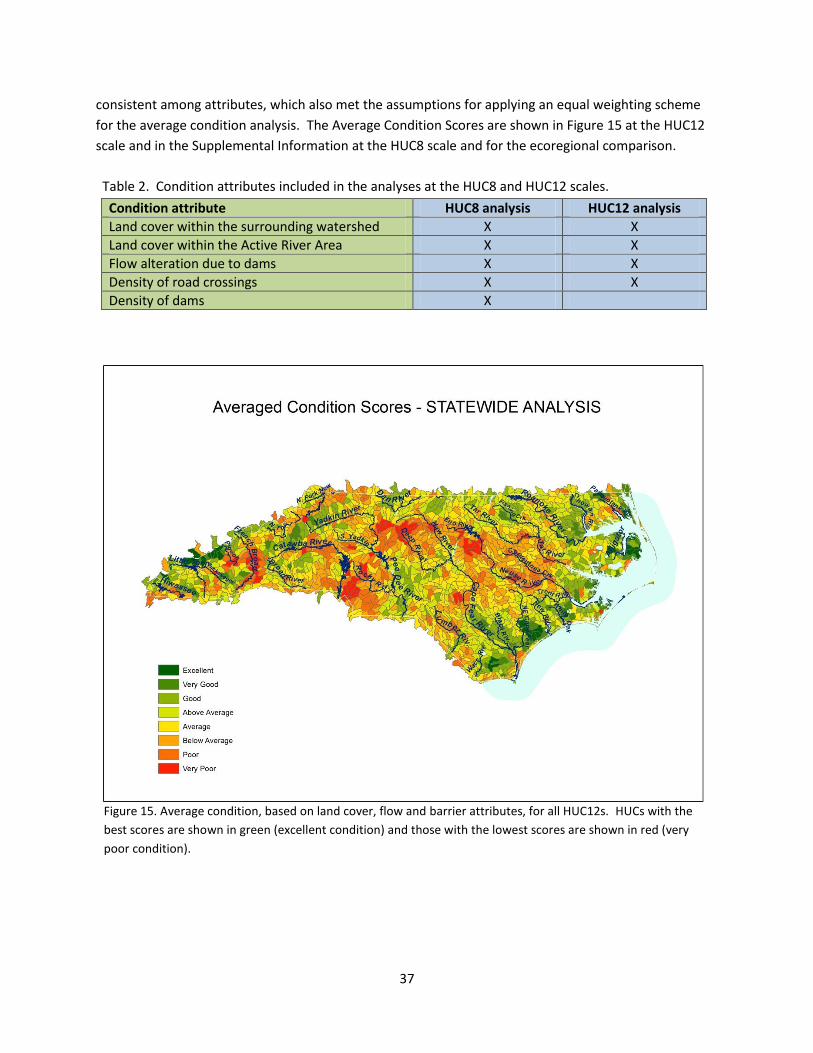
37
consistent among attributes, which also met the assumptions for applying an equal weighting scheme
for the average condition analysis. The Average Condition Scores are shown in Figure 15 at the HUC12
scale and in the Supplemental Information at the HUC8 scale and for the ecoregional comparison.
Condition attribute HUC8 analysis HUC12 analysis
Land cover within the surrounding watershed X X
Land cover within the Active River Area X X
Flow alteration due to dams X X
Density of road crossings X X
Density of dams X
Figure 15. Average condition, based on land cover, flow and barrier attributes, for all HUC12s. HUCs with the
best scores are shown in green (excellent condition) and those with the lowest scores are shown in red (very
poor condition).
Table 2. Condition attributes included in the analyses at the HUC8 and HUC12 scales.
38
The scores across the state vary considerably, with the lowest scores being in urban areas and in areas
with heavy agricultural use. Areas that have scores substantially above average in condition included
the following:
Coastal Plain: the lower Cape Fear River, the Waccamaw River, interior Brunswick County (Green
Swamp/Juniper Creek), Angola Swamp, the Black River, the White Oak River, the lower Roanoke River,
the Cashie River, the Chowan River, the Pasquotank and the Alligator Rivers
Piedmont: Fishing Creek, the upper Tar River, portions of the Haw and Deep Rivers near their
confluence, portions of the Pee Dee River, Lower Uwharrie River, and the Dan River
Mountains: the north fork of the New and Toe Rivers, the headwaters of the Pigeon River, the Little
Tennessee River, the Johns and Linville Rivers, and parts of the Tuckasegee River
Data evaluated but not used for final condition analysis
We evaluated a number of other datasets and conducted several additional analyses that were not used
in our final assessment of condition across the state. These analyses included an assessment of water
withdrawals, analysis of the spatial configuration of natural habitat within the ARA, and rates of land
cover change. These data are provided in the electronic supplemental materials.
Water withdrawals were assessed in collaboration with North Carolina’s Division of Water Resources
(DWR). We worked with DWR staff to obtain the best available data to estimate water withdrawals/use
in 2008. Years other than 2008 were noted in the files and indicate the most recent data available for
that particular user. This dataset contained the County, use year, company name, facility name, use
type, IBT basin #, HUC 8, surface water withdrawal amount per month, ground water amount per
month, surface water average daily demand, and ground water average daily demand. All of the data
was in MGD (million gallons per day). We calculated the total surface water and ground water for each
use type per HUC8 and per basin (HUC6). This dataset, though representing extensive amounts of work
to document water withdrawal and use patterns, did not fully reflect water use across the state. For
example, substantial amounts of water are withdrawn for agricultural purposes and these uses are not
adequately captured in the current DWR data since agricultural withdrawals do not have to be reported
to the state unless they exceed one million gallons per day. Non-agricultural water users are not
required to report withdrawals that are below 100,000 gallons per day. In addition, water withdrawal
data was reported by DWR at the HUC8 scale, which did not facilitate a finer-scale assessment of
patterns of water use. As a result, we decided not to use this information in our final evaluation of
condition.
Patchiness of natural vegetation within the Active River Area. We sought to evaluate differences in the
number and size of natural patches within the ARA. Our assumption was that areas with fewer, larger
natural patches have greater lateral connectivity and floodplain intactness, and that this would lead to
better conditions for in-stream biota. To accomplish this, the following natural land cover classes were
39
extracted from the ARA NLCD 2006 grid: water, forest, grassland/herbaceous, and wetland. The natural
grid cells were region grouped using an 8-neighbor rule to create patches of natural cover found in the
ARA. The region grouped grid was converted to a polygon and the polygon was dissolved on the unique
patch ID’s. The area of each unique natural patch was calculated. For each reporting unit, an identity
function was run to combine the reporting unit polygons with the ARA natural patch polygons so that
each patch that occurred in more than one reporting unit would be associated with all the reporting
units in which it occurred so as not to penalize large patches for crossing multiple reporting unit
boundaries. For each reporting unit we calculated summary statistics for each watershed ID (e.g., HUC
12 code). To provide a picture of fragmentation within the ARA at different scales, the following
summary statistics were generated for each reporting unit: number of patches, average patch area
(acres), minimum patch area (acres), maximum patch area (acres), and median patch area (acres).
We found that patch number and size within the ARA was highly correlated with the percent of natural
cover within the ARA. As natural cover increased in the ARA, so too did the size of natural patches, and
the number of patches decreased due to consolidation of natural areas. Due to these high correlations,
we decided not to use this information in our final evaluation of condition; however we believe that this
information has significant value for conservation planning, particularly at fine spatial scales, so we have
included these data at both the HUC8 and HUC12 scales in the electronic supplemental materials.
Rates of land cover change. We used the NLCD data for the entire state to assess how rapidly land cover
was changing across the state. To do this, we grouped land cover types into two classes: natural (see
earlier list of cover types included) and developed (agricultural and development-based land cover
designations). For each 30m grid cell, we compared the 2001 NLCD data with the 2006 NLCD data, and
identified those grid cells that had undergone a change from one class to another (primarily from
natural to developed) during that five year period. We then calculated the percent of grid cells that had
undergone a change in class at both the HUC12 and HUC8 scales to identify areas changing more rapidly
than others. Overall, the rates of change were quite low during this period (from 0-3%), though the
analysis did highlight areas that are changing faster than others which indicates a high potential for
future land cover change. This is valuable information; however it is limited, reflecting only a five year
window of time. We look forward to exploring patterns of land cover change in more detail in the
future, but found more substantial investigation to be outside the scope of this project. Consequently,
we present the data here and in the electronic supplemental materials, but did not use it for our final
assessment of condition.
Generating a set of priorities
To generate a set of priorities that gives us insight into focal protection and restoration areas and that
identifies areas in need of further investigation, we incorporated both the information from the CPT
analysis on the distribution of conservation targets as well as the scores of average condition (which at
the HUC12 scale incorporates land cover across the HUC, within the ARA, flow alteration, and road
crossing density). Since each of these attributes was standardized and reported using z-scores, similar
values represent similar departures from average conditions. Accordingly, we were able to query the
40
scores for CPT and average condition – hence combining information on the LOCATION of conservation
targets and their likely CONDITION – in a variety of different ways to generate categories of priorities.
As mentioned earlier, these z-scores and queries were conducted at the statewide scale to show
priorities when all HUCs were compared across the state and at the ecoregional scale to assess priorities
within the mountains, coastal plain and piedmont ecoregions. We conducted four queries, which
together assigned one of four categories to each HUC within North Carolina (see Figure 16). The queries
were:
1) HUCs where the CPT/Targets Score was above average (z-score ≤ 0) AND where the Average
Condition Score was above average (z-score ≤ 0) - These HUCs scored well for both presence
of conservation targets, and for the condition of lands and waters in the area. We present
these as the best opportunities for preservation-based strategies (shown in DARK GREEN in
Figure 16).
2) HUCs where the CPT/Targets Score was above average (z-score ≤ 0) AND where the Average
Condition Score was below average (z-score > 0) - These HUCs were those where
conservation targets were plentiful, but the condition score below average. We present
these as the best opportunities for restoration-based strategies (shown in LIGHT GREEN in
Figure 16) focused on improving the condition of the lands and waters in these areas so that
they can provide long-term support for the existing biota.
3) HUCs where the CPT/Targets Score was below average (z-score > 0) AND where the Average
Condition Score was above average (z-score ≤ 0) - These HUCs scored low for conservation
targets/biodiversity, but condition was above average. This is an interesting case, which
raises the question of why there is not a greater prevalence of conservation targets since the
condition is relatively good. We propose that this category represents locations that should
be investigated further (shown in Yellow in Figure 16). This would involve determining
whether the low CPT score resulted from a lack of sampling at the location, or if there is
actually a reduced number of targets at the site, and if so, why. For example, was there a
historical land use that made a long-term impact?
4) HUCs where the CPT/Targets Score was below average AND (z-score > 0) where the Average
Condition Score was below average (z-score > 0) - These HUCs scored below average for both
conservation targets/biodiversity and for condition. We present these as locations with low
resource value, and as places of low priority for protection or restoration efforts. These are
shown in PINK in Figure 16.
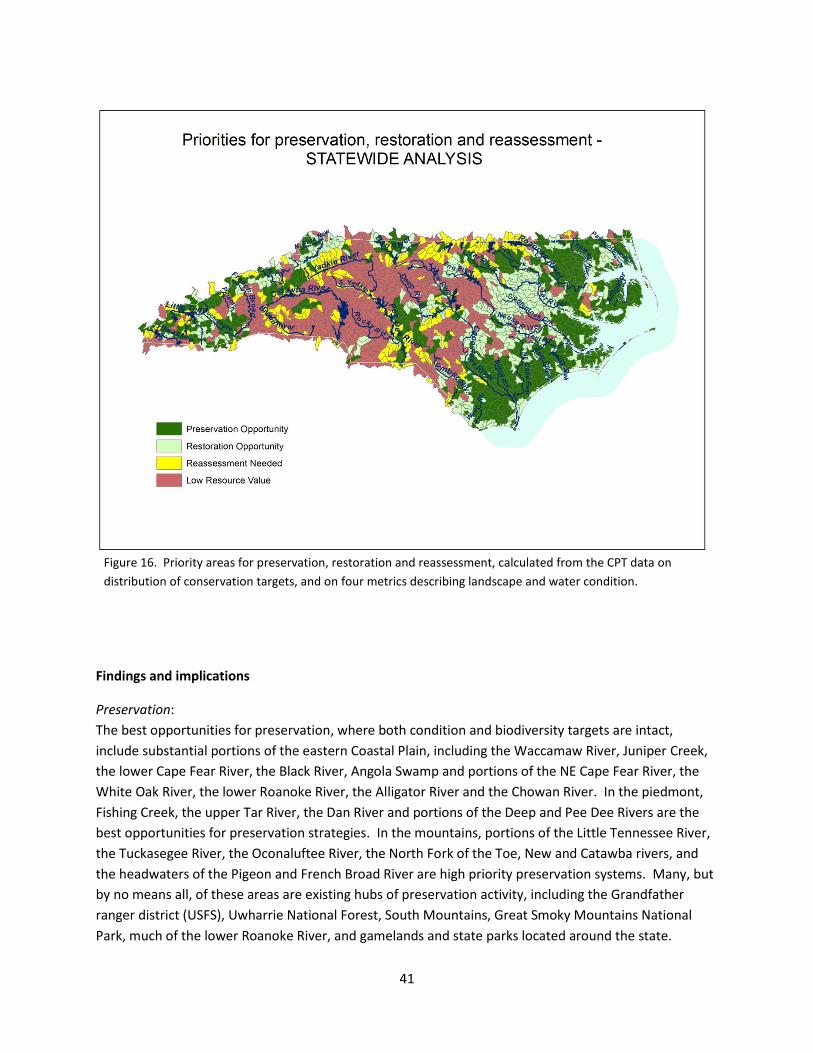
41
Findings and implications
Preservation:
The best opportunities for preservation, where both condition and biodiversity targets are intact,
include substantial portions of the eastern Coastal Plain, including the Waccamaw River, Juniper Creek,
the lower Cape Fear River, the Black River, Angola Swamp and portions of the NE Cape Fear River, the
White Oak River, the lower Roanoke River, the Alligator River and the Chowan River. In the piedmont,
Fishing Creek, the upper Tar River, the Dan River and portions of the Deep and Pee Dee Rivers are the
best opportunities for preservation strategies. In the mountains, portions of the Little Tennessee River,
the Tuckasegee River, the Oconaluftee River, the North Fork of the Toe, New and Catawba rivers, and
the headwaters of the Pigeon and French Broad River are high priority preservation systems. Many, but
by no means all, of these areas are existing hubs of preservation activity, including the Grandfather
ranger district (USFS), Uwharrie National Forest, South Mountains, Great Smoky Mountains National
Park, much of the lower Roanoke River, and gamelands and state parks located around the state.
Figure 16. Priority areas for preservation, restoration and reassessment, calculated from the CPT data on
distribution of conservation targets, and on four metrics describing landscape and water condition.
42
Restoration:
Restoration opportunities – where biodiversity and community targets are intact, but condition has
been compromised – are plentiful, particularly in the piedmont and parts of the coastal plain.
Opportunities for restoration are interspersed with the preservation opportunities in the mountains and
coastal plain, and help to highlight areas where condition could be improved to support the continued
persistence of the area’s still intact natural communities. In the piedmont, where restoration
opportunities abound, the Eno River, the Deep River and portions of the Tar and Haw Rivers represent
priority locations for restoration.
Further Investigation:
Areas with low biodiversity (CPT) scores and high condition reflect locations where 1) biodiversity values
are in fact high, but sampling efforts have not been sufficient to detect the full range of species and
natural communities at the site, or 2) where biodiversity is indeed unexpectedly low, given high quality
conditions at the site. In either case, these areas may warrant further investigation. These areas may
also be good locations for reintroducing species that have become extirpated from portions of their
range, though this strategy would require further investigation to maximize the chance of success.
Low Resource Value: Areas of the state that did not fall into any of these three categories were those with low CPT and
condition scores, and which we have identified as those with low priority for conservation action. Based
on our assessment, the condition in these areas has been substantially altered by human activities, and
these areas have fewer conservation targets than most others in the state. As such, we do not see any
immediate potential for conservation action in these locations.
Further uses of this information
Our approach of combining information on the distribution of conservation targets with information on
condition across the state is by no means the only way to use and interpret these data, and we
encourage further exploration to answer questions that are focused on particular conservation
challenges. We conducted these analyses at multiple spatial scales, and anticipate each will inform
different questions and that various users will focus on different portions of the data presented. To
facilitate extended use of this information, all of the data described above is available in Excel tables
online (see information on accessing these data at the end of this report).
Others are encouraged to use the data in differing combinations to assist them in answering their own
unique questions. For example, one question may be: where are the locations in North Carolina where
existing biodiversity is better than average, but altered flows may present a significant problem, and
where flow restoration may have a large impact? The information we present can be used to begin to
address this question. In overlaying the data on the distribution of conservation targets (CPT data) with
information on flow alteration, the user could quickly identify those locations with high biodiversity that
also have moderate to heavy flow alteration. This analysis could then be used in conjunction with
43
information on potential opportunities for flow modification (e.g., FERC relicensing processes), or with
data on dam removal opportunities, to identify specific places for further scrutiny and action.
Other users are also encouraged to apply a different weighting scheme to these data, as needed to
guide their own initiatives. For example, users focused on water quality concerns may be most
interested in condition attributes that are driven by changes in land cover in the Active River Area
and/or the watershed as a whole since land cover has strong impacts on water quality. These users may
choose to more heavily weight the land cover condition attributes, and apply lower weights to the flow
alteration, road crossing and/or barrier density attributes. These types of explorations are strongly
encouraged, and provide users with the opportunity to tailor the data to their own needs.
Each of the data sets also stands independently and can be used to identify priority locations for action
based on that specific attribute. For example, data on the patchiness of natural land cover within the
Active River Area can be used to identify locations for riparian restoration. Information on road crossing
and dam density can be used to identify areas that are challenged with low linear connectivity and to
begin to identify locations where connectivity along the stream could be increased substantially by
working at a few specific locations. We expect and strongly encourage this type of exploration and use
of our data and hope that you will communicate with TNC and NHP about any such efforts, to ensure
that the most current data available are used.
Comparison of results with previous assessments
We compared the results of our quantitative analysis with The Nature Conservancy’s 2002 Southeast
Biodiversity Assessment (Smith et al. 2002) and with North Carolina’s current Wildlife Action Plan
(NCWRC 2005) to assess areas of overlap and areas of difference. Each of these assessments was
conducted using different datasets and to accomplish somewhat different goals, so areas of
disagreement should be interpreted carefully. Figure 17 shows the overlap between our current
analysis, the 2002 TNC assessment and the 2005 Wildlife Action Plan priorities.
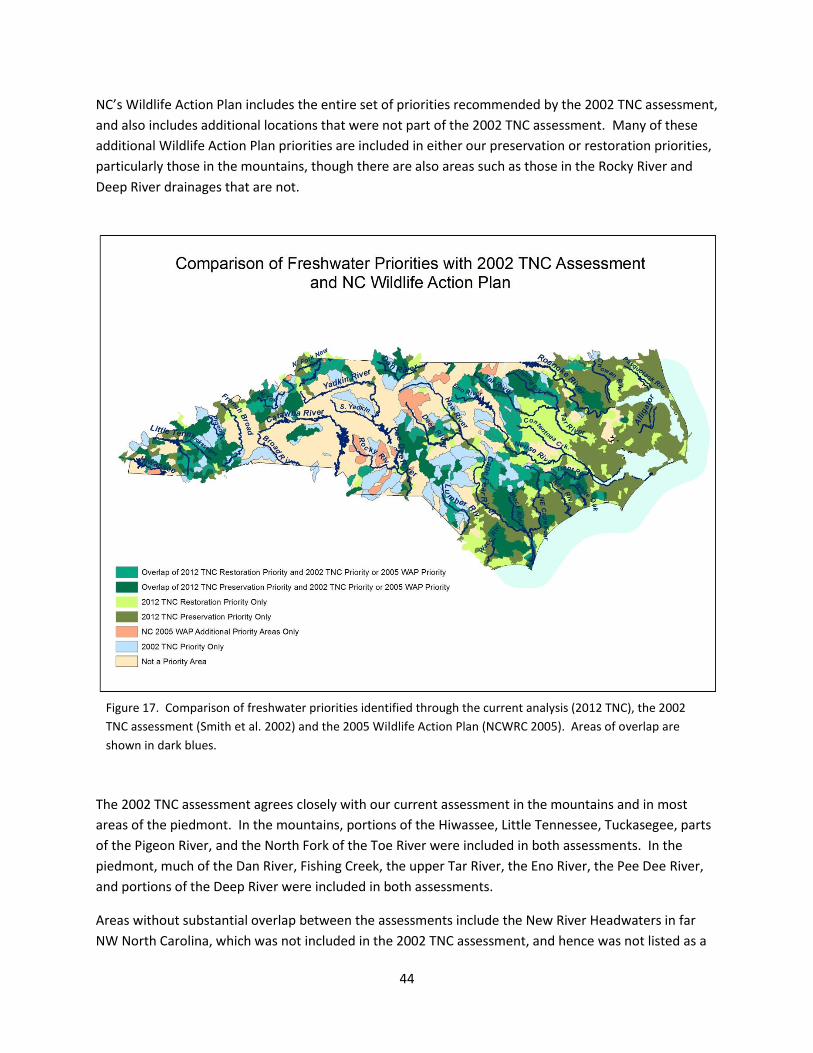
44
NC’s Wildlife Action Plan includes the entire set of priorities recommended by the 2002 TNC assessment,
and also includes additional locations that were not part of the 2002 TNC assessment. Many of these
additional Wildlife Action Plan priorities are included in either our preservation or restoration priorities,
particularly those in the mountains, though there are also areas such as those in the Rocky River and
Deep River drainages that are not.
The 2002 TNC assessment agrees closely with our current assessment in the mountains and in most
areas of the piedmont. In the mountains, portions of the Hiwassee, Little Tennessee, Tuckasegee, parts
of the Pigeon River, and the North Fork of the Toe River were included in both assessments. In the
piedmont, much of the Dan River, Fishing Creek, the upper Tar River, the Eno River, the Pee Dee River,
and portions of the Deep River were included in both assessments.
Areas without substantial overlap between the assessments include the New River Headwaters in far
NW North Carolina, which was not included in the 2002 TNC assessment, and hence was not listed as a
Figure 17. Comparison of freshwater priorities identified through the current analysis (2012 TNC), the 2002
TNC assessment (Smith et al. 2002) and the 2005 Wildlife Action Plan (NCWRC 2005). Areas of overlap are
shown in dark blues.
45
priority. Both our current assessment and the Wildlife Action Plan indicate that this area of the state is a
high priority for freshwater conservation. Our assessment also indicated that portions of the French
Broad should be considered high priority, though this was not listed as a priority in the 2002 TNC
assessment. In the piedmont, portions of the Rocky River were not prioritized in our current assessment
but were part of the Wildlife Action Plan and 2002 TNC assessment priorities. Another likely reason for
many of the observed differences in priorities between our assessment and the Wildlife Action Plan is
that substantial amounts of information have been gained on the state’s freshwater biota since the
Wildlife Action Plan was finalized in 2005. Some areas, which were thought to contain rare species, are
now known to have experienced local extirpation of these species. For example, areas of the Rocky
River were Wildlife Action Plan priorities due to the presumed extant populations of the Carolina
heelsplitter have been recently surveyed and the historic populations in these areas are now thought to
be extirpated.
There were substantial differences in priorities between the 2002 TNC assessment and our current
assessment in the Coastal Plain. Areas of agreement were limited, but included the Waccamaw River
and Juniper Creek, the Black River, portions of the lower Cape Fear River, the Trent River, the White Oak
River, and portions of the lower Roanoke River. The 2002 TNC assessment prioritized very little of the
Albemarle Peninsula, or Northeastern North Carolina as a whole, while our assessment indicates that
much of this area should be considered a high priority for freshwater conservation. We believe that
these differences are due to a number of factors: 1) our methods cover the entire surface of the state,
whereas other methods were restricted to entirely freshwater systems and did not include areas under
tidal influence, 2) unlike other methods, ours includes elements of the riparian community such as
Aquatic Significant Natural Heritage Areas, Habitat Indicator Guilds, etc; which are very well represented
in the coastal plain, 3) the condition of the surrounding landscape factors heavily in our analysis, and
played little to no role in others, 4) information on anadromous fish was explicitly incorporated into the
CPT (Anadromous Fish Spawning Areas and Fish Nursery Areas) and resulted in areas with high scores in
the coastal plain, and 5) our estimate of flow alteration did not fully account for alteration due to
ditching. Ditching is a common practice in parts of the coastal plain, and in particular in the Northeast
part of the state, such as the Albemarle Peninsula. This practice may substantially alter natural flows,
though frequently in ways which are hard to accurately model. Therefore, we have likely
underestimated flow alteration in parts of the coastal plain, and hence to some degree inflated the
average condition of these locations.
Threats to North Carolina’s freshwater systems
We assessed threats to North Carolina’s freshwater systems in several ways: through our literature
review, the expert workshops, and from the data analyses described above in which we assessed
patterns of land cover, dam and road crossing density, alteration to flows, and other components of
condition that represent current and future threats to these systems. Here we describe in further detail
the threats that are common to most of North Carolina’s freshwater systems, as well as threats specific
to individual basins and/or sub-basins.
46
Our literature review identified a suite of threats found in nearly all of North Carolina’s basins. These
include: habitat degradation and land use change associated with increasing development across the
state, increasing numbers of barriers to movement within stream networks (i.e., dams, culverts and road
crossings, and associated impoundments), sedimentation and erosion from altered patterns of flow and
changes in land cover, more demanding patterns of water use in many areas of the state, increasing
prevalence of aquatic invasives, and point and non-point source pollution. More specific threats to each
of these basins are discussed in detail in the Wildlife Action Plan (NC WRC 2005), and in the Division of
Water Quality’s (DWQ) basinwide plans.
Below, we highlight the stressors in each basin associated with detrimental impacts to water quality, as
identified by DWQ. Many of these stressors overlap with those identified in the Wildlife Action Plan, but
there are also other threats that are more specific to impacts on water quality. Below are the primary
stressors and their sources identified in the DWQ’s plan for each basin:
Broad River – Stressors and sources: Habitat degradation, high turbidity, fecal coliform bacteria, low pH,
nutrient loading, reduced riparian vegetation, sedimentation, nutrient impacts from construction and
stormwater runoff and wastewater treatment plants, point source pollution, and historic mining
activities.
Cape Fear River – Stressors and sources: impervious surface areas, construction sites, road building,
land clearing, agriculture and forestry, habitat degradation, sedimentation, lack of organic material,
stream channelization, arsenic, chlorophyll a, low DO, impaired pH, turbidity due to urbanization, fecal
coliform bacteria and enterrococcus, mercury in fish tissue, large impervious areas, modified watershed
hydrology resulting in streambank erosion and sedimentation.
Catawba River – Stressors: Turbidity, low pH, copper, fecal coliform, development pressures, impacts
from converting agricultural lands to urban areas, livestock operations, row crop and ornamental
nurseries, stormwater runoff, point source pollutants, failing septic systems, out-dated wastewater
treatment facilities, excess nutrient loading and nonpoint source runoff, point source pollution, and
agricultural runoff. Sources: low pH (stream flows, atmospheric deposition, development impacts,
decreased buffering capacity); stormwater volume and velocity (severe stream bank and aquatic life
damage); impacts from poultry farm construction (major shift in animal operations from cattle to
poultry within the basin since the 1990s); septic systems and coal ash ponds; flow alteration.
Chowan River – Stressors and Sources: Agriculture and runoff from WWTP land application sites,
mercury and dioxin, fecal coliform bacteria, excess nutrient loading, pesticide and/or herbicide
contamination, and sedimentation.
French Broad River – Stressors and sources: Pathogens (25% of the ambient monitoring stations
exceeded the criteria for fecal coliform bacteria), sources include failing septic systems, straight piping,
sanitary sewer overflows, and lack of livestock exclusion from streams; turbidity; copper; pesticides; pH;
habitat degradation.
47
Hiwassee River – Stressors and sources: Habitat degradation, typically a result of increased flow of
stormwater runoff from land-disturbing activities and streambank erosion due to a lack of adequate
riparian vegetation, fecal coliform bacteria, nutrient impacts, low dissolved oxygen (DO), sediment, total
suspended solids, turbidity, stormwater outfall, construction, agriculture, pasture, and impervious
surfaces.
Little Tennessee River – Stressors: NPS pollution including inputs of sediment and/or nutrients; habitat
degradation attributable to the combination of steep gradients, chronic erosion, and sedimentation;
fecal coliform bacteria; habitat degradation; lack of organic material; nutrient impacts; low DO; total
suspended solids; turbidity; and low pH. Sources of stressors: stormwater outfall, construction,
agriculture, impervious surfaces, WWTP NPDES, MS4 NPDES, land conversion, road construction,
impoundments, and failing septic systems.
Lumber River – Stressors and sources: fecal coliform bacteria, mercury, low dissolved oxygen levels,
copper, turbidity, nutrient loading, habitat degradation resulting partly from nonpoint source pollution,
stormwater runoff and septic systems.
Neuse River – Stressors: low DO levels, elevated turbidity, elevated chlorophyll a and high or low pH
(due to elevated nutrients), bacteria (fecal coliform and enterococci), nonpoint source runoff, urban
development, excessive nutrient loading, habitat degradation, sedimentation, loss of riparian vegetation
and organic aquatic microhabitats, channelization and lack of riparian habitat, development, drainage
for agricultural purposes, lack of instream habitat, high conductivity, and algal blooms. Sources:
concentrated animal feeding operations, ANOPS land application site, general agriculture/pasture, row
crop agriculture, forest harvesting, MS4 NPDES, stormwater runoff, WWTP NPDES, failing septic
systems, landfills, impoundments, industrial sites, construction, land clearing, natural conditions, urban
and agricultural runoff, new construction and existing development, point source discharges, volume of
stormwater runoff from development and agriculture that contributes to instream habitat loss and
sedimentation, and agricultural runoff including high levels of nutrients and identified pesticides.
New River – Stressors: Habitat degradation from nonpoint source runoff, acid mine drainage and one
point source, habitat degradation, fecal coliform bacteria, toxic impacts and low pH. Sources of
stressors: WWTP NPDES, agriculture, pasture, impervious surface, and road construction.
Pasquotank River – Stressors: Habitat degradation, chlorophyll a, lack of organic material, low DO, low
pH, nutrient impacts, dioxins, and channelization. Sources: Agriculture, failing septic systems, MS4
NPDES, and WWTP NPDES.
Roanoke River – Stressors: Low DO, turbidity, fecal coliform bacteria, dioxins, and mercury. Sources of
stressors: urban or impervious surface areas, construction sites, land clearing, agriculture and water
impoundments, point source discharges, flow alteration.
48
Savannah River – Stressors: Nutrient impacts, habitat degradation, fecal coliform bacteria, temperature
changes, toxic impacts. Sources of stressors: Waste Water Treatment Plant (WWTP) NPDES (i.e.
National Pollution Discharge Elimination Sites), impervious surface, land clearing, road construction.
Tar-Pamlico River Basin – Stressors: Nutrient enrichment, fecal coliform bacteria and incidences of low
DO leading to fish kills, copper, chlorophyll a, and algal blooms.
Watauga River – Stressors: Habitat degradation, nutrient impacts, ammonia, temperature. Sources of
stressors: agriculture, construction, impervious surface, pasture, stormwater outfalls, and WWTP
NPDES.
White Oak River – Stressors and sources for saltwater and freshwater: agriculture, failing septic
systems, forest harvesting, impervious surface, marinas, stormwater runoff, and WWTP NPDES.
Yadkin-Pee Dee River – Stressors: Increasing nutrient enrichment, urbanization, and wastewater,
habitat degradation, turbidity, low pH in streams (high in lakes), elevated fecal coliform
bacteria, nutrient loading, and low DO. Sources: Agriculture, impervious surfaces, MS4 NPDES, WWTP
NPDES, construction, impoundments, failing septic systems, land clearing, road construction, industrial
sites, animals, mining, nonpoint source runoff from urban areas and waste land-application sites, flow
alteration.
The National Fish Habitat Action Plan (NFHAP; National Fish Habitat Board 2010) summarizes the results
of the first detailed national assessment undertaken by scientists working to synthesize information on
threats to aquatic habitat across the United States. The report focuses on freshwater and estuarine
aquatic habitats, and analyzes a variety of disturbance variables to generate risk rankings across the
country. These variables include:
1) Urban/Human settlement (percent urban land use; human population density; road density)
2) Livestock and grazing (percent pasture and hay in the watershed)
3) Agriculture (percent row crop agriculture in the watershed)
4) Point source pollution data (numbers of National Pollution Discharge Elimination Sites, Toxic
Release Inventory sites, and National Superfund sites)
5) Habitat fragmentation (numbers of dams and road crossings)
6) Mine density
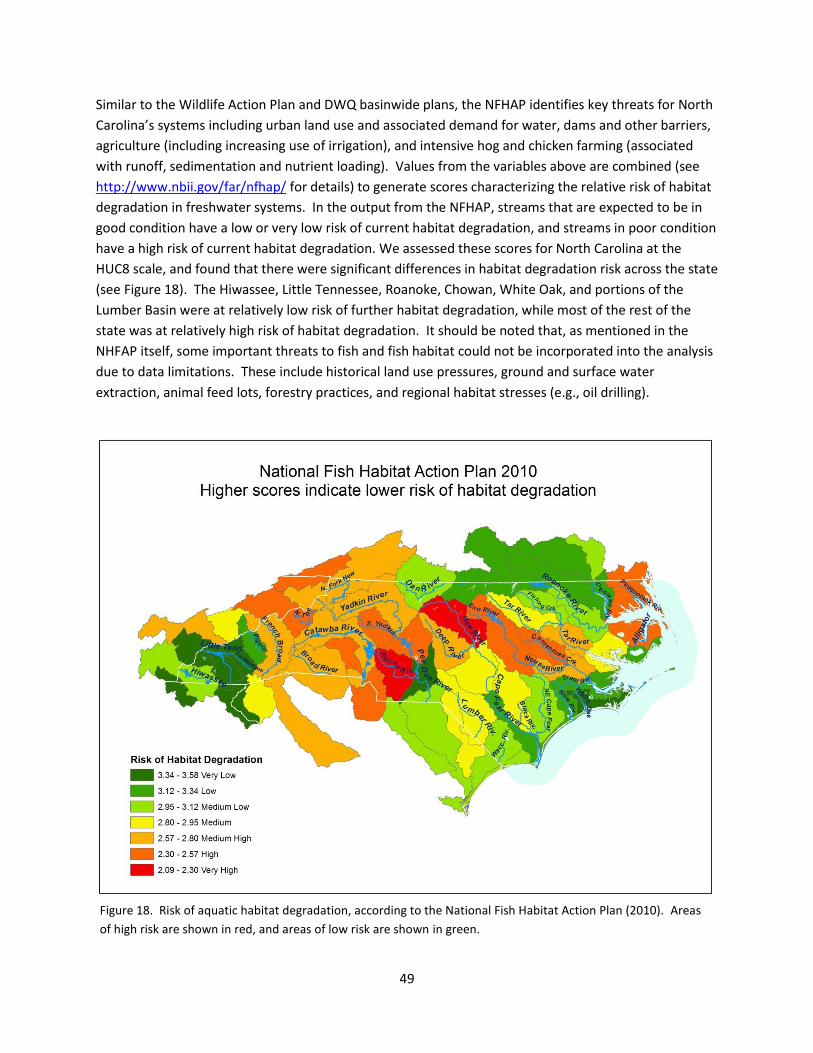
49
Similar to the Wildlife Action Plan and DWQ basinwide plans, the NFHAP identifies key threats for North
Carolina’s systems including urban land use and associated demand for water, dams and other barriers,
agriculture (including increasing use of irrigation), and intensive hog and chicken farming (associated
with runoff, sedimentation and nutrient loading). Values from the variables above are combined (see
http://www.nbii.gov/far/nfhap/ for details) to generate scores characterizing the relative risk of habitat
degradation in freshwater systems. In the output from the NFHAP, streams that are expected to be in
good condition have a low or very low risk of current habitat degradation, and streams in poor condition
have a high risk of current habitat degradation. We assessed these scores for North Carolina at the
HUC8 scale, and found that there were significant differences in habitat degradation risk across the state
(see Figure 18). The Hiwassee, Little Tennessee, Roanoke, Chowan, White Oak, and portions of the
Lumber Basin were at relatively low risk of further habitat degradation, while most of the rest of the
state was at relatively high risk of habitat degradation. It should be noted that, as mentioned in the
NHFAP itself, some important threats to fish and fish habitat could not be incorporated into the analysis
due to data limitations. These include historical land use pressures, ground and surface water
extraction, animal feed lots, forestry practices, and regional habitat stresses (e.g., oil drilling).
Figure 18. Risk of aquatic habitat degradation, according to the National Fish Habitat Action Plan (2010). Areas
of high risk are shown in red, and areas of low risk are shown in green.
50
Our literature review also revealed several informative articles that focused on single threats to North
Carolina’s freshwater systems, such as nonpoint source pollution risk, nutrient loading, and
concentrated animal feeding operations (CAFOs). In an effort to predict nonpoint source pollution risk
across North Carolina, Potter et al. (2004) sought to: 1) investigate the importance of land cover,
especially the amount of forest at the watershed and riparian zone scales, for benthic
macroinvertebrate community composition; and 2) develop vulnerability models to help policymakers
and natural resource managers understand the impact of land cover changes on water quality in NC.
The results should enable managers and policymakers to weigh the risks of management and policy
decisions to a given watershed or set of watersheds, including whether streamside buffer protection
zones are ecologically effective. Regression analyses revealed that landscape variables such as land
cover explained up to 56.3% of the variability in the benthic macroinvertebrate index scores. NC
watersheds with low forest cover are at the greatest risk for degraded water quality and stream habitat
conditions.
Potter et al. (2004) found three general results: 1) Forested land cover, at both the watershed and
riparian scales, was a statistically significant predictor of benthic macroinvertebrate communities that
are less tolerant of stream degradation, and that indicate a greater level of aquatic ecologic integrity and
better water quality. The opposite was the case for agricultural land cover (at both scales) and
developed land cover (in riparian zones). 2) One land cover characteristic (watershed percent forested)
and one land form feature (watershed shape) were consistently the most important and most
statistically significant variables in explaining macroinvertebrate variability in statewide multiple
regression analyses. 3) The importance of forest cover in predicting macrobenthic invertebrate
community assemblage varied by the physiographic region in which a watershed was located. The
amount of forest cover in riparian zones was a significant predictor of intolerant macroinvertebrate taxa
in the Coastal Plain. In the Piedmont, watershed forest cover and riparian forest cover were significant
predictors of the macroinvertebrate assemblage. Forest cover was not a good predictor in the Southern
Appalachians.
In brief, the ecological risk assessment process undertaken by Potter et al. (2004) generated
vulnerability model equations that can provide a basis for quantitatively comparing, ranking, and
prioritizing risks to water quality. Such an assessment can be useful in cost-benefit and cost-
effectiveness analyses of alternative management options. Specifically the model equations offer a
useful approach for characterizing the risk of potential land management options through the
“simulation” of land use activities and land cover changes.
In addition to the threats identified in our literature review, we focused on identifying threats to the
state’s freshwater systems during our expert workshops. The feedback we received during these
sessions echoed many of the threats identified from the literature review, as well as several additional
threats not covered in the literature. The threats identified from these workshop sessions are shown in
Table 3 below.
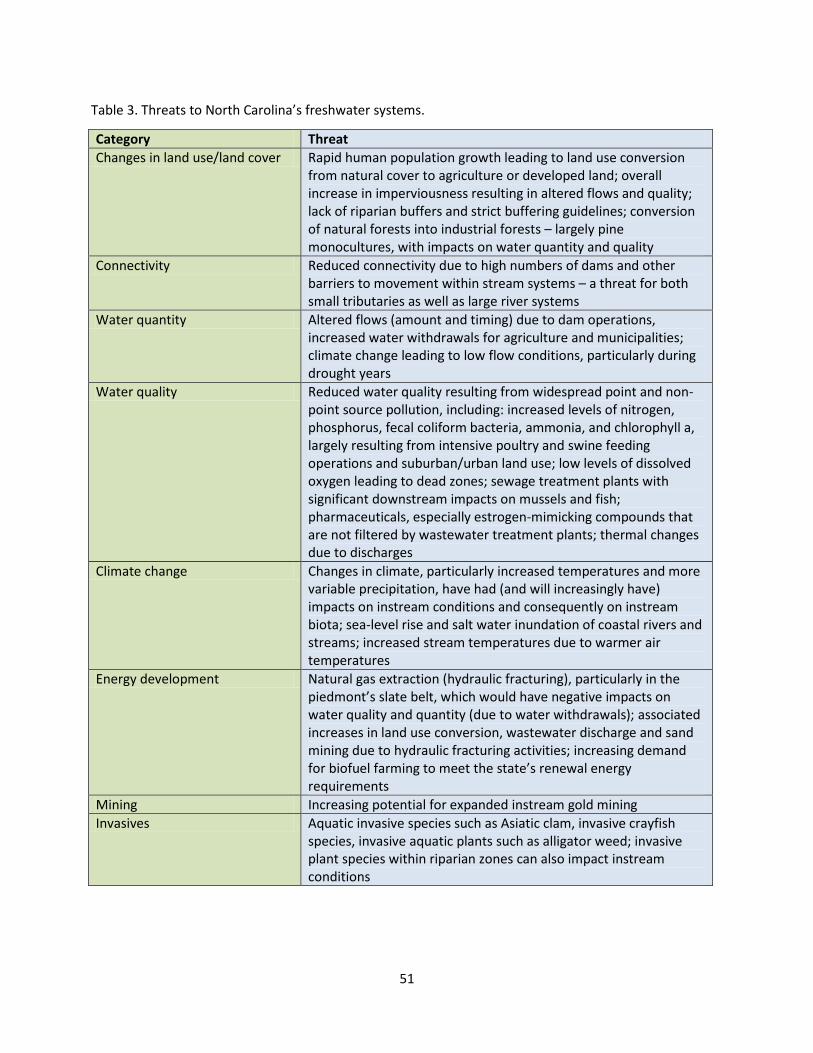
51
Category Threat
Changes in land use/land cover Rapid human population growth leading to land use conversion from natural cover to agriculture or developed land; overall increase in imperviousness resulting in altered flows and quality; lack of riparian buffers and strict buffering guidelines; conversion of natural forests into industrial forests – largely pine monocultures, with impacts on water quantity and quality
Connectivity Reduced connectivity due to high numbers of dams and other barriers to movement within stream systems – a threat for both small tributaries as well as large river systems
Water quantity Altered flows (amount and timing) due to dam operations, increased water withdrawals for agriculture and municipalities; climate change leading to low flow conditions, particularly during drought years
Water quality Reduced water quality resulting from widespread point and non-point source pollution, including: increased levels of nitrogen, phosphorus, fecal coliform bacteria, ammonia, and chlorophyll a, largely resulting from intensive poultry and swine feeding operations and suburban/urban land use; low levels of dissolved oxygen leading to dead zones; sewage treatment plants with significant downstream impacts on mussels and fish; pharmaceuticals, especially estrogen-mimicking compounds that are not filtered by wastewater treatment plants; thermal changes due to discharges
Climate change Changes in climate, particularly increased temperatures and more variable precipitation, have had (and will increasingly have) impacts on instream conditions and consequently on instream biota; sea-level rise and salt water inundation of coastal rivers and streams; increased stream temperatures due to warmer air temperatures
Energy development Natural gas extraction (hydraulic fracturing), particularly in the piedmont’s slate belt, which would have negative impacts on water quality and quantity (due to water withdrawals); associated increases in land use conversion, wastewater discharge and sand mining due to hydraulic fracturing activities; increasing demand for biofuel farming to meet the state’s renewal energy requirements
Mining Increasing potential for expanded instream gold mining
Invasives Aquatic invasive species such as Asiatic clam, invasive crayfish species, invasive aquatic plants such as alligator weed; invasive plant species within riparian zones can also impact instream conditions
Table 3. Threats to North Carolina’s freshwater systems.
52
Many of these threats impact nearly all basins in North Carolina. Threats such as climate change, dams
and other barriers, land use change due to development and agriculture, and the presence of aquatic
invasives impact every basin in the state. Other threats, such as reduced water quality due to intensive
animal feeding operations, increasing needs for water withdrawals, growing demands for energy
development, and high numbers of sewage treatment plants, are more pronounced in some parts of the
state than others and will therefore require targeted actions at those sites.
Many organizations are already working to address these threats to freshwater systems in North
Carolina, and these actions present a great number of opportunities for further work to decrease levels
of threat. In the sections below, we describe current conservation initiatives in each basin and identify
key strategies and opportunities for future action.
Key strategies and opportunities
Given the extent of freshwater systems in North Carolina and the significant number that are of high
conservation priority, it is not a surprise that many ongoing and potential opportunities to advance
freshwater conservation emerged from our workshops, our literature review, and other explorations
into these topics. Below we describe opportunities identified during the course of this study. Here we
do not focus on itemizing priorities for habitat or species conservation and restoration in specific areas
of the state, as this has been comprehensively addressed in the sections above. Instead, we focus on
opportunities related to water quantity and quality, partnership building, economic incentives,
education and outreach, and statewide opportunities to address land protection/land use and
restoration. This is by no means an exhaustive list, but should give a good sense of the breadth of
possibilities. Many opportunities were identified by multiple sources – via our literature review and our
workshops, though some we found only from our literature search. For these, we cite the relevant
works. We also present strategies and opportunities at the basin and sub-basin scale that were
identified by workshop participants (see Appendix 5). In addition, a detailed list of current freshwater
conservation initiatives in each basin and sub-basin is provided in Appendix 6.
Environmental Flows and Water Use – Statewide strategies and opportunities
Workshop participants identified a large number of statewide opportunities related to protecting or
restoring natural flow regimes and addressing threats to adequate water quantity. These included:
Work with the N.C. Department of Environment and Natural Resources to assess environmental
flow needs and incorporate these into hydrologic modeling and water management (e.g.,
through participation in DENR’s Environmental Flows Science Advisory Board), and to enhance
instream flow protection.
Reduce water use in urban areas, such as through use of more sustainable irrigation, use of grey
water rather than freshwater, or reuse of treated water (e.g., programs in Cary and Goldsboro)
whenever possible.

53
Reduce effects of altered streamflow due to stormwater runoff.
Regulate water withdrawals, particularly for surface water withdrawals, and including
mandatory reporting for all commercial agricultural users. Encourage a statewide water
allocation system (this may have particular impacts on the agriculture industry).
Garner public support for more sustainable water use practices, capitalizing on drought
occurrences and risk.
Quantify impacts of ditching on natural flow regimes.
Better understand the effects of groundwater withdrawals within critical aquifer recharge areas.
Connectivity and Dam Management – Statewide strategies and opportunities
Many flow-related concerns stem from existing dams and other barriers, and are exacerbated by the
reduced aquatic connectivity that these barriers cause. We have identified the following strategic
opportunities to improve freshwater connectivity and dam management:
Work with FERC and licensees to ensure implementation of license provisions and settlement
agreements that result in flow regimes that benefit aquatic communities.
Refine and implement guidelines for providing dam removal mitigation credits to facilitate and
fund restoration of aquatic connectivity, based on recent publication of the report “Determining
appropriate compensatory mitigation credit for dam removal projects in NC” (US ACOE et al.
2008)
Perform removal of obsolete or nonfunctional dams; there is an effort being led by American
Rivers but funding and project managers are lacking.
Engage with the Department of Transportation to prioritize culverts and bridges for replacement
and repair, and to improve transportation planning and project implementation to
avoid/mitigate direct, indirect, and cumulative impacts to freshwater systems.
Water Quality – Statewide strategies and opportunities
In addition to opportunities to address water quantity and connectivity threats, the workshop
participants identified a wide range of possible points of intervention to improve water quality,
including:
Engage in discussion regarding natural gas extraction (i.e., hydraulic fracturing), and work to
influence future gas extraction sitings in locations that will have reduced negative impacts (this
is particularly important in the Cape Fear, Yadkin-PeeDee, Neuse and Dan basins).
Improve stormwater management via low impact development, better stormwater retention
and infiltration standards, constructed wetlands, and incentives for protection of existing
wetlands.
Draft guidelines to incentivize management/treatment of greywater with reuse for irrigation or
treatment through wetlands.
Assess wastewater treatment plant locations, treatment levels (secondary, tertiary) and their
biotic impacts to identify how we can improve management of wastewater treatment through
54
plant improvements, best practice implementation, etc. Seek more stringent wastewater
standards and associated permitting.
Improve waste management/best management practice implementation at confined animal
feeding operations (NC Department of Agriculture – Soil and Water Conservation Division).
Encourage legislation to require fencing cattle out of riparian areas by incentivizing fence
construction, crossings and water source creation.
Work to attain statewide policy that will reduce levels of pharmaceuticals and personal care
products (estrogen mimicking compounds, antidepressants, insect repellents) in the water.
Increase state funding for enforcement of existing erosion and sedimentation control laws.
Build on examples of other programs for stream data collection and documentation
http://gis.vcu.edu/instar/ and application to management of lands and infrastructure
http://www.dcr.virginia.gov/stormwater_management/healthy_waters/index.shtml.
Partnership building - Statewide strategies and opportunities
Many if not most of the strategies detailed in each of these opportunities sections cannot be carried out
solely by one organization, and require developing new or rejuvenating old partnerships. Specific
opportunities related to partnership building to achieve freshwater conservation include:
Enhance partnerships to influence the State Legislature. Partners should include traditional
conservation entities, but must also include those that can make compelling ties to human
quality of life and health.
Establish partnerships with a goal of increasing the understanding of the general public
regarding freshwater conservation issues. A successful example of this was the 1999
Chattanooga symposium on aquatic systems in peril (Bibb et al. 2000), but we need to better
encourage the participation of the public and the media.
Generally, for many different strategies, we need to bring North Carolina’s conservation groups
together to focus on key issues and strategies and better coordinate efforts across the state
(this approach has been successful in the Little Tennessee basin).
Develop freshwater-focused partnerships with neighboring states. For example, partnerships
with Virginia to address invasive transfers into the Roanoke basin and flow management on the
Dan River; encourage more activity in the Yadkin/ Pee Dee, Roanoke and Catawba bi-state
commissions; expand existing partnerships with Tennessee to improve fish and mussel
restoration on the Pigeon/French Broad; and build partnerships with South Carolina to prioritize
barriers for removal – build on ongoing work at American Rivers and Duke University (Hoenke
project described above).
Work closely with USFWS to coordinate priorities for listing and recovery and to better support
programs directed at listed species recovery (NCWRC 2005).
Organize partners to develop aquatic nuisance species management plans for appropriate
basins and sub-basins (NCWRC 2005).
55
Land protection and land use - Statewide strategies and opportunities
Land protection has great potential to impact freshwater biodiversity and ecosystem functioning,
particularly for tracts immediately adjacent to the water, particularly headwaters, or in areas located
between major sources of inputs (such as CAFOs or other intensive agriculture). We have addressed
these areas of protection priority in the sections above, so here we focus on more specific opportunities
related to land protection.
Implement a statewide buffer policy for riparian zone protection, taking into account different
buffering needs based on geography (e.g., mountains vs. coastal plain).
Seek matching funds and assistance with planning and executing protection and stewardship
opportunities related to freshwater conservation on military installations.
Partner with the Department of Transportation to conduct a survey of in-stream impediments to
fish and other organism passage for aquatic connectivity within high priority watersheds.
Explore Federal Emergency Management Agency (FEMA) funding for floodplain conservation.
Work to ensure continued funding for the Clean Water Management Trust Fund (CWMTF).
Encourage use of Conservation Reserve Enhancement Program (CREP) permanent versus 30
year easements.
Work with decision-makers at local and regional levels to inform decisions that impact
important freshwater resources and encourage land protection.
Economic incentives - Statewide strategies and opportunities
Incentivizing strategies that promote freshwater conservation can significantly enhance the ability to
take strategies to scale. Some of the economic incentive-based strategies that the workshop
participants identified were:
Incentivize land use practices that improve water quality through recognition, tax breaks and
the use of new tools to examine land practices.
Provide incentives for landowners to keep their lands forested/green through conservation
districts, land trusts, CWMTF, conservation leases, and certification programs for foresty, cattle,
swine and other industries.
People are willing to pay more for organic/free range food. Create a market driven system that
encourages certification for practices that benefit water quality and quantity, and focuses on
how farmers manage the land and water, not just their animals.
Evaluate the cost of treatment for water derived from high quality watersheds (high % natural
cover) versus low quality watersheds (low % natural cover) to quantify the economic benefits of
watershed protection.
Mitigation and restoration - Statewide strategies and opportunities
Mitigation and restoration opportunities have great potential for improving the condition of freshwater
systems in North Carolina. Some, but by no means all, of the specific strategies include:
56
Partnering with restoration and mitigation programs to identify priority focus areas.
Work with the Ecosystem Enhancement Program (EEP) and other groups to more fully
incorporate ecological success criteria into stream mitigation project selection and
development.
Increase the amount of mitigation dollars that fund permanent protection and conservation of
high quality freshwater systems. For example, with DOT mitigation, the language in the general
statutes needs to be better defined. Currently there are no incentives for preservation.
Evaluate the success of restoration projects in truly restoring diverse and functional freshwater
systems.
Particularly in the Tar River basin, where initiatives are underway, build on this existing work to
gear mitigation toward preservation in the Tar tributaries.
Education and Outreach
Further develop web-based tools to communicate with a broader public audience, particularly
for resources such as fish, crayfish and mussel atlases (NCWRC 2005).
Enhance print media revolving around key freshwater conservation issues and places, and
circulate more extensively to a diverse audience (NCWRC 2005).
Educate homeowners on the impacts of fertilizer, herbicide and pesticide use.
Educate decision-makers, particularly local governments, about freshwater threats and needs
and provide tools to inform their decision-making processes.
Encourage more community involvement in river clean-up efforts, specifically national river
sweep opportunities and national public land day activities.
Provide K-12 teaching resources for science curricula to introduce students to local and
statewide threats to freshwater resources.
Information gaps and research needs
Although a considerable cumulative body of work was available for this assessment of freshwater
conservation in North Carolina, we also discovered significant information gaps and research needs,
which we identified through our literature review, our original data analyses, as well as discussions with
freshwater experts from around the Southeast.
Data on freshwater organisms and freshwater condition has been gathered across North Carolina;
however, this sampling has not been carried out evenly across the state, for various reasons. For
example, larger river sampling is often limited to specific locations required for FERC relicensing
processes or other site-specific studies. While the DWQ Basinwide Monitoring Program does survey
main stem rivers, for logistical reasons the vast majority of their sampling sites are located in wadeable
streams, which does not include larger rivers and tributaries with high flow volumes. In other locations,
such as areas in the coastal plain, and particularly in the Northeast part of the state, even wadeable
streams are not well surveyed due to limited resources. The overall result is uneven knowledge of
57
freshwater biota and freshwater conditions across the state. Filling these gaps in sampling intensity
should be a high priority, though they will require substantial investment of time and resources.
Further, as Figure 16 shows, when data on the distribution of conservation targets is combined with
information on landscape condition, areas with very good condition but low biodiversity are revealed
(e.g., areas in yellow in Figure 16). These are prime areas for further survey work, which would clarify
whether the low levels of freshwater conservation targets are due to inadequate biological data, to
authentic patterns, or to condition features not included in this analysis.
In addition to further emphasis on surveys across the state for many species of aquatic snails, crayfish,
mussels, fish and non-native species, the Wildlife Action Plan identifies specific inventory needs for each
basin. Significant progress has been achieved toward carrying out the surveys recommended in the
2005 Wildlife Action Plan, though much remains to be done. An updated Wildlife Action Plan is
currently being written, and will be completed in 2015, with new recommendations for specific species
and locations meriting further investigation. Detailed lists of species inventory and research needs are
also presented in Butler (2002), for the Southern Appalachians and in Smith et al. (2002), for much of
the Southeast, including nearly all of North Carolina.
There is also a pressing need for more detailed taxonomic studies, including molecular techniques, to
identify new, cryptic species, and to more accurately determine the spatial extent of each species’
distribution (Agapow et al. 2004). Specific needs for better taxonomic resolution have been identified in
the 2005 Wildlife Action Plan, and include: Sicklefin redhorse, Hiwassee greenside and Redline darters,
mussels and all crayfish (Hiwassee); Sicklefin redhorse, Villosa, Pleurobema, and Fusconaia mussels,
crayfish, Smoky dace, and Stonecat (Little Tennessee); Strophitus, Pleurobema and Fusconaia mussels,
and crayfish (French Broad); Crayfish and snails (Watauga); Snails (New); Snails and Redhorse suckers
(Savannah); Elliptio and Strophitus mussels and crayfish (Broad); Alasmidonta, Elliptio and Strophitus
mussels and crayfish (Catawba); Elliptio mussels, Carolina elktoe, Carolina redhorse, Thinlip chub
(Yadkin-Pee Dee); Elliptio mussels (Roanoke); Elliptio mussels (Cape Fear); Elliptio mussels, Roanoke and
Rock bass, Least brook lamprey, Bridle shiner, Carolina fatmucket (Neuse); Elliptio mussels, Roanoke and
Rock bass, Least brook lamprey (Tar-Pamlico); Elliptio mussels, killifish (Chowan); Elliptio mussels (White
Oak); and Killifish, esp. Lake Phelps killifish (Pasquotank). While some of these have been resolved since
the Wildlife Action Plan was written in 2005, most continue to require additional investigation.
Information needed for mussels in particular includes fine-scaled distribution mapping for many species,
systematics and fish host identification and interactions, and pea clam distributions (NCWRC 2005).
Crayfish distribution information is limited for some species, and information on distributional changes
and population trends is virtually non-existent. Field surveys and additional taxonomic expertise is
required to accurately assess conservation status for these species which are frequently hard to
distinguish in the field (NCWRC 2005). Freshwater snail knowledge is extremely limited, with basic
survey information lacking for nearly all species. Particular focus should be on the endemic, small snails
in the Hydrobiidae family (NCWRC 2005). There is also a strong need for extensive survey work for
aquatic insects across the region (Smith et al. 2002).
58
The existing efforts of the Wildlife Resources Commission, the NC Natural Heritage Program, and other
entities responsible for gathering aquatic data across the state need to be shared and consolidated to
assure reliable state-wide knowledge of aquatic species, to minimize any redundancy in effort, and to
maximize the output of future survey and taxonomic research. Ideally, North Carolina and neighboring
states would develop a standardized method to classify aquatic systems, and to inventory and assess
aquatic biota (Smith et al. 2002). Efforts are underway to improve data sharing and enhance
collaborations, and this forward progress must continue and even accelerate. Key partners in this
endeavor include NC DWQ, NC DOT, USFWS, USFS, TVA, universities, museums, hydropower and
forestry industries, and many others (NCWRC 2005).
In addition to more extensive inventory and taxonomic work across the state, there are substantial
information gaps in several topical areas. Of greatest need are additional studies of:
1) The ecology and life-history of priority species, particularly to understand the timing and
location of spawning, general habitat preferences, patterns of fecundity, population trajectories
and contributors to population viability, inter and intraspecific interactions, and population
genetics.
2) The impacts of non-native species on native freshwater biota.
3) Long-term patterns of population change, in ways that allow researchers to identify the
responses of freshwater biota to changing conditions (e.g., response to habitat
degradation/land cover change, or changes in water quality; NCWRC 2005, Weijters 2009).
4) The success of different conservation actions/strategies in achieving meaningful freshwater
conservation goals (NCWRC 2005).
5) Threshold levels of landscape alteration, such as land cover change that have disproportionate
impacts on in-stream biota and function (Smith et al. 2002).
6) Recent patterns of change in land use/cover, and projections of future changes in land
use/cover and human population density, to identify areas of high urgency for conservation
action (e.g., Thomas et al. 2009).
7) Flow alteration across the state, including detailed data collection and analyses of water
withdrawals (including agricultural withdrawals which are currently not well documented),
returns and transfers, and how this and other factors shape flow alteration in ways that impact
the freshwater biota.
8) The impacts of confined animal feeding operations, sewage treatment plants, and
pharmaceuticals and personal care products that are not removed through traditional water
treatment programs, on water quality and the resulting impacts on in-stream biota.
Conclusions
North Carolina’s waters support some of the richest aquatic communities in the country, yet many of
the state’s freshwater systems and the species and communities living in its waters have shown
significant declines and are highly threatened due to anthropogenic activities. Here we reviewed
59
information on the distribution of freshwater conservation targets and found much agreement among
our sources, leading to a strong picture of the location of the state’s highest quality freshwater systems.
Our analysis of landscape condition within which lies each freshwater system has shown strong
differences in condition across the state, with some parts of the coastal plain and mountain regions in
very good condition and many parts of the piedmont (and portions of the coastal plain and mountains)
in very poor condition. Combined, this information on the distribution of conservation targets and the
condition of the landscape and waters has allowed us to identify priority locations for freshwater
preservation and restoration, and areas needing further investigation. These findings from our analysis
compliment previous research to identify the state’s freshwater priorities, and together show a clear
blueprint of locations for freshwater conservation work.
We also tried to summarize the extensive opportunities that exist for freshwater conservation across the
state and to document existing efforts to engage in freshwater conservation within each of the state’s
basins. The opportunities and ongoing initiatives we described are undoubtedly a small subset of the
total range of opportunities and initiatives that exist, though we hope that they serve as a good starting
point upon which to explore and build new projects. Despite all of the ongoing activities to study,
protect and restore freshwater systems in North Carolina, there remains a pressing need for additional
information to inform our work. In itemizing some of the data gaps and information needs, we hope to
guide future investment of resources, and in so doing, help to fill some of these gaps.
It is our goal not only to review existing work and to present the details of our own analysis, but also to
facilitate the use of these data by other groups working toward freshwater conservation in North
Carolina. To this end, we have provided electronic access to the data used in our original analyses, and
they can be accessed through the internet links provided below. We hope that other groups will explore
these data and utilize the datasets that are of greatest relevance to their work. If you have questions
regarding the data contained within this report, or have questions about any of the content, please
contact Chuck Peoples at [email protected] or Margaret Fields at [email protected].
Accessing electronic data used in this report
To access the electronic datasets used in the analyses described in this report, please follow the link
below. If you have trouble accessing the data in this way, please contact Chuck Peoples or Margaret
Fields (contact information above).
https://ncfocloud.egnyte.com/publicController.do?folderName=20120601&fileName=c45df32b6fdf430a
60
References
Abell R, DM Olson, E Dinerstein et al. 2000. Freshwater ecoregions of North America: A conservation
assessment. Island Press, Washington, DC.
Adams WF, JM Alderman, RG Biggins, AG Gerberich, EP Keferl, HJ Porter, AS Van Devender. 1990. A report on the conservation status of North Carolina’s freshwater and terrestrial molluscan fauna. N.C. Wildlife Resources Commission, Raleigh, NC. Bibb KA, SJ Walsh, RG Biggins, VA Mudrak, NM Burkhead. 2000. Strategy for the conservation of Southeastern imperiled fishes. U.S. Fish and Wildlife Service and the U.S. Geological Survey. Bogan AE. 1993. Freshwater bivalve extinctions (Mollusca: Unionoida): A search for causes. American Zoologist 33:599–609.
Butler RS. 2002. Imperiled fishes of the Southern Appalachian ecosystem, with emphasis on the non-
federally listed fauna. US Fish & Wildlife Service, Asheville, NC.
Cape Fear Arch Conservation Plan. 2009. Cape Fear Arch.
Clamp JC, WF Adams, JW Reid, AY Taylor, JE Cooper, C McGrath, DJ Williams, DJ DeMont, WO McLarney, G Mottesi, J Alderman. 1999. A report on the conservation status of North Carolina’s freshwater and terrestrial crustacean fauna. N.C. Wildlife Resources Commission, Raleigh.
DeWan A, N Dubois, K Theoharides, J Boshoven. 2010. Understanding the impacts of climate change on
fish and wildlife in North Carolina. Defenders of Wildlife, Washington, D.C.
Endries M. 2011. Aquatic Species Mapping in North Carolina using Maxent. USFWS - Asheville Ecological
Services.
Etnier DA. 1997. Jeopardized Southeastern freshwater fishes: a search for causes. Pages 87–104 in GW Benz and DE Collins, editors. Aquatic fauna in peril: the Southeastern perspective. Southeast Aquatic Research Institute, Decatur, GA.
Hoenke KM. 2012. A GIS tool prioritizing dams for removal within the state of North Carolina. Masters
Project, Duke University.
LeGrand HE, SE McRae, SP Hall, and JT Finnegan. 2004. Natural Heritage Program list of the rare animal species of North Carolina. N.C. Department of Environment and Natural Resources, Natural Heritage Program, Raleigh, NC.
Miller RR, JD Williams, Williams JE. 1989. Extinctions of North American fishes during the past century.
Fisheries 14: 22-38.
61
Minckley WL, JE Deacon. 1991. Battle against extinction. Native fish management in the American West.
University of Arizona Press, Tuscon, AZ.
National Fish Habitat Board, 2010. Through a Fish’s Eye: The Status of Fish habitats in the US.
Association of Fish and Wildlife Agencies, Washington D.C.
NatureServe. 2011. NatureServe Conservation Status. Available at
http://www.natureserve.org/explorer/ranking.htm
Neves RJ, AE Bogan, JD Williams et al. 1997. Satus of aquatic mollusks in the Southeastern United States:
a downward spiral of diversity. Pages 43-86 in GW Benz an dDE Collins, eds. Aquatic fauna in peril: the
Southeastern perspective. Southeast Aquatic Research Institute. Decature, GA.
North Carolina Natural Heritage Program. 2011. Conservation Planning Tool.
Available at: www.NCNHP.org.
North Carolina Division of Water Quality Basinwide Water Quality Plans.
http://portal.ncdenr.org/web/wq/ps/bpu/basin
North Carolina Ecosystem Enhancement Program’s Restoration Plan.
http://www.nceep.net/pages/lwplanning.htm . River Basin Restoration Priorities- Targeted Local
Watersheds and Local Watershed Plans
North Carolina State Wildlife Action Plan. 2005. North Carolina Wildlife Resources Institute.
Potter K, F Cubbage, G Blank, R Schaberg. 2004. A Watershed-Scale model for Predicting Nonpoint
Pollution Risk in North Carolina. Environmental Management 34: 62-74.
Richter, BD, DP Braun, MA Mendelson, LL Master. 1997. Threats to imperiled freshwater fauna. Conservation Biology 11(5):1081–1093.
Sala OE, SF Chapin III, JJ Armesto et al. 2000. Global biodiversity scenarios for the year 2100. Science
287: 1770-1774.
Schuster GA. 1997. Resource management of freshwater crustaceans in the Southeastern United States. Pages 269–282. in GW Benz and DE Collins, editors. Aquatic fauna in peril: the Southeastern perspective. Southeast Aquatic Research Institute, Decatur, GA. Smith MP, R Schiff, A Olivero, J MacBroom. 2008. The Active River Area: A conservation framework for
protecting rivers and streams. The Nature Conservancy.
Smith RK, PL Freeman, JV Higgins, et al. 2002. Priority areas for freshwater conservation action: A
biodiversity assessment of the Southeastern United States. The Nature Conservancy.
62
Taylor CA, ML Warren, JF Fitzpatrick, HH Hobbs, RF Jezerinac, WL Pflieger, HW Robison. 1996. Conservation status of crayfishes of the United States and Canada. Fisheries 21:25–38.
Thomas N, G Dobson, P Dezendorf et al. 2009. Development of a parcel-based density analysis tool to evaluate growth patterns in western North Carolina. Journal of Conservation Planning 5: 38-53.
U.S. Army Corps of Engineers, U.S. Environmental Protection Agency, U.S. Fish and Wildlife Service, N.C.
Division of Water Quality, N.C. Wildlife Resources Commission, N.C. Division of Water Resources. 2008.
Determining appropriate compensatory mitigation credit for dam removal projects in North Carolina.
U.S. Geological Survey. 2011. Southeast Gap Analysis Project Land Cover Mapping. Available at
http://www.basic.ncsu.edu/segap/index.html
Warren ML, PL Angermeier, BM Burr, WR Haag. 1997. Decline of a diverse fish fauna: patterns of
imperilment and protection in the Southeastern United States. Pages 105–164 in GW Benz and DE
Collins, editors. Aquatic fauna in peril: the Southeastern perspective. Southeast Aquatic Research
Institute, Decatur, GA.
Warren ML, BM Burr. 1994. Status of freshwater fishes of the United States: overview of an imperiled
fauna. Fisheries 19:6–18.
Warren ML, BM Burr, SJ Walsh et al. 2000. Diversity, distribution, and conservation status of the native
freshwater fishes of the southern United States. Fisheries 25(10):7–31.
Weijters MJ, JH Janse, R Alkemade and JTA Verhoeven. 2009. Quantifying the effect of catchment land
use and water nutrient concentrations on freshwater river and stream biodiversity. Aquatic
Conservation: Marine and Freshwater Ecosystems 19: 104-112.
Williams JD, ML Warren, KS Cummings, JL Harris, RJ Neves. 1993. Conservation status of the freshwater mussels of the United States and Canada. Fisheries 18:6–22.
63
Appendix 1. Technical documentation for the development of freshwater conservation priorities based on the NC Conservation Planning Tool (CPT)
By the NC Natural Heritage Program, Allison Weakley, 2011 All GIS data were processed using ESRI’s ArcGIS 9.3 ArcMap software, including the Spatial Analyst extension. Due to the large number of data layers and features in some layers, a raster-based data model was used to store and process the layers. All conversions to ESRI GRID format used the same extent and cell size (see below). The cell size of the GRID (30m) represents the overall spatial precision of the combined data layers. For more information on these data and the conservation values (CPT Ratings) assigned to each layer, see Chapter 4 of the online documentation provided by the Natural Heritage Program at: http://www.onencnaturally.org/pages/ConservationPlanningTool.html.
Individual Layer Processing All layers were projected in NC Stateplane, NAD83, meters and have the following extent and cell size:
EXTENT North 322678.5877 South -40351.413 East 978249.376 West 119769.376
CELL SIZE 30m Buffers on individual layers were created as vectors using the ArcToolbox Buffer tool except where otherwise noted. Conversion to raster was performed using the same template to keep the extent and cell size consistent. All GRIDS were reclassified to represent their relative conservation values (CPT Rating), and NoData values were replaced with zeros.
Natural Heritage Program - NHP
Aquatic Significant Natural Heritage Areas (ASNHA) – NHP provided snha.shp (December 2011). All records with SITENAME including ‘Aquatic Habitat’ were selected. Polygons were buffered by 300 feet using the ArcToolbox Buffer tool, and the result was converted to GRID, preserving the ‘Sig’ field. Reclassified to CPT Ratings ‘Sig’ A or B = 10, C = 8.
Element Occurrences (EOs) – NHP provided nheo.shp, filtered to include only CPT-qualifying EOs (December 2011); EOs with EO_RANK of X, F, H, or D, last observed (LAST_OBS) >30 years ago, and those with ACCURACY of very low or low are excluded. The data were further filtered to only include those taxa considered aquatic (TYPE = AQUATIC). To create data for “EOs – High Ranking”, all polygons were intersected (using the Biogeography Overlapping Polygon tool) to find overlaps of EOs and the result was converted to GRID; the overlapping EOs GRID was reclassified to a CPT Rating = 5. Polygons with GRANK beginning with G1 or G2; SRANK beginning with S1; or EORANK beginning with A or B were assigned a CPT Rating = 5 in a temp field. All other EOs (“EOs – Other”) were assigned a CPT Rating = 4. Polygons were converted to GRID, preserving the temp field.
GUILDS
Core Guild Areas - NHP provided a shapefile (tnc_active_river_core_areas – November 2011) of Landscape Habitat Indicator (LHI) Guild core areas that occur within riparian areas, selected based on the occurrence of indicator species within core areas that either require riparian habitats (“obligative”) or that are strongly associated with riparian habitats (“facultative”). A SCOREINT field was created for further processing; SCOREINT is a long integer derived from the Guild Score Total *100. The shapefile was then run through a Python script to process each guild into a GRID layer. For each Guild, the polygon features are selected from the original shapefile, converted to GRID on the SCOREINT field, and reclassified to replace NoData values with 0. The original Score field provided by NHP was used to add scores together where guilds overlapped, resulting in a Guild Score Total. All the resulting GRIDs
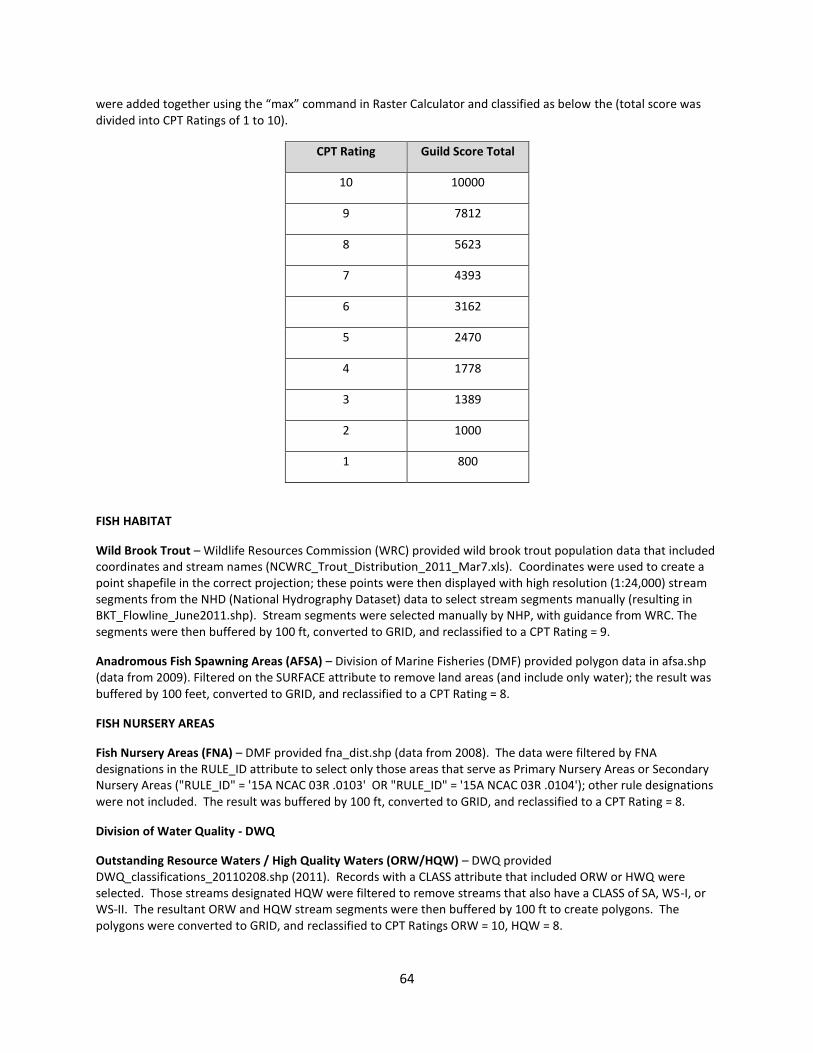
64
were added together using the “max” command in Raster Calculator and classified as below the (total score was divided into CPT Ratings of 1 to 10).
CPT Rating Guild Score Total
10 10000
9 7812
8 5623
7 4393
6 3162
5 2470
4 1778
3 1389
2 1000
1 800
FISH HABITAT
Wild Brook Trout – Wildlife Resources Commission (WRC) provided wild brook trout population data that included coordinates and stream names (NCWRC_Trout_Distribution_2011_Mar7.xls). Coordinates were used to create a point shapefile in the correct projection; these points were then displayed with high resolution (1:24,000) stream segments from the NHD (National Hydrography Dataset) data to select stream segments manually (resulting in BKT_Flowline_June2011.shp). Stream segments were selected manually by NHP, with guidance from WRC. The segments were then buffered by 100 ft, converted to GRID, and reclassified to a CPT Rating = 9.
Anadromous Fish Spawning Areas (AFSA) – Division of Marine Fisheries (DMF) provided polygon data in afsa.shp (data from 2009). Filtered on the SURFACE attribute to remove land areas (and include only water); the result was buffered by 100 feet, converted to GRID, and reclassified to a CPT Rating = 8.
FISH NURSERY AREAS
Fish Nursery Areas (FNA) – DMF provided fna_dist.shp (data from 2008). The data were filtered by FNA designations in the RULE_ID attribute to select only those areas that serve as Primary Nursery Areas or Secondary Nursery Areas ("RULE_ID" = '15A NCAC 03R .0103' OR "RULE_ID" = '15A NCAC 03R .0104'); other rule designations were not included. The result was buffered by 100 ft, converted to GRID, and reclassified to a CPT Rating = 8.
Division of Water Quality - DWQ
Outstanding Resource Waters / High Quality Waters (ORW/HQW) – DWQ provided DWQ_classifications_20110208.shp (2011). Records with a CLASS attribute that included ORW or HWQ were selected. Those streams designated HQW were filtered to remove streams that also have a CLASS of SA, WS-I, or WS-II. The resultant ORW and HQW stream segments were then buffered by 100 ft to create polygons. The polygons were converted to GRID, and reclassified to CPT Ratings ORW = 10, HQW = 8.
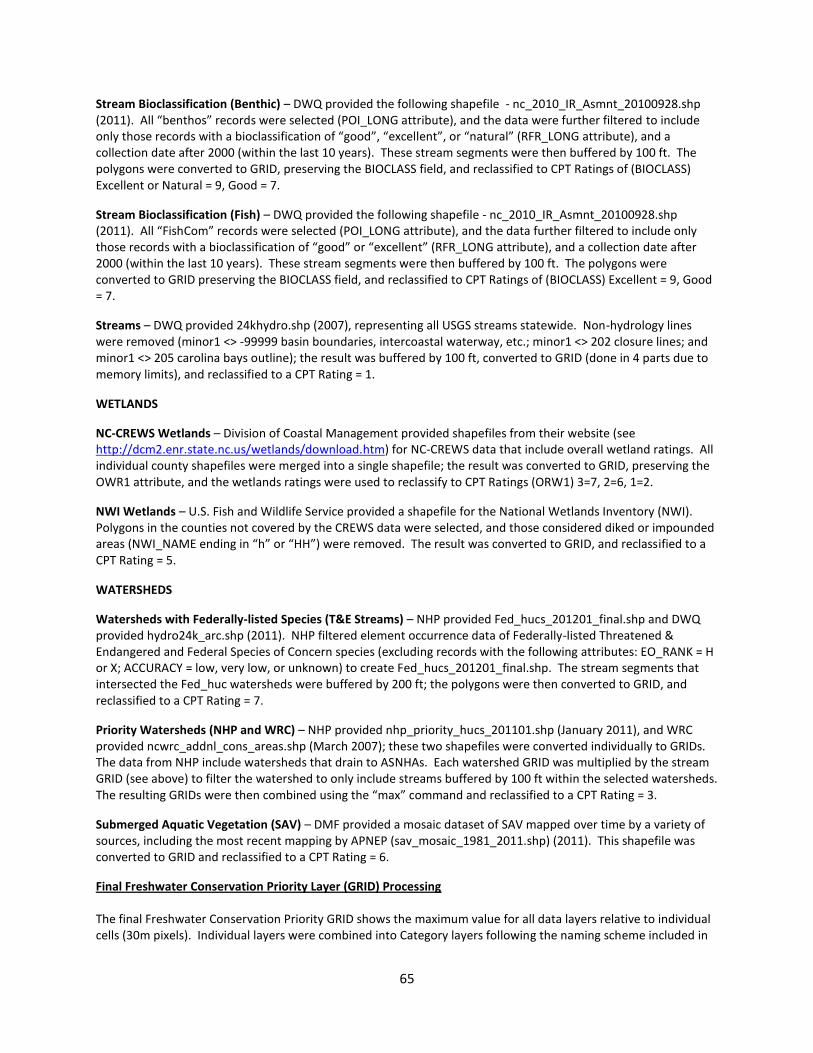
65
Stream Bioclassification (Benthic) – DWQ provided the following shapefile - nc_2010_IR_Asmnt_20100928.shp (2011). All “benthos” records were selected (POI_LONG attribute), and the data were further filtered to include only those records with a bioclassification of “good”, “excellent”, or “natural” (RFR_LONG attribute), and a collection date after 2000 (within the last 10 years). These stream segments were then buffered by 100 ft. The polygons were converted to GRID, preserving the BIOCLASS field, and reclassified to CPT Ratings of (BIOCLASS) Excellent or Natural = 9, Good = 7.
Stream Bioclassification (Fish) – DWQ provided the following shapefile - nc_2010_IR_Asmnt_20100928.shp (2011). All “FishCom” records were selected (POI_LONG attribute), and the data further filtered to include only those records with a bioclassification of “good” or “excellent” (RFR_LONG attribute), and a collection date after 2000 (within the last 10 years). These stream segments were then buffered by 100 ft. The polygons were converted to GRID preserving the BIOCLASS field, and reclassified to CPT Ratings of (BIOCLASS) Excellent = 9, Good = 7.
Streams – DWQ provided 24khydro.shp (2007), representing all USGS streams statewide. Non-hydrology lines were removed (minor1 <> -99999 basin boundaries, intercoastal waterway, etc.; minor1 <> 202 closure lines; and minor1 <> 205 carolina bays outline); the result was buffered by 100 ft, converted to GRID (done in 4 parts due to memory limits), and reclassified to a CPT Rating = 1.
WETLANDS
NC-CREWS Wetlands – Division of Coastal Management provided shapefiles from their website (see http://dcm2.enr.state.nc.us/wetlands/download.htm) for NC-CREWS data that include overall wetland ratings. All individual county shapefiles were merged into a single shapefile; the result was converted to GRID, preserving the OWR1 attribute, and the wetlands ratings were used to reclassify to CPT Ratings (ORW1) 3=7, 2=6, 1=2.
NWI Wetlands – U.S. Fish and Wildlife Service provided a shapefile for the National Wetlands Inventory (NWI). Polygons in the counties not covered by the CREWS data were selected, and those considered diked or impounded areas (NWI_NAME ending in “h” or “HH”) were removed. The result was converted to GRID, and reclassified to a CPT Rating = 5.
WATERSHEDS
Watersheds with Federally-listed Species (T&E Streams) – NHP provided Fed_hucs_201201_final.shp and DWQ provided hydro24k_arc.shp (2011). NHP filtered element occurrence data of Federally-listed Threatened & Endangered and Federal Species of Concern species (excluding records with the following attributes: EO_RANK = H or X; ACCURACY = low, very low, or unknown) to create Fed_hucs_201201_final.shp. The stream segments that intersected the Fed_huc watersheds were buffered by 200 ft; the polygons were then converted to GRID, and reclassified to a CPT Rating = 7.
Priority Watersheds (NHP and WRC) – NHP provided nhp_priority_hucs_201101.shp (January 2011), and WRC provided ncwrc_addnl_cons_areas.shp (March 2007); these two shapefiles were converted individually to GRIDs. The data from NHP include watersheds that drain to ASNHAs. Each watershed GRID was multiplied by the stream GRID (see above) to filter the watershed to only include streams buffered by 100 ft within the selected watersheds. The resulting GRIDs were then combined using the “max” command and reclassified to a CPT Rating = 3.
Submerged Aquatic Vegetation (SAV) – DMF provided a mosaic dataset of SAV mapped over time by a variety of sources, including the most recent mapping by APNEP (sav_mosaic_1981_2011.shp) (2011). This shapefile was converted to GRID and reclassified to a CPT Rating = 6.
Final Freshwater Conservation Priority Layer (GRID) Processing The final Freshwater Conservation Priority GRID shows the maximum value for all data layers relative to individual cells (30m pixels). Individual layers were combined into Category layers following the naming scheme included in

66
the CPT online documentation. See Chapter 4 of the Conservation Planning Tool online documentation (Biodiversity and Wildlife Habitat Assessment). The “max” function in Raster Calculator was used to assemble Category layers into the Final layer. A Value Attribute Table (VAT) was created to show relative values for each individual Category layer in an attribute table using the “combine” command in Raster Calculator.
67
Appendix 2. Species list used in NHP Conservation Planning Tool analysis
Scientific name Common name
Acipenser brevirostrum Shortnose Sturgeon
Agnetina capitata Northern Stone
Alasmidonta heterodon Dwarf Wedgemussel
Alasmidonta raveneliana Appalachian Elktoe
Alasmidonta robusta Carolina Elktoe
Alasmidonta sp. 2 a bivalve (Uwharries region)
Alasmidonta undulata Triangle Floater
Alasmidonta varicosa Brook Floater
Alasmidonta viridis Slippershell Mussel
Ambloplites cavifrons Roanoke Bass
Amnicola sp. 1 Waccamaw Snail
Anodonta implicata Alewife Floater
Aplodinotus grunniens Freshwater Drum
Aspiromitus appalachianus A Hornwort
Attaneuria ruralis Giant Stone
Bacopa caroliniana Blue Water-hyssop
Bacopa innominata Tropical Water-hyssop
Baetisca becki a mayfly
Baetisca obesa a mayfly
Barbaetis benfieldi Benfield's Bearded Small Minnow Mayfly
Bolotoperla rossi Smoky Willowfly
Caecidotea carolinensis Bennett's Mill Cave Water Slater
Cambarus catagius Greensboro Burrowing Crayfish
Cambarus chaugaensis Chauga Crayfish
Cambarus davidi Carolina Ladle Crayfish
Cambarus georgiae Little Tennessee Crayfish
Cambarus lenati Broad River Stream Crayfish
Cambarus parrishi Hiwassee Headwaters Crayfish
Cambarus reburrus French Broad River Crayfish
Cambarus spicatus Broad River Spiny Crayfish
Cambarus tuckasegee Tuckasegee Stream Crayfish
Carpiodes carpio River Carpsucker
Carpiodes cyprinus Quillback
Carpiodes sp. cf. velifer Atlantic Highfin Carpsucker
Ceraclea cancellata a caddisfly
Ceraclea mentiea a caddisfly
Ceraclea slossonae a caddisfly
Ceratophyllum australe Southern Hornwort
Chelonia mydas Green Seaturtle
Choroterpes basalis a mayfly
68
Cincinnatia sp. 1 Waccamaw Siltsnail
Clinostomus sp. 1 Smoky Dace
Cottus caeruleomentum Blue Ridge Sculpin
Cottus carolinae Banded Sculpin
Cryptobranchus alleganiensis Hellbender
Cyclonaias tuberculata Purple Wartyback
Cyprinella sp. 1 Thinlip Chub
Cyprinella zanema Santee Chub
Dermochelys coriacea Leatherback Seaturtle
Dibusa angata a caddisfly
Didiplis diandra Water Purslane
Diplectrona metaqui a diplectronan caddisfly
Dolania americana American Sand Burrowing Mayfly
Drunella lata a mayfly
Elassoma boehlkei Carolina Pygmy Sunfish
Elimia christyi Christy's Elimia
Elliptio dilatata Spike
Elliptio fisheriana Northern Lance
Elliptio folliculata Pod Lance
Elliptio lanceolata Yellow Lance
Elliptio marsupiobesa Cape Fear Spike
Elliptio roanokensis Roanoke Slabshell
Elliptio steinstansana Tar River Spinymussel
Elliptio waccamawensis Waccamaw Spike
Ephebe lanata Rockshag Lichen
Ephebe solida A Rockshag Lichen
Ephemerella berneri a mayfly
Erimonax monachus Spotfin Chub
Erimystax insignis eristigma Southern Blotched Chub
Eriocaulon parkeri Estuary Pipewort
Etheostoma acuticeps Sharphead Darter
Etheostoma collis Carolina Darter
Etheostoma inscriptum Turquoise Darter
Etheostoma jessiae Blueside Darter
Etheostoma kanawhae Kanawha Darter
Etheostoma mariae Pinewoods Darter
Etheostoma perlongum Waccamaw Darter
Etheostoma podostemone Riverweed Darter
Etheostoma tennesseense Tennessee Darter
Etheostoma vulneratum Wounded Darter
Exoglossum laurae Tonguetied Minnow
Exoglossum maxillingua Cutlip Minnow
Fissidens hallianus A Plume Moss
69
Fundulus cf. diaphanus Lake Phelps Killifish
Fundulus chrysotus Golden Topminnow
Fundulus confluentus Marsh Killifish
Fundulus luciae Spotfin Killifish
Fundulus waccamensis Waccamaw Killifish
Fusconaia barnesiana Tennessee Pigtoe
Fusconaia masoni Atlantic Pigtoe
Fusconaia subrotunda Long-solid
Gomphus septima Septima's Clubtail
Graptemys geographica Common Map Turtle
Helisoma eucosmium Greenfield Rams-horn
Heterandria formosa Least Killifish
Heteranthera multiflora Multiflowered Mud-plantain
Hiodon tergisus Mooneye
Homoeoneuria cahabensis Cahaba Sand-filtering Mayfly
Hottonia inflata Featherfoil
Hybopsis rubrifrons Rosyface Chub
Hygrohypnum closteri Closter's Brook-hypnum
Hypentelium roanokense Roanoke Hog Sucker
Ichthyomyzon bdellium Ohio Lamprey
Ictiobus bubalus Smallmouth Buffalo
Ictiobus niger Black Buffalo
Isoetes virginica Virginia Quillwort
Isoperla frisoni Wisconsin Stripetail
Isoperla lata Dark Stripetail
Lampetra aepyptera Least Brook Lamprey
Lampetra appendix American Brook Lamprey
Lampsilis cariosa Yellow Lampmussel
Lampsilis fasciola Wavy-rayed Lampmussel
Lampsilis fullerkati Waccamaw Fatmucket
Lampsilis radiata Eastern Lampmussel
Lampsilis sp. 2 Chameleon Lampmussel
Lampsilis splendida Rayed Pink Fatmucket
Lasmigona decorata Carolina Heelsplitter
Lasmigona holstonia Tennessee Heelsplitter
Lasmigona subviridis Green Floater
Leptodea ochracea Tidewater Mucket
Leptoxis dilatata Seep Mudalia
Ligumia nasuta Eastern Pondmussel
Lilaeopsis carolinensis Carolina Grasswort
Luxilus chrysocephalus Striped Shiner
Luziola fluitans Southern Water Grass
Macdunnoa brunnea a mayfly
70
Macromia margarita Mountain River Cruiser
Matrioptila jeanae a caddisfly
Megaceros aenigmaticus A Hornwort
Megaleuctra williamsae Williams' Rare Winter Stonefly
Menidia extensa Waccamaw Silverside
Micropterus coosae Redeye Bass
Moxostoma ariommum Bigeye Jumprock
Moxostoma breviceps Smallmouth Redhorse
Moxostoma robustum Robust Redhorse
Moxostoma sp. 2 Sicklefin Redhorse
Moxostoma sp. 3 Carolina Redhorse
Myriophyllum laxum Loose Water-milfoil
Myriophyllum tenellum Leafless Water-milfoil
Necturus lewisi Neuse River Waterdog
Necturus maculosus Common Mudpuppy
Notropis bifrenatus Bridle Shiner
Notropis lutipinnis Yellowfin Shiner
Notropis mekistocholas Cape Fear Shiner
Notropis micropteryx Highland Shiner
Notropis sp. 1 Kanawha Rosyface Shiner
Notropis volucellus Mimic Shiner
Noturus eleutherus Mountain Madtom
Noturus flavus Stonecat
Noturus furiosus Carolina Madtom
Noturus gilberti Orangefin Madtom
Noturus sp. 2 Broadtail Madtom
Ophiogomphus aspersus Brook Snaketail
Ophiogomphus howei Pygmy Snaketail
Ophiogomphus rupinsulensis Rusty Snaketail
Orconectes carolinensis North Carolina Spiny Crayfish
Orconectes virginiensis Chowanoke Crayfish
Palaeagapetus celsus a caddisfly
Pegias fabula Littlewing Pearlymussel
Percina burtoni Blotchside Logperch
Percina caprodes Logperch
Percina nigrofasciata Blackbanded Darter
Percina oxyrhynchus Sharpnose Darter
Percina rex Roanoke Logperch
Percina squamata Olive Darter
Percina williamsi Sickle Darter
Phenacobius teretulus Kanawha Minnow
Planorbella magnifica Magnificent Rams-horn
Platyhypnidium riparioides Long-beaked Water Feather Moss
71
Pleurobema collina James Spinymussel
Pleurobema oviforme Tennessee Clubshell
Polyodon spathula Paddlefish
Potamilus alatus Pink Heelsplitter
Potamogeton confervoides Conferva Pondweed
Procambarus braswelli Waccamaw Crayfish
Progomphus bellei Belle's Sanddragon
Pteronarcys comstocki Spiny Salmonfly
Ptilimnium nodosum Harperella
Rhyacophila amicis a caddisfly
Sagittaria stagnorum Water Arrowhead
Sander canadensis Sauger
Schoenoplectus acutus Hardstem Bulrush
Schoenoplectus etuberculatus Canby's Bulrush
Schoenoplectus subterminalis Swaying Bulrush
Semotilus lumbee Sandhills Chub
Somatogyrus virginicus Panhandle Pebblesnail
Sphagnum torreyanum Giant Peatmoss
Stenelmis gammoni Gammon's Stenelmis Riffle Beetle
Sternotherus minor Loggerhead Musk Turtle
Strophitus undulatus Creeper
Thoburnia hamiltoni Rustyside Sucker
Torreyochloa pallida Pale Mannagrass
Tortopus puella a mayfly
Toxolasma pullus Savannah Lilliput
Triaenodes marginatus a triaenode caddisfly
Trichechus manatus West Indian Manatee
Utricularia cornuta Horned Bladderwort
Utricularia geminiscapa Two-flowered Bladderwort
Utricularia macrorhiza Greater Bladderwort
Utricularia minor Small Bladderwort
Utricularia olivacea Dwarf Bladderwort
Utricularia resupinata Northeastern Bladderwort
Valvata sincera a valvatid snail
Villosa constricta Notched Rainbow
Villosa delumbis Eastern Creekshell
Villosa iris Rainbow
Villosa trabalis Cumberland Bean
Villosa vanuxemensis Mountain Creekshell
Villosa vaughaniana Carolina Creekshell
Viviparus intertextus Rotund Mysterysnail
Warnstorfia fluitans Floating Sickle-moss
Zapada chila Smokies Forestfly
72
Appendix 3. Active River Area (ARA) and NLCD 2006 Composition Metrics: HUC6, HUC8, HUC12, and NHDPlus catchments, description and metadata Overview: The Active River Area (ARA) was generated for the state of North Carolina at a 6-m resolution using a LIDAR-derived Digital Elevation Model (DEM) from the North Carolina Floodplain Mapping Program (NCFMP) and 100-year floodplain delineations from the NCFMP. Proportions of the NLCD 2006 Land Use/Land Cover (LULC) major classes in the ARA delineation were calculated for four different reporting units. Three of the reporting units were the following watershed scales derived from the Watershed Boundary Dataset (WBD) Hydrological Unit Codes (HUCs): HUC6, HUC8, and HUC12. The fourth reporting unit was the NHDPlus catchment polygons. In addition, LULC composition was calculated for four different size classes of the ARA for each of the four reporting units. Size classes were based on work from TNC’s Eastern Conservation Science office on a stream size classification and attribution project for the Northeast Association of Fish and Wildlife Agencies (NEAFWA) in which the NHDPlus Flowlines were classified based on the NHDPlus cumulative drainage area attribute.
North Carolina ARA Size Classes:
Size 1: headwaters, creeks, isolated lakes; drainage area 0 to < 38.61 square miles
Size 2: small rivers with their connected lake systems; drainage area 38.61 < 200 square miles
Size 3: medium tributary and mainstem rivers with their connected lake systems; drainage area 200 < 3861 square miles
Size 4: large and great rivers with their connected lake systems; drainage area > 3861 square miles
Analysis Description: The ARA was delineated and then combined with the North Carolina Floodplain Mapping Program (NCFMP) 100-year floodplain data to create the North Carolina Active River Area delineation at a spatial resolution of 6-m. Details on the delineation of the ARA can be found at the end of this document. A grid of the 2006 NLCD 30-m raster data re-classed into seven major land use types was obtained from TNC’s North Carolina Field Office. The NLCD grid was then re-sampled to a 6-m resolution and snapped to the 6-m ARA raster grid. The re-sampled NLCD 2006 grid was then extracted by the ARA grid. The ARA area of each of the six major LULC classes was calculated for each of the four reporting units. The percentage of each LULC type within the ARA was then calculated for each reporting unit. For each of the four reporting units, an Excel spreadsheet was created that includes the LULC percentage values for the ARA and the four ARA size classes. The spreadsheet values can be viewed in ArcMap by joining the HUC text or catchment COMID field to the corresponding field in the spatial data. Time Period: June 2011 Coordinate system: All input and output data is in the following coordinate system: Projected coordinate system name: NAD_1983_Albers Geographic coordinate system name: GCS_North_American_1983 Contact: Analie Barnett The Nature Conservancy Southern Resource Office Durham, NC 27713 Email: [email protected] T: 919.484.7857, ext. 131
Notes on Use:
73
As the NLCD 2006 was re-sampled from a 30-m spatial resolution to 6-m, the LULC percentages are estimates rather than absolute numbers. In addition, several of the reporting units, particularly the larger HUC6 and HUC8 watersheds encompass areas outside the state of North Carolina for which the ARA was not delineated.
ARA LULC Composition Metrics For each reporting unit, eight LULC proportion metrics were calculated for the ARA and for each of the four size classes for a total of 40 metrics for each reporting unit. A value of -99999 indicates there was no data for a particular reporting unit and/or land cover class.
Attribute Fields HUC# This field provides a unique code for each watershed derived for the Watershed Boundary Dataset data. # denotes the watershed level (i.e., 6, 8, or 12). HUC#_TEXT The numeric HUC code converted to a text field in Excel so that it can be joined to the corresponding spatial data.
COMID Common identifier of the NHD feature from the NHDPlus datset. This field is only applicable for the NHDPlus catchment data.
ARA delineation
Water Proportion of the Active River Area comprised of cells coded as water (class 11) in the NLCD 2006. Value derived from calculating using Tabulate Area with watershed as the zonal class, HUC code as the zonal field, and the ARA + NLCD 2006 as the value grid.
Developed
Proportion of the Active River Area comprised of cells coded as developed (classes 21, 22, 23, and 24) in the NLCD 2006. Value derived from calculating using Tabulate Area with watershed as the zonal class, HUC code as the zonal field, and the ARA + NLCD 2006 as the value grid. Barren Proportion of the Active River Area comprised of cells coded as Barren (class 31) in the NLCD 2006. Value derived from calculating using Tabulate Area with watershed as the zonal class, HUC code as the zonal field, and the ARA + NLCD 2006 as the value grid. Forest Proportion of the Active River Area comprised of cells coded as Forest (classes 41, 42, and 43) in the NLCD 2006. Value derived from calculating using Tabulate Area with watershed as the zonal class, HUC code as the zonal field, and the ARA + NLCD 2006 as the value grid.
Shrub.Grass Proportion of the Active River Area comprised of cells coded as Shrubland (class 52) or Grassland (class 71) in the NLCD 2006. Value derived from calculating using Tabulate Area with watershed as the zonal class, HUC code as the zonal field, and the ARA + NLCD 2006 as the value grid.
Ag
74
Proportion of the Active River Area comprised of cells coded as Agricultural land (classes 81 and 82) in the NLCD 2006. Value derived from calculating using Tabulate Area with watershed as the zonal class, HUC code as the zonal field, and the ARA + NLCD 2006 as the value grid.
Wetland Proportion of the Active River Area comprised of cells coded as wetland (classes 90 and 95) in the NLCD 2006. Value derived from calculating using Tabulate Area with watershed as the zonal class, HUC code as the zonal field, and the ARA + NLCD 2006 as the value grid.
Natural Proportion of the Active River Area comprised of cells coded as water, shrubland/grassland, forest, and wetland in the NLCD 2006. Value derived from summing proportions for the four natural classes that were calculated using Tabulate Area with watershed as the zonal class, HUC code as the zonal field, and the ARA + NLCD 2006 as the value grid.
ARA, by size classes 1 - 4
s# where “s” stands for size and “#” denotes the ARA size class from 1 to 4. s#_Water Proportion of the Active River Area comprised of cells coded as water (class 11) in the NLCD 2006. Value derived from calculating using Tabulate Area with watershed as the zonal class, HUC code as the zonal field, and the ARA + NLCD 2006 as the value grid.
s#_Developed Proportion of the Active River Area size class # comprised of cells coded as developed (classes 21, 22, 23, and 24) in the NLCD 2006. Value derived from calculating using Tabulate Area with watershed as the zonal class, HUC code as the zonal field, and the ARA + NLCD 2006 as the value grid. s#_Barren Proportion of the Active River Area comprised of cells coded as Barren (class 31) in the NLCD 2006. Value derived from calculating using Tabulate Area with watershed as the zonal class, HUC code as the zonal field, and the ARA + NLCD 2006 as the value grid.
s#_Forest Proportion of the Active River Area size class # comprised of cells coded as Forest (classes 41, 42, and 43) in the NLCD 2006. Value derived from calculating using Tabulate Area with watershed as the zonal class, HUC code as the zonal field, and the ARA + NLCD 2006 as the value grid.
s#_Shrub.Grass Proportion of the Active River Area size class # comprised of cells coded as Shrubland (class 52) or Grassland (class 71) in the NLCD 2006. Value derived from calculating using Tabulate Area with watershed as the zonal class, HUC code as the zonal field, and the ARA + NLCD 2006 as the value grid.
s#_Ag Proportion of the Active River Area size class # comprised of cells coded as Agricultural land (classes 81 and 82) in the NLCD 2006. Value derived from calculating using Tabulate Area with watershed as the zonal class, HUC code as the zonal field, and the ARA + NLCD 2006 as the value grid.
s#_Wetland Proportion of the Active River Area size class # comprised of cells coded as wetland (classes 90 and 95) in the NLCD 2006. Value derived from calculating using Tabulate Area with watershed as the zonal class, HUC code as the zonal field, and the ARA + NLCD 2006 as the value grid.
75
s#_Natural Proportion of the Active River Area comprised of cells coded as water, shrubland/grassland, forest, and wetland in the NLCD 2006. Value derived from summing proportions for the four natural classes that were calculated using Tabulate Area with watershed as the zonal class, HUC code as the zonal field, and the ARA + NLCD 2006 as the value grid.
Input Data Descriptions and Metadata
Derivation of the North Carolina Active River Area Raster Grid Input Data: 1. North Carolina Floodplain Mapping Program (NCFMP) Data http://www.ncfloodmaps.com/ Data Status: As of June 2011, data was effective for all counties in North Carolina except for Haywood. The data for Haywood was classified as “Preliminary Status.” Metadata: The metadata for the NCFMP Data can be downloaded as a pdf at http://floodmaps.nc.gov/fmis/Download.aspx by clicking on “NCFMP Geodatabase Dictionary” Metadata for individual counties is also available by downloading a DFIRM for the county of interest. Key Processing Steps:
1. For each county (n=100), download DFIRM geodatabase from the NCFMP portal at http://floodmaps.nc.gov/fmis/Download.aspx. All data was downloaded June 2011.
2. For each county, export the MapFldHazAr (Flood Hazard Polygons) to a shapefile. a. MapFldHazAr is a GIS shapefile representing the area within the flood mapping boundaries
defined by the engineering models for the 100 year, 500 year and floodway. The MapFldHazAr spatial table contains information about the flood hazard within the study area. These zones are used by FEMA to designate the Special Flood Hazard Area (SFHA), identify areas of coastal high hazard flooding, and for insurance rating purposes. These data are the flood hazard areas that are or will be depicted on the FIRM.
3. Merge the extracted MapFldHazAr shapefiles into a single shapefile for the state 4. Select the following values from the “ZONE_LID” attribute field that correspond to the 1% annual chance
floodplain boundary: a. VE b. AO c. AH d. A99 e. AR f. A g. AE
5. Convert the selected areas to a raster grid with the same resolution (6-m, 15-ft) as the LIDAR-derived Digital Elevation Model (DEM) that was used in the floodplain mapping process for North Carolina
76
2. Active River Area Description: The following paragraphs are taken from documentation written by Arlene Olivero Sheldon, TNC Eastern Region, 8/13/09, to describe the Active River Area delineated at the Eastern regional scale using a 30-m DEM and 1:100,000 hydrography. For the Pascagoula ARA delineation, 30-m elevation and 1:100,000 hydrography data were used. The Active River Area conservation framework provides a conceptual and spatially explicit basis for the assessment, protection, management, and restoration of freshwater and riparian ecosystems. The active river area framework is based upon dominant processes and disturbance regimes to identify areas within which important physical and ecological processes of the river or stream occur. The framework identifies five key subcomponents of the active river area: 1) material contribution zones, 2) meander belts, 3) riparian wetlands, 4) floodplains and 5) terraces. These areas are defined by the major physical and ecological processes associated and explained in the context of the continuum from the upper, mid and lower watershed in the ARA framework paper (Smith et al. 2008). The framework provides a spatially explicit manner for accommodating the natural ranges of variability to system hydrology, sediment transport, processing and transport of organic materials, and key biotic interactions.
GIS techniques allow the active river area components to be identified over a range of spatial scales. The Riparian Active River Area model delineates an ARA Riparian Base Zone using cost distance modeling and an additional ARA Riparian Material Contribution Zone extending approximately 90-m on either side of input water cells for those streams and rivers that do not have the ARA Riparian Base Zones covering this area already.
We expect the meander belts, riparian wetlands, ~100 year floodplains, and lower terraces to be primarily within the ARA Riparian Base Zone, however these features could not be separately distinguished in the regional scale model. Although these 4 subcomponents could not be distinguished in the regional scale model, the ARA Riparian Base Zone and ARA Riparian Material Contribution Zone are however further mapped as falling on either “wetflats” or “non-wetflat” landforms. Most riparian wetlands and longer-term floodwater storage are expected in the ARA Riparian Base Zone cells coded as wetflat landforms because it is on these landforms that we expect water is most likely accumulate and settle. It may be useful to note that the ARA Riparian Base Zone is calibrated to represent the general extent of the FEMA 100 year floodplain, although in many areas it extends outside mapped FEMA 100 year floodplain. This is expected because the FEMA 100 year floodplain does not represent the natural 100 year floodplain, but instead maps the expected areas where flooding may still occur given flood control dams, levees, and other human interventions. FEMA 100 year floodplain is also primarily only mapped zone around larger rivers. As a conservation zone, the ARA Riparian zone seeks to represent the more natural state of river processes and thus an even larger potential zone of influence/extent around all rivers and streams.
We expect the ARA Material Contribution Zone to include additional near stream/river habitat that is at higher slope than the base zone. This area may include less active terraces and is generally less subject to overbank flows and direct hydrologic connection to the stream/rivers. This area however contributes to other important riverine processes such as shading, input of woody debris, sediments, and nutrients which influence river health. This area also provides habitat to certain species more closely associated with near shore or riparian ecosystems.
The Active River area maps and conceptual framework can be used to inform management efforts such as conservation planning, the establishment of protected area networks, the development and implementation of management policies and programs, and river restoration projects. Protection of the active river area provides benefits to aquatic and terrestrial species that rely on instream, riparian and floodplain habitat to carry out their life cycles. An intact active river area also offers a wide range of benefits to society including the reduction of flood and erosion hazards, protecting water quality, and providing the many subsistence, commercial, recreational and economic benefits associated with healthy freshwater systems.
Input Data:
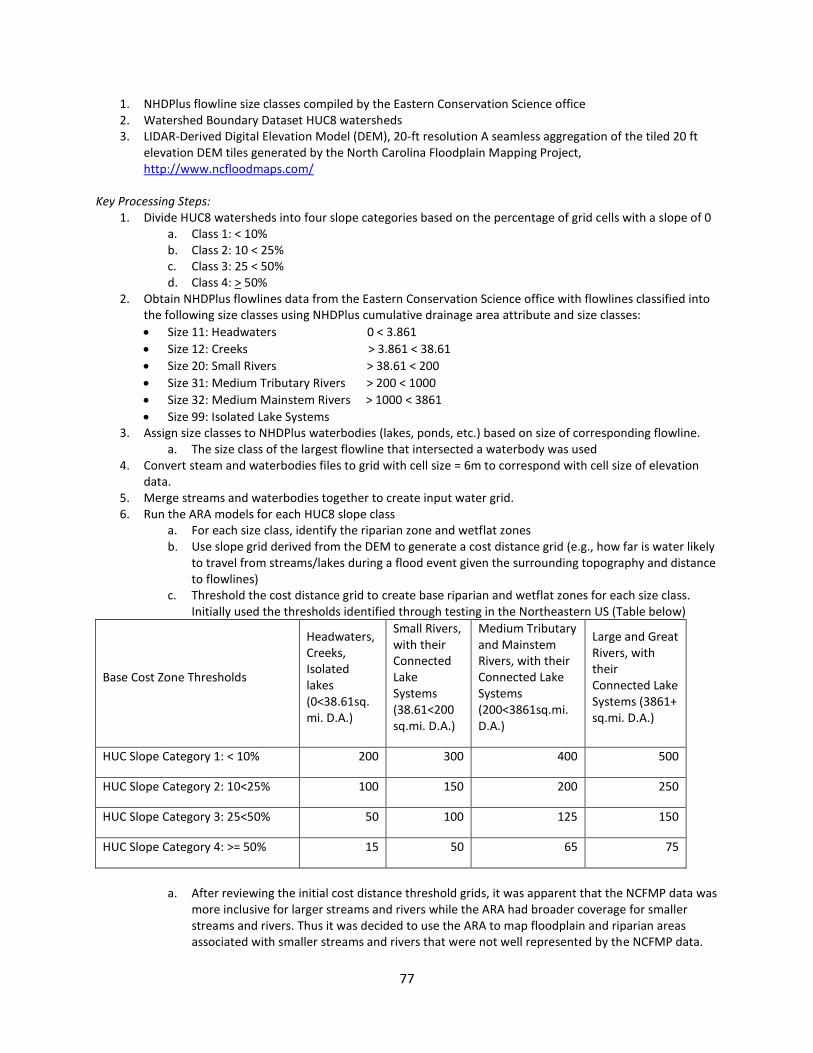
77
1. NHDPlus flowline size classes compiled by the Eastern Conservation Science office 2. Watershed Boundary Dataset HUC8 watersheds 3. LIDAR-Derived Digital Elevation Model (DEM), 20-ft resolution A seamless aggregation of the tiled 20 ft
elevation DEM tiles generated by the North Carolina Floodplain Mapping Project, http://www.ncfloodmaps.com/
Key Processing Steps:
1. Divide HUC8 watersheds into four slope categories based on the percentage of grid cells with a slope of 0 a. Class 1: < 10% b. Class 2: 10 < 25% c. Class 3: 25 < 50% d. Class 4: > 50%
2. Obtain NHDPlus flowlines data from the Eastern Conservation Science office with flowlines classified into the following size classes using NHDPlus cumulative drainage area attribute and size classes:
Size 11: Headwaters 0 < 3.861
Size 12: Creeks > 3.861 < 38.61
Size 20: Small Rivers > 38.61 < 200
Size 31: Medium Tributary Rivers > 200 < 1000
Size 32: Medium Mainstem Rivers > 1000 < 3861
Size 99: Isolated Lake Systems 3. Assign size classes to NHDPlus waterbodies (lakes, ponds, etc.) based on size of corresponding flowline.
a. The size class of the largest flowline that intersected a waterbody was used 4. Convert steam and waterbodies files to grid with cell size = 6m to correspond with cell size of elevation
data. 5. Merge streams and waterbodies together to create input water grid. 6. Run the ARA models for each HUC8 slope class
a. For each size class, identify the riparian zone and wetflat zones b. Use slope grid derived from the DEM to generate a cost distance grid (e.g., how far is water likely
to travel from streams/lakes during a flood event given the surrounding topography and distance to flowlines)
c. Threshold the cost distance grid to create base riparian and wetflat zones for each size class. Initially used the thresholds identified through testing in the Northeastern US (Table below)
Base Cost Zone Thresholds
Headwaters, Creeks, Isolated lakes (0<38.61sq.mi. D.A.)
Small Rivers, with their Connected Lake Systems (38.61<200 sq.mi. D.A.)
Medium Tributary and Mainstem Rivers, with their Connected Lake Systems (200<3861sq.mi. D.A.)
Large and Great Rivers, with their Connected Lake Systems (3861+ sq.mi. D.A.)
HUC Slope Category 1: < 10% 200 300 400 500
HUC Slope Category 2: 10<25% 100 150 200 250
HUC Slope Category 3: 25<50% 50 100 125 150
HUC Slope Category 4: >= 50% 15 50 65 75
a. After reviewing the initial cost distance threshold grids, it was apparent that the NCFMP data was
more inclusive for larger streams and rivers while the ARA had broader coverage for smaller streams and rivers. Thus it was decided to use the ARA to map floodplain and riparian areas associated with smaller streams and rivers that were not well represented by the NCFMP data.
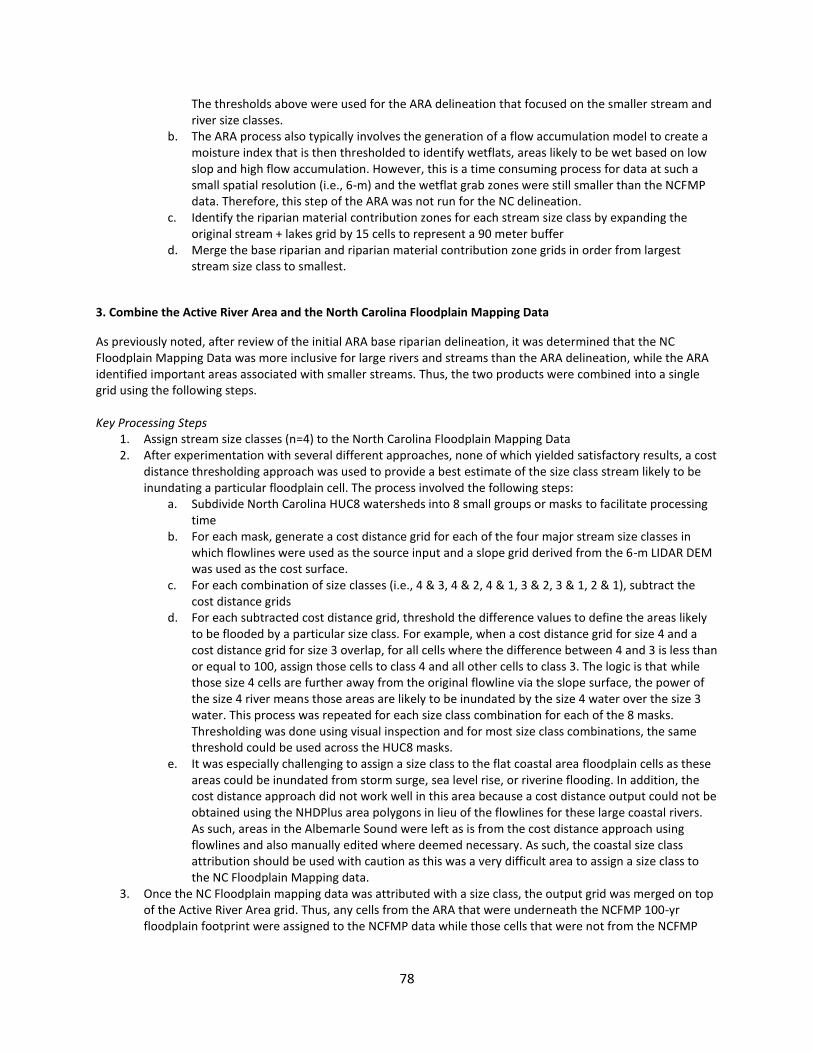
78
The thresholds above were used for the ARA delineation that focused on the smaller stream and river size classes.
b. The ARA process also typically involves the generation of a flow accumulation model to create a moisture index that is then thresholded to identify wetflats, areas likely to be wet based on low slop and high flow accumulation. However, this is a time consuming process for data at such a small spatial resolution (i.e., 6-m) and the wetflat grab zones were still smaller than the NCFMP data. Therefore, this step of the ARA was not run for the NC delineation.
c. Identify the riparian material contribution zones for each stream size class by expanding the original stream + lakes grid by 15 cells to represent a 90 meter buffer
d. Merge the base riparian and riparian material contribution zone grids in order from largest stream size class to smallest.
3. Combine the Active River Area and the North Carolina Floodplain Mapping Data
As previously noted, after review of the initial ARA base riparian delineation, it was determined that the NC Floodplain Mapping Data was more inclusive for large rivers and streams than the ARA delineation, while the ARA identified important areas associated with smaller streams. Thus, the two products were combined into a single grid using the following steps. Key Processing Steps
1. Assign stream size classes (n=4) to the North Carolina Floodplain Mapping Data 2. After experimentation with several different approaches, none of which yielded satisfactory results, a cost
distance thresholding approach was used to provide a best estimate of the size class stream likely to be inundating a particular floodplain cell. The process involved the following steps:
a. Subdivide North Carolina HUC8 watersheds into 8 small groups or masks to facilitate processing time
b. For each mask, generate a cost distance grid for each of the four major stream size classes in which flowlines were used as the source input and a slope grid derived from the 6-m LIDAR DEM was used as the cost surface.
c. For each combination of size classes (i.e., 4 & 3, 4 & 2, 4 & 1, 3 & 2, 3 & 1, 2 & 1), subtract the cost distance grids
d. For each subtracted cost distance grid, threshold the difference values to define the areas likely to be flooded by a particular size class. For example, when a cost distance grid for size 4 and a cost distance grid for size 3 overlap, for all cells where the difference between 4 and 3 is less than or equal to 100, assign those cells to class 4 and all other cells to class 3. The logic is that while those size 4 cells are further away from the original flowline via the slope surface, the power of the size 4 river means those areas are likely to be inundated by the size 4 water over the size 3 water. This process was repeated for each size class combination for each of the 8 masks. Thresholding was done using visual inspection and for most size class combinations, the same threshold could be used across the HUC8 masks.
e. It was especially challenging to assign a size class to the flat coastal area floodplain cells as these areas could be inundated from storm surge, sea level rise, or riverine flooding. In addition, the cost distance approach did not work well in this area because a cost distance output could not be obtained using the NHDPlus area polygons in lieu of the flowlines for these large coastal rivers. As such, areas in the Albemarle Sound were left as is from the cost distance approach using flowlines and also manually edited where deemed necessary. As such, the coastal size class attribution should be used with caution as this was a very difficult area to assign a size class to the NC Floodplain Mapping data.
3. Once the NC Floodplain mapping data was attributed with a size class, the output grid was merged on top of the Active River Area grid. Thus, any cells from the ARA that were underneath the NCFMP 100-yr floodplain footprint were assigned to the NCFMP data while those cells that were not from the NCFMP
79
100-yr floodplain are visible. The following attributes fields are used to identify the components of the NC ARA grid
a. 10: material contribution zone for size 1 streams (90-m buffer of input water pixels) b. 20: material contribution zone for size 2 streams and rivers (90-m buffer of input water pixels) c. 30: material contribution zone for size 3 streams and rivers (90-m buffer of input water pixels) d. 40: material contribution zone for size 4 streams and rivers (90-m buffer of input water pixels) e. 100: ARA base riparian zone for size 1 streams (cost distance threshold output) f. 200: ARA base riparian zone for size 2 streams and rivers (cost distance threshold output) g. 300: ARA base riparian zone for size 3 streams and rivers (cost distance threshold output) h. 400: ARA base riparian zone for size 4 streams and rivers (cost distance threshold output) i. 1000: NCFMP 100-yr floodplain data likely inundated by size 1 streams j. 2000: NCFMP 100-yr floodplain data likely inundated by size 2 streams and rivers k. 3000: NCFMP 100-yr floodplain data likely inundated by size 3 streams and rivers l. 4000: NCFMP 100-yr floodplain data likely inundated by size 4 streams and rivers
Metadata for Additional Input Data
1. North Carolina LIDAR-derived 20-ft Digital Elevation Model (DEM); “nc20ft_grd” Source: North Carolina Floodplain Mapping Project Brief Description: A seamless aggregation of the tiled 20 ft elevation DEM tiles generated by the North Carolina Floodplain Mapping Project, http://www.ncfloodmaps.com Available URL: http://floodmaps.nc.gov/fmis/Download.aspx
2. NHDPlus Flowlines with size classes based on cumulative drainage area Source: The Nature Conservancy (TNC) Eastern Region Conservation Science Brief Description: NHDPlus Flowlines categorized into NEAFWA size classes based on the NHDPlus cumulative drainage area attribute. Available URL: internal TNC link, file name = “reg123456_q1uninitstm.shp”
3. HUC 6 watershed boundaries. Source: Watershed Boundary Dataset (WBD) for North Carolina Brief Description: Coordinated effort between the United States Department of Agriculture-Natural Resources Conservation Service (USDA-NRCS), the United States Geological Survey (USGS), and the Environmental Protection Agency (EPA). The Watershed Boundary Dataset (WBD) was created from a variety of sources from each state and aggregated into a standard national layer for use in strategic planning and accountability. Available URL: http://datagateway.nrcs.usda.gov
4. HUC 8 watershed boundaries. Source: Watershed Boundary Dataset (WBD) for North Carolina Brief Description: Coordinated effort between the United States Department of Agriculture-Natural Resources Conservation Service (USDA-NRCS), the United States Geological Survey (USGS), and the Environmental Protection Agency (EPA). The Watershed Boundary Dataset (WBD) was created from a variety of sources from each state and aggregated into a standard national layer for use in strategic planning and accountability. Available URL: http://datagateway.nrcs.usda.gov
5. HUC 12 watershed boundaries. Source: Watershed Boundary Dataset (WBD) for Pennsylvania Brief Description: Coordinated effort between the United States Department of Agriculture-Natural Resources Conservation Service (USDA-NRCS), the United States Geological Survey (USGS), and the Environmental Protection Agency (EPA). The Watershed Boundary Dataset (WBD) was created from a

80
variety of sources from each state and aggregated into a standard national layer for use in strategic planning and accountability. Available URL: http://datagateway.nrcs.usda.gov
6. NHDPlus catchment boundaries. Source: NHDPlus Brief Description: Contains a catchment polygon for each NHD Flowline that received a catchment. Available URL: http://www.horizon-systems.com/nhdplus/data.php
81
Appendix 4. Flow alteration calculations
Contact: Analie Barnett The Nature Conservancy Southern Resource Office Durham, NC 27713 Email: [email protected] T: 919.484.7857, ext. 131
The percent area of NHD high resolution waterbodies (lakes/ponds and reservoirs) was calculated for
each NHDPlus local and network catchment as a potential proxy for flow alteration due to dams and
barriers using the following key steps.
1. The NHD high resolution geodatabases (gdb) were downloaded by state for the SARP states from ftp://nhdftp.usgs.gov/DataSets/Staged/States/
2. For each state, the waterbody data was exported from the gdb to a single shapefile, using a query to select only reservoirs (FTYPE=436) and lakes/ponds (FTYPE=390)
3. The state waterbody and reservoir shapefiles were merged into a single shapefile 4. The merged data was projected to NAD 1983 Albers importing the projection information from
an NHDPlus catchment grid 5. The merged waterbody data was clipped to the SARP footprint 6. An approximate coastal zone was created to select only those lakes/ponds that fall outside the
coastal zone (retain all reservoirs) a. Gulf of Mexico: 1-m elevation threshold was used to delimit the coastal zone b. Atlantic Coast: 2-m elevation threshold was used to delimit the coastal zone
7. The selected waterbody polygons were converted to a 30-m raster, retaining the attribute that identifies a waterbody as a reservoir or a lake/pond
8. For each NHDPlus region, the CA3T tool was used to allocate the waterbody grid to the NHDPlus catchments by calculating the area (sq km) and the area-weighted percent of lakes/ponds and reservoirs within each catchment
9. The allocated output tables for each NHDPlus region from Step 8 were merged into a single file and joined to the NHDPlus catchment shapefile by COMID
10. For each NHDPlus region, the CA3T tool was used to accumulate the waterbody area allocation and percent from 8.
11. The accumulated output tables for each NHDPlus region from Step 10 was merged into a single file and joined to the NHDPlus catchment shapefile by COMID
12. The area for the two waterbody types (lakes/ponds and reservoirs) was summed to calculate total waterbody area for each catchment
13. The accumulated area for the two waterbody types was summed to calculate total accumulated waterbody area for each catchment
14. For each catchment in the NHDPlus region, the allocated and accumulated waterbody area was divided by the local and network catchment area and multiplied by 100 to calculate the percentage of the local and network catchment comprised of a waterbody.
Local NHDPlus Catchment Scale: % Waterbody Area Summarized for each HUC watershed
82
1. Created centroid for each NHDPlus catchment to deal with cases where the catchment boundaries and HUC boundaries are not consistent. This ensures that a catchment is only assigned to a particular HUC if the majority of the catchment occurs within that HUC.
2. For each HUC scale (HUC12 and HUC8), conducted a spatial join of the NHDPlus catchment centroids to the HUC watersheds for NC’s river basins
a. For each HUC12 and HUC8 watershed, summed the waterbody area (sq km) within each catchment whose centroid was contained by a HUC12 or HUC8 watershed
3. Divided the total waterbody area within each HUC by the total HUC area (converted to sq km) and calculated this as a percent
Network NHDPlus Catchment Scale: % Waterbody Area for entire upstream drainage area for a HUC (based on NHDPlus drainage relationships)
1. Using the NHDPlus centroids, conducted spatial join of the NHDPlus catchment centroids to the HUC12 and HUC8 watersheds for NC’s river basins
a. For each HUC12 and HUC8 watershed, took the maximum mean annual flow (MAFLOWU) value for all the catchments whose centroid is contained by a HUC12 or HUC8 watershed
i. Spot checked HUC12 and HUC8 watersheds with the catchments to ensure that the most downstream catchment within a HUC12 or HUC8 watershed was selected
2. Joined the NHDPlus catchment network (accumulated) waterbody data to the HUC12 and HUC8 watershed using the unique maximum MAFLOWU value that was spatially joined to each HUC12 and HUC8 watershed
3. The resultant network catchment waterbody data joined to each HUC represents the accumulated upstream waterbody area for that catchment, plus the catchment’s waterbody area itself. For most HUC’s, this value represents the accumulated impact to flowlines that extend outside of the HUCs but to which the flowlines ultimately drain. That is, in most cases, the network drainage area for the most downstream catchment in a HUC8 or HUC12 watershed will be significantly larger than the drainage area of the HUC itself so it represents the cumulative impact of impoundments (using waterbody area as a proxy).
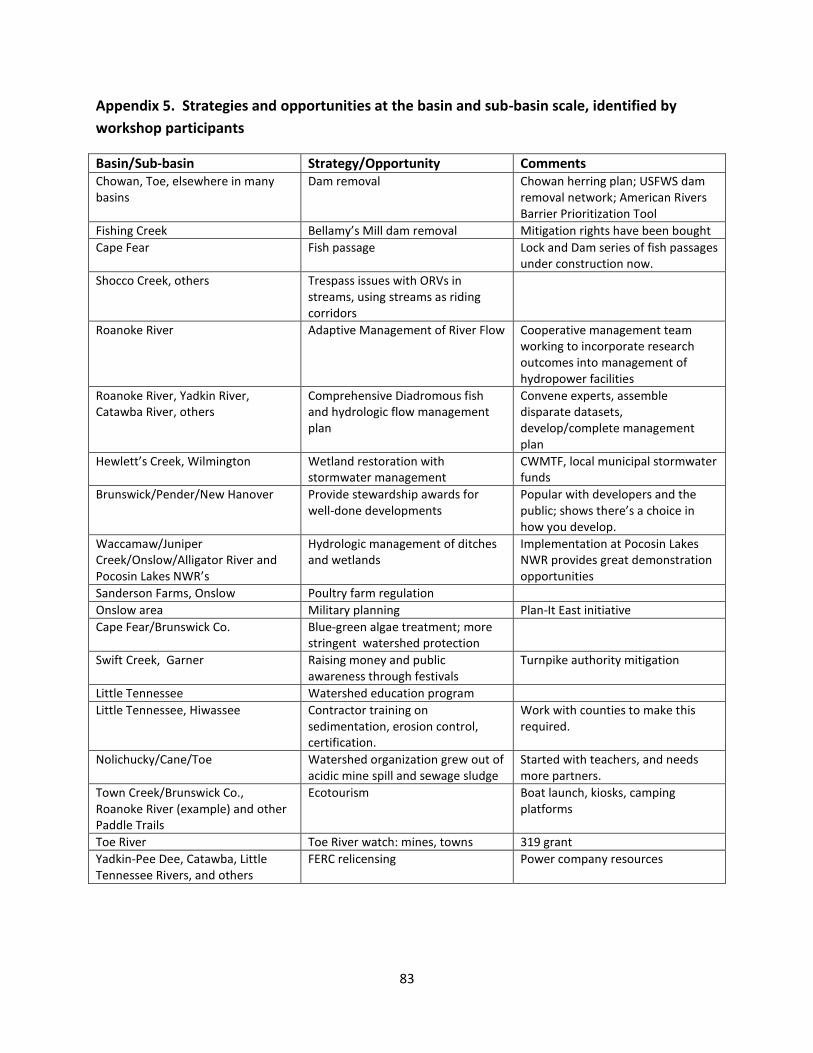
83
Appendix 5. Strategies and opportunities at the basin and sub-basin scale, identified by
workshop participants
Basin/Sub-basin Strategy/Opportunity Comments Chowan, Toe, elsewhere in many basins
Dam removal
Chowan herring plan; USFWS dam removal network; American Rivers Barrier Prioritization Tool
Fishing Creek Bellamy’s Mill dam removal Mitigation rights have been bought
Cape Fear Fish passage Lock and Dam series of fish passages under construction now.
Shocco Creek, others Trespass issues with ORVs in streams, using streams as riding corridors
Roanoke River Adaptive Management of River Flow Cooperative management team working to incorporate research outcomes into management of hydropower facilities
Roanoke River, Yadkin River, Catawba River, others
Comprehensive Diadromous fish and hydrologic flow management plan
Convene experts, assemble disparate datasets, develop/complete management plan
Hewlett’s Creek, Wilmington Wetland restoration with stormwater management
CWMTF, local municipal stormwater funds
Brunswick/Pender/New Hanover Provide stewardship awards for well-done developments
Popular with developers and the public; shows there’s a choice in how you develop.
Waccamaw/Juniper Creek/Onslow/Alligator River and Pocosin Lakes NWR’s
Hydrologic management of ditches and wetlands
Implementation at Pocosin Lakes NWR provides great demonstration opportunities
Sanderson Farms, Onslow Poultry farm regulation
Onslow area Military planning Plan-It East initiative
Cape Fear/Brunswick Co. Blue-green algae treatment; more stringent watershed protection
Swift Creek, Garner Raising money and public awareness through festivals
Turnpike authority mitigation
Little Tennessee Watershed education program
Little Tennessee, Hiwassee Contractor training on sedimentation, erosion control, certification.
Work with counties to make this required.
Nolichucky/Cane/Toe Watershed organization grew out of acidic mine spill and sewage sludge
Started with teachers, and needs more partners.
Town Creek/Brunswick Co., Roanoke River (example) and other Paddle Trails
Ecotourism Boat launch, kiosks, camping platforms
Toe River Toe River watch: mines, towns 319 grant
Yadkin-Pee Dee, Catawba, Little Tennessee Rivers, and others
FERC relicensing Power company resources
84
Appendix 6. Current freshwater conservation initiatives in each basin Below is a list of groups working toward freshwater conservation in each basin, based on findings from personal communications, published reports and articles, and internet research. This is by no means an exhaustive list, and additional information on the initiatives in each basin can be found in the Wildlife Action Plan and the DWQ Basinwide Plans. Here we try to capture the variety of organizations and activities that are active within each basin. This represents an impressive investment in freshwater research and conservation, and provides a strong platform on which to build future initiatives. Many groups, such as the Natural Heritage Program and others, frequently work at the statewide level to accomplish freshwater conservation. These initiatives are not detailed in this section, but are described in other sections of this report. ALBEMARLE-CHOWAN
TNC NC- coastal adaptation and wetland restoration (Alligator River National Wildlife Refuge)
Accurate Marine Environmental- planted 22 native trees and shrubs along Paradise Creek as part of a NFWF grant for the Chesapeake Bay (stream bank restoration)
NC Coastal Land Trust- land acquisition of property that has creek frontage along Ahoskie Creek (tributary of Chowan River).
Albemarle-Pamlico National Estuary Program (NCDENR)- water quality monitoring
Community Conservation Assistance Program- a voluntary, incentive-based program designed to improve water quality through the installation of various best management practices (BMPs) on urban, suburban and rural lands, not directly involved in agricultural production
NC EEP- river basin restoration planning, local watershed planning
Coastal and Estuarine Land Conservation Program(NOAA)
NC WRC – multiple initiatives
BROAD
Carolina Mountain Land Conservancy- land acquisition; conservation easements; upper Green River watershed is one of their main focus areas (Green River Preserve- 3,145 acres; and East fork headwaters- 786 acres for conservation) along with the Upper French Broad River watershed (Humphrey Farm- 182 acres conservation easement; Ochlawaha Bog- 27 acres for restoration)
Foothills Conservancy of NC- Facilitated the addition of the 2,556-acre Broughton/Clear Creek Watershed in 2000 & the 454-acre School for the Deaf Watershed in 2005 to South Mountains State Park, providing a new western entrance to the park & a location for a planned environmental education center; Protected Lone Mountain, a 1,245-acre tract containing the headwaters of the First Broad River, as state wildlife lands in 2005; Placed Foothills Conservancy's first conservation easement in 2000 on 114 acres of a Broad River family farm & in 2005 received donated fee interest in the property & acquired additional acres along a mile of the river to establish the conservancy's 234-acre River Bend Boundary Preserve.
Town of Lake Lure- conduct a detailed evaluation of infiltration and inflow problems and needs in the Town’s sewer
Mountain Valleys RC & D- protect 250 riparian areas through permanent conservation easements; implementation of sediment stabilization BMPs and sediment monitoring; upper broad river watershed protection program
NC WRC
Rutherford Soil & Water Conservation District- continue a program to implement agricultural BMPS
NC DENR DEH- WaDE Program (onsite wastewater, BMP implementation)
NC Rural Economic Development Center, Inc. – clean water bonds
NC Agricultural Cost Share Program- erosion reduction, sediment/nutrient delivery reduction, stream protection from animals, proper animal waste management, agricultural chemical pollution prevention
Environmental Quality Institute Volunteer Water Information Network- water quality testing/ monitoring
85
CAPE FEAR
Cape Fear River Assembly- Cape Fear River Assembly received $933,675 through EPA’s Targeted Watershed Program to address impaired water quality areas. They proposed to develop, demonstrate, and evaluate an innovative water quality nutrient trading program for the Jordan Lake watershed within the Cape Fear River Basin.
Haw River Assembly/ Haw River Watch/ Stream Steward Campaign- nonprofit citizen org. working to restore the Haw River and protect Jordan Lake using education, citizen water quality monitoring, and research as tools.
Triangle J Council of Governments- recognized as a leader in water supply protection efforts. TJCOG assisted local governments in the development of their watershed management regulations and has strongly encouraged the development of the state's minimum standards for the protection of public water supplies.
UNC Wilmington Center for Marine Science Research Programs- administers the Lower Cape Fear Program as well as a host of other environmental monitoring and research in the basin. Researchers have been involved in post-hurricane monitoring of water quality and studies of impacts of land use changes and intensive farming in the Northeast Cape Fear and Black River watersheds
NC EEP- river basin restoration planning, local watershed planning
NC WRC- conservation of the Gopher frog; Isolated Wetland Pond Restore; Implementation of the Green Growth Toolbox: Integrating NC Wildlife Action Plan priorities into local land use planning
Piedmont Land Conservancy- Upper Haw River Watershed Protection Initiative (413 Acres protected)
NCSU Water Quality Group- a multidisciplinary team that implements, analyzes and evaluates nonpoint source pollution control technologies and water quality program.
Triangle Land Conservancy – Deep River work
Cape Fear Resource Conservation and Development
Cape Fear Arch Conservation Collaboration – working extensively across the basin to identify high priority areas for protection, to promote restoration and protection, to strengthen and build partnerships working toward conservation, and to ensure long-term conservation success in the basin.
Cape Fear River Partnership – led by NOAA, this group of partners, including state and federal agency participants, academics, environmental organizations and others, is working to identify and fill data needs for migratory fish conservation in the Cape Fear basin, and to catalyze and coordinate conservation action to enhance migratory fish populations and their habitats.
The Nature Conservancy – freshwater-related land protection along the Black River, Holly Shelter Creek, Shaken Creek, Sandy Run Creek, Harrison Creek, Carver’s Creek; research in coordination with DWR on the potential for aquatic invasive control using biocontrol techniques on the Black River between Ivanhoe and Beatty’s Bridge; research in collaboration with DMF to assess the effectiveness of the rock arch fish passage at Cape Fear Lock & Dam #1 for facilitating movement of shad upstream.
Piedmont Land Conservancy- Upper Haw River Watershed Protection Initiative (413 Acres protected)
Onslow Bight Conservation Forum – Northeast Cape Fear River
NC Coastal Land Trust
CATAWBA
Catawba RiverKeeper Foundation, Inc – protection and enhancement of the Catawba River, its lakes, tributaries and watershed; regular water quality sampling
Conservation Easement Fund- preserving and protecting 1,311 acres in NC and 146 acres in SC of riparian and wetland habitats
Charlotte-Mecklenburg – post-construction controls ordinance, water quality education campaign, regional stormwater partnership, stream monitoring program, industrial/municipal inspection program, erosion control program
City of Charlotte- Pilot Best Management Practices Program, Stream and Wetland mitigation Bank, Stream & Pond Capital Projects
86
Mecklenburg County- Lake Management Program (water quality monitoring), Mc Dowell Creek Watershed Restoration, Creek ReLeaf Program (stream buffer and floodplain restoration), Capital Improvement Program (stream restoration, enhancement and preservation)
Gaston County- Sediment & Erosion Control Local Program, Stormwater Phase II Local Program
Other Organizations Active in Catawba Basin (from Basinwide Plan): NC Stream Watch, SCDHEC, Bi-State Commission, Catawba River Corridor Project, Lake James Task Force, Catawba County, Burke County, Voices and Choices, Catawba River Women’s Group, Sustainable Environment for Quality of Life, Catawba Land Conservancy, Foothills Land Conservancy, Catawba River Foundation, Trout Unlimited, American Rivers Catawba-Wateree Relicensing, NC Wildlife Foundation, VWIN and The Trust for Public Land.
Duke Energy- Catawba River is a major environmental asset in the Duke Energy service area
Foothills Conservancy of NC- Via a generous bargain sale in 2005, acquired 753 acres sheltering Catawba River headwaters above Old Fort & an adjacent 130 acres to establish the June Carol Adams Preserve. In 2005-06, placed conservation easements on 477 adjoining acres; In February this year, protected 2,800 acres at the confluence of the Johns and Catawba Rivers as state game land in an $11.5 million Duke-Energy hydro-relicensing related deal supported by the N. C. Clean Water Management Trust Fund; Secured CWMTF support for Riparian Protection planning and landowner outreach for the Catawba River's headwaters near Old Fort.
FRENCH BROAD
NC EEP- river basin restoration planning, local watershed planning
DWQ Asheville Regional Office Watershed Initiative- current projects in the French Broad basin include: The Mills River Watershed, Richland Creek Watershed, and North Toe River Watershed
French Broad River Volunteer Buffer Partnership- The Land-of-Sky Regional Council, using grants from the Clean Water Management Trust Fund and Tennessee Valley Authority, initiated the Voluntary Buffer Partnership to develop a comprehensive plan for protecting and restoring riparian buffers along the mainstem of the French Broad River in four counties. The partnership has developed a “toolbox” of possible buffer protection/restoration options and is continually working with landowners to stabilize streambanks and preserve buffers using conservation easements.
Western North Carolina Alliance- supports the development and enforcement of standards and regulations sufficient to protect surface waters and ground water from sediment, organic pollution, and toxins; and to preserve and restore waterways as healthy ecosystems, as well as recreational and esthetic resources.
French Broad Riverkeeper
Environmental and Conservation Organization- test stream health with biomonitoring, chemical monitoring, bacterial monitoring, adopt-a-stream programs, sedimentation control as well as —Big Sweep, the state’s largest watershed cleanup initiative. The newest innovation, SWAT team (Stream Water Action Teams) follows up on waterways that have been flagged as problematic.
Haywood Waterways Association- focuses on reducing nonpoint pollution in the Pigeon River watershed. HWA works through a variety of voluntary initiatives including educational programs, greenways, information and work sessions, erosion control workshops, and obtaining grants and other resources to address nonpoint pollution.
Volunteer Water Information Network- water quality monitoring program where trained volunteers collect water from 224 sites throughout Buncombe, Henderson, Madison and Transylvania counties; 139 of these sites are in the French Broad River basin. Samples are analyzed in a state certified lab at UNC-Asheville for parameters such as turbidity, suspended solids, pH, alkalinity, conductivity and heavy metals such as zinc, copper and lead.
RiverLink- Recent projects include the installation of Best Management Practices to reduce stormwater runoff and bank stabilization to reduce sedimentation in the Swannanoa River watershed
Mud Creek Watershed Restoration Council- the council has developed a restoration plan and implementation strategy to improve water quality, increased public awareness and appreciation of the watershed, promoted farmland conservation and the restoration of wetlands, and set water quality priorities.
87
USDA Natural Resource Conservation Service Programs- Conservation Reserve Program, Environmental Quality incentives Program, Emergency Watershed Protection Program, Wetland Reserve Program, Conservation Security Program
NC WRC- implementation of the Green Growth Toolbox: Integrating NC Wildlife Actoin Plan priorities into local land use planning
Alcoa Power- NC Resource Management and Enhancement Fund
LITTLE TENNESSEE AND HIWASSEE
Little Tennessee Watershed Association (LTWA)- long term biological monitoring, stream bank restoration, education
Land Trust for the Little Tennessee River- Rural land Conservation to help conserve the landscape of the upper Little Tennessee and Hiwassee River valleys by protecting private land from inappropriate development; As of September 2009, LTLT has protected 3564 acres through conservation easements, and another 1278 acres through acquisition; land stewardship- stream side reforestation, stream bank stabilization, invasive exotic plant control, and wetland restoration.
Upper Cullasaja Watershed Association- Assessment of Mill Creek 303(d) and monger Creek, watershed strategy and action plan, long term rainfall data collection, volunteer water quality monitoring, public education, erosion and sediment control consulting
Watershed Assoc. of the Tuckasegee River- long term biological monitoring, volunteer water quality monitoring, watershed planning, education
Little Tennessee Non Point Source Team- regular roundtable discussions among resource professionals and nonprofit organizations, sediment and erosion impact education, 2006 basinwide planning conference
NC EEP- river basin restoration planning, local watershed planning
Southern Appalachian Highlands Conservancy
NC WRC- purchased acres along the Little TN river and tributaries
Alcoa Power Generating Inc.
Duke Power
Cherokee County Soil and Water Conservation District
Clay County Soil and Water Conservation District
Hiwassee River Watershed Coalition Inc.- facilitates water quality improvements throughout the watershed; bank stabilization and riparian buffer enhancement; The Andrews Rec Park Project (July 2005) was a Priority 1 stream restoration project and riparian buffer planting and enhancement taking place along 970 linear feet of Town Branch in Andrews, NC.
LUMBER
Winyah Rivers Foundation/ Waccamaw Riverkeeper- o Waccamaw Riverkeeper- engaged in implementing two new programs:
1) Expanding an existing Volunteer Water Quality monitoring program upstream to NC to include sampling locations along the Waccamaw River and in Lake Waccamaw
2) Establish a Muddy Water Watch program- Volunteers will be trained to identify and report occurrences of erosion and sedimentation that are in violation of State law and that pose a threat to water quality
Waccamaw Watershed Academy (Coastal Carolina University)- delivers educational, research, and public outreach services to the university and local region
Sand Hills Area Land Trust
NC Coastal Land Trust- NC Coastal Land Trust purchased a landowner agreement for 296 acres in Columbus County along four miles of the Waccamaw River. This purchase was funded by the CWMTF and the Attorney General’s Environmental Enhancement Grant Program. It will help to protect water quality and wildlife.
88
The Nature Conservancy – Freshwater-related land protection in a variety of locations throughout the Lumber Basin, including Juniper Creek and its tributaries, Lake Waccamaw, headwaters of Lockwoods Folly, Drowning Creek, Carver’s Creek; involvement in the Waccamaw Blue Trail project.
Friends of the Lake Waccamaw State Park- members and volunteers have been committed to the protection of water quality and the national significance for biological diversity on the park lands and in Lake Waccamaw as well as the Waccamaw River watershed. Initiatives include funding for projects to improve and support clean water in and around Lake Waccamaw and the Waccamaw River.
Cape Fear Resource Conservation and Development- conducted a debris removal project with a $182,091 grant from the Division of Water Resources.
Cape Fear Arch Conservation Collaboration
NC Coastal Land Trust
NEUSE
Ellerbe Creek Watershed Association- watershed restoration, storm water impact reduction, stormwater runoff reduction, water quality monitoring
Friends of South Ellerbe Creek- informal group of citizens dedicated to conserving and enhancing the scenic, recreational, natural and historic qualities of South Ellerbe Creel. Urban stream cleanup.
Eno River Association- non-profit conservation org. Efforts to date have resulted in almost 5,500 acres of protected lands.
Upper Neuse River Basin Assoc.- consists of 14 local governments that provide an ongoing forum to address watershed management issues. UNRBA has created a comprehensive, integrated watershed management plan for the Upper Neuse River Basin. The plan was developed in partnership with the state Division of Water Quality and accepted by the UNRBA Board of Directors in 2003. The watershed management plan includes an assessment of water quality and related water quantity management and a work plan that describes proposed water quality protection strategies, including point and nonpoint source programs.
Upper Neuse Clean Water Initiative- a partnership effort to prioritize and, through voluntary actions, protect those lands most critical for the long-term safety and health of all drinking water supplies for the communities in the Upper Neuse River Basin. Comprised of 3 major components: comprehensive conservation planning; outreach to landowners, local governments, and the public; and acquisition through the purchase or donation of land or conservation easements from willing sellers of properties identified in the plan as high priority.
Riparian Corridor Conservation Program- Clean Water Management Trust Fund (CWMTF) – Conservation Trust for North Carolina (CTNC) Riparian Corridor Conservation Program facilitates the identification and establishment of integrated networks of protected areas and forested riparian corridors. More specifically, the program involves pass through funding from CWMTF, through CTNC, to the state’s 24 local and regional land trusts to develop conservation plans with detailed analysis of a defined project area and prioritization of waterfront parcels for protection and restoration based on each property's impacts on water quality in a targeted stream segment.
Conservation Trust for NC- Conservation Trust for North Carolina and CWMTF have funded three riparian corridor conservation plans in the Neuse River basin. Plans were prepared for the Eno River, upper Neuse subbasin and Lower Swift Creek.
Triangle Land Conservancy- protecting important open space—stream corridors, forests, wildlife habitat, farmland and natural areas—in Chatham, Durham, Johnston, Lee, Orange and Wake counties. TLC identifies the most significant and threatened lands in the triangle region; plans with local communities for their protection; conserves these lands through purchase or private conservation agreements; manages these lands; and promotes positive conservation approaches and the protection of open space.
Triangle J Council of Governments- public water supply protection
Neuse River Foundation, Inc.- educating the public, advocating for clean water and fighting to stop water pollution.
89
o Neuse Riverkeeper foundation- protects, restores and preserves the Neuse River basin through education, advocacy and enforcement, in order to provide clean water for drinking, recreation and enjoyment
Lower Neuse Basin Assoc.- an association that represents 23 permitted facilities owned by 18 municipalities and industries with wastewater treatment facilities permitted to discharge treated wastewater into the Neuse River below Falls of the Neuse Dam.
NC EEP- river basin restoration planning, local watershed planning
Coastal and Estuarine Conservation Program- The program provides funding for projects that ensure conservation of these areas for the benefit of future generations, giving priority lands which can be effectively managed and protected, and that have significant ecological value.
Community Conservation Assistance Program- a voluntary, incentive-based program designed to improve water quality through the installation of various best management practices (BMPs) on urban, suburban and rural lands, not directly involved in agricultural production.
NCSU WECO- Black Creek Watershed restoration
NC WRC- implementation of the Green Growth Toolbox: Integrating NC Wildlife Action Plan priorities into local land use planning
Black Creek Watershed Association- Restoration of a degraded urban watershed through stormwater BMPs at the town, institutional and residential level.
Onslow Bight Conservation Forum
NC Coastal Land Trust
NEW
New River Community Partners- provides support and assistance to local and regional groups for those projects described in the New River Watershed Work Plan; coordinates with the River Navigator to create new partnerships with state and federal agencies and provide training and technical assistance related to water quality
National Committee for the New River- implementing the Five Year River Protection Plan, awarded funding from the CWMTF for land protection and streambank restoration projects, coordinates the New River Big Sweet clean-up efforts every Sept./Oct., established a volunteer water quality monitoring program, working to protect nearly 1,000 acres of forested land and build a greenway in the historic district of Todd, established the River Builder Program to help re-establish riparian vegetation along streambanks
Middle Fork Greenway Association- received two grants from CWMTF for surveys, environmental site assessments and legal fees to secure easements, developed the Middle Fork Greenway Trail Feasibility Study, increasing community awareness of watershed protection and streambank erosion
Blue Ridge Rural land Trust- participated in the designation of Beech Creek Bog as a State natural Area, is working with the Conservation Trust of NC to buy Bullhead Mountain, and has acquired several conservation easements
NC EEP- river basin restoration planning, local watershed planning
National Committee for the New River- stream bank and riparian buffer restoration (River Builder Program); helped to protect over 4,500 acres – for a total of 28.7 miles along the river and its tributaries – and is currently working on many additional projects in the New River Basin.
Blue Ridge Parkway Foundation- restore eroding stream banks and riparian areas
ROANOKE
Roanoke River Basin Association- participation in the Virginia Roanoke River Basin Advisory Committee, Participation in the USACOE Kerr 216 study, Participation in the current American Electric Power relicensing study at Smith Mountain Lake, participating in the Stakeholders Board for the control of nuisance aquatic plants in Lake Gaston
The Nature Conservancy - extensive land protection along the lower Roanoke, and ongoing collaboration with Army Corps of Engineers and Dominion Power to assess historical and current flow regimes and ecological impacts
90
Piedmont Land Conservancy- protected 2,248 acres in Stokes and Rockingham Counties (part of Dan River Watershed Protection Initiative)
Dan River Basin Association - focuses on river access, citizen watershed awareness and river recreation
Albemarle-Pamlico National Estuary Program (NCDENR)- water quality monitoring
National Wildlife Refuge System- protects and enhances wooded wetlands consisting of bottomland hardwoods and swamps with high waterfowl value along the Roanoke River. Administered by the US FWS
NC EEP- river basin restoration planning, local watershed planning
SAVANNAH
NC EEP- river basin restoration planning, local watershed planning TAR-PAMLICO
Conservation Trust for NC- Upper Neuse Clean Water Initiative, conservation easements, protection of Nationally Significant Aquatic Habitats
TNC NC- Coastal adaptation and wetland restoration on Alligator River National Wildlife Refuge; protection of rare aquatic species and Nationally Significant Aquatic Habitats
Tar River Land Conservancy- conservation easements and protection of riparian buffers , riparian corridor conservation
NC EEP- river basin restoration planning, local watershed planning
Albemarle-Pamlico National Estuary Program (NCDENR)- water quality monitoring
Significant purchase of game lands and Medoc addition through actions of The Nature Conservancy
USFWS development of strategic habitat plan for Dwarfwedge mussell and Tar River spiny mussell (both federally endangered species)
NC Coastal Land Trust
WHITE OAK
New River Foundation- restoration and protection of local public trust waters though education and stewardship
Onslow County Water Quality Project- initiative by the Onslow County Commissioners in 1999
Stewards of The White Oak River Basin- trash clean-up
The Nature Conservancy – protection of headwater streams within the New River (White Oak) drainage
White Oak River Watershed Advisory Board- a citizen stakeholder-based organization, was convened and coordinated by the Watershed Education for Communities and Officials (WECO) of NC State University in response to citizens’ concerns about the White Oak River. The board was convened to review technical water quality and policy information to develop consensus-based management strategies and policy options targeted at water quality problems in the river. Active from 1997-2005
North River Farms Restoration project- Restoration activities have involved land acquisition by NCCF (4200 ac.), 1809 Partnership (1400 ac.), and Restoration Systems (400 ac.). All of these areas are under conservation easement and will be restored over a ten-year time period. As of 2006, restoration was complete on 550 acres of North River Farms, with 230 additional acres scheduled to be completed in 2007. Eventually approximately 5,000 acres of prior converted cropland will be restored to wetlands.
Onslow Bight Conservation Forum- several governmental agencies and private conservation groups with land holdings in the landscape as well as other interested agencies and groups found common ground in the need to maintain and enhance conservation. An estuarine conservation plan is being developed; the estuarine waters of Carteret County have been identified as potential priority sites in the White Oak Basin.
Onslow County, City of Jacksonville, and Camp Lejeune- sought funding and have covered approximately 30 stream miles for alligatorweed control in 2006. Jacksonville and Onslow both had cost share agreements with DENR Aquatic Weed Control Program for herbicide spraying of alligatorweed. The Marine Corps bases used alligatorweed flea beetles on Southwest Creek and herbicides on recreational ponds aboard the bases. Onslow Cooperative Extension had an Integrated Pest Management (IPM) grant that provided alligatorweed flea beetles and herbicides.
91
NC Coastal Nonpoint Source Program- Bioretention Design and installation at Carteret Community College, Outreach on Coastal Microbial Pollution, Crystal Coast Visitor Stormwater Treatment Practice Design, Erosion and Sedimentation Control Compliance workshops, Funding of a Water Quality Planning Specialist at NCSU, Wetland Training for the Division of Coastal Management Staff, Watershed Characterization study to support fecal coliform TMDL development, Supporting the NC Clean Marina Program
NC EEP- river basin restoration planning, local watershed planning
Coastal and Estuarine Land Conservation Program(NOAA)
NC WRC – multiple initiatives
Onslow Bight Conservation Forum
NC Coastal Land Trust
YADKIN
Alcoa Power Generating, Inc. and Progress Energy - The Uwharrie Lakes Region is comprised of six hydroelectric projects that stretch from near Salisbury, North Carolina downstream approximately 74 river miles to Blewett Falls Dam near Rockingham, North Carolina. The six hydroelectric projects include the four upstream dams operated by Alcoa Power Generating, Inc. (APGI) and two lower dams operated by Progress Energy.
Foothills Land Conservancy of NC- Secured a federal Scenic Byways grant to support conservation outreach beginning later this year with landowners on three scenic byways, including the byway along the Yadkin River through Happy Valley.
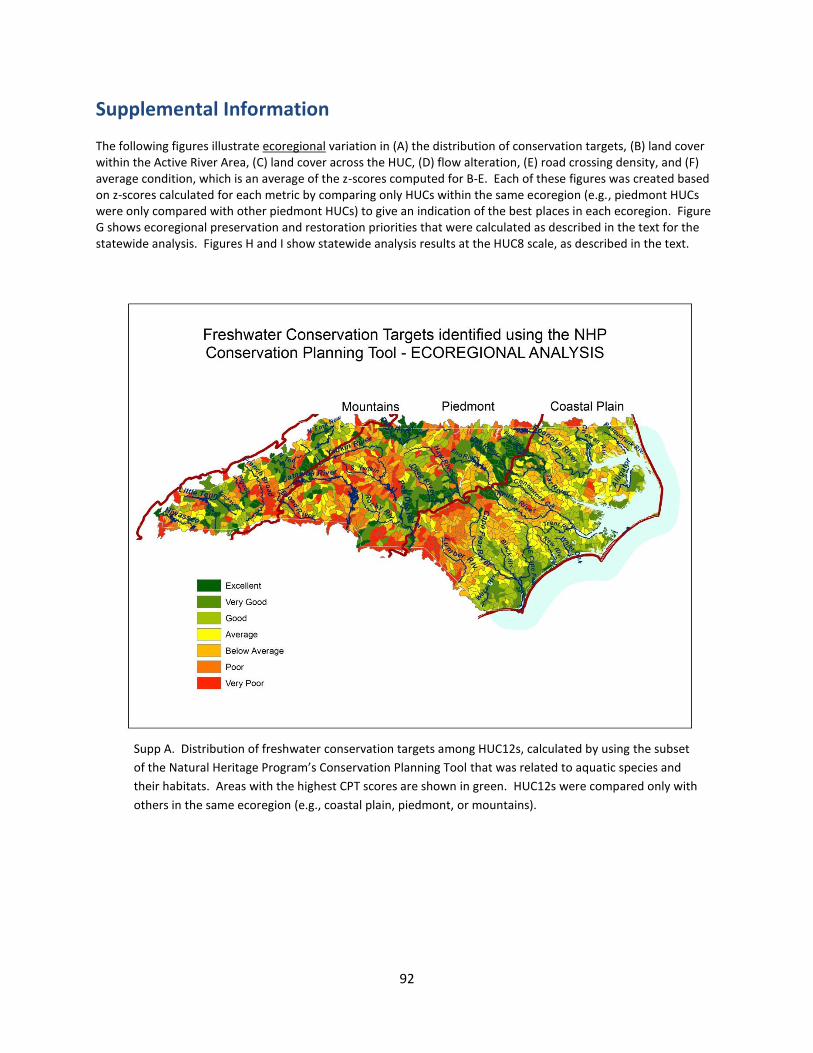
92
Supplemental Information The following figures illustrate ecoregional variation in (A) the distribution of conservation targets, (B) land cover within the Active River Area, (C) land cover across the HUC, (D) flow alteration, (E) road crossing density, and (F) average condition, which is an average of the z-scores computed for B-E. Each of these figures was created based on z-scores calculated for each metric by comparing only HUCs within the same ecoregion (e.g., piedmont HUCs were only compared with other piedmont HUCs) to give an indication of the best places in each ecoregion. Figure G shows ecoregional preservation and restoration priorities that were calculated as described in the text for the statewide analysis. Figures H and I show statewide analysis results at the HUC8 scale, as described in the text.
Supp A. Distribution of freshwater conservation targets among HUC12s, calculated by using the subset
of the Natural Heritage Program’s Conservation Planning Tool that was related to aquatic species and
their habitats. Areas with the highest CPT scores are shown in green. HUC12s were compared only with
others in the same ecoregion (e.g., coastal plain, piedmont, or mountains).
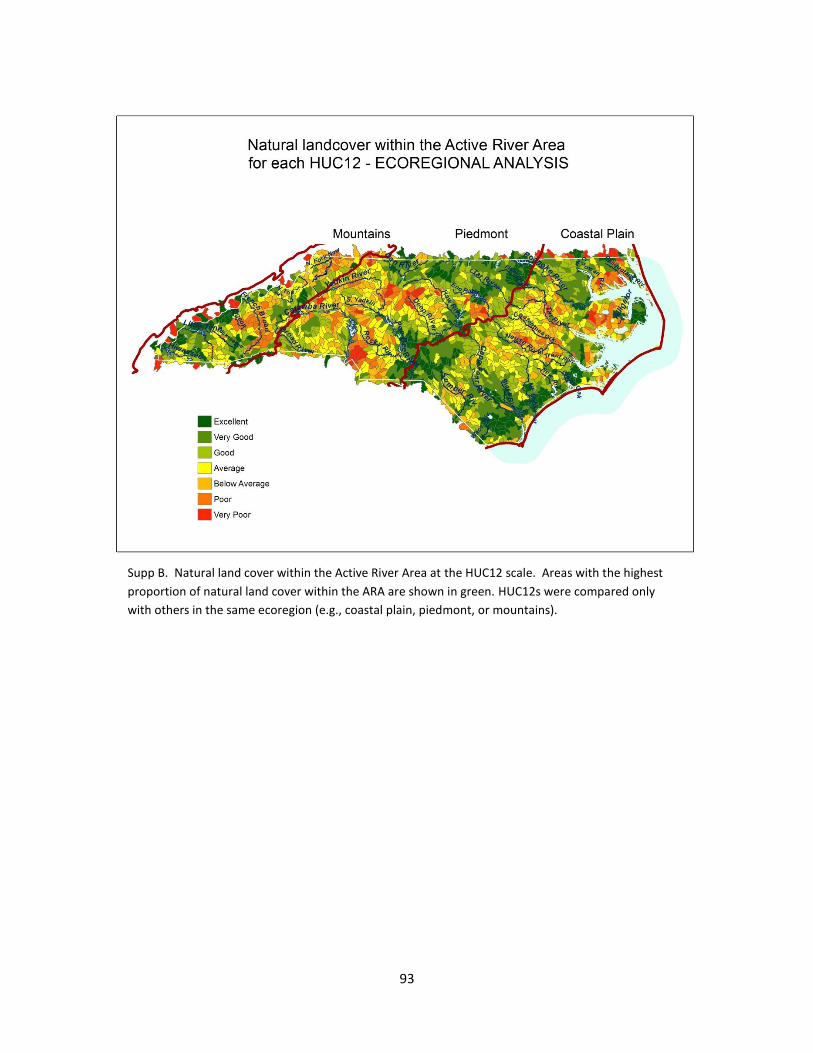
93
Supp B. Natural land cover within the Active River Area at the HUC12 scale. Areas with the highest
proportion of natural land cover within the ARA are shown in green. HUC12s were compared only
with others in the same ecoregion (e.g., coastal plain, piedmont, or mountains).
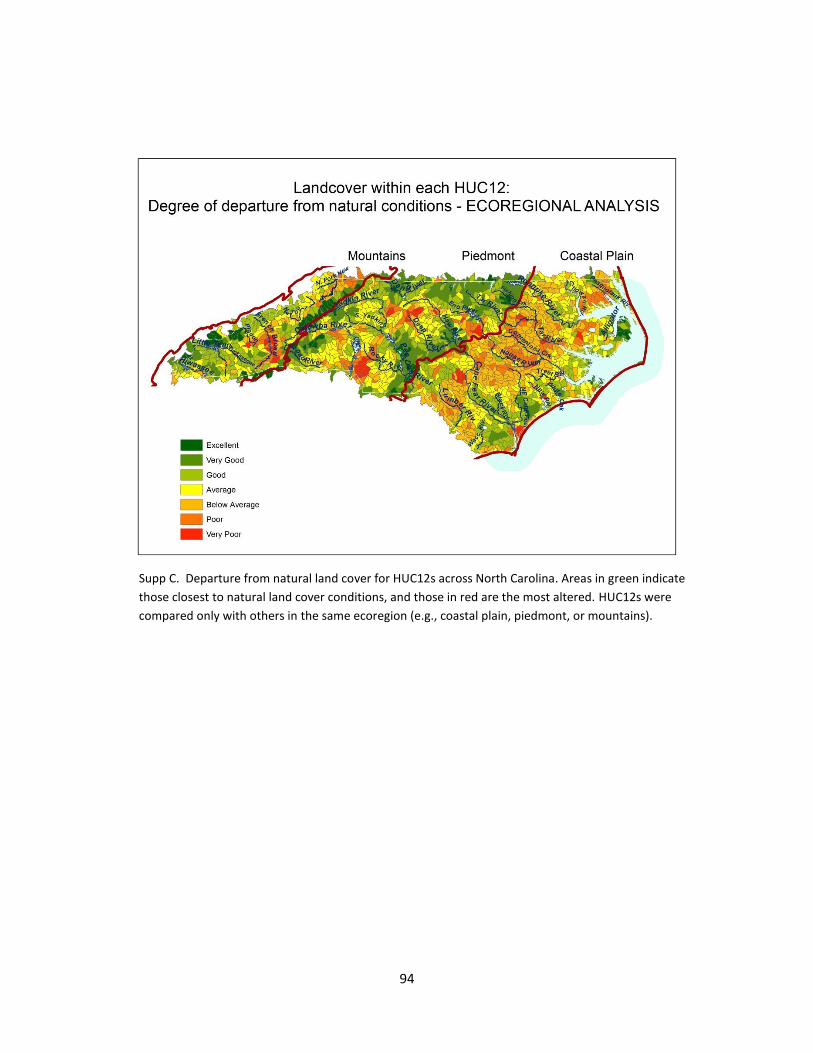
94
Supp C. Departure from natural land cover for HUC12s across North Carolina. Areas in green indicate
those closest to natural land cover conditions, and those in red are the most altered. HUC12s were
compared only with others in the same ecoregion (e.g., coastal plain, piedmont, or mountains).
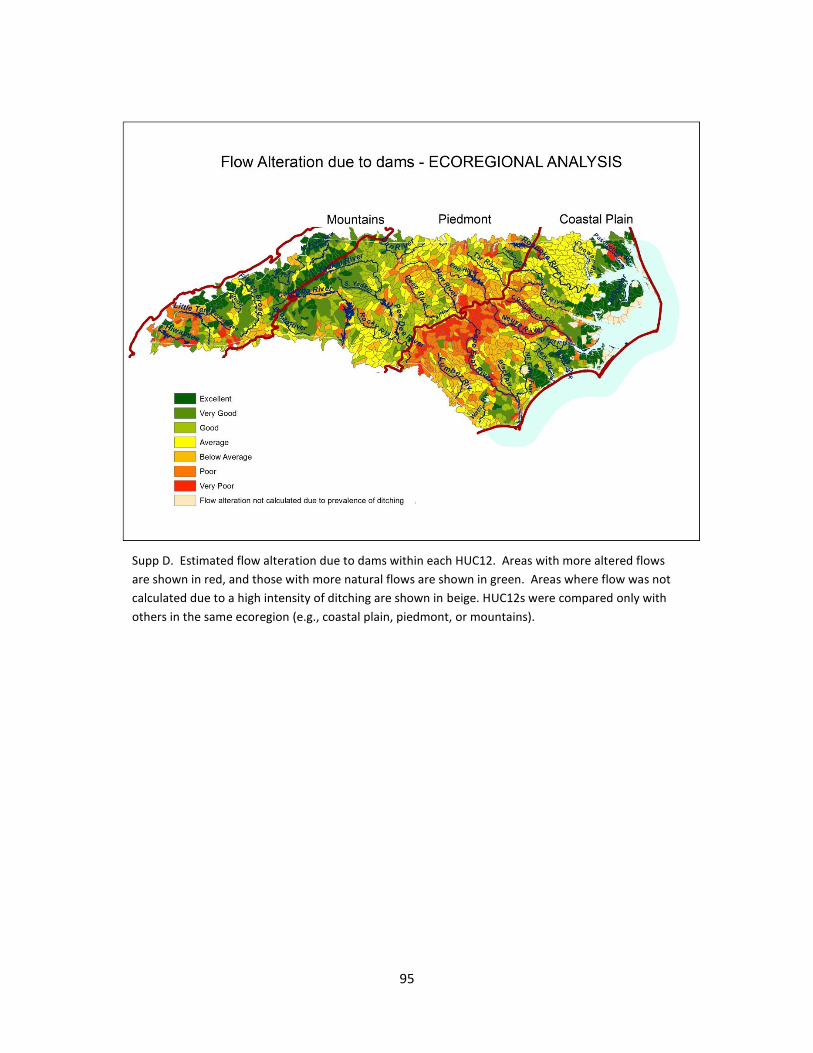
95
Supp D. Estimated flow alteration due to dams within each HUC12. Areas with more altered flows
are shown in red, and those with more natural flows are shown in green. Areas where flow was not
calculated due to a high intensity of ditching are shown in beige. HUC12s were compared only with
others in the same ecoregion (e.g., coastal plain, piedmont, or mountains).
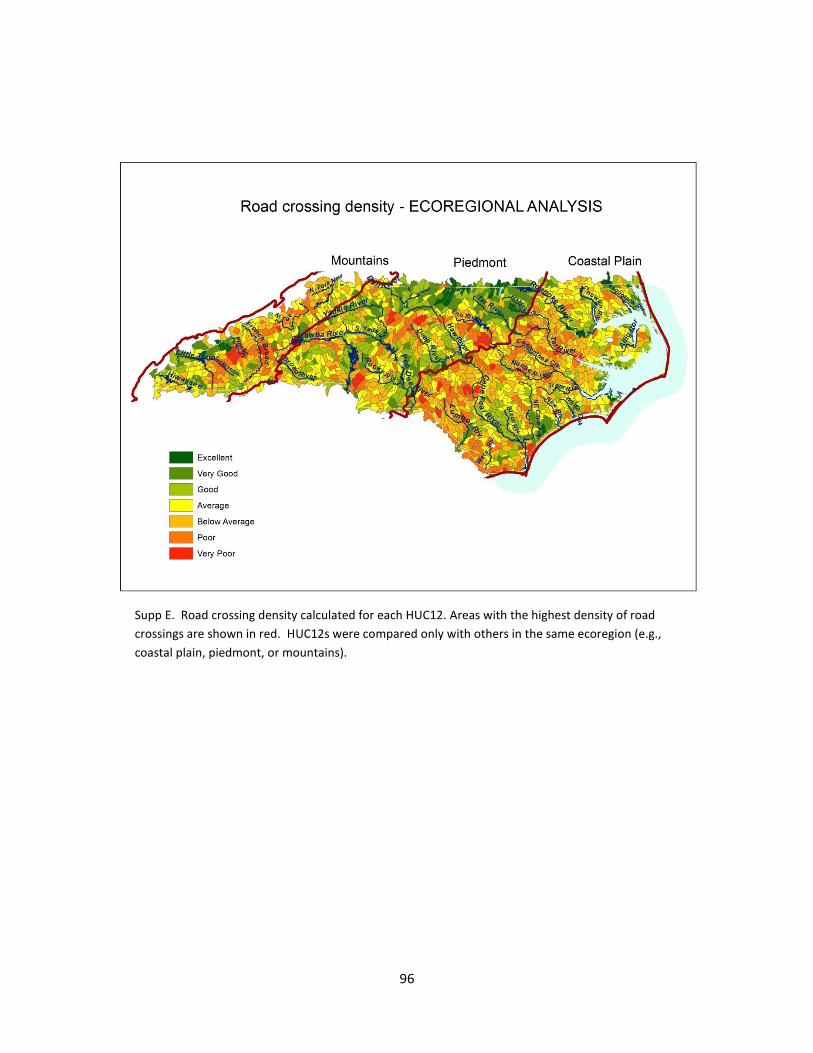
96
Supp E. Road crossing density calculated for each HUC12. Areas with the highest density of road
crossings are shown in red. HUC12s were compared only with others in the same ecoregion (e.g.,
coastal plain, piedmont, or mountains).
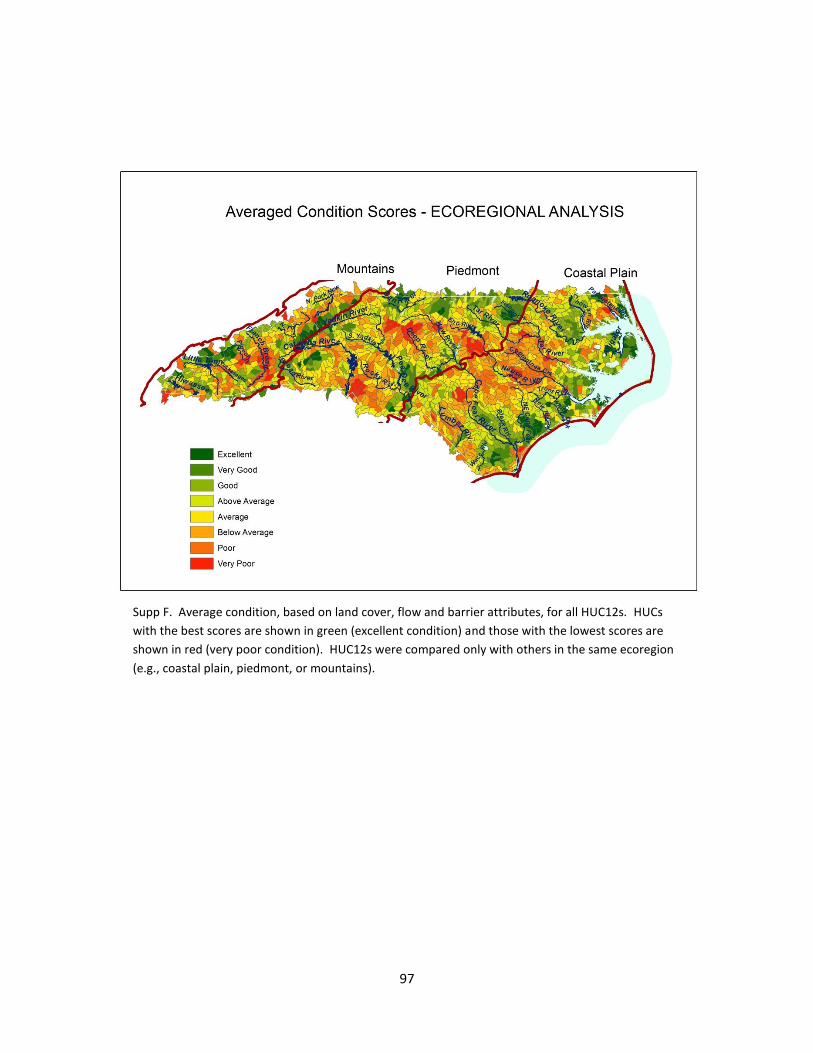
97
Supp F. Average condition, based on land cover, flow and barrier attributes, for all HUC12s. HUCs
with the best scores are shown in green (excellent condition) and those with the lowest scores are
shown in red (very poor condition). HUC12s were compared only with others in the same ecoregion
(e.g., coastal plain, piedmont, or mountains).
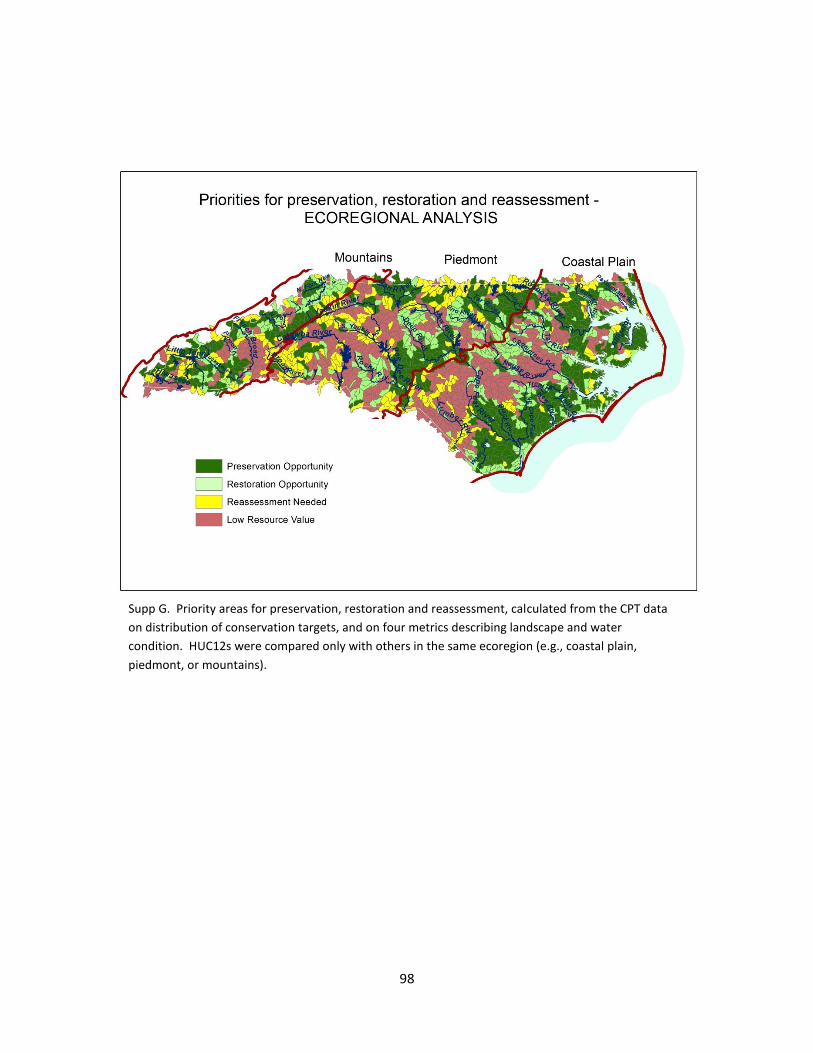
98
Supp G. Priority areas for preservation, restoration and reassessment, calculated from the CPT data
on distribution of conservation targets, and on four metrics describing landscape and water
condition. HUC12s were compared only with others in the same ecoregion (e.g., coastal plain,
piedmont, or mountains).
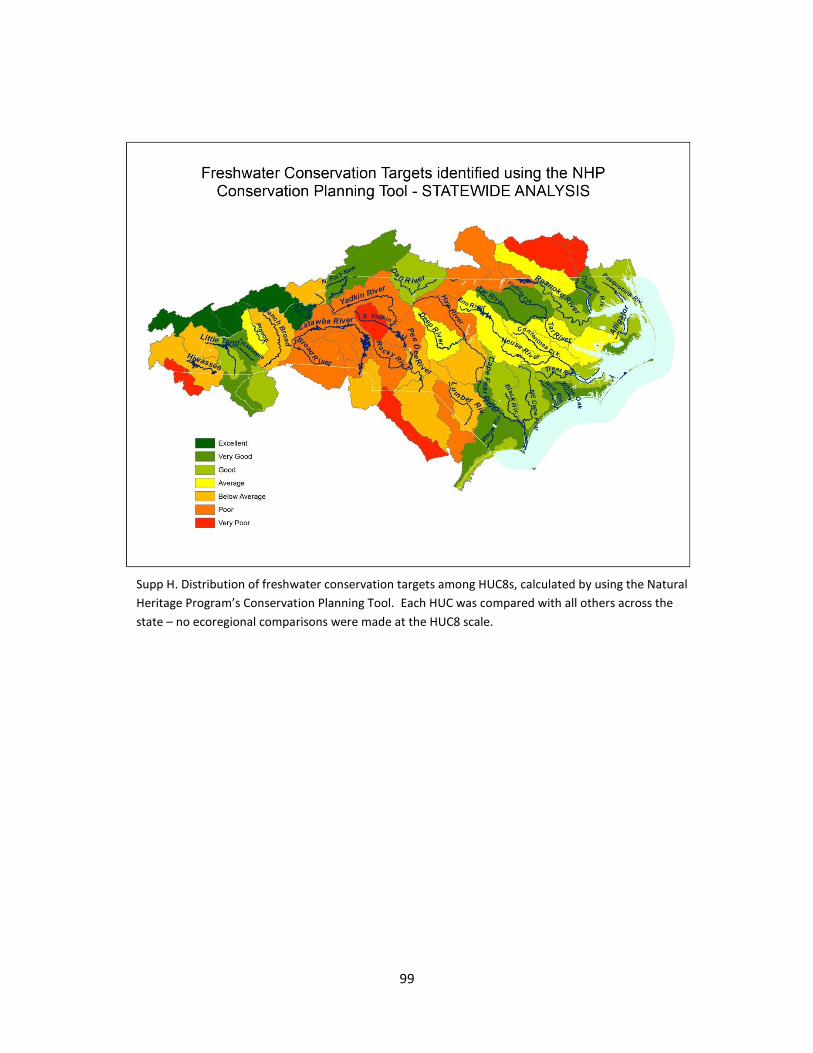
99
Supp H. Distribution of freshwater conservation targets among HUC8s, calculated by using the Natural
Heritage Program’s Conservation Planning Tool. Each HUC was compared with all others across the
state – no ecoregional comparisons were made at the HUC8 scale.
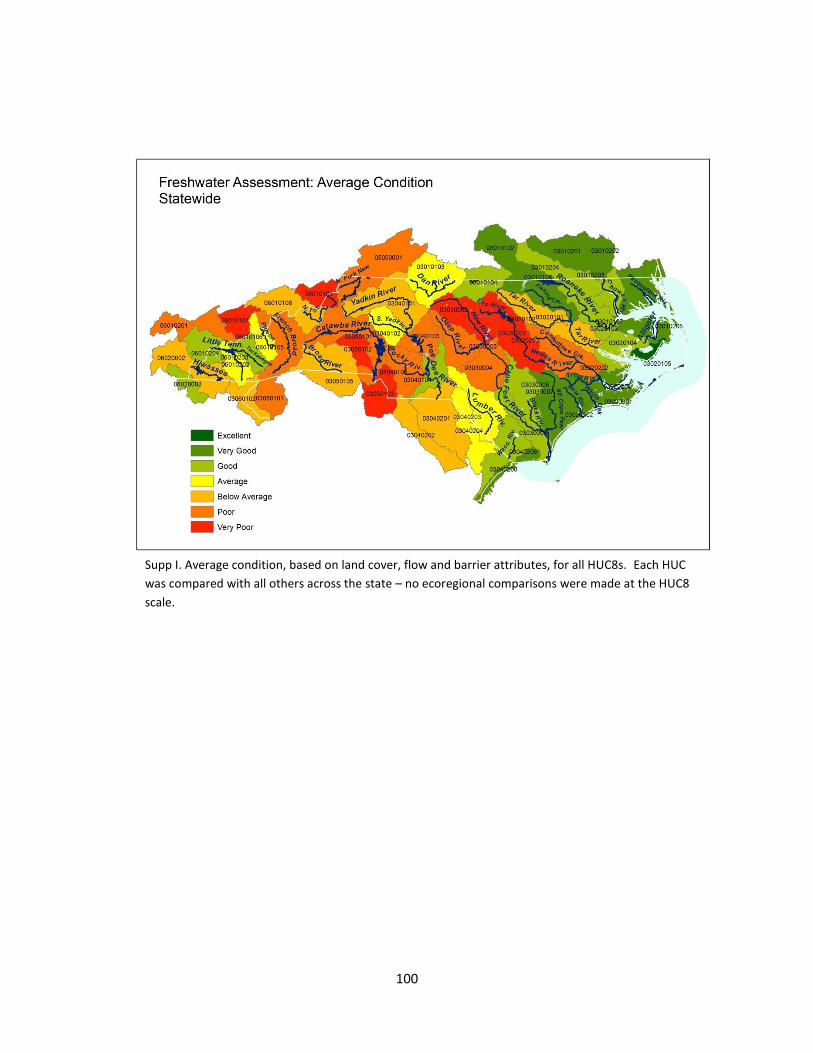
100
Supp I. Average condition, based on land cover, flow and barrier attributes, for all HUC8s. Each HUC
was compared with all others across the state – no ecoregional comparisons were made at the HUC8
scale.


