Embed Size (px)
Citation preview
RESEARCH ARTICLE Open Access
Comprehensive host-pathogen protein-protein interaction network analysisBabak Khorsand1, Abdorreza Savadi1,2* and Mahmoud Naghibzadeh2
* Correspondence: [email protected] EngineeringDepartment, Faculty of Engineering,Ferdowsi University of Mashhad,Mashhad, Iran2Ferdowsi University of Mashhad,Azadi Square, Mashhad 9177948974,Iran
Abstract
Background: Infectious diseases are a cruel assassin with millions of victims aroundthe world each year. Understanding infectious mechanism of viruses is indispensablefor their inhibition. One of the best ways of unveiling this mechanism is toinvestigate the host-pathogen protein-protein interaction network. In this paper wetry to disclose many properties of this network. We focus on human as host andintegrate experimentally 32,859 interaction between human proteins and virusproteins from several databases. We investigate different properties of humanproteins targeted by virus proteins and find that most of them have a considerablehigh centrality scores in human intra protein-protein interaction network.Investigating human proteins network properties which are targeted by differentvirus proteins can help us to design multipurpose drugs.
Results: As host-pathogen protein-protein interaction network is a bipartite networkand centrality measures for this type of networks are scarce, we proposed seven newcentrality measures for analyzing bipartite networks. Applying them to different virusstrains reveals unrandomness of attack strategies of virus proteins which could helpus in drug design hence elevating the quality of life. They could also be used indetecting host essential proteins. Essential proteins are those whose functions arecritical for survival of its host. One of the proposed centralities named diversity ofpredators, outperforms the other existing centralities in terms of detecting essentialproteins and could be used as an optimal essential proteins’ marker.
Conclusions: Different centralities were applied to analyze human protein-proteininteraction network and to detect characteristics of human proteins targeted by virusproteins. Moreover, seven new centralities were proposed to analyze host-pathogenprotein-protein interaction network and to detect pathogens’ favorite host proteinvictims. Comparing different centralities in detecting essential proteins reveals thatdiversity of predator (one of the proposed centralities) is the best essential proteinmarker.
Keywords: Pathogen-host protein interaction network, Network analysis, Bipartitenetwork, Centrality, Essential proteins
© The Author(s). 2020 Open Access This article is licensed under a Creative Commons Attribution 4.0 International License, whichpermits use, sharing, adaptation, distribution and reproduction in any medium or format, as long as you give appropriate credit tothe original author(s) and the source, provide a link to the Creative Commons licence, and indicate if changes were made. Theimages or other third party material in this article are included in the article's Creative Commons licence, unless indicated otherwisein a credit line to the material. If material is not included in the article's Creative Commons licence and your intended use is notpermitted by statutory regulation or exceeds the permitted use, you will need to obtain permission directly from the copyrightholder. To view a copy of this licence, visit http://creativecommons.org/licenses/by/4.0/. The Creative Commons Public DomainDedication waiver (http://creativecommons.org/publicdomain/zero/1.0/) applies to the data made available in this article, unlessotherwise stated in a credit line to the data.
Khorsand et al. BMC Bioinformatics (2020) 21:400 https://doi.org/10.1186/s12859-020-03706-z
BackgroundKilling millions of humans, infectious diseases are the most brutal enemies of the entire
history. Billions of dollars are spent to reveal the way hosts are infected by pathogens
and their presumptive victims. Host-Pathogen protein-protein interactions can be the
best clue for initiating infection which have been studied in different pathogens [1–8].
Exploring molecular functions, biological processes, cellular compartment, common
pathways and the other properties of host proteins targeted by pathogens can help us
in infectious disease inhibition. Investigating common targets of different pathogens
could help us to design multipurpose drugs.
Moreover, investigating protein-protein interactions between human proteins (HPPIs)
could help us to find viruses’ potential HPs victims. To do that, HPPI network is ana-
lyzed by different centrality measures. In network analysis, centrality is the main con-
cept of identifying gravity of each node in the network. Centrality measures can be
used to find most important HPs in HPPI network (HPPIN) to identify new drug tar-
gets [9–15]. Each centrality measure defines nodes’ weight from a different perspective.
HPPIN has been analyzed by different centralities such as Degree Centrality [16],
Closeness [17], Lobby Index [18], Betweenness [19], Clustering Coefficient [20], Leader
Rank [21], Topological Coefficient [22], Module Centrality [23], Eigenvector Centrality
[24], Neighborhood Connectivity [25], Normalized Alpha Centrality [26], Average
Shortest Path Length [27], Subgraph Centrality [28], Radiality [29], Range limited Cen-
trality [30] and Eccentricity [31].
Essential genes are minimal gene sets which are indispensable for a living cell and
their functions are the foundation of life [32]. As disruption of these genes can lead to
cell death, we investigate human virus protein-protein interaction network (HVPPIN)
to see whether the product of essential genes (essential proteins) are main targets of
virus proteins (VPS) and which human proteins (HPs) are targeted by more VPs.
In this paper, we focus on human as host and integrate experimentally protein-
protein interactions (PPIs) between human proteins and virus proteins (HVPPIs) from
different databases. Exploring the HVPPIN shows that human proteins which are tar-
geted by different virus strains either have a lot of interactors in intra HPPIN or bridge
between two large cliques.
Additionally, network analysis is performed on HPPIN by eight different centralities.
Results demonstrate that centrality scores of HPs targeted by different virus strains are
significantly higher than the other HPs. Besides, it reveals that centrality scores of es-
sential proteins (EPs) are significantly higher than non-essential proteins.
HVPPIN is a special type of network called bipartite in which interactions are inter-
species in contrast with HPPIN which is a unipartite network meaning interactions are
intraspecies. As most of the common centralities are designed for unipartite network
and HVPPIN is a bipartite network, seven novel bipartite centralities including CHTV
(connectivity of human proteins targeted by same virus protein), PS (propagation
speed), DP (diversity of predators), DSP (decreased shortest path), CI (component
index), CR (crown centrality) and VC (vulnerable centrality) are proposed to analyze
HVPPIN.
CHTV and CR scores of HVPPIN demonstrate the significant higher scores of real
samples in comparison with random ones. PS analysis reveals the property of three de-
gree of separation for HPPIN in presence of virus proteins. DSP results disclose the
Khorsand et al. BMC Bioinformatics (2020) 21:400 Page 2 of 22
robustness of HPPIN. By doing extra analysis on VC, we found that virus proteins that
have higher VC score, target considerably more EPs in comparison with virus proteins
with lower VC score and could be chosen for drug target purposes. Finally, comparing
DP scores of EPs and non-EPs with other centrality scores of EPs and non-EPs reveals
that DP out performs the other centralities in detecting EPs and could be used as EPs
marker.
Moreover, we make a database for human proteins centralities, DP score and virus
families evolutionary distance which is publicly available at http://bioinf.modares.ac.ir/
software/PHINA.
MethodsPreliminaries and definitions
A graph is generally illustrated by G(V, E) where V(G) is the set of nodes also
known as vertex set and E(G) ⊂ V(G) ⨯ V(G) is the set of edges between the graph’s
nodes also known as edge set. Two vertices vi and vj which are connected by an
edge are called adjacent. All the vertices adjacent to vi are called the neighbors of
vi and declared by N(vi). Number of neighbors of vi is called degree of vi and de-
noted by deg(vi) = |N(vi)∣. Edges which have the same end vertices are called paral-
lel edges and if both end vertices are the same, it will be called a self-loop. A
graph which has neither parallel edges nor a self-loop is called a simple graph,
otherwise it is called multigraph or hyper graph. A sequence of alternating vertices
is called walk. Walk with no repeated edge is called trial and trial with sets of
unique vertices is called path. If a path exists between each pair of graph vertices,
it is called connected graph. Subgraph of a graph is a graph S(V, E) which V(S) ⊆
V(G) and E(S) ⊆ E(G). Maximally connected subgraph of a graph is called compo-
nent. A fully connected graph is said complete graph. A complete subgraph of a
graph is called clique [33].
A bipartite graph [34] G(T, B, E) is a kind of graph that has two vertices disjointing
subset T and B (top and bottom) which V(G) = T(G) ⋃ B(G) and T(G) ⋂ B(G) = .
Moreover, each edge has an end vertex from the top node and another from bottom
nodes (∀(tb) E(G) ∣ t T(G), b B(G)). In a bipartite graph for any top vertex tiT(G), N(ti) ⊂ B(G) while for any bottom vertex bi B(G), N(bi) ⊂ T(G). There are many
real bipartite networks such as actor-movie network [35] which illustrates the movies
and the actors playing in them, author-article network [36] which shows the articles
and theirs authors, gene-disease network [37–43] which reveals diseases and their tar-
geted genes, metabolite-enzyme network [44–46] which shows metabolites and their
corresponding enzymes, and host-pathogen PPI network such as fungal pathogen sce-
dosporium aurantiacum with human long epithelial cells [47], Leptospira interrogans
and Homo sapiens [48], extracellular bacterial pathogen and human host [49], zika virus
non-structural proteins and human host proteins [50], bacterial and fungal pathogens
and maize stalks host [51].
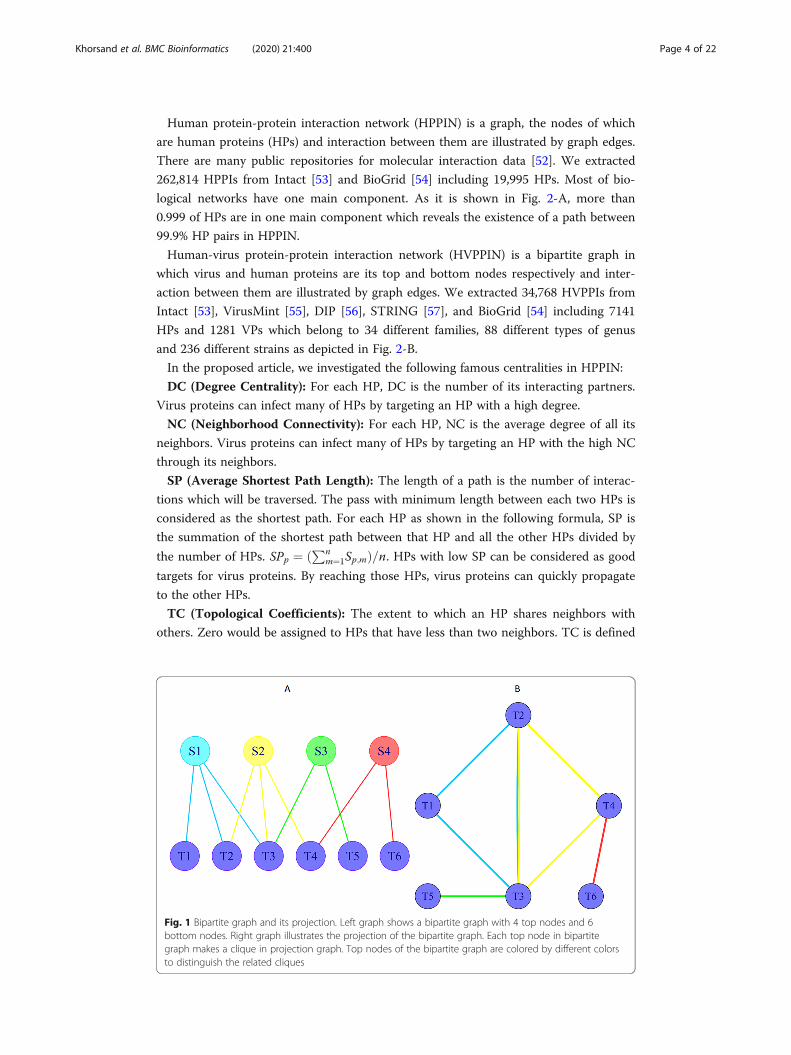
Bipartite projection of graph G(T, B, E) is graph G ′ (B′, E′) where nodes are subsets of
G bottom nodes which have at least one common neighbor. Each pair of nodes that
have common neighbors are connected with an edge as it is shown in sample graph of
Fig 1. In other words, each top node makes a clique with the size of its degree.
Khorsand et al. BMC Bioinformatics (2020) 21:400 Page 3 of 22
Human protein-protein interaction network (HPPIN) is a graph, the nodes of which
are human proteins (HPs) and interaction between them are illustrated by graph edges.
There are many public repositories for molecular interaction data [52]. We extracted
262,814 HPPIs from Intact [53] and BioGrid [54] including 19,995 HPs. Most of bio-
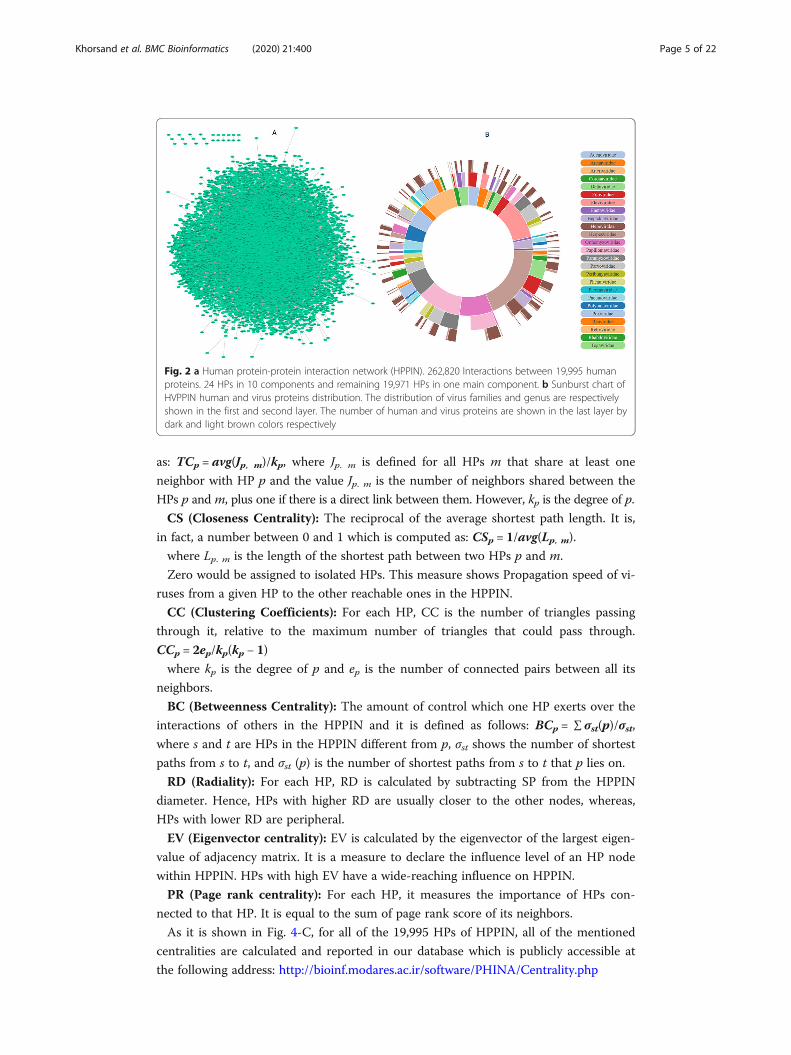
logical networks have one main component. As it is shown in Fig. 2-A, more than
0.999 of HPs are in one main component which reveals the existence of a path between
99.9% HP pairs in HPPIN.
Human-virus protein-protein interaction network (HVPPIN) is a bipartite graph in
which virus and human proteins are its top and bottom nodes respectively and inter-
action between them are illustrated by graph edges. We extracted 34,768 HVPPIs from
Intact [53], VirusMint [55], DIP [56], STRING [57], and BioGrid [54] including 7141
HPs and 1281 VPs which belong to 34 different families, 88 different types of genus
and 236 different strains as depicted in Fig. 2-B.
In the proposed article, we investigated the following famous centralities in HPPIN:
DC (Degree Centrality): For each HP, DC is the number of its interacting partners.
Virus proteins can infect many of HPs by targeting an HP with a high degree.
NC (Neighborhood Connectivity): For each HP, NC is the average degree of all its
neighbors. Virus proteins can infect many of HPs by targeting an HP with the high NC
through its neighbors.
SP (Average Shortest Path Length): The length of a path is the number of interac-
tions which will be traversed. The pass with minimum length between each two HPs is
considered as the shortest path. For each HP as shown in the following formula, SP is
the summation of the shortest path between that HP and all the other HPs divided by
the number of HPs. SPp ¼ ðPnm¼1Sp;mÞ=n. HPs with low SP can be considered as good
targets for virus proteins. By reaching those HPs, virus proteins can quickly propagate
to the other HPs.
TC (Topological Coefficients): The extent to which an HP shares neighbors with
others. Zero would be assigned to HPs that have less than two neighbors. TC is defined
Fig. 1 Bipartite graph and its projection. Left graph shows a bipartite graph with 4 top nodes and 6bottom nodes. Right graph illustrates the projection of the bipartite graph. Each top node in bipartitegraph makes a clique in projection graph. Top nodes of the bipartite graph are colored by different colorsto distinguish the related cliques
Khorsand et al. BMC Bioinformatics (2020) 21:400 Page 4 of 22
as: TCp = avg(Jp, m)/kp, where Jp. m is defined for all HPs m that share at least one
neighbor with HP p and the value Jp. m is the number of neighbors shared between the
HPs p and m, plus one if there is a direct link between them. However, kp is the degree of p.
CS (Closeness Centrality): The reciprocal of the average shortest path length. It is,
in fact, a number between 0 and 1 which is computed as: CSp = 1/avg(Lp, m).
where Lp. m is the length of the shortest path between two HPs p and m.
Zero would be assigned to isolated HPs. This measure shows Propagation speed of vi-
ruses from a given HP to the other reachable ones in the HPPIN.
CC (Clustering Coefficients): For each HP, CC is the number of triangles passing
through it, relative to the maximum number of triangles that could pass through.
CCp = 2ep/kp(kp − 1)
where kp is the degree of p and ep is the number of connected pairs between all its
neighbors.
BC (Betweenness Centrality): The amount of control which one HP exerts over the
interactions of others in the HPPIN and it is defined as follows: BCp = ∑ σst(p)/σst,
where s and t are HPs in the HPPIN different from p, σst shows the number of shortest
paths from s to t, and σst (p) is the number of shortest paths from s to t that p lies on.
RD (Radiality): For each HP, RD is calculated by subtracting SP from the HPPIN
diameter. Hence, HPs with higher RD are usually closer to the other nodes, whereas,
HPs with lower RD are peripheral.
EV (Eigenvector centrality): EV is calculated by the eigenvector of the largest eigen-
value of adjacency matrix. It is a measure to declare the influence level of an HP node
within HPPIN. HPs with high EV have a wide-reaching influence on HPPIN.
PR (Page rank centrality): For each HP, it measures the importance of HPs con-
nected to that HP. It is equal to the sum of page rank score of its neighbors.
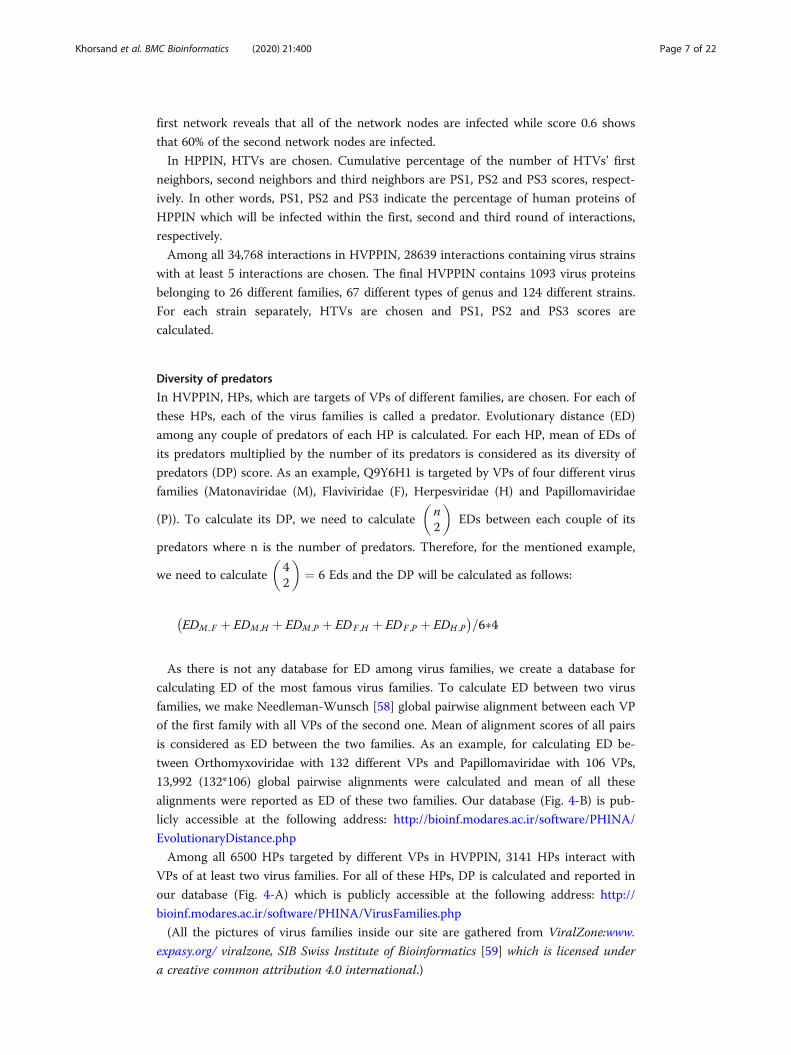
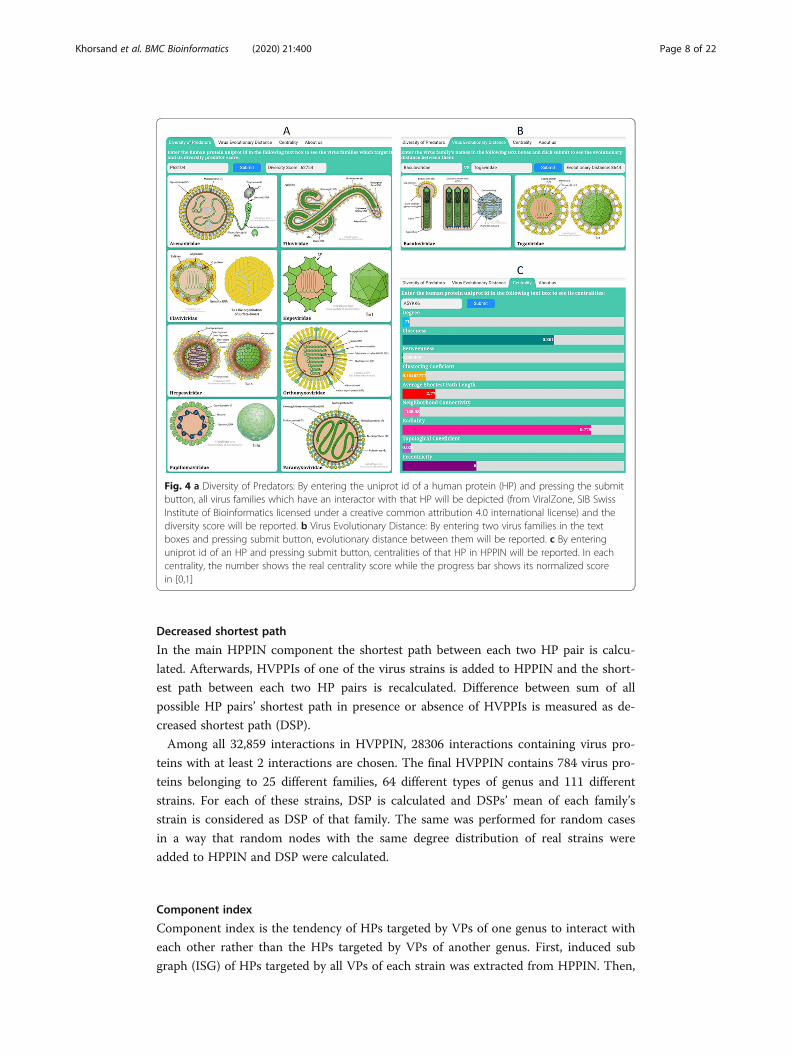
As it is shown in Fig. 4-C, for all of the 19,995 HPs of HPPIN, all of the mentioned
centralities are calculated and reported in our database which is publicly accessible at
the following address: http://bioinf.modares.ac.ir/software/PHINA/Centrality.php
Fig. 2 a Human protein-protein interaction network (HPPIN). 262,820 Interactions between 19,995 humanproteins. 24 HPs in 10 components and remaining 19,971 HPs in one main component. b Sunburst chart ofHVPPIN human and virus proteins distribution. The distribution of virus families and genus are respectivelyshown in the first and second layer. The number of human and virus proteins are shown in the last layer bydark and light brown colors respectively
Khorsand et al. BMC Bioinformatics (2020) 21:400 Page 5 of 22
Moreover, we propose seven new centralities for analyzing HVPPIN:
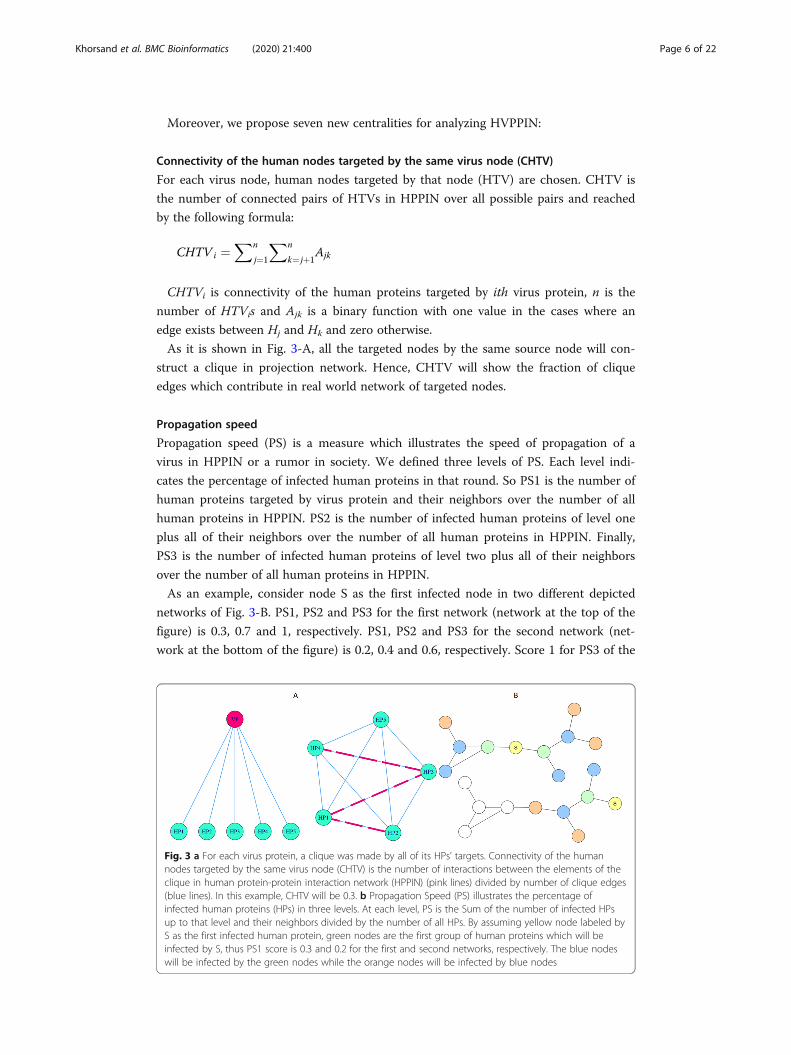
Connectivity of the human nodes targeted by the same virus node (CHTV)
For each virus node, human nodes targeted by that node (HTV) are chosen. CHTV is
the number of connected pairs of HTVs in HPPIN over all possible pairs and reached
by the following formula:
CHTV i ¼Xn
j¼1
Xn
k¼ jþ1Ajk
CHTVi is connectivity of the human proteins targeted by ith virus protein, n is the
number of HTVis and Ajk is a binary function with one value in the cases where an
edge exists between Hj and Hk and zero otherwise.
As it is shown in Fig. 3-A, all the targeted nodes by the same source node will con-
struct a clique in projection network. Hence, CHTV will show the fraction of clique
edges which contribute in real world network of targeted nodes.
Propagation speed
Propagation speed (PS) is a measure which illustrates the speed of propagation of a
virus in HPPIN or a rumor in society. We defined three levels of PS. Each level indi-
cates the percentage of infected human proteins in that round. So PS1 is the number of
human proteins targeted by virus protein and their neighbors over the number of all
human proteins in HPPIN. PS2 is the number of infected human proteins of level one
plus all of their neighbors over the number of all human proteins in HPPIN. Finally,
PS3 is the number of infected human proteins of level two plus all of their neighbors
over the number of all human proteins in HPPIN.
As an example, consider node S as the first infected node in two different depicted
networks of Fig. 3-B. PS1, PS2 and PS3 for the first network (network at the top of the
figure) is 0.3, 0.7 and 1, respectively. PS1, PS2 and PS3 for the second network (net-
work at the bottom of the figure) is 0.2, 0.4 and 0.6, respectively. Score 1 for PS3 of the
Fig. 3 a For each virus protein, a clique was made by all of its HPs’ targets. Connectivity of the humannodes targeted by the same virus node (CHTV) is the number of interactions between the elements of theclique in human protein-protein interaction network (HPPIN) (pink lines) divided by number of clique edges(blue lines). In this example, CHTV will be 0.3. b Propagation Speed (PS) illustrates the percentage ofinfected human proteins (HPs) in three levels. At each level, PS is the Sum of the number of infected HPsup to that level and their neighbors divided by the number of all HPs. By assuming yellow node labeled byS as the first infected human protein, green nodes are the first group of human proteins which will beinfected by S, thus PS1 score is 0.3 and 0.2 for the first and second networks, respectively. The blue nodeswill be infected by the green nodes while the orange nodes will be infected by blue nodes
Khorsand et al. BMC Bioinformatics (2020) 21:400 Page 6 of 22
first network reveals that all of the network nodes are infected while score 0.6 shows
that 60% of the second network nodes are infected.
In HPPIN, HTVs are chosen. Cumulative percentage of the number of HTVs’ first
neighbors, second neighbors and third neighbors are PS1, PS2 and PS3 scores, respect-
ively. In other words, PS1, PS2 and PS3 indicate the percentage of human proteins of
HPPIN which will be infected within the first, second and third round of interactions,
respectively.
Among all 34,768 interactions in HVPPIN, 28639 interactions containing virus strains
with at least 5 interactions are chosen. The final HVPPIN contains 1093 virus proteins
belonging to 26 different families, 67 different types of genus and 124 different strains.
For each strain separately, HTVs are chosen and PS1, PS2 and PS3 scores are
calculated.
Diversity of predators
In HVPPIN, HPs, which are targets of VPs of different families, are chosen. For each of
these HPs, each of the virus families is called a predator. Evolutionary distance (ED)
among any couple of predators of each HP is calculated. For each HP, mean of EDs of
its predators multiplied by the number of its predators is considered as its diversity of
predators (DP) score. As an example, Q9Y6H1 is targeted by VPs of four different virus
families (Matonaviridae (M), Flaviviridae (F), Herpesviridae (H) and Papillomaviridae
(P)). To calculate its DP, we need to calculaten2
� �EDs between each couple of its
predators where n is the number of predators. Therefore, for the mentioned example,
we need to calculate42
� �¼ 6 Eds and the DP will be calculated as follows:
EDM;F þ EDM;H þ EDM;P þ EDF;H þ EDF;P þ EDH ;P� �
=6�4
As there is not any database for ED among virus families, we create a database for
calculating ED of the most famous virus families. To calculate ED between two virus
families, we make Needleman-Wunsch [58] global pairwise alignment between each VP
of the first family with all VPs of the second one. Mean of alignment scores of all pairs
is considered as ED between the two families. As an example, for calculating ED be-
tween Orthomyxoviridae with 132 different VPs and Papillomaviridae with 106 VPs,
13,992 (132*106) global pairwise alignments were calculated and mean of all these
alignments were reported as ED of these two families. Our database (Fig. 4-B) is pub-
licly accessible at the following address: http://bioinf.modares.ac.ir/software/PHINA/
EvolutionaryDistance.php
Among all 6500 HPs targeted by different VPs in HVPPIN, 3141 HPs interact with
VPs of at least two virus families. For all of these HPs, DP is calculated and reported in
our database (Fig. 4-A) which is publicly accessible at the following address: http://
bioinf.modares.ac.ir/software/PHINA/VirusFamilies.php
(All the pictures of virus families inside our site are gathered from ViralZone:www.
expasy.org/ viralzone, SIB Swiss Institute of Bioinformatics [59] which is licensed under
a creative common attribution 4.0 international.)
Khorsand et al. BMC Bioinformatics (2020) 21:400 Page 7 of 22
Decreased shortest path
In the main HPPIN component the shortest path between each two HP pair is calcu-
lated. Afterwards, HVPPIs of one of the virus strains is added to HPPIN and the short-
est path between each two HP pairs is recalculated. Difference between sum of all
possible HP pairs’ shortest path in presence or absence of HVPPIs is measured as de-
creased shortest path (DSP).
Among all 32,859 interactions in HVPPIN, 28306 interactions containing virus pro-
teins with at least 2 interactions are chosen. The final HVPPIN contains 784 virus pro-
teins belonging to 25 different families, 64 different types of genus and 111 different
strains. For each of these strains, DSP is calculated and DSPs’ mean of each family’s
strain is considered as DSP of that family. The same was performed for random cases
in a way that random nodes with the same degree distribution of real strains were
added to HPPIN and DSP were calculated.
Component index
Component index is the tendency of HPs targeted by VPs of one genus to interact with
each other rather than the HPs targeted by VPs of another genus. First, induced sub
graph (ISG) of HPs targeted by all VPs of each strain was extracted from HPPIN. Then,
Fig. 4 a Diversity of Predators: By entering the uniprot id of a human protein (HP) and pressing the submitbutton, all virus families which have an interactor with that HP will be depicted (from ViralZone, SIB SwissInstitute of Bioinformatics licensed under a creative common attribution 4.0 international license) and thediversity score will be reported. b Virus Evolutionary Distance: By entering two virus families in the textboxes and pressing submit button, evolutionary distance between them will be reported. c By enteringuniprot id of an HP and pressing submit button, centralities of that HP in HPPIN will be reported. In eachcentrality, the number shows the real centrality score while the progress bar shows its normalized scorein [0,1]
Khorsand et al. BMC Bioinformatics (2020) 21:400 Page 8 of 22
for each strain, the number of interactions within its ISG HPs, and the number of inter-
actions between its HPs and other ISG HPs was calculated. Finally, component index
was defined between two strains by the following formula:
Xnic
i¼1
Xnic
j¼ieij −
Xnic
i¼1
Xnoc
o¼1eio
� �=
Xnic
i¼1
Xnic
j¼ieij þ
Xnic
i¼1
Xnoc
o¼1eio
� �
nic is the number of first ISG HPs, noc is the number of second ISG HPs, eij is 1 if ith
HP of first ISG interacts with jth HP of the first ISG. eio is 1 if ith HP of first ISG inter-
acts with oth HP of second ISG. In other words, component index is the difference be-
tween the intra-interactions of an ISG and inter-interactions of that ISG with another
ISG over the sum of inter and intra interactions.
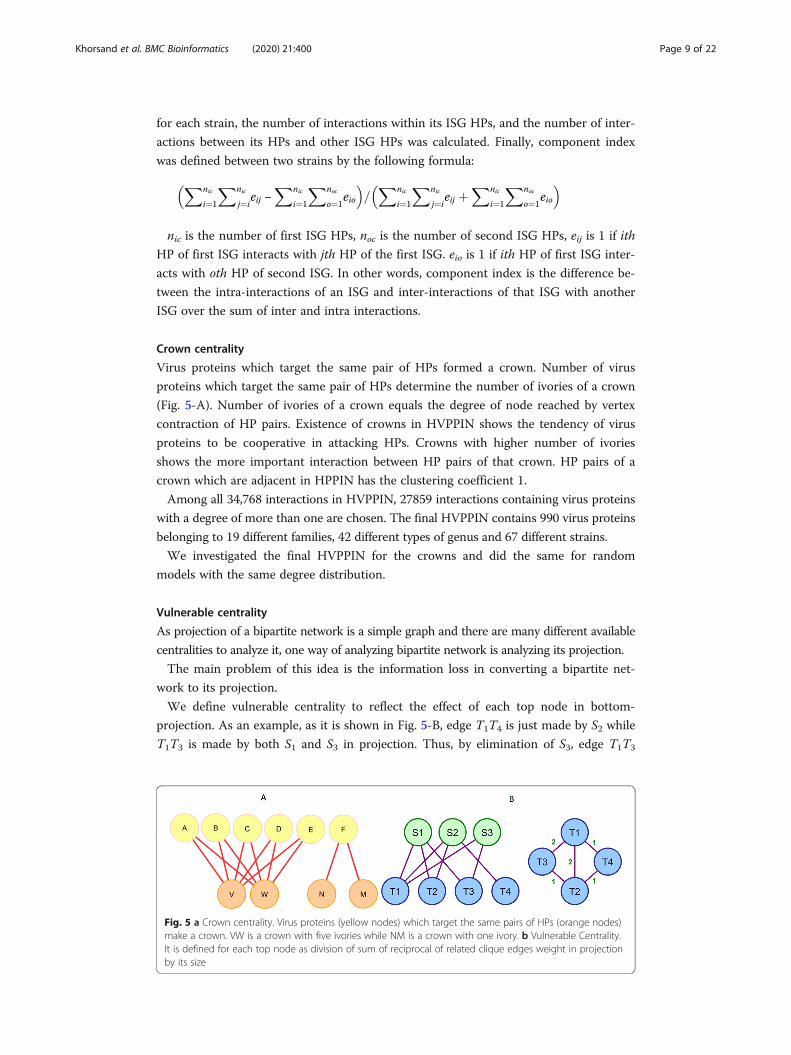
Crown centrality
Virus proteins which target the same pair of HPs formed a crown. Number of virus
proteins which target the same pair of HPs determine the number of ivories of a crown
(Fig. 5-A). Number of ivories of a crown equals the degree of node reached by vertex
contraction of HP pairs. Existence of crowns in HVPPIN shows the tendency of virus
proteins to be cooperative in attacking HPs. Crowns with higher number of ivories
shows the more important interaction between HP pairs of that crown. HP pairs of a
crown which are adjacent in HPPIN has the clustering coefficient 1.
Among all 34,768 interactions in HVPPIN, 27859 interactions containing virus proteins
with a degree of more than one are chosen. The final HVPPIN contains 990 virus proteins
belonging to 19 different families, 42 different types of genus and 67 different strains.
We investigated the final HVPPIN for the crowns and did the same for random
models with the same degree distribution.
Vulnerable centrality
As projection of a bipartite network is a simple graph and there are many different available
centralities to analyze it, one way of analyzing bipartite network is analyzing its projection.
The main problem of this idea is the information loss in converting a bipartite net-
work to its projection.
We define vulnerable centrality to reflect the effect of each top node in bottom-
projection. As an example, as it is shown in Fig. 5-B, edge T1T4 is just made by S2 while
T1T3 is made by both S1 and S3 in projection. Thus, by elimination of S3, edge T1T3
Fig. 5 a Crown centrality. Virus proteins (yellow nodes) which target the same pairs of HPs (orange nodes)make a crown. VW is a crown with five ivories while NM is a crown with one ivory. b Vulnerable Centrality.It is defined for each top node as division of sum of reciprocal of related clique edges weight in projectionby its size
Khorsand et al. BMC Bioinformatics (2020) 21:400 Page 9 of 22
remains, though by elimination of S2, edge T1T4 will be permanently dropped from
projection.
Vulnerable centrality is defined for each top node as sum of reciprocal of projection
weight divided by the equivalent clique size. As an example, for the graph of Fig. 5-B,
V1. V2. V3 (vulnerable score for S1. S2. S3) is calculated by:
V 1 ¼ 11þ 12þ 12
� �=3 ¼ 0:67:V 2 ¼ 1
1þ 11þ 12
� �=3 ¼ 0:83:V 3 ¼ 1
2
� �=1 ¼ 0:5
Essential proteins functions are indispensable for life cycle and thus, investigating
them can be useful for both drug target purposes for inhibition and better understand-
ing of their behaviors. 2472 EPs were gathered from Georgi [60], 1734 EPs were re-
ported in Blomen [61], 1878 EPs were extracted from Wang [62], 3230 EPs were
derived from Lek [63] and 7127 were collected from Chen [64]. Finally, 6115 genes
which were at least reported in two of the mentioned studies were considered as essen-
tial proteins.
Lots of papers apply network topology for detecting new essential proteins [65–70].
Eight different mentioned centralities and two new proposed centralities (DP and VC)
were calculated for all of the HPs of HPPIN. Afterwards, centralities of essential HPs
were compared against non-essential HPs and the results were reported to investigate
whether they could be applied for detecting new essential proteins.
Furthermore, Virus proteins of each strain, were clustered into 2 groups based on
vulnerable score. Thereafter, the number of essential proteins targeted by each group
were compared to see whether there exists a significant difference between the two
groups.
ResultsAll the existing mentioned centralities and the two new proposed centralities (DP and
VC) are investigated to see whether they could be an essential protein marker.
For the other five proposed centralities, different topics were investigated. For CHTV
and crown centrality, we figured out if there is a significant difference in real sample
scores in comparison with random sample scores or not. We also uncovered the degree
of separation of HPPIN. Moreover, robustness of HPPIN is measured by DSP. Propen-
sity of HPs targeted by the same VP to have inter or intra interaction was investigated.
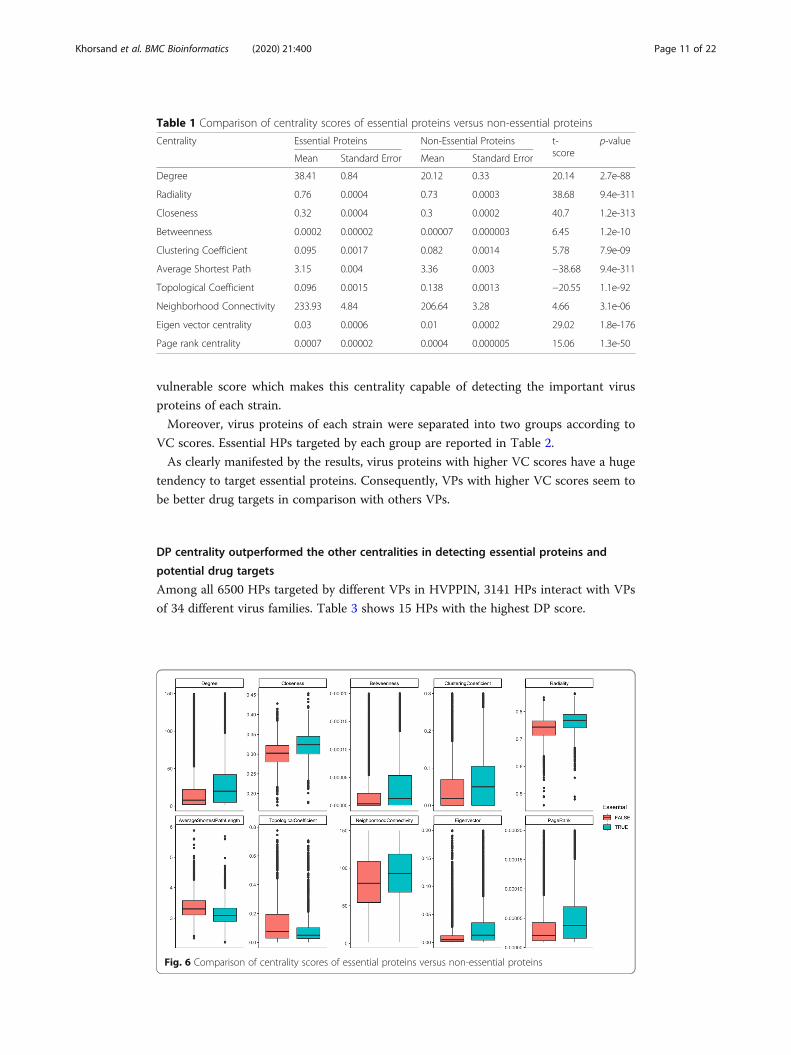
Essential proteins are critical nodes in HPPIN
Ten different centralities were measured in HPPIN and as it is shown in Table 1 and
Fig. 6, essential proteins’ centrality scores were significantly different in comparison
with non-essential proteins.
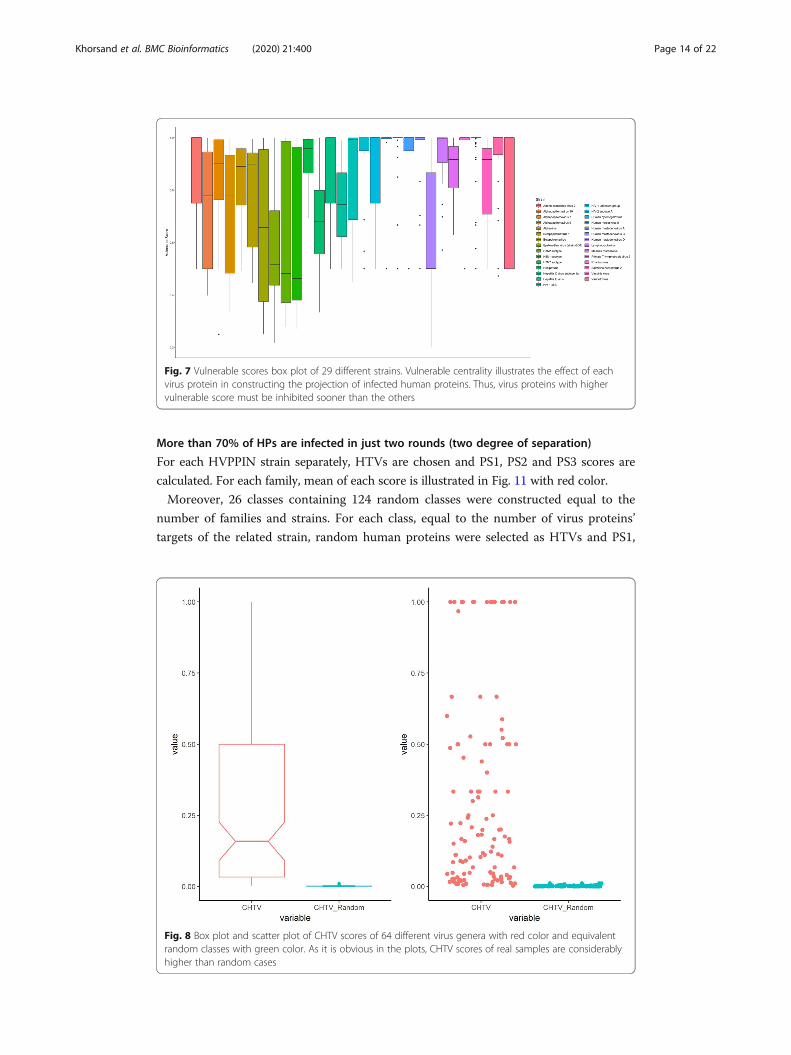
Virus proteins with higher VC scores have a huge tendency to target essential proteins
In our model, vulnerable centrality illustrates the effect of each virus protein in con-
structing the projection of infected human proteins. Thus, virus proteins with higher
vulnerable scores must be inhibited sooner than the others. In other words, inhibiting
the virus proteins with higher vulnerable scores will maximized the chance of early in-
hibition of whole virus spread. As it is illustrated in Fig. 7, by calculating vulnerable
scores of 29 different strains, virus proteins of each strain have a considerable diverse
Khorsand et al. BMC Bioinformatics (2020) 21:400 Page 10 of 22
vulnerable score which makes this centrality capable of detecting the important virus
proteins of each strain.
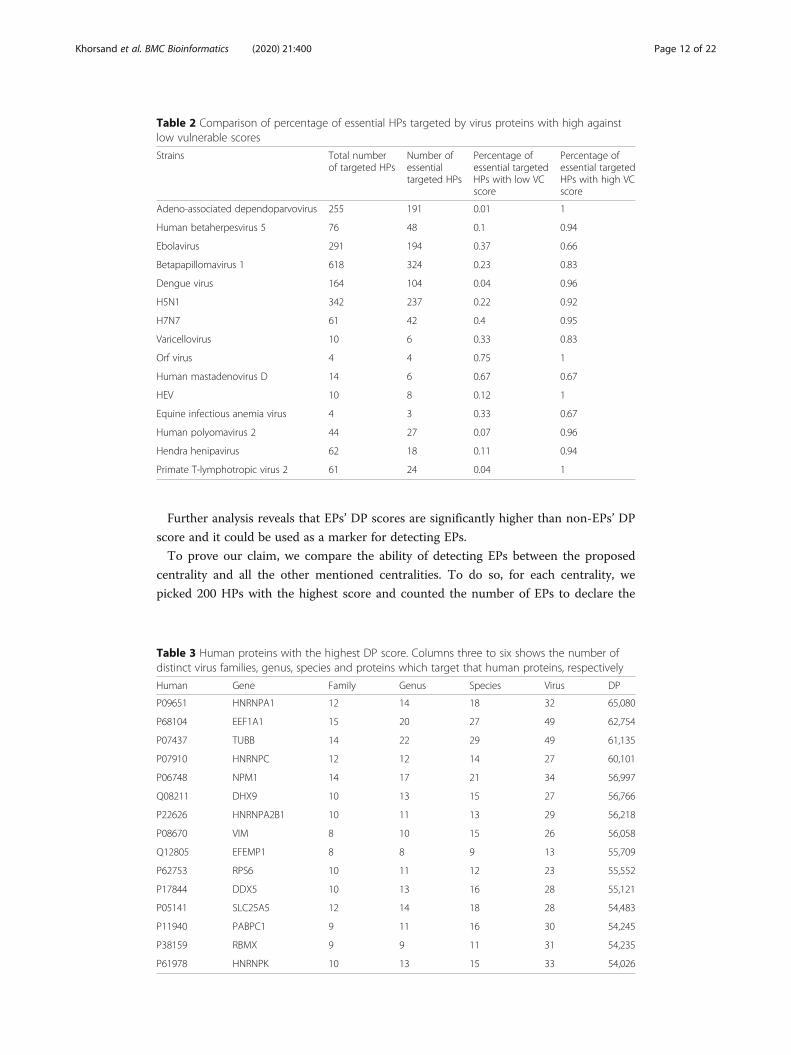
Moreover, virus proteins of each strain were separated into two groups according to
VC scores. Essential HPs targeted by each group are reported in Table 2.
As clearly manifested by the results, virus proteins with higher VC scores have a huge
tendency to target essential proteins. Consequently, VPs with higher VC scores seem to
be better drug targets in comparison with others VPs.
DP centrality outperformed the other centralities in detecting essential proteins and
potential drug targets
Among all 6500 HPs targeted by different VPs in HVPPIN, 3141 HPs interact with VPs
of 34 different virus families. Table 3 shows 15 HPs with the highest DP score.
Table 1 Comparison of centrality scores of essential proteins versus non-essential proteins
Centrality Essential Proteins Non-Essential Proteins t-score
p-value
Mean Standard Error Mean Standard Error
Degree 38.41 0.84 20.12 0.33 20.14 2.7e-88
Radiality 0.76 0.0004 0.73 0.0003 38.68 9.4e-311
Closeness 0.32 0.0004 0.3 0.0002 40.7 1.2e-313
Betweenness 0.0002 0.00002 0.00007 0.000003 6.45 1.2e-10
Clustering Coefficient 0.095 0.0017 0.082 0.0014 5.78 7.9e-09
Average Shortest Path 3.15 0.004 3.36 0.003 −38.68 9.4e-311
Topological Coefficient 0.096 0.0015 0.138 0.0013 −20.55 1.1e-92
Neighborhood Connectivity 233.93 4.84 206.64 3.28 4.66 3.1e-06
Eigen vector centrality 0.03 0.0006 0.01 0.0002 29.02 1.8e-176
Page rank centrality 0.0007 0.00002 0.0004 0.000005 15.06 1.3e-50
Fig. 6 Comparison of centrality scores of essential proteins versus non-essential proteins
Khorsand et al. BMC Bioinformatics (2020) 21:400 Page 11 of 22
Further analysis reveals that EPs’ DP scores are significantly higher than non-EPs’ DP
score and it could be used as a marker for detecting EPs.
To prove our claim, we compare the ability of detecting EPs between the proposed
centrality and all the other mentioned centralities. To do so, for each centrality, we
picked 200 HPs with the highest score and counted the number of EPs to declare the
Table 2 Comparison of percentage of essential HPs targeted by virus proteins with high againstlow vulnerable scores
Strains Total numberof targeted HPs
Number ofessentialtargeted HPs
Percentage ofessential targetedHPs with low VCscore
Percentage ofessential targetedHPs with high VCscore
Adeno-associated dependoparvovirus 255 191 0.01 1
Human betaherpesvirus 5 76 48 0.1 0.94
Ebolavirus 291 194 0.37 0.66
Betapapillomavirus 1 618 324 0.23 0.83
Dengue virus 164 104 0.04 0.96
H5N1 342 237 0.22 0.92
H7N7 61 42 0.4 0.95
Varicellovirus 10 6 0.33 0.83
Orf virus 4 4 0.75 1
Human mastadenovirus D 14 6 0.67 0.67
HEV 10 8 0.12 1
Equine infectious anemia virus 4 3 0.33 0.67
Human polyomavirus 2 44 27 0.07 0.96
Hendra henipavirus 62 18 0.11 0.94
Primate T-lymphotropic virus 2 61 24 0.04 1
Table 3 Human proteins with the highest DP score. Columns three to six shows the number ofdistinct virus families, genus, species and proteins which target that human proteins, respectively
Human Gene Family Genus Species Virus DP
P09651 HNRNPA1 12 14 18 32 65,080
P68104 EEF1A1 15 20 27 49 62,754
P07437 TUBB 14 22 29 49 61,135
P07910 HNRNPC 12 12 14 27 60,101
P06748 NPM1 14 17 21 34 56,997
Q08211 DHX9 10 13 15 27 56,766
P22626 HNRNPA2B1 10 11 13 29 56,218
P08670 VIM 8 10 15 26 56,058
Q12805 EFEMP1 8 8 9 13 55,709
P62753 RPS6 10 11 12 23 55,552
P17844 DDX5 10 13 16 28 55,121
P05141 SLC25A5 12 14 18 28 54,483
P11940 PABPC1 9 11 16 30 54,245
P38159 RBMX 9 9 11 31 54,235
P61978 HNRNPK 10 13 15 33 54,026
Khorsand et al. BMC Bioinformatics (2020) 21:400 Page 12 of 22
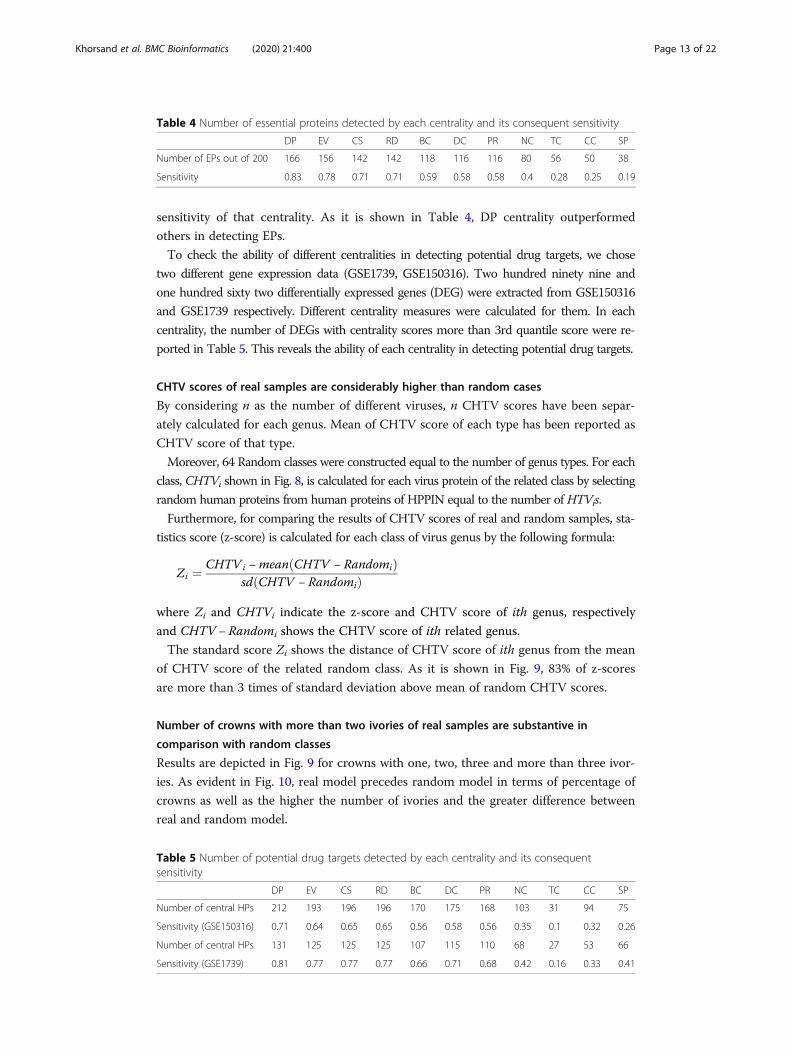
sensitivity of that centrality. As it is shown in Table 4, DP centrality outperformed
others in detecting EPs.
To check the ability of different centralities in detecting potential drug targets, we chose
two different gene expression data (GSE1739, GSE150316). Two hundred ninety nine and
one hundred sixty two differentially expressed genes (DEG) were extracted from GSE150316
and GSE1739 respectively. Different centrality measures were calculated for them. In each
centrality, the number of DEGs with centrality scores more than 3rd quantile score were re-
ported in Table 5. This reveals the ability of each centrality in detecting potential drug targets.
CHTV scores of real samples are considerably higher than random cases
By considering n as the number of different viruses, n CHTV scores have been separ-
ately calculated for each genus. Mean of CHTV score of each type has been reported as
CHTV score of that type.
Moreover, 64 Random classes were constructed equal to the number of genus types. For each
class, CHTVi shown in Fig. 8, is calculated for each virus protein of the related class by selecting
random human proteins from human proteins of HPPIN equal to the number of HTVis.
Furthermore, for comparing the results of CHTV scores of real and random samples, sta-
tistics score (z-score) is calculated for each class of virus genus by the following formula:
Zi ¼ CHTV i −mean CHTV − Randomið Þsd CHTV − Randomið Þ
where Zi and CHTVi indicate the z-score and CHTV score of ith genus, respectively
and CHTV − Randomi shows the CHTV score of ith related genus.
The standard score Zi shows the distance of CHTV score of ith genus from the mean
of CHTV score of the related random class. As it is shown in Fig. 9, 83% of z-scores
are more than 3 times of standard deviation above mean of random CHTV scores.
Number of crowns with more than two ivories of real samples are substantive in
comparison with random classes
Results are depicted in Fig. 9 for crowns with one, two, three and more than three ivor-
ies. As evident in Fig. 10, real model precedes random model in terms of percentage of
crowns as well as the higher the number of ivories and the greater difference between
real and random model.
Table 4 Number of essential proteins detected by each centrality and its consequent sensitivity
DP EV CS RD BC DC PR NC TC CC SP
Number of EPs out of 200 166 156 142 142 118 116 116 80 56 50 38
Sensitivity 0.83 0.78 0.71 0.71 0.59 0.58 0.58 0.4 0.28 0.25 0.19
Table 5 Number of potential drug targets detected by each centrality and its consequentsensitivity
DP EV CS RD BC DC PR NC TC CC SP
Number of central HPs 212 193 196 196 170 175 168 103 31 94 75
Sensitivity (GSE150316) 0.71 0.64 0.65 0.65 0.56 0.58 0.56 0.35 0.1 0.32 0.26
Number of central HPs 131 125 125 125 107 115 110 68 27 53 66
Sensitivity (GSE1739) 0.81 0.77 0.77 0.77 0.66 0.71 0.68 0.42 0.16 0.33 0.41
Khorsand et al. BMC Bioinformatics (2020) 21:400 Page 13 of 22
More than 70% of HPs are infected in just two rounds (two degree of separation)
For each HVPPIN strain separately, HTVs are chosen and PS1, PS2 and PS3 scores are
calculated. For each family, mean of each score is illustrated in Fig. 11 with red color.
Moreover, 26 classes containing 124 random classes were constructed equal to the
number of families and strains. For each class, equal to the number of virus proteins’
targets of the related strain, random human proteins were selected as HTVs and PS1,
Fig. 7 Vulnerable scores box plot of 29 different strains. Vulnerable centrality illustrates the effect of eachvirus protein in constructing the projection of infected human proteins. Thus, virus proteins with highervulnerable score must be inhibited sooner than the others
Fig. 8 Box plot and scatter plot of CHTV scores of 64 different virus genera with red color and equivalentrandom classes with green color. As it is obvious in the plots, CHTV scores of real samples are considerablyhigher than random cases
Khorsand et al. BMC Bioinformatics (2020) 21:400 Page 14 of 22
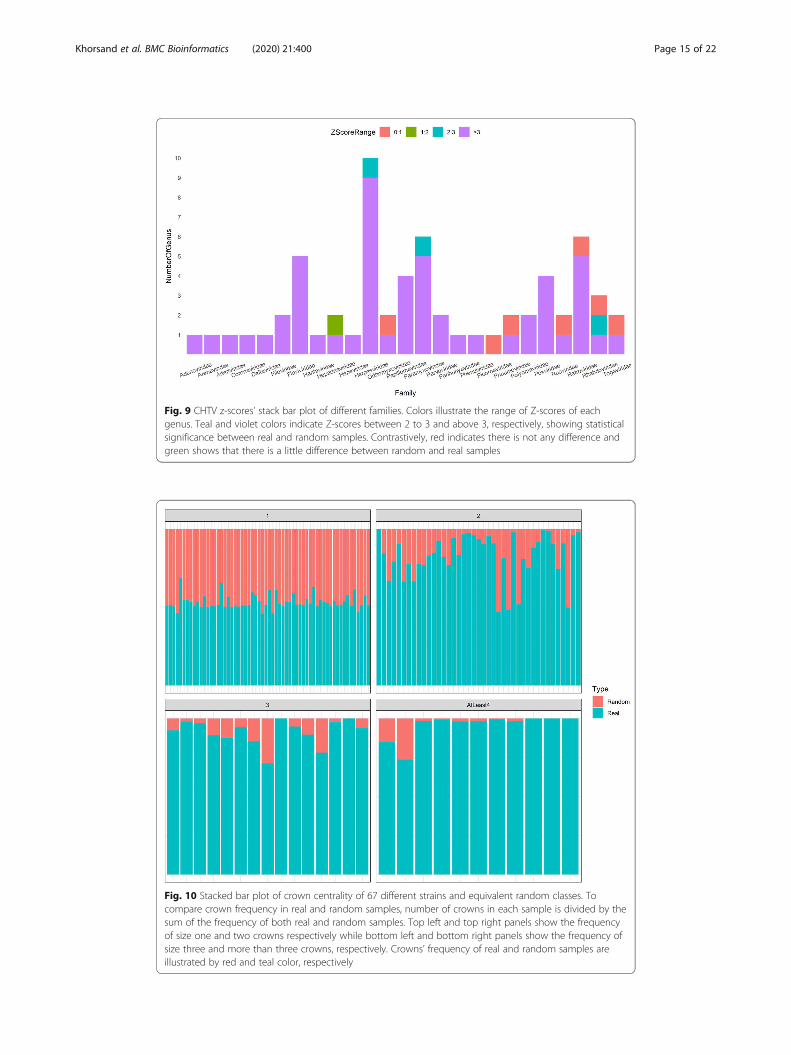
Fig. 9 CHTV z-scores’ stack bar plot of different families. Colors illustrate the range of Z-scores of eachgenus. Teal and violet colors indicate Z-scores between 2 to 3 and above 3, respectively, showing statisticalsignificance between real and random samples. Contrastively, red indicates there is not any difference andgreen shows that there is a little difference between random and real samples
Fig. 10 Stacked bar plot of crown centrality of 67 different strains and equivalent random classes. Tocompare crown frequency in real and random samples, number of crowns in each sample is divided by thesum of the frequency of both real and random samples. Top left and top right panels show the frequencyof size one and two crowns respectively while bottom left and bottom right panels show the frequency ofsize three and more than three crowns, respectively. Crowns’ frequency of real and random samples areillustrated by red and teal color, respectively
Khorsand et al. BMC Bioinformatics (2020) 21:400 Page 15 of 22
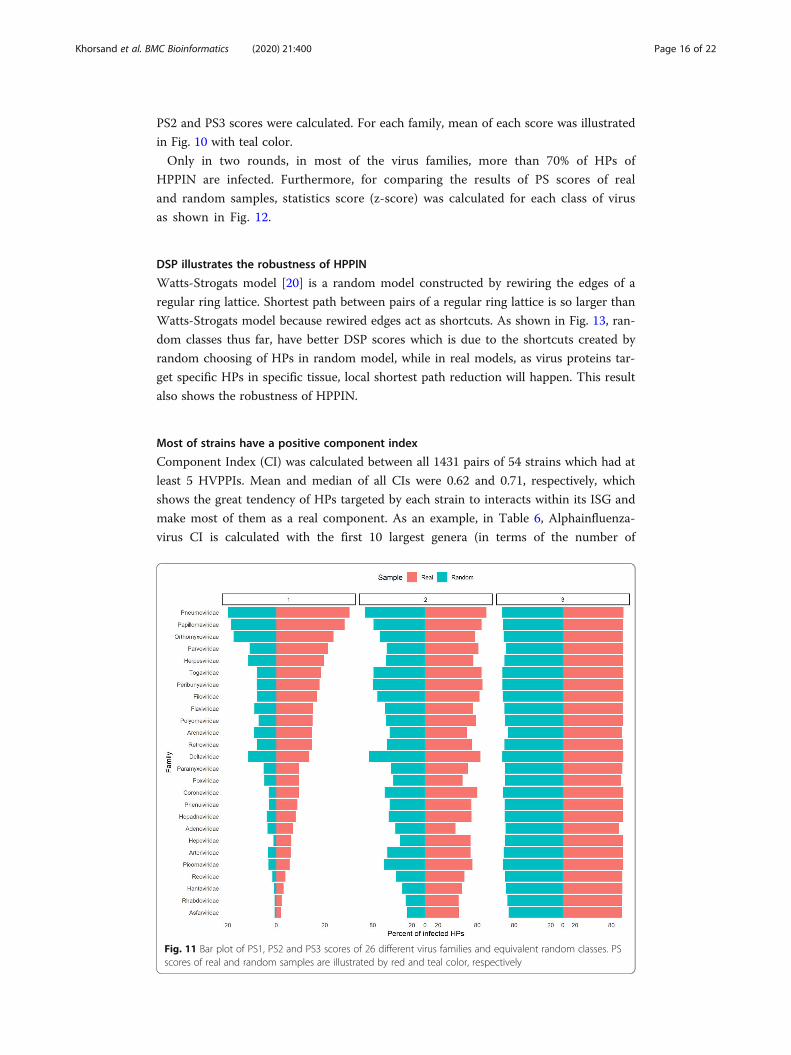
PS2 and PS3 scores were calculated. For each family, mean of each score was illustrated
in Fig. 10 with teal color.
Only in two rounds, in most of the virus families, more than 70% of HPs of
HPPIN are infected. Furthermore, for comparing the results of PS scores of real
and random samples, statistics score (z-score) was calculated for each class of virus
as shown in Fig. 12.
DSP illustrates the robustness of HPPIN
Watts-Strogats model [20] is a random model constructed by rewiring the edges of a
regular ring lattice. Shortest path between pairs of a regular ring lattice is so larger than
Watts-Strogats model because rewired edges act as shortcuts. As shown in Fig. 13, ran-
dom classes thus far, have better DSP scores which is due to the shortcuts created by
random choosing of HPs in random model, while in real models, as virus proteins tar-
get specific HPs in specific tissue, local shortest path reduction will happen. This result
also shows the robustness of HPPIN.
Most of strains have a positive component index
Component Index (CI) was calculated between all 1431 pairs of 54 strains which had at
least 5 HVPPIs. Mean and median of all CIs were 0.62 and 0.71, respectively, which
shows the great tendency of HPs targeted by each strain to interacts within its ISG and
make most of them as a real component. As an example, in Table 6, Alphainfluenza-
virus CI is calculated with the first 10 largest genera (in terms of the number of
Fig. 11 Bar plot of PS1, PS2 and PS3 scores of 26 different virus families and equivalent random classes. PSscores of real and random samples are illustrated by red and teal color, respectively
Khorsand et al. BMC Bioinformatics (2020) 21:400 Page 16 of 22
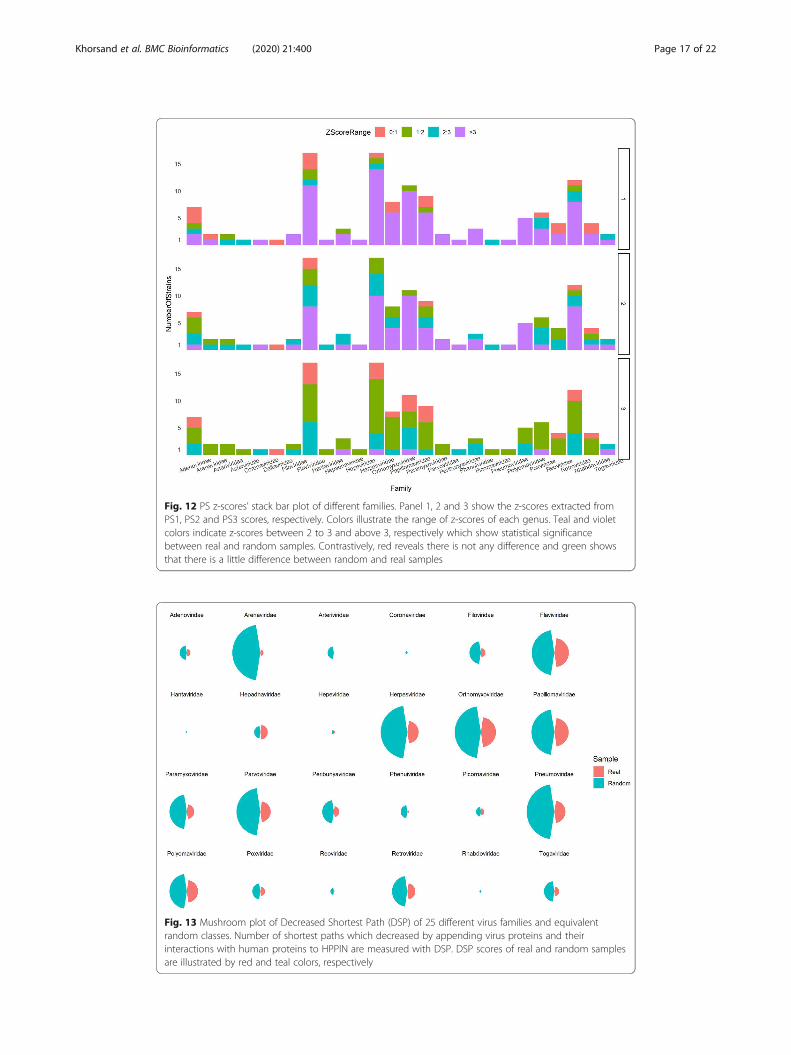
Fig. 12 PS z-scores’ stack bar plot of different families. Panel 1, 2 and 3 show the z-scores extracted fromPS1, PS2 and PS3 scores, respectively. Colors illustrate the range of z-scores of each genus. Teal and violetcolors indicate z-scores between 2 to 3 and above 3, respectively which show statistical significancebetween real and random samples. Contrastively, red reveals there is not any difference and green showsthat there is a little difference between random and real samples
Fig. 13 Mushroom plot of Decreased Shortest Path (DSP) of 25 different virus families and equivalentrandom classes. Number of shortest paths which decreased by appending virus proteins and theirinteractions with human proteins to HPPIN are measured with DSP. DSP scores of real and random samplesare illustrated by red and teal colors, respectively
Khorsand et al. BMC Bioinformatics (2020) 21:400 Page 17 of 22
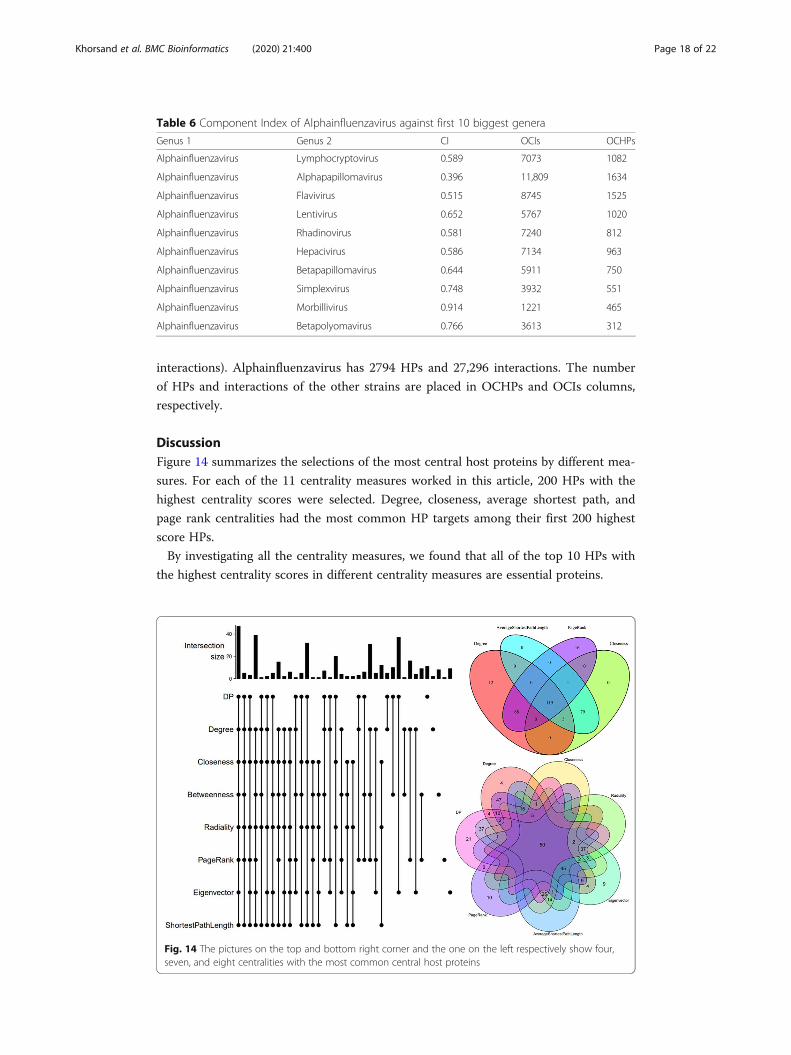
interactions). Alphainfluenzavirus has 2794 HPs and 27,296 interactions. The number
of HPs and interactions of the other strains are placed in OCHPs and OCIs columns,
respectively.
DiscussionFigure 14 summarizes the selections of the most central host proteins by different mea-
sures. For each of the 11 centrality measures worked in this article, 200 HPs with the
highest centrality scores were selected. Degree, closeness, average shortest path, and
page rank centralities had the most common HP targets among their first 200 highest
score HPs.
By investigating all the centrality measures, we found that all of the top 10 HPs with
the highest centrality scores in different centrality measures are essential proteins.
Table 6 Component Index of Alphainfluenzavirus against first 10 biggest genera
Genus 1 Genus 2 CI OCIs OCHPs
Alphainfluenzavirus Lymphocryptovirus 0.589 7073 1082
Alphainfluenzavirus Alphapapillomavirus 0.396 11,809 1634
Alphainfluenzavirus Flavivirus 0.515 8745 1525
Alphainfluenzavirus Lentivirus 0.652 5767 1020
Alphainfluenzavirus Rhadinovirus 0.581 7240 812
Alphainfluenzavirus Hepacivirus 0.586 7134 963
Alphainfluenzavirus Betapapillomavirus 0.644 5911 750
Alphainfluenzavirus Simplexvirus 0.748 3932 551
Alphainfluenzavirus Morbillivirus 0.914 1221 465
Alphainfluenzavirus Betapolyomavirus 0.766 3613 312
Fig. 14 The pictures on the top and bottom right corner and the one on the left respectively show four,seven, and eight centralities with the most common central host proteins
Khorsand et al. BMC Bioinformatics (2020) 21:400 Page 18 of 22
Moreover, the following HPs were detected as HPs with high centrality score in the
most of the centrality measures:
� P05412 (Transcription factor AP-1)
� P62993 (Growth factor receptor-bound protein 2)
� P08238 (Heat shock protein HSP 90-beta)
� Q99459 (Cell division cycle 5-like protein)
� Q08379 (Golgin subfamily A member 2)
� P61981 (14–3-3 protein gamma)
� Q86VP6 (Cullin-associated NEDD8-dissociated protein 1)
� P10809 (60 kDa heat shock protein, mitochondrial)
� P11142 (Heat shock cognate 71 kDa protein)
� P27824 (Calnexin)
Connectivity of HPs targeted by the same VP and propagation speed of viruses in
HPPIN reveals that VPs select their targets purposefully.
The tendency of virus proteins with high VC scores in targeting essential proteins
and the results of DP centrality in detecting essential proteins shows that HPs with high
DP score can be considered as potential drug targets.
Investigating Crown centrality scores reveals the tendency of VPs to have collabor-
ation in targeting same HP pairs.
Finally, Table 7 summarizes some of the possible usages of the proposed centralities.
ConclusionsIn this article, we studied the properties of a bipartite network generated from interac-
tions between human proteins versus virus proteins. As there are different virus fam-
ilies, we investigated each family as a separate network and reported the results for
most famous virus families. As HVPPIN is a bipartite network and centrality measures
for this type of network is scarce, seven new centralities were proposed on HVPPIN
and measured on different strains of famous virus families. In all proposed centralities,
significant difference was observed between real and random samples’ scores.
Moreover, we found some significant properties of essential proteins. By investigating
HPPIN and calculating ten famous centralities, it was revealed that essential HPs have
Table 7 Some of the usages of new proposed centralities
Centrality
CC Crown Specifying the amount of cooperation between the two authorsin writing articles, or the cooperation between viruses intargeting the same pair of HPs.
CI Component Index Detecting groups in social networks, or components of HPPIN.
PS Propagation Speed Revealing the speed of the rumor in society, or the speed ofspreading virus in HPPIN.
DP Diversity of Predator Disclosing favorite HP targets of viruses.
VC Vulnerable Centrality Revealing the indispensable parts of a network, or the mostimportant proteins of a virus which should be initially inhibited.
DSP Decreased Shortest Path Detecting critical points of a network, or potential drug targets.
CHTV Connectivity of Human nodeTargeted by the same Virus node
Disclosing the clique like subnetworks, or the attack tendency ofviruses.
Khorsand et al. BMC Bioinformatics (2020) 21:400 Page 19 of 22
a considerable higher centrality scores in comparison with non-essential HPs and it
could be used for finding new essential HPs. In addition, we observed that DP scores
have the same pattern. For finding the best marker of EPs, for each of the centralities,
we select 200 HPs with the highest scores and calculated the sensitivity of detecting
EPs with them. Results demonstrate that DP outperforms the others. Furthermore, ana-
lyzing VC scores of HVPPIN disclosed that VPs with high VC scores target essential
HPs significantly higher than VCs with low VC scores. This observation could be used
for choosing VCs with high VC score as the first target of drug design.
The current work can be extended by using the proposed centralities in the other bi-
partite networks. Moreover, it is suggested to recalculate centralities by adding new
HPPIs to HPPIN for finding potential EPs. Doing the same with HVPPIN and consider-
ing new HP targets of high-VC-scores VPs and HPs with high DP scores as potential
EPs are also recommended.
AbbreviationsHPPI: Human protein-protein interaction; HVPPI: Human-virus protein-protein interaction; HPPIN: Human protein-protein interaction network; HVPPIN: Human-virus protein-protein interaction network; HP: Human protein; VP: Virusprotein; EP: Essential protein; CHTV: Connectivity of human proteins targeted by same virus protein; PS: Propagationspeed; DP: Diversity of predators; DSP: Decreased shortest path; CI: Component index; CR: Crown centrality;VC: Vulnerable centrality; DC: Degree centrality; NC: Neighborhood connectivity; SP: Average shortest path length;TC: Topological coefficients; CS: Closeness centrality; CC: Clustering coefficients; BC: Betweenness centrality;RD: Radiality; EV: Eigenvector centrality; PR: Page rank centrality; HTV: Human proteins targeted by virus;ED: Evolutionary distance; ISG: Induced sub graph; DEG: Differentially expressed gene
AcknowledgementsNot applicable
Authors’ contributionsBK. designed the work, constructed and analyzed the datasets, proposed new centralities. AS. helped in dataacquisition and interpretation. MN. helped in conception of the work and interpretation of the data. The authors readand approved the final manuscript.
FundingThere is not any special source of funding
Availability of data and materialsSome part of data, analyzed during the current study are publicly available in the http://bioinf.modares.ac.ir/software/PHINAThe other datasets which were analyzed during the current study available from the corresponding author onreasonable request.
Ethics approval and consent to participateNot applicable
Consent for publicationNot applicable
Competing interestsThe authors declare that they have no competing interests.
Received: 1 February 2020 Accepted: 31 July 2020
References1. Davis FP, Barkan DT, Eswar N, McKerrow JH, Sali A. Host–pathogen protein interactions predicted by comparative
modeling. Protein Sci. 2007;16(12):2585–96.2. Dyer MD, Murali TM, Sobral BW. Computational prediction of host-pathogen protein–protein interactions.
Bioinformatics. 2007;23(13):i159–66.3. Eng CLP, Tong JC, Tan TW. Predicting host tropism of influenza a virus proteins using random forest. BMC Med Genet.
2014;7(3):S1.4. Evans P, Dampier W, Ungar L, Tozeren A. Prediction of HIV-1 virus-host protein interactions using virus and host
sequence motifs. BMC Med Genet. 2009;2(1):27.5. Barnes B, et al. Predicting novel protein-protein interactions between the HIV-1 virus and Homo sapiens. In: Student
conference (ISC), 2016 IEEE EMBS international; 2016. p. 1–4.
Khorsand et al. BMC Bioinformatics (2020) 21:400 Page 20 of 22
6. Hale BG, Jackson D, Chen Y-H, Lamb RA, Randall RE. Influenza a virus NS1 protein binds p85β and activatesphosphatidylinositol-3-kinase signaling. Proc Natl Acad Sci. 2006;103(38):14194–9.
7. Cui G, Fang C, Han K. Prediction of protein-protein interactions between viruses and human by an SVM model. BMCBioinformatics. 2012;13(7):S5.
8. Khorsand B, Savadi A, Zahiri J, Naghibzadeh M. Alpha influenza virus infiltration prediction using virus-human protein–protein interaction network. Math Biosci Eng. 2020;17(4):3109–29. https://doi.org/10.3934/mbe.2020176.
9. Miryala SK, Ramaiah S. Exploring the multi-drug resistance in Escherichia coli O157: H7 by gene interaction network: asystems biology approach. Genomics. 2019;111(4):958–65.
10. Miryala SK, Anbarasu A, Ramaiah S. Impact of bedaquiline and capreomycin on the gene expression patterns ofmultidrug-resistant mycobacterium tuberculosis H37Rv strain and understanding the molecular mechanism of antibioticresistance. J Cell Biochem. 2019;120(9):14499–509.
11. Miryala SK, Anbarasu A, Ramaiah S. Systems biology studies in Pseudomonas aeruginosa PA01 to understand their rolein biofilm formation and multidrug efflux pumps. Microb Pathog. 2019;136:103668.
12. Miryala SK, Anbarasu A, Ramaiah S. Role of SHV-11, a class a β-lactamase, gene in multidrug resistance among Klebsiellapneumoniae strains and understanding its mechanism by gene network analysis. Microb Drug Resist. 2020;26:900–8.
13. Miryala SK, Anbarasu A, Ramaiah S. Evolutionary relationship of penicillin-binding protein 2 coding penA gene andUnderstanding the role in drug-resistance mechanism using gene interaction network analysis. In: EmergingTechnologies for Agriculture and Environment. Singapore: Springer; 2020. p. 9–25.
14. Debroy R, Miryala SK, Naha A, Anbarasu A, Ramaiah S. Gene interaction network studies to decipher the multi-drugresistance mechanism in salmonella enterica serovar Typhi CT18 reveal potential drug targets. Microb Pathog. 2020;142:104096.
15. Naha A, Miryala SK, Debroy R, Ramaiah S, Anbarasu A. Elucidating the multi-drug resistance mechanism of Enterococcusfaecalis V583: a gene interaction network analysis. Gene. 2020. p. 144704–16.
16. Proctor CH, Loomis CP. Analysis of sociometric data. Res Methods Soc relations. 1951;2:561–85.17. Newman MEJ. A measure of betweenness centrality based on random walks. Soc Networks. 2005;27(1):39–54.18. Korn A, Schubert A, Telcs A. Lobby index in networks. Phys A Stat Mech its Appl. 2009;388(11):2221–6.19. Freeman LC. A set of measures of centrality based on betweenness. Sociometry. 1977;40:35–41.20. Watts DJ, Strogatz SH. Collective dynamics of ‘small-world’ networks. 1998;393:440–2.21. Lü L, Zhang Y-C, Yeung CH, Zhou T. Leaders in social networks, the delicious case. PLoS One. 2011;6(6):e21202.22. Stelzl U, et al. A human protein-protein interaction network: a resource for annotating the proteome. Cell. 2005;122(6):
957–68.23. Kovács IA, Palotai R, Szalay MS, Csermely P. Community landscapes: an integrative approach to determine overlapping
network module hierarchy, identify key nodes and predict network dynamics. PLoS One. 2010;5(9):e12528.24. Bonacich P. Power and centrality: a family of measures. Am J Sociol. 1987;92(5):1170–82.25. Maslov S, Sneppen K. Specificity and stability in topology of protein networks. Science (80- ). 2002;296(5569):910–3.26. Gosh R, Lerman K. A parameterized centrality metrics for network analysis. Phys Ther Rev. 2011. p. 66118–27.27. Beardwood J, Halton JH, Hammersley JM. The shortest path through many points. Math Proc Camb Philos Soc. 1959;
55(4):299–327.28. Estrada E, Rodriguez-Velazquez JA. Subgraph centrality in complex networks. Phys Rev E. 2005;71(5):56103.29. Brandes U. A faster algorithm for betweenness centrality. J Math Sociol. 2001;25(2):163–77.30. Ercsey-Ravasz M, Lichtenwalter RN, Chawla NV, Toroczkai Z. Range-limited centrality measures in complex networks.
Phys Rev E. 2012;85(6):66103.31. Hage P, Harary F. Eccentricity and centrality in networks. Soc Networks. 1995;17(1):57–63.32. Itaya M. An estimation of minimal genome size required for life. FEBS Lett. 1995;362(3):257–60.33. Diestel R. Graduate texts in mathematics: graph theory, vol. 173. Heidelb: SpringerVerlag; 2000.34. Bondy JA, Murty USR. Graph theory with applications, vol. 290. Ontario: Citeseer; 1976.35. Guillaume J-L, Latapy M. Bipartite structure of all complex networks. Inf Process Lett. 2004;90(Issue-5):215–21.36. Gustafsson H, Hancock DJ, Côté J. Describing citation structures in sport burnout literature: a citation network analysis.
Psychol Sport Exerc. 2014;15(6):620–6.37. Abdelmoneim AH, Mustafa MI, Mahmoud TA, Murshed NS, Hassan MA. In silico analysis and modeling of novel
pathogenic single nucleotide polymorphisms (SNPs) in human CD40LG gene. bioRxiv. 2019:552596.38. Özgür A, Vu T, Erkan G, Radev DR. Identifying gene-disease associations using centrality on a literature mined gene-
interaction network. Bioinformatics. 2008;24(13):i277–85.39. Yuan F, Zhang Y-H, Kong X-Y, Cai Y-D. Identification of candidate genes related to inflammatory bowel disease using
minimum redundancy maximum relevance, incremental feature selection, and the shortest-path approach. Biomed ResInt. 2017, 2017.
40. Zickenrott S, Angarica VE, Upadhyaya BB, Del Sol A. Prediction of disease–gene–drug relationships following adifferential network analysis. Cell Death Dis. 2016;7(1):e2040.
41. Zeng X, Ding N, Rodríguez-Patón A, Zou Q. Probability-based collaborative filtering model for predicting gene–diseaseassociations. BMC Med Genet. 2017;10(5):76.
42. Hwang S, et al. HumanNet v2: human gene networks for disease research. Nucleic Acids Res. 2018;47(D1):D573–80.43. Huang L, Wang Y, Wang Y, Bai T. Gene-disease interaction retrieval from multiple sources: a network based method.
Biomed Res Int. 2016;2016.44. Noda-Garcia L, Liebermeister W, Tawfik DS. Metabolite–enzyme coevolution: from single enzymes to metabolic
pathways and networks. Annu Rev Biochem. 2018;87:187–216.45. Ravasz E, Somera AL, Mongru DA, Oltvai ZN, Barabási A-L. Hierarchical organization of modularity in metabolic networks.
Science (80- ). 2002;297(5586):1551–5.46. Diether M, Sauer U. Towards detecting regulatory protein–metabolite interactions. Curr Opin Microbiol. 2017;39:16–23.47. Kaur J, et al. Interactions of an emerging fungal pathogen Scedosporium aurantiacum with human lung epithelial cells.
Sci Rep. 2019;9(1):5035.
Khorsand et al. BMC Bioinformatics (2020) 21:400 Page 21 of 22
48. Kumar S, Lata KS, Sharma P, Bhairappanavar SB, Soni S, Das J. Inferring pathogen-host interactions between Leptospirainterrogans and Homo sapiens using network theory. Sci Rep. 2019;9(1):1434.
49. Griesenauer B, et al. Determination of an interaction network between an extracellular bacterial pathogen and thehuman host. MBio. 2019;10(3):e01193–19.
50. Golubeva VA, et al. Network of interactions between ZIKA virus non-structural proteins and human host proteins. Cells.2020;9(1):153.
51. Cobo-Díaz JF, Baroncelli R, Le Floch G, Picot A. Combined metabarcoding and co-occurrence network analysis to profilethe bacterial, fungal and fusarium communities and their interactions in maize stalks. Front Microbiol. 2019;10:261.
52. Miryala SK, Anbarasu A, Ramaiah S. Discerning molecular interactions: a comprehensive review on biomolecularinteraction databases and network analysis tools. Gene. 2018;642:84–94.
53. Kerrien S, et al. The IntAct molecular interaction database in 2012. Nucleic Acids Res. 2011;40(D1):D841–46.54. Oughtred R, et al. The BioGRID interaction database: 2019 update. Nucleic Acids Res. 2018;47(D1):D529–41.55. Chatr-aryamontri A, et al. VirusMINT: a viral protein interaction database. Nucleic Acids Res. Jan. 2009;37(Database issue):
D669–73.56. Deane CM. Protein interactions: two methods for assessment of the reliability of high throughput observations. Mol Cell
Proteomics. 2002;1(5):349–56.57. Cook H, Doncheva N, Szklarczyk D, von Mering C, Jensen L. Viruses. STRING: a virus-host protein-protein interaction
database. Viruses. 2018;10(10):519.58. Needleman SB, Wunsch CD. A general method applicable to the search for similarities in the amino acid sequence of
two proteins. J Mol Biol. 1970;48(3):443–53.59. Masson P, et al. ViralZone: recent updates to the virus knowledge resource. Nucleic Acids Res. 2012;41(D1):D579–83.60. Georgi B, Voight BF, Bućan M. From mouse to human: evolutionary genomics analysis of human Orthologs of essential
genes. PLoS Genet. 2013;9(5):e1003484.61. Blomen VA, et al. Gene essentiality and synthetic lethality in haploid human cells. Science (80- ). 2015;350(6264):1092–6.62. Wang T, et al. Identification and characterization of essential genes in the human genome. Science (80- ). 2015;
350(6264):1096–101.63. Lek M, et al. Analysis of protein-coding genetic variation in 60,706 humans. Nature. Aug. 2016;536:285.64. Chen W-H, Lu G, Chen X, Zhao X-M, Bork P. OGEE v2: an update of the online gene essentiality database with special
focus on differentially essential genes in human cancer cell lines. Nucleic Acids Res. Oct. 2016;45(D1):D940–4.65. Li X, Li W, Zeng M, Zheng R, Li M. Network-based methods for predicting essential genes or proteins: a survey. Brief
Bioinform. 2020;21(2):566–83.66. Li G, Li M, Wang J, Wu J, Wu F-X, Pan Y. Predicting essential proteins based on subcellular localization, orthology and
PPI networks. BMC Bioinformatics. 2016;17(8):279.67. Jalili M, et al. Evolution of centrality measurements for the detection of essential proteins in biological networks. Front
Physiol. 2016;7:375.68. Li M, Ni P, Chen X, Wang J, Wu F, Pan Y. "Construction of Refined Protein Interaction Network for Predicting Essential
Proteins," in IEEE/ACM Transactions on Computational Biology and Bioinformatics. 2019;16(4):1386–97. https://doi.org/10.1109/TCBB.2017.2665482.
69. Qin C, Sun Y, Dong Y. A new method for identifying essential proteins based on network topology properties andprotein complexes. PLoS One. 2016;11(8):e0161042.
70. Azhagesan K, Ravindran B, Raman K. Network-based features enable prediction of essential genes across diverseorganisms. PLoS One. 2018;13(12):e0208722.
Publisher’s NoteSpringer Nature remains neutral with regard to jurisdictional claims in published maps and institutional affiliations.
Khorsand et al. BMC Bioinformatics (2020) 21:400 Page 22 of 22


