Embed Size (px)
Citation preview

N Engl J Med, Vol. 346, No. 1
·
January 3, 2002
·
www.nejm.org
·
23
PROTHROMBOTIC COAGULATION ABNORMALITIES PRECEDING THE HEMOLYTIC–UREMIC SYNDROME
PROTHROMBOTIC COAGULATION ABNORMALITIES PRECEDINGTHE HEMOLYTIC–UREMIC SYNDROME
W
AYNE
L. C
HANDLER
, M.D., S
RDJAN
J
ELACIC
, B.S., D
ANIEL
R. B
OSTER
, B.S., M
ARCIA
A. C
IOL
, P
H
.D., G
LYN
D. W
ILLIAMS
, M.B., C
H
.B., S
ANDRA
L. W
ATKINS
, M.D., T
AKASHI
I
GARASHI
, M.D., P
H
.D.,
AND
P
HILLIP
I. T
ARR
, M.D.
A
BSTRACT
Background
The hemolytic–uremic syndrome is athrombotic complication of
Escherichia coli
O157:H7infection. It is not known whether the coagulationabnormalities precede, and potentially cause, thisdisorder.
Methods
In 53 children infected with
E. coli
O157:H7,we measured a panel of markers indicating activa-tion of the clotting cascade and renal function withinfour days after the onset of illness. These markerswere measured again in as many as possible of the 16children in whom the hemolytic–uremic syndromedeveloped.
Results
The children in whom the hemolytic–ure-mic syndrome subsequently developed had signifi-cantly higher median plasma concentrations of pro-thrombin fragment 1+2, tissue plasminogen activator(t-PA) antigen, t-PA–plasminogen-activator inhibitortype 1 (PAI-1) complex, and
D
-dimer than childrenwith uncomplicated infection. These abnormalitiespreceded the development of azotemia and throm-bocytopenia. When the hemolytic–uremic syndromedeveloped, the urinary concentrations of beta
2
-micro-globulin and
N
-acetyl-
b
-glucosaminidase rose signifi-cantly (P=0.03 for both increases); the plasma concen-trations of t-PA antigen, t-PA–PAI-1 complex,
D
-dimer,and plasmin–antiplasmin complex also increased sig-nificantly. The concentration of t-PA antigen correlatedwith that of the t-PA–PAI-1 complex in a linear regres-sion model (squared correlation coefficient, 0.80; P<0.001).
Conclusions
In the hemolytic–uremic syndrome,thrombin generation (probably due to acceleratedthrombogenesis) and inhibition of fibrinolysis pre-cede renal injury and may be the cause of such inju-ry. (N Engl J Med 2002;346:23-32.)
Copyright © 2002 Massachusetts Medical Society.
From the Departments of Laboratory Medicine (W.L.C.), Anesthesiology(G.D.W.), and Pediatrics (S.L.W., P.I.T.), University of Washington School ofMedicine, Seattle; Children’s Hospital and Regional Medical Center, Seat-tle (S.J., D.R.B., M.A.C., G.D.W., S.L.W., P.I.T.); and the Department ofPediatrics, University of Tokyo Graduate School of Medicine, Tokyo, Japan(T.I.). Address reprint requests to Dr. Tarr at the Division of Gastroenter-ology, CH-24, Children’s Hospital and Regional Medical Center, 4800Sand Point Way NE, Seattle, WA 98105, or at [email protected].
HE hemolytic–uremic syndrome consists ofthrombocytopenia, nonimmune hemolyticanemia, and renal insufficiency. The syn-drome develops about one week after the
onset of diarrhea in approximately 15 percent of chil-dren infected with
Escherichia coli
O157:H7.
1,2
Thedevelopment of microvascular thrombi, composedlargely of fibrin, and endothelial-cell swelling are com-mon in this disorder.
3-7
E. coli
O157:H7 producesShiga toxins, which have diverse effects on eukaryot-
T
ic cells.
8
Presumably, these toxins injure host endo-thelial cells during the early stages of
E. coli
O157:H7infection and initiate a cascade that leads to the hemo-lytic–uremic syndrome.
Coagulation abnormalities in the hemolytic–ure-mic syndrome differ from those observed in classicdisseminated intravascular coagulation. In the hemo-lytic–uremic syndrome, unlike the consumptive coag-ulopathies, the concentration of fibrinogen is normalor elevated,
9-11
and the prothrombin time and par-tial-thromboplastin time are normal or only slightlyprolonged.
9
However, the concentration of circulatingprothrombin fragment 1+2, the prothrombin-activa-tion peptide that is cleaved from prothrombin whenthrombin is generated, increases.
10,11
Elevated plasmaplasminogen-activator inhibitor type 1 (PAI-1) activ-ity and increased concentrations of tissue plasmino-gen activator (t-PA) antigen and
D
-dimer
10-13
furthercharacterize the coagulopathy of the hemolytic–ure-mic syndrome.
In persons with the hemolytic–uremic syndrome,it is not known whether intravascular thrombin formsbefore renal insufficiency develops. In addition, theparadox of elevated t-PA concentrations during athrombotic disorder remains unexplained. We exam-ined a panel of coagulation markers in children with
E. coli
O157:H7 infection to determine the sequenceof vascular and renal injury as the hemolytic–uremicsyndrome develops and to characterize more com-pletely the associated coagulation abnormalities.
METHODS
Study Subjects and Procedures
The children with
E. coli
O157:H7 infection who participatedin this study have been described previously.
1
Microbiology lab-oratories in Washington, Oregon, Idaho, and Wyoming notified uswhenever
E. coli
O157:H7 was identified in the stool culture of achild under the age of 10 years. We immediately contacted thephysician of each infected child and asked him or her to seek per-mission from the child’s family for us to approach them about par-ticipation in the study. If permission was granted, we explained
Downloaded from www.nejm.org at AL KHAZINDAR CO LTD TOTAL TRANSPORT on September 04, 2004.Copyright © 2002 Massachusetts Medical Society. All rights reserved.

24
·
N Engl J Med, Vol. 346, No. 1
·
January 3, 2002
·
www.nejm.org
The New England Journal of Medicine
the purpose of the investigation to the family and obtained writteninformed consent from the child’s parent or guardian. If appro-priate, we also obtained assent from the child. In addition, childrenunder the age of 10 years who presented to the Emergency De-partment of the Children’s Hospital and Regional Medical Centerwith acute bloody diarrhea were enrolled at the time of presenta-tion if the consent of the parent or guardian and, if appropriate,the assent of the child were granted. Data from these children wereanalyzed as part of this study if a stool culture subsequently yield-ed
E. coli
O157:H7.A standardized questionnaire was administered to each child’s
caregiver to determine when the diarrhea began relative to enroll-ment in the study. The first day on which diarrhea occurred wasdefined as day 1 of the illness. Blood for research was obtained dur-ing the first clinically indicated phlebotomy after enrollment. Urinewas obtained as a clean-void or bagged specimen as soon as pos-sible after enrollment. If the hemolytic–uremic syndrome devel-oped, specimens were obtained again, if possible, within 24 hoursafter the child fulfilled the case definition of the syndrome (as de-fined below). Phlebotomy and bladder catheterization were notperformed solely for research purposes.
In all the children with infection, daily complete blood countswere obtained and renal-function tests performed for clinical pur-poses until the hemolytic–uremic syndrome developed and re-solved or until it became apparent that the infection was resolvingwithout this complication. The period of risk for the develop-ment of the hemolytic–uremic syndrome was considered to be 14days after the onset of diarrhea, according to the results of previ-ous studies in the state of Washington.
2,14
The hemolytic–uremicsyndrome was defined by the presence of the following: hemolyticanemia (a hematocrit below 30 percent, with evidence of frag-mented erythrocytes on a peripheral-blood smear), thrombocyto-penia (a platelet count of less than 150,000 per cubic millimeter),and renal insufficiency (a serum creatinine concentration that ex-ceeded the upper limit of normal for the child’s age). Uncomplicat-ed infection was defined as illness that resolved without progressingto the hemolytic–uremic syndrome. Medical records were reviewedto verify the fulfillment of these classification criteria.
Children 1 to 10 years of age who had no hematologic, renal,inflammatory, or infectious processes and who were undergoingelective operations at the Children’s Hospital and Regional Med-ical Center served as controls. Written informed consent was ob-tained from each child’s parent or guardian, and assent was also ob-tained from the child, if appropriate. Blood from these childrenwas obtained when an intravenous catheter was inserted at the be-ginning of anesthesia.
Laboratory Analysis
Blood collected by phlebotomy was added in 1.8-ml quantitiesto chilled glass tubes containing 0.2 ml of 0.105 M sodium citrateand kept on ice until centrifugation, which was performed withinan hour after collection. Plasma was then aspirated and frozen (at–70°C) in aliquots until analysis. Urine specimens were kept onice and then frozen (at ¡70°C) in aliquots within four hours aftercollection. The plasma samples were rapidly thawed, and the con-centrations of the following factors were determined with the use ofcommercially available enzyme immunoassays:
D
-dimer
15
and t-PAantigen (Asserachrom, Diagnostica Stago, Parsippany, N.J.), PAI-1activity (Chromolize PAI-1, Biopool, Ventura, Calif.), and plasmin–antiplasmin complexes
16
and prothrombin fragment 1+2 (En-zygnost F1+2, Dade Behring, Marburg, Germany).
17
The concen-tration of t-PA–PAI-1 complex was measured if sufficient plasmaremained after all the other coagulation assays had been per-formed.
18
The urine samples were thawed on ice. Beta
2
-microglob-ulin concentrations were determined by latex agglutination,
19
and
N-
acetyl-
b
-glucosaminidase concentrations were determined by afluorogenic assay with the use of methylumbelliferyl
N
-acetyl-
b
-glucosaminide as a substrate.
20
The assays of coagulation markers and urinary beta
2
-microglob-ulin and
N
-acetyl-
b
-glucosaminidase were performed by staff mem-bers who were unaware of the enrollment characteristics of thechildren from whom the samples had been obtained. Informationon the identity of the samples was retained in the laboratory of oneof the authors. Assays were performed in batches and included si-multaneous analysis of samples from all three groups of children.
The samples were assigned to one of three groups for initial analy-sis: those obtained from the children without infection (controls),those obtained on or before day 4 of illness from children with un-complicated infection, and those obtained on or before day 4 fromchildren in whom the hemolytic–uremic syndrome subsequentlydeveloped. We chose to analyze data from samples collected duringthe first four days of illness because the earliest point at which thehemolytic–uremic syndrome occurred in any of the children inthis study was day 5 of illness, and we wished to avoid analyzingdata on samples from children in whom one or more of the cri-teria for the hemolytic–uremic syndrome had already been ful-filled. In children in whom the hemolytic–uremic syndrome diddevelop, we obtained informed consent (and, if necessary, assent)to collect a second set of plasma samples, urine samples, or bothfrom subjects after the case definition of the syndrome had beenmet, in order to identify any significant changes in the results ofthe laboratory assays.
Statistical Analysis
The Wilcoxon rank–sum test was used to test the significanceof differences between the children with uncomplicated infectionand those in whom the hemolytic–uremic syndrome subsequent-ly developed; between the children with uncomplicated infectionand the controls; and between the children in whom the hemo-lytic–uremic syndrome subsequently developed and the controls.The significance level was set at 0.05, and all tests to assess P valueswere two-sided. A linear regression model was used to analyze therelation between the concentrations of t-PA antigen and t-PA–PAI-1 complex on or before day 4 of illness in the two groups ofinfected children. Paired data from the same children, obtained attwo different times during the illness, were analyzed with use ofthe nonparametric Wilcoxon signed-rank test.
RESULTS
Between May 1, 1997, and February 1, 2001, plas-ma was obtained on or before day 4 of illness from53 infected children (Table 1); all of the samples ex-cept one were obtained after microbiologic diagno-sis of
E. coli
O157:H7 infection. Sufficient plasma tomeasure the concentration of t-PA–PAI-1 complexwas available from all except three of the infectedchildren. Urine samples were obtained on or beforeday 4 of illness from 35 of the infected children. Thehemolytic–uremic syndrome developed between days5 and 13 of illness, inclusive, in 16 of the 53 children.Urine samples had been obtained from 11 of these 16children, and 14 subsequently contributed a secondplasma sample and 6 a second urine sample for re-search purposes when the hemolytic–uremic syn-drome developed. All of the 14 control children con-tributed plasma, and 6 of them contributed urine.
The samples were obtained after similar numbersof days of illness in the two groups of children withinfection: those with uncomplicated infection andthose in whom the hemolytic–uremic syndrome sub-sequently developed. The hematocrit, platelet count,
Downloaded from www.nejm.org at AL KHAZINDAR CO LTD TOTAL TRANSPORT on September 04, 2004.Copyright © 2002 Massachusetts Medical Society. All rights reserved.

PROTHROMBOTIC COAGULATION ABNORMALITIES PRECEDING THE HEMOLYTIC–UREMIC SYNDROME
N Engl J Med, Vol. 346, No. 1
·
January 3, 2002
·
www.nejm.org
·
25
*Plus–minus values are means ±SD. Day 1 of illness was defined as the first day of diarrhea. PAI-1 denotes plasminogen-activator inhibitor,and t-PA tissue plasminogen activator. Sufficient plasma to measure the concentration of t-PA–PAI-1 complex was available from all exceptthree of the infected children. Urine samples were obtained on or before day 4 of illness from 35 of the infected children. Dashes indicatethat the variable is not applicable. Because of rounding, not all percentages total 100.
†To convert values for serum creatinine to micromoles per liter, multiply by 88.4.
‡P<0.05 by the Wilcoxon rank-sum test for the comparison with the median value in the controls.
§P<0.05 by the Wilcoxon rank-sum test for the comparison with the median value in the children with uncomplicated infection and withthe median value in the controls.
¶P<0.05 by the Wilcoxon signed-rank test for the comparison with the median value obtained on or before day 4 of illness, before theonset of the hemolytic–uremic syndrome in children from whom paired samples were available.
T
ABLE
1.
C
HARACTERISTICS
OF
THE
C
HILDREN
.*
C
HARACTERISTIC
N
O
I
NFECTION
(C
ONTROLS
) (N=14)
U
NCOMPLICATED
I
NFECTION
(N=37)
B
EFORE
H
EMOLYTIC
–U
REMIC
S
YNDROME
(N=16)
A
FTER
O
NSET
OF
H
EMOLYTIC
–U
REMIC
S
YNDROME
(N=14)
Female sex — no. (%) 2 (14) 13 (35) 5 (31) 5 (36)
Age — yr 4.3±3.2 3.9±2.4 3.4±1.8 3.5±1.9
Race or ethnic group — no. (%)WhiteHispanicBlackAsian or Pacific IslanderNative American
12 (86)0 1 (7)0 1 (7)
30 (81)5 (14)2 (5)0 0
13 (81)2 (12)0 1 (6)0
12 (86)1 (7)01 (7)0
Bloody diarrhea — no. (%) — 30 (81) 14 (88) 12 (86)
Plasma sample obtained — no. (%)Day 2 of illnessDay 3 of illnessDay 4 of illness
———
4 (11)10 (27)23 (62)
2 (12)5 (31)9 (56)
———
Day of illness plasma sample obtained after hemolytic–uremic syndrome case def-inition fulfilled (in 14 children)
MedianRange
— — —
86–13
Day of illness urine sample obtained after hemolytic–uremic syndrome case def-inition fulfilled (in 6 children)
MedianRange
— —
86–13
Hematocrit — % 35.6±3.0 37.4±2.6 38.2±5.0 22.0±3.3
Platelet count — ¬10
¡3
per mm
3
321±70 317±74 322±97 43±30
Creatinine — mg/dl† 0.4±0.1 0.4±0.1 0.4±0.2 2.0±1.2
Prothrombin fragment 1+2 — nmol/literMedianRange
0.730.30–1.37
1.44‡0.48–5.40
2.45§0.70–11.0
3.941.75–20.6
PAI-1 activity — IU/mlMedianRange
1.40.4–7.0
1.70.1–17.6
6.1§0.5–48.7
11.52.0–28.6
t-PA–PAI-1 complex — ng/mlMedianRange
2.00.9–4.2
2.60.5–9.9
4.5§1.4–18.0
9.2¶3.4–18.7
t-PA antigen — ng/mlMedianRange
3.11.8–9.1
3.30.5–8.7
4.3§1.5–18.7
11.4¶4.1–15.4
D
-Dimer — log
e
ng/mlMedianRange
5.885.03–6.43
7.20‡5.96–8.27
7.80§6.59–8.87
9.17¶7.26–10.85
Plasmin–antiplasmin complex — ng/mlMedianRange
405140–683
691‡321–1673
847§300–3286
2159¶1250–5874
Beta
2
-microglobulin — mg/mlMedianRange
«70«70–220
89«70–5655
326‡«70–4159
19,398¶714–44,658
N
-acetyl-
b
-glucosaminidase — U/literMedianRange
2.31.4–3.9
2.71.0–9.0
3.40.5–11.0
17.0¶8.4–74.6
Downloaded from www.nejm.org at AL KHAZINDAR CO LTD TOTAL TRANSPORT on September 04, 2004.Copyright © 2002 Massachusetts Medical Society. All rights reserved.

26
·
N Engl J Med, Vol. 346, No. 1
·
January 3, 2002
·
www.nejm.org
The New England Journal of Medicine
and serum creatinine concentration were normal andsimilar in these two groups, as well as in the controlgroup (Table 1). Thus, hemolysis, quantitative plate-let abnormalities, and renal insufficiency had yet toevolve in the children in whom the hemolytic–ure-mic syndrome subsequently developed.
Despite the absence of microangiopathic changes orrenal insufficiency, the children in whom the hemolyt-ic–uremic syndrome subsequently developed hadhigher median values for each of the coagulation fac-tors and urinary proteins than the children with un-complicated infection, who, in turn, had higher medi-an values for each of these variables than the controls.These differences were significant with respect to theplasma concentrations of fragment 1+2 (P=0.003for the comparison between the children who laterhad the hemolytic–uremic syndrome and those withuncomplicated infection and P<0.001 for the com-parison between those with uncomplicated infectionand the controls) and
D
-dimer (P=0.002 and P<0.001, respectively), according to the Wilcoxon rank-sum test (Fig. 1 and Table 1). Children in whom thehemolytic–uremic syndrome subsequently developedhad significantly higher median plasma concentra-tions of t-PA antigen than those with uncomplicatedinfection and the controls (P=0.006 and P=0.01, re-spectively); the same was true with respect to the me-dian concentrations of PAI-1 (P=0.02 and P=0.005,respectively) and of t-PA–PAI-1 complex (P=0.006and P=0.001, respectively). The median plasma con-centrations of plasmin–antiplasmin complex and me-dian urinary concentrations of beta
2
-microglobulinwere significantly greater in the children in whomthe hemolytic–uremic syndrome developed than inthe controls (P<0.001 and P=0.04, respectively) butwere not significantly greater than those in the chil-dren with uncomplicated infection (Fig. 2 and Table1). The overlap between the infected groups in plasmaand urinary values was usually considerable, as shownfor selected variables in Figures 1 and 2.
In the children in whom the hemolytic–uremicsyndrome eventually developed, the median changesbetween the initial concentrations of coagulation fac-
tors measured after enrollment and the concentrationsmeasured after the onset of this complication (amongthe 14 children from whom paired plasma sampleswere available) were statistically significant with respectto the following variables: t-PA antigen (median in-crease, 4.90 ng per milliliter; P=0.01), t-PA–PAI-1complex (median increase, 4.0 ng per milliliter; P=0.002),
D
-dimer (median increase, 0.56 log
e
ng permilliliter; P=0.02), and plasmin–antiplasmin complex(median increase, 982 mg per milliliter; P<0.001)(Fig. 3 and Table 1). The changes in urinary indexesbetween these two time points among the childrenfrom whom paired urine samples were available werealso significant: the urinary beta
2
-microglobulin con-centration increased by a median of 20,899 mg permilliliter (P=0.03), and the
N
-acetyl-
b
-glucosamini-dase concentration increased by a median of 20.75U per liter (P=0.03) (Fig. 2 and Table 1). In contrast,the median changes in the concentration of prothrom-bin fragment 1+2 and PAI-1 activity were 0.915 nmolper liter (P=0.17) and 4.45 IU per milliliter (P=0.24), respectively (Fig. 3 and Table 1).
During the first four days of illness the concentra-tions of t-PA–PAI-1 complex were strongly correlatedwith the concentration of circulating t-PA antigen(squared correlation coefficient, 0.80; P<0.001)among the children with infection (Fig. 4). The me-dian percentages of total t-PA antigen in complexeswith PAI-1 were 81 percent in the children with un-complicated infection, 95 percent in those in whomthe hemolytic–uremic syndrome subsequently devel-oped, and 86 percent in those with the hemolytic–uremic syndrome.
DISCUSSION
Our data shed light on the pathophysiology of theprogression of
E. coli
O157:H7 infection to the he-molytic–uremic syndrome. The concentrations of pro-thrombin fragment 1+2 during the first four days ofillness were as high as those in patients with dissem-inated intravascular coagulation caused by abdomi-nal sepsis or cancer
21
and were similar to the concen-trations of fragment 1+2 observed in children with
Figure 1 (facing page).
Box Plot of Coagulation Factors in Children without
Escherichia coli
O157:H7 Infection and within Four Daysafter the Onset of Diarrhea in Children with Infection.Shown for each coagulation factor is the distribution of values from the 14 children without infection (controls), the 37 childrenwhose
E. coli
O157:H7 infection resolved without development of the hemolytic–uremic syndrome, and the 16 children in whomthe hemolytic–uremic syndrome subsequently developed. The horizontal line within each box represents the median, the lowerand upper borders of each box represent the 25th and the 75th percentiles, respectively, and the T bars represent the differencesbetween the lower and upper borders multiplied by 1.5. Outliers (values that exceed these boundaries) are depicted as single points.The asterisks indicate P<0.05 by the Wilcoxon rank-sum test for the comparison between the median value in the group of childrenin whom the hemolytic–uremic syndrome subsequently developed and the median value in each of the other two groups of chil-dren, and the dagger indicates P<0.05 by the Wilcoxon rank-sum test for the comparison between the median value in the childrenwith uncomplicated infection and the median value in the controls.
Downloaded from www.nejm.org at AL KHAZINDAR CO LTD TOTAL TRANSPORT on September 04, 2004.Copyright © 2002 Massachusetts Medical Society. All rights reserved.

PROTHROMBOTIC COAGULATION ABNORMALITIES PRECEDING THE HEMOLYTIC–UREMIC SYNDROME
N Engl J Med, Vol. 346, No. 1
· January 3, 2002 · www.nejm.org · 27
0
50
NoInfection
UncomplicatedInfection
BeforeHemolytic–
UremicSyndrome
40
30
20
10
*
PA
I-1
Act
ivit
y (I
U/m
l)
0
10
NoInfection
UncomplicatedInfection
BeforeHemolytic–
UremicSyndrome
8
12
6
4
2*
Pro
thro
mb
in F
rag
men
t 1+
2 (n
mo
l/lit
er)
0
15
NoInfection
UncomplicatedInfection
BeforeHemolytic–
UremicSyndrome
10
20
5*
t-P
A A
nti
gen
(n
g/m
l)
0
10
NoInfection
UncomplicatedInfection
BeforeHemolytic–
UremicSyndrome
8
6
4
2
*†
D-D
imer
(lo
ge
ng
/ml)
†
Downloaded from www.nejm.org at AL KHAZINDAR CO LTD TOTAL TRANSPORT on September 04, 2004.Copyright © 2002 Massachusetts Medical Society. All rights reserved.

28 · N Engl J Med, Vol. 346, No. 1 · January 3, 2002 · www.nejm.org
The New England Journal of Medicine
the hemolytic–uremic syndrome in European stud-ies.10,11 These elevations demonstrate that in E. coliO157:H7 infection, prothrombin is being convertedto thrombin at an early stage of illness, when the hem-atocrit, platelet count, and serum creatinine concen-tration are normal. The thrombin generation at thisstage of illness most likely represents thrombogene-sis. The formation of fibrin can be inferred from thefinding of disseminated thrombi in patients with thehemolytic–uremic syndrome, usually in specimens ob-tained at autopsy,3-7 and from the elevated concentra-tion of fibrinopeptide A22 in children with the hemo-lytic–uremic syndrome, which was presumably causedby E. coli O157:H7.23
The elevation of prothrombin fragment 1+2 beforethe development of azotemia suggests that thrombo-genesis precedes, and may lead to, renal insufficiencyin the hemolytic–uremic syndrome caused by E. coliO157:H7. Because the serum creatinine concentra-tion can be a delayed indicator of renal injury, weanalyzed urinary concentrations of beta2-microglob-ulin and N-acetyl-b-glucosaminidase (a proximal re-nal tubular enzyme), which are early markers of in-jury to the kidneys after exposure to nephrotoxicagents.24,25 Despite several outlying elevated values,most of the infected children in our study had nor-mal concentrations of N-acetyl-b-glucosaminidase.There was evidence of impaired renal absorption ofbeta2-microglobulin, but the concentration of neitherof these urinary proteins became markedly elevateduntil the hemolytic–uremic syndrome developed. Ourdata probably underestimate the renal tubular injuryat the onset of the hemolytic–uremic syndrome, be-cause some of the children became anuric and thuswere unable to provide a second urine sample foranalysis, which presumably would have had an evenhigher concentration of these proteins.
The delay in the elevation of these urinary pro-teins and the delay in the onset of azotemia contrastwith the relative stability of the plasma concentra-tions of prothrombin fragment 1+2 in most of thechildren in whom paired samples were available foranalysis. This sequence of events suggests that pro-
thrombotic abnormalities might underlie the initialpathophysiologic events leading to renal injury in thehemolytic–uremic syndrome and that tubular injuryand renal insufficiency are secondary to the formationof fibrin thrombi. An alternative and, in our opinion,less likely explanation is that circulating bacterial prod-ucts, probably Shiga toxins, directly injure renal cellsbefore or at the same time as they injure vascular cells,but that the renal manifestations of this injury ap-pear later.
The correlation of the concentrations of t-PA–PAI-1 complex with those of the t-PA antigen resolvesthe seemingly contradictory observation that a puta-tively profibrinolytic molecule, t-PA, increases in con-centration after the onset of the hemolytic–uremicsyndrome, which is a thrombotic disorder.10,12 Spe-cifically, the half-life of t-PA antigen in the circula-tion is 2.4 minutes when it is in its free form and 5.0minutes when it is in t-PA–PAI-1 complexes.26 There-fore, the formation of complexes of t-PA and PAI-1elevates the concentration of circulating t-PA anti-gen at the same time that it inhibits the ability of t-PAto activate plasminogen. This mechanism probablyunderlies the diminished fibrinolytic potential of theplasma of children with the hemolytic–uremic syn-drome.10 The diminished capacity of t-PA to activateplasminogen in infected children before the hemo-lytic–uremic syndrome develops also extends the find-ings of Bergstein et al.,13 who observed that elevatedPAI-1 activity and, presumably, augmented t-PA in-hibition are associated with prolongation of the he-molytic–uremic syndrome.
The elevated concentrations of circulating D-dimer,a fibrin-degradation product, can be misinterpretedas representing the rate of plasminogen activation andthus the concentration of functional plasminogen ac-tivators. However, the concentration of D-dimer is el-evated when there is excess fibrin in the vascular sys-tem, as in patients with deep venous thrombosis ordisseminated intravascular coagulation. The D-dimerconcentration may increase further when the con-centration of circulating t-PA increases in the pres-ence of increased concentrations of fibrin,27,28 but
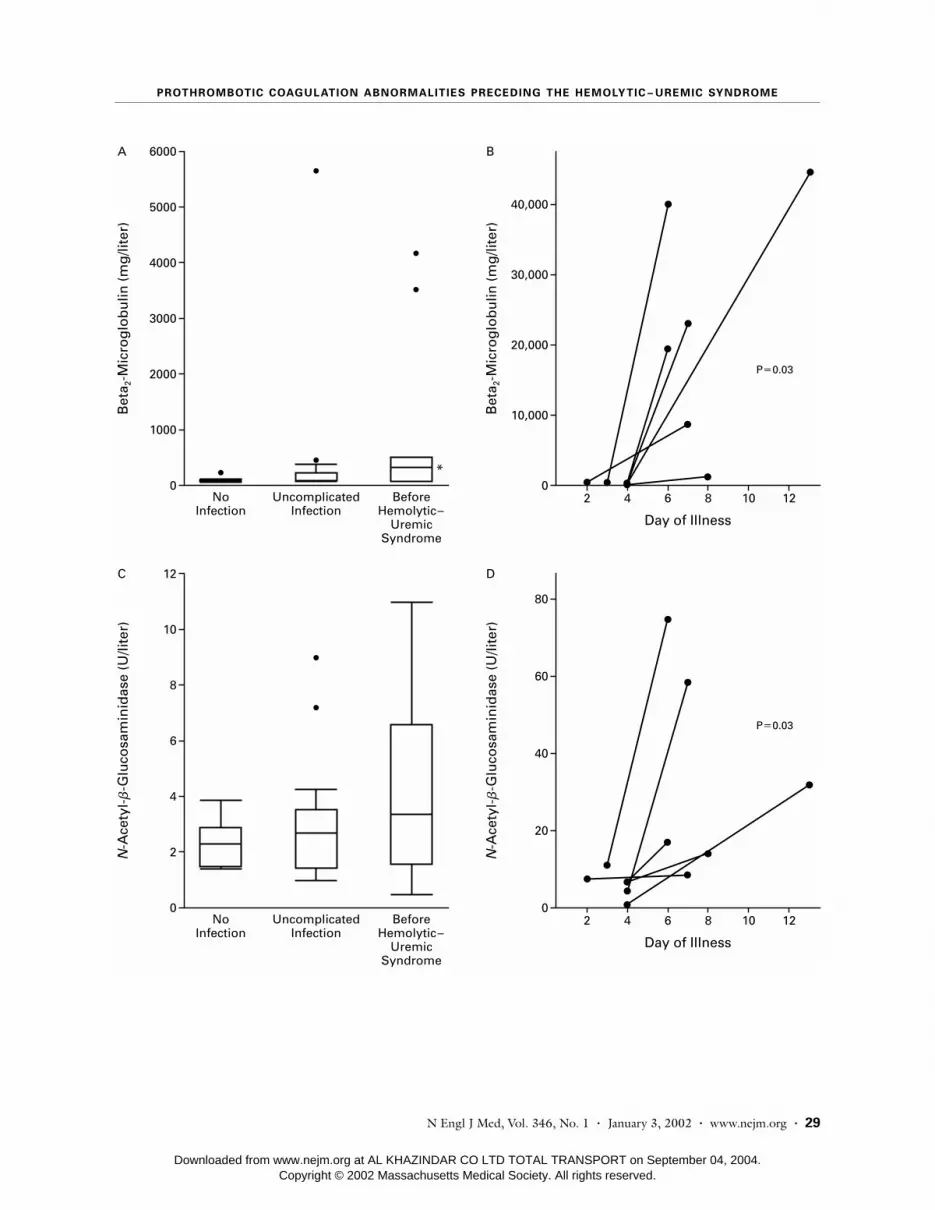
Figure 2 (facing page). Urinary Markers of Renal Injury Associated with Escherichia coli O157:H7 Infection.Panels A and C show box plots of the urinary concentrations of beta2-microglobulin and N-acetyl-b-glucosaminidase, respectively,in children without infection (controls) and within four days after the onset of diarrhea in children with E. coli O157:H7 infection.The horizontal line within each box represents the median, the lower and upper borders of each box represent the 25th and the75th percentiles, respectively, and the T bars represent the differences between the lower and upper borders multiplied by 1.5.Outliers (values that exceed these boundaries) are depicted as single points. The asterisk indicates P<0.05 by the Wilcoxon rank-sumtest for the comparison between the median value in the group of children in whom the hemolytic–uremic syndrome subsequentlydeveloped and the median value in the controls. Panels B and D show changes in the concentrations of urinary beta2-microglobulinand N-acetyl-b-glucosaminidase, respectively, between the values measured after enrollment and the values measured after theonset of the hemolytic–uremic syndrome in the six children from whom paired urine samples were available for analysis. P valuesare for the comparison between the pairs of values, by the Wilcoxon signed-rank test.
Downloaded from www.nejm.org at AL KHAZINDAR CO LTD TOTAL TRANSPORT on September 04, 2004.Copyright © 2002 Massachusetts Medical Society. All rights reserved.
PROTHROMBOTIC COAGULATION ABNORMALITIES PRECEDING THE HEMOLYTIC–UREMIC SYNDROME
N Engl J Med, Vol. 346, No. 1 · January 3, 2002 · www.nejm.org · 29
0
5000
4000
6000A
3000
2000
1000
Bet
a 2-M
icro
glo
bu
lin (
mg
/lite
r)
NoInfection
UncomplicatedInfection
BeforeHemolytic–
UremicSyndrome
*
0
10
8
12C
6
4
2N-A
cety
l-b
-Glu
cosa
min
idas
e (U
/lite
r)
NoInfection
UncomplicatedInfection
BeforeHemolytic–
UremicSyndrome
0
40,000
30,000
B
20,000
10,000Bet
a 2-M
icro
glo
bu
lin (
mg
/lite
r)
Day of Illness
P=0.03
2 4 6 8 10 12
0
60
40
80
D
20
N-A
cety
l-b
-Glu
cosa
min
idas
e (U
/lite
r)
Day of Illness
P=0.03
2 4 6 8 10 12
Downloaded from www.nejm.org at AL KHAZINDAR CO LTD TOTAL TRANSPORT on September 04, 2004.Copyright © 2002 Massachusetts Medical Society. All rights reserved.

30 · N Engl J Med, Vol. 346, No. 1 · January 3, 2002 · www.nejm.org
The New England Journal of Medicine
Figure 3. Changes in the Concentrations of Coagulation Factors at the Onset of the Hemolytic–Uremic Syndrome.Changes between the values measured after enrollment and the values measured after the onset of the hemolytic–uremic syn-drome are shown for the 14 children from whom paired plasma samples were available for analysis. P values are for the comparisonbetween the pairs of values, by the Wilcoxon signed-rank test.
0
50
0
10
20
30
40
2 4 6 8 10 12
Day of Illness
P=0.24
PA
I-1
Act
ivit
y (I
U/m
l)
0
11
0
6
7
8
9
10
2 4 6 8 10 12
Day of Illness
P=0.02
D-D
imer
(lo
ge
ng
/ml)
0
20
0
5
10
15
2 4 6 8 10 12
P=0.17
Pro
thro
mb
in F
rag
men
t 1+
2 (n
mo
l/lit
er)
0
20
0
5
10
15
2 4 6 8 10 12
P=0.01
t-P
A A
nti
gen
(n
g/m
l)
Downloaded from www.nejm.org at AL KHAZINDAR CO LTD TOTAL TRANSPORT on September 04, 2004.Copyright © 2002 Massachusetts Medical Society. All rights reserved.

PROTHROMBOTIC COAGULATION ABNORMALITIES PRECEDING THE HEMOLYTIC–UREMIC SYNDROME
N Engl J Med, Vol. 346, No. 1 · January 3, 2002 · www.nejm.org · 31
increased amounts of active t-PA alone will not raisethe D-dimer concentration. For example, when t-PA isinfused into normal subjects, circulating D-dimers26,29
are not detected; the appearance of D-dimers in thecirculation depends on the presence of intravascularfibrin. Therefore, it is more likely that elevated con-centrations of circulating D-dimer in persons withE. coli O157:H7 infection reflect the mass of intra-vascular fibrin present than it is that they signify anincreased rate of plasminogen activation or elevatedconcentrations of functional plasminogen activators.The increasing concentrations of these fibrin-degra-dation products as the hemolytic–uremic syndromeevolves most likely indicate accelerating accretion ofintravascular fibrin.
In our study, children with uncomplicated E. coliO157:H7 infection also had higher median values forcoagulation factors than did children without infec-tion. Thus, as with the degradation of von Willebrandfactor,3 at least some children infected with E. coliO157:H7 have vascular injury without evidence of he-matologic or renal injury. It is not known whetherthis vascular injury plays a part in the pathophysiol-
ogy of the gastrointestinal manifestations of E. coliO157:H7 infection.
The greater severity of prothrombotic abnormali-ties in the children in whom the hemolytic–uremicsyndrome subsequently developed than in thosewhose illness resolved spontaneously has several clin-ical implications. First, the blood count and serumcreatinine concentration are normal, and thus thesevalues do not indicate the severity of vascular injuryearly in the course of illness; considerable amountsof thrombin are generated in infected children, de-spite normal hematocrits, platelet counts, and serumcreatinine concentrations. Second, although our find-ings are useful in delineating the pathophysiology ofthe sequelae of E. coli O157:H7 infection, we mustcaution against the use of these data to predict the de-velopment of the hemolytic–uremic syndrome. Therewas extensive overlap between the values in the chil-dren with uncomplicated infection and those in thechildren in whom the hemolytic–uremic syndromesubsequently developed. Third, the coagulation ab-normalities that are observed before azotemia developsmight present an opportunity for altering the pro-
Figure 4. Correlation between Plasma Concentrations of t-PA and t-PA–PAI-1 Complex in Children withEscherichia coli O157:H7 Infection.The values from samples obtained after the onset of the hemolytic–uremic syndrome were not includ-ed in the regression analysis but are plotted here to show the persistent correlation between the con-centrations of t-PA antigen and t-PA–PAI-1 complex after the onset of the hemolytic–uremic syndrome.R2 denotes the squared correlation coefficient.
0
20
0 18
R2=0.80P<0.001
5
10
15
1383
t-PA Antigen (ng/ml)
t-P
A–
PA
I-1
Co
mp
lex
(ng
/ml)
Uncomplicated infectionBefore hemolytic–
uremic syndromeAfter onset of hemolytic–
uremic syndrome
Downloaded from www.nejm.org at AL KHAZINDAR CO LTD TOTAL TRANSPORT on September 04, 2004.Copyright © 2002 Massachusetts Medical Society. All rights reserved.

32 · N Engl J Med, Vol. 346, No. 1 · January 3, 2002 · www.nejm.org
The New England Journal of Medicine
thrombotic cascade early in the course of the illness,possibly by thrombin inhibition, and thus haltingthe progression to renal insufficiency. However, theformation of thrombin and the inhibition of fibrinol-ysis are well under way by the fourth day of illness inchildren in whom the hemolytic–uremic syndromesubsequently develops; the vascular disorder may al-ready be irreversible by the time of presentation. Clear-ly, the best way to prevent the hemolytic–uremicsyndrome is to prevent primary infection with E. coliO157:H7.
Presented in part at the Fourth International Symposium and Workshopon Shiga Toxin (Verocytotoxin-Producing) Escherichia coli Infections, Kyoto,Japan, October 29–November 2, 2000, and the 18th Congress of the Inter-national Society on Thrombosis and Haemostasis, Paris, July 6–12, 2001.
We are indebted to Kaye Green for expert secretarial assistance, tothe participating children and their families, and to the participat-ing microbiologists, other members of the laboratory staff, nurses,and physicians.
REFERENCES
1. Wong CS, Jelacic S, Habeeb RL, Watkins SL, Tarr PI. The risk of hemo-lytic–uremic syndrome after antibiotic treatment of Escherichia coli O157:H7 infections. N Engl J Med 2000;342:1930-6.2. Tarr PI, Neill MA, Clausen CR, Watkins SL, Christie DL, Hickman RO. Escherichia coli O157:H7 and the hemolytic uremic syndrome: impor-tance of early cultures in establishing the etiology. J Infect Dis 1990;162:553-6.3. Tsai HM, Chandler WL, Sarode R, et al. Von Willebrand factor and von Willebrand factor-cleaving metalloprotease activity in Escherichia coli O157:H7-associated hemolytic uremic syndrome. Pediatr Res 2001;49:653-9.4. Inward CD, Howie AJ, Fitzpatrick MM, Rafaat F, Milford DV, Taylor CM. Renal histopathology in fatal cases of diarrhoea-associated haemolytic uraemic syndrome. Pediatr Nephrol 1997;11:556-9.5. Richardson SE, Karmali MA, Becker LE, Smith CR. The histopathol-ogy of the hemolytic uremic syndrome associated with verocytotoxin-pro-ducing Escherichia coli infections. Hum Pathol 1988;19:1102-8.6. Riella MC, George CR, Hickman RO, et al. Renal microangiopathy of the hemolytic-uremic syndrome in childhood. Nephron 1976;17:188-203.7. Habib R. Pathology of the hemolytic–uremic syndrome. In: Kaplan BS, Trompeter RS, Moake JL, eds. Hemolytic uremic syndrome and thrombot-ic thrombocytopenic purpura. New York: Marcel Dekker, 1992:315-53.8. Nakao H, Takeda T. Escherichia coli Shiga toxin. J Nat Toxins 2000;9:299-313.9. Katz J, Lurie A, Kaplan BS, Krawitz S, Metz J. Coagulation findings in the hemolytic–uremic syndrome of infancy: similarity to hyperacute renal allograft rejection. J Pediatr 1971;78:426-34.10. Nevard CH, Jurd KM, Lane DA, Philippou H, Haycock GB, Hunt BJ. Activation of coagulation and fibrinolysis in childhood diarrhoea-asso-ciated haemolytic uraemic syndrome. Thromb Haemost 1997;78:1450-5.11. Van Geet C, Proesmans W, Arnout J, Vermylen J, Declerck PJ. Activa-tion of both coagulation and fibrinolysis in childhood hemolytic uremic syndrome. Kidney Int 1998;54:1324-30.
12. van de Kar NC, van Hinsbergh VW, Brommer EJ, Monnens LA. The fibrinolytic system in the hemolytic uremic syndrome: in vivo and in vitro studies. Pediatr Res 1994;36:257-64.13. Bergstein JM, Riley M, Bang NU. Role of plasminogen-activator in-hibitor type 1 in the pathogenesis and outcome of the hemolytic uremic syndrome. N Engl J Med 1992;327:755-9.14. Bell BP, Griffin PM, Lozano P, Christie DL, Kobayashi JM, Tarr PI. Predictors of hemolytic uremic syndrome in children during a large out-break of Escherichia coli O157:H7 infections. Pediatrics 1997;100:127. ab-stract. (See http://www.pediatrics.org/cgi/content/full/100/1/e12.)15. Elms MJ, Bunce IH, Bundesen PG, et al. Measurement of crosslinked fibrin degradation products — an immunoassay using monoclonal anti-bodies. Thromb Haemost 1983;50:591-4.16. Holvoet P, de Boer A, Verstreken M, Collen D. An enzyme-linked im-munosorbent assay (ELISA) for the measurement of plasmin-a2-antiplas-min complex in human plasma — application to the detection of in vivo activation of the fibrinolytic system. Thromb Haemost 1986;56:124-7.17. Pelzer H, Schwarz A, Stuber W. Determination of human prothrom-bin activation fragment 1+2 in plasma with an antibody against a synthetic peptide. Thromb Haemost 1991;65:153-9.18. Chandler WL, Jascur ML, Henderson PJ. Measurement of different forms of tissue plasminogen activator in plasma. Clin Chem 2000;46:38-46.19. Evrin PE, Wibell L. The serum levels and urinary excretion of 2-microglobulin in apparently healthy subjects. Scand J Clin Lab Invest 1972;29:69-74.20. Alderman MH, Melcher L, Drayer DE, Reidenberg MM. Increased excretion of urinary N-acetyl-b-glucosaminidase in essential hypertension and its decline with antihypertensive therapy. N Engl J Med 1983;309:1213-7.21. Okamoto K, Takaki A, Takeda S, Katoh H, Ohsato K. Coagulopathy in disseminated intravascular coagulation due to abdominal sepsis: deter-mination of prothrombin fragment 1+2 and other markers. Haemostasis 1992;22:17-24.22. Monnens LA, van Aken W, de Jong M. “Active” intravascular coagu-lation in the epidemic form of hemolytic–uremic syndrome. Clin Nephrol 1982;17:284-7.23. Chart H, Rowe B, van de Kar N, Monnens LA. Serological identifi-cation of Escherichia coli O157 as cause of haemolytic uraemic syndrome in Netherlands. Lancet 1991;337:437.24. Hayashi M, Numaguchi M, Watabe H, Enomoto H, Yaoi Y. Cisplatin-induced nephrotoxicity and the protective effect of fosfomycin on it as demonstrated by using a crossover study of urinary metabolite levels. Acta Obstet Gynecol Scand 1997;76:590-5.25. Colding H, Brygge K, Brendstrup L, Bentzon MW, Andersen GE. Enzymuria in neonates receiving continuous intravenous infusion of gen-tamicin. APMIS 1992;100:119-24.26. Chandler WL, Alessi MC, Aillaud MF, Henderson P, Vague P, Juhan-Vague I. Clearance of tissue plasminogen activator (TPA) and TPA/plas-minogen activator inhibitor type 1 (PAI-1) complex: relationship to elevat-ed TPA antigen in patients with high PAI-1 activity levels. Circulation 1997;96:761-8.27. Brenner B, Francis CW, Totterman S, et al. Quantitation of venous clot lysis with the D-dimer immunoassay during fibrinolytic therapy requires correction for soluble fibrin degradation. Circulation 1990;81:1818-25.28. Knecht MF, Heinrich F, Spanuth E. Evaluation of plasma D-dimer in the diagnosis and in the course of fibrinolytic therapy of deep vein throm-bosis and pulmonary embolism. Thromb Res 1992;67:213-20.29. Chandler WL, Alessi MC, Aillaud MF, Vague P, Juhan-Vague I. For-mation, inhibition and clearance of plasmin in vivo. Haemostasis 2000;30:204-18.
Copyright © 2002 Massachusetts Medical Society.
Downloaded from www.nejm.org at AL KHAZINDAR CO LTD TOTAL TRANSPORT on September 04, 2004.Copyright © 2002 Massachusetts Medical Society. All rights reserved.


