Embed Size (px)
Citation preview
Chapter 8
Proton Magnetic Resonance Spectroscopy in IntracranialGliomas
Eftychia Z. Kapsalaki, Ioannis Tsougos, Kyriaki Theodorou, and Kostas N. Fountas
Abstract Recent MRI advances have focused on thedevelopment and application of molecular and physi-ological imaging capabilities. One of these relativelynew MRI methods, Magnetic Resonance Spectroscopy(MRS) reflects the continuing evolution from purelyanatomic to physiological and molecular imaging ofthe brain. Magnetic Resonance Spectroscopy yieldsimages of the distribution and concentration of natu-rally occurring molecules such as N-acetyl aspartate(NAA) (one of the most abundant amino acids inthe brain), choline (Cho) (a key constituent of cellmembranes), lactate (Lac) (a reflection of anaerobicmetabolism) and Creatines (Cr). It has been sug-gested that the sum of Cr and Phosphocreatine isrelatively constant in the human brain, and for thisreason Cr is often used as a reference signal, andit is a common practice for metabolite ratios to beexpressed as a ratio relative to Cr. However, withthe development of quantitative analysis techniques,it is clear that total Cr is not constant, both in dif-ferent brain regions and in pathological processes, sothe assumption of Cr as a reference signal should beused with caution. It is well known that gliomas rep-resent the most common type of primary intracranialtumors. The establishment of an accurate diagno-sis, the preoperative evaluation of tumor metabolismand the obtaining information regarding tumor histo-logical grade, may increase the efficacy of the cur-rently employed treatments and eventually improve theoverall clinical outcome in gliomas cases. Magnetic
K.N. Fountas (�)Department of Neurosurgery, University Hospital of Larisa,School of Medicine, University of Thessaly, Larisa, Greeceemail:[email protected]
Resonance Spectroscopy may substantially improvethe non-invasive categorization of human brain tumors,especially gliomas. The utilization of MRS (coupledto conventional MRI techniques) in the evaluation oftumors provides greater information concerning tumoractivity and metabolism. In addition, it may providevaluable information regarding the tumor response tothe employed treatments.
Keywords Choline · Creatine · Glioma · Lipids · MRspectroscopy · N-acetyl-aspartate
Introduction
Magnetic Resonance Imaging (MRI) is consideredthe method of choice for the identification and theevaluation of brain tumors. The MR characteristicsof brain tumors depend on their consistency andtheir histopathology. The role of MRI in the evalu-ation of patients with intracranial masses is to iden-tify the lesion, provide a differential diagnosis andcontribute to the selection process of the best thera-peutic approach for these patients. Since many braintumors have similar imaging characteristics, advancedMR techniques have been introduced and may fur-ther attribute to the differential diagnosis of theselesions. Such techniques include Diffusion WeightedImaging (DWI), fractional anisotropy and tractogra-phy (DTI), perfusion weighted Imaging (pWI), andMagnetic Resonance Spectroscopy (MRS). Use ofthese advanced methodologies in the preoperativeevaluation of gliomas, may significantly narrow thedifferential diagnosis and minimize the possibility
67M.A. Hayat (ed.), Tumors of the Central Nervous System, Volume 1,DOI 10.1007/978-94-007-0344-5_8, © Springer Science+Business Media B.V. 2011

68 E.Z. Kapsalaki et al.
of misdiagnosis, particularly in the cases of ringenhancing lesions. In addition, the establishment of anaccurate diagnosis may clarify some occasionally per-plexing issues, regarding the best surgical planning forthese patients.
It is well known that gliomas represent the major-ity of primary intracranial brain tumors. They maybe circumscribed (WHO I), or diffuse and infiltra-tive (WHO II-IV). The degree of malignancy increasesas pyrinokinesias and mitotic activity increase, andnecrosis and neovascularization develop in theselesions. Preoperative imaging evaluation needs to pro-vide accurate information regarding the extent of thelesion, which is better identified after contrast admin-istration, but also to detect the presence of any neo-plastic cells in the peritumoral edema. In a largenumber of cases, infiltrative gliomas are character-ized by a remarkable heterogeneity and significantlyvarying stages of malignancy in different areas ofthe same tumor. The employment of advanced MRimaging, using DWI, pWI and MRS, may accuratelyidentify the areas of highest malignancy in a tumor,and thus navigate the surgeon to the most aggressivearea of this tumor. Moreover, MRS provides informa-tion regarding tumors’ biochemical profile, by measur-ing specific metabolite concentrations and their ratios,and thus may potentially predict their histologicalgrade.
Furthermore, identification of the presence of tumorcells in the peritumoral edema, contributes to amore aggressive surgical resection, and a more effi-cient post operative radiation planning. In addition,the question of postsurgical radiation necrosis and/orinterstitial brachytherapy associated necrosis versustumor recurrence constitutes a puzzling issue inthe management of patients with surgically resectedgliomas. Magnetic Resonance Spectroscopy combinedwith pWI may be useful, particularly in those casesthat these two methodologies provide concordantresults.
In this chapter, we provide a brief overview of theMRS general principles, a brief description of the nec-essary hardware and software for performing MRS andits technical limitations. We outline the usually recog-nized metabolites in normal brain and other patholog-ical conditions, we describe the most frequently usedmetabolic ratios in clinical practice, we analyze thespectral characteristics of gliomas, and we also referto the future directions of MRS.
General Principles of MagneticResonance Spectroscopy
Proton Magnetic Resonance Spectroscopy (alsoHydrogen−1 MRS, or H1 MRS) is the applicationof nuclear magnetic resonance with respect toHydrogen-1 nuclei within the molecules of a sub-stance. Since the atomic number of hydrogen is 1,a positive hydrogen ion (H+) has no electrons andcorresponds to a bare nucleus with one proton.Regarding clinical applications, water is the biggestsource of protons in the human body, therefore, allowsthe application of brain H1 MRS.
Magnetic Resonance Spectroscopy depends on thechemical shift theory, which corresponds to a changein the resonance frequency of the nuclei within themolecules, according to their chemical bonds. Thepresence of an electron cloud constitutes an electronicshield, which slightly lowers the static magnetic fieldto which the nucleus would normally be subjected.Thus, same nuclei will resonate in different frequen-cies, according to which molecular group they belongto, as they experience this different “shielding effect”.This resonance frequency difference (chemical shift)is expressed as parts per million or ppm, a value thatis independent of the amplitude of the magnetic field.Thus, the value of the chemical shift provides informa-tion about the molecular group carrying the hydrogennuclei, and therefore provides differentiation amongseveral metabolites.
Therefore, within a certain region of interest, ide-ally a voxel of at least 8 cm3, it is possible to gatherinformation on these molecular groups and presentit as a spectrum. In this spectrum, the x-axis (ori-ented from right to left) represents the precessionfrequency, which differentiates the identity of a cer-tain compound. On the other hand, the intensity onthe y-axis can be used to quantify the amount of asubstance, although this is a matter of great disputeand includes serious risks that should be taken intoaccount. To obtain reliable absolute concentrations,one has to consider potential complicating factors, withrespect to both the data acquisition method and the dataprocessing method. For example, relaxation effectsin data acquisition can be either corrected or elimi-nated, whereas data fitting is complicated by factorssuch as the contribution of macromolecules (Jansenet al., 2006).

8 Proton Magnetic Resonance Spectroscopy in Intracranial Gliomas 69
Peaks of several molecular groups on the spectrumare also called resonances. Some metabolites do nothave simple resonances, but may be split into two(called doublet), three (triplet) or even more sub-peaks.As spins can be considered to be small magnets, theyinteract with the main magnetic field, thus the degreeof interaction, known as spin-spin coupling, causesa peak to split into more than one sub peaks. Thefrequency separation of each peak and the clear rep-resentation of its characteristics depends on the fieldstrength, on the magnetic field homogeneity, the degreeof chemical shift, the samples’ chemical composition,and on the digital resolution i.e. the precision withwhich the signal is sampled.
At low fields with a poor shim, the peaks tend tooverlap and that causes difficulty in interpreting andin measuring peak heights. In proton MRS (H1MRS),the water signal must be suppressed, as it is muchgreater than the signal from other H1 containing com-pounds and it has overlapping spectroscopic peaks.The reference frequency used, set at zero ppm, is thatof the standard tetra-methyl silane Si-(CH3)4, whichhas a single proton resonance due to its a completelysymmetrical molecule. It should be mentioned here,that above 4 ppm the spectrum becomes unreliable,since the suppression of the water peak at 4.7 ppmtends to destroy the neighbouring portions of thespectrum.
Proton MRS Apparatus
In-vivo H1MRS uses MRI apparatus that is virtuallyidentical to that used in routine imaging, but neverthe-less requires:
• A sufficiently strong and very homogenous mag-netic field (at least 1.5 T), to distinguish resonancepeaks, shimming ideally less than 0.5 ppm overthe central 20 cm Diameter of a Spherical Volume(DSV).
• Specific sequences for spectroscopic signal acquisi-tion. There are two types of H1MRS: Single VoxelSpectroscopy (SVS), which receives the spectrumfrom a single voxel only, and Chemical ShiftImaging (CSI), which measures spectra in a sin-gle dimension projection (1D), on a two dimensionslice (2D), or a three dimensional volume (3D)
• Adapted data processing software, and• An adapted radiofrequency system (in the reso-
nance frequency of the studied nucleus).
Single-Voxel (SV) Spectroscopy
In SV spectroscopy, the signal is received from a vol-ume limited to a single voxel. This acquisition is fairlyfast (1–5 min) and a spectrum is easily obtained. Itis performed in three steps. Initially, the suppressionof the water signal is performed, followed by theselection of a voxel of interest, and lastly by theacquisition of the spectrum. For the spectra acquisitionthere are two types of sequences available: (a) Point-RESolved Spectroscopy (PRESS) and (b) STimulatedEcho Acquisition Mode (STEAM). It is worth men-tioning that the analyzed volume is selected by threeselective radiofrequency pulses (accompanied by gra-dients) in the three directions in space (either 90◦–90◦–90◦in STEAM, or 90◦–180◦–180◦ in PRESS). Thesepulses determine three orthogonal planes, whose inter-section corresponds to the studied volume. Only thesignal within this voxel will be recorded, by selectingthe echo resulting from a series of the three studiedradiofrequency pulses.
Chemical Shift Imaging (CSI)
Chemical shift imaging (CSI) consists of spectro-scopic data of a group of voxels, in slice(s) (2D) orin a specific volume (3D). It is based on a repeti-tion of STEAM or PRESS type sequences to whicha spatial phase encoding is added. The number anddirection of phase encodings depend on the number ofdimensions explored, having as a consequence though,a longer acquisition time. The results appear in theform of a matrix of the obtained spectra from thestudied regions, or as parametric images (metabolicmaps).
However, it has to be emphasized that CSI hasseveral disadvantages. In this technique, voxels ofinterest (VOIs) are much larger than those in SVS,so it is more difficult to achieve magnetic fieldhomogeneity. Localization of multiple VOIs is not asaccurate as localization via a single voxel in SVS,

70 E.Z. Kapsalaki et al.
as phase encoding causes much more spin dephasing.In addition, adjacent voxels’ interference can add upto 10% of their signal to the voxel of interest, thusdegrading the obtained spectra. As a result, there isa signal loss of approximately 13% per direction ofphase encoding, which has to be appropriately multi-plied in the case of 3D CSI. Another disadvantage of3D CSI is the increased acquisition time, which canlast up to 15 min.
Limitations of MR Spectroscopy
Though a promising advance, several technical limita-tions potentially compromise the efficacy of MRS asa diagnostic modality. Intraparenchymal calcification,contamination from adjacent bone and fat (from theskull), cerebrospinal fluid (CSF) or the presence ofintratumoral hemorrhage may alter the MRS sig-nal and, if inadvertently included in an assessedvoxel, may confound the obtained results. In order toobtain a good and accurate H1MRS analysis the fol-lowing guidelines should be scholastically followed:good magnetic homogeneity, good water suppres-sion, proper localization in respect to the lesion, welloptimized pulse sequences, and finally a cooperativepatient.
To obtain good homogeneity, excellent shimmingis a prerequisite, and calibration of water suppressionmust be exceedingly efficient. This allows a good anal-ysis of the metabolite intensities. Another importantissue is to obtain adequate signal-to-noise ratio in orderto permit reproducible peak area integration, avoid-ing artefacts. Finally, the appropriate voxel size shouldbe selected, and has to be large enough to obtain adetectable metabolite signal, thus avoiding distortionfrom other peaks in the spectrum and should not beplaced near the skull, to avoid contamination frombone and fat. However, when the voxel size has tobe very small, the obtained spectrum requires a largeracquisition time, in order to obtain good shimming andwater suppression.
Stronger magnetic fields, as 3 T, can spread out pre-cession frequencies over a wider range and may doublespatial and temporal resolution. Moreover, strongermagnetic fields may also allow the detection of com-pounds that are currently considered to be not clearlydetectable with lower magnetic fields. Nevertheless, at
higher magnetic fields, water is much more difficultto be suppressed, due to the increased magnetic fieldinhomogeneity, poorer radiofrequency coil efficiency,poorer shimming, and different relaxation times. Kimet al. (2006) have concluded that although there is anincreased signal to noise ratio at 3 T compared to 1.5T, a better spectral resolution at a short TE (35 ms)but not at long TE (144 ms), there was no significantdifference in the metabolite ratios at 3 T. Their find-ings are in agreement with our experience from using3 T MRI and MRS. Another issue that needs to betaken into consideration is the usage of commercialMRS analysis packages, which may be user-friendlybut should be used with extreme caution, since in thesepackages there are metabolites, which are not detectedin a routine brain spectrum (Xu et al., 2008).
Proton Magnetic ResonanceSpectroscopy Brain Metabolites
Choline (Cho)
At 3.2 ppm a prominent resonance arises from themethyl protons of choline (Cho) containing com-pounds. It constitutes a structural compound of the cellmembrane and is routinely detected in a normal brainspectrum, but in small concentrations. Choline signalsin brain tumor studies are considered as a surrogatemarker of cellular membrane turnover. Ex vivo studiesof perchloric acid extracts of intracranial tumor tissueindicate that Cho spectral signal represents mostly freeCho, phosphocholine (PC) and glycerophosocholine(GPC) molecules (Miller et al., 1996). Nevertheless,at routine clinical magnetic field strengths, these threecompounds are seen as a single resonance, as they can-not be resolved, hence they are referred as the total Chosignal.
Possible causes for the elevated Cho signal seen inbrain tumors can be separated into: (a) intracellularand (b) extracellular mechanisms. In the intracellu-lar environment, Cho may be elevated as a resultof enhanced transport, phosphocholine may be ele-vated as a result of accelerated phosphorylation andtransport, and all three compounds (Cho, PC andGPC) may be elevated as a result of cellular mem-brane break down. In the extracellular environment

8 Proton Magnetic Resonance Spectroscopy in Intracranial Gliomas 71
and in the blood, Cho may be elevated as a result ofhyperperfusion and/or systemic metabolic alterations.According to several in vitro MRS studies based onbrain tumor biopsy material, increased intracellular PCis the predominant cause for the Cho signal eleva-tion (Tzika et al., 2002). It has been demonstrated,that PC increases with cell proliferation rate, andthat glioma cells have enhanced Cho transport andphosphorylation during their growing phase (Podo,1999).
Recently, the technique of 1H high-resolution magicangle spinning (HR-MAS) has been shown to producehigh-quality data, allowing the accurate measurementof many metabolites present in unprocessed biopsytissue, allowing better correlations between in vivoand in vitro studies (Wilson et al., 2009). It has tobe emphasized however, that the exact interpretationof changes in total choline signal is complicated, dueto multiple contributions to the observed total cholinespectrum resonance. Therefore, more general terms asincreased cellular membrane turnover or altered cel-lular membrane metabolism, are frequently used toexplain elevated Cho in gliomas.
Creatine (Cr)
At 3.03 ppm a composite peak arises from the methyland methylene protons of Cr and phosphorylated cre-atine (PCr), often called total Creatine (tCr). In thebrain, Cr and PCr are present in both neuronal andglial cells, and together with ATP play a crucial rolein the energy metabolism of neuronal tissues. Total Crconstitutes a metabolite routinely detected in normalbrain spectrum, and is considered to be a measure ofcellular density, while is especially high in glial cells.The concentration of total creatine is relatively con-stant, with no changes reported with brain aging. Assuch, its resonance is frequently used as an internalconcentration reference and other metabolites are rep-resented as ratios to Cr. While convenient, the use ofany internal concentration reference should be usedwith extreme caution. There appears to be a substantialvariation in Cr concentrations between grey and whitematter, as well as within individual tumors of a certaintype. Although under most conditions, the use of Cr asa constant is reliable, previous absolute quantificationstudies have demonstrated that in a number of brain
tumours, Cr levels were found to be significantly lessthan those in normal brain (Howe et al., 2003), and aredecreasing with increased grade of malignancy.
N-Acetyl Aspartate (NAA)
At 2.01 ppm a prominent resonance arises from themethyl group of NAA. In general, NAA is consideredto be a highly specific neuronal marker, reflectingthe number of intact neurons in the gray matter, andthe density of intact axons in the white matter. NAAis exclusively localized in the central and peripheralnervous system. Its concentration varies in differentparts of the brain, and undergoes significant changesfollowing any developmental central and peripheralnervous system changes. It has been reported thatNAA resonance is a marker of neuronal density, andits decreased concentration in tumors reflects neu-ronal loss (Majos et al., 2004). The reported NAAconcentration reduction in brain tumor spectra is typi-cally attributed to the displacement and destruction ofneuronal tissue, which accompanies gliotic infiltration(Birken and Oldendorf, 1989). Indeed, the vast major-ity of in vivo H1MRS studies have demonstrated thatNAA signal is markedly decreased in brain tumor spec-tra, although it is not unusual to detect a small residualamount of NAA. When NAA is present in a braintumor spectrum, it is difficult to exclude the possibil-ity that a small amount of NAA-containing (normal)brain tissue has accidentally been included in the sam-pled volume. It needs to be pointed out however, thatNAA also decreases in other pathological conditionssuch as in the chronic stages of stroke (Gideon et al.,1992), or in multiple sclerosis (Simone et al., 2001).Moreover, NAA levels may reflect neuronal dysfunc-tion rather than actual neuronal loss. This is substan-tiated by recovery of NAA levels in cases of incom-plete reversible ischemia (Brulatout et al., 1996) orreversible traumatic brain injury (Sinson et al., 2001).
Alanine (Ala)
At 1.47 ppm a prominent resonance arises from thethree methyl protons coupled to a single methane in thealanine molecule. Alanine is known to be the substrateof several amino acid transporters. The signal from

72 E.Z. Kapsalaki et al.
Alanine is usually overlapped by lipids, therefore, theuse of spectral editing or the application of longer echotimes is necessary, in order to distinguish these two res-onances. Alanine is a non essential amino acid, with itsmain function being in the metabolism of tryptophanand pyridoxine. It also assists in the metabolism ofsugars and organic acids, providing energy for muscletissues and brain, without any significant contributionhowever, to the actual energy metabolism, but mainlyto the carbon recycling process (Broer et al., 2007).Yudkoff et al. (1986) found, in cultured astrocytes, animportant flux of nitrogen from glutamate to alanine,corresponding to net alanine synthesis. They proposedthat alanine released from astrocytes is utilized byneurons to synthesize glutamate, whereas we wouldsuggest that in higher eukaryotes, alanine may actuallybe the substrate that feeds the neurons to sustain theirenergy needs.
The total concentration of Ala is very low andis almost not detectable in a normal brain spectrum.It is not usually detected in gliomas, but has beenexpressed in tumors of meningeal origin, and it may bea distinct metabolite for meningiomas. Manton et al.(1995) suggested that the presence of ala in menin-giomas may indicate that their metabolism involvespartial oxidation of glutamine rather than glycolysis.Nevertheless increased Ala has also been observed incases of evolving ischemia.
Lipids (Lip)
Lipid signals arise at about 0.9 and 1.4 ppm. Lipidsare normally absent from a normal MR brain spec-trum. They have short transverse relaxation times thus,are relatively easier to be detected when using shortTE SVS (35 ms or less). The appearance of lipid res-onances in a tumor usually represents necrosis, thusLip are present in high grade gliomas, which typicallyhave a larger necrotic fraction than lower grade tumors.Lipid concentration increases with the increased cel-lularity of the tumor, however, Lip are not alwaysspecific and reproducible markers. Since free lipid sig-nals appear to be associated with necrotic areas, theymay indicate high degree of malignancy or a tumorof metastatic origin. Therefore, detection of lipids isindicative of a malignant tumor. Gotsis et al. (1996)have reported that lipids are detected in anaplastic
gliomas and GBM, in metastatic lesions, but also inabscesses of bacterial origin. They are usually notdetected in low grade tumors, but may be found in lipidcontaining meningiomas. It is widely known that lipidsremain a perplexing finding in brain H1MRS.
Lactate (Lac)
At 1.33 ppm lactate arises as a doublet resonance fromthe three equivalent methyl protons, while the singlemethine proton resonates as a quartet at 4.10 ppm. Lac(or lactic acid) is the end-product, hence the reflec-tion, of anaerobic glycolysis. In normal human brain,lactate is below or at the limit of detectability inmost studies. Its absence may conversely correlate withincreased neo-vascularization of a highly aggressivemalignant tumor. Increased Lac concentrations havebeen observed in a wide variety of conditions that areassociated with restricted blood flow, hence hypoxia,such as ischemic stroke (Barker et al., 1994), mito-chondrial myopathy, encephalopathy, and lactacidosis.It is also present in aggressive tumors (Negendanket al., 1996), and abscesses.
The increased concentration of Lactate and lipids,are consistent with rapid tumor growth leading tohypoxia, hypoxic stress, and finally to central necro-sis, as the tumor outgrows its blood supply. AlthoughLac concentration is considered to increase with astro-cytoma grade (Auer et al., 2001), the statistical sig-nificance of this finding is questionable, due to itshigh variability within tumor groups. Moreover, lac-tate and lipid levels, as a marker of tumor grade, haveshown varied results in long-TE studies (Negendanket al., 1996). Lipids and lactate may coincide sincethey appear in the same region of the spectrum. Theseresonances are better distinguished at higher magneticfields and by using CSI, which produces inversion ofthe lactate peak but not of the lipid peak.
MyoInositol (mI)
MyoInositol is a rather complex sugar alcohol thatgives rise to four groups of resonances. The main res-onance peak can be seen at 3.56 ppm. MyoInositol islocated in astrocytes and is considered to be a markerof glial cells, but its exact function is not known.

8 Proton Magnetic Resonance Spectroscopy in Intracranial Gliomas 73
It has been found that, mI is elevated in low-gradeastrocytomas and demyelinating lesions (as multiplesclerosis). Castillo et al. (2000) reported that elevatedmI may be a marker of low-grade astrocytomas. Recentmagic-angle spinning (MAS) studies of whole-tumorbiopsies have demonstrated that mI is elevated inastrocytomas, and its concentration decreases as malig-nancy grade increases (Cheng et al., 1998). Moreover,in a recent study by Kallenberg et al. (2009) it wasshown that in the contralateral normal-appearing whitematter, mean myo-inositol levels were significantlyincreased in patients with GBM compared to the levelsof control subjects. Similarly, mI levels were higherin patients with GBM, compared to those of patientswith low grade gliomas. Hence, increased concen-trations of mI in the contralateral normal-appearingwhite matter of GBM patients are consistent with mildastrocytosis, and may suggest an early widespreadneoplastic infiltration.
A normal brain spectrum is characterized by amarked concentration of NAA and presence of Cho
and Cr (Fig. 8.1). Other metabolites, as Ala, Lip orLac, are not detectable in a normal brain spectrum.Pathological brain areas show variable amounts ofdecreased concentration of NAA. Depending on thehistological profile of the lesion, there may be vari-able amounts of Cho, Cr, Lip, Lac, Ala, mI, or othermetabolites. The absolute amount of these metabolites,but more importantly their ratios, may characterize abrain lesion. Benign and low grade lesions presentNAA but in lower concentrations than the normalvalues (Table 8.1). Absolute metabolite values varysignificantly in different normal individuals; therefore,evaluating their ratios is a more accurate marker ingrading gliomas, than their absolute values. It is alwayshelpful to compare metabolite values in both hemi-spheres. In establishing an H1MRS diagnosis, theratios of NAA/Cho, NAA/Cr and Cho/Cr are beingcalculated (Table 8.2). All other metabolites are beingidentified in pathological conditions.
The principal metabolites that are most commonlyevaluated in Proton Magnetic Resonance Spectroscopy
Fig. 8.1 MRS normal spectrum, demonstrating a dominant peak corresponding to NAA at 2 ppm, a peak at 3.03 ppm correspondingto Cr and a peak identified at 3.2 ppm corresponding to Cho

74 E.Z. Kapsalaki et al.
Table 8.1 Theconcentrations of thecharacteristic metabolites ingliomas
Low grade (II) Anaplastic (III) GBM (IV)
NAA Low Very low Very low or absentCho High Very high Very very highCr Low Low Very lowCho/Cr High Very high Very very high
Table 8.2 Approximateratios of the normally detectedmetabolites in gliomas areshown, as reported by Fountasand Castillo
Normal brain Low grade (II) Anaplastic (III) GBM (IV)
NAA/Cr Fountas et al. 1.52 Increased Increased Very increasedNAA/Cr Castillo et al. 1.26 1.23 1.48 3.24NAA/Cho 1.74 Decreased Decreased Very decreasedCho/Cr Fountas et al. 1.51 2.15 2.78 5.40Cho/Cr Castillo et al. 0.62 1.06 1.48 2.08mI/Cr Castillo et al. 0.49 0.82 0.33 0.15
Table 8.3 Summary of the principal metabolites that are most commonly evaluated in proton magnetic resonance spectroscopy(H1MRS)
MetaboliteFrequency/Cerebralconcentration Physiological role TE Variation impact
Cho 3.2 ppm/0.9–2.5 mmol/kg Marker of cellmembranemetabolism.
Long/short ↑ Tumors, inflammation,hypoxia, demyelization.
Caution:Higher in white matter thanGrey matter.
CrCreatine/Phosphocreatine
3.0 ppm/5.1–10.6 mmol/kg Compounds related toenergy metabolismmarker.
Long/short Serves as reference peak as it isrelatively constant.↓ Hypoxia, Stroke, Tumors
NAAN-Acetyl-Aspartate
2.02 ppm/7.9–16.6 mmol/kg Neuronal cell marker.Only seen in healthynervous tissue.
Long/short ↓ Neuronal dysfunction.↓ Ischaemia, trauma,inflammation,
infection, tumors, dementia,gliosis.
AlaAlanine
1.5 ppm/0.2–1.4 mmol/kg Is characteristicof mengingealtumors
Long/short Expressed in tumors ofmeningeal origin, may bediscriminant metabolite.
LipidsFree Lipids
0.9, 1.4 ppm/>1.0 mmol/kg
Membrane breakdownproduct.
Long/short Indication of histologicalnecrosis.
High grade tumors, metastaticlesions
Lactate 1.33 ppm/0.4 mmol/kg A product of anaerobicglycolysis.
Long Nonspecific marker of tumoraggressiveness.
Myo-inositol(mI)
3.6 ppm/3.8–8.1 mmol/kg Glial Marker Long/short A diagnostic modifier indiseases that affect Cho.
↓ as glioma grade increases
(H1MRS) of the brain and a brief yet comprehen-sive explanation of their role in determining theobtained spectrum and potentially predicting theirhistopathological type and grade are summarised inTable 8.3.
Spectroscopic Tumor Profile
It is well known that gliomas are infiltrative tumors,which may extend and spread along the white mattertracts to the adjacent brain tissue, and frequently

8 Proton Magnetic Resonance Spectroscopy in Intracranial Gliomas 75
invade neighboring lobes, and even the contralat-eral hemisphere (Mikkelsen and Edvardsen, 1995).Gliomas are categorized into four grades: Pilocyticastrocytomas (WHO I), astrocytomas (WHO II),anaplastic astrocytomas, oligodendrogliomas andmixed glial tumors (WHO III) and GlioblastomasMultiforme (WHO IV). Anaplastic astrocytomasand GBM are more heterogeneous, may producemass effect, and show variable degree of contrastenhancement. Gliomas frequently need to be differen-tiated from other tumors such as solitary metastases,lymphomas, but also non neoplastic lesions such as anabscess, or an evolving infarct.
There has been interest in using proton MRspectroscopic imaging (H1MRS) in the evaluationof the tumor borders and disease burden (Croteauet al., 2001). Moreover, several studies sought to deter-mine a correlation between different proton H1MRSmetabolic ratios and the degree of tumor infiltration,and examined the role of H1MRS in suggesting apreoperative histological diagnosis.
An important contribution of H1MRS is to iden-tify the metabolic profile and the histological grade ofa brain glioma. Negendank et al. (1996) and Fountaset al. (2004) concluded that glial tumors have signif-icantly elevated Cho signals, and decreased Cr andNAA signal, compared to normal brain. Choline sig-nal intensities were extremely high, while Cr signalintensities were very low, in anaplastic astrocytomasand GBMs in their series. They also described thatanaplastic astrocytomas and GBMs demonstrated anincreased Cho/Cr ratio (Table 8.2). Lipids may bedetected in all grades of gliomas, however they usuallypresent in higher concentrations in anaplastic astro-cytomas and GBMs. Significant variability has beenobserved regarding the presence or absence of Lippeaks in low-grade gliomas. Likewise, the concentra-tion of Lac varies significantly among patients withastrocytomas of the same histologic grade. Similarly,mI shows great variability in astrocytomas. The ratioof MI/Cr is a marker reported by Castillo et al. (2000)to be higher in low-grade astrocytomas, intermediate incontrol subjects, and lower in patients with anaplasticastrocytomas and GBMs.
Despite the accurate measurement of absolutemetabolite concentrations, it seems that their ratiosmay be a more important marker in grading gliomas.Regarding the metabolite ratio findings, Fountas et al.(2004) reported NAA/Cr ratio to be decreased in all
gliomas however, they found no correlation betweenthe degree of reduction and the tumor’s histologicalgrade. Likewise, the ratio of NAA/Cho is found tobe inconsistent among tumors of the same histologicgrade. Contrariwise, the Cho/Cr ratio is found to bea reproducible and consistent marker among astrocy-tomas of the same histologic grade. This metaboliteratio is lower in low-grade astrocytomas (grades IIand III), but almost two-fold increased in GBMs. Thisfinding suggests that the higher the Cho/Cr ratio is,the higher the tumor grade will be (Table 8.3). Theratios of Cho/Cr in grade II and III gliomas maynot vary significantly, but in these cases, their con-ventional MRI characteristics may be helpful in theirdifferentiation, since in grade III astrocytomas con-trast enhancement is present in the vast majority ofcases (Figs. 8.2 and 8.3). Moreover, the presence oflip in anaplastic astrocytomas may suggest a moreaggressive histological type.
Nevertheless, gliomas need to be differentiated fromother benign or malignant lesions. The most com-mon differential diagnosis of glioma grade II and IIIis ischemia and infection, particularly when locatedin the temporal lobe. The concentration of lactate isincreased in ischemia, and additionally the presenceof lipids suggests necrosis in an infarcted brain area.Moreover, DWI may help differentiate acute/subacuteischemia from a low grade tumor, since ischemiashows markedly decreased diffusion. It cannot beoveremphasized the importance of the patient’s clinicalhistory and symptomatology in the differential diag-nosis process along with thorough interpretation of allavailable imaging studies.
In cases of lymphomas, H1MRS alone may notbe able to distinguish them from gliomas, since bothshow increased Cho, reduced NAA and increasedCho/Cr and Cho/NAA ratios. In such cases, H1MRScombined with DWI may help in their differentia-tion, since lymphomas demonstrate characteristicallydecreased diffusivity. Furthermore, lymphomas have amore homogeneous contrast enhancement compared togliomas, however this is certainly not a pathognomonicfinding. The concordance of the above characteristicsmay help to establish a diagnosis in these cases.
GBM very often has conventional imaging charac-teristics indistinguishable from abscesses and metas-tases. Magnetic Resonance Spectroscopy may playan important role in the diagnosis and differenti-ation of these lesions. Abscesses uniquely contain
76 E.Z. Kapsalaki et al.
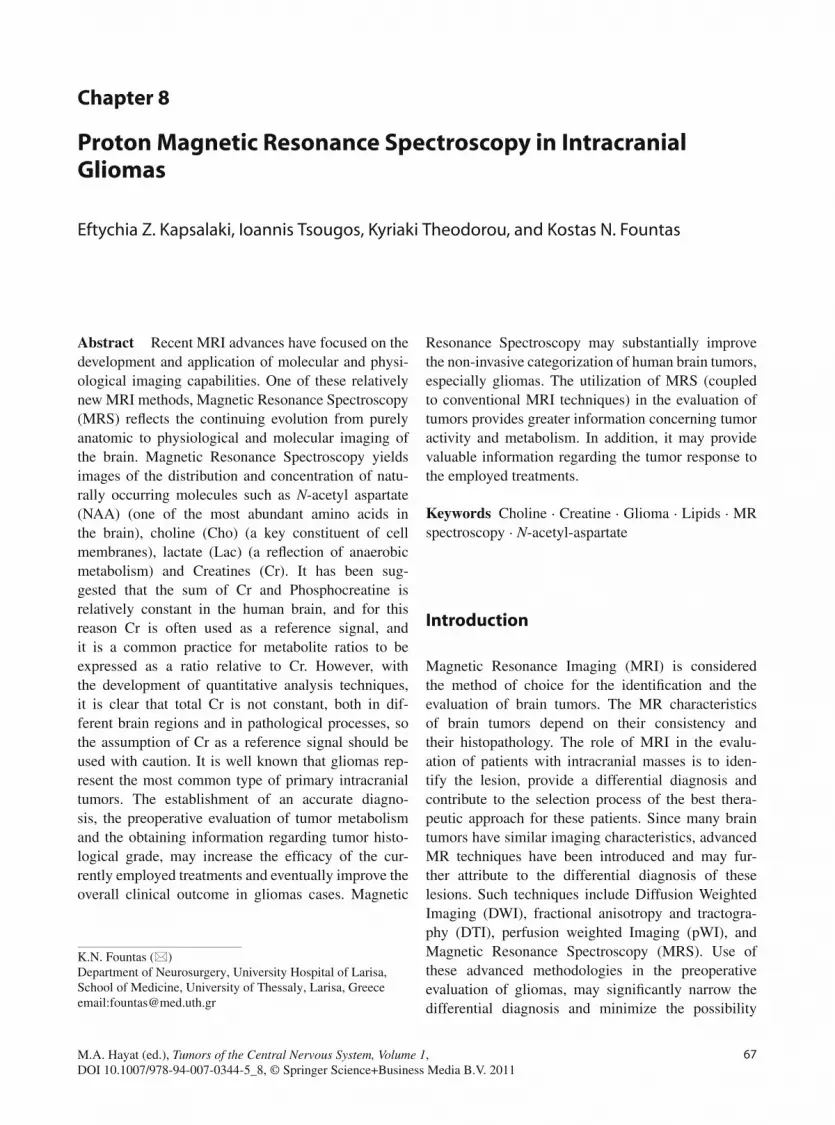
Fig. 8.2 A spectrum of a low grade astrocytoma (WHO II). Note the slightly decreased concentration of NAA and the relativelyincreased concentration of Cho. The concentration of Cr remains relatively unchanged. Lipids are almost undetectable
several aminoacids detectable on H1MRS. Moreover,abscesses have decreased diffusivity due to thedecreased mobility of water protons, a finding thatis not present in gliomas. Kapsalaki et al. (2008)reported the H1MRS characteristics of a wide varietyof bacterial abscesses and also the usefulness of thismethodology in distinguishing abscesses from gliomasand metastatic lesions. They outline in their studythe role of H1MRS in identifying the causative agentof an abscess, and they point out its importance infollowing up the abscess’s therapeutic response. Theuse of H1MRS in combination with DWI can signifi-cantly increase the diagnostic accuracy of conventionalMR imaging and thus provide valuable preoperativeinformation, regarding the nature of space occupying,ring-enhancing intracranial lesions.
Metastatic lesions, when solitary and ring enhanc-ing, may also have indistinguishable imaging char-acteristics from necrotic GBMs. Both lesions showdecreased, almost absent NAA, elevated Cho anddecreased Cr. Lipids may also be present in both GBMand metastatic lesions, with metastatic lesions usu-ally showing higher concentrations of lipids. On theother hand, the overall appearance of the spectrumbetween GBM and metastasis may occasionally beindistinguishable. In this case, H1MRS can differen-tiate between the two tumor types by evaluating thespectra at the lesion’s periphery, as seen in Fig. 8.4.An infiltrating tumor, as a GBM, would yield elevatedCho and Lipids signals at the periphery of the lesion,whereas a metastasis would yield a relatively normalspectrum.

8 Proton Magnetic Resonance Spectroscopy in Intracranial Gliomas 77
a) b)
Fig. 8.3 A spectrum of an anaplastic astrocytoma (WHO III)(a) and (b): Note the decreased concentration of NAA and themarkedly increased concentration of Cho in both spectra. In (a),the concentration of Cr remains relatively stable and lipids are
almost undetectable. In (b), the concentration of Cr is slightlydiminished and the lipids are increased, findings that possiblyindicate a more aggressive type of glioma
a) b)
Fig. 8.4 (a) Spectrum obtained from the center of a tumor. Notethe absence of NAA and Cr, and the markedly increased con-centration of Cho. Also, there is a large amount of lipids in thetumor. These findings are characteristic of a necrotic GBM or
a metastatic lesion. The presence of a normal spectrum identi-fied in the periphery of the lesion (b) is more suggestive of ametastatic lesion

78 E.Z. Kapsalaki et al.
The major difficulty presents when we need todifferentiate radiation necrosis from progressing orrecurring glioma. Despite aggressive surgical resec-tion along with chemotherapy and radiation, gliomashave the tendency to locally recur. An important ques-tion that is frequently raised is to differentiate inthese cases between tumor recurrence versus radia-tion necrosis. In radiation necrosis spectrum, lipids aredetected but Cho is usually not increased. However,increased levels of Cho may be seen in radiationnecrosis due to the presence of inflammation. In suchcases, differentiation with H1MRS alone is almostimpossible. Other imaging modalities need to be com-bined, as DWI and perfusion MRI. A low CerebralBlood Volume (CBV) through the area of contrastenhancement usually suggests radiation necrosis. Onthe contrary, high CBV along with increased levelsof Cho and markedly increased Cho/Cr, Cho/NAAratios is more suggestive of tumor recurrence. Despiteall the recent MR advances, it is not unusual thedifferentiation between tumor recurrence and radia-tion necrosis to be still impossible. In these cases,thorough comparison with preoperative studies andclose clinical and imaging follow up is of paramountimportance.
Future of MRS Aided Diagnosis
It seems that we may have reached the limit of visualinterpretation of spectra and as a result the field ofneurospectroscopy should extend beyond qualitativeanalysis. Xu et al. (2008), propose at least two meth-ods, which will take clinical MRS beyond the purelyvisual interpretation of a few metabolite peaks, to aricher, more automated neurochemical diagnostic con-cept. One is the wavelet analysis which extracts moreinformation after data acquisition, than can currentlybe included in Fourier transform (FT). Another, isthe widely disseminated LC Model (Provencher, 1993)which breaks the visible spectrum up into its presumedconstituents, on the basis that any chemical alreadyknown to exist in the FT spectrum (so-called priorknowledge) can be outlined and quantified separatelyfrom the overlapping series of peaks we see on thescreen of the MR scanner. This should only includepatients in which the clinical/radiological diagnosis isuncertain.
Proton MRS is a promising diagnostic modality,which may be used to offer a better preoperative eval-uation of intracranial gliomas. It may provide noninvasive information regarding the histological gradeof the examined tumor. It needs to be emphasized thatH1MRS is not aiming to replace surgical biopsy inestablishing a histological diagnosis. It is a compli-mentary method to the existent imaging modalities,which may attribute to a better preoperative evaluationof gliomas, and may also help differentiate betweenpost-surgical radiation necrosis and tumor recurrence.H1MRS should be combined with conventional MRimaging and possibly all other available advanced MRimaging techniques, in order to suggest an accuratepreoperative diagnosis, including tumor’s histopatho-logical type and grade.
References
Auer DP, Gossl C, Schirmer T, Czisch M (2001) Improved lipidanalysis of 1H-MR spectra in the presence of mobile lipids.Magn Reson Med 46:615–618
Barker PB, Gillard JH, van Zijl PCM, Soher BJ, Hanley DF,Agildere AM, Oppenheimer SM, Bryan RN (1994) Acutestroke: evaluation with serial proton MR spectroscopic imag-ing. Radiology 192:723–732
Birken DL, Oldendorf WH (1989) N-acetyl-L-aspartic acid: aliterature review of a compound prominent in 1H-NMR spec-troscopic studies of brain. Neurosci Biobehav Rev 13:23–31
Broer S, Broer A, Hansen J, Bubb WA, Balcar VJ, Nasrallah FA,Garner B, Rae C (2007) Alanine metabolism, transport, andcycling in the brain. J Neurochem 102:1758–1770
Brulatout S, Meric P, Loubinoux I, Borredon J, Correze JL,Roucher P, Gillet B, Berenger G, Beloeil JC, Tiffon B,Mispelter J, Seylaz J (1996) A one-dimensional (proton andphosphorus) and two-dimensional (proton) in vivo NMRspectroscopic study of reversible global cerebral ischemia.J Neurochem 66:2491–2499
Castillo M, Smith JK, Kwock L (2000) Correlation of myo-inositol levels and grading of cerebral astrocytomas. Am JNeuroradiol 21:1645–1649
Cheng LL, Chang IW, Louis DN, Gonzalez RG (1998)Correlation of high resolution magic angle spinning pro-ton magnetic resonance spectroscopy with histopathologyof intact human brain tumor specimens. Cancer Res 58:1825–1832
Croteau D, Scarpace L, Hearshen D, Gutiérrez J, Rock J,Rosenblum M, Fisher J, Mikkelsen T (2001) Correlationbetween magnetic resonance spectroscopy imaging andimage-guided biopsies: semi-quantitative and qualitativehisto-pathologic analysis of patients with untreated glioma.Neurosurgery 49:823–829
Fountas KN, Kapsalaki E, Vogel R, Fezoulidis I, Robinson JS,Gotsis ED (2004) Noninvasive histologic grading of solid

8 Proton Magnetic Resonance Spectroscopy in Intracranial Gliomas 79
astrocytomas using proton magnetic resonance spectroscopy.Stereotact Funct Neurosurg 82:90–97
Gideon P, Henriksen O, Sperling B, Christiansen P, Olsen TS,Jorgensen HS, Arlien-Soborg P (1992) Early time course ofN-acetylaspartate, creatine and phosphocreatine, and com-pounds containing choline in the brain after acute stroke.A proton magnetic resonance spectroscopy study. Stroke23:1566–1572
Gotsis ED, Fountas K, Kapsalaki E, Toulas P, Peristeris G,Papadakis N (1996) In vivo proton MR spectroscopy: thediagnostic possibilities of lipid resonances in brain tumors.Anticancer Res 16:1565–1567
Howe FA, Barton SJ, Cudlip SA, Stubbs M, Saunders DE,Murphy M, Wilkins P, Opstad KS, Doyle VL, McLeanMA, Bell BA, Griffiths JR (2003) Metabolic profilesof human brain tumors using quantitative in vivo 1Hmagnetic resonance spectroscopy. Magn Reson Med 49:223–232
Jansen JF, Backes WH, Nicolay K, Kooi ME (2006) 1H MRspectroscopy of the brain: absolute quantification of metabo-lites. Radiology 240:318–332
Kallenberg K, Bock HC, Helms G, Jung K, Wrede A, Buhk JH,Giese A, Frahm J, Strik H, Dechent P, Knauth M (2009)Untreated glioblastoma multiforme: increased myo-inositoland glutamine levels in the contralateral cerebral hemisphereat proton MR spectroscopy. Radiology 253:805–812
Kapsalaki E, Gotsis ED, Fountas KN (2008) The role ofproton magnetic resonance spectroscopy in the diagnosisand categorization of cerebral abscesses. Neurosurg Focus24:E7
Kim JH, Chang KH, Na DG, Song IC, Kim SJ, Kwon BJ, HanMH (2006) Comparison of 1.5T and 3T 1H MR spectroscopyfor human brain tumors. Korean J Radiol 7:156–161
Majos C, Julia-Sape M, Alonso J, Serrallonga M, Aguilera C,Acebes JJ, Arus C, Gili J (2004) Brain tumor classification byproton MR spectroscopy: comparison of diagnostic accuracyat short and long TE. Am J Neuroradiol 25:1696–1704
Manton DJ, Lowry M, Blackband SJ, Horsman A (1995)Determination of proton metabolite concentrations and relax-ation parameters in normal human brain and intracranialtumours. NMR Biomed 8:104–112
Mikkelsen T, Edvardsen K (1995) Invasiveness in nervous sys-tem tumors. In Black P, Loeffler JS (eds) Cancer of thenervous system. Blackwell, Cambridge, MA
Miller BL, Chang L, Booth R, Ernst T, Cornford M, Nikas D,McBride D, Jenden DJ (1996) In vivo 1H MRS choline:correlation with in vitro chemistry/histology. Life Sci 58:1929–1935
Negendank WG, Sauter R, Brown TR, Evelhoch JL, Falini A,Gotsis ED, Heerschap A, Kamada K, Lee BC, Mengeot MM,Moser E, Padavic-Shaller KA, Sanders JA, Spraggins TA,Stillman AE, Terwey B, Vogl TJ, Wicklow K, ZimmermanRA (1996) Proton magnetic resonance spectroscopy inpatients with glial tumors: a multicenter study. J Neurosurg84:449–458
Podo F (1999) Tumour phospholipid metabolism. NMR Biomed7:413–439
Provencher SW (1993) Estimation of metabolite concentrationsfrom localized in vivo proton NMR spectra. Magn ResonMed 30:672–679
Simone IL, Tortorella C, Federico F, Liguori M, Lucivero V,Giannini P, Carrara D, Bellacosa A, Livrea P (2001) Axonaldamage in multiple sclerosis plaques: a combined magneticresonance imaging and 1H-magnetic resonance spectroscopystudy. J Neurol Sci 182:143–150
Sinson G, Bagley LJ, Cecil KM, Torchia M, McGowanJC, Lenkinski RE, McIntosh TK, Grossman RI (2001)Magnetization transfer imaging and proton MR spectroscopyin the evaluation of axonal injury: correlation with clini-cal outcome after traumatic brain injury. Am J Neuroradiol22:143–151
Tzika AA, Cheng LL, Goumnerova L, Madsen JR, ZurakowskiD, Astrakas LG, Zarifi MK, Scott RM, Anthony DC,Gonzalez RG, Black PM (2002) Biochemical characteri-zation of pediatric brain tumors by using in vivo and exvivo magnetic resonance spectroscopy. J Neurosurg 96:1023–1031
Wilson M, Davies NP, Grundy RG, Peet AC (2009) A quantita-tive comparison of metabolite signals as detected by in vivoMRS with ex vivo 1H HR-MAS for childhood brain tumours.NMR Biomed 22:213–219
Xu V, Chan H, Lin AP, Sailasuta N, Valencerina S, Tran T,Hovener J, Ross BD (2008) MR spectroscopy in diagno-sis and neurological decision-making. Semin Neurol 28:407–422
Yudkoff M, Nissim I, Hummeler K, Medow M, Pleasure D(1986) Utilization of [15 N]glutamate by cultured astrocytes.Biochem J 234:185–192


