Embed Size (px)
Citation preview
Psycholinguistic speech processing
assessment for adults:
Development and case series
Rebekka Theresa Niepelt
Department of Human Communication Sciences
University of Sheffield
A thesis submitted in fulfilment of the requirements
for the degree of Doctor of Philosophy
August 2017


Acknowledgements
”Life is a journey, not a destination…”
(Quote from Ralpho Waldo Emerson)
This last journey – name it PhD – would have been impossible without the help and support of many people. Thank you to everyone from the bottom of my heart!!
First, I want to thank my supervisors, Dr Jenny Thomson, Dr Blanca Schäfer, and Prof Joy Stackhouse. Jenny was my supervisor all way along and has looked after me in innumerable ways – thank you so much for that. Her constructive advice, guidance, reassurance, and recommendations helped me to develop my ideas and have contributed enormously to this work. Blanca joined the journey half way through and supported my development, especially by always making time and digging deep into the fundament of this work – thank you for that. Finally, Joy supported me during the first two years and maintained particularly the creativity and brainstorming phase that formed the base for this PhD work – thank you.
Many thanks are also directed to all participants of my pilot study, the normative study, and the six case studies. Thank you for the cooperation and the time you offered to take part.
Furthermore, I want to gratefully thank Lisa Clarkson for putting up with my thesis and proofreading it, as well as Joy Newbold who supported me during item recording and Rose Brooks who contributed to the successful completion of this thesis by helping out with reliability analyses – thank you for that.
A thanks also goes to colleagues and staff at the Department of Human Communication Sciences who were always supportive and valuable advisors. I want to thank especially the DevResearch Cluster for great interest, ideas, and encouragement. Moreover, thank you to the technicians who helped me out when I was in some miserable situations.
A huge thank you goes to my family and friends. It was reassuring to know and feel that my parents and siblings always had/have my back – this support helped me not to lose focus, to concentrate on the ‘good’ things in life, and reminded me constantly that I can do that!! Moreover, I want to thank all my friends for continuous support and believing in me. Especially my SLT specialists Melanie, Charlie, and Katharina had to listen to a lot of moaning, but never got tired of encouraging and standing behind me all the way through – thank you girls! A huge thank you also goes to Sebastian who helped me to understand the world of Microsoft Excel and Word. Last but not least, thanks to all ‘neutral’ PhD friends from Sheffield, who understood and shared the troubles of the PhD journey with me, for all the unique moments which helped to ‘switch-off’ for a while, especially Teresa, Martha, Hisham, and Giannis.
Finally, I want to thank Sotiris. He joined me at the beginning of this journey and helped me to fulfil my dream. He was and is my pillar of strength. Thank you for all the love, peace, energy, and immeasurable support which you gave and give me. Without our ‘philosophising’ discussions I would not be who I am and where I am now. Here is to Dr. & Dr.!! Let the new journey begin…

Abstract
In educational institutions there are a significant number of young adults with speech,
language and literacy problems. Nevertheless, due to a lack of assessment tools,
difficulties are often not recognised which in turn limits access to possible supports.
The specific objective of this study was to develop a comprehensive speech processing
skills assessment battery for native English-speaking adults, taking psycholinguistics
into account. The assessment tool consists of subtests that assess auditory
discrimination of non-words and non-word repetition, reading and spelling of non-
words, and spoonerisms with non- and real words.
Normative data from 101 English-speaking adults (age 18-35 years) were collected and
analysed in terms of general psychometric properties. Further in depth analyses look
at the nature of mistakes and reaction time of participants. Moreover, a case series of
participants who stammer (N=6) was conducted to test the speech processing
assessment in regards to profiling existing speech difficulties and comparing these
profiles to norm data.
Results support the establishment of objectivity, validity and reliability of the
assessment tool, but also highlight important factors which need to be investigated in
more detail. Results concerning the case studies showed individual differences of
performances compared to the norm data which can be explained by theoretical
knowledge about stammering.
Outcomes encourage the usage of the assessment tool for research (e.g. comparison
of speech processing profiles in adults with speech disorders) as well as the possibility
of further development for clinical and educational settings (e.g. the development of
specific disability support). A next step of this programme of work could be to modify
the assessment tool based on analysed outcomes. Moreover, deeper investigation of
people experiencing speech difficulties could follow to support the profiling of adults
with persistent developmental speech difficulties in, for example, higher education.

Publications arising from this thesis
Niepelt, R. T. (2015). Investigating Speech Processing Abilities in Adults who Stammer,
Procedia-Social and Behavioral Sciences, Vol. 193, 325-326.
Presentations with published abstracts
Niepelt, R. T., Thomson, J., Stackhouse, J. (2014). A psycholinguistic investigation into
adults who stammer. Paper presented at The Inaugural Sheffield Postgraduate
Linguistics Conference, University of Sheffield, Sheffield 05.02.-06.02.2014.
Niepelt, R. T. (2014). Speech processing skills in adults who stutter: Developing an
assessment tool. Poster presented at the European Symposium on Fluency
Disorders (ECSF), Thomas Moore U College, Campus De Molen, Antwerp 28.03.-
29.03.2014.
Niepelt, R. T., Thomson, J., Stackhouse, J. (2015). Investigating speech processing
abilities in adults who stammer. Paper presented at the 10th Oxford Dysfluency
Conferenc’, St Catherine's College Oxford, Oxford 17.07.-20.07.2014.
Niepelt, R. T., Schaefer, B. (2016). Entwicklung eines neuen psycholinguistischen
Diagnostikinstrumentes für Erwachsene mit Sprachverarbeitungsproblemen.
Paper presented at 45. Dbl-Jahreskongress (Annual Conference of German
Speech and Language therapist association), Bielefeld 26.05-28.05.2016.
Niepelt, R. T., Thomson, J., Schaefer, B. (2016). Development of an assessment tool for
speech processing skills in English-speaking adults. Paper presented at the ICPLA:
The international clinical phonetics and linguistics association conference,
Dalhousie University Halifax, Canada, Halifax 15.06.-18.06.2016.

Contents
List of Figures .................................................................................................................. 17
List of Tables ................................................................................................................... 19
Conventions .................................................................................................................... 22
Introduction .................................................................................................................... 25
Thesis outline .................................................................................................................. 29
PART I: BACKGROUND TO THE STUDY .............................................................................. 31
1. Chapter 1: Psycholinguistics .................................................................................... 31
1.1 Psycholinguistics and speech and language therapy ................................................... 31
1.2 Speech processing within a psycholinguistic framework ............................................. 33
1.2.1 The Stackhouse and Wells psycholinguistic model ............................................. 34
1.2.2 Clinical assessment using the psycholinguistic framework ................................. 47
1.3 The nature of speech difficulties .................................................................................. 49
1.4 Adults with speech difficulties and psycholinguistic assessment ................................. 51
1.4.1 The linguistic processing model based on the logogen model ........................... 53
1.4.2 Clinical assessment using the linguistic processing model ................................. 62
1.5 Combined suitability of psycholinguistic model and linguistic processing model for
speech processing assessment design .................................................................................. 63
1.6 Chapter summary ......................................................................................................... 65
1.6.1 Main research objective ...................................................................................... 66
2. Chapter 2: Stammering ............................................................................................ 69
2.1 Empirical research about stammering ......................................................................... 72
2.1.1 Sensory and sensory-motor control factors ........................................................ 73
2.1.2 Language factors ................................................................................................. 79
2.2 Theories about stammering ......................................................................................... 83
2.2.1 Speech motor control ......................................................................................... 84
2.2.2 System control modelling ................................................................................... 85
2.2.3 Cognitive and linguistic processing ...................................................................... 85
2.2.4 Anticipatory struggle ........................................................................................... 87
2.2.5 Multifactorial models .......................................................................................... 88
2.3 Psycholinguistic background of stammering ................................................................ 89
2.3.1 Psycholinguistic assessment rationale for stammering....................................... 90
2.4 Chapter summary ......................................................................................................... 95
2.4.1 Secondary research objective .............................................................................. 96
3. Chapter 3: Research questions ................................................................................. 99
PART II: METHODS ........................................................................................................ 101
4. Methods ............................................................................................................... 101
4.1 Overall design ............................................................................................................. 101
4.2 Task development based on the psycholinguistic model and the linguistic processing
model .................................................................................................................................. 102
4.3 Tasks ........................................................................................................................... 104
4.3.1 Auditory discrimination of non-words .............................................................. 104
4.3.2 Non-word repetition .......................................................................................... 105
4.3.3 Matching spoken and written non-words – Reading of non-words .................. 105
4.3.4 Spelling of non-words ........................................................................................ 106
4.3.5 Spoonerism of non-words and real words ........................................................ 107
4.4 Cognitive load ............................................................................................................. 108
4.5 Stimulus item design .................................................................................................. 111
4.5.1 Item characteristics ........................................................................................... 111
4.5.2 Design of distractor items .................................................................................. 120
4.5.3 Presentation order of stimuli............................................................................. 121
4.6 Pilot study ................................................................................................................... 121
4.6.1 Design ................................................................................................................ 122
4.6.2 Participants ........................................................................................................ 122
4.6.3 Material ............................................................................................................. 122
4.6.4 Procedure .......................................................................................................... 123
4.6.5 Scoring ............................................................................................................... 123
4.6.6 Results ............................................................................................................... 123
4.7 Revision of assessment tool ....................................................................................... 129
4.8 Finalised stimulus items ............................................................................................. 130
4.8.1 Auditory discrimination of non-words .............................................................. 131
4.8.2 Non-word repetition ......................................................................................... 132
4.8.3 Reading of non-words ....................................................................................... 133
4.8.4 Spelling of non-words ....................................................................................... 134
4.8.5 Spoonerism with real words ............................................................................. 134
4.8.6 Spoonerism with non-words ............................................................................. 135
4.9 Normative study ......................................................................................................... 135
4.9.1 Design ................................................................................................................ 135
4.9.2 Participants ....................................................................................................... 136
4.9.3 Material ............................................................................................................. 137
4.9.4 Procedure .......................................................................................................... 138
4.9.5 Scoring ............................................................................................................... 138
4.10 Case series ............................................................................................................. 146
4.10.1 Overall design ............................................................................................... 146
4.10.2 Case studies .................................................................................................. 146
4.10.3 Design ........................................................................................................... 146
4.10.4 Participants ................................................................................................... 147
4.10.5 Material ......................................................................................................... 147
4.10.6 Procedure ...................................................................................................... 153
4.10.7 Scoring .......................................................................................................... 153
4.11 Chapter summary .................................................................................................. 154
PART III: RESULTS .......................................................................................................... 155
5. Chapter 5: Results - Psychometric properties ......................................................... 155
5.1 Descriptive results for all tasks .................................................................................. 157
5.2 Error types and frequencies ....................................................................................... 170
5.2.1 Auditory discrimination ..................................................................................... 170
5.2.2 Reading .............................................................................................................. 171
5.2.3 Non-word repetition ......................................................................................... 172
5.2.4 Spoonerism tasks ............................................................................................... 177
5.2.5 Spelling ............................................................................................................... 188
5.3 Objectivity ................................................................................................................... 195
5.4 Reliability .................................................................................................................... 196
5.4.1 Internal consistency ........................................................................................... 196
5.4.2 Test-retest reliability .......................................................................................... 198
5.4.3 Inter-rater reliability .......................................................................................... 200
5.5 Test validity ................................................................................................................ 201
5.5.1 Content validity.................................................................................................. 202
5.5.2 Construct validity ............................................................................................... 202
5.5.3 Validity of reading of non-word task ................................................................. 206
5.6 Discussion ................................................................................................................... 209
5.6.1 Objectivity .......................................................................................................... 210
5.6.2 Reliability ........................................................................................................... 211
5.6.3 Validity ............................................................................................................... 215
5.7 Chapter conclusion ..................................................................................................... 216
6. Chapter 6: Results - Case series .............................................................................. 218
6.1 Case study 1 ................................................................................................................ 221
6.1.1 Interview data .................................................................................................... 221
6.1.2 Assessment data ................................................................................................ 223
6.1.3 Discussion .......................................................................................................... 231
6.2 Case study 2 ................................................................................................................ 233
6.2.1 Interview data .................................................................................................... 233
6.2.2 Assessment data ................................................................................................ 235
6.2.3 Discussion .......................................................................................................... 242
6.3 Case study 3 ................................................................................................................ 243
6.3.1 Interview data .................................................................................................... 243
6.3.2 Assessment data ................................................................................................ 244
6.3.3 Discussion .......................................................................................................... 252
6.4 Case study 4 ................................................................................................................ 253
6.4.1 Interview data .................................................................................................... 253
6.4.2 Assessment data ............................................................................................... 255
6.4.3 Discussion .......................................................................................................... 260
6.5 Case study 5 ............................................................................................................... 262
6.5.1 Interview data ................................................................................................... 262
6.5.2 Assessment data ............................................................................................... 263
6.5.3 Discussion .......................................................................................................... 270
6.6 Case study 6 ............................................................................................................... 272
6.6.1 Interview data ................................................................................................... 272
6.6.2 Assessment data ............................................................................................... 273
6.6.3 Discussion .......................................................................................................... 280
6.7 Overall thoughts related to discussions of case studies............................................. 282
6.8 Chapter conclusion ..................................................................................................... 286
Part IV: GENERAL DISCUSSION ....................................................................................... 287
7. Chapter 7: General Discussion ............................................................................... 287
7.1 Summary and examination of results for psychometric properties ........................... 287
7.1.1 Objectivity ......................................................................................................... 288
7.1.2 Reliability ........................................................................................................... 288
7.1.3 Validity ............................................................................................................... 289
7.2 Summary and examination of results for case series ................................................ 293
7.3 Discussion of unexpected results ............................................................................... 298
7.4 Limitations of the study ............................................................................................. 300
7.5 Relevance of the findings ........................................................................................... 302
7.6 Implications or practical applications of the study .................................................... 302
7.7 Recommendations for further research ..................................................................... 304
Conclusion .................................................................................................................... 307
References .................................................................................................................... 309
Appendices ................................................................................................................... 337

17
List of Figures
Figure 1: Psycholinguistic model in a box-arrow-model based on Stackhouse and Wells (1997).
.......................................................................................................................................... 36
Figure 2: Input side of psycholinguistic model in a box-arrow-model based on Stackhouse and
Wells (1997). .................................................................................................................... 38
Figure 3: Stored knowledge of psycholinguistic model in a box-arrow-model based on
Stackhouse and Wells (1997). .......................................................................................... 41
Figure 4: Output side of psycholinguistic model in a box-arrow-model based on Stackhouse
and Wells (1997). ............................................................................................................. 45
Figure 5: Linguistic processing model based on the logogen model from Patterson and
Shewell (1987). ................................................................................................................. 55
Figure 6: Input side of linguistic processing model based on the logogen model from
Patterson and Shewell (1987). ......................................................................................... 58
Figure 7: Stored knowledge components of linguistic processing model based on the logogen
model from Patterson and Shewell (1987). ..................................................................... 60
Figure 8: Output side of linguistic processing model based on the logogen model from
Patterson and Shewell (1987). ......................................................................................... 61
Figure 9: Psycholinguistic model of Stackhouse and Wells (1997). .......................................... 91
Figure 10: Linguistic Processing Model of Patterson and Shewell (1987). ............................... 91
Figure 11: Psycholinguistic model as box-arrow model including lexical and non-lexical route.
........................................................................................................................................ 102
Figure 12: Linguistic processing model including lexical and non-lexical route. .................... 103
Figure 13: Display of all tasks organised in input versus output and related to demand of
representational processing. .......................................................................................... 110
Figure 14: Total number of correct realisations per item in the auditory discrimination of non-
words task performances (N=9). .................................................................................... 124
Figure 15: Total number of correct realisations per item in the non-word repetition task
performances (N=9). ...................................................................................................... 124
Figure 16: Total number of correct realisations per item in the spoonerism with non-words
task performances (N=9). ............................................................................................... 125
Figure 17: Total number of correct realisations per item in the spoonerism with real words
task performances (N=9). ............................................................................................... 125
18
Figure 18: Total number of correct realisations in reading of non-words task performances
(N=9). .............................................................................................................................. 126
Figure 19: Total number of legal realisations in spelling of non-words task performances
(N=9). .............................................................................................................................. 126
Figure 20: Example of screen including instructions for auditory discrimination of non-words.
........................................................................................................................................ 137
Figure 21: Reaction time measure cut-off points per item across the complete assessment
tool. ................................................................................................................................. 139
Figure 22: Histogram for accuracy of performances for Auditory discrimination of non-words
out of 18 (N=101). ........................................................................................................... 159
Figure 23: Histogram for reaction time performances for Auditory discrimination of non-
words (N=101). ............................................................................................................... 159
Figure 24: Histogram for accuracy of performances for Non-word repetition out of 18
(N=101). .......................................................................................................................... 160
Figure 25: Histogram for reaction time performances for Non-word repetition (N=101). .... 160
Figure 26: Histogram for accuracy of performances for Reading of non-words out of 13
(N=101). .......................................................................................................................... 161
Figure 27: Histogram for reaction time performances for Reading of non-words (N=101). .. 161
Figure 28: Histogram for accuracy of performances for Spelling of non-words out of 109
(N=101). .......................................................................................................................... 162
Figure 29: Histogram for reaction time measures for Spelling of non-words (N=101). .......... 162
Figure 30: Histogram for accuracy of performances for Spoonerism with real words out of 10
(N=101). .......................................................................................................................... 163
Figure 31: Histogram for reaction time measures for Spoonerism with real words (N=101). 163
Figure 32: Histogram for accuracy of performances for Spoonerism with non-words out of 10
(N=101). .......................................................................................................................... 164
Figure 33: Histogram for reaction time measures for Spoonerism with non-words (N=101).164
Figure 34: Boxplots of accuracy of performances for each task - AD=Auditory discrimination;
NW=Non-word repetition; R=Reading; S=Spelling; SPR=Spoonerism with real words;
SPN= Spoonerism with non-words - (N=101). ................................................................ 165
Figure 35: Boxplots of reaction time measures for each task - AD=Auditory discrimination;
NW=Non-word repetition; R=Reading; S=Spelling; SPR=Spoonerism with real words;
SPN= Spoonerism with non-words - (N=101). ................................................................ 165
19
List of Tables
Table 1: Common and differentiating factors of the psycholinguistic model and the linguistic
processing model as the theoretical basis for the development of a speech processing
assessment. ...................................................................................................................... 64
Table 2: Summary of descriptive research findings on stammering as related to the three
main components of a psycholinguistic speech processing model; PWS = People who
stammer. .......................................................................................................................... 93
Table 3: Tasks with number of displayed items per task. ....................................................... 110
Table 4: Spread of syllable length and stress pattern across 102 items. ................................ 113
Table 5: Hierarchy of onsets for developing test items. ......................................................... 114
Table 6: Spread of onsets across the 102 test items. ............................................................. 114
Table 7: Matrix of creating items for non-word repetition and auditory discrimination of non-
words. ............................................................................................................................. 115
Table 8: Matrix for creating items for reading and spelling of non-words; S = syllable. ........ 116
Table 9: Matrix for creating items for spoonerism of both real and non-words. ................... 117
Table 10: Steps taken to create non-words. ........................................................................... 119
Table 11: Scores given by pilot participants on scale from 1-10 for difficulty. ....................... 128
Table 12: Finalised items for auditory discrimination of non-words including syllable length
and distractor items. ...................................................................................................... 131
Table 13: Finalised items for non-word repetition including syllable length. ........................ 132
Table 14: Finalised items for reading non-words including syllable length and distractor items.
........................................................................................................................................ 133
Table 15: Finalised items for spelling non-words including syllable length. ........................... 134
Table 16: Finalised items for spoonerism with real words. .................................................... 134
Table 17: Finalised items for spoonerism with non-words. .................................................... 135
Table 18: Scoring system for the spelling of non-words task including consonant sound points
and syllable amount points per item. ............................................................................ 142
Table 19: Examples for judging realisations of spelling of non-words task, including consonant
sound points and syllable amount points and sum of points. ....................................... 143
Table 20: Spelling data from survey asking 10 professionals to spell from IPA to orthographic
English. ........................................................................................................................... 144
Table 21: Descriptive measures for accuracy for all tasks. ..................................................... 157
Table 22: Descriptive measures for reaction time for all tasks. ............................................. 158
20
Table 23: Skewness and Kurtosis values for all tasks related to accuracy and reaction time
(N=101). .......................................................................................................................... 166
Table 24: Kolmogorov-Smirnov and Shapiro-Wilk statistics for accuracy (N=101). ................ 167
Table 25: Kolmogorov-Smirnov and Shapiro-Wilk statistics for reaction time (N=101). ........ 168
Table 26: Hits and correct misses performances for auditory discrimination task (N=101), out
of 909 choices. ................................................................................................................ 170
Table 27: Overview of items in reading task including target items and three choices displayed
orthographically in the task trials (N=101). .................................................................... 171
Table 28: Word-level error types in the non-word repetition task. ........................................ 173
Table 29: Syllable-level errors made with consonants in non-word repetition task. ............. 174
Table 30: Syllable-level errors made with consonant clusters in the non-word repetition task.
........................................................................................................................................ 174
Table 31: Syllable-level errors made with vowels in the non-word repetition task. .............. 175
Table 32: Frequency of errors made for the non-word repetition task at word-level
(explanations of abbreviations of errors types on page 165)......................................... 176
Table 33: Frequency of errors made for the non-word repetition task at syllable-level
(explanations of abbreviations of errors types on pages 165-167). ............................... 176
Table 34: Errors made on the whole spoonerism for spoonerism with real words. ............... 178
Table 35: Consonant errors for spoonerism with real words. ................................................ 179
Table 36: Cluster errors for spoonerism with real words. ...................................................... 179
Table 37: Vowel errors for spoonerism with real words. ........................................................ 180
Table 38: Other errors for spoonerism with real words. ........................................................ 180
Table 39: Errors made for the whole spoonerism for spoonerism with non-words. .............. 181
Table 40: Consonant errors for spoonerism with non-words. ................................................ 182
Table 41: Cluster errors for spoonerism with non-words. ...................................................... 183
Table 42: Vowel errors for spoonerism with non-words. ....................................................... 183
Table 43: Other errors for spoonerism with non-words. ........................................................ 184
Table 44: Frequencies of errors for spoonerism with real words on the whole spoonerism. 185
Table 45: Frequency of errors for spoonerism with real words in one of the two spoonerism
words. ............................................................................................................................. 185
Table 46: Frequency of errors for spoonerism with non-words made on the whole
spoonerism. .................................................................................................................... 186
Table 47: Frequency of errors for spoonerism with non-words made on one item of the
spoonerism. .................................................................................................................... 187
Table 48: Word-level errors types in spelling. ......................................................................... 189
21
Table 49: Syllable-level errors made with consonants in spelling. ......................................... 190
Table 50: Syllable-level errors made with consonant clusters in spelling. ............................. 190
Table 51: Other error made in the spelling of non-words task. ............................................. 191
Table 52: Items in spelling task including errors made at syllable level. ................................ 192
Table 53: Three items in the spelling task realised incorrectly at highly frequent rates,
including nature of errors. ............................................................................................. 194
Table 54: Cronbach's alpha statistics for accuracy for all tasks (N=101). ............................... 196
Table 55: Cronbach's alpha statistics for reaction time for all tasks (N=101). ....................... 198
Table 56: Mean and standard deviation values for accuracy and reaction time measures at T1
and T2. ............................................................................................................................ 199
Table 57: Spearman’s Rho for test-retest reliability of 8% of the whole cohort (N=101). ..... 200
Table 58: Intraclass correlation for absolute agreement. ...................................................... 201
Table 59: Spearman’s Rho correlations of accuracy and reaction time (RT) across all tasks
(AD=Auditory discrimination; NW=Non-word repetition; S=Spelling; R=Reading;
SPN=Spoonerism with non-words; SPR=Spoonerism with real words) of the speech
processing assessment. .................................................................................................. 205
Table 60: Spearman's Rho comparing reading accuracy of TOWRE and the reading task of the
newly created speech processing assessment (N=8), (RW = Real Word; NW = Non
Word). ............................................................................................................................ 208
Table 61: Key facts, including age, gender, native language, and study programme from all
case study participants (N=6). ........................................................................................ 219
Table 62: Descriptive measures for S1 for accuracy and reaction time per task compared to
mean/standard deviation of the large scale study (LSS). ............................................... 223
Table 63: Hits and correct misses performances for auditory discrimination of non-words, out
of 18 choices for S1. ....................................................................................................... 224
Table 64: Items of reading task including highlighting showing items with errors made by S1.
........................................................................................................................................ 225
Table 65: Outcomes for S1 in non-word repetition. ............................................................... 226
Table 66: Outcomes for S1 in spoonerism with real words. ................................................... 228
Table 67: Outcomes for S1 in spoonerism with non-words. .................................................. 229
Table 68: S1's outcomes for spelling of non-words. ............................................................... 230
Table 69: Descriptive measures for S2's accuracy and reaction time per task compared to
mean/standard deviation values of LSS. ........................................................................ 235
Table 70: Hits and correct misses performances for auditory discrimination of non-words, out
of 18 choices for S2. ....................................................................................................... 236
22
Table 71: Items of reading task including highlighting showing items with errors made by S2.
........................................................................................................................................ 237
Table 72: S2's outcomes for non-word repetition task. .......................................................... 238
Table 73: S2's outcomes for spoonerism with real words task. .............................................. 239
Table 74: S2's outcomes for spoonerism with non-words task. ............................................. 240
Table 75: S2's outcomes for spelling of non-words task. ........................................................ 242
Table 76: Descriptive measures for S3's accuracy and reaction time outcomes per task
compared to mean/standard deviation values of LSS. ................................................... 245
Table 77: Hits and correct misses performances for auditory discrimination of non-words, out
of 18 choices for S3. ........................................................................................................ 245
Table 78: Items of reading task including highlighting showing items with errors made by S3.
........................................................................................................................................ 247
Table 79: S3's performances in non-word repetition. ............................................................. 248
Table 80: S3's performances of spoonerism with real words. ................................................ 249
Table 81: S3's performances of spoonerism with non-words. ................................................ 250
Table 82: S3's performances in spelling of non-words task. ................................................... 251
Table 83: Descriptive measures for S4 for accuracy and reaction time per task compared to
mean/standard deviation values of LSS for S4. .............................................................. 255
Table 84: Hits and correct misses performances for auditory discrimination of non-words, out
of 18 choices for S4. ........................................................................................................ 256
Table 85: Items of reading task including highlighting showing items with errors made by S4.
........................................................................................................................................ 257
Table 86: S4's outcomes for spoonerism with real words task. .............................................. 258
Table 97: Hits and correct misses performances for auditory discrimination of non-words, out
of 18 choices for S6. ........................................................................................................ 274
Table 99: S6's performances of non-word repetition. ............................................................ 276
Table 102: S6's outcomes of spelling of non-words. ............................................................... 280
Conventions
/pritɒtbəhʊd/ phonemic transcription: e.g. in reading of non-words; presenting
single sounds or sound clusters; real words when phonoloigical
information is required

23
<pretotbuhood> orthographic transcription: e.g. representation of non-words; specific
sounds and sound clusters in written form
[pri’tɒtbə,hʊd] phonetic transcription: e.g. recorded item (non-word and real word)

Introduction
25
Introduction
Speech processing is a cognitive skill which serves as a fundamental basis for spoken
and written language abilities (Nathan, Stackhouse, Goulandris, & Snowling, 2004;
Stackhouse & Wells, 1997). The processing of spoken language (or written language)
necessitates the co-ordination of multiple communicative processes such as
hearing/vision and understanding, as well as formulating spoken or written language
and then articulating speech or executing writing. Speech processing is sometimes
conceptualised in terms of input and output processing, where input processing
describes underlying skills/abilities which are needed to identify and understand
received speech, whereas output processing encompasses the formulation and
production of speech. Both sets of processes involve the activation of stored lexical
representations. Effective processing abilities at all stages are critical to the successful
acquisition of speech and language. Compromised speech processing abilities can
result in speech and language and wider communication difficulties which may be long-
lasting. Speech and language abilities are crucial not just for verbal communication;
they are a fundamental and necessary foundation for literacy development. In turn,
literacy is needed for educational attainment, from primary education through to
university. Early spoken language difficulties which persist into adolescence and affect
literacy development can lead to long-term academic underachievement, besides
social and behavioural problems (Nathan et al., 2004). Hence, early identification of
speech difficulties is important. Nevertheless, speech difficulties are not always
detected early enough and/or might persist into adulthood (Pascoe, Stackhouse, &
Wells, 2006). Those difficulties might be overt and observable in spontaneous speech
production, or they might be quite subtle, leading to largely normal speech output,
with the difficulties more visible when investigating underlying speech processing skills.
Speech processing demands can increase markedly as young people enter tertiary or
higher education. Systems in higher education have shifted during recent decades from
lecture-style teaching towards more student-directed learning (Garrison & Kanuka,
2004; Hicks, Reid, & George, 2001; Kolb & Kolb, 2005). This often involves different
teaching methods and learning styles such as workshops, group work, and student-led
presentations. There is an increased focus on oral presentations and/or reflective
Introduction
26
writing within higher education which raises the importance of effective oral and
written communication (Novak, 2011). In addition, (digital) literacy skills are essential
for the acquisition of new knowledge. Given this complexity of skills sets needed for
graduate and undergraduate students, an individual’s speech difficulties potentially
result in a greater degree of disability in higher education settings, as well as in
professional contexts where requirements for oral communication, for example in
group meetings, presentations and extensive use of phones or video-conferencing, and
written communication are also high. A crucial question therefore arises: how best to
identify individuals with persisting speech difficulties, especially if the speech
difficulties are more subtle, once they have transitioned from compulsory education.
A small number of speech processing assessments exist for research and clinical use.
These assessments target children as well as adults. Assessments for children are
mainly used to identify problems or difficulties during key phases of speech and
language development (Chiat, 2000; Stackhouse & Wells, 1997). In contrast, speech
processing assessments for adults are utilised to gain insights into acquired speech and
language difficulties, such as aphasia or acquired dyslexia, caused by acquired brain
damage (Coltheart, 2013; Patterson & Shewell, 1987). Speech processing assessments
are based on the idea of a processing system which functions using input, lexicon
(knowledge) and output (Ellis & Young, 2013; Levelt, 1999). Although these
assessments focus on different age groups, a common factor is the theoretical basis
grounded in psycholinguistic speech processing models. The shared aim of all
assessments is to identify areas of strength and vulnerability within the system by
assessing multiple aspects of speech processing.
Nevertheless, existing speech processing assessments do not always offer a complete
assessment set. Psycholinguistic-based assessments in children, for example, rely on
the creativity and knowledge of an assessor to systematically test the complete speech
processing system by introducing self-developed tasks or different standardised
assessments which together cover the whole system (Rees, 2001b; Stackhouse, Vance,
Pascoe, & Wells, 2007). On the other hand, assessment for adults involves the detailed
testing of knowledge and cognitive abilities in light of breakdowns due to brain damage
in a previously intact, mature language system (De Bleser, Cholewa, & Tabatabaie,
Introduction
27
1997). Finally, although psycholinguistic assessment brings many advantages, it can be
time-consuming and might not always be feasible in clinical practice. It seems to be a
challenge to develop specific test tools which are sensitive enough to pick up deficits
and build individual profiles of performances, especially if the assessment aims to
investigate heterogeneous groups.
For individuals with persisting developmental speech difficulties, assessment of both
overt behaviours and underlying speech processes offers unique challenges. Due to the
influence of external factors, such as prior support, home/school experiences, as well
as within-individual factors such as compensation strategies, and the sheer complexity
of linguistic and cognitive maturation, these difficulties may be harder to identify
beyond childhood (Guitar, 2013; Spencer, Packman, Onslow, & Ferguson, 2005, 2009).
Such factors may contribute to students with speech difficulties going undetected
within higher education. However, literature shows that there is a sub-group of
students in tertiary education institutions experiencing different forms of speech
processing difficulties, for example, apraxia, stammering, and dyslexia (Cameron, 2016;
Cameron & Nunkoosing, 2012; Clegg, Hollis, Mawhood, & Rutter, 2005). Such
difficulties have typically emerged during childhood and for some individuals they
continue into adulthood. One specific speech difficulty that can persist is
developmental stammering, which has a worldwide prevalence rate of around 1%
(Boyle et al., 2011; Craig, Hancock, Tran, Craig, & Peters, 2002; van Riper, 1982).
Research on this topic has amply demonstrated the high impact of stammering on
social life, but also in the area of career choice (Bricker-Katz, Lincoln, & McCabe, 2009;
Guitar, 2013). In choosing a career, individuals need to make decisions about what to
study, and the experience of having a stammer can impact on these decisions (O’Brian,
Jones, Packman, Menzies, & Onslow, 2011). Currently, it is unclear how many students
who stammer are taking part in higher education, as the last survey was made decades
ago and sampled just one US college population (Porfert & Rosenfield, 1978).
In spite of the fact that stammering is described amply in the research literature (Boey,
Wuyts, Heyning, Heylen, & Bodt, 2009; Guitar, 2013), the majority of accounts focus
upon the overt and specific behaviours of stammering, for example, blocks and
prolongations, without looking at the speech processes underlying these characteristic
Introduction
28
features of stammering, such as input processing or lexical access. Therefore, the
exploration of possible underlying speech processing difficulties could help to
investigate speech processing processes in speakers who stammer (Pascoe et al.,
2006). To summarise, no assessment tool currently exists that is sensitive to the
complex, persistent (and potentially more subtle) speech difficulties of young adults
with developmental (as opposed to acquired) speech difficulties. The intention and
motivation of this thesis was to fill this gap and develop a tool which, besides the
examination of overt speech problems, makes it possible to investigate the broader
population experiencing speech difficulties. Therefore, in this doctoral thesis, a
psycholinguistic approach was adopted in order to develop a multi-componential
assessment of speech processing, suitable for an adult population (as described above),
as well as developing and validating the assessment on a normative sample of
university students. Moreover, due to the specific interest in adults who stammer, as
a sub-group of adults experiencing speech difficulties, the utility of the assessment in
profiling a case series of young adults with a developmental stammer was explored.
Thesis outline
29
Thesis outline
This dissertation comprises several chapters over four main parts. Each chapter
presents a brief introduction to the content of the chapter and ends with either a
summary or a concluding thought about the discussed outcomes. Part I of the thesis
focuses on the theoretical background and considerations for the study presented
here, while Part II explains methodological and other strategies, used for task design,
participant recruitment and data collection. Part III, documents analyses and
evaluations of outcomes, followed by Part IV which concludes with general discussion
points about the outcomes in light of existing research and sets out important
recommendations and applications of the current study.
PART I: BACKGROUND TO THE STUDY
Chapter 1 and Chapter 2 present the theoretical background for this doctoral study.
Chapter 1 focuses on psycholinguistics. First, general psycholinguistic principles and
processes are explained, particularly in relation to the modality of speech processing.
Speech processing is first addressed by defining and explaining the processes by means
of ‘the psycholinguistic model’, the speech processing model of Stackhouse and Wells
(1997). This model focuses on child speech processes; the principles of these processes
(and child speech disorders) will be explained as the model itself is elaborated. The
chapter then elaborates speech processing specifically in adult speakers and describes
how speech difficulties manifest in adults generally, including current definitions.
Specific speech processing characteristics for adult speakers are discussed and mapped
to a processing model for adult speech and language. To this end, ‘the linguistic
processing model’ (Patterson & Shewell, 1987) is introduced. The chapter ends by
explaining and justifying the suitability and use of both models as the theoretical basis
of a new speech processing assessment for the targeted group of young adults. Chapter
2 establishes the relevant theoretical context for the application of the speech
processing assessment tool to a case series of adults experiencing persistent
developmental stammering. Stammering as a speech difficulty is described, starting
with definitions of the phenomenon, followed by the elaboration of current empirical
research about stammering difficulties and characteristic behaviours. Finally, the
Thesis outline
30
chapter briefly discusses some causal theories of stammering and the rationale for
assessing stammering in the context of a psycholinguistic approach.
The background to the study finishes with Chapter 3, which outlines the research
questions for this doctoral study.
PART II: METHODS
Chapter 4 presents the methodological steps and processes for the execution of this
doctoral study. First, the design of tasks and items is explained in detail, drawing on
findings in existing independent research. Then the results of a pilot study are
presented and their influence on the revision of tasks and items is explained. This is
followed by the report on recruitment, participants, procedure, and analysis of data for
the normative sample group. The second part of Chapter 4 elaborates these
components for the case series participants, with additional procedural elements
described.
PART III: RESULTS
Chapters 5 and 6 explore the outcomes of assessment of the normative sample group
and case series participants. The research questions established for the new speech
processing assessment are answered in Chapter 5. Psychometric properties, including
objectivity, reliability, and validity are discussed. Chapter 6 then focuses on the
additional research questions formulated specifically for each individual stammering
case study. Each case study is presented and discussed separately, followed by overall
thoughts related to the individual discussions which capture all findings in the case
series data and briefly relate it back to existing research.
PART IV: GENERAL DISCUSSION
Finally, Chapter 7 presents a general discussion of the broader theoretical and
methodological implications of the findings. Future directions for research and
application are outlined.
Chapter 1: Psycholinguistics
31
PART I: BACKGROUND TO THE STUDY
1. Chapter 1: Psycholinguistics
Psycholinguistics can be defined loosely as the study of the psychology of language
(Scovel, 1998). The basics of psycholinguistics are used in many disciplinary research
and clinical areas such as cognitive science, psychology, linguistics and speech and
language therapy (Gaskell, 2007). Within the area of speech and language therapy, it
has been used to develop models of assessment and intervention for developmental
populations (Baker, Croot, McLeod, & Paul, 2001; Chiat, 2000; Fox, Dodd, & Howard,
2002; Rees, 2001a; Schulte-Körne, Deimel, Bartling, & Remschmidt, 1998; Stackhouse
et al., 2007; Stackhouse & Wells, 1997), as well as populations with acquired speech
and language issues (De Bleser et al., 1997; Caramazza, Laudanna, & Romani, 1988;
Coltheart, 2013; Patterson, 1988). For developmental populations, psycholinguistic
theory provides a lens on language acquisition and speech and language development
(e.g. Chiat, 2000; Stackhouse & Wells, 1997), as well as developmental dyslexia (e.g.
Habib, 2000; Serniclaes, Sprenger-Charolles, Carré, & Demonet, 2001), and
connectionist models of language acquisition (Baker et al., 2001). Connectionist
approaches use computer simulations to try to model neurologically-feasible language
processing mechanisms (Pinker & Prince, 1988) in, for example, second language
acquisition (Ellis, 2003). Within the area of acquired speech and language disorders,
studies of aphasia and acquired dyslexia typify much of the published psycholinguistic
research (Caramazza, 1991; Lees, 2005), both in terms of clinical manifestation and in
seeking to understand theoretical underpinnings of these disorders. The following
section will focus on the application of psycholinguistics specifically within the area of
speech and language therapy.
1.1 Psycholinguistics and speech and language therapy
Modern psycholinguistics, related to speech and language therapy and speech
processing, describes the study of psychological and neurobiological factors that are
involved when acquiring, understanding and producing speech and language
(Coltheart, Rastle, Perry, Langdon, & Ziegler, 2001; Norcliffe, Harris, & Jaeger, 2015;
Stackhouse & Wells, 1997). For example, psycholinguistic assessment can potentially
Chapter 1: Psycholinguistics
32
help describe different points of underlying processing difficulty that may manifest in
a single surface speech behaviour (Baker et al., 2001; Crosbie, Holm, & Dodd, 2005;
Fisher, Lai, & Monaco, 2003; Fox et al., 2002; Schaefer et al., 2009; Stackhouse, 1992;
Stackhouse, Pascoe, & Gardner, 2006; Stackhouse & Wells, 1997).
Psycholinguistic approaches to understanding speech and language are relatively
recent within the wider history of speech and language research and are preceded by
two other key approaches, the medical model and the linguistic approach. The medical
model focuses on the overt speech or language behaviours that appear problematic.
For example, practitioners refer to speech processing difficulties from a medical
viewpoint on specific disorders, such as dyspraxia and dysarthria (Milloy & Morgan-
Barry, 1990) or stammering (Rustin, 1991). Furthermore, common medical causes for
speech difficulties include cleft palate, autism and/or learning difficulties (Stackhouse
& Wells, 1997). In these cases there is often an identifiable cause for the speech
difficulties. However, not all speech and language difficulties have overt aetiological
explanations, which in turn limits the degree to which medical description can be fully
relied on as a descriptive framework.
One possible supplement to medical descriptors is the linguistic approach, which
elaborates language behaviours on their own terms, without recourse to aetiological
explanations (Ball, 2003; Bybee, 2003). For example, a linguistic approach can
differentiate between phonetic speech errors, where an individual is trying to use
speech sounds contrastively but is displaying errors in the phonetic realisation of a
target, versus a phonological speech error, where a crucial sound contrast needed to
signal a difference in meaning, for example /t/ vs. /k/, is not being made. Usage-based
linguistic models facilitate understanding of how language patterns and rules are
‘constructed’ by usage, and determine what appropriate language use is (Ball, 2003;
Bybee, 2003; Newton, 2012). For example, one usage-based linguistic model is the so-
called ‘cognitive linguistic model’ (Ungerer & Schmid, 2013), which seeks to account
for key phenomena in language development, such as language as a tool for
communication, language as a learned behaviour, language within a natural context,
and language being influenced by the pivotal role of grammatical constructions (Tyler,
2010). Generally, linguistic approaches can offer useful descriptions of speech and
Chapter 1: Psycholinguistics
33
language behaviours and patterns, including delays and disorders (i.e. atypical
behaviours and patterns), but do not offer explicit explanations for underlying
processes.
In contrast, psycholinguistic approaches use linguistic analysis to characterise surface
behaviours, but then add in deeper layers of investigation to explore the processes
underlying these overt speech and language behaviours. The psycholinguistic
perspective has become a prominent way of investigating speech and language
difficulties (Gaskell, 2007). It can be used to complement the other approaches and it
has specific strengths in characterising the level of psycholinguistic breakdown
(Stackhouse & Wells, 1997). The approach can also inform the design of effective
speech and language interventions. For example, in a study by Crosbie et al., (2005), a
group of children with a speech disorder showed greater progress when their
intervention focused on underlying speech processing difficulties than when therapy
tackled overt output characteristics.
As introduced, this doctoral study sets out to develop a speech processing assessment
for adults and to use the assessment tool to explore the speech processing abilities of
adults who experience a persistent developmental stammer. Given the utility of the
psycholinguistic approach, in terms of being able to describe a range of speech
behaviours and processing abilities whether or not a specific aetiology is known, and
also to detect underlying difficulties, it was decided to ground the current assessment
within a psycholinguistic framework.
1.2 Speech processing within a psycholinguistic framework
Speech processing is being defined in this thesis as the mechanism of processing speech
sounds – their nature and position within words. The processing mechanisms do of
course extend across longer sequences than words, but the single-word level is the
focus of this study (this caveat will be addressed further in Chapter 1.2.1 below). It also
encompasses the ability to reflect on these structures, as well as peripheral skills such
as hearing and articulation. Individuals can experience difficulties with isolated
components of speech processing, or multiple aspects of the speech processing system
(De Bleser et al., 1997; Pascoe et al., 2006; Stackhouse & Wells, 1997). Equally, these
Chapter 1: Psycholinguistics
34
difficulties can occur as part of a constellation of behaviours with a known aetiology,
for example hearing impairment, or else they can occur without a clear aetiology.
Detailed ways of defining speech difficulties for different age populations are described
in more detail in Section 1.3.
Different psycholinguistic models have been used for speech processing assessment
and intervention for children and adults (Caramazza et al., 1988; Chiat, 2000; Ellis &
Young, 2013; Patterson & Shewell, 1987; Shallice, 1987, 1988; Stackhouse & Wells,
1997). The most widely used developmental psycholinguistic framework is arguably
that of Stackhouse and Wells (1997), created as a box- and arrow model to investigate
and describe children’s speech. Given the focus in this thesis on developmental speech
difficulties, as opposed to acquired speech difficulties, speech processing will be
examined first through this model, below.
1.2.1 The Stackhouse and Wells psycholinguistic model
In psycholinguistic terms there are three general mechanisms which are associated
with speech processing (Chiat, 2000; Patterson & Shewell, 1987; Stackhouse & Wells,
1997). These levels are:
(a) Input: A speaker needs perceptual channels to process visual and auditory
speech input.
(b) Stored knowledge: Language knowledge is stored in the mental lexicon.
(c) Output: A speaker requires functioning speech output organs, including the
vocal and oral tract, and the ability to make neuro-motor links to the brain
to plan and execute intentional physical movements.
Although these three levels can be seen as the basic mechanisms involved in speech
processing, it is important to note that speech processing itself is a continuum (Gaskell,
2007; Scovel, 1998). For basic conceptualisation it is, however, useful to divide the
speech processing system into different components in order to understand identify
distinct breakdowns within the system (Rees, 2001a, 2001b). However, evidence shows
that, for example, during normal input processing, components related to stored
knowledge and wider cognitive functioning are also activated (Pascoe, Stackhouse, &
Chapter 1: Psycholinguistics
35
Wells, 2005; Rees, 2001b). Wider cognitive functioning in this context includes the
involvement of, for example, attention and memory when processing speech and
language (Cohen et al., 2000). Furthermore, feedback loops while producing speech
can implicate input processing as well as stored knowledge. Chiat (2000, 2001) has also
suggested that language learning itself might be seen as a mapping task. Hence, for
example, during acquisition of a new word, input processing (the acoustic signal)
interacts with output processing (articulatory movements) to identify familiar sounds
within the novel information.
The specific speech processing model of Stackhouse and Wells (1993, 1997) can be
used both as an assessment and hypothesis-testing tool (Pascoe et al., 2005). It is
described as a theoretical box-and-arrow model which defines or explains speech
processing (Baker et al., 2001). This system includes the three main components input,
output, and lexical representations (stored knowledge/lexical representations within
this model include phonological representations, semantic representations, and motor
program) and aims to provide an exploratory model for developmental speech
processing. It has been successfully used in research and clinical practice focused upon
developmental speech and literacy difficulties in children (e.g. Baird, 1991; Bishop &
Leonard, 2014; Constable, Stackhouse, & Wells, 1997; Dodd, 2013; Snowling,
Goulandris, & Defty, 1996; Stackhouse & Wells, 1993, 1997; Waters, Hawkes, &
Burnett, 1998). The following Figure 1 illustrates the psycholinguistic model.
Chapter 1: Psycholinguistics
36
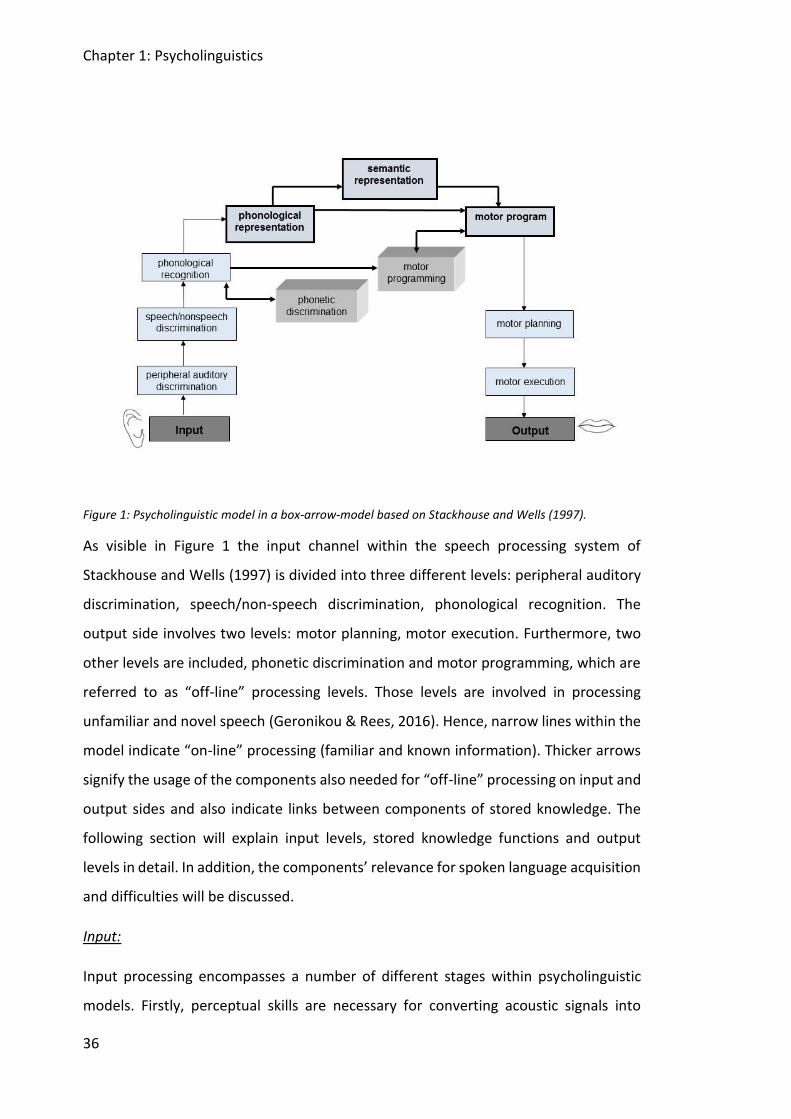
Figure 1: Psycholinguistic model in a box-arrow-model based on Stackhouse and Wells (1997).
As visible in Figure 1 the input channel within the speech processing system of
Stackhouse and Wells (1997) is divided into three different levels: peripheral auditory
discrimination, speech/non-speech discrimination, phonological recognition. The
output side involves two levels: motor planning, motor execution. Furthermore, two
other levels are included, phonetic discrimination and motor programming, which are
referred to as “off-line” processing levels. Those levels are involved in processing
unfamiliar and novel speech (Geronikou & Rees, 2016). Hence, narrow lines within the
model indicate “on-line” processing (familiar and known information). Thicker arrows
signify the usage of the components also needed for “off-line” processing on input and
output sides and also indicate links between components of stored knowledge. The
following section will explain input levels, stored knowledge functions and output
levels in detail. In addition, the components’ relevance for spoken language acquisition
and difficulties will be discussed.
Input:
Input processing encompasses a number of different stages within psycholinguistic
models. Firstly, perceptual skills are necessary for converting acoustic signals into
Chapter 1: Psycholinguistics
37
neural representations of sound. Following this stage, specific speech information must
be accurately recognised as speech and then more specifically identified in terms of
the phonological information conveyed, including syllables and phonemes (Gaskell,
2007). Skills within the input level of a speech processing system have been found to
be crucial for language acquisition (Beckman & Edwards, 2000; Evans, 2001). For
example, during language acquisition a child needs to understand that the audio-visual
signal (speech input) encodes a string of different words which have specific meanings
(Chiat, 2000, 2001). Therefore, the development of accurate auditory perception skills
is vital (Aslin, Jusczyk, & Pisoni, 1998).
Considering speech input processing related to speech difficulties, it can be said that
traditional diagnostic tests used in clinical practice often require, for example,
successful auditory processing ability, but without directly assessing it (Stackhouse &
Wells, 1997). For example, if a test aims to check for articulation skills by asking the
individual to repeat specific items, before producing the speech item, the individual
first needs to accurately perceive and recognise the auditory stimuli in order to activate
a motor programme and subsequently plan and execute this programme. Hence, a
client’s difficulties in such a diagnostic test might not be characterised correctly if both
input and output processing are not independently investigated (Logue-Kennedy et al.,
2011). Research has further shown that multiple levels within input processing need to
be assessed separately so that a clear picture of an individual’s speech processing skills
can be elucidated (Hind, 2006). Below, some of these different levels of input
processing will be considered.
The following Figure 2 shows all components of the psycholinguistic model which are
considered within input processing. Detailed explanation will follow below.
Chapter 1: Psycholinguistics
38
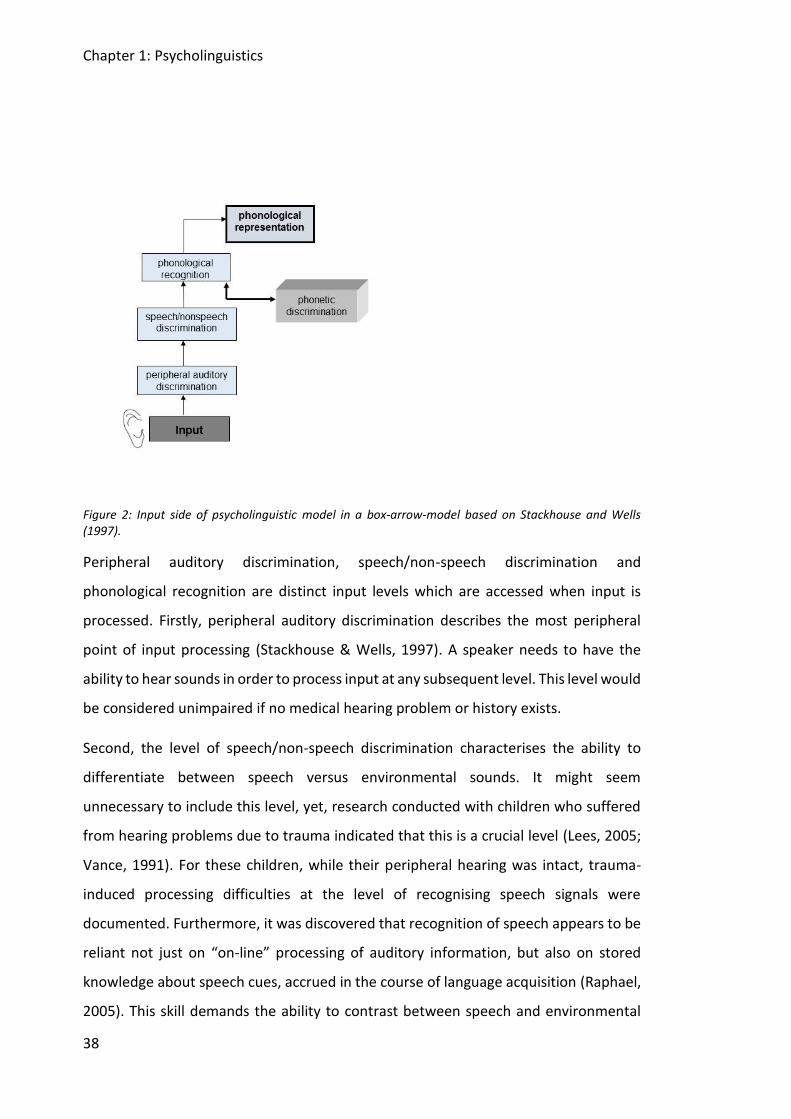
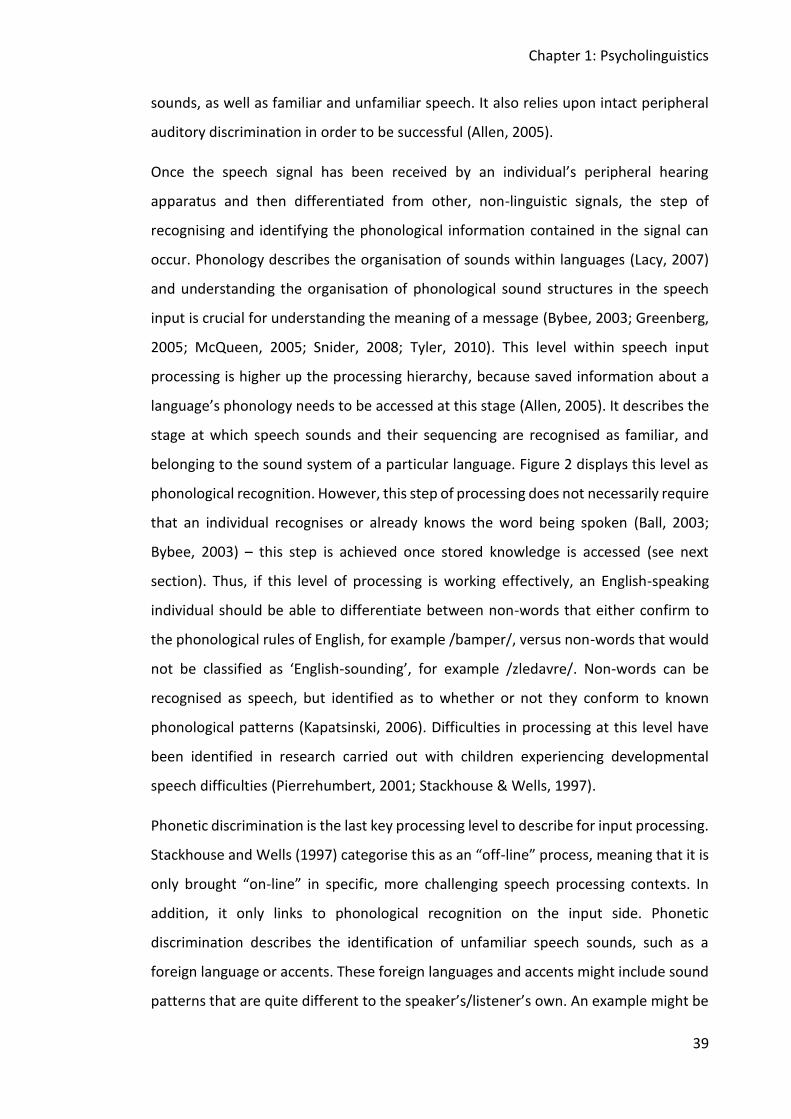
Figure 2: Input side of psycholinguistic model in a box-arrow-model based on Stackhouse and Wells (1997).
Peripheral auditory discrimination, speech/non-speech discrimination and
phonological recognition are distinct input levels which are accessed when input is
processed. Firstly, peripheral auditory discrimination describes the most peripheral
point of input processing (Stackhouse & Wells, 1997). A speaker needs to have the
ability to hear sounds in order to process input at any subsequent level. This level would
be considered unimpaired if no medical hearing problem or history exists.
Second, the level of speech/non-speech discrimination characterises the ability to
differentiate between speech versus environmental sounds. It might seem
unnecessary to include this level, yet, research conducted with children who suffered
from hearing problems due to trauma indicated that this is a crucial level (Lees, 2005;
Vance, 1991). For these children, while their peripheral hearing was intact, trauma-
induced processing difficulties at the level of recognising speech signals were
documented. Furthermore, it was discovered that recognition of speech appears to be
reliant not just on “on-line” processing of auditory information, but also on stored
knowledge about speech cues, accrued in the course of language acquisition (Raphael,
2005). This skill demands the ability to contrast between speech and environmental
Chapter 1: Psycholinguistics
39
sounds, as well as familiar and unfamiliar speech. It also relies upon intact peripheral
auditory discrimination in order to be successful (Allen, 2005).
Once the speech signal has been received by an individual’s peripheral hearing
apparatus and then differentiated from other, non-linguistic signals, the step of
recognising and identifying the phonological information contained in the signal can
occur. Phonology describes the organisation of sounds within languages (Lacy, 2007)
and understanding the organisation of phonological sound structures in the speech
input is crucial for understanding the meaning of a message (Bybee, 2003; Greenberg,
2005; McQueen, 2005; Snider, 2008; Tyler, 2010). This level within speech input
processing is higher up the processing hierarchy, because saved information about a
language’s phonology needs to be accessed at this stage (Allen, 2005). It describes the
stage at which speech sounds and their sequencing are recognised as familiar, and
belonging to the sound system of a particular language. Figure 2 displays this level as
phonological recognition. However, this step of processing does not necessarily require
that an individual recognises or already knows the word being spoken (Ball, 2003;
Bybee, 2003) – this step is achieved once stored knowledge is accessed (see next
section). Thus, if this level of processing is working effectively, an English-speaking
individual should be able to differentiate between non-words that either confirm to
the phonological rules of English, for example /bamper/, versus non-words that would
not be classified as ‘English-sounding’, for example /zledavre/. Non-words can be
recognised as speech, but identified as to whether or not they conform to known
phonological patterns (Kapatsinski, 2006). Difficulties in processing at this level have
been identified in research carried out with children experiencing developmental
speech difficulties (Pierrehumbert, 2001; Stackhouse & Wells, 1997).
Phonetic discrimination is the last key processing level to describe for input processing.
Stackhouse and Wells (1997) categorise this as an “off-line” process, meaning that it is
only brought “on-line” in specific, more challenging speech processing contexts. In
addition, it only links to phonological recognition on the input side. Phonetic
discrimination describes the identification of unfamiliar speech sounds, such as a
foreign language or accents. These foreign languages and accents might include sound
patterns that are quite different to the speaker’s/listener’s own. An example might be
Chapter 1: Psycholinguistics
40
a speaker of English from the South East of England processing the speech of an English
speaker from the Highlands of Scotland. The listener will still be able to recognise and
identify the language or accent, but additional phonetic processing is required for this
to be successful. It is known that phonetic discrimination is needed for comprehending
an individual’s own first language and later on to approach learning new languages
(Nathan & Wells, 2001). Furthermore, a speaker might have the ability to reproduce
unfamiliar sounds of a foreign language without fully understanding the meaning of
what they are producing. This process is only possible in combination with the
phonological recognition level since the latter level is crucial for decision making as to
the phonological content of phonetically-variant information being received. Hence,
these two levels are linked. In the next section, the sub-components of stored
knowledge processing will be considered.
Stored knowledge:
The stored knowledge of a speaker includes broadly all information about the
phonological form, motor program and semantic context of a word (Chiat, 2000). This
is also known as the mental lexicon and represents the level of processing at which
speech processing intersects with broader language processing (Gaskell, 2007). Stored
knowledge acts as a key intermediary between the received information (input) and
the spoken or written production (output). The following Figure 3 displays the
components designated by the authors of the psycholinguistic model as stored lexical
knowledge. Further explanations will elaborate the functions of these components
within this developmental speech processing model.
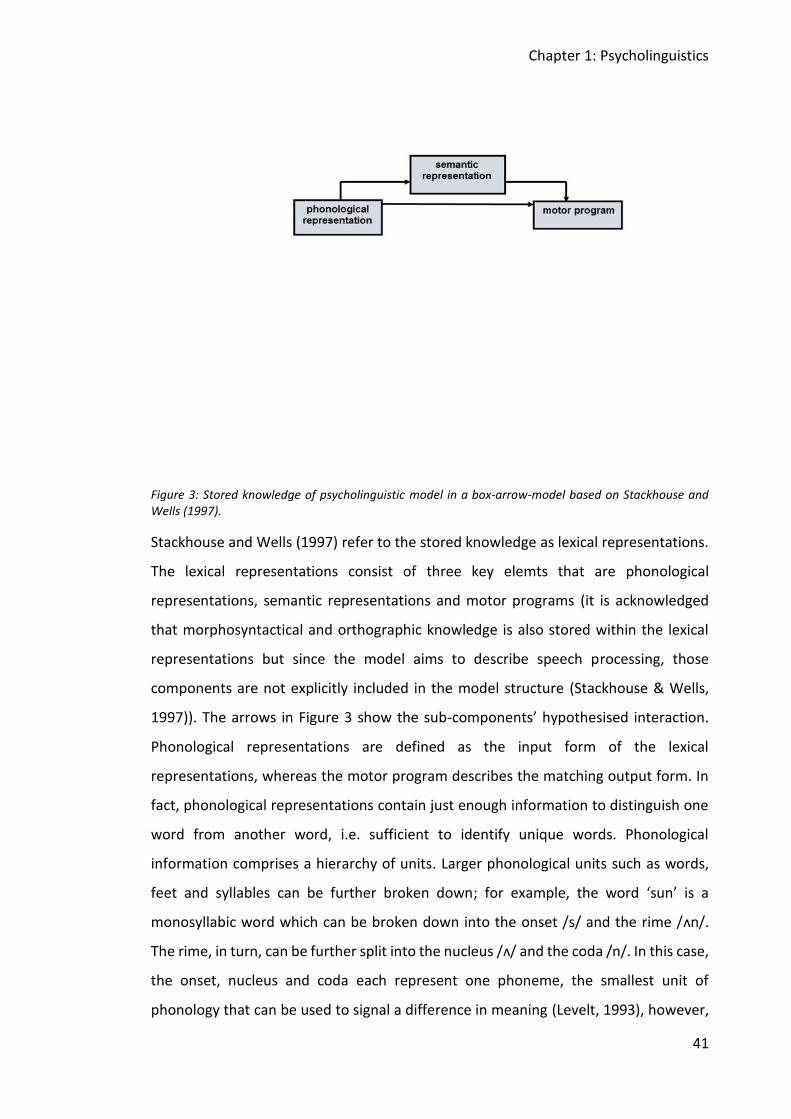
Chapter 1: Psycholinguistics
41
Figure 3: Stored knowledge of psycholinguistic model in a box-arrow-model based on Stackhouse and Wells (1997).
Stackhouse and Wells (1997) refer to the stored knowledge as lexical representations.
The lexical representations consist of three key elemts that are phonological
representations, semantic representations and motor programs (it is acknowledged
that morphosyntactical and orthographic knowledge is also stored within the lexical
representations but since the model aims to describe speech processing, those
components are not explicitly included in the model structure (Stackhouse & Wells,
1997)). The arrows in Figure 3 show the sub-components’ hypothesised interaction.
Phonological representations are defined as the input form of the lexical
representations, whereas the motor program describes the matching output form. In
fact, phonological representations contain just enough information to distinguish one
word from another word, i.e. sufficient to identify unique words. Phonological
information comprises a hierarchy of units. Larger phonological units such as words,
feet and syllables can be further broken down; for example, the word ‘sun’ is a
monosyllabic word which can be broken down into the onset /s/ and the rime /ʌn/.
The rime, in turn, can be further split into the nucleus /ʌ/ and the coda /n/. In this case,
the onset, nucleus and coda each represent one phoneme, the smallest unit of
phonology that can be used to signal a difference in meaning (Levelt, 1993), however,
Chapter 1: Psycholinguistics
42
phonemes can also be decomposed into their respective features of voice, place and
manner of articulation (Caramazza, Papagno, & Ruml, 2000). The reason why
phonological representations are described as the input part of lexical representations
is that the decomposition of a word into its smallest chunks facilitates identification of
the word but does not itself enable pronunciation. In turn, access to the phonological
representation is very dependent upon intact input processing from the level of
peripheral auditory discrimination upwards. Overall, phonological representations are
an abstraction of the actual word form which represents stored phonological
information. This implicit phonological knowledge about word forms is established
from an early age on. Children learn to listen to their own or others’ speech production,
self-correct mispronunciations and update their phonological representations
accordingly. This process may be negatively affected in individuals with speech
processing difficulties and may result in incorrect or incomplete phonological
respresentations. In turn, the quality of phonological representations affects output
skills within the speech processing system, especially speech articulation and decoding
performances.
Based on this implicit phonological knowledge and speech processing skills, explicit
knowledge about the sound structure of words starts developing, i.e. phonological
awareness. Phonological awareness describes the metalinguistic ability to reflect on a
sound structure of a word or utterance independent of its meaning (Stackhouse and
Wells, 1997). It can be subdivided into different levels, namely, phoneme awareness,
onset-rime awareness, and syllable awareness (Gillion. 2018). Different phonological
awareness skills require different levels of explicit metacognitive processes (Anthony
et al., 2010). For example, a complex task such as sound manipulation requires
adequate working memory skills to be successfully completed. Some phonological
awaereness tasks require the access of the lexical representations (e.g. rhyme
production of real words) and some do not (e.g. sound identification of non-words).
Hence, some phonological awareness tasks can be used to tap into phonological
representations and identify difficulties on the lexical level (imprecise/incomplete
phonological represnetations will negatively impact on phonological awareness
skills).While phonological awareness can explore the quality of phonological
Chapter 1: Psycholinguistics
43
representation, it also constitutes an important prerequisite for literacy acquisition
(Stackhouse, 2006). In particular in the early stages of literacy development, the ability
to segment sounds is a necessary skill in order to decode words, while the blending of
sounds provides a foundation for reading. The identification of orthographic elements,
such as prefixes, plurals or the regular past tense form –ed, are dependent on the
child’s ability to use their lexical representations (incl. phonological representations) to
segment words into different parts and establish morpho-syntactical rules and
translate spoken words into their orthographic representations (for more details see
chapter 1.4, page 52).
Another important component of the stored knowledge is the semantic representation
(Caramazza & Mahon, 2006; Moss, Tyler, & Taylor, 2007). These representations are
crucial for comprehension and production of speech, as psycholinguistically orientated
research with brain-damaged populations has shown (Caramazza & Hillis, 1990;
Shallice, 1987). The semantic representation contains all the information an individual
has stored concerning a word’s meaning – from this information an individual can
define a word, reflect on words that are similar or different in meaning, as well as
consider multiple meanings of the same word, for example, knowledge of the word
‘run’ might include the physical act of moving quickly, but also the idea of ‘running’ for
president, or having a ‘runny’ nose. Research has shown that the properties of words
related to their meaning can have an impact on other parts of the speech processing
system (Ford, Marslen-Wilson, & Davis, 2003). For example, words which are used very
regularly in speech (i.e. are high frequency) are typically accessed more quickly than
their low frequency counterparts.
The semantic representation is also closely related to the motor program – i.e. the
stored knowledge concerning the articulatory gestures needed in order to produce a
known spoken word. An important concept here is ‘gestures’: studies of speech errors
in fluent speakers as well as those with speech difficulties suggest that it is unlikely that
programs are stored in a segment-by-segment manner, but rather, information about
how combinations of sounds are articulated is stored for more efficient access (Gaskell,
2007). Hence, the motor program is seen as the basis for planning articulatory speech
output and therefore considered the output part of stored knowledge processingThe
Chapter 1: Psycholinguistics
44
explicit task of the motor program within stored knowledge processing is thus the
matching of stored articulatory gestures to the planned message (meaning) to be
conveyed.
This outline of the nature of lexical representations covers the key elements most
relevant to speech processing. However, Stackhouse and Wells (1997) assert that
lexical representations of a mature speaker also contain grammatical representations,
orthographic representations and orthographic programs. As an example of a word’s
saved information, Stackhouse and Wells explain all components for the word MOUSE.
Semantic representations might include knowledge of an animal with a long tail that
eats cheese. Phonological representations break down the monosyllabic word into its
phonological units, whereas orthographic representations present the letter pattern
which is used to identify the word, and the orthographic program would facilitate the
writing of the word in the correct order of graphemes (letters). Moreover, grammatical
representations of this word might include that the word is a noun and has an irregular
plural MOUSE – MICE. Finally, the motor program would match articulatory gestures,
such as lip closure for the sound /m/, to the word for verbal production.
Output:
Output processing describes the various subcomponents needed in order to realise
different sounds in different contexts (Stackhouse & Wells, 2001). It also involves the
construction of connecting sounds into words and words into sentences (Fowler, 2007).
Hence, it requires the physical skills of speech production which in turn rely on working
functional speech apparatus components, such as the vocal tract.
Figure 4 illustrates the output side of the psycholinguistic model including the output
side of the stored knowledge (motor program) as it directly influences output levels.
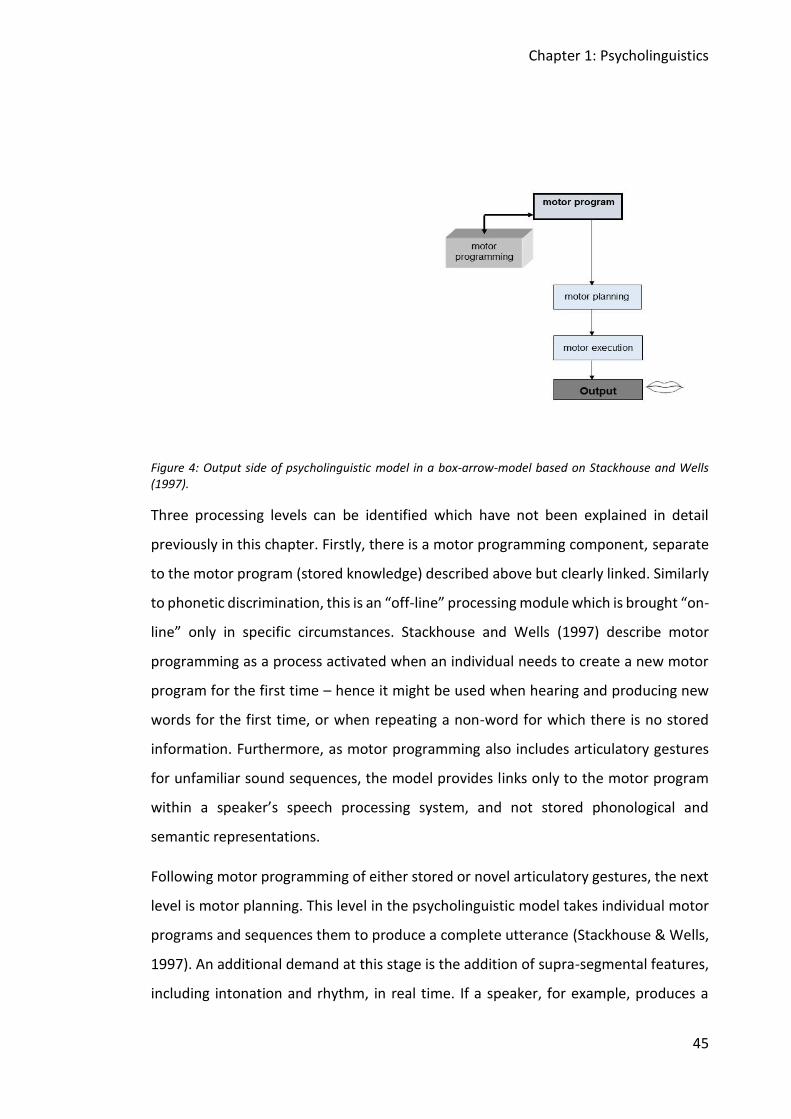
Chapter 1: Psycholinguistics
45
Figure 4: Output side of psycholinguistic model in a box-arrow-model based on Stackhouse and Wells (1997).
Three processing levels can be identified which have not been explained in detail
previously in this chapter. Firstly, there is a motor programming component, separate
to the motor program (stored knowledge) described above but clearly linked. Similarly
to phonetic discrimination, this is an “off-line” processing module which is brought “on-
line” only in specific circumstances. Stackhouse and Wells (1997) describe motor
programming as a process activated when an individual needs to create a new motor
program for the first time – hence it might be used when hearing and producing new
words for the first time, or when repeating a non-word for which there is no stored
information. Furthermore, as motor programming also includes articulatory gestures
for unfamiliar sound sequences, the model provides links only to the motor program
within a speaker’s speech processing system, and not stored phonological and
semantic representations.
Following motor programming of either stored or novel articulatory gestures, the next
level is motor planning. This level in the psycholinguistic model takes individual motor
programs and sequences them to produce a complete utterance (Stackhouse & Wells,
1997). An additional demand at this stage is the addition of supra-segmental features,
including intonation and rhythm, in real time. If a speaker, for example, produces a
Chapter 1: Psycholinguistics
46
question versus a statement, different stress patterns and intonational contours are
needed (Ferreira & Swets, 2002; Jescheniak, Hahne, & Schriefers, 2003). The
phenomenon of ‘slips of the tongue’ are thought to represent errors at the motor
planning stage, for example saying “par cark” for “car park” (Cuetos, Aguado, &
Caramazza, 2000). In this example, the speaker fails to match a planned word to its
phonological components (use of sounds or chain of sounds) that would then let
him/her pronounce the word (Caramazza et al., 2000). This stage of processing is also
important to ensure that sounds are produced accurately in context – for example the
motor gestures at the end of the word /swiːt/ will be different if the following word is
/tuːθ/, as opposed to the word, /ɡəːl/. Motor planning thus facilitates smooth co-
articulation in connected speech (Farnetani & Recasens, 2010).
Finally, the most overtly noticeable skills which need to be in place to produce speech
output are at the stage of motor execution, including articulatory skills (Fowler, 2007),
in deploying the physical apparatus of speech production – the respiratory organs and
the vocal tract including the larynx, the laryngeal, oral and nasal cavities, and the
pharynx. In the vocal tract, the target word form’s phonetic characteristics are
matched. In clinical practice, this component of output processing can be assessed by
the oral examination of the vocal tract. For example, the ‘Paediatric Oral Skills Package’
(Brindley, Cave, Crane, Lees, & Moffat, 1996) is a traditional assessment tool which
aims to check the basic structure and function of articulators. Further assessments
could also include the investigation of sounds produced in different positions within
the word, such as word-initial versus word-final productions (Stackhouse & Wells,
1997), to help differentiating an articulatory problem from phonological sequencing
difficulties. Nevertheless, as with peripheral auditory processing on the input side,
motor execution is the level which is mainly implicated in medical aspects of speech
processing.
Concluding, the three main processing components described here (input, lexical
representations/stored knowledge, output) can be differentiated by assessors at the
task levels for each component, but the inter-dependence of the components remains
clear. If an individual manifests overt speech output difficulties, it will be important to
check the relative integrity of each of these levels of processing in order to fully
Chapter 1: Psycholinguistics
47
understand the nature of the difficulty. In considering the relationships between input
and output, the research of Bishop, Brown and Robson (1990) is also pertinent. These
researchers found that developmental difficulties in output processes can have a
negative impact on the development of input auditory perception (Bishop et al., 1990).
Indeed, the first babbling sounds of infants seem already to be matched to the specific
articulatory demands of the mother tongue (Guenther, Hampson, & Johnson, 1998),
which again supports the idea of there being a connection between articulatory
movements and auditory input in the production of sounds.
Up to now, speech processing has been explained by elaborating its three main
components input, stored knowledge, and output processing, and following the
psycholinguistic model of Stackhouse and Wells (1997) to delineate the roles of process
sub-components. A strength of the psycholinguistic model is that speech processing
assessment can target and be informed by these components and sub-components
using it as a framework. The next section will briefly elaborate the use of the
psycholinguistic framework in clinical assessment.
1.2.2 Clinical assessment using the psycholinguistic framework
Generally, a speech difficulty can be determined by assessing different levels of the
psycholinguistic framework (illustrated in the box-arrow model in Figure 1) and
localising one or more breakdowns at particular levels. Hence, the model permits the
formulation of hypotheses about the processes responsible for the disordered speech
output or input. Hypotheses can be tested systematically by tapping the different
processing levels in the model using specific techniques (Stackhouse & Wells, 1997).
Furthermore, the psycholinguistic framework is not deficit-centred: it can highlight an
individual’s processing strengths as well as his/her weaknesses. Taking a holistic
approach, strengths may be used to support and compensate for the weaknesses. The
psycholinguistic framework (Stackhouse et al., 2006, 2007, Stackhouse & Wells, 1997,
2001) offers a complete instrument to prepare detailed, individual speech processing
profiles for investigating, describing and explaining speech and literacy difficulties.
Furthermore, it combines the descriptive value of the medical and linguistic
approaches but, crucially, considers underlying cognitive processes. It therefore affords
Chapter 1: Psycholinguistics
48
a potentially better understanding of the nature of a speech difficulty (Baker et al.,
2001; Pascoe et al., 2005; Stackhouse et al., 2007).
The psycholinguistic framework is a practical tool for carrying out assessment and
devising intervention targets for individuals and monitoring their progress. Stackhouse
and Wells and others have developed an explicit assessment checklist, organised
around 11 investigative questions which relate to the different levels of the
psycholinguistic model (box-arrow model) (Stackhouse et al., 2007; Stackhouse &
Wells, 1997, 2001). These questions do not represent one discrete level each, but
together they facilitate a comprehensive understanding of a speech profile by
pinpointing skills ranging from, for example, ‘Does the speaker have adequate auditory
perception?’ to ‘Can the speaker manipulate phonological units?’ (Pascoe et al., 2006).
Clinicians and practitioners can use other standardised assessments which answer
specific questions for the profile, but need to be creative related to assessing the
complete speech profile. Stackhouse and Wells (1997) highlight the idea that
psycholinguistic assessment is not carried out in an examination setting, but rather
takes place in the mind of a practitioner. Authors adhering to the psycholinguistic
framework describe different tasks, such as auditory discrimination and repetition of
words, which can be used to assess different levels of the model (Rees, 2001b;
Stackhouse & Wells, 1997, 2001). They also emphasise the importance of using
assessment outcomes to maximise therapy efficiency by creating tasks, similar to
assessment tasks, which are related to the different levels of the model and therefore
inform very specific therapy targets.
Much research related to the psycholinguistic model above has focused on
developmental speech difficulties and it has been shown that the model lends itself
well to comprehensive speech assessment and intervention planning for children.
However, a stated secondary aim of this doctoral study is to assess speech processing
skills in a group of adults who have experienced persistent speech difficulties since
childhood or adolescence (specifically, stammering). Therefore, at this juncture, it is
important to set out a short review of the nature and types of speech difficulties
generally, followed by a discussion of the application of psycholinguistic approaches to
adults’ speech processing assessment. It will become apparent that profiling of the
Chapter 1: Psycholinguistics
49
mature speech and language processing system, whether intact or impaired, brings
requirements and challenges which are slightly different to those for the developing
system. An alternative speech processing model will then be introduced, which caters
for these different requirements but shares much common ground with the child-
oriented psycholinguistic model. It will become clear that there are advantages in
integrating the two models for the purpose of assessing (and treating) adults with
speech difficulties persisting from childhood.
1.3 The nature of speech difficulties
Speech difficulties, also called speech disorders, have been widely investigated in the
area of developmental speech processing (e.g. Enderby & Philipp, 1986; Law, Boyle,
Harris, Harkness, & Nye, 2000; Nathan & Wells, 2001). Indeed, the term speech
difficulties seems to be an umbrella term which includes different definitions and
descriptions of difficulties and disorders. On the one hand, Pascoe et al. (2006) refer to
the term speech difficulty as the disturbed skill to produce speech at sound, word, or
sentence level. This definition embraces speech difficulties not only on sound level, but
also in utterances/communication, such as stammering. On the other hand, the term
speech sound disorder is applied internationally when describing difficulties which
result from problems of perception or production of speech (International Expert Panel
on Multilingual Children’s Speech, 2012). Referring to this definition, speech sound
disorders are difficulties which can affect perception, articulation and phonological
representations, as well as intonation, grammatical representations and word
structures. The term encompasses difficulties both with and without a known
aetiology. In contrast, the American Psychiatric Association (2013) excludes speech
sound disorders with a known origin (such as Down’s syndrome) within their
classification system. The definition by this Association asserts that a speech sound
disorder is present if an impact on verbal communication is obvious, communication
effectiveness is therefore limited, the difficulty started during developmental stages,
and no origin is obvious. Hence, recent definitions of speech difficulties highlight the
broad domain of problems which would fall into this category.
On account of this, explanations of speech difficulties vary throughout current
literature partly because children with speech problems form a heterogeneous group
Chapter 1: Psycholinguistics
50
(Crosbie et al., 2005; Fisher et al., 2003; Fox et al., 2002; Jahn, 2007; Stackhouse et al.,
2006), and no homogeneous picture can be introduced for speech disorders (Dodd,
2013). Indeed, researchers have made many attempts to classify developmental
speech disorders (Stackhouse et al., 2007). Articulation disorders, delayed phonological
development, deviant-consistent and deviant-inconsistent phonological disorders, and
phonologically-based speech sound disorder (Adams, 1994; Bradford & Dodd, 1994;
Broomfield & Dodd, 2004; Dodd, Hua, & Shatford, 2000; Fox et al., 2002; Holm & Dodd,
1999; Lousada, Jesus, Hall, & Joffe, 2014) are only some of the classified disorders
falling into the category of speech difficulties, because they are all characterised by
speech difficulties investigated from a linguistic perspective. That is why the
identification of different and underlying criteria – the psycholinguistic perspective – is
beneficial to the description of individual speech difficulties (Broomfield & Dodd, 2004;
McLeod & Baker, 2017) and could facilitate the accurate differential diagnosis of
underlying and maintaining causes (Shriberg, Green, Campbell, Mcsweeny, & Scheer,
2003). It could identify the locus of breakdown(s) within the speech processing system
and therefore add to and enhance the description based on phonological rules and
simplifying processes (Dodd, 2013; Edwards, Fourakis, Beckman, & Fox, 1999; Hewlett,
Gibbon, & Cohen-McKenzie, 1998).
Given the heterogeneity of both definitions and speech difficulties themselves, for the
purpose of this doctoral study the term speech difficulties will be used as a broad
description of speakers showing problems in their speech output. Speech disorders, as
well as speech difficulties based on a diagnosis (such as stammering), are included in
this description. The term ‘difficulty’ was chosen to capture mild and severe speech
difficulties without judging between medical and linguistic classified problems.
Moreover, the focus of this study is the investigation of adult speakers. As the reviewed
literature suggested that persistent speech difficulties are gradually more difficult to
measure due to improvement of skills (Nippold, 2007), the term speech difficulty can
encompass these more subtle difficulties seen in adulthood.
As explained above, assessment of speech difficulties within the psycholinguistic
perspective has many advantages and the psycholinguistic framework of Stackhouse
and Wells forms a comprehensive assessment instrument for children experiencing
Chapter 1: Psycholinguistics
51
developmental speech difficulties. Yet, the main objective of this doctoral research was
to develop a psycholinguistic-based speech processing assessment for adults, which
can be utilised for adults with persistent developmental speech difficulties. Hence,
problems which were originally developmental would be investigated while they
persist. The next section will focus on adults with speech difficulties and their
psycholinguistic-based assessment.
1.4 Adults with speech difficulties and psycholinguistic
assessment
The psycholinguistic framework of Stackhouse and Wells (1997), described above,
provides a clear and systematic basis for speech and language practitioners to assess
speech processing and plan possible interventions. Indeed, the framework has been
used as the foundation for an existing assessment compendium (Stackhouse et al.,
2007), where tasks are designed to isolate specific speech processing strengths and
weaknesses. However, as alluded to above, speech difficulties do not remain static over
time. The older a person gets, the more difficult it may be to detect underlying speech
processing difficulties (Bishop, 1997; Stiegler & Hoffman, 2001). Research evidently
shows that speech and language development continues beyond childhood by refining
skills which were acquired during childhood (Nippold, 2007). Furthermore, there is
evidence of populations which suffer from persistent language and communication
difficulties in adolescence (Conti-Ramsden, Botting, Simkin, & Knox, 2001; Stothard,
Snowling, Bishop, Chipchase, & Kaplan, 1998) and adulthood (Clegg et al., 2005). On
the one hand, those difficulties might become more established (Duffy, 2013), but on
the other hand, due to the influence of external factors such as periods of speech and
language therapy as well as the complex course of development which may engender
compensatory strategies or strengths in other areas, these speech difficulties may also
be harder to identify in adults (Guitar, 2013; Spencer et al., 2005; Spencer, Clegg, &
Stackhouse, 2012). Indeed, persisting difficulties might be harder to measure, as
ongoing and elusive improvement skills could influence classification of difficulties to a
great extent (Nippold, 2007). Finally, persisting language, speech and communication
disorders in adolescents or adults, have been significantly linked to faulty speech
Chapter 1: Psycholinguistics
52
processing systems during development (Briscoe, Bishop, & Norbury, 2001; Stothard
et al., 1998).
As development proceeds, the influence of speech processing, as well as speech
difficulties may broaden. Phonological processing, as well as being a fundamental basis
of speech perception and production, is a pre-cursor of literacy skills such as reading
and spelling (Stothard et al., 1998). For example, in order to produce written output,
an individual needs to be able to connect single sounds to individual letters. Secondly,
awareness of the sounds in words, or phonological awareness, is critical for learning
initial letter-sound correspondences as well as being able to read unfamiliar words later
in life (Goswami, 2000; Lonigan, Burgess, & Anthony, 2000; Muter, Hulme, Snowling, &
Stevenson, 2004; Stackhouse & Wells, 2001). In turn, once reading and spelling
acquisition is underway, individuals will not only store information about how to
recognise and verbalise words in their lexical representations, they will also store
information about the ‘orthographic’ form, i.e. the visual letter pattern of the word
(Snowling & Stackhouse, 2013). These orthographic forms will also be used to generate
written output.
Thus, psycholinguistic assessment of speech processing beyond childhood is likely to
need a slightly different assessment focus, in terms of both the level of difficulty and
the skill-domains targeted. The goal of this doctoral research was to meet this need
and develop a psycholinguistic-based speech processing assessment for adults who
show speech difficulties persisting since childhood, such as adults who stammer. Such
participants would match some characteristics found in psycholinguistic-based
assessment profiles for children, due to the developmental nature of the speech
difficulty, but also need the opportunity to reveal processing strengths and weaknesses
via certain tasks constructed for adult system.
In particular, psycholinguistic models aiming to fully capture adult language specify
orthographic input and output processing routes and stored orthographic lexical
representations (Ellis & Young, 2013; Gaskell, 2007). They depict how the orthographic
components are separate from but can interconnect with spoken input and output.
The developmental speech processing models do of course address the relationship
between speech and language processing and literacy (orthographic) development
Chapter 1: Psycholinguistics
53
(Chiat, 2000; Frith, 1985; Snowling & Stackhouse, 2013) but they do not seek to
elaborate the mature system. However, to reiterate, the established child-oriented
models remain vital because they are sensitive to patterns of developmental disorders
(whether or not these persist in adulthood). Thus, to profile adults with speech
difficulties persisting from childhood, an assessment tool should include characteristics
and tasks drawn from a valid model of adult speech and language processing as well as
a developmental model (Coltheart, 2013; Stackhouse et al., 2007). Clinical
psycholinguistic models of adult speech and language processing do exist (Ellis &
Young, 2013; Shallice, 1988; Tainturier & Rapp, 2003), as do associated assessments,
for example the ‘Psycholinguistic Assessment of Language Processing in Aphasia’
('PALPA': Kay, Lesser, & Coltheart, 2009). However, these models and assessments
were designed for adults with overt acquired speech and language difficulties, typically
arising out of neurological impairment later in life, as opposed to a developmental
speech difficulty (Ellis & Young, 2013; Levelt, 1999). Such neurological impairments can
be very significant in their severity and so as with psycholinguistic assessment focused
on children, the sensitivity of existing assessments may not always detect more subtle
speech difficulties. These models focused on adult speech and language processing
can, however, as indicated above, be useful in specifying additional levels of
processing, for example, those concerning orthographic processing. The next section
sets out a more specific examination of a psycholinguistic model of speech and
language processing in adulthood, namely the linguistic processing model based on the
logogen model (Patterson & Shewell, 1987). This model should introduce factors which
are not covered by the psycholinguistic model, but are necessary to be considered in
assessment of persistent speech difficulties in adults.
1.4.1 The linguistic processing model based on the logogen model
One model that is very commonly used for research and assessment in the area of
neuropsychology is the linguistic processing model for adults, or logogen model (e.g.
Ellis & Young, 2013; Levelt, 1999; Patterson & Shewell, 1987). This model can account
for breakdowns in speech and language processing including orthographic processing
while clearly distinguishing between sub-lexical and lexical functions. It is based on an
edited version of the logogen model (Morton, 1979), which is a model first developed
Chapter 1: Psycholinguistics
54
for speech and language processing in healthy adult subjects that originally described
the levels/units which are accessed and activated during single word reading (Morton,
1970, 1979). In subsequent modifications of the model, reading, writing, speaking, and
listening processes were investigated in impaired populations and added as
units/levels of speech processing (Ellis, 2016; Morton, 1980; Newcombe & Marshall,
1980; Patterson, 1988). The current version of the model characterises relatively
independent linguistic sub-systems which are responsible for processing different
linguistic demands such as identification, segmentation and manipulation of
phonological units (Coltheart, 2013; Coltheart, Sartori, & Job, 1987). Furthermore, all
existing versions of the model share as their basis the principle that the literacy system
can be assessed separately to the verbal speech system. This fact supports the
application of the model to adult speech processing, as speech and literacy systems are
most likely fully-developed at this age. Most versions of the logogen model also
differentiate between receptive input systems and expressive output systems.
Different researchers discuss different components of the model modified to their
related research area (e.g. Caramazza & Hillis, 1990; Caramazza et al., 1988; Coltheart,
Masterson, Byng, Prior, & Riddoch, 1983; McCarthy & Warrington, 1986; Shallice,
1987). For example, research in the area of acquired dyslexia mainly focuses on
breaking down components involved in grapheme-phoneme conversion, while
research into language deficits, for example in aphasia, may focus on the semantic and
cognitive skills components. The common goal of these researchers is to identify
damage within brain injured populations and to investigate the possible locus and
nature of breakdowns within the language and speech processing system. Further
development of the logogen model was facilitated by empirical research in the area of
acquired dyslexia (Coltheart et al., 2001). The version of the linguistic processing model
currently explicitly used for reading and writing impairments is the dual-route cascaded
model which also facilitates computational analysis of reading and writing (Besner &
Roberts, 2003; Coltheart et al., 2001). Nevertheless, for the purpose of this doctoral
study, Patterson and Shewell’s model was chosen since its purpose is to capture the
complete linguistic processing system at the single word level, including spoken
language, whereas the former-mentioned model involves only written language
(Coltheart, 2013; Coltheart et al., 2001). While the Stackhouse and Wells (1997) model
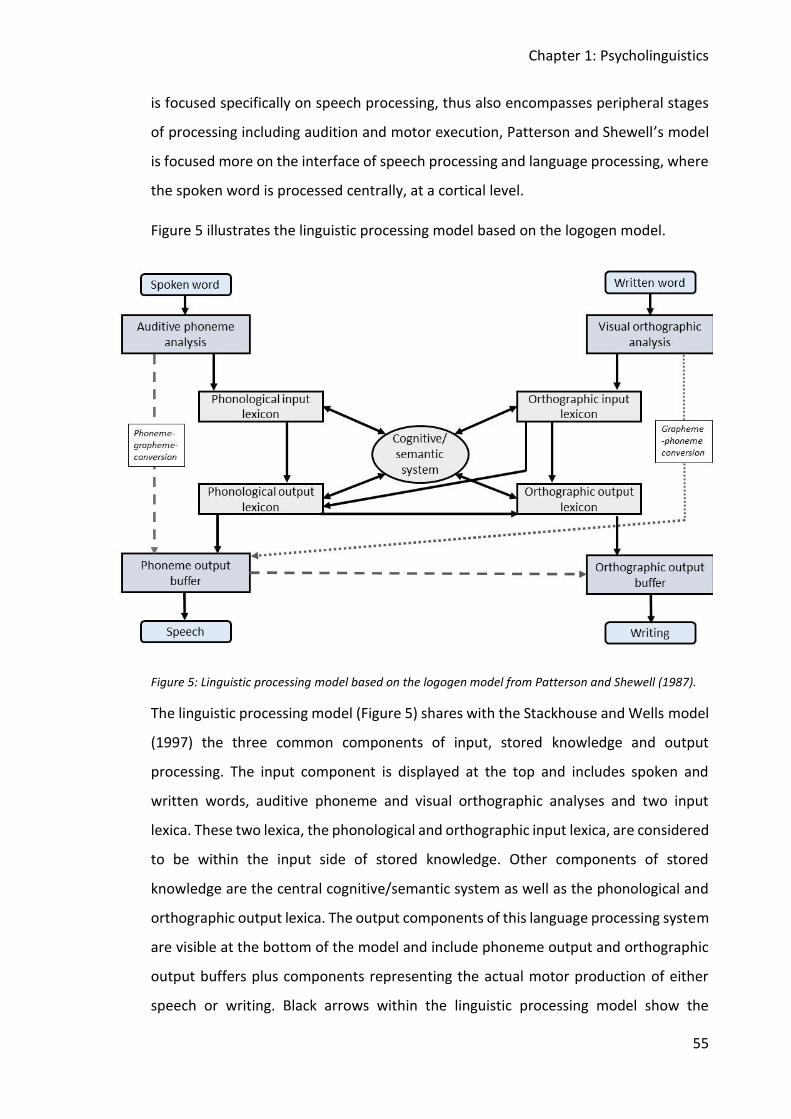
Chapter 1: Psycholinguistics
55
is focused specifically on speech processing, thus also encompasses peripheral stages
of processing including audition and motor execution, Patterson and Shewell’s model
is focused more on the interface of speech processing and language processing, where
the spoken word is processed centrally, at a cortical level.
Figure 5 illustrates the linguistic processing model based on the logogen model.
Figure 5: Linguistic processing model based on the logogen model from Patterson and Shewell (1987).
The linguistic processing model (Figure 5) shares with the Stackhouse and Wells model
(1997) the three common components of input, stored knowledge and output
processing. The input component is displayed at the top and includes spoken and
written words, auditive phoneme and visual orthographic analyses and two input
lexica. These two lexica, the phonological and orthographic input lexica, are considered
to be within the input side of stored knowledge. Other components of stored
knowledge are the central cognitive/semantic system as well as the phonological and
orthographic output lexica. The output components of this language processing system
are visible at the bottom of the model and include phoneme output and orthographic
output buffers plus components representing the actual motor production of either
speech or writing. Black arrows within the linguistic processing model show the
Chapter 1: Psycholinguistics
56
available routes and directions of processing, for example, direct inputs from the
orthographic input lexicon to the orthographic output lexicon. Additionally, two
dashed lines are included which are labelled as phoneme-grapheme-conversion and
grapheme-phoneme-conversion. These routes are used in the processing of unfamiliar
language (Morton, 1979). Hence, if an unfamiliar auditorily-presented word needed to
be produced by the listener in a written form, phoneme-grapheme-conversion would
be accessed, whereas grapheme-phoneme-conversion would be used reading
unfamiliar words (Coltheart et al., 2001). In alphabetic languages, reading and spelling
is dependent on working conversions between graphemes and phonemes (Frith, 1985),
especially in the early stages of learning to read (Stackhouse & Wells, 1997).
Looking back to the psycholinguistic model (Stackhouse & Wells, 1997) and its
components, while levels of processing are parsed in slightly different ways, with
different labels, many parallels can be seen between the two models. If considering the
spoken word to speech route (left side of model in Figure 5) including the auditive
phoneme analysis, the phonological input lexicon, the cognitive/semantic system, the
phonological output lexicon, and the phoneme output buffer, this side of the Patterson
and Shewell model maps conceptually to the input, stored knowledge and output
processing levels of Stackhouse and Wells’ speech processing model. However, the
three input levels provided in the psycholinguistic model are not fully captured within
the linguistic processing model, as only one input level is present, namely the auditive
phoneme analysis. Hypothetically, the auditive phoneme analysis is best matched to
the phonological recognition stage of the Stackhouse and Wells model, as it is
described as the level of discrimination of familiar and unfamiliar speech (De Bleser et
al., 1997). Additionally, the two distinct output levels of the Stackhouse and Wells
model are not specifically presented within the Patterson and Shewell model. Instead,
the phoneme output buffer is presented and this can be linked to the motor planning
stage of the model, given its task of producing planned speech (De Bleser et al., 1997).
The stored knowledge components of the Stackhouse and Wells model are
encompassed by three components within the linguistic processing model:
phonological input lexicon could be seen as equivalent to phonological representations
and the phonological output lexicon might have the same role as the motor program.
Chapter 1: Psycholinguistics
57
In fact, the phonological input lexicon can be described as long-term storage for
familiar words, by which analysed auditory phoneme chains can be identified. On the
other hand, the phonological output lexicon is activated in production of speech.
Hence, the phonologically stored information is represented using both input and
output lexica. Both models include a semantic system within the stored knowledge. In
addition, and importantly, in both models, information can pass from input to output
processing without accessing the cognitive/semantic system. The different number of
levels related to input and output processing for each model might be due to the
distinct development of the two individual models while being utilised for research and
assessment in different targeted populations. Nevertheless, the basic speech
processing system components and the idea of speech processing as a continuum is
supported and apparent in both models.
The following section will explain in detail the components of the linguistic processing
model that provide additional information to that provided by the Stackhouse and
Wells (1997) model, including the input levels (visual orthographic analysis), stored
knowledge components (orthographic input and output lexica) and the output levels
(orthographic output buffer). Furthermore, the functions and characteristics of the
different levels and the connections between them will be elaborated. Figures 6, 7 and
8 depict input processes, stored knowledge, and output processes respectively and
include all relevant components, but the descriptions that follow will mainly focus on
the ‘new’ processing routes: from the written word (input) to writing (output).
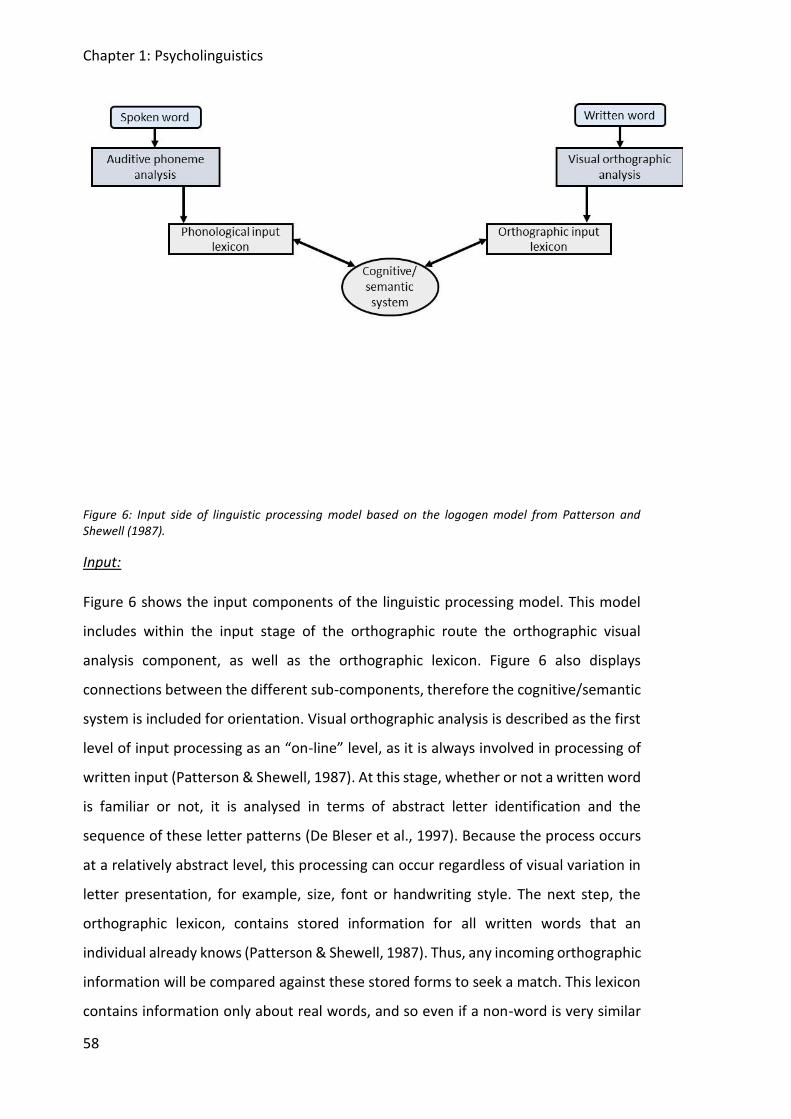
Chapter 1: Psycholinguistics
58
Figure 6: Input side of linguistic processing model based on the logogen model from Patterson and Shewell (1987).
Input:
Figure 6 shows the input components of the linguistic processing model. This model
includes within the input stage of the orthographic route the orthographic visual
analysis component, as well as the orthographic lexicon. Figure 6 also displays
connections between the different sub-components, therefore the cognitive/semantic
system is included for orientation. Visual orthographic analysis is described as the first
level of input processing as an “on-line” level, as it is always involved in processing of
written input (Patterson & Shewell, 1987). At this stage, whether or not a written word
is familiar or not, it is analysed in terms of abstract letter identification and the
sequence of these letter patterns (De Bleser et al., 1997). Because the process occurs
at a relatively abstract level, this processing can occur regardless of visual variation in
letter presentation, for example, size, font or handwriting style. The next step, the
orthographic lexicon, contains stored information for all written words that an
individual already knows (Patterson & Shewell, 1987). Thus, any incoming orthographic
information will be compared against these stored forms to seek a match. This lexicon
contains information only about real words, and so even if a non-word is very similar
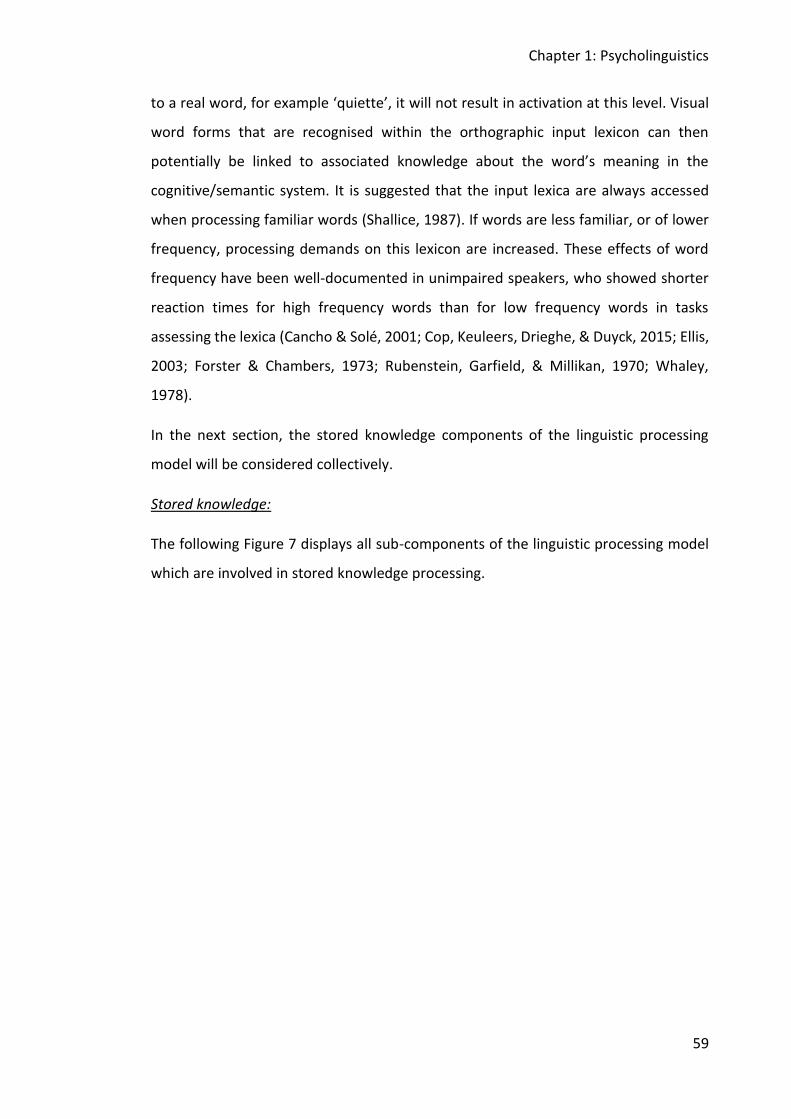
Chapter 1: Psycholinguistics
59
to a real word, for example ‘quiette’, it will not result in activation at this level. Visual
word forms that are recognised within the orthographic input lexicon can then
potentially be linked to associated knowledge about the word’s meaning in the
cognitive/semantic system. It is suggested that the input lexica are always accessed
when processing familiar words (Shallice, 1987). If words are less familiar, or of lower
frequency, processing demands on this lexicon are increased. These effects of word
frequency have been well-documented in unimpaired speakers, who showed shorter
reaction times for high frequency words than for low frequency words in tasks
assessing the lexica (Cancho & Solé, 2001; Cop, Keuleers, Drieghe, & Duyck, 2015; Ellis,
2003; Forster & Chambers, 1973; Rubenstein, Garfield, & Millikan, 1970; Whaley,
1978).
In the next section, the stored knowledge components of the linguistic processing
model will be considered collectively.
Stored knowledge:
The following Figure 7 displays all sub-components of the linguistic processing model
which are involved in stored knowledge processing.
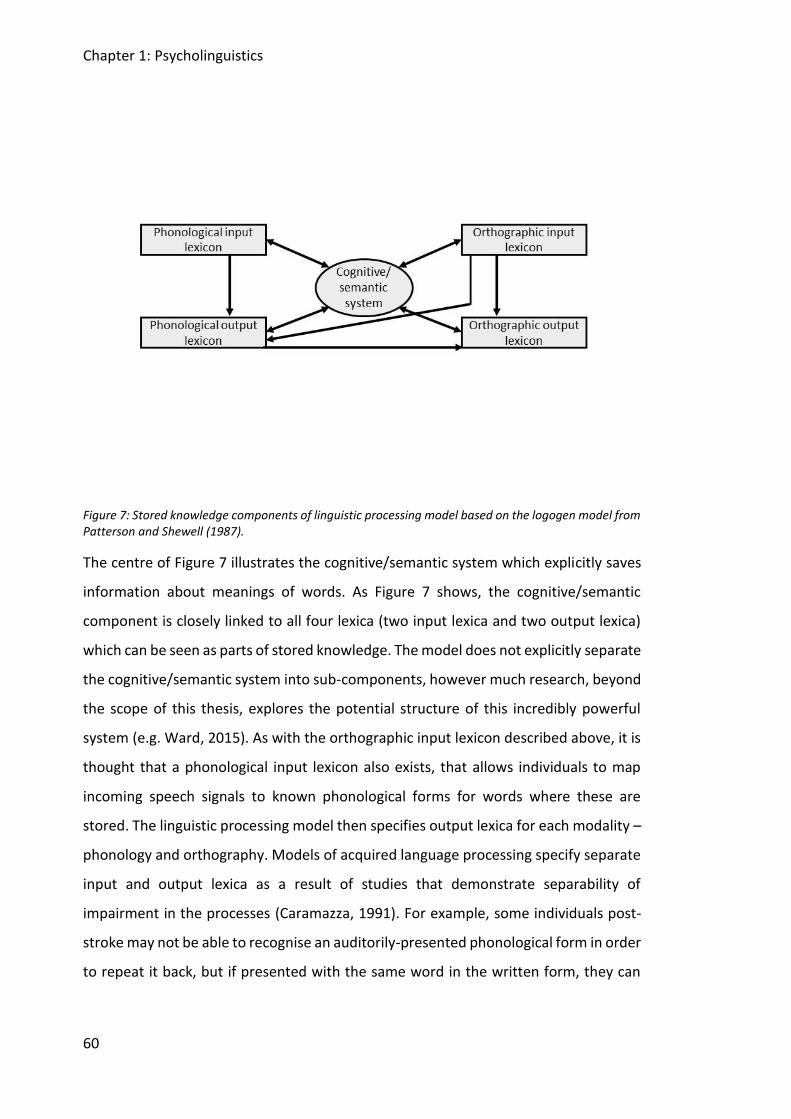
Chapter 1: Psycholinguistics
60
Figure 7: Stored knowledge components of linguistic processing model based on the logogen model from Patterson and Shewell (1987).
The centre of Figure 7 illustrates the cognitive/semantic system which explicitly saves
information about meanings of words. As Figure 7 shows, the cognitive/semantic
component is closely linked to all four lexica (two input lexica and two output lexica)
which can be seen as parts of stored knowledge. The model does not explicitly separate
the cognitive/semantic system into sub-components, however much research, beyond
the scope of this thesis, explores the potential structure of this incredibly powerful
system (e.g. Ward, 2015). As with the orthographic input lexicon described above, it is
thought that a phonological input lexicon also exists, that allows individuals to map
incoming speech signals to known phonological forms for words where these are
stored. The linguistic processing model then specifies output lexica for each modality –
phonology and orthography. Models of acquired language processing specify separate
input and output lexica as a result of studies that demonstrate separability of
impairment in the processes (Caramazza, 1991). For example, some individuals post-
stroke may not be able to recognise an auditorily-presented phonological form in order
to repeat it back, but if presented with the same word in the written form, they can
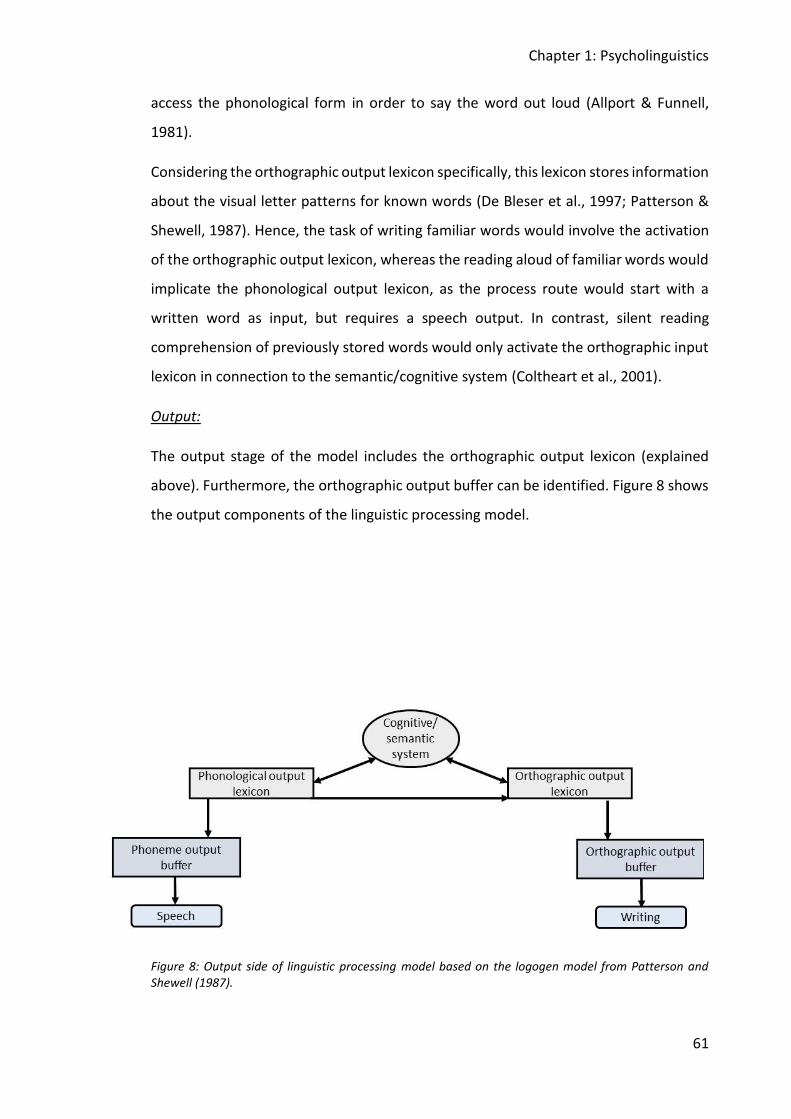
Chapter 1: Psycholinguistics
61
access the phonological form in order to say the word out loud (Allport & Funnell,
1981).
Considering the orthographic output lexicon specifically, this lexicon stores information
about the visual letter patterns for known words (De Bleser et al., 1997; Patterson &
Shewell, 1987). Hence, the task of writing familiar words would involve the activation
of the orthographic output lexicon, whereas the reading aloud of familiar words would
implicate the phonological output lexicon, as the process route would start with a
written word as input, but requires a speech output. In contrast, silent reading
comprehension of previously stored words would only activate the orthographic input
lexicon in connection to the semantic/cognitive system (Coltheart et al., 2001).
Output:
The output stage of the model includes the orthographic output lexicon (explained
above). Furthermore, the orthographic output buffer can be identified. Figure 8 shows
the output components of the linguistic processing model.
Figure 8: Output side of linguistic processing model based on the logogen model from Patterson and Shewell (1987).
Chapter 1: Psycholinguistics
62
The not yet described sub-sections of the model include the orthographic output
buffer. This buffer is used as short-term memory storage for subsequent processing
(De Bleser et al., 1997). It contains linear sequences of the words which should be
produced in writing. Once a written form has been selected from the orthographic
output lexicon it may take a few seconds for the word to be written, and so this buffer
represents the storage capacity needed to keep the lexical item activated until all the
information needed has been retrieved. A parallel phoneme output buffer is specified
in the model for the process of converting a phonological form from the phonological
output lexicon into overt speech.
The previous paragraphs explained the basic linguistic processing model of Patterson
and Shewell (1987) and its components in detail with the purpose of exploring speech
and language processing in adulthood. The next section focuses on the use of the
model in clinical assessment.
1.4.2 Clinical assessment using the linguistic processing model
Overall, the linguistic processing model allows for the investigation of speech and
language processing at different levels and provides a chance to identify the locus of
breakdown in speech or writing. Furthermore, outcomes of assessments informed by
the model can be used by practitioners and clinicians for intervention planning and
execution (Shallice, 1987), similarly to the use of the psycholinguistic framework.
Indeed, the linguistic processing model has successfully been used for assessment
procedures in areas of aphasia. As briefly mentioned above, different tools exist for
aphasic patients which facilitate assessment based on the linguistic processing model
(e.g. ‘PALPA’- Psycholinguistic Assessments of Language Processing in Aphasia (Kay et
al., 2009); ‘LeMo’- Lexikon modellorientiert (lexicon orientated model) (De Bleser et
al., 1997)). For aphasia diagnosis such tools facilitate single case investigations of
normal processing skills versus syndrome-orientated approaches (De Bleser et al.,
1997). It is possible to identify unimodal impairments when assessing persons with
aphasia within the model (Caramazza & McCloskey, 1988; Ellis, 1987). The assessment
includes investigations comparing receptive skills and production skills. For example,
word stores can be assessed by oral naming of pictures. This task would include the
Chapter 1: Psycholinguistics
63
visual analysis, as well as the semantic system and phonological output lexicon and
buffer. Another example of a task is lexical decision, which primarily taps input
processing. A person is required to judge whether a stimulus form (presented auditorily
or visually) is a real word or a non-word (e.g. /sɪt/ = real word; or /jut/ (non-word).
Within dyslexia research, the linguistic processing model has also been successfully
used to describe acquired dyslexia. It was first used by Newcombe and Marshall (1985)
who defined three different kinds of acquired dyslexia, namely visual, surface and deep
dyslexia. These impairments were then further investigated and classified by empirical
data (Coltheart, Patterson, & Marshall, 1980; Patterson, Marshall, & Coltheart, 1985).
Impaired spelling has also been investigated using the linguistic processing model
(Beauvois & Dérouesné, 1981; Patterson, 1988). Overall, the application of this model
to processing of reading and spelling has facilitated insight into symptoms of dyslexia
by clearly separating different process routes.
The literature reviewed above has shown that the linguistic processing model
complements the psycholinguistic model when developing a theoretically based
assessment tool for adults with persistent developmental speech difficulties. The
following section highlights the suitability of both models, combined, as the theoretical
basis.
1.5 Combined suitability of psycholinguistic model and
linguistic processing model for speech processing
assessment design
To recap: assessment grounded in the psycholinguistic model can provide a holistic
picture of an individual’s speech processing system (Stackhouse & Wells, 1997). It
compares input versus output performances and allows the investigator to test
different levels within the speech processing system. It can help to identify strengths
and weaknesses within the system, and help to modify weaknesses by compensating
with strengths (Altmann, 2002; Stackhouse & Wells, 2001).
Processing of speech within the model is organised in a hierarchical way and the model
provides the opportunity to investigate levels of processing in a fine-grained manner,
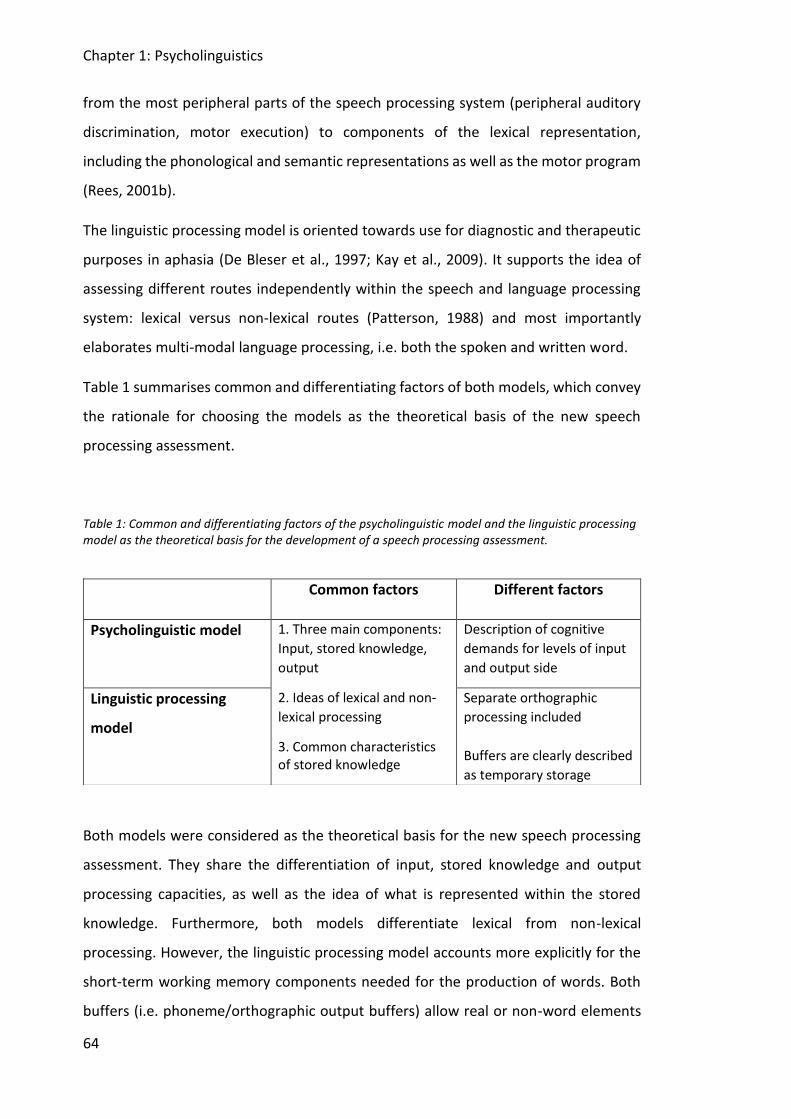
Chapter 1: Psycholinguistics
64
from the most peripheral parts of the speech processing system (peripheral auditory
discrimination, motor execution) to components of the lexical representation,
including the phonological and semantic representations as well as the motor program
(Rees, 2001b).
The linguistic processing model is oriented towards use for diagnostic and therapeutic
purposes in aphasia (De Bleser et al., 1997; Kay et al., 2009). It supports the idea of
assessing different routes independently within the speech and language processing
system: lexical versus non-lexical routes (Patterson, 1988) and most importantly
elaborates multi-modal language processing, i.e. both the spoken and written word.
Table 1 summarises common and differentiating factors of both models, which convey
the rationale for choosing the models as the theoretical basis of the new speech
processing assessment.
Table 1: Common and differentiating factors of the psycholinguistic model and the linguistic processing model as the theoretical basis for the development of a speech processing assessment.
Both models were considered as the theoretical basis for the new speech processing
assessment. They share the differentiation of input, stored knowledge and output
processing capacities, as well as the idea of what is represented within the stored
knowledge. Furthermore, both models differentiate lexical from non-lexical
processing. However, the linguistic processing model accounts more explicitly for the
short-term working memory components needed for the production of words. Both
buffers (i.e. phoneme/orthographic output buffers) allow real or non-word elements
Common factors Different factors
Psycholinguistic model 1. Three main components:
Input, stored knowledge,
output
2. Ideas of lexical and non-
lexical processing
3. Common characteristics of stored knowledge
Description of cognitive
demands for levels of input
and output side
Linguistic processing
model
Separate orthographic
processing included
Buffers are clearly described
as temporary storage
Chapter 1: Psycholinguistics
65
to be temporarily held and assembled before spoken/written word production (Kay et
al., 1992). In contrast, the Stackhouse & Wells model describes in more detail the
transition from an abstract motor program to an actual word production,
differentiating motor planning and motor execution (Constable et al., 1997; Nathan,
2001; Stackhouse and Wells, 1997).
One thing that is not explicitly specified in either model, although it is addressed by
some assessment frameworks, is that the integrity of processing at any of the levels is
not necessarily “all or none”. For example, an individual may show intact motor
planning skills on shorter utterances or more familiar words. Equally, motor planning
problems may be more severe in certain environments, for example, a conversation in
a noisy public space with someone who is not very familiar. Thus, environmental
factors, as well as the individual’s cognitive and linguistic resources more broadly, may
influence the integrity of a more specific speech processing level. In considering the
design of a new speech assessment it was thus deemed very important to factor
different levels of linguistic complexity into task design, for example, varying stimulus
lengths and levels of phonological complexity. This is particularly important for a
speech assessment that aims to detect speech processing difficulties in individuals
where a) their speech difficulties may manifest in more subtle ways and b) they present
with a persistent stammer, a speech difficulty known to be sensitive to wider capacities
and demands. The latter is a topic that will be explored in more depth in the next
chapter.
1.6 Chapter summary
This chapter addressed the topics of psycholinguistics, speech processing and
psycholinguistic-based speech processing system assessment, including the meanings
of the terms, explanations of principles, contexts and connections between the areas,
within a review of the existing literature. Key points were as follows:
• Psycholinguistics, the psychological study of language, is used in many
disciplinary areas; in the area of speech and language therapy it is utilised to
develop models of assessment and intervention.

Chapter 1: Psycholinguistics
66
• Psycholinguistic approaches to assessment complement linguistic analysis by
helping to identify underlying processing difficulties which may account for
patterns of more overtly observed speech behaviour.
• Speech processing is the term used within psycholinguistics to describe the
three domains needed for successful speech, namely input processing, stored
knowledge, and output processing.
• Speech difficulties can arise from problems across one or more of these
domains. Psycholinguistic assessment offers a potentially powerful tool to
characterise such a complex and heterogeneous set of difficulties.
• Two psycholinguistic models have been successfully applied to the clinical
assessment of children’s speech and adults with aphasia respectively, the
psycholinguistic model of Stackhouse and Wells (1997) and the linguistic
processing model of Patterson and Shewell (1987).
• No comprehensive psycholinguistic clinical assessment currently exists for
adults with hidden and persistent developmental speech difficulties: existing
assessments for adults are mainly based on clinically impaired speech for overt
acquired speech and language difficulties (e.g. ’PALPA’ for adults with aphasia
(Kay et al., 2009)), as well as other assessments for children which focus on
developmental stages. It seems that the sensitivity of those existing
assessments might fail to yield a comprehensive picture of the abilities/skills
missing or deficient in members of the population of interest defined above
(Nippold, 2007).
1.6.1 Main research objective
To conclude this Chapter 1 on psycholinguistic approaches, the main objective of the
thesis is re-stated: to develop a new psycholinguistic-based speech processing
assessment tool for adults with speech processing difficulties, including more subtle
manifestations. The design of the speech processing assessment should draw on the
combined elements of the psycholinguistic model and the linguistic processing model.
Moreover, the design of the assessment tool should target psychometric properties
and therefore facilitate objective testing of speech processing skills in adults so that

Chapter 1: Psycholinguistics
67
unbiased comparisons of outcomes can be made. For that, the assessment also needs
to be reliable – guaranteeing that outcomes of the assessment are accurate and
reproducible. Finally, tasks and stimuli of the new tool should be valid and test what
they claim to test, and so maximise the extent to which evidence and theory can
support interpretations of assessment outcomes. These issues of objectivity, reliability
and validity will be framed precisely in Chapter 3 (research questions).
The next chapter will review what is currently known about stammering, and consider
the utility of a psycholinguistic approach with this group.

Chapter 2: Stammering
69
2. Chapter 2: Stammering
Stammering (also known as dysfluency or stuttering) is considered a fluency disorder
(WHO: World Health Organization, 2010). The following sections will elaborate
different definitions of stammering and further describe characteristics and concerns
in relation to this speech difficulty in adults (targeted group of participants for case
studies in this doctoral investigation).
Recent definitions of stammering describe it as an aberration to normal speech marked
by higher percentages of normal dysfluent patterns (given that every speaker
experiences dysfluent patterns in speech at some time) (WHO, 2010). These dysfluent
patterns are hesitations, repetitions, and pauses, which are alternative expressions for
van Riper’s (1982) three classes of symptoms: blocks, repetitions, and prolongations.
Additionally, stammered speech is also characterised by secondary symptoms (e.g.
inserted sounds or movements), which are reflections of avoidance strategies
developed by an individual non-fluent speaker (Guitar, 2013).
In previous decades, stammering was classified in two different ways: as a
neuromuscular disorder or a neuropsychological impairment. Charles van Riper (1990)
presented stammering as a neuromuscular disorder where the dysfluent speech is
explained by a disruption to the timing of speech and its associated muscle
movements. More specifically, van Riper proposed that the programming of muscle
activity needed to produce speech appeared compromised, causing a breakdown in
the synchronous and sequential timing of speech articulation; this in turn could result
in instances of speech dysfluency including blocks, repetitions, and prolongations.
These situations were thought to occur involuntarily, but could sometimes be
predicted by the speakers.
At the same time, Perkins, Kent and Curlee (1991) described stammering as a
neuropsychological impairment, where the locus of difficulty is more in the speakers’
control of their own speech. According to this description, the loss of control is
predominantly influenced by internal and external psychological factors, such as the
pressure of giving an oral presentation in front of a big audience.
Chapter 2: Stammering
70
Research has also shown that genetic disposition plays a role in the aetiology of
stammering (Curlee, 2004; Yairi, Ambrose, & Cox, 1996). To date, the study designs
used to explore genetic factors in stammering have included investigation of family
histories, twin studies, research on adopted children who stammer, as well as
investigation of congenital factors that mediate the impact of childhood traumas
(Fagnani, Fibiger, Skytthe, & Hjelmborg, 2011; Felsenfeld et al., 2000; Guitar, 2013;
Kraft & Yairi, 2012; Ooki, 2005). If stammering occurs in an individual, most likely
someone in the closer or wider family will have also experienced stammering, unless
the stammering was precipitated by an environmental incident. However, not all cases
of stammering can be described by a genetic disposition and not every child born with
a genetic disposition goes on to manifest an overt stammer (Kang et al., 2010). Hence,
other factors and characteristics must influence the development of stammering to
some extent.
Indeed, people who stammer were and are considered to show different
developmental pathways in areas such as speech motor, cognitive, linguistic and
emotional behaviour from child age up to adulthood (e.g. Guitar, 2013; Jackson, Yaruss,
Quesal, Terranova, & Whalen, 2015; Peters, Hulstijn, & van Lieshout, 2000; Peters &
Starkweather, 1989; Ward, 2008; Yaruss & Quesal, 2006). Reasons for the persistence
of developmental stammering include external and internal factors, such as
consolidation/entrenchment of secondary behaviours as well as an individual’s ability
to meet the social demands of their particular environment. Research suggests that the
school-age period is particularly influential in the developmental course of an
individual’s stammering behaviours (Benecken & Spindler, 2004; Guitar & Conture,
2007; Hayhow, 1999), and this can be a time when the development of avoidance
strategies increases rapidly. Reaching adulthood, while for some adults avoidance
strategies and secondary behaviours can continue to draw attention to the person’s
dysfluent speech, for some individuals their avoidance and coping strategies can
become so established, and potentially successful, that their speech difficulties
become more ‘hidden’ (Craig & Tran, 2005; Crichton-Smith, 2002). As an example, an
individual who stammers may develop a speech flow more inclined by individual
Chapter 2: Stammering
71
patterns, for example, ‘uhm’ and ‘erm’ during speaking, which may sound just like
normal dysfluency.
Concluding, stammering can be generally characterised by unfolding patterns of
stammering behaviours, but the manifestation may look different, even within a single
individual, as they move from childhood to adulthood. Likewise, Guitar (2013)
describes that adults who have stammered since childhood often express a huge
influence of stammering on work, study, and social life. This influence might be so
prominent that the person who stammers declines job opportunities or avoids talking
in public situations (Craig & Tran, 2014; Yaruss & Quesal, 2004). Indeed, already Peters
and Starkweather (1989) pointed out that adults who stammer often describe a
negative impact on their work or even their career choice. Additionally, Craig and
Calver (1991) found that people who stammer are frequently employed in positions
below their potential.
Related to higher or further education of adults experiencing stammering, Klompas and
Ross (2004) discovered that stammering has an impact on adults’ performances within
an educational environment. Oral presentations, others’ lack of understanding of the
stammering speaker, reading aloud, and self-confidence were some of the key issues
reported via qualitative research. Blood, Ridenour Jr., Qualls and Hammer (2003) also
emphasise that contemporary educational settings require an increasing ability in
verbal communication skills due to assessment via oral presentation, as well as learning
via small group seminars and tutorials. They found that young adults who stammer, in
general, recounted significantly poorer self-perceived communicative competence
than their non-stammering counterparts (also found by Gunn et al., 2014; Iverach et
al., 2009).
In summary, current definitions of stammering largely describe surface behaviours,
while the causes and origins remain less well elucidated. Indeed, the intent in this thesis
was to fill this research lacuna by carrying out more comprehensive psycholinguistic
profiles of young adults with persistent developmental stammering.
The remainder of this chapter will elaborate the speech difficulty persistent
developmental stammering in greater detail and consider its psycholinguistic aspects.
Chapter 2: Stammering
72
First, stammering behaviours, namely underlying deficits and empirically
demonstrated factors, will be described in more depth. After that, current theories on
the causes of stammering will be explored. Finally, following on from the previous
chapter, the utility of considering these behaviours within a psycholinguistic model of
speech processing will also be explored.
2.1 Empirical research about stammering
Currently, two well-established areas that contribute to knowledge about stammering
are (i) the domains of sensory control and sensory-motor control, as well as (ii) the
influence of language factors on the development of stammering (Guitar, 2013). As
explained below, neuroscience studies have been a major source of insight in relation
to differences in brain structure and function of people who stammer compared to
those who do not stammer, especially in the area of neurophysiological differences,
namely sensory and sensory-motor control (e.g. Fox, 2003; Neumann et al., 2003;
Watkins, Smith, Davis, & Howell, 2008). In fact, structural brain differences have been
highlighted using magnetic resonance imaging in a great number of studies (Beal,
Gracco, Lafaille, & De Nil, 2007; Chang, Erickson, Ambrose, Hasegawa-Johnson, &
Ludlow, 2008; Chang, Zhu, Choo, & Angstadt, 2015; Civier, Kronfeld-Duenias, Amir,
Ezrati-Vinacour, & Ben-Shachar, 2015; Connally, Ward, Howell, & Watkins, 2014;
Cykowski et al., 2008; Foundas, Bollich, Corey, Hurley, & Heilman, 2001; Kell et al.,
2009; Kronfeld-Duenias, Amir, Ezrati-Vinacour, Civier, & Ben-Shachar, 2016; Neef,
Anwander, & Friederici, 2015; Watkins et al., 2008). Key findings describe a larger
planum temporale, one of the most important functional areas for language, as well as
asymmetry in the auditory cortex (Foundas et al., 2001). Furthermore, deviated
patterns of gyri in cerebral areas of language and speech processing were discovered
(Cykowski et al., 2008). Other studies, using electroencephalogram (EEG) testing
revealed that frontal and prefrontal areas for planning and execution of speech, and
auditory and sub-cortical areas of language are activated differently in people who
stammer (Braun et al., 1997; Brown, Ingham, Ingham, Laird, & Fox, 2005; De Nil & Kroll,
2001; De Nil, Kroll, Kapur, & Houle, 2000; De Nil, Kroll, Lafaille, & Houle, 2003; Fox et
al., 1996; Loucks, Kraft, Choo, Sharma, & Ambrose, 2011; Neumann et al., 2003, 2005;
Watkins et al., 2008). In fact, during speech production a greater activation of cerebral
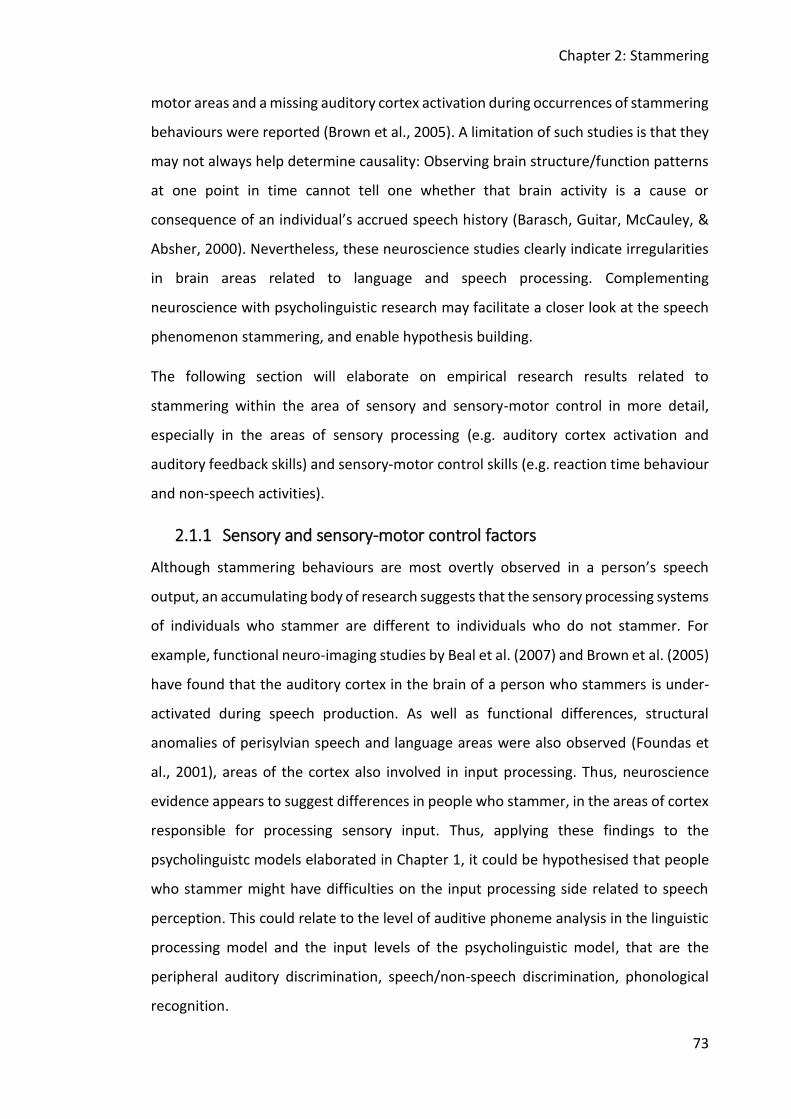
Chapter 2: Stammering
73
motor areas and a missing auditory cortex activation during occurrences of stammering
behaviours were reported (Brown et al., 2005). A limitation of such studies is that they
may not always help determine causality: Observing brain structure/function patterns
at one point in time cannot tell one whether that brain activity is a cause or
consequence of an individual’s accrued speech history (Barasch, Guitar, McCauley, &
Absher, 2000). Nevertheless, these neuroscience studies clearly indicate irregularities
in brain areas related to language and speech processing. Complementing
neuroscience with psycholinguistic research may facilitate a closer look at the speech
phenomenon stammering, and enable hypothesis building.
The following section will elaborate on empirical research results related to
stammering within the area of sensory and sensory-motor control in more detail,
especially in the areas of sensory processing (e.g. auditory cortex activation and
auditory feedback skills) and sensory-motor control skills (e.g. reaction time behaviour
and non-speech activities).
2.1.1 Sensory and sensory-motor control factors
Although stammering behaviours are most overtly observed in a person’s speech
output, an accumulating body of research suggests that the sensory processing systems
of individuals who stammer are different to individuals who do not stammer. For
example, functional neuro-imaging studies by Beal et al. (2007) and Brown et al. (2005)
have found that the auditory cortex in the brain of a person who stammers is under-
activated during speech production. As well as functional differences, structural
anomalies of perisylvian speech and language areas were also observed (Foundas et
al., 2001), areas of the cortex also involved in input processing. Thus, neuroscience
evidence appears to suggest differences in people who stammer, in the areas of cortex
responsible for processing sensory input. Thus, applying these findings to the
psycholinguistc models elaborated in Chapter 1, it could be hypothesised that people
who stammer might have difficulties on the input processing side related to speech
perception. This could relate to the level of auditive phoneme analysis in the linguistic
processing model and the input levels of the psycholinguistic model, that are the
peripheral auditory discrimination, speech/non-speech discrimination, phonological
recognition.
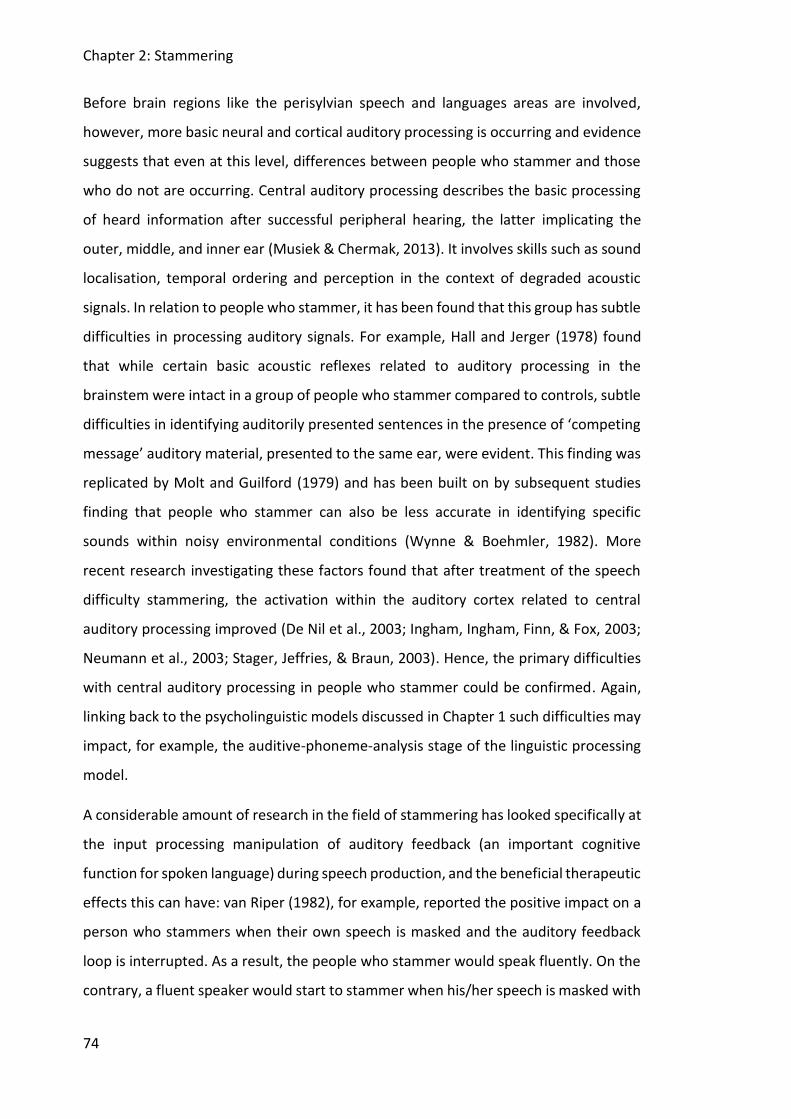
Chapter 2: Stammering
74
Before brain regions like the perisylvian speech and languages areas are involved,
however, more basic neural and cortical auditory processing is occurring and evidence
suggests that even at this level, differences between people who stammer and those
who do not are occurring. Central auditory processing describes the basic processing
of heard information after successful peripheral hearing, the latter implicating the
outer, middle, and inner ear (Musiek & Chermak, 2013). It involves skills such as sound
localisation, temporal ordering and perception in the context of degraded acoustic
signals. In relation to people who stammer, it has been found that this group has subtle
difficulties in processing auditory signals. For example, Hall and Jerger (1978) found
that while certain basic acoustic reflexes related to auditory processing in the
brainstem were intact in a group of people who stammer compared to controls, subtle
difficulties in identifying auditorily presented sentences in the presence of ‘competing
message’ auditory material, presented to the same ear, were evident. This finding was
replicated by Molt and Guilford (1979) and has been built on by subsequent studies
finding that people who stammer can also be less accurate in identifying specific
sounds within noisy environmental conditions (Wynne & Boehmler, 1982). More
recent research investigating these factors found that after treatment of the speech
difficulty stammering, the activation within the auditory cortex related to central
auditory processing improved (De Nil et al., 2003; Ingham, Ingham, Finn, & Fox, 2003;
Neumann et al., 2003; Stager, Jeffries, & Braun, 2003). Hence, the primary difficulties
with central auditory processing in people who stammer could be confirmed. Again,
linking back to the psycholinguistic models discussed in Chapter 1 such difficulties may
impact, for example, the auditive-phoneme-analysis stage of the linguistic processing
model.
A considerable amount of research in the field of stammering has looked specifically at
the input processing manipulation of auditory feedback (an important cognitive
function for spoken language) during speech production, and the beneficial therapeutic
effects this can have: van Riper (1982), for example, reported the positive impact on a
person who stammers when their own speech is masked and the auditory feedback
loop is interrupted. As a result, the people who stammer would speak fluently. On the
contrary, a fluent speaker would start to stammer when his/her speech is masked with
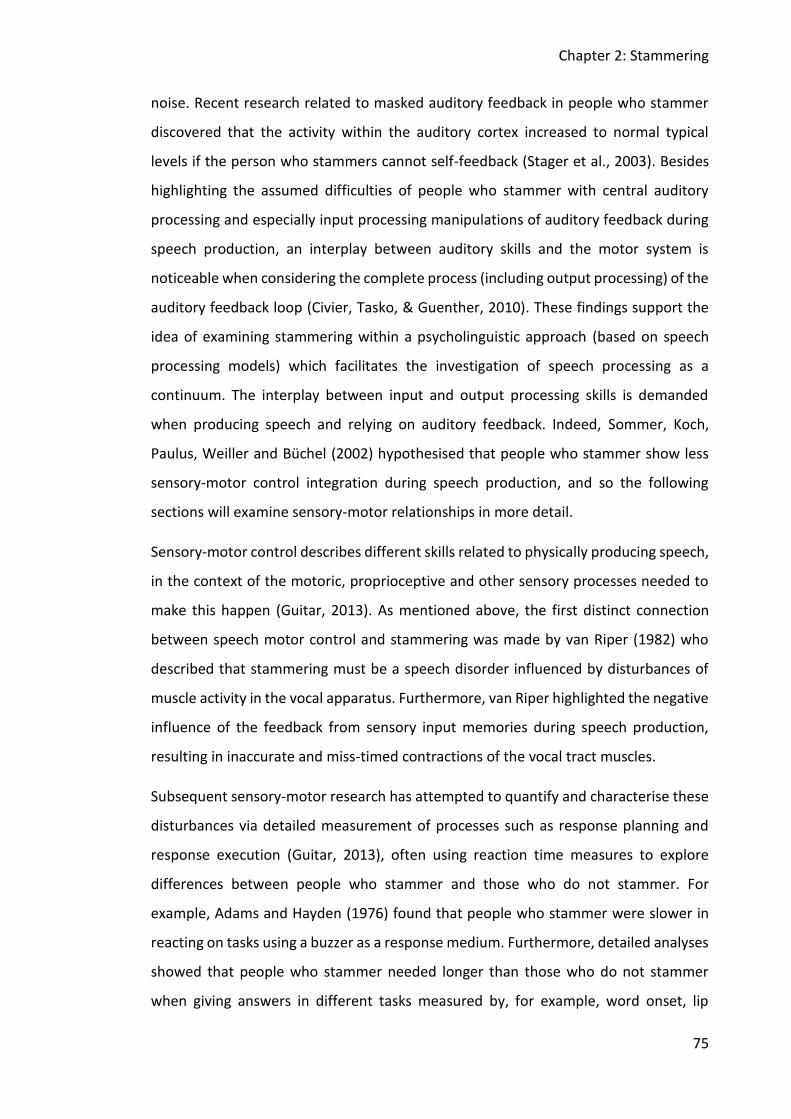
Chapter 2: Stammering
75
noise. Recent research related to masked auditory feedback in people who stammer
discovered that the activity within the auditory cortex increased to normal typical
levels if the person who stammers cannot self-feedback (Stager et al., 2003). Besides
highlighting the assumed difficulties of people who stammer with central auditory
processing and especially input processing manipulations of auditory feedback during
speech production, an interplay between auditory skills and the motor system is
noticeable when considering the complete process (including output processing) of the
auditory feedback loop (Civier, Tasko, & Guenther, 2010). These findings support the
idea of examining stammering within a psycholinguistic approach (based on speech
processing models) which facilitates the investigation of speech processing as a
continuum. The interplay between input and output processing skills is demanded
when producing speech and relying on auditory feedback. Indeed, Sommer, Koch,
Paulus, Weiller and Büchel (2002) hypothesised that people who stammer show less
sensory-motor control integration during speech production, and so the following
sections will examine sensory-motor relationships in more detail.
Sensory-motor control describes different skills related to physically producing speech,
in the context of the motoric, proprioceptive and other sensory processes needed to
make this happen (Guitar, 2013). As mentioned above, the first distinct connection
between speech motor control and stammering was made by van Riper (1982) who
described that stammering must be a speech disorder influenced by disturbances of
muscle activity in the vocal apparatus. Furthermore, van Riper highlighted the negative
influence of the feedback from sensory input memories during speech production,
resulting in inaccurate and miss-timed contractions of the vocal tract muscles.
Subsequent sensory-motor research has attempted to quantify and characterise these
disturbances via detailed measurement of processes such as response planning and
response execution (Guitar, 2013), often using reaction time measures to explore
differences between people who stammer and those who do not stammer. For
example, Adams and Hayden (1976) found that people who stammer were slower in
reacting on tasks using a buzzer as a response medium. Furthermore, detailed analyses
showed that people who stammer needed longer than those who do not stammer
when giving answers in different tasks measured by, for example, word onset, lip
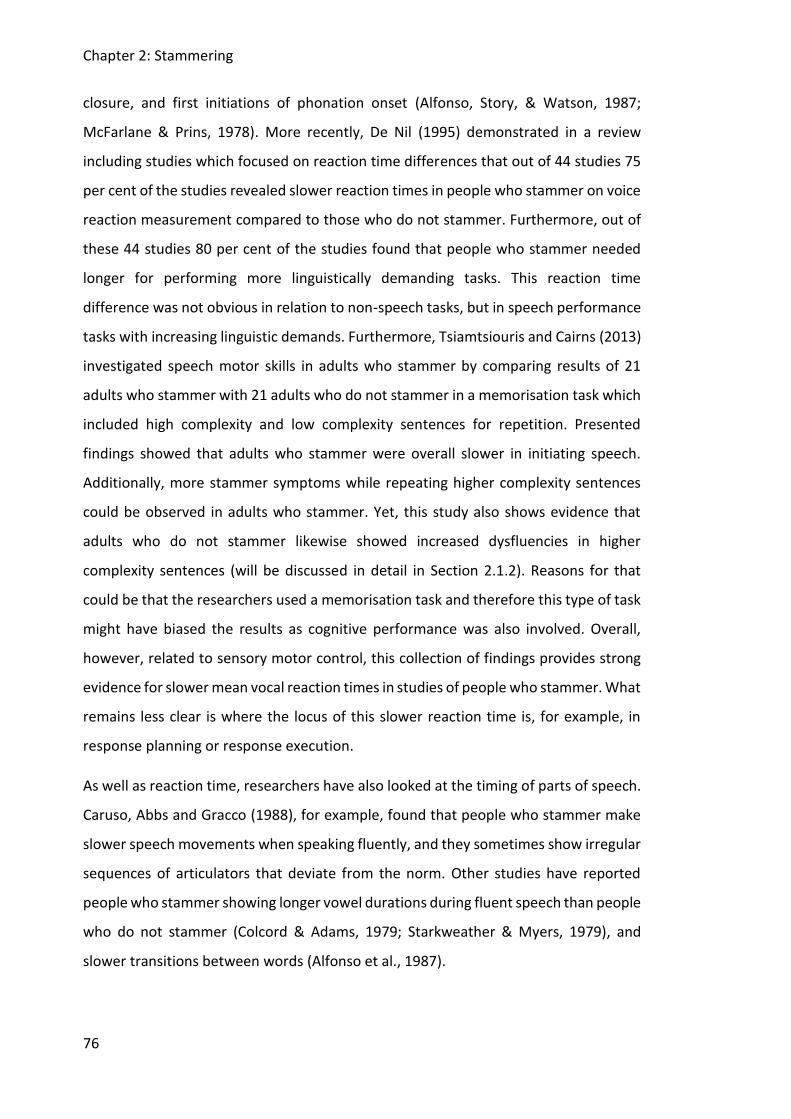
Chapter 2: Stammering
76
closure, and first initiations of phonation onset (Alfonso, Story, & Watson, 1987;
McFarlane & Prins, 1978). More recently, De Nil (1995) demonstrated in a review
including studies which focused on reaction time differences that out of 44 studies 75
per cent of the studies revealed slower reaction times in people who stammer on voice
reaction measurement compared to those who do not stammer. Furthermore, out of
these 44 studies 80 per cent of the studies found that people who stammer needed
longer for performing more linguistically demanding tasks. This reaction time
difference was not obvious in relation to non-speech tasks, but in speech performance
tasks with increasing linguistic demands. Furthermore, Tsiamtsiouris and Cairns (2013)
investigated speech motor skills in adults who stammer by comparing results of 21
adults who stammer with 21 adults who do not stammer in a memorisation task which
included high complexity and low complexity sentences for repetition. Presented
findings showed that adults who stammer were overall slower in initiating speech.
Additionally, more stammer symptoms while repeating higher complexity sentences
could be observed in adults who stammer. Yet, this study also shows evidence that
adults who do not stammer likewise showed increased dysfluencies in higher
complexity sentences (will be discussed in detail in Section 2.1.2). Reasons for that
could be that the researchers used a memorisation task and therefore this type of task
might have biased the results as cognitive performance was also involved. Overall,
however, related to sensory motor control, this collection of findings provides strong
evidence for slower mean vocal reaction times in studies of people who stammer. What
remains less clear is where the locus of this slower reaction time is, for example, in
response planning or response execution.
As well as reaction time, researchers have also looked at the timing of parts of speech.
Caruso, Abbs and Gracco (1988), for example, found that people who stammer make
slower speech movements when speaking fluently, and they sometimes show irregular
sequences of articulators that deviate from the norm. Other studies have reported
people who stammer showing longer vowel durations during fluent speech than people
who do not stammer (Colcord & Adams, 1979; Starkweather & Myers, 1979), and
slower transitions between words (Alfonso et al., 1987).
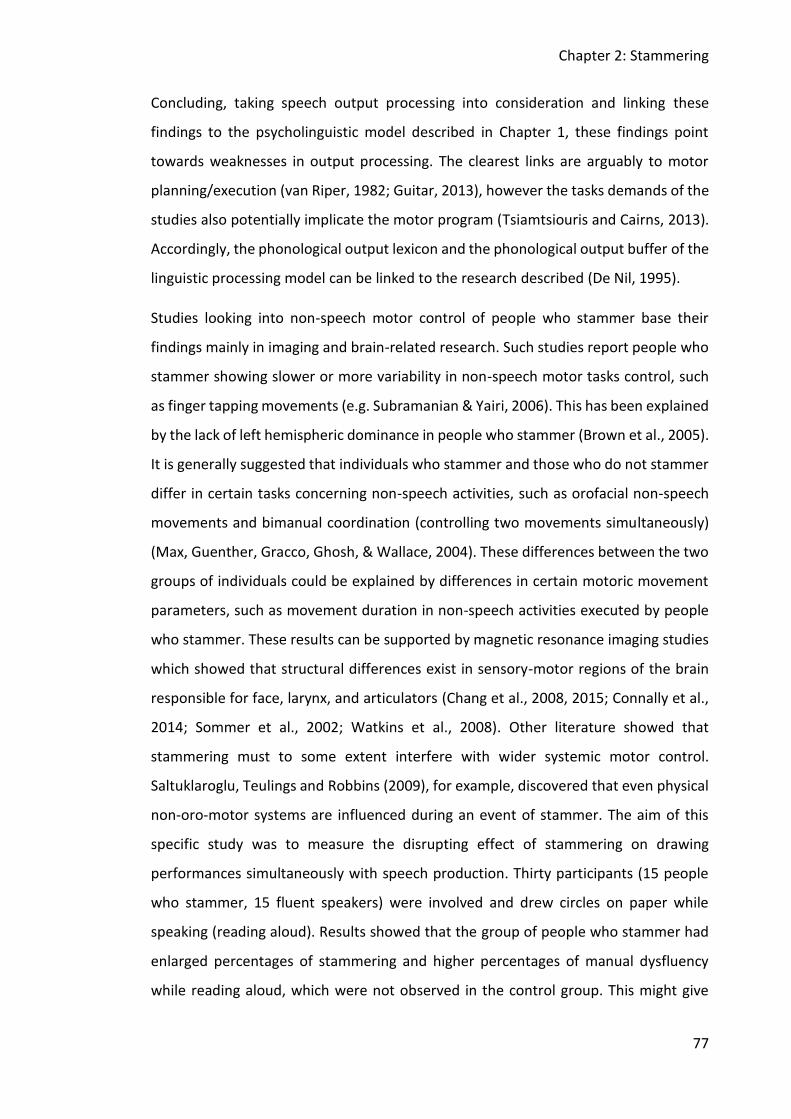
Chapter 2: Stammering
77
Concluding, taking speech output processing into consideration and linking these
findings to the psycholinguistic model described in Chapter 1, these findings point
towards weaknesses in output processing. The clearest links are arguably to motor
planning/execution (van Riper, 1982; Guitar, 2013), however the tasks demands of the
studies also potentially implicate the motor program (Tsiamtsiouris and Cairns, 2013).
Accordingly, the phonological output lexicon and the phonological output buffer of the
linguistic processing model can be linked to the research described (De Nil, 1995).
Studies looking into non-speech motor control of people who stammer base their
findings mainly in imaging and brain-related research. Such studies report people who
stammer showing slower or more variability in non-speech motor tasks control, such
as finger tapping movements (e.g. Subramanian & Yairi, 2006). This has been explained
by the lack of left hemispheric dominance in people who stammer (Brown et al., 2005).
It is generally suggested that individuals who stammer and those who do not stammer
differ in certain tasks concerning non-speech activities, such as orofacial non-speech
movements and bimanual coordination (controlling two movements simultaneously)
(Max, Guenther, Gracco, Ghosh, & Wallace, 2004). These differences between the two
groups of individuals could be explained by differences in certain motoric movement
parameters, such as movement duration in non-speech activities executed by people
who stammer. These results can be supported by magnetic resonance imaging studies
which showed that structural differences exist in sensory-motor regions of the brain
responsible for face, larynx, and articulators (Chang et al., 2008, 2015; Connally et al.,
2014; Sommer et al., 2002; Watkins et al., 2008). Other literature showed that
stammering must to some extent interfere with wider systemic motor control.
Saltuklaroglu, Teulings and Robbins (2009), for example, discovered that even physical
non-oro-motor systems are influenced during an event of stammer. The aim of this
specific study was to measure the disrupting effect of stammering on drawing
performances simultaneously with speech production. Thirty participants (15 people
who stammer, 15 fluent speakers) were involved and drew circles on paper while
speaking (reading aloud). Results showed that the group of people who stammer had
enlarged percentages of stammering and higher percentages of manual dysfluency
while reading aloud, which were not observed in the control group. This might give
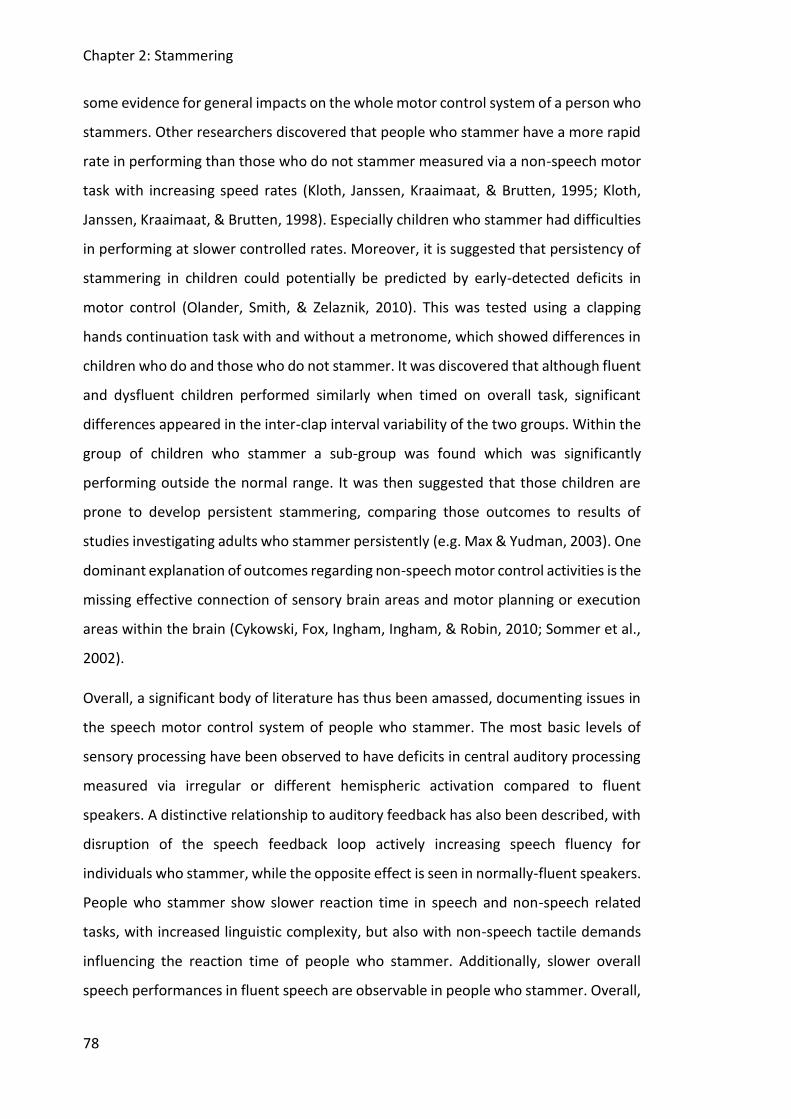
Chapter 2: Stammering
78
some evidence for general impacts on the whole motor control system of a person who
stammers. Other researchers discovered that people who stammer have a more rapid
rate in performing than those who do not stammer measured via a non-speech motor
task with increasing speed rates (Kloth, Janssen, Kraaimaat, & Brutten, 1995; Kloth,
Janssen, Kraaimaat, & Brutten, 1998). Especially children who stammer had difficulties
in performing at slower controlled rates. Moreover, it is suggested that persistency of
stammering in children could potentially be predicted by early-detected deficits in
motor control (Olander, Smith, & Zelaznik, 2010). This was tested using a clapping
hands continuation task with and without a metronome, which showed differences in
children who do and those who do not stammer. It was discovered that although fluent
and dysfluent children performed similarly when timed on overall task, significant
differences appeared in the inter-clap interval variability of the two groups. Within the
group of children who stammer a sub-group was found which was significantly
performing outside the normal range. It was then suggested that those children are
prone to develop persistent stammering, comparing those outcomes to results of
studies investigating adults who stammer persistently (e.g. Max & Yudman, 2003). One
dominant explanation of outcomes regarding non-speech motor control activities is the
missing effective connection of sensory brain areas and motor planning or execution
areas within the brain (Cykowski, Fox, Ingham, Ingham, & Robin, 2010; Sommer et al.,
2002).
Overall, a significant body of literature has thus been amassed, documenting issues in
the speech motor control system of people who stammer. The most basic levels of
sensory processing have been observed to have deficits in central auditory processing
measured via irregular or different hemispheric activation compared to fluent
speakers. A distinctive relationship to auditory feedback has also been described, with
disruption of the speech feedback loop actively increasing speech fluency for
individuals who stammer, while the opposite effect is seen in normally-fluent speakers.
People who stammer show slower reaction time in speech and non-speech related
tasks, with increased linguistic complexity, but also with non-speech tactile demands
influencing the reaction time of people who stammer. Additionally, slower overall
speech performances in fluent speech are observable in people who stammer. Overall,
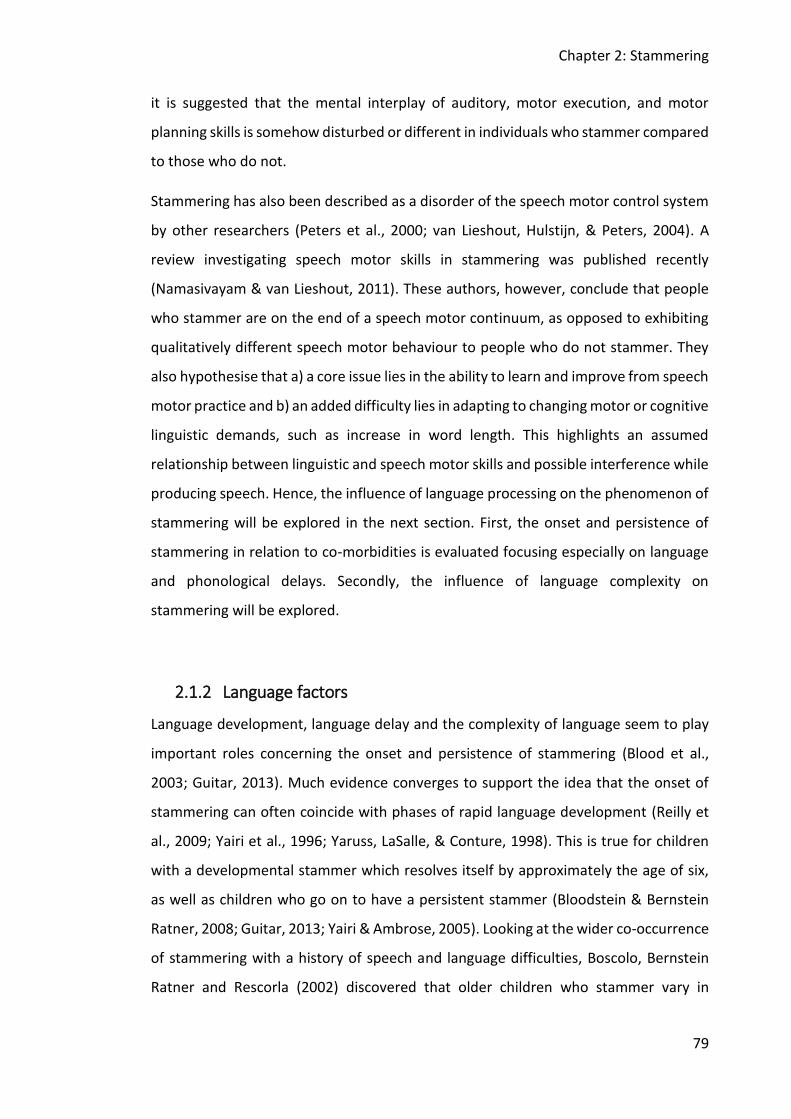
Chapter 2: Stammering
79
it is suggested that the mental interplay of auditory, motor execution, and motor
planning skills is somehow disturbed or different in individuals who stammer compared
to those who do not.
Stammering has also been described as a disorder of the speech motor control system
by other researchers (Peters et al., 2000; van Lieshout, Hulstijn, & Peters, 2004). A
review investigating speech motor skills in stammering was published recently
(Namasivayam & van Lieshout, 2011). These authors, however, conclude that people
who stammer are on the end of a speech motor continuum, as opposed to exhibiting
qualitatively different speech motor behaviour to people who do not stammer. They
also hypothesise that a) a core issue lies in the ability to learn and improve from speech
motor practice and b) an added difficulty lies in adapting to changing motor or cognitive
linguistic demands, such as increase in word length. This highlights an assumed
relationship between linguistic and speech motor skills and possible interference while
producing speech. Hence, the influence of language processing on the phenomenon of
stammering will be explored in the next section. First, the onset and persistence of
stammering in relation to co-morbidities is evaluated focusing especially on language
and phonological delays. Secondly, the influence of language complexity on
stammering will be explored.
2.1.2 Language factors
Language development, language delay and the complexity of language seem to play
important roles concerning the onset and persistence of stammering (Blood et al.,
2003; Guitar, 2013). Much evidence converges to support the idea that the onset of
stammering can often coincide with phases of rapid language development (Reilly et
al., 2009; Yairi et al., 1996; Yaruss, LaSalle, & Conture, 1998). This is true for children
with a developmental stammer which resolves itself by approximately the age of six,
as well as children who go on to have a persistent stammer (Bloodstein & Bernstein
Ratner, 2008; Guitar, 2013; Yairi & Ambrose, 2005). Looking at the wider co-occurrence
of stammering with a history of speech and language difficulties, Boscolo, Bernstein
Ratner and Rescorla (2002) discovered that older children who stammer vary in
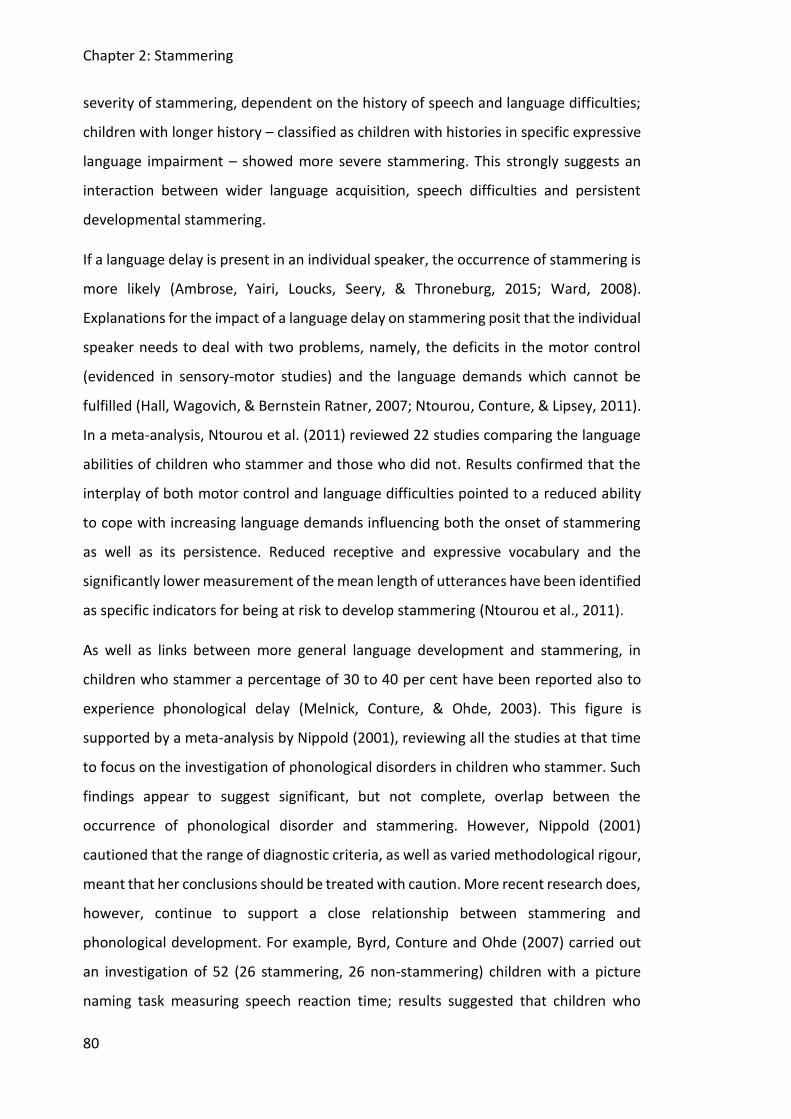
Chapter 2: Stammering
80
severity of stammering, dependent on the history of speech and language difficulties;
children with longer history – classified as children with histories in specific expressive
language impairment – showed more severe stammering. This strongly suggests an
interaction between wider language acquisition, speech difficulties and persistent
developmental stammering.
If a language delay is present in an individual speaker, the occurrence of stammering is
more likely (Ambrose, Yairi, Loucks, Seery, & Throneburg, 2015; Ward, 2008).
Explanations for the impact of a language delay on stammering posit that the individual
speaker needs to deal with two problems, namely, the deficits in the motor control
(evidenced in sensory-motor studies) and the language demands which cannot be
fulfilled (Hall, Wagovich, & Bernstein Ratner, 2007; Ntourou, Conture, & Lipsey, 2011).
In a meta-analysis, Ntourou et al. (2011) reviewed 22 studies comparing the language
abilities of children who stammer and those who did not. Results confirmed that the
interplay of both motor control and language difficulties pointed to a reduced ability
to cope with increasing language demands influencing both the onset of stammering
as well as its persistence. Reduced receptive and expressive vocabulary and the
significantly lower measurement of the mean length of utterances have been identified
as specific indicators for being at risk to develop stammering (Ntourou et al., 2011).
As well as links between more general language development and stammering, in
children who stammer a percentage of 30 to 40 per cent have been reported also to
experience phonological delay (Melnick, Conture, & Ohde, 2003). This figure is
supported by a meta-analysis by Nippold (2001), reviewing all the studies at that time
to focus on the investigation of phonological disorders in children who stammer. Such
findings appear to suggest significant, but not complete, overlap between the
occurrence of phonological disorder and stammering. However, Nippold (2001)
cautioned that the range of diagnostic criteria, as well as varied methodological rigour,
meant that her conclusions should be treated with caution. More recent research does,
however, continue to support a close relationship between stammering and
phonological development. For example, Byrd, Conture and Ohde (2007) carried out
an investigation of 52 (26 stammering, 26 non-stammering) children with a picture
naming task measuring speech reaction time; results suggested that children who
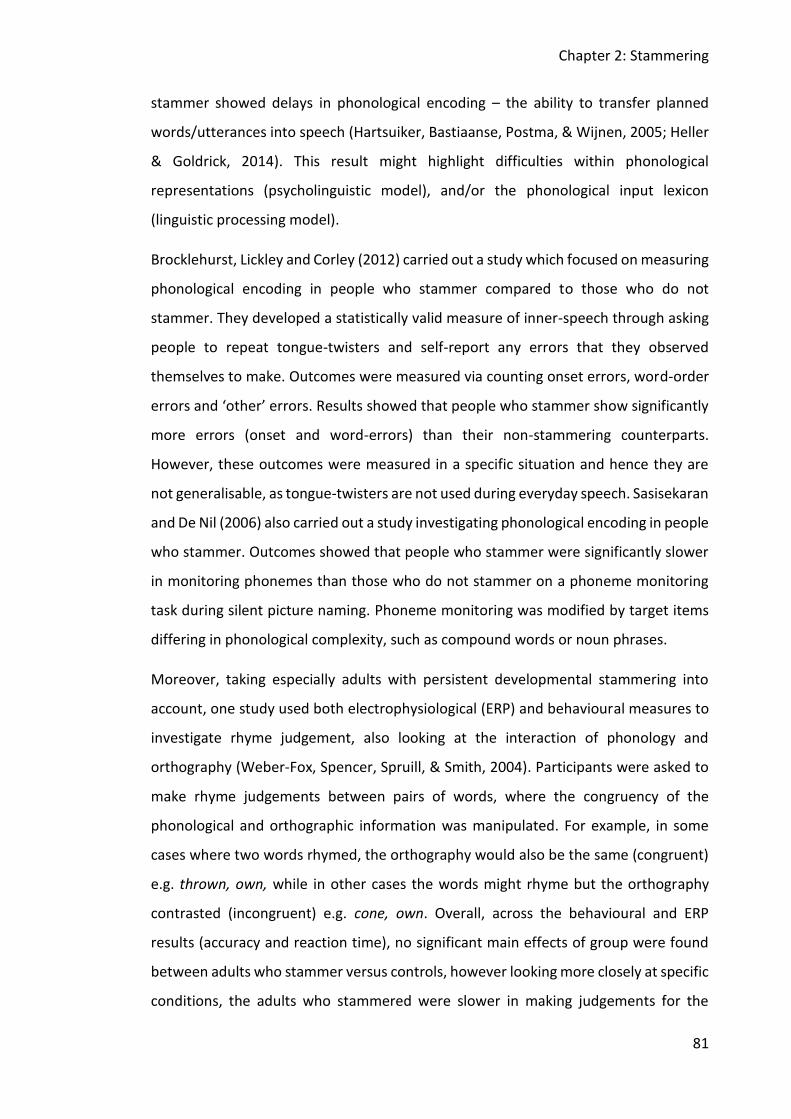
Chapter 2: Stammering
81
stammer showed delays in phonological encoding – the ability to transfer planned
words/utterances into speech (Hartsuiker, Bastiaanse, Postma, & Wijnen, 2005; Heller
& Goldrick, 2014). This result might highlight difficulties within phonological
representations (psycholinguistic model), and/or the phonological input lexicon
(linguistic processing model).
Brocklehurst, Lickley and Corley (2012) carried out a study which focused on measuring
phonological encoding in people who stammer compared to those who do not
stammer. They developed a statistically valid measure of inner-speech through asking
people to repeat tongue-twisters and self-report any errors that they observed
themselves to make. Outcomes were measured via counting onset errors, word-order
errors and ‘other’ errors. Results showed that people who stammer show significantly
more errors (onset and word-errors) than their non-stammering counterparts.
However, these outcomes were measured in a specific situation and hence they are
not generalisable, as tongue-twisters are not used during everyday speech. Sasisekaran
and De Nil (2006) also carried out a study investigating phonological encoding in people
who stammer. Outcomes showed that people who stammer were significantly slower
in monitoring phonemes than those who do not stammer on a phoneme monitoring
task during silent picture naming. Phoneme monitoring was modified by target items
differing in phonological complexity, such as compound words or noun phrases.
Moreover, taking especially adults with persistent developmental stammering into
account, one study used both electrophysiological (ERP) and behavioural measures to
investigate rhyme judgement, also looking at the interaction of phonology and
orthography (Weber-Fox, Spencer, Spruill, & Smith, 2004). Participants were asked to
make rhyme judgements between pairs of words, where the congruency of the
phonological and orthographic information was manipulated. For example, in some
cases where two words rhymed, the orthography would also be the same (congruent)
e.g. thrown, own, while in other cases the words might rhyme but the orthography
contrasted (incongruent) e.g. cone, own. Overall, across the behavioural and ERP
results (accuracy and reaction time), no significant main effects of group were found
between adults who stammer versus controls, however looking more closely at specific
conditions, the adults who stammered were slower in making judgements for the
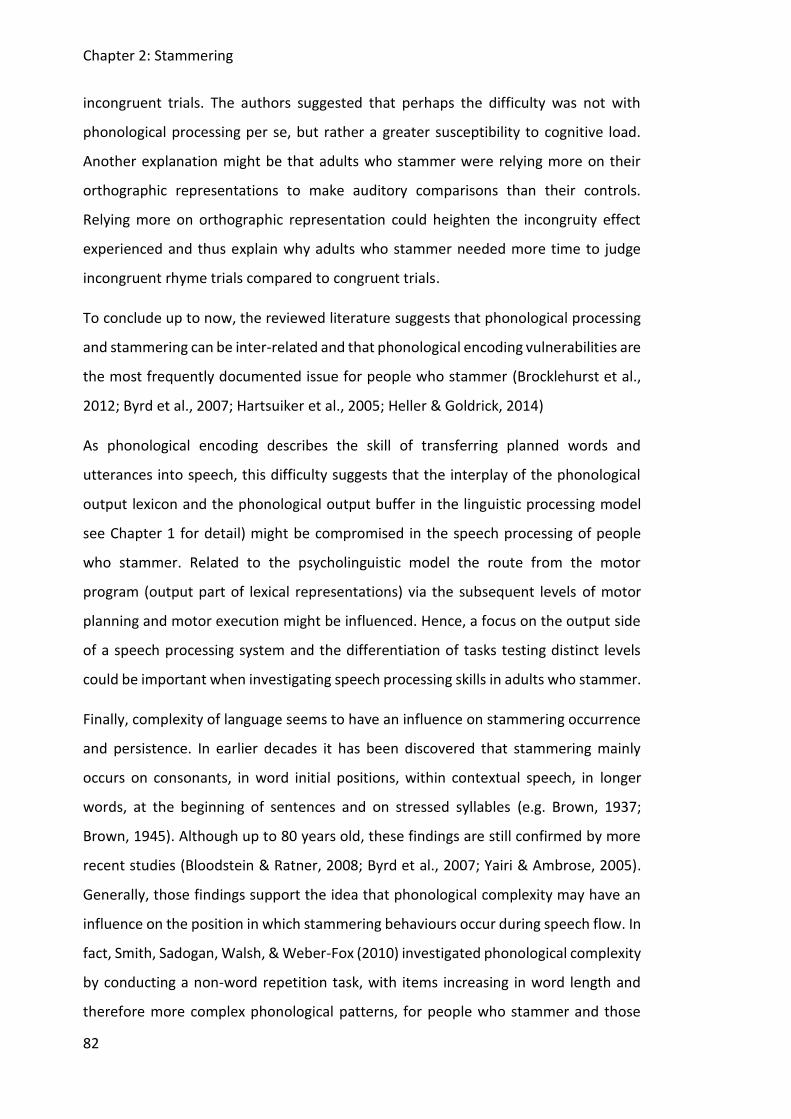
Chapter 2: Stammering
82
incongruent trials. The authors suggested that perhaps the difficulty was not with
phonological processing per se, but rather a greater susceptibility to cognitive load.
Another explanation might be that adults who stammer were relying more on their
orthographic representations to make auditory comparisons than their controls.
Relying more on orthographic representation could heighten the incongruity effect
experienced and thus explain why adults who stammer needed more time to judge
incongruent rhyme trials compared to congruent trials.
To conclude up to now, the reviewed literature suggests that phonological processing
and stammering can be inter-related and that phonological encoding vulnerabilities are
the most frequently documented issue for people who stammer (Brocklehurst et al.,
2012; Byrd et al., 2007; Hartsuiker et al., 2005; Heller & Goldrick, 2014)
As phonological encoding describes the skill of transferring planned words and
utterances into speech, this difficulty suggests that the interplay of the phonological
output lexicon and the phonological output buffer in the linguistic processing model
see Chapter 1 for detail) might be compromised in the speech processing of people
who stammer. Related to the psycholinguistic model the route from the motor
program (output part of lexical representations) via the subsequent levels of motor
planning and motor execution might be influenced. Hence, a focus on the output side
of a speech processing system and the differentiation of tasks testing distinct levels
could be important when investigating speech processing skills in adults who stammer.
Finally, complexity of language seems to have an influence on stammering occurrence
and persistence. In earlier decades it has been discovered that stammering mainly
occurs on consonants, in word initial positions, within contextual speech, in longer
words, at the beginning of sentences and on stressed syllables (e.g. Brown, 1937;
Brown, 1945). Although up to 80 years old, these findings are still confirmed by more
recent studies (Bloodstein & Ratner, 2008; Byrd et al., 2007; Yairi & Ambrose, 2005).
Generally, those findings support the idea that phonological complexity may have an
influence on the position in which stammering behaviours occur during speech flow. In
fact, Smith, Sadogan, Walsh, & Weber-Fox (2010) investigated phonological complexity
by conducting a non-word repetition task, with items increasing in word length and
therefore more complex phonological patterns, for people who stammer and those
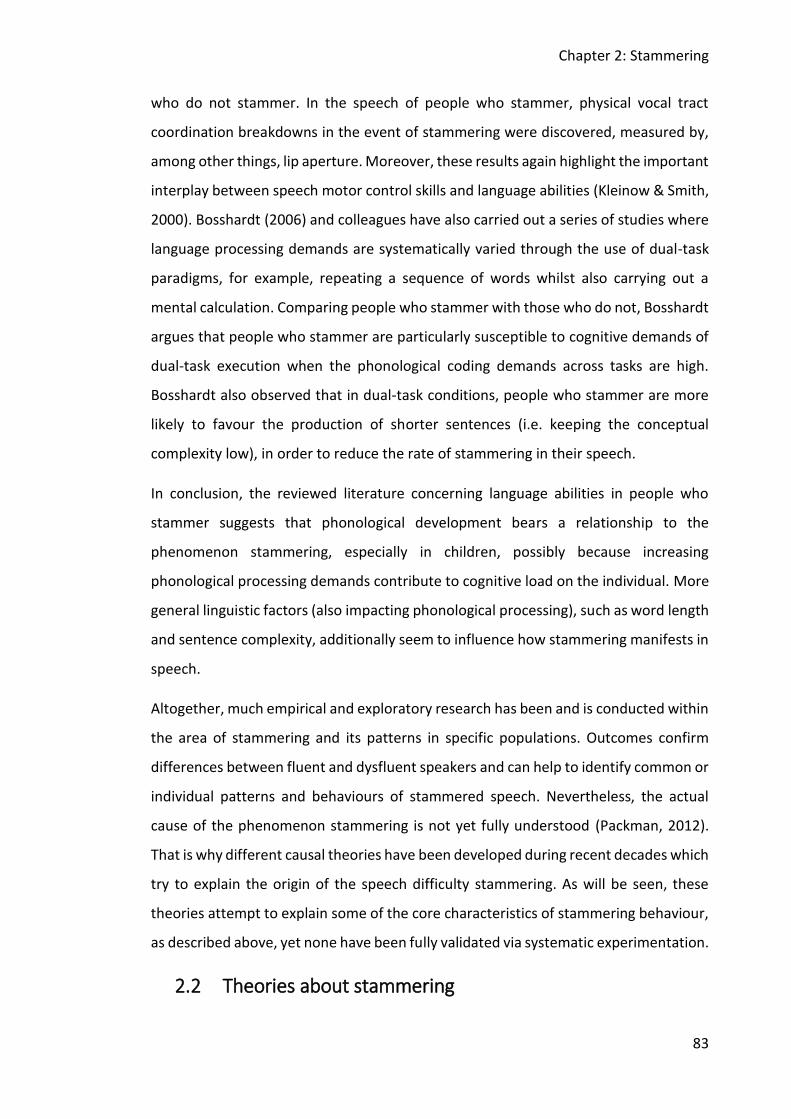
Chapter 2: Stammering
83
who do not stammer. In the speech of people who stammer, physical vocal tract
coordination breakdowns in the event of stammering were discovered, measured by,
among other things, lip aperture. Moreover, these results again highlight the important
interplay between speech motor control skills and language abilities (Kleinow & Smith,
2000). Bosshardt (2006) and colleagues have also carried out a series of studies where
language processing demands are systematically varied through the use of dual-task
paradigms, for example, repeating a sequence of words whilst also carrying out a
mental calculation. Comparing people who stammer with those who do not, Bosshardt
argues that people who stammer are particularly susceptible to cognitive demands of
dual-task execution when the phonological coding demands across tasks are high.
Bosshardt also observed that in dual-task conditions, people who stammer are more
likely to favour the production of shorter sentences (i.e. keeping the conceptual
complexity low), in order to reduce the rate of stammering in their speech.
In conclusion, the reviewed literature concerning language abilities in people who
stammer suggests that phonological development bears a relationship to the
phenomenon stammering, especially in children, possibly because increasing
phonological processing demands contribute to cognitive load on the individual. More
general linguistic factors (also impacting phonological processing), such as word length
and sentence complexity, additionally seem to influence how stammering manifests in
speech.
Altogether, much empirical and exploratory research has been and is conducted within
the area of stammering and its patterns in specific populations. Outcomes confirm
differences between fluent and dysfluent speakers and can help to identify common or
individual patterns and behaviours of stammered speech. Nevertheless, the actual
cause of the phenomenon stammering is not yet fully understood (Packman, 2012).
That is why different causal theories have been developed during recent decades which
try to explain the origin of the speech difficulty stammering. As will be seen, these
theories attempt to explain some of the core characteristics of stammering behaviour,
as described above, yet none have been fully validated via systematic experimentation.
2.2 Theories about stammering
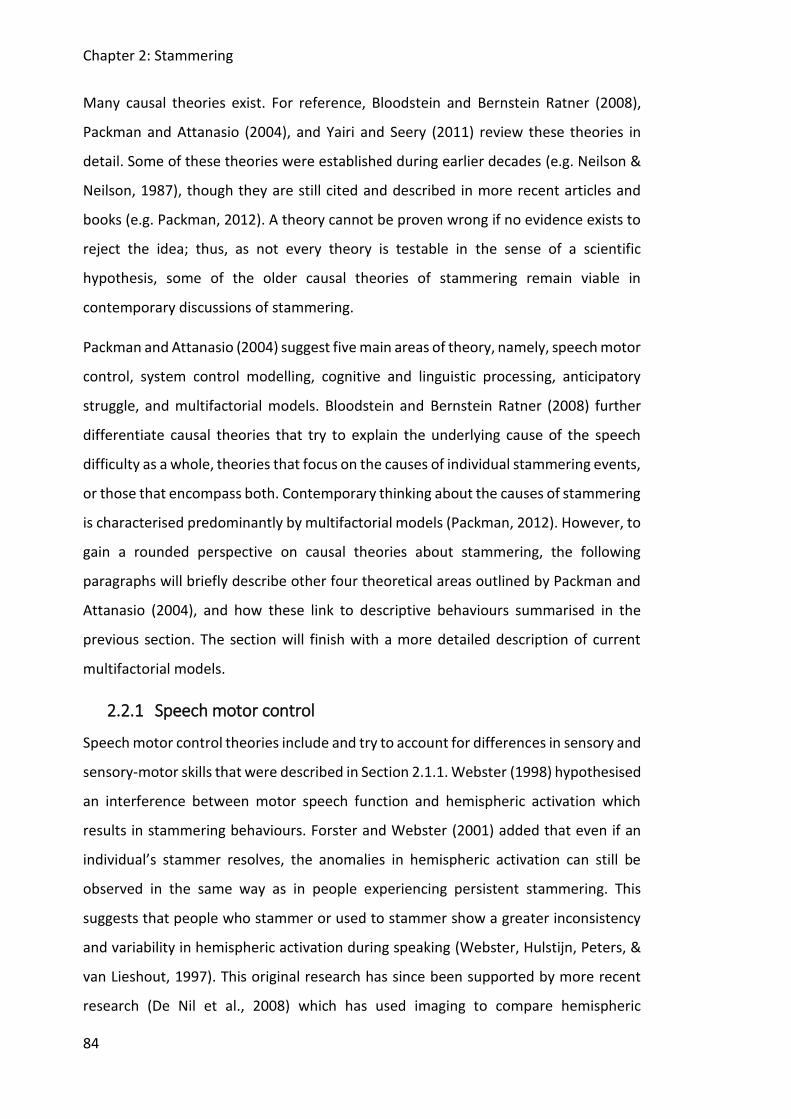
Chapter 2: Stammering
84
Many causal theories exist. For reference, Bloodstein and Bernstein Ratner (2008),
Packman and Attanasio (2004), and Yairi and Seery (2011) review these theories in
detail. Some of these theories were established during earlier decades (e.g. Neilson &
Neilson, 1987), though they are still cited and described in more recent articles and
books (e.g. Packman, 2012). A theory cannot be proven wrong if no evidence exists to
reject the idea; thus, as not every theory is testable in the sense of a scientific
hypothesis, some of the older causal theories of stammering remain viable in
contemporary discussions of stammering.
Packman and Attanasio (2004) suggest five main areas of theory, namely, speech motor
control, system control modelling, cognitive and linguistic processing, anticipatory
struggle, and multifactorial models. Bloodstein and Bernstein Ratner (2008) further
differentiate causal theories that try to explain the underlying cause of the speech
difficulty as a whole, theories that focus on the causes of individual stammering events,
or those that encompass both. Contemporary thinking about the causes of stammering
is characterised predominantly by multifactorial models (Packman, 2012). However, to
gain a rounded perspective on causal theories about stammering, the following
paragraphs will briefly describe other four theoretical areas outlined by Packman and
Attanasio (2004), and how these link to descriptive behaviours summarised in the
previous section. The section will finish with a more detailed description of current
multifactorial models.
2.2.1 Speech motor control
Speech motor control theories include and try to account for differences in sensory and
sensory-motor skills that were described in Section 2.1.1. Webster (1998) hypothesised
an interference between motor speech function and hemispheric activation which
results in stammering behaviours. Forster and Webster (2001) added that even if an
individual’s stammer resolves, the anomalies in hemispheric activation can still be
observed in the same way as in people experiencing persistent stammering. This
suggests that people who stammer or used to stammer show a greater inconsistency
and variability in hemispheric activation during speaking (Webster, Hulstijn, Peters, &
van Lieshout, 1997). This original research has since been supported by more recent
research (De Nil et al., 2008) which has used imaging to compare hemispheric
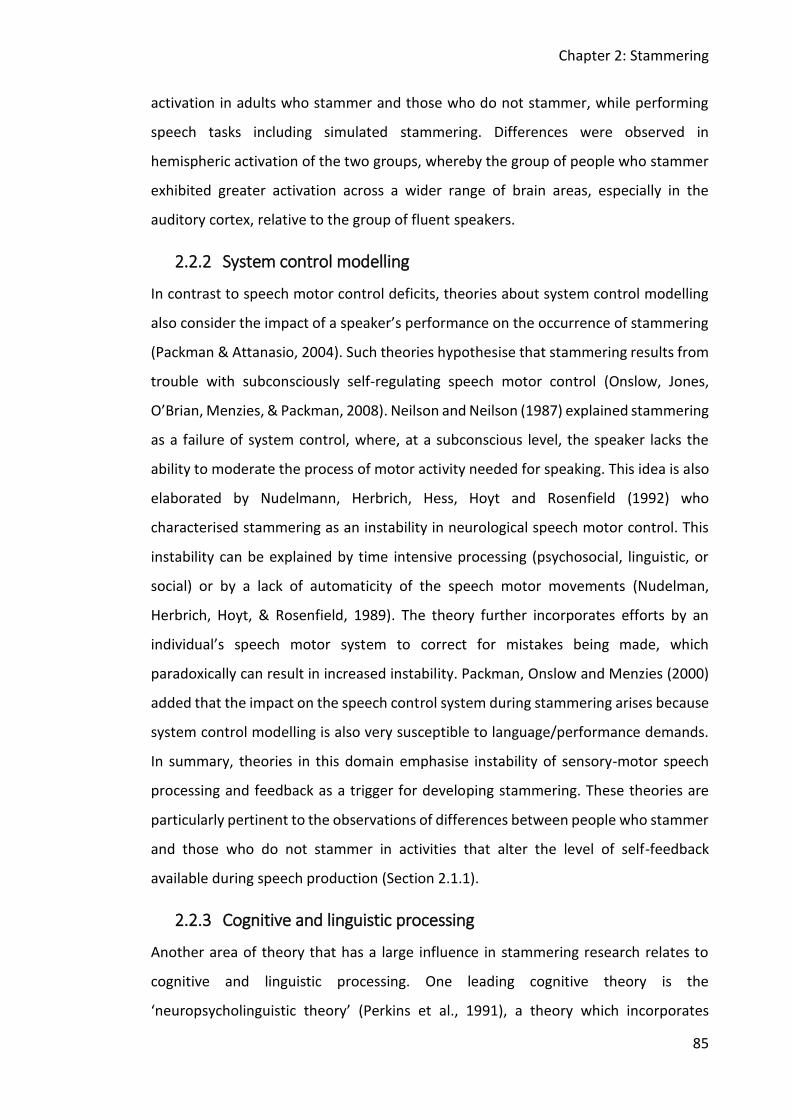
Chapter 2: Stammering
85
activation in adults who stammer and those who do not stammer, while performing
speech tasks including simulated stammering. Differences were observed in
hemispheric activation of the two groups, whereby the group of people who stammer
exhibited greater activation across a wider range of brain areas, especially in the
auditory cortex, relative to the group of fluent speakers.
2.2.2 System control modelling
In contrast to speech motor control deficits, theories about system control modelling
also consider the impact of a speaker’s performance on the occurrence of stammering
(Packman & Attanasio, 2004). Such theories hypothesise that stammering results from
trouble with subconsciously self-regulating speech motor control (Onslow, Jones,
O’Brian, Menzies, & Packman, 2008). Neilson and Neilson (1987) explained stammering
as a failure of system control, where, at a subconscious level, the speaker lacks the
ability to moderate the process of motor activity needed for speaking. This idea is also
elaborated by Nudelmann, Herbrich, Hess, Hoyt and Rosenfield (1992) who
characterised stammering as an instability in neurological speech motor control. This
instability can be explained by time intensive processing (psychosocial, linguistic, or
social) or by a lack of automaticity of the speech motor movements (Nudelman,
Herbrich, Hoyt, & Rosenfield, 1989). The theory further incorporates efforts by an
individual’s speech motor system to correct for mistakes being made, which
paradoxically can result in increased instability. Packman, Onslow and Menzies (2000)
added that the impact on the speech control system during stammering arises because
system control modelling is also very susceptible to language/performance demands.
In summary, theories in this domain emphasise instability of sensory-motor speech
processing and feedback as a trigger for developing stammering. These theories are
particularly pertinent to the observations of differences between people who stammer
and those who do not stammer in activities that alter the level of self-feedback
available during speech production (Section 2.1.1).
2.2.3 Cognitive and linguistic processing
Another area of theory that has a large influence in stammering research relates to
cognitive and linguistic processing. One leading cognitive theory is the
‘neuropsycholinguistic theory’ (Perkins et al., 1991), a theory which incorporates
Chapter 2: Stammering
86
neurological and psycholinguistic-based explanations of stammering behaviour.
According to this theory, the stammering speaker shows a neurological dyssynchrony
between articulation speed and syllable integration while formulating and expressing
speech. Thus, from a psycholinguistic perspective, output processing is impeded by
neurological difficulties in synchronising the various steps of speech production. Kolk
and Postma (1997) more specifically proposed that stammering occurs as a result of
mistakes and errors which arise in the phonetic plan of a speaker. The speaker tries
subconsciously to correct these mistakes and so stammering occurs; namely, the
‘covert repair hypothesis’. This theory is closely connected to observations of
phonological development difficulties in children who stammer, as well as persistent
phonological encoding difficulties in people who stammer compared to those who do
not stammer (see Section 2.1.2). The theory draws on the psycholinguistic model of
speech production by Levelt (1993), which includes the process of speech monitoring,
including the detection and correction of errors during speech production. Speech
errors can be repaired overtly, after the speech has been fully articulated, or else the
repair can be covert, before the speech motor programme is fully executed. If an error
is repaired covertly the speech act is interrupted. The result might be repetition of a
sound until the subsequent sounds are able to be encoded or articulated. Speech may
be filled with non-fluent patterns (such as ‘erm’ or ‘uhm’), or a speaker might
experience a block, where muscular tension builds up while the covert speech repair is
occurring (Kolk & Postma, 1997). While both normal dysfluencies and stammering can
be the result of covert repair processes, the ‘covert repair hypothesis’ suggests that
people who stammer are more prone to the phonological encoding errors that
precipitate a need for repair. The theory was expanded by the vicious circle hypothesis
and the EXPLAN theory. The vicious circle hypothesis (Vasiç & Wijnen, 2005) suggests
the locus of the problem is not necessarily faulty phonological encoding per se, but
rather that people who stammer monitor their speech differently so that they have a
lower threshold for initiating repairs during speech production. In attempting to repair
errors so early, new errors occur; thus, a vicious circle is created. The EXPLAN theory
(Howell & Au-Yeung, 2002) adds that the errors actually occur when the rate of
planning speech falls below the rate of producing the speech which means that the
speaker does not have enough planned speech to successfully finish an utterance.
Chapter 2: Stammering
87
Howell and Au-Yeung also attempt to explain the distinction between people who
stammer and those who do not stammer within their hypothesis by marking that a
fluent speaker also shows patterns of dysfluencies which are defined by whole word
repetitions rather than repetitions or prolongations of incomplete fragments. Indeed,
the fluent speaker avails oneself of already formulated segments, in contrast to the
person who stammers and tries to improvise with unplanned speech segments. To
summarise, many psycholinguistic theories of stammering emphasise the importance
of the phonological encoding stage of speech production as a core domain of difficulty.
However, the exact locus of the difficulty, i.e. the process of encoding itself, error
monitoring or the synchrony between encoding and speech production is currently
unclear.
2.2.4 Anticipatory struggle
In contrast to the previous theories, anticipatory struggle is a theory which describes
stammering as a learned behaviour (Packman & Attanasio, 2004). Put forward by
Bloodstein (1995), the earliest manifestations of this theory described stammering as
a learned reaction to struggling with speaking and participation in communication
during language acquisition and speech during childhood (Bloodstein, 1995). However,
as research has accumulated, providing evidence for a genetic (i.e. not learned)
component to stammering (Curlee, 2004), Bloodstein has revised his theory. More
current versions of this theory explain early-emerging childhood stammering through
genetic disposition, while stammering that develops in older children potentially has a
different cause, related to anticipatory struggle (Bloodstein, 2001). This revision leaves
quite a few questions remaining, in terms of what might precipitate this learned
behaviour in older children. However, Bloodstein (2001) emphasises the potential
difficulty of language acquisition contributing negatively to the development of
stammering. This perspective draws on the literature that reports links between
language development and stammering incidence in Section 2.1.2.
To summarise so far, the four theoretical areas described represent both diversity in
perspectives, and some convergence in views on the vulnerability of the speech
processing system for people who stammer. The final set of theories to be discussed
Chapter 2: Stammering
88
are multifactorial models, which attempt to explain stammering from a more
comprehensive perspective.
2.2.5 Multifactorial models
Multifactorial models try to explain the causes of stammering from a holistic
perspective. So far, the theories above focused on a specific part of the puzzle, however
it is also possible to discern common processes or systems that have a more over-
arching importance. For example, the speech motor system is considered in speech
motor control and system control modelling theories, but also features within cognitive
and linguistic explanations of stammering. Multifactorial models thus try to integrate
multiple perspectives into one model of development and causality for stammering
and acknowledge that the development of stammering cannot be explained by single
defined factors (Smith, 1999).
A key multifactorial model is the ‘model of capacities and demands’ (Starkweather &
Givens-Ackermann, 1997; Starkweather & Gottwald, 2000; Starkweather, 1987), which
aims to explain the development and causes of stammering in an interactional way.
Speech motor control, language development, social and emotional functions, as well
as cognitive development are the main areas which are named as important capacities
during the development of stammering. The core idea of the model is that an
imbalance between these capacities and actual demands on the young child result in
the onset of stammering. Examples of demands could be a phase of learning lots of
new words which require more phonological skills (linguistic demands), influences on
language development from the outside such as demanding social communication
(social and environmental demands), the general cognitive and mental ability to learn
and understand speech and language (cognitive demands), and the ability to
accomplish motor execution and language at the same time (motoric demands). Hence,
the onset of stammering can be explained by a specific instance of imbalance between
demands and capacities whereas a constant imbalance might result in stammering
becoming established as a persistent speech difficulty (Herzka & Koesling, 2008). This
model is used by many researchers (e.g. Guitar, 2013; Kalinowski & Saltuklaroglu, 2003;
Starkweather & Givens-Ackermann, 1997) to explain the onset of stammering and its
development and causes.
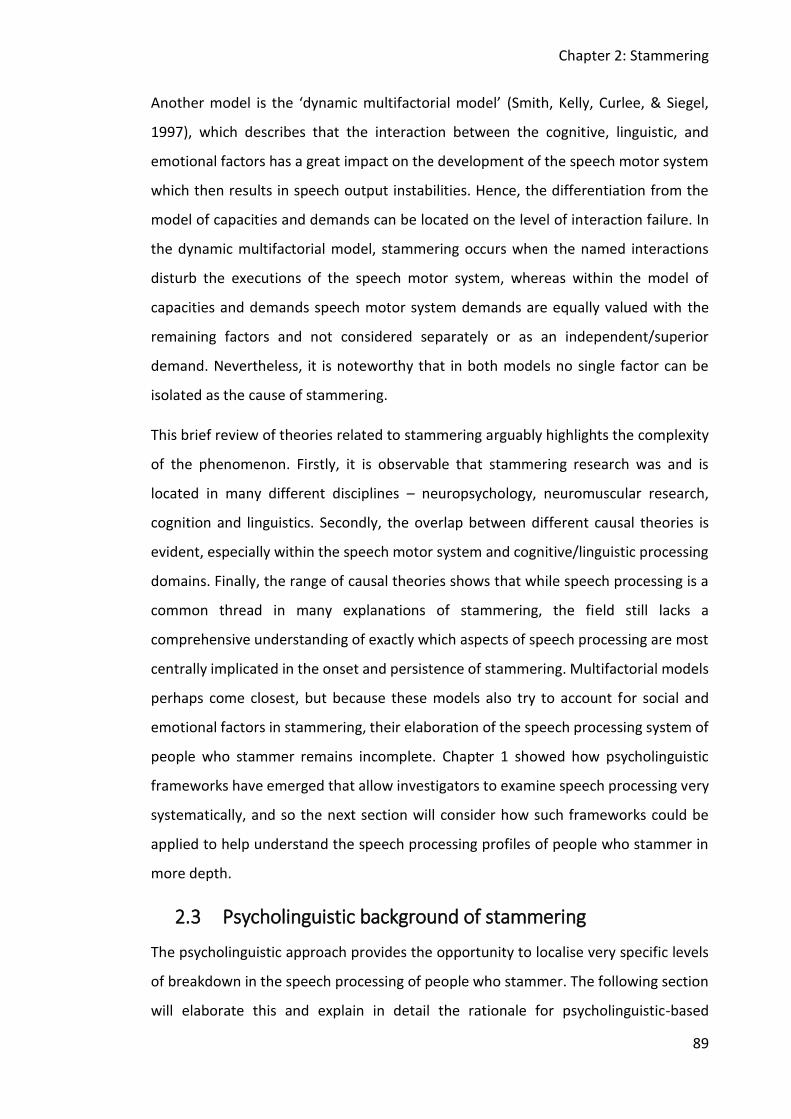
Chapter 2: Stammering
89
Another model is the ‘dynamic multifactorial model’ (Smith, Kelly, Curlee, & Siegel,
1997), which describes that the interaction between the cognitive, linguistic, and
emotional factors has a great impact on the development of the speech motor system
which then results in speech output instabilities. Hence, the differentiation from the
model of capacities and demands can be located on the level of interaction failure. In
the dynamic multifactorial model, stammering occurs when the named interactions
disturb the executions of the speech motor system, whereas within the model of
capacities and demands speech motor system demands are equally valued with the
remaining factors and not considered separately or as an independent/superior
demand. Nevertheless, it is noteworthy that in both models no single factor can be
isolated as the cause of stammering.
This brief review of theories related to stammering arguably highlights the complexity
of the phenomenon. Firstly, it is observable that stammering research was and is
located in many different disciplines – neuropsychology, neuromuscular research,
cognition and linguistics. Secondly, the overlap between different causal theories is
evident, especially within the speech motor system and cognitive/linguistic processing
domains. Finally, the range of causal theories shows that while speech processing is a
common thread in many explanations of stammering, the field still lacks a
comprehensive understanding of exactly which aspects of speech processing are most
centrally implicated in the onset and persistence of stammering. Multifactorial models
perhaps come closest, but because these models also try to account for social and
emotional factors in stammering, their elaboration of the speech processing system of
people who stammer remains incomplete. Chapter 1 showed how psycholinguistic
frameworks have emerged that allow investigators to examine speech processing very
systematically, and so the next section will consider how such frameworks could be
applied to help understand the speech processing profiles of people who stammer in
more depth.
2.3 Psycholinguistic background of stammering
The psycholinguistic approach provides the opportunity to localise very specific levels
of breakdown in the speech processing of people who stammer. The following section
will elaborate this and explain in detail the rationale for psycholinguistic-based
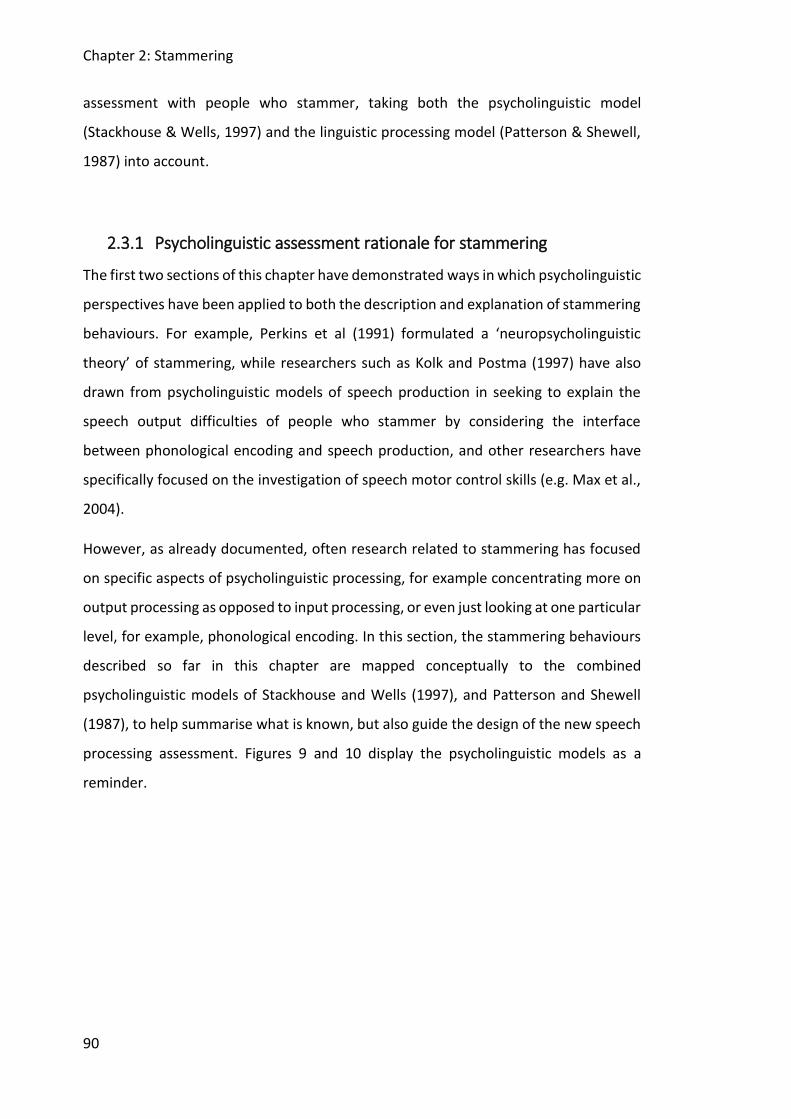
Chapter 2: Stammering
90
assessment with people who stammer, taking both the psycholinguistic model
(Stackhouse & Wells, 1997) and the linguistic processing model (Patterson & Shewell,
1987) into account.
2.3.1 Psycholinguistic assessment rationale for stammering
The first two sections of this chapter have demonstrated ways in which psycholinguistic
perspectives have been applied to both the description and explanation of stammering
behaviours. For example, Perkins et al (1991) formulated a ‘neuropsycholinguistic
theory’ of stammering, while researchers such as Kolk and Postma (1997) have also
drawn from psycholinguistic models of speech production in seeking to explain the
speech output difficulties of people who stammer by considering the interface
between phonological encoding and speech production, and other researchers have
specifically focused on the investigation of speech motor control skills (e.g. Max et al.,
2004).
However, as already documented, often research related to stammering has focused
on specific aspects of psycholinguistic processing, for example concentrating more on
output processing as opposed to input processing, or even just looking at one particular
level, for example, phonological encoding. In this section, the stammering behaviours
described so far in this chapter are mapped conceptually to the combined
psycholinguistic models of Stackhouse and Wells (1997), and Patterson and Shewell
(1987), to help summarise what is known, but also guide the design of the new speech
processing assessment. Figures 9 and 10 display the psycholinguistic models as a
reminder.
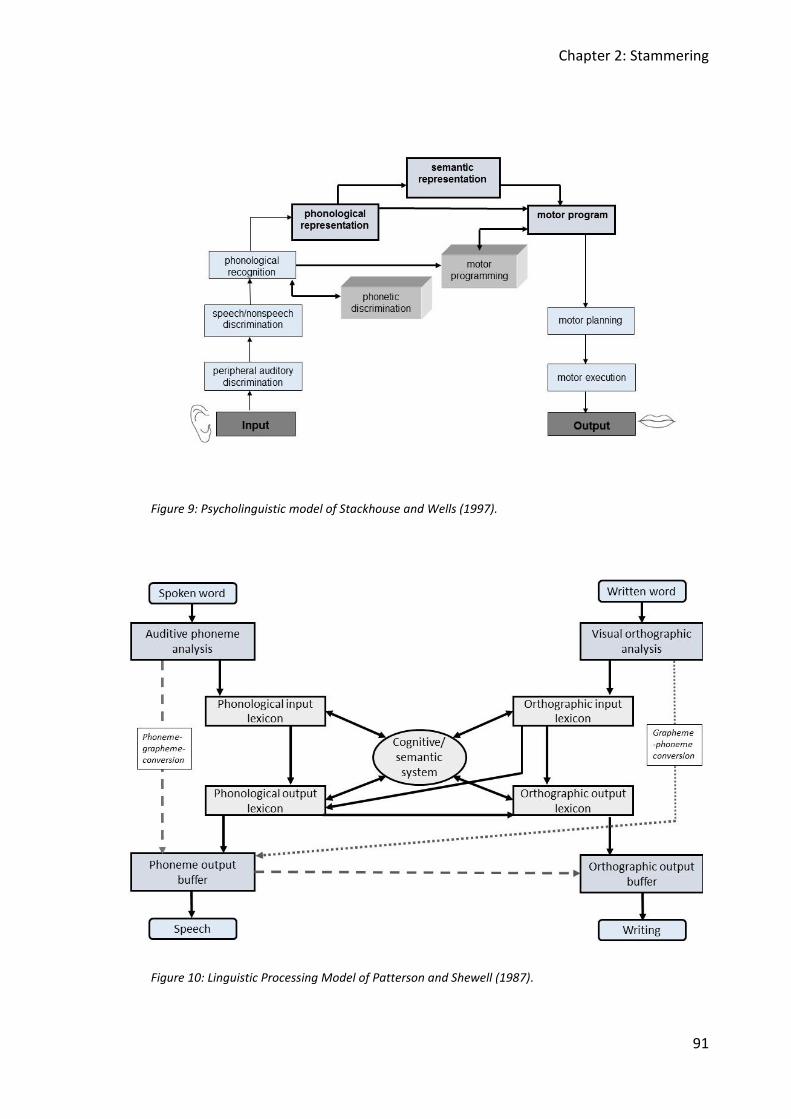
Chapter 2: Stammering
91
Figure 9: Psycholinguistic model of Stackhouse and Wells (1997).
Figure 10: Linguistic Processing Model of Patterson and Shewell (1987).
Chapter 2: Stammering
92
Table 2 takes the over-arching categories of input, stored knowledge and output
processing and summarises relevant research findings in the field of stammering
expanded in this chapter. Input processing for the psycholinguistic model (Figure 9)
includes the levels of peripheral auditory discrimination, speech/non-speech
discrimination and phonological recognition. Output processing includes motor
planning and motor execution whereas all remaining “on-line” components represent
stored knowledge. For the linguistic processing model (Figure 10), Table 2 refers to
input processing as the auditive phoneme analysis and refers to output processing as
the phonological output buffer. As no research has been reported which focuses on
orthographic skills in people who stammer, these levels are not directly represented.
However, the cognitive/semantic system plus its four lexica are subsumed within the
stored knowledge component of Table 2.
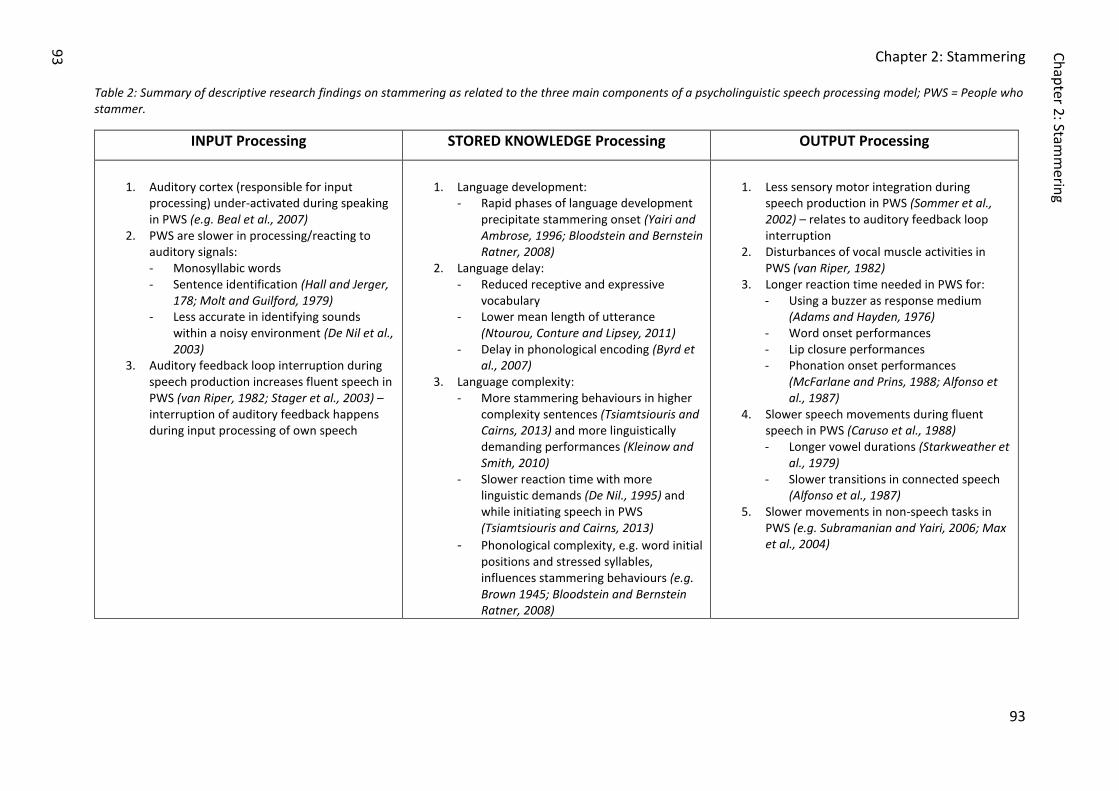
Chapter 2: Stammering
93
Table 2: Summary of descriptive research findings on stammering as related to the three main components of a psycholinguistic speech processing model; PWS = People who stammer.
INPUT Processing STORED KNOWLEDGE Processing OUTPUT Processing
1. Auditory cortex (responsible for input
processing) under-activated during speaking in PWS (e.g. Beal et al., 2007)
2. PWS are slower in processing/reacting to auditory signals: - Monosyllabic words - Sentence identification (Hall and Jerger,
178; Molt and Guilford, 1979) - Less accurate in identifying sounds
within a noisy environment (De Nil et al., 2003)
3. Auditory feedback loop interruption during speech production increases fluent speech in PWS (van Riper, 1982; Stager et al., 2003) – interruption of auditory feedback happens during input processing of own speech
1. Language development:
- Rapid phases of language development precipitate stammering onset (Yairi and Ambrose, 1996; Bloodstein and Bernstein Ratner, 2008)
2. Language delay: - Reduced receptive and expressive
vocabulary - Lower mean length of utterance
(Ntourou, Conture and Lipsey, 2011) - Delay in phonological encoding (Byrd et
al., 2007) 3. Language complexity:
- More stammering behaviours in higher complexity sentences (Tsiamtsiouris and Cairns, 2013) and more linguistically demanding performances (Kleinow and Smith, 2010)
- Slower reaction time with more linguistic demands (De Nil., 1995) and while initiating speech in PWS (Tsiamtsiouris and Cairns, 2013)
- Phonological complexity, e.g. word initial positions and stressed syllables, influences stammering behaviours (e.g. Brown 1945; Bloodstein and Bernstein Ratner, 2008)
1. Less sensory motor integration during
speech production in PWS (Sommer et al., 2002) – relates to auditory feedback loop interruption
2. Disturbances of vocal muscle activities in PWS (van Riper, 1982)
3. Longer reaction time needed in PWS for: - Using a buzzer as response medium
(Adams and Hayden, 1976) - Word onset performances - Lip closure performances - Phonation onset performances
(McFarlane and Prins, 1988; Alfonso et al., 1987)
4. Slower speech movements during fluent speech in PWS (Caruso et al., 1988) - Longer vowel durations (Starkweather et
al., 1979) - Slower transitions in connected speech
(Alfonso et al., 1987) 5. Slower movements in non-speech tasks in
PWS (e.g. Subramanian and Yairi, 2006; Max et al., 2004)
Ch
apter 2: Stam
me
ring
93
Chapter 2: Stammering
94
Table 2 helps demonstrate the breadth of processing issues observed in the speech
processing of people who stammer, across input, stored knowledge and output
domains, as well as the potential difficulty, apparent from the research carried out to
date, in isolating specific psycholinguistic levels affected.
Regarding input processing findings, it is observable that processing may be impacted
from quite peripheral levels of audition, for example, identifying sounds in noise
(peripheral auditory discrimination/speech-nonspeech discrimination levels of the
Stackhouse and Wells (1997) model), through to tasks involving phonological
recognition (sentence recognition) and beyond. This breadth of issues supports the
design of a psycholinguistic assessment that will cover a range of input processing
levels.
Within the stored knowledge column, the research suggests that speech processing for
people who stammer is very susceptible to length and complexity effects, both within
phonological processing and wider language processing. These findings support the
decision to manipulate complexity as a factor in task for the new tool, that is, having
tasks with stimulus or target word/non-word forms that gradually increase in length
and phonological load. Given the findings showing a clear impact of linguistic load, it
appears important for at least one task to systematically manipulate this factor. One
straightforward way to do this is via a task that involves either real words or non-words;
completing the version of the task with real words will require accessing of
lexical/semantic knowledge, while completing the non-words version will minimise
these access demands.
With regard to output processing, a range of behaviours are reported, some of which
are potentially difficult to isolate to one or other level of output processing. For
example, while it could be predicted that van Riper’s description of disturbances of
vocal muscle activity might implicate the motor execution level of the Stackhouse and
Wells model, do slower speech movements represent a problem at the level of motor
planning, motor execution, or even an issue with the stored motor program. For this
reason, it will be important for the assessment created here to cover more than one
level of output processing.
Chapter 2: Stammering
95
Finally, across all three levels of speech processing, reductions in speed and increases
in reaction time feature prominently as reported characteristics for those who
stammer. This would suggest that in order to assess speech processing strengths and
weaknesses in this population, it will be crucial to record reaction time, as this may be
a highly sensitive measure of task performance.
Overall, therefore, in seeking to map existing research findings about stammering onto
a general psycholinguistic framework, it is clear that while the phenomenon of
stammering has broad and potentially wide-reaching effects on speech processing,
there remains a lot of ambiguity in terms of specific processing levels implicated, as
well as whether the same levels are affected across different individuals who stammer.
2.4 Chapter summary
This chapter reviewed the phenomenon of stammering in relation to its origin and
development. A review of descriptive research was presented to survey known
characteristics about stammering. Furthermore, existing causal theories were outlined
and current research related to those theories and specific putative causal factors were
discussed against a backdrop of psycholinguistic models. Key points were as follows:
• Stammering is a speech difficulty characterised by a significantly high
number of normal dysfluent patterns in the speech output of a speaker who
stammers.
• Much descriptive and neuroimaging research highlights differences in
sensory, sensory-motor and language factors of speech processing in people
who stammer, though the associated difficulties are wide-ranging and
include higher level issues such as vulnerability to linguistic complexity, as
well as more basic difficulties in discriminating the speech signal noise due
to issues pertaining to central auditory processing.
• The most current, dominant causal theories of stammering are
multifactorial, reflecting the obvious complexity of stammering while
accommodating factors of motoric, emotional, linguistic, and cognitive
origins.
Chapter 2: Stammering
96
• Assessing stammering within a psycholinguistic-based assessment enables
investigators to examine descriptive and neuroimaging research findings in
relation to a range of distinct input and output speech processing levels and
the influence of stored knowledge components on speech of people who
stammer.
• Reaction time is a frequently reported characteristic which tends to increase
in length (very occasionally data show the opposite trend) in people who
stammer and is therefore an important outcome measure, alongside task
performance accuracy, when investigating people who stammer.
2.4.1 Secondary research objective
To conclude this Chapter 2 on stammering, the secondary objective of this doctoral
study is re-stated: to explore speech profiles of young adults who experience a
persistent developmental stammer, but are more subtle within higher education. To
this end, the newly developed speech processing assessment tool will be used to test
each case study participant. Additional data will be gathered via semi-structured
research interviews to gain a full picture of each individual’s stammering history and
patterns of behaviour and to compare this reported information to the performance
data collected using the speech processing assessment. Detailed explanations of
additional data is presented in Chapter 4.
Related to this objective, particular aims for task design in this assessment of adults
who stammer are as follows. The range of tasks should (i) include both input and output
processes; (ii) vary in complexity and cognitive load; (iii) include tasks in which linguistic
complexity (e.g. word length) is manipulated, so that the effect of processing demands
can be observed; (iv) include tasks which can be completed without spoken output to
gauge processing skills when there is no influence of speech production demands; (iv)
include reaction time as a measure alongside accuracy of performance.
The following Part II of the thesis will describe and explain the methods used in this
doctoral study to develop the new speech processing assessment and to conduct the
series of case studies. First, Chapter 3 below sets out the research questions which

Chapter 2: Stammering
97
framed the design, methods and execution of the study and the analysis and
interpretation of results.

Chapter 3: Research questions
99
3. Chapter 3: Research questions
The research questions distil the research objectives set out at the end of Chapter 1
(Psycholinguistics) and Chapter 2 (Stammering) respectively.
Main research objective: to develop a new psycholinguistic-based speech processing
assessment tool for adults.
➢ Question 1. What basic psychometric properties are required for a
comprehensive assessment tool?
When developing an assessment tool, if assessment outcomes are to be trusted, it is
essential to demonstrate the objectivity, validity and reliability of the tasks and stimuli
developed for the tool for being able to firm statistically proven interpretations and
conclusions of assessment outcomes (Field, 2013).
➢ Question 1a. What are the basic psychometric properties of the speech
processing assessment tool?
➢ Question 1b. Can objectivity, reliability, and validity of the new developed
speech processing assessment be confirmed?
More detailed research questions related to objectivity, reliability and validity were
then formulated, drawing on the theoretical findings in Chapters 1 and 2.
Objectivity
➢ Question 2. Can a newly developed assessment tool, based on researched
theories, be conducted using an objective and accurate procedure for
execution, scoring and analysing?
Reliability
➢ Question 3a. What is the internal consistency of the speech processing
assessment?
➢ Question 3b. What is the test-retest reliability of the speech processing
assessment?
Chapter 3: Research questions
100
➢ Question 3c. What is the inter-rater reliability of the speech processing
assessment?
Validity
➢ Question 4a. Does the speech processing assessment test what it claims to
test?
➢ Question 4b. Can theory-based assumptions be confirmed?
i) Do tasks with similar speech processing demands correlate more
strongly than with other tasks?
ii) What is the relationship between reaction time and performance
accuracy within subtests?
Chapter 5 will focus on the evaluation of all research questions related to psychometric
properties of the new speech processing assessment.
Secondary research objective: to explore the speech profiles of young adults with a
persistent developmental stammer, using (i) the newly developed speech processing
assessment tool, and (ii) semi-structured interviews to gather additional data that
helps compare this reported information to the performance data collected using the
speech processing assessment.
➢ Question 5. Do people who experience a speech difficulty show different
performances compared to the normative sample group?
➢ Question 6. What are the speech processing profiles of individuals who
stammer?
➢ Question 7. Can specific and individual patterns be observed consistent with
additional data collected in the interview?
Comparisons between outcomes for these case study participants and the normative
data (psychometric testing) are also detailed in Part III.
Chapter 4: Methods
101
PART II: METHODS 4. Methods
This chapter focuses on the remit of the newly developed assessment and the rationale
for its focus. Generally, it is important to notice that the overall aim of this new
assessment was to investigate abilities across a range of psycholinguistic skill areas,
such as auditory discrimination or repetition of novel words, as opposed to looking at
variations in specific phonemic contrasts or particular sounds per se. Equally, it was a
primary intent of this assessment to examine speech processing relatively
independently of stored knowledge/the mental lexicon, and thus most tasks utilized
non-words as opposed to real words. This is not to deny the importance of the critical
interplay between lexical and non-lexical processing, however, in order to provide a
manageable scope, the investigation here targets speech processing at the more
peripheral levels of both psycholinguistic (Stackhouse & Wells, 1997) and linguistic
processing models (Patterson & Shewell, 1987).
Finally, as this doctoral study aimed to investigate adults with persistent
developmental speech difficulties that are more subtle, there was a need to design
assessment tasks that could discriminate the skills of adults, as opposed to children. It
was thought that, for example, a variation in syllable length of stimuli would add
cognitive load to the task demands. Cognitive load or cognitive complexity of tasks will
be further explored in Section 4.4.
4.1 Overall design
A key aim for the assessment described here was that it would allow investigation of
speech processing at multiple levels (e.g. speech discrimination, speech production
etc.) and at different levels of difficulty and task demand. In practical terms, it was
intended that the assessment would be suitable for use in both clinical and research
settings where an overview of speech processing was sought.
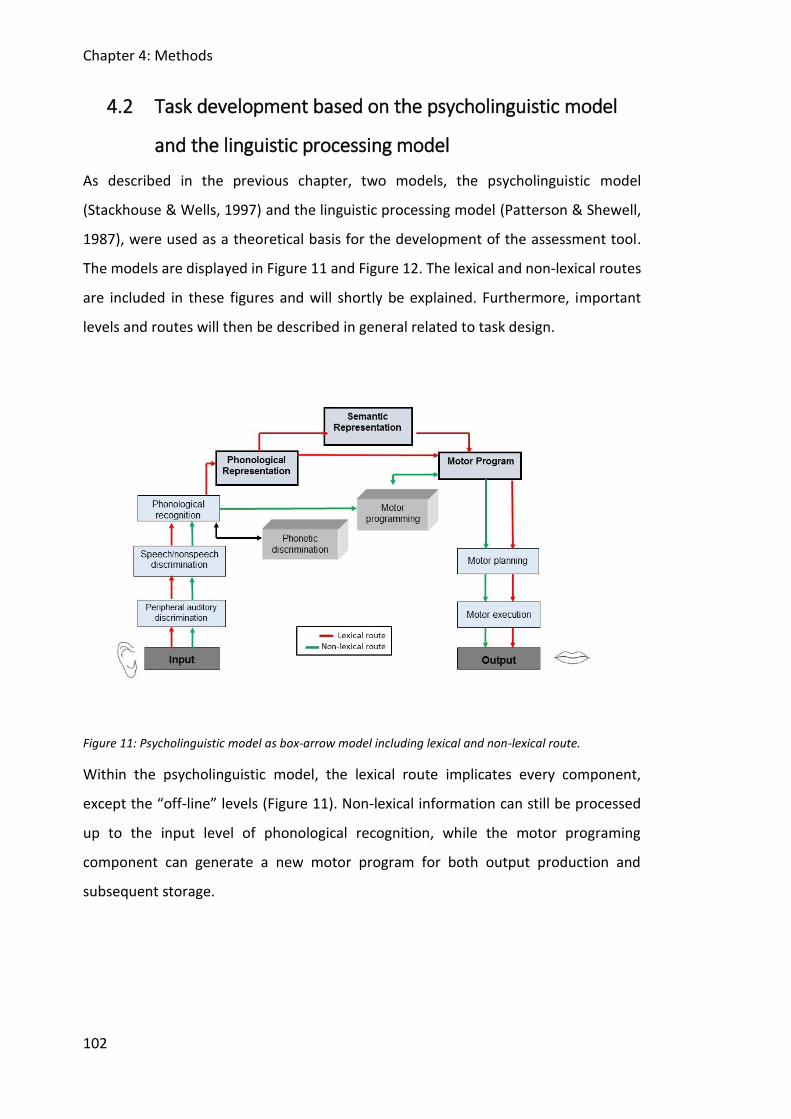
Chapter 4: Methods
102
4.2 Task development based on the psycholinguistic model
and the linguistic processing model
As described in the previous chapter, two models, the psycholinguistic model
(Stackhouse & Wells, 1997) and the linguistic processing model (Patterson & Shewell,
1987), were used as a theoretical basis for the development of the assessment tool.
The models are displayed in Figure 11 and Figure 12. The lexical and non-lexical routes
are included in these figures and will shortly be explained. Furthermore, important
levels and routes will then be described in general related to task design.
Figure 11: Psycholinguistic model as box-arrow model including lexical and non-lexical route.
Within the psycholinguistic model, the lexical route implicates every component,
except the “off-line” levels (Figure 11). Non-lexical information can still be processed
up to the input level of phonological recognition, while the motor programing
component can generate a new motor program for both output production and
subsequent storage.
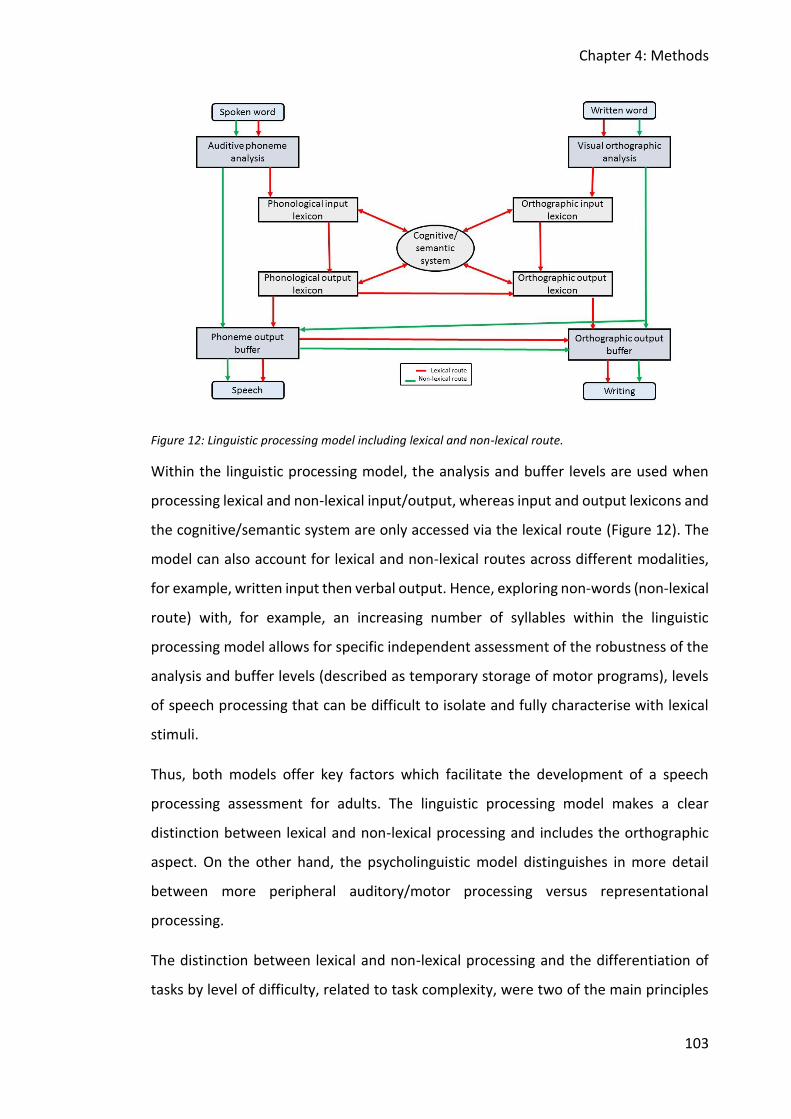
Chapter 4: Methods
103
Figure 12: Linguistic processing model including lexical and non-lexical route.
Within the linguistic processing model, the analysis and buffer levels are used when
processing lexical and non-lexical input/output, whereas input and output lexicons and
the cognitive/semantic system are only accessed via the lexical route (Figure 12). The
model can also account for lexical and non-lexical routes across different modalities,
for example, written input then verbal output. Hence, exploring non-words (non-lexical
route) with, for example, an increasing number of syllables within the linguistic
processing model allows for specific independent assessment of the robustness of the
analysis and buffer levels (described as temporary storage of motor programs), levels
of speech processing that can be difficult to isolate and fully characterise with lexical
stimuli.
Thus, both models offer key factors which facilitate the development of a speech
processing assessment for adults. The linguistic processing model makes a clear
distinction between lexical and non-lexical processing and includes the orthographic
aspect. On the other hand, the psycholinguistic model distinguishes in more detail
between more peripheral auditory/motor processing versus representational
processing.
The distinction between lexical and non-lexical processing and the differentiation of
tasks by level of difficulty, related to task complexity, were two of the main principles
Chapter 4: Methods
104
considered when choosing tasks for the new assessment tool. However, other factors
were also taken into consideration and applied to each task. These other factors were
mostly informed by the aim to create a valid and reliable assessment tool. The way
tasks are presented and answered should always reflect a transparent and
comprehensive system. Hence, clear instructions, which were similar in format across
all tasks, were put in place prior to assessment, along with a scoring system.
Furthermore, reaction time should be measured, as it was thought that someone with
a mature speech processing system, but an underlying and undetected speech
difficulty, might be able to perform difficult and complex tasks due to increased
automatisation through years of practice and compensation strategies. Hence,
reaction time and accuracy are the main measurements of task performances, with the
rationale that if task accuracy was not sensitive enough, potential sensitivity could be
captured using reaction time variations. Detailed instructions and composition of the
individual tasks are described below.
4.3 Tasks
Altogether, six tasks were chosen: Auditory discrimination of non-words (AD), non-
word repetition (NW), reading of non-words (R), spelling of non-words (S), spoonerism
with real words (SPR), and spoonerism with non-words (SPN). These tasks were chosen
to allow the assessment to investigate input and output processing, at both peripheral
as well as higher levels of processing. Below, the tasks and their corresponding
theoretical levels are explained in more detail.
4.3.1 Auditory discrimination of non-words
Auditory discrimination of non-words involves auditory processing, short-term
memory, and non-lexical decision making. Originally, this task was constructed to test
auditory discrimination of similar non-words in a child’s speech performance
(Bridgeman & Snowling, 1988; Stackhouse & Wells, 1997). It can also provide a
counterpart to non-word repetition – the two tasks allow for the assessment of input
(non-word auditory discrimination) and output (non-word repetition) processing of
phonological forms that are not linked to an existing lexical representation. Given the
lack of direct match for non-words within an individual’s long-term memory for lexical
Chapter 4: Methods
105
representations, this also makes non-word tasks particularly reliant on phonological
short-term memory processing (Vance, 1995). Stackhouse et al. (2007) describe how
the complexity of an auditory discrimination task can be heightened using non-words
of increasing lengths, for example, when working with older children or adults with
persistent speech impairments. Versions of this task also exist within assessments
based on the linguistic processing model, providing information concerning the
integrity of the pre-lexical auditory analysis stage and the phonological input buffer at
a segmental level (Franklin, 1989; Pinard, Chertkow, Black, & Peretz, 2002; Shallice,
1988; Tessier, Weill-Chounlamountry, Michelot, & Pradat-Diehl, 2007). Hence, it was
decided to introduce the task using non-words and items varying in syllable length to
increase complexity. Two items are presented and the participant decides if the items
are the same or not.
4.3.2 Non-word repetition
Non-word repetition involves auditory processing and short-term memory, as well as
non-lexical speech production including motor programming and execution. Related to
the psycholinguistic model and the developmental aspect of it, the task was introduced
to examine a child’s ability to create new motor programs (Nathan et al., 2004; Vance,
Stackhouse, & Wells, 2005). Motor programming as a skill is needed for new word
learning. When considering acquisition of speech and language, this task is very
important, as new motor programs are learned continuously. Although the task might
seem irrelevant to an adult speaker, new words are frequently acquired by adults when
new terminology is learned during college, university and in employment. Moreover,
second language learning needs good motor programming ability. Error performances
within this task might indicate problems within the motor programming and auditory
decoding skills, therefore the task is seen as counterpart to auditory discrimination
(Stackhouse et al., 2007). Within the linguistic processing model, assessing adults with
this task can test abilities in auditory phoneme correspondence and the phonological
output buffer (Goodman & Caramazza, 1986; Shallice, Rumiati, & Zadini, 2000).
Complexity of stimuli was manipulated by increasing stimuli length. Within each trial,
one item is presented and the participant is asked to repeat it as accurately as possible.
4.3.3 Matching spoken and written non-words – Reading of non-words
Chapter 4: Methods
106
It was decided to include a measure of non-word reading judgement in the current
assessment, to enable further investigation of an individual’s phonological input and
output skills; investigating the nature of phonological processing in speakers with overt
speech output difficulties can be complicated by output errors, which may or may not
be a reflection of the phonological level of processing. In the task designed here, in
each trial the participant hears one non-word, presented aurally. The participant then
sees either two (pilot) or three (final assessment) written non-words and is asked to
select the written form that best matches the spoken non-word. The task therefore
involves auditory processing, short-term memory, and sound-to letter-mapping via the
non-lexical processing route. Through the lens of the linguistic processing model, which
best addresses written language, this task involves auditory phoneme analysis
(identification, segmentation), as well as visual orthographic analysis (De Bleser et al.,
1997). Moreover, it will activate the phoneme output and/or the orthographic output
buffer as a temporary phonological store. A non-word spelling assessment was also
created (see below) as a parallel output task, again to allow investigation of
phonological (and orthographic) processing whilst again bypassing overt speech
production.
4.3.4 Spelling of non-words
As mentioned for reading, spelling of non-words is a potential way to investigate the
integrity of phonological input/output processing.whilst keeping overt speech output
demands at a minimum. For a speech assessment tool, investigation of spelling offers
both advantages and limitations. In terms of advantages, it again allows for
investigation of the phonological processing without the potential confound of a
speech output difficulty (which can be assessed through other tasks). However, as a
potential limitation, spelling requires not just robust phonological skill, but also the
knowledge of how a language combines letters to graphically signify those
representations – orthographic knowledge – and so is still not a “pure” measure of
phonological processing (Snowling & Stackhouse, 2013). Thus, similarly to reading,
spelling is best represented within the linguistic processing model, where spelling tasks
will involve auditory phoneme analysis (identification, segmentation), as well as the
Chapter 4: Methods
107
integrity of the phonological output buffer and the orthographic output buffer. While
stored representations (phonological input lexicon/orthographic output lexicon) may
be referred to in order to complete either the reading or spelling tasks, they are not
essential. Generally, errors in performances could indicate difficulties in one or more
levels (Beauvois & Dérouesné, 1981; Buchwald & Rapp, 2006; Domahs, De Bleser, &
Eisenberg, 2001; Goodman & Caramazza, 1986; Hatfield & Patterson, 1983; Partz,
Seron, & Linden, 1992; Roeltgen & Heilman, 1983; Tainturier & Rapp, 2003). However,
by a process of deduction using performance on tasks that use a different combination
of levels, more specific levels of difficulty can be isolated. In the task devised for the
current study, the participants hear a spoken non-word and are asked to write down
how they think it would be spelt if it was a real English word.
4.3.5 Spoonerism of non-words and real words
A spoonerism task is a phonological awareness task (i.e. sound manipulation) in which
the participant is asked to manipulate a linguistic unit. A commonly used format is that
the person completing the task has to exchange the initial onsets of two words, for
example, <car park> becomes <par cark>. Asking individuals to deliberately create
spoonerisms was first introduced as an assessment to detect more subtle phonological
processing difficulties in older children identified as having developmental dyslexia
(Stackhouse & Wells, 1991). If used with real words, it measures the ability to actively
reflect on the internal phonological structure of words but also gives an indication of
the quality of an individual’s phonological representations (Stackhouse & Wells, 1997).
If the test uses non-words as test items, less access to existing phonological
representations is involved, however, this version potentially adds more working
memory load (as no semantic-lexical or orthographic information can be accessed to
support the completion of the task). Phonological awareness can be difficult to
characterise in adulthood, as more basic measures of phonological awareness, for
example, rime detection or first phoneme identification may result in ceiling scores,
precluding the investigation of variability. Given its relative complexity, the spoonerism
task was selected for use here, as it has been found in other studies to be sensitive to
performance variation amongst adult populations (Brunswick, McCrory, Price, Frith &
Frith, 1999).
Chapter 4: Methods
108
Within the psycholinguistic model, the task can be located on the output side quite
close to lexical representations (motor program), when using real words, as
orthographic, semantic and phonological representations of the words might be saved
and used to perform the task. If non-words are used, there will be less reference to
existing lexical representations and once the phonological manipulation has been
carried out a new motor program will be created in order to verbalise the spoken
response.
Within the linguistic processing model, the manipulation of metalinguistic units is not
explicitly represented as a discrete processing stage, however in published
assessments based on this model one task assesses abilities in rhyme discrimination,
which potentially involves metaphonological judgement of larger phonological units
(De Bleser et al., 1997). Spoonerism tasks are typically presented in a spoken form and
so the both word and non-word stimuli will be processed via auditive phoneme
analysis. For real word stimuli, further processing at the levels of phonological input
and output lexicon will occur, while for the non-words, these lexica may be used little,
if at all. Adults often report that when completing this task, they visualise the written
word form of either the word or non-word presented, to help with the phonological
manipulation (Thomson, personal communication), which may thus also implicate the
orthographic output lexicon and buffer. To produce the spoken response to each trial,
the resultant response will pass from the phoneme output buffer to speech output.
A spoonerism with real words and non-words respectively was included in the current
assessment to test more advanced phonological processing both with and without the
support of existing representational knowledge. Two items are presented and the
participant manipulates the non-words or real words by swapping their onsets and
producing a new word pair.
4.4 Cognitive load
Moreover, cognitive complexity demands or cognitive load should generally be
mentioned as a crucial factor when assessing adult speech since matured cognitive
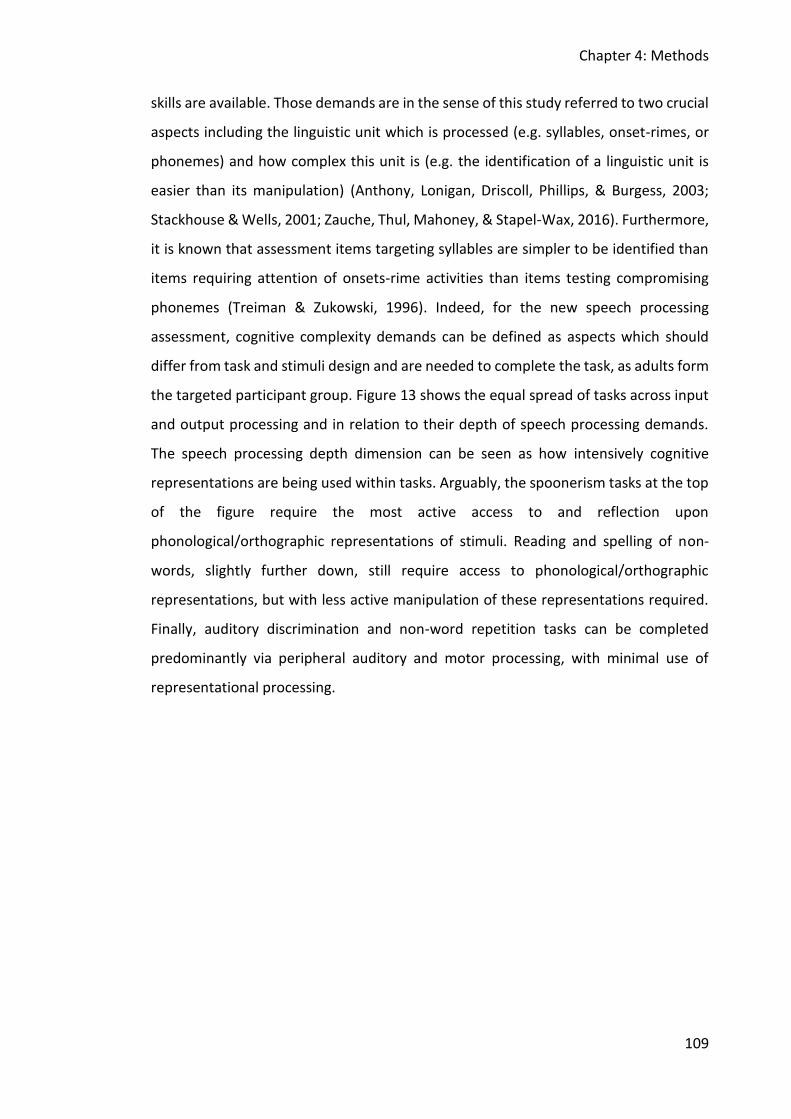
Chapter 4: Methods
109
skills are available. Those demands are in the sense of this study referred to two crucial
aspects including the linguistic unit which is processed (e.g. syllables, onset-rimes, or
phonemes) and how complex this unit is (e.g. the identification of a linguistic unit is
easier than its manipulation) (Anthony, Lonigan, Driscoll, Phillips, & Burgess, 2003;
Stackhouse & Wells, 2001; Zauche, Thul, Mahoney, & Stapel-Wax, 2016). Furthermore,
it is known that assessment items targeting syllables are simpler to be identified than
items requiring attention of onsets-rime activities than items testing compromising
phonemes (Treiman & Zukowski, 1996). Indeed, for the new speech processing
assessment, cognitive complexity demands can be defined as aspects which should
differ from task and stimuli design and are needed to complete the task, as adults form
the targeted participant group. Figure 13 shows the equal spread of tasks across input
and output processing and in relation to their depth of speech processing demands.
The speech processing depth dimension can be seen as how intensively cognitive
representations are being used within tasks. Arguably, the spoonerism tasks at the top
of the figure require the most active access to and reflection upon
phonological/orthographic representations of stimuli. Reading and spelling of non-
words, slightly further down, still require access to phonological/orthographic
representations, but with less active manipulation of these representations required.
Finally, auditory discrimination and non-word repetition tasks can be completed
predominantly via peripheral auditory and motor processing, with minimal use of
representational processing.
Chapter 4: Methods
110
Figure 13: Display of all tasks organised in input versus output and related to demand of representational processing.
As a next step, the number of items per task was considered. As mentioned earlier, a
key aim of the assessment tool was to provide a general overview of an individual’s
speech processing that would be practical to administer for both clinicians and
researchers. It was thus intended that total administration should not go beyond
approximately 30 minutes. Table 3 shows the number of items per task. As can be seen,
tasks that assess parallel levels, i.e. reading versus spelling; non-word and real word
spoonerisms; auditory discrimination versus non-word repetition, have the same
number of items. Given the higher possible influence of chance in the performance of
the auditory discrimination task (the chance of a correct response = 50 per cent), both
the discrimination and non-word repetition tasks had the highest number of items.
Table 3: Tasks with number of displayed items per task.
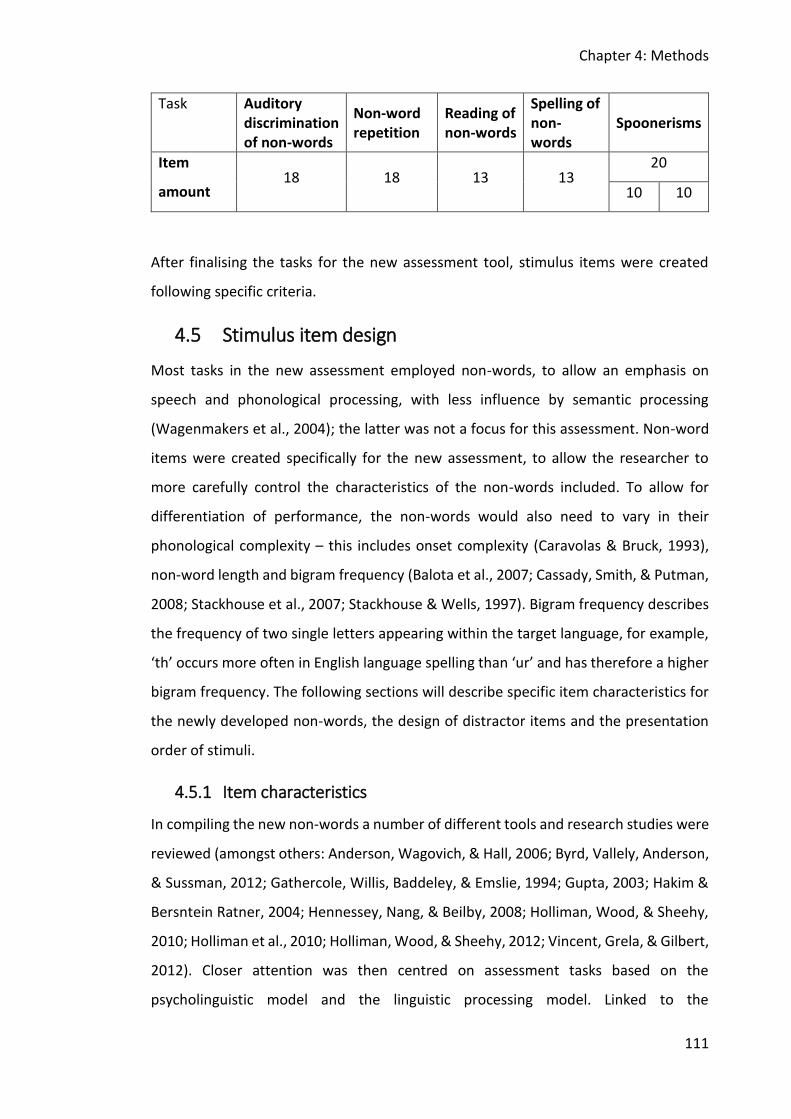
Chapter 4: Methods
111
Task Auditory discrimination of non-words
Non-word repetition
Reading of non-words
Spelling of non-words
Spoonerisms
Item
amount 18 18 13 13
20
10 10
After finalising the tasks for the new assessment tool, stimulus items were created
following specific criteria.
4.5 Stimulus item design
Most tasks in the new assessment employed non-words, to allow an emphasis on
speech and phonological processing, with less influence by semantic processing
(Wagenmakers et al., 2004); the latter was not a focus for this assessment. Non-word
items were created specifically for the new assessment, to allow the researcher to
more carefully control the characteristics of the non-words included. To allow for
differentiation of performance, the non-words would also need to vary in their
phonological complexity – this includes onset complexity (Caravolas & Bruck, 1993),
non-word length and bigram frequency (Balota et al., 2007; Cassady, Smith, & Putman,
2008; Stackhouse et al., 2007; Stackhouse & Wells, 1997). Bigram frequency describes
the frequency of two single letters appearing within the target language, for example,
‘th’ occurs more often in English language spelling than ‘ur’ and has therefore a higher
bigram frequency. The following sections will describe specific item characteristics for
the newly developed non-words, the design of distractor items and the presentation
order of stimuli.
4.5.1 Item characteristics
In compiling the new non-words a number of different tools and research studies were
reviewed (amongst others: Anderson, Wagovich, & Hall, 2006; Byrd, Vallely, Anderson,
& Sussman, 2012; Gathercole, Willis, Baddeley, & Emslie, 1994; Gupta, 2003; Hakim &
Bersntein Ratner, 2004; Hennessey, Nang, & Beilby, 2008; Holliman, Wood, & Sheehy,
2010; Holliman et al., 2010; Holliman, Wood, & Sheehy, 2012; Vincent, Grela, & Gilbert,
2012). Closer attention was then centred on assessment tasks based on the
psycholinguistic model and the linguistic processing model. Linked to the
Chapter 4: Methods
112
psycholinguistic model, non-words have often been created by manipulating real
words (Stackhouse et al., 2007). At a basic level, these manipulations have exchanged
vowels while keeping consonants stable. More complex non-words have also altered
consonants through changes in place and manner of articulation, voicing and devoicing
characteristics, and in the relative position of consonants, namely, metathesis. The
stress pattern of the real word the non-word derived from is typically maintained to
ensure real word likeness. Similar strategies can be found with tasks based on the
linguistic processing model (De Bleser et al., 1997). Management of differences in non-
words relied on onset and coda manipulations, contrast in manner of articulation,
frequency of the real word, and metathesis within a word. Importantly, all non-words
created through these means remain phonologically “legal”.
Given the precedent of deriving non-words from real words described above, it was
determined that the same strategy would be used for this specific assessment tool. This
would also help to ensure phonological and orthographic legality across the tool
(Frisch, Large, & Pisoni, 2000).
The following criteria were taken into consideration during the selection of test items
and are explained in more detail below.
(1) Word properties that are varied include:
O Stress pattern
O Syllable number (1-6 syllables)
O Phonological aspects (articulatory difficulty, complexity of onset)
(2) Orthographic control
(1) Word properties
Syllable number and stress pattern
The syllable lengths used in this tool were chosen based on previous research that also
aimed to measure individual differences in verbal performance (Gathercole et al.,
1994; New, Ferrand, Pallier, & Brysbaert, 2006) and the rules of English language (Frisch
et al., 2000). It was ensured that items increased in difficulty by presenting a range of
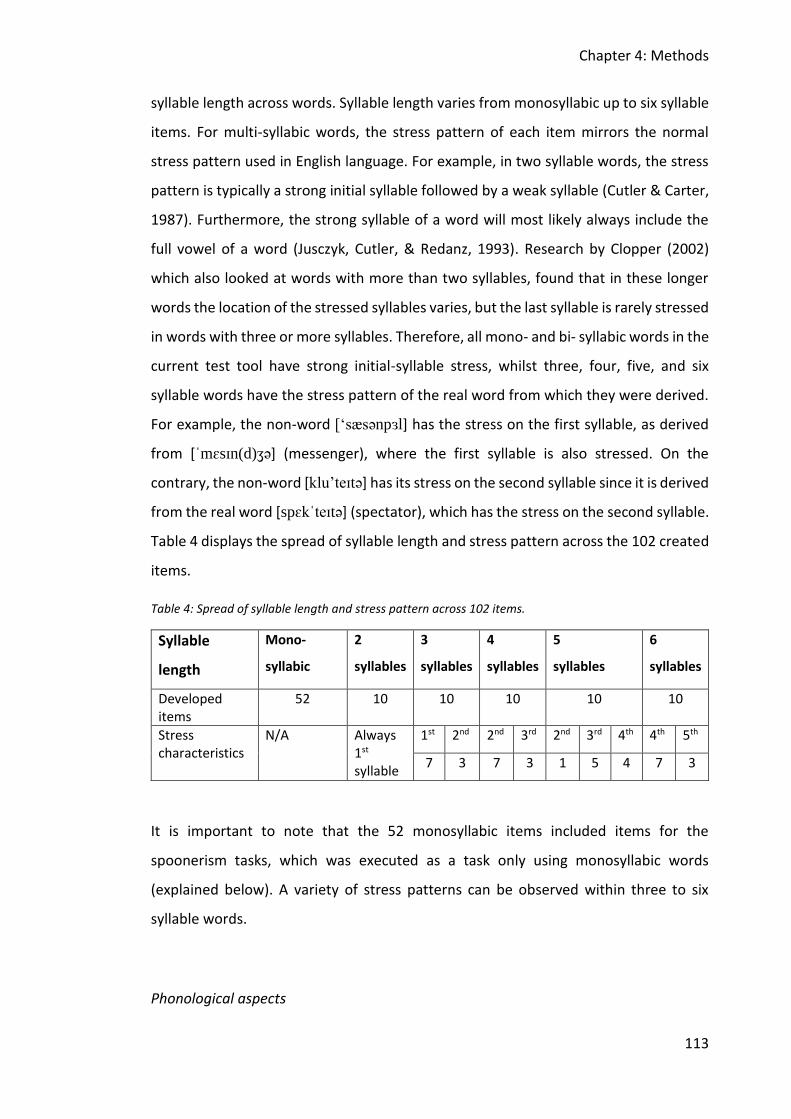
Chapter 4: Methods
113
syllable length across words. Syllable length varies from monosyllabic up to six syllable
items. For multi-syllabic words, the stress pattern of each item mirrors the normal
stress pattern used in English language. For example, in two syllable words, the stress
pattern is typically a strong initial syllable followed by a weak syllable (Cutler & Carter,
1987). Furthermore, the strong syllable of a word will most likely always include the
full vowel of a word (Jusczyk, Cutler, & Redanz, 1993). Research by Clopper (2002)
which also looked at words with more than two syllables, found that in these longer
words the location of the stressed syllables varies, but the last syllable is rarely stressed
in words with three or more syllables. Therefore, all mono- and bi- syllabic words in the
current test tool have strong initial-syllable stress, whilst three, four, five, and six
syllable words have the stress pattern of the real word from which they were derived.
For example, the non-word [‘sæsənpɜl] has the stress on the first syllable, as derived
from [ˈmɛsɪn(d)ʒə] (messenger), where the first syllable is also stressed. On the
contrary, the non-word [klu’teɪtə] has its stress on the second syllable since it is derived
from the real word [spɛkˈteɪtə] (spectator), which has the stress on the second syllable.
Table 4 displays the spread of syllable length and stress pattern across the 102 created
items.
Table 4: Spread of syllable length and stress pattern across 102 items.
Syllable
length
Mono-
syllabic
2
syllables
3
syllables
4
syllables
5
syllables
6
syllables
Developed items
52 10 10 10 10 10
Stress characteristics
N/A Always 1st syllable
1st 2nd 2nd 3rd 2nd 3rd 4th 4th 5th
7 3 7 3 1 5 4 7 3
It is important to note that the 52 monosyllabic items included items for the
spoonerism tasks, which was executed as a task only using monosyllabic words
(explained below). A variety of stress patterns can be observed within three to six
syllable words.
Phonological aspects
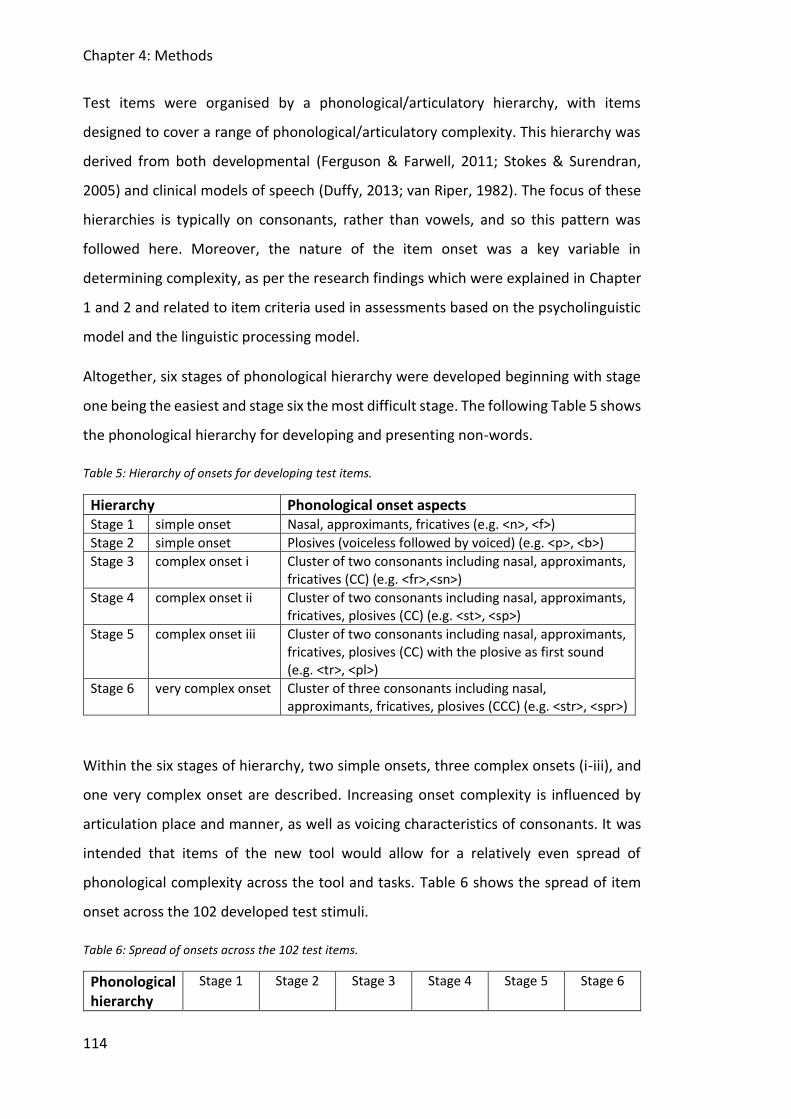
Chapter 4: Methods
114
Test items were organised by a phonological/articulatory hierarchy, with items
designed to cover a range of phonological/articulatory complexity. This hierarchy was
derived from both developmental (Ferguson & Farwell, 2011; Stokes & Surendran,
2005) and clinical models of speech (Duffy, 2013; van Riper, 1982). The focus of these
hierarchies is typically on consonants, rather than vowels, and so this pattern was
followed here. Moreover, the nature of the item onset was a key variable in
determining complexity, as per the research findings which were explained in Chapter
1 and 2 and related to item criteria used in assessments based on the psycholinguistic
model and the linguistic processing model.
Altogether, six stages of phonological hierarchy were developed beginning with stage
one being the easiest and stage six the most difficult stage. The following Table 5 shows
the phonological hierarchy for developing and presenting non-words.
Table 5: Hierarchy of onsets for developing test items.
Hierarchy Phonological onset aspects Stage 1 simple onset Nasal, approximants, fricatives (e.g. <n>, <f>)
Stage 2 simple onset Plosives (voiceless followed by voiced) (e.g. <p>, <b>)
Stage 3 complex onset i Cluster of two consonants including nasal, approximants, fricatives (CC) (e.g. <fr>,<sn>)
Stage 4 complex onset ii Cluster of two consonants including nasal, approximants, fricatives, plosives (CC) (e.g. <st>, <sp>)
Stage 5 complex onset iii Cluster of two consonants including nasal, approximants, fricatives, plosives (CC) with the plosive as first sound (e.g. <tr>, <pl>)
Stage 6 very complex onset Cluster of three consonants including nasal, approximants, fricatives, plosives (CCC) (e.g. <str>, <spr>)
Within the six stages of hierarchy, two simple onsets, three complex onsets (i-iii), and
one very complex onset are described. Increasing onset complexity is influenced by
articulation place and manner, as well as voicing characteristics of consonants. It was
intended that items of the new tool would allow for a relatively even spread of
phonological complexity across the tool and tasks. Table 6 shows the spread of item
onset across the 102 developed test stimuli.
Table 6: Spread of onsets across the 102 test items.
Phonological hierarchy
Stage 1 Stage 2 Stage 3 Stage 4 Stage 5 Stage 6
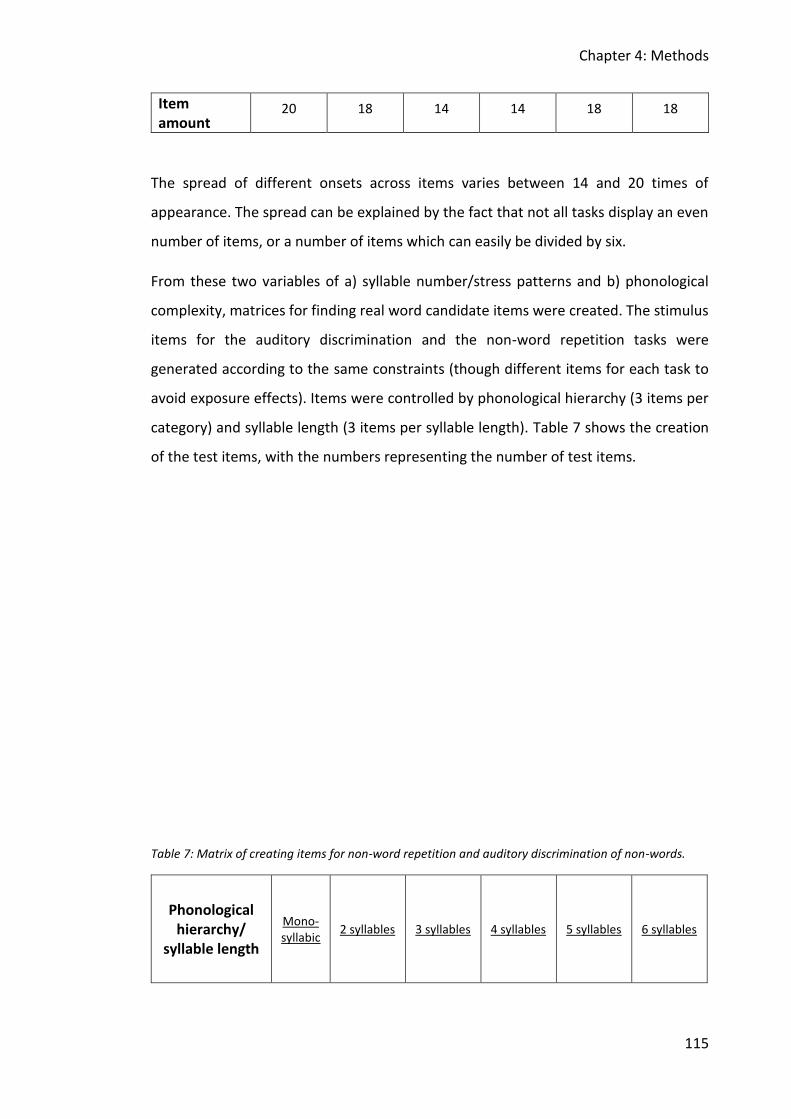
Chapter 4: Methods
115
Item amount
20 18 14 14 18 18
The spread of different onsets across items varies between 14 and 20 times of
appearance. The spread can be explained by the fact that not all tasks display an even
number of items, or a number of items which can easily be divided by six.
From these two variables of a) syllable number/stress patterns and b) phonological
complexity, matrices for finding real word candidate items were created. The stimulus
items for the auditory discrimination and the non-word repetition tasks were
generated according to the same constraints (though different items for each task to
avoid exposure effects). Items were controlled by phonological hierarchy (3 items per
category) and syllable length (3 items per syllable length). Table 7 shows the creation
of the test items, with the numbers representing the number of test items.
Table 7: Matrix of creating items for non-word repetition and auditory discrimination of non-words.
Phonological hierarchy/
syllable length
Mono-syllabic
2 syllables 3 syllables 4 syllables 5 syllables 6 syllables
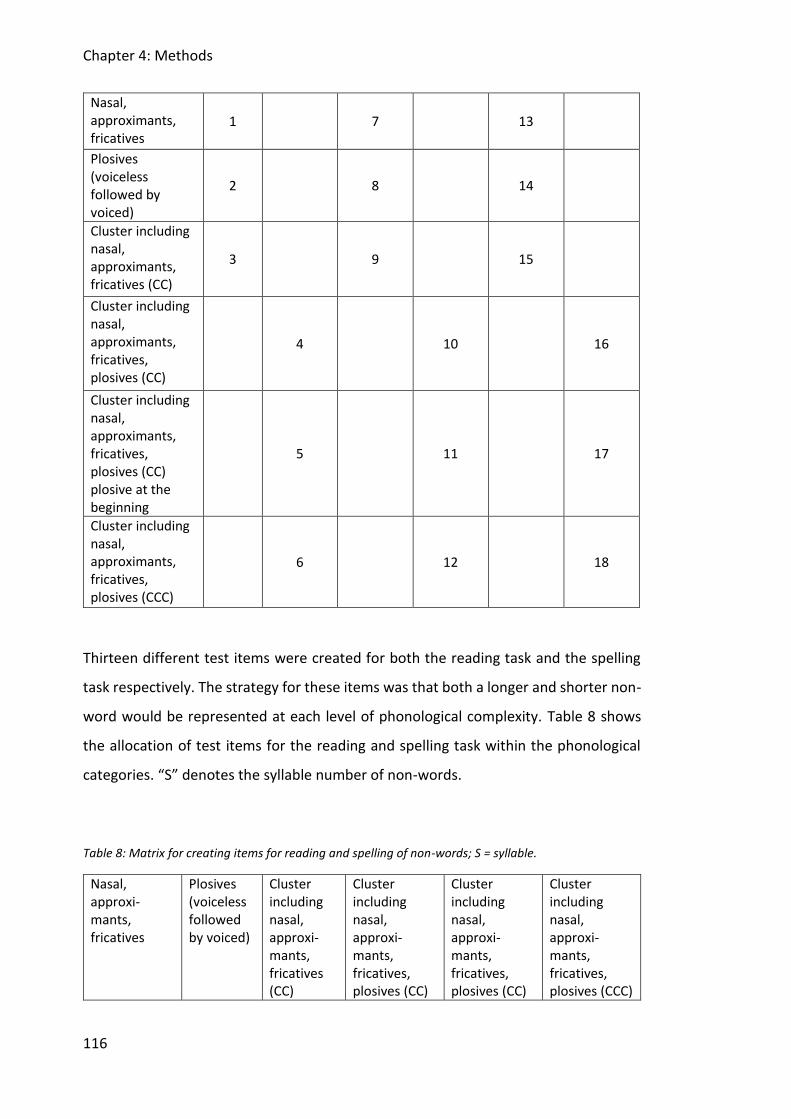
Chapter 4: Methods
116
Nasal, approximants, fricatives
1 7 13
Plosives (voiceless followed by voiced)
2 8 14
Cluster including nasal, approximants, fricatives (CC)
3 9 15
Cluster including nasal, approximants, fricatives, plosives (CC)
4 10 16
Cluster including nasal, approximants, fricatives, plosives (CC) plosive at the beginning
5 11 17
Cluster including nasal, approximants, fricatives, plosives (CCC)
6 12 18
Thirteen different test items were created for both the reading task and the spelling
task respectively. The strategy for these items was that both a longer and shorter non-
word would be represented at each level of phonological complexity. Table 8 shows
the allocation of test items for the reading and spelling task within the phonological
categories. “S” denotes the syllable number of non-words.
Table 8: Matrix for creating items for reading and spelling of non-words; S = syllable.
Nasal, approxi-mants, fricatives
Plosives (voiceless followed by voiced)
Cluster including nasal, approxi-mants, fricatives (CC)
Cluster including nasal, approxi-mants, fricatives, plosives (CC)
Cluster including nasal, approxi-mants, fricatives, plosives (CC)
Cluster including nasal, approxi-mants, fricatives, plosives (CCC)
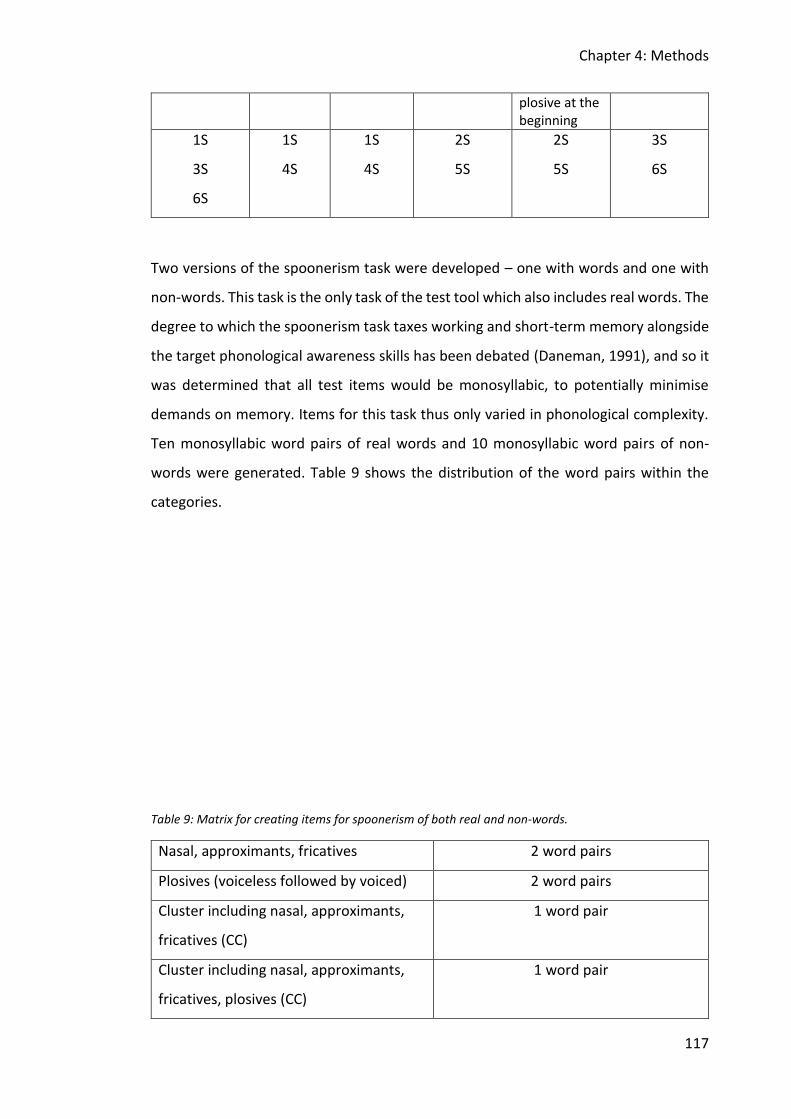
Chapter 4: Methods
117
plosive at the beginning
1S
3S
6S
1S
4S
1S
4S
2S
5S
2S
5S
3S
6S
Two versions of the spoonerism task were developed – one with words and one with
non-words. This task is the only task of the test tool which also includes real words. The
degree to which the spoonerism task taxes working and short-term memory alongside
the target phonological awareness skills has been debated (Daneman, 1991), and so it
was determined that all test items would be monosyllabic, to potentially minimise
demands on memory. Items for this task thus only varied in phonological complexity.
Ten monosyllabic word pairs of real words and 10 monosyllabic word pairs of non-
words were generated. Table 9 shows the distribution of the word pairs within the
categories.
Table 9: Matrix for creating items for spoonerism of both real and non-words.
Nasal, approximants, fricatives 2 word pairs
Plosives (voiceless followed by voiced) 2 word pairs
Cluster including nasal, approximants,
fricatives (CC)
1 word pair
Cluster including nasal, approximants,
fricatives, plosives (CC)
1 word pair
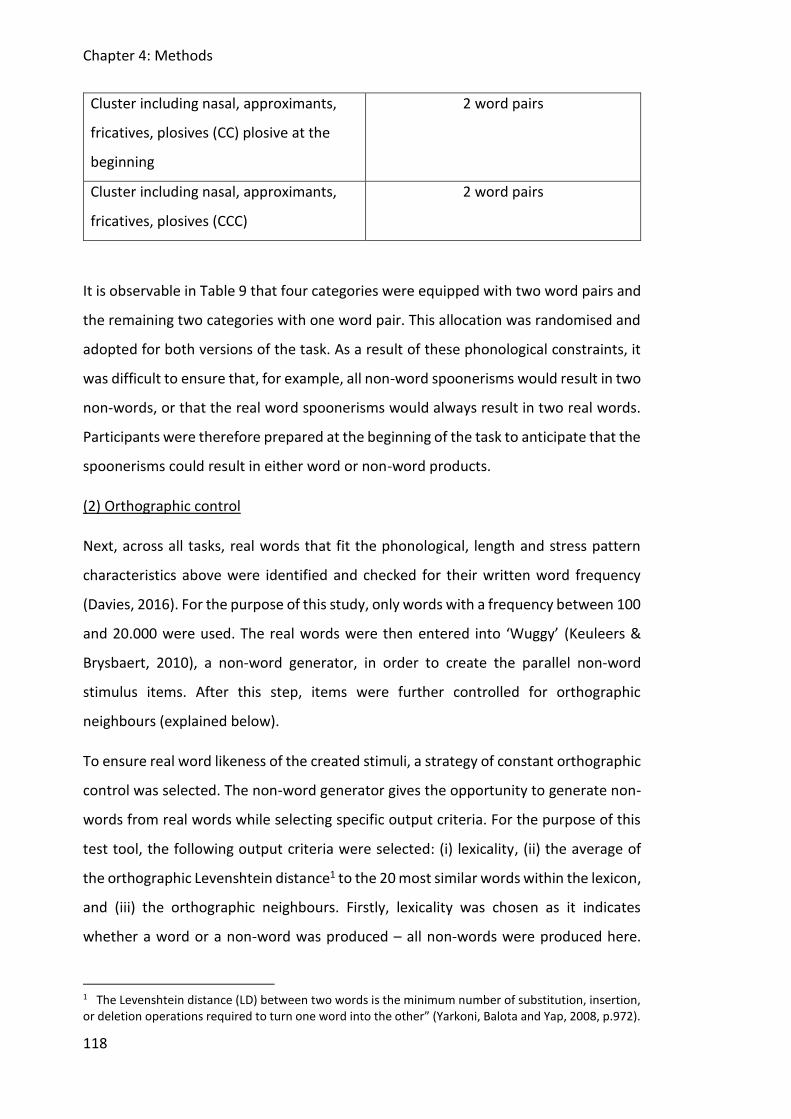
Chapter 4: Methods
118
Cluster including nasal, approximants,
fricatives, plosives (CC) plosive at the
beginning
2 word pairs
Cluster including nasal, approximants,
fricatives, plosives (CCC)
2 word pairs
It is observable in Table 9 that four categories were equipped with two word pairs and
the remaining two categories with one word pair. This allocation was randomised and
adopted for both versions of the task. As a result of these phonological constraints, it
was difficult to ensure that, for example, all non-word spoonerisms would result in two
non-words, or that the real word spoonerisms would always result in two real words.
Participants were therefore prepared at the beginning of the task to anticipate that the
spoonerisms could result in either word or non-word products.
(2) Orthographic control
Next, across all tasks, real words that fit the phonological, length and stress pattern
characteristics above were identified and checked for their written word frequency
(Davies, 2016). For the purpose of this study, only words with a frequency between 100
and 20.000 were used. The real words were then entered into ‘Wuggy’ (Keuleers &
Brysbaert, 2010), a non-word generator, in order to create the parallel non-word
stimulus items. After this step, items were further controlled for orthographic
neighbours (explained below).
To ensure real word likeness of the created stimuli, a strategy of constant orthographic
control was selected. The non-word generator gives the opportunity to generate non-
words from real words while selecting specific output criteria. For the purpose of this
test tool, the following output criteria were selected: (i) lexicality, (ii) the average of
the orthographic Levenshtein distance1 to the 20 most similar words within the lexicon,
and (iii) the orthographic neighbours. Firstly, lexicality was chosen as it indicates
whether a word or a non-word was produced – all non-words were produced here.
1 The Levenshtein distance (LD) between two words is the minimum number of substitution, insertion, or deletion operations required to turn one word into the other” (Yarkoni, Balota and Yap, 2008, p.972).
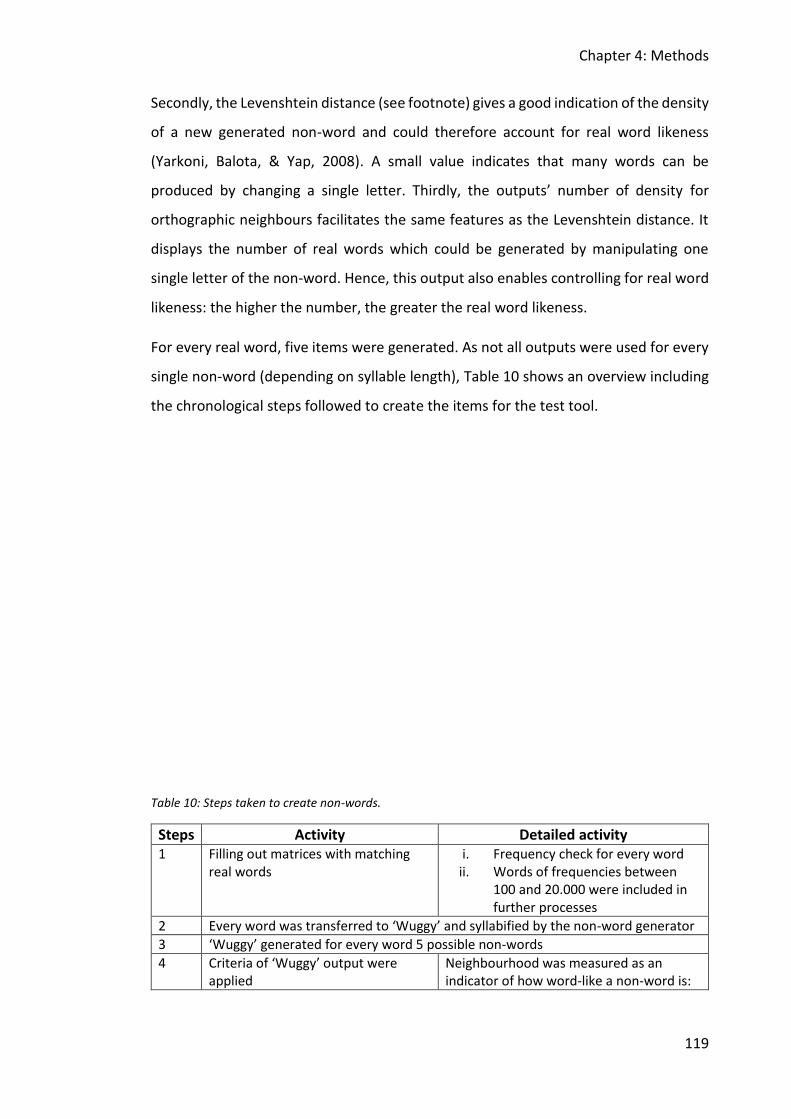
Chapter 4: Methods
119
Secondly, the Levenshtein distance (see footnote) gives a good indication of the density
of a new generated non-word and could therefore account for real word likeness
(Yarkoni, Balota, & Yap, 2008). A small value indicates that many words can be
produced by changing a single letter. Thirdly, the outputs’ number of density for
orthographic neighbours facilitates the same features as the Levenshtein distance. It
displays the number of real words which could be generated by manipulating one
single letter of the non-word. Hence, this output also enables controlling for real word
likeness: the higher the number, the greater the real word likeness.
For every real word, five items were generated. As not all outputs were used for every
single non-word (depending on syllable length), Table 10 shows an overview including
the chronological steps followed to create the items for the test tool.
Table 10: Steps taken to create non-words.
Steps Activity Detailed activity 1 Filling out matrices with matching
real words i. Frequency check for every word
ii. Words of frequencies between 100 and 20.000 were included in further processes
2 Every word was transferred to ‘Wuggy’ and syllabified by the non-word generator
3 ‘Wuggy’ generated for every word 5 possible non-words
4 Criteria of ‘Wuggy’ output were applied
Neighbourhood was measured as an indicator of how word-like a non-word is:
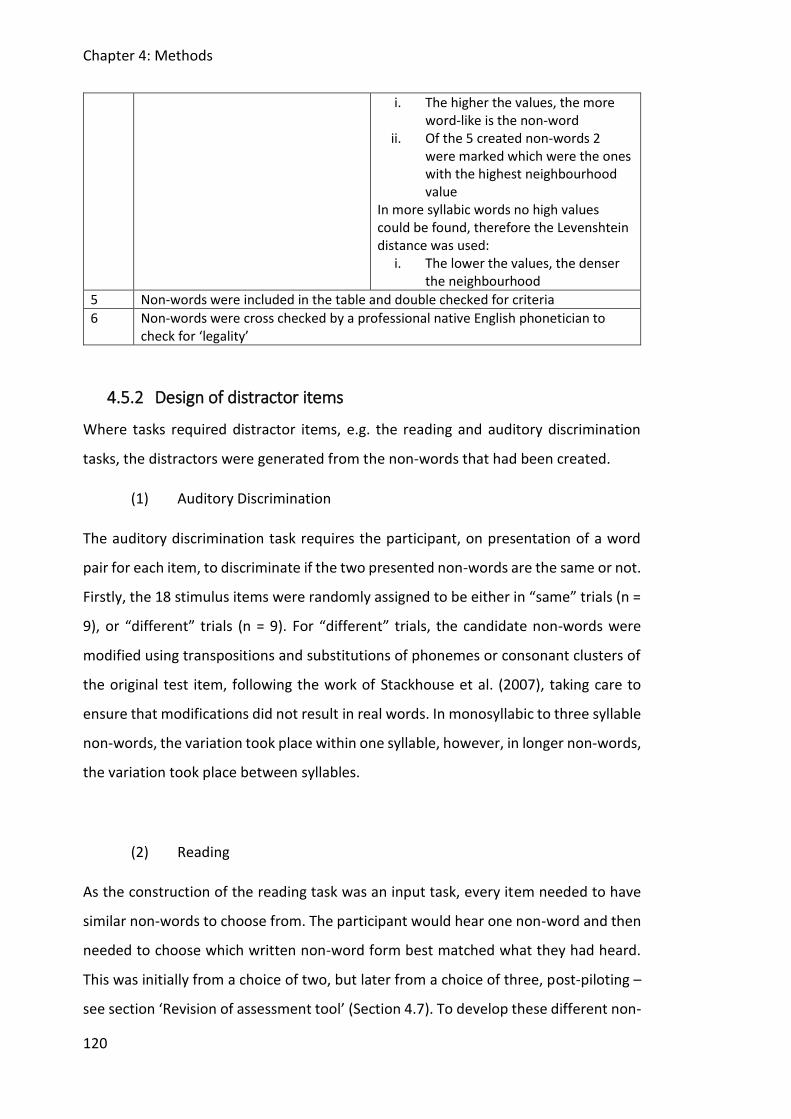
Chapter 4: Methods
120
i. The higher the values, the more word-like is the non-word
ii. Of the 5 created non-words 2 were marked which were the ones with the highest neighbourhood value
In more syllabic words no high values could be found, therefore the Levenshtein distance was used:
i. The lower the values, the denser the neighbourhood
5 Non-words were included in the table and double checked for criteria
6 Non-words were cross checked by a professional native English phonetician to check for ‘legality’
4.5.2 Design of distractor items
Where tasks required distractor items, e.g. the reading and auditory discrimination
tasks, the distractors were generated from the non-words that had been created.
(1) Auditory Discrimination
The auditory discrimination task requires the participant, on presentation of a word
pair for each item, to discriminate if the two presented non-words are the same or not.
Firstly, the 18 stimulus items were randomly assigned to be either in “same” trials (n =
9), or “different” trials (n = 9). For “different” trials, the candidate non-words were
modified using transpositions and substitutions of phonemes or consonant clusters of
the original test item, following the work of Stackhouse et al. (2007), taking care to
ensure that modifications did not result in real words. In monosyllabic to three syllable
non-words, the variation took place within one syllable, however, in longer non-words,
the variation took place between syllables.
(2) Reading
As the construction of the reading task was an input task, every item needed to have
similar non-words to choose from. The participant would hear one non-word and then
needed to choose which written non-word form best matched what they had heard.
This was initially from a choice of two, but later from a choice of three, post-piloting –
see section ‘Revision of assessment tool’ (Section 4.7). To develop these different non-
Chapter 4: Methods
121
words, dependent on the length of the test item, the manipulation was either a
substitution with a letter representing a similar sound (e.g. target word <sturand>;
manipulation <sturamd>) or a letter transposition within the non-word (target word
<deneselation>; manipulation <desenelation>). It was ensured that the orthographic
characteristics of all manipulated non-words were controlled for orthographic
transparency. This transparency was ensured by calculating orthographic neighbours
and Levenshtein distance for the distractor items. The same parameters as for the test
stimuli were used. Furthermore, a professional native English linguist checked the
items related to phonological and orthographic “legality”.
4.5.3 Presentation order of stimuli
In order to facilitate participant performance, it was decided that within each subtest
shorter non-word items would be presented first, and where relevant syllable length
would increase systematically through the course of the subtest. Within syllable length,
however, the final order of items was determined by a randomisation procedure
(selecting items from a hat). For subtests that did not vary in syllable length, the order
of item presentation was also determined by the same randomisation process. Once
the order of item presentation was confirmed, each participant then received this same
randomly-generated order during assessment.
After developing the first set of test items, a paper version of the tasks was piloted and
edited. The following section describes the pilot procedure, its outcomes and the
consequent changes to the tasks.
4.6 Pilot study
Prior to the main standardisation, a pilot study was carried out in order to explore the
appropriateness and scope of the new tool, especially items and task design. Goals of
the pilot study were to investigate i) if the newly created stimuli were appropriate to
assess speech processing skills in adults; ii) if the task instructions were clear and easy
to follow; iii) if the sequence of tasks was adequate; and iv) if the whole assessment
was manageable in approximately 20 to 30 minutes. Participants’ feedback was also
taken into consideration during this process. It was expected that outcomes of the pilot
Chapter 4: Methods
122
study would give insight into the transparency and comprehensives of the tasks and
stimuli design.
4.6.1 Design
A cross-sectional group study was carried out.
4.6.2 Participants
Nine university students were recruited who were all fluent English speakers and
between the age of 18 and 35. At the time of the data collection, all participants were
postgraduate students at the University of Sheffield, either from the Department of
Human Communication Sciences or from social science disciplines. By recruiting from
disciplines predominantly related to health or linguistic research, it was thought that
participants with relevant background knowledge could give more detailed feedback.
Participants were selected on the basis of the following criteria:
• Age between 18 and 35
• Fluent English speakers
• No history of speech and language difficulties
• No hearing loss
• No learning difficulties or neurological problems
Altogether, seven female and two male participants were recruited with a mean age of
26.7 years (standard deviation = 3.19 years).
4.6.3 Material
All tasks described in the previous sections were administered (see ‘Tasks’ Section 4.3).
The tasks were presented verbally by the investigator. In general, input tasks were
executed first, followed by the output tasks. Tasks increased in complexity within the
two categories. The sequence of tasks was:
1. Auditory discrimination of non-words
2. Reading of non-words
3. Non-word repetition
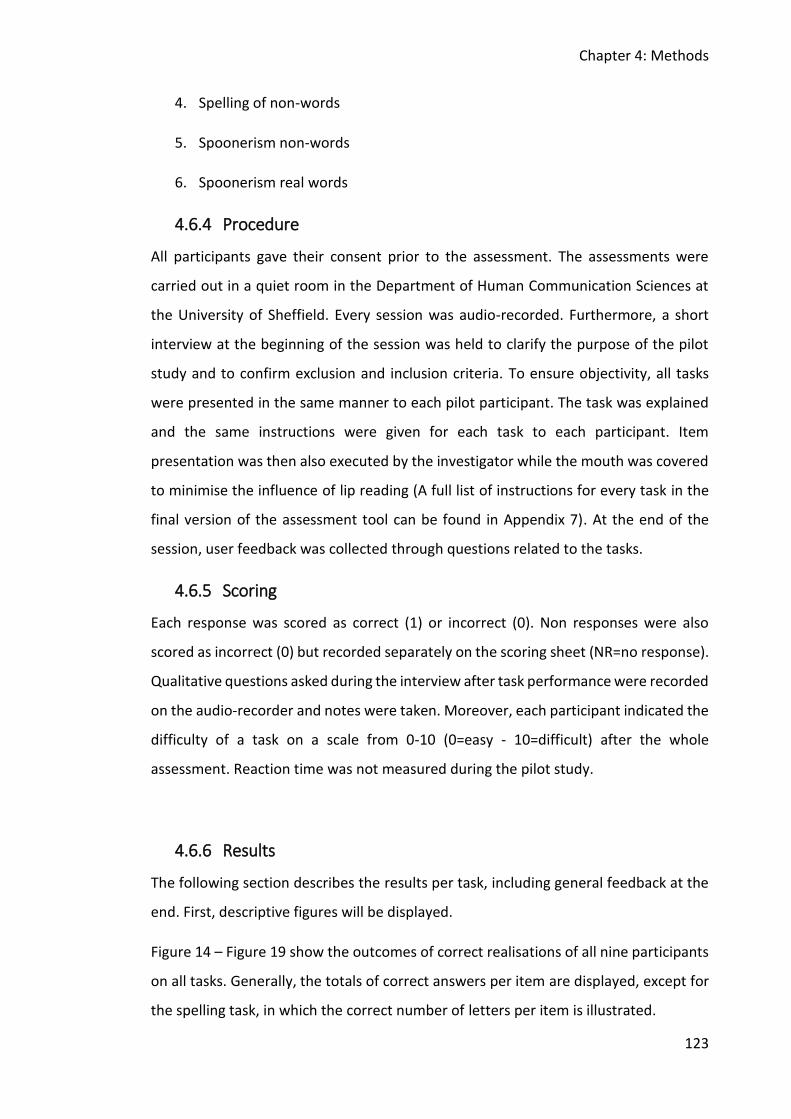
Chapter 4: Methods
123
4. Spelling of non-words
5. Spoonerism non-words
6. Spoonerism real words
4.6.4 Procedure
All participants gave their consent prior to the assessment. The assessments were
carried out in a quiet room in the Department of Human Communication Sciences at
the University of Sheffield. Every session was audio-recorded. Furthermore, a short
interview at the beginning of the session was held to clarify the purpose of the pilot
study and to confirm exclusion and inclusion criteria. To ensure objectivity, all tasks
were presented in the same manner to each pilot participant. The task was explained
and the same instructions were given for each task to each participant. Item
presentation was then also executed by the investigator while the mouth was covered
to minimise the influence of lip reading (A full list of instructions for every task in the
final version of the assessment tool can be found in Appendix 7). At the end of the
session, user feedback was collected through questions related to the tasks.
4.6.5 Scoring
Each response was scored as correct (1) or incorrect (0). Non responses were also
scored as incorrect (0) but recorded separately on the scoring sheet (NR=no response).
Qualitative questions asked during the interview after task performance were recorded
on the audio-recorder and notes were taken. Moreover, each participant indicated the
difficulty of a task on a scale from 0-10 (0=easy - 10=difficult) after the whole
assessment. Reaction time was not measured during the pilot study.
4.6.6 Results
The following section describes the results per task, including general feedback at the
end. First, descriptive figures will be displayed.
Figure 14 – Figure 19 show the outcomes of correct realisations of all nine participants
on all tasks. Generally, the totals of correct answers per item are displayed, except for
the spelling task, in which the correct number of letters per item is illustrated.
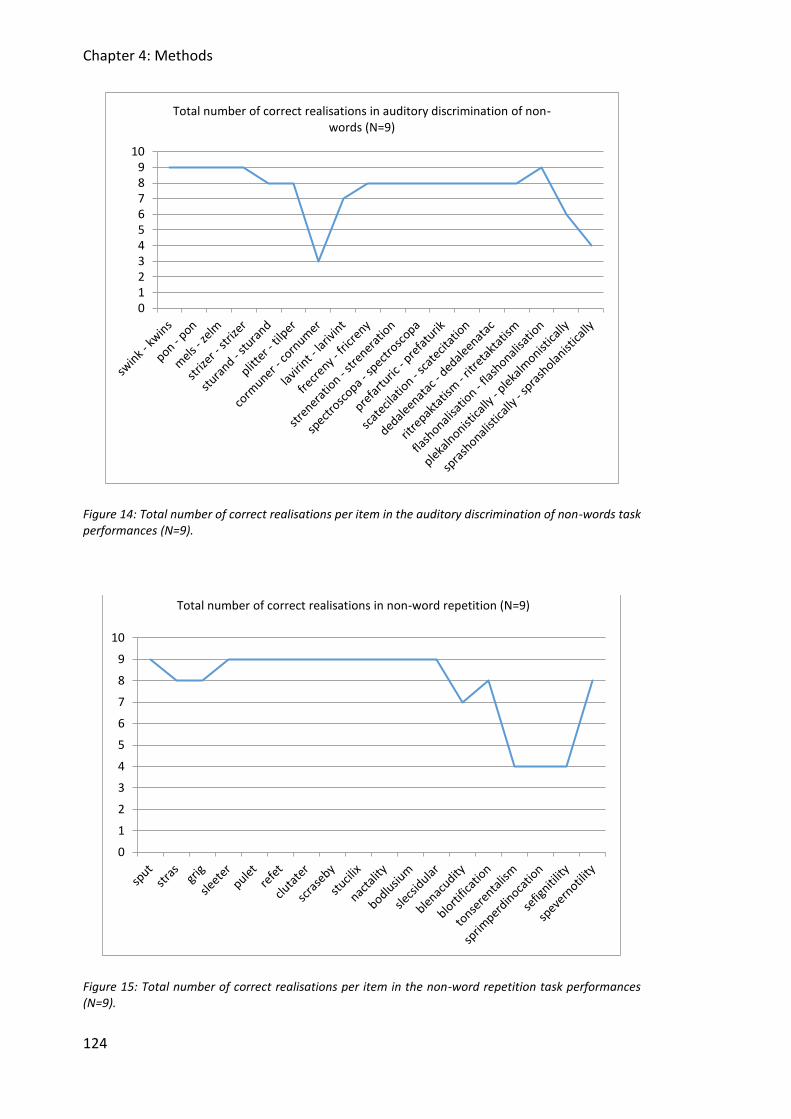
Chapter 4: Methods
124
Figure 14: Total number of correct realisations per item in the auditory discrimination of non-words task performances (N=9).
Figure 15: Total number of correct realisations per item in the non-word repetition task performances (N=9).
0123456789
10
Total number of correct realisations in auditory discrimination of non-words (N=9)
0
1
2
3
4
5
6
7
8
9
10
Total number of correct realisations in non-word repetition (N=9)
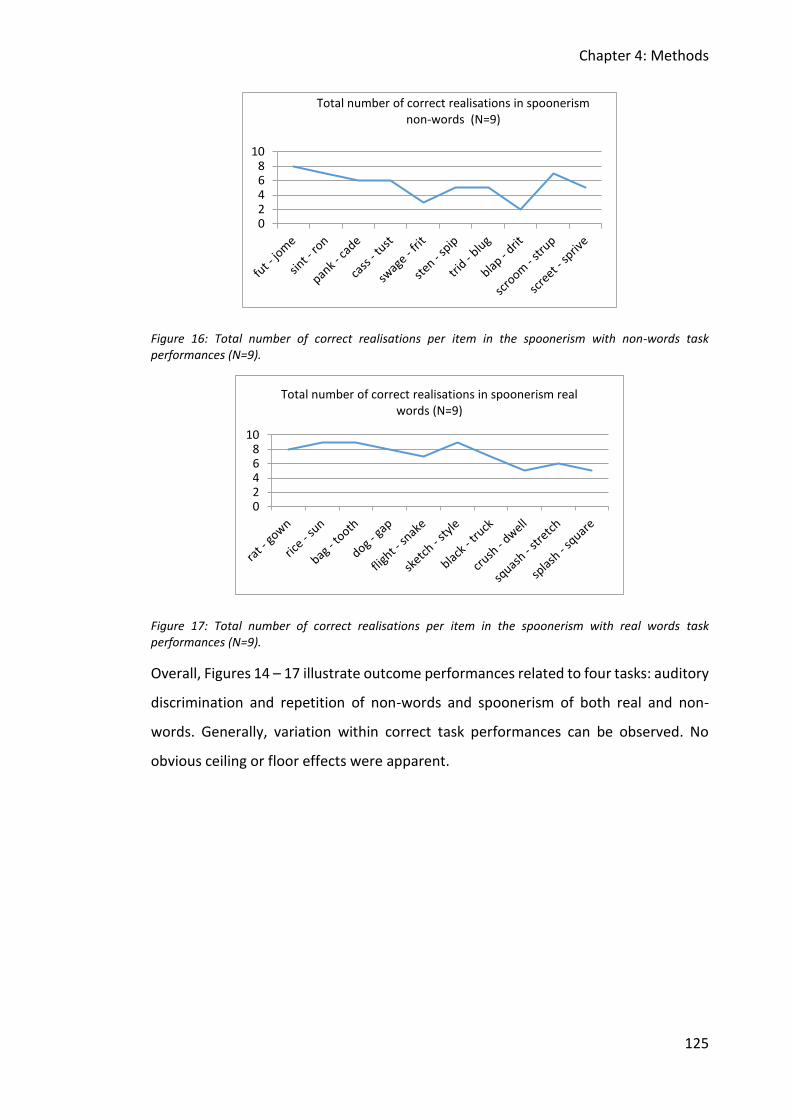
Chapter 4: Methods
125
Figure 16: Total number of correct realisations per item in the spoonerism with non-words task performances (N=9).
Figure 17: Total number of correct realisations per item in the spoonerism with real words task performances (N=9).
Overall, Figures 14 – 17 illustrate outcome performances related to four tasks: auditory
discrimination and repetition of non-words and spoonerism of both real and non-
words. Generally, variation within correct task performances can be observed. No
obvious ceiling or floor effects were apparent.
02468
10
Total number of correct realisations in spoonerism non-words (N=9)
02468
10
Total number of correct realisations in spoonerism real words (N=9)
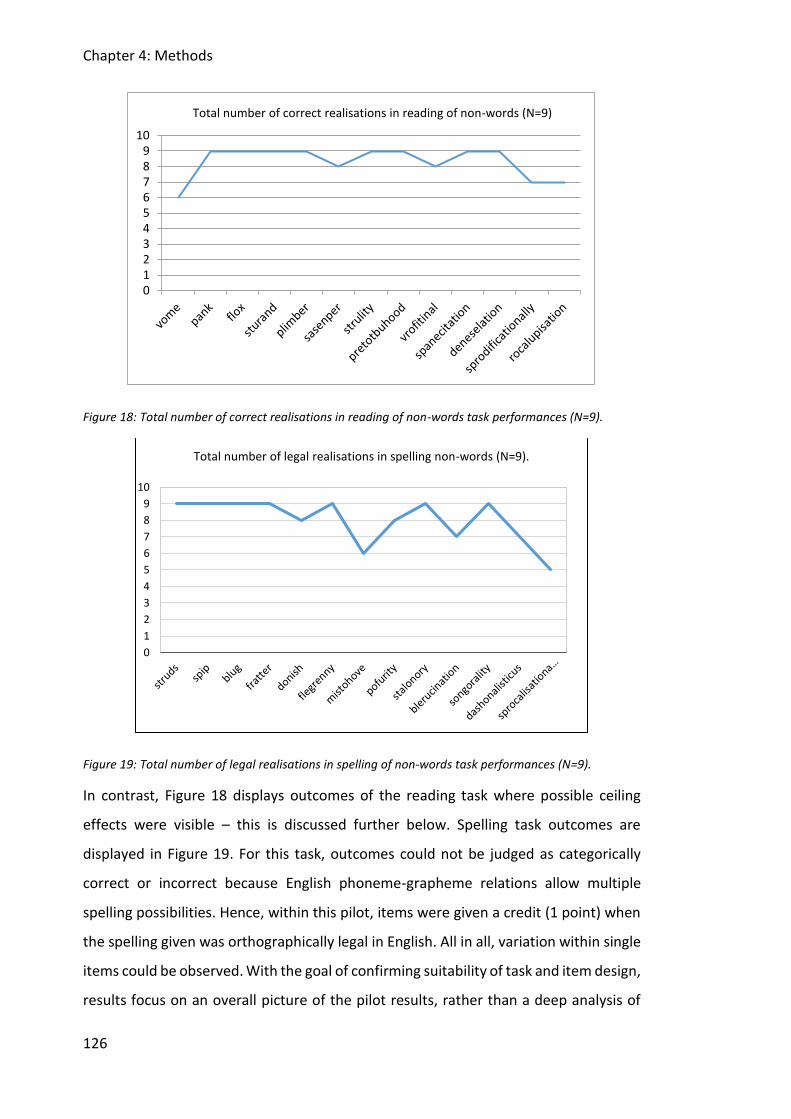
Chapter 4: Methods
126
Figure 18: Total number of correct realisations in reading of non-words task performances (N=9).
Figure 19: Total number of legal realisations in spelling of non-words task performances (N=9).
In contrast, Figure 18 displays outcomes of the reading task where possible ceiling
effects were visible – this is discussed further below. Spelling task outcomes are
displayed in Figure 19. For this task, outcomes could not be judged as categorically
correct or incorrect because English phoneme-grapheme relations allow multiple
spelling possibilities. Hence, within this pilot, items were given a credit (1 point) when
the spelling given was orthographically legal in English. All in all, variation within single
items could be observed. With the goal of confirming suitability of task and item design,
results focus on an overall picture of the pilot results, rather than a deep analysis of
0123456789
10
Total number of correct realisations in reading of non-words (N=9)
0
1
2
3
4
5
6
7
8
9
10
Total number of legal realisations in spelling non-words (N=9).
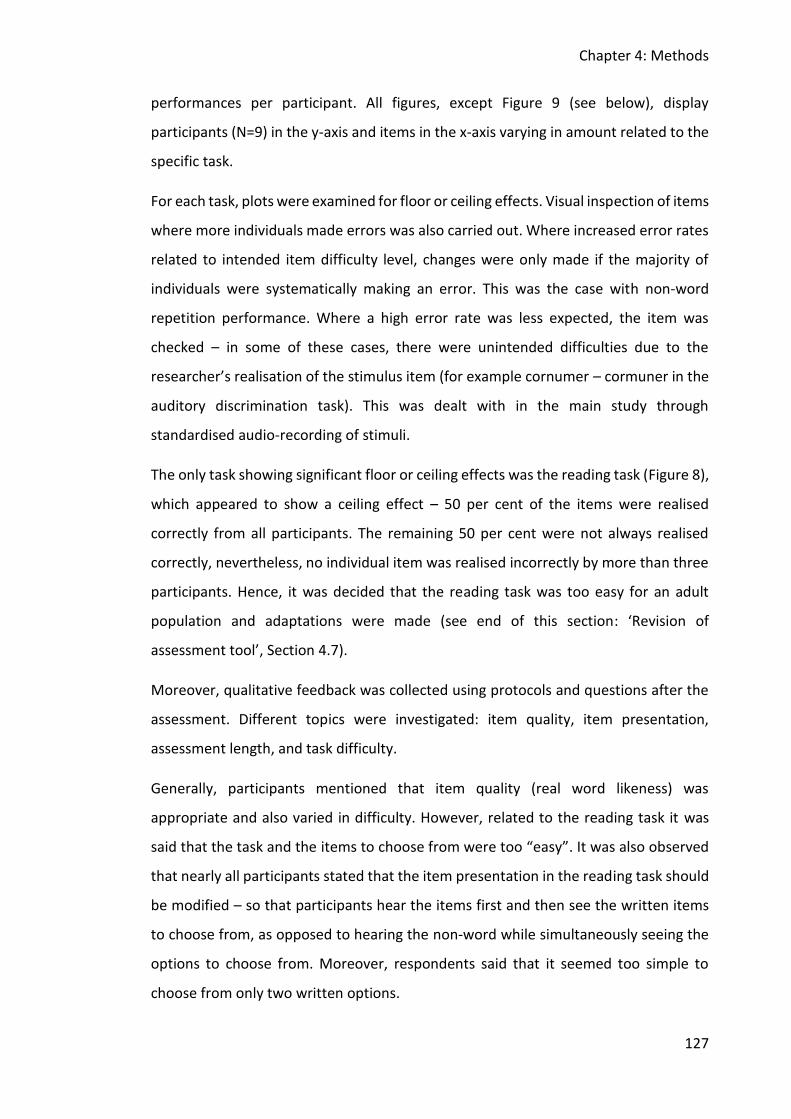
Chapter 4: Methods
127
performances per participant. All figures, except Figure 9 (see below), display
participants (N=9) in the y-axis and items in the x-axis varying in amount related to the
specific task.
For each task, plots were examined for floor or ceiling effects. Visual inspection of items
where more individuals made errors was also carried out. Where increased error rates
related to intended item difficulty level, changes were only made if the majority of
individuals were systematically making an error. This was the case with non-word
repetition performance. Where a high error rate was less expected, the item was
checked – in some of these cases, there were unintended difficulties due to the
researcher’s realisation of the stimulus item (for example cornumer – cormuner in the
auditory discrimination task). This was dealt with in the main study through
standardised audio-recording of stimuli.
The only task showing significant floor or ceiling effects was the reading task (Figure 8),
which appeared to show a ceiling effect – 50 per cent of the items were realised
correctly from all participants. The remaining 50 per cent were not always realised
correctly, nevertheless, no individual item was realised incorrectly by more than three
participants. Hence, it was decided that the reading task was too easy for an adult
population and adaptations were made (see end of this section: ‘Revision of
assessment tool’, Section 4.7).
Moreover, qualitative feedback was collected using protocols and questions after the
assessment. Different topics were investigated: item quality, item presentation,
assessment length, and task difficulty.
Generally, participants mentioned that item quality (real word likeness) was
appropriate and also varied in difficulty. However, related to the reading task it was
said that the task and the items to choose from were too “easy”. It was also observed
that nearly all participants stated that the item presentation in the reading task should
be modified – so that participants hear the items first and then see the written items
to choose from, as opposed to hearing the non-word while simultaneously seeing the
options to choose from. Moreover, respondents said that it seemed too simple to
choose from only two written options.
Chapter 4: Methods
128
Related to assessment length, participants were 100 per cent satisfied with the time it
took. On average, the assessment took 23 minutes which seemed appropriate for the
purpose of this assessment tool. This is supported by research investigating selective
attention spans of students in university settings, which is supposed to last
approximately 20 minutes (Cirillo, 2007). This attention span refers to concentration
on one task2. Furthermore, comments related to item quantity per task confirmed the
chosen number as suitable for the purpose of this test tool. However, all participants
also mentioned that they felt that tasks increased in difficulty which led to fatigue
towards the end of the assessment.
Participants were also asked to indicate their thoughts about the difficulty of each task
after the assessment. A scale from zero to 10 was presented and participants specified
the difficulty of each task by naming a number on this scale. Zero was characterised as
very simple and 10 as very difficult. Table 11 shows responses related to task difficulty.
Table 11: Scores given by pilot participants on scale from 1-10 for difficulty.
Name of task Auditory discriminations
Reading Non-word
repetition
Spelling Spoonerism with real
words
Spoonerism with non-
words
Most named degree of difficulty
1 2 2 7 7 8
Range of named degrees of difficulty
0-3 1-3 2-3 6-10 6-8 7-10
As shown in Table 11, input tasks were judged as simpler than output tasks. Auditory
discrimination was categorised as the simplest task of the assessment, whereas
spoonerism with non-words was considered the most difficult task. These results could
also relate back to feedback received about fatigue towards the end of the assessment,
because all task were presented in an order of constantly increasing difficulty. All
participants said that it was very difficult to perform the spoonerism tasks. They
expressed that the concentration level for these tasks is the highest. However, the
spoonerism manipulating non-words was judged as slightly more difficult than the real
2 Within higher education it is often suggested to change the setting of teaching every 20 minutes to prevent students from drifting off.
Chapter 4: Methods
129
word spoonerisms. Furthermore, spelling was characterised as a rather challenging
task as well. In contrast, participants found non-word repetition and reading tasks fairly
simple to perform.
Altogether, descriptive and qualitative results of piloting the assessment tool
suggested that the tool in its broader appearance seemed appropriate for the purpose
of this PhD work. However, several issues emerging from participant feedback needed
to be taken into consideration, followed by a revision of the detailed tasks and items.
It was also decided that additional objectivity and reliability could be achieved through
the audio-recording of relevant test items and standard visual presentation of the
instructions of each task.
Firstly, at task level, all tasks remained as originally designed, except for reading of non-
words. Due to feedback and descriptive results showing a ceiling effect, the task
needed to be manipulated and increased in difficulty. Secondly, specific items across
the tool needed to be revisited and re-checked for specific item characteristics. As a
final step, the test was prepared for computer presentation using recorded sound files
to ensure uniformity of stimulus presentation and standardised presentation timings,
as well as enabling recording of reaction time data. Finally, the order of task
presentation was revised in consideration of the feedback around fatigue and difficulty
of tasks.
4.7 Revision of assessment tool
In the revised assessment tool, a new task order ensured an appropriate sequence of
simple and difficult tasks during the assessment:
1. Auditory discrimination of non-words
2. Spelling of non-words
3. Non-word repetition
4. Spoonerism real words
5. Reading of non-words
6. Spoonerism non-words
Chapter 4: Methods
130
Revisions at the task level were applied to the non-word reading task. The number of
non-words to choose from was increased to three non-words per item. Furthermore,
the task was edited so that a participant would first hear the non-word and afterwards
the three choices would be displayed to the participant (as opposed to simultaneous
appearance of written and verbal input).
Revisions at item level were minimal. As a final step, items were checked by a
professional English phonetician, to ensure phonological and phonotactic legality.
Moreover, all items were recorded for presentation by a native English speaker to
guarantee standardised item presentation. All items were recorded using the IPA
transcriptions rather than the suggested orthographic spelling. The whole assessment
tool was programmed on a computer, using the software PsychoPy (Peirce, 2007),
ensuring that every participant would receive exactly the same instructions. It was also
decided that every test item should only be presented once, to increase the
standardisation of administration. Thus, objectivity was addressed and improved.
4.8 Finalised stimulus items
The following Table 12 to Table 17 show the finalised items per task. It is important to
notice that orthographic representations of the items are included in the tables, to aid
readability, but all recordings and presentations during the tasks were given based on
the IPA transcription of the item. Hence, spelling of presented items might not be the
only way to represent the spoken phonological form.(See section 4.9.5 for full details).
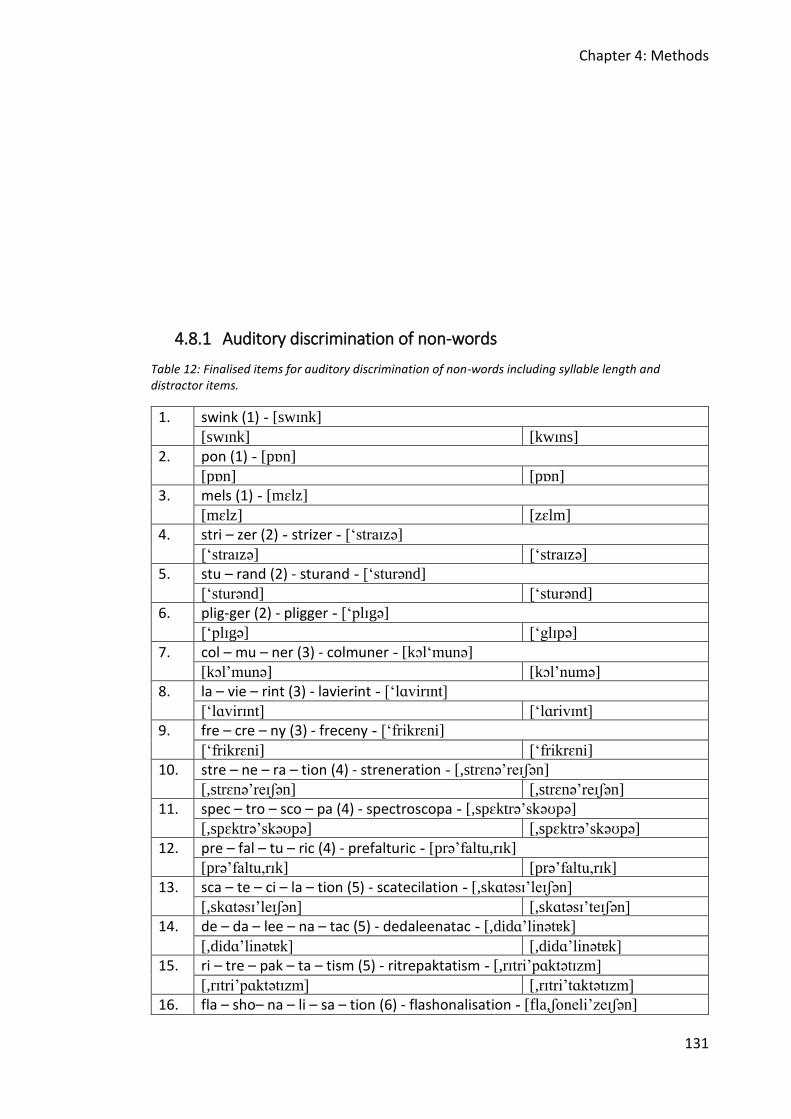
Chapter 4: Methods
131
4.8.1 Auditory discrimination of non-words
Table 12: Finalised items for auditory discrimination of non-words including syllable length and distractor items.
1. swink (1) - [swɪnk]
[swɪnk] [kwɪns]
2. pon (1) - [pɒn]
[pɒn] [pɒn]
3. mels (1) - [mɛlz]
[mɛlz] [zɛlm]
4. stri – zer (2) - strizer - [‘straɪzə]
[‘straɪzə] [‘straɪzə]
5. stu – rand (2) - sturand - [‘sturənd]
[‘sturənd] [‘sturənd]
6. plig-ger (2) - pligger - [‘plɪgə]
[‘plɪgə] [‘glɪpə]
7. col – mu – ner (3) - colmuner - [kɔl‘munə]
[kɔl’munə] [kɔl’numə]
8. la – vie – rint (3) - lavierint - [‘lɑvirɪnt]
[‘lɑvirɪnt] [‘lɑrivɪnt]
9. fre – cre – ny (3) - freceny - [‘frikrɛni]
[‘frikrɛni] [‘frikrɛni]
10. stre – ne – ra – tion (4) - streneration - [,strɛnə’reɪʃən]
[,strɛnə’reɪʃən] [,strɛnə’reɪʃən]
11. spec – tro – sco – pa (4) - spectroscopa - [,spɛktrə’skəʊpə]
[,spɛktrə’skəʊpə] [,spɛktrə’skəʊpə]
12. pre – fal – tu – ric (4) - prefalturic - [prə’faltu,rɪk]
[prə’faltu,rɪk] [prə’faltu,rɪk]
13. sca – te – ci – la – tion (5) - scatecilation - [,skɑtəsɪ’leɪʃən]
[,skɑtəsɪ’leɪʃən] [,skɑtəsɪ’teɪʃən]
14. de – da – lee – na – tac (5) - dedaleenatac - [,didɑ’linətɐk]
[,didɑ’linətɐk] [,didɑ’linətɐk]
15. ri – tre – pak – ta – tism (5) - ritrepaktatism - [,rɪtri’pɑktətɪzm]
[,rɪtri’pɑktətɪzm] [,rɪtri’tɑktətɪzm]
16. fla – sho– na – li – sa – tion (6) - flashonalisation - [fla,ʃoneli’zeɪʃən]
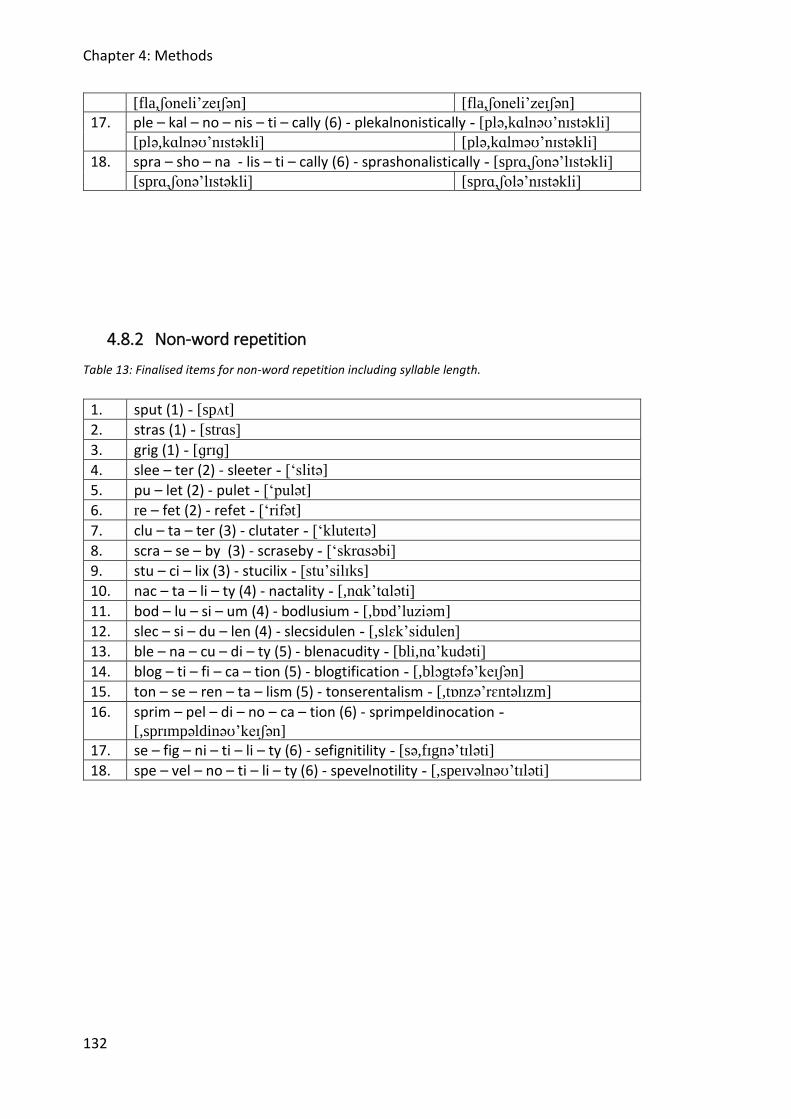
Chapter 4: Methods
132
[fla,ʃoneli’zeɪʃən] [fla,ʃoneli’zeɪʃən]
17. ple – kal – no – nis – ti – cally (6) - plekalnonistically - [plə,kɑlnəʊ’nɪstəkli]
[plə,kɑlnəʊ’nɪstəkli] [plə,kɑlməʊ’nɪstəkli]
18. spra – sho – na - lis – ti – cally (6) - sprashonalistically - [sprɑ,ʃonə’lɪstəkli]
[sprɑ,ʃonə’lɪstəkli] [sprɑ,ʃolə’nɪstəkli]
4.8.2 Non-word repetition
Table 13: Finalised items for non-word repetition including syllable length.
1. sput (1) - [spʌt]
2. stras (1) - [strɑs]
3. grig (1) - [ɡrɪɡ]
4. slee – ter (2) - sleeter - [‘slitə]
5. pu – let (2) - pulet - [‘pulət]
6. re – fet (2) - refet - [‘rifət]
7. clu – ta – ter (3) - clutater - [‘kluteɪtə]
8. scra – se – by (3) - scraseby - [‘skrɑsəbi]
9. stu – ci – lix (3) - stucilix - [stu’silɪks]
10. nac – ta – li – ty (4) - nactality - [,nɑk’tɑləti]
11. bod – lu – si – um (4) - bodlusium - [,bɒd’luziəm]
12. slec – si – du – len (4) - slecsidulen - [,slɛk’sidulen]
13. ble – na – cu – di – ty (5) - blenacudity - [bli,nɑ’kudəti]
14. blog – ti – fi – ca – tion (5) - blogtification - [,blɔgtəfə’keɪʃən]
15. ton – se – ren – ta – lism (5) - tonserentalism - [,tɒnzə’rɛntəlɪzm]
16. sprim – pel – di – no – ca – tion (6) - sprimpeldinocation -
[,sprɪmpəldinəʊ’keɪʃən]
17. se – fig – ni – ti – li – ty (6) - sefignitility - [sə,fɪgnə’tɪləti]
18. spe – vel – no – ti – li – ty (6) - spevelnotility - [,speɪvəlnəʊ’tɪləti]
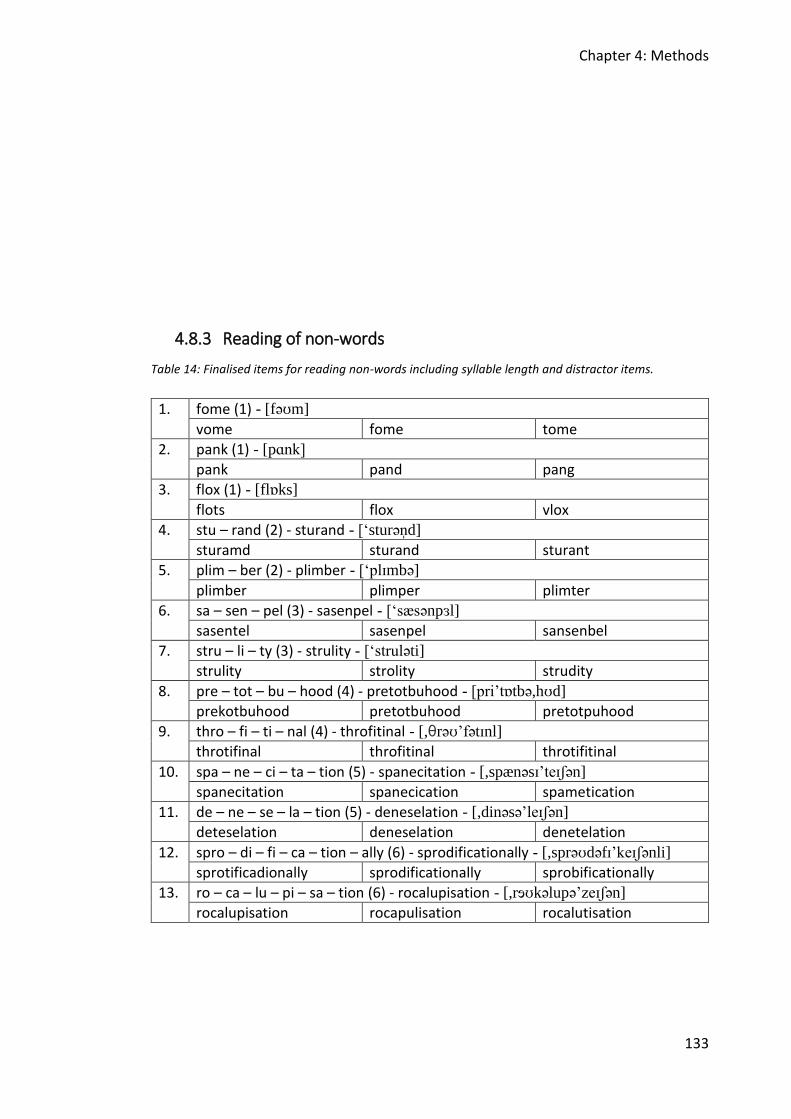
Chapter 4: Methods
133
4.8.3 Reading of non-words
Table 14: Finalised items for reading non-words including syllable length and distractor items.
1. fome (1) - [fəʊm]
vome fome tome
2. pank (1) - [pɑnk]
pank pand pang
3. flox (1) - [flɒks]
flots flox vlox
4. stu – rand (2) - sturand - [‘sturən̩d]
sturamd sturand sturant
5. plim – ber (2) - plimber - [‘plɪmbə]
plimber plimper plimter
6. sa – sen – pel (3) - sasenpel - [‘sæsənpɜl]
sasentel sasenpel sansenbel
7. stru – li – ty (3) - strulity - [‘struləti]
strulity strolity strudity
8. pre – tot – bu – hood (4) - pretotbuhood - [pri’tɒtbə,hʊd]
prekotbuhood pretotbuhood pretotpuhood
9. thro – fi – ti – nal (4) - throfitinal - [,θrəʊ’fətɪnl]
throtifinal throfitinal throtifitinal
10. spa – ne – ci – ta – tion (5) - spanecitation - [,spænəsɪ’teɪʃən]
spanecitation spanecication spametication
11. de – ne – se – la – tion (5) - deneselation - [,dinəsə’leɪʃən]
deteselation deneselation denetelation
12. spro – di – fi – ca – tion – ally (6) - sprodificationally - [,sprəʊdəfɪ’keɪʃənli]
sprotificadionally sprodificationally sprobificationally
13. ro – ca – lu – pi – sa – tion (6) - rocalupisation - [,rɘʊkəlupə’zeɪʃən]
rocalupisation rocapulisation rocalutisation
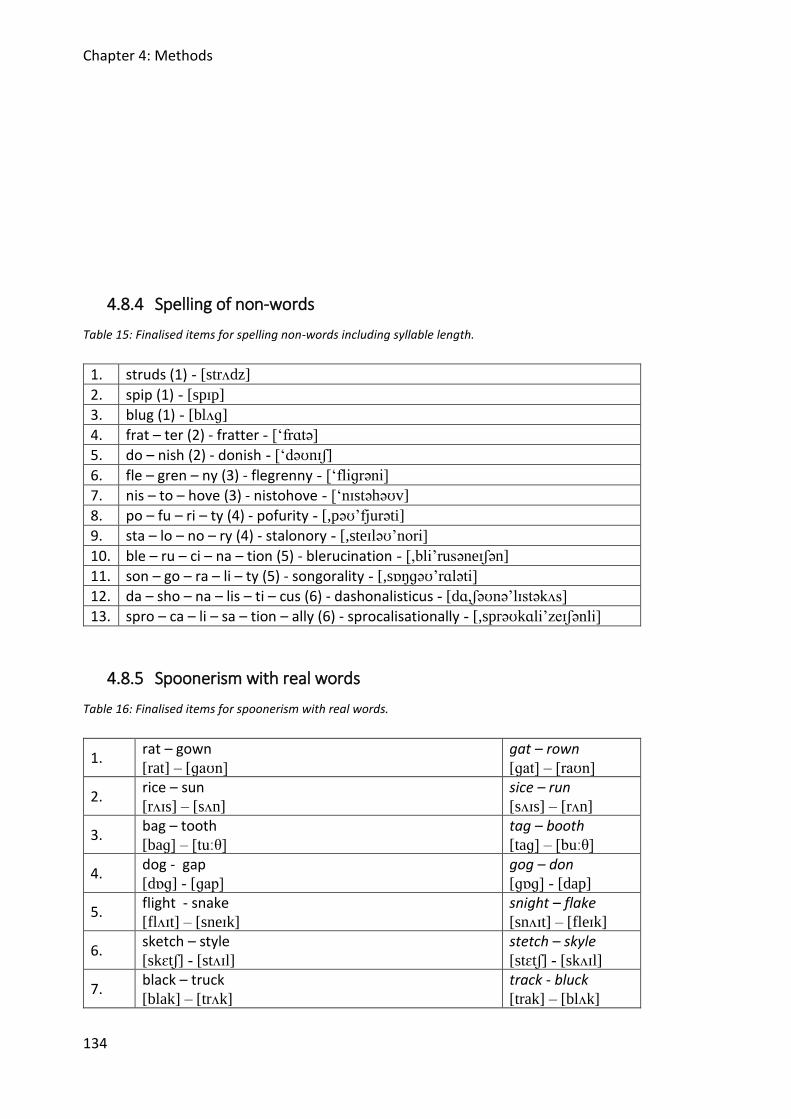
Chapter 4: Methods
134
4.8.4 Spelling of non-words
Table 15: Finalised items for spelling non-words including syllable length.
1. struds (1) - [strʌdz]
2. spip (1) - [spɪp]
3. blug (1) - [blʌɡ]
4. frat – ter (2) - fratter - [‘frɑtə]
5. do – nish (2) - donish - [‘dəʊnɪʃ]
6. fle – gren – ny (3) - flegrenny - [‘fliɡrəni]
7. nis – to – hove (3) - nistohove - [‘nɪstəhəʊv]
8. po – fu – ri – ty (4) - pofurity - [,pəʊ’fjurəti]
9. sta – lo – no – ry (4) - stalonory - [,steɪləʊ’nori]
10. ble – ru – ci – na – tion (5) - blerucination - [,bli’rusəneɪʃən]
11. son – go – ra – li – ty (5) - songorality - [,sɒŋɡəʊ’rɑləti]
12. da – sho – na – lis – ti – cus (6) - dashonalisticus - [dɑ,ʃəʊnə’lɪstəkʌs]
13. spro – ca – li – sa – tion – ally (6) - sprocalisationally - [,sprəʊkɑli’zeɪʃənli]
4.8.5 Spoonerism with real words
Table 16: Finalised items for spoonerism with real words.
1. rat – gown [rat] – [ɡaʊn]
gat – rown [ɡat] – [raʊn]
2. rice – sun [rʌɪs] – [sʌn]
sice – run [sʌɪs] – [rʌn]
3. bag – tooth [baɡ] – [tuːθ]
tag – booth [taɡ] – [buːθ]
4. dog - gap [dɒɡ] - [ɡap]
gog – don [ɡɒɡ] - [dap]
5. flight - snake [flʌɪt] – [sneɪk]
snight – flake [snʌɪt] – [fleɪk]
6. sketch – style [skɛtʃ] - [stʌɪl]
stetch – skyle [stɛtʃ] - [skʌɪl]
7. black – truck [blak] – [trʌk]
track - bluck [trak] – [blʌk]
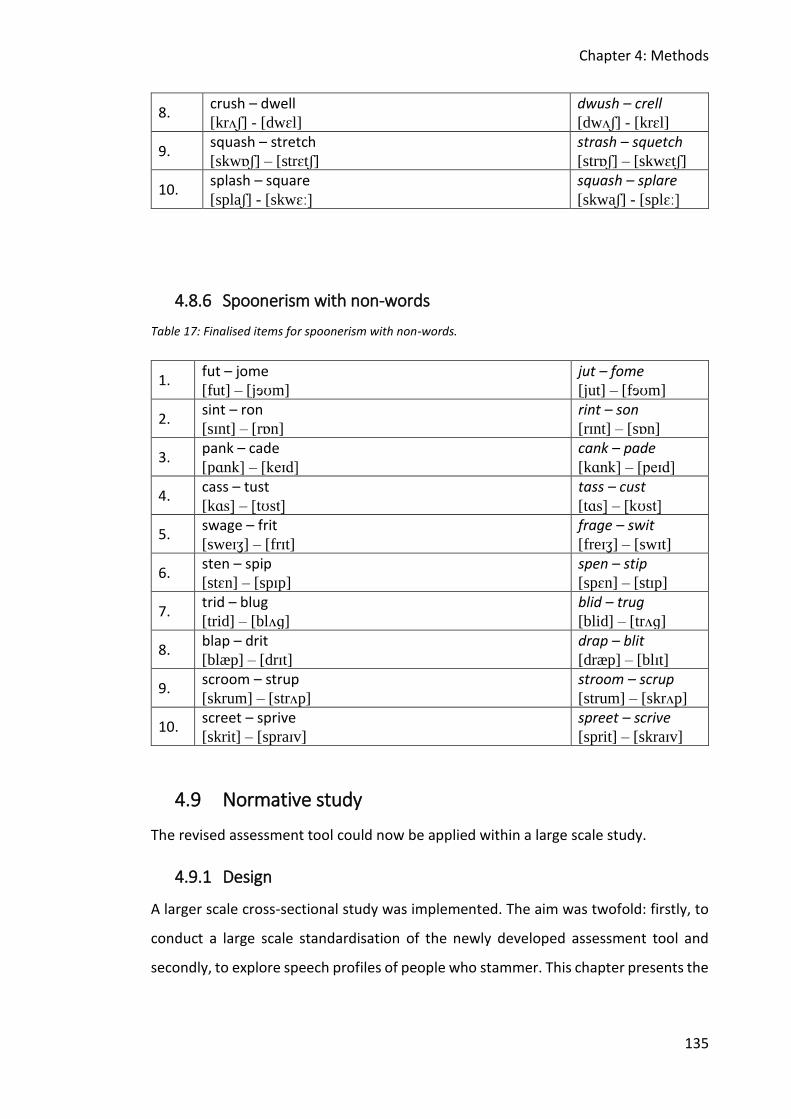
Chapter 4: Methods
135
8. crush – dwell [krʌʃ] - [dwɛl]
dwush – crell [dwʌʃ] - [krɛl]
9. squash – stretch [skwɒʃ] – [strɛtʃ]
strash – squetch [strɒʃ] – [skwɛtʃ]
10. splash – square [splaʃ] - [skwɛː]
squash – splare [skwaʃ] - [splɛː]
4.8.6 Spoonerism with non-words
Table 17: Finalised items for spoonerism with non-words.
1. fut – jome [fut] – [jɘʊm]
jut – fome [jut] – [fɘʊm]
2. sint – ron [sɪnt] – [rɒn]
rint – son [rɪnt] – [sɒn]
3. pank – cade [pɑnk] – [keɪd]
cank – pade [kɑnk] – [peɪd]
4. cass – tust [kɑs] – [tʊst]
tass – cust [tɑs] – [kʊst]
5. swage – frit [sweɪʒ] – [frɪt]
frage – swit [freɪʒ] – [swɪt]
6. sten – spip [stɛn] – [spɪp]
spen – stip [spɛn] – [stɪp]
7. trid – blug [trid] – [blʌɡ]
blid – trug [blid] – [trʌɡ]
8. blap – drit [blæp] – [drɪt]
drap – blit [dræp] – [blɪt]
9. scroom – strup [skrum] – [strʌp]
stroom – scrup [strum] – [skrʌp]
10. screet – sprive [skrit] – [spraɪv]
spreet – scrive [sprit] – [skraɪv]
4.9 Normative study
The revised assessment tool could now be applied within a large scale study.
4.9.1 Design
A larger scale cross-sectional study was implemented. The aim was twofold: firstly, to
conduct a large scale standardisation of the newly developed assessment tool and
secondly, to explore speech profiles of people who stammer. This chapter presents the
Chapter 4: Methods
136
methodological steps related to the standardisation process. Chapter 4.10 focuses on
methods and results of the mixed methods study of people who stammer.
4.9.2 Participants
The same inclusion and exclusion criteria as described in the pilot study were applied.
At the time of data collection all participants were students at the University of
Sheffield, and were selected according to the following criteria:
• Age between 18 and 35
• University students (undergraduate or postgraduate)
• Fluent native English speakers
• No history of speech and language difficulties
• No hearing loss
• No learning difficulties or neurological problems
It was decided to assess monolingual English speakers; knowing English as a
second/less fluent language could detrimentally impact performance on these tasks,
which would in turn make the comparison of the norm group to individuals with speech
difficulties more difficult to interpret. Recruitment of students was conducted using
the university’s email system. A short description of the study and feasibility to take
part was explained and students were invited to take part in the study. If they were
interested they could fill out a Google Form indicating that they were happy to
volunteer. The whole process was anonymous. The investigator then invited students
who signed up via email and sent them a link where they could sign up for an
assessment time slot. Confidentiality was guaranteed. Furthermore, students could
enter a prize draw to win one of 20 available Amazon vouchers.
Altogether, 101 participants were recruited. An age range from 18 to 35 was
represented from a range of study disciplines. The mean age of the whole cohort was
24.38 years with a standard deviation of 4.6 years. Just over 85 per cent of the sample
was female, of whom approximately 15 per cent reported speech and language
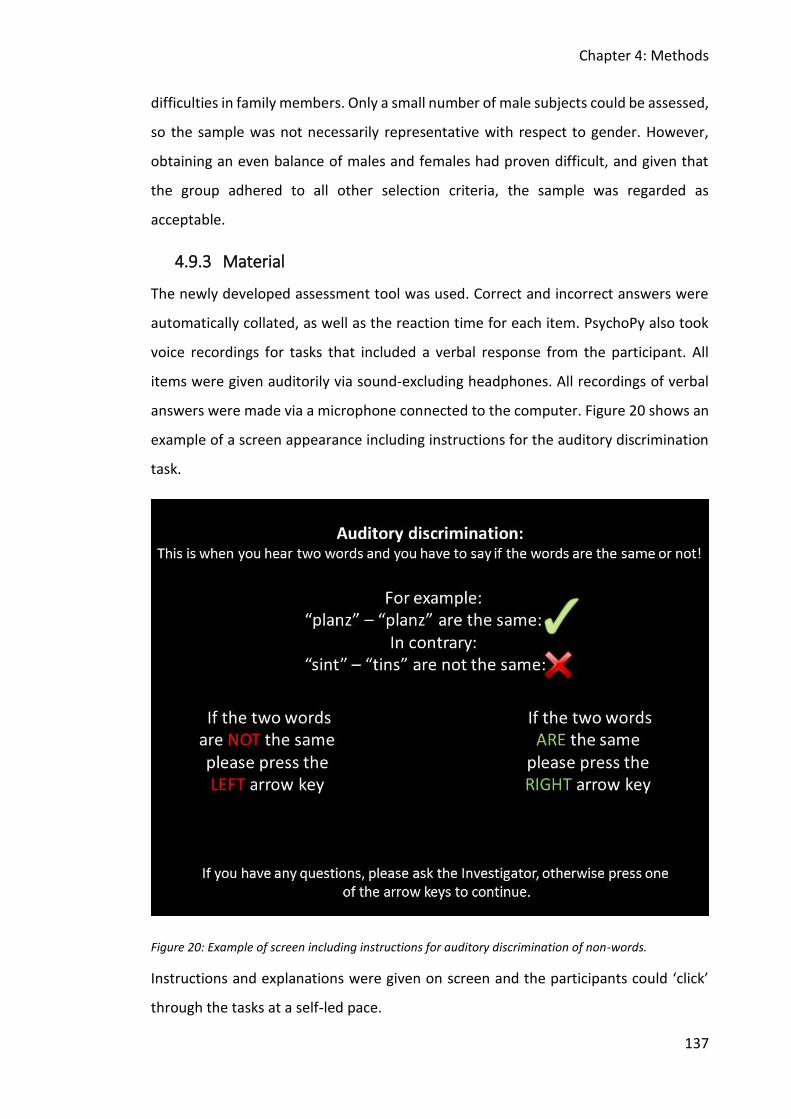
Chapter 4: Methods
137
difficulties in family members. Only a small number of male subjects could be assessed,
so the sample was not necessarily representative with respect to gender. However,
obtaining an even balance of males and females had proven difficult, and given that
the group adhered to all other selection criteria, the sample was regarded as
acceptable.
4.9.3 Material
The newly developed assessment tool was used. Correct and incorrect answers were
automatically collated, as well as the reaction time for each item. PsychoPy also took
voice recordings for tasks that included a verbal response from the participant. All
items were given auditorily via sound-excluding headphones. All recordings of verbal
answers were made via a microphone connected to the computer. Figure 20 shows an
example of a screen appearance including instructions for the auditory discrimination
task.
Figure 20: Example of screen including instructions for auditory discrimination of non-words.
Instructions and explanations were given on screen and the participants could ‘click’
through the tasks at a self-led pace.
Chapter 4: Methods
138
4.9.4 Procedure
Prior to assessment and study execution, ethical approval was obtained from the
University of Sheffield, Faculty of Medicine, Dentistry, and Health (Appendix 1). After
first recruitment, the data collection started in November 2014. Data collection was
completed in June 2016. The assessments were carried out in a quiet room in the
Department of Human Communication Sciences at the University of Sheffield. On
arrival, all participants gave their consent to take part in the study (Appendix 3). A short
interview was held at the beginning of the session to clarify the purpose of the study
and to confirm exclusion and inclusion criteria (information sheet was handed out:
Appendix 2). The sessions were recorded on a digital audio-recorder. The time taken
to complete the assessment was approximately 20 – 25 minutes.
4.9.5 Scoring
Each response was scored as correct (1) or incorrect (0) for the input tasks. Non
responses were also scored as incorrect (0) but recorded separately on the scoring
sheet (NR = no realisation). Where possible, output tasks were scored “live” as correct
or incorrect by the investigator, however all verbal responses were also recorded for
offline re-listening where needed. Details on how the spelling task was scored are
provided below. Reaction time was measured by the programme for all tasks. Raw
reaction time measures started from the onset of stimulus item presentation and
terminated once the item was completed. Termination of the task was operationalised
for most tasks by a button press. Specifically, for the auditory discrimination and non-
word reading tasks, the participants pressed a button to signal their final response, the
timing of which was recorded. For the spelling, non-word repetition and both
spoonerism tasks, participants pressed a button on immediate completion of these
tasks, which again was used to measure total time for task completion. While it could
be argued that there will be an inevitable time lag between the participant’s finishing
an utterance/piece of writing and then executing the button press, there are also
practical hurdles in accurately and efficiently measuring the exact end of a vocal
utterance etc. Thus, in the interests of exploring a measure that was relatively easy to
collect and analyse, this measure of reaction time was chosen.
Figure 21 demonstrates the passage of time measured as reaction time for this study.
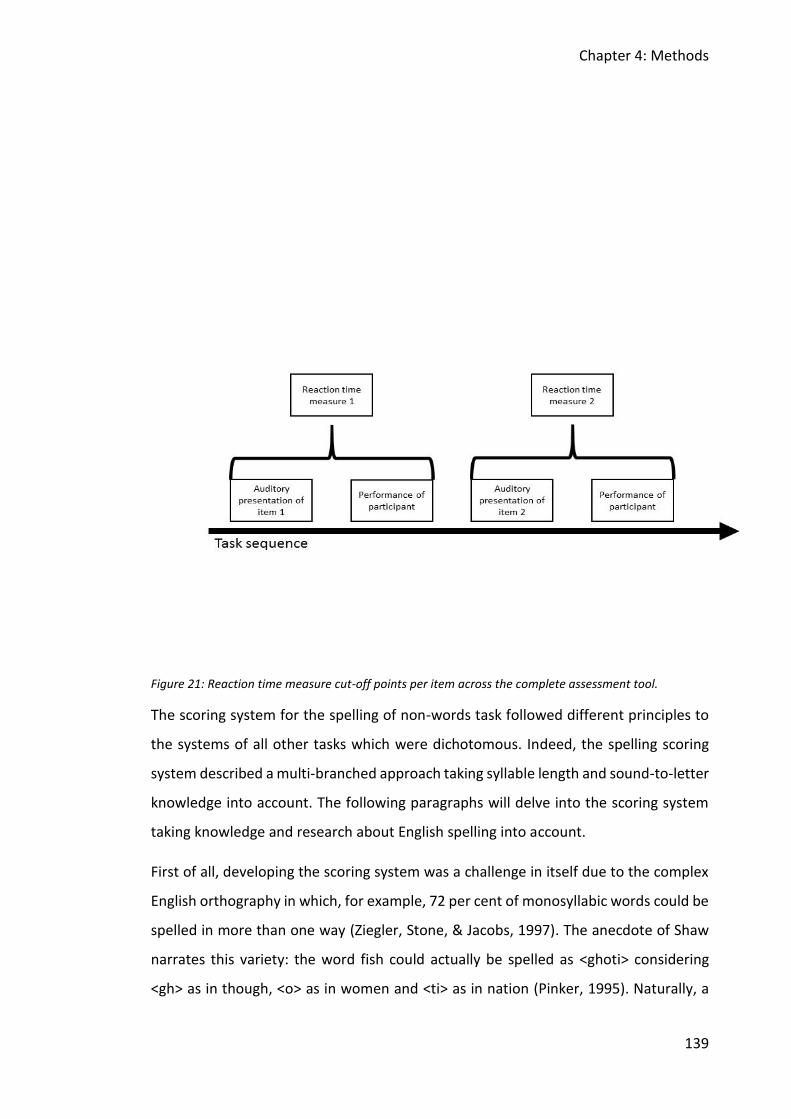
Chapter 4: Methods
139
Figure 21: Reaction time measure cut-off points per item across the complete assessment tool.
The scoring system for the spelling of non-words task followed different principles to
the systems of all other tasks which were dichotomous. Indeed, the spelling scoring
system described a multi-branched approach taking syllable length and sound-to-letter
knowledge into account. The following paragraphs will delve into the scoring system
taking knowledge and research about English spelling into account.
First of all, developing the scoring system was a challenge in itself due to the complex
English orthography in which, for example, 72 per cent of monosyllabic words could be
spelled in more than one way (Ziegler, Stone, & Jacobs, 1997). The anecdote of Shaw
narrates this variety: the word fish could actually be spelled as <ghoti> considering
<gh> as in though, <o> as in women and <ti> as in nation (Pinker, 1995). Naturally, a
Chapter 4: Methods
140
system needed to be in place which differentiated between acceptable and non-
acceptable spellings respecting the complexity of English orthography. It was generally
decided that legal spelling of non-words based on the English sound system was
considered acceptable whereas illegal spelling (orthographic combinations of foreign
languages: e.g. <aux>) would be non-acceptable. As Moats (2000) suggests, English
spelling is predictable to some extent. Five principles can be followed that predict
English spelling to 84 per cent. However, two of these principles base English spelling
predictability in the origin, history, and the meaning of a word. Hence, these rules could
not easily be applied to spelling of non-words. The other principles, though, explain
rules based on phoneme-grapheme-correspondences and emphasise the importance
of a sound’s position within a word. For example, the sound /k/ is spelled as <ck> after
a stressed short vowel as in <nickel> and at the end of one syllable words such as
<back>. Moreover, a short vowel can indicate doubled spelling of consonants when
followed by the sounds /f/, /l/, and /s/, as in <staff>, <will>, and <grass>. Thus, it was
important to consider such predictability of English spelling while developing the
scoring system. The following paragraphs will explain the process in more detail.
As a second step, the units which should be judged during outcome scoring needed to
be defined. As mentioned above, syllable amount per non-word was considered as one
judgement perspective. Hence, a monosyllabic item would receive one point for
correct realisation of syllable amount, as against a four-syllable item that was already
scored with four points if four syllables were realised correctly in written output,
independently of spelling characteristics. Introduced spelling characteristics did then
further facilitate the judgement of legality of the non-word.
It is known that adults use a word’s origin to help pronounce unfamiliar words
(Treiman, Kessler, & Evans, 2007). Related to foreign unfamiliar words, this would
mean that knowledge of the relevant foreign language would influence adults’ spelling.
Since all items presented in the spelling task were non-words, therefore unfamiliar, but
developed in a controlled way including legality and frequency, an English language
based spelling was expected. Accordingly, sound combinations not existing in English
orthography were judged as incorrect.
Chapter 4: Methods
141
Moreover, English spelling is highly influenced by context conditioning (Treiman,
Kessler, & Bick, 2003). On the one hand, vowels can condition consonants, for example,
/k/ is frequently realised as <ck> after a short vowel as in <pick>, in contrast to a long
vowel after which /k/ would be spelled as <k> (peak) (Perry, Ziegler, & Coltheart, 2002).
On the other hand, consonants can condition vowels as in <font> versus <want> where
the same vowel sound is realised with two different letters following specific
consonants (Treiman et al., 2003). Hayes, Treiman and Kessler (2006) observed that
context conditioning abilities, especially consonants conditioning vowels, increase with
age. Taking this knowledge into account it was decided to only judge either consonants
or vowels within the scoring system. In fact, consonants were chosen, because more
variety in scoring was given (more consonants than vowels exist in the English spelling
system). Furthermore, consonants are less universal and vary from language to
language (for example /θ/ exists in English, but not in German; all vowels are presented
in both languages). It was thought that a clearer distinction between correct and
incorrect realisations of sounds can be made for consonant sounds as against vowel
sounds. Finally, principles of predictability of English spelling mainly describe the
spelling pattern of consonants, rather than vowels (Moats, 2000).
As a next step, all 13 created non-words of the spelling task were analysed regarding
their consonants (consonant clusters were split in individual sounds = /spr/ -> 3 sounds)
and syllable amount. As a result, a scoring system was established which indicated a
number of points per individual item. Table 18 displays the scoring system including
values per item.
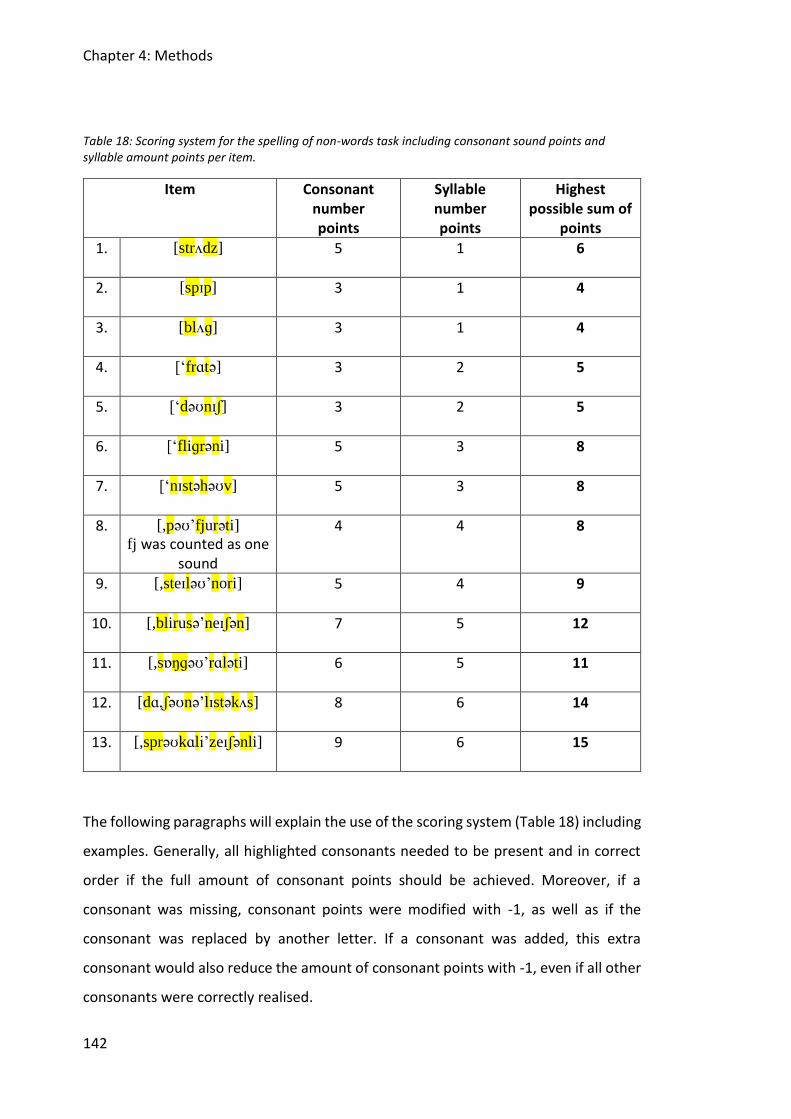
Chapter 4: Methods
142
Table 18: Scoring system for the spelling of non-words task including consonant sound points and syllable amount points per item.
Item Consonant number points
Syllable number points
Highest possible sum of
points
1. [strʌdz] 5 1 6
2. [spɪp] 3 1 4
3. [blʌɡ] 3 1 4
4. [‘frɑtə] 3 2 5
5. [‘dəʊnɪʃ] 3 2 5
6. [‘fliɡrəni] 5 3 8
7. [‘nɪstəhəʊv] 5 3 8
8. [,pəʊ’fjurəti]
fj was counted as one sound
4 4 8
9. [,steɪləʊ’nori] 5 4 9
10. [,blirusə’neɪʃən] 7 5 12
11. [,sɒŋɡəʊ’rɑləti] 6 5 11
12. [dɑ,ʃəʊnə’lɪstəkʌs] 8 6 14
13. [,sprəʊkɑli’zeɪʃənli] 9 6 15
The following paragraphs will explain the use of the scoring system (Table 18) including
examples. Generally, all highlighted consonants needed to be present and in correct
order if the full amount of consonant points should be achieved. Moreover, if a
consonant was missing, consonant points were modified with -1, as well as if the
consonant was replaced by another letter. If a consonant was added, this extra
consonant would also reduce the amount of consonant points with -1, even if all other
consonants were correctly realised.
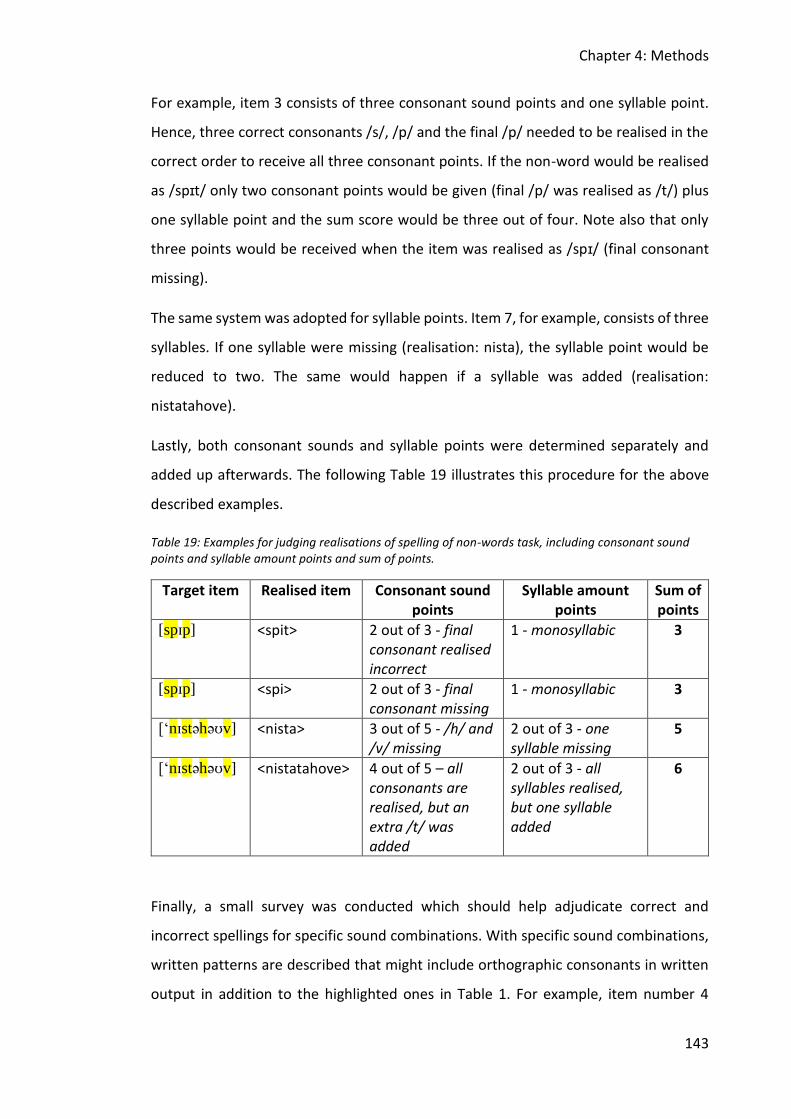
Chapter 4: Methods
143
For example, item 3 consists of three consonant sound points and one syllable point.
Hence, three correct consonants /s/, /p/ and the final /p/ needed to be realised in the
correct order to receive all three consonant points. If the non-word would be realised
as /spɪt/ only two consonant points would be given (final /p/ was realised as /t/) plus
one syllable point and the sum score would be three out of four. Note also that only
three points would be received when the item was realised as /spɪ/ (final consonant
missing).
The same system was adopted for syllable points. Item 7, for example, consists of three
syllables. If one syllable were missing (realisation: nista), the syllable point would be
reduced to two. The same would happen if a syllable was added (realisation:
nistatahove).
Lastly, both consonant sounds and syllable points were determined separately and
added up afterwards. The following Table 19 illustrates this procedure for the above
described examples.
Table 19: Examples for judging realisations of spelling of non-words task, including consonant sound points and syllable amount points and sum of points.
Target item Realised item Consonant sound points
Syllable amount points
Sum of points
[spɪp] <spit> 2 out of 3 - final consonant realised incorrect
1 - monosyllabic 3
[spɪp] <spi> 2 out of 3 - final consonant missing
1 - monosyllabic 3
[‘nɪstəhəʊv] <nista> 3 out of 5 - /h/ and /v/ missing
2 out of 3 - one syllable missing
5
[‘nɪstəhəʊv] <nistatahove> 4 out of 5 – all consonants are realised, but an extra /t/ was added
2 out of 3 - all syllables realised, but one syllable added
6
Finally, a small survey was conducted which should help adjudicate correct and
incorrect spellings for specific sound combinations. With specific sound combinations,
written patterns are described that might include orthographic consonants in written
output in addition to the highlighted ones in Table 1. For example, item number 4
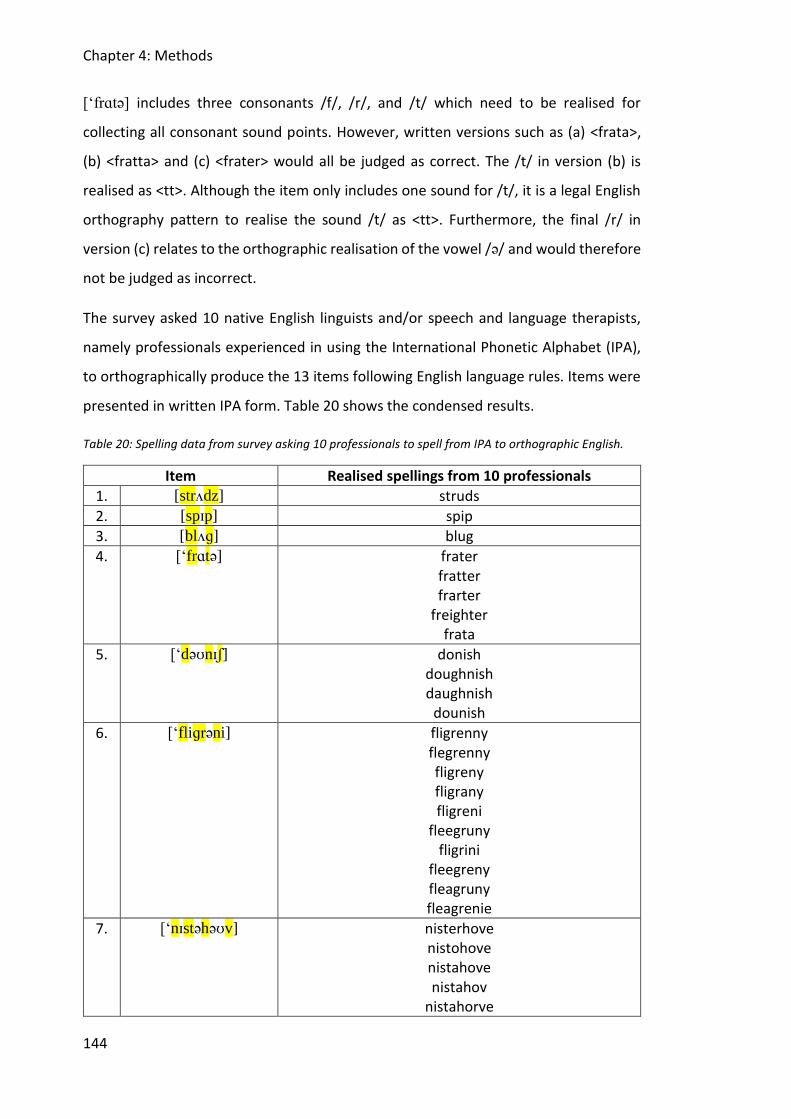
Chapter 4: Methods
144
[‘frɑtə] includes three consonants /f/, /r/, and /t/ which need to be realised for
collecting all consonant sound points. However, written versions such as (a) <frata>,
(b) <fratta> and (c) <frater> would all be judged as correct. The /t/ in version (b) is
realised as <tt>. Although the item only includes one sound for /t/, it is a legal English
orthography pattern to realise the sound /t/ as <tt>. Furthermore, the final /r/ in
version (c) relates to the orthographic realisation of the vowel /ə/ and would therefore
not be judged as incorrect.
The survey asked 10 native English linguists and/or speech and language therapists,
namely professionals experienced in using the International Phonetic Alphabet (IPA),
to orthographically produce the 13 items following English language rules. Items were
presented in written IPA form. Table 20 shows the condensed results.
Table 20: Spelling data from survey asking 10 professionals to spell from IPA to orthographic English.
Item Realised spellings from 10 professionals
1. [strʌdz] struds
2. [spɪp] spip
3. [blʌɡ] blug
4. [‘frɑtə] frater fratter frarter
freighter frata
5. [‘dəʊnɪʃ] donish doughnish daughnish
dounish
6. [‘fliɡrəni] fligrenny flegrenny fligreny fligrany fligreni
fleegruny fligrini
fleegreny fleagruny fleagrenie
7. [‘nɪstəhəʊv] nisterhove nistohove nistahove nistahov
nistahorve
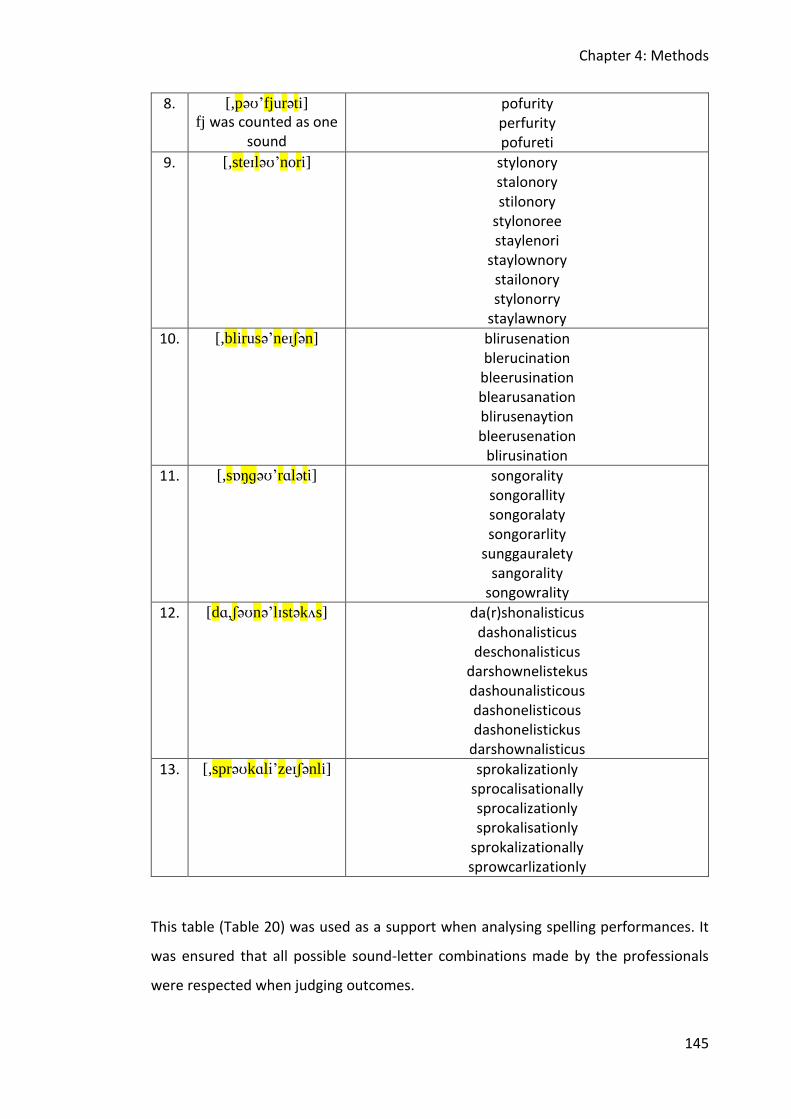
Chapter 4: Methods
145
8. [,pəʊ’fjurəti]
fj was counted as one sound
pofurity perfurity pofureti
9. [,steɪləʊ’nori] stylonory stalonory stilonory
stylonoree staylenori
staylownory stailonory stylonorry
staylawnory
10. [,blirusə’neɪʃən] blirusenation blerucination
bleerusination blearusanation blirusenaytion bleerusenation
blirusination
11. [,sɒŋɡəʊ’rɑləti] songorality songorallity songoralaty songorarlity
sunggauralety sangorality
songowrality
12. [dɑ,ʃəʊnə’lɪstəkʌs] da(r)shonalisticus dashonalisticus deschonalisticus
darshownelistekus dashounalisticous dashonelisticous dashonelistickus
darshownalisticus
13. [,sprəʊkɑli’zeɪʃənli] sprokalizationly sprocalisationally sprocalizationly sprokalisationly
sprokalizationally sprowcarlizationly
This table (Table 20) was used as a support when analysing spelling performances. It
was ensured that all possible sound-letter combinations made by the professionals
were respected when judging outcomes.
Chapter 4: Methods
146
4.10 Case series
4.10.1 Overall design
A sub-aim for the doctoral study was that it would allow investigation of speech
processing at multiple levels (e.g. speech discrimination, speech production etc.) and
at different levels of difficulty and task demand for a population with speech
difficulties. Specifically this thesis set out to investigate individuals who stammer. In
practical terms, it was intended that the assessment would be suitable for outlining
speech profiles of individuals and give insight into possible breakdowns or difficulties
experienced by members of this heterogeneous population of stammerers (Guitar,
2013).
4.10.2 Case studies
The speech processing assessment was applied in a case study setting to explore
individual speech profiles.
4.10.3 Design
Six case studies were carried out. The aim was to explore speech profiles of people who
stammer. A mixed method study was applied by using semi-structured interviews and
investigation with the speech processing assessment tool. Semi-structured interviews
offer a fairly open framework which allows focused and conversational two-way
communication about a problem (Barriball & While, 1994). Furthermore, they facilitate
detangling the factors that might lead to the problem (Denzin & Lincoln, 2011;
Kincheloe, McLaren, & Steinberg, 2011; Weis & Fine, 2004). Therefore, as a
heterogeneous group of participants was recruited, the semi-structured interview
approach facilitated individual insights into the stammering difficulties of every case
study participant. The information gathered from the semi-structured interview was
used to help interpret the assessment score results. It was developed to provide
important context for the patterns of accuracy and response time seen in individual
case study participants, both compared to each other, as well as with the normative
sample.
Chapter 4: Methods
147
4.10.4 Participants
Similar inclusion and exclusion criteria as described in the large scale study were
applied. At the time of data collection all participants were students at the University
of Sheffield, and were selected according to the following criteria:
• Age between 18 and 35
• University students (undergraduate or postgraduate)
• Fluent native English speakers
• History of stammering and current stammer
• No hearing loss
It was decided to assess fluent English speakers; knowing English as a less fluent
language could detrimentally impact performance on these tasks, which would in turn
make the comparison of the individuals with speech difficulties to the normative group
more difficult to interpret. Recruitment of students was conducted in the same way as
described for the large scale study. The only difference was that a voucher from
Amazon was guaranteed.
Altogether, six participants were recruited. An age range from 21 to 31 was
represented from a range of study disciplines. The mean age of the six individuals was
23.83 years with a standard deviation of 3.82 years. Five out of six participants were
male and one was female.
4.10.5 Material
The newly developed assessment tool was administered in the same way described for
the large scale study. Correct and incorrect answers were automatically collated, as
well as the reaction time for each item. PsychoPy took voice recordings for tasks that
included a verbal response from the participant. Instructions and explanations of the
speech processing assessment were given on screen and the participants could ‘click’
through the tasks at a self-led pace. A semi-structured interview was administered.
Topics discussed were:
Chapter 4: Methods
148
1. Onset of stammering and severity of stammering from onset up to now – this
information was used to confirm that the participant had a persistent
developmental stammer.
2. Case history of other speech and language difficulties – this information would
help illuminate if additional speech and language difficulties (either resolved or
persistent) might be impacting on observed assessment performance.
3. Management of stammering: history of therapy, other approaches to manage
stammering – this information helped determine if the individual was aware of
and/or was using any specific techniques to manage behaviour, which might
impact observed assessment performance. For example, stuttering
modification therapy approaches introduce a preventive technique which
reduces the obvious stammering behaviours (van Riper, 1982).
4. Family history of speech and language difficulties – this information was
gathered to cross-check the fact that genetic dispostition is evident in
developmental stammering (Curlee, 2004; Yairi et al., 1996).
5. Specific stammering patterns from onset up to now, including strategies to
manage the stammer – this information was collected so that the investigator
could understand specific avoidance strategies of the individual (Ward, 2008).
Furthermore, it was used to observe what happens to speech output if these
strategies cannot be used in the assessment situation by the participant.
6. Current impact of stammering during specific situations (informal versus
formal) – this information was gathered to get an idea of the influence of the
speech difficulty in day-to-day life and potential context-dependent differences
e.g. in social situations versus events within higher education (as explained in
the introduction of the thesis).
7. Stammering behaviour during the speech processing assessment – this
information was collected in order to understand potential errors in
perfromances during administration of the assessment tool. It was also used to
interpret stammering behaviours that occurred and reaction time outcomes.
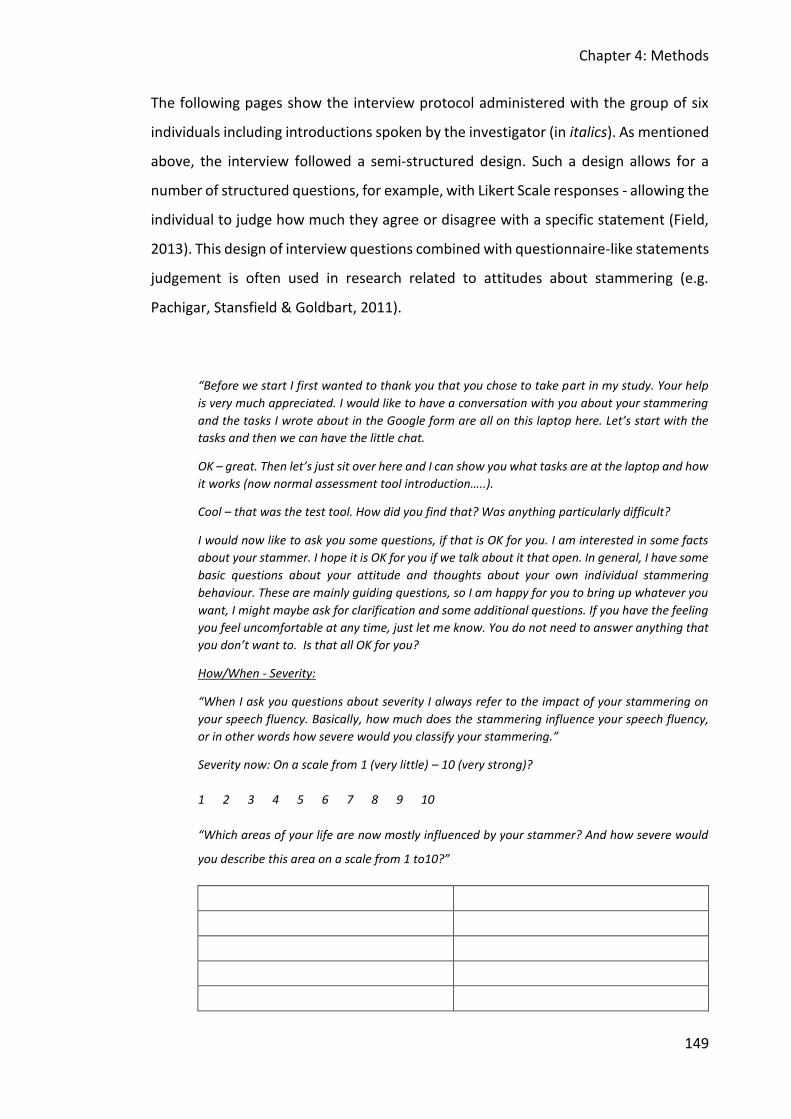
Chapter 4: Methods
149
The following pages show the interview protocol administered with the group of six
individuals including introductions spoken by the investigator (in italics). As mentioned
above, the interview followed a semi-structured design. Such a design allows for a
number of structured questions, for example, with Likert Scale responses - allowing the
individual to judge how much they agree or disagree with a specific statement (Field,
2013). This design of interview questions combined with questionnaire-like statements
judgement is often used in research related to attitudes about stammering (e.g.
Pachigar, Stansfield & Goldbart, 2011).
“Before we start I first wanted to thank you that you chose to take part in my study. Your help
is very much appreciated. I would like to have a conversation with you about your stammering
and the tasks I wrote about in the Google form are all on this laptop here. Let’s start with the
tasks and then we can have the little chat.
OK – great. Then let’s just sit over here and I can show you what tasks are at the laptop and how
it works (now normal assessment tool introduction…..).
Cool – that was the test tool. How did you find that? Was anything particularly difficult?
I would now like to ask you some questions, if that is OK for you. I am interested in some facts
about your stammer. I hope it is OK for you if we talk about it that open. In general, I have some
basic questions about your attitude and thoughts about your own individual stammering
behaviour. These are mainly guiding questions, so I am happy for you to bring up whatever you
want, I might maybe ask for clarification and some additional questions. If you have the feeling
you feel uncomfortable at any time, just let me know. You do not need to answer anything that
you don’t want to. Is that all OK for you?
How/When - Severity:
“When I ask you questions about severity I always refer to the impact of your stammering on
your speech fluency. Basically, how much does the stammering influence your speech fluency,
or in other words how severe would you classify your stammering.”
Severity now: On a scale from 1 (very little) – 10 (very strong)?
1 2 3 4 5 6 7 8 9 10
“Which areas of your life are now mostly influenced by your stammer? And how severe would
you describe this area on a scale from 1 to10?”
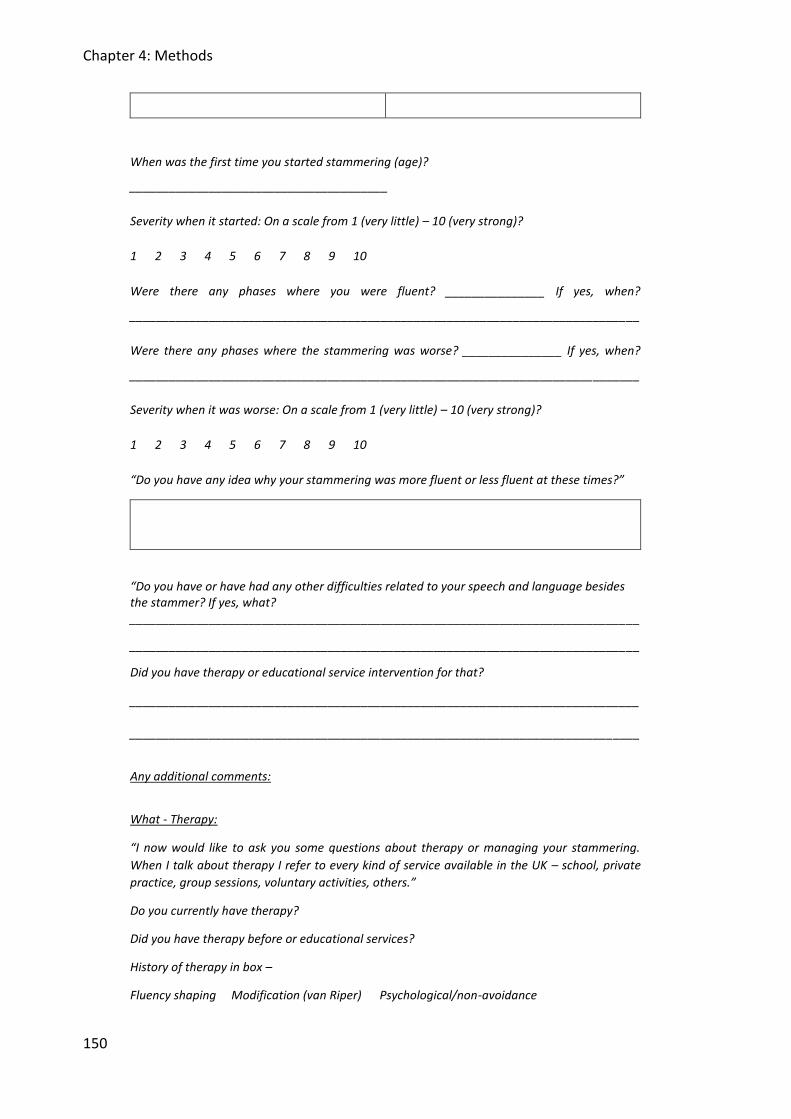
Chapter 4: Methods
150
When was the first time you started stammering (age)?
_______________________________________
Severity when it started: On a scale from 1 (very little) – 10 (very strong)?
1 2 3 4 5 6 7 8 9 10
Were there any phases where you were fluent? _______________ If yes, when?
_____________________________________________________________________________
Were there any phases where the stammering was worse? _______________ If yes, when?
_____________________________________________________________________________
Severity when it was worse: On a scale from 1 (very little) – 10 (very strong)?
1 2 3 4 5 6 7 8 9 10
“Do you have any idea why your stammering was more fluent or less fluent at these times?”
“Do you have or have had any other difficulties related to your speech and language besides the stammer? If yes, what? _____________________________________________________________________________
_____________________________________________________________________________
Did you have therapy or educational service intervention for that?
_____________________________________________________________________________
_____________________________________________________________________________
Any additional comments:
What - Therapy:
“I now would like to ask you some questions about therapy or managing your stammering.
When I talk about therapy I refer to every kind of service available in the UK – school, private
practice, group sessions, voluntary activities, others.”
Do you currently have therapy?
Did you have therapy before or educational services?
History of therapy in box –
Fluency shaping Modification (van Riper) Psychological/non-avoidance
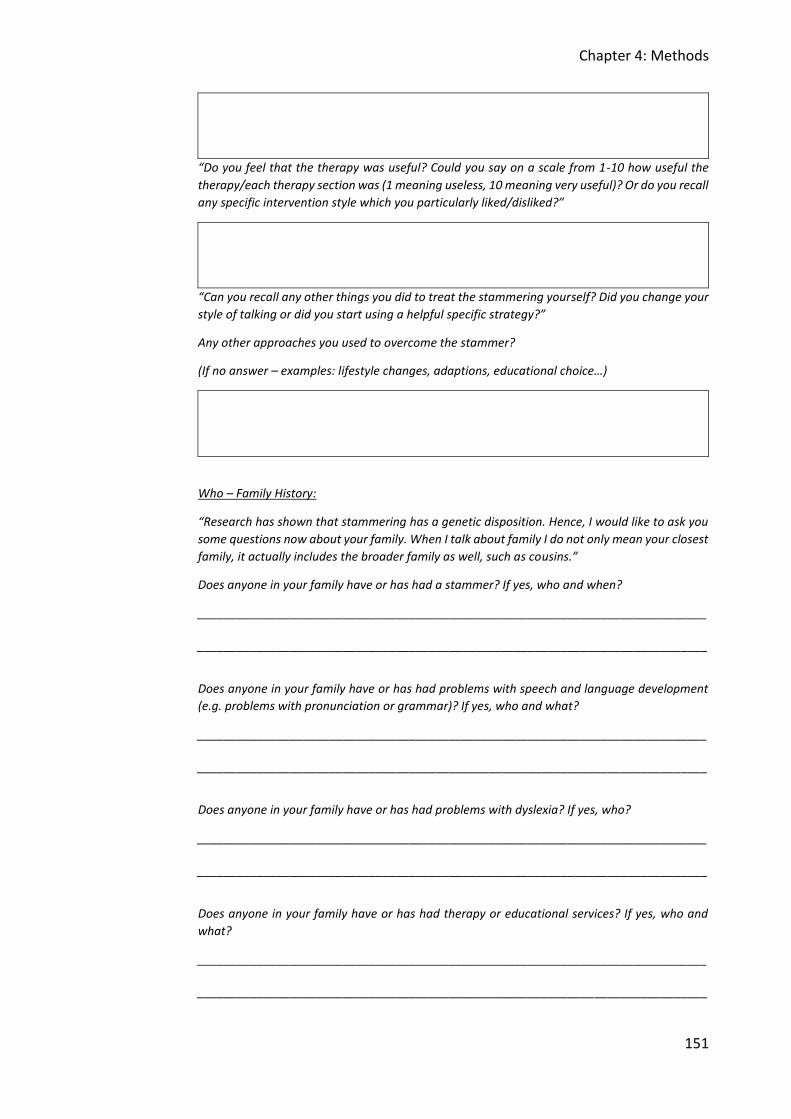
Chapter 4: Methods
151
“Do you feel that the therapy was useful? Could you say on a scale from 1-10 how useful the
therapy/each therapy section was (1 meaning useless, 10 meaning very useful)? Or do you recall
any specific intervention style which you particularly liked/disliked?”
“Can you recall any other things you did to treat the stammering yourself? Did you change your
style of talking or did you start using a helpful specific strategy?”
Any other approaches you used to overcome the stammer?
(If no answer – examples: lifestyle changes, adaptions, educational choice…)
Who – Family History:
“Research has shown that stammering has a genetic disposition. Hence, I would like to ask you
some questions now about your family. When I talk about family I do not only mean your closest
family, it actually includes the broader family as well, such as cousins.”
Does anyone in your family have or has had a stammer? If yes, who and when?
_____________________________________________________________________________
_____________________________________________________________________________
Does anyone in your family have or has had problems with speech and language development
(e.g. problems with pronunciation or grammar)? If yes, who and what?
_____________________________________________________________________________
_____________________________________________________________________________
Does anyone in your family have or has had problems with dyslexia? If yes, who?
_____________________________________________________________________________
_____________________________________________________________________________
Does anyone in your family have or has had therapy or educational services? If yes, who and
what?
_____________________________________________________________________________
_____________________________________________________________________________
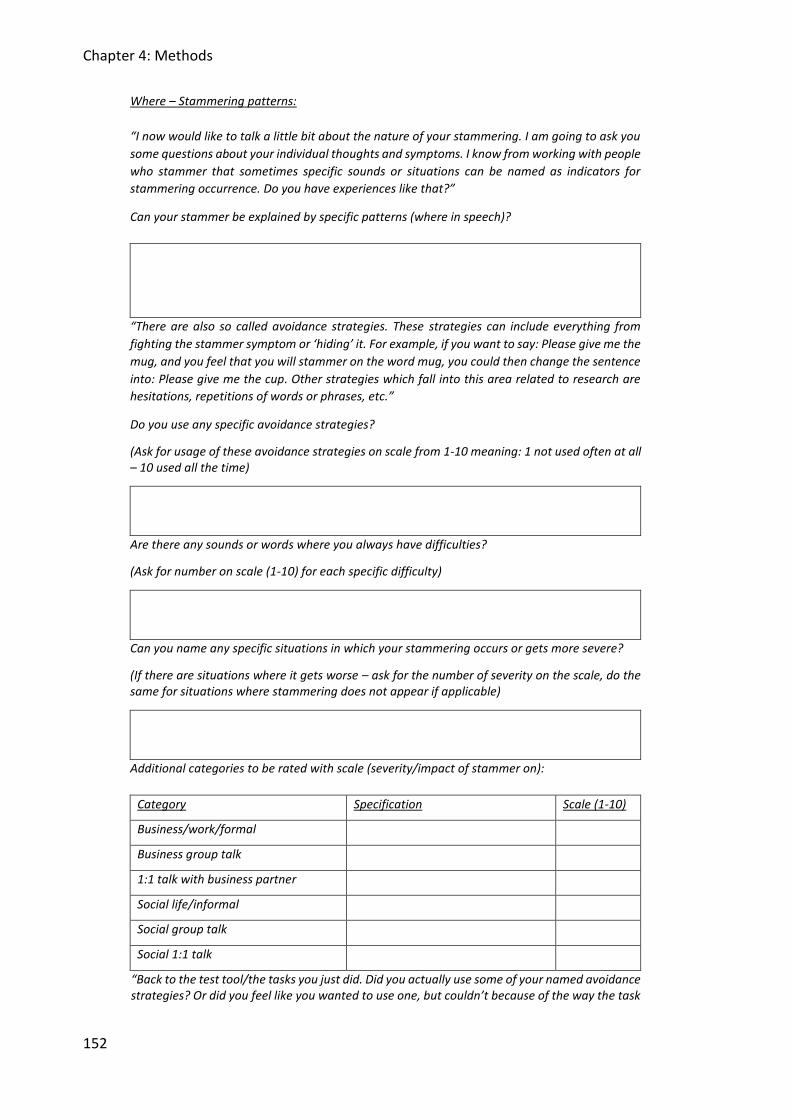
Chapter 4: Methods
152
Where – Stammering patterns:
“I now would like to talk a little bit about the nature of your stammering. I am going to ask you
some questions about your individual thoughts and symptoms. I know from working with people
who stammer that sometimes specific sounds or situations can be named as indicators for
stammering occurrence. Do you have experiences like that?”
Can your stammer be explained by specific patterns (where in speech)?
“There are also so called avoidance strategies. These strategies can include everything from
fighting the stammer symptom or ‘hiding’ it. For example, if you want to say: Please give me the
mug, and you feel that you will stammer on the word mug, you could then change the sentence
into: Please give me the cup. Other strategies which fall into this area related to research are
hesitations, repetitions of words or phrases, etc.”
Do you use any specific avoidance strategies?
(Ask for usage of these avoidance strategies on scale from 1-10 meaning: 1 not used often at all – 10 used all the time)
Are there any sounds or words where you always have difficulties?
(Ask for number on scale (1-10) for each specific difficulty)
Can you name any specific situations in which your stammering occurs or gets more severe?
(If there are situations where it gets worse – ask for the number of severity on the scale, do the same for situations where stammering does not appear if applicable)
Additional categories to be rated with scale (severity/impact of stammer on):
Category Specification Scale (1-10)
Business/work/formal
Business group talk
1:1 talk with business partner
Social life/informal
Social group talk
Social 1:1 talk
“Back to the test tool/the tasks you just did. Did you actually use some of your named avoidance strategies? Or did you feel like you wanted to use one, but couldn’t because of the way the task
Chapter 4: Methods
153
was constructed? (If applicable, Did you skip any answers, because you would have stammered on them?)
Those are most of my questions. Is there anything else you would like to say, that you think we have missed or overlooked?
_____________________________________________________________________________
_____________________________________________________________________________
Finally, do you have any reason/idea why you stammer?
_____________________________________________________________________________
_____________________________________________________________________________
4.10.6 Procedure
Prior to assessment and interview, ethical approval was obtained from the University
of Sheffield, Faculty of Medicine, Dentistry, and Health (Appendix 4). Data collection
took place during May and June in 2016. The sessions were carried out in a quiet room
in the Department of Human Communication Sciences at the University of Sheffield.
On arrival, all participants gave their consent to take part in the study (Appendix 6). A
short explanation was given at the beginning of the session to clarify the purpose of
the study and to confirm exclusion and inclusion criteria (information sheet was
handed out: Appendix 5). The session then started, beginning with the speech
processing assessment and followed by the interview. The sessions were recorded on
a digital audio-recorder. The time taken to complete the whole session was 90-120
minutes – approximately 30 minutes for the speech processing assessment and 60+
minutes for the interview.
4.10.7 Scoring
During the assessment, each response was scored as correct (1) or incorrect (0) for the
input tasks. Non responses were also scored as incorrect (0) but recorded separately
on the scoring sheet (NR = no realisation). Where possible, output tasks were scored
“live” as correct or incorrect by the investigator, however all verbal responses were
also recorded for offline re-listening where needed. Additionally, the investigator
Chapter 4: Methods
154
marked stammer behaviours, if they occurred, on exact items. Stammer behaviours
were categorised by the three primary symptoms: blocks (B), repetitions (R) and
prolongations (PB) (van Riper, 1982). It is important to note that the term prolongation
does not only refer to the symptom itself: it also names a specific technique which
tackles stammering behaviour. The prolongation as a technique is used as a preventive
skill and inserted by the individual in their speech flow (Ward, 2008). It helps to reduce
the amount of stammer symptoms. For example, if one would mainly stammer on a
/p/, the prolongation as a technique could be used on words beginning with /p/ and
the risk of a real stammer symptom occurring then decreases. It is possible to
differentiate between both kinds of prolongations based on perceptual differences
related to tension. Whereas the stammer behaviour prolongation occurs with high
physical tension during speech, the prolongation as a prevention is characterised by
minimal physical tension which increases during word onset. Indeed, the prolongation
as prevention could be explained by a speaker ‘sliding into’ the word (first sound of the
word). If a speaker is familiar with this technique, it might be used frequently (even
subconsciously – it depends on the speaker’s familiarity with the technique). Hence,
besides the three primary categories of stammering behaviours identified above,
prolongation as a prevention (PP) was added to the list of abbreviations for stammering
judgements in the scoring system. Spelling was scored following the same scoring
system as described for the large scale study. Reaction time was measured by the
programme for all tasks, identical to the previously described procedure. Interview
data were audio-recorded and the protocol was filled out, as far as possible, during the
session. After interview completion the investigator revisited the audio recordings and
retrieved any information missed for the protocol form.
4.11 Chapter summary
The methods chapter of this doctoral study presented in detail the development of the
new speech processing assessment tool, including tasks and stimulus design.
Furthermore, a pilot study was presented which led to revision of some tasks and
items. Finally, participant details, procedure, and scoring systems were explained. The
following chapters will display outcomes of this doctoral study and discuss those
results.
Chapter 5: Results - Psychometric properties
155
PART III: RESULTS
5. Chapter 5: Results - Psychometric properties
This chapter focuses on exploration of the outcomes of the normative sample group
(N=101) related to objectivity, reliability, and validity of the newly developed speech
processing assessment (basic psychometric properties). Firstly, basic psychometric
properties will be explored, followed by consideration of the assessment’s objectivity.
Analyses of reliability including internal consistency, test-retest reliability and inter-
rater reliability will then be illustrated. Finally, validity, namely content and construct
validity, will be explored.
The following research questions were investigated:
➢ Question 1. What basic psychometric properties are required for a
comprehensive assessment tool?
➢ Question 1a. What are the basic psychometric properties of the speech
processing assessment tool?
➢ Question 1b. Can objectivity, reliability, and validity of the new developed
speech processing assessment be confirmed?
Objectivity
➢ Question 2. Can a newly developed assessment tool, based on researched
theories, be conducted using an objective and accurate procedure for
execution, scoring and analysing?
Reliability
➢ Question 3a. What is the internal consistency of the speech processing
assessment?
➢ Question 3b. What is the test-retest reliability of the speech processing
assessment?
➢ Question 3c. What is the inter-rater reliability of the speech processing
assessment?
Chapter 5: Results - Psychometric properties
156
Validity
➢ Question 4a. Does the speech processing assessment test what it claims to
test?
➢ Question 4b. Can theory-based assumptions be confirmed?
i) Do tasks with similar speech processing demands correlate more
strongly than with other tasks?
ii) What is the relationship between reaction time and performance
accuracy within subtests?
As a first step, basic psychometric properties will be explored, including descriptive
values, such as mean and standard deviation, followed by qualitative and quantitative
descriptions of error types made during assessment. Reaction time was measured to
enable analysis based in comparisons of accuracy and reaction time. Moreover, it was
thought that this measure could facilitate insight into data differences when comparing
normal speakers and those with underlying speech difficulties, such as stammering (see
Chapter 6 for qualitative and quantitative analysis related to stammering).
Reaction time measures were cleaned prior to further analysis. The aim of this process
was to exclude extreme outliers (on both ends of the continuum) which could unduly
influence the data set. Generally it is known that pushing a key on the computer needs
a specific minimum amount of time in terms of the motor programming and execution
(Baayen, Milin, Durdević, Hendrix, & Marelli, 2011). Conversely, excessively long
performances could be influenced by processes extraneous to the assessment’s
primary focus. If, for example, uncertainty about which key to press exist in the
participant’s mind (which results in longer reaction times), the actual reaction time
measure is influenced by processes other than those which are aimed to be tested with
the task. Hence, reaction times were cleaned following a specific procedure. The mean
reaction time for every participant per task was calculated. The data were then cleaned
using two standard deviations from a participant’s mean as a cut-off threshold (Ratcliff,
1993; Wilcox, 2005). Reaction time values at the trial level either two standard
deviations above or below the mean were removed independently of task outcome
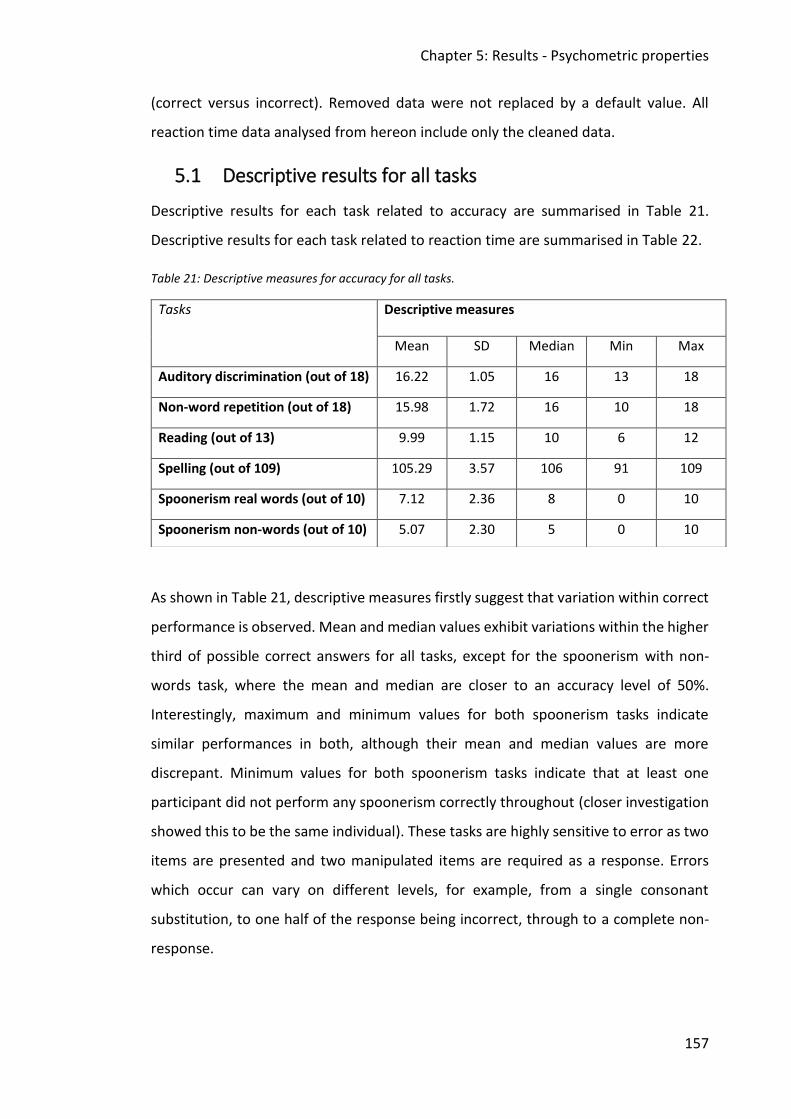
Chapter 5: Results - Psychometric properties
157
(correct versus incorrect). Removed data were not replaced by a default value. All
reaction time data analysed from hereon include only the cleaned data.
5.1 Descriptive results for all tasks
Descriptive results for each task related to accuracy are summarised in Table 21.
Descriptive results for each task related to reaction time are summarised in Table 22.
Table 21: Descriptive measures for accuracy for all tasks.
As shown in Table 21, descriptive measures firstly suggest that variation within correct
performance is observed. Mean and median values exhibit variations within the higher
third of possible correct answers for all tasks, except for the spoonerism with non-
words task, where the mean and median are closer to an accuracy level of 50%.
Interestingly, maximum and minimum values for both spoonerism tasks indicate
similar performances in both, although their mean and median values are more
discrepant. Minimum values for both spoonerism tasks indicate that at least one
participant did not perform any spoonerism correctly throughout (closer investigation
showed this to be the same individual). These tasks are highly sensitive to error as two
items are presented and two manipulated items are required as a response. Errors
which occur can vary on different levels, for example, from a single consonant
substitution, to one half of the response being incorrect, through to a complete non-
response.
Tasks Descriptive measures
Mean SD Median Min Max
Auditory discrimination (out of 18) 16.22 1.05 16 13 18
Non-word repetition (out of 18) 15.98 1.72 16 10 18
Reading (out of 13) 9.99 1.15 10 6 12
Spelling (out of 109) 105.29 3.57 106 91 109
Spoonerism real words (out of 10) 7.12 2.36 8 0 10
Spoonerism non-words (out of 10) 5.07 2.30 5 0 10
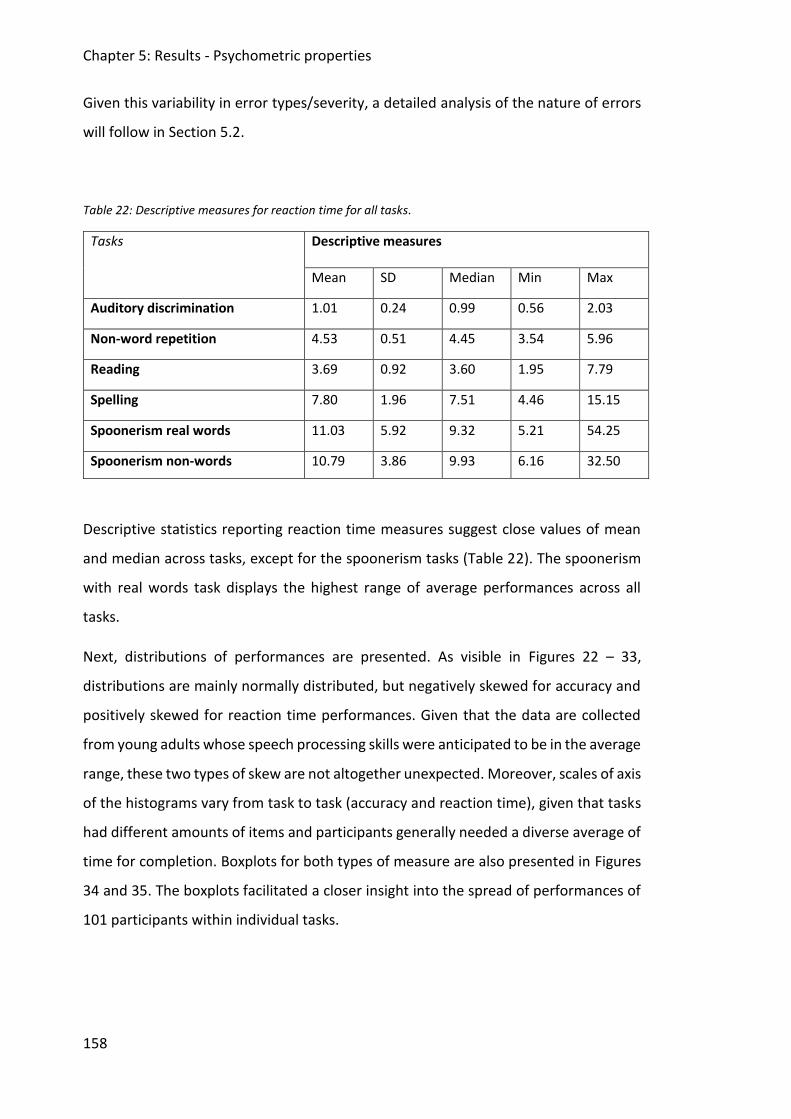
Chapter 5: Results - Psychometric properties
158
Given this variability in error types/severity, a detailed analysis of the nature of errors
will follow in Section 5.2.
Table 22: Descriptive measures for reaction time for all tasks.
Tasks Descriptive measures
Mean SD Median Min Max
Auditory discrimination 1.01 0.24 0.99 0.56 2.03
Non-word repetition 4.53 0.51 4.45 3.54 5.96
Reading 3.69 0.92 3.60 1.95 7.79
Spelling 7.80 1.96 7.51 4.46 15.15
Spoonerism real words 11.03 5.92 9.32 5.21 54.25
Spoonerism non-words 10.79 3.86 9.93 6.16 32.50
Descriptive statistics reporting reaction time measures suggest close values of mean
and median across tasks, except for the spoonerism tasks (Table 22). The spoonerism
with real words task displays the highest range of average performances across all
tasks.
Next, distributions of performances are presented. As visible in Figures 22 – 33,
distributions are mainly normally distributed, but negatively skewed for accuracy and
positively skewed for reaction time performances. Given that the data are collected
from young adults whose speech processing skills were anticipated to be in the average
range, these two types of skew are not altogether unexpected. Moreover, scales of axis
of the histograms vary from task to task (accuracy and reaction time), given that tasks
had different amounts of items and participants generally needed a diverse average of
time for completion. Boxplots for both types of measure are also presented in Figures
34 and 35. The boxplots facilitated a closer insight into the spread of performances of
101 participants within individual tasks.
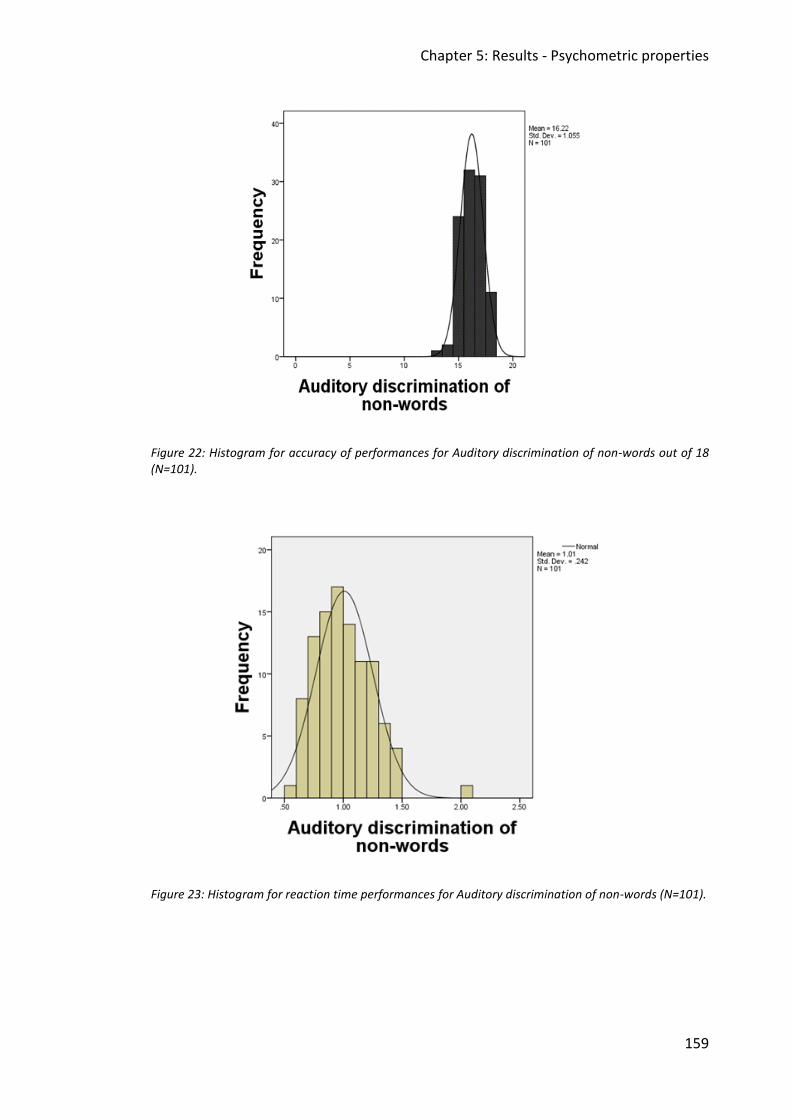
Chapter 5: Results - Psychometric properties
159
Figure 22: Histogram for accuracy of performances for Auditory discrimination of non-words out of 18 (N=101).
Figure 23: Histogram for reaction time performances for Auditory discrimination of non-words (N=101).
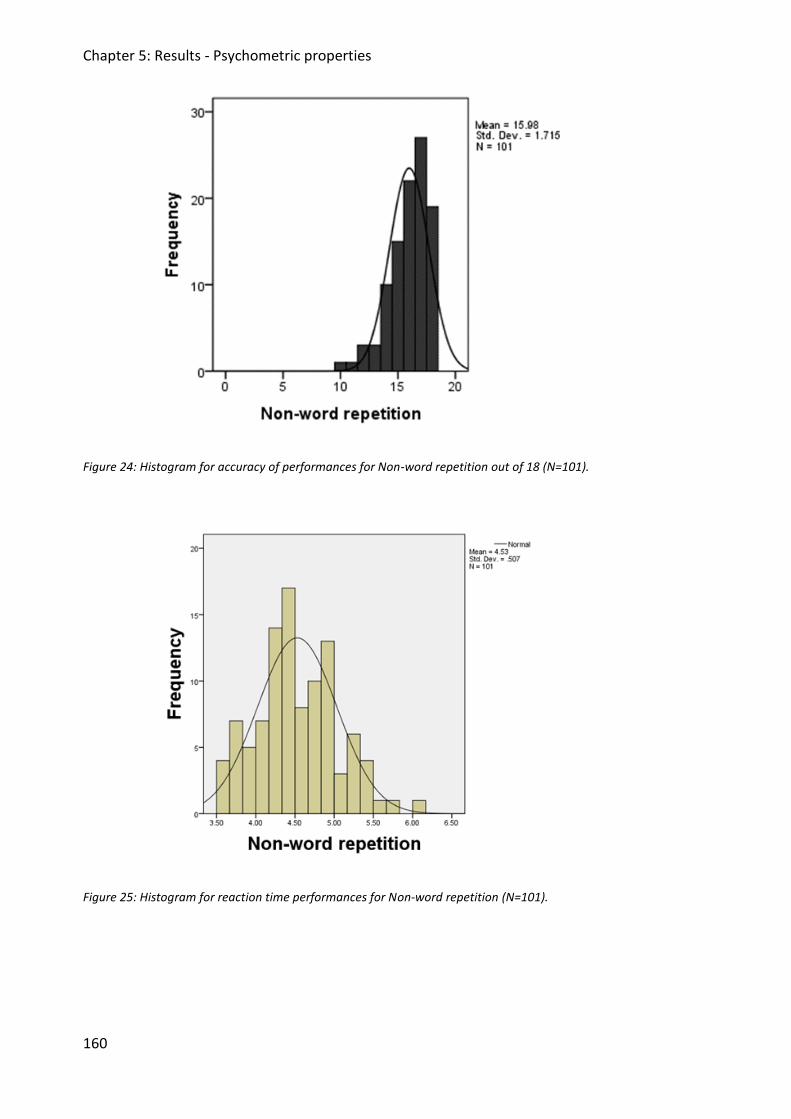
Chapter 5: Results - Psychometric properties
160
Figure 24: Histogram for accuracy of performances for Non-word repetition out of 18 (N=101).
Figure 25: Histogram for reaction time performances for Non-word repetition (N=101).
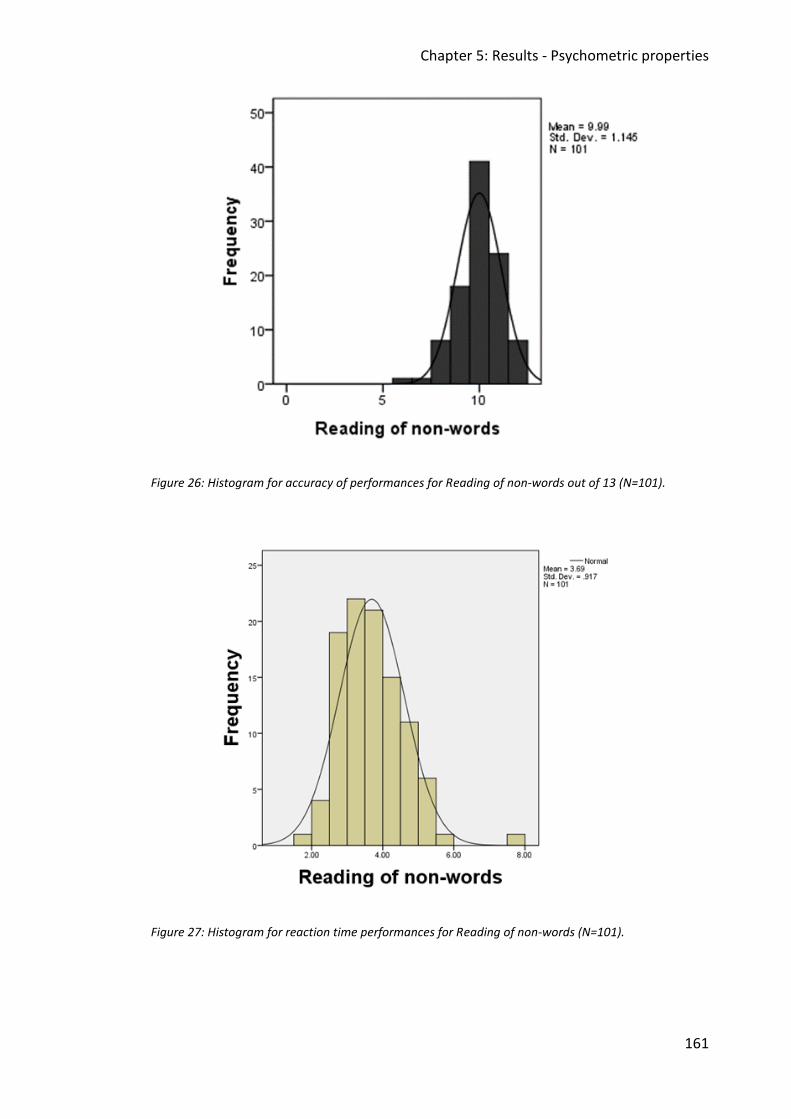
Chapter 5: Results - Psychometric properties
161
Figure 26: Histogram for accuracy of performances for Reading of non-words out of 13 (N=101).
Figure 27: Histogram for reaction time performances for Reading of non-words (N=101).
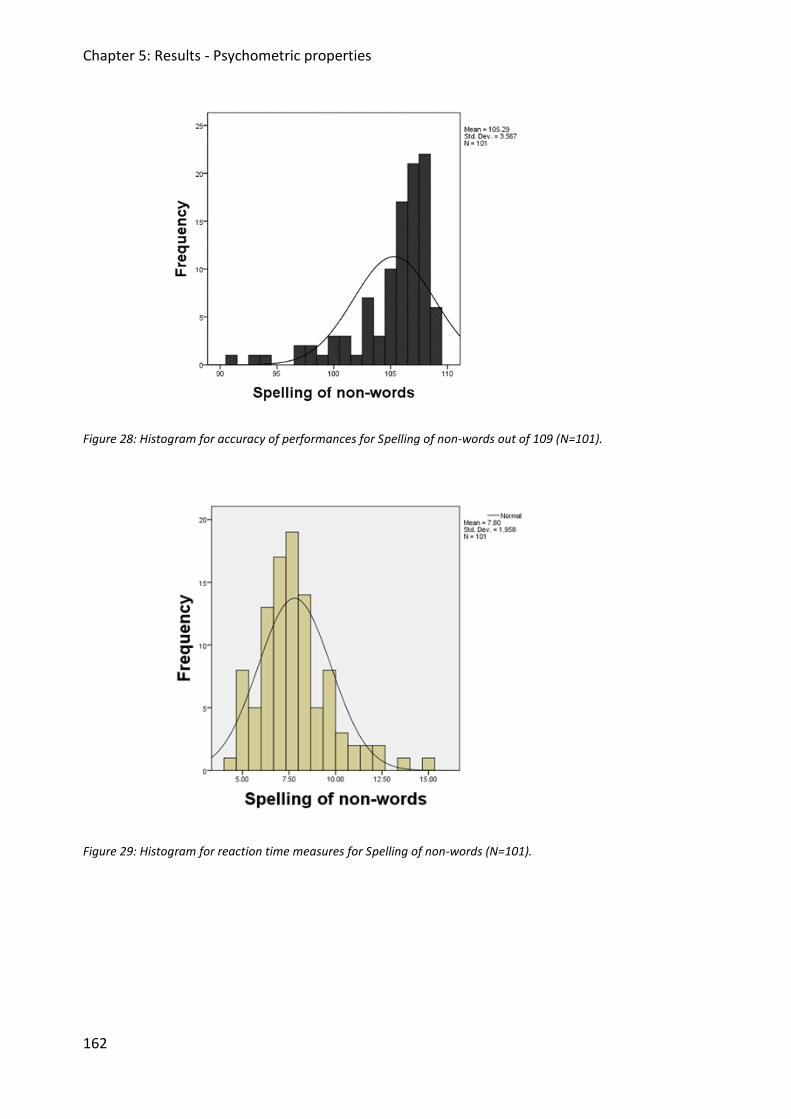
Chapter 5: Results - Psychometric properties
162
Figure 28: Histogram for accuracy of performances for Spelling of non-words out of 109 (N=101).
Figure 29: Histogram for reaction time measures for Spelling of non-words (N=101).
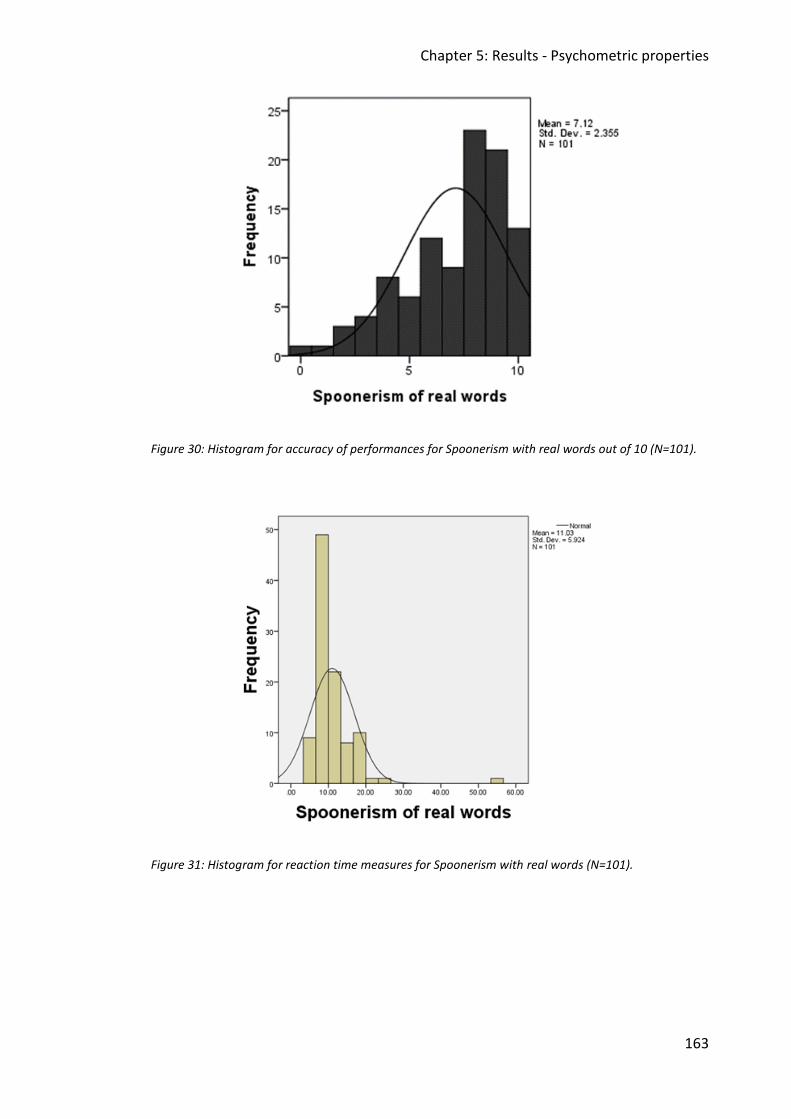
Chapter 5: Results - Psychometric properties
163
Figure 30: Histogram for accuracy of performances for Spoonerism with real words out of 10 (N=101).
Figure 31: Histogram for reaction time measures for Spoonerism with real words (N=101).
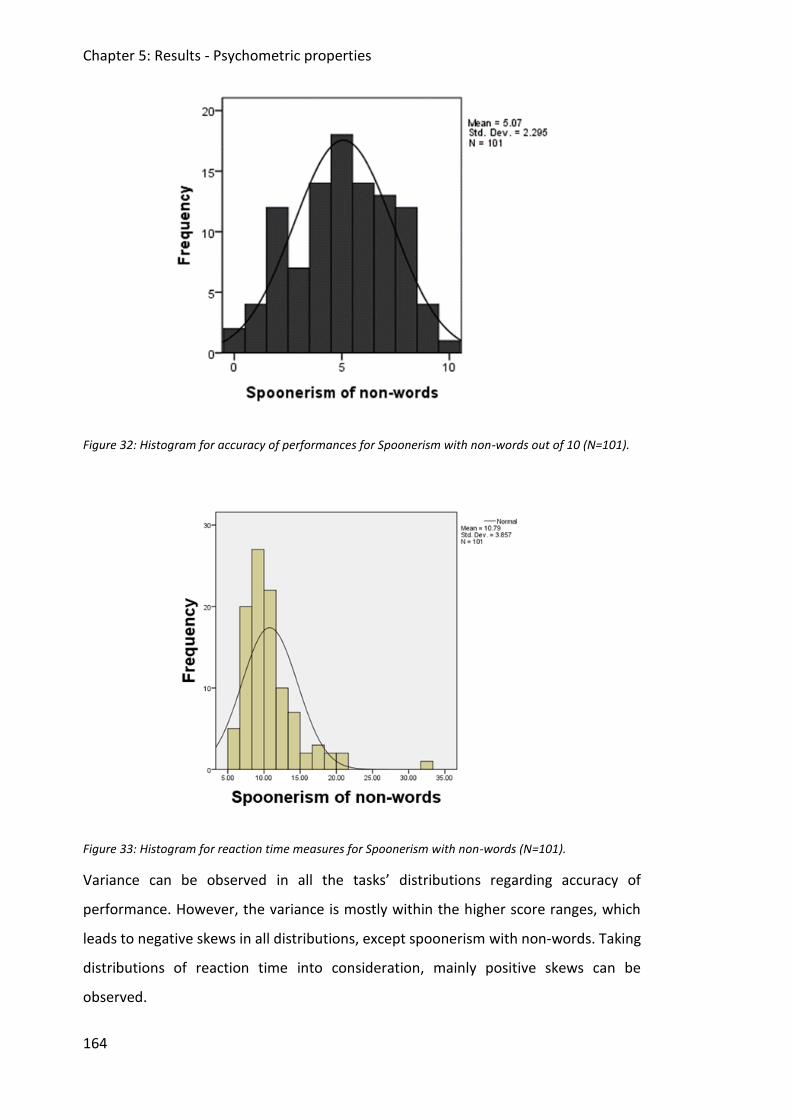
Chapter 5: Results - Psychometric properties
164
Figure 32: Histogram for accuracy of performances for Spoonerism with non-words out of 10 (N=101).
Figure 33: Histogram for reaction time measures for Spoonerism with non-words (N=101).
Variance can be observed in all the tasks’ distributions regarding accuracy of
performance. However, the variance is mostly within the higher score ranges, which
leads to negative skews in all distributions, except spoonerism with non-words. Taking
distributions of reaction time into consideration, mainly positive skews can be
observed.
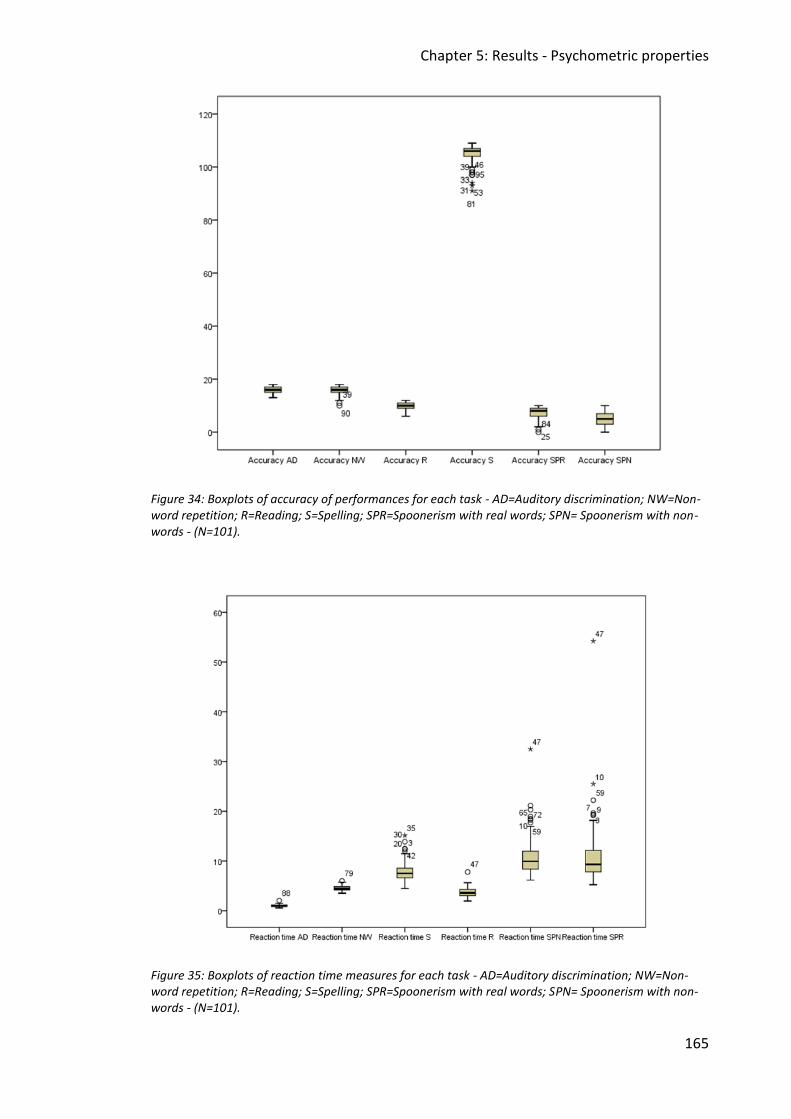
Chapter 5: Results - Psychometric properties
165
Figure 34: Boxplots of accuracy of performances for each task - AD=Auditory discrimination; NW=Non-word repetition; R=Reading; S=Spelling; SPR=Spoonerism with real words; SPN= Spoonerism with non-words - (N=101).
Figure 35: Boxplots of reaction time measures for each task - AD=Auditory discrimination; NW=Non-word repetition; R=Reading; S=Spelling; SPR=Spoonerism with real words; SPN= Spoonerism with non-words - (N=101).
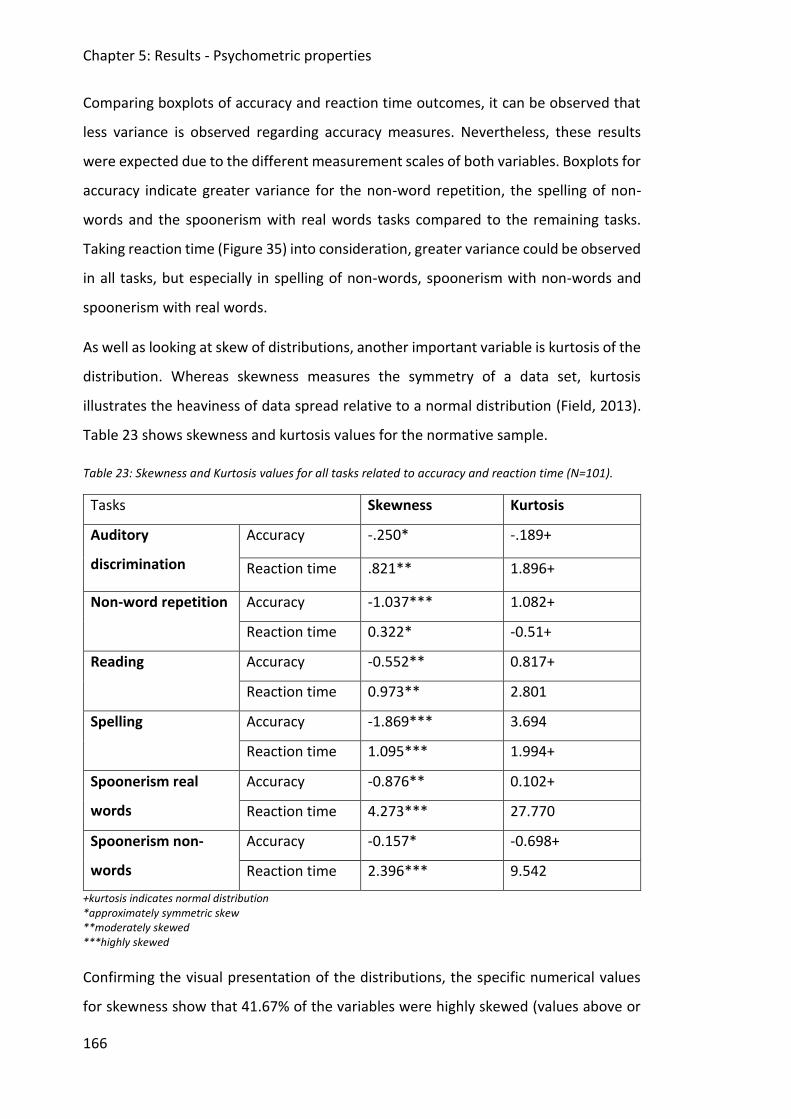
Chapter 5: Results - Psychometric properties
166
Comparing boxplots of accuracy and reaction time outcomes, it can be observed that
less variance is observed regarding accuracy measures. Nevertheless, these results
were expected due to the different measurement scales of both variables. Boxplots for
accuracy indicate greater variance for the non-word repetition, the spelling of non-
words and the spoonerism with real words tasks compared to the remaining tasks.
Taking reaction time (Figure 35) into consideration, greater variance could be observed
in all tasks, but especially in spelling of non-words, spoonerism with non-words and
spoonerism with real words.
As well as looking at skew of distributions, another important variable is kurtosis of the
distribution. Whereas skewness measures the symmetry of a data set, kurtosis
illustrates the heaviness of data spread relative to a normal distribution (Field, 2013).
Table 23 shows skewness and kurtosis values for the normative sample.
Table 23: Skewness and Kurtosis values for all tasks related to accuracy and reaction time (N=101).
Tasks Skewness Kurtosis
Auditory
discrimination
Accuracy -.250* -.189+
Reaction time .821** 1.896+
Non-word repetition Accuracy -1.037*** 1.082+
Reaction time 0.322* -0.51+
Reading Accuracy -0.552** 0.817+
Reaction time 0.973** 2.801
Spelling Accuracy -1.869*** 3.694
Reaction time 1.095*** 1.994+
Spoonerism real
words
Accuracy -0.876** 0.102+
Reaction time 4.273*** 27.770
Spoonerism non-
words
Accuracy -0.157* -0.698+
Reaction time 2.396*** 9.542
+kurtosis indicates normal distribution *approximately symmetric skew **moderately skewed ***highly skewed
Confirming the visual presentation of the distributions, the specific numerical values
for skewness show that 41.67% of the variables were highly skewed (values above or
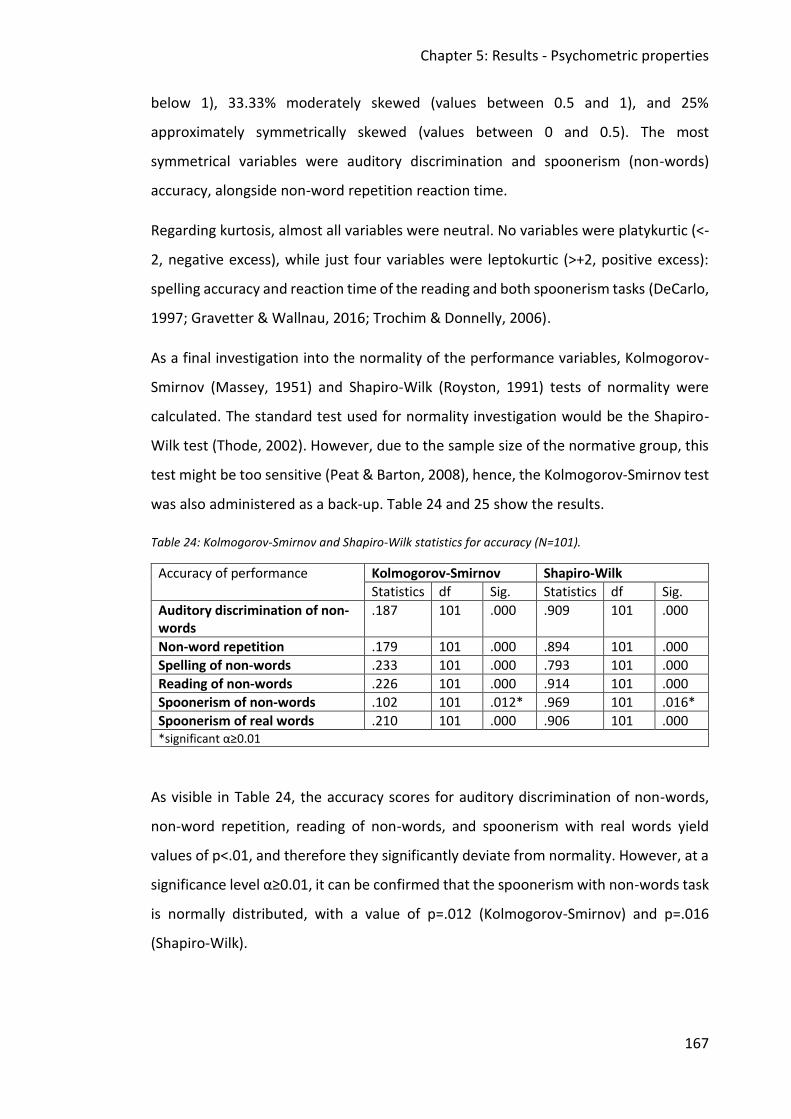
Chapter 5: Results - Psychometric properties
167
below 1), 33.33% moderately skewed (values between 0.5 and 1), and 25%
approximately symmetrically skewed (values between 0 and 0.5). The most
symmetrical variables were auditory discrimination and spoonerism (non-words)
accuracy, alongside non-word repetition reaction time.
Regarding kurtosis, almost all variables were neutral. No variables were platykurtic (<-
2, negative excess), while just four variables were leptokurtic (>+2, positive excess):
spelling accuracy and reaction time of the reading and both spoonerism tasks (DeCarlo,
1997; Gravetter & Wallnau, 2016; Trochim & Donnelly, 2006).
As a final investigation into the normality of the performance variables, Kolmogorov-
Smirnov (Massey, 1951) and Shapiro-Wilk (Royston, 1991) tests of normality were
calculated. The standard test used for normality investigation would be the Shapiro-
Wilk test (Thode, 2002). However, due to the sample size of the normative group, this
test might be too sensitive (Peat & Barton, 2008), hence, the Kolmogorov-Smirnov test
was also administered as a back-up. Table 24 and 25 show the results.
Table 24: Kolmogorov-Smirnov and Shapiro-Wilk statistics for accuracy (N=101).
Accuracy of performance Kolmogorov-Smirnov Shapiro-Wilk
Statistics df Sig. Statistics df Sig.
Auditory discrimination of non-words
.187 101 .000 .909 101 .000
Non-word repetition .179 101 .000 .894 101 .000
Spelling of non-words .233 101 .000 .793 101 .000
Reading of non-words .226 101 .000 .914 101 .000
Spoonerism of non-words .102 101 .012* .969 101 .016*
Spoonerism of real words .210 101 .000 .906 101 .000 *significant α≥0.01
As visible in Table 24, the accuracy scores for auditory discrimination of non-words,
non-word repetition, reading of non-words, and spoonerism with real words yield
values of p<.01, and therefore they significantly deviate from normality. However, at a
significance level α≥0.01, it can be confirmed that the spoonerism with non-words task
is normally distributed, with a value of p=.012 (Kolmogorov-Smirnov) and p=.016
(Shapiro-Wilk).
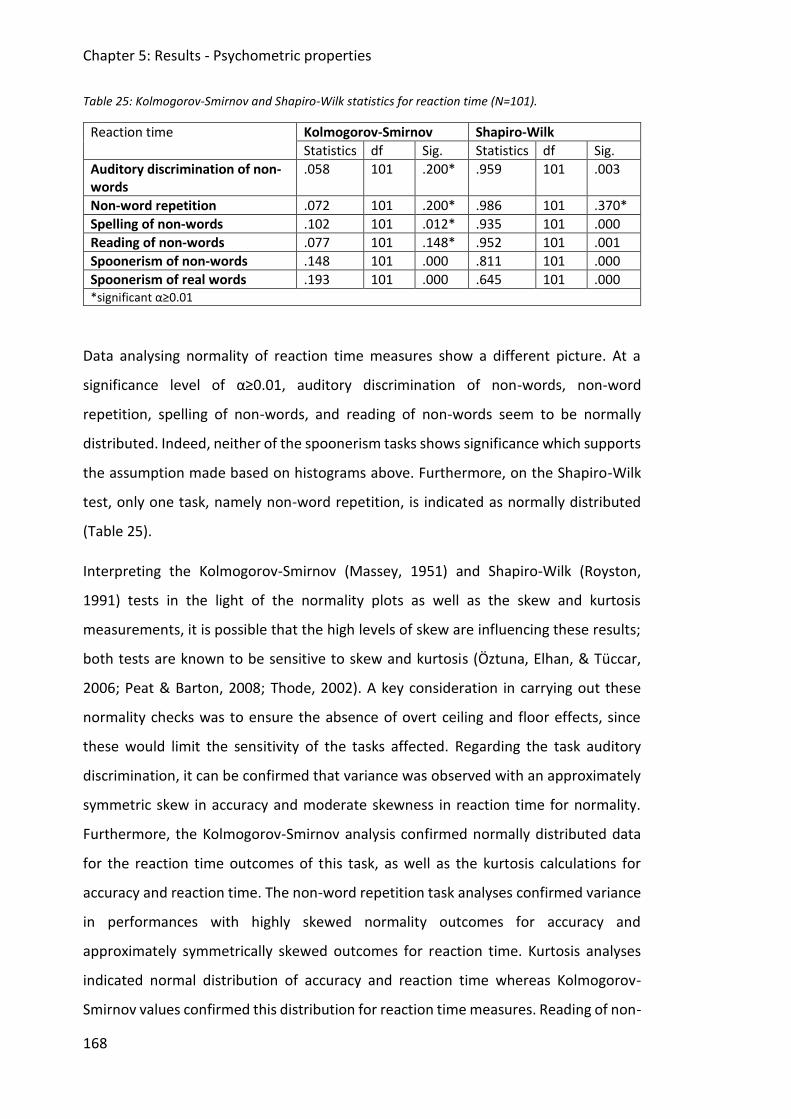
Chapter 5: Results - Psychometric properties
168
Table 25: Kolmogorov-Smirnov and Shapiro-Wilk statistics for reaction time (N=101).
Reaction time Kolmogorov-Smirnov Shapiro-Wilk
Statistics df Sig. Statistics df Sig.
Auditory discrimination of non-words
.058 101 .200* .959 101 .003
Non-word repetition .072 101 .200* .986 101 .370*
Spelling of non-words .102 101 .012* .935 101 .000
Reading of non-words .077 101 .148* .952 101 .001
Spoonerism of non-words .148 101 .000 .811 101 .000
Spoonerism of real words .193 101 .000 .645 101 .000 *significant α≥0.01
Data analysing normality of reaction time measures show a different picture. At a
significance level of α≥0.01, auditory discrimination of non-words, non-word
repetition, spelling of non-words, and reading of non-words seem to be normally
distributed. Indeed, neither of the spoonerism tasks shows significance which supports
the assumption made based on histograms above. Furthermore, on the Shapiro-Wilk
test, only one task, namely non-word repetition, is indicated as normally distributed
(Table 25).
Interpreting the Kolmogorov-Smirnov (Massey, 1951) and Shapiro-Wilk (Royston,
1991) tests in the light of the normality plots as well as the skew and kurtosis
measurements, it is possible that the high levels of skew are influencing these results;
both tests are known to be sensitive to skew and kurtosis (Öztuna, Elhan, & Tüccar,
2006; Peat & Barton, 2008; Thode, 2002). A key consideration in carrying out these
normality checks was to ensure the absence of overt ceiling and floor effects, since
these would limit the sensitivity of the tasks affected. Regarding the task auditory
discrimination, it can be confirmed that variance was observed with an approximately
symmetric skew in accuracy and moderate skewness in reaction time for normality.
Furthermore, the Kolmogorov-Smirnov analysis confirmed normally distributed data
for the reaction time outcomes of this task, as well as the kurtosis calculations for
accuracy and reaction time. The non-word repetition task analyses confirmed variance
in performances with highly skewed normality outcomes for accuracy and
approximately symmetrically skewed outcomes for reaction time. Kurtosis analyses
indicated normal distribution of accuracy and reaction time whereas Kolmogorov-
Smirnov values confirmed this distribution for reaction time measures. Reading of non-
Chapter 5: Results - Psychometric properties
169
words performances showed variance with moderate skews for normality for accuracy
and reaction time, whereas Kolmogorov-Smirnov confirmed normal distribution for
reaction time and kurtosis analyses for accuracy of outcomes. For spelling of non-
words, observed variance in outcomes could be confirmed for reaction time outcomes
using the Kolmogorov-Smirnov results and the kurtosis analyses. Skewness
investigations, however, indicated highly skewed data regarding normality for accuracy
and reaction time on this task. The task spoonerism with non-words was the only task
which showed normally distributed data for accuracy scores using Kolmogorov-
Smirnov and Shapiro-Wilk analyses. Kurtosis calculations confirmed this normal
distribution. Moreover, besides observed variances in accuracy and reaction time
performances, data were moderately skewed for accuracy and highly skewed for
reaction time. In contrast, analyses taking the spoonerism with real words task into
consideration did not show any significant outcomes in Kolmogorov-Smirnov and
Shapiro-Wilk analyses regarding normality, but showed approximately symmetrically
skewed data for accuracy and highly skewed data for reaction time. Moreover, kurtosis
evaluations indicated a normal distribution of accuracy outcomes for this task. Hence,
a variety of outcomes across and within tasks could be observed taking different
statistical tests into consideration and their interpretation of normality of results. Yet,
overall, while the data are subject to skew, it was determined that the psychometric
properties of the assessment were adequate to show performance variation across the
full range of subtests included.
Before analysing objectivity, reliability and validity in more detail, errors made during
assessment were analysed regarding their nature and frequency. These analyses were
carried out in order to gain a first exploratory idea of the errors’ characteristics. A
second aim of this analysis was to provide a sense of the types of errors occurring
within a normative sample, to allow more detailed comparison with the errors made
in the case series study.
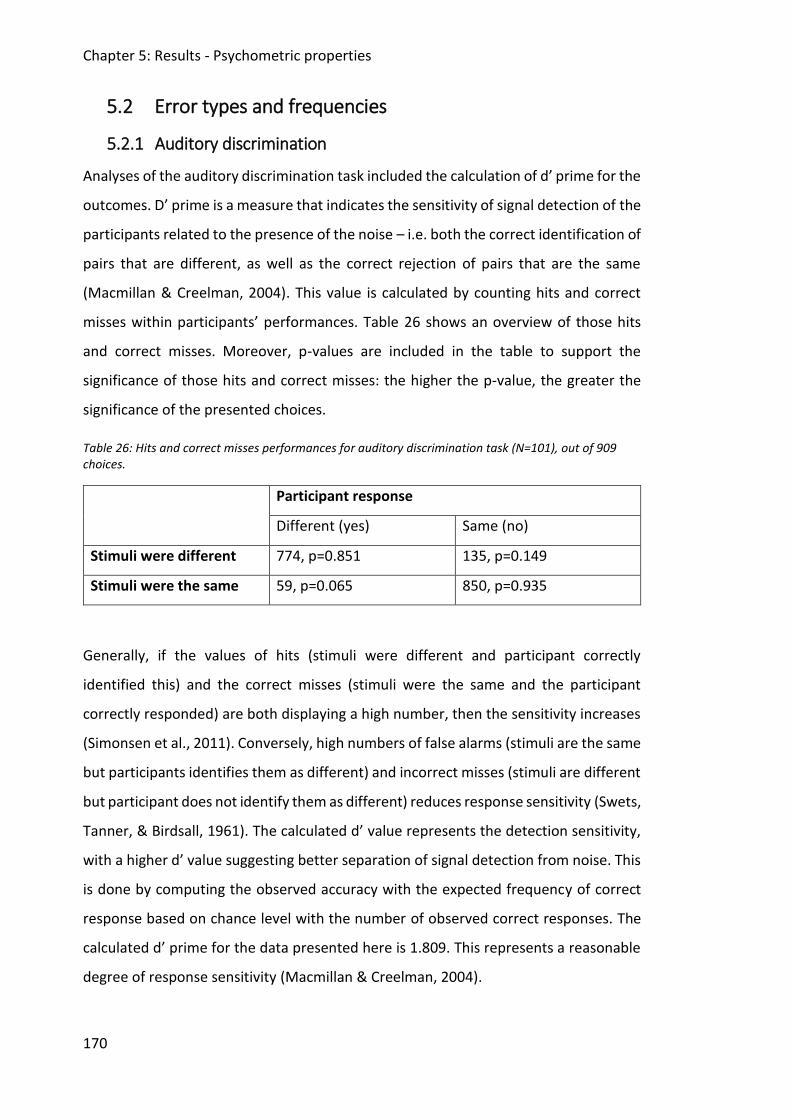
Chapter 5: Results - Psychometric properties
170
5.2 Error types and frequencies
5.2.1 Auditory discrimination
Analyses of the auditory discrimination task included the calculation of d’ prime for the
outcomes. D’ prime is a measure that indicates the sensitivity of signal detection of the
participants related to the presence of the noise – i.e. both the correct identification of
pairs that are different, as well as the correct rejection of pairs that are the same
(Macmillan & Creelman, 2004). This value is calculated by counting hits and correct
misses within participants’ performances. Table 26 shows an overview of those hits
and correct misses. Moreover, p-values are included in the table to support the
significance of those hits and correct misses: the higher the p-value, the greater the
significance of the presented choices.
Table 26: Hits and correct misses performances for auditory discrimination task (N=101), out of 909 choices.
Participant response
Different (yes) Same (no)
Stimuli were different 774, p=0.851 135, p=0.149
Stimuli were the same 59, p=0.065 850, p=0.935
Generally, if the values of hits (stimuli were different and participant correctly
identified this) and the correct misses (stimuli were the same and the participant
correctly responded) are both displaying a high number, then the sensitivity increases
(Simonsen et al., 2011). Conversely, high numbers of false alarms (stimuli are the same
but participants identifies them as different) and incorrect misses (stimuli are different
but participant does not identify them as different) reduces response sensitivity (Swets,
Tanner, & Birdsall, 1961). The calculated d’ value represents the detection sensitivity,
with a higher d’ value suggesting better separation of signal detection from noise. This
is done by computing the observed accuracy with the expected frequency of correct
response based on chance level with the number of observed correct responses. The
calculated d’ prime for the data presented here is 1.809. This represents a reasonable
degree of response sensitivity (Macmillan & Creelman, 2004).
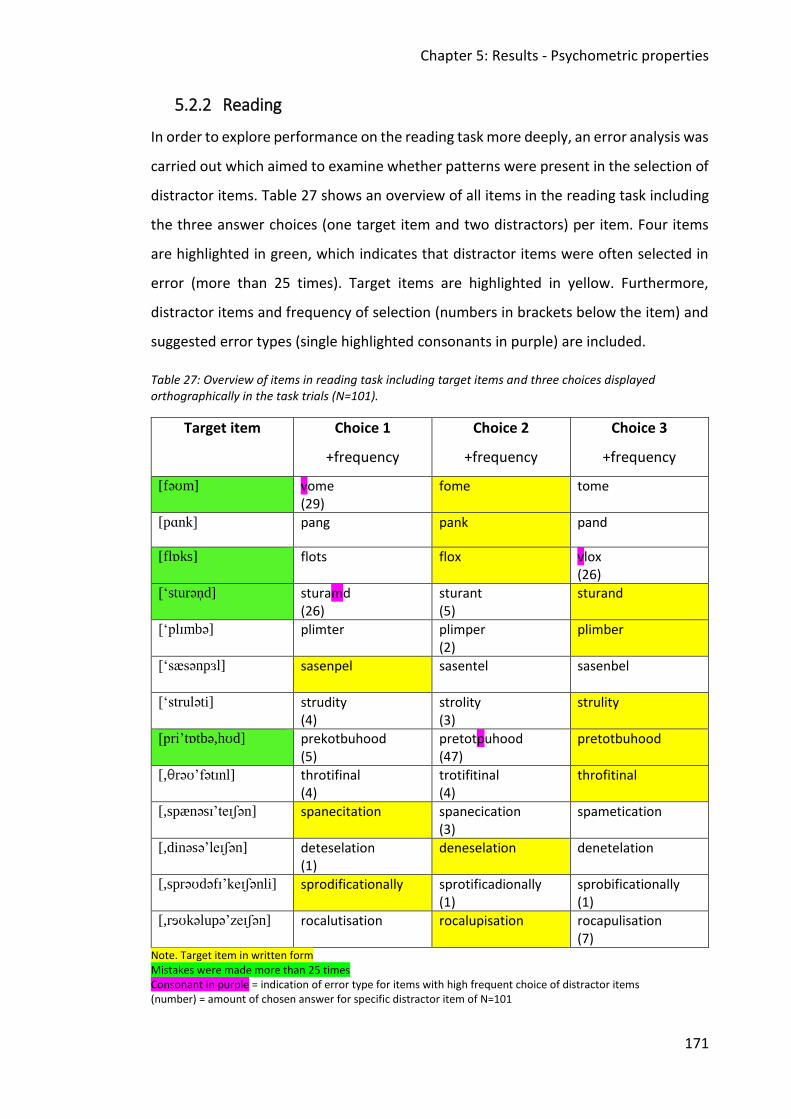
Chapter 5: Results - Psychometric properties
171
5.2.2 Reading
In order to explore performance on the reading task more deeply, an error analysis was
carried out which aimed to examine whether patterns were present in the selection of
distractor items. Table 27 shows an overview of all items in the reading task including
the three answer choices (one target item and two distractors) per item. Four items
are highlighted in green, which indicates that distractor items were often selected in
error (more than 25 times). Target items are highlighted in yellow. Furthermore,
distractor items and frequency of selection (numbers in brackets below the item) and
suggested error types (single highlighted consonants in purple) are included.
Table 27: Overview of items in reading task including target items and three choices displayed orthographically in the task trials (N=101).
Target item Choice 1
+frequency
Choice 2
+frequency
Choice 3
+frequency
[fəʊm] vome (29)
fome tome
[pɑnk]
pang pank pand
[flɒks] flots flox vlox (26)
[‘sturən̩d] sturamd (26)
sturant (5)
sturand
[‘plɪmbə] plimter plimper (2)
plimber
[‘sæsənpɜl] sasenpel
sasentel sasenbel
[‘struləti]
strudity (4)
strolity (3)
strulity
[pri’tɒtbə,hʊd] prekotbuhood (5)
pretotpuhood (47)
pretotbuhood
[,θrəʊ’fətɪnl] throtifinal (4)
trotifitinal (4)
throfitinal
[,spænəsɪ’teɪʃən]
spanecitation spanecication
(3) spametication
[,dinəsə’leɪʃən]
deteselation (1)
deneselation denetelation
[,sprəʊdəfɪ’keɪʃənli]
sprodificationally sprotificadionally
(1) sprobificationally (1)
[,rɘʊkəlupə’zeɪʃən] rocalutisation rocalupisation rocapulisation (7)
Note. Target item in written form Mistakes were made more than 25 times Consonant in purple = indication of error type for items with high frequent choice of distractor items (number) = amount of chosen answer for specific distractor item of N=101
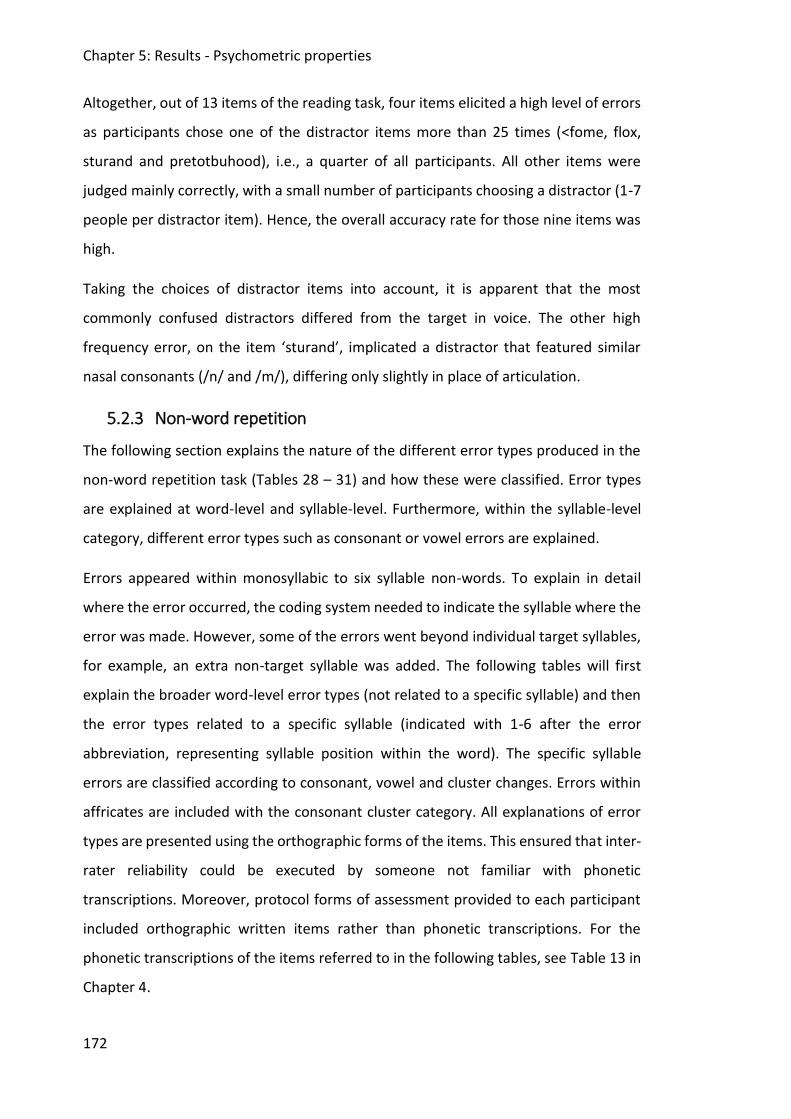
Chapter 5: Results - Psychometric properties
172
Altogether, out of 13 items of the reading task, four items elicited a high level of errors
as participants chose one of the distractor items more than 25 times (<fome, flox,
sturand and pretotbuhood), i.e., a quarter of all participants. All other items were
judged mainly correctly, with a small number of participants choosing a distractor (1-7
people per distractor item). Hence, the overall accuracy rate for those nine items was
high.
Taking the choices of distractor items into account, it is apparent that the most
commonly confused distractors differed from the target in voice. The other high
frequency error, on the item ‘sturand’, implicated a distractor that featured similar
nasal consonants (/n/ and /m/), differing only slightly in place of articulation.
5.2.3 Non-word repetition
The following section explains the nature of the different error types produced in the
non-word repetition task (Tables 28 – 31) and how these were classified. Error types
are explained at word-level and syllable-level. Furthermore, within the syllable-level
category, different error types such as consonant or vowel errors are explained.
Errors appeared within monosyllabic to six syllable non-words. To explain in detail
where the error occurred, the coding system needed to indicate the syllable where the
error was made. However, some of the errors went beyond individual target syllables,
for example, an extra non-target syllable was added. The following tables will first
explain the broader word-level error types (not related to a specific syllable) and then
the error types related to a specific syllable (indicated with 1-6 after the error
abbreviation, representing syllable position within the word). The specific syllable
errors are classified according to consonant, vowel and cluster changes. Errors within
affricates are included with the consonant cluster category. All explanations of error
types are presented using the orthographic forms of the items. This ensured that inter-
rater reliability could be executed by someone not familiar with phonetic
transcriptions. Moreover, protocol forms of assessment provided to each participant
included orthographic written items rather than phonetic transcriptions. For the
phonetic transcriptions of the items referred to in the following tables, see Table 13 in
Chapter 4.
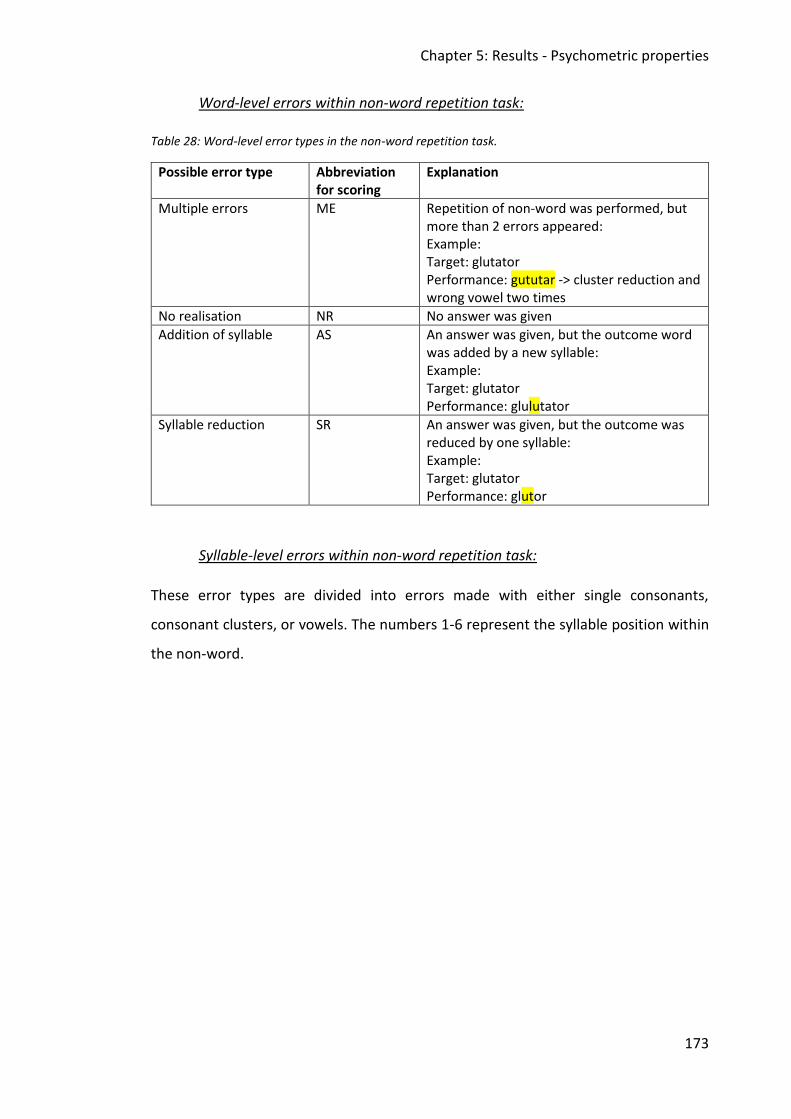
Chapter 5: Results - Psychometric properties
173
Word-level errors within non-word repetition task:
Table 28: Word-level error types in the non-word repetition task.
Possible error type Abbreviation for scoring
Explanation
Multiple errors ME Repetition of non-word was performed, but more than 2 errors appeared: Example: Target: glutator Performance: gututar -> cluster reduction and wrong vowel two times
No realisation NR No answer was given
Addition of syllable AS An answer was given, but the outcome word was added by a new syllable: Example: Target: glutator Performance: glulutator
Syllable reduction SR An answer was given, but the outcome was reduced by one syllable: Example: Target: glutator Performance: glutor
Syllable-level errors within non-word repetition task:
These error types are divided into errors made with either single consonants,
consonant clusters, or vowels. The numbers 1-6 represent the syllable position within
the non-word.
Chapter 5: Results - Psychometric properties
174
Consonant errors:
Table 29: Syllable-level errors made with consonants in non-word repetition task.
Possible error type Abbreviation for scoring
Explanation
Wrong consonant WC Consonant within one syllable was produced wrong: Example: Target: glutator Performance: glupator = WC2
Consonant reduction COR One syllable is missing a consonant: Example: Target: glutator Performance: gluator = CR2
Consonant made to cluster
CLA One consonant within the word was made to a cluster: Example: Target: glutator Performance: glutrator = CLA2
Spoonerism of two consonants across word
SP Two consonants within the word were swapped within one syllable or across one syllable within one word, when item was repeated: Example: Target: glutator Performance: glutarot = SP3
Consonant cluster errors:
Table 30: Syllable-level errors made with consonant clusters in the non-word repetition task.
Possible error type Abbreviation for scoring
Explanation
Wrong cluster WCL Wrong cluster was used in one of the syllables when word was produced: Example: Target: glutator Performance: blutator = WCL1
Cluster reduction CLR Cluster within one syllable was reduced: Example: Target: glutator Performance: gutator = CLR1
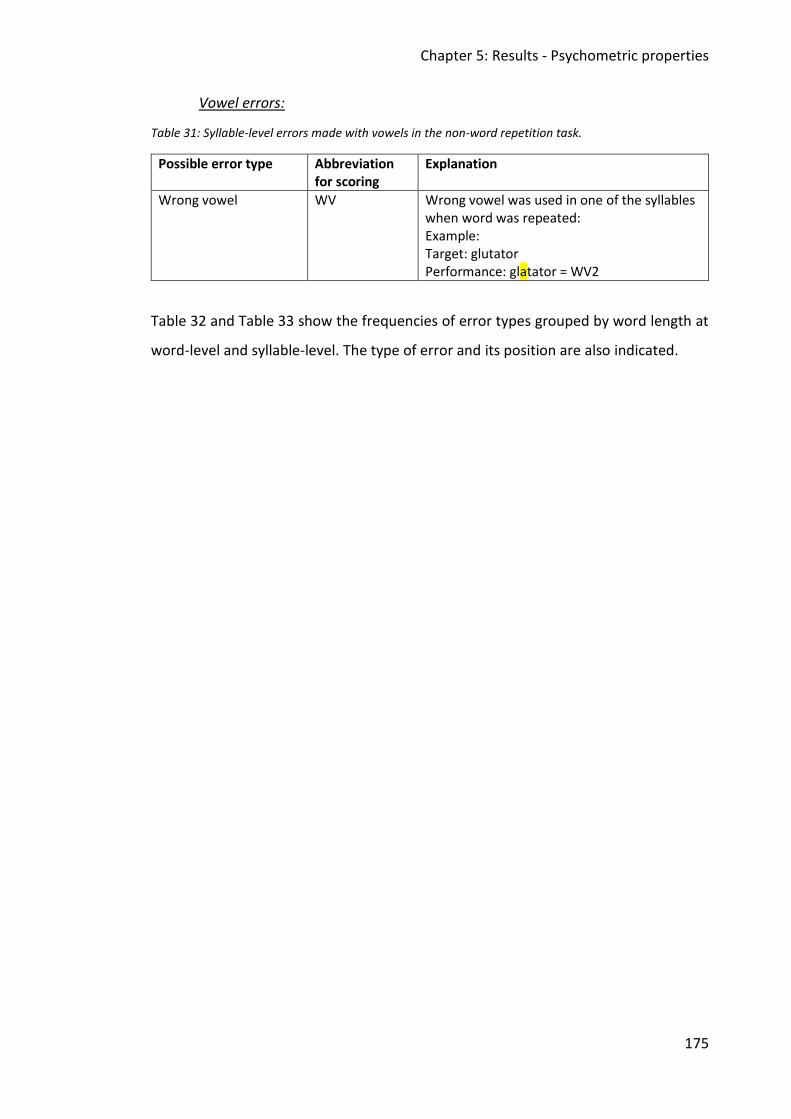
Chapter 5: Results - Psychometric properties
175
Vowel errors:
Table 31: Syllable-level errors made with vowels in the non-word repetition task.
Possible error type Abbreviation for scoring
Explanation
Wrong vowel WV Wrong vowel was used in one of the syllables when word was repeated: Example: Target: glutator Performance: glatator = WV2
Table 32 and Table 33 show the frequencies of error types grouped by word length at
word-level and syllable-level. The type of error and its position are also indicated.

Chapter 5: Results - Psychometric properties
176
Table 32: Frequency of errors made for the non-word repetition task at word-level (explanations of abbreviations of errors types on page 165).
Error type
Monosyllabic 2 Syllables 3 Syllables 4 Syllables 5 Syllables 6 Syllables
ME 9 4 20
NR 1 2 2
AS 1 1
SR 1 Occurred more than 10 times
Table 33: Frequency of errors made for the non-word repetition task at syllable-level (explanations of abbreviations of errors types on pages 165-167).
Error type
Mono-syllabic
2 Syllables
3 Syllables
4 Syllables
5 Syllables
6 Syllables
Position
1st 2nd 1st 2nd 3rd 1st 2nd 3rd 4th 1st 2nd 3rd 4th 5th 1st 2nd 3rd 4th 5th 6th
WC 1 3 10 1 8 3 11 1 4 1 13 2 12 6
COR 7 1
CLA 3 5 1
SP 1
WCL 1 4 2 28 17
CLR 12 2 1 1
WV 3 4 1 1 6 2 4 1 1 3 Occurred more than 10 times
Ch
apter 5: R
esults - P
sycho
metric p
rop
erties
17
8
Chapter 5: Results - Psychometric properties
177
Altogether, it is observable that word-level errors did not occur in monosyllabic to
three syllable non-words (Table 32). Within longer stimuli it was observable that six
syllable non-words were incorrectly realised 20 times. This result likely reflects the
increasing phonological and short-term memory load of the longer items.
Furthermore, errors made on specific syllables show higher frequencies (minimum of
10 times) in three, five, and six syllable non-words (Table 33). Concluding, it is
observable that most errors occurred in five syllable (n = 54) and six syllable non-words
(n = 58), compared to the other non-word lengths.
5.2.4 Spoonerism tasks
The analyses of the spoonerism tasks will be displayed as follows:
a. Spoonerism with real words ▪ Possible errors for whole spoonerism with real words (both words) ▪ Possible errors for single word in spoonerism with real words
(indicating 1 or 2 to signify word position)
• Consonant errors
• Consonant cluster errors
• Vowel errors
• Other errors
b. Spoonerism with non-words ▪ Possible errors for whole spoonerism with non-words (both words) ▪ Possible errors for single word in spoonerism with non-words
(indicating 1 or 2 to signify word position)
• Consonant errors
• Consonant cluster errors
• Vowel errors
• Other errors
c. Frequencies of errors made in both spoonerism tasks ▪ Spoonerism with real words ▪ Spoonerism with non-words
a. Spoonerism with real words
The following descriptions explain the nature of the different error types made in the
spoonerism task with real words (Tables 34 – 38). The scoring system for the
spoonerism tasks with non-words is presented separately, as more error types
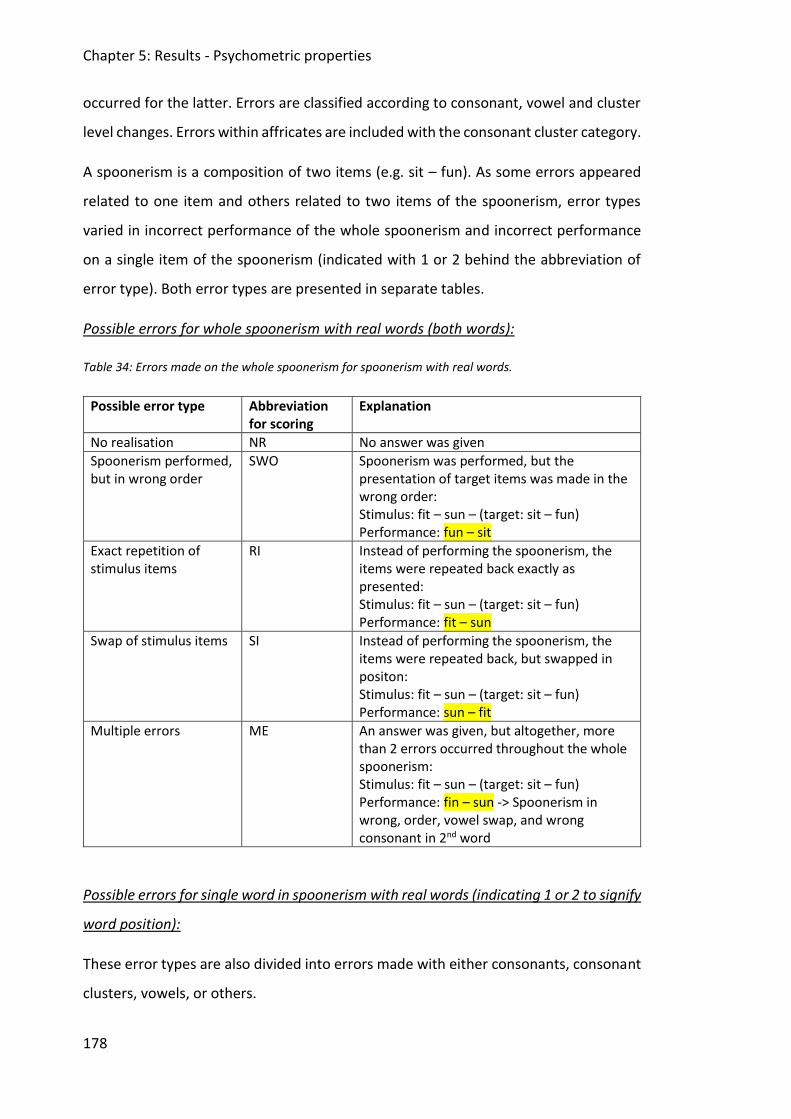
Chapter 5: Results - Psychometric properties
178
occurred for the latter. Errors are classified according to consonant, vowel and cluster
level changes. Errors within affricates are included with the consonant cluster category.
A spoonerism is a composition of two items (e.g. sit – fun). As some errors appeared
related to one item and others related to two items of the spoonerism, error types
varied in incorrect performance of the whole spoonerism and incorrect performance
on a single item of the spoonerism (indicated with 1 or 2 behind the abbreviation of
error type). Both error types are presented in separate tables.
Possible errors for whole spoonerism with real words (both words):
Table 34: Errors made on the whole spoonerism for spoonerism with real words.
Possible error type Abbreviation for scoring
Explanation
No realisation NR No answer was given
Spoonerism performed, but in wrong order
SWO Spoonerism was performed, but the presentation of target items was made in the wrong order: Stimulus: fit – sun – (target: sit – fun) Performance: fun – sit
Exact repetition of stimulus items
RI Instead of performing the spoonerism, the items were repeated back exactly as presented: Stimulus: fit – sun – (target: sit – fun) Performance: fit – sun
Swap of stimulus items SI Instead of performing the spoonerism, the items were repeated back, but swapped in positon: Stimulus: fit – sun – (target: sit – fun) Performance: sun – fit
Multiple errors
ME An answer was given, but altogether, more than 2 errors occurred throughout the whole spoonerism: Stimulus: fit – sun – (target: sit – fun) Performance: fin – sun -> Spoonerism in wrong, order, vowel swap, and wrong consonant in 2nd word
Possible errors for single word in spoonerism with real words (indicating 1 or 2 to signify
word position):
These error types are also divided into errors made with either consonants, consonant
clusters, vowels, or others.
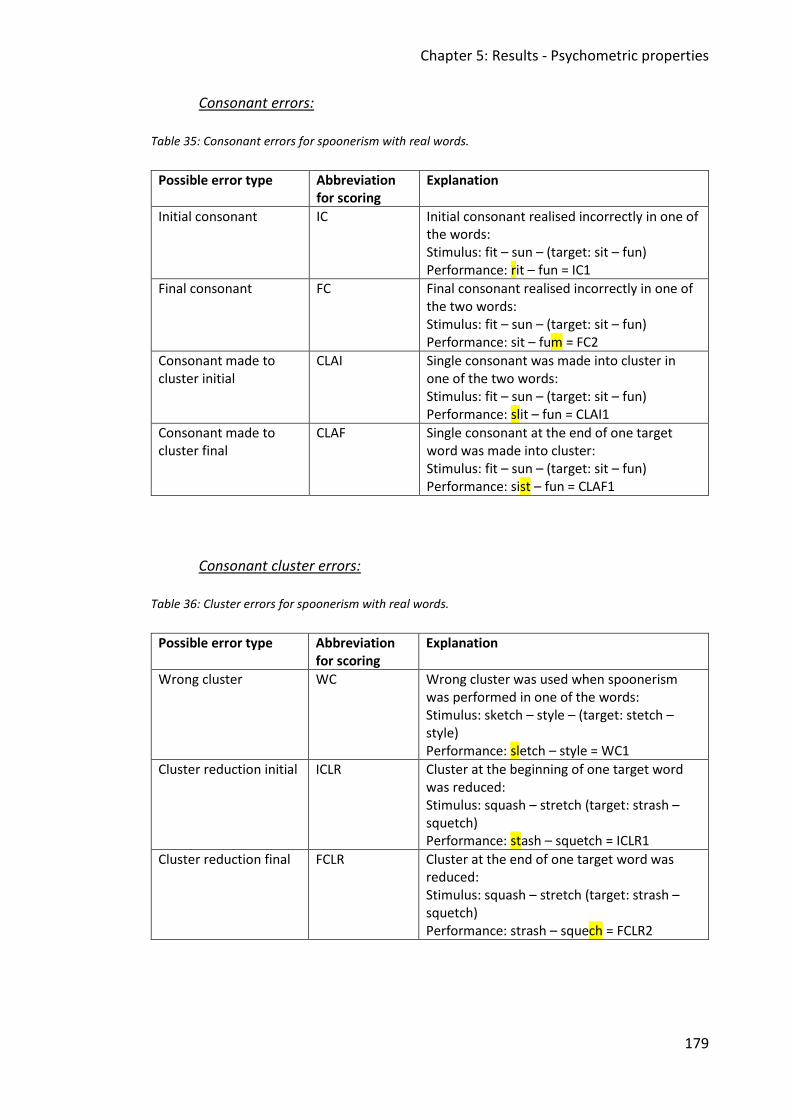
Chapter 5: Results - Psychometric properties
179
Consonant errors:
Table 35: Consonant errors for spoonerism with real words.
Possible error type Abbreviation for scoring
Explanation
Initial consonant IC Initial consonant realised incorrectly in one of the words: Stimulus: fit – sun – (target: sit – fun) Performance: rit – fun = IC1
Final consonant FC Final consonant realised incorrectly in one of the two words: Stimulus: fit – sun – (target: sit – fun) Performance: sit – fum = FC2
Consonant made to cluster initial
CLAI Single consonant was made into cluster in one of the two words: Stimulus: fit – sun – (target: sit – fun) Performance: slit – fun = CLAI1
Consonant made to cluster final
CLAF Single consonant at the end of one target word was made into cluster: Stimulus: fit – sun – (target: sit – fun) Performance: sist – fun = CLAF1
Consonant cluster errors:
Table 36: Cluster errors for spoonerism with real words.
Possible error type Abbreviation for scoring
Explanation
Wrong cluster WC Wrong cluster was used when spoonerism was performed in one of the words: Stimulus: sketch – style – (target: stetch – style) Performance: sletch – style = WC1
Cluster reduction initial ICLR Cluster at the beginning of one target word was reduced: Stimulus: squash – stretch (target: strash – squetch) Performance: stash – squetch = ICLR1
Cluster reduction final FCLR Cluster at the end of one target word was reduced: Stimulus: squash – stretch (target: strash – squetch) Performance: strash – squech = FCLR2
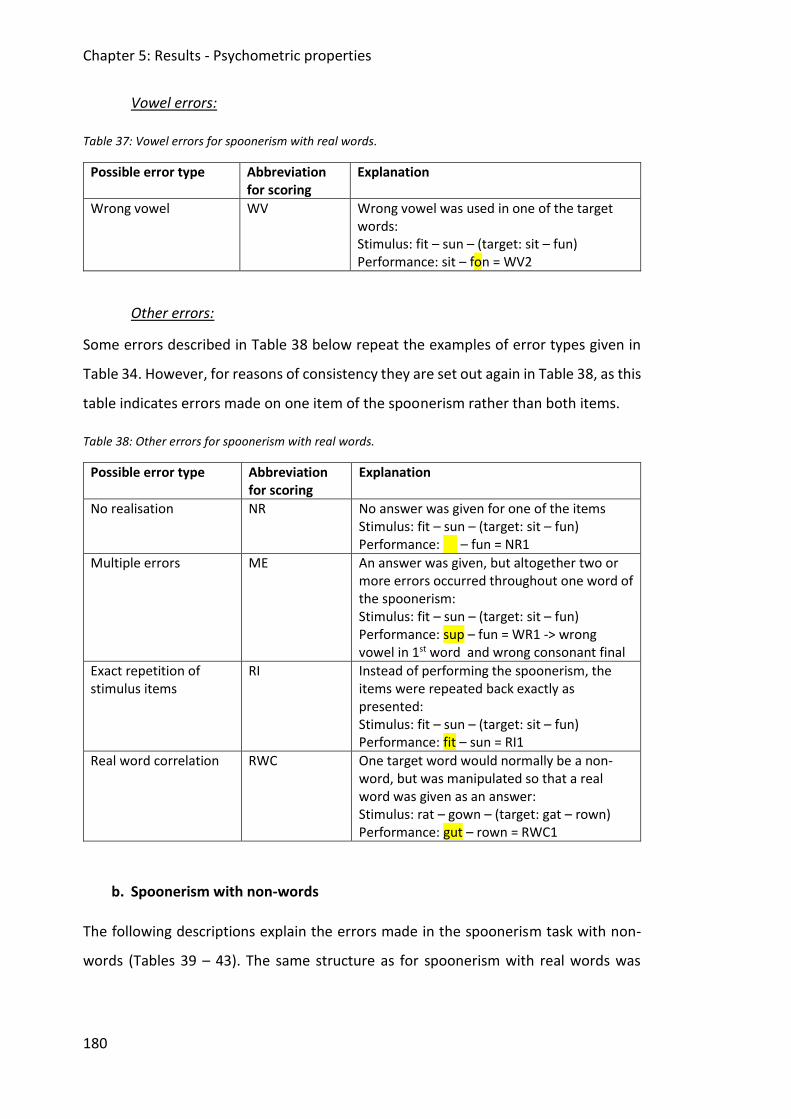
Chapter 5: Results - Psychometric properties
180
Vowel errors:
Table 37: Vowel errors for spoonerism with real words.
Possible error type Abbreviation for scoring
Explanation
Wrong vowel WV Wrong vowel was used in one of the target words: Stimulus: fit – sun – (target: sit – fun) Performance: sit – fon = WV2
Other errors:
Some errors described in Table 38 below repeat the examples of error types given in
Table 34. However, for reasons of consistency they are set out again in Table 38, as this
table indicates errors made on one item of the spoonerism rather than both items.
Table 38: Other errors for spoonerism with real words.
Possible error type Abbreviation for scoring
Explanation
No realisation NR No answer was given for one of the items Stimulus: fit – sun – (target: sit – fun) Performance: sit – fun = NR1
Multiple errors ME An answer was given, but altogether two or more errors occurred throughout one word of the spoonerism: Stimulus: fit – sun – (target: sit – fun) Performance: sup – fun = WR1 -> wrong vowel in 1st word and wrong consonant final
Exact repetition of stimulus items
RI Instead of performing the spoonerism, the items were repeated back exactly as presented: Stimulus: fit – sun – (target: sit – fun) Performance: fit – sun = RI1
Real word correlation RWC One target word would normally be a non-word, but was manipulated so that a real word was given as an answer: Stimulus: rat – gown – (target: gat – rown) Performance: gut – rown = RWC1
b. Spoonerism with non-words
The following descriptions explain the errors made in the spoonerism task with non-
words (Tables 39 – 43). The same structure as for spoonerism with real words was
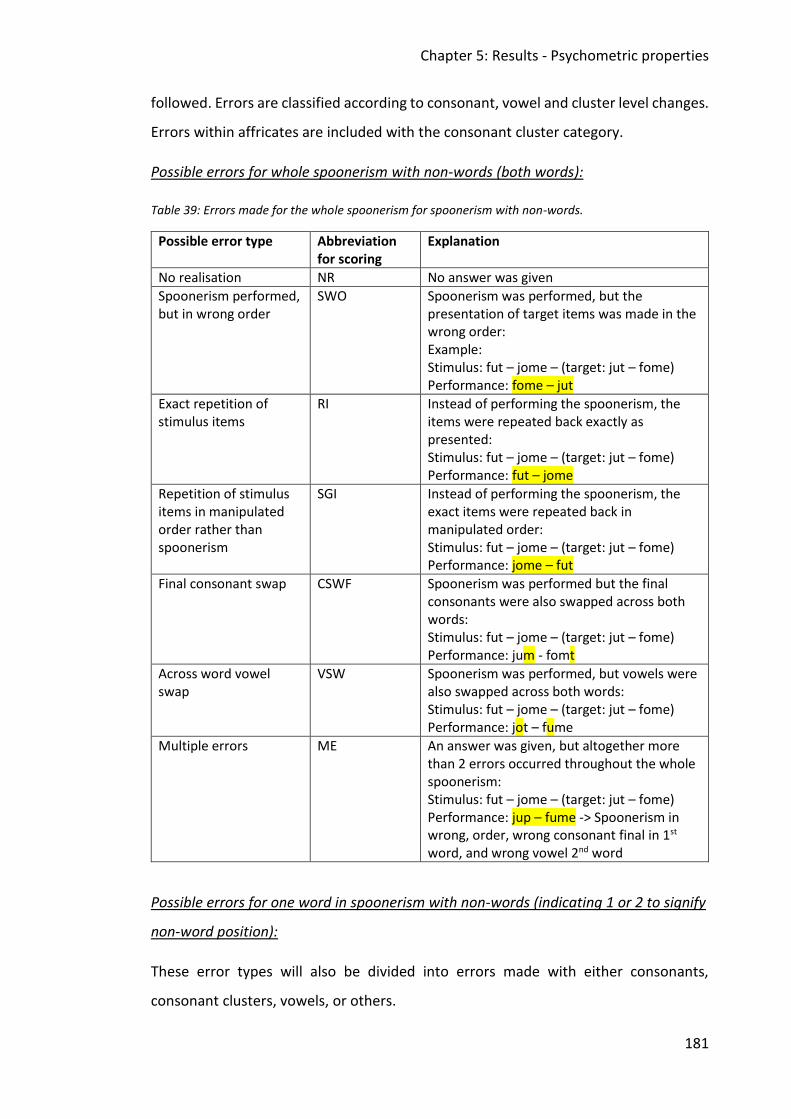
Chapter 5: Results - Psychometric properties
181
followed. Errors are classified according to consonant, vowel and cluster level changes.
Errors within affricates are included with the consonant cluster category.
Possible errors for whole spoonerism with non-words (both words):
Table 39: Errors made for the whole spoonerism for spoonerism with non-words.
Possible error type Abbreviation for scoring
Explanation
No realisation NR No answer was given
Spoonerism performed, but in wrong order
SWO Spoonerism was performed, but the presentation of target items was made in the wrong order: Example: Stimulus: fut – jome – (target: jut – fome) Performance: fome – jut
Exact repetition of stimulus items
RI Instead of performing the spoonerism, the items were repeated back exactly as presented: Stimulus: fut – jome – (target: jut – fome) Performance: fut – jome
Repetition of stimulus items in manipulated order rather than spoonerism
SGI Instead of performing the spoonerism, the exact items were repeated back in manipulated order: Stimulus: fut – jome – (target: jut – fome) Performance: jome – fut
Final consonant swap CSWF Spoonerism was performed but the final consonants were also swapped across both words: Stimulus: fut – jome – (target: jut – fome) Performance: jum - fomt
Across word vowel swap
VSW Spoonerism was performed, but vowels were also swapped across both words: Stimulus: fut – jome – (target: jut – fome) Performance: jot – fume
Multiple errors ME An answer was given, but altogether more than 2 errors occurred throughout the whole spoonerism: Stimulus: fut – jome – (target: jut – fome) Performance: jup – fume -> Spoonerism in wrong, order, wrong consonant final in 1st word, and wrong vowel 2nd word
Possible errors for one word in spoonerism with non-words (indicating 1 or 2 to signify
non-word position):
These error types will also be divided into errors made with either consonants,
consonant clusters, vowels, or others.
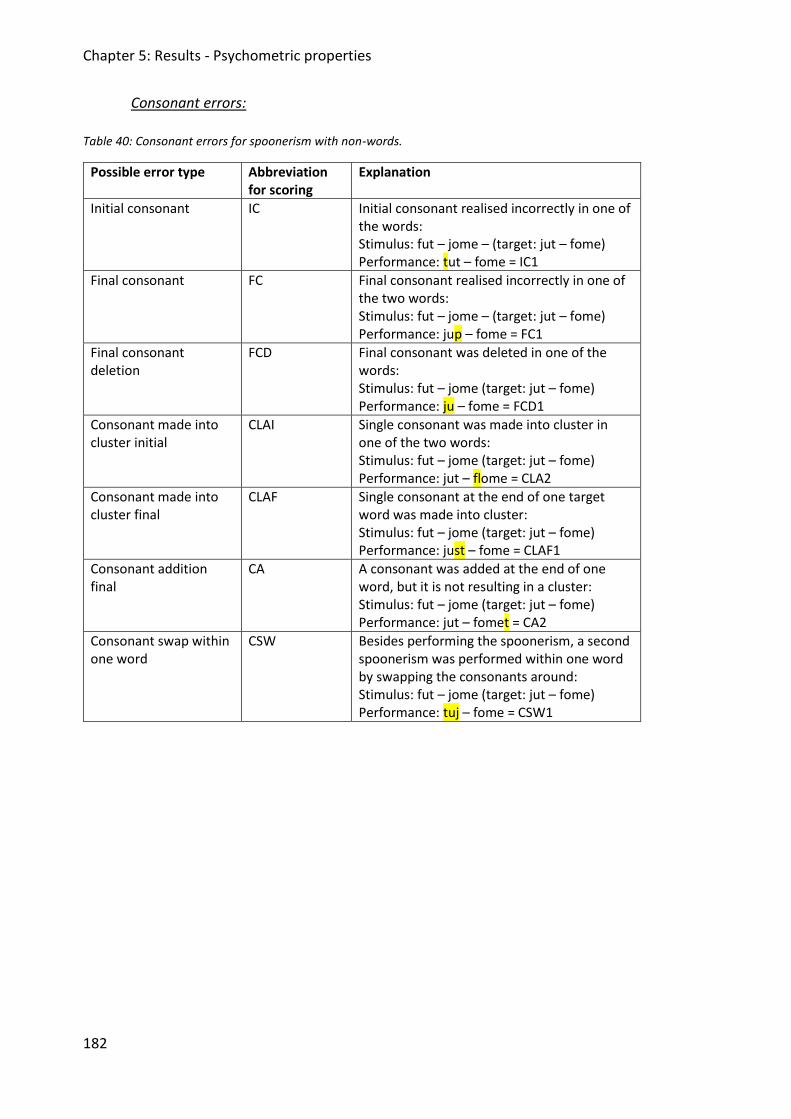
Chapter 5: Results - Psychometric properties
182
Consonant errors:
Table 40: Consonant errors for spoonerism with non-words.
Possible error type Abbreviation for scoring
Explanation
Initial consonant IC Initial consonant realised incorrectly in one of the words: Stimulus: fut – jome – (target: jut – fome) Performance: tut – fome = IC1
Final consonant FC Final consonant realised incorrectly in one of the two words: Stimulus: fut – jome – (target: jut – fome) Performance: jup – fome = FC1
Final consonant deletion
FCD Final consonant was deleted in one of the words: Stimulus: fut – jome (target: jut – fome) Performance: ju – fome = FCD1
Consonant made into cluster initial
CLAI Single consonant was made into cluster in one of the two words: Stimulus: fut – jome (target: jut – fome) Performance: jut – flome = CLA2
Consonant made into cluster final
CLAF Single consonant at the end of one target word was made into cluster: Stimulus: fut – jome (target: jut – fome) Performance: just – fome = CLAF1
Consonant addition final
CA A consonant was added at the end of one word, but it is not resulting in a cluster: Stimulus: fut – jome (target: jut – fome) Performance: jut – fomet = CA2
Consonant swap within one word
CSW Besides performing the spoonerism, a second spoonerism was performed within one word by swapping the consonants around: Stimulus: fut – jome (target: jut – fome) Performance: tuj – fome = CSW1
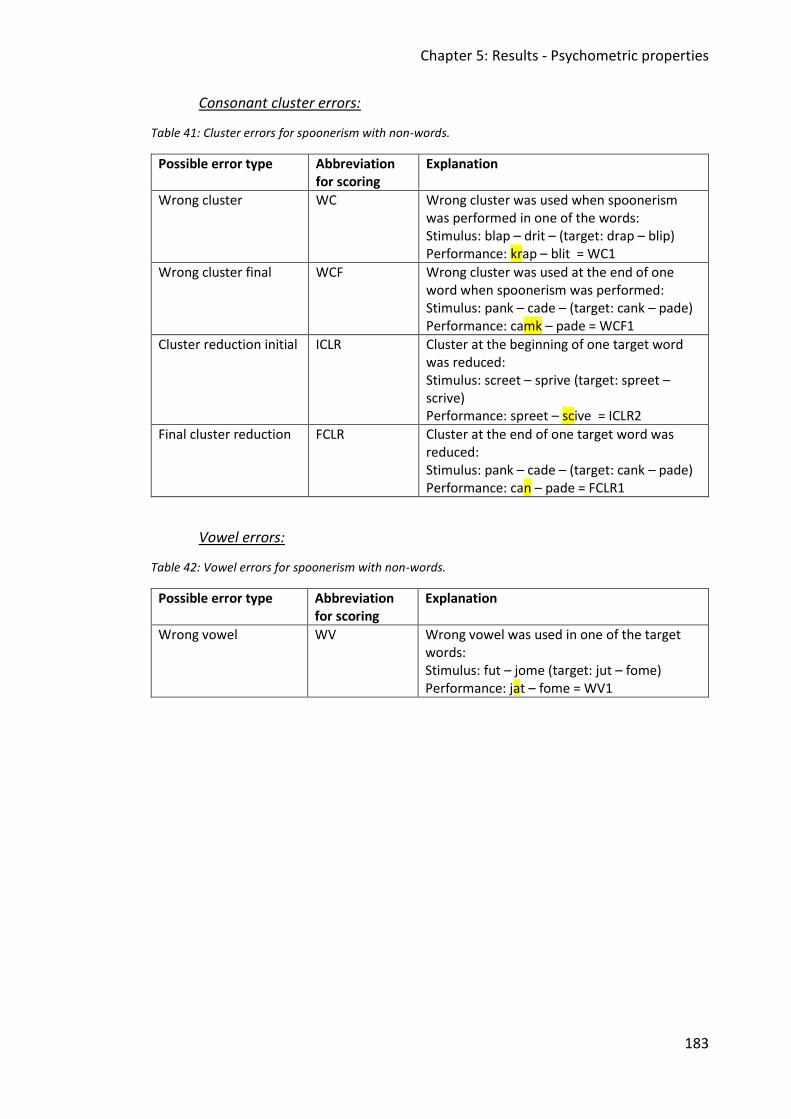
Chapter 5: Results - Psychometric properties
183
Consonant cluster errors:
Table 41: Cluster errors for spoonerism with non-words.
Possible error type Abbreviation for scoring
Explanation
Wrong cluster WC Wrong cluster was used when spoonerism was performed in one of the words: Stimulus: blap – drit – (target: drap – blip) Performance: krap – blit = WC1
Wrong cluster final WCF Wrong cluster was used at the end of one word when spoonerism was performed: Stimulus: pank – cade – (target: cank – pade) Performance: camk – pade = WCF1
Cluster reduction initial ICLR Cluster at the beginning of one target word was reduced: Stimulus: screet – sprive (target: spreet – scrive) Performance: spreet – scive = ICLR2
Final cluster reduction FCLR Cluster at the end of one target word was reduced: Stimulus: pank – cade – (target: cank – pade) Performance: can – pade = FCLR1
Vowel errors:
Table 42: Vowel errors for spoonerism with non-words.
Possible error type Abbreviation for scoring
Explanation
Wrong vowel WV Wrong vowel was used in one of the target words: Stimulus: fut – jome (target: jut – fome) Performance: jat – fome = WV1
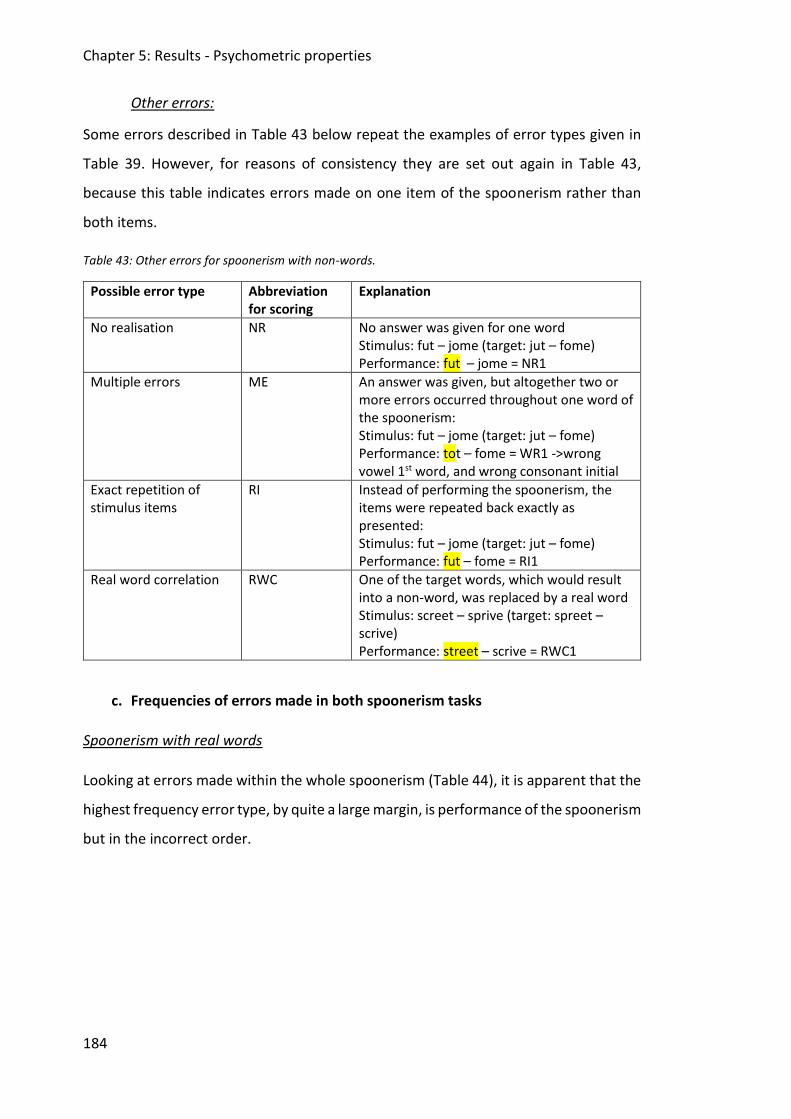
Chapter 5: Results - Psychometric properties
184
Other errors:
Some errors described in Table 43 below repeat the examples of error types given in
Table 39. However, for reasons of consistency they are set out again in Table 43,
because this table indicates errors made on one item of the spoonerism rather than
both items.
Table 43: Other errors for spoonerism with non-words.
Possible error type Abbreviation for scoring
Explanation
No realisation NR No answer was given for one word Stimulus: fut – jome (target: jut – fome) Performance: fut – jome = NR1
Multiple errors ME An answer was given, but altogether two or more errors occurred throughout one word of the spoonerism: Stimulus: fut – jome (target: jut – fome) Performance: tot – fome = WR1 ->wrong vowel 1st word, and wrong consonant initial
Exact repetition of stimulus items
RI Instead of performing the spoonerism, the items were repeated back exactly as presented: Stimulus: fut – jome (target: jut – fome) Performance: fut – fome = RI1
Real word correlation RWC One of the target words, which would result into a non-word, was replaced by a real word Stimulus: screet – sprive (target: spreet – scrive) Performance: street – scrive = RWC1
c. Frequencies of errors made in both spoonerism tasks
Spoonerism with real words
Looking at errors made within the whole spoonerism (Table 44), it is apparent that the
highest frequency error type, by quite a large margin, is performance of the spoonerism
but in the incorrect order.
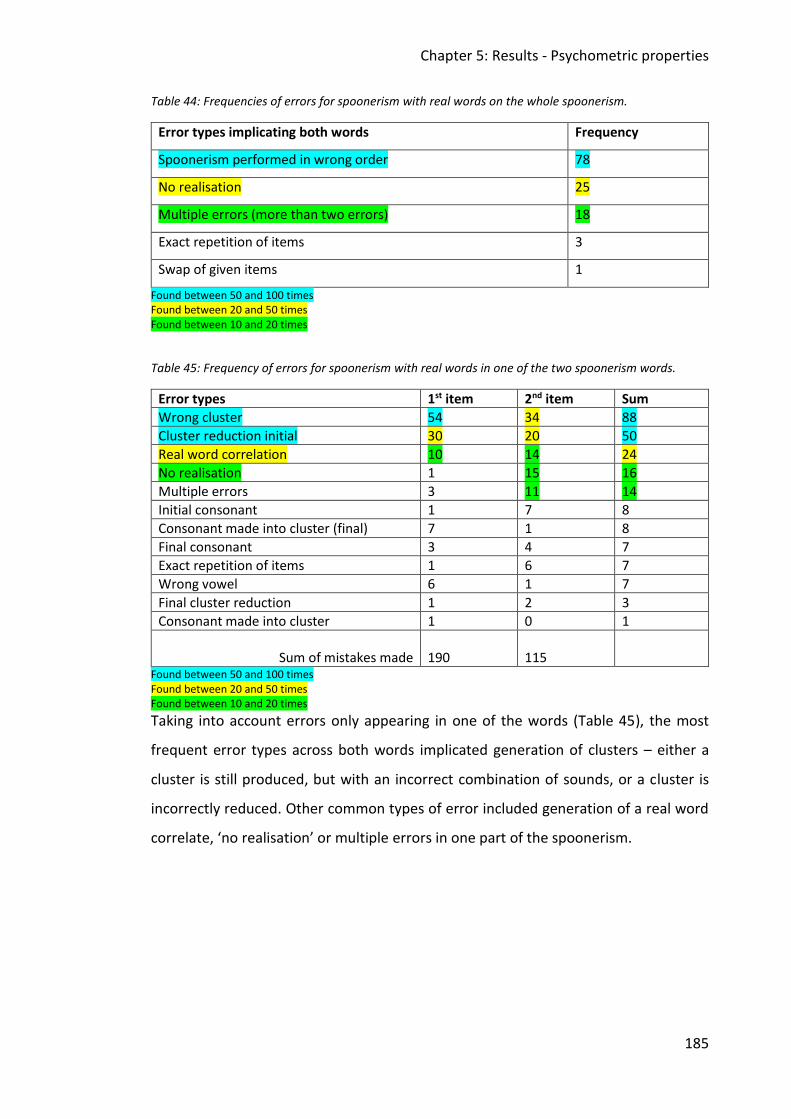
Chapter 5: Results - Psychometric properties
185
Table 44: Frequencies of errors for spoonerism with real words on the whole spoonerism.
Error types implicating both words Frequency
Spoonerism performed in wrong order 78
No realisation 25
Multiple errors (more than two errors) 18
Exact repetition of items 3
Swap of given items 1
Found between 50 and 100 times Found between 20 and 50 times Found between 10 and 20 times
Table 45: Frequency of errors for spoonerism with real words in one of the two spoonerism words.
Error types 1st item 2nd item Sum
Wrong cluster 54 34 88
Cluster reduction initial 30 20 50
Real word correlation 10 14 24
No realisation 1 15 16
Multiple errors 3 11 14
Initial consonant 1 7 8
Consonant made into cluster (final) 7 1 8
Final consonant 3 4 7
Exact repetition of items 1 6 7
Wrong vowel 6 1 7
Final cluster reduction 1 2 3
Consonant made into cluster 1 0 1
Sum of mistakes made
190
115
Found between 50 and 100 times Found between 20 and 50 times Found between 10 and 20 times
Taking into account errors only appearing in one of the words (Table 45), the most
frequent error types across both words implicated generation of clusters – either a
cluster is still produced, but with an incorrect combination of sounds, or a cluster is
incorrectly reduced. Other common types of error included generation of a real word
correlate, ‘no realisation’ or multiple errors in one part of the spoonerism.
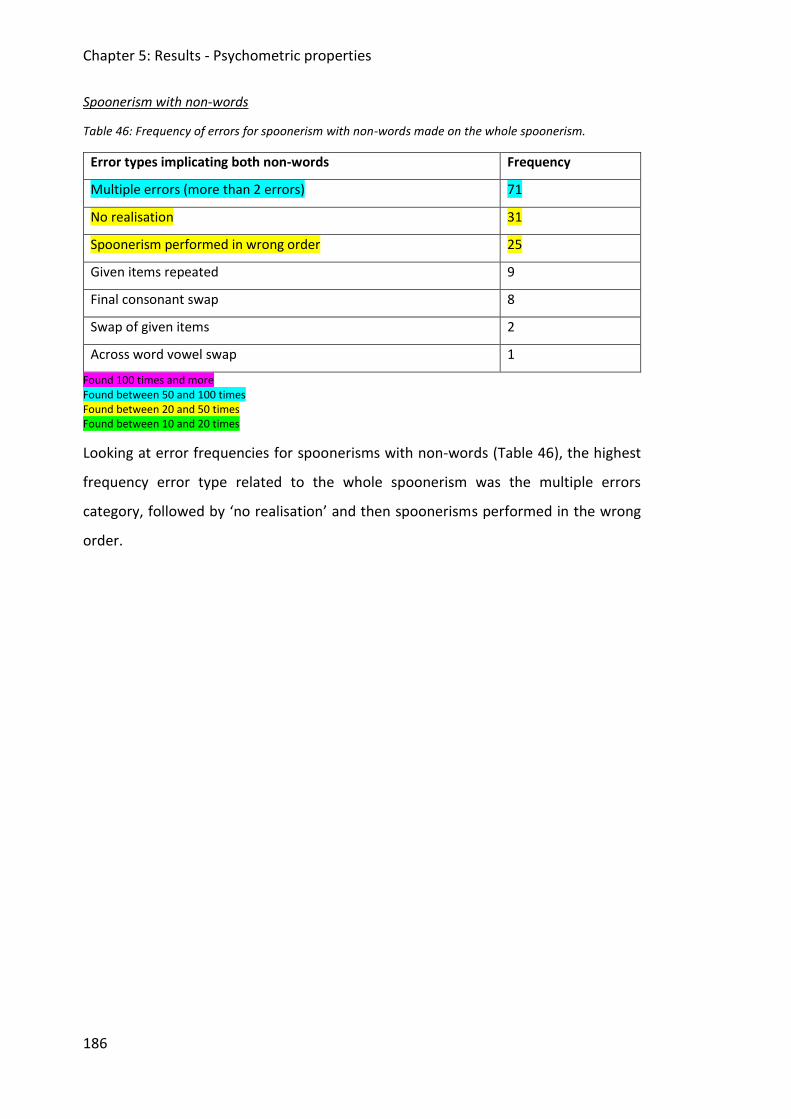
Chapter 5: Results - Psychometric properties
186
Spoonerism with non-words
Table 46: Frequency of errors for spoonerism with non-words made on the whole spoonerism.
Error types implicating both non-words Frequency
Multiple errors (more than 2 errors) 71
No realisation 31
Spoonerism performed in wrong order 25
Given items repeated 9
Final consonant swap 8
Swap of given items 2
Across word vowel swap 1
Found 100 times and more Found between 50 and 100 times Found between 20 and 50 times Found between 10 and 20 times
Looking at error frequencies for spoonerisms with non-words (Table 46), the highest
frequency error type related to the whole spoonerism was the multiple errors
category, followed by ‘no realisation’ and then spoonerisms performed in the wrong
order.
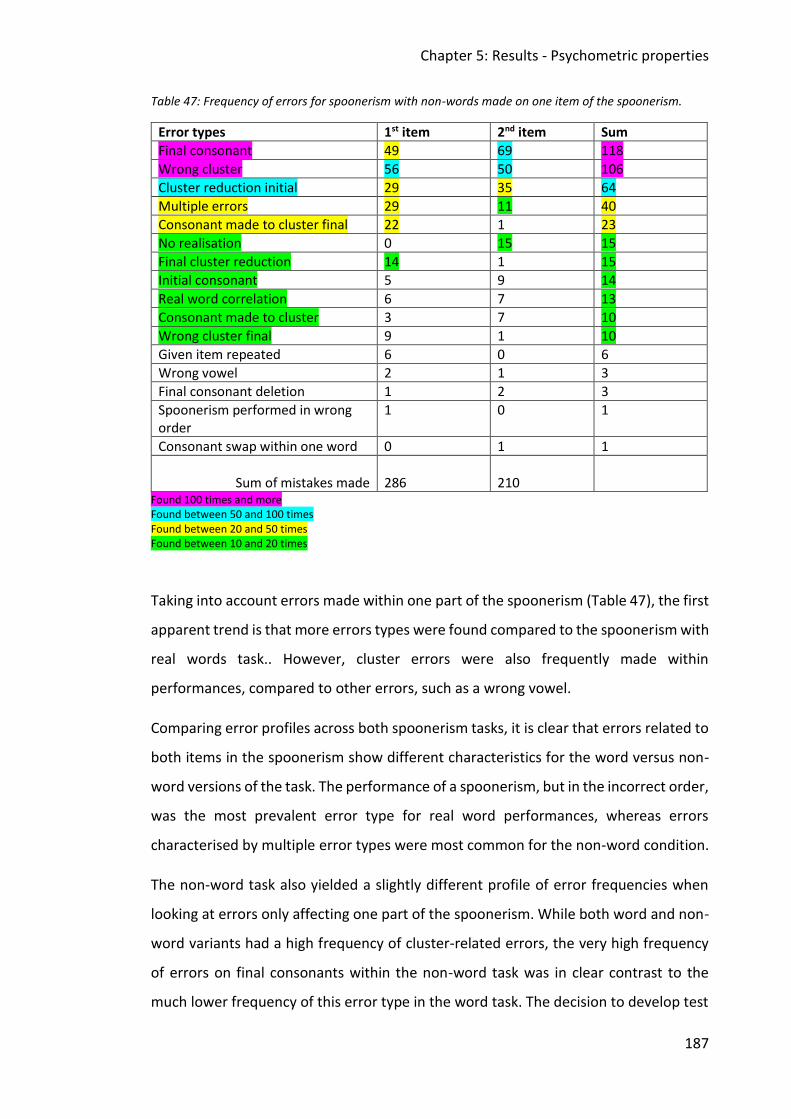
Chapter 5: Results - Psychometric properties
187
Table 47: Frequency of errors for spoonerism with non-words made on one item of the spoonerism.
Error types 1st item 2nd item Sum
Final consonant 49 69 118
Wrong cluster 56 50 106
Cluster reduction initial 29 35 64
Multiple errors 29 11 40
Consonant made to cluster final 22 1 23
No realisation 0 15 15
Final cluster reduction 14 1 15
Initial consonant 5 9 14
Real word correlation 6 7 13
Consonant made to cluster 3 7 10
Wrong cluster final 9 1 10
Given item repeated 6 0 6
Wrong vowel 2 1 3
Final consonant deletion 1 2 3
Spoonerism performed in wrong order
1 0 1
Consonant swap within one word 0 1 1
Sum of mistakes made
286
210
Found 100 times and more Found between 50 and 100 times Found between 20 and 50 times Found between 10 and 20 times
Taking into account errors made within one part of the spoonerism (Table 47), the first
apparent trend is that more errors types were found compared to the spoonerism with
real words task.. However, cluster errors were also frequently made within
performances, compared to other errors, such as a wrong vowel.
Comparing error profiles across both spoonerism tasks, it is clear that errors related to
both items in the spoonerism show different characteristics for the word versus non-
word versions of the task. The performance of a spoonerism, but in the incorrect order,
was the most prevalent error type for real word performances, whereas errors
characterised by multiple error types were most common for the non-word condition.
The non-word task also yielded a slightly different profile of error frequencies when
looking at errors only affecting one part of the spoonerism. While both word and non-
word variants had a high frequency of cluster-related errors, the very high frequency
of errors on final consonants within the non-word task was in clear contrast to the
much lower frequency of this error type in the word task. The decision to develop test
Chapter 5: Results - Psychometric properties
188
items that become progressively more complex within a phonological hierarchy is
supported by these results, as participants seemed to perform less accurately on items
with a cluster than single consonant items. This provides the task with a gradient of
difficulty with which to differentiate performance.
5.2.5 Spelling
The following descriptions explain the different error types made in the spelling of non-
words task.
Errors appeared within monosyllabic up to six syllable non-words. Similarly to the
scoring system for the non-word repetition task, the judgement always indicated the
syllable in which the error was made. Moreover, some of the errors made describe a
broader characteristic, for example a syllable addition. Deviating from other scoring
systems that were developed for the speech processing assessment, broader word-
level error types were also indicated with a syllable depending on where, for example,
the syllable addition happened. It was possible to do this as the scoring system for the
spelling task facilitated more detailed judgements, than the binary correct/incorrect
decisions permitted for other tasks across the tool. Individual items varied in terms of
the highest number of points possible per item (see methods, spelling scoring system,
Section 4.9.5). Hence, points ranged from zero (‘no realisation’) to the highest number
available for a specific item.
Tables 48 – 51 display the error types for the spelling of non-words task. The specific
syllable errors are classified according to consonant, cluster and syllable structure
levels (see the respective tables below). Errors within affricates are included within the
consonant cluster category. Location of error is indicated by a number (1-6) which
indicates the syllable in which the error occurred. Vowel errors were not considered
for this task, as the scoring system excluded vowels from judgement.
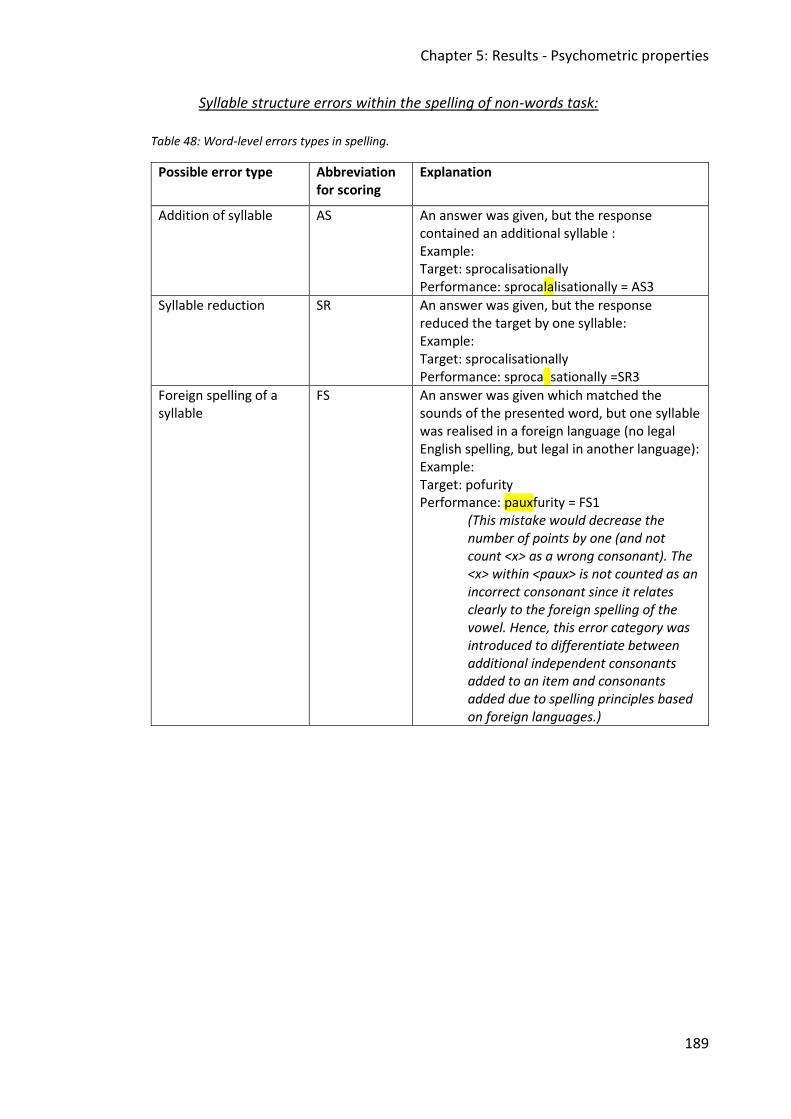
Chapter 5: Results - Psychometric properties
189
Syllable structure errors within the spelling of non-words task:
Table 48: Word-level errors types in spelling.
Possible error type Abbreviation for scoring
Explanation
Addition of syllable AS An answer was given, but the response contained an additional syllable : Example: Target: sprocalisationally Performance: sprocalalisationally = AS3
Syllable reduction SR An answer was given, but the response reduced the target by one syllable: Example: Target: sprocalisationally Performance: sprocalisationally =SR3
Foreign spelling of a syllable
FS An answer was given which matched the sounds of the presented word, but one syllable was realised in a foreign language (no legal English spelling, but legal in another language): Example: Target: pofurity Performance: pauxfurity = FS1
(This mistake would decrease the number of points by one (and not count <x> as a wrong consonant). The <x> within <paux> is not counted as an incorrect consonant since it relates clearly to the foreign spelling of the vowel. Hence, this error category was introduced to differentiate between additional independent consonants added to an item and consonants added due to spelling principles based on foreign languages.)
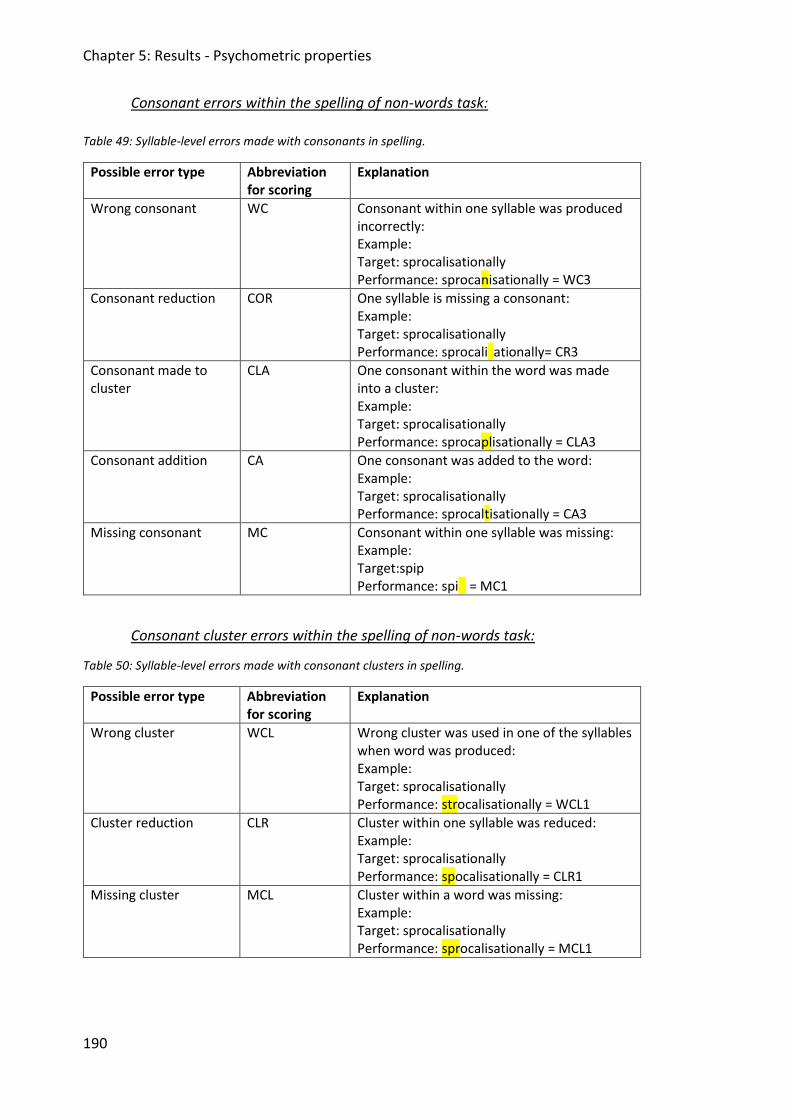
Chapter 5: Results - Psychometric properties
190
Consonant errors within the spelling of non-words task:
Table 49: Syllable-level errors made with consonants in spelling.
Possible error type Abbreviation for scoring
Explanation
Wrong consonant WC Consonant within one syllable was produced incorrectly: Example: Target: sprocalisationally Performance: sprocanisationally = WC3
Consonant reduction COR One syllable is missing a consonant: Example: Target: sprocalisationally Performance: sprocalisationally= CR3
Consonant made to cluster
CLA One consonant within the word was made into a cluster: Example: Target: sprocalisationally Performance: sprocaplisationally = CLA3
Consonant addition CA One consonant was added to the word: Example: Target: sprocalisationally Performance: sprocaltisationally = CA3
Missing consonant MC Consonant within one syllable was missing: Example: Target:spip Performance: spip = MC1
Consonant cluster errors within the spelling of non-words task:
Table 50: Syllable-level errors made with consonant clusters in spelling.
Possible error type Abbreviation for scoring
Explanation
Wrong cluster WCL Wrong cluster was used in one of the syllables when word was produced: Example: Target: sprocalisationally Performance: strocalisationally = WCL1
Cluster reduction CLR Cluster within one syllable was reduced: Example: Target: sprocalisationally Performance: spocalisationally = CLR1
Missing cluster MCL Cluster within a word was missing: Example: Target: sprocalisationally Performance: sprocalisationally = MCL1
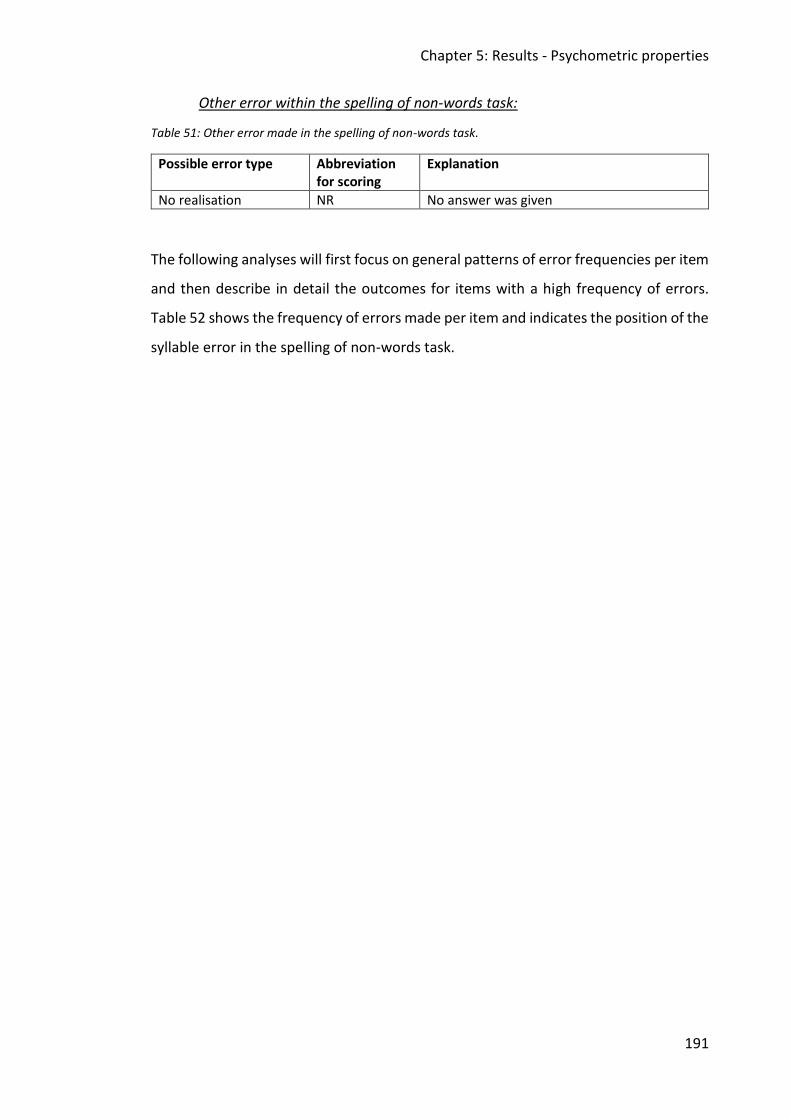
Chapter 5: Results - Psychometric properties
191
Other error within the spelling of non-words task:
Table 51: Other error made in the spelling of non-words task.
Possible error type Abbreviation for scoring
Explanation
No realisation NR No answer was given
The following analyses will first focus on general patterns of error frequencies per item
and then describe in detail the outcomes for items with a high frequency of errors.
Table 52 shows the frequency of errors made per item and indicates the position of the
syllable error in the spelling of non-words task.
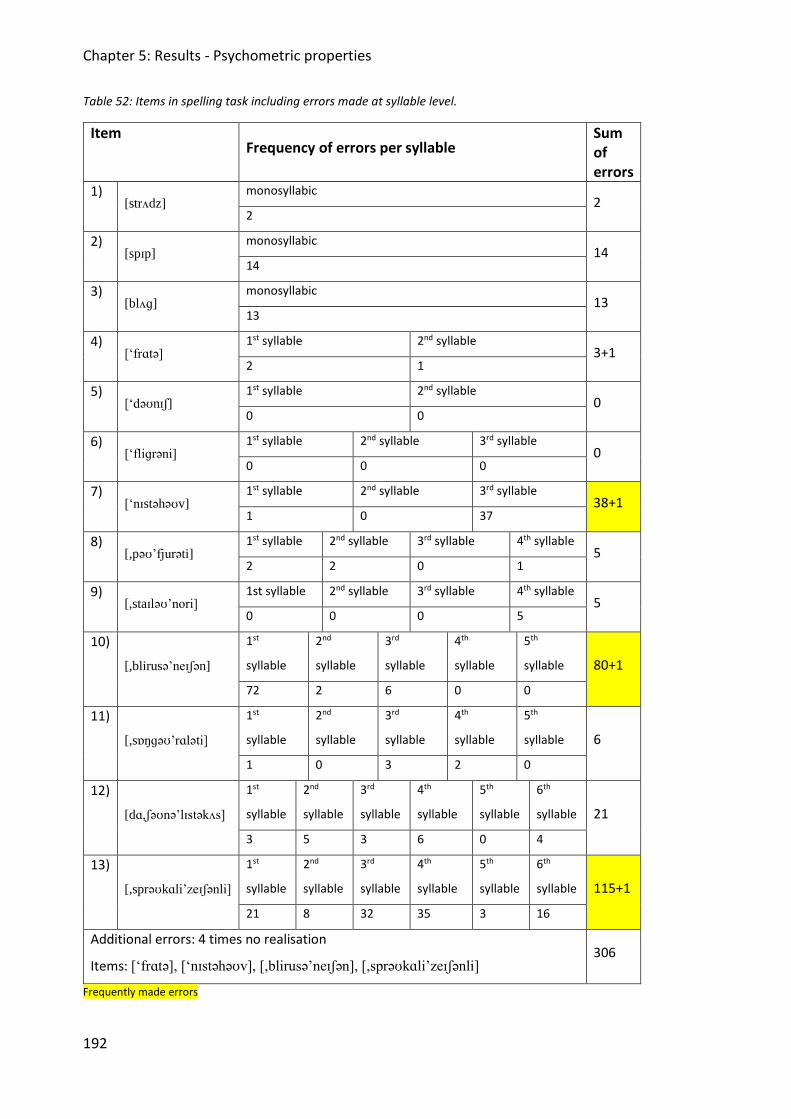
Chapter 5: Results - Psychometric properties
192
Table 52: Items in spelling task including errors made at syllable level.
Item Frequency of errors per syllable
Sum of errors
1) [strʌdz]
monosyllabic 2
2
2) [spɪp]
monosyllabic 14
14
3) [blʌɡ]
monosyllabic 13
13
4) [‘frɑtə]
1st syllable 2nd syllable 3+1
2 1
5) [‘dəʊnɪʃ]
1st syllable 2nd syllable 0
0 0
6) [‘fliɡrəni]
1st syllable 2nd syllable 3rd syllable 0
0 0 0
7) [‘nɪstəhəʊv]
1st syllable 2nd syllable 3rd syllable 38+1
1 0 37
8) [,pəʊ’fjurəti]
1st syllable 2nd syllable 3rd syllable 4th syllable 5
2 2 0 1
9) [,staɪləʊ’nori]
1st syllable 2nd syllable 3rd syllable 4th syllable 5
0 0 0 5
10)
[,blirusə’neɪʃən]
1st
syllable
2nd
syllable
3rd
syllable
4th
syllable
5th
syllable 80+1
72 2 6 0 0
11)
[,sɒŋɡəʊ’rɑləti]
1st
syllable
2nd
syllable
3rd
syllable
4th
syllable
5th
syllable 6
1 0 3 2 0
12)
[dɑ,ʃəʊnə’lɪstəkʌs]
1st
syllable
2nd
syllable
3rd
syllable
4th
syllable
5th
syllable
6th
syllable 21
3 5 3 6 0 4
13)
[,sprəʊkɑli’zeɪʃənli]
1st
syllable
2nd
syllable
3rd
syllable
4th
syllable
5th
syllable
6th
syllable 115+1
21 8 32 35 3 16
Additional errors: 4 times no realisation
Items: [‘frɑtə], [‘nɪstəhəʊv], [,blirusə’neɪʃən], [,sprəʊkɑli’zeɪʃənli] 306
Frequently made errors
Chapter 5: Results - Psychometric properties
193
Altogether, 306 mistakes were identified in the analysis of the spelling of non-words
task. One notable observation is that compared to the other output tasks (non-word
repetition and both spoonerism tasks), only a small number of complete ‘no
realisations’ were found (additional errors: four); that might be due to the fact that
participants could spell their answer which might facilitate task performance by
allowing more time to think and formulate the answer (using visual feedback), in
contrast to the verbal answers required in the other output tasks which counted
immediately towards scoring. Also, the scoring system for the spelling task was unique
– a system needed to be in place which differentiated between acceptable and non-
acceptable spellings respecting the complexity of English orthography. In the scoring
systems for the other output tasks, incorrect versus correct performance judgements
were made in the first instance. All errors in the spelling task outcomes were counted
independently of frequency of errors made per participant and per specific item.
Of the remaining errors (302) made in the spelling task, three items, namely items 7,
10, and 13, yielded more frequently occurring errors than the remaining items. For all
remaining items, the overall accuracy rate was relatively high. Item 7 was marked by a
high number of mistakes on the third syllable, whereas for item 10, the first syllable
was mainly realised incorrectly. A spread of errors across all syllables can be found for
item 13. For further analysis, the error type/nature was considered. Table 53 shows an
overview of errors made for these three items.
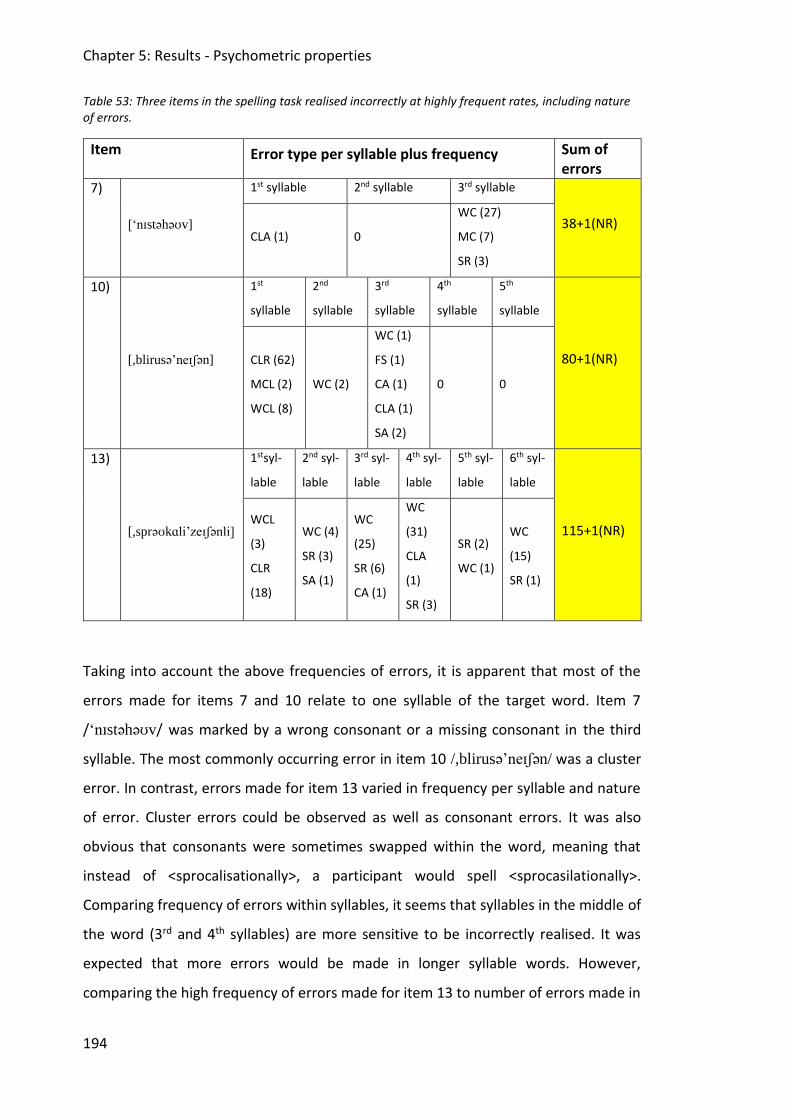
Chapter 5: Results - Psychometric properties
194
Table 53: Three items in the spelling task realised incorrectly at highly frequent rates, including nature of errors.
Item Error type per syllable plus frequency Sum of errors
7)
[‘nɪstəhəʊv]
1st syllable 2nd syllable 3rd syllable
38+1(NR) CLA (1) 0
WC (27)
MC (7)
SR (3)
10)
[,blirusə’neɪʃən]
1st
syllable
2nd
syllable
3rd
syllable
4th
syllable
5th
syllable
80+1(NR) CLR (62)
MCL (2)
WCL (8)
WC (2)
WC (1)
FS (1)
CA (1)
CLA (1)
SA (2)
0 0
13)
[,sprəʊkɑli’zeɪʃənli]
1stsyl-
lable
2nd syl-
lable
3rd syl-
lable
4th syl-
lable
5th syl-
lable
6th syl-
lable
115+1(NR) WCL
(3)
CLR
(18)
WC (4)
SR (3)
SA (1)
WC
(25)
SR (6)
CA (1)
WC
(31)
CLA
(1)
SR (3)
SR (2)
WC (1)
WC
(15)
SR (1)
Taking into account the above frequencies of errors, it is apparent that most of the
errors made for items 7 and 10 relate to one syllable of the target word. Item 7
/‘nɪstəhəʊv/ was marked by a wrong consonant or a missing consonant in the third
syllable. The most commonly occurring error in item 10 /,blirusə’neɪʃən/ was a cluster
error. In contrast, errors made for item 13 varied in frequency per syllable and nature
of error. Cluster errors could be observed as well as consonant errors. It was also
obvious that consonants were sometimes swapped within the word, meaning that
instead of <sprocalisationally>, a participant would spell <sprocasilationally>.
Comparing frequency of errors within syllables, it seems that syllables in the middle of
the word (3rd and 4th syllables) are more sensitive to be incorrectly realised. It was
expected that more errors would be made in longer syllable words. However,
comparing the high frequency of errors made for item 13 to number of errors made in
Chapter 5: Results - Psychometric properties
195
other 5 or 6 syllable words, a great difference can be observed (e.g. 21
<dashonalisticus> versus 116 <sprocalisationally>). Additionally, all three items include
one ‘no realisation’ error out of four across the whole task. Cronbach’s alpha analyses
(explained in Section 5.4.1) of these items did not show that those items had a specific
score in relation to other items of this task. However, these specific items will be
addressed later in the discussion (Section 5.6.2) of this chapter.
Concluding, these analyses show that three items in this task were particularly prone
to error. Future developments (out of the scope of this doctoral study) of the tool
would need to consider the clarity of the specific audio-recordings for these items, but
if the sounds proved to be intrinsically hard to perceive, the items might need to be
revised in order to bolster test reliability at an item level. This will be further addressed
in the discussion of the results.
This provides a segue to the next sections, which further describe characteristics of the
speech processing assessment in relation to objectivity, reliability and validity.
5.3 Objectivity
With the aim of attaining objectivity, three different kinds of objectivity were
specifically addressed: test objectivity, scoring objectivity, and objectivity in
interpreting the results. Moreover, objectivity was mainly ensured by using a computer
based program for the new speech processing assessment (Peirce, 2007). This
procedure warrants exact same task presentation and execution for every participant,
as well as judgement of correct or incorrect answers. Firstly, the complete tool was
programmed on a laptop to allow for standardised and consistent presentation of the
task instructions (given via written text on screen), practice items and task stimuli.
Furthermore, the programme automatically identified correct and incorrect answers
where possible, so enabling greater objectivity in scoring. Items were presented via
headphones and participants recorded their responses by pressing one of the coloured
keys or speaking into the microphone. A fixed number of response options was given
for all input tasks, namely reading of non-words and auditory discrimination of non-
words (correct versus incorrect). Performances on output tasks, namely, non-word
repetition and spoonerism, were firstly assessed by the investigator using binary
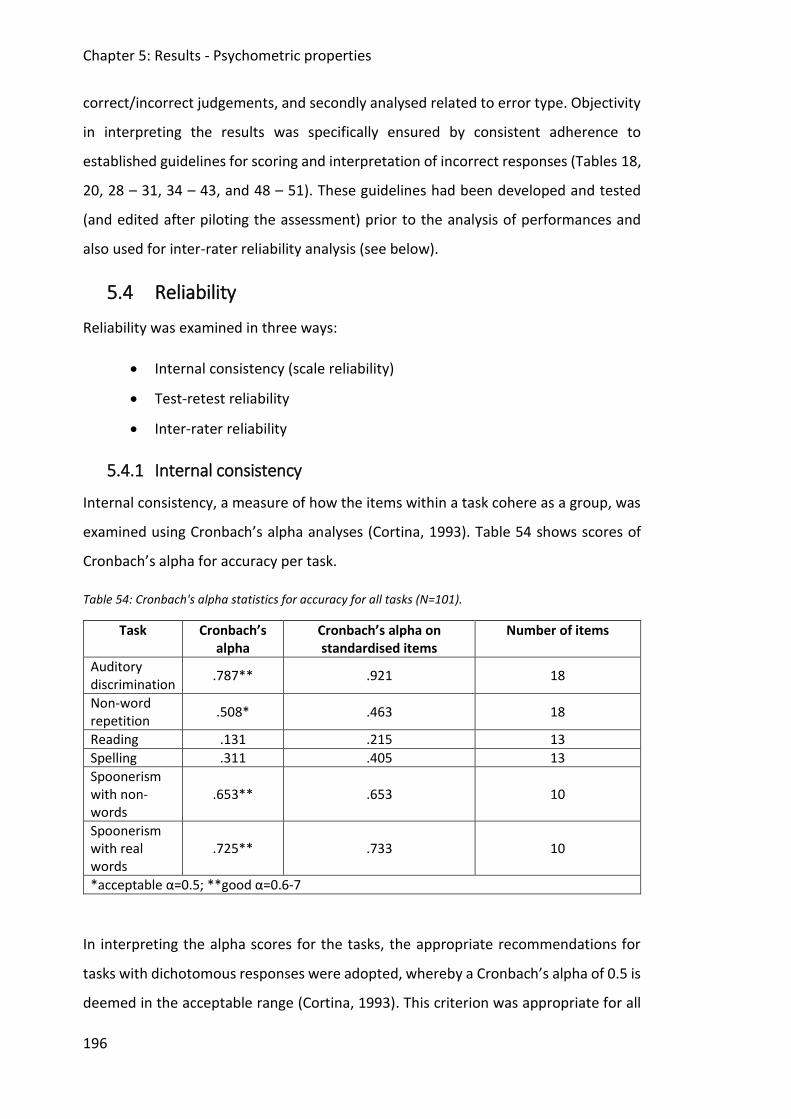
Chapter 5: Results - Psychometric properties
196
correct/incorrect judgements, and secondly analysed related to error type. Objectivity
in interpreting the results was specifically ensured by consistent adherence to
established guidelines for scoring and interpretation of incorrect responses (Tables 18,
20, 28 – 31, 34 – 43, and 48 – 51). These guidelines had been developed and tested
(and edited after piloting the assessment) prior to the analysis of performances and
also used for inter-rater reliability analysis (see below).
5.4 Reliability
Reliability was examined in three ways:
• Internal consistency (scale reliability)
• Test-retest reliability
• Inter-rater reliability
5.4.1 Internal consistency
Internal consistency, a measure of how the items within a task cohere as a group, was
examined using Cronbach’s alpha analyses (Cortina, 1993). Table 54 shows scores of
Cronbach’s alpha for accuracy per task.
Table 54: Cronbach's alpha statistics for accuracy for all tasks (N=101).
Task Cronbach’s alpha
Cronbach’s alpha on standardised items
Number of items
Auditory discrimination
.787** .921 18
Non-word repetition
.508* .463 18
Reading .131 .215 13
Spelling .311 .405 13
Spoonerism with non-words
.653** .653 10
Spoonerism with real words
.725** .733 10
*acceptable α=0.5; **good α=0.6-7
In interpreting the alpha scores for the tasks, the appropriate recommendations for
tasks with dichotomous responses were adopted, whereby a Cronbach’s alpha of 0.5 is
deemed in the acceptable range (Cortina, 1993). This criterion was appropriate for all
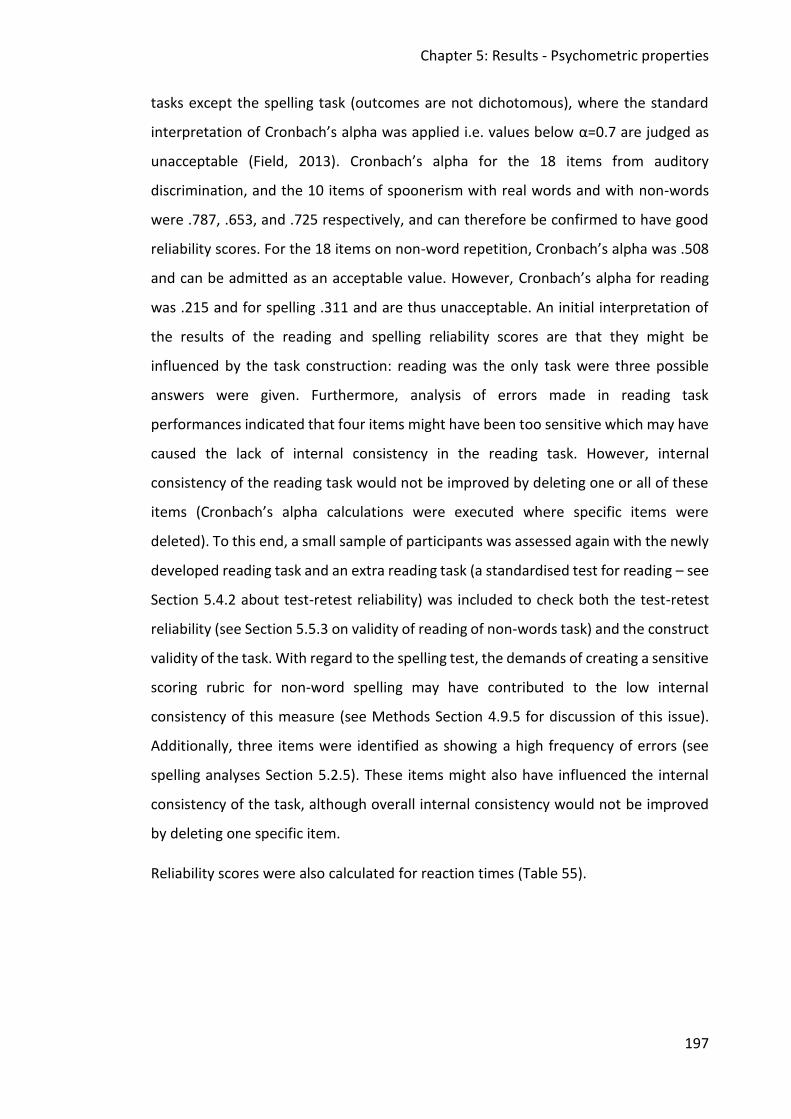
Chapter 5: Results - Psychometric properties
197
tasks except the spelling task (outcomes are not dichotomous), where the standard
interpretation of Cronbach’s alpha was applied i.e. values below α=0.7 are judged as
unacceptable (Field, 2013). Cronbach’s alpha for the 18 items from auditory
discrimination, and the 10 items of spoonerism with real words and with non-words
were .787, .653, and .725 respectively, and can therefore be confirmed to have good
reliability scores. For the 18 items on non-word repetition, Cronbach’s alpha was .508
and can be admitted as an acceptable value. However, Cronbach’s alpha for reading
was .215 and for spelling .311 and are thus unacceptable. An initial interpretation of
the results of the reading and spelling reliability scores are that they might be
influenced by the task construction: reading was the only task were three possible
answers were given. Furthermore, analysis of errors made in reading task
performances indicated that four items might have been too sensitive which may have
caused the lack of internal consistency in the reading task. However, internal
consistency of the reading task would not be improved by deleting one or all of these
items (Cronbach’s alpha calculations were executed where specific items were
deleted). To this end, a small sample of participants was assessed again with the newly
developed reading task and an extra reading task (a standardised test for reading – see
Section 5.4.2 about test-retest reliability) was included to check both the test-retest
reliability (see Section 5.5.3 on validity of reading of non-words task) and the construct
validity of the task. With regard to the spelling test, the demands of creating a sensitive
scoring rubric for non-word spelling may have contributed to the low internal
consistency of this measure (see Methods Section 4.9.5 for discussion of this issue).
Additionally, three items were identified as showing a high frequency of errors (see
spelling analyses Section 5.2.5). These items might also have influenced the internal
consistency of the task, although overall internal consistency would not be improved
by deleting one specific item.
Reliability scores were also calculated for reaction times (Table 55).
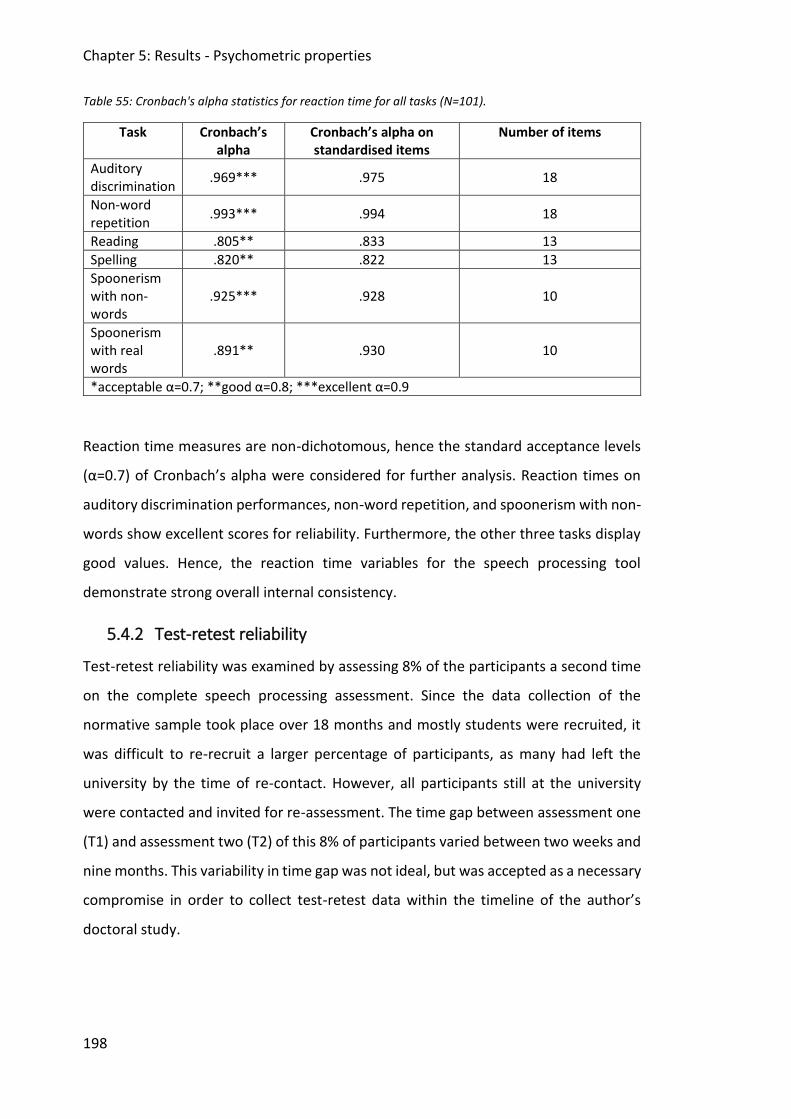
Chapter 5: Results - Psychometric properties
198
Table 55: Cronbach's alpha statistics for reaction time for all tasks (N=101).
Task Cronbach’s alpha
Cronbach’s alpha on standardised items
Number of items
Auditory discrimination
.969*** .975 18
Non-word repetition
.993*** .994 18
Reading .805** .833 13
Spelling .820** .822 13
Spoonerism with non-words
.925*** .928 10
Spoonerism with real words
.891** .930 10
*acceptable α=0.7; **good α=0.8; ***excellent α=0.9
Reaction time measures are non-dichotomous, hence the standard acceptance levels
(α=0.7) of Cronbach’s alpha were considered for further analysis. Reaction times on
auditory discrimination performances, non-word repetition, and spoonerism with non-
words show excellent scores for reliability. Furthermore, the other three tasks display
good values. Hence, the reaction time variables for the speech processing tool
demonstrate strong overall internal consistency.
5.4.2 Test-retest reliability
Test-retest reliability was examined by assessing 8% of the participants a second time
on the complete speech processing assessment. Since the data collection of the
normative sample took place over 18 months and mostly students were recruited, it
was difficult to re-recruit a larger percentage of participants, as many had left the
university by the time of re-contact. However, all participants still at the university
were contacted and invited for re-assessment. The time gap between assessment one
(T1) and assessment two (T2) of this 8% of participants varied between two weeks and
nine months. This variability in time gap was not ideal, but was accepted as a necessary
compromise in order to collect test-retest data within the timeline of the author’s
doctoral study.
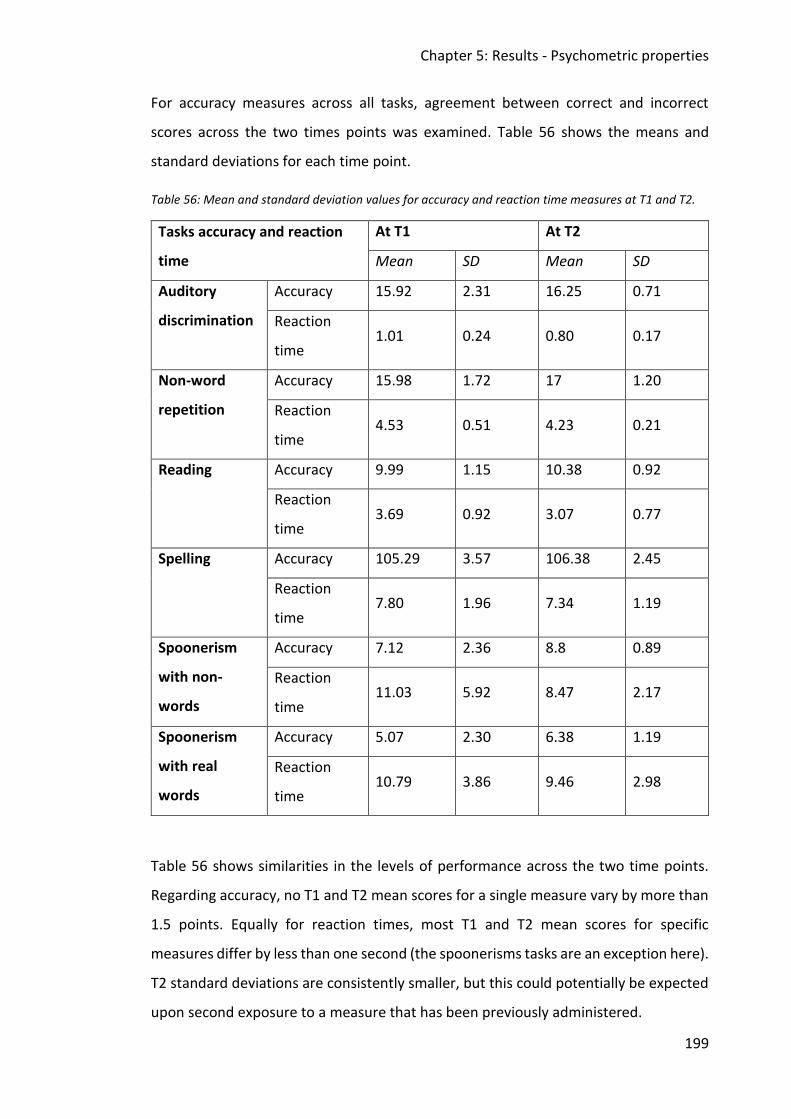
Chapter 5: Results - Psychometric properties
199
For accuracy measures across all tasks, agreement between correct and incorrect
scores across the two times points was examined. Table 56 shows the means and
standard deviations for each time point.
Table 56: Mean and standard deviation values for accuracy and reaction time measures at T1 and T2.
Tasks accuracy and reaction
time
At T1 At T2
Mean SD Mean SD
Auditory
discrimination
Accuracy 15.92 2.31 16.25 0.71
Reaction
time 1.01 0.24 0.80 0.17
Non-word
repetition
Accuracy 15.98 1.72 17 1.20
Reaction
time 4.53 0.51 4.23 0.21
Reading Accuracy 9.99 1.15 10.38 0.92
Reaction
time 3.69 0.92 3.07 0.77
Spelling Accuracy 105.29 3.57 106.38 2.45
Reaction
time 7.80 1.96 7.34 1.19
Spoonerism
with non-
words
Accuracy 7.12 2.36 8.8 0.89
Reaction
time 11.03 5.92 8.47 2.17
Spoonerism
with real
words
Accuracy 5.07 2.30 6.38 1.19
Reaction
time 10.79 3.86 9.46 2.98
Table 56 shows similarities in the levels of performance across the two time points.
Regarding accuracy, no T1 and T2 mean scores for a single measure vary by more than
1.5 points. Equally for reaction times, most T1 and T2 mean scores for specific
measures differ by less than one second (the spoonerisms tasks are an exception here).
T2 standard deviations are consistently smaller, but this could potentially be expected
upon second exposure to a measure that has been previously administered.
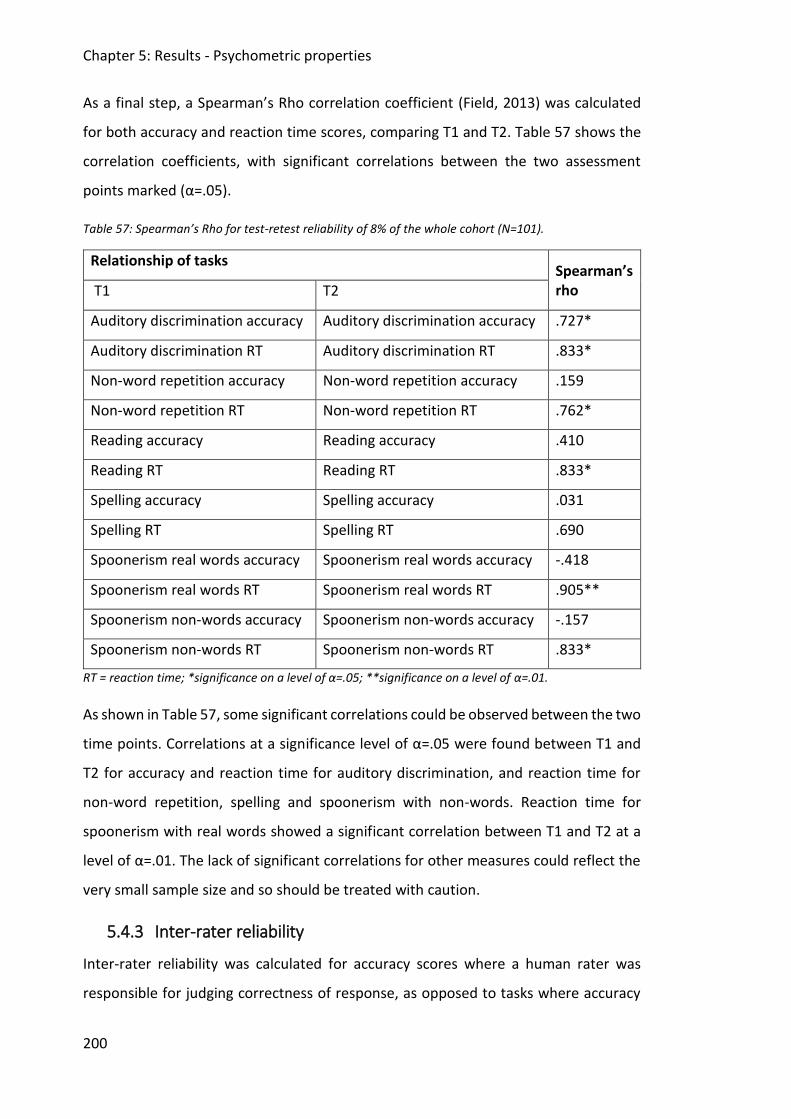
Chapter 5: Results - Psychometric properties
200
As a final step, a Spearman’s Rho correlation coefficient (Field, 2013) was calculated
for both accuracy and reaction time scores, comparing T1 and T2. Table 57 shows the
correlation coefficients, with significant correlations between the two assessment
points marked (α=.05).
Table 57: Spearman’s Rho for test-retest reliability of 8% of the whole cohort (N=101).
Relationship of tasks Spearman’s rho T1 T2
Auditory discrimination accuracy Auditory discrimination accuracy .727*
Auditory discrimination RT Auditory discrimination RT .833*
Non-word repetition accuracy Non-word repetition accuracy .159
Non-word repetition RT Non-word repetition RT .762*
Reading accuracy Reading accuracy .410
Reading RT Reading RT .833*
Spelling accuracy Spelling accuracy .031
Spelling RT Spelling RT .690
Spoonerism real words accuracy Spoonerism real words accuracy -.418
Spoonerism real words RT Spoonerism real words RT .905**
Spoonerism non-words accuracy Spoonerism non-words accuracy -.157
Spoonerism non-words RT Spoonerism non-words RT .833*
RT = reaction time; *significance on a level of α=.05; **significance on a level of α=.01.
As shown in Table 57, some significant correlations could be observed between the two
time points. Correlations at a significance level of α=.05 were found between T1 and
T2 for accuracy and reaction time for auditory discrimination, and reaction time for
non-word repetition, spelling and spoonerism with non-words. Reaction time for
spoonerism with real words showed a significant correlation between T1 and T2 at a
level of α=.01. The lack of significant correlations for other measures could reflect the
very small sample size and so should be treated with caution.
5.4.3 Inter-rater reliability
Inter-rater reliability was calculated for accuracy scores where a human rater was
responsible for judging correctness of response, as opposed to tasks where accuracy
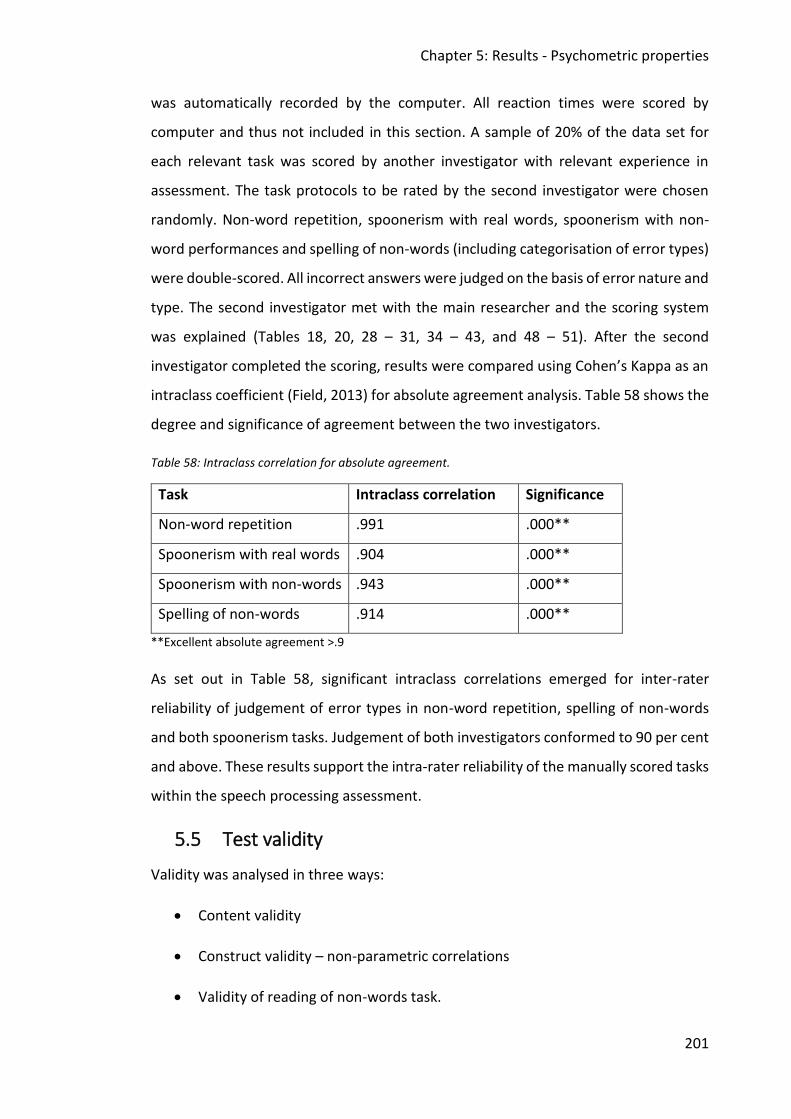
Chapter 5: Results - Psychometric properties
201
was automatically recorded by the computer. All reaction times were scored by
computer and thus not included in this section. A sample of 20% of the data set for
each relevant task was scored by another investigator with relevant experience in
assessment. The task protocols to be rated by the second investigator were chosen
randomly. Non-word repetition, spoonerism with real words, spoonerism with non-
word performances and spelling of non-words (including categorisation of error types)
were double-scored. All incorrect answers were judged on the basis of error nature and
type. The second investigator met with the main researcher and the scoring system
was explained (Tables 18, 20, 28 – 31, 34 – 43, and 48 – 51). After the second
investigator completed the scoring, results were compared using Cohen’s Kappa as an
intraclass coefficient (Field, 2013) for absolute agreement analysis. Table 58 shows the
degree and significance of agreement between the two investigators.
Table 58: Intraclass correlation for absolute agreement.
Task Intraclass correlation Significance
Non-word repetition .991 .000**
Spoonerism with real words .904 .000**
Spoonerism with non-words .943 .000**
Spelling of non-words .914 .000**
**Excellent absolute agreement >.9
As set out in Table 58, significant intraclass correlations emerged for inter-rater
reliability of judgement of error types in non-word repetition, spelling of non-words
and both spoonerism tasks. Judgement of both investigators conformed to 90 per cent
and above. These results support the intra-rater reliability of the manually scored tasks
within the speech processing assessment.
5.5 Test validity
Validity was analysed in three ways:
• Content validity
• Construct validity – non-parametric correlations
• Validity of reading of non-words task.
Chapter 5: Results - Psychometric properties
202
Within the scope of the project it was not possible to include every possible measure
of validity at this stage, but in the future this could be done by testing other types of
validity. Furthermore, criterion and concurrent validity could not be addressed directly
beforehand, as no comparable measures were present.
5.5.1 Content validity
Generally, content validity is most directly addressed during the process of task design,
and this process is described in detail elsewhere in this thesis (Chapter 4, Section 4.2-
4.5). Indeed, content validity, also referred to as logical validity, ensures that an
assessment covers all aspects of a given construct (Field, 2013). Thus, in the context of
this doctoral study it relates to the justification for the choice, design and use of the
tasks based on theoretical concepts related to speech processing. In order to address
content validity, task design was based on the previously described psycholinguistic
models. Furthermore, current validated test tools were evaluated related to task
construction and item choice. Content validity was ensured by a transparent and
structured process for creating and compiling test items, based on existing
independent research and the pilot results.
5.5.2 Construct validity
Construct validity explores whether a test measures what it purports to test (Field,
2013). In the context of this study, it means that task and item design is consistent with
the principles of task and item design with demonstrated validity in other independent
research. Construct validity was therefore addressed by exploring different linguistic
criteria for item design that were considered in previous studies (Packman, 2001;
Gathercole et al., 1994; Howell & Au-Yeung, 2002). Hence, as the construct of the test
tool is based on existing task materials from other current research, it was hoped that
the new tool would measure what it claims to measure. One way of investigating this
statistically was to look at the correlations between performances on different subtests
within the measure. Because all the subtests were designed to tap into speech
processing to some degree, it was predicted that if the test had good construct validity,
a high number of significant correlations would be seen between subtests. It was also
predicted that correlations might be stronger among subtests that shared more
similarities in the speech processing domains they assessed, for example, subtests that
Chapter 5: Results - Psychometric properties
203
shared speech output demands, or tasks that required linkage between speech and
orthographic processing (the reading and spelling tasks).
The relationship between tasks within the speech processing assessment was tested
using non-parametric correlations. The non-parametric procedure was chosen because
accuracy data were not normally distributed. Results of the correlational analysis are
shown in Table 59.
Looking at the correlations (Spearman’s Rho), a large number of significant correlations
were found: 34 out of 55 correlations were statistically significant, of which one was
strong, 21 moderate and 12 were weak correlations, with Spearman’s Rho values
ranging from .2 to .5 (see Table 59).
Taking correlations between accuracy of tasks into consideration, auditory
discrimination accuracy related moderately to non-word repetition and weakly to
spoonerism with non-word accuracy. Non-word repetition correlated moderately with
spelling accuracy and both spoonerism tasks. Spelling also correlated with both
spoonerism tasks. Additionally, the two spoonerism tasks correlated moderately with
respect to accuracy.
Regarding reaction time data, further correlations were observed. Reaction time for
auditory discrimination correlated weakly with reaction time measures for both
spoonerism tasks, but moderately with reaction time measures on all other tasks. In
contrast, non-word repetition reaction times related strongly to spelling reaction
times, while correlating moderately with spoonerism (real words) reaction times. The
correlations between reaction times for spoonerism non-word and reading outcomes
were weak. Furthermore, reading reaction times correlated moderately with those for
the spelling task. Reaction times for the spelling task correlated moderately with all
other reaction time measures, except for both spoonerism tasks which were only
weakly correlated with spelling. The two spoonerism tasks’ reaction times correlated
moderately with each other and with reading reaction times.
Looking across accuracy and reaction time, moderate correlations could be observed
between these measures for both spoonerism tasks (real words and non-words).
Furthermore, reaction time measures for the spoonerism with real words task related

Chapter 5: Results - Psychometric properties
204
moderately to accuracy of non-word repetition performance, whereas reaction time
from the spoonerism with non-words task correlated only weakly with non-word
repetition performances. Additionally, reaction times for both spoonerism tasks
correlated weakly with spelling accuracy. Finally, reading reaction time measures
correlated moderately with accuracy for the non-word repetition, spoonerism with
non-words and auditory discrimination tasks, but only weakly with accuracy for
spoonerism with real words.
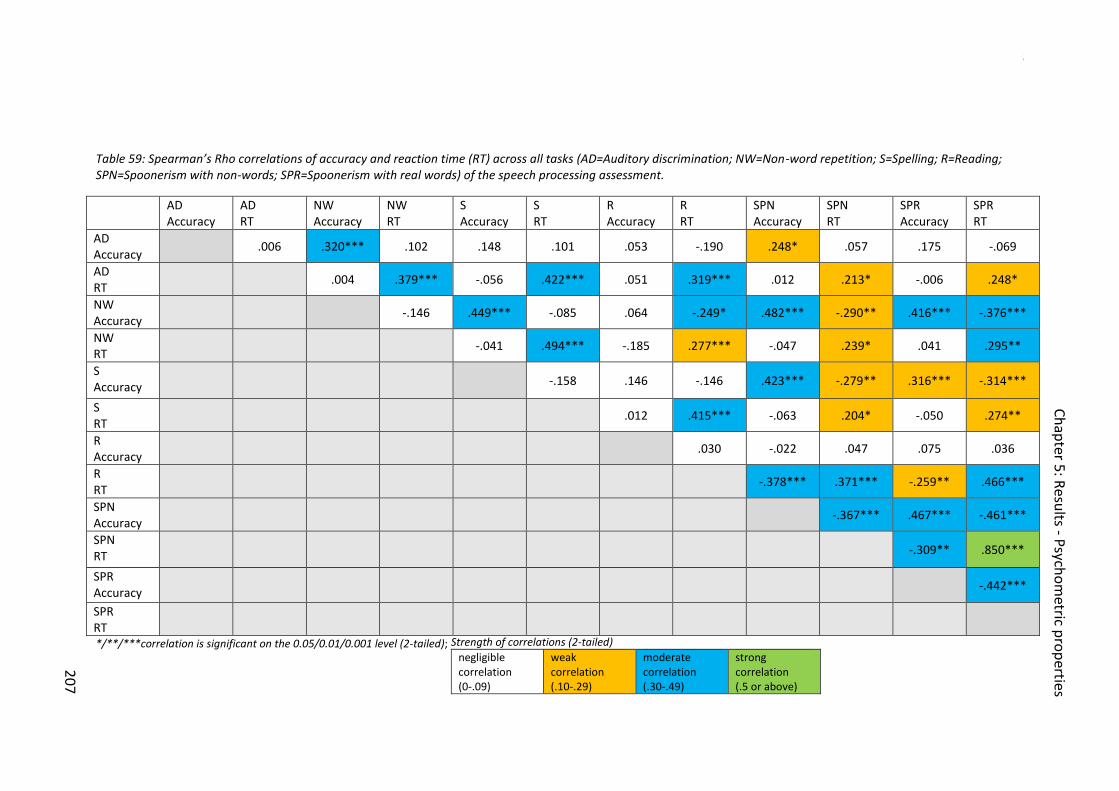
Chapter 5: Results - Psychometric properties
205
Strength of correlations (2-tailed)
negligible correlation (0-.09)
weak correlation (.10-.29)
moderate correlation (.30-.49)
strong correlation (.5 or above)
Table 59: Spearman’s Rho correlations of accuracy and reaction time (RT) across all tasks (AD=Auditory discrimination; NW=Non-word repetition; S=Spelling; R=Reading; SPN=Spoonerism with non-words; SPR=Spoonerism with real words) of the speech processing assessment.
AD Accuracy
AD RT
NW Accuracy
NW RT
S Accuracy
S RT
R Accuracy
R RT
SPN Accuracy
SPN RT
SPR Accuracy
SPR RT
AD Accuracy
.006 .320*** .102 .148 .101 .053 -.190 .248* .057 .175 -.069
AD RT
.004 .379*** -.056 .422*** .051 .319*** .012 .213* -.006 .248*
NW Accuracy
-.146 .449*** -.085 .064 -.249* .482*** -.290** .416*** -.376***
NW RT
-.041 .494*** -.185 .277*** -.047 .239* .041 .295**
S Accuracy -.158 .146 -.146 .423*** -.279** .316*** -.314***
S RT
.012 .415*** -.063 .204* -.050 .274**
R Accuracy
.030 -.022 .047 .075 .036
R RT
-.378*** .371*** -.259** .466***
SPN Accuracy
-.367*** .467*** -.461***
SPN RT -.309** .850***
SPR Accuracy
-.442***
SPR RT
*/**/***correlation is significant on the 0.05/0.01/0.001 level (2-tailed);
Ch
apter 5: R
esults - P
sycho
metric p
rop
erties
20
7
Chapter 5: Results - Psychometric properties
206
The pattern of correlations overall supports assumptions made about the relationship
between input and output tasks. All input tasks correlated moderately with their
output counterparts (see Figure 13 in Chapter 4.4) related to accuracy and reaction
time measures (auditory discrimination of non-words with non-word repetition) except
for reading and spelling. Furthermore, correlations were found between input and
output tasks which are not demanding the same level of cognitive complexity:
spoonerism with non-words accuracy compared to auditory discrimination accuracy
and spelling of non-words accuracy. Reaction time measures showed more sensitive
results, in the sense of frequency and nature of correlations, than accuracy outcomes,
and can therefore be confirmed as an important variable when assessing adults.
Surprisingly, reading reaction time outcomes relate to other reaction times, but also to
accuracy of performance for other tasks, such as non-word repetition and both
spoonerism tasks, even though the internal consistency of the task was low.
Altogether, a high number of significant correlations were found between tasks of
similar or different complex cognitive demands within the psycholinguistic models,
supporting the validity of the internal structure of the assessment tool and the
assumed links between subtests. This is especially supported by the moderately and
highly significant correlations found between the input and output versions of each
subtest. The range of other significant correlations remains mainly weak to moderate
(rs(101)=.2-.5). Nevertheless, these outcomes suggest that general construct validity of
the created sub-tests can be judged as reasonable.
5.5.3 Validity of reading of non-word task
As mentioned above, an additional test was administered with the participants of the
test-retest study related to the reading task. Participants were asked to perform the
‘Test of Word Reading Efficiency (TOWRE)’ (Torgesen, Wagner, & Rashotte, 1999). This
assessment was used to compare performances of the reading of non-words task to a
well-established measure of reading efficiency. Given the low internal consistency and
test-retest reliability of the reading measure devised for this speech processing
assessment tool, it was decided that cross-checking the task’s construct validity might
be informative. The TOWRE has two subtests, single word reading and single non-word
reading. Participants are presented with a list of written words/non-words respectively
Chapter 5: Results - Psychometric properties
207
and are asked to read aloud as many items as they can within a 45-second window of
time. The test yields an efficiency score, representing the number of words/non-words
read in 45 seconds. Because many of the skilled adult readers in this sample were able
to complete the list in under 45 seconds, it was necessary to derive an alternative
efficiency measure in which the speed per words was calculated. This value was a
function of both number of items read correctly, as well as total time taken. Across the
eight participants the average for real words was 103.5 words (standard deviation =
15.32) per 43.75 seconds (standard deviation = 2.43) and the mean average for non-
words was 62.5 words (standard deviation = 7.63) in 44.63 seconds (standard deviation
= 2.00). All raw values, number of items and speed, were transformed into standard
scores presented by the TOWRE manual (if participants were quicker than 45 seconds
the highest available standard score was given). Given the small sample size,
Spearman’s Rho non-parametric correlations were used to compare performance
between the non-word reading measure developed in this study (at T1 and T2), and
participants’ TOWRE standard scores. Table 60 illustrates these correlations.
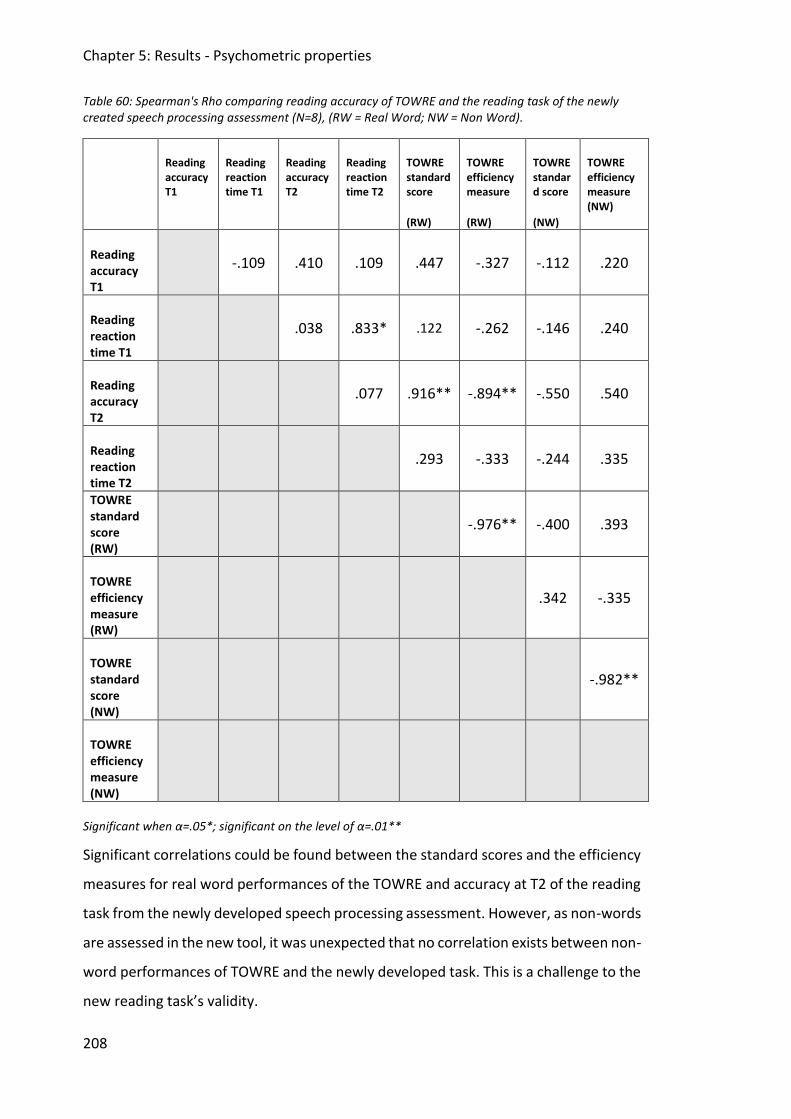
Chapter 5: Results - Psychometric properties
208
Table 60: Spearman's Rho comparing reading accuracy of TOWRE and the reading task of the newly created speech processing assessment (N=8), (RW = Real Word; NW = Non Word).
Reading accuracy T1
Reading reaction time T1
Reading accuracy T2
Reading reaction time T2
TOWRE standard score
(RW)
TOWRE efficiency measure
(RW)
TOWRE standard score
(NW)
TOWRE efficiency measure (NW)
Reading accuracy T1
-.109 .410 .109 .447 -.327 -.112 .220
Reading reaction time T1
.038 .833* .122 -.262 -.146 .240
Reading accuracy T2
.077 .916** -.894** -.550 .540
Reading reaction time T2
.293 -.333 -.244 .335
TOWRE standard score (RW)
-.976** -.400 .393
TOWRE efficiency measure (RW)
.342 -.335
TOWRE standard score (NW)
-.982**
TOWRE efficiency measure (NW)
Significant when α=.05*; significant on the level of α=.01**
Significant correlations could be found between the standard scores and the efficiency
measures for real word performances of the TOWRE and accuracy at T2 of the reading
task from the newly developed speech processing assessment. However, as non-words
are assessed in the new tool, it was unexpected that no correlation exists between non-
word performances of TOWRE and the newly developed task. This is a challenge to the
new reading task’s validity.
Chapter 5: Results - Psychometric properties
209
5.6 Discussion
The following discussion will be structured by answering the research questions
presented at the beginning of this chapter.
➢ Question 1. What basic psychometric properties are required for a
comprehensive assessment tool?
➢ Question 1a. What are the basic psychometric properties of the speech
processing assessment tool?
➢ Question 1b. Can objectivity, reliability, and validity of the new developed
speech processing assessment be confirmed?
Overall, the aim was to develop a comprehensive speech processing assessment for
adults. Preliminary results suggest some support for the objectivity, reliability, and
validity of the speech processing assessment. Furthermore, basic psychometric
properties illustrate the spread of data and confirm the sensitivity of the assessment
for testing adults. Basic psychometric properties considered included descriptive
statistics, as well as objectivity, reliability and validity analyses. Taking descriptive
measures into account, variability could be observed in accuracy and reaction time
performances across all tasks. No clear ceiling or floor effects were discovered which
suggests that the tasks are sensitive on a broad level. Altogether, reaction time
measures were more normally distributed than accuracy outcomes, which supports the
use of reaction times as a variable when assessing adults in speech processing.
Nevertheless, when looking at individual task performance, via minimum and
maximum values, there were some surprisingly low performances, for example, 0
correct answers for both spoonerism tasks (accuracy), gained by the same person (P1).
Errors made by P1 are 50 per cent non-realisations and mainly spoonerisms performed
in wrong order for the spoonerism with real words task. For the non-word spoonerism
task P1 also showed three non-realisations but all other spoonerisms were marked by
wrong realisations which are characterised by more than two errors, such as usage of
an incorrect consonant or consonant cluster. A possible interpretation of P1’s results
could be that he did not understand the task, however, practice items of both tasks
were executed correctly. This, though, might be due to the fact that the practice items
Chapter 5: Results - Psychometric properties
210
were explained prior to the activity trial. Furthermore, five other participants could be
identified as showing somewhat notable performances related either to accuracy or
reaction time. Though, all minimum or maximum scores across modality were reached
from different participants. However, one more participant (P2) showed low accuracy
scores for both tasks (2 correct answers) with mainly non-realisations as error types
(i.e. the participant did not even try to perform the spoonerisms). The other individuals
(P3 and P4) showed low scores in spoonerism with real words (error types non-
realisation and spoonerism in wrong order), but average and above average
performances in spoonerism with non-words. Practice items were performed
accurately across all participants. One possible explanation for this is that the
participants (students from the university) took part with an extrinstic motivation of
collecting study points for their individual study programme. Indeed, some students
received credits for taking the time to take part. It might be that those participants did
not perform to the limit of their full skills and ‘clicked through’ some parts of the test,
rather than putting a real effort. This fact was not considered prior to data collection
and therefore not expected. However, observations of the investigator support the
idea that some results might be biased by extrinsic motivation. Another possible
explanation for these participants is that maybe some underlying difficulties exists
which have not been captured in the scope of this study’s inclusion and exclusion
criteria. Although the investigator asked for any history of difficulties of any kinds,
some participants might still have had a history of difficulties which they did not
disclose at the time of the assessment. In future research these possible bias factors
should be taken into consideration by introducing clearer exclusion criteria and
controlling for participants motivation using, for example, end-user feedback.
5.6.1 Objectivity
➢ Question 2. Can a newly developed assessment tool, based on researched
theories, be conducted using an objective and accurate procedure for
execution, scoring and analysing?
Results relating to objectivity of the speech processing assessment indicate good
objectivity across the speech processing assessment. Firstly, the development of the
assessment was based on theoretical models which have been successfully used in
Chapter 5: Results - Psychometric properties
211
previous research (De Bleser et al., 1997; Patterson & Shewell, 1987; Stackhouse &
Wells, 1997). Secondly, the procedure for execution of the tool was made more
objective by using a computer-based programme (PsychoPy; (Peirce, 2007)) which
ensured identical input for every participant, including instructions and task
presentations. Thirdly, the scoring of performances was partly done by the programme
automatically; objectivity can be confirmed in this respect. Nevertheless, for qualitative
error analyses a scoring system was developed prior to the assessment. This scoring
system was comprehensive and transparent and could be used reliably by different
investigators (as seen in inter-rater reliability results). Finally, item design was based
on material in previous research projects and controlled for legality of English non-
words using an objective non-word generator (Keuleers & Brysbaert, 2010). This tool
enabled the investigator to control the properties of non-words generated, so that they
matched counterpart real words on all requisite criteria.
5.6.2 Reliability
➢ Question 3a. What is the internal consistency of the speech processing
assessment?
➢ Question 3b. What is the test-retest reliability of the speech processing
assessment?
➢ Question 3c. What is the inter-rater reliability of the speech processing
assessment?
Generally, reliability analyses showed variable results. Internal consistency, test-retest
reliability and inter-rater reliability were included in the analyses.
Internal consistency
There is overall a good degree of internal consistency across the tool. Accuracy
outcomes showed acceptable to good internal consistency on a dichotomous scale
(Cortina, 1993) for the auditory discrimination of non-words task, both spoonerism
with real and non-words tasks and the non-word repetition task. In contrast, the
literacy measures, namely the reading and spelling of non-words tasks, did not indicate
internal consistency. Further analyses showed that in both tasks some items (reading
Chapter 5: Results - Psychometric properties
212
4 items and spelling 3 items) were highly prone to error. These items might have
influenced the overall internal consistency of the tasks and therefore should be
revisited and checked for item characteristics. McDonald (2013) and Schmitt (1996)
suggest that Cronbach’s alpha measures are highly influenced by assumptions in
classical testing theory and therefore item redundancy might be an important factor
for attaining significant results. Although items for the speech processing assessment
were designed following an objective procedure, they also purposely differed in
specific characteristics (such as consonant versus clusters with different place, manner,
and voice). Hence, the detected items of the spelling and reading tasks which showed
high error frequency, might have been more divergent from the whole item set than
all remaining items.
Indeed, the reading task was the only task modified after piloting the speech processing
assessment. Instead of the initial response choice of two items (one target and one
distractor), the revised version included three response choices (one target and two
distractors) in order to try and increase the difficulty level of the task. In the revised
version four items were incorrectly judged by at least a quarter of the normative group.
Interestingly, the high error rate of these items indicated always only one specific
distractor item which was chosen. Hence, the items /fəʊm/ = <fome> where
participants chose <vome> with 17.26 per cent, /flɒks/ = <flox> they chose <vlox>, and
/‘sturən̩d/ = <sturand> was replaced with <sturamd> with each 15.48 per cent, and
/pri’tɒtbə,hʊd/ = <pretotbuhood> became <pretotpuhood> with 27.98 per cent
incorrect answer choices. One of the possible explanations for these errors is auditory-
perceptual confusion, given that the distractors chosen were all close phonological
distractors (3 voicing substitutions, 1 place of articulation substitution), and the non-
words were presented auditorally, for participants to match to a written orthographic
form. It would be important to check the auditory clarity of these stimulus recordings,
as well as considering whether voicing distinctions, especially in the context of non-
words, are potentially too difficult to be reliable, even within a normative sample. It
was then further investigated if internal consistency measurements would increase if
one or more of these items were deleted for analysis (Cortina, 1993; Sijtsma, 2009).
Yet, removing one or more of the above items did not change the overall internal
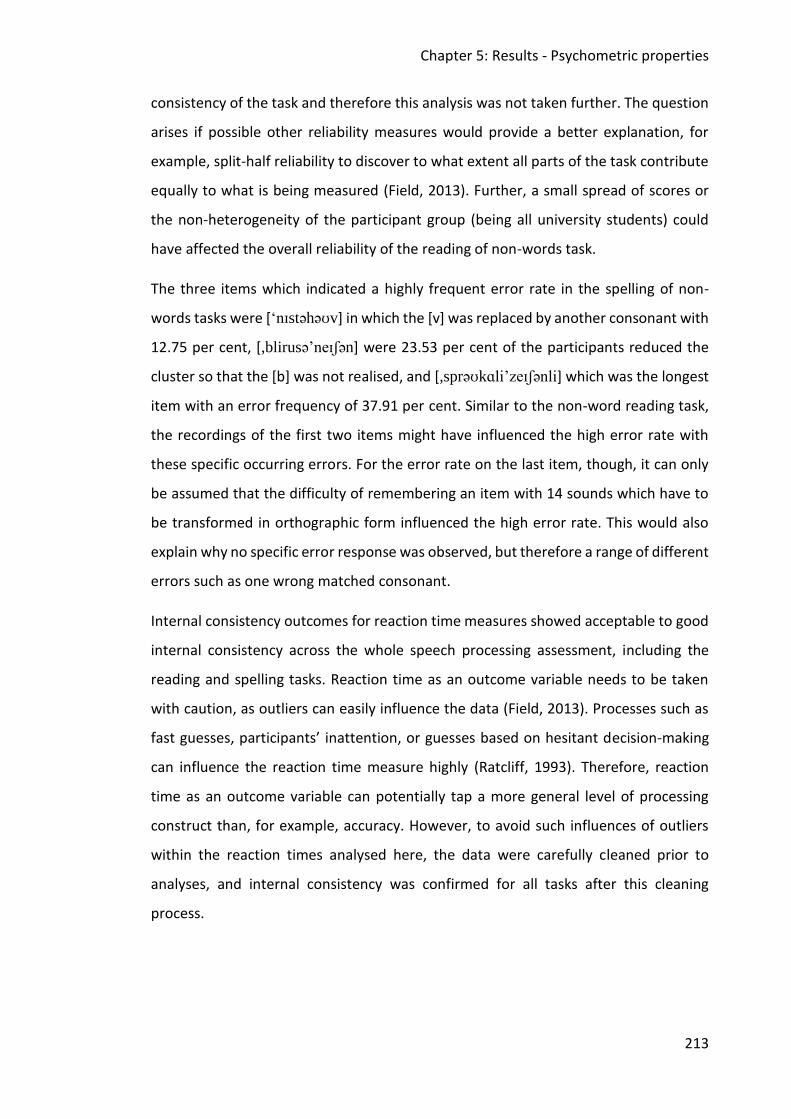
Chapter 5: Results - Psychometric properties
213
consistency of the task and therefore this analysis was not taken further. The question
arises if possible other reliability measures would provide a better explanation, for
example, split-half reliability to discover to what extent all parts of the task contribute
equally to what is being measured (Field, 2013). Further, a small spread of scores or
the non-heterogeneity of the participant group (being all university students) could
have affected the overall reliability of the reading of non-words task.
The three items which indicated a highly frequent error rate in the spelling of non-
words tasks were [‘nɪstəhəʊv] in which the [v] was replaced by another consonant with
12.75 per cent, [,blirusə’neɪʃən] were 23.53 per cent of the participants reduced the
cluster so that the [b] was not realised, and [,sprəʊkɑli’zeɪʃənli] which was the longest
item with an error frequency of 37.91 per cent. Similar to the non-word reading task,
the recordings of the first two items might have influenced the high error rate with
these specific occurring errors. For the error rate on the last item, though, it can only
be assumed that the difficulty of remembering an item with 14 sounds which have to
be transformed in orthographic form influenced the high error rate. This would also
explain why no specific error response was observed, but therefore a range of different
errors such as one wrong matched consonant.
Internal consistency outcomes for reaction time measures showed acceptable to good
internal consistency across the whole speech processing assessment, including the
reading and spelling tasks. Reaction time as an outcome variable needs to be taken
with caution, as outliers can easily influence the data (Field, 2013). Processes such as
fast guesses, participants’ inattention, or guesses based on hesitant decision-making
can influence the reaction time measure highly (Ratcliff, 1993). Therefore, reaction
time as an outcome variable can potentially tap a more general level of processing
construct than, for example, accuracy. However, to avoid such influences of outliers
within the reaction times analysed here, the data were carefully cleaned prior to
analyses, and internal consistency was confirmed for all tasks after this cleaning
process.
Chapter 5: Results - Psychometric properties
214
Test-retest reliability
Test-retest reliability was addressed comparing means and standard deviations and
calculating Spearman’s Rho significance for a sample of 8 per cent of the original
cohort. Generally, test-retest reliability was fair, but hard to analyse within such a small
retest sample. Nonetheless, significant correlations could be found for reaction time
measures of the non-word repetition and auditory discrimination of non-words tasks,
the reading of non-words task and the spoonerism of non-words task. Moreover,
accuracy of the auditory discrimination of non-words task was correlated significantly.
Other accuracy outcomes did not show significant correlations, but comparisons of
mean values indicated similar performances at both assessment settings. These results
might also have been influenced by the amount of time between the assessments
which varied between two weeks and nine months. Research suggests that the time
frame for test-retest reliability should be brief in order to decrease external factors,
such as development of skills, during the period (Cicchetti, 1994; McCrae, Kurtz,
Yamagata, & Terracciano, 2011), although the role of this variable in young adults (as
opposed to children) may be less pronounced. Likewise, the gap between assessments
should not be too brief, to reduce the likelihood that participants are performing on
the basis of memory from the first assessment. Despite these possible limitations, the
results here suggest some significance for test-retest reliability and comparisons of
mean values, very tentatively supporting the test-retest reliability of the speech
processing assessment.
Inter-rater reliability
Inter-rater reliability analyses were used to look at the degree of agreement possible
for the judgement of response correctness and the nature of any errors made. Other
measurements did not need to be co-rated, as they were objectively scored by the
computer programme. For calculating inter-rater reliability, the intraclass coefficient
was used which facilitates a calculation of agreement of raters (Field, 2013). As
research suggests, a sample of 20 per cent of the whole cohort was randomly chosen
and errors were analysed using the scoring system in place for each task. Results
indicate highly significant values for inter-rater reliability and therefore confirms
consensus of different raters when judging performances independently. Additionally,
Chapter 5: Results - Psychometric properties
215
these results confirm the developed scoring system as being transparent and
comprehensive.
5.6.3 Validity
➢ Question 4a. Does the speech processing assessment test what it claims to
test?
➢ Question 4b. Can theory-based assumptions be confirmed?
In order to address validity of the speech processing assessment, content validity and
construct validity were investigated. During this doctoral study, it was not possible to
investigate other types of validity. First results generally suggest that the speech
processing assessment broadly tests what it claims to test. Construct validity measures
were taken into consideration and are discussed below. Furthermore, content validity
was assumed to be secured by the fact that the development of the speech processing
assessment tool was based on theoretical psycholinguistic models that have been
extensively reported upon and used in previous research and assessment development
(De Bleser et al., 1997; Coltheart et al., 2001; Kay et al., 2009; Morton, 1979; Schaefer
et al., 2009; Stackhouse et al., 2007; Stackhouse & Wells, 1997). Moreover, the task
design aimed to cover all aspects of psycholinguistic processing, resulting in a
comprehensive assessment (see methods: explanation of task development, Section
4.2-4.5).
i) Do tasks with similar speech processing demands correlate more
strongly than with other tasks?
ii) What is the relationship between reaction time and performance
accuracy within subtests?
Overall, a high number of significant correlations between tasks of similar or different
complex cognitive demands were discovered, confirming the internal structure of the
assessment and the assumed links between subtests. This can specifically be supported
by the correlation between accuracy of the auditory discrimination of non-words and
the non-word repetition task, as well as the correlation of accuracy between both
spoonerism tasks. Stackhouse et al. (2007) suggested that auditory discrimination and
Chapter 5: Results - Psychometric properties
216
non-word repetition demand the same psycholinguistic skills, but differ in outcome
(input versus output). Regarding the spoonerism task, the correlation was expected
given the similarity of task construction and demands. Moreover, correlations between
accuracy of all output tasks could be found, which again supports the idea that the
demands of skills at a broader level (here, output) affect performance across tasks at
that level. The only task which did not correlate in accuracy with the other tasks was
reading of non-words. It was expected that reading would correlate with spelling
(literacy counterpart) and most likely auditory discrimination, as those two tasks are
input tasks. These assumed correlations could not be confirmed, though correlations
between the reaction times of reading and spelling were strongly significant. Within
the current study, a subsequent step was taken to investigate the reading task’s
construct validity to see how performance on the task correlated with performance on
an already-existing and validated reading test, the ‘TOWRE’ (Torgesen et al., 1999).
Overall, however, the small sample size for this validation study precludes any firm
conclusions.
Taking correlations between reaction time measures into account, reading and spelling
performances related strongly. Moreover, correlations were found between reaction
time measures of all tasks, of which some were strong (e.g. non-word repetition task
and spelling). Again, this might indicate the important value of including a broad
measure, such as reaction time, when assessing normal speaking adults (Ratcliff, 1993).
Further analyses focused on the relationships between reaction time and accuracy.
Every task’s reaction time measures related to another task’s accuracy outcomes. In
particular, reaction time outcomes of the reading of non-word task correlated with
accuracy of non-word repetition, auditory discrimination and both spoonerism tasks.
Hence, one expected correlation of both input tasks (reading and auditory
discrimination) did emerge. Nevertheless, a closer look at the reading task’s validity is
necessary in the future.
5.7 Chapter conclusion
In summary, evidence for good objectivity could be demonstrated. Reliability is
variable: there is a generally good degree of internal consistency across measures, with

Chapter 5: Results - Psychometric properties
217
the exception of the literacy measures; test-retest reliability is fair; inter-rater reliability
is good. In terms of validity, this requires further investigation, but at least regarding
an initial investigation of internal construct and content validity, the results are
supportive.
The following chapter focuses on results of the case studies of participants who
stammer and were assessed with the speech processing assessment tool.
Chapter 6: Results - Case series
218
6. Chapter 6: Results - Case series
Besides the development of a speech processing assessment for adults, this doctoral
study aimed to explore individual speech profiles of six people who stammer. The
comprehensive design of the new assessment should support the speech profiling of
an individual who stammers in order to facilitate more clarity about the possible level
of breakdown. Furthermore, it was hoped that data gathered during interview sessions
would help to disentangle the factors behind the individual stammering behaviours and
characteristics of each participant that might lead to the speech difficulty.
The following research questions were explored:
➢ Question 5. Do people who experience a speech difficulty show different
performances compared to the normative sample group?
➢ Question 6. What are the speech processing profiles of individuals who
stammer?
➢ Question 7. Can specific and individual patterns be observed consistent with
data collected in the interview?
This chapter will focus on the outcomes of the six case studies. Firstly, data for
individual cases will be presented followed by comparisons to the outcomes of the
large scale study (LSS), also referred to as the normative group sample. Every case study
will be explored separately, including descriptive values such as raw scores, followed
by qualitative and quantitative descriptions of error types and/or stammering
behaviours made during assessment. The data presented include interview outcomes
(interview data), performances on the speech processing assessment and analyses of
stammering behaviours that occurred during the assessment session, if applicable,
(assessment data), and a discussion of interview and assessment outcomes of each
participant focusing on answering the above named research questions (discussion).
All results will be presented anonymously. The participants will be referred to as S1 to
S6. Words in “…” apostrophes indicate word choices from participants. Table 61
summarises the key facts about the six participants.
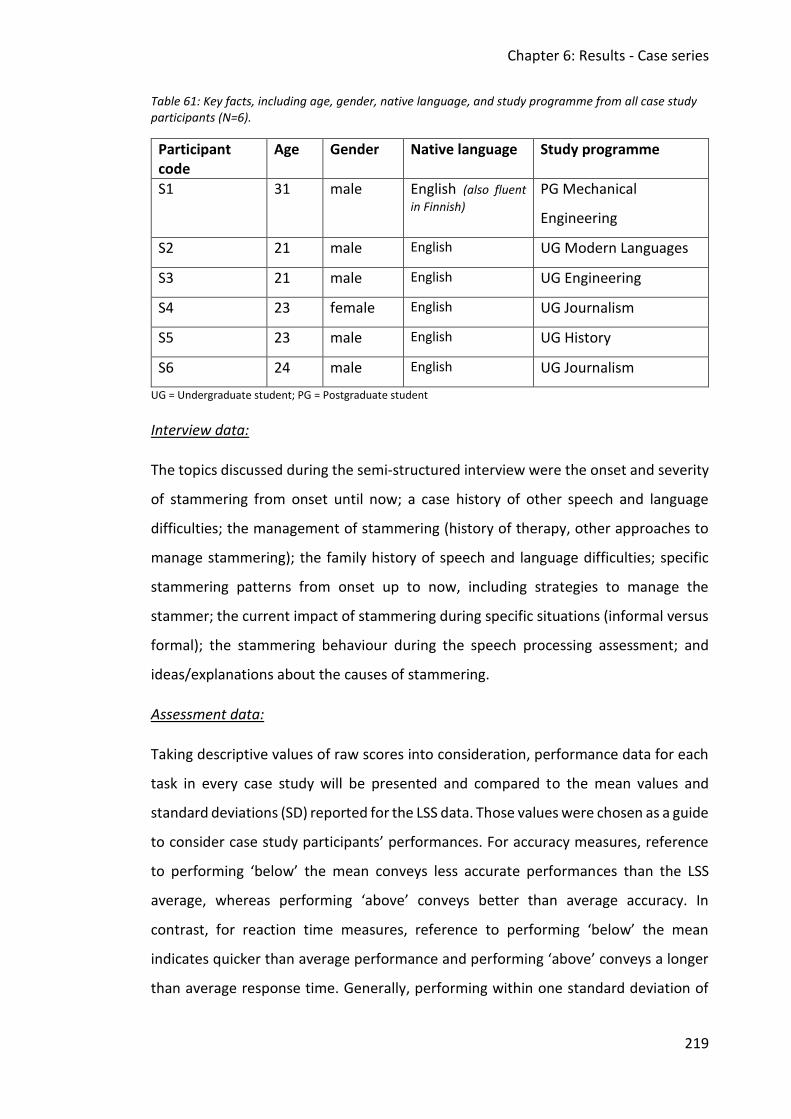
Chapter 6: Results - Case series
219
Table 61: Key facts, including age, gender, native language, and study programme from all case study participants (N=6).
Participant code
Age Gender Native language Study programme
S1 31 male English (also fluent
in Finnish) PG Mechanical
Engineering
S2 21 male English UG Modern Languages
S3 21 male English UG Engineering
S4 23 female English UG Journalism
S5 23 male English UG History
S6 24 male English UG Journalism
UG = Undergraduate student; PG = Postgraduate student
Interview data:
The topics discussed during the semi-structured interview were the onset and severity
of stammering from onset until now; a case history of other speech and language
difficulties; the management of stammering (history of therapy, other approaches to
manage stammering); the family history of speech and language difficulties; specific
stammering patterns from onset up to now, including strategies to manage the
stammer; the current impact of stammering during specific situations (informal versus
formal); the stammering behaviour during the speech processing assessment; and
ideas/explanations about the causes of stammering.
Assessment data:
Taking descriptive values of raw scores into consideration, performance data for each
task in every case study will be presented and compared to the mean values and
standard deviations (SD) reported for the LSS data. Those values were chosen as a guide
to consider case study participants’ performances. For accuracy measures, reference
to performing ‘below’ the mean conveys less accurate performances than the LSS
average, whereas performing ‘above’ conveys better than average accuracy. In
contrast, for reaction time measures, reference to performing ‘below’ the mean
indicates quicker than average performance and performing ‘above’ conveys a longer
than average response time. Generally, performing within one standard deviation of
Chapter 6: Results - Case series
220
the LSS mean indicates a performance within the normal range: performances of +/-
one standard deviation are achieved by the middle 68.2% of the LSS participants.
Performance that is one standard deviation above or below the mean is also
considered as within the normal range but noteworthy in discussions, while
performances falling two standard deviations above or the below the mean are even
more notable.
Next, the analyses of frequency of errors made, and their nature (if applicable), are
displayed per task per participant. The analyses follow the same principles as those
conducted for the LSS data (see Chapter 5.2). For the auditory discrimination of non-
words task, d’ prime was used for the LSS as it is a measure that indicates the sensitivity
of signal detection of a participant related to the presence of the noise – i.e. both the
correct identification of pairs that are different, as well as the correct rejection of pairs
that are the same (Macmillan & Creelman, 2004). Given the small number of trials for
the case study participants, it did not seem appropriate to compare d’prime values,
because no statistical comparison was possible due to small sample sizes. Hence,
d’prime will be stated within the text of this section for the auditory discrimination of
non-words task outcomes for each case study within the text, while the proportions (in
percentages) of correct hits and misses, in comparison to the normative group, will
appear in tables. It is important to note, however, that even the percentages calculated
for the case examples are influenced by the small number of possible correct hits and
misses (nine for both); for example, one incorrect hit would reduce the score of 100%
to 88.89%. In contrast, the percentages calculated for the LSS are far more sensitive
due to the overall high number of trials. For all remaining tasks, reading errors per item,
and the frequencies and nature of errors for all output tasks are reported, along with
the occurrence of stammering behaviours where applicable. The same system which
was applied for error coding in the LSS data was used to analyse the nature of the errors
in the case studies for the non-word repetition, spelling of non-words and both
spoonerisms tasks (see Chapter 5.2). The same analyses will be displayed for every case
study.
Finally, some initial thoughts about what the results mean about the individual’s
processing skills will be integrated with the written explanations of the results. This is
Chapter 6: Results - Case series
221
to promote coherence with and towards the discussion of results at the end of each
case study. These preliminary thoughts will be picked up in more detail in the main
discussion.
Discussion:
At the end of each case summary and set of descriptive data, an individual discussion
of that case study participant is displayed. Amongst others, factors using the qualitative
information about the individual stammering behaviours of each participant gained
from the interview data are discussed. These factors might entail specific sounds or
situations in which the individual anticipates a risk of stammering, or other stammering
behaviours or contexts of concern. They also address specific information given by the
individual about his or her performances and possible stammering influences during
the speech processing assessment, if applicable. The discussion of the results for each
individual participant aims to answer the general research questions stated above.
6.1 Case study 1
6.1.1 Interview data
This participant is a 31-year-old male mechanical engineering student whose first
language is English. Additionally, he is fluent in Finnish.
S1 described his current stammer as a 6/7 on a scale from 0-10, where 0 means not
severe and 10 means highly severe. It was reported that his stammer had changed in
nature over the years. Initially, he started stammering when he was around six or seven
years old and experienced severe stammering behaviours at this time. He was fluent
during secondary school, but his stammering became more severe again when he
started university. He rated his stammer as 9/10 out of 10 when he first started
university. He suggested that his stammering was more severe in university due to the
anxiety that came with university demands/tasks.
S1 never received therapy for his stammer. However, he described that he stammers
less when his communication partner is aware of his stammer: indeed, the stammer is
then not a “problem”. This can be supported by observations made by the investigator.
During the entire interview session, only two small stammering behaviours were
Chapter 6: Results - Case series
222
observed. S1 confirmed that he felt comfortable during the interview because he knew
that the investigator was aware of the stammer.
In addition to his stammer, S1 reported problems with speech and language
development during childhood and adolescence. This included difficulties with vowel
diphthongs when learning Finnish during childhood – a problem which is reportedly
quite rare, so this is a notable difficulty. Nowadays, he has problems with specific
consonants, namely: /l/, /ʃ/, /r/, and some remaining difficulties with diphthongs.
Furthermore, S1 reported that situations in his everyday life are influenced by his
stammer. He is mostly a quiet member in social situations (although he would like to
talk more sometimes). However, the stammer has not had any influence on his
educational choices.
He also described how he uses avoidance strategies, especially changing tenses and
switching words within sentences. Moreover, he uses “filling” phrases to gain time,
such as “I was just thinking…”. He reports that all these strategies are used 10 out of
10 (very frequent use) according to a 0-10 frequency scale where 0 describes never and
10 means all the time. The use of these strategies would also reduce the number of
noticeable stammering behaviours in his speech.
When he was asked how his stammer varies in different life situations (on a scale of 0
(not at all) to 10 (severe)), different situations were described. In formal situations,
such as talking to his supervisor at university, he judged his stammer as 7, whereas this
increases to 10 when he has to give a presentation. In social conversations (group,
individual) he described the severity of the stammer as 7, however, the stammer would
not be obvious due to his usage of avoidance strategies.
Regarding his family history, different facts were discovered. S1 reports that his sister
has had a stammer since childhood, but is dealing “well” with it. His father, though, has
a severe stammer.
Retrospectively, taking the speech processing assessment into consideration, he
thought that he would definitely stammer when performing spoonerisms, but he
surprised himself that he “did not need to stammer at all”. However, in the non-word
repetition task he stammered in multisyllabic words. He further explained that if the
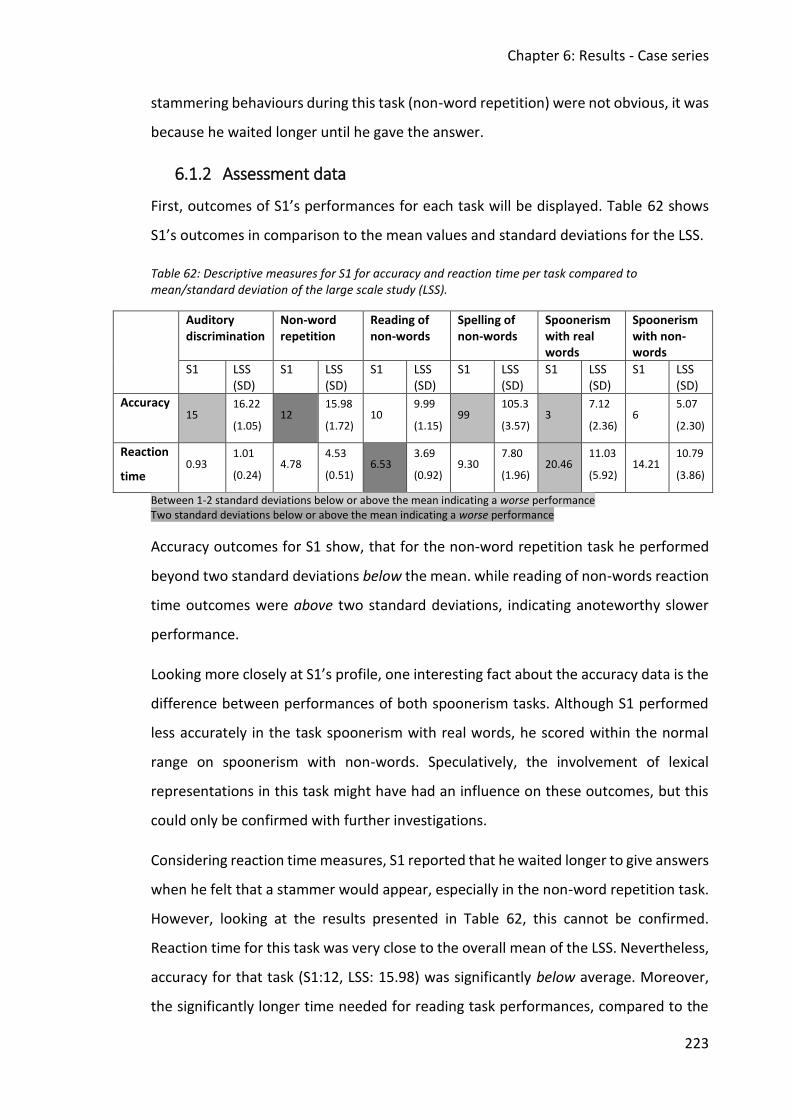
Chapter 6: Results - Case series
223
stammering behaviours during this task (non-word repetition) were not obvious, it was
because he waited longer until he gave the answer.
6.1.2 Assessment data
First, outcomes of S1’s performances for each task will be displayed. Table 62 shows
S1’s outcomes in comparison to the mean values and standard deviations for the LSS.
Table 62: Descriptive measures for S1 for accuracy and reaction time per task compared to mean/standard deviation of the large scale study (LSS).
Auditory discrimination
Non-word repetition
Reading of non-words
Spelling of non-words
Spoonerism with real words
Spoonerism with non-words
S1 LSS (SD)
S1 LSS (SD)
S1 LSS (SD)
S1 LSS (SD)
S1 LSS (SD)
S1 LSS (SD)
Accuracy
15
16.22
(1.05) 12
15.98
(1.72) 10
9.99
(1.15) 99
105.3
(3.57) 3
7.12
(2.36) 6
5.07
(2.30)
Reaction
time 0.93
1.01
(0.24) 4.78
4.53
(0.51) 6.53
3.69
(0.92) 9.30
7.80
(1.96) 20.46
11.03
(5.92) 14.21
10.79
(3.86)
Between 1-2 standard deviations below or above the mean indicating a worse performance Two standard deviations below or above the mean indicating a worse performance
Accuracy outcomes for S1 show, that for the non-word repetition task he performed
beyond two standard deviations below the mean. while reading of non-words reaction
time outcomes were above two standard deviations, indicating anoteworthy slower
performance.
Looking more closely at S1’s profile, one interesting fact about the accuracy data is the
difference between performances of both spoonerism tasks. Although S1 performed
less accurately in the task spoonerism with real words, he scored within the normal
range on spoonerism with non-words. Speculatively, the involvement of lexical
representations in this task might have had an influence on these outcomes, but this
could only be confirmed with further investigations.
Considering reaction time measures, S1 reported that he waited longer to give answers
when he felt that a stammer would appear, especially in the non-word repetition task.
However, looking at the results presented in Table 62, this cannot be confirmed.
Reaction time for this task was very close to the overall mean of the LSS. Nevertheless,
accuracy for that task (S1:12, LSS: 15.98) was significantly below average. Moreover,
the significantly longer time needed for reading task performances, compared to the
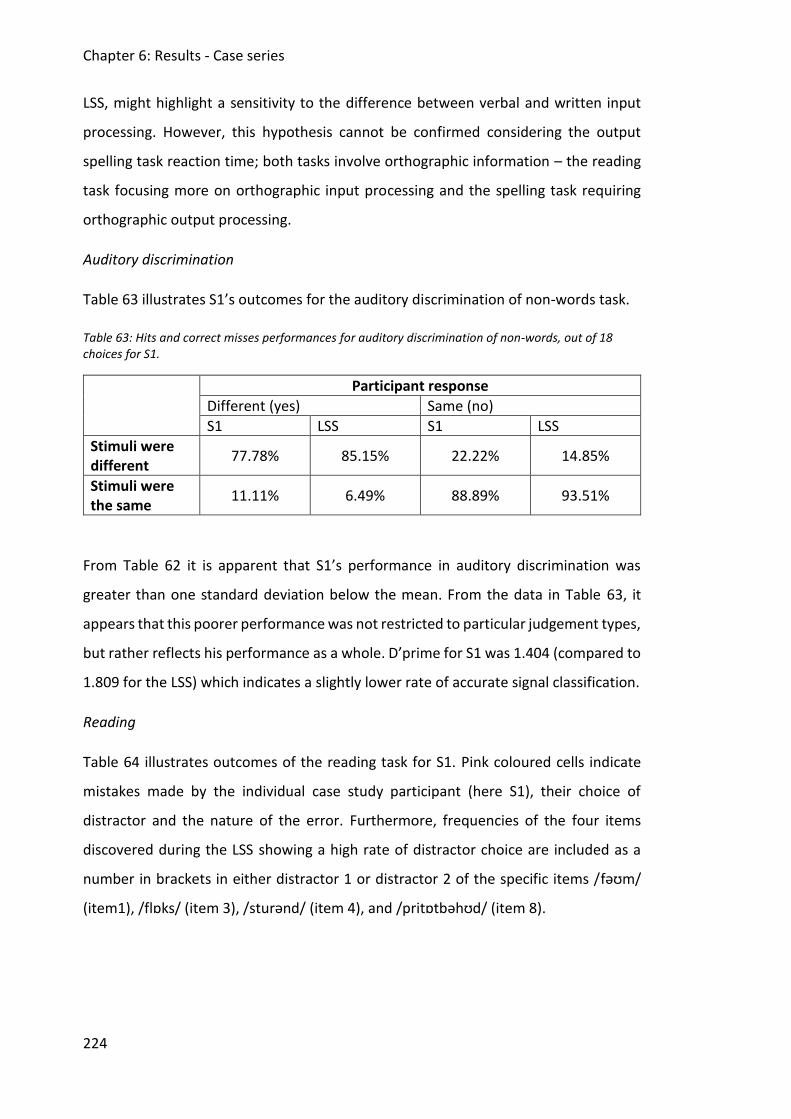
Chapter 6: Results - Case series
224
LSS, might highlight a sensitivity to the difference between verbal and written input
processing. However, this hypothesis cannot be confirmed considering the output
spelling task reaction time; both tasks involve orthographic information – the reading
task focusing more on orthographic input processing and the spelling task requiring
orthographic output processing.
Auditory discrimination
Table 63 illustrates S1’s outcomes for the auditory discrimination of non-words task.
Table 63: Hits and correct misses performances for auditory discrimination of non-words, out of 18 choices for S1.
Participant response
Different (yes) Same (no)
S1 LSS S1 LSS
Stimuli were different
77.78% 85.15% 22.22% 14.85%
Stimuli were the same
11.11% 6.49% 88.89% 93.51%
From Table 62 it is apparent that S1’s performance in auditory discrimination was
greater than one standard deviation below the mean. From the data in Table 63, it
appears that this poorer performance was not restricted to particular judgement types,
but rather reflects his performance as a whole. D’prime for S1 was 1.404 (compared to
1.809 for the LSS) which indicates a slightly lower rate of accurate signal classification.
Reading
Table 64 illustrates outcomes of the reading task for S1. Pink coloured cells indicate
mistakes made by the individual case study participant (here S1), their choice of
distractor and the nature of the error. Furthermore, frequencies of the four items
discovered during the LSS showing a high rate of distractor choice are included as a
number in brackets in either distractor 1 or distractor 2 of the specific items /fəʊm/
(item1), /flɒks/ (item 3), /sturənd/ (item 4), and /pritɒtbəhʊd/ (item 8).
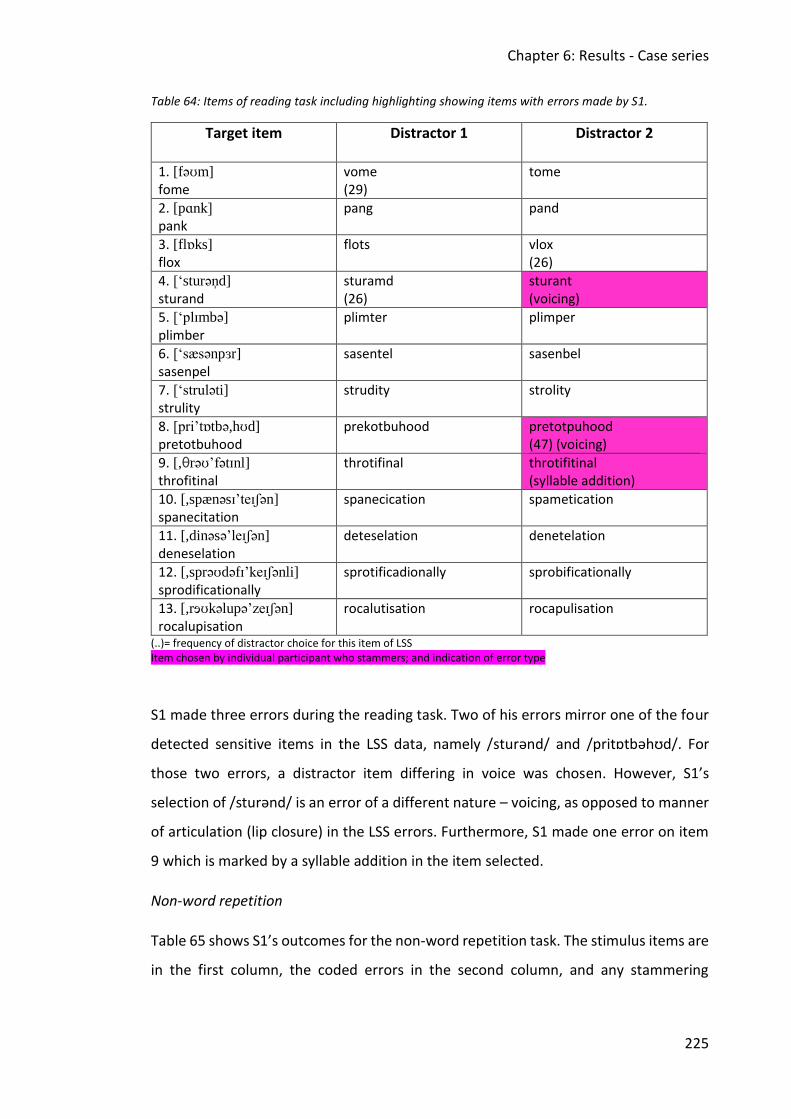
Chapter 6: Results - Case series
225
Table 64: Items of reading task including highlighting showing items with errors made by S1.
Target item Distractor 1
Distractor 2
1. [fəʊm]
fome vome (29)
tome
2. [pɑnk]
pank
pang pand
3. [flɒks] flox
flots vlox (26)
4. [‘sturən̩d] sturand
sturamd (26)
sturant (voicing)
5. [‘plɪmbə] plimber
plimter plimper
6. [‘sæsənpɜr] sasenpel
sasentel sasenbel
7. [‘struləti]
strulity
strudity
strolity
8. [pri’tɒtbə,hʊd] pretotbuhood
prekotbuhood
pretotpuhood (47) (voicing)
9. [,θrəʊ’fətɪnl] throfitinal
throtifinal
throtifitinal (syllable addition)
10. [,spænəsɪ’teɪʃən]
spanecitation
spanecication spametication
11. [,dinəsə’leɪʃən]
deneselation
deteselation
denetelation
12. [,sprəʊdəfɪ’keɪʃənli]
sprodificationally
sprotificadionally sprobificationally
13. [,rɘʊkəlupə’zeɪʃən] rocalupisation
rocalutisation rocapulisation
(..)= frequency of distractor choice for this item of LSS Item chosen by individual participant who stammers; and indication of error type
S1 made three errors during the reading task. Two of his errors mirror one of the four
detected sensitive items in the LSS data, namely /sturənd/ and /pritɒtbəhʊd/. For
those two errors, a distractor item differing in voice was chosen. However, S1’s
selection of /sturənd/ is an error of a different nature – voicing, as opposed to manner
of articulation (lip closure) in the LSS errors. Furthermore, S1 made one error on item
9 which is marked by a syllable addition in the item selected.
Non-word repetition
Table 65 shows S1’s outcomes for the non-word repetition task. The stimulus items are
in the first column, the coded errors in the second column, and any stammering
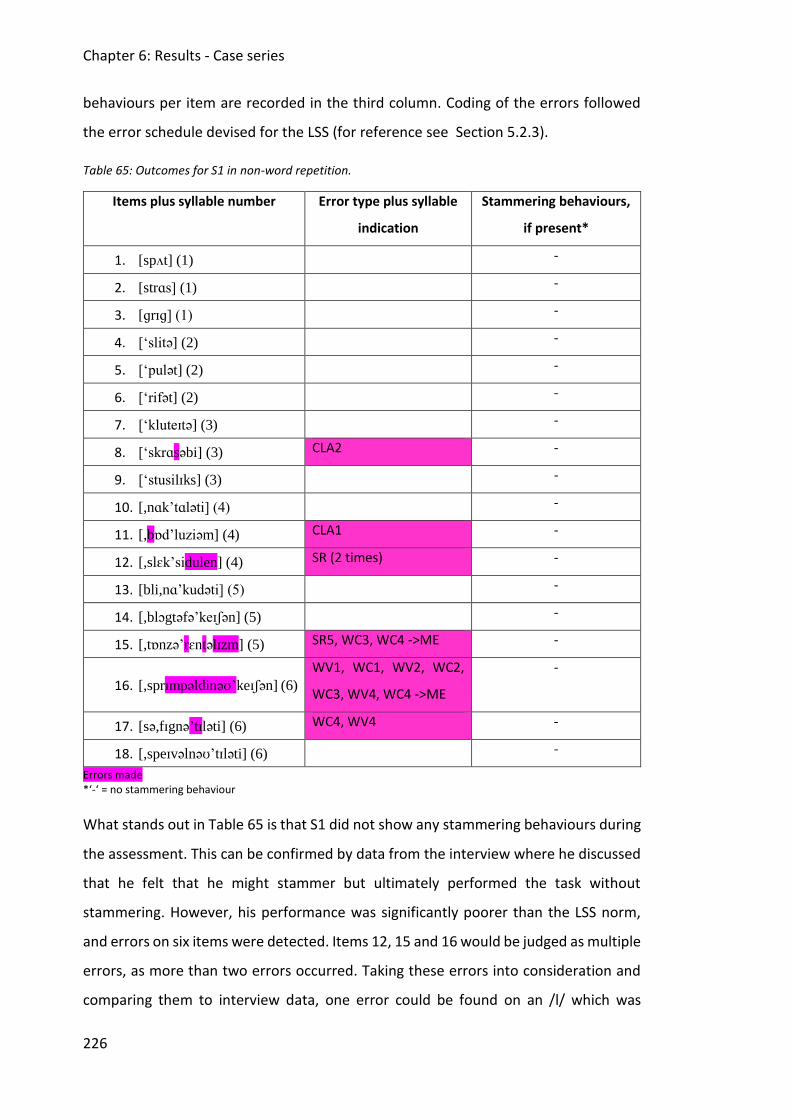
Chapter 6: Results - Case series
226
behaviours per item are recorded in the third column. Coding of the errors followed
the error schedule devised for the LSS (for reference see Section 5.2.3).
Table 65: Outcomes for S1 in non-word repetition.
Items plus syllable number Error type plus syllable
indication
Stammering behaviours,
if present*
1. [spʌt] (1) -
2. [strɑs] (1) -
3. [ɡrɪɡ] (1) -
4. [‘slitə] (2) -
5. [‘pulət] (2) -
6. [‘rifət] (2) -
7. [‘kluteɪtə] (3) -
8. [‘skrɑsəbi] (3) CLA2 -
9. [‘stusilɪks] (3) -
10. [,nɑk’tɑləti] (4) -
11. [,bɒd’luziəm] (4) CLA1 -
12. [,slɛk’sidulen] (4) SR (2 times) -
13. [bli,nɑ’kudəti] (5) -
14. [,blɔgtəfə’keɪʃən] (5) -
15. [,tɒnzə’rɛntəlɪzm] (5) SR5, WC3, WC4 ->ME -
16. [,sprɪmpəldinəʊ’keɪʃən] (6) WV1, WC1, WV2, WC2,
WC3, WV4, WC4 ->ME
-
17. [sə,fɪgnə’tɪləti] (6) WC4, WV4 -
18. [,speɪvəlnəʊ’tɪləti] (6) -
Errors made *‘-‘ = no stammering behaviour
What stands out in Table 65 is that S1 did not show any stammering behaviours during
the assessment. This can be confirmed by data from the interview where he discussed
that he felt that he might stammer but ultimately performed the task without
stammering. However, his performance was significantly poorer than the LSS norm,
and errors on six items were detected. Items 12, 15 and 16 would be judged as multiple
errors, as more than two errors occurred. Taking these errors into consideration and
comparing them to interview data, one error could be found on an /l/ which was
Chapter 6: Results - Case series
227
described by S1 as ‘difficult’. Furthermore, one error reflecting his difficulty with /r/
was found. On both occasions the consonant was replaced. Difficulties with /ʃ/ could
not be observed in S1’s non-word repetition outcomes. However, this might be due to
the position of the /ʃ/ in the non-words. In the non-words, /ʃ/ was mainly present on
the unstressed syllable in the latter part of the item, for example in item 14. Further,
syllable reductions in items 12 and 15 were observed, altogether three times.
Interestingly, this error type occurred only once in the complete LSS data set. Hence,
S1 seems to show that error more frequently. Although he said that he did not actually
stammer during the assessment, these errors might be an indication of avoidance
behaviour. This can also be supported by his statement that: “I felt I needed to
stammer, but then I did not”. Normally, people who stammer can feel a stammering
behaviour coming during speaking and once it is there, it does not disappear again –
only if the speech flow is stopped willingly (Guitar, 2013).
Spoonerism with real words
Table 66 shows S1’s performances for the spoonerism with real words task. The
stimulus items are in the first column, the coded errors in the second column, and any
stammering behaviours per item are recorded in the third column. Coding of the errors
followed the error schedule devised for the LSS (explained in Section 5.2.4).
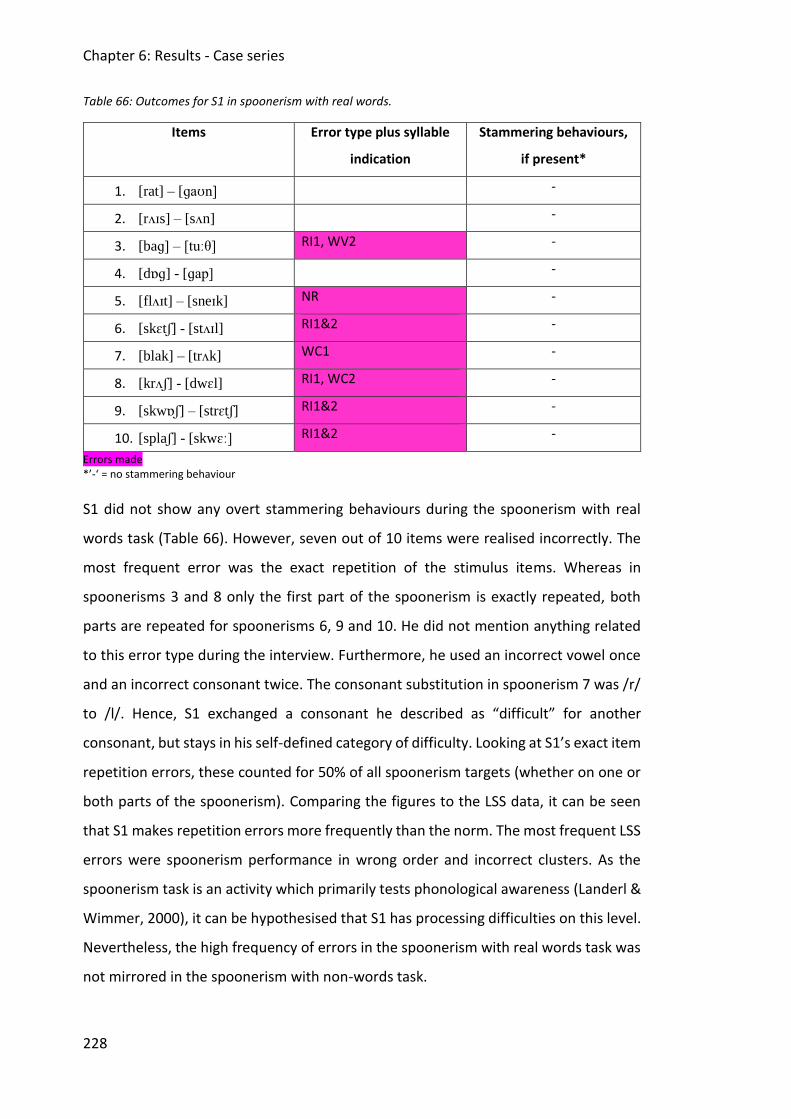
Chapter 6: Results - Case series
228
Table 66: Outcomes for S1 in spoonerism with real words.
Items Error type plus syllable
indication
Stammering behaviours,
if present*
1. [rat] – [ɡaʊn] -
2. [rʌɪs] – [sʌn] -
3. [baɡ] – [tuːθ] RI1, WV2 -
4. [dɒɡ] - [ɡap] -
5. [flʌɪt] – [sneɪk] NR -
6. [skɛtʃ] - [stʌɪl] RI1&2 -
7. [blak] – [trʌk] WC1 -
8. [krʌʃ] - [dwɛl] RI1, WC2 -
9. [skwɒʃ] – [strɛtʃ] RI1&2 -
10. [splaʃ] - [skwɛː] RI1&2 -
Errors made *’-‘ = no stammering behaviour
S1 did not show any overt stammering behaviours during the spoonerism with real
words task (Table 66). However, seven out of 10 items were realised incorrectly. The
most frequent error was the exact repetition of the stimulus items. Whereas in
spoonerisms 3 and 8 only the first part of the spoonerism is exactly repeated, both
parts are repeated for spoonerisms 6, 9 and 10. He did not mention anything related
to this error type during the interview. Furthermore, he used an incorrect vowel once
and an incorrect consonant twice. The consonant substitution in spoonerism 7 was /r/
to /l/. Hence, S1 exchanged a consonant he described as “difficult” for another
consonant, but stays in his self-defined category of difficulty. Looking at S1’s exact item
repetition errors, these counted for 50% of all spoonerism targets (whether on one or
both parts of the spoonerism). Comparing the figures to the LSS data, it can be seen
that S1 makes repetition errors more frequently than the norm. The most frequent LSS
errors were spoonerism performance in wrong order and incorrect clusters. As the
spoonerism task is an activity which primarily tests phonological awareness (Landerl &
Wimmer, 2000), it can be hypothesised that S1 has processing difficulties on this level.
Nevertheless, the high frequency of errors in the spoonerism with real words task was
not mirrored in the spoonerism with non-words task.
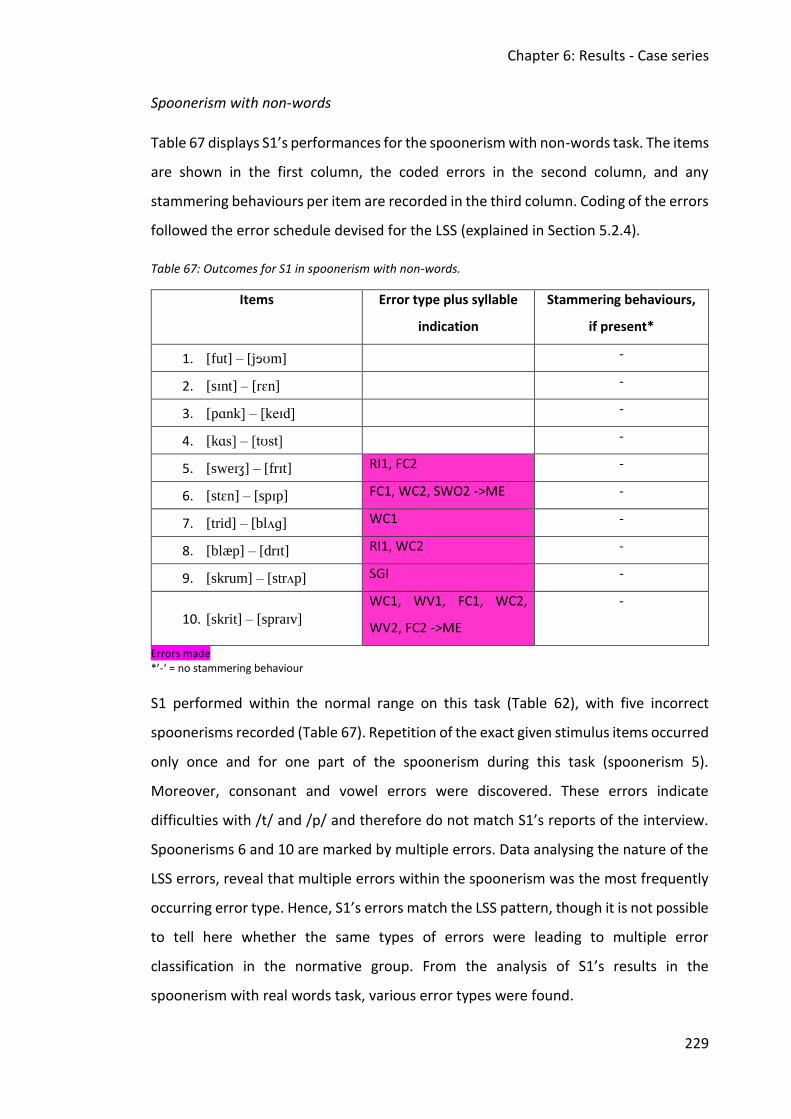
Chapter 6: Results - Case series
229
Spoonerism with non-words
Table 67 displays S1’s performances for the spoonerism with non-words task. The items
are shown in the first column, the coded errors in the second column, and any
stammering behaviours per item are recorded in the third column. Coding of the errors
followed the error schedule devised for the LSS (explained in Section 5.2.4).
Table 67: Outcomes for S1 in spoonerism with non-words.
Items Error type plus syllable
indication
Stammering behaviours,
if present*
1. [fut] – [jɘʊm] -
2. [sɪnt] – [rɛn] -
3. [pɑnk] – [keɪd] -
4. [kɑs] – [tʊst] -
5. [sweɪʒ] – [frɪt] RI1, FC2 -
6. [stɛn] – [spɪp] FC1, WC2, SWO2 ->ME -
7. [trid] – [blʌɡ] WC1 -
8. [blæp] – [drɪt] RI1, WC2 -
9. [skrum] – [strʌp] SGI -
10. [skrit] – [spraɪv] WC1, WV1, FC1, WC2,
WV2, FC2 ->ME
-
Errors made *’-‘ = no stammering behaviour
S1 performed within the normal range on this task (Table 62), with five incorrect
spoonerisms recorded (Table 67). Repetition of the exact given stimulus items occurred
only once and for one part of the spoonerism during this task (spoonerism 5).
Moreover, consonant and vowel errors were discovered. These errors indicate
difficulties with /t/ and /p/ and therefore do not match S1’s reports of the interview.
Spoonerisms 6 and 10 are marked by multiple errors. Data analysing the nature of the
LSS errors, reveal that multiple errors within the spoonerism was the most frequently
occurring error type. Hence, S1’s errors match the LSS pattern, though it is not possible
to tell here whether the same types of errors were leading to multiple error
classification in the normative group. From the analysis of S1’s results in the
spoonerism with real words task, various error types were found.
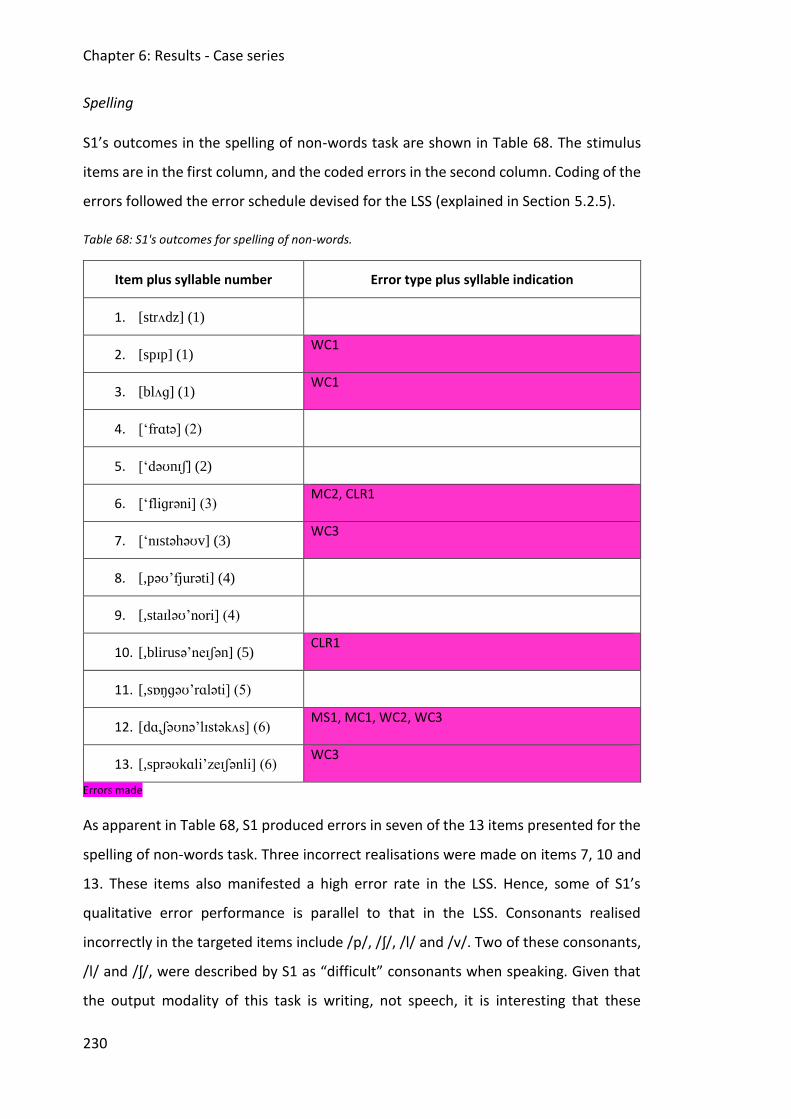
Chapter 6: Results - Case series
230
Spelling
S1’s outcomes in the spelling of non-words task are shown in Table 68. The stimulus
items are in the first column, and the coded errors in the second column. Coding of the
errors followed the error schedule devised for the LSS (explained in Section 5.2.5).
Table 68: S1's outcomes for spelling of non-words.
Item plus syllable number Error type plus syllable indication
1. [strʌdz] (1)
2. [spɪp] (1) WC1
3. [blʌɡ] (1) WC1
4. [‘frɑtə] (2)
5. [‘dəʊnɪʃ] (2)
6. [‘fliɡrəni] (3) MC2, CLR1
7. [‘nɪstəhəʊv] (3) WC3
8. [,pəʊ’fjurəti] (4)
9. [,staɪləʊ’nori] (4)
10. [,blirusə’neɪʃən] (5) CLR1
11. [,sɒŋɡəʊ’rɑləti] (5)
12. [dɑ,ʃəʊnə’lɪstəkʌs] (6) MS1, MC1, WC2, WC3
13. [,sprəʊkɑli’zeɪʃənli] (6) WC3
Errors made
As apparent in Table 68, S1 produced errors in seven of the 13 items presented for the
spelling of non-words task. Three incorrect realisations were made on items 7, 10 and
13. These items also manifested a high error rate in the LSS. Hence, some of S1’s
qualitative error performance is parallel to that in the LSS. Consonants realised
incorrectly in the targeted items include /p/, /ʃ/, /l/ and /v/. Two of these consonants,
/l/ and /ʃ/, were described by S1 as “difficult” consonants when speaking. Given that
the output modality of this task is writing, not speech, it is interesting that these
Chapter 6: Results - Case series
231
consonants are amongst those presenting with errors. Nevertheless, analyses of the
errors made in the LSS revealed qualitative similar mistakes on the same items and the
same consonants.
6.1.3 Discussion
In summary, S1 performed within average levels of accuracy for the reading of non-
words task and the spoonerism with non-words task, whereas his accuracy in other
tasks is below the LSS’s average, especially in non-word repetition. Reaction time
measures for S1 were comparable to the LSS on three tasks: auditory discrimination of
non-words, non-word repetition and spelling of non-words. On the other hand, reading
of non-words and both spoonerism tasks showed longer reaction time measures,
especially reading of non-words.
In connection with the general research questions, it can be confirmed that S1’s speech
profile shows differences in accuracy and reaction time on some tasks compared to the
normative group. These differences can be discussed at a descriptive level but no firm
conclusions can be made due to lack of generalisability of case study data. However,
S1’s overall performance for the spoonerism with real words task, his accuracy scores
for the non-word repetition task, and his reaction times in the reading of non-words
task can be flagged as striking compared to the normative group data.
Regarding the non-word repetition task, S1’s accuracy outcomes could be explained by
his stammer. Errors occurred on consonants which he described as “difficult” during
his interview, so he may have used a form of avoidance strategy. This strategy would
include repeating the non-word in a modified manner to avoid a stammering behaviour
arising. As mentioned above, this suggestion could be supported by data collected
during the interview in which S1 said that he felt that he needed to stammer, but
ultimately did not do so. Moreover, research about non-word repetition skills in
individuals who stammer suggests that such individuals have difficulty remembering or
reproducing novel phonological sequences (Anderson et al., 2006; Hakim & Bernstein
Ratner, 2004). Although the group investigated in that study comprised children who
stammer, the findings lend support to the theory that such phonological difficulties lie
behind S1’s less accurate performance in the non-word repetition task. S1’s tendency
Chapter 6: Results - Case series
232
to replace “difficult” consonants in his output could have happened subconsciously
while trying to reproduce the non-word.
Returning to the discussion of S1’s difficulties with the spoonerism with real words task,
it remains questionable what influenced his performance. On the one hand, the
underlying speech difficulty could have blocked his answers; on the other hand, there
may be a problem with phonological awareness, especially when a task requires access
to aspects of the lexical representation. When performing a spoonerism with real
words, as opposed to non-words, the familiarity of a real word will potentially activate
the phonological representation, semantic representation and motor program of the
known word (cf. Stackhouse & Wells, 1997). Also, people often report visualising the
orthographic form (visual letter pattern) of words when carrying out spoonerisms tasks
(Allyn & Burt, 1998). Within the tasks presented here, it is not possible to tease apart
exactly how the lexicality of the spoonerism items impacted S1’s performance,
however this is something to flag for future study. Moreover, S1’s outcomes for the
spoonerism with real words tasks can be linked to evident empirical research about the
phenomenon of stammering (Chapter 2). Studies have shown that people who
stammer show difficulties at the level of stored word knowledge relating to the greater
linguistic demands for performances on real words (Kleinow & Smith, 2000). Moreover,
it is suggested that people who stammer need longer for tasks with greater linguistic
demands, especially when they have to initiate speech (De Nil, 1995; Tsiamtsiouris &
Cairns, 2013). Thus, as the spoonerism with real words task was designed to assess the
impact of greater linguistic complexity, S1’s accuracy and reaction time outcomes
support the theory that people who stammer have underlying difficulties with stored
word knowledge.
Finally, S1’s significantly longer reaction time needed for the reading of non-words task
could be partly explained by evidence about difficulties with central auditory
processing (e.g. Beal et al., 2007). Nevertheless, it remains questionable why his
outcomes for the auditory discrimination task (also input processing) did not flag any
difference compared to the LSS. Speculatively, the different task design of these two
tasks has influenced this outcome. Whereas the auditory discrimination of non-words
task requires the judging of two auditory stimuli, the reading of non-words task places
Chapter 6: Results - Case series
233
greater demands on phonological sequence memory for matching one auditory
stimulus to one of three different written word forms. Hence, the more complex task
demands might have influenced the significantly longer reaction time outcomes for the
reading of non-words task. Moreover, due to his stammer S1 might rely more on
orthographic representations (as similar to spoonerism with real words) to perform
this task and therefore needed longer to process.
Taking the combination of interview and assessment outcomes of S1 into
consideration, S1 described several consonants as “difficult” and errors connected with
these consonants could be observed in S1’s data, for example, consonant replacement.
Specific consonants of interest for S1 were /l/, /ʃ/, and /r/. Although no overt
stammering behaviours were obvious during the speech processing assessment
process, it seems as if some non-responses or the higher error rate (e.g. in non-word
repetition and spoonerism with real words) might have been influenced by the
underlying processing difficulties (with phonological processing and stored knowledge)
explained above. Moreover, it can be hard to quantify the effect of a stammer on
speech behaviours when the manifestation is so dependent upon context. S1 explained
that he stammers less if his conversation partner is aware of his difficulty. In the
interview situation here, he may have felt comfortable given that the investigator
recruited him because of his stammer. Finally, S1 mentioned during the interview that
he needed longer for completing the non-word repetition task. However, he did not
need longer for the completion of the non-word repetition task.
6.2 Case study 2
6.2.1 Interview data
This participant is a 21-year-old, male, modern languages student and native English
speaker.
S2 described his current stammer as a 4 on a scale from 0-10 (10=very severe). The
onset of his stammer was at age 10 with an approximate severity of 4. Severity
increased to 6 when he attended secondary school, but S2 did not report specific
reasons for this.
Chapter 6: Results - Case series
234
S2 attended therapy for a period of six years. During that therapy, he was taught
different breathing techniques and how to generally slow down when speaking.
Furthermore, he needed to do a lot of practice in therapy and practice alone for
learning the technique of prolongations. He mostly worked with the sounds /s/ and /f/.
He reported that blocks would appear mostly when producing plosives, and
prolongations as a stammering behaviour would occur on the sound /l/. He judged the
helpfulness of the therapy as 6 out of 10 (10=very helpful), although his stammer got
worse for a while during therapy. This was perhaps due to awareness training which
took place simultaneously. He also reported that he practised alone a great deal, and
still does so, because his desire to overcome his stammer was and continues to be very
strong.
When talking about specific stammering patterns, he reported that he always had (and
still has) trouble saying his own name because it includes the consonant /l/ which he
identified as difficult. Mostly, he blocks in this situation. He also tries to avoid specific
words (the words are varying) when he can feel that a stammer might occur, but he
reported that did not need to use this strategy during the interview.
Regarding consistency of stammering severity, S2 said that nowadays his stammer
would be 0 on the severity scale when considering social situations. In
university/formal situations (bank, doctor) he said that it varies between 3 and 4.
However, sometimes he would also judge it as 0 in these situations.
Regarding his family history, S2 reported that his uncle has a stammer.
S2 said that during the speech processing assessment he did not have the feeling he
needed to stammer at all. Furthermore, he did not purposely avoid behaviours.
However, he reported that he might have used techniques subconsciously and
preventively when performing the assessment.
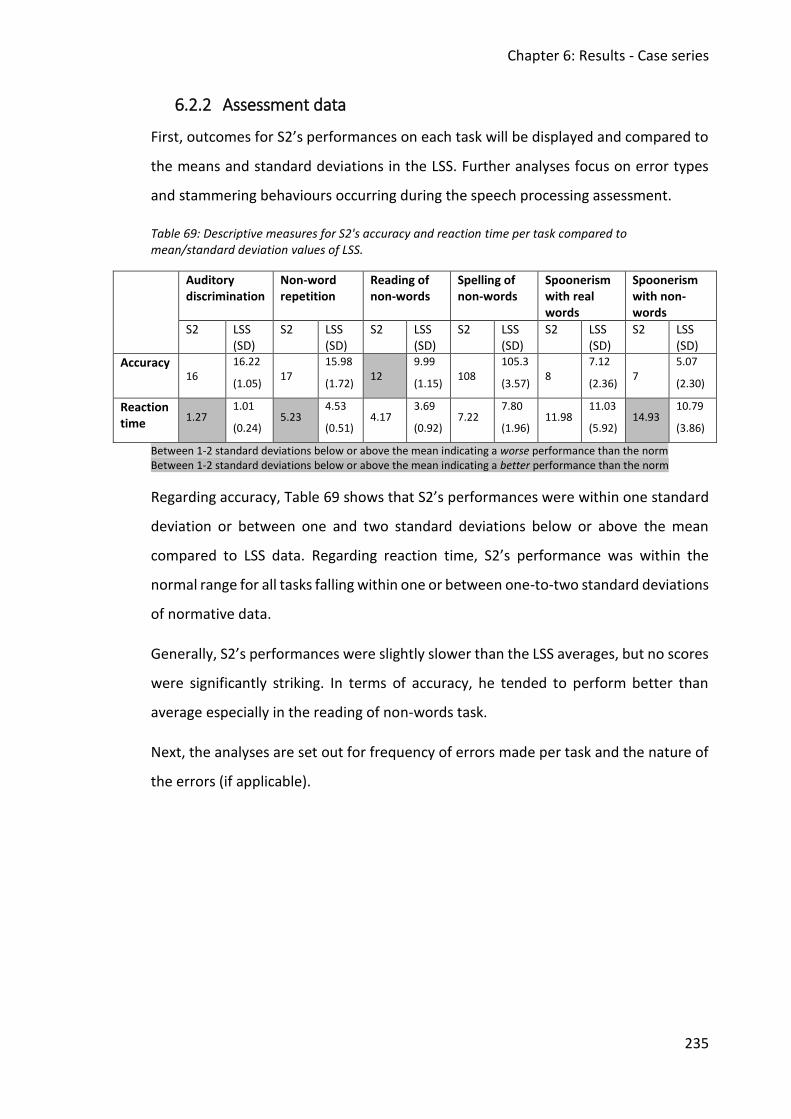
Chapter 6: Results - Case series
235
6.2.2 Assessment data
First, outcomes for S2’s performances on each task will be displayed and compared to
the means and standard deviations in the LSS. Further analyses focus on error types
and stammering behaviours occurring during the speech processing assessment.
Table 69: Descriptive measures for S2's accuracy and reaction time per task compared to mean/standard deviation values of LSS.
Auditory discrimination
Non-word repetition
Reading of non-words
Spelling of non-words
Spoonerism with real words
Spoonerism with non-words
S2 LSS (SD)
S2 LSS (SD)
S2 LSS (SD)
S2 LSS (SD)
S2 LSS (SD)
S2 LSS (SD)
Accuracy 16
16.22
(1.05) 17
15.98
(1.72) 12
9.99
(1.15) 108
105.3
(3.57) 8
7.12
(2.36) 7
5.07
(2.30)
Reaction time
1.27 1.01
(0.24) 5.23
4.53
(0.51) 4.17
3.69
(0.92) 7.22
7.80
(1.96) 11.98
11.03
(5.92) 14.93
10.79
(3.86)
Between 1-2 standard deviations below or above the mean indicating a worse performance than the norm Between 1-2 standard deviations below or above the mean indicating a better performance than the norm
Regarding accuracy, Table 69 shows that S2’s performances were within one standard
deviation or between one and two standard deviations below or above the mean
compared to LSS data. Regarding reaction time, S2’s performance was within the
normal range for all tasks falling within one or between one-to-two standard deviations
of normative data.
Generally, S2’s performances were slightly slower than the LSS averages, but no scores
were significantly striking. In terms of accuracy, he tended to perform better than
average especially in the reading of non-words task.
Next, the analyses are set out for frequency of errors made per task and the nature of
the errors (if applicable).
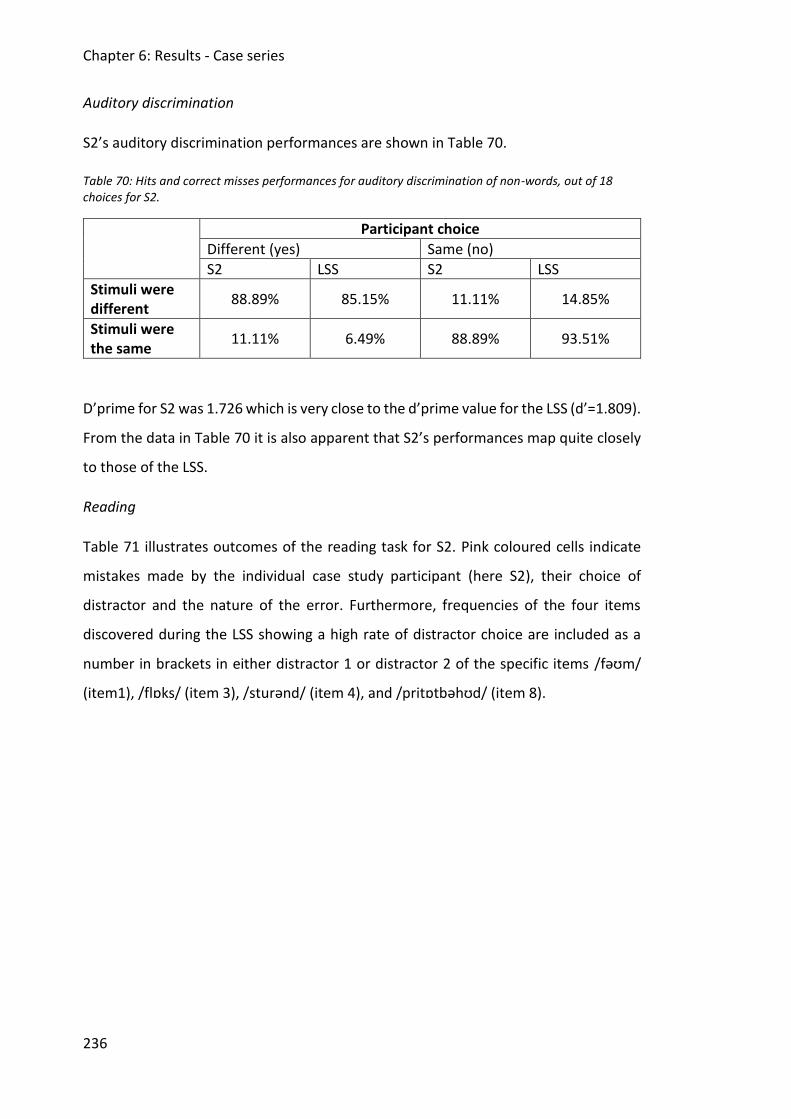
Chapter 6: Results - Case series
236
Auditory discrimination
S2’s auditory discrimination performances are shown in Table 70.
Table 70: Hits and correct misses performances for auditory discrimination of non-words, out of 18 choices for S2.
Participant choice
Different (yes) Same (no)
S2 LSS S2 LSS
Stimuli were different
88.89% 85.15% 11.11% 14.85%
Stimuli were the same
11.11% 6.49% 88.89% 93.51%
D’prime for S2 was 1.726 which is very close to the d’prime value for the LSS (d’=1.809).
From the data in Table 70 it is also apparent that S2’s performances map quite closely
to those of the LSS.
Reading
Table 71 illustrates outcomes of the reading task for S2. Pink coloured cells indicate
mistakes made by the individual case study participant (here S2), their choice of
distractor and the nature of the error. Furthermore, frequencies of the four items
discovered during the LSS showing a high rate of distractor choice are included as a
number in brackets in either distractor 1 or distractor 2 of the specific items /fəʊm/
(item1), /flɒks/ (item 3), /sturənd/ (item 4), and /pritɒtbəhʊd/ (item 8).
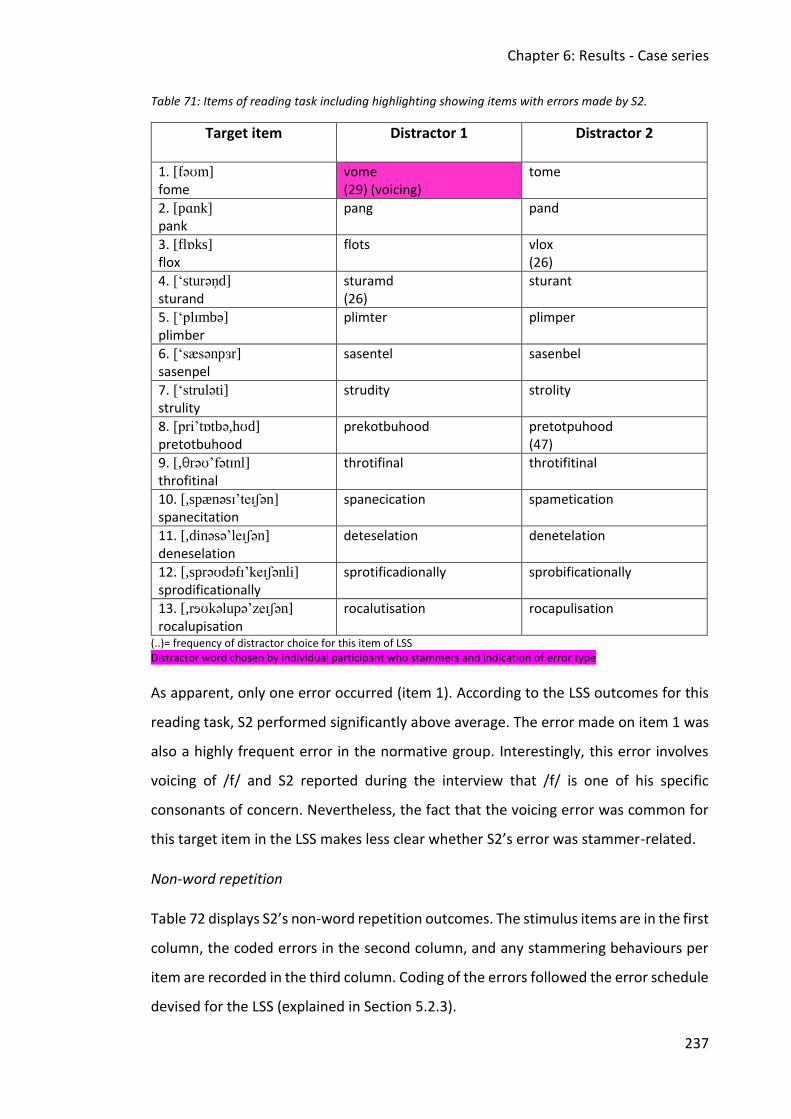
Chapter 6: Results - Case series
237
Table 71: Items of reading task including highlighting showing items with errors made by S2.
Target item Distractor 1
Distractor 2
1. [fəʊm]
fome vome (29) (voicing)
tome
2. [pɑnk]
pank
pang pand
3. [flɒks] flox
flots vlox (26)
4. [‘sturən̩d] sturand
sturamd (26)
sturant
5. [‘plɪmbə] plimber
plimter plimper
6. [‘sæsənpɜr] sasenpel
sasentel sasenbel
7. [‘struləti]
strulity
strudity
strolity
8. [pri’tɒtbə,hʊd] pretotbuhood
prekotbuhood
pretotpuhood (47)
9. [,θrəʊ’fətɪnl] throfitinal
throtifinal
throtifitinal
10. [,spænəsɪ’teɪʃən]
spanecitation
spanecication spametication
11. [,dinəsə’leɪʃən]
deneselation
deteselation
denetelation
12. [,sprəʊdəfɪ’keɪʃənli]
sprodificationally
sprotificadionally sprobificationally
13. [,rɘʊkəlupə’zeɪʃən] rocalupisation
rocalutisation rocapulisation
(..)= frequency of distractor choice for this item of LSS Distractor word chosen by individual participant who stammers and indication of error type
As apparent, only one error occurred (item 1). According to the LSS outcomes for this
reading task, S2 performed significantly above average. The error made on item 1 was
also a highly frequent error in the normative group. Interestingly, this error involves
voicing of /f/ and S2 reported during the interview that /f/ is one of his specific
consonants of concern. Nevertheless, the fact that the voicing error was common for
this target item in the LSS makes less clear whether S2’s error was stammer-related.
Non-word repetition
Table 72 displays S2’s non-word repetition outcomes. The stimulus items are in the first
column, the coded errors in the second column, and any stammering behaviours per
item are recorded in the third column. Coding of the errors followed the error schedule
devised for the LSS (explained in Section 5.2.3).
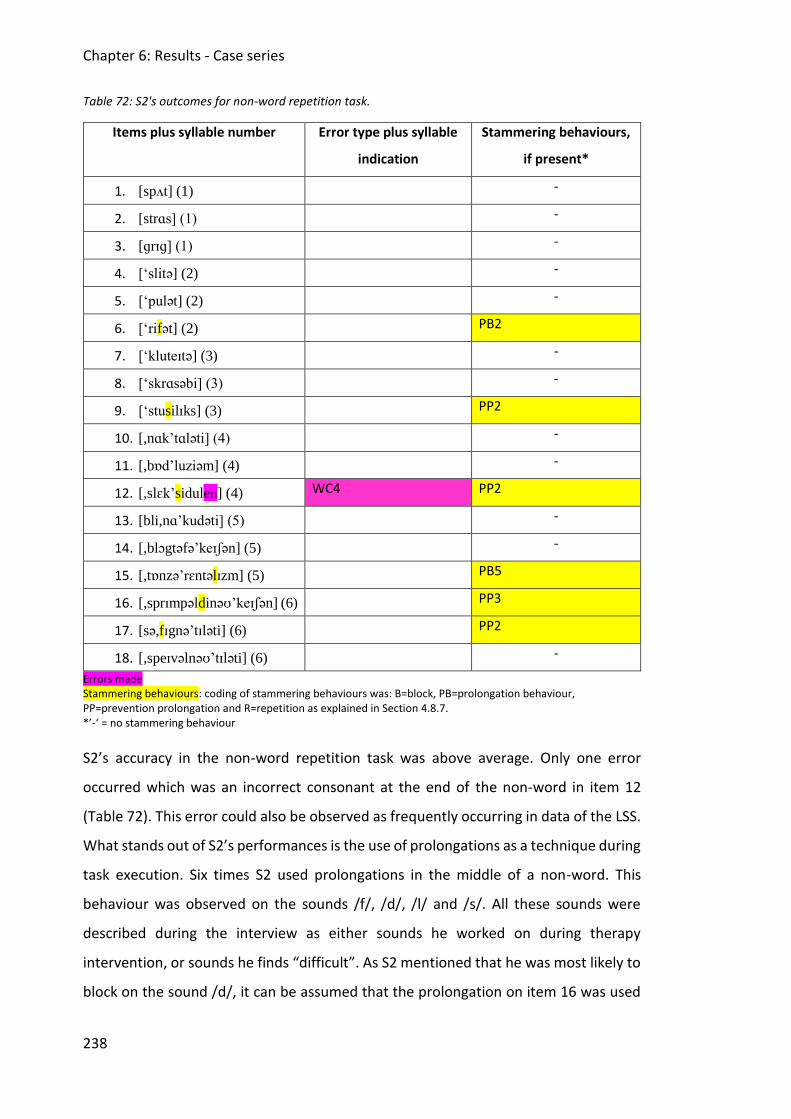
Chapter 6: Results - Case series
238
Table 72: S2's outcomes for non-word repetition task.
Items plus syllable number Error type plus syllable
indication
Stammering behaviours,
if present*
1. [spʌt] (1) -
2. [strɑs] (1) -
3. [ɡrɪɡ] (1) -
4. [‘slitə] (2) -
5. [‘pulət] (2) -
6. [‘rifət] (2) PB2
7. [‘kluteɪtə] (3) -
8. [‘skrɑsəbi] (3) -
9. [‘stusilɪks] (3) PP2
10. [,nɑk’tɑləti] (4) -
11. [,bɒd’luziəm] (4) -
12. [,slɛk’sidulen] (4) WC4 PP2
13. [bli,nɑ’kudəti] (5) -
14. [,blɔgtəfə’keɪʃən] (5) -
15. [,tɒnzə’rɛntəlɪzm] (5) PB5
16. [,sprɪmpəldinəʊ’keɪʃən] (6) PP3
17. [sə,fɪgnə’tɪləti] (6) PP2
18. [,speɪvəlnəʊ’tɪləti] (6) -
Errors made Stammering behaviours: coding of stammering behaviours was: B=block, PB=prolongation behaviour, PP=prevention prolongation and R=repetition as explained in Section 4.8.7. *’-‘ = no stammering behaviour
S2’s accuracy in the non-word repetition task was above average. Only one error
occurred which was an incorrect consonant at the end of the non-word in item 12
(Table 72). This error could also be observed as frequently occurring in data of the LSS.
What stands out of S2’s performances is the use of prolongations as a technique during
task execution. Six times S2 used prolongations in the middle of a non-word. This
behaviour was observed on the sounds /f/, /d/, /l/ and /s/. All these sounds were
described during the interview as either sounds he worked on during therapy
intervention, or sounds he finds “difficult”. As S2 mentioned that he was most likely to
block on the sound /d/, it can be assumed that the prolongation on item 16 was used
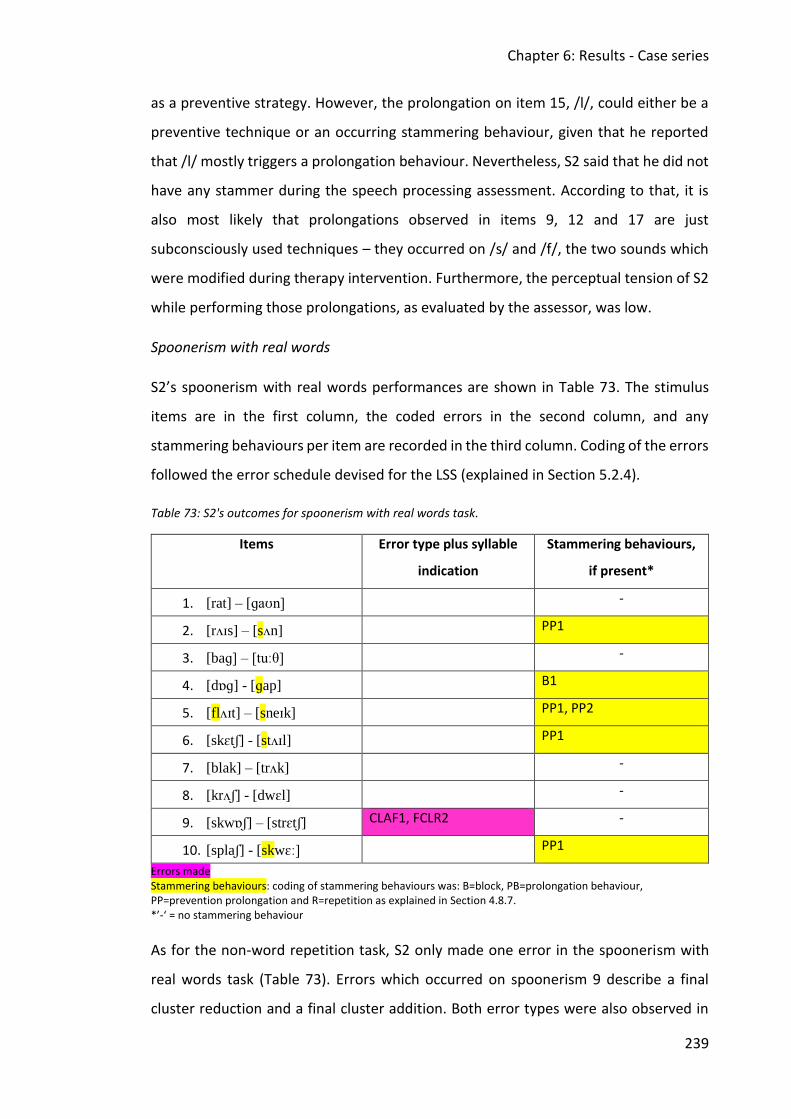
Chapter 6: Results - Case series
239
as a preventive strategy. However, the prolongation on item 15, /l/, could either be a
preventive technique or an occurring stammering behaviour, given that he reported
that /l/ mostly triggers a prolongation behaviour. Nevertheless, S2 said that he did not
have any stammer during the speech processing assessment. According to that, it is
also most likely that prolongations observed in items 9, 12 and 17 are just
subconsciously used techniques – they occurred on /s/ and /f/, the two sounds which
were modified during therapy intervention. Furthermore, the perceptual tension of S2
while performing those prolongations, as evaluated by the assessor, was low.
Spoonerism with real words
S2’s spoonerism with real words performances are shown in Table 73. The stimulus
items are in the first column, the coded errors in the second column, and any
stammering behaviours per item are recorded in the third column. Coding of the errors
followed the error schedule devised for the LSS (explained in Section 5.2.4).
Table 73: S2's outcomes for spoonerism with real words task.
Items Error type plus syllable
indication
Stammering behaviours,
if present*
1. [rat] – [ɡaʊn] -
2. [rʌɪs] – [sʌn] PP1
3. [baɡ] – [tuːθ] -
4. [dɒɡ] - [ɡap] B1
5. [flʌɪt] – [sneɪk] PP1, PP2
6. [skɛtʃ] - [stʌɪl] PP1
7. [blak] – [trʌk] -
8. [krʌʃ] - [dwɛl] -
9. [skwɒʃ] – [strɛtʃ] CLAF1, FCLR2 -
10. [splaʃ] - [skwɛː] PP1
Errors made Stammering behaviours: coding of stammering behaviours was: B=block, PB=prolongation behaviour, PP=prevention prolongation and R=repetition as explained in Section 4.8.7. *’-‘ = no stammering behaviour
As for the non-word repetition task, S2 only made one error in the spoonerism with
real words task (Table 73). Errors which occurred on spoonerism 9 describe a final
cluster reduction and a final cluster addition. Both error types were also observed in
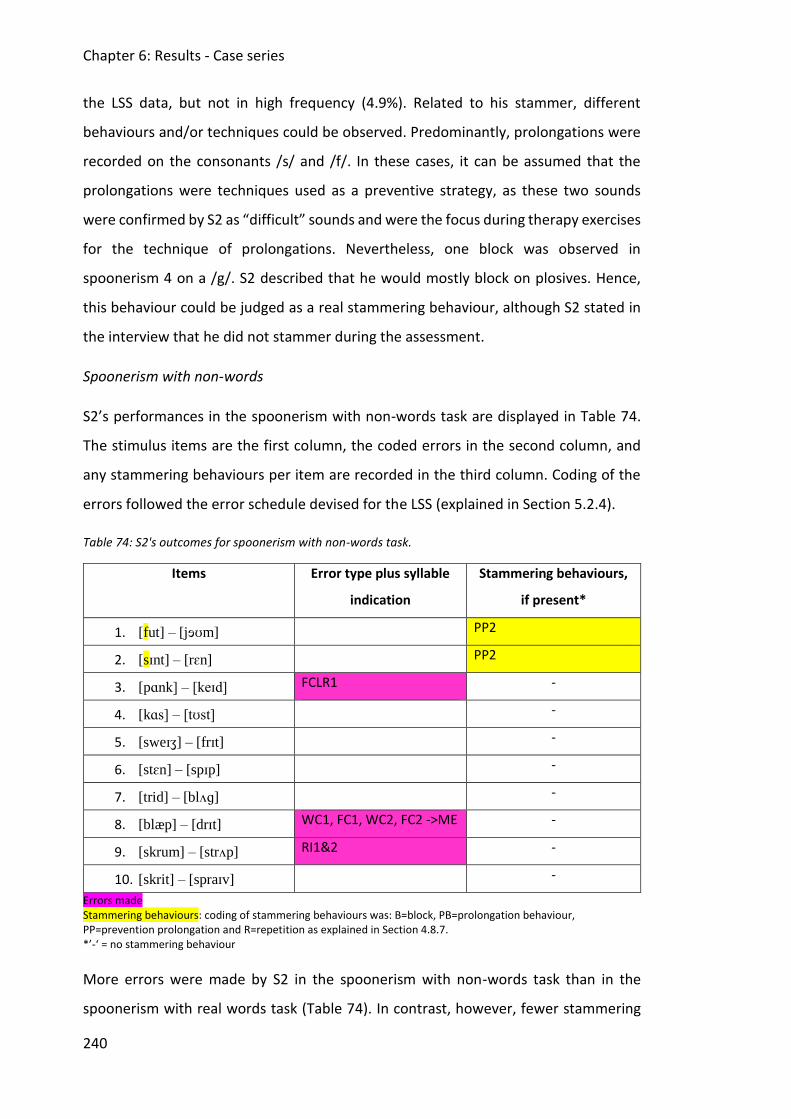
Chapter 6: Results - Case series
240
the LSS data, but not in high frequency (4.9%). Related to his stammer, different
behaviours and/or techniques could be observed. Predominantly, prolongations were
recorded on the consonants /s/ and /f/. In these cases, it can be assumed that the
prolongations were techniques used as a preventive strategy, as these two sounds
were confirmed by S2 as “difficult” sounds and were the focus during therapy exercises
for the technique of prolongations. Nevertheless, one block was observed in
spoonerism 4 on a /g/. S2 described that he would mostly block on plosives. Hence,
this behaviour could be judged as a real stammering behaviour, although S2 stated in
the interview that he did not stammer during the assessment.
Spoonerism with non-words
S2’s performances in the spoonerism with non-words task are displayed in Table 74.
The stimulus items are the first column, the coded errors in the second column, and
any stammering behaviours per item are recorded in the third column. Coding of the
errors followed the error schedule devised for the LSS (explained in Section 5.2.4).
Table 74: S2's outcomes for spoonerism with non-words task.
Items Error type plus syllable
indication
Stammering behaviours,
if present*
1. [fut] – [jɘʊm] PP2
2. [sɪnt] – [rɛn] PP2
3. [pɑnk] – [keɪd] FCLR1 -
4. [kɑs] – [tʊst] -
5. [sweɪʒ] – [frɪt] -
6. [stɛn] – [spɪp] -
7. [trid] – [blʌɡ] -
8. [blæp] – [drɪt] WC1, FC1, WC2, FC2 ->ME -
9. [skrum] – [strʌp] RI1&2 -
10. [skrit] – [spraɪv] -
Errors made Stammering behaviours: coding of stammering behaviours was: B=block, PB=prolongation behaviour, PP=prevention prolongation and R=repetition as explained in Section 4.8.7. *’-‘ = no stammering behaviour
More errors were made by S2 in the spoonerism with non-words task than in the
spoonerism with real words task (Table 74). In contrast, however, fewer stammering

Chapter 6: Results - Case series
241
techniques/behaviours occurred for the non-words spoonerism task as compared to
the real word version. Spoonerism trials 3, 8 and 9 showed errors which were also
made by participants in the LSS. Multiple errors on one spoonerism was the most
frequent error in this population. Moreover, final cluster reduction (spoonerism 3) was
frequently included as an error in the LSS. Hence, S2’s qualitative error performance
was similar to that of the LSS. The only two stammering behaviours which occurred
were prolongations on the sounds /f/ and /s/. Again, these behaviours can most likely
be judged as a standard preventive technique due to the facts described above
(concerning spoonerism with real words).
Spelling
S2’s outcomes for the spelling of non-words task are set out in Table 75. Column 1
contains the stimulus items and column 2 has the coded errors. Coding of the errors
followed the error schedule devised for the LSS (explained in Section 5.2.5).
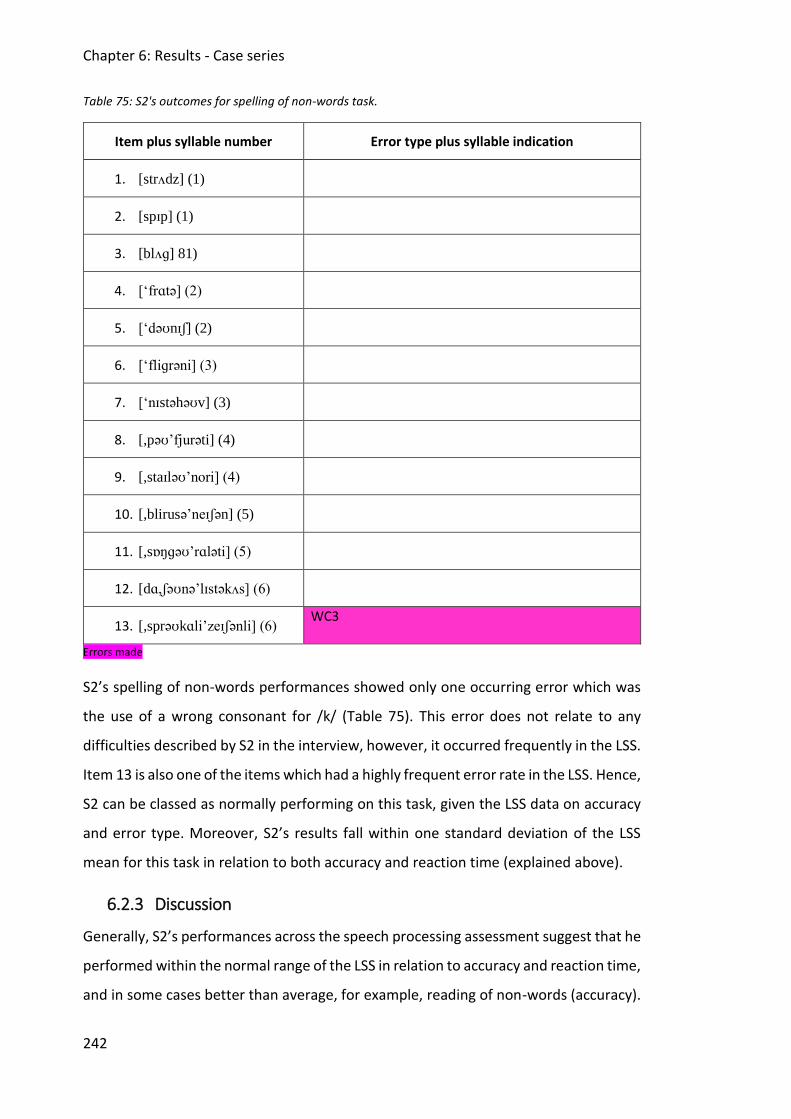
Chapter 6: Results - Case series
242
Table 75: S2's outcomes for spelling of non-words task.
Item plus syllable number Error type plus syllable indication
1. [strʌdz] (1)
2. [spɪp] (1)
3. [blʌɡ] 81)
4. [‘frɑtə] (2)
5. [‘dəʊnɪʃ] (2)
6. [‘fliɡrəni] (3)
7. [‘nɪstəhəʊv] (3)
8. [,pəʊ’fjurəti] (4)
9. [,staɪləʊ’nori] (4)
10. [,blirusə’neɪʃən] (5)
11. [,sɒŋɡəʊ’rɑləti] (5)
12. [dɑ,ʃəʊnə’lɪstəkʌs] (6)
13. [,sprəʊkɑli’zeɪʃənli] (6) WC3
Errors made
S2’s spelling of non-words performances showed only one occurring error which was
the use of a wrong consonant for /k/ (Table 75). This error does not relate to any
difficulties described by S2 in the interview, however, it occurred frequently in the LSS.
Item 13 is also one of the items which had a highly frequent error rate in the LSS. Hence,
S2 can be classed as normally performing on this task, given the LSS data on accuracy
and error type. Moreover, S2’s results fall within one standard deviation of the LSS
mean for this task in relation to both accuracy and reaction time (explained above).
6.2.3 Discussion
Generally, S2’s performances across the speech processing assessment suggest that he
performed within the normal range of the LSS in relation to accuracy and reaction time,
and in some cases better than average, for example, reading of non-words (accuracy).
Chapter 6: Results - Case series
243
Although he needed longer for three tasks, namely, auditory discrimination of non-
words, non-word repetition, and spoonerism with non-words, his performances were
very close to normal range.
While an individual speech processing profile could be established, no specific or
individual patterns related to the assessment tool could be observed for S2. Moreover,
S2 does not show any differences in performances compared to the normative sample
group. Nevertheless, some observations were made which related to stammering
behaviour.
According to S2’s interview data, he reported that he mainly had problems with the
sounds /l/, /s/ and /f/ and these difficulties were in fact observed to a great extent in
his stammering patterns during the assessment. It remains unclear if some of these
techniques were used preventively, or if an actual stammering behaviour was
observed. Evidenced-based therapy approaches include the preventive and constant
use of techniques, such as prolongations, to reduce the occurrence of stammering
behaviours (Blomgren, Roy, Callister, & Merrill, 2005). Since S2 had intervention for a
period of over six years and mainly focused on the prolongation for the sounds /s/ and
/f/, it can be assumed that the prolongations manifested here were a strategy rather
than actual stammering behaviours. According to S2’s reports, he also experienced
blocks on plosives. This was observable once during the assessment on a “difficult”
sound for him (/g/). Nevertheless, at the end of the interview he could not recall this
block behaviour which occurred during the assessment. Yet, generally the data
collected here (interview and assessment) for S2 supports the idea that people who
stammer know where and when they stammer (Guitar, 2013; Ward, 2008), since the
use of prolongations as a preventive technique was observed frequently and this
technique demands awareness for stammering behaviour that could occur.
6.3 Case study 3
6.3.1 Interview data
This participant is a 21-year-old male engineering student and native English speaker.
S3 described his current stammer as a 4 on the severity scale (out of 10=very severe).
The first time he stammered was apparently three years ago, when he was 18 years
Chapter 6: Results - Case series
244
old, but he said he cannot remember if it occurred during childhood as well. Since onset
three years ago, the stammer severity has continuously been at a 4 on the severity
scale.
S3 has never attended therapy for his stammer. He reported that if he stammers he
mostly suffers from blocks and repetitions. Furthermore, he explained that he uses
avoidance strategies. These avoidance strategies are swapping words related to
semantic categories, and repetitions of words/chunks. He could not name any specific
sounds which are difficult for him. Additionally, he described that he sometimes
mumbles the rest of a word or a sentence to overcome the stammer. He said that the
stammer and the mumbling happen simultaneously and sometimes either one can
occur more frequently. Furthermore, he speculated that he might be a stammer-
clutterer.
Related to specific situations he described that his stammer is mostly more severe in
formal/university situations than in social situations. Thus while university-related
situations were reported as around 3 to 4 on a severity scale (from 0-10), S3 judged
social situations as 2 to 3.
S3 reported that no family history of stammering is known.
During the speech processing assessment, he skipped two answers as he had the
feeling he would stammer and he wanted to avoid it. These skips happened once in the
spoonerism with real words task and once in the spoonerism with non-words task.
6.3.2 Assessment data
First, outcomes of S3’s performances for each task will be displayed and compared to
the means and standard deviations of the LSS. Further analyses focus on error types
and occurring stammering behaviours during the speech processing assessment.
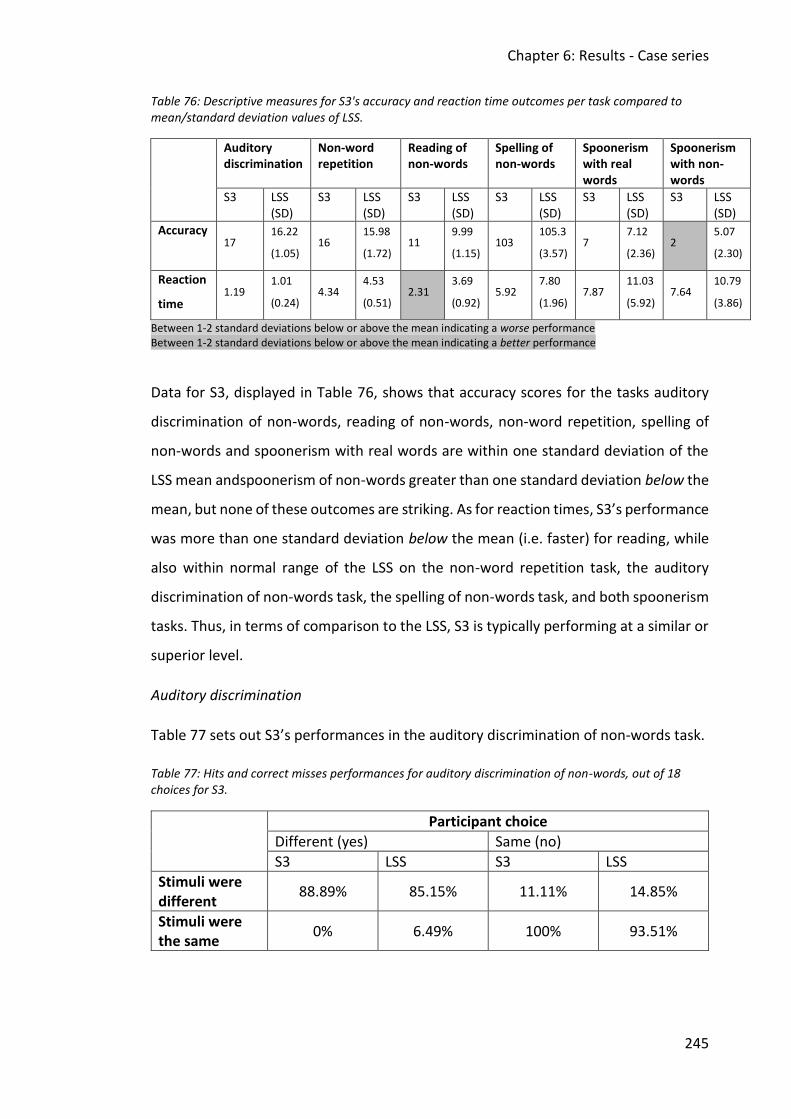
Chapter 6: Results - Case series
245
Table 76: Descriptive measures for S3's accuracy and reaction time outcomes per task compared to mean/standard deviation values of LSS.
Auditory discrimination
Non-word repetition
Reading of non-words
Spelling of non-words
Spoonerism with real words
Spoonerism with non-words
S3 LSS (SD)
S3 LSS (SD)
S3 LSS (SD)
S3 LSS (SD)
S3 LSS (SD)
S3 LSS (SD)
Accuracy
17
16.22
(1.05) 16
15.98
(1.72) 11
9.99
(1.15) 103
105.3
(3.57) 7
7.12
(2.36) 2
5.07
(2.30)
Reaction
time 1.19
1.01
(0.24) 4.34
4.53
(0.51) 2.31
3.69
(0.92) 5.92
7.80
(1.96) 7.87
11.03
(5.92) 7.64
10.79
(3.86)
Between 1-2 standard deviations below or above the mean indicating a worse performance Between 1-2 standard deviations below or above the mean indicating a better performance
Data for S3, displayed in Table 76, shows that accuracy scores for the tasks auditory
discrimination of non-words, reading of non-words, non-word repetition, spelling of
non-words and spoonerism with real words are within one standard deviation of the
LSS mean andspoonerism of non-words greater than one standard deviation below the
mean, but none of these outcomes are striking. As for reaction times, S3’s performance
was more than one standard deviation below the mean (i.e. faster) for reading, while
also within normal range of the LSS on the non-word repetition task, the auditory
discrimination of non-words task, the spelling of non-words task, and both spoonerism
tasks. Thus, in terms of comparison to the LSS, S3 is typically performing at a similar or
superior level.
Auditory discrimination
Table 77 sets out S3’s performances in the auditory discrimination of non-words task.
Table 77: Hits and correct misses performances for auditory discrimination of non-words, out of 18 choices for S3.
Participant choice
Different (yes) Same (no)
S3 LSS S3 LSS
Stimuli were different
88.89% 85.15% 11.11% 14.85%
Stimuli were the same
0% 6.49% 100% 93.51%
Chapter 6: Results - Case series
246
Auditory discrimination task outcomes for S3 display generally similar percentages for
correct hits and correct misses compared to the LSS (Table 77), although it is notable
that S3 had no instances of false alarms. In parallel, calculated d’prime for S3’s
performances was d’=1.990 which is slightly higher than d’prime outcomes for the LSS
(d’=1.809), which may represent this good level of sensitivity.
Reading
Table 78 illustrates outcomes for the reading task for S3. Pink coloured cells indicate
mistakes made by the individual case study participant (here S3), their choice of
distractor and the nature of the error. Furthermore, frequencies of the four items
discovered during the LSS showing a high rate of distractor choice are included as a
number in brackets in either distractor 1 or distractor 2 of the specific items /fəʊm/
(item1), /flɒks/ (item 3), /sturənd/ (item 4), and /pritɒtbəhʊd/ (item 8).
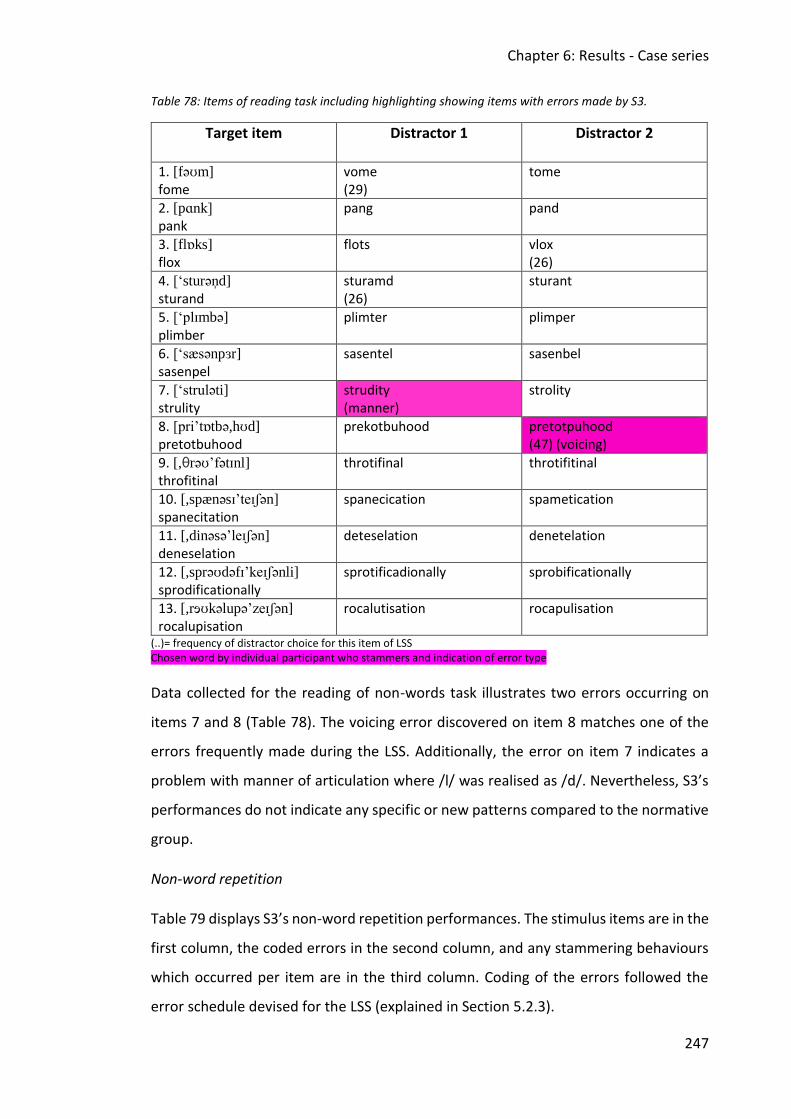
Chapter 6: Results - Case series
247
Table 78: Items of reading task including highlighting showing items with errors made by S3.
Target item Distractor 1
Distractor 2
1. [fəʊm]
fome vome (29)
tome
2. [pɑnk]
pank
pang pand
3. [flɒks] flox
flots vlox (26)
4. [‘sturən̩d] sturand
sturamd (26)
sturant
5. [‘plɪmbə] plimber
plimter plimper
6. [‘sæsənpɜr] sasenpel
sasentel sasenbel
7. [‘struləti]
strulity
strudity (manner)
strolity
8. [pri’tɒtbə,hʊd] pretotbuhood
prekotbuhood
pretotpuhood (47) (voicing)
9. [,θrəʊ’fətɪnl] throfitinal
throtifinal
throtifitinal
10. [,spænəsɪ’teɪʃən]
spanecitation
spanecication spametication
11. [,dinəsə’leɪʃən]
deneselation
deteselation
denetelation
12. [,sprəʊdəfɪ’keɪʃənli]
sprodificationally
sprotificadionally sprobificationally
13. [,rɘʊkəlupə’zeɪʃən] rocalupisation
rocalutisation rocapulisation
(..)= frequency of distractor choice for this item of LSS Chosen word by individual participant who stammers and indication of error type
Data collected for the reading of non-words task illustrates two errors occurring on
items 7 and 8 (Table 78). The voicing error discovered on item 8 matches one of the
errors frequently made during the LSS. Additionally, the error on item 7 indicates a
problem with manner of articulation where /l/ was realised as /d/. Nevertheless, S3’s
performances do not indicate any specific or new patterns compared to the normative
group.
Non-word repetition
Table 79 displays S3’s non-word repetition performances. The stimulus items are in the
first column, the coded errors in the second column, and any stammering behaviours
which occurred per item are in the third column. Coding of the errors followed the
error schedule devised for the LSS (explained in Section 5.2.3).

Chapter 6: Results - Case series
248
Table 79: S3's performances in non-word repetition.
Items plus syllable number Error type plus syllable
indication
Stammering behaviours,
if present*
1. [spʌt] (1) -
2. [strɑs] (1) -
3. [ɡrɪɡ] (1) -
4. [‘slitə] (2) -
5. [‘pulət] (2) -
6. [‘rifət] (2) -
7. [‘kluteɪtə] (3) -
8. [‘skrɑsəbi] (3) -
9. [‘stusilɪks] (3) -
10. [,nɑk’tɑləti] (4) -
11. [,bɒd’luziəm] (4) -
12. [,slɛk’sidulen] (4) -
13. [bli,nɑ’kudəti] (5) -
14. [,blɔgtəfə’keɪʃən] (5) B3
15. [,tɒnzə’rɛntəlɪzm] (5) WC2 -
16. [,sprɪmpəldinəʊ’keɪʃən] (6) ICLR1 -
17. [sə,fɪgnə’tɪləti] (6) -
18. [,speɪvəlnəʊ’tɪləti] (6) -
Errors made Stammering behaviours: coding of stammering behaviours was: B=block, PB=prolongation behaviour, PP=prevention prolongation and R=repetition as explained in Section 4.8.7. *’-‘ = no stammering behaviour
Altogether, two errors occurred in S3’s performances of the non-word repetition task
(Table 79) – a wrong consonant and a cluster reduction. Both error types occurred
frequently in the data collected for the LSS and can therefore be judged as usual errors.
However, S3 did stammer on item 14 with a block behaviour. This block was obvious in
the assessment session and on recorded data, but was not identified by S3 himself. He
described during the interview that he would mostly suffer from repetitions and blocks,
but no repetitions were observed.
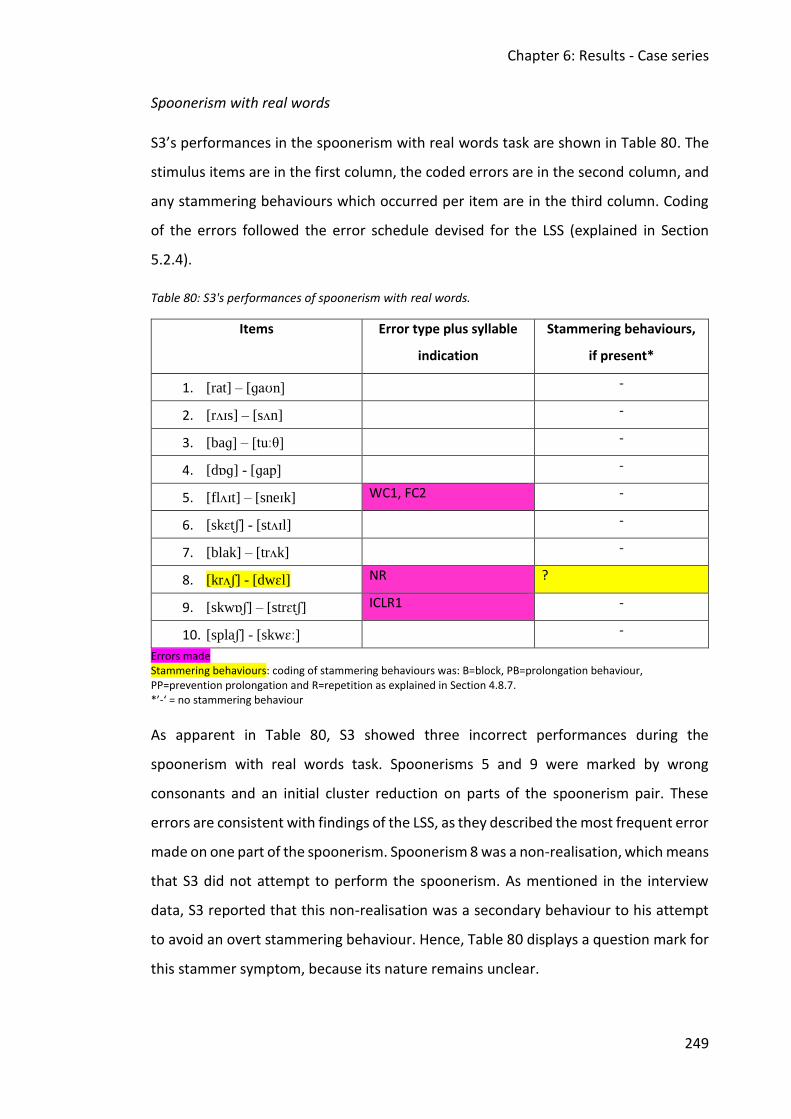
Chapter 6: Results - Case series
249
Spoonerism with real words
S3’s performances in the spoonerism with real words task are shown in Table 80. The
stimulus items are in the first column, the coded errors are in the second column, and
any stammering behaviours which occurred per item are in the third column. Coding
of the errors followed the error schedule devised for the LSS (explained in Section
5.2.4).
Table 80: S3's performances of spoonerism with real words.
Items Error type plus syllable
indication
Stammering behaviours,
if present*
1. [rat] – [ɡaʊn] -
2. [rʌɪs] – [sʌn] -
3. [baɡ] – [tuːθ] -
4. [dɒɡ] - [ɡap] -
5. [flʌɪt] – [sneɪk] WC1, FC2 -
6. [skɛtʃ] - [stʌɪl] -
7. [blak] – [trʌk] -
8. [krʌʃ] - [dwɛl] NR ?
9. [skwɒʃ] – [strɛtʃ] ICLR1 -
10. [splaʃ] - [skwɛː] -
Errors made Stammering behaviours: coding of stammering behaviours was: B=block, PB=prolongation behaviour, PP=prevention prolongation and R=repetition as explained in Section 4.8.7. *’-‘ = no stammering behaviour
As apparent in Table 80, S3 showed three incorrect performances during the
spoonerism with real words task. Spoonerisms 5 and 9 were marked by wrong
consonants and an initial cluster reduction on parts of the spoonerism pair. These
errors are consistent with findings of the LSS, as they described the most frequent error
made on one part of the spoonerism. Spoonerism 8 was a non-realisation, which means
that S3 did not attempt to perform the spoonerism. As mentioned in the interview
data, S3 reported that this non-realisation was a secondary behaviour to his attempt
to avoid an overt stammering behaviour. Hence, Table 80 displays a question mark for
this stammer symptom, because its nature remains unclear.
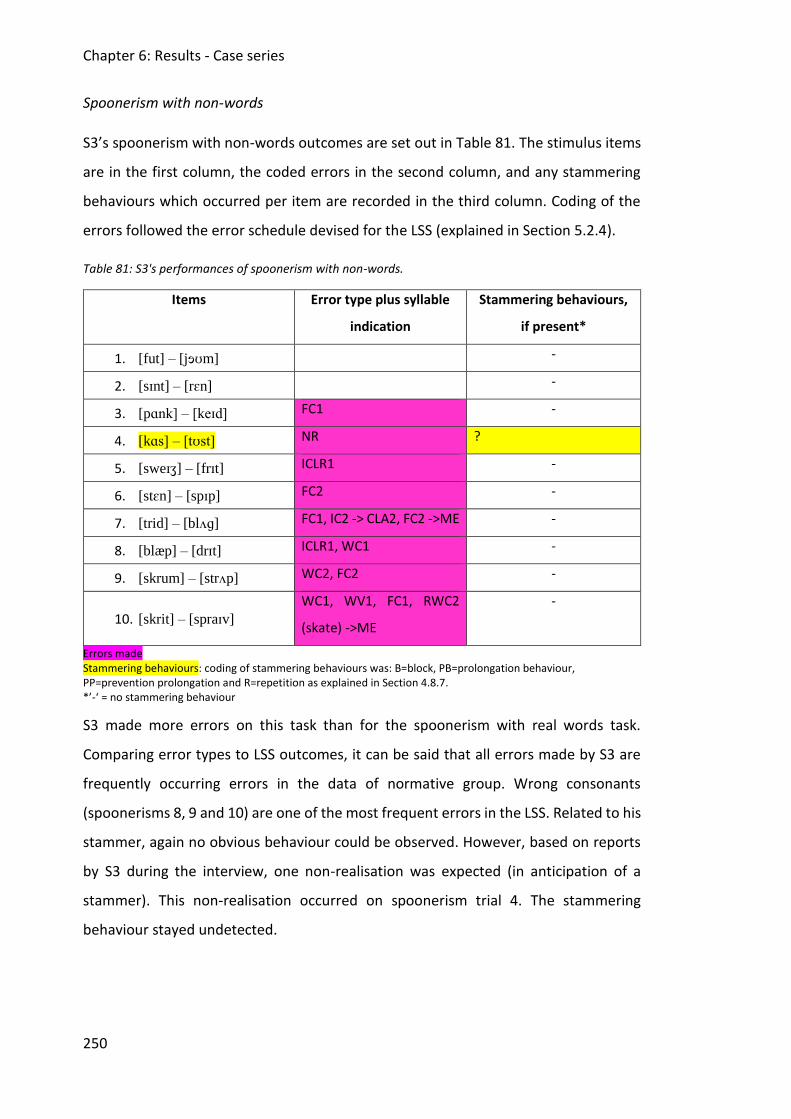
Chapter 6: Results - Case series
250
Spoonerism with non-words
S3’s spoonerism with non-words outcomes are set out in Table 81. The stimulus items
are in the first column, the coded errors in the second column, and any stammering
behaviours which occurred per item are recorded in the third column. Coding of the
errors followed the error schedule devised for the LSS (explained in Section 5.2.4).
Table 81: S3's performances of spoonerism with non-words.
Items Error type plus syllable
indication
Stammering behaviours,
if present*
1. [fut] – [jɘʊm] -
2. [sɪnt] – [rɛn] -
3. [pɑnk] – [keɪd] FC1 -
4. [kɑs] – [tʊst] NR ?
5. [sweɪʒ] – [frɪt] ICLR1 -
6. [stɛn] – [spɪp] FC2 -
7. [trid] – [blʌɡ] FC1, IC2 -> CLA2, FC2 ->ME -
8. [blæp] – [drɪt] ICLR1, WC1 -
9. [skrum] – [strʌp] WC2, FC2 -
10. [skrit] – [spraɪv] WC1, WV1, FC1, RWC2
(skate) ->ME
-
Errors made Stammering behaviours: coding of stammering behaviours was: B=block, PB=prolongation behaviour, PP=prevention prolongation and R=repetition as explained in Section 4.8.7. *’-‘ = no stammering behaviour
S3 made more errors on this task than for the spoonerism with real words task.
Comparing error types to LSS outcomes, it can be said that all errors made by S3 are
frequently occurring errors in the data of normative group. Wrong consonants
(spoonerisms 8, 9 and 10) are one of the most frequent errors in the LSS. Related to his
stammer, again no obvious behaviour could be observed. However, based on reports
by S3 during the interview, one non-realisation was expected (in anticipation of a
stammer). This non-realisation occurred on spoonerism trial 4. The stammering
behaviour stayed undetected.
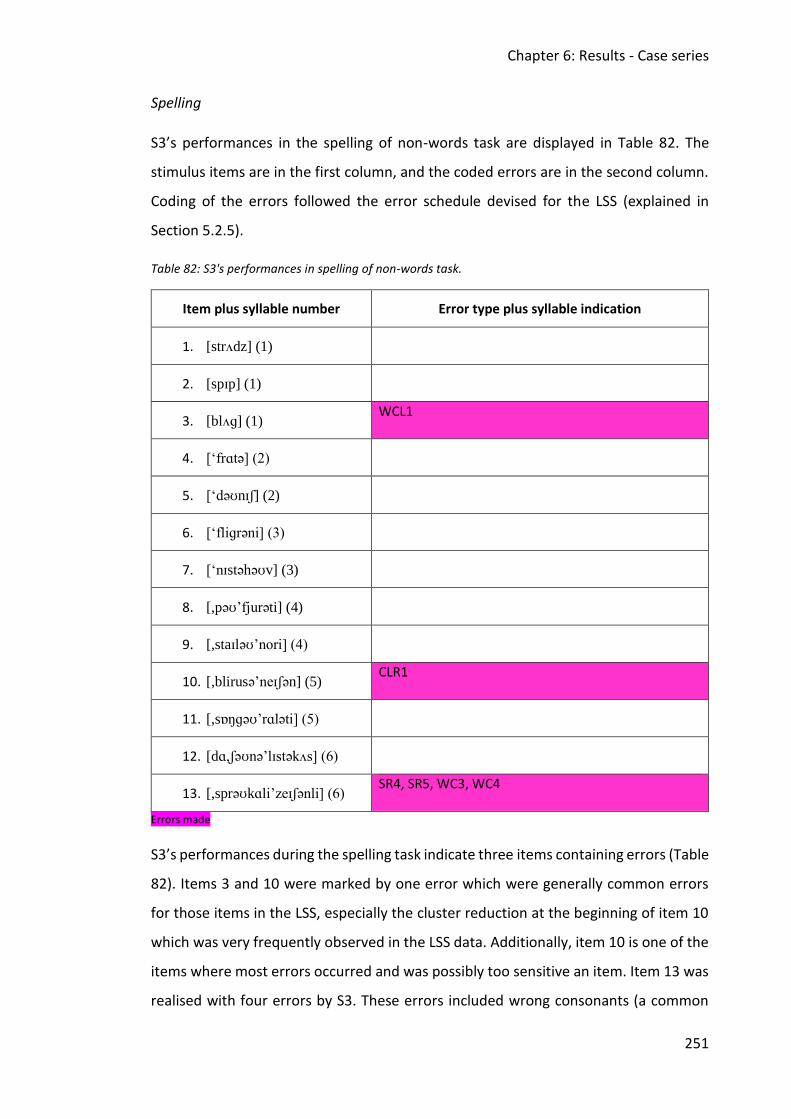
Chapter 6: Results - Case series
251
Spelling
S3’s performances in the spelling of non-words task are displayed in Table 82. The
stimulus items are in the first column, and the coded errors are in the second column.
Coding of the errors followed the error schedule devised for the LSS (explained in
Section 5.2.5).
Table 82: S3's performances in spelling of non-words task.
Item plus syllable number Error type plus syllable indication
1. [strʌdz] (1)
2. [spɪp] (1)
3. [blʌɡ] (1) WCL1
4. [‘frɑtə] (2)
5. [‘dəʊnɪʃ] (2)
6. [‘fliɡrəni] (3)
7. [‘nɪstəhəʊv] (3)
8. [,pəʊ’fjurəti] (4)
9. [,staɪləʊ’nori] (4)
10. [,blirusə’neɪʃən] (5) CLR1
11. [,sɒŋɡəʊ’rɑləti] (5)
12. [dɑ,ʃəʊnə’lɪstəkʌs] (6)
13. [,sprəʊkɑli’zeɪʃənli] (6) SR4, SR5, WC3, WC4
Errors made
S3’s performances during the spelling task indicate three items containing errors (Table
82). Items 3 and 10 were marked by one error which were generally common errors
for those items in the LSS, especially the cluster reduction at the beginning of item 10
which was very frequently observed in the LSS data. Additionally, item 10 is one of the
items where most errors occurred and was possibly too sensitive an item. Item 13 was
realised with four errors by S3. These errors included wrong consonants (a common
Chapter 6: Results - Case series
252
error in the LSS for item 15) and syllable reductions. Syllable reduction was also an error
made by LSS participants for item 15, but not as frequently as, for example, wrong
consonants. One could argue that those syllable reductions might be connected to S3’s
concerns about “mumbling” and “swallowing” word parts. However, this assumption
might be too speculative due to the fact that this error also occurred in the LSS data.
Nevertheless, it has been shown that if cluttering exists, written output can also be
affected (Ward, 2008).
6.3.3 Discussion
Using the new assessment tool, it was possible to produce a speech processing profile
for S3. Data presented for S3 generally showed accordance with average data for the
LSS. Yet, reaction time performances for some tasks, especially reading of non-words,
showed faster responses by S3 compared to the normative group. In contrast, accuracy
measures for the spoonerism with non-words task were slightly below the observed
average in the LSS.
Although generally no striking differences from the LSS norms were found, the
descriptive assessment data will be discussed in light of the accuracy and reaction times
variance observed and the additional interview data.
Firstly, S3’s less accurate performance in spoonerism with non-words might highlight a
possible processing deficit with phonological manipulation on the highest level (Allyn
& Burt, 1998). However, this difficulty then would only occur in tasks which do not
recruit lexical representations, since his performance on the spoonerism with real
words task was very close to the LSS average. Further investigation is needed to
develop and reject or accept this hypothesis. However, this pattern of performance
might be interpreted in light of existing research on stammering (Chapter 2). It has
been shown that people who stammer generally perform less accurately on tasks with
higher-level linguistic demands (Kleinow & Smith, 2000). The task spoonerism with
non-words brings complex linguistic demands, so S3’s performance is consistent with
these findings but, importantly, the tasks described in that study included lexical
representations whereas real words were not used in the spoonerism task discussed
here.
Chapter 6: Results - Case series
253
Data collected during S3’s interview indicated that he might think of himself as a
stammer-clutterer. Cluttering is described as a speech difficulty where a person speaks
rather quicker – than average with a sometimes irregular pace (LaSalle & Wolk, 2011).
Furthermore, clutter behaviours are characterised by syllable and consonant deletions
during speech (van Zaalen- op ’t Hof, Wijnen, & De Jonckere, 2009; Ward, 2008). In
fact, both characteristics were observed in S3’s performances during the speech
processing assessment, as well as a higher pace of articulation during the interview.
However, as consonant deletion and syllable reduction were also common errors made
by the LSS group across all tasks of the speech processing assessment, it remains
uncertain whether S3’s errors reflect possible cluttering behaviours. Furthermore, S3’s
fast speech could also be compared to his reaction time measures which were mostly
below average. Although reaction time measures the period of silence prior to a
participant giving an answer, S3’s test outcomes show that his responses were slightly
quicker than the norm. Hypothetically speaking, both reaction time outcomes and a
higher pace of speech indicate that S3’s performances might be of a quicker nature.
These measures are consistent with a stammer-clutterer’s typical profile, but firm
conclusions cannot be drawn without further investigation.
Taking the combination of interview and assessment outcomes of S3 into
consideration, firstly, S3 did not describe any specific sounds or words which would
precipitate a stammer, but he mentioned that he mainly experienced blocks and
repetitions. One block behaviour was observed during his performance of the speech
processing assessment. Furthermore, he indicated that he skipped two spoonerisms in
order to suppress an imminent stammering behaviour, and the data confirm this: there
were two ‘no realisation’ outcomes, one in each of the spoonerism tasks.
6.4 Case study 4
6.4.1 Interview data
This participant is a 23-year-old female journalism student and native English speaker.
She described her current stammer as a 3 on the severity scale (10=very severe).
However, this value would increase to 7-10 in situations where she wants to ”play being
Chapter 6: Results - Case series
254
silly” or is “trying to do impressions”, as well as when she is excited – where mostly the
stammer occurs at the start of a sentence.
She first started stammering at the age of three years and it then ceased at five years
of age. However, the stammer returned suddenly when she was 14 years old. On its
return, it was quite severe (rated 6) and then decreased to the current degree of
severity (3) over a period of 12 months.
S4 never received therapy for her stammer. During her childhood the stammer
resolved itself. Nowadays she uses her own strategies to handle the stammer (see
below).
S4 described different patterns in which her stammer occurs. It mostly happens on all
plosives, especially /k/, and the fricative /f/. It also manifests when she needs to ask
for attention, for example, ”Excuse me...” and when she talks to people she does not
know. Her stammering behaviours are described mainly as prolongations and
repetitions, however, during the interview, three natural blocks appeared and these
were followed by secondary behaviours (shaking head up and down quite heavily). She
also described that the most stammering behaviours occur when she is “crossed” (by
someone) and nearly always when she wants to say ”for fuck’s sake”.
S4 reported that the use of avoidance strategies is frequent. She mainly modifies at the
word level by exchanging words with synonyms, or modifying the whole sentence
structure. Sometimes she also uses filler phrases or laughs to gain time. In some
situations she also just ”gives up” and cannot ”be bothered talking anymore”. She
described that it would get her too annoyed and angry.
Despite this, S4 explained that her social life is hardly influenced by her stammer. In
informal settings she feels generally comfortable and ”lets it out” whenever a stammer
occurs (0 on severity scale 0-10). Nevertheless, she would sometimes “get cross” when
her boyfriend or her sister laugh about her, but mostly she would end up laughing with
them. By contrast, in more formal contexts, she adapts to situations by being quieter
and taking less part in activities, such as seminars at university (5 on severity scale 0-
10). When she needs to go to a bank, she would try to go with someone else, or avoid
going at all. She reports managing a lot of things online.
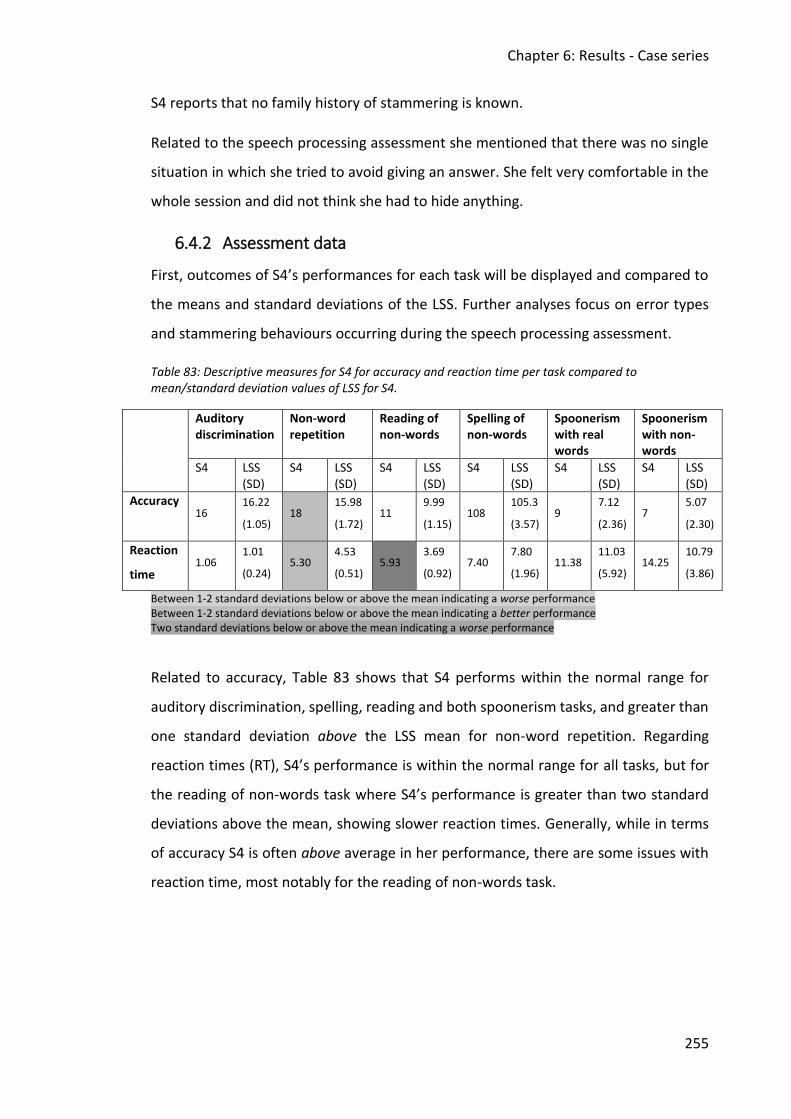
Chapter 6: Results - Case series
255
S4 reports that no family history of stammering is known.
Related to the speech processing assessment she mentioned that there was no single
situation in which she tried to avoid giving an answer. She felt very comfortable in the
whole session and did not think she had to hide anything.
6.4.2 Assessment data
First, outcomes of S4’s performances for each task will be displayed and compared to
the means and standard deviations of the LSS. Further analyses focus on error types
and stammering behaviours occurring during the speech processing assessment.
Table 83: Descriptive measures for S4 for accuracy and reaction time per task compared to mean/standard deviation values of LSS for S4.
Auditory discrimination
Non-word repetition
Reading of non-words
Spelling of non-words
Spoonerism with real words
Spoonerism with non-words
S4 LSS (SD)
S4 LSS (SD)
S4 LSS (SD)
S4 LSS (SD)
S4 LSS (SD)
S4 LSS (SD)
Accuracy
16
16.22
(1.05) 18
15.98
(1.72) 11
9.99
(1.15) 108
105.3
(3.57) 9
7.12
(2.36) 7
5.07
(2.30)
Reaction
time 1.06
1.01
(0.24) 5.30
4.53
(0.51) 5.93
3.69
(0.92) 7.40
7.80
(1.96) 11.38
11.03
(5.92) 14.25
10.79
(3.86)
Between 1-2 standard deviations below or above the mean indicating a worse performance Between 1-2 standard deviations below or above the mean indicating a better performance Two standard deviations below or above the mean indicating a worse performance
Related to accuracy, Table 83 shows that S4 performs within the normal range for
auditory discrimination, spelling, reading and both spoonerism tasks, and greater than
one standard deviation above the LSS mean for non-word repetition. Regarding
reaction times (RT), S4’s performance is within the normal range for all tasks, but for
the reading of non-words task where S4’s performance is greater than two standard
deviations above the mean, showing slower reaction times. Generally, while in terms
of accuracy S4 is often above average in her performance, there are some issues with
reaction time, most notably for the reading of non-words task.
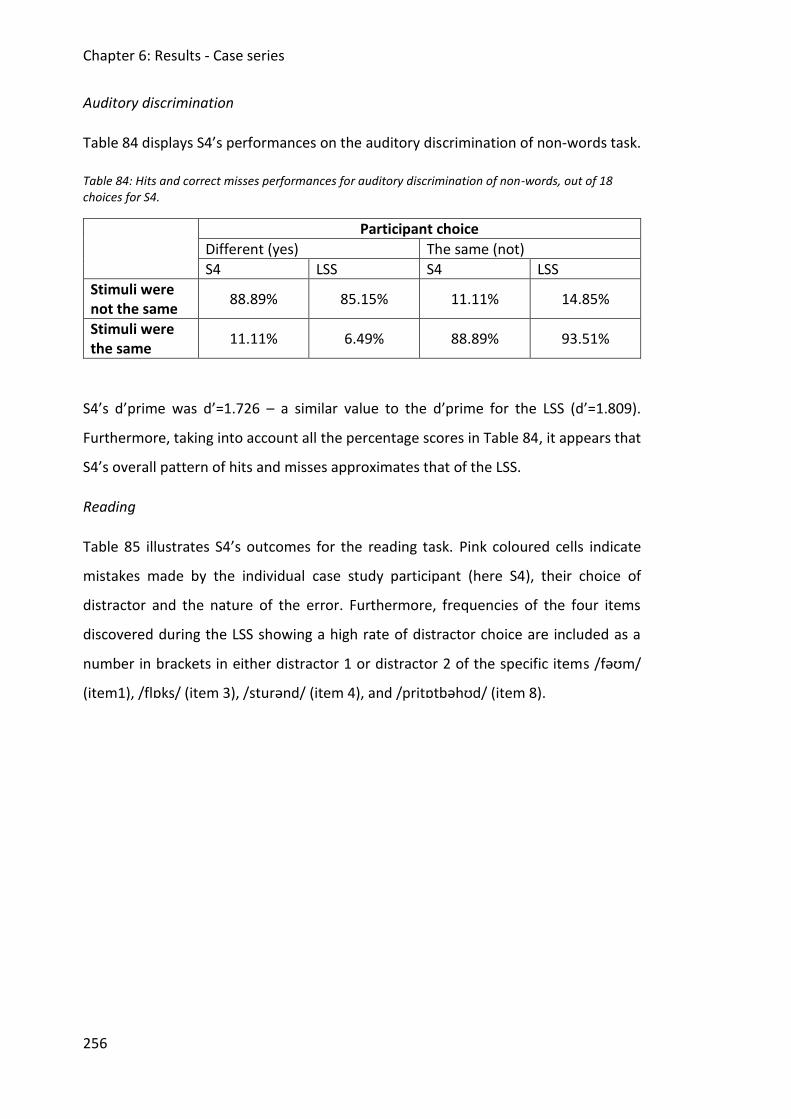
Chapter 6: Results - Case series
256
Auditory discrimination
Table 84 displays S4’s performances on the auditory discrimination of non-words task.
Table 84: Hits and correct misses performances for auditory discrimination of non-words, out of 18 choices for S4.
Participant choice
Different (yes) The same (not)
S4 LSS S4 LSS
Stimuli were not the same
88.89% 85.15% 11.11% 14.85%
Stimuli were the same
11.11% 6.49% 88.89% 93.51%
S4’s d’prime was d’=1.726 – a similar value to the d’prime for the LSS (d’=1.809).
Furthermore, taking into account all the percentage scores in Table 84, it appears that
S4’s overall pattern of hits and misses approximates that of the LSS.
Reading
Table 85 illustrates S4’s outcomes for the reading task. Pink coloured cells indicate
mistakes made by the individual case study participant (here S4), their choice of
distractor and the nature of the error. Furthermore, frequencies of the four items
discovered during the LSS showing a high rate of distractor choice are included as a
number in brackets in either distractor 1 or distractor 2 of the specific items /fəʊm/
(item1), /flɒks/ (item 3), /sturənd/ (item 4), and /pritɒtbəhʊd/ (item 8).
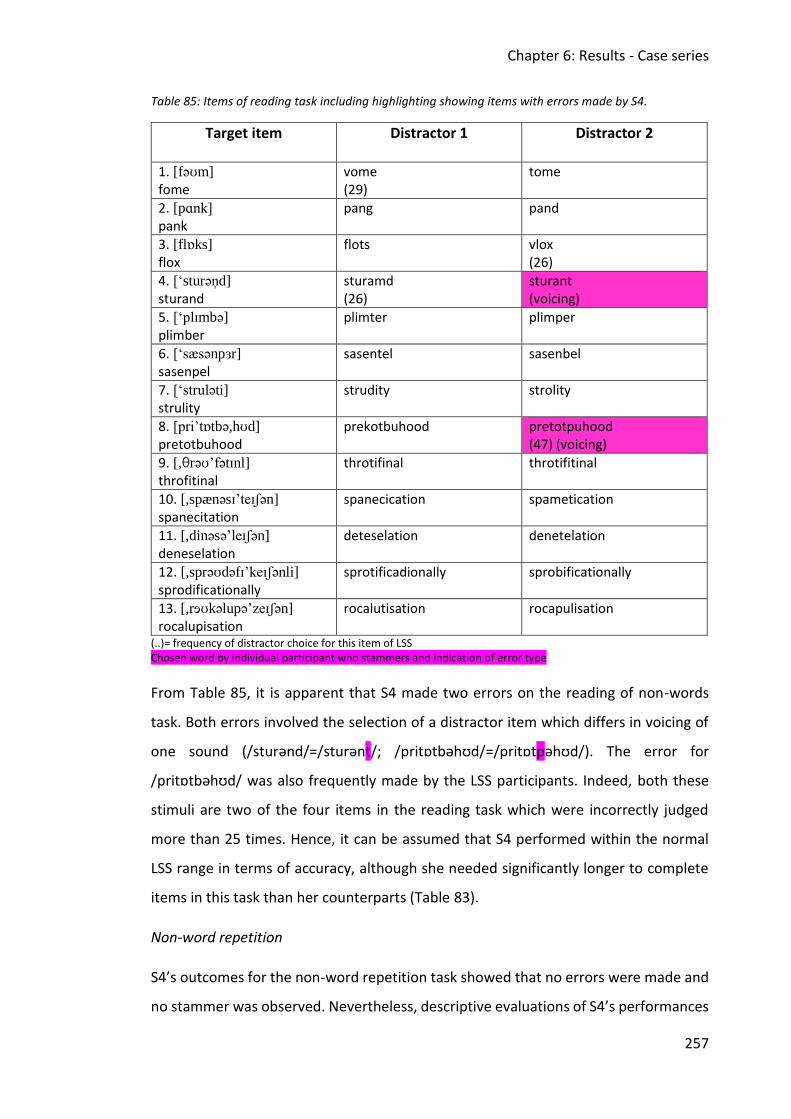
Chapter 6: Results - Case series
257
Table 85: Items of reading task including highlighting showing items with errors made by S4.
Target item Distractor 1
Distractor 2
1. [fəʊm]
fome vome (29)
tome
2. [pɑnk]
pank
pang pand
3. [flɒks] flox
flots vlox (26)
4. [‘sturən̩d] sturand
sturamd (26)
sturant (voicing)
5. [‘plɪmbə] plimber
plimter plimper
6. [‘sæsənpɜr] sasenpel
sasentel sasenbel
7. [‘struləti]
strulity
strudity
strolity
8. [pri’tɒtbə,hʊd] pretotbuhood
prekotbuhood
pretotpuhood (47) (voicing)
9. [,θrəʊ’fətɪnl] throfitinal
throtifinal
throtifitinal
10. [,spænəsɪ’teɪʃən]
spanecitation
spanecication spametication
11. [,dinəsə’leɪʃən]
deneselation
deteselation
denetelation
12. [,sprəʊdəfɪ’keɪʃənli]
sprodificationally
sprotificadionally sprobificationally
13. [,rɘʊkəlupə’zeɪʃən] rocalupisation
rocalutisation rocapulisation
(..)= frequency of distractor choice for this item of LSS Chosen word by individual participant who stammers and indication of error type
From Table 85, it is apparent that S4 made two errors on the reading of non-words
task. Both errors involved the selection of a distractor item which differs in voicing of
one sound (/sturənd/=/sturənt/; /pritɒtbəhʊd/=/pritɒtpəhʊd/). The error for
/pritɒtbəhʊd/ was also frequently made by the LSS participants. Indeed, both these
stimuli are two of the four items in the reading task which were incorrectly judged
more than 25 times. Hence, it can be assumed that S4 performed within the normal
LSS range in terms of accuracy, although she needed significantly longer to complete
items in this task than her counterparts (Table 83).
Non-word repetition
S4’s outcomes for the non-word repetition task showed that no errors were made and
no stammer was observed. Nevertheless, descriptive evaluations of S4’s performances
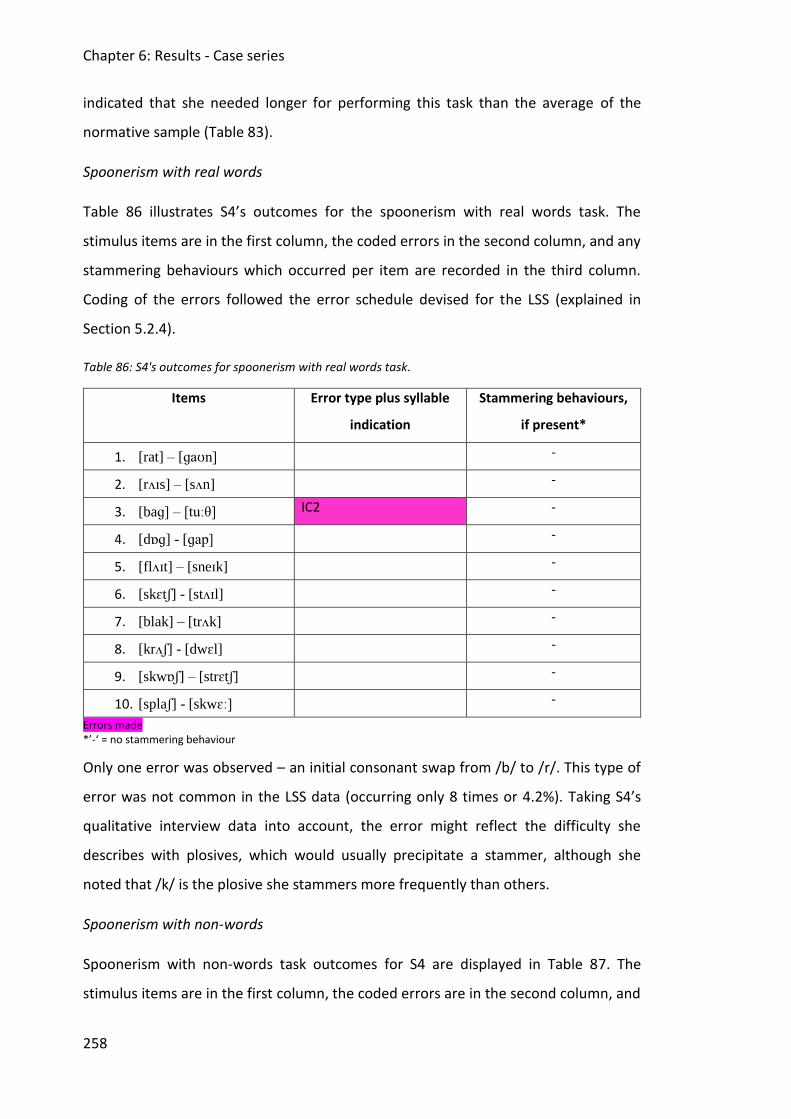
Chapter 6: Results - Case series
258
indicated that she needed longer for performing this task than the average of the
normative sample (Table 83).
Spoonerism with real words
Table 86 illustrates S4’s outcomes for the spoonerism with real words task. The
stimulus items are in the first column, the coded errors in the second column, and any
stammering behaviours which occurred per item are recorded in the third column.
Coding of the errors followed the error schedule devised for the LSS (explained in
Section 5.2.4).
Table 86: S4's outcomes for spoonerism with real words task.
Items Error type plus syllable
indication
Stammering behaviours,
if present*
1. [rat] – [ɡaʊn] -
2. [rʌɪs] – [sʌn] -
3. [baɡ] – [tuːθ] IC2 -
4. [dɒɡ] - [ɡap] -
5. [flʌɪt] – [sneɪk] -
6. [skɛtʃ] - [stʌɪl] -
7. [blak] – [trʌk] -
8. [krʌʃ] - [dwɛl] -
9. [skwɒʃ] – [strɛtʃ] -
10. [splaʃ] - [skwɛː] -
Errors made *’-‘ = no stammering behaviour
Only one error was observed – an initial consonant swap from /b/ to /r/. This type of
error was not common in the LSS data (occurring only 8 times or 4.2%). Taking S4’s
qualitative interview data into account, the error might reflect the difficulty she
describes with plosives, which would usually precipitate a stammer, although she
noted that /k/ is the plosive she stammers more frequently than others.
Spoonerism with non-words
Spoonerism with non-words task outcomes for S4 are displayed in Table 87. The
stimulus items are in the first column, the coded errors are in the second column, and
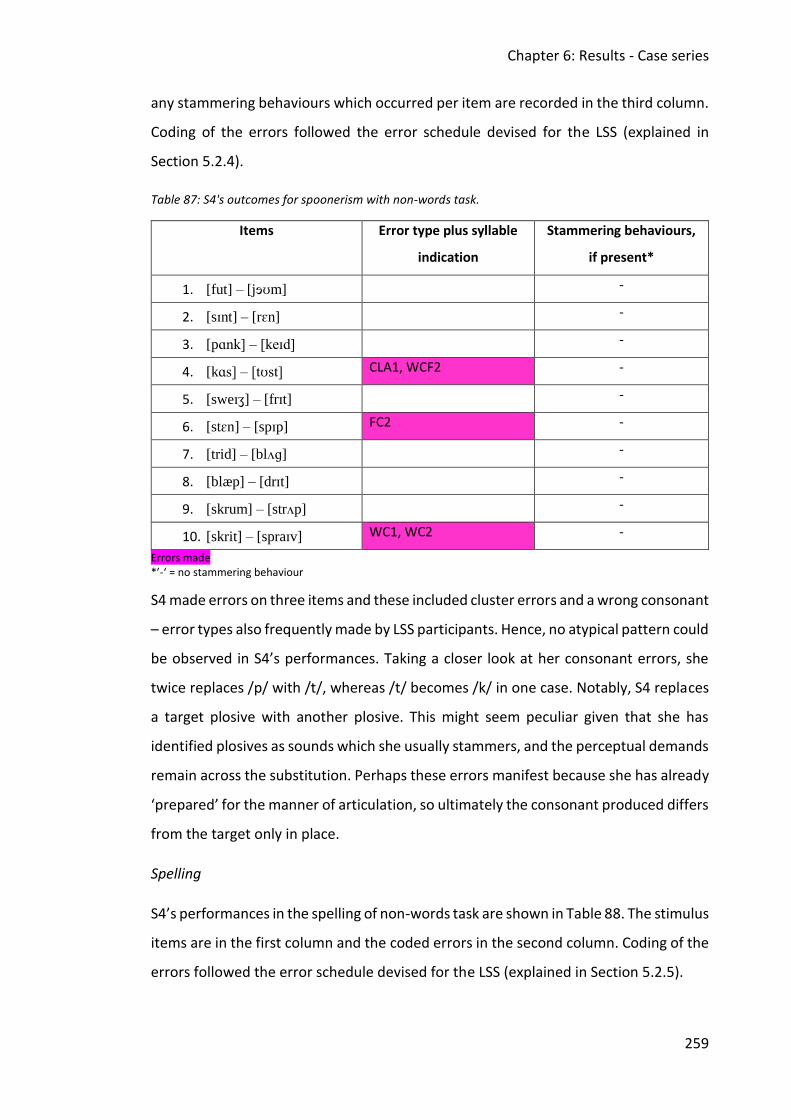
Chapter 6: Results - Case series
259
any stammering behaviours which occurred per item are recorded in the third column.
Coding of the errors followed the error schedule devised for the LSS (explained in
Section 5.2.4).
Table 87: S4's outcomes for spoonerism with non-words task.
Items Error type plus syllable
indication
Stammering behaviours,
if present*
1. [fut] – [jɘʊm] -
2. [sɪnt] – [rɛn] -
3. [pɑnk] – [keɪd] -
4. [kɑs] – [tʊst] CLA1, WCF2 -
5. [sweɪʒ] – [frɪt] -
6. [stɛn] – [spɪp] FC2 -
7. [trid] – [blʌɡ] -
8. [blæp] – [drɪt] -
9. [skrum] – [strʌp] -
10. [skrit] – [spraɪv] WC1, WC2 -
Errors made *’-‘ = no stammering behaviour
S4 made errors on three items and these included cluster errors and a wrong consonant
– error types also frequently made by LSS participants. Hence, no atypical pattern could
be observed in S4’s performances. Taking a closer look at her consonant errors, she
twice replaces /p/ with /t/, whereas /t/ becomes /k/ in one case. Notably, S4 replaces
a target plosive with another plosive. This might seem peculiar given that she has
identified plosives as sounds which she usually stammers, and the perceptual demands
remain across the substitution. Perhaps these errors manifest because she has already
‘prepared’ for the manner of articulation, so ultimately the consonant produced differs
from the target only in place.
Spelling
S4’s performances in the spelling of non-words task are shown in Table 88. The stimulus
items are in the first column and the coded errors in the second column. Coding of the
errors followed the error schedule devised for the LSS (explained in Section 5.2.5).
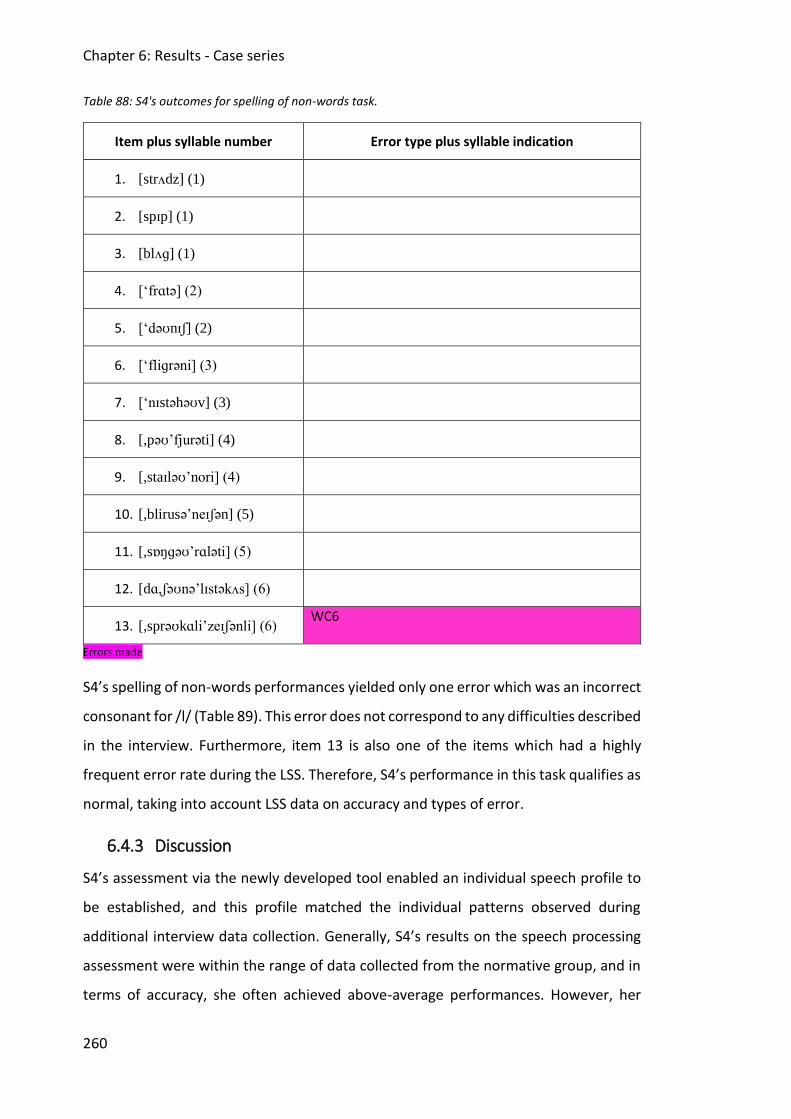
Chapter 6: Results - Case series
260
Table 88: S4's outcomes for spelling of non-words task.
Item plus syllable number Error type plus syllable indication
1. [strʌdz] (1)
2. [spɪp] (1)
3. [blʌɡ] (1)
4. [‘frɑtə] (2)
5. [‘dəʊnɪʃ] (2)
6. [‘fliɡrəni] (3)
7. [‘nɪstəhəʊv] (3)
8. [,pəʊ’fjurəti] (4)
9. [,staɪləʊ’nori] (4)
10. [,blirusə’neɪʃən] (5)
11. [,sɒŋɡəʊ’rɑləti] (5)
12. [dɑ,ʃəʊnə’lɪstəkʌs] (6)
13. [,sprəʊkɑli’zeɪʃənli] (6) WC6
Errors made
S4’s spelling of non-words performances yielded only one error which was an incorrect
consonant for /l/ (Table 89). This error does not correspond to any difficulties described
in the interview. Furthermore, item 13 is also one of the items which had a highly
frequent error rate during the LSS. Therefore, S4’s performance in this task qualifies as
normal, taking into account LSS data on accuracy and types of error.
6.4.3 Discussion
S4’s assessment via the newly developed tool enabled an individual speech profile to
be established, and this profile matched the individual patterns observed during
additional interview data collection. Generally, S4’s results on the speech processing
assessment were within the range of data collected from the normative group, and in
terms of accuracy, she often achieved above-average performances. However, her
Chapter 6: Results - Case series
261
reaction times indicated that she sometimes needed slightly longer than participants
in the LSS. This was particularly the case for the reading of non-words task.
Related to the longer reaction times for the non-word repetition task, it could be
suggested that S4 tried to avoid stammering. She might have used more time to
internally rehearse the target item before producing it (Bricker-Katz et al., 2009).
Nevertheless, this suggested extra time was not similarly observable in other output
tasks (spoonerisms and spelling). In contrast, the significantly slower outcomes for the
reading of non-words task would need further investigation. If the orthographic
component of this task had an influence on S4’s performances, a strikingly poorer
performance in the spelling task would be expected, but this was not observable.
Moreover, S4’s accuracy scores on this task were significantly better than the LSS’s
outcomes. Hence, the factors that influenced her reaction time on this input task
measures remain questionable. Though, S4’s significant longer reaction time needed
for the reading of non-words task could be highlighted by evidence about difficulties
with central auditory processing in people who stammer, given that these difficulties
occur during input processing (Beal et al., 2007).
In sum, no firm conclusions can be made about how S4’s speech processing profile
relates to her stammering. On the one hand, some of her reaction time outcomes might
indicate underlying difficulties related to stammering, but on the other hand such
difficulties were not consistently observed across all tasks of the assessment.
Related to S4’s stammering behaviours, no stammering was observed during the
speech processing assessment. Hence, data collected during the interview, in which S4
identified repetitions as her main stammering behaviour along with general difficulties
with plosives and /f/, could not be confirmed. Nevertheless, one error occurred which
could be consistent with a difficulty with plosives. Furthermore, S4 showed stammering
behaviours during the interview (which she herself recognised as stammering
behaviours), characterised by blocks (three times), rather than the repetitions and
prolongations that she described as her frequent stammering behaviours. However, S4
showed pronounced secondary behaviours during these three blocks. Secondary
behaviours often accompany the primary stammering behaviour and help to overcome
the individual instances of difficulty (Büchel & Sommer, 2004). Furthermore, these
Chapter 6: Results - Case series
262
secondary behaviours can modify the actual stammer behaviour (Wingate, 1964).
Hence, secondary behaviour can influence the appearance and characteristics of a
stammer to a great extent.
6.5 Case study 5
6.5.1 Interview data
This participant is a 23-year-old male history student and native English speaker.
S5 described his current stammer as a 3 on the severity scale (10=very severe). His
stammer first occurred at the age of four or five when he started learning to read. At
this time, his stammer was at least an 8. The severity lessened over two years and since
then the severity has been more constantly at a 3. S5 also reported that aside from his
stammer he also experiences dyslexia.
S5 explained that he had speech therapy, focusing only on his stammer, for a period of
18 months during which time he learned how to use physical as well as verbal
approaches to manage his stammer. This therapy took place during his teenage years.
He judged the therapy as very useful (10 on usefulness scale). Furthermore, he
mentioned that when his difficulties first began, he had a lot of pressure from his family
which aimed to motivate him to lose the stammer. He reported that he is sure that
”the stammer would not have manifested when this pressure were not there”. The
therapy S5 received was as a participant in a research study at King’s College in London.
He described a range of patterns in which his stammer occurs, but he eventually
needed to write them down in the interview as he could not produce the isolated
sounds. The sound combinations <str>, <mru>, <krus> and <p> are the patterns he
identified (The sound combination <mru> appears presumably mid word (e.g.
steamroom) or across words (e.g. same room) and might be difficult to spot in single
word testing). He described that his stammer mostly occurs in situations of pressure
for him, such as bars, pubs and restaurants (he wrote those down as well and there
was a spelling mistake on the interview protocol: restaurant became resturant). These
situations include fast-moving conversations and multiple speakers. Furthermore, the
background noise in those locations is disturbing to S5. He also described general
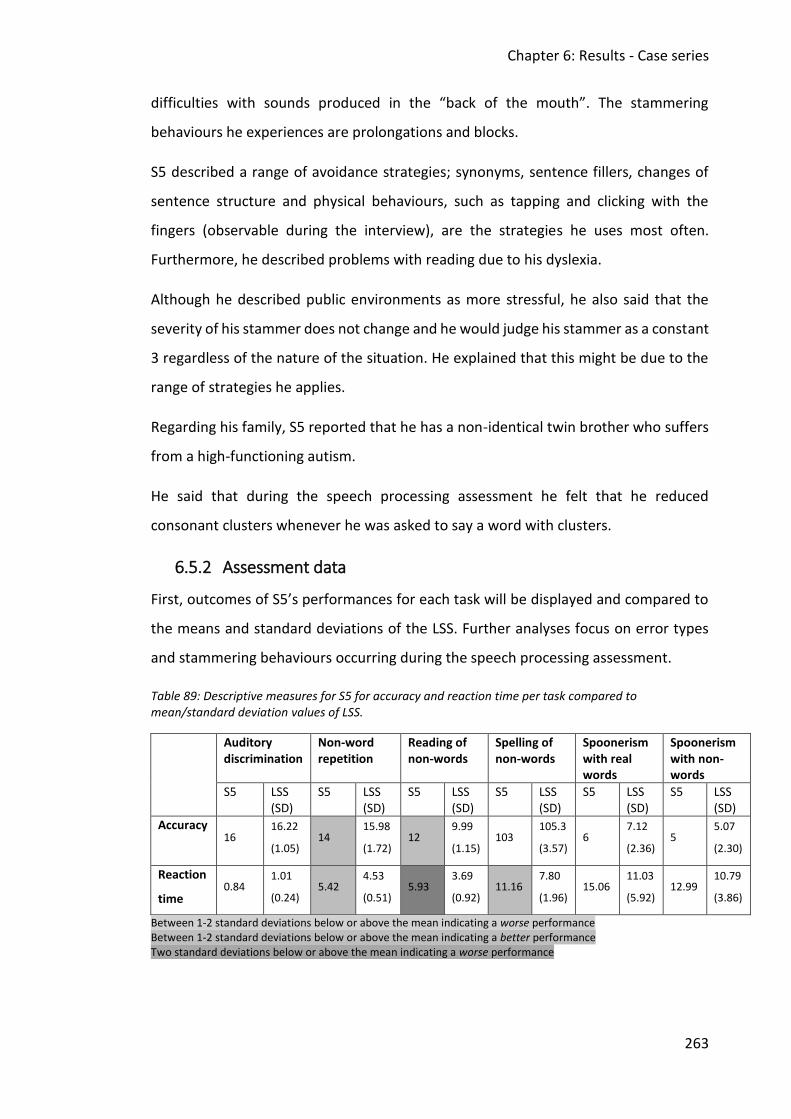
Chapter 6: Results - Case series
263
difficulties with sounds produced in the “back of the mouth”. The stammering
behaviours he experiences are prolongations and blocks.
S5 described a range of avoidance strategies; synonyms, sentence fillers, changes of
sentence structure and physical behaviours, such as tapping and clicking with the
fingers (observable during the interview), are the strategies he uses most often.
Furthermore, he described problems with reading due to his dyslexia.
Although he described public environments as more stressful, he also said that the
severity of his stammer does not change and he would judge his stammer as a constant
3 regardless of the nature of the situation. He explained that this might be due to the
range of strategies he applies.
Regarding his family, S5 reported that he has a non-identical twin brother who suffers
from a high-functioning autism.
He said that during the speech processing assessment he felt that he reduced
consonant clusters whenever he was asked to say a word with clusters.
6.5.2 Assessment data
First, outcomes of S5’s performances for each task will be displayed and compared to
the means and standard deviations of the LSS. Further analyses focus on error types
and stammering behaviours occurring during the speech processing assessment.
Table 89: Descriptive measures for S5 for accuracy and reaction time per task compared to mean/standard deviation values of LSS.
Auditory discrimination
Non-word repetition
Reading of non-words
Spelling of non-words
Spoonerism with real words
Spoonerism with non-words
S5 LSS (SD)
S5 LSS (SD)
S5 LSS (SD)
S5 LSS (SD)
S5 LSS (SD)
S5 LSS (SD)
Accuracy
16
16.22
(1.05) 14
15.98
(1.72) 12
9.99
(1.15) 103
105.3
(3.57) 6
7.12
(2.36) 5
5.07
(2.30)
Reaction
time 0.84
1.01
(0.24) 5.42
4.53
(0.51) 5.93
3.69
(0.92) 11.16
7.80
(1.96) 15.06
11.03
(5.92) 12.99
10.79
(3.86)
Between 1-2 standard deviations below or above the mean indicating a worse performance Between 1-2 standard deviations below or above the mean indicating a better performance Two standard deviations below or above the mean indicating a worse performance
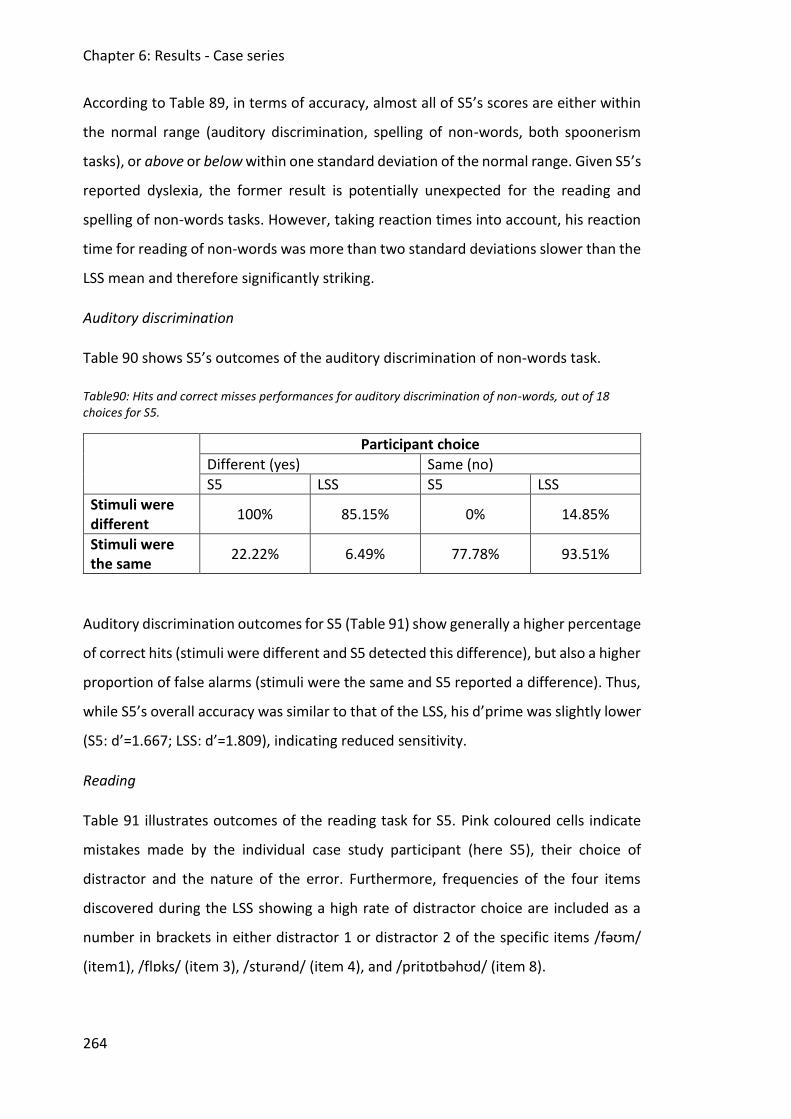
Chapter 6: Results - Case series
264
According to Table 89, in terms of accuracy, almost all of S5’s scores are either within
the normal range (auditory discrimination, spelling of non-words, both spoonerism
tasks), or above or below within one standard deviation of the normal range. Given S5’s
reported dyslexia, the former result is potentially unexpected for the reading and
spelling of non-words tasks. However, taking reaction times into account, his reaction
time for reading of non-words was more than two standard deviations slower than the
LSS mean and therefore significantly striking.
Auditory discrimination
Table 90 shows S5’s outcomes of the auditory discrimination of non-words task.
Table90: Hits and correct misses performances for auditory discrimination of non-words, out of 18 choices for S5.
Participant choice
Different (yes) Same (no)
S5 LSS S5 LSS
Stimuli were different
100% 85.15% 0% 14.85%
Stimuli were the same
22.22% 6.49% 77.78% 93.51%
Auditory discrimination outcomes for S5 (Table 91) show generally a higher percentage
of correct hits (stimuli were different and S5 detected this difference), but also a higher
proportion of false alarms (stimuli were the same and S5 reported a difference). Thus,
while S5’s overall accuracy was similar to that of the LSS, his d’prime was slightly lower
(S5: d’=1.667; LSS: d’=1.809), indicating reduced sensitivity.
Reading
Table 91 illustrates outcomes of the reading task for S5. Pink coloured cells indicate
mistakes made by the individual case study participant (here S5), their choice of
distractor and the nature of the error. Furthermore, frequencies of the four items
discovered during the LSS showing a high rate of distractor choice are included as a
number in brackets in either distractor 1 or distractor 2 of the specific items /fəʊm/
(item1), /flɒks/ (item 3), /sturənd/ (item 4), and /pritɒtbəhʊd/ (item 8).
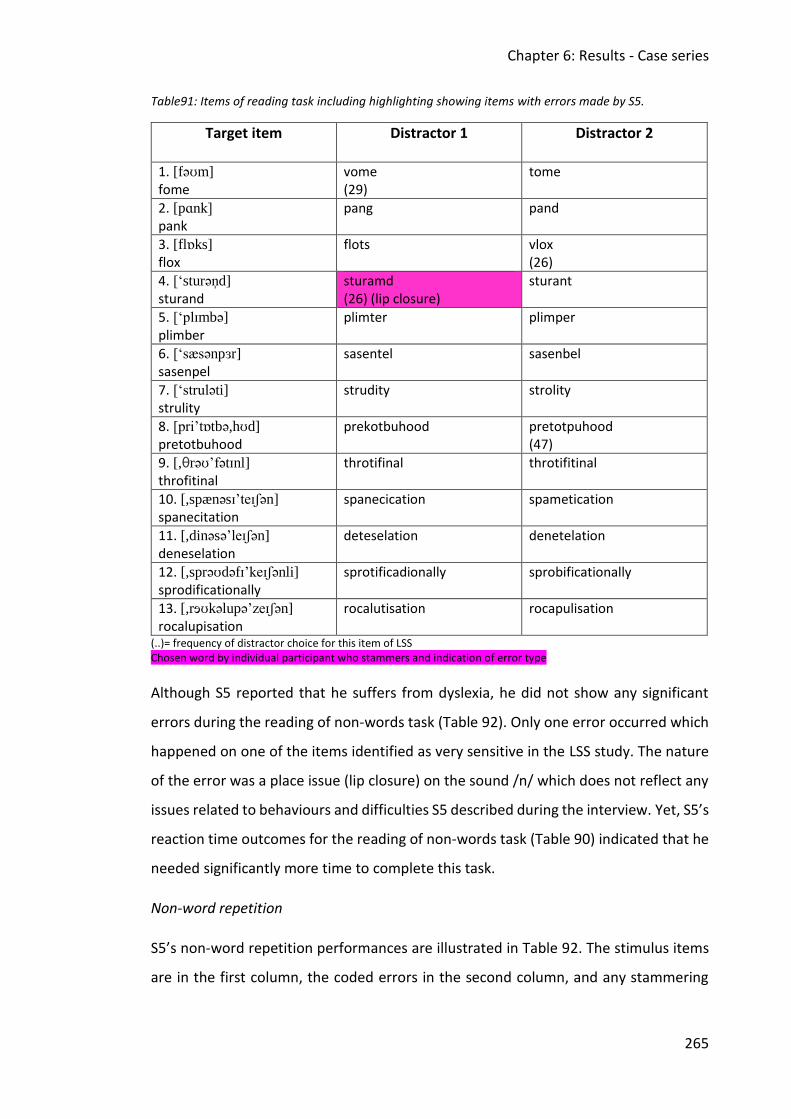
Chapter 6: Results - Case series
265
Table91: Items of reading task including highlighting showing items with errors made by S5.
Target item Distractor 1
Distractor 2
1. [fəʊm]
fome vome (29)
tome
2. [pɑnk]
pank
pang pand
3. [flɒks] flox
flots vlox (26)
4. [‘sturən̩d] sturand
sturamd (26) (lip closure)
sturant
5. [‘plɪmbə] plimber
plimter plimper
6. [‘sæsənpɜr] sasenpel
sasentel sasenbel
7. [‘struləti]
strulity
strudity
strolity
8. [pri’tɒtbə,hʊd] pretotbuhood
prekotbuhood
pretotpuhood (47)
9. [,θrəʊ’fətɪnl] throfitinal
throtifinal
throtifitinal
10. [,spænəsɪ’teɪʃən]
spanecitation
spanecication spametication
11. [,dinəsə’leɪʃən]
deneselation
deteselation
denetelation
12. [,sprəʊdəfɪ’keɪʃənli]
sprodificationally
sprotificadionally sprobificationally
13. [,rɘʊkəlupə’zeɪʃən] rocalupisation
rocalutisation rocapulisation
(..)= frequency of distractor choice for this item of LSS Chosen word by individual participant who stammers and indication of error type
Although S5 reported that he suffers from dyslexia, he did not show any significant
errors during the reading of non-words task (Table 92). Only one error occurred which
happened on one of the items identified as very sensitive in the LSS study. The nature
of the error was a place issue (lip closure) on the sound /n/ which does not reflect any
issues related to behaviours and difficulties S5 described during the interview. Yet, S5’s
reaction time outcomes for the reading of non-words task (Table 90) indicated that he
needed significantly more time to complete this task.
Non-word repetition
S5’s non-word repetition performances are illustrated in Table 92. The stimulus items
are in the first column, the coded errors in the second column, and any stammering
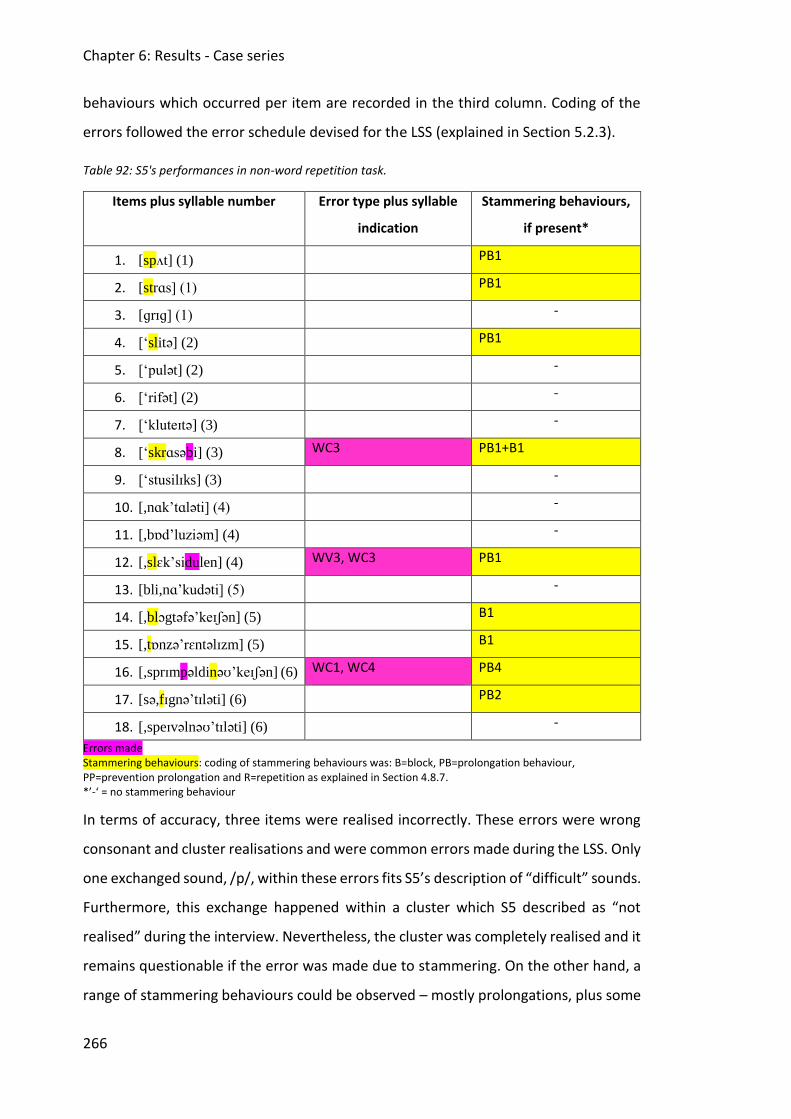
Chapter 6: Results - Case series
266
behaviours which occurred per item are recorded in the third column. Coding of the
errors followed the error schedule devised for the LSS (explained in Section 5.2.3).
Table 92: S5's performances in non-word repetition task.
Items plus syllable number Error type plus syllable
indication
Stammering behaviours,
if present*
1. [spʌt] (1) PB1
2. [strɑs] (1) PB1
3. [ɡrɪɡ] (1) -
4. [‘slitə] (2) PB1
5. [‘pulət] (2) -
6. [‘rifət] (2) -
7. [‘kluteɪtə] (3) -
8. [‘skrɑsəbi] (3) WC3 PB1+B1
9. [‘stusilɪks] (3) -
10. [,nɑk’tɑləti] (4) -
11. [,bɒd’luziəm] (4)
-
12. [,slɛk’sidulen] (4) WV3, WC3 PB1
13. [bli,nɑ’kudəti] (5) -
14. [,blɔgtəfə’keɪʃən] (5) B1
15. [,tɒnzə’rɛntəlɪzm] (5)
B1
16. [,sprɪmpəldinəʊ’keɪʃən] (6) WC1, WC4 PB4
17. [sə,fɪgnə’tɪləti] (6)
PB2
18. [,speɪvəlnəʊ’tɪləti] (6) -
Errors made Stammering behaviours: coding of stammering behaviours was: B=block, PB=prolongation behaviour, PP=prevention prolongation and R=repetition as explained in Section 4.8.7. *’-‘ = no stammering behaviour
In terms of accuracy, three items were realised incorrectly. These errors were wrong
consonant and cluster realisations and were common errors made during the LSS. Only
one exchanged sound, /p/, within these errors fits S5’s description of “difficult” sounds.
Furthermore, this exchange happened within a cluster which S5 described as “not
realised” during the interview. Nevertheless, the cluster was completely realised and it
remains questionable if the error was made due to stammering. On the other hand, a
range of stammering behaviours could be observed – mostly prolongations, plus some
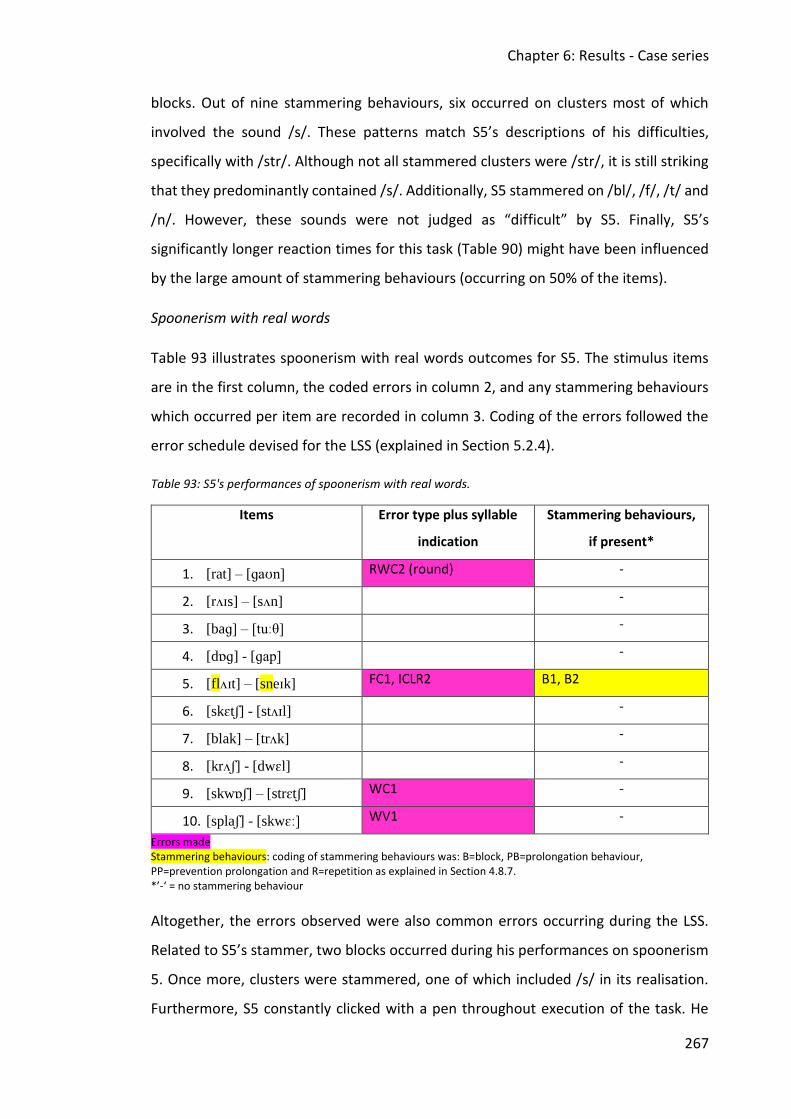
Chapter 6: Results - Case series
267
blocks. Out of nine stammering behaviours, six occurred on clusters most of which
involved the sound /s/. These patterns match S5’s descriptions of his difficulties,
specifically with /str/. Although not all stammered clusters were /str/, it is still striking
that they predominantly contained /s/. Additionally, S5 stammered on /bl/, /f/, /t/ and
/n/. However, these sounds were not judged as “difficult” by S5. Finally, S5’s
significantly longer reaction times for this task (Table 90) might have been influenced
by the large amount of stammering behaviours (occurring on 50% of the items).
Spoonerism with real words
Table 93 illustrates spoonerism with real words outcomes for S5. The stimulus items
are in the first column, the coded errors in column 2, and any stammering behaviours
which occurred per item are recorded in column 3. Coding of the errors followed the
error schedule devised for the LSS (explained in Section 5.2.4).
Table 93: S5's performances of spoonerism with real words.
Items Error type plus syllable
indication
Stammering behaviours,
if present*
1. [rat] – [ɡaʊn] RWC2 (round) -
2. [rʌɪs] – [sʌn] -
3. [baɡ] – [tuːθ]
-
4. [dɒɡ] - [ɡap] -
5. [flʌɪt] – [sneɪk] FC1, ICLR2 B1, B2
6. [skɛtʃ] - [stʌɪl] -
7. [blak] – [trʌk] -
8. [krʌʃ] - [dwɛl] -
9. [skwɒʃ] – [strɛtʃ] WC1 -
10. [splaʃ] - [skwɛː] WV1 -
Errors made Stammering behaviours: coding of stammering behaviours was: B=block, PB=prolongation behaviour, PP=prevention prolongation and R=repetition as explained in Section 4.8.7. *’-‘ = no stammering behaviour
Altogether, the errors observed were also common errors occurring during the LSS.
Related to S5’s stammer, two blocks occurred during his performances on spoonerism
5. Once more, clusters were stammered, one of which included /s/ in its realisation.
Furthermore, S5 constantly clicked with a pen throughout execution of the task. He
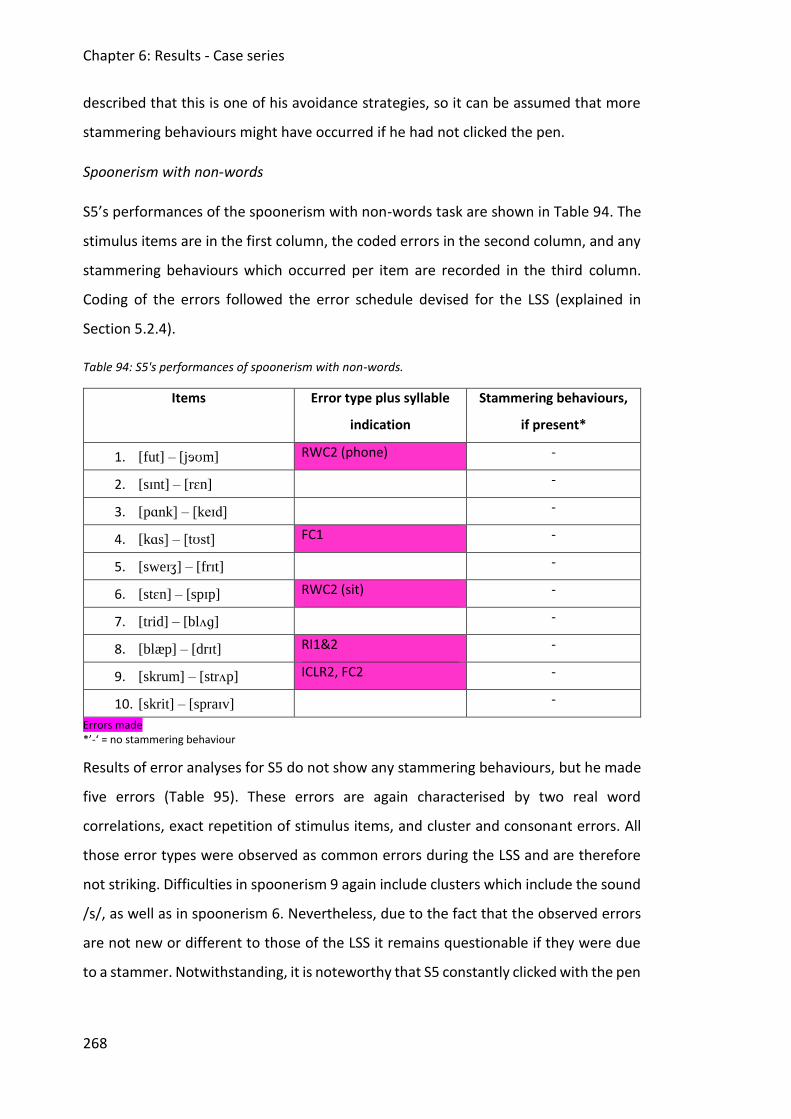
Chapter 6: Results - Case series
268
described that this is one of his avoidance strategies, so it can be assumed that more
stammering behaviours might have occurred if he had not clicked the pen.
Spoonerism with non-words
S5’s performances of the spoonerism with non-words task are shown in Table 94. The
stimulus items are in the first column, the coded errors in the second column, and any
stammering behaviours which occurred per item are recorded in the third column.
Coding of the errors followed the error schedule devised for the LSS (explained in
Section 5.2.4).
Table 94: S5's performances of spoonerism with non-words.
Items Error type plus syllable
indication
Stammering behaviours,
if present*
1. [fut] – [jɘʊm] RWC2 (phone) -
2. [sɪnt] – [rɛn] -
3. [pɑnk] – [keɪd] -
4. [kɑs] – [tʊst] FC1 -
5. [sweɪʒ] – [frɪt]
-
6. [stɛn] – [spɪp] RWC2 (sit) -
7. [trid] – [blʌɡ]
-
8. [blæp] – [drɪt] RI1&2 -
9. [skrum] – [strʌp] ICLR2, FC2 -
10. [skrit] – [spraɪv]
-
Errors made *’-‘ = no stammering behaviour
Results of error analyses for S5 do not show any stammering behaviours, but he made
five errors (Table 95). These errors are again characterised by two real word
correlations, exact repetition of stimulus items, and cluster and consonant errors. All
those error types were observed as common errors during the LSS and are therefore
not striking. Difficulties in spoonerism 9 again include clusters which include the sound
/s/, as well as in spoonerism 6. Nevertheless, due to the fact that the observed errors
are not new or different to those of the LSS it remains questionable if they were due
to a stammer. Notwithstanding, it is noteworthy that S5 constantly clicked with the pen
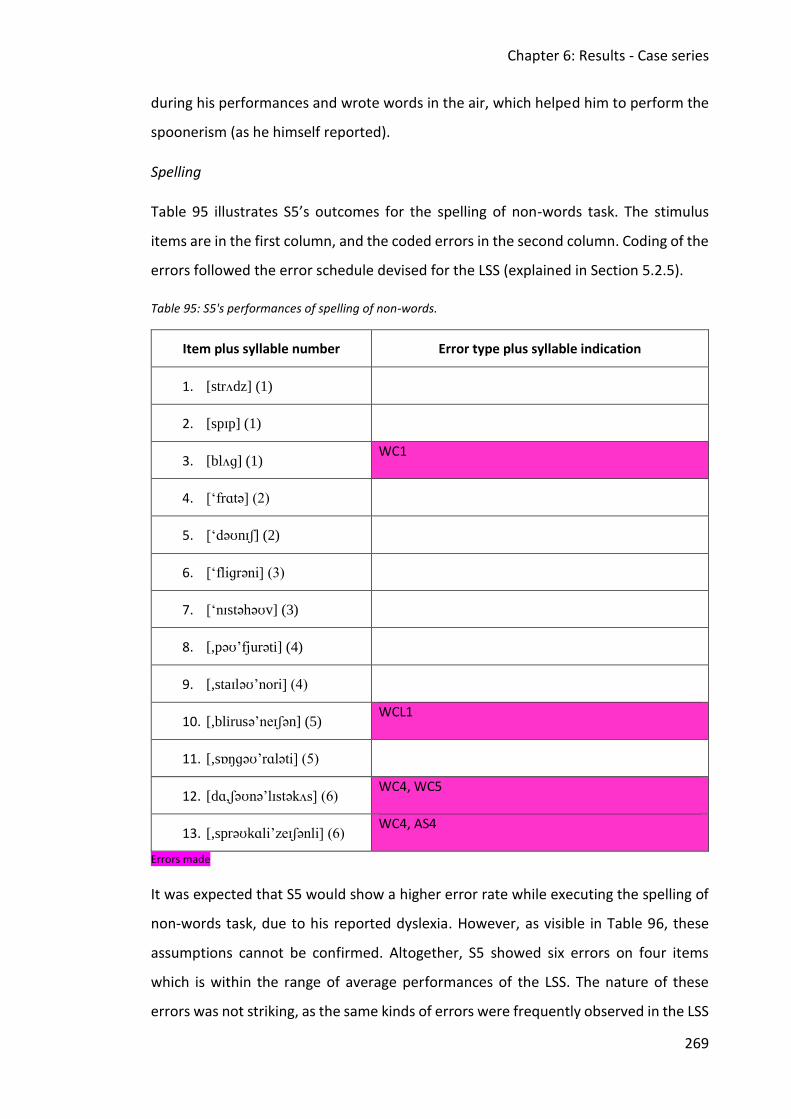
Chapter 6: Results - Case series
269
during his performances and wrote words in the air, which helped him to perform the
spoonerism (as he himself reported).
Spelling
Table 95 illustrates S5’s outcomes for the spelling of non-words task. The stimulus
items are in the first column, and the coded errors in the second column. Coding of the
errors followed the error schedule devised for the LSS (explained in Section 5.2.5).
Table 95: S5's performances of spelling of non-words.
Item plus syllable number Error type plus syllable indication
1. [strʌdz] (1)
2. [spɪp] (1)
3. [blʌɡ] (1) WC1
4. [‘frɑtə] (2)
5. [‘dəʊnɪʃ] (2)
6. [‘fliɡrəni] (3)
7. [‘nɪstəhəʊv] (3)
8. [,pəʊ’fjurəti] (4)
9. [,staɪləʊ’nori] (4)
10. [,blirusə’neɪʃən] (5) WCL1
11. [,sɒŋɡəʊ’rɑləti] (5)
12. [dɑ,ʃəʊnə’lɪstəkʌs] (6) WC4, WC5
13. [,sprəʊkɑli’zeɪʃənli] (6) WC4, AS4
Errors made
It was expected that S5 would show a higher error rate while executing the spelling of
non-words task, due to his reported dyslexia. However, as visible in Table 96, these
assumptions cannot be confirmed. Altogether, S5 showed six errors on four items
which is within the range of average performances of the LSS. The nature of these
errors was not striking, as the same kinds of errors were frequently observed in the LSS
Chapter 6: Results - Case series
270
data. Nevertheless, his reaction time outcomes (Table 90) indicated that he needed
significantly longer to perform this task.
6.5.3 Discussion
An individual speech profile could be established for S5 using the new speech
processing assessment and a semi-structured interview. In summary, S5 generally
performs within the range of data collected for the LSS in relation to accuracy, with
slightly less accuracy in non-word repetition and superior accuracy in reading of non-
words. Regarding reaction times, S5 manifested significantly longer reaction times in
the reading of non-words task.. Error types made across the assessment overlapped
with error types made during the LSS. Stammering was observed during the interview
and during the verbal output tasks of the speech processing assessment.
Furthermore, interview data were observed to be consistent with descriptive
assessment outcomes considering S5’s stammering characteristics, especially in the
non-word repetition task. Moreover, related to S5’s described dyslexia, results of the
speech processing assessment indicated significantly longer reaction times for S5 for
tasks using orthographic modalities.
S5 reported having dyslexia in the interview. Hence, it was expected that frequent
errors would be observed during reading and spelling of non-words performances. This
expectation could not be confirmed as S5 performed within the average accuracy range
of the LSS in both tasks. The speech processing assessment might not be sensitive
enough to discover dyslexic features, however, more research is needed to confirm this
assumption. Nevertheless, the reaction time variable may have signalled some issues,
with both literacy tasks taking significantly longer to perform (more than two standard
deviations slower than the LSS mean). Hence, the reaction time measurement may be
a variable sensitive to adult literacy difficulties. Furthermore, descriptions of literacy
development define disadvantages of approaching new words that are not previously
saved in one’s speech processing system and lead to faulty written output (Frith, 1985;
Litt & Nation, 2014). Thus, S5’s outcomes could support these described disadvantages
as more time was needed for performing tasks with ‘new words’ (here non-words).
Chapter 6: Results - Case series
271
Considering the longer reaction times for the non-word repetition task, it could be
suggested that S5’s performances were influenced by the large amount of occurring
stammering behaviours (50%). Research, also from earlier decades, discovered that
stammerers need more time to perform speech output tasks (Alfonso et al., 1987;
Bloodstein & Bernstein Ratner, 2008). Hence, the longer time S5 needed could be
explained, yet no significantly striking reaction times were observed during both
spoonerism tasks which include speech output as a measurement as well.
Specific consonants,consonants clusters, and sound combinations of interest for S5
were <str>, <mru>, <krus> and <p> (were presented in written form by S5) for
triggering stammering behaviours, as described during the interview. Difficulties
described on these specific sounds could partly be observed. Firstly, all observed
behaviours were characterised by either a prolongation or a block, as expected based
on the interview data. Secondly, most of those behaviours happened on clusters which
were named as “not realised” by S5. It is known that the more complex the phonetic
values of a word (consonant versus consonant cluster), the more they lead to occurring
stammering behaviours in adults (Howell, Au-Yeung, Yaruss, & Eldridge, 2006). Hence,
S5’s described difficulties seem to be common behaviours in adults who stammer.
Nevertheless, he fully produced the clusters, although he stated the opposite.
Finally, S5 reported during the interview that he used specific avoidance strategies
during the assessment completion. Indeed, avoidance strategies were observed in both
spoonerism tasks. The constant clicking of a pen was described as a strategy to
overcome stammer. Although S5 could not directly avoid a stammer, since the items
were fixed and could not be exchanged, he showed common secondary behaviour.
Stammerers often develop strategies which physically help them to overcome a
stammer (Guitar, 2013). The amount of stammering behaviours during these tasks
might have been much greater if S5 did not use his avoidance strategy.
Chapter 6: Results - Case series
272
6.6 Case study 6
6.6.1 Interview data
This participant is a 24-year-old male journalism student and native English speaker.
S6 described his current stammer as a 3 on the severity scale out of 10 (10=very
severe). This value, however, would increase up to 6-7 when he has to speak on the
phone to somebody unknown, as well as in “rapid transaction” situations and when he
cannot escape situations (“put on the spot”).
He was a late talker and supposedly started talking at the age of four. At that time he
started speaking with a stammer with a severity of 5-6. The stammer then increased
up to 9 in and throughout primary school. During secondary school, his severity was
between 4.5 and 7.5. Within the 12 months before the current interview he felt that
his stammer was constantly at the level of a 3. He described that his stammer ruled his
identity completely from the age of six to 19. He explained the variations in severity
were due to a combination of “not knowing how to cope and therapy luck or rather no
luck”.
He was first treated in primary school with the Lidcombe programme (Jones, Onslow,
Harrison, & Packman, 2000). He described the usefulness of the programme as a 3 out
of 10 (10=very useful) – he felt that the therapy actually increased his stammer
occurrence and he did not find it helpful. After that he avoided going to therapy and
tried to solve the “problem” himself. Finally, he entered therapy again which used van
Riper`s stuttering modification as a base (van Riper, 1982), and the treatment was
mostly psychological using a non-avoidance approach. This actually helped him “very
much” (10 on a usefulness scale) and he judges his severity as 3 since then. Another
approach he tried for himself was playing in a drama class. Whenever in a role, he did
not stammer. Furthermore, he explained as a strategy that he tried to hold his “social
circle as small as possible” and “hardly made any new friends during school time and
at university”.
Most of his stammering behaviour would occur on /st/ and generally with the “roof of
your mouth sounds”. When he was younger he had difficulties with /g/, /p/ and /b/.
The stammer would mostly occur as prolongations.
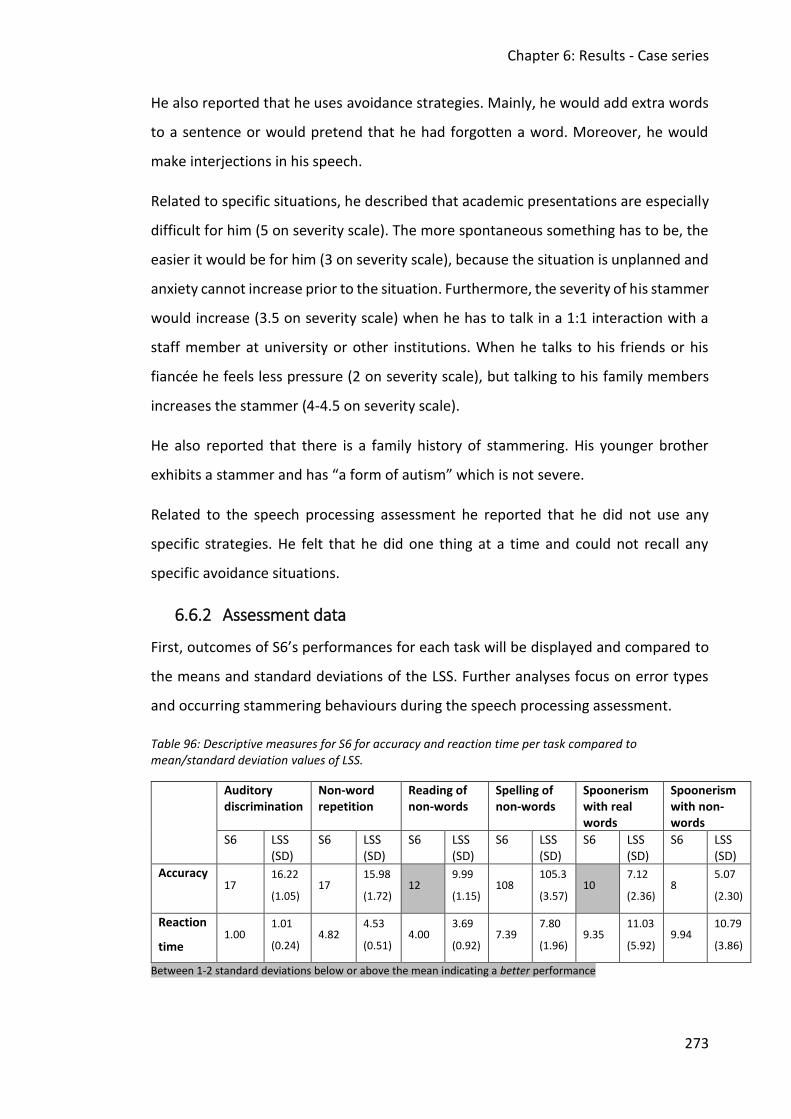
Chapter 6: Results - Case series
273
He also reported that he uses avoidance strategies. Mainly, he would add extra words
to a sentence or would pretend that he had forgotten a word. Moreover, he would
make interjections in his speech.
Related to specific situations, he described that academic presentations are especially
difficult for him (5 on severity scale). The more spontaneous something has to be, the
easier it would be for him (3 on severity scale), because the situation is unplanned and
anxiety cannot increase prior to the situation. Furthermore, the severity of his stammer
would increase (3.5 on severity scale) when he has to talk in a 1:1 interaction with a
staff member at university or other institutions. When he talks to his friends or his
fiancée he feels less pressure (2 on severity scale), but talking to his family members
increases the stammer (4-4.5 on severity scale).
He also reported that there is a family history of stammering. His younger brother
exhibits a stammer and has “a form of autism” which is not severe.
Related to the speech processing assessment he reported that he did not use any
specific strategies. He felt that he did one thing at a time and could not recall any
specific avoidance situations.
6.6.2 Assessment data
First, outcomes of S6’s performances for each task will be displayed and compared to
the means and standard deviations of the LSS. Further analyses focus on error types
and occurring stammering behaviours during the speech processing assessment.
Table 96: Descriptive measures for S6 for accuracy and reaction time per task compared to mean/standard deviation values of LSS.
Auditory discrimination
Non-word repetition
Reading of non-words
Spelling of non-words
Spoonerism with real words
Spoonerism with non-words
S6 LSS (SD)
S6 LSS (SD)
S6 LSS (SD)
S6 LSS (SD)
S6 LSS (SD)
S6 LSS (SD)
Accuracy
17
16.22
(1.05) 17
15.98
(1.72) 12
9.99
(1.15) 108
105.3
(3.57) 10
7.12
(2.36) 8
5.07
(2.30)
Reaction
time 1.00
1.01
(0.24) 4.82
4.53
(0.51) 4.00
3.69
(0.92) 7.39
7.80
(1.96) 9.35
11.03
(5.92) 9.94
10.79
(3.86)
Between 1-2 standard deviations below or above the mean indicating a better performance
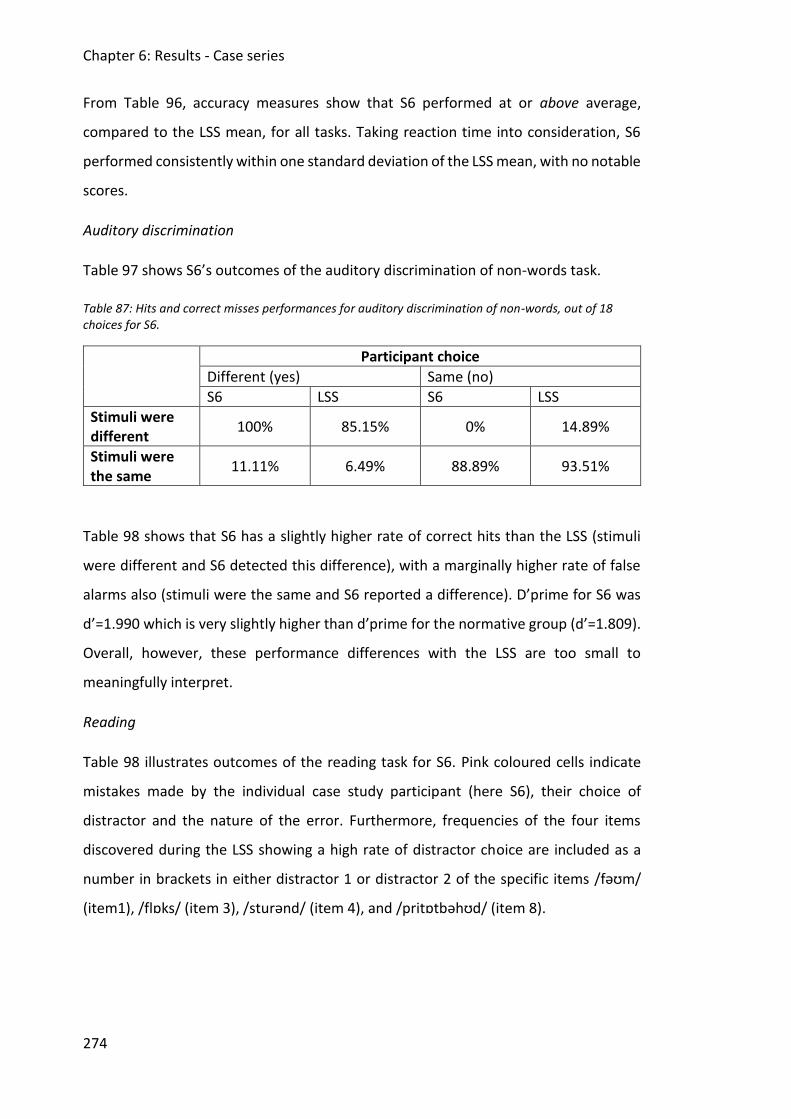
Chapter 6: Results - Case series
274
From Table 96, accuracy measures show that S6 performed at or above average,
compared to the LSS mean, for all tasks. Taking reaction time into consideration, S6
performed consistently within one standard deviation of the LSS mean, with no notable
scores.
Auditory discrimination
Table 97 shows S6’s outcomes of the auditory discrimination of non-words task.
Table 87: Hits and correct misses performances for auditory discrimination of non-words, out of 18 choices for S6.
Participant choice
Different (yes) Same (no)
S6 LSS S6 LSS
Stimuli were different
100% 85.15% 0% 14.89%
Stimuli were the same
11.11% 6.49% 88.89% 93.51%
Table 98 shows that S6 has a slightly higher rate of correct hits than the LSS (stimuli
were different and S6 detected this difference), with a marginally higher rate of false
alarms also (stimuli were the same and S6 reported a difference). D’prime for S6 was
d’=1.990 which is very slightly higher than d’prime for the normative group (d’=1.809).
Overall, however, these performance differences with the LSS are too small to
meaningfully interpret.
Reading
Table 98 illustrates outcomes of the reading task for S6. Pink coloured cells indicate
mistakes made by the individual case study participant (here S6), their choice of
distractor and the nature of the error. Furthermore, frequencies of the four items
discovered during the LSS showing a high rate of distractor choice are included as a
number in brackets in either distractor 1 or distractor 2 of the specific items /fəʊm/
(item1), /flɒks/ (item 3), /sturənd/ (item 4), and /pritɒtbəhʊd/ (item 8).
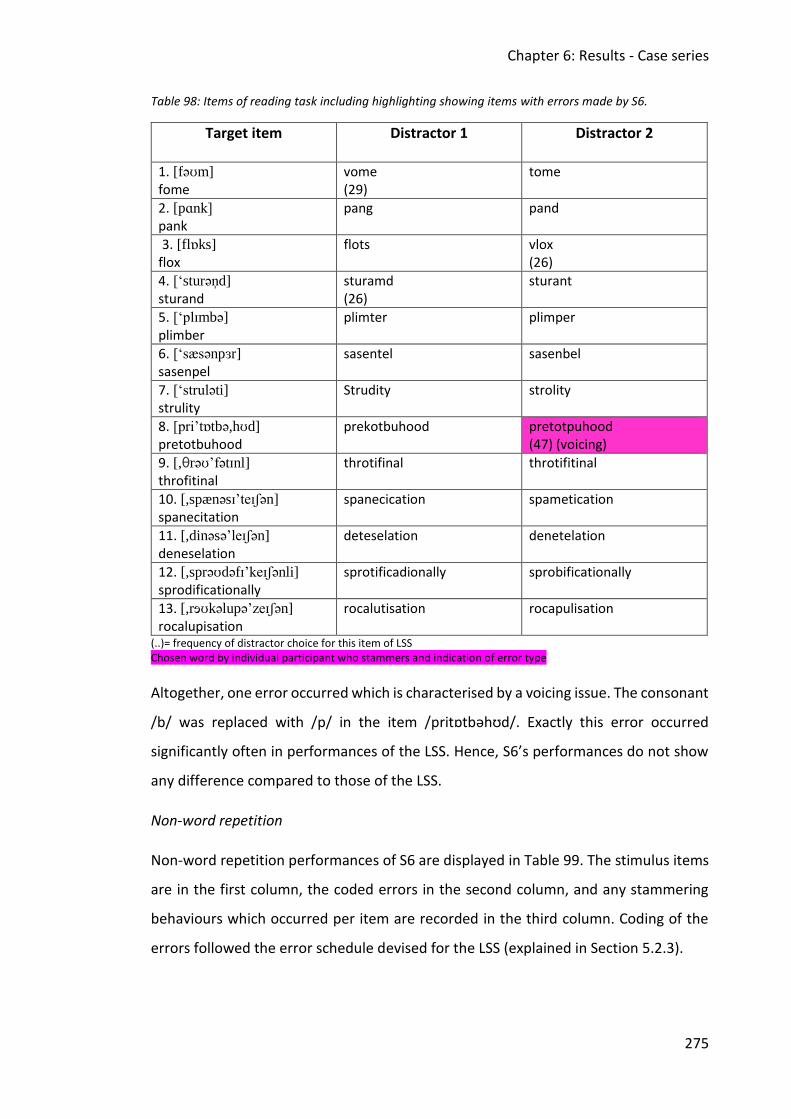
Chapter 6: Results - Case series
275
Table 98: Items of reading task including highlighting showing items with errors made by S6.
Target item Distractor 1
Distractor 2
1. [fəʊm]
fome vome (29)
tome
2. [pɑnk]
pank
pang pand
3. [flɒks] flox
flots vlox (26)
4. [‘sturən̩d] sturand
sturamd (26)
sturant
5. [‘plɪmbə] plimber
plimter plimper
6. [‘sæsənpɜr] sasenpel
sasentel sasenbel
7. [‘struləti]
strulity
Strudity
strolity
8. [pri’tɒtbə,hʊd] pretotbuhood
prekotbuhood
pretotpuhood (47) (voicing)
9. [,θrəʊ’fətɪnl] throfitinal
throtifinal
throtifitinal
10. [,spænəsɪ’teɪʃən]
spanecitation
spanecication spametication
11. [,dinəsə’leɪʃən]
deneselation
deteselation
denetelation
12. [,sprəʊdəfɪ’keɪʃənli]
sprodificationally
sprotificadionally sprobificationally
13. [,rɘʊkəlupə’zeɪʃən] rocalupisation
rocalutisation rocapulisation
(..)= frequency of distractor choice for this item of LSS Chosen word by individual participant who stammers and indication of error type
Altogether, one error occurred which is characterised by a voicing issue. The consonant
/b/ was replaced with /p/ in the item /pritɒtbəhʊd/. Exactly this error occurred
significantly often in performances of the LSS. Hence, S6’s performances do not show
any difference compared to those of the LSS.
Non-word repetition
Non-word repetition performances of S6 are displayed in Table 99. The stimulus items
are in the first column, the coded errors in the second column, and any stammering
behaviours which occurred per item are recorded in the third column. Coding of the
errors followed the error schedule devised for the LSS (explained in Section 5.2.3).
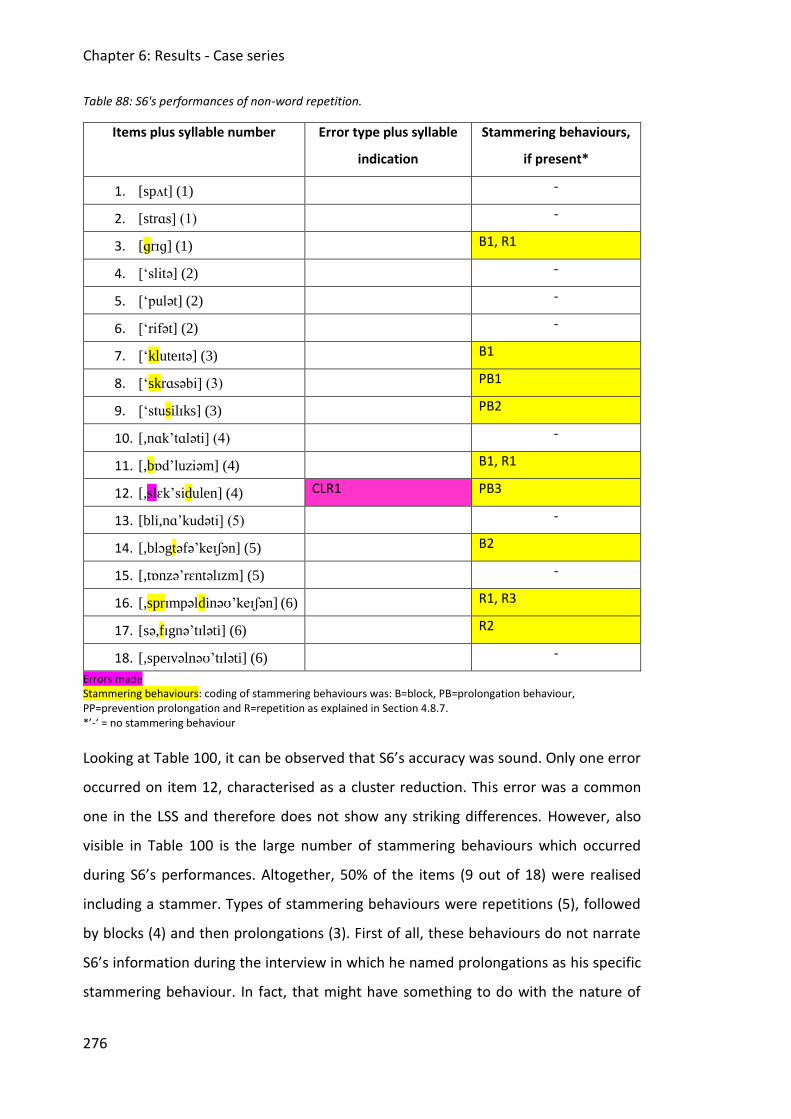
Chapter 6: Results - Case series
276
Table 88: S6's performances of non-word repetition.
Items plus syllable number Error type plus syllable
indication
Stammering behaviours,
if present*
1. [spʌt] (1) -
2. [strɑs] (1) -
3. [ɡrɪɡ] (1) B1, R1
4. [‘slitə] (2) -
5. [‘pulət] (2) -
6. [‘rifət] (2) -
7. [‘kluteɪtə] (3) B1
8. [‘skrɑsəbi] (3) PB1
9. [‘stusilɪks] (3) PB2
10. [,nɑk’tɑləti] (4) -
11. [,bɒd’luziəm] (4) B1, R1
12. [,slɛk’sidulen] (4) CLR1 PB3
13. [bli,nɑ’kudəti] (5) -
14. [,blɔgtəfə’keɪʃən] (5) B2
15. [,tɒnzə’rɛntəlɪzm] (5) -
16. [,sprɪmpəldinəʊ’keɪʃən] (6) R1, R3
17. [sə,fɪgnə’tɪləti] (6) R2
18. [,speɪvəlnəʊ’tɪləti] (6) -
Errors made Stammering behaviours: coding of stammering behaviours was: B=block, PB=prolongation behaviour, PP=prevention prolongation and R=repetition as explained in Section 4.8.7. *’-‘ = no stammering behaviour
Looking at Table 100, it can be observed that S6’s accuracy was sound. Only one error
occurred on item 12, characterised as a cluster reduction. This error was a common
one in the LSS and therefore does not show any striking differences. However, also
visible in Table 100 is the large number of stammering behaviours which occurred
during S6’s performances. Altogether, 50% of the items (9 out of 18) were realised
including a stammer. Types of stammering behaviours were repetitions (5), followed
by blocks (4) and then prolongations (3). First of all, these behaviours do not narrate
S6’s information during the interview in which he named prolongations as his specific
stammering behaviour. In fact, that might have something to do with the nature of
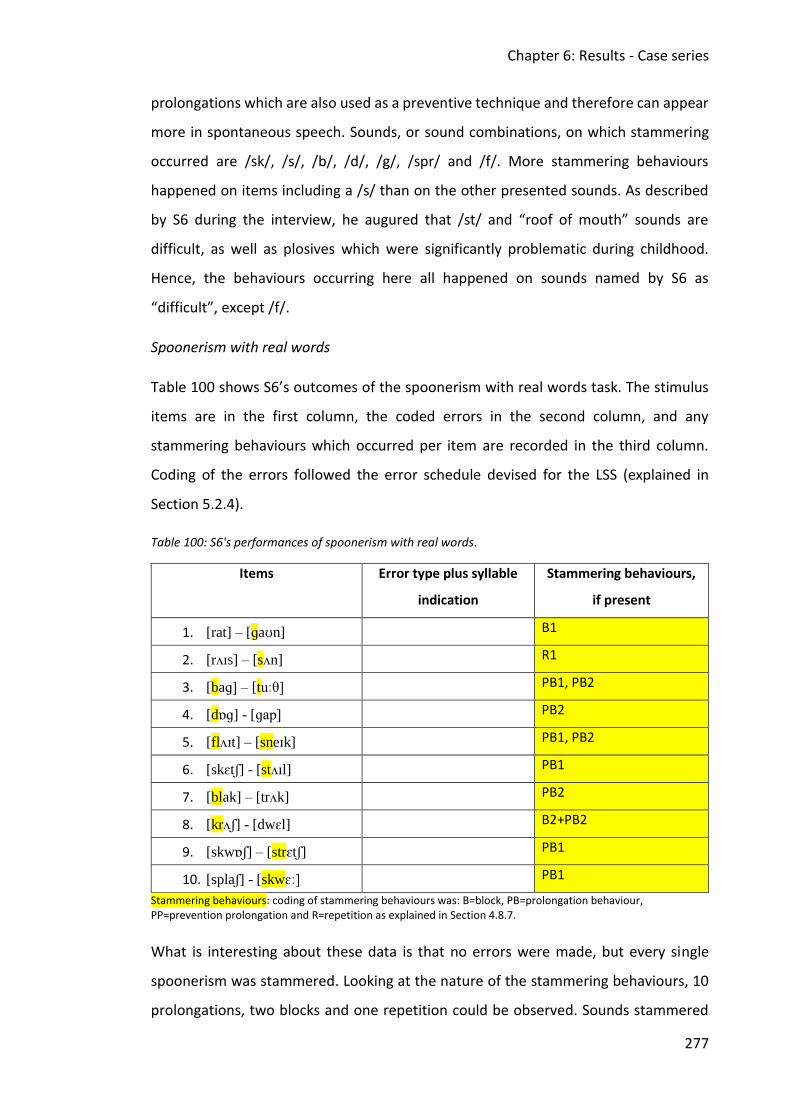
Chapter 6: Results - Case series
277
prolongations which are also used as a preventive technique and therefore can appear
more in spontaneous speech. Sounds, or sound combinations, on which stammering
occurred are /sk/, /s/, /b/, /d/, /g/, /spr/ and /f/. More stammering behaviours
happened on items including a /s/ than on the other presented sounds. As described
by S6 during the interview, he augured that /st/ and “roof of mouth” sounds are
difficult, as well as plosives which were significantly problematic during childhood.
Hence, the behaviours occurring here all happened on sounds named by S6 as
“difficult”, except /f/.
Spoonerism with real words
Table 100 shows S6’s outcomes of the spoonerism with real words task. The stimulus
items are in the first column, the coded errors in the second column, and any
stammering behaviours which occurred per item are recorded in the third column.
Coding of the errors followed the error schedule devised for the LSS (explained in
Section 5.2.4).
Table 100: S6's performances of spoonerism with real words.
Items Error type plus syllable
indication
Stammering behaviours,
if present
1. [rat] – [ɡaʊn] B1
2. [rʌɪs] – [sʌn] R1
3. [baɡ] – [tuːθ] PB1, PB2
4. [dɒɡ] - [ɡap] PB2
5. [flʌɪt] – [sneɪk] PB1, PB2
6. [skɛtʃ] - [stʌɪl] PB1
7. [blak] – [trʌk] PB2
8. [krʌʃ] - [dwɛl] B2+PB2
9. [skwɒʃ] – [strɛtʃ] PB1
10. [splaʃ] - [skwɛː] PB1
Stammering behaviours: coding of stammering behaviours was: B=block, PB=prolongation behaviour, PP=prevention prolongation and R=repetition as explained in Section 4.8.7.
What is interesting about these data is that no errors were made, but every single
spoonerism was stammered. Looking at the nature of the stammering behaviours, 10
prolongations, two blocks and one repetition could be observed. Sounds stammered
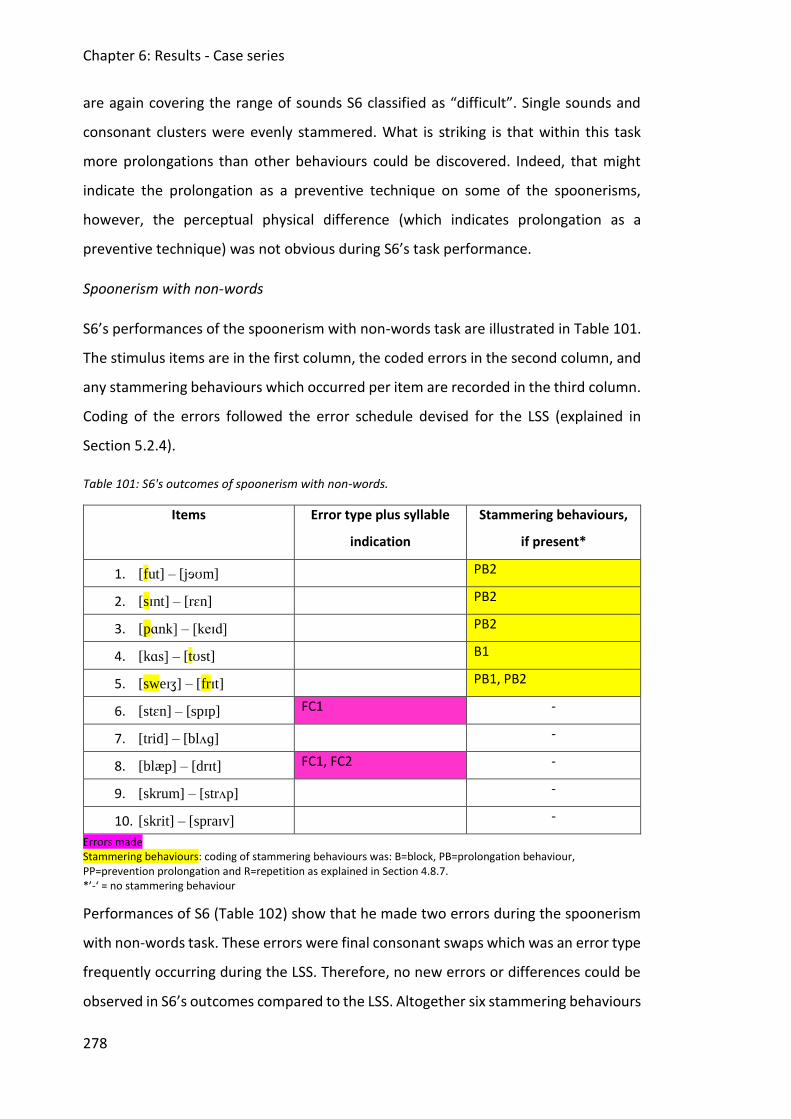
Chapter 6: Results - Case series
278
are again covering the range of sounds S6 classified as “difficult”. Single sounds and
consonant clusters were evenly stammered. What is striking is that within this task
more prolongations than other behaviours could be discovered. Indeed, that might
indicate the prolongation as a preventive technique on some of the spoonerisms,
however, the perceptual physical difference (which indicates prolongation as a
preventive technique) was not obvious during S6’s task performance.
Spoonerism with non-words
S6’s performances of the spoonerism with non-words task are illustrated in Table 101.
The stimulus items are in the first column, the coded errors in the second column, and
any stammering behaviours which occurred per item are recorded in the third column.
Coding of the errors followed the error schedule devised for the LSS (explained in
Section 5.2.4).
Table 101: S6's outcomes of spoonerism with non-words.
Items Error type plus syllable
indication
Stammering behaviours,
if present*
1. [fut] – [jɘʊm] PB2
2. [sɪnt] – [rɛn] PB2
3. [pɑnk] – [keɪd] PB2
4. [kɑs] – [tʊst] B1
5. [sweɪʒ] – [frɪt]
PB1, PB2
6. [stɛn] – [spɪp] FC1 -
7. [trid] – [blʌɡ] -
8. [blæp] – [drɪt] FC1, FC2 -
9. [skrum] – [strʌp] -
10. [skrit] – [spraɪv] -
Errors made Stammering behaviours: coding of stammering behaviours was: B=block, PB=prolongation behaviour, PP=prevention prolongation and R=repetition as explained in Section 4.8.7. *’-‘ = no stammering behaviour
Performances of S6 (Table 102) show that he made two errors during the spoonerism
with non-words task. These errors were final consonant swaps which was an error type
frequently occurring during the LSS. Therefore, no new errors or differences could be
observed in S6’s outcomes compared to the LSS. Altogether six stammering behaviours
Chapter 6: Results - Case series
279
were included in his performance. Those behaviours were five prolongations and one
block on sounds classified as “difficult” by S6. Interestingly, S6 stammered less during
this spoonerism task than the one with real words. The prolongations were probably
used as preventive techniques, but it remains unclear as no perceptual tension change
was noticed and the non-word items were unknown and therefore not programmed in
his lexicon. Prolongation as a preventive technique is sometimes used for familiar
words on which a stammer could occur (dependent on the individual) (Guitar, 2013).
This fact could also support the generally smaller number of occurring stammering
behaviours or preventive techniques of S6 in the spoonerism with non-words task, as
non-words were unknown.
Spelling
Table 102 shows S6’s outcomes of the spelling of non-word task. The stimulus items
are in the first column and the coded errors in the second column. Coding of the errors
followed the error schedule devised for the LSS (explained in Section 5.2.5).
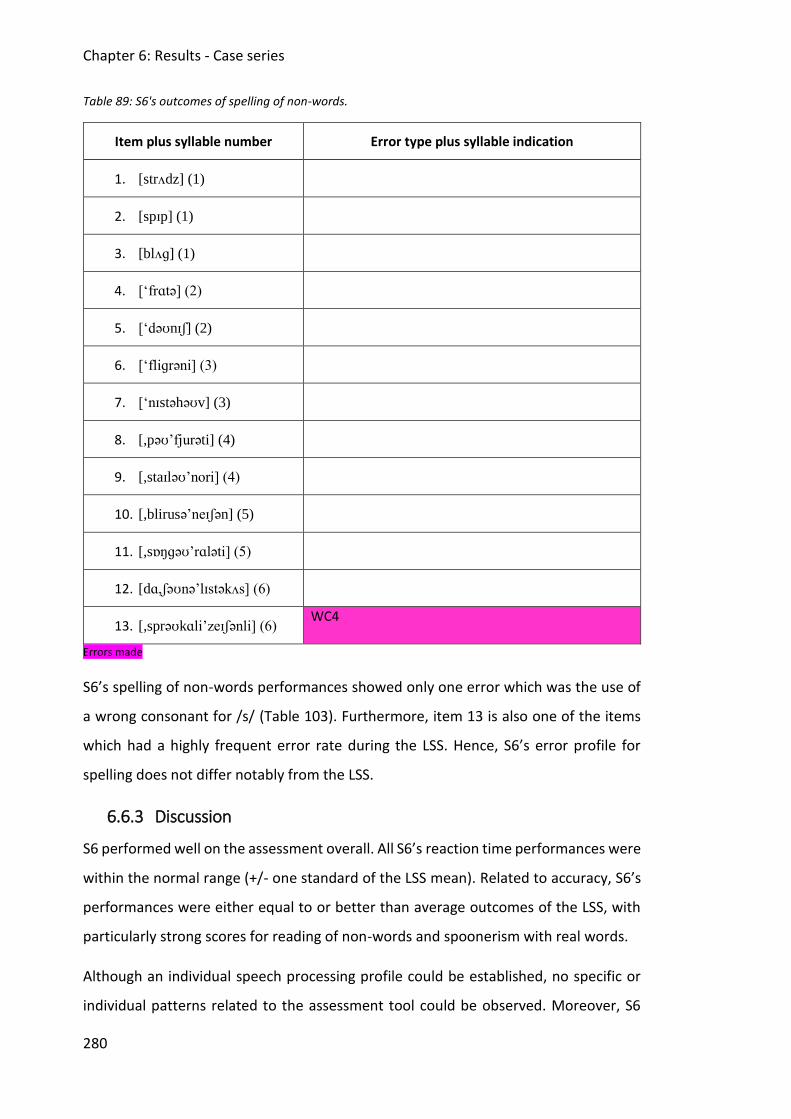
Chapter 6: Results - Case series
280
Table 89: S6's outcomes of spelling of non-words.
Item plus syllable number Error type plus syllable indication
1. [strʌdz] (1)
2. [spɪp] (1)
3. [blʌɡ] (1)
4. [‘frɑtə] (2)
5. [‘dəʊnɪʃ] (2)
6. [‘fliɡrəni] (3)
7. [‘nɪstəhəʊv] (3)
8. [,pəʊ’fjurəti] (4)
9. [,staɪləʊ’nori] (4)
10. [,blirusə’neɪʃən] (5)
11. [,sɒŋɡəʊ’rɑləti] (5)
12. [dɑ,ʃəʊnə’lɪstəkʌs] (6)
13. [,sprəʊkɑli’zeɪʃənli] (6) WC4
Errors made
S6’s spelling of non-words performances showed only one error which was the use of
a wrong consonant for /s/ (Table 103). Furthermore, item 13 is also one of the items
which had a highly frequent error rate during the LSS. Hence, S6’s error profile for
spelling does not differ notably from the LSS.
6.6.3 Discussion
S6 performed well on the assessment overall. All S6’s reaction time performances were
within the normal range (+/- one standard of the LSS mean). Related to accuracy, S6’s
performances were either equal to or better than average outcomes of the LSS, with
particularly strong scores for reading of non-words and spoonerism with real words.
Although an individual speech processing profile could be established, no specific or
individual patterns related to the assessment tool could be observed. Moreover, S6
Chapter 6: Results - Case series
281
does not show any differences in performances compared to the normative sample
group. Nevertheless, some observations were made which related to stammering
behaviour.
The performance with greater accuracy in the reading of non-words task might indicate
the positive effect of an input task for a person experiencing stammering. S6 did not
need to perform any oral motoric activity to carry out this task and a stammer could
not have influenced his performance. On another thought, the spoonerism with real
words task yields a significantly better performance: this task may favour S6 because
he can deploy lexical representations to use preventive techniques and so “hide” his
stammer.
A significant amount of stammering behaviour was observed during the speech
processing assessment. S6 stammered on sounds and sound combinations that he had
identified as “difficult” during the interview, namely /st/, /g/, /p/ and /b/ and ”roof of
mouth” sounds. S6 also described the common occurrence of prolongations, though
within the assessment, blocks, repetitions and prolongations were all documented.
Especially during the non-word repetition task, blocks and repetitions were observed
more frequently than prolongations. Such a specific assessment setting, where
avoidance/modification strategies are potentially more difficult to implement, may
have resulted in this higher incidence of blocks and repetitions.
However, in both spoonerism tasks, particularly the spoonerism with real words,
prolongations occurred more frequently than other stammering behaviours. It could
mean that occurring prolongations were modified as prevention rather than actual
behaviours (Blomgren et al., 2005), although this differentiation cannot be confirmed
by perceptual tension. However, the therapy S6 attended, which he scored as very
useful (modification non-avoidance approach), essentially includes prolongations as a
preventive technique (van Riper, 1982). Additionally, it is striking that more of those
prolongations occurred in the spoonerism with real words task compared to the
spoonerism of non-words task. Due to complex maturation of the speech difficulty
from childhood to adulthood, S6 might be able to subconsciously identify real words
which could be a hazard for the occurrence of stammering behaviours (Guitar, 2013).
The normal reaction to those words would be to prevent the occurrence of a
Chapter 6: Results - Case series
282
stammering behaviour by using a preventive technique (Blomgren et al., 2005). It could
be speculated that the involved lexical presentations of the spoonerism with real words
task have had an influence on the use of the prolongation technique, as words are
familiar.
6.7 Overall thoughts related to discussions of case studies
The case studies presented here describe six individuals who have experienced
stammering since childhood. Exploratory results yielded possible ideas about
breakdowns of speech within an individual speech processing system of a person who
stammers. However, in order to build universal hypotheses, deeper and detailed
investigation is needed with a larger sample of people who stammer. Furthermore, it
is important to note that every case study was highly individual and no general features
could be observed across all six case studies. Identifying common patterns or
breakdowns in a stammering population is a challenge in itself, as many other factors
also influence the speech difficulty, such as psychology and emotions (Guitar, 2013),
which increases the difficulty of detecting general causes.
This case study analysis aimed to meet the secondary research objective of this thesis
which was to explore speech profiles of young adults with a persistent developmental
stammer, using (i) the newly developed speech processing assessment tool, and (ii)
semi-structured interviews to gather additional data. Three research questions
informed the structure of data collection, analysis, and discussion.
Research questions:
➢ Question 5. Do people who experience a speech difficulty show different
performances compared to the normative sample group?
➢ Question 6. What are the speech processing profiles of individuals who
stammer?
➢ Question 7. Can specific and individual patterns be observed consistent with
data collected in the interview?
Every case study exhibited its own individual features and different performances were
observed (De Bleser et al., 1997; Stackhouse & Wells, 1997). Some significantly less
Chapter 6: Results - Case series
283
accurate performances, but also some more accurate performances, were discovered
which were analysed in the individual discussions of each case study. Across the series,
input task performances were accurate (but there was one case of less accurate
performance in auditory discrimination), or even significantly better than norms. In the
cases where less accurate performances were observed, output tasks were most likely
to be affected. Moreover, reaction time outcomes indicated mostly longer times
needed by the case study participants for different tasks (dependent on case study,
though most often impacting non-word repetition, reading of non-words and
spoonerisms – either real or non-words). In terms of the relationship between accuracy
and reaction time, considerable variability was observed. Looking at non-word
repetition for example, while S4 demonstrated superior accuracy in the presence of
slower reaction time (potentially a speed/accuracy trade-off), S5 demonstrated less
accurate and slower reaction time on the same task.
A synopsis of the six individual profiles supports the inclusion of each and every sub-
test in the tool for future case studies in clinic or in research. To summarise the
comparisons (including scores beyond one standard deviation): S1 showed accuracy
and reaction time weaknesses across all tasks of the tool except spoonerism with non-
words, whereas S2 had reaction time weaknesses only in three tasks (auditory
discrimination of non-words, non-word repetition, spoonerism with non-words) and
even a superior performance in terms of accuracy (reading task). S3 struggled with
accuracy only in spoonerism with non-words, but showed superior reaction times for
reading non-words. In contrast, S4’s performances were accurate but showed reaction
time deficits in two tasks (non-word repetition and reading of non-words). S5 also
showed reaction time weaknesses in three tasks (non-word repetition, reading and
spelling of non-words) alongside poor accuracy in non-word repetition, while showing
superior accuracy in reading of non-words. Finally, S6 did not show any weakness in
accuracy or reaction time, and demonstrated superior accuracy in the reading of non-
words and spoonerism with real words tasks. This overview reveals that each task
exposed weakness either in accuracy or reaction time or both by at least one
participant (though no systematic relationships between reaction time and accuracy
could be observed across the group as a whole, within individuals, or within tasks).
Chapter 6: Results - Case series
284
Therefore each task has potential value in flagging processing weakness and suggesting
which levels need further investigation, whether in research or clinical contexts.
However, two tasks seem to be more sensitive in picking up weaknesses as well as
superior skills: non-word repetition and reading of non-words task. Even in a small case
series, both tasks could reveal reaction time weakness, while the reading of non-words
task could highlight superior performance accuracy. There may be value in using these
sub-tests as a rapid screening technique in clinic for young adults, but all tasks may be
needed for a more comprehensive picture.
Comparing the nature of speech errors made in the case studies and in the large scale
group, no specific or striking differentiation was observed between the groups.
However, the case studies produced rich information about a range of stammering
behaviours and their occurrence. These were described by participants in interviews
and also observed during assessment with the tool. Generally, the qualitative interview
data confirmed the speech processing assessment data. If the speech processing
assessment had been administered by itself, in four of the six cases an accurate profile
describing when and where participants stammer could have been established and this
would include details of consonants or consonant combinations which trigger
stammering behaviours.
Regarding the potential value of the tool to prescribe more detailed investigations of
these (and new) case studies, some further points should be noted about the
spoonerism tasks. The spoonerism with real words task was included in the tool to
investigate if and how mature and complex lexical representations have an influence
on task performance, especially in adults experiencing a persistent developmental
speech difficulty. Indeed, it seemed that the influence of lexical representations
(spoonerism with real words) had a positive or negative effect on accuracy, depending
on the case, and appeared to increase stammering frequency. Applying the
psycholinguistic model, a negative lexical effect on accuracy and especially on
stammering frequency would suggest a difficulty with phonological representations,
the semantic system and/or the motor program (Chiat, 2000; Stackhouse & Wells,
1997). Mapping the spoonerism with real words task to the linguistic processing model,
all four lexica and the semantic/cognitive system are potentially involved in successful
Chapter 6: Results - Case series
285
task completion (Patterson & Shewell, 1987; De Bleser et al. 1997). Furthermore,
stammering is a difficulty that most overtly affects speech output levels; however, as
discussed in Chapter 2, individuals who stammer seem particularly sensitive to
linguistic demand, i.e. speech processing is impacted at the lexical representation level
(Kleinow & Smith, 2000; Tsiamtsiouris & Cairns, 2013). The spoonerism task with real-
words might thus be a sensitive index of the interface between linguistic demand and
speech output.
An alternative perspective on why the spoonerism task with real-words was often more
error-prone than the non-word task relates to the familiarity of real words and an
individual’s accrued experience in either successfully or unsuccessfully producing a
particular word. Thus, increased expectations or previous experience of stammering
behaviour on familiar words might have influenced performances either in a positive
way (more preventive techniques could be used which result in less observable
stammering behaviour and supports more accurate performances) or in a negative way
(habitual stammering behaviour are triggered, which may result in output errors, either
as a result of the stammering behaviour itself, or efforts to avoid it). Well-researched
facts about stammering support the idea that an individual speaker who stammers can
predict when a stammering behaviour might occur, especially on real words (Guitar,
2013; Ward, 2008). Furthermore, familiar speech leads to the more frequent use of
preventive techniques in people who stammer (Blomgren et al., 2005). In fact, in both
case studies (S2 and S6) in which a great amount of stammering behaviours could be
observed in the spoonerism task with real words, the use of prolongations as a
preventive technique for completing this task was notable.
Altogether, considering these exploratory case series results from a clinical
perspective, it is suggested that a psycholinguistic-based assessment of speech
processing skills in adults with persistent developmental speech difficulties would
provide valuable behavioural data for clinical use. The combination of qualitative
interview data and quantitative assessment data is especially useful for insights into
individual speech processing skills and needs. Further research could focus on the
deeper and more detailed investigation and interpretation of individual speech
profiles, and particularly on gathering data from more young adults who stammer to
Chapter 6: Results - Case series
286
see if the patterns observed in this case series (such as sensitivity to the non-word
repetition and reading of non-words tasks) are manifested in a bigger cohort. Thus, the
secondary research objective was met. It is argued that the newly developed
assessment tool can be used to profile the speech processing strengths and
weaknesses of adults with persistent developmental stammering, relative to norms.
6.8 Chapter conclusion
In conclusion, the series of case studies investigated in this doctoral study showed that
it is possible to produce individual speech profiles of people who stammer which could
be descriptively compared to average outcomes of the normative group. For each
individual case, suppositions could be made about possible breakdowns within the
speech processing system. Moreover, individual patterns were observed which could
be confirmed by data collected in interviews. The assessment also facilitated the
identification and characterisation of different stammering behaviours. It was shown
that the importance of matching quantitative and additional interview data to help
disentangle these characteristics is critical when interpreting these results.
Chapter 7: General Discussion
287
Part IV: GENERAL DISCUSSION
7. Chapter 7: General Discussion
As currently no assessment tool exists that is sensitive to the complex, persistent
speech difficulties of young adults, this doctoral study set out to adopt a
psycholinguistic approach in order to develop a multi-componential assessment of
speech processing, suitable for an adult population. The aim of the thesis was to
develop and validate a new speech processing assessment on a normative sample of
university students. Furthermore, the present study investigates the utility of the
speech processing assessment in profiling a case study series of young adults with a
persistent developmental stammer.
7.1 Summary and examination of results for psychometric
properties
In order to best understand the psychometric properties, namely objectivity, reliability
and validity, of the newly-developed speech processing assessment, 101 native English
speaking university students were assessed and outcomes were evaluated related to
objectivity, reliability and validity. Prior to these analyses descriptive statistics were
presented and discussed in the light of normal distribution, skewness and kurtosis.
Generally, no clear ceiling effect was observable. While certain diagnostic tests may
distinguish between a normative group, who perform at ceiling, and individuals with a
difficulty, who do not, a lack of ceiling effects for the normative group is relatively
common in tests of developmental ability/difficulty, where all individuals will be
performing across a continuum.
Equally, in designing an assessment battery to capture more subtle speech processing
difficulties in individuals who do not necessarily have very overt speech difficulties, the
assessment also provides a reasonable degree of challenge for a normative sample.
An alternative explanation, explored in Chapter 5, is that the performance of some of
the normative sample was reduced, due to reliance on extrinsic motivation in order to
carry out the tasks (e.g. course credit). This bias was not considered prior to data
collection and while this explanation can not be definitively proved within the results
Chapter 7: General Discussion
288
here, it will be picked up again in the section of limitations of this doctoral study (see
7.4).
7.1.1 Objectivity
Different types of objectivity, namely, test objectivity, scoring objectivity, and
objectivity in interpreting the results, were considered during task development. A key
element of test objectivity is ensuring objective administration. To this end, detailed
instructions were designed to ensure consistency of administration within and across
testing personnel. These instructions were then presented via computer and thus
consistency of task presentation was further supported. Objectivity of scoring within
the input tasks was ensured by using a response format which provided a fixed number
of options and only one correct answer. To ensure consistent scoring for the output
tasks, detailed criteria for scoring per task and in-depth interpretation for possible
error types were developed. These strategies contributed to the minimisation of scorer
subjectivity across the assessment (Field, 2013).
7.1.2 Reliability
With regard to reliability, variable results were observed. The developed tasks showed
good overall internal consistency (Cronbach’s alpha) for accuracy scores on a
dichotomous scale for auditory discrimination of non-words, non-word repetition, and
both spoonerism tasks (with real words and with non-words). Nevertheless, no internal
consistency for accuracy could be confirmed for reading of non-words and spelling of
non-words. For both tasks, certain items appeared to result in particularly high error
rates. These were four items in the reading of non-words task (e.g. <flox> versus
<vlox>) and three items in the spelling of non-words task (e.g. [‘nɪstəhəʊv] in which the
/v/ was replaced by another consonant). Whilst the reasons for such high error rates
have not been fully resolved, the role of non-word length, auditory-perceptual
similarity and other parameters should be carefully considered in item-level analysis.
Regarding reaction time outcomes, good internal consistency was observed for all tasks
across the tool.
Chapter 7: General Discussion
289
Test-retest reliability was explored by re-assessing 8 per cent of the sample at a second
time point. The second time point varied from participant to participant due to
organisational issues. With such a small sample size, the ability to detect statistically
significant relationships was reduced, however despite these constraints, significant
positive correlations were documented for reaction time measures for the non-word
repetition, the auditory discrimination of non-words, the reading of non-words, and
the spoonerism with real words tasks. Furthermore, there was a statistically significant
positive correlation for the test-retest results of the auditory discrimination task
related to accuracy outcomes. Test-retest reliability for this assessment ideally would
need to be confirmed further with a larger retest sample.
Finally, inter-rater reliability measurements were taken for all tasks that required an
accuracy judgement by the investigator (non-word repetition, spelling of non-words,
spoonerism with real words, and spoonerism with non-words). Analyses focused on 20
per cent of the complete normative sample and included judgement of correct and
incorrect answers, as well as categorising the nature of errors. Inter-rater reliability
measurements across all tasks were highly significant and therefore confirmed the
objective analyses of the results presented here, and affirmed the developed scoring
system as transparent and comprehensive.
7.1.3 Validity
Taking validity into consideration, content validity was ensured by using well-
established theoretical frameworks as a basis for the development of the speech
processing assessment. Indeed, two distinct speech processing models, namely the
psycholinguistic model (Stackhouse & Wells, 1997) and the linguistic processing model
(Patterson & Shewell, 1987), were used to lead the informed process of task
development for a comprehensive speech processing assessment. The new assessment
used these frameworks as a basis, exploring previous methods to assess the different
levels of speech processing; this resulted in subtests that tapped both input and output
processing, peripheral processing versus tasks involving lexical representations, as well
as spoken versus written verbal processing. The two models have been successfully
used in previous research and assessment development (e.g. De Bleser et al., 1997;
Stackhouse et al., 2007; Stackhouse & Wells, 1997), which formed a basis for
Chapter 7: General Discussion
290
establishing the validity of the new speech processing assessment. Moreover, a pilot
phase of this doctoral study was used to confirm and reject developed tasks and items.
Pilot studies are an important design feature within research to increase the utility of
the main study and offer valuable insights for other researchers (van Teijlingen &
Hundley, 2002). Nearly all items and tasks were confirmed and then used for the main
study without any alterations. Moreover, the pilot study confirmed the randomised
presentation of items within tasks, as well as the time frame and task order.
Construct validity, which examines to what degree a test measures what it intends to
measure, is often assessed by looking at how task performance relates to tests that
assess a similar set of skills in a similar population. Given that this assessment was the
first of its kind designed for comprehensive use with young adults with speech
difficulties, such validation was challenging: assessments of young children
(Stackhouse & Wells, 1997) would potentially be too easy for this population, whilst
assessments used within the realm of acquired aphasia (Patterson & Shewell, 1987)
aim to look at much more overt processing difficulties than might be seen in a
persistent developmental speech difficulty. Construct validity was thus analysed using
the alternative strategy used in this area: within-assessment correlations – because all
the subtests were designed to tap into speech processing to some degree, it was
predicted that if the test had good construct validity, a high number of significant
correlations would be seen between subtests. This prediction was largely supported,
with a high number of significant correlations occurring between accuracy scores
across tasks and reaction time across tasks respectively.
Correlations were also present between reaction time and accuracy variables, both
within and across tasks. However, within-task correlations between reaction time and
accuracy could only be observed for both spoonerism tasks. All other tasks did not
show correlations between their accuracy and reaction time measures. One
explanation for this could be that these two variables would not necessarily be
expected to correlate: accuracy and reaction time often may be involved in a “speed-
accuracy trade-off” in task performance (Bruyer & Brysbaert, 2011) which means that
one would slow down to become more accurate or vice versa. Hence, they are
Chapter 7: General Discussion
291
separable processes, but react similarly to modification during task performance
(Dutilh, Wagenmakers, Visser, & van der Maas, 2011).
The only task where correlations to other tasks were not seen was the accuracy
outcomes of the reading of non-words task. It was especially expected that accuracy of
reading of non-words would correlate with spelling of non-words (same modality of
task execution) and also with auditory discrimination of non-words (another input
task). To further investigate the construct validity of the reading task, participants
within the test-retest sample were also administered a standardised test of reading
skills (‘TOWRE’), to see if relationships could be observed with an already validated test
of reading skill. The ‘TOWRE’ aims to measure word reading rate and accuracy of
reading words and non-words and can be used for populations of six to 24 years of age
(Torgesen et al., 1999). The comparison of outcomes of the new reading of non-words
task to non-word performances in the ‘TOWRE’ of the test-retest sample was of special
interest. No correlation between performances in the standardised reading test and
the new reading of non-words task were present. However, this lack of correlation is
somewhat difficult to interpret. Firstly, although the non-word items of the ‘TOWRE’
are similar in, for example, orthographic legality to the non-words designed in this
thesis, the ‘TOWRE’ contains a greater diversity of non-word length/syllabic
complexity. Equally, participants undertaking the ‘TOWRE’ are asked to read the non-
words aloud as fast as possible, thus the task has more output demands than the task
designed here, and has an added time pressure. Hence, these additional variables
might have influenced the results of this comparison. Moreover, a small sample size
limits the statistical power of this comparison. Altogether, while significant correlations
existed between the new non-word reading task reaction and other reaction time
variables, the validity of the non-word reading task should be treated with caution.
Taking item development under closer inspection, given that the new speech
processing assessment aims to target a population which has not been investigated in
this sense before, item development was based on existing research findings of studies
using similar items and task constructions. Firstly, Wagenmakers et al. (2004)
highlighted the importance of the use of non-words to gain a clear distinction between
lexical and non-lexical processing. Hence, mainly non-words were used throughout the
Chapter 7: General Discussion
292
assessment to gain a more ‘pure’ picture of speech processing skills independently of
the impact of lexical representations. However, from a clinical perspective the use of
real words provides the opportunity to explore the impact of lexical knowledge on test
performance and allows the investigator to test different hypotheses of speech
processing weaknesses especially in relation to the intersection with semantic
processing. Hence, it was decided to add the task spoonerism with real words to the
set. Outcomes on the lexical version of the spoonerism task yielded faster and more
accurate performances on average compared to the non-lexical spoonerism tasks with
non-words. Hence, the difference in performances between these two tasks suggests
that lexical knowledge (phonological and semantic representations) positively
facilitated individuals’ ability to complete a complex phonological/orthographic
manipulation task (Allyn & Burt, 1998). However, taking the case series into account
only two case studies showed noteable differences between accuracy performances of
these two tasks (S1: spoonerism with real words 3 and spoonerism with non-words 6;
S2: spoonerism with real words 7 and spoonerism with non-words 2). Furthermore,
comparing these outcomes to LSS data it can be seen that all scores lay within the
minimum and maximum range of the normative group. Hence, the outcomes can only
be discussed on the basis of the individual case. For the future though, it will be
important to further investigate this lexicality effect with different clinical cohorts to
understand the generalisability of the effect. Moreover, a greater amount of test items
(currently only 10 items per task) would facilitate better interpretations of results.
To further contribute to test validity, all stimulus items were highly controlled in terms
of their linguistic properties, especially regarding their phonological complexity and
real word likeness. Based on ideas from, amongst others, Balota et al. (2007), Caravolas
and Bruck (1993), Cassady et al. (2008), Stackhouse et al. (2007), and Stokes and
Surendran (2005) items were systematically varied by onset complexity and length,
whilst being controlled for bigram frequency. In addition, non-words were controlled
for stress pattern (Frisch et al., 2000). Clinical models of speech, for example one for
apraxia (Duffy, 2013), also informed the process of defining a hierarchy for
phonological complexity, such as a simple onset (e.g. a nasal = /n/) versus a complex
onset (e.g. cluster including a plosive at the beginning = /tr/).
Chapter 7: General Discussion
293
As two tasks also involved orthographic modalities, non-word items were further
controlled for orthographic legality in the English language to maintain a consistent
degree of real-word-likeness of the newly developed items (Davies, 2016; Frisch et al.,
2000). To further support this process a non-word generator, Wuggy (Keuleers &
Brysbaert, 2010), was used which makes it possible to derive non-words from real
words. As previous research suggested, the best real word likeness is ensured by
deriving non-words from real words and controlling for legality (Coady & Evans, 2008).
Hence, the items created for the current assessment were as consistent in their
orthographic properties as possible.
Altogether, the above paragraphs described research and studies that informed
processes which aimed to establish objectivity, reliability and validity of the new
speech processing assessment. Due to lack of existing research in the area of assessing
young adults on speech processing abilities, it was not possible to validate this
assessment on a single parallel measure, however, through the range of design
considerations and strategies for objectivity outlined above, reliability and validity
were carefully incorporated into the design at every step. Altogether, across the
performance of the normative sample of 101 university students, while the data were
subject to skew, it was determined that the psychometric properties of the assessment
were adequate to show performance variation across the full range of subtests
included. This can be supported by case study data which gives tentative confirmation
– they show different performances within and across participants.
7.2 Summary and examination of results for case series
The utility of the new speech processing assessment for adults with persistent speech
difficulties was examined by investigating six case studies of native English-speaking
students who had experienced persistent developmental stammering since childhood.
The assessment of stammering within a psycholinguistic context offered the
opportunity to comprehensively investigate a speech difficulty that researchers and
clinicians still struggle to fully characterise; while on the surface stammering appears
to be a difficulty of output processing, empirical research suggests a more complex
constellation of speech processing issues. The case studies here also included an
interview about the speech difficulty and its history, alongside the administration of
Chapter 7: General Discussion
294
the speech processing assessment. Given the heterogeneous patterns of performance,
each individual was considered separately and grouping of the data was deemed
inappropriate.
Taking explorations of individual speech profiles and qualitative interview data of case
studies into account, a range of stammering behaviours in most of the case studies was
observed during interview conversations and more so during speech processing
assessment completion. The stammering behaviours that manifested often confirmed
the interview data which described, for example, specific consonants or sound
combinations as a trigger for stammering events. Situations or sound combinations
varied from participant to participant and therefore cannot be considered as universal.
Related to those stammering behaviours, though, it was discovered that they occurred
more often during the spoonerism with real words task in the case of every participant
who showed stammering behaviours. This task directly involves lexical representation
which might have had an influence on the frequency of occurring stammering
behaviours. Moreover, the cognitive load of this task can be judged as rather high, since
metaphonological skills, such as manipulation of phonemic segments (Stackhouse &
Wells, 1997) and accurate speech output abilities are needed to complete this task
successfully. Nevertheless, this conclusion stays questionable but could be used as a
basis for further hypothetical testing. Moreover, looking at the qualitative interview
data, all participants were able to name when stammer events would occur for them
individually. Research confirms these statements, as especially adolescents or adults
who stammer have developed a sensitivity towards their speech difficulty which lets
them make those judgements (Hearne, Packman, Onslow, & Quine, 2008; Klompas &
Ross, 2004; Messenger, Onslow, Packman, & Menzies, 2004). The nature of the
stammering behaviours occurring during individuals’ assessment performances also
reflects patterns which have been reported in previous research. Firstly, all stammering
behaviours occurred on word initial positions or on the stressed syllable of the item. In
earlier decades Brown (1937, 1945) and more recently, for example, Bloodstein and
Bernstein Ratner (2008), confirmed the occurrence of stammering behaviour in word
initial positions and/or stressed syllables of words. Furthermore, frequently more
stammering behaviour was observed on linguistically more complex, and therefore
Chapter 7: General Discussion
295
longer, items. Many research studies have been conducted with adults and with
children which support the idea of stammering occurring more frequently in situations
of linguistically more complex demands (e.g. Kleinow & Smith, 2000; Smith et al., 2010;
Yairi & Ambrose, 2005). Concluding, the pattern of each individual stammering
behaviour which occurred during the interview and the assessment completion in the
six case studies presented here can be explained by previously established findings
about the phenomenon stammering.
With regard to case study assessment data which was used to test the utility of the
speech processing assessment for adults with persistent speech difficulties, the case
studies demonstrated significant heterogeneity in their performances. Some tasks
yielded more significant variations in case study performances compared to normative
data. The tasks reading of non-words and non-word repetition yielded the most
differences between the normative group and the case study individuals, though these
differences manifested in performances both above and below the norm group. For
three out of the six case studies non-word reading performance was greater than one
standard deviation above the normative means for either accuracy (i.e. more accurate)
and/or reaction time (i.e. longer). Interestingly, only one case study showed both
significantly better accuracy but in the context of significantly longer reaction times for
this specific task. Regarding non-word repetition, while two individuals performed
greater than one standard deviation above the mean for accuracy, one of the six
performed more than two standard deviations below the mean. Reaction times for this
task showed that three participants had times that were significantly slower than
average, while the other three were comparable with the norms.
In contrast, auditory discrimination of non-words and spelling of non-words showed
the smallest differences with the norm group for both variables. For both tasks, none
of the case studies performed beyond two standard deviations above or below the
mean. For both tasks the same individual performed more than one standard deviation
below the mean for accuracy, while two other individuals performed more than one
standard deviation outside the mean for reaction time (slower reaction time) one for
auditory discrimination and one for spelling respectively.
Chapter 7: General Discussion
296
Accuracy for both spoonerism tasks did not show any striking differences compared to
the normative group, with a single (but different) individual performing more than one
standard deviation below the norm for each. Reaction time outcomes of these tasks
also showed one significantly slower performance on each, and one significantly
quicker performance was observed for the spoonerism with real words task.
As described above, some differences could be discovered for individual case studies
compared to norm data, but given the diversity in both a) the number of subtests in
which an individual performed either similarly to/differently to the norm group and b)
the combination of subskills implicated in difficulty for any individual, generalisability
from this sample is not easily possible. The lack of generalisabilty was partially
expected, firstly, due to the design of the six exploratory case studies, and secondly,
because the assessment was designed to move away from descriptive tasks about
stammering (as elaborated in Chapter 2) and explore underlying weakness of people
who stammer. In order to profile speech of people who stammer, a range of tasks
tapping input and output processing was needed to assess individual levels of the
speech difficulty, including strengths and weaknesses, which might remain hidden if
only their speech output is analysed (Guitar, 2013; Pascoe et al., 2006; Stackhouse &
Wells, 1997). Furthermore, it was expected that every case study would show
individualised results and diverse stammering patterns (Guitar, 2013; van Riper, 1982;
Ward, 2008). Such differentiation highlights the advantages of psycholinguistic
assessment in that it facilitates profiling of individuals’ strengths and weaknesses,
rather than forming generalisations (De Bleser et al., 1997; Gaskell, 2007; Stackhouse
& Wells, 1997). Indeed, psycholinguistic-based assessment probes the different levels
of processing which underlie speech understanding and production, towards
explaining not just describing a linguistic-based symptomatic pattern of speech
difficulty (Chiat, 2000). Furthermore, the building of unique psycholinguistic profiles
makes it possible to explore the relationships between linguistic complexity, variability
of language, and speech processing in individuals who stammer (Baker et al., 2001;
Crosbie et al., 2005; Fisher et al., 2003; Fox et al., 2002; Stackhouse et al., 2007;
Stackhouse & Wells, 1993).
Chapter 7: General Discussion
297
Although a group comparison was not carried out, one specific trend could be observed
when considering all six case studies simultaneously. While overall, individuals who
stammer performed similarly to norm group, an area where more disparity was
observed was in the domain of reaction time, especially for the non-word repetition
and spoonerism tasks. Research about people who stammer has shown that reaction
time is a crucial variable when assessing their performances (Kleinow & Smith, 2000;
Logan, 2003). De Nil (1995) discovered that people who stammer need longer for
linguistic processing tasks than their counterparts, a finding which is partially echoed
in the present study. This observation has also been confirmed by other researchers
(Caruso et al., 1988; Guitar, Guitar, Neilson, O’Dwyer, & Andrews, 1988). The
descriptive research reviewed in Chapter 2 of this thesis shows that many influencing
factors have been proposed to explain why people who stammer show longer reaction
times in speech production tasks, including issues with motor programming, sensory-
motor control difficulties, and the effect of compensatory strategies (e.g. Max et al.,
2004; Sommer et al., 2002; Subramanian & Yairi, 2006). Interestingly, longer reaction
times were also observed for one individual within the auditory discrimination of non-
words task, an input task which does not involve speech production. This finding
resonates with research suggesting that stammering is a phenomenon that also
implicates input processing (Brown et al., 2005; De Nil et al., 2003; Foundas et al.,
2004), though the slower reaction time was only present for one individual. To
summarise, the trend in the current case series was for people who stammer to need
somewhat longer for speech output tasks, but also for an input task; this pattern is
consistent with conclusions of previous relevant research (Brown et al., 2005) but
cannot be generalised without more confirmatory case study data. Nevertheless, a
good insight into different processing skills and weaknesses could be captured.
Looking at the psycholinguistic speech processing profiles for the six cases, especially
the presence or absence of stammering behaviours, a possible influence of lexical
representation on performance could be observed for half of the individuals, with
increased stammering behaviour in the real word version as opposed to the non-word
version. Although a very tentative finding, this result potentially links to accounts of
stammering that place the locus of difficulty at the intersection of the lexical
Chapter 7: General Discussion
298
representation and motor program. For example, van Riper (1982) first established that
the internal feedback loop for speech production might be disturbed in a person who
stammers. The internal feedback loop describes the interaction between the motor
program and the lexical representations (e.g. phonological representation) to form
speech. Stored phonological information is accessed which in turn allows the speech
processing system to monitor speech production. However, a larger sample size would
be needed to fully verify this finding.
Finally, linking these results back to causal theories discussed during Chapter 2, the use
of multifactorial models as the explanatory framework can be supported (Packman,
2012). Outcomes of this doctoral study seem to confirm underlying difficulties at the
interface of lexical representations and motor programming, sensory input deficits
(indicated by reaction time measures for auditory discrimination of non-words) and the
influence of linguistic complexity on the occurrence of stammering behaviours.
Starkweather and Gottwald (2000) explained the phenomenon of stammering based
on linguistic, cognitive, motoric, and emotional factors. Although not all of these
dimensions could be confirmed within the scope of the results presented here, the
motoric and linguistic indications were noteworthy. Nevertheless, with such a small
cohort of case studies it was not expected to see results that would uniformly support
particular empirical research about the phenomenon of stammering (Guitar, 2013).
However, based on the analysis so far, it can be tentatively predicted that some more
widely shared difficulties would come into view with a larger cohort, given that some
patterns are already emergent, such as longer reaction times when reading non-words
(evident in three out of six case studies). Yet, the six speech processing profiles are
diverse. This underscores how vital it is to conduct individualised clinical assessments
of people who stammer rather than relying on generalised descriptions.
7.3 Discussion of unexpected results
Regarding aspects of the assessment which require particular modification going
forward, the reading and spelling tasks exhibited the weakest psychometric properties.
Both of these tasks had low internal consistency as measured by Cronbach’s alpha for
their accuracy scores. Moreover, accuracy measures of the reading of non-words task
did not correlate with any other accuracy outcomes and hence content validity for the
Chapter 7: General Discussion
299
reading of non-words task could not be confirmed. The internal consistency issues
could have been due to some items in both these tasks being particularly prone to high
error rates.
This reduced reliability of the non-word reading and spelling tasks may have
contributed to the lack of notable performance patterns for these two tasks in
particular. Though, case study data revealed that three participants had reduced
reaction times, three showed better accuracy than the large scale sample and one
participant had an interesting mix, i.e. very high accuracy and very long reaction time
for the reading of non-words task. Generally, both tasks were specifically selected and
designed so that they did not require verbal speech output. It was thought that
individuals with overt speech output difficulties might, in the absence of speech
production demands in a task, have the opportunity to reveal phonological processing
strengths via a different modality. Alternatively, the presence of performance difficulty
in the absence of the need for overt speech output might indicate a greater depth of
speech processing difficulty. Yet, each case study participant performed comparably in
written and spoken modalities, within individuals, as well as compared to the norm
group. Aside from reliability issues, there are other possible explanations for the lack
of performance differences. A larger range of items, especially some more difficult
items or more taxing task requirements, might have uncovered striking differences in
performances between verbal and written output, as well as between groups.
Regarding differences between the normative sample and the individuals who
stammer more specifically, it is important to remember that as young adults, the
individuals who stammer will have experienced a complex trajectory of speech
processing development (Pascoe et al., 2006). If these individuals had been assessed
using a similar assessment tool in early childhood, it is hard to say whether they would
have manifested more difficulties in relation to a normative sample, but since resolved
some of those difficulties.
Another design decision that may have obscured performance differences, both
between spoken and written tasks, as well as between participant groups, was the
decision to not include stammering behaviours in the scoring of any subtest, i.e. if
individuals stammered on an item, it was noted, but no marks were lost. Integrating
Chapter 7: General Discussion
300
stammering behaviours into the scoring system would have had a significant impact,
for example, for S2 who frequently employed sound prolongations as a technique
during assessment completion, especially for the production of non-words. This
technique is used to reduce the occurrence of stammering behaviours on specific
sounds identified by individuals as triggers for their stammering behaviours (Blomgren
et al., 2005). However, if stammering behaviour on an assessment item was flagged
somehow as a sign of speech processing difficulty, then the differences between the
normative sample and case studies would have been more pronounced.
7.4 Limitations of the study
This doctoral study has a number of possible limitations. Firstly, the group of young
adults with speech difficulties was smaller than hoped for, due to difficulties in locating
and recruiting participants from this very specific population. Individuals who stammer
are not always a group who are specifically served by university disability services and
so making contact with individuals who stammer relied on a more general email
recruitment strategy, which was necessarily less targeted. Notwithstanding the small
number of case studies, each one yielded useful data via the new assessment tool along
with valuable qualitative insights, as already discussed in this thesis. Comparison of
data to newly established norms would perhaps show more distinct patterns of results
if the case series group were larger.
Secondly, there were some limitations concerning the psychometric properties of the
newly-developed speech processing assessment. Test-retest reliability values may
have suffered due to organisational challenges, such as time constraints and the need
to re-recruit participants. As for validity analyses, it was not possible to measure
concurrent validity or predictive validity primarily because there is no ‘golden standard’
assessment for the specific target population with a protocol which would have fit the
time frame of this study. Nevertheless, limitations to the validity analyses restrict the
insight into psychometric properties.
Descriptive results showed no distinct ceiling or floor effects for the outcomes of the
normative sample group as opposed to other tests of adults’ skills, for example the
PALPA, which are based on the same linguistic processing model used for the here
Chapter 7: General Discussion
301
presented assessment. However, the difference in target groups of the different
assessments might influence these outcomes to some extent and limit the suitability
of comparing psychometric properties of norm data collected with the PALPA to norm
data collected during this doctoral study. Indeed, non-occuring ceiling effects were
interpreted as a measurement of sensitivity. All tasks seemed to be accurate to test
speech processing in adults, as they are sensitive enough and highlight variation in
performances in normal speaking adults.
In addition, it would have been useful to collect end-user feedback from the normative
group, so that the choice and difficulty of tasks could have been discussed in the light
of the participant’s opinion. This would then facilitate a clearer discussion of certain
tasks and could inform future developments of the tool. End-user feedback may have
also been useful in probing the possible limitation already mentioned in Section 7.1.,
concerning the motivation of the normative group students to perform their best on
the assessment tasks.
Regarding the composition of the assessment tool, it would have been beneficial to
include more tasks requiring overt access to lexical representations, in order to be able
to better understand the influence of the lexical knowledge on speech processing.
Furthermore, the influence of the working memory on the different tasks cannot be
measured in the current version of the tasks, but it is known that working memory is
needed especially for the tasks designed to have a greater cognitive load (i.e.
spoonerisms) (Cassady et al., 2008). Finally, the spelling task was developed following
the same procedure as the development of all other tasks, namely items were based
on real words and derived from a non-word generator. However, as the output medium
of task execution differs significantly to all other output tasks, it would have been useful
to develop items for this task in a different way. Using a different approach would have
better facilitated the consideration of predictable spellings of the English orthography,
which in turn would have streamlined the scoring for this task. All these points should
be addressed and incorporated in possible future research related to this speech
processing assessment.
Chapter 7: General Discussion
302
7.5 Relevance of the findings
This is the first study, to our knowledge, to develop a comprehensive assessment tool
for young adults which can, within a short time-frame, examine speech processing
abilities and yield a systematic profile. Building upon existing psycholinguistic models
(Patterson & Shewell, 1987; Stackhouse & Wells, 1997), the assessment incorporates a
range of input and output tasks with different levels of cognitive and linguistic
processing demands. The successful combination of these two well-researched speech
processing models showed that although each has targeted a different population, it
was possible to build a unified, theory-based, speech processing assessment bringing
together advantages of both models. Furthermore, through the calculated use of non-
word stimuli, the new tool can help clinicians and other investigators gain insights into
non-lexical speech processing skills. It also enables assessment of phonological and
orthographic processing routes. The speech processing assessment is potentially
suitable for different groups of adults, including young adults who experience speech
difficulties, including those of a more subtle nature.
This thesis also describes for the first time a detailed investigation of six individuals who
stammer, using the speech processing assessment alongside qualitative interview data.
The assessment data helped to confirm information reported during the interview, and
the resulting observations and analyses are relevant to current research debates about
the phenomenon stammering.
7.6 Implications or practical applications of the study
The speech processing assessment developed in this doctoral study brings important
potential practical applications. First, it is a clinical tool that can be used to help assess
the needs of individual adults in higher and further education settings, whose learning,
occupational or social activities may have been (or continue to be) compromised by
speech and language difficulties whether overt or subtle, including stammering
disorders. Research studies confirm that there are students in higher education
experiencing different forms of speech processing difficulties (Cameron, 2016;
Cameron & Nunkoosing, 2012; Clegg et al., 2005) and assessment tools are sparse.
Using the newly developed psycholinguistic assessment, an investigator can build a
Chapter 7: General Discussion
303
comprehensive speech profile which highlights processing strengths and weaknesses
and points to any underlying locus/loci of deficit rather than simply describing surface
linguistic performance. Its design is sensitive to patterns of ‘hidden’ speech processing
problems persisting from childhood. The fact that the tool can be administered in a
short time-frame is an important practical advantage. The resulting speech processing
profile can be used to help plan appropriate intervention. In the case of students in
higher and further education settings, intervention might include official recognition of
learning needs and the putting into place of disability support measures to help enable
the students to realise their potential.
Secondly, the newly developed psycholinguistic assessment tool has practical
relevance more widely for practitioners, clinicians, and researchers working within the
speech difficulties field, as they develop and test hypotheses in relation to a
heterogeneous group of adults whose speech and language difficulties do not emerge
from acquired brain injury and who offer unique challenges in identification and
differentiation. The tool can also be applied to psycholinguistic investigations of adults
who do not have speech and language difficulties, for example in research contexts
focusing on non-impaired speech processing. Furthermore, the tool could be utilised
to assess adults with other speech difficulties, such as dyspraxia, and those with literacy
difficulties. It would be expected that differences in the speech profiles of individuals
of each group would occur, showing variations in strengths and weaknesses. For
example, taking an individual with dyspraxia into consideration, with a hypothesised
locus at the level of motor planning (Duffy, 2013), a task like non-word repetition might
be most impacted, with performance on the spoonerism tasks also vulnerable to motor
planning issues. Such performance on the spoonerism tasks could then be
distinguished from a primary phonological difficulty by comparing, for example,
performance on the non-word reading and spelling tasks. Generally, the normative and
case series datasets of this doctoral study contribute to the wider corpus of empirical
data in the field; further recommendations to refine and augment the datasets via
further investigation are set out below.
Chapter 7: General Discussion
304
7.7 Recommendations for further research
Specific recommendations have been drawn up to further develop the work presented
in this doctoral thesis. The first group of recommendations relates to design
improvements to the new assessment tool.
It is essential to tackle the internal consistency of the reading of non-words and the
spelling of non-words tasks. Closer scrutiny of stimulus items and further development
and re-testing is necessary to re-establish stronger reliability and validity scores for
these tasks. In the course of the tool’s development, seven items (three for spelling
and four for reading), were shown to elicit high error rates, i.e. participants frequently
selected distractor items by mistake. This may be due at least in part to the auditory
recording quality and voicing distinctions, therefore new recordings should be made
and tested with a group of normal speakers.
Secondly, currently the tool was used as a whole to establish a comprehensive speech
profile of an individual. In future, different tasks could be considered to test and
explore hypotheses which result from assessment based on other formal and informal
procedures. Hence, the auditory discrimination of non-words task could probably be
used to follow up hypotheses which consider lower level auditory discrimination as
relatively intact despite impoverished phonological representations. Another idea
could be to follow up on detected difficulties with greater demanding lexical
representations and utilise the spoonerism tasks to assess these skills.
Furthermore, it has not been certain that the two orthographic tasks are testing what
they were designed to test. Indeed, the rationale for introducing tasks which can be
performed without spoken output was to uncover potential underlying processing
strengths/challenges for participants who experience speech production difficulties.
However, the results did not show any specific advantages or disadvantages for
participants via the orthographic modality. More testing and data analysis is needed to
determine whether these tasks, as originally designed, were sensitive enough to tap
the relevant speech processing levels in adults.
One possible remedial strategy would be to carefully re-design these two tasks by
introducing greater levels of difficulty. At item level, more difficulty could be factored
Chapter 7: General Discussion
305
in by increasing phonological complexity. At the level of task construction, the number
of response options for the non-word reading task could be increased to four, or the
context of the stimuli changed, for example in the case of the reading of non-words
task by requiring identification of a specific non-word within strings of different non-
words. Moreover, results should be compared to other standardised test materials
looking at reading and spelling of non-words performances. For example, ‘TOWRE’
relationships could be investigated to a greater extent and in more detail. Another
comparative measurement could be the ‘Wechsler Individual Achievement Test’
(WIAT) (Lichtenberger & Smith, 2005) which also assesses reading, alongside language
and numerical attainment. However, this test uses non-speeded tasks, as opposed to
the ‘TOWRE’, which might give different possibilities of comparison. Furthermore, the
speech processing assessment could be used to investigate adults who experience
dyslexia. It would be interesting to observe if the performance of participants with
known difficulties in reading and writing would be differentiated from the normative
sample on a) the written tasks but also b) the more overtly speech-based tasks.
An alternative strategy to remedy the problems with the reading and the spelling tasks
would be to replace them with tests which involve speech output but have different
demands to the remaining four tasks in the new tool (auditory discrimination of non-
words, non-word repetition, and the two spoonerism tasks). For example, other
phoneme manipulation tasks or lexical retrieval tasks, such as phoneme elision and
sentence completion (often used for psycholinguistic assessment in children and adults
(De Bleser et al., 1997; Stackhouse et al., 2007; Stackhouse & Wells, 1997)), could be
used to test speech input and output processes. Such assessment tasks would need to
be planned and constructed carefully with sufficient complexity to capture underlying
difficulties as well as strengths in the adult speech processing system.
The final group of recommendations for further research relates to investigations of
the phenomenon stammering. Systematic hypothesis-building and testing in this area
could shed light on factors informing causal theories of stammering. For example, the
assessment could be modified to investigate the role of lexical representations in task
completion, to expand the comparison between performance on real word and non-
word tasks. In the case study series described in this thesis, outcomes for the
Chapter 7: General Discussion
306
spoonerism with non-words and spoonerism with real words tasks indicated that
lexical representations might play an important role in people who stammer in terms
of the accuracy of performance and also the occurrence of stammering behaviours.
One study design could focus on creating and testing counterpart real word versions of
all already developed non-word tasks. In that way, a direct and more comprehensive
comparison between performances requiring or not requiring processing of lexical
representations on different levels could be investigated.
Finally, the role of external stressors which trigger or impact on stammering behaviours
is another aspect of assessment that could be explored. Case series interview data
confirmed that stammering occurrence varies according to the formality of a given
situation. It would be interesting in further case studies to manipulate an equivalent
stress factor in the assessment setting to observe the impact on performance of
different tasks and the occurrence of stammering behaviours. Of course, what
constitutes a stressful or demanding situation might be different for every individual.
However, it is possible to introduce ‘stress’ or demands to tasks in experimental ways,
for example by introducing a visual or auditory ‘countdown’ which records the time
elapsing for the task second by second (De Nil & Brutten, 1991), or else background
noise could be added to the auditory environment. It would be useful to investigate
this factor in normal speakers as well as individuals who stammer and compare the
outcomes to existing data collected during this doctoral study.
Conclusion
307
Conclusion
This doctoral study has investigated the development of a psycholinguistic speech
processing assessment for adults. Psychometric properties of this new assessment
were tested using a normative group sample of 101 university students. The
assessment was used to characterise the speech profiles for a case series of six adults
who experience speech difficulties in the form of persistent developmental
stammering.
Taking into account the principles of objectivity, reliability and validity a six sub-test
assessment tool was designed. Subtests were created that covered a wide range of
speech processing levels, with a progression of within-task linguistic demand
integrated where appropriate. Use of a computer programme for presentation of the
assessment helped provide administrative and scoring objectivity. Indices of reliability
for the assessment indicated a generally good degree of internal consistency across
measures, a fair test-retest reliability, and a very good inter-rater reliability. Validity
was addressed, both by grounding the assessment in established psycholinguistic
theory, and confirmed via the presence of expected correlations between sub-tasks
within the tool. Analysed results support internal construct and content validity of the
new developed speech processing assessment, but further investigation is needed.
The assessment of adults who stammer showed considerable diversity of
performances between the six individuals, as well as a mixed profile of both strength
and weakness in comparison to the normative data. The differences observed were
largely concordant with previous empirical research that has explored the
phenomenon of stammering, however these results, and the assessment tool itself,
further highlight the heterogeneity of speech profiles that this group possesses.
Concluding, the test battery designed for this doctoral study is the first of its kind and
displays a comprehensive psycholinguistic speech processing assessment of adults’
speech processing abilities in a short time-frame (approx. 20-30 minutes). It can be
used for profiling individuals’ speech processing skills and comparing outcomes of
different speech profiles. Further, it can highlight stammering behaviours and
characteristics. After unsatisfactory outcomes for specific psychometric properties of

Conclusion
308
the assessment tool have been resolved, it could be used to develop an improved
speech processing assessment for adults based on the most sensitive subtests
identified. The new assessment could assist the identification of speech difficulties in
young adults and suitable support could be developed, especially within higher
education.
References
309
References
Adams, M. J. (1994). Beginning to Read: Thinking and Learning about Print. New York, NY: MIT
Press.
Adams, M. R., & Hayden, P. (1976). The Ability of Stutterers and Nonstutterers to Initiate and
Terminate Phonation during Production of an Isolated Vowel. Journal of Speech,
Language, and Hearing Research, 19(2), 290–296.
Alfonso, P. J., Story, R. S., & Watson, B. C. (1987). The organization of supralaryngeal
articulation in stutterers’ fluent speech production: A second report. Annual Bulletin
of the Research Institute of Logopedics and Phoniatrics, 21, 117–129.
Allen, J. B. (2005). Articulation and Intelligibility. Synthesis Lectures on Speech and Audio
Processing, 1(1), 1–124.
Allport, D. A., & Funnell, E. (1981). Components of the Mental Lexicon. Phil. Trans. R. Soc. Lond.
B, 295(1077), 397–410.
Allyn, F. A., & Burt, J. S. (1998). Pinch my wig or winch my pig: Spelling, spoonerisms and other
language skills. Reading and Writing, 10(1), 51–74.
Altmann, G. T. M. (2002). Psycholinguistics: Critical Concepts in Psychology. New York, NY:
Taylor & Francis.
Ambrose, N. G., Yairi, E., Loucks, T. M., Seery, C. H., & Throneburg, R. (2015). Relation of motor,
linguistic and temperament factors in epidemiologic subtypes of persistent and
recovered stuttering: Initial findings. Journal of Fluency Disorders, 45, 12–26.
American Psychiatric Association. (2013). Diagnostic and statistical manual of mental disorders
(DSM-5). Arlington, VA: American Psychiatric Publishing.
Anderson, J. D., Wagovich, S. A., & Hall, N. E. (2006). Nonword repetition skills in young children
who do and do not stutter. Journal of Fluency Disorders, 31(3), 177–199.
Anthony, J. L., Lonigan, C. J., Driscoll, K., Phillips, B. M., & Burgess, S. R. (2003). Phonological
sensitivity: A quasi-parallel progression of word structure units and cognitive
operations. Reading Research Quarterly, 38(4), 470–487.Aslin, R., Jusczyk, P. W., &
Pisoni, D. B. (1998). Speech and auditory processing during infancy: constraints on and
precursors to language. In W. Kuhn & Siegler (Eds.), Handbook of child psychology:
cognition, perception, and language. New York, NY: Wiley.
Baayen, R. H., Milin, P., Durdević, D. F. ,́ Hendrix, P., & Marelli, M. (2010). An amorphous model
for morphological processing in visual comprehension based on naive discriminative
learning. Psychological review, 118(3), 438.
References
310
Baird, G. (1991). Developmental Speech Disorders. Archives of Disease in Childhood, 66(3),
371–372.
Baker, E., Croot, K., McLeod, S., & Paul, R. (2001). Psycholinguistic Models of Speech
Development and Their Application to Clinical Practice. Journal of Speech Language
and Hearing Research, 44(3), 685.
Ball, M. J. (2003). Clinical applications of a cognitive phonology. Logopedics Phoniatrics
Vocology, 28(2), 63–69.
Balota, D. A., Yap, M. J., Hutchison, K. A., Cortese, M. J., Kessler, B., Loftis, B., … Treiman, R.
(2007). The English Lexicon Project. Behavior Research Methods, 39(3), 445–459.
Barasch, C. T., Guitar, B., McCauley, R. J., & Absher, R. G. (2000). Disfluency and Time
Perception. Journal of Speech, Language, and Hearing Research, 43(6), 1429–1439.
Barriball, L. K., & While, A. (1994). Collecting data using a semi-structured interview: a
discussion paper. Journal of Advanced Nursing, 19(2), 328–335.
Beal, D. S., Gracco, V. L., Lafaille, S. J., & De Nil, L. F. (2007). Voxel-based morphometry of
auditory and speech-related cortex in stutterers. Neuroreport, 18(12), 1257–1260.
Beauvois, M. F., & Dérouesné, J. (1981). Lexical or orthographic agraphia. Brain : A Journal of
Neurology, 104(Pt 1), 21–49.
Beckman, M. E., & Edwards, J. (2000). The Ontogeny of Phonological Categories and the
Primacy of Lexical Learning in Linguistic Development. Child Development, 71(1), 240–
249.
Benecken, J., & Spindler, C. (2004). Zur psychosozialen Situation stotternder Schulkinder in
Allgemeinschulen. Die Sprachheilarbeit, 49(2), 61–70.
Besner, D., & Roberts, M. A. (2003). Reading nonwords aloud: Results requiring change in the
dual route cascaded model. Psychonomic Bulletin & Review, 10(2), 398–404.
Bishop, D. V. M. (1997). Pre- and Perinatal Hazards and Family Background in Children with
Specific Language Impairments: A Study of Twins. Brain and Language, 56(1), 1–26.
Bishop, D. V. M., Brown, B. B., & Robson, J. (1990). The Relationship Between Phoneme
Discrimination, Speech Production, and Language Comprehension in Cerebral-Palsied
Individuals. Journal of Speech, Language, and Hearing Research, 33(2), 210–219.
Bishop, D. V. M., & Leonard, L. (2014). Speech and Language Impairments in Children: Causes,
Characteristics, Intervention and Outcome. Abingdon, UK: Psychology Press.
Blomgren, M., Roy, N., Callister, T., & Merrill, R. M. (2005). Intensive Stuttering Modification
Therapy: A Multidimensional Assessment of Treatment Outcomes. Journal of Speech,
Language, and Hearing Research, 48(3), 509–523.
References
311
Blood, G. W., Ridenour Jr., V. J., Qualls, C. D., & Hammer, C. S. (2003). Co-occurring disorders
in children who stutter. Journal of Communication Disorders, 36(6), 427–448.
Bloodstein, O. (1995). A Handbook on Stuttering. San Diego, CA: Singular Publ. Group, Inc.
Bloodstein, O. (2001). Incipient and developed stuttering as two distinct disorders: Resolving a
dilemma. Journal of Fluency Disorders, 26(1), 67–73.
Bloodstein, O., & Bernstein Ratner, N. (2008). A handbook on stuttering (6th ed.). Clifton Park,
New York, NY: Delmar.
Boey, D. R. A., Wuyts, F. L., Heyning, P. H., Heylen, L., & Bodt, M. S. (2009). Characteristics of
stuttering in Dutch‐speaking individuals. Clinical Linguistics & Phonetics, 23(4), 241–
254.
Boscolo, B., Bernstein Ratner, N., & Rescorla, L. (2002). Fluency of School-Aged Children With
a History of Specific Expressive Language Impairment: An Exploratory Study. American
Journal of Speech-Language Pathology, 11(1), 41–49.
Bosshardt, H. G. (2006). Cognitive processing load as a determinant of stuttering: summary of
a research programme. Clinical Linguistics & Phonetics, 20(5), 371–385.
Boyle, C. A., Boulet, S., Schieve, L. A., Cohen, R. A., Blumberg, S. J., Yeargin-Allsopp, M., … Kogan,
M. D. (2011). Trends in the Prevalence of Developmental Disabilities in US Children,
1997–2008. Pediatrics, 127(6), 1034–1042.
Bradford, A., & Dodd, B. (1994). The motor planning abilities of phonologically disordered
children. International Journal of Language & Communication Disorders, 29(4), 349–
369.
Braun, A. R., Varga, M., Stager, S., Schulz, G., Selbie, S., Maisog, J. M., … Ludlow, C. L. (1997).
Altered patterns of cerebral activity during speech and language production in
developmental stuttering. An H2(15)O positron emission tomography study. Brain,
120(5), 761–784.
Bricker-Katz, G., Lincoln, M., & McCabe, P. (2009). A life-time of stuttering: How emotional
reactions to stuttering impact activities and participation in older people. Disability and
Rehabilitation, 31(21), 1742–1752.
Bridgeman, E., & Snowling, M. (1988). The perception of phoneme sequence: A comparison of
dyspraxic and normal children. International Journal of Language & Communication
Disorders, 23(3), 245–252.
Brindley, C., Cave, D., Crane, S., Lees, J., & Moffat, V. (1996). Paediatric Oral Skills Package.
London: Whurr Publishers.
Briscoe, J., Bishop, D. V. M., & Norbury, C. F. (2001). Phonological Processing, Language, and
Literacy: A Comparison of Children with Mild-to-moderate Sensorineural Hearing Loss
References
312
and Those with Specific Language Impairment. Journal of Child Psychology and
Psychiatry, 42(3), 329–340.
Brocklehurst, P. H., Lickley, R. J., & Corley, M. (2012). The influence of anticipation of word
misrecognition on the likelihood of stuttering. Journal of Communication Disorders,
45(3), 147–160.
Broomfield, J., & Dodd, B. (2004). The nature of referred subtypes of primary speech disability.
Child Language Teaching and Therapy, 20(2), 135–151.
Brown, S., Ingham, R. J., Ingham, J. C., Laird, A. R., & Fox, P. T. (2005). Stuttered and fluent
speech production: An ALE meta-analysis of functional neuroimaging studies. Human
Brain Mapping, 25(1), 105–117.
Brown, S.F. (1937). The influence of grammatical function on the incidence of stuttering.
Journal of Speech Disorders, 2(4), 207–215.
Brown, S. F. (1945). The Loci of Stutterings In The Speech Sequence. Journal of Speech
Disorders, 10(3), 181–192.
Brunswick, N., McCrory, E., Price, C. J., Frith, C. D., & Frith, U. (1999). Explicit and implicit
processing of words and pseudowords by adult developmental dyslexics: A search for
Wernicke's Wortschatz?. Brain, 122(10), 1901-1917.
Büchel, C., & Sommer, M. (2004). What Causes Stuttering? PLOS Biology, 2(2), e46.
Buchwald, A., & Rapp, B. (2006). Consonants and vowels in orthographic representations.
Cognitive Neuropsychology, 23(2), 308–337.
Bruyer, R., & Brysbaert, M. (2011). Combining speed and accuracy in cognitive psychology: is
the inverse efficiency score (IES) a better dependent variable than the mean reaction
time (RT) and the percentage of errors (PE)?. Psychologica Belgica, 51(1), 5-13.
Bybee, J. (2003). Phonology and Language Use. Cambridge, UK: Cambridge University Press.
Byrd, C. T., Conture, E. G., & Ohde, R. N. (2007). Phonological Priming in Young Children Who
Stutter: Holistic Versus Incremental Processing. American Journal of Speech-Language
Pathology, 16(1), 43–53.)
Byrd, C. T., Vallely, M., Anderson, J. D., & Sussman, H. (2012). Nonword repetition and
phoneme elision in adults who do and do not stutter. Journal of Fluency Disorders,
37(3), 188–201.
Cameron, H. E. (2016). Beyond cognitive deficit: the everyday lived experience of dyslexic
students at university. Disability & Society, 31(2), 223–239.
Cameron, H. E., & Nunkoosing, K. (2012). Lecturer perspectives on dyslexia and dyslexic
students within one faculty at one university in England. Teaching in Higher Education,
17(3), 341–352.
References
313
Cancho, R. F., & Solé, R. V. (2001). The small world of human language. Proceedings of the Royal
Society of London B: Biological Sciences, 268(1482), 2261–2265.
Caramazza, A. (1991). The Role of the (Output) Phonological Buffer in Reading, Writing, and
Repetition. In Issues in Reading, Writing and Speaking (pp. 93–135). Netherlands:
Springer.
Caramazza, A., & Hillis, A. E. (1990). Levels of representation, co-ordinate frames, and unilateral
neglect. Cognitive Neuropsychology, 7(5–6), 391–445.
Caramazza, A., Laudanna, A., & Romani, C. (1988). Lexical access and inflectional morphology.
Cognition, 28(3), 297–332.
Caramazza, A., & Mahon, B. Z. (2006). The organisation of conceptual knowledge in the brain:
The future’s past and some future directions. Cognitive Neuropsychology, 23(1), 13–
38.
Caramazza, A., & McCloskey, M. (1988). The case for single-patient studies. Cognitive
Neuropsychology, 5(5), 517–527.
Caramazza, A., Papagno, C., & Ruml, W. (2000). The Selective Impairment of Phonological
Processing in Speech Production. Brain and Language, 75(3), 428–450.
Caravolas, M., & Bruck, M. (1993). The Effect of Oral and Written Language Input on Children′s
Phonological Awareness: A Cross-Linguistic Study. Journal of Experimental Child
Psychology, 55(1), 1–30.
Caruso, A. J., Abbs, J. H., & Gracco, V. L. (1988). Kinematic analysis of multiple movement
coordination during speech in stutterers. Brain, 111(2), 439–455.
Cassady, J. C., Smith, L. L., & Putman, S. M. (2008). Phonological Awareness Development as a
Discrete Process: Evidence for an Integrative Model. Reading Psychology, 29(6), 508–
533.
Chang, S.-E., Erickson, K. I., Ambrose, N. G., Hasegawa-Johnson, M. A., & Ludlow, C. L. (2008).
Brain anatomy differences in childhood stuttering. NeuroImage, 39(3), 1333–1344.
Chang, S.-E., Zhu, D. C., Choo, A. L., & Angstadt, M. (2015). White matter neuroanatomical
differences in young children who stutter. Brain, 138(3), 694–711.
Chiat, S. (2000). Understanding Children with Language Problems. Cambridge, UK: Cambridge
University Press.
Chiat, S. (2001). Mapping theories of developmental language impairment: Premises,
predictions and evidence. Language and Cognitive Processes, 16(2–3), 113–142.
Cicchetti, D. V. (1994). Guidelines, criteria, and rules of thumb for evaluating normed and
standardized assessment instruments in psychology. Psychological Assessment, 6(4),
284–290.
References
314
Cirillo, F. (2007). The pomodoro technique. San Fransisco, CA: Creative Commons Attribution.
Civier, O., Kronfeld-Duenias, V., Amir, O., Ezrati-Vinacour, R., & Ben-Shachar, M. (2015).
Reduced fractional anisotropy in the anterior corpus callosum is associated with
reduced speech fluency in persistent developmental stuttering. Brain and Language,
143, 20–31.
Civier, O., Tasko, S. M., & Guenther, F. H. (2010). Overreliance on auditory feedback may lead
to sound/syllable repetitions: Simulations of stuttering and fluency-inducing
conditions with a neural model of speech production. Journal of Fluency Disorders,
35(3), 246–279.
Clegg, J., Hollis, C., Mawhood, L., & Rutter, M. (2005). Developmental language disorders – a
follow-up in later adult life. Cognitive, language and psychosocial outcomes. Journal of
Child Psychology and Psychiatry, 46(2), 128–149.
Clopper, C. G. (2002). Frequency of stress patterns in English: A computational analysis. IULC
Working Papers Online, 2(2).
Coady, J. A., & Evans, J. L. (2008). Uses and interpretations of non‐word repetition tasks in
children with and without specific language impairments (SLI). International Journal of
Language & Communication Disorders, 43(1), 1–40.
Cohen, N. J., Vallance, D. D., Barwick, M., Im, N., Menna, R., Horodezky, N. B., & Isaacson, L.
(2000). The Interface between ADHD and Language Impairment: An Examination of
Language, Achievement, and Cognitive Processing. Journal of Child Psychology and
Psychiatry, 41(3), 353–362.
Colcord, R. D., & Adams, M. R. (1979). Voicing Duration and Vocal SPL Changes Associated with
Stuttering Reduction During Singing. Journal of Speech, Language, and Hearing
Research, 22(3), 468–479.
Coltheart, M. (2013). The Cognitive Neuropsychology of Language (Psychology Revivals).
Abingdon, UK: Psychology Press.
Coltheart, M., Masterson, J., Byng, S., Prior, M., & Riddoch, J. (1983). Surface dyslexia. The
Quarterly Journal of Experimental Psychology Section A, 35(3), 469–495.
Coltheart, M., Patterson, K. E., & Marshall, J. C. (1980). Deep dyslexia since 1980. In M.
Coltheart, K. E. Patterson, & J. C. Marshall (Eds.), Deep dyslexia, 2nd ed (pp. 407–451).
New York, NY: Routledge.
Coltheart, M., Rastle, K., Perry, C., Langdon, R., & Ziegler, J. (2001). DRC: A dual route cascaded
model of visual word recognition and reading aloud. Psychological Review, 108(1),
204–256.
References
315
Coltheart, M., Sartori, G., & Job, R. (1987). The cognitive neuropsychology of language.
Hillsdale, NJ: Lawrence Erlbaum Associates, Inc.
Connally, E. L., Ward, D., Howell, P., & Watkins, K. E. (2014). Disrupted white matter in language
and motor tracts in developmental stuttering. Brain and Language, 131, 25–35.
Constable, A., Stackhouse, J., & Wells, B. (1997). Developmental word-finding difficulties and
phonological processing: The case of the missing handcuffs. Applied Psycholinguistics,
18(4), 507–536.
Conti-Ramsden, G., Botting, N., Simkin, Z., & Knox, E. (2001). Follow-up of children attending
infant language units: outcomes at 11 years of age. International Journal of Language
& Communication Disorders, 36(2), 207–219.
Cop, U., Keuleers, E., Drieghe, D., & Duyck, W. (2015). Frequency effects in monolingual and
bilingual natural reading. Psychonomic Bulletin & Review, 22(5), 1216–1234.
Cortina, J. M. (1993). What is coefficient alpha? An examination of theory and applications.
Journal of Applied Psychology, 78(1), 98–104.
Craig, A. R., & Calver, P. (1991). Following Up on Treated StutterersStudies of Perceptions of
Fluency and Job Status. Journal of Speech, Language, and Hearing Research, 34(2),
279–284.
Craig, A., & Tran, Y. (2005). The epidemiology of stuttering: The need for reliable estimates of
prevalence and anxiety levels over the lifespan. Advances in Speech Language
Pathology, 7(1), 41–46.
Craig, A., Hancock, K., Tran, Y., Craig, M., & Peters, K. (2002). Epidemiology of Stuttering in the
Community Across the Entire Life Span. Journal of Speech, Language, and Hearing
Research, 45(6), 1097–1105.
Craig, A., & Tran, Y. (2014). Trait and social anxiety in adults with chronic stuttering: Conclusions
following meta-analysis. Journal of Fluency Disorders, 40, 35–43.
Crichton-Smith, I. (2002). Communicating in the real world: accounts from people who
stammer. Journal of Fluency Disorders, 27(4), 333–352.
Crosbie, S., Holm, A., & Dodd, B. (2005). Intervention for children with severe speech disorder:
A comparison of two approaches. International Journal of Language & Communication
Disorders, 40(4), 467–491.
Cuetos, F., Aguado, G., & Caramazza, A. (2000). Dissociation of Semantic and Phonological
Errors in Naming. Brain and Language, 75(3), 451–460.
Curlee, R. F. (2004). Stuttering. In R. D. Kent (Ed.), The MIT encyclopedia of Communication
disorders. London: The MIT Press.
References
316
Cutler, A., & Carter, D. M. (1987). The predominance of strong initial syllables in the English
vocabulary. Computer Speech & Language, 2(3), 133–142.
Cykowski, M. D., Fox, P. T., Ingham, R. J., Ingham, J. C., & Robin, D. A. (2010). A study of the
reproducibility and etiology of diffusion anisotropy differences in developmental
stuttering: A potential role for impaired myelination. NeuroImage, 52(4), 1495–1504.
Cykowski, M. D., Kochunov, P. V., Ingham, R. J., Ingham, J. C., Mangin, J.-F., Rivière, D., … Fox,
P. T. (2008). Perisylvian Sulcal Morphology and Cerebral Asymmetry Patterns in Adults
Who Stutter. Cerebral Cortex, 18(3), 571–583.
Daneman, M. (1991). Working memory as a predictor of verbal fluency. Journal of
Psycholinguistic Research, 20(6), 445–464.
Davies, M. (2016). Word frequency: based on 450 million word COCA corpus. Retrieved 10
December 2016, from http://www.wordfrequency.info/compare_bnc.asp
De Bleser, R., Cholewa, J., & Tabatabaie, N. S. S. (1997). LeMo, an Expert System for Single Case
Assessment of W ord Processing Impairments in Aphasic Patients. Neuropsychological
Rehabilitation, 7(4), 339–366.
De Nil, L. F., & Brutten, G. J. (1991). Voice onset times of stuttering and nonstuttering children:
The influence of externally and linguistically imposed time pressure. Journal of Fluency
Disorders, 16(2), 143–158.
De Nil, L. F. (1995). Linguistic and motor approaches to stuttering: Exploring unification.
Presented at the Annual Convention of the American Speech-Language-Hearing
Association, Orlando, Florida.
De Nil, L. F., Beal, D. S., Sophie J. Lafaille, Kroll, R. M., Crawley, A. P., & Gracco, V. L. (2008). The
effects of simulated stuttering and prolonged speech on the neural activation patterns
of stuttering and nonstuttering adults. Brain and Language, 107(2), 114–123.
De Nil, L. F, & Kroll, R. M. (2001). Searching for the neural basis of stuttering treatment
outcome: recent neuroimaging studies. Clinical Linguistics & Phonetics, 15(1–2), 163–
168.
De Nil, L. F, Kroll, R. M., Kapur, S., & Houle, S. (2000). A Positron Emission Tomography Study
of Silent and Oral Single Word Reading in Stuttering and Nonstuttering Adults. Journal
of Speech, Language, and Hearing Research, 43(4), 1038–1053.
De Nil, L. F, Kroll, R. M., Lafaille, S. J., & Houle, S. (2003). A positron emission tomography study
of short- and long-term treatment effects on functional brain activation in adults who
stutter. Journal of Fluency Disorders, 28(4), 357–380.
DeCarlo, L. T. (1997). On the meaning and use of kurtosis. Psychological Methods, 2(3), 292–
307.
References
317
Denzin, N. K., & Lincoln, Y. S. (2011). The SAGE Handbook of Qualitative Research. Thousand
Oaks, CA: SAGE.
Dodd, B., Hua, Z., & Shatford, C. (2000). Does speech disorder spontaneously resolve? Current
Research in Language and Communication Science, 1, 3–10.
Dodd, B. (2013). Differential Diagnosis and Treatment of Children with Speech Disorder.
Hoboken, NJ: John Wiley & Sons.
Domahs, F., De Bleser, R., & Eisenberg, P. (2001). Silbische Aspekte segmentalen Schreibens -
neurolinguistische Evidenz. Linguistische Berichte, (185), 13–29.
Duffy, J. R. (2013). Motor Speech Disorders: Substrates, Differential Diagnosis, and
Management. Missouri: Elsevier Health Sciences.
Dutilh, G., Wagenmakers, E. J., Visser, I., & van der Maas, H. L. (2011). A phase transition model
for the speed‐accuracy trade‐off in response time experiments. Cognitive Science,
35(2), 211-250.
Edwards, J., Fourakis, M., Beckman, M. E., & Fox, R. A. (1999). Characterizing Knowledge
Deficits in Phonological Disorders. Journal of Speech, Language, and Hearing Research,
42(1), 169–186.
Ellis, A. W. (1987). Intimations of modularity, or, the modularity of mind: Doing cognitive
neuropsychology without syndromes. In M. Coltheart, G. Sartori, & Job (Eds.), The
cognitive neruopsycholgy of language. (pp. 397–408). Hove, UK: Lawrence Erlbaum
Associates Ltd.
Ellis, A. W., & Young, A. W. (2013). Human Cognitive Neuropsychology: A Textbook With
Readings. Abingdon, UK: Psychology Press.
Ellis, A. W. (2016). Reading, Writing and Dyslexia (Classic Edition): A Cognitive Analysis.
Abingdon, UK: Psychology Press.
Ellis, N. C. (2003). Constructions, chunking, and connectionism: The emergence of second
language structure. In C. J. Doughty & M. H. Long (Eds.), The handbook of second
language acquisition. Oxford, UK: Blackwell Publishing Ltd.
Enderby, P., & Philipp, R. (1986). Speech and language handicap: Towards knowing the size of
the problem. British Journal of Disorders of Communication, 21(2), 151–165.
Evans, J. L. (2001). An emergent account of language impairments in children with SLI:
implications for assessment and intervention. Journal of Communication Disorders,
34(1–2), 39–54.
Fagnani, C., Fibiger, S., Skytthe, A., & Hjelmborg, J. V. B. (2011). Heritability and environmental
effects for self-reported periods with stuttering: A twin study from Denmark.
Logopedics Phoniatrics Vocology, 36(3), 114–120.
References
318
Farnetani, E., & Recasens, D. (2010). Coarticulation and Connected Speech Processes. In W. J.
Hardcastle, J. Laver, & Gibbon (Eds.), Handbook of Phonetic Sciences (pp. 316–352).
Oxford, UK: Blackwell Publishing Ltd.
Felsenfeld, S., Kirk, K. M., Zhu, G., Statham, D. J., Neale, M. C., & Martin, N. G. (2000). A Study
of the Genetic and Environmental Etiology of Stuttering in a Selected Twin Sample.
Behavior Genetics, 30(5), 359–366.
Ferguson, C. A., & Farwell, C. B. (2011). Words and sounds in early language acquisition: English
initial consonants in the first fifty words. In W. S. Wang (Ed.), The Lexicon in
Phonological Change (pp. 419–439). Berlin, Germany: De Gruyter.
Ferreira, F., & Swets, B. (2002). How Incremental Is Language Production? Evidence from the
Production of Utterances Requiring the Computation of Arithmetic Sums. Journal of
Memory and Language, 46(1), 57–84.
Field, A. (2013). Discovering Statistics Using IBM SPSS Statistics. Thousand Oaks, CA: SAGE.
Fisher, S. E., Lai, C. S. L., & Monaco, A. P. (2003). Deciphering the Genetic Basis of Speech and
Language Disorders. Annual Review of Neuroscience, 26(1), 57–80.
Ford, M. A., Marslen-Wilson, W. D., & Davis, M. H. (2003). Morphology and frequency:
contrasting methodologies. In R. H. Baayen & R. Schreuder (Eds.), Morphological
Structure in Language Processing (pp. 89–124). Berlin, Germany: Mouton de Gruyter.
Forster, D. C., & Webster, W. G. (2001). Speech-Motor Control and Interhemispheric Relations
in Recovered and Persistent Stuttering. Developmental Neuropsychology, 19(2), 125–
145.
Forster, K. I., & Chambers, S. M. (1973). Lexical access and naming time. Journal of Verbal
Learning and Verbal Behavior, 12(6), 627–635.
Foundas, A. L., Bollich, A. M., Corey, D. M., Hurley, M., & Heilman, K. M. (2001). Anomalous
anatomy of speech–language areas in adults with persistent developmental stuttering.
Neurology, 57(2), 207–215.
Foundas, A. L., Bollich, A. M., Feldman, J., Corey, D. M., Hurley, M., Lemen, L. C., & Heilman, K.
M. (2004). Aberrant auditory processing and atypical planum temporale in
developmental stuttering. Neurology, 63(9), 1640–1646.
Fowler, C. A. (2007). Speech production. In M.G. Gaskell (Ed.), The Oxford Handbook of
Psycholinguistics. Oxford, UK: Oxford University Press.
Fowlert, A. E., Swainson, B., & Scarborough, H. (2004). Relationships of naming skills to reading,
memory, and receptive vocabulary: Evidence for imprecise phonological
representations of words by poor readers. Annals of Dyslexia, 54(2), 247.
References
319
Fox, A. V., Dodd, B., & Howard, D. (2002). Risk factors for speech disorders in children.
International Journal of Language & Communication Disorders, 37(2), 117–131.
Fox, P. T. (2003). Brain imaging in stuttering: where next? Journal of fluency disorders, 28(4),
265–272.
Fox, P. T., Ingham, R. J., Ingham, J. C., Hirsch, T. B., Downs, J. H., Martin, C., … Lancaster, J. L.
(1996). A PET study of the neural systems of stuttering, 382(6587), 158–162.
Franklin, S. (1989). Dissociations in auditory word comprehension; evidence from nine fluent
aphasic patients. Aphasiology, 3(3), 189–207.
Frisch, S. A., Large, N. R., & Pisoni, D. B. (2000). Perception of Wordlikeness: Effects of Segment
Probability and Length on the Processing of Nonwords. Journal of Memory and
Language, 42(4), 481–496.
Frith, U. (1985). Beneath the surface of developmental dyslexia. In K. E. Patterson, J. C.
Marshall, & M. Coltheart (Eds.), Surface Dyslexia: Neuropsychological and cognitive
studies of phonological reading (pp. 301–330). Hillsdale, NJ: Lawrence Erlbaum
Associates.
Garrison, D. R., & Kanuka, H. (2004). Blended learning: Uncovering its transformative potential
in higher education. The Internet and Higher Education, 7(2), 95–105.
Gaskell, M. G. (2007). The Oxford Handbook of Psycholinguistics. Oxford, UK: Oxford University
Press.
Gathercole, S. E., Willis, C. S., Baddeley, A. D., & Emslie, H. (1994). The children’s test of
nonword repetition: A test of phonological working memory. Memory, 2(2), 103–127.
Geronikou, E., & Rees, R. (2016). Psycholinguistic profiling reveals underlying impairments for
Greek children with speech disorders. Child Language Teaching and Therapy, 32(1),
95–110.
Gillon, G. T. (2017). Phonological awareness (2nd ed.): From research to practice. New York, NY:
Guilford Publications.
Goodman, R. A., & Caramazza, A. (1986). Aspects of the spelling process: Evidence from a case
of acquired dysgraphia. Language and Cognitive Processes, 1(4), 263–296.
Goswami, U. (2000). Phonological representations, reading development and dyslexia: towards
a cross-linguistic theoretical framework. Dyslexia, 6(2), 133–151.
Gravetter, F. J., & Wallnau, L. B. (2016). Statistics for The Behavioral Sciences. Boston, MA:
Cengage Learning.
Greenberg, S. (2005). A multi-tier framework for understanding spoken language. In S.
Greenberg & W. Ainsworth (Eds.), Listening to Speech: A Auditory Perspective.
Hillsdale, NJ: Erlbaum.
References
320
Guenther, F. H., Hampson, M., & Johnson, D. (1998). A theoretical investigation of reference
frames for the planning of speech movements. Psychological Review, 105(4), 611–633.
Guitar, B. (2013). Stuttering: An Integrated Approach to Its Nature and Treatment. Baltimore,
MD: Lippincott Williams & Wilkins.
Guitar, B., & Conture, E. G. (2007). The child who stutters: to the paediatrician (4th ed.).
Memphis, TN: The Stuttering Foundation of America.
Guitar, B., Guitar, C., Neilson, P., O’Dwyer, N., & Andrews, G. (1988). Onset Sequencing of
Selected Lip Muscles in Stutterers and Nonstutterers. Journal of Speech, Language, and
Hearing Research, 31(1), 28–35.
Gunn, A., Menzies, R. G., O’Brian, S., Onslow, M., Packman, A., Lowe, R., … Block, S. (2014). Axis
I anxiety and mental health disorders among stuttering adolescents. Journal of Fluency
Disorders, 40, 58–68.
Gupta, P. (2003). Examining the relationship between word learning, nonword repetition, and
immediate serial recall in adults. The Quarterly Journal of Experimental Psychology
Section A, 56(7), 1213–1236.
Habib, M. (2000). The neurological basis of developmental dyslexiaAn overview and working
hypothesis. Brain, 123(12), 2373–2399.
Hakim, H. B., & Bersntein Ratner, N. (2004). Nonword repetition abilities of children who
stutter: an exploratory study. Journal of Fluency Disorders, 29(3), 179–199.
Hall, J. W., & Jerger, J. (1978). Central Auditory Function in Stutterers. Journal of Speech,
Language, and Hearing Research, 21(2), 324–337.
Hall, N., Wagovich, S. A., & Bernstein Ratner, N. (2007). Language considerations in childhood
stuttering. In E. G. Conture & R. F. Curlee (Eds.), Stuttering and related disorders of
fluency (pp. 153–167). New York, NY: Thieme.
Hartsuiker, R. J., Bastiaanse, R., Postma, A., & Wijnen, F. (2005). Phonological Encoding and
Monitoring in Normal and Pathological Speech. Abingdon, UK: Psychology Press.
Hatfield, F. M., & Patterson, K. E. (1983). Phonological spelling. The Quarterly Journal of
Experimental Psychology Section A, 35(3), 451–468.
Hayes, H., Treiman, R., & Kessler, B. (2006). Children use vowels to help them spell consonants.
Journal of Experimental Child Psychology, 94(1), 27–42.
Hayhow, R. (1999). The Bristol Stammering Research project. Speaking out, 20, 1(2), 5.
Hearne, A., Packman, A., Onslow, M., & Quine, S. (2008). Stuttering and its treatment in
adolescence: The perceptions of people who stutter. Journal of Fluency Disorders,
33(2), 81–98.
References
321
Heller, J. R., & Goldrick, M. (2014). Grammatical constraints on phonological encoding in
speech production. Psychonomic Bulletin & Review, 21(6), 1576–1582.
Hennessey, N. W., Nang, C. Y., & Beilby, J. M. (2008). Speeded verbal responding in adults who
stutter: Are there deficits in linguistic encoding? Journal of Fluency Disorders, 33(3),
180–202.
Herzka, T. B., & Koesling, C. (2008). Stottern im Kindesalter. Stuttgart, Germany: Georg Thieme
Verlag.
Hewlett, N., Gibbon, F., & Cohen-McKenzie, W. (1998). When is a velar an alveolar? Evidence
supporting a revised psycholinguistic model of speech production in children.
International Journal of Language & Communication Disorders, 33(2), 161–176.
Hickok, G., Houde, J., & Rong, F. (2011). Sensorimotor Integration in Speech Processing:
Computational Basis and Neural Organization. Neuron, 69(3), 407–422.
Hicks, M., Reid, I., & George, R. (2001). Enhancing on-line teaching: Designing responsive
learning environments. International Journal for Academic Development, 6(2), 143–
151.
Hind, S. (2006). Survey of care pathway for auditory processing disorder. Audiological
Medicine, 4(1), 12–24.
Holliman, A. J., Wood, C., & Sheehy, K. (2010). Does speech rhythm sensitivity predict children’s
reading ability 1 year later? Journal of Educational Psychology, 102(2), 356–366.
Holliman, A. J., Wood, C., & Sheehy, K. (2012). A cross-sectional study of prosodic sensitivity
and reading difficulties. Journal of Research in Reading, 35(1), 32–48.
Holm, A., & Dodd, B. (1999). Differential diagnosis of phonological disorder in two bilingual
children acquiring Italian and English. Clinical Linguistics & Phonetics, 13(2), 113–129.
Howell, P. (2004). Assessment of Some Contemporary Theories of Stuttering That Apply to
Spontaneous Speech. Contemporary Issues in Communication Science and Disorders :
CICSD, 31, 122–139.
Howell, P., & Au-Yeung, J. (2002). The EXPLAN theory of fluency control applied to the diagnosis
of stuttering. In E. Fava (Ed.), Clinical linguistics: theory and applications in speech
pathology and therapy. Amsterdam, Netherlands: John Benjamins Publishing.
Howell, P., Au-Yeung, J., Yaruss, S., & Eldridge, K. (2006). Phonetic difficulty and stuttering in
English. Clinical Linguistics & Phonetics, 20(9), 703–716.
Ingham, R. J., Ingham, J. C., Finn, P., & Fox, P. T. (2003). Towards a functional neural systems
model of developmental stuttering. Journal of Fluency Disorders, 28(4), 297–318.
References
322
International Expert Panel on Multilingual Children’s Speech. (2012). Multilingual children with
speech sound disorders: Position paper. Bathurst, NSW, Australia: Research Institute
for Professional Practice, Learning and Education (RIPPLE), Charles Stuart University.
Iverach, L., Jones, M., O’Brian, S., Block, S., Lincoln, M., Harrison, E., … Onslow, M. (2009).
Screening for personality disorders among adults seeking speech treatment for
stuttering. Journal of Fluency Disorders, 34(3), 173–186.
Jackson, E. S., Yaruss, J. S., Quesal, R. W., Terranova, V., & Whalen, D. H. (2015). Responses of
adults who stutter to the anticipation of stuttering. Journal of Fluency Disorders, 45,
38–51.
Jahn, T. (2007). Phonologische Störungen bei Kindern: Diagnostik und Therapie. Stuttgart,
Germany: Georg Thieme Verlag.
Jescheniak, J. D., Hahne, A., & Schriefers, H. (2003). Information flow in the mental lexicon
during speech planning: evidence from event-related brain potentials. Cognitive Brain
Research, 15(3), 261–276.
Jones, M., Onslow, M., Harrison, E., & Packman, A. (2000). Treating Stuttering in Young
ChildrenPredicting Treatment Time in the Lidcombe Program. Journal of Speech,
Language, and Hearing Research, 43(6), 1440–1450.
Jusczyk, P. W., Cutler, A., & Redanz, N. J. (1993). Infants’ Preference for the Predominant Stress
Patterns of English Words. Child Development, 64(3), 675–687.
Kalinowski, J., & Saltuklaroglu, T. (2003). Choral speech: the amelioration of stuttering via
imitation and the mirror neuronal system. Neuroscience & Biobehavioral Reviews,
27(4), 339–347.
Kang, C., Riazuddin, S., Mundorff, J., Krasnewich, D., Friedman, P., Mullikin, J. C., & Drayna, D.
(2010). Mutations in the Lysosomal Enzyme–Targeting Pathway and Persistent
Stuttering. New England Journal of Medicine, 362(8), 677–685.
Kapatsinski, V. M. (2006). Towards a single-mechanism account of frequency effects.
Proceedings of LACUS 32: Networks, 325–335.
Kay, J., Lesser, R., & Coltheart, M. (2009). PALPA: Psycholinguistic assessments of language
processing in aphasia. Abingdon, UK: Psychology Press.
Kay, J. M., Lesser, R., & Coltheart, M. (1992). PALPA: psycholinguistic assessment of language
performance in aphasia. Hove, UK: Lawrence Erlbaum Associaroes.
Kell, C. A., Neumann, K., von Kriegstein, K., Posenenske, C., Gudenberg, V., W, A., … Giraud, A.-
L. (2009). How the brain repairs stuttering. Brain, 132(10), 2747–2760.
Keuleers, E., & Brysbaert, M. (2010). Wuggy: A multilingual pseudoword generator. Behavior
Research Methods, 42(3), 627–633.
References
323
Kincheloe, J. L., McLaren, P., & Steinberg, S. R. (2011). Critical pedagogy and qualitative
research. In N. K. Denzin & Y. S. Lincoln (Eds.), The SAGE handbook of qualitative
research (pp. 163–177). Thousand Oaks, CA: SAGE.
Kleinow, J., & Smith, A. (2000). Influences of length and syntactic complexity on the speech
motor stability of the fluent speech of adults who stutter. Journal of Speech, Language,
and Hearing Research: JSLHR, 43(2), 548–559.
Klompas, M., & Ross, E. (2004). Life experiences of people who stutter, and the perceived
impact of stuttering on quality of life: personal accounts of South African individuals.
Journal of Fluency Disorders, 29(4), 275–305.
Kloth, S., Janssen, P., Kraaimaat, F. W., & Brutten, G. J. (1995). Speech-motor and linguistic skills
of young stutterers prior to onset. Journal of Fluency Disorders, 20(2), 157–170.
Kloth, S., Janssen, P., Kraaimaat, F., & Brutten, G. J. (1998). Child and mother variables in the
development of stuttering among high-risk children. Journal of Fluency Disorders,
23(4), 217–230.
Kolb, A. Y., & Kolb, D. A. (2005). Learning Styles and Learning Spaces: Enhancing Experiential
Learning in Higher Education. Academy of Management Learning & Education, 4(2),
193–212.
Kolk, H., & Postma, A. (1997). Stuttering as a covert repair hypothesis. In R. F. Curlee & G. M.
Siegel (Eds.), Nature and treatment of stuttering: New directions. Boston, MA: Allyn &
Bacon.
Kraft, S. J., & Yairi, E. (2012). Genetic Bases of Stuttering: The State of the Art, 2011. Folia
Phoniatrica et Logopaedica, 64(1), 34–47.
Kronfeld-Duenias, V., Amir, O., Ezrati-Vinacour, R., Civier, O., & Ben-Shachar, M. (2016). The
frontal aslant tract underlies speech fluency in persistent developmental stuttering.
Brain Structure and Function, 221(1), 365–381.
Lacy, P. (2007). The Cambridge Handbook of Phonology. Cambridge, UK: Cambridge University
Press.
Landerl, K., & Wimmer, H. (2000). Deficits in phoneme segmentation are not the core problem
of dyslexia: Evidence from German and English children. Applied Psycholinguistics,
21(2), 243–262.
LaSalle, L. R., & Wolk, L. (2011). Stuttering, cluttering, and phonological complexity: Case
studies. Journal of Fluency Disorders, 36(4), 285–289.
Law, J., Boyle, J., Harris, F., Harkness, A., & Nye, C. (2000). Prevalence and natural history of
primary speech and language delay: findings from a systematic review of the literature.
International Journal of Language & Communication Disorders, 35(2), 165–188.
References
324
Lees, J. (2005). Children with acquired aphasias. London, UK: Whurr Publishers.
Levelt, W. J. M. (1993). Speaking: From Intention to Articulation. London, UK: MIT Press.
Levelt, W. J. M. (1999). Models of word production. Trends in Cognitive Sciences, 3(6), 223–
232.
Lichtenberger, E. O., & Smith, D. R. (2005). Essentials of WIAT-II and KTEA-II Assessment.
Hoboken, NJ: John Wiley & Sons.
Litt, R. A., & Nation, K. (2014). The nature and specificity of paired associate learning deficits in
children with dyslexia. Journal of Memory and Language, 71(1), 71–88.
Logan, K. J. (2003). The effect of syntactic structure upon speech initiation times of stuttering
and nonstuttering speakers. Journal of Fluency Disorders, 28(1), 17–35.
Logue-Kennedy, M., Lyons, R., Carroll, C., Byrne, M., Dignan, E., & O’Hagan, L. (2011). Services
for Children With Central Auditory Processing Disorder in the Republic of Ireland:
Current and Future Service Provision. American Journal of Audiology, 20(1), 9–18.
Lonigan, C. J., Burgess, S. R., & Anthony, J. L. (2000). Development of emergent literacy and
early reading skills in preschool children: Evidence from a latent-variable longitudinal
study. Developmental Psychology, 36(5), 596–613.
Loucks, T., Kraft, S. J., Choo, A. L., Sharma, H., & Ambrose, N. G. (2011). Functional brain
activation differences in stuttering identified with a rapid fMRI sequence. Journal of
Fluency Disorders, 36(4), 302–307.
Lousada, M., Jesus, L. M. T., Hall, A., & Joffe, V. (2014). Intelligibility as a clinical outcome
measure following intervention with children with phonologically based speech–sound
disorders. International Journal of Language & Communication Disorders, 49(5), 584–
601.
Macmillan, N. A., & Creelman, C. D. (2004). Detection Theory: A User’s Guide. Abingdon, UK:
Psychology Press.
Massey, F. J. (1951). The Kolmogorov-Smirnov Test for Goodness of Fit. Journal of the American
Statistical Association, 46(253), 68–78.
Max, L., Guenther, F. H., Gracco, V. L., Ghosh, S. S., & Wallace, M. E. (2004). Unstable or
insufficiently activated internal models and feedback-biased motor control as sources
of dysfluency: A theoretical model of stuttering. Contemporary issues in
communication science and disorders, 31, 105–122.
Max, L., & Yudman, E. M. (2003). Accuracy and Variability of Isochronous Rhythmic Timing
Across Motor Systems in Stuttering Versus Nonstuttering Individuals. Journal of
Speech, Language, and Hearing Research, 46(1), 146–163.
References
325
McCarthy, R., & Warrington, E. K. (1986). Phonological Reading: Phenomena and Paradoxes.
Cortex, 22(3), 359–380.
McCrae, R. R., Kurtz, J. E., Yamagata, S., & Terracciano, A. (2011). Internal Consistency, Retest
Reliability, and their Implications For Personality Scale Validity. Personality and Social
Psychology Review : An Official Journal of the Society for Personality and Social
Psychology, Inc, 15(1), 28–50.
McDonald, R. P. (2013). Test Theory: A Unified Treatment. Abingdon, UK: Psychology Press.
McFarlane, S. C., & Prins, D. (1978). Neural Response Time of Stutterers and Nonstutterers in
Selected Oral Motor Tasks. Journal of Speech, Language, and Hearing Research, 21(4),
768–778.
McLeod, S., & Baker, E. (2017). Children’s speech: An evidence-based approach to assessment
and intervention. Boston, MA: Pearson Education.
McQueen, J. M. (2005). Speech perception. In K. Lamberts & Goldstone (Eds.), The Handbook
of Cognition. (pp. 255–275). Thousand Oaks, CA: SAGE.
Melnick, K. S., Conture, E. G., & Ohde, R. N. (2003). Phonological Priming in Picture Naming of
Young Children Who Stutter. Journal of Speech, Language, and Hearing Research,
46(6), 1428–1443.
Messenger, M., Onslow, M., Packman, A., & Menzies, R. (2004). Social anxiety in stuttering:
measuring negative social expectancies. Journal of Fluency Disorders, 29(3), 201–212.
Milloy, N., & Morgan-Barry, R. (1990). Developmental neurological disorders. In P. Grunwell
(Ed.), Developmental Speech Disorders. London, UK: Churchill Livingstone.
Moats, L. C. (2000). Speech to print: Language essentials for teachers. Baltimore, MD: Brookes
Publishing
Molt, L. F., & Guilford, A. M. (1979). Auditory processing and anxiety in stutterers. Journal of
Fluency Disorders, 4(4), 255–267.
Morton, J. (1970). A functional model for memory. In D. A. Norman (Ed.), Models of human
memory. New York, NY: Academic Press.
Morton, J. (1979). Facilitation in Word Recognition: Experiments Causing Change in the
Logogen Model. In P. A. Kolers, M. E. Wrolstad, & H. Bouma (Eds.), Processing of Visible
Language (pp. 259–268). New York, NY: Springer US.
Morton, J. (1980). The logogen model and orthographic structure. In U. Frith (Ed.), Cognitive
process in spelling. London, UK: Academic Press.
Moss, H. E., Tyler, L. K., & Taylor, K. I. (2007). Conceptual structure. In M.G. Gaskell (Ed.), The
Oyford Handbook of Psycholinguistics. Oxford, UK: Oxford University Press.
References
326
Musiek, F. E., & Chermak, G. D. (2013). Handbook of Central Auditory Processing Disorder,
Volume I, Second Edition: Auditory Neuroscience and Diagnosis. San Diego, CA: Plural
Publishing.
Muter, V., Hulme, C., Snowling, M. J., & Stevenson, J. (2004). Phonemes, Rimes, Vocabulary,
and Grammatical Skills as Foundations of Early Reading Development: Evidence From
a Longitudinal Study. Developmental Psychology, 40(5), 665–681.
Namasivayam, A. K., & van Lieshout, P. (2011). Speech Motor Skill and Stuttering. Journal of
Motor Behavior, 43(6), 477–489.
Nathan, L., & Wells, B. (2001). Can children with speech difficulties process an unfamiliar
accent? Applied Psycholinguistics, 22(3), 343–361.
Nathan, L., Stackhouse, J., Goulandris, N., & Snowling, M. J. (2004). The Development of Early
Literacy Skills Among Children With Speech Difficulties: A Test of the ‘Critical Age
Hypothesis’. Journal of Speech Language and Hearing Research, 47(2), 377.
Neef, N. E., Anwander, A., & Friederici, A. D. (2015). The Neurobiological Grounding of
Persistent Stuttering: from Structure to Function. Current Neurology and Neuroscience
Reports, 15(9), 63.
Neilson, M. D., & Neilson, P. D. (1987). Speech motor control and stuttering: A computational
model of adaptive sensory-motor processing. Speech Communication, 6(4), 325–333.
Neumann, K., Euler, H. A., Gudenberg, A. W. von, Giraud, A.-L., Lanfermann, H., Gall, V., &
Preibisch, C. (2003). The nature and treatment of stuttering as revealed by fMRI.
Journal of Fluency Disorders, 28(4), 381–410.
Neumann, K., Preibisch, C., Euler, H. A., Gudenberg, A. W. von, Lanfermann, H., Gall, V., &
Giraud, A.-L. (2005). Cortical plasticity associated with stuttering therapy. Journal of
Fluency Disorders, 30(1), 23–39.
New, B., Ferrand, L., Pallier, C., & Brysbaert, M. (2006). Reexamining the word length effect in
visual word recognition: New evidence from the English Lexicon Project. Psychonomic
Bulletin & Review, 13(1), 45–52.
Newcombe, F., & Marshall, J. C. (1980). Transcoding and lexical stabilisation. Deep Dyslexia,
176–188.
Newcombe, F., & Marshall, J. C. (1985). Reading and writing by letter sounds. In K. E. Patterson,
J. C. Marshall, & M. Coltheart (Eds.), Surface dyslexia. (pp. 35–50). Hove, UK: Lawrence
Erlbaum Associates Ltd.
Newton, C. (2012). Between-word processes in children with speech difficulties: insights from
a usage-based approach to phonology. Clinical Linguistics & Phonetics, 26(8), 712–727.
References
327
Nippold, M. A. (2001). Phonological disorders and stuttering in children: what is the frequency
of co-occurrence? Clinical Linguistics & Phonetics, 15(3), 219–228.
Nippold, M. A. (2007). Later Language Development: The School-Age and Adolescent Years.
Second Edition. (3rd ed.). Austin, TX: Pro-Ed.
Norcliffe, E., Harris, A. C., & Jaeger, T. F. (2015). Cross-linguistic psycholinguistics and its critical
role in theory development: early beginnings and recent advances. Language,
Cognition and Neuroscience, 30(9), 1009–1032.
Novak, J. D. (2011). A theory of education: Meaningful learning underlies the constructive
integration of thinking, feeling, and acting leading to empowerment for commitment
and responsibility. Meaningful Learning Review, 1(2), 1–14.
Ntourou, K., Conture, E. G., & Lipsey, M. W. (2011). Language Abilities of Children Who Stutter:
A Meta-Analytical Review. American Journal of Speech-Language Pathology, 20(3),
163–179.
Nudelman, H. B., Herbrich, K. E., Hoyt, B. D., & Rosenfield, D. B. (1989). A neuroscience model
of stuttering. Journal of Fluency Disorders, 14(6), 399–427.
Nudelmann, H. B., Herbrich, K. E., Hess, K. R., Hoyt, B. D., & Rosenfield, D. B. (1992). A model
of the phonatory response time of stutterers and fluent speakers to frequency‐
modulated tones, 92(4), 1882–1888.
O’Brian, S., Jones, M., Packman, A., Menzies, R., & Onslow, M. (2011). Stuttering severity and
educational attainment. Journal of Fluency Disorders, 36(2), 86–92.
Olander, L., Smith, A., & Zelaznik, H. (2010). Evidence That a Motor Timing Deficit Is a Factor in
the Development of Stuttering. Journal of Speech, Language, and Hearing Research :
JSLHR, 53(4), 876–886.
Onslow, M., Jones, M., O’Brian, S., Menzies, R., & Packman, A. (2008). Defining, Identifying, and
Evaluating Clinical Trials of Stuttering Treatments: A Tutorial for Clinicians. American
Journal of Speech-Language Pathology, 17(4), 401–415.
Ooki, S. (2005). Genetic and Environmental Influences on Stuttering and Tics in Japanese Twin
Children. Twin Research and Human Genetics, 8(1), 69–75.
Oppenheim, G. M., & Dell, G. S. (2008). Inner speech slips exhibit lexical bias, but not the
phonemic similarity effect. Cognition, 106(1), 528–537.
Öztuna, D., Elhan, A. H., & Tüccar, E. (2006). Investigation of Four Different Normality Tests in
Terms of Type 1 Error Rate and Power under Different Distributions. Turkish Journal of
Medical Sciences, 36(3), 171–176.
References
328
Pachigar, V., Stansfield, J., & Goldbart, J. (2011). Beliefs and attitudes of primary school
teachers in Mumbai, India towards children who stutter.International Journal of
Disability, Development and Education, 58(3), 287-302.
Packman, A. (2012). Theory and therapy in stuttering: A complex relationship. Journal of
Fluency Disorders, 37(4), 225–233.
Packman, A., & Attanasio, J. S. (2004). Theoretical Issues in Stuttering. Abingdon, UK:
Psychology Press.
Packman, A., Onslow, M. Coombes, T. (2001). Stuttering and lexical retrieval. Clinical Linguistics
& Phonetics, 15(6), 487–498.
Packman, A., Onslow, M., & Menzies, R. (2000). Novel speech patterns and the treatment of
stuttering. Disability and Rehabilitation, 22(1–2), 65–79.
Partz, M.-P., Seron, X., & Linden, M. (1992). Re-education of a surface dysgraphia with a visual
imagery strategy. Cognitive Neuropsychology, 9(5), 369–401.
Pascoe, M., Stackhouse, J., & Wells, B. (2005). Phonological therapy within a psycholinguistic
framework: Promoting change in a child with persisting speech difficulties.
International Journal of Language & Communication Disorders, 40(2), 189–220.
Pascoe, M., Stackhouse, J., & Wells, B. (2006). Persisting Speech Difficulties in Children:
Children’s Speech and Literacy Difficulties. West Sussex, UK: John Wiley & Sons.
Patterson, K. E. (1988). Acquired disorders of spelling. Perspectives on Cognitive
Neuropsychology, 231–229.
Patterson, K. E., & Shewell, C. (1987). Speak and spell: Dissociations and word class effects. In
M. Coltheart, R. Job, & G. Sartori (Eds.), The Cognitive Neuroprychology of Language
(pp. 273–294). Hillsdale, NJ: Erlbaum.
Patterson, K., Marshall, J. C., & Coltheart, M. (1985). Surface dyslexia: Neuropsychological and
cognitive studies of phonological reading. Hove, UK: Lawrence Erlbaum Associates.
Peat, J., & Barton, B. (2008). Medical Statistics: A Guide to Data Analysis and Critical Appraisal.
Hoboken, NJ: John Wiley & Sons.
Peirce, J. W. (2007). PsychoPy—Psychophysics software in Python. Journal of Neuroscience
Methods, 162(1–2), 8–13.
Perkins, W. H., Kent, R. D., & Curlee, R. F. (1991). A Theory of Neuropsycholinguistic Function
in Stuttering. Journal of Speech, Language, and Hearing Research, 34(4), 734–752.
Perry, C., Ziegler, J. C., & Coltheart, M. (2002). How predictable is spelling? Developing and
testing metrics of phoneme-grapheme contingency. The Quarterly Journal of
Experimental Psychology Section A, 55(3), 897–915.
References
329
Peters, H. F. M., Hulstijn, W., & van Lieshout, P. H. H. M. (2000). Recent Developments in
Speech Motor Research into Stuttering. Folia Phoniatrica et Logopaedica, 52(1–3),
103–119.
Peters, H. F. M., & Starkweather, C. W. (1989). Development of stuttering throughout life.
Journal of Fluency Disorders, 14(5), 303–321.
Pierrehumbert, J. B. (2001). Exemplar dynamics: Word frequency, lenition and contrast.
Frequency and the emergence of linguistic structure. In J. Bybee & Hopper (Eds.),
Frequency and the emergence of linguistic structure (pp. 137–158). Amsterdam,
Netherlands: Benjamins.
Pinard, M., Chertkow, H., Black, S., & Peretz, I. (2002). A Case Study of Pure Word Deafness:
Modularity in Auditory Processing? Neurocase, 8(1–2), 40–55.
Pinker, S. (1995). The Language Instinct: The New Science of Language and Mind. London, UK:
Penguin UK.
Pinker, S., & Prince, A. (1988). On language and connectionism: Analysis of a parallel distributed
processing model of language acquisition. Cognition, 28(1–2), 73–193.
Porfert, A. R., & Rosenfield, D. B. (1978). Prevalence of stuttering. Journal of Neurology,
Neurosurgery & Psychiatry, 41(10), 954–956.
Raphael, L. J. (2005). Acoustic cues to the perception of segmental phonemes. In D. B. Pisoni &
R. Remez (Eds.), The Handbook of Speech Perception (pp. 182–206). Oxford, UK:
Blackwell.
Ratcliff, R. (1993). Methods for dealing with reaction time outliers. Psychological Bulletin,
114(3), 510–532.
Rees, R. (2001a). Principles of Psycholinguistic Intervention. In J. Stackhoue & B. Wells (Eds.),
Children’s Speech and Literacy Difficulties: Identification and Intervention. London, UK:
Whurr Publishers.
Rees, R. (2001b). What do tasks really tap? In J. Stackhoue & B. Wells (Eds.), Children’s Speech
and Literacy Difficulties: Identification and Intervention. London., UK: Whurr
Publishers.
Reilly, S., Onslow, M., Packman, A., Wake, M., Bavin, E. L., Prior, M., … Ukoumunne, O. C. (2009).
Predicting Stuttering Onset by the Age of 3 Years: A Prospective, Community Cohort
Study. Pediatrics, 123(1), 270–277.
Roelofs, A. (2004). Error Biases in Spoken Word Planning and Monitoring by Aphasic and
Nonaphasic Speakers: Comment on Rapp and Goldrick (2000). Psychological Review,
111(2), 561–572.
References
330
Roeltgen, D. P., & Heilman, K. (1983). Lexical Agraphia, Support for the Two-strategy
Hypothesis of Spelling. Neurology, 33(4), 241–242.
Royston, P. (1991). Approximating the Shapiro-Wilk W-test for non-normality. Statistics and
Computing, 2(3), 117–119.
Rubenstein, H., Garfield, L., & Millikan, J. A. (1970). Homographic entries in the internal lexicon.
Journal of Verbal Learning and Verbal Behavior, 9(5), 487–494.
Rustin, L. (1991). Parents, Families and the Stuttering Child. London, UK: Whurr Publishers.
Saltuklaroglu, T., Teulings, H.-L., & Robbins, M. (2009). Differential levels of speech and manual
dysfluency in adults who stutter during simultaneous drawing and speaking tasks.
Human Movement Science, 28(5), 643–654.
Sasisekaran, J., & De Nil, L. F. (2006). Phoneme monitoring in silent naming and perception in
adults who stutter. Journal of Fluency Disorders, 31(4), 284–302.
Schaefer, B., Fricke, S., Szczerbinski, M., Fox‐Boyer, A. V., Stackhouse, J., & Wells, B. (2009).
Development of a test battery for assessing phonological awareness in German‐
speaking children. Clinical Linguistics & Phonetics, 23(6), 404–430.
Schmitt, N. (1996). Uses and abuses of coefficient alpha. Psychological Assessment, 8(4), 350–
353.
Schulte-Körne, G., Deimel, W., Bartling, J., & Remschmidt, H. (1998). Auditory processing and
dyslexia: evidence for a specific speech processing deficit. NeuroReport, 9(2), 337–340.
Scovel, T. (1998). Psycholinguistics. Oxford Introductory to Language Study. Oxford, UK: Oxford
University Press.
Serniclaes, W., Sprenger-Charolles, L., Carré, R., & Demonet, J.-F. (2001). Perceptual
Discrimination of Speech Sounds in Developmental Dyslexia. Journal of Speech,
Language, and Hearing Research, 44(2), 384–399.
Shallice, T. (1987). Impairments of semantic processing: Multiple dissociations. In M. Coltheart,
R. Job, & Sartori (Eds.), The cognitive neuropsychology of language. London, UK:
Lawrence Erlbaum.
Shallice, T. (1988). From Neuropsychology to Mental Structure. Cambridge, UK: Cambridge
University Press.
Shallice, T., Rumiati, R. I., & Zadini, A. (2000). The Selective Impairment of the Phonological
Output Buffer. Cognitive Neuropsychology, 17(6), 517–546.
Shriberg, L. D., Green, J. R., Campbell, T. F., Mcsweeny, J. L., & Scheer, A. R. (2003). A diagnostic
marker for childhood apraxia of speech: the coefficient of variation ratio. Clinical
Linguistics & Phonetics, 17(7), 575–595.
References
331
Sijtsma, K. (2009). On the Use, the Misuse, and the Very Limited Usefulness of Cronbach’s
Alpha. Psychometrika, 74(1), 107.
Simonsen, C., Sundet, K., Vaskinn, A., Birkenaes, A. B., Engh, J. A., Færden, A., … Andreassen,
O. A. (2011). Neurocognitive Dysfunction in Bipolar and Schizophrenia Spectrum
Disorders Depends on History of Psychosis Rather Than Diagnostic Group.
Schizophrenia Bulletin, 37(1), 73–83.
Smith, A. (1999). Stuttering: A unified approach to a multifactorial, dynamic disorder. In N.
Bersntein Ratner & Healy (Eds.), Stuttering research and practice: Bridging the gap.
Mahwah, NJ: Lawrence Erlbaum Associates Inc.
Smith, A., Kelly, E., Curlee, R. F., & Siegel, G. M. (1997). Stuttering: A dynamic, multifactorial
model. Nature and treatment of stuttering: New directions, 2, 204-217.
Smith, A., Sadagopan, N., Walsh, B., & Weber-Fox, C. (2010). Increasing phonological
complexity reveals heightened instability in inter-articulatory coordination in adults
who stutter. Journal of Fluency Disorders, 35(1), 1–18.
Snider, N. (2008). An exemplar model of syntactic priming. Stanford, CA: Stanford University
ProQuest Dissertations Publishing.
Snowling, M. J., Goulandris, N., & Defty, N. (1996). A longitudinal study of reading development
in dyslexic children. Journal of Educational Psychology, 88(4), 653–669.
Snowling, M. J., & Stackhouse, J. (2013). Dyslexia, Speech and Language: A Practitioner’s
Handbook. West Sussex, UK: John Wiley & Sons.
Sommer, M., Koch, M. A., Paulus, W., Weiller, C., & Büchel, C. (2002). Disconnection of speech-
relevant brain areas in persistent developmental stuttering. The Lancet, 360(9330),
380–383.
Spencer, E., Packman, A., Onslow, M., & Ferguson, A. (2005). A preliminary investigation of the
impact of stuttering on language use. Clinical Linguistics & Phonetics, 19(3), 191–201.
Spencer, E., Packman, A., Onslow, M., & Ferguson, A. (2009). The effect of stuttering on
communication: A preliminary investigation. Clinical Linguistics & Phonetics, 23(7),
473–488.
Spencer, S., Clegg, J., & Stackhouse, J. (2012). Language and disadvantage: a comparison of the
language abilities of adolescents from two different socioeconomic areas.
International Journal of Language & Communication Disorders, 47(3), 274–284.
Stackhouse, J. (1992). Developmental verbal dyspraxia I: A review and critique. International
Journal of Language & Communication Disorders, 27(1), 19–34.
References
332
Stackhouse, J., Pascoe, M., & Gardner, H. (2006). Intervention for a child with persisting speech
and literacy difficulties: A psycholinguistic approach. Advances in Speech Language
Pathology, 8(3), 231–244.
Stackhouse, J. (2006). Speech and spelling difficulties: what to look for. In M. Snowling & J.
Stackhouse (Eds) Dyslexia, speech and language: A practitioner’s handbook, West
Sussex, UK: John Wiley & Sons.
Stackhouse, J., Vance, M., Pascoe, M., & Wells, B. (2007). Compendium of Auditory and Speech
Tasks: Children’s Speech and Literacy Difficulties 4 with CD-ROM. West Sussex, UK: John
Wiley & Sons.
Stackhouse, J., & Wells, B. (1991). Dyslexia: The obvious and hidden speech and language
disorder. Integrating theory & practice, 7(1).
Stackhouse, J., & Wells, B. (1993). Psycholinguistic assessment of developmental speech
disorders. International Journal of Language & Communication Disorders, 28(4), 331–
348.
Stackhouse, J., & Wells, B. (1997). Children’s Speech and Literacy Difficulties: A Psycholinguistic
Framework. West Sussex, UK: John Wiley & Sons.
Stackhouse, J., & Wells, B. (2001). Children’s speech and literacy difficulties: Identification and
intervention (Vol. 2). West Sussex, UK: John Wiley & Sons.
Stager, S. V., Jeffries, K. J., & Braun, A. R. (2003). Common features of fluency-evoking
conditions studied in stuttering subjects and controls: an H215O PET study. Journal of
Fluency Disorders, 28(4), 319–336.
Starkweather, C., & Givens-Ackermann, J. (1997). Stuttering. Austin,TX: Pro-Ed.
Starkweather, C., & Gottwald, S. R. (2000). The demands and capacities model: Response to
siegel. Journal of Fluency Disorders, 25(4), 369–375.
Starkweather, C., & Myers, M. (1979). Duration of subsegments within the intervocalic interval
in stutterers and nonstutterers. Journal of Fluency Disorders, 4(3), 205–214.
Starkweather, C. (1987). Fluency and stuttering (Vol. xiv). Englewood Cliffs, NJ: Prentice-Hall,
Inc.
Stiegler, L. N., & Hoffman, P. R. (2001). Discourse-based intervention for word finding in
children. Journal of Communication Disorders, 34(4), 277–303.
Stokes, S. F., & Surendran, D. (2005). Articulatory Complexity, Ambient Frequency, and
Functional Load as Predictors of Consonant Development in Children. Journal of Speech
Language and Hearing Research, 48(3), 577.
References
333
Stothard, S. E., Snowling, M. J., Bishop, D. V. M., Chipchase, B. B., & Kaplan, C. A. (1998).
Language-Impaired PreschoolersA Follow-Up Into Adolescence. Journal of Speech,
Language, and Hearing Research, 41(2), 407–418.
Subramanian, A., & Yairi, E. (2006). Identification of traits associated with stuttering. Journal of
Communication Disorders, 39(3), 200–216.
Swets, J. A., Tanner, W. P. J., & Birdsall, T. G. (1961). Decision Processes In Perception.
Psychological Review, 68(5), 301–340.
Tainturier, M.-J., & Rapp, B. (2003). Is a single graphemic buffer used in reading and spelling?
Aphasiology, 17(6–7), 537–562.
Tessier, C., Weill-Chounlamountry, A., Michelot, N., & Pradat-Diehl, D. P. (2007). Rehabilitation
of word deafness due to auditory analysis disorder. Brain Injury, 21(11), 1165–1174.
Thode, H. C. (2002). Testing For Normality. Boca Raton, FL: CRC Press.
Torgesen, J. K., Wagner, R. K., & Rashotte, C. A. (1999). Test of word reading efficiency (TOWRE).
Austin, TX: Pro-Ed.
Treiman, R., Kessler, B., & Bick, S. (2003). Influence of consonantal context on the
pronunciation of vowels: A comparison of human readers and computational models.
Cognition, 88(1), 49–78.
Treiman, R., Kessler, B., & Evans, R. (2007). Anticipatory conditioning of spelling-to-sound
translation. Journal of Memory and Language, 56(2), 229–245.
Treiman, R., & Zukowski, A. (1996). Children’s Sensitivity to Syllables, Onsets, Rimes, and
Phonemes. Journal of Experimental Child Psychology, 61(3), 193–215.
Trochim, W. M., & Donnelly, J. P. (2006). The research methods knowledge base (3rd ed.).
Cincinnati, OH: Atomic Dog.
Tsiamtsiouris, J., & Cairns, H. S. (2013). Effects of sentence-structure complexity on speech
initiation time and disfluency. Journal of Fluency Disorders, 38(1), 30–44.
Tyler, A. (2010). Usage-Based Approaches to Language and Their Applications to Second
Language Learning. Annual Review of Applied Linguistics, 30, 270–291.
Ungerer, F., & Schmid, H.-J. (2013). An Introduction to Cognitive Linguistics. Abingdon, UK:
Routledge.
Van Lieshout, P. H. H. M., Hulstijn, W., & Peters, H. F. M. (2004). Searching for the weak link in
the speech production chain of people who stutter: A motor skill approach. In B.
Maassen, H. Peters, & P. H. van Lieshout (Eds.), Speech Motor Control: In Normal and
Disordered Speech. Oxford, UK: Oxford University Press.
Van Riper, C. (1982). The nature of stuttering. Englewood Cliffs, NJ: Prentice Hall.
References
334
Van Riper, C. (1990). Final thoughts about stuttering. Journal of fluency disorders, 15(5), 317–
318.
Van Teijlingen, E. R., & Hundley, V. (2002). The importance of pilot studies. Nursing Standard,
16(40), 33–36.
Van Zaalen- op ’t Hof, Y., Wijnen, F., & De Jonckere, P. H. (2009). Differential diagnostic
characteristics between cluttering and stuttering—Part one. Journal of Fluency
Disorders, 34(3), 137–154.
Vance, M. (1991). Educational and therapeutic approaches used with a child presenting with
acquired aphasia with convulsive disorder (Landau-Kleffner Syndrome). Child
Language Teaching and Therapy, 7(1), 41–60.
Vance, M. (1995). Investigating speech processing skills in young children. International Journal
of Language & Communication Disorders, 30(S1), 287–293.
Vance, M., Stackhouse, J., & Wells, B. (2005). Speech-production skills in children aged 3–7
years. International Journal of Language & Communication Disorders, 40(1), 29–48.
Vasiç, N., & Wijnen, F. (2005). Stuttering as a monitoring deficit. In Hartsuiker, R. J., Bastiaanse,
R., Postma, A., & Wijnen, F. In R.J. Hartsuiker, R. Bastiaanse, A. Postma, & F. Wijnen
(Eds.), Phonological encoding and monitoring in normal and pathological speech.
Abingdon, UK: Psychology Press.
Vincent, I., Grela, B. G., & Gilbert, H. R. (2012). Phonological priming in adults who stutter.
Journal of Fluency Disorders, 37(2), 91–105.
Wagenmakers, E.-J., Steyvers, M., Raaijmakers, J. G. W., Shiffrin, R. M., van Rijn, H., &
Zeelenberg, R. (2004). A model for evidence accumulation in the lexical decision task.
Cognitive Psychology, 48(3), 332–367.
Ward, D. (2008). Stuttering and Cluttering: Frameworks for Understanding and Treatment.
Abingdon, UK: Psychology Press.
Ward, J. (2015). The Student’s Guide to Cognitive Neuroscience. Abingdon, UK: Psychology
Press.
Waters, D., Hawkes, C., & Burnett, E. (1998). Targeting Speech Processing Strengths to
Facilitate Pronunciation Change. International Journal of Language & Communication
Disorders, 33(sup1), 469–474.
Watkins, K. E., Smith, S. M., Davis, S., & Howell, P. (2008). Structural and functional
abnormalities of the motor system in developmental stuttering. Brain, 131(1), 50–59.
Weber-Fox, C., Spencer, R. M. C., Spruill, J. E., & Smith, A. (2004). Phonologic Processing in
Adults Who StutterElectrophysiological and Behavioral Evidence. Journal of Speech,
Language, and Hearing Research, 47(6), 1244–1258.
References
335
Webster, W. G. (1998). Brain models and the clinical management of stuttering. Journal of
Speech-Language Pathology and Audiology, 22(4), 220–230.
Webster, W. G., Hulstijn, W., Peters, H. F. M, & van Lieshout, P. H. H. M. (1997). Principles of
human brain organization related to lateralization of language and speech motor
functions in normal speakers and stutterers. Speech production: Motor control, brain
research and fluency disorders, 119–139.
Weis, L., & Fine, M. (2004). Working Method: Research and Social Justice. Abingdon, UK:
Routledge.
Whaley, C. P. (1978). Word—nonword classification time. Journal of Verbal Learning and Verbal
Behavior, 17(2), 143–154.
WHO: World Health Organization. (2010). The ICD-10 Classification of Mental and Behavioural
Disorders. Retrieved 12 March 2007, from
http://apps.who.int/classifications/icd10/browse/2010/en.
Wilcox, R. R. (2005). Robust Testing Procedures. In Encyclopedia of Statistics in Behavioral
Science. West Sussex, UK: John Wiley & Sons, Ltd.
Wingate, M. E. (1964). A Standard Definition of Stuttering. Journal of Speech and Hearing
Disorders, 29(4), 484–489.
Wynne, M. K., & Boehmler, R. M. (1982). Central Auditory Function in Fluent and Disfluent
Normal Speakers. Journal of Speech, Language, and Hearing Research, 25(1), 54–57.
Yairi, E., & Ambrose, N. (2005). Early Childhood Stuttering for clinicians by clinicians. Austin, TX:
Pro-Ed.
Yairi, E., & Seery, C. H. (2011). Stuttering: Foundations and clinical applications. Upper Saddle
River, NJ: Pearson Education, Inc.
Yairi, E., Ambrose, N., & Cox, N. (1996). Genetics of StutteringA Critical Review. Journal of
Speech, Language, and Hearing Research, 39(4), 771–784.
Yarkoni, T., Balota, D., & Yap, M. (2008). Moving beyond Coltheart’s N: A new measure of
orthographic similarity. Psychonomic Bulletin & Review, 15(5), 971–979.
Yaruss, J. S., LaSalle, L. R., & Conture, E. G. (1998). Evaluating Stuttering in Young
ChildrenDiagnostic Data. American Journal of Speech-Language Pathology, 7(4), 62–
76.
Yaruss, J. S., & Quesal, R. W. (2004). Stuttering and the International Classification of
Functioning, Disability, and Health (ICF): An update. Journal of Communication
Disorders, 37(1), 35–52.

References
336
Yaruss, J. S., & Quesal, R. W. (2006). Overall Assessment of the Speaker’s Experience of
Stuttering (OASES): Documenting multiple outcomes in stuttering treatment. Journal
of Fluency Disorders, 31(2), 90–115.
Zauche, L. H., Thul, T. A., Mahoney, A. E. D., & Stapel-Wax, J. L. (2016). Influence of language
nutrition on children’s language and cognitive development: An integrated review.
Early Childhood Research Quarterly, 36, 318–333.
Ziegler, J. C., Stone, G. O., & Jacobs, A. M. (1997). What is the pronunciation for -ough and the
spelling for /u/? A database for computing feedforward and feedback consistency in
English. Behavior Research Methods, Instruments, & Computers, 29(4), 600–618.
Appendices
337
Appendices
1. Appendix 1 – Approval letter ethics normative study
2. Appendix 2 – Approval letter ethics case series
3. Appendix 3 – Research project information sheet normative study
4. Appendix 4 – Research project consent form normative study
5. Appendix 5 – Research project information sheet case series
6. Appendix 6 – Research project consent form case series
7. Appendix 7 – Instructions per task
Appendices
338
Appendix 1 – Approval letter ethics normative study
Appendices
339
Appendix 2 – Approval letter ethics case series

Appendices
341
Appendix 3 – Research project information sheet normative study
Research project information sheet: Psycholinguistic speech processing assessment for adults: Development and case series Name of researcher: Rebekka Niepelt [email protected] Name of supervisors: Dr Jenny Thomson [email protected] Prof Joy Stackhouse [email protected] Hello, My name is Rebekka Niepelt and I am a PhD student in the Department for Human Communication Sciences at the University of Sheffield. You are being invited to take part in my research project. Before you decide it is important for you to understand why the research is being done and what it will involve. Please take time to read the following information carefully and discuss it with others if you wish. Contact me if there is anything that is not clear or if you would like more information. Take time to decide whether or not you wish to take part. I have written this information sheet to help you understand why we are doing the research and what it will involve. Who is organising the project? The Human Communication Sciences Department at the University of Sheffield is responsible for the project. It is organised by Rebekka Niepelt, Dr Jenny Thomson and Prof Joy Stackhouse. What is the project about? The project aims to find out:
1. If developed speech tasks (test tool) are sensitive enough to assess speech processing abilities in adults
2. If adults who stammer show other speech processing abilities than adults who do not stammer in this tasks
Why have I been chosen? This project involves participants who stammer, but also those who do not stammer. Additionally, first data will be collected and used as valid outcomes of the new developed test
Department Of Human
Communication Sciences
Head of Department
Professor Shelagh Brumfitt Senate Award Fellow
PhD, M.Phil, Dip CST, Cert MRCSLT (Hons)
362 Mushroom Lane
Sheffield
S10 2TS
United Kingdom
Telephone: +44 (0) 114 222 2418/ 2402/ 2405
International: +44 (0) 114 222 2418
Fax: +44 (0) 114 2222439
Email: [email protected]
http://www.shef.ac.uk/hcs
Appendices
342
tool. You have been chosen, because you are between 18 and 35 years old, and you do not stammer or have any other speech and language difficulties. By collecting data from you the pool of data can be filled up and this then makes comparisons possible between data of adults who stammer and adults who do not stammer. What will happen if I take part? It is up to you to decide whether or not to take part. If you do decide to take part you should keep this information sheet and sign the attached consent form. Even if you do this, you can still withdraw at any time without it affecting any benefits that you are entitled to in any way. You do not have to give a reason. An assessment tool was developed which includes different tasks testing speech processing abilities. The assessment Rebekka will do with you includes tasks where you are asked to repeat, read, spell, and manipulate words or non-words. The assessment will not take longer than 1 hour. The assessment will take part in a facility of the University of Sheffield, best in the Department of Human Communication Sciences. The appointment for the session will be made within normal working hours between 9 and 5 pm at a time convenient for you. Do I have to take part? No. You do not have to take part if you do not want to. If you do decide to take part you:
• Will be asked to sign a consent form.
• Can choose to stop being involved at any time.
• Can ask for any information about you to be removed from the project. What type of information will be collected? The following information about you will be collected from you if you agree: • General data: name, age, socioeconomic situation, education • Special data: outcome of the assessment -> to analyse the results and compare
between the two groups Will I be recorded and what will happen to the recording? If you give your permission, the assessment will be recorded using an audio and/or video recorder. This is so that I can listen to it and watch it again later. No one-else will have access to the recording. The recording will be kept safe in a locked cabinet in a locked office in the Department of Human Communication Sciences, University of Sheffield. You do not have to be recorded if you don’t want to, you can still take part in the study. Even if you agree to being recorded, you can still change your mind at any time without giving a reason. Are there any risks? No. If you take part in the project, nothing will change. There are no obvious disadvantages. Results are not going to change or affect anything in your life. Results of this assessment are just used for statistical analyses and drawing comparisons between groups, anonymously. If you don’t want to carry on with the assessment you can ask to stop the assessment at any time, without giving a reason. You can win a prize for taking part! If you do take part in the study and complete the the assessment, you could win a gift voucher for amazon. There are 15 gift vouchers to win. Each voucher is worth £20. You will give your email address which Rebekka will keep and then will pull out 15 addresses from a hat containing all email addresses. The emailadress will be used just for the raffle and for nothing else.

Appendices
343
You can agree to enter this raffle on the consent form. You may change your mind at any time about the raffle. If this happens, just tell it to Rebekka. If I am not happy can I make a complaint? Yes. If you want to complain about anything during the research project you are free to contact either me or my supervisors (See below for contact details). Complaints will be taken seriously and tried to be solved very quickly. If this cannot be solved it then may be forwarded to the Head of the Department - Professor Shelagh Brumfitt at the address at the top of this sheet. Will anyone know I’m taking part in this project? Your name or any other information about who you are will be kept strictly confidential and you will not be identified by name or by any other information in the final write up of this project or any subsequent publications. Only Rebekka and her research supervisors will have access to this data which will be coded by numbers, so that your name does not appear anywhwere. What will happen to the results of the research project? The results of the research are going to be published in my PhD dissertation in August 2017. The results will be written up as a project report and included in presentations considering stammering research. No one will be able to identify you in any of these. All the results will be kept in Rebekka’s locked office, in the Department of Human Communication Sciences, University of Sheffield. Who has ethically reviewed the project? This project has been approved by the Ethics Committee of the Department of Human Communication Sciences. If you would like to take part, please complete and return the consent form to Rebekka. A copy will then be given to you to keep. Who do I contact for further information?
1. Researcher: Rebekka Niepelt Human Communication Sciences Department, 362 Mushroom Lane, The University of Sheffield, S10 2TS 01142222412 [email protected]
2. Supervisor 1: Dr Jenny Thomson Human Communication Sciences Department, 362 Mushroom Lane, The University of Sheffield, S10 2TS 01142222440 [email protected]
3. Supervisor 2: Prof Joy Stackhouse Human Communication Sciences Department, 362 Mushroom Lane, The University of Sheffield, S10 2TS 01142222401 [email protected]

Appendices
345
Appendix 4 – Research project consent form normative study
Research project consent form: Psycholinguistic speech processing assessment for adults: Development and case series Name of researcher: Rebekka Niepelt [email protected] Name of supervisors: Dr Jenny Thomson [email protected] Prof Joy Stackhouse [email protected] Participant Identification Number for this project: Please read the following and tick the boxes if you agree. 1. I confirm that have read and understand the information sheet explaining the above
research project and I have had the opportunity to ask questions about the project. 2. I understand that my participation is voluntary and that I am free to withdraw at any
time without giving any reason and without there being any negative consequences. In addition, should I not wish to answer any particular question or questions, I am free to decline. (Tel: 0114 22 22 412).
3. I understand that my responses will be kept strictly confidential I give permission for
members of the research team to have access to my anonymised responses. I understand that my name will not be linked with the research materials, and I will not be identified or identifiable in the report or reports that result from the research.
4. I agree to take part in the above research project. 5. I agree for the data collected from me to be used in follow ups of this particular study. 6. I AGREE that my interview can be audio recorded and it can be kept electronically until
the project is finished.
Department Of Human
Communication Sciences
Head of Department
Professor Shelagh Brumfitt Senate Award Fellow
PhD, M.Phil, Dip CST, Cert MRCSLT (Hons)
362 Mushroom Lane
Sheffield
S10 2TS
United Kingdom
Telephone: +44 (0) 114 222 2418/ 2402/ 2405
International: +44 (0) 114 222 2418
Fax: +44 (0) 114 2222439
Email: [email protected]
http://www.shef.ac.uk/hcs
Appendices
346
7. If I complete the whole assessment of the project I would like to enter the raffle to win an amazon gift voucher worth £20.
________________________ ________________ ____________________ Name of Participant Date Signature (or legal representative) ________________________ ________________ ____________________ Name of Researcher Date Signature To be signed and dated in presence of the participant Thank you for completing this form. Please return to Rebekka Niepelt. You will also get a copy to keep.
If yes, then please write your
email address here:
_________________________
Appendices
347
Appendix 5 – Research project information sheet case series
Research project information sheet: Psycholinguistic speech processing assessment for adults: Development and case series Name of researcher: Rebekka Niepelt [email protected] Name of supervisors: Dr Jenny Thomson [email protected] Dr Blanca Schaefer
[email protected] Hello, My name is Rebekka Niepelt and I am a PhD student in the Department for Human Communication Sciences at the University of Sheffield. You are being invited to take part in my research project. Before you decide it is important for you to understand why the research is being done and what it will involve. Please take time to read the following information carefully and discuss it with others if you wish. Contact me if there is anything that is not clear or if you would like more information. Take time to decide whether or not you wish to take part. I have written this information sheet to help you understand why we are doing the research and what it will involve. Who is organising the project? The Human Communication Sciences Department at the University of Sheffield is responsible for the project. It is organised by Rebekka Niepelt, Dr Jenny Thomson and Dr Blanca Schaefer. What is the project about? The project aims to find out:
3. If developed speech tasks (test tool) are sensitive enough to assess speech processing abilities in adults
4. If adults who stammer show other speech processing abilities than adults who do not stammer in this tasks
Why have I been chosen? This project involves participants who stammer, but also those who do not stammer. Additionally, first data will be collected and used as valid outcomes of the new developed test
Department Of Human
Communication Sciences
Head of Department
Professor Patricia Cowell PhD, MA, BS
362 Mushroom Lane
Sheffield
S10 2TS
United Kingdom
Telephone: +44 (0) 114 222 2418/ 2402/ 2405
International: +44 (0) 114 222 2418
Fax: +44 (0) 114 2222439
Email: [email protected]
http://www.shef.ac.uk/hcs
Appendices
348
tool. You have been chosen, because you are between 18 and 35 years old, and experience stammering since childhood. By collecting data from you the pool of data can be filled up and this then makes comparisons possible between data of adults who stammer and adults who do not stammer. What will happen if I take part? It is up to you to decide whether or not to take part. If you do decide to take part you should keep this information sheet and sign the attached consent form. Even if you do this, you can still withdraw at any time without it affecting any benefits that you are entitled to in any way. You do not have to give a reason. An assessment tool was developed which includes different tasks testing speech processing abilities. The assessment Rebekka will do with you includes tasks where you are asked to repeat, read, spell, and manipulate words or non-words. The assessment will not take longer than 1 hour. The assessment will take part in a facility of the University of Sheffield, best in the Department of Human Communication Sciences. The appointment for the session will be made within normal working hours between 9 and 5 pm at a time convenient for you. After the assessment you will have a little chat with Rebekka about your stammer. Do I have to take part? No. You do not have to take part if you do not want to. If you do decide to take part you:
• Will be asked to sign a consent form.
• Can choose to stop being involved at any time.
• Can ask for any information about you to be removed from the project. What type of information will be collected? The following information about you will be collected from you if you agree: • General data: name, age, socioeconomic situation, education • Special data: outcome of the assessment -> to analyse the results and compare
between the two groups • Interview data: The little chat will be recorded -> to analyse and revisit the chat later Will I be recorded and what will happen to the recording? If you give your permission, the assessment will be recorded using an audio and/or video recorder. This is so that I can listen to it and watch it again later. No one-else will have access to the recording. The recording will be kept safe in a locked cabinet in a locked office in the Department of Human Communication Sciences, University of Sheffield. You do not have to be recorded if you don’t want to, you can still take part in the study. Even if you agree to being recorded, you can still change your mind at any time without giving a reason. Are there any risks? No. If you take part in the project, nothing will change. There are no obvious disadvantages. Results are not going to change or affect anything in your life. Results of this assessment are just used for statistical analyses and drawing comparisons between groups, anonymously. If you don’t want to carry on with the assessment you can ask to stop the assessment at any time, without giving a reason. You will receive a 20 pounds amazon vouher for taking part! If you do take part in the study and complete the the assessment, you get a gift voucher for amazon.

Appendices
349
If I am not happy can I make a complaint? Yes. If you want to complain about anything during the research project you are free to contact either me or my supervisors (See below for contact details). Complaints will be taken seriously and tried to be solved very quickly. If this cannot be solved it then may be forwarded to the Head of the Department - Professor Patricia Cowell at the address at the top of this sheet. Will anyone know I’m taking part in this project? Your name or any other information about who you are will be kept strictly confidential and you will not be identified by name or by any other information in the final write up of this project or any subsequent publications. Only Rebekka and her research supervisors will have access to this data which will be coded by numbers, so that your name does not appear anywhwere. What will happen to the results of the research project? The results of the research are going to be published in my PhD dissertation in August 2017. The results will be written up as a project report and included in presentations considering stammering research. No one will be able to identify you in any of these. All the results will be kept in Rebekka’s locked office, in the Department of Human Communication Sciences, University of Sheffield. Who has ethically reviewed the project? This project has been approved by the Ethics Committee of the Department of Human Communication Sciences. If you would like to take part, please complete and return the consent form to Rebekka. A copy will then be given to you to keep. Who do I contact for further information?
1. Researcher: Rebekka Niepelt Human Communication Sciences Department, 362 Mushroom Lane, The University of Sheffield, S10 2TS 01142222412 [email protected]
2. Supervisor 1: Dr Jenny Thomson Human Communication Sciences Department, 362 Mushroom Lane, The University of Sheffield, S10 2TS 01142222440 [email protected]
3. Supervisor 2: Dr Blanca Schaefer Human Communication Sciences Department, 362 Mushroom Lane, The University of Sheffield, S10 2TS 0114 22 22423 [email protected]

Appendices
351
Appendix 6 – Research project consent form case series
Research project consent form: Psycholinguistic speech processing assessment for adults: Development and case series Name of researcher: Rebekka Niepelt [email protected] Name of supervisors: Dr Jenny Thomson [email protected] Dr Blanca Schaefer [email protected] Participant Identification Number for this project: Please read the following and tick the boxes if you agree. 1. I confirm that I have read and understand the information sheet explaining the above
research project and I have had the opportunity to ask questions about the project. 2. I understand that my participation is voluntary and that I am free to withdraw at any
time without giving any reason and without there being any negative consequences. In addition, should I not wish to answer any particular question or questions, I am free to decline. (Tel: 0114 22 22 412).
3. I understand that my responses will be kept strictly confidential I give permission for
members of the research team to have access to my anonymised responses. I understand that my name will not be linked with the research materials, and I will not be identified or identifiable in the report or reports that result from the research.
4. I agree to take part in the above research project. 5. I agree for the data collected from me to be used in follow ups of this particular study. 6. I AGREE that my interview can be audio recorded and it can be kept electronically until
the project is finished.
Department Of Human
Communication Sciences
Head of Department
Professor Patricia Cowell PhD, MA, BS
362 Mushroom Lane
Sheffield
S10 2TS
United Kingdom
Telephone: +44 (0) 114 222 2418/ 2402/ 2405
International: +44 (0) 114 222 2418
Fax: +44 (0) 114 2222439
Email: [email protected]
http://www.shef.ac.uk/hcs

Appendices
352
________________________ ________________ ____________________ Name of Participant Date Signature (or legal representative) ________________________ ________________ ____________________ Name of Researcher Date Signature To be signed and dated in presence of the participant Thank you for completing this form. Please return to Rebekka Niepelt. You will also get a copy to keep.
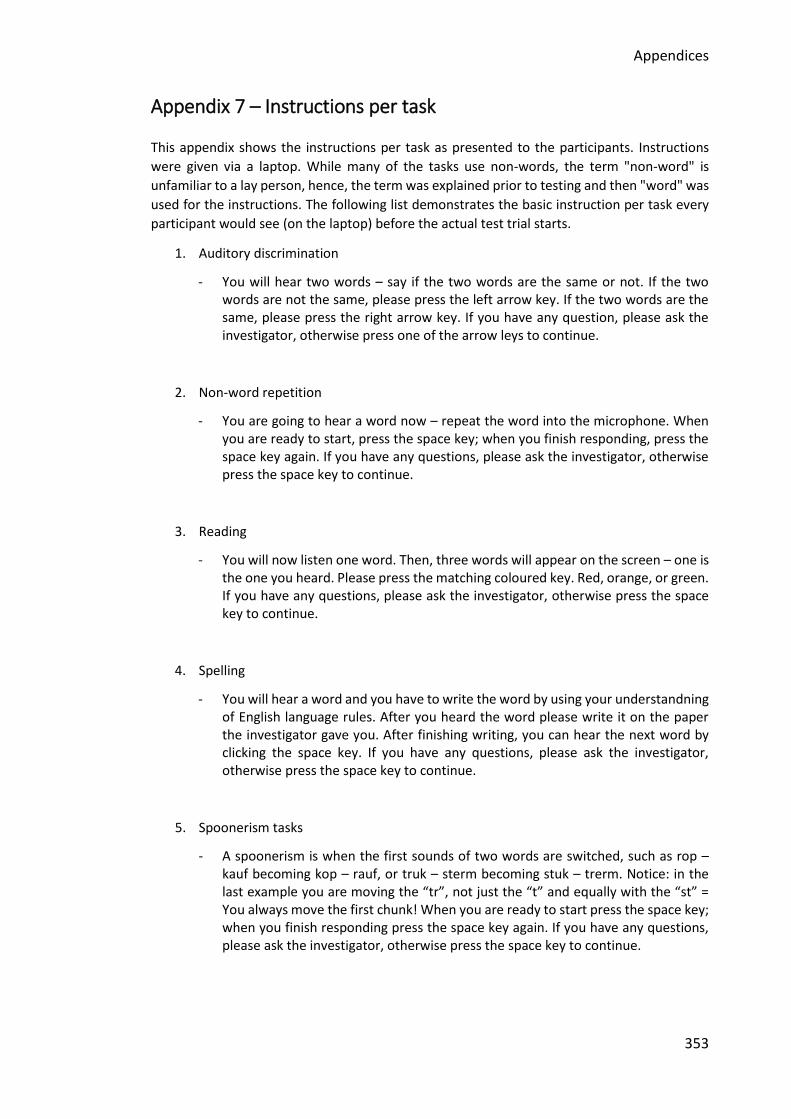
Appendices
353
Appendix 7 – Instructions per task This appendix shows the instructions per task as presented to the participants. Instructions
were given via a laptop. While many of the tasks use non-words, the term "non-word" is
unfamiliar to a lay person, hence, the term was explained prior to testing and then "word" was
used for the instructions. The following list demonstrates the basic instruction per task every
participant would see (on the laptop) before the actual test trial starts.
1. Auditory discrimination
- You will hear two words – say if the two words are the same or not. If the two words are not the same, please press the left arrow key. If the two words are the same, please press the right arrow key. If you have any question, please ask the investigator, otherwise press one of the arrow leys to continue.
2. Non-word repetition
- You are going to hear a word now – repeat the word into the microphone. When you are ready to start, press the space key; when you finish responding, press the space key again. If you have any questions, please ask the investigator, otherwise press the space key to continue.
3. Reading
- You will now listen one word. Then, three words will appear on the screen – one is the one you heard. Please press the matching coloured key. Red, orange, or green. If you have any questions, please ask the investigator, otherwise press the space key to continue.
4. Spelling
- You will hear a word and you have to write the word by using your understandning of English language rules. After you heard the word please write it on the paper the investigator gave you. After finishing writing, you can hear the next word by clicking the space key. If you have any questions, please ask the investigator, otherwise press the space key to continue.
5. Spoonerism tasks
- A spoonerism is when the first sounds of two words are switched, such as rop – kauf becoming kop – rauf, or truk – sterm becoming stuk – trerm. Notice: in the last example you are moving the “tr”, not just the “t” and equally with the “st” = You always move the first chunk! When you are ready to start press the space key; when you finish responding press the space key again. If you have any questions, please ask the investigator, otherwise press the space key to continue.


