Embed Size (px)
Citation preview
83
Iranian Journal of Otorhinolaryngology, Vol.27(2), Serial No.79, Mar 2015
Original Article
Psychometric Properties of the Persian Version of the
Tinnitus Handicap Inventory (THI-P)
Mir Mohammad Jalali1,*Robabeh Soleimani
2, Mahnaz Fallahi
2, Mohammad Aghajanpour
1,
Masoumeh Elahi2
Abstract Introduction: Tinnitus can have a significant effect on an individual’s quality of life, and is very difficult quantify. One of the most popular questionnaires used in this area is the Tinnitus Handicap Inventory (THI). The aim of this study was to determine the reliability and validity of a Persian translation of the Tinnitus Handicap Inventory (THI-P). Materials and Methods: This prospective clinical study was performed in the Otolaryngology Department of Guilan University of Medical Sciences, Iran. A total of 102 patients aged 23–80 years with tinnitus completed the (THI-P). The patients were instructed to complete the Beck Depression Inventory (BDI) and the State-Trait Anxiety Inventory (STAI). Audiometry was performed. Eight-five patients were asked to complete the THI-P for a second time 7–10 days after the initial interview. We assessed test–retest reliability and internal reliability of the THI-P. Validity was assessed by analyzing the THI-P of patients according to their age, tinnitus duration and psychological distress (BDI and STAI). A factor analysis was computed to verify if three subscales (functional, emotional, and catastrophic) represented three distinct variables. Results: Test–retest correlation coefficient scores were highly significant. The THI-P and its subscales showed good internal consistency reliability (α = 0.80 to 0.96). High-to-moderate correlations were observed between THI-P and psychological distress and tinnitus symptom ratings. A confirmatory factor analysis failed to validate the three subscales of THI, and high inter-correlations found between the subscales question whether they represent three distinct factors. Conclusion: The results suggest that the THI-P is a reliable and valid tool which can be used in a clinical setting to quantify the impact of tinnitus on the quality of life of Iranian patients. Keywords: Anxiety, Depression, Questionnaires, Reproducibility of results, Tinnitus, Psychometrics.
Received date: 21 May 2014 Accepted date: 8 Sep 2014
1Department of Otorhinolaryngology, Amiralmomenin Hospital, Guilan University of Medical Sciences, Guilan, Iran.
2Department of Psychiatry, Shafa Hospital, Guilan University of Medical Sciences, Guilan, Iran.
*Corresponding Author:
Shafa Hospital, Guilan University of Medical Sciences, Guilan, Iran.
Postal codes: 41939-55599, Fax: 0098-131-3241842, Email: [email protected]
Jalali MM, et al
84 Iranian Journal of Otorhinolaryngology,Vol.27(2),Serial No.79, Mar 2015
Introduction
Tinnitus is a phantom auditory perception
or sensation (1,2), with a prevalence in
adults of 10–15% (3,4). The mechanism
and pathophysiology of tinnitus is not well
defined. Tinnitus can cause emotional
distress in patients and affect their quality
of life. Although some people with tinnitus
experience depression, irritation, distraction
or insomnia (5), tinnitus is not a significant
problem in 80% of cases (6). As tinnitus is
largely a subjective complaint, it is
important to identify patients whose life is
affected by the condition. One of the most
significant efforts to understand the
complexity of problems in tinnitus patients
was undertaken by Newman et al. who
introduced the Tinnitus Handicap Inventory
(THI) questionnaire (7).
This questionnaire consists of 25 items and
three subscales: the performance subscale
(12 items), the emotional subscale (8 items),
and the catastrophic subscale (5 items).
These scales represent role and physical
functioning, psychological distress, and
depression and loss of control, respectively.
Each item has three potential answers: 4
points for ‘yes’, 2 points for ‘sometimes’,
and 0 points for ‘no’. The total score for the
test ranges between 0 (no tinnitus handicap)
and100 (the worst possible annoyance). In
the full version of the THI (0–100 points),
scores ranging between 0 and 16 points are
associated with no handicap, and scores of
18 points or more reflect some degree of
handicap (i.e., mild, moderate, severe, or
catastrophic categories) (8). Studies have
shown that THI is a robust and appropriate
psychometric tool to measure the impact of
tinnitus on daily life (8) and to determine the
outcomes of various treatments (9-11).
THI has high internal consistency,
reliability, convergent validity, and
construct reliability (12). This questionnaire
has been translated into various languages,
including Turkish, Danish (THI-DK),
Spanish, Korean, Portuguese, Italian,
Singaporean languages, Chinese(Mandarin:
THI-CM; Cantonese: THI-CH), Japanese,
and Filipino (12-22). It has demonstrated
adequate reliability and validity in all of
these translations. In 2011, Mahmoudian et
al. translated this questionnaire into Persian
and applied it in 112 patients with tinnitus.
The researchers did not find any significant
differences in gender, age, hearing
impairment, and total score and subscales
of Persian version of THI (THI-P). Pearson
product-moment correlations revealed
adequate test–retest reliability for the THI-
P (r=0.96). Cronbach’s α coefficient
indicated adequate internal stability of the
THI-P (r=0.943), with a total–item
correction varying between r=0.939 and
r=0.944, indicating its reproducibility (23).
To the best of our knowledge, there is no
study evaluating the construct validity of
the THI, nor any report of its psychometric
properties. The aim of this study was to
continue the work of Mahmoudian and
colleagues concerning the reliability and
validity of the Persian version of the
questionnaire, and to undertake the
following: 1) assess the reliability and
validity of the Persian version of THI for
measuring the consequences of tinnitus; 2)
investigate the complex relationship
between tinnitus and psychological
distress in adult outpatients suffering from
tinnitus; 3) assess the basic psychometric
properties of the THI-P.
Materials and Methods
This study is a psychometric validation of
the THI by Newman, conducted from
March to September 2013.
The original version of the THI (THI-US)
was translated into Persian (THI-P) using a
translation-back translation method (23).
Two native speakers of Persian, bilingual
in English and Persian, separately
performed the forward translation
independently of one another. Two of the
investigators (JMM, SR) performed a
synthesis of the two translations. A fluent
English-speaking person who was ignorant
Reproducibility of THI-P
Iranian Journal of Otorhinolaryngology,Vol.27(2),Serial No.79, Mar 2015 85
of the original version then back translated
this version into English. An expert team
composed of two of the investigators
(JMM, SR) and a bilingually experienced
translator reviewed the preliminary version
of the THI. The wording of individual
items was then adjusted based on a
comparison of the original and the back-
translated version. Three audiologists
further verified the appropriateness of the
translation. A form with Persian and
English versions of all the 25 items was
given to them. Each item was to be rated
as either ‘appropriate’ or ‘inappropriate’.
If an item was deemed inappropriate, the
judges would have to suggest corrections.
If two out of three judges found an item in
the THI-P appropriate, the translation was
considered correct. Minor alterations were
carried out according to the answers
obtained from the three audiologists, and
our Persian version of the THI was then
finalized.
Subjects
The final version of the THI-P was
administered to 102 tinnitus patients
(62 males, 40 females, aged 20–80 years)
recruited consecutively at the Department
of Otorhinolaryngology, Amiralmomenin
Hospital, Guilan University of Medical
Sciences (GUMS) after receiving
otoneurological and audiological
evaluations. Inclusion criteria were
sensorineural-related tinnitus, and we
excluded cases of concurrent external and
middle ear diseases and temporoman-
dibular joint (TMJ) disorders. Patients
with dizziness, vertigo, mental retardation
or psychiatric disorders, head and neck
disease, or any organic disease (for
example vascular disease) were excluded.
We considered the educational level and
hand preference of patients. The study was
approved by the ethics committee of
GUMS and was conducted in accordance
with Helsinki Declarations. Informed
consent was obtained from all subjects
before testing. Test–retest reliability was
assessed following a second investigation.
We asked the patients to complete the
inventory again 7–10 days after the first
investigation. Eighty-five of 102 patients
(49 males, 36 females, aged 23–80 years)
completed the second inventory. None of
the included patients were given any
intervention.
Tonal and vocal audiometry and impe-
dance tests were carried out in all patients.
Tinnitus pitch and loudness matches were
determined using the two-alternative
forced-choice method. A pair of tones was
presented and the subject was asked to
identify which tone best matched the pitch
of their tinnitus. Loudness matches were
tested using the bracketing approach with
1-dB increments. The tones were
presented in the ear contralateral to the
predominant or louder tinnitus (24). If the
tinnitus was equally loud on both sides, the
ear with the better hearing was used as the
test ear. If there was no difference in
hearing acuity, the test ear was chosen
randomly.
Assessment of Tinnitus Severity
Tinnitus severity was assessed by asking
patients to complete a visual analogue scale
(VAS) measuring the perceived loudness of
their tinnitus (tinnitus loudness). The VAS
scales consisted of a 10-cm line with
endpoints anchored as total absence and
maximum tinnitus loudness.
Additional Measures
As mentioned earlier, the THI consists
three subscales: functional, emotional and
catastrophic which evaluate physical
functioning, affective responses to tinnitus,
and ability to cope and fear of a grave
disease. Then we considered following
questionnaires for evaluating construct
validity. The 21-item self-report Beck
Depression Inventory (BDI) was used to
Jalali MM, et al
86 Iranian Journal of Otorhinolaryngology,Vol.27(2),Serial No.79, Mar 2015
assess current depressive symptoms (25).
Its validity and reliability have been
demonstrated in Iran previously
(Cronbach’s α: 0.89, test–retest correlation:
0.94) (26). Each item has four statements
describing increasing levels of severity, and
the total score ranges from 0 to 63. Scores
of 10 or more indicate the presence of
depressive symptoms (27).
Anxiety was assessed using the Persian
version of the Spielberger State-Trait
Anxiety Inventory (STAI). The STAI scale
consists of 40 statements describing various
emotional states. Twenty of these
statements require the subjects to describe
their emotional reaction in terms of anxiety
at a particular moment or period in time
(state anxiety). Statements are scored on a
4-point scale of increasing intensity, from
‘not at all’ to ‘very much so’ (with scores
of 0–3, respectively). The other 20 items
require the subject to describe how they
generally feel and their general response to
situations perceived as threatening (trait
anxiety). These items are also scored on a
4-point intensity scale, from ‘almost never’
to ‘almost always’. For both sections,
possible cumulative scores for each scale
range from 0 (not anxious) to 60 (high
anxiety). Scores of 40 or more indicate the
presence of anxiety symptoms (28). The
Persian version of STAI has been used in
previous studies and its validity and
reliability have been demonstrated. The
value of Cronbach’s α coefficient for
state/trait anxiety were 0.70 and 0.78,
respectively (29, 30).
Statistical Analysis
For this trial, we evaluated the suitability
of the sample using the Bartlett test of
Sphericity. The value for this test was less
than 0.001 (chi-square = 1870.23, df =
300), indicating that there are correlations
in the dataset that are appropriate for factor
analysis. Also, we assessed sampling
adequacy using the Kaiser-Meyer-Olkin
(KMO) measurement. KMO varies from 0
to 1.0 and the overall KMO value should
be 0.60 or higher to proceed with factor
analysis; with a value greater than 0.90
considered outstanding. In this study, the
KMO value was 0.93.
For external reliability of the questionnaire,
we used test–retest reliability. For analysis
of internal reliability of the questionnaire,
Cronbach’s α coefficient was calculated.
Principal component analysis with varimax
rotation was used to validate the THI factor
structure. Items were retained if they had
loadings equal to or greater than ±0.40 and
an eigenvalue ≥ 1. Factor loading is the most
significant factor in the interpretation of the
principal component analysis and a value of
±0.4 is considered highly significant. Also a
criterion of eigenvalues is to determine the
number of factors.
An independent t-test was computed to test
the hypothesis that the THI score and its
subscales could differ between males and
females. Pearson’s product moments were
calculated between the total score of the
THI-P and the scores of its subscales, age
and pure tone average (PTA) to assess
correlations.
Pearson’s product moments were also
calculated between the total score of the
THI-P and the scores of its subscales, as
well as between the scores of the Beck, the
STAI, and VAS to test convergent validity.
Statistical significance was set at P<0.05
in all analyses, for which the statistical
software SPSS 21.0 version was used. We
performed a confirmatory factor analysis
using AMOS. In confirmatory factor
analysis (CFA), we specified a model,
indicating which variables loaded on
which factors and which factors were
correlated.
Results
Participant Characteristics
The mean age of the participants was
50.25 ± 13.40 years (range, 20–80 years)
Reproducibility of THI-P
Iranian Journal of Otorhinolaryngology,Vol.27(2),Serial No.79, Mar 2015 87
and 60.8% of cases were male. All patients
suffered from continuous uni- or bilateral
tinnitus with a mean duration of 2.8 years
(range 6 months to 18 years, median 1.8
years).
The mean PTA hearing threshold,
calculated over 0.5, 1, 2, and 4 kHz across
both ears, ranged from 1.25–76.25 dB HL
(mean=20.36 dB). In 50 cases (49%) the
audiograms revealed bilateral sloping
high-frequency hearing losses. Thirty-
seven patients (36.3%) had bilateral
normal hearing (PTA ≤ 25 dB HL) and 15
(14.7%) showed a unilateral sensorineural
hearing loss. In terms of PTA hearing
threshold, a low non-significant correlation
was found between the mean hearing
threshold and tinnitus handicap scores.
Also, there was a low correlation between
tinnitus duration and THI-P score
(P<0.05). We found significant medium-
to-high correlations between VAS, BDI,
STAI and THI-P scores (all correlation
were significant at the 0.01 level).
The majority of subjects (47%) were 46–65
years old, followed by those aged 26–45
years (34%) the 65 years and older (15%).
The lowest concentration of subjects was
found in the 20–25-year age bracket (4%).
As was the case for the original version of
the THI, no correlations between age and
tinnitus handicap score were observed in the
THI-P (ρ = 0.138, P= 0.17).
Tinnitus Characteristics
Most of the patients suffered from
unilateral tinnitus (60%), while 40%
suffered from bilateral tinnitus. Tinnitus
pitch was most frequently matched at 4200
Hz, while mean loudness matching was at
the 8-dB sensation level (SL) (standard
deviation [SD]=4.6). All loudness matches
across all handicap grades were at the 0–12
dB SL. A significant correlation was found
between the duration of the tinnitus and
tinnitus handicap scores (P=0.228,
P=0.02). The majority of cases were
classified as slight (28.52%), followed by
mild and moderate (22.54% each), severe
and catastrophic (13.72% each). In males,
the majority of cases were concentrated in
the mild (25.8%) and moderate (25.8%)
grades while in females most of the cases
were slight (39.9%). Mean total THI in
male and female participants was 42.16 and
37.95, respectively. Gender differences in
perceived tinnitus handicap were examined
using t-tests for independent samples. As in
the case for the original version of the THI,
no significant effect of gender was
observed in the THI-P (P>0.05).
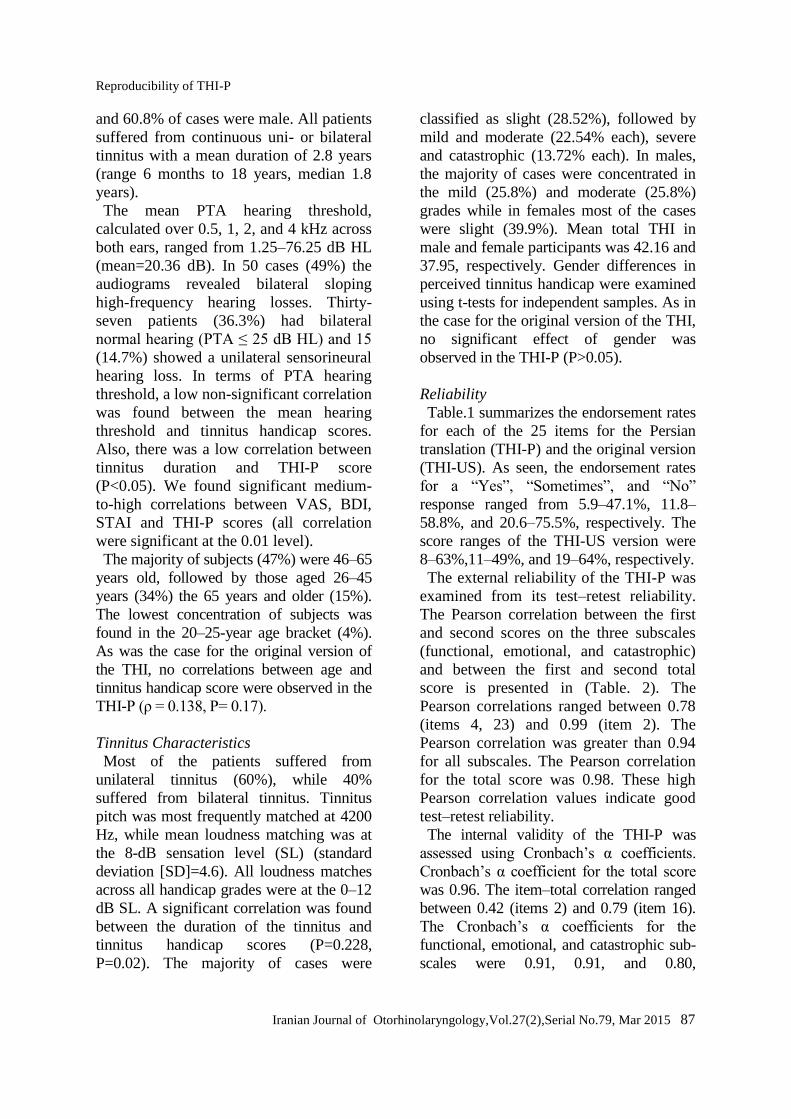
Reliability
Table.1 summarizes the endorsement rates
for each of the 25 items for the Persian
translation (THI-P) and the original version
(THI-US). As seen, the endorsement rates
for a “Yes”, “Sometimes”, and “No”
response ranged from 5.9–47.1%, 11.8–
58.8%, and 20.6–75.5%, respectively. The
score ranges of the THI-US version were
8–63%,11–49%, and 19–64%, respectively.
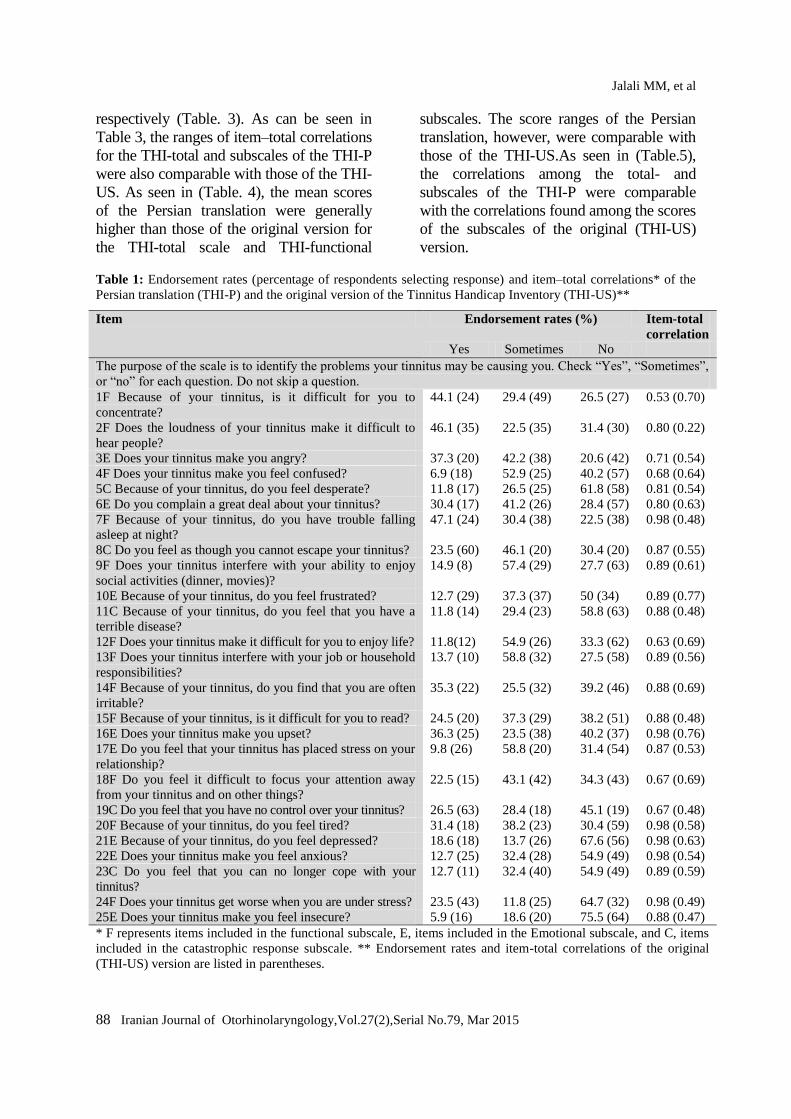
The external reliability of the THI-P was
examined from its test–retest reliability.
The Pearson correlation between the first
and second scores on the three subscales
(functional, emotional, and catastrophic)
and between the first and second total
score is presented in (Table. 2). The
Pearson correlations ranged between 0.78
(items 4, 23) and 0.99 (item 2). The
Pearson correlation was greater than 0.94
for all subscales. The Pearson correlation
for the total score was 0.98. These high
Pearson correlation values indicate good
test–retest reliability.
The internal validity of the THI-P was
assessed using Cronbach’s α coefficients.
Cronbach’s α coefficient for the total score
was 0.96. The item–total correlation ranged
between 0.42 (items 2) and 0.79 (item 16).
The Cronbach’s α coefficients for the
functional, emotional, and catastrophic sub-
scales were 0.91, 0.91, and 0.80,
Jalali MM, et al
88 Iranian Journal of Otorhinolaryngology,Vol.27(2),Serial No.79, Mar 2015
respectively (Table. 3). As can be seen in
Table 3, the ranges of item–total correlations
for the THI-total and subscales of the THI-P
were also comparable with those of the THI-
US. As seen in (Table. 4), the mean scores
of the Persian translation were generally
higher than those of the original version for
the THI-total scale and THI-functional
subscales. The score ranges of the Persian
translation, however, were comparable with
those of the THI-US.As seen in (Table.5),
the correlations among the total- and
subscales of the THI-P were comparable
with the correlations found among the scores
of the subscales of the original (THI-US)
version.
Table 1: Endorsement rates (percentage of respondents selecting response) and item–total correlations* of the
Persian translation (THI-P) and the original version of the Tinnitus Handicap Inventory (THI-US)**
Item Endorsement rates (%) Item-total
correlation
Yes Sometimes No
The purpose of the scale is to identify the problems your tinnitus may be causing you. Check “Yes”, “Sometimes”,
or “no” for each question. Do not skip a question.
1F Because of your tinnitus, is it difficult for you to
concentrate?
44.1 (24) 29.4 (49) 26.5 (27) 0.53 (0.70)
2F Does the loudness of your tinnitus make it difficult to
hear people?
46.1 (35) 22.5 (35) 31.4 (30) 0.80 (0.22)
3E Does your tinnitus make you angry? 37.3 (20) 42.2 (38) 20.6 (42) 0.71 (0.54)
4F Does your tinnitus make you feel confused? 6.9 (18) 52.9 (25) 40.2 (57) 0.68 (0.64)
5C Because of your tinnitus, do you feel desperate? 11.8 (17) 26.5 (25) 61.8 (58) 0.81 (0.54)
6E Do you complain a great deal about your tinnitus? 30.4 (17) 41.2 (26) 28.4 (57) 0.80 (0.63)
7F Because of your tinnitus, do you have trouble falling
asleep at night?
47.1 (24) 30.4 (38) 22.5 (38) 0.98 (0.48)
8C Do you feel as though you cannot escape your tinnitus? 23.5 (60) 46.1 (20) 30.4 (20) 0.87 (0.55)
9F Does your tinnitus interfere with your ability to enjoy
social activities (dinner, movies)?
14.9 (8) 57.4 (29) 27.7 (63) 0.89 (0.61)
10E Because of your tinnitus, do you feel frustrated? 12.7 (29) 37.3 (37) 50 (34) 0.89 (0.77)
11C Because of your tinnitus, do you feel that you have a
terrible disease?
11.8 (14) 29.4 (23) 58.8 (63) 0.88 (0.48)
12F Does your tinnitus make it difficult for you to enjoy life? 11.8(12) 54.9 (26) 33.3 (62) 0.63 (0.69)
13F Does your tinnitus interfere with your job or household
responsibilities?
13.7 (10) 58.8 (32) 27.5 (58) 0.89 (0.56)
14F Because of your tinnitus, do you find that you are often
irritable?
35.3 (22) 25.5 (32) 39.2 (46) 0.88 (0.69)
15F Because of your tinnitus, is it difficult for you to read? 24.5 (20) 37.3 (29) 38.2 (51) 0.88 (0.48)
16E Does your tinnitus make you upset? 36.3 (25) 23.5 (38) 40.2 (37) 0.98 (0.76)
17E Do you feel that your tinnitus has placed stress on your
relationship?
9.8 (26) 58.8 (20) 31.4 (54) 0.87 (0.53)
18F Do you feel it difficult to focus your attention away
from your tinnitus and on other things?
22.5 (15) 43.1 (42) 34.3 (43) 0.67 (0.69)
19C Do you feel that you have no control over your tinnitus? 26.5 (63) 28.4 (18) 45.1 (19) 0.67 (0.48)
20F Because of your tinnitus, do you feel tired? 31.4 (18) 38.2 (23) 30.4 (59) 0.98 (0.58)
21E Because of your tinnitus, do you feel depressed? 18.6 (18) 13.7 (26) 67.6 (56) 0.98 (0.63)
22E Does your tinnitus make you feel anxious? 12.7 (25) 32.4 (28) 54.9 (49) 0.98 (0.54)
23C Do you feel that you can no longer cope with your
tinnitus?
12.7 (11) 32.4 (40) 54.9 (49) 0.89 (0.59)
24F Does your tinnitus get worse when you are under stress? 23.5 (43) 11.8 (25) 64.7 (32) 0.98 (0.49)
25E Does your tinnitus make you feel insecure? 5.9 (16) 18.6 (20) 75.5 (64) 0.88 (0.47)
* F represents items included in the functional subscale, E, items included in the Emotional subscale, and C, items
included in the catastrophic response subscale. ** Endorsement rates and item-total correlations of the original
(THI-US) version are listed in parentheses.
Reproducibility of THI-P
Iranian Journal of Otorhinolaryngology,Vol.27(2),Serial No.79, Mar 2015 89
Table 2: Pearson product-moment correlation coefficients, standard error (SE) of measurement, 95% confidence
intervals (CIs), mean and standard deviation (SD), range values associated with the test–retest administrations of
the Persian version of Tinnitus Handicap Inventory (THI-P) subscales and total scores (N=85).
THI-P Test Retest Correlation
Coefficients Se 95% CI p-value
Functional (Maximum score: 48)
Mean 37.9 38.1
0.98 3.0 6.2
SD 26.8 26.8 0.001
Range 0-48 0-48
Emotional (Maximum score: 32)
Mean 22.0 21.6
0.98 1.5 2.1
SD 13.5 13.5 0.001
Range 0-30 0-28
Catastrophic response (Maximum score: 20)
Mean 10.8 11.0
0.94 1.0 2.0
SD 9.1 9.1 0.001
Range 0-18 0-20
Total (Maximum score: 100)
Mean 6.1 6.3
0.98 0.6 1.3
SD 5.4 5.5 0.001
Range 4-92 2-94
Table 3: Reliability coefficients (Cronbach’s α coefficient) of the Persian translation of the THI (THI-P) and the
original version (THI-US).
THI-P (α)
THI-US
(α)
THI-P
(Item-total)
THI-US
(Item-total)
THI-total (25 items) 0.96 0.93 0.42–0.79 0.22–0.77
Functional (12 items) 0.91 0.86 0.51–0.75 0.27–0.76
Emotional (8 items) 0.91 0.87 0.62–0.79 0.56–0.82
Catastrophic (5 items) 0.80 0.68 0.55–0.62 0.42–0.48
Table 4: Mean scores (±SD) and range of scores of the total THI scale and subscales of the Persian translation
(THI-P) and the original version (THI-US).
THI-total Functional Emotional Catastrophic
THI-P (mean) (n=102) 40.4 ± 26.5 22.0 ± 12.9 11.7 ± 9.2 6.7 ± 5.5
THI-US (mean) (n=66) 24.4 ± 20.5 11.0 ± 9.7 8.2 ± 8.4 6.1 ± 4.5
THI-P (range) (n=102) 4-96 0-46 0-32 0-20
THI-US (range) (n=66) 0-92 0-44 0-32 0-18
Table 5: Pearson product-moment correlations among THI-total and subscales of the Persian (THI-P) and the
original (THI-US) version.
THI-total Functional Emotional Catastrophic
THI-total 1.00 (1.00) - - -
Functional P (US) 0.97 (0.92) 1.00 (1.00) - -
Emotional P (US) 0.97 (0.93) 0.90 (0.75) 1.00 (1.00) -
Catastrophic P (US) 0.93 (0.89) 0.84 (0.65) 0.89 (0.78) 1.00 (1.00)
Jalali MM, et al
90 Iranian Journal of Otorhinolaryngology,Vol.27(2),Serial No.79, Mar 2015
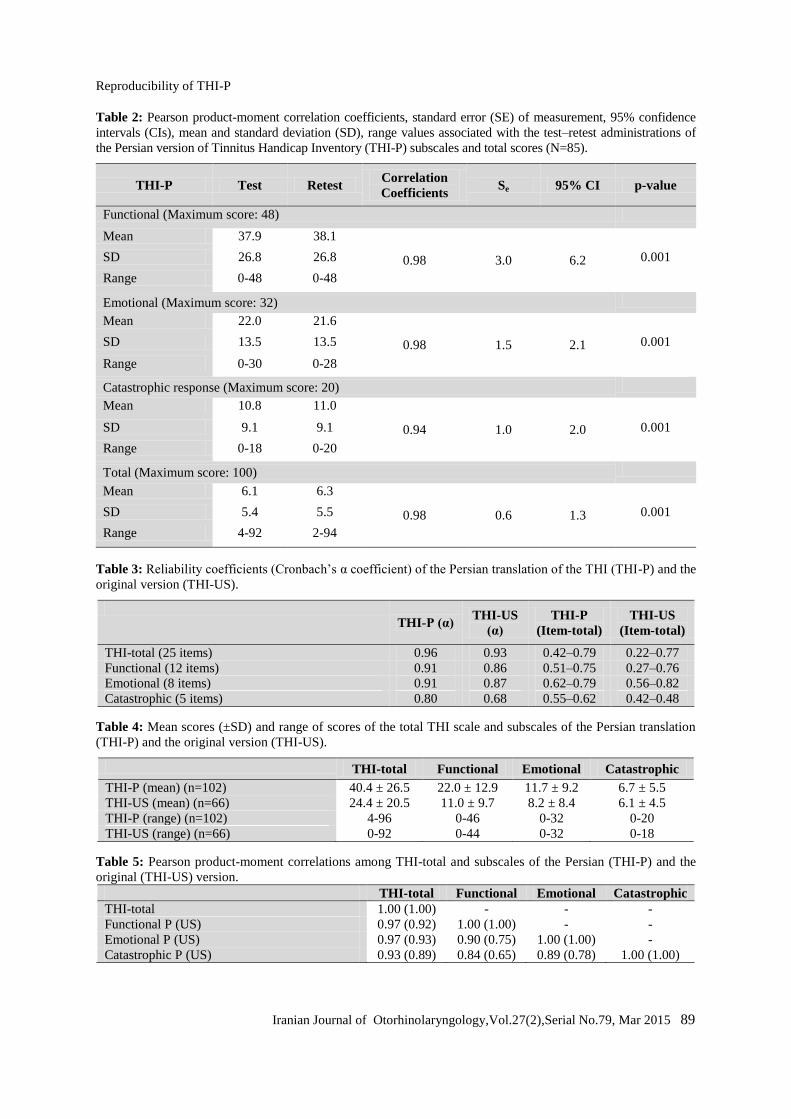
Confirmatory Factor Analysis
A confirmatory factor analysis was
conducted to test whether the data could
confirm the latent variables represented by
the functional, emotional, and catastrophic
subscales of the original version of the THI.
The data were analyzed using a principal
components factor analysis with varimax
rotation. Because the KMO sampling
adequacy was 0.930, the items were con-
sidered acceptable for factor analysis. The
eigenvalues for these factors were 12.88
(Factor 1), 2.04 (Factor 2), and 1.08 (Factor
3). Factor 1 explained 51.52% of the
variance, Factor 2 explained 8.16% of the
variance, and Factor 3 explained 4.34% of
the variance. To ensure distinct subscales,
the differences between the highest and
second-highest factor loadings had to exceed
0.20 to be retained in the analysis. In the
three-factor solution, 10 items were loaded
on more than one factor, with the remaining
three factors consisting of 5, 5 and 5 items,
respectively. The results are given in Table 6.
Table 6: Results of the three-factor solution of the 25 items of the Persian translation (THI-P) of the Tinnitus
Handicap Inventory (THI)*
Scale item Factor
1 2 3
F 24 Does your tinnitus get worse when you are under stress? 0.90
E 21 Because of your tinnitus, do you feel depressed? 0.84
E 25 Does your tinnitus make you feel insecure? 0.82
E 22 Does your tinnitus make you feel anxious? 0.80
C 23 Do you feel that you can no longer cope with your tinnitus? 0.75
C 5 Because of your tinnitus, do you feel desperate? 0.63
E 10 Because of your tinnitus, do you feel frustrated? 0.60
F 18 Do you feel it difficult to focus your attention away from your tinnitus? 0.55
C 11 Because of your tinnitus, do you feel that you have a terrible disease? 0.54
C 19 Do you feel that you have no control over your tinnitus? 0.52
E 6 Do you complain a great deal about your tinnitus? 0.50
F 4 Does your tinnitus make you feel confused? 0.39
F 15 Because of your tinnitus, is it difficult for you to read? 0.76
F 14 Because of your tinnitus, do you find that you are often irritable? 0.72
F 7 Because of your tinnitus, do you have trouble falling asleep at night? 0.71
E 16 Does your tinnitus make you upset? 0.64
E 3 Does your tinnitus make you angry? 0.61
F 20 Because of your tinnitus, do you feel tired? 0.56
F 2 Does the loudness of your tinnitus make it difficult to hear people? 0.77
F 9 Does your tinnitus interfere with your ability to enjoy social activities? 0.71
F 1 Because of your tinnitus, is it difficult for you to concentrate? 0.65
F 12 Does your tinnitus make it difficult for you to enjoy life? 0.65
F 13 Does your tinnitus interfere with your job or household
responsibilities?
0.62
E 17 Do you feel that your tinnitus has placed stress on your relationship? 0.57
C 8 Do you feel as though you cannot escape your tinnitus? 0.57
Reproducibility of THI-P
Iranian Journal of Otorhinolaryngology,Vol.27(2),Serial No.79, Mar 2015 91
Split Sample Validity
We validated our analysis by conducting
an analysis on each half of the sample. We
compared the results of these two split-
sample analyses with the analysis of the
full data set. All of the communalities in
both validation samples met the criteria.
The pattern of loadings for both validation
samples was the same, and the same as the
pattern for the analysis using the full
sample. This validation analysis supports a
finding that the results of this principal
component analysis were generalizable to
the population represented by this dataset.
Construct Validity
Table 2 summarizes the correlations
among scores on the THI-P for tinnitus
severity and psychological distress. The
mean VAS for tinnitus severity was 6.33
(SD=2.04). In 62 cases (59.8%) VAS was
more than 5. A significant correlation was
observed between THI-P and tinnitus
severity according to the VAS (ρ=0.479,
P= 0.001).
The score for the BDI ranged from 0 to 39
(mean=4.7). In 19 cases (18.6%),
depressive symptoms were reported. The
STAI measures both anxiety as a general
trait and the here-and-now level of
perceived anxiety. The mean scores for two
questionnaires were 41.1 and 44.5,
respectively. In 41 (40.2%) and 56 cases
(54.9%), state and trait anxiety,
respectively, were pathologic. We found a
high correlation between the BDI and STAI
scores and tinnitus handicap scores of
participants with tinnitus (ρ = 0.66 and ρ =
0.69–0.77, respectively).
Discussion
The results of the present investigation
demonstrate that the Persian translation of
the THI (THI-P) has a good internal
consistency and reliability for the total
scale; as also demonstrated in a previous
study (23). THI-P had the same internal
reliability as the original version (α = 0.93).
The internal reliability of the functional
(α= 0.91) and emotional (α=0.91) subscales
of the THI-P were similar to those of the
original THI (α=0.86 and α=0.87,
respectively). The internal reliability of the
catastrophic subscale of THI-P (α=0.80)
was higher than that reported for the
original THI version (α= 0.68).
A well-known measurement parameter
for internal consistency is Cronbach’s α
coefficient, which means that all test items
measure the same construct. As a rule of
thumb, values greater than 0.7 show good
internal consistencies and values greater
than 0.9 show very high internal
consistencies (30). To determine whether
each item was consistent with the average
direction of the other items, an item–total
correlation test was performed. If the
correlation (calculated using Pearson’s
correlation coefficient) between one single
item and the total score without this item
has a low correlation (<0.3) (31), then the
item does not measure the same construct
as the others. For the THI-P questionnaire,
item 2 showed lower item–total correlations
(0.42) than other items; which is in
accordance with previous findings reported
by Newman et al. (7). These data indicate
that hearing difficulties due to tinnitus
loudness (item 2) were only moderately
correlated with tinnitus handicap.
THI-P had good external reliability for the
total score and the subscale scores (total
Pearson correlation, 0.98; functional, emo-
tional, and catastrophic Pearson correlations
were 0.98, 0.98, and 0.94, respectively).
Items 4 and 23 demonstrated the lowest
degree of test–retest reliability.
The high inter-correlations found between
the subscales of the THI were similar to
those found for the original version. This
finding calls into question whether the
subscales represent three distinct, underlying
latent variables, and it should be mentioned
that the three subscales of the THI were not
Jalali MM, et al
92 Iranian Journal of Otorhinolaryngology,Vol.27(2),Serial No.79, Mar 2015
created by a factor analysis (7).
Two points concerning the construct
validity of a questionnaire are important to
note. First, although researchers often
describe their instruments as “validated,”
construct validity is an estimate of the
extent to which variance in the measure
reflects variance in the underlying
construct. Second, the extent of observed
associations with measures of other match
theoretical predictions shows how it is
associated with those variables (32). To
assess the construct validity, the original
THI developers used the BDI, Modified
Somatic Perception Questionnaire, and
symptom rating scales. Weak correlations
were observed between THI and both the
BDI and Modified Somatic Perception
Questionnaire. Significant correlations were
observed between the THI and symptom
rating scales. The creators of the
Portuguese, Italian, and Cantonese versions
of the THI evaluated validity by testing
correlations between THI translations and
other questionnaires. The Portuguese THI
was correlated to the BDI with a Pearson
correlation coefficient of 0.68, thus
confirming its validity (16). The Italian
version correlated well with the MOS 36-
Item Short Form Health Survey (SF-36)
and the Hospital Anxiety and Depression
Scale (HADS), providing evidence of good
construct validity (17, 33, 34). THI-CH
scores significantly correlated with the
anxiety and depression scores of the HADS
(20). The results of our confirmatory factor
analysis seem to reinforce this doubt,
because 10 out of the 25 items were loaded
on more than one factor, and the items
loading on the remaining three factors only
partially represented the subscales
suggested by Newman et al (7). Factor
analysis of the THI-P yielded similar results
to the factor analyses performed on other
versions of the THI. Factor analysis of THI-
DK (13), the Italian version of the THI
(17), THI-CM (19), and THI-CH (20) also
revealed unifactorial structures. In the
validation study for THI-DK, researchers
stated that the three factors only partially
matched the items in the original three
subscales (13). Factor analysis of the Italian
version of the THI indicated that the first,
second, and third factors accounted for
35.9%, 7.8%, and 7.5% of the variance,
respectively (17). Factor analysis of THI-
CM demonstrated that the first, second, and
third factors accounted for 38.9%, 6.5%,
and 5.0% of the variance, respectively (19).
Factor analysis of THI-CH demonstrated
that the first, second, and third factors
accounted for 41.9%, 6.87%, and 5.87% of
the variance, respectively (20). Factor
analysis of the original THI version
performed in 2003 indicated that three
factors could explain 52.8% of the variance,
and adding more factors contributed little to
the explanation of variance. Additionally,
the majority of items were loaded on the
first factor (35). The unifactorial structure
of the original version was demonstrated.
As was observed for the original version,
the Persian version of THI does not appear
to be affected by age, gender, or hearing
loss. These findings were similar to those
found by Mahmoudian et al (23).
Our results showed moderate-to-strong
relationships between the THI and
depression as measured by the BDI. These
findings are in agreement with earlier reports
of a relationship between depression and
tinnitus severity (36, 37). In contrast, only a
weak relationship between THI and
depression was observed for the original
version. This difference between the Persian
and the original sample may be explained by
the higher mean THI-total scores (40.4 ±
26.5) of the Persian sample compared with
the original US sample (THI-total: 24.4 ±
20.5). Strong-to-moderate correlations were
also observed between the THI-P and the
STAI questionnaires. Similar correlations
were generally observed for THI-total scores
and scores on the three subscales. This
Reproducibility of THI-P
Iranian Journal of Otorhinolaryngology,Vol.27(2),Serial No.79, Mar 2015 93
finding suggests that the subscales may not
necessarily measure three distinct factors.
The high correlation between the three
subscales in the confirmatory factor analysis
is in favor of the above finding. These
findings are in concordance with the earlier
Zachariae study which failed to validate the
three distinct factors (13).
We showed a clear linear relationship
between a VAS estimate of tinnitus severity
and the corresponding scores for the THI-P
questionnaire. This demonstrates that total
score could distinguish between different
grades of tinnitus severity.
The most important specifications of an
instrument for assessment include
repeatability, consistency, and validity of
the obtained scores. We evaluated
reliability of the THI-P from two aspects of
the test–retest reliability and Interclass
Correlation Coefficient (ICC). The other
aspect of consistency was related to the
correlation between test–retest which was
evaluated by the Pearson correlation
coefficient. We obtained a value of 0.984 in
the Persian THI version, consistent with
significant correlation in retest. Comparison
of consistency in the finding of this
research with the original English version
using Cronbach’s α coefficient revealed a
significant correlation of the Persian
version (0.96) with the English version
(0.93) (7). The present study proved the
internal consistency/coherency of the THI-
P. This demonstrates that the THI-P is
satisfactory for application in
clinical/research environments.
With respect to the subscales of THI-P, our
data suggest that the items of the subscales
included in the original version of the THI
may not represent distinct underlying latent
variables, and further studies using the THI
and other similar measures are needed to
clarify whether specific tinnitus distress
measures can be identified. Since the design
of this study did not allow for the testing of
different subset of patients with tinnitus, it is
recommended that the relationship between
the THI-P and psychopathological problems
be investigated.
Conclusion
In conclusion, the results of the study
suggest that the THI-P is a reliable measure
of tinnitus-related handicaps. The reliability
of THI-P is in line with that of the original
English version. Consistent with previous
findings reported by Mahmoudian (23), the
THI-P has high internal consistency,
adequate test–retest reliability and adequate
reproducibility. In addition, we found high
construct validity, and concurrent validity.
Thus, we conclude that the THI-P is a
reliable and valid tool to assess tinnitus-
related handicap in Persian-speaking adults.
However, it appears that the subscale items
of the THI do not represent distinct
underlying latent variables, and further
studies using the THI and other similar
measures are needed to clarify whether
specific tinnitus distress measures can be
identified.
Acknowledgments
The authors are grateful to the tinnitus
patients for their participation in this
research. No potential conflict of interest
relevant to this article was reported.
References 1. Jastreboff PJ, Hazell JW. Treatment of tinnitus based on a neurophysiological model. In: Vernon JA, editor. Tinnitus: treatment and relief. Boston, MA: Allyn and Bacon; 1998. p. 201–17. 2. Moller AR. Tinnitus: presence and future. Prog Brain Res. 2007; 166:3–16. 3. Henry JA, Dennis KC, Schechter MA. General review of tinnitus: prevalence, mechanisms, effects, and management. J Speech Lang Hear Res. 2005; 48(5):1204–35. 4. Hoffman HJ, Reed GW. Epidemiology of tinnitus. In: Snow JB, editor. Tinnitus: theory and manage- ment. Lewiston, NY: BC Decker; 2004. p. 16-41. 5. Westin V, Hayes SC, Andersson G. Is it the sound or your relationship to it? The role of acceptance in predicting tinnitus impact. Behav Res Ther. 2008; 46(12):1259–65.
Jalali MM, et al
94 Iranian Journal of Otorhinolaryngology,Vol.27(2),Serial No.79, Mar 2015
6. Davis A, Refaie AE. Epidemiology of tinnitus. In: Tyler RS, editor. Tinnitus handbook. Sandiego, CA: Singular; 2000. p. 1–24. 7. Newman CW, Jacobson GP, Spitzer JB. Development of the tinnitus handicap inventory. Arch Otolaryngol Head Neck Surg. 1996; 122(2): 143–8. 8. Newman CW, Jacobson GP. Psychometric adequacy of the Tinnitus Handicap Inventory (THI) for evaluating treatment outcome. J Am Acad Audiol 1998; 9: 379–80. 9. Mirz F, Zachariae B, Anderson SE, Nielsen AG, Johansen LV, Bjerring P, et al. Treatment of tinnitus with low-intensity laser. Ugeskr Laeger 2000; 162(25): 3607–10. 10. Henry JL, Wilson PH. The psychological management of tinnitus: comparison of a combined cognitive educational program, education alone and a waiting-list control. Int Tinnitus J 1996; 2:9–20. 11. Westerberg BD, Roberson JB Jr, Stach BA. A double-blind placebo-controlled trial of baclofen in the treatment of tinnitus. Am J Otol 1996;17(6): 896–903. 12. Aksoy S, Firat Y, Alpar R. The Tinnitus Handicap Inventory: A Study of Validity and Reliability. Int Tinnitus J. 2007;13(2):94–98. 13. Zachariae R, Mirz F, Johansen LV, Andersen SE, Bjerring P, Pedersen CB. Reliability and validity of a Danish adaptation of the tinnitus handicap inventory. Scand Audiol 2000; 29(1): 37–43. 14. Baguley D, Norman M. Tinnitus handicap inventory. J Am Acad Audiol 2001; 12(7): 379–80. 15. Kim JH, Lee SY, Kim CH, Lim SL, Shin JN, Chung WH, et al. Reliability and validity of a Korean adaptation of the tinnitus handicap inventory. Korean J Otolaryngol-Head Neck Surg 2002; 45(4):328–34. 16. Schmidt LP, Teixeira VN, Dall’Igna C, Dallagnol D, Smith MM. Brazilian Portuguese language version of the “Tinnitus Handicap Inventory”: validity and reproducibility. Braz J Otorhinolaryngol 2006; 72(6):808–10. 17. Monzani D, Genovese E, Marrara A, Gherpelli C, Pingani L, Forghieri M, et al. Validity of the Italian adaptation of the Tinnitus Handicap Inventory: focus on quality of life and psychological distress in tinnitus-sufferers. Acta Otorhinolaryngol Ital 2008; 28(3):126–34. 18. Lim JJ, Lu PK, Koh DS, Eng SP. Impact of tinnitus as measured by the Tinnitus Handicap Inventory among tinnitus sufferers in Singapore. Singapore Med J 2010; 51(7):551–7. 19. Meng Z, Zheng Y, Liu S, Wang K, Kong X, Tao Y, et al. Reliability and validity of the chinese (mandarin) Tinnitus Handicap Inventory. Clin Exp Otorhinolaryngol 2012;5(1):10–6. 20. Kam AC, Cheung AP, Chan PY, Leung EK, Wong TK, van Hasselt CA, et al. Psychometric properties of the Chinese (Cantonese) Tinnitus Handicap Inventory. Clin Otolaryngol 2009; 34(4): 309–15. 21. Shinden S, Ogawa K, Inoue Y, Tazo M, Asano K. Tinnitus annoyance and difficulty in activities of daily life evaluated by the Tinnitus Handicap Inventory. Audiol Japan 2002;45(6):685–91.
22. Tobias CA, Llanes EG, Chiong C. Validity of a filipino translation of the Tinnitus Handicap Inventory. Int Tinnitus J 2012; 17(1):64–9. 23. Mahmoudian S, Shahmiri E, Rouzbahani M, Jafari Z, Keyhani MR, Rahimi F, et al. Persian language version of the “Tinnitus Handicap Inventory”: translation, standardization, validity and reliability. International Tinnitus Journal 2011;16(2): 93-103. 24. Vernon JA, Meikle MB: Measurement of tinnitus:an update. In: Kitahara M, editor. tinnitus, Pathophysiology and Management. Tokyo, Igaku-Shoin Ltd, 1988, p. 36–52. 25. Beck AT, Ward CH, Mendelson M, Mock J, Erbaugh J. An inventory for measuring depression. Arch Gen Psychiatry 1961; 4(6):561–71. 26. Ghassemzadeh H, Mojtabai R, Karamghadiri N, Ebrahimkhani N. Psychometric properties of a Persian-language version of the Beck Depression Inventory–Second edition: BDI-II-PERSIAN. Depress Anxiety 2005;21(4):185–92. 27. Lespérance F, Frasure-Smith N, Talajic M, Cameron O. Major depression before and after myocardial infarction: its nature and consequences. Psychosom Med 1996; 58(2):99–112. 28. Spielberger CD, Gorsuch RL, Luschene RE. Manual for the State-Trait Anxiety Inventory. Palo Alto, CA: Consulting Psychologists Press 1970. 29. Bastani F, Hidarnia A, Kazemnejad A, Vafaei M, Kashanian M. A randomized controlled trial of the effects of applied relaxation training on reducing anxiety and perceived stress in pregnant women. J Midwifery Womens Health 2005; 50(4):e36–e40. 30. Dadsetan P, Mansour M. Mental illness. Tehran: Roshd Press; 1998 [in Persian]. 31. Nunnally JC, Bernstein I: Psychometric Theory (McGraw-Hill Series in Psychology). New York: McGraw-Hill Higher Education 1993, p. 736. 32. Westen D, Rosenthal R. Quantifying construct validity: Two simple measures. Journal of Personality and Social Psychology. 2003; 84(3): 608–18. 33. McHorney CA, Ware JE Jr, Raczek AE. The MOS 36-item short-form health survey (SF-36): II. Psychometric and clinical tests of validity in measuring physical and mental health constructs. Med Care 1993; 31(3):247–63. 34. Costantini M, Musso M, Viterbori P, Bonci F, Del Mastro L, Garrone O, et al. Detecting psychological distress in cancer patients: validity of the Italian version of the Hospital Anxiety and Depression Scale. Support Care Cancer 1999; 7(3):121–7. 35. Baguley DM, Andersson G. Factor analysis of the Tinnitus Handicap gInventory. Am J Audiol 2003; 12(1):31–4. 36. Kuk FK, Tyler RS, Russell D, Jordan H. The psychometric properties of a tinnitus handicap questionnaire. Ear Hear 1990; 11(6):434–45. 37. Zeman F, Koller M, Langguth B, Landgrebe M. Which tinnitus-related aspects are relevant for quality of life and depression: results from a large international multicentre sample? Health Qual Life Outcomes 2014 Jan 14;12:7.


