Embed Size (px)
Citation preview

G
L
P
Ga
b
c
a
ARRAA
KPEPISP
1
inpnfaattowotl
MT
d
0d
ARTICLE IN PRESSModel
AND-2014; No. of Pages 15
Landscape and Urban Planning xxx (2011) xxx–xxx
Contents lists available at ScienceDirect
Landscape and Urban Planning
journa l homepage: www.e lsev ier .com/ locate / landurbplan
ublic Participation GIS: A new method for national park planning
reg Browna,b,∗, Delene Weberc
School of Geography, Planning and Environmental Management, University of Queensland, Brisbane, QLD 4072, AustraliaGeography Department, Central Washington University, 400 E. University Way, Ellensburg, WA 98926, United StatesBarbara Hardy Centre for Sustainable Urban Environments, University of South Australia, Adelaide, South Australia 5095, Australia
r t i c l e i n f o
rticle history:eceived 21 September 2010eceived in revised form 1 March 2011ccepted 12 March 2011vailable online xxx
eywords:ark experiences
a b s t r a c t
This paper describes research to evaluate the use of a public participation geographic information system(PPGIS) methodology for national park planning. Visitor perceptions of park experiences, environmentalimpacts, and facility needs were collected via an internet-based mapping method for input into a nationalpark planning decision support system. The PPGIS method presupposes that consistent with the dominantstatutory framework, national parks should be managed for both visitor enjoyment and natural andcultural resource protection. This paper: (1) describes the PPGIS method used in a 2009 park planningstudy conducted for national parks in the Greater Alpine region of Victoria, Australia; (2) presents and
nvironmental impactsPGISndicatorstandardsublic participation GIS
evaluates selected results of the Greater Alpine study and provides examples of how PPGIS data canbe used for decision support in park planning; (3) provides a summary of lessons learned including adiscussion of future implementation constraints. The results demonstrate that an internet, participatorymapping method, though not without limitations, can be effective in measuring visitor experiences,environmental impacts, and facility needs for a variety of park planning processes. PPGIS expands a parkagency’s repertoire of methods to engage the public in planning and can help build and sustain trust ina park agency’s planning process and decisions.
© 2011 Elsevier B.V. All rights reserved.
. Introduction
Most national park systems have a dual and potentially conflict-ng statutory mandate to provide for both visitor enjoyment andatural and cultural landscape protection. For example, the pur-ose of U.S. National Park system is “to conserve the scenery and theatural and historic objects and the wild life therein and to provide
or the enjoyment of the same in such manner and by such meanss will leave them unimpaired for the enjoyment of future gener-tions” (National Park Service Organic Act of 1916, 16 U.S.C. 1). Inhe U.K., the purposes of national parks are to conserve and enhancehe natural beauty, wildlife and cultural heritage while promotingpportunities for the understanding and enjoyment by the public,
Please cite this article in press as: Brown, G., & Weber, D. Public ParticipatPlan. (2011), doi:10.1016/j.landurbplan.2011.03.003
ith an added duty to foster the social and economic well-beingf the local communities (National Parks and Access to the Coun-ryside Act of 1949, Part II § 5 and 11a). In Victoria, Australia, theocation of this study, the purpose of Parks Victoria is to conserve,
∗ Corresponding author at: School of Geography, Planning and Environmentalanagement, University of Queensland, Brisbane, QLD 4072, Australia.
el.: +61 7 3365 6654; fax: +61 7 3365 6899.E-mail addresses: [email protected] (G. Brown),
[email protected] (D. Weber).
169-2046/$ – see front matter © 2011 Elsevier B.V. All rights reserved.oi:10.1016/j.landurbplan.2011.03.003
protect, and enhance natural and cultural values, provide qualityexperiences, services and information to customers, provide excel-lence and innovation in park management, and contribute to theenvironmental, social and economic wellbeing of Victorians (ParksVictoria, 2009).
To be effective, national park management authorities requirepark planning and management methods that provide useful infor-mation for decision support including information about visitorexperience and resource protection. Resources available for parkplanning and decision-making include statements of park pur-poses, observations of park staff, indicators and standards ofquality, and public input (Anderson, Lime, & Wang, 1998). Com-mon to national park planning is the development of plans thatrecognize the diversity of national park resources and visitor oppor-tunities both within individual national park units, and at differentparks on a regional or national scale. Differential national park qual-ities may be reflected in a regional or national park system plan (e.g.,Ecosystem Management Plan), a park comprehensive plan (e.g., aMaster or General Management Plan), or a park sub-area plan (e.g.,
ion GIS: A new method for national park planning. Landscape Urban
a Backcountry Management Plan).Two planning concepts that are central to national park planning
are park management zones and indicators of quality. Large parkscomprise multiple management zones that address managementpriorities within a park (e.g., conservation, recreation or educa-
ING
L
2 nd Ur
tcatppn(V11QFsr2t
ampKiwiaptmp&1c&Y(W
(sEcCari
mcaepmwitpcpbicta
f
ARTICLEModel
AND-2014; No. of Pages 15
G. Brown, D. Weber / Landscape a
ion) and typically reflect the spatial heterogeneity of biophysicalonditions and visitor opportunities. Management zones providemeans to spatially separate potentially conflicting park activi-
ies, or alternatively, to collocate complementary activities. Theotential for diverse visitor experiences is recognized in variousublic lands planning frameworks such as the Recreation Opportu-ity Spectrum (Driver & Brown, 1978); Limits of Acceptable ChangeStankey et al., 1985), Visitor Impact Management (Graefe, Kuss, &aske, 1990), Visitor Activities Management Process (Parks Canada,991); Visitor Experience and Resource Protection (Hof & Lime,997; Manning, Graefe, & McCool, 1996; Wilkinson, 1995), anduality Upgrading and Learning (Chilman, Foster, & Everson, 1990).uture park management frameworks will likely move towards aystems approach focused on linkages between the physical envi-onment and visitor opportunities (Brown, Koth, Kreag, & Weber,006) and the application of geographic information systems (GIS)echnology can facilitate these linkages.
Indicators and standards of quality are often attached to man-gement zones to provide criteria to assess the effectiveness ofanagement activities. Indicators may be established for both
hysical resources and experiential outcomes. For example, onangaroo Island in South Australia, environmental indicators
nclude the number of hooded plover pairs and the percentage ofaste diverted from landfill on the island, whereas the experiential
ndicators include the proportion of visitors who believe they hadn intimate experience with wildlife in a natural setting, and theroportion of visitors who believed their experience was similar tohat suggested in marketing documents (TOMM, 2006). Other com-
on indicators used in park management include encounters witharticular visitor groups (Hall, Shelby, & Rolloff, 1996; MartinsonShelby, 1992; Stankey, 1980; Vaske, Graefe, Shelby, & Heberlein,
986; Young, Williams, & Roggenbuck, 1991); number of groupsamped within sight or sound of each other (Roggenbuck, Williams,Watson, 1993; Williams, Roggenbuck, Patterson, & Watson, 1992;oung et al., 1991); number of pieces of litter visible from campsiteRoggenbuck et al., 1993); and depth of erosion on a trail (Parks and
ildlife Service Tasmania, 2003).Standards are threshold points associated with an indicator
e.g., depth of erosion should not exceed 3 cm or “no more thanix encounters with other groups per day during peak season”).stablishing useful and cost effective indicators remains a majorhallenge to park managers. Research as early as Clark, Hendee, andampbell (1971) demonstrated differences between recreationistsnd managers in defining what constitutes an environmental expe-ience, highlighting the need to seek public input when establishingndicators and standards.
Public participation is important to protected area planning andanagement because decisions about management zones and indi-
ators of quality involve a series of subjective value judgments anddiversity of interests (McCool & Cole, 1997). Experiential knowl-dge gained through a public involvement process can add differenterspectives and augment scientific knowledge and expert judg-ent. The scope of public participation in park planning can varyidely from inviting individual comments on a park plan, to work-
ng with national park stakeholder groups in a planning process,o broad-scale surveys of park visitors. It is important in publicarticipation GIS (PPGIS) projects (described below) to articulatelear goals and understand the limitations of the project. For exam-le, acknowledging that visitors perceptions of management wille based on a range of socioeconomic and individual factors includ-
ng past experience, may lead us to expect that an assessment of
Please cite this article in press as: Brown, G., & Weber, D. Public ParticipatPlan. (2011), doi:10.1016/j.landurbplan.2011.03.003
urrent management effectiveness conducted by a visitor is likelyo be different to that conducted by a manager who is likely to havedifferent set of experiences.
Gathering high quality public input is however, a difficult taskor park managers. It is difficult to engage many visitors in park
PRESSban Planning xxx (2011) xxx–xxx
planning when they are intent on enjoying limited leisure time.Further, parks are often large and dispersed with low number ofstaff which makes intercepting park visitors difficult. Research byWeber (2007) in other Parks Victoria sites highlighted demandby visitors for convenient participation methods with the inter-net being cited frequently as an example of a convenient method.The internet PPGIS platform developed for this study provides auseful mechanism to gather public input from a wide spectrum ofAustralians. In 2009, 80.1% of the Australian population used theinternet (Nielsen, 2009). In 2005 it was estimated that these usershave a median age of 36.56 years (www.internetworldstats.com).Importantly, the Australian Bureau of Statistics (2010) showed 71%of users had broadband connections of speeds of 1.5 Mbps or greaterwhich makes using the internet-based PPGIS, particularly accessingthe demonstration, a quicker exercise.
As well as being a convenient method that is accessible to thegeneral public, respondents seem to readily understand internet-based PPGIS systems. People’s spatial awareness and use ofmapping is likely to have improved with usage of programs suchas Google Maps and Near Maps. This does not suggest that moretraditional methods such as public meetings, focus groups or sur-veying should not take place. In fact, the PPGIS reported in thisstudy was only one method of a variety used to elicit public inputfor a management plan. What makes a PPGIS system particularlyvaluable to land managers is the functionality it provides, for exam-ple the ability to overlay visitor data on existing GIS layers such astrails, vegetation and soil. This paper uses data from a project in theAlpine area of Victoria to demonstrate the application of PPGIS inpark planning.
1.1. Review of PPGIS applications
In this paper, we present public participation using geographicinformation systems (PPGIS) as a method for assisting nationalpark planning. The term “public participation geographic infor-mation systems” (PPGIS) was conceived in 1996 at the meetingof the National Center for Geographic Information and Analy-sis (NCGIA). PPGIS combines the practice of GIS and mapping atlocal levels to produce knowledge of place. The formal defini-tion of the PPGIS remains nebulous (Tulloch, 2007) with use ofthe term “PPGIS” emerging in the United States and developed-country contexts while the term participatory GIS or “PGIS” isoften used to describe participatory planning approaches in ruralareas of developing countries, the result of a spontaneous mergerof Participatory Learning and Action (PLA) methods with geo-graphic information technologies (Rambaldi, Kwaku Kyem, Mbile,McCall, & Weiner, 2006). Since the 1990s, the range of PPGISapplications has been extensive, ranging from community andneighborhood planning to mapping traditional ecological knowl-edge of indigenous people (see Sieber, 2006 and Sawicki &Peterman, 2002 for a review of PPGIS applications). AlthoughPPGIS activity often involves community mapping and databasedevelopment outside of formal government processes, the focusof this paper is on the genre of PPGIS that seeks to expandand enhance public participation and community collabora-tion in governmental processes for environmental planning andmanagement.
In an early PPGIS public lands application, Brown and Reed(2000) asked individuals to identify the location of landscape val-ues for the Chugach National Forest (U.S.) planning process. Reedand Brown (2003) subsequently developed a quantitative mod-
ion GIS: A new method for national park planning. Landscape Urban
eling approach using the PPGIS mapped attributes to determinewhether management alternatives were generally consistent, andmore important, place-consistent, with publicly held forest val-ues. Research using PPGIS has also been conducted to identifythe location of highway corridor values (Brown, 2003); to iden-
ING
L
nd Ur
tb2o(2MRuFtft2aC
brbiPbSPmitim
1
tPVtabptaenwtmnvtt
vTtespiPdesn
ARTICLEModel
AND-2014; No. of Pages 15
G. Brown, D. Weber / Landscape a
ify “coupled social–ecological” hotspots (SES) where human andiophysical systems are closely linked (Alessa, Kliskey, & Brown,008); to identify preferences for tourism and residential devel-pment (Brown, 2006); to identify priority areas for conservationPfueller, Xuan, Whitelaw, & Winter, 2009; Raymond & Brown,007); to manage recreation resources on public lands (McIntyre,oore, & Yuan, 2008); to identify place attachment (Brown &
aymond, 2007); and to measure urban park and open space val-es for park planning (Brown, 2008). Researchers with the Canadianorest Service designed and developed the first internet-based par-icipatory mapping application to collect data on the locations oforest landscape values across a 2.4 million hectare study area inhe province of Alberta, Canada (Beverly, Uto, Wilkes, & Bothwell,008). Additional internet-based studies for national forest man-gement in the U.S. followed (Brown & Reed, 2009; Clement &heng, 2010).
In their assessment of the strengths and weaknesses of internet-ased PPGIS, Brown and Reed (2009) report that the spatialesults from the methodology are sensitive to the subpopulationseing sampled and that general public data collection using the
nternet may need to be augmented by traditional mail-basedPGIS methods to increase participation rates, a finding supportedy a recent internet-based PPGIS study in Wyoming (Pocewicz,chnitzer, & Nielsen-Pincus, 2010). However, the internet-basedPGIS methodology appears complementary to workshop or publiceeting-based mapping of landscape values that may be included
n national park planning participatory processes. A key strength ofhe PPGIS methodology is that it can build and strengthen trust byncreasing opportunities for collaboration in public lands manage-
ent (Brown & Reed, 2009).
.2. Research objectives
To better understand the strengths and limitations of PPGIS spa-ial mapping methods for national park planning, we developed aPGIS process for national parks in the Greater Alpine region ofictoria, Australia, in 2009. PPGIS systems have the flexibility to be
ailored to the national park planning application through choicesbout sampling, the attributes to be mapped, and the analyses toe performed. As one of the first PPGIS studies for national parklanning, we were guided by a series of research questions relatedo both the method and the usefulness of the resulting data andnalysis for park planning: (1) can the concepts of visitor experi-nces, perceived environmental impacts, and park facilities/serviceeeds be effectively mapped using an internet-based PPGIS? (2)ill park visitors participate in the study following contact during
heir park visit? (3) what are the similarities and differences in theix of visitor experiences and environmental impacts in different
ational park units? (i.e., the park “profile”) and (4) are mappedisitor experiences, perceived environmental impacts, and facili-ies/services needs consistent with existing management zones forhe national park units?
To describe the use of PPGIS for national park planning, we pro-ide a framework for organizing and presenting the results in Fig. 1.his paper will focus on the data collection methods used, descrip-ive analysis of the results, and one planning application—thexploration of management indicators for determining the con-istency of visitor experience and environmental impact data inark management zones in the region. Although not presented
n this paper, other park planning applications are possible using
Please cite this article in press as: Brown, G., & Weber, D. Public ParticipatPlan. (2011), doi:10.1016/j.landurbplan.2011.03.003
PGIS data. For example, Fig. 1 shows three such applications:etermining whether level of service (LOS) criteria are being met;stablishing or validating Recreation Opportunity Spectrum clas-ifications; and examining visitor perceptions of facilities/serviceseeds against asset management plans.
PRESSban Planning xxx (2011) xxx–xxx 3
2. Methods
2.1. Study area and planning process
Parks Victoria, the national park management agency for Vic-toria, Australia, is preparing a new Greater Alpine National ParksManagement Plan that will include the Alpine, Baw Baw, MountBuffalo, Errinundra and Snowy River National Parks as well as theAvon Wilderness Park, Walhalla and adjacent historic areas. Theplanning area covers over 860,000 ha and is located in central andeastern Victoria. National parks and historic areas extend in anarc from Baw Baw National Park in the southwest to ErrinundraNational Park in the east (see Fig. 2). Specifically, the managementplan will cover the 9 park units comprising 5 national parks; 1wilderness area; and 3 historic areas. All units were included inthe study. Under government legislation, all national parks andother protected areas need to have a management plan and mostplans are reviewed every 10–15 years. The Greater Alpine NationalPark management plan will consolidate the existing, individualnational park plans to provide a broad strategic plan for manag-ing the mix of Alpine parks. Substantial changes have occurredsince the last management plan was published, including climatechange, fire frequency, cessation of cattle grazing, and an increasein nature-based tourism. A PPGIS was initiated to gather data fromthe general public about their use and experience in the study area,as well as their perceptions of environmental impacts. This datainformed a wiki draft plan, which was available for public input.More traditional methods such as public forums and focus groupswere also used to gather data, as well as approaches targeted atyounger audiences, such as blogging via a purpose built website(www.weplan.parks.vic.gov.au). The draft plan was then open forpublic input for a period of three months before the final plan wasdeveloped.
2.2. Survey procedure
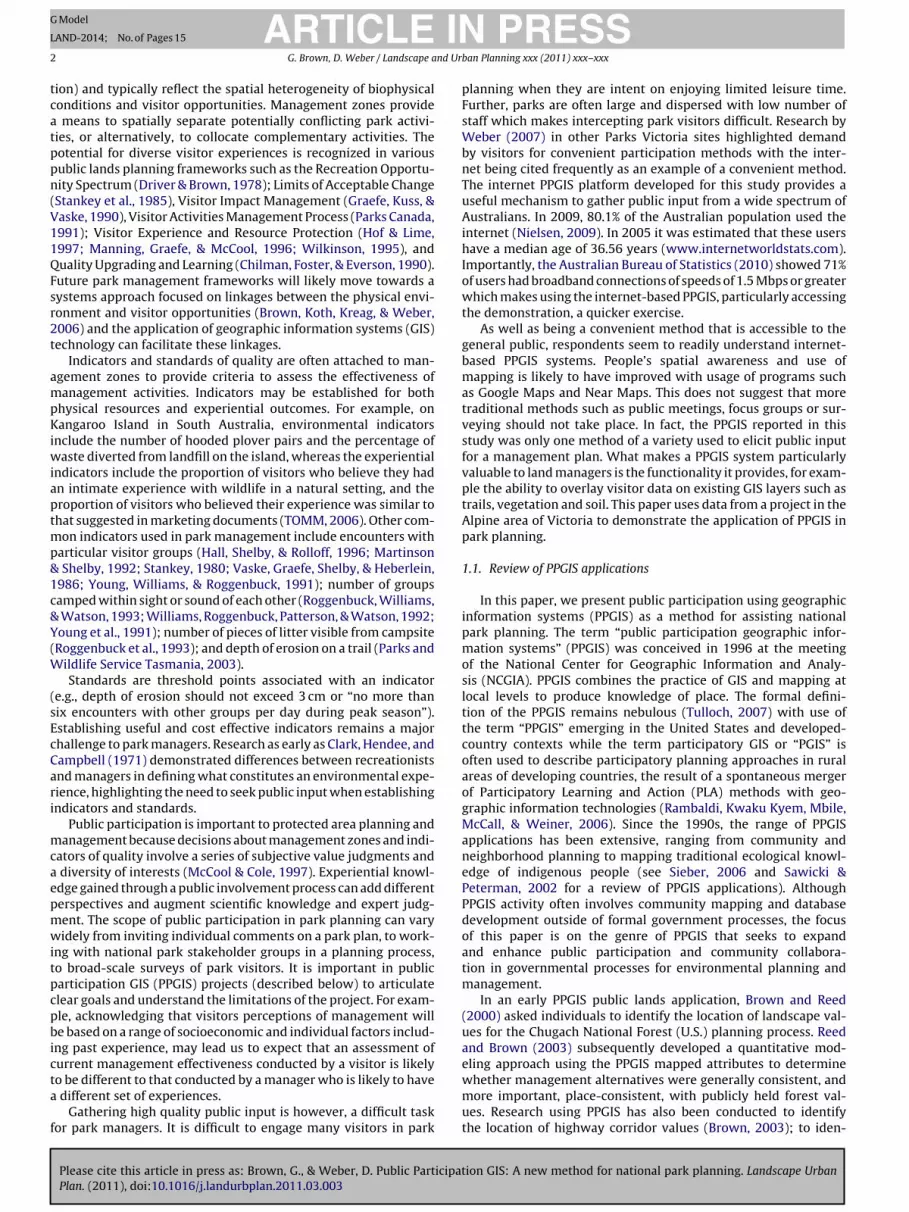
After consultation with Parks Victoria staff and based on currentliterature, park experience and environmental impact variables forinvestigation were identified. The variables were pre-tested andmodified based on comments from Parks Victoria staff (see Table 1).In January 2009, an interactive web-based public participation GISsurvey was launched (http://www.landscapemap2.org/pvppgis/).Participants were recruited on-site at various national parks andalso by advertising the web-site. Parks Victoria staff members thatworked for national parks in the Greater Alpine region were sentemail invitations with specific access codes by the Parks Victoriaplanning team. When participants accessed the website they werewelcomed by a page explaining the study and the time needed tocomplete the survey. Participants then entered their access code tobegin the survey. An option to request an access code was providedfor those who had not received an access code via field surveyingor staff invitation. The survey consisted of two components: (a) aspatial component where participants mapped experience, impact,and facilities variables and (b) 10 questions measuring respon-dent characteristics such as their self-assessed knowledge of theVictorian Alps, their self-assessed knowledge of the natural envi-ronment, the number of times they had visited the national parksin the Victorian Alps, and basic demographic questions includingage, gender, income, and level of formal education.
After reading background information and consenting to partic-ipate, respondents were offered an optional demonstration of how
ion GIS: A new method for national park planning. Landscape Urban
the PPGIS system worked. To enter data, they would click on a maptile representing a park section they had visited and then select anddrag different park experience and environmental impact markersto the relevant location on the map (see Fig. 3). Each person wasprovided a total of six markers for each of the 18 variables shown in

Please cite this article in press as: Brown, G., & Weber, D. Public Participation GIS: A new method for national park planning. Landscape UrbanPlan. (2011), doi:10.1016/j.landurbplan.2011.03.003
ARTICLE IN PRESSG Model
LAND-2014; No. of Pages 15
4 G. Brown, D. Weber / Landscape and Urban Planning xxx (2011) xxx–xxx
Fig. 1. A framework for using PPGIS in national park planning.
Fig. 2. Map of Greater Alpine study area, Victoria, Australia.
Table 1Variables (markers) that park visitors could map on the PPGIS website.
Experience variables Impact variables Other variables
Aesthetic/scenic Track condition (degraded) Special placesCrowding/congestion Campsite condition (degraded) Facilities/services changesSolitude/escape Rubbish/litterSocial interaction Wildlife (dead or sick)Trail-based activity Vegetation (dead/unhealthy)Other physical activity/adventure Water quality (degraded)Overnight stay/camping NoiseLearning/discoveryWildlife viewing

ARTICLE IN PRESSG Model
LAND-2014; No. of Pages 15
G. Brown, D. Weber / Landscape and Urban Planning xxx (2011) xxx–xxx 5
e. Par
TlpRiu
ftrcwerspto
2
tiAch
Fig. 3. Screenshot of PPGIS user interface after entering access cod
able 1. Respondents were able to optionally annotate each markerocation with text. Respondents could see all the markers they hadlaced but not the overall mapping pattern created by other users.espondents were asked if they would like copies of the results and
n the spirit of PPGIS these were made available to all interestedsers via a web link that was emailed to them.
The survey procedure was consistent with recommendationsrom the tailored design method described by Dillman (2000). Forhose email addresses collected on-site, if no response had beenegistered after one week, a personal reminder of the importance ofompleting the survey was emailed. If another two weeks elapsedithout response, another reminder was emailed. This reminder
mphasized the ease of the PPGIS system and offered potentialewards (e.g., shopping vouchers for the first five to complete theurvey). The Parks Victoria (PV) staff sample was invited to partici-ate via email from a member of the Parks Victoria Alpine Planningeam. PV staff were sent at least three reminders of the importancef participation.
.3. Sampling
Park visitors were contacted face-to-face at multiple locations in
Please cite this article in press as: Brown, G., & Weber, D. Public ParticipatPlan. (2011), doi:10.1016/j.landurbplan.2011.03.003
he study area. Surveying was conducted over eleven days, includ-ng the Australia Day long weekend and the Easter school holidays.
convenience sample was collected where interviewers inter-epted potential participants at key visitor nodes, for example traileads of popular hikes, high use camping areas, picnic spots and
ticipants drag and drop markers (left) onto the map image (right).
along high use nature trails in each of the nine park units in thestudy location. The nature of the PPGIS study was briefly describedand the visitors were asked if they would voluntarily participate inthe study. If they agreed, they were provided with a one-page infor-mation sheet that described the study and were provided an accesscode to the PPGIS website. To increase ability to intercept peopleand also to provide greater consistency, all participants completedthe internet-based PPGIS activity at a later date, rather than in thefield. A total of 579 visitor contacts were made using this method.
To increase the sample size, an option was provided that allowedindividuals to visit the PPGIS website and request an access codewithout having been explicitly contacted for participation. ThePPGIS web-site was advertised via radio spots, through flyersin visitor information centres and on the Parks Victoria AlpinePlanning Team’s wePlan website (www.weplan.parks.vic.gov.au).Media releases were also sent to all local newspapers in the studyregion and outdoor magazines. Additionally, Parks Victoria staffwere requested to participate via a series of emails from theParks Victoria Planning team. The aim of this sample was to allowfor a comparison between “expert” and “amateur” assessment ofimpacts.
ion GIS: A new method for national park planning. Landscape Urban
2.4. Analysis methods
The most meaningful analyses of PPGIS data for park planningare those that generate information for decision support. Morespecifically, PPGIS systems that collect visitor and staff data about

ING
L
6 nd Ur
ptpramsnTpodn
iafp
stmoiuadecclms
mwocl
oipactitbtopc
mmawtitPcwsa
ARTICLEModel
AND-2014; No. of Pages 15
G. Brown, D. Weber / Landscape a
ark experiences and perceived environmental impacts, facili-ies/services needs, and special places can be analyzed to: (1)rioritize park areas and facilities to allocate scarce managerialesources, (2) determine standards of quality for different parkreas, (3) identify visitor experiences and impacts with existinganagement zones, levels of service (LOS), or other management
tandards for the park, and (4) suggest new options for the plan-ing and management of national parks or sub-areas within a park.he scope of the planning activity (e.g., regional/multiple nationalarks vs. single national park) should guide the type and naturef the analyses performed. Quantitative analyses consist of bothescriptive and inferential methods designed to inform park plan-ing decisions.
Descriptive analysis. The most useful starting point for analysiss to generate descriptive tables, maps, and charts of the visitornd staff survey data. These descriptive inventories provide theoundation for more sophisticated analysis and modeling for parklanning.
Tables show the frequency and rank of mapped attributes bytudy region, park unit, or other planning sub-area. For illustra-ion, tables were generated by region and national park unit. GIS
aps can be generated for each mapped attribute or a combinationf attributes. Descriptive maps of park experiences, environmentalmpacts, facility needs, and special place locations were generatedsing ArcGIS® software to show the spatial distribution of visitornd staff mapped attributes. Density maps of the attribute pointata were created using a kernel density function to show experi-nce and impact “hotspots”, for example, areas of perceived parkrowding, or alternatively, solitude. Specialized charts or graphsan provide better visualization of attributes by area than tabu-ar results. In this study, radar charts were generated to show the
ix of experience and perceived impacts of different national parktudy units in the Greater Alpine region.
Inferential and managerial analysis. The types of inferential andanagement analysis should be guided by the management frame-ork used by the national park management agency. Management
f national parks in Victoria is guided by a number of managementoncepts including park management zones, levels of service (LOS),evels of protection (LOP), and asset planning.
Data collected through a PPGIS system provide for the creationf a variety of management indicators that can augment traditionalndicators used in carrying capacity approaches such as encounterser day or number of pieces of litter seen from a campsite. Gener-ting indicator data using PPGIS systems provides flexibility for thereation of a variety of management indicators and has the poten-ial to be more cost effective because data pertaining to multiplendicators can be collected from a large number of people at oneime (e.g., via the internet). Multiple management indicators cane easily generated from single mapped attributes (e.g., crowding,rack conditions) or a composite of mapped attributes (e.g., the ratiof positive park experiences to environmental impacts). Table 2rovides some examples of potential management indicators thatan be generated from PPGIS data.
In this paper, we provide an example of the use of PPGIS data in aanagerial analysis that examines the consistency of existing parkanagement zones with mapped experiences and impacts. Man-
gement zones provide a geographic framework for: (1) indicatinghich management directions have priority in different parts of
he park, (2) minimizing existing conflicts between uses and activ-ties or between activities and the park’s values, and (3) assessinghe suitability of future activities and development proposals.
Please cite this article in press as: Brown, G., & Weber, D. Public ParticipatPlan. (2011), doi:10.1016/j.landurbplan.2011.03.003
arks Victoria has six primary management zones (conservation,onservation and recreation, recreation development, education,ilderness, reference) and a number of overlay zones including
pecial protection areas. Historical zones/areas also exist withinnd external to national parks and are managed to protect histori-
PRESSban Planning xxx (2011) xxx–xxx
cal and cultural resources and to provide opportunities for peopleto learn about and understand the heritage values of the reserve.Each zone is accompanied by an aim and scope. For example, theaim of the conservation zone is to “protect sensitive natural envi-ronments and to provide for minimal impact recreation activitiesand simple visitor facilities subject to ensuring minimal interfer-ence to natural processes” while the scope covers “broad areascontaining sensitive natural environments or ecosystems whichare unable to sustain the impact of significant levels of dispersedrecreation activity and other uses.” A series of managerial presup-positions regarding the relationship between management zonesand experiences and impacts were examined: (1) there shouldbe proportionately fewer environmental impacts observed in theconservation and reference zones relative to the recreation and con-servation and recreation development zones, (2) there should bemore recreation experiences (e.g., trail activity, physical activity) inthe recreation zones than in the other zones, and (3) there shouldbe more opportunities for solitude experience in the remote andwilderness zones than in other zones.
To examine the relationship between park managementzones and visitor experiences and perceived environmentalimpacts, respondent mapped attributes were intersected withthe spatial boundaries for management zones using ArcGIS®.Cross-tabulations were generated in SPSS® based on the spatialdistribution of attributes that fell within the management zones.Analysis was limited to management zones for which there werea minimum of 30 attributes. Chi-square statistics and analysis ofstandardized residuals (difference between observed and expectedcell counts) were completed to indicate which map attributes weredisproportionately represented within a given management zonethus contributing to the overall association between map attributesand management zones. Standardized residuals greater than 1.96indicate that a given map attribute/zone association contributessignificantly to the overall relationship between attributes andmanagement zones.
Following analysis of experiences and impacts by managementzone, we explored the use of several composite metrics as a meansof determining normative standards by management zone. Is therean acceptable range of experiences and impacts per managementzone? The first alternative is based on the ratio of positive or neutralpark experiences to negative environmental impacts by manage-ment zone. Ideally, one would want this ratio to be high in all parkmanagement zones, but given that some zones emphasize environ-mental protection over visitor access, there may be differentiationin those management zones where resource protection receivespriority. For example, conservation zones should have a higher ratioof positive or neutral park experiences to environmental impactscompared to the conservation and recreation or recreation devel-opment zones because of the potential for more environmentalimpacts associated with visitation. The second potential indicatorexplored in this paper is based on the number of observed envi-ronmental impacts per zone divided by the area of the zone, orthe density of impacts. A reasonable starting point for establish-ing a zone standard would be metrics that fall within one standarddeviation of the empirical average for the management zone.
3. Results
3.1. Survey response rates and respondent characteristics
ion GIS: A new method for national park planning. Landscape Urban
A total of 351 responses were received on the PPGIS website.This comprised 248 responses from visitors intercepted on site; 83responses from the general public; and 20 responses from ParksVictoria staff. The overall response rate from on-site surveying was51% while the response rate from Parks Victoria Alpine-based staff

ARTICLE IN PRESSG Model
LAND-2014; No. of Pages 15
G. Brown, D. Weber / Landscape and Urban Planning xxx (2011) xxx–xxx 7
Table 2Potentially useful management indicators using park experience and impacts.
Indicators Calculation Usefulness Limitations
Single attributeCrowding—measures perceivedcrowding within management zone.
Sum of all points within zone. Tostandardize across management zones,divide by the area of the zone or thenumber of visitors per zone.
Indicates the most crowdedmanagement zones.
Unless standardized by number ofvisitors or area, may have higher countsimply by virtue of higher visitationrates or larger management zones.
Track condition—measures perceivedtrack condition problems withinmanagement zone
Sum all points within zone. Tostandardize across management zones,divide by the area of the zone orkilometers of track within the zone.
Indicates areas in need of trackmaintenance or upgrade.
Unless standardized, will likely reflectareas with high track use.
Composite attributesExperience/impact ratio—the ratio ofpositive or neutral park experiences toperceived environmental impacts
Sum all positive or neutral parkexperiences within zone and divide bynumber of environmental impacts inthe zone.
Indirect measure of sustainable parkmanagement. High ratios indicate highvisitor benefit relative toenvironmental impact.
Assumes equality among parkexperiences and impacts. A zone with10 positive experiences and 5 impactswould be evaluated the same as 2positive experiences and 1 impact.
Impact density—the number ofperceived environmental impacts byarea
Sum all perceived environmentalimpacts within zone and divide by thearea of the zone.
Indirect measure of sustainable parkmanagement. High values indicatepark degradation and need formanagement attention.
Assumes equality among parkenvironmental impacts. Not allimpacts are anthropogenic.
Experience diversity—indicates thediversity of park experiences bymanagement zone (Shannon diversityindex)
D =v∑
i=1
pi ln pi , where pi = the
proportional abundance of the ith parkexperience = (ni/N); ni = the number ofmapped park experiences in the ithexperience category; N = the total
Indicates how visitors are using amanagement zone. The diversity ofpark experiences may or may not beconsistent with zone managementobjectives.
Diversity of park experiences may ormay not be a useful proxy for potentialvisitor conflict, or alternatively, visitorsatisfaction.
mna2rtwido
ueti(hemArawccV
nwtpoimos
number of all mapped parkexperiences; ln = natural logarithm;v = the number of park experiencecategories.
embers was 25%. The response rate for on-site surveying was sig-ificantly higher than other web-based PPGIS studies, e.g., Brownnd Reed (2009) reported 10–12%, Beverly et al. (2008) reported2%, and Brown (2005) reported 25%. It is unclear why responseate from Parks Victoria staff was so low. It could be speculatedhat staff were too busy, did not see value in the process, or thereas some discord between the central office planning staff mak-
ng the request and the regional staff being asked to respond. Whileisappointing, the sample was still sufficient to make some generalbservations.
Participants were asked 10 sociodemographic questions to helpnderstand the characteristics of the study participants and toxamine whether some of these characteristics might be related tohe type of experiences and impacts identified in the study. Approx-mately 80 percent of visitors report average or better knowledgeself-identified) of places in the Victorian Alps and about 86 percentad average or better knowledge (self-identified) of the naturalnvironment. This “knowledge” was not assessed in anyway. Theajority of visitors (55%) participating had visited the Victorianlps more than 10 times in their lifetime. About 60 percent ofespondents were male and 40 percent female with an averagege in the mid-forties. Respondents were divided between thoseith children (about 54 percent) and those without (about 46 per-
ent). The respondents’ level of formal education and income wereonsistent with the general population that visits national parks inictoria.
The number of mapped park experiences and impacts was sig-ificantly related to one’s knowledge of places in the region whichas also related to the number of times visiting national parks in
he region. In general, the greater the self-reported knowledge oflaces in the region, the larger the number of mapped attributes. A
Please cite this article in press as: Brown, G., & Weber, D. Public ParticipatPlan. (2011), doi:10.1016/j.landurbplan.2011.03.003
ne-way ANOVA statistical test confirmed that individuals identify-ng “good” or “excellent” knowledge of places mapped significantly
ore experiences and impacts than individuals reporting “low”r “average” knowledge of places. Park experiences also differedomewhat by household income (Chi-square = 37.8, p ≤ .05). Lower
income individuals/families experienced more overnight stays andmore solitude while experiencing less social interaction. Higherincome individuals/families engaged in more trail-based activi-ties (bushwalking) in particular. Individuals/families in the middleincome category had the highest level of learning/discovery expe-riences.
The park experiences of visitors differed somewhat from ParksVictoria staff. Park visitors identified proportionately more socialinteraction and less solitude experiences than PV staff. PV staffidentified fewer wildlife viewing and social experiences than visi-tors but more solitude experiences. The types of perceived impactsalso differed by sampling groups. PV staff identified proportionatelymore than double the number of campsite impacts and significantlymore track condition impacts while visitors identified proportion-ately more noise, rubbish, water, and wildlife impacts.
3.2. Distribution of visitor experiences and environmentalimpacts in the study region
A total of 5776 attributes were mapped in the study region, andspecific comments were annotated for 372 markers. The frequencyof attributes mapped appears in Table 3. Mapped park experiencesaccount for 79.2% of total mapped attributes while perceived envi-ronmental impacts account for 12.9% of mapped attributes. Specialplaces (6.7%) and facilities/services (1.5%) account for the remain-der of mapped attributes. The number of mapped, positive parkexperience attributes (aesthetic, overnight, solitude, physical activ-ity, trail activity, social interaction, learning, and wildlife viewing)represent about 75 percent of total attributes mapped while thenumber of negative attributes (crowding, track condition, campsitecondition, rubbish, vegetation, noise, water quality, and wildlife)
ion GIS: A new method for national park planning. Landscape Urban
represent about 18 percent of total attributes mapped.The relationship between mapped attributes (experiences and
impacts) was explored using bivariate correlations between thenumber of mapped experiences and perceived environmentalimpacts. A number of significant relationships were found: aes-

ARTICLE IN PRESSG Model
LAND-2014; No. of Pages 15
8 G. Brown, D. Weber / Landscape and Urban Planning xxx (2011) xxx–xxx
Table 3Frequency of mapped attributes in the study region. “E” indicates experienceattribute and “I” indicates impact attribute. “F” indicates facilities or services need.
Map attribute Frequency Percent of mappedattributes
Aesthetic/scenic (E) 942 16.3Overnight (E) 812 14.1Solitude/escape (E) 558 9.7Other physical activity (E) 546 9.5Trail activity (E) 496 8.6Special Places 385 6.7Social interaction (E) 366 6.3Learning/discovery (E) 312 5.4Crowding/congestion (E) 269 4.7Wildlife viewing (E) 265 4.6Track condition (I) 166 2.9Rubbish/litter (I) 119 2.1Vegetation (dead/unhealthy) (I) 113 2.0Campsite condition (I) 109 1.9Noise (I) 109 1.9Facilities/services (F) 87 1.5
toca(
3
TfgtuPtofHieatbDsphNreih
taottittc
app
edvi
sito
rex
per
ien
ces
for
nat
ion
alp
arks
and
his
tori
car
eas
inth
eG
reat
erA
lpin
ere
gion
.Bol
d/u
nd
erli
ne
ind
icat
esth
ela
rges
tpe
rcen
tage
for
the
exp
erie
nce
cate
gory
.
Aes
thet
ic/s
cen
icC
row
din
g/co
nge
stio
nSo
litu
de/
esca
pe
Soci
alin
tera
ctio
nTr
aila
ctiv
ity
Oth
erp
hys
ical
acti
vity
Ove
r-n
igh
tLe
arn
ing/
dis
cove
ryW
ild
life
view
ing
alPa
rk21
.34.
914
.85.
413
.110
.219
.56.
05.
0es
sPa
rk16
.70.
016
.73.
313
.36.
723
.310
.010
.0io
nal
Park
17.4
3.0
15.2
7.6
13.6
15.9
18.9
4.5
3.8
atio
nal
Park
33.3
0.0
19.0
1.6
9.5
1.6
9.5
15.9
9.5
8.6
8.6
2.9
8.6
17.1
2.9
17.1
31.4
2.9
H.A
.12
.718
.85.
012
.77.
76.
522
.37.
76.
5o
Nat
ion
alPa
rk22
.53.
19.
29.
011
.817
.813
.55.
57.
5H
.A.
13.2
2.6
7.9
10.5
7.9
10.5
26.3
18.4
2.6
Nat
ion
alPa
rk21
.43.
615
.26.
35.
417
.015
.26.
39.
8.
22.8
5.7
7.3
8.9
10.6
8.1
13.0
17.9
5.7
Water quality (I) 80 1.4Wildlife (dead or sick) (I) 42 .7
Total 5776 100.0
hetic and solitude experiences (r = .64), trail and overnight (r = .51),ther (non-walking) physical activities and overnight (r = .56),rowding and noise (r = .61), solitude and overnight (r = .62), tracknd campsite conditions (r = .65), campsite and rubbish conditionsr = .58), rubbish and wildlife (.50), and noise and rubbish (r = .64).
.3. Distribution of visitor experiences by park
A total of nine visitor experience variables were investigated.he point distributions can be presented in map, tabular, or chartormat. The mapped, spatial distribution of park experiences in thereater Alpine Region appears in Fig. 4. Table 4 presents the dis-ribution of these experiences by park unit and highlights the parknit where people associate most strongly with each experience.ark experiences in the Greater Alpine Region are unevenly dis-ributed among the different national park units. About 63 percentf all mapped experiences were in Alpine National Park (n = 2195)ollowed by Mt. Buffalo National Park (15%, n = 510) and Howquaills Historic Area (7%, n = 260). The results show that aesthet-
cs and overnight experiences are an important part of the visitorxperience at all parks. Errinundra N.P. had the highest percent-ge of aesthetic/scenic experiences (33%). Howqua Hills H.A. hadhe highest percentage of crowding/congestion experiences (19%)ut this may be a function of the time of surveying (Australiaay long weekend). Errinundra N.P. had the highest percentage of
olitude/escape experiences (19%), Howqua Hills H.A. the highestercentage of social interaction experiences (13%), Grant H.A. theighest percentage of trail (track) experiences (17%), Mt. Buffalo.P. the highest percentage of (non-hiking) physical activity expe-
iences (18%), Mt. Wills H.A. the highest percentage of overnightxperiences (26%), Grant H.A. the highest percentage of learn-ng/discovery experiences (31%), and Avon Wilderness Park theighest percentage of wildlife viewing experiences (10%).
Interestingly, solitude/escape was not an experience confinedo only remote or wilderness parks but was important to visitorst most parks. The three historic areas and Mt. Buffalo were thenly sites where less than 15% of the mapped experiences relatedo the solitude/escape variable. Over 10% of variables mapped for
Please cite this article in press as: Brown, G., & Weber, D. Public Participation GIS: A new method for national park planning. Landscape UrbanPlan. (2011), doi:10.1016/j.landurbplan.2011.03.003
he Howqua Hills and Mount Wills Historic Areas related to socialnteraction. Trail-related activity was an important part of the visi-or experience at most parks with 6 of the 10 units recording morehan 10% of the experiences mapped as trail related. Other physi-al activities were very important at Mt. Buffalo, Snowy River, Baw Ta
ble
4Pe
rcen
tage
ofm
Park
un
it
Alp
ine
Nat
ion
Avo
nW
ild
ern
Baw
Baw
Nat
Erri
nu
nd
raN
Gra
nt
H.A
.H
owqu
aH
ills
Mou
nt
Bu
ffal
Mou
nt
Wil
lsSn
owy
Riv
erW
alh
alla
H.A

ARTICLE IN PRESSG Model
LAND-2014; No. of Pages 15
G. Brown, D. Weber / Landscape and Urban Planning xxx (2011) xxx–xxx 9
e poin
BtAv
3
ptrqwpeir
bWNwaoa
i
Fig. 4. Distribution of all experienc
aw, and Alpine National Parks. Learning/discovery was an impor-ant experience at several parks, most notably at the Grant Historicrea. Wildlife viewing was not mapped as extensively as otherariables.
.4. Assessing similarity/differences in experiences by park unit
To better understand the overall similarity (dissimilarity) inark experiences, bivariate rank correlations were calculated forhe park units (see Table 5). A rank correlation quantifies theelationship between the park experiences (using the ranks of fre-uencies) on a scale from −1 to +1. A high, positive correlationould indicate that individuals have similar experiences in the twoarks while a value of 0 would indicate no relationship betweenxperiences in the two parks. A negative rank correlation wouldndicate that park experiences tend to have opposite frequencyanks.
The strongest correlations in park experiences occurredetween Baw Baw and Mt. Buffalo National Parks (r = .92), Avonilderness Park and Alpine N.P. (r = .85), and Mt. Buffalo and Alpine
.P. (r = .83). The weakest rank correlations in park experiencesere between Mt. Buffalo and Grant H.A. (r = .00) and Mt. Buffalo
Please cite this article in press as: Brown, G., & Weber, D. Public ParticipatPlan. (2011), doi:10.1016/j.landurbplan.2011.03.003
nd Howqua Hills H.A. (r = .03). The park experiences tend towardspposite ranks between Snowy River N.P. and Grant H.A. (r = −.21)nd between Snowy River and Howqua Hills H.A. (r = −.18).
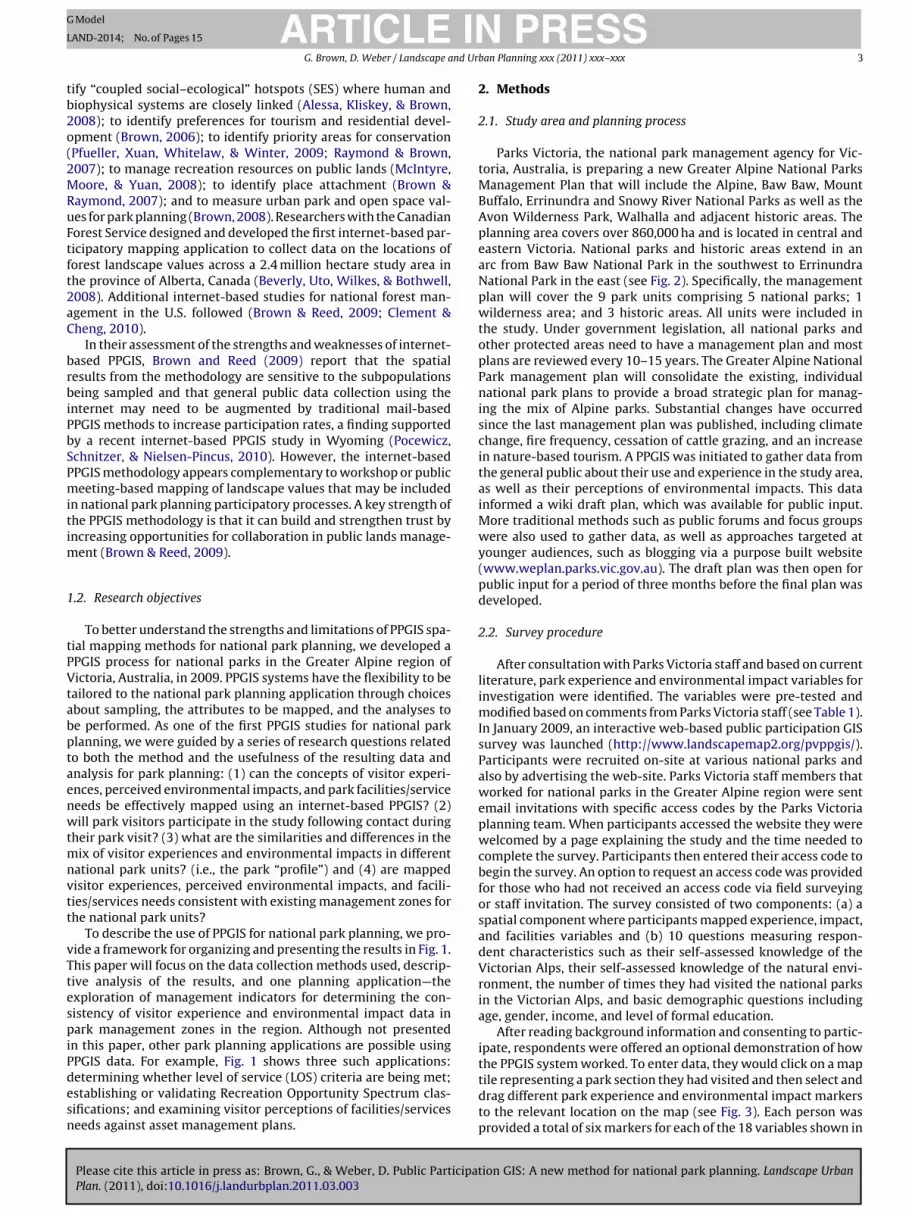
The distribution of experiences in park units can be presentedn graphical format using radar charts that display multiple quan-
ts in Greater Alpine planning area.
titative variables allowing visual comparison of park experienceprofiles (see Fig. 5). For example, the radar charts of Mt. BuffaloN.P. and Snowy River N.P. are similar in shape, but both differ sig-nificantly from Grant Historic Area.
3.5. Distribution of perceived environmental impacts
A total of seven perceived environmental impacts were exam-ined in this study. It is important to note that these wereperceptions of the respondents and not measured according toany standard or indicator. Observed environmental impacts inthe Greater Alpine Region, similar to park experiences, are alsounevenly distributed among the different national park units.About 67 percent of all mapped impacts were in Alpine N.P.(n = 381) followed by Howqua Hills H.A. (11%, n = 64) and Mt. Buf-falo N.P. (7%, n = 39). Mt. Buffalo N.P. had the highest percentage oftrack impacts (51%), Grant H.A. the highest percentage of campsiteimpacts (37%), Avon Wilderness Park the highest percentage of rub-bish/litter impacts (22%) and wildlife impacts (26%), Mt. Wills H.A.the highest percentage of vegetation impacts (60%), Walhalla H.A.the highest percentage of water quality impacts (40%), and HowquaHills the highest percentage of noise impacts (36%).
ion GIS: A new method for national park planning. Landscape Urban
Track condition appears to be the recognizable impact at mostparks. This impact represented about 25% of the all impact markers.Campsite condition and rubbish were also mapped extensively atmany parks. At least a third of impact markers at Grant, Errinundraand Snowy River are related to degraded campsite conditions. Dead

ARTICLE IN PRESSG Model
LAND-2014; No. of Pages 15
10 G. Brown, D. Weber / Landscape and Urban Planning xxx (2011) xxx–xxx
ark e
oteaH
agtHa5ar
3m
imtbdd
rapzrt
Fig. 5. Radar charts showing the distribution of p
r sick wildlife was not mapped extensively at most parks, althoughhis impact was noted in the Avon Wilderness Park. Degraded veg-tation was observed in many locations, notably Mount Wills, Avonnd Mt. Buffalo N.P. Noise impacts were most pronounced at theowqua Hills Historic Area.
A combined impact “hotspot” map was generated for the regionnd appears in Fig. 6. Hotspot maps are raster images containingrid cells representing a density of points that are often color-codedo show increasing density of points as increasing color intensity.otspot maps were generated for the impact observations usingpoint density function (kernel method) with a grid cell size of
00 m and a 2000 m search radius. An impact hotspot map visu-lly indicates priority areas for managerial attention and potentialemediation.
.6. Relationship between experiences and impacts andanagement zones
A total of 2707 experience and impact attributes were analyzedn 25 management zones that had at least 30 attributes per manage-
ent zone in the Greater Alpine Region. As one would expect fromhe large sample size, there is a statistically significant associationetween management zones and visitor experiences (�2 = 177.0,f = 40, p ≤ .001) and perceived environmental impacts (�2 = 78.8,f = 30, p ≤ .001). The results are presented in Tables 6 and 7.
The presupposition that there should be more recreation expe-iences in the recreation zones is supported for both physical trail
Please cite this article in press as: Brown, G., & Weber, D. Public ParticipatPlan. (2011), doi:10.1016/j.landurbplan.2011.03.003
ctivity experiences in the recreation development zone and forhysical activity experiences in the conservation and recreationone. These relationships are major contributors (standardizedesiduals > 1.96) to the overall chi-square value. The presuppositionhat there should be more opportunities for solitude experiences
xperiences by park in the Greater Alpine Region.
in the remote and wilderness zones is also supported by the empir-ical findings. The opposite experience, crowding, appears highestin the historic and recreation development zones. Other significantexperience/zone associations include conservation and wildernesszones having the highest proportion of aesthetic experiences andhistoric areas having the highest proportion of learning and socialexperiences.
The presupposition that there should be proportionately fewerenvironmental impacts observed in the conservation zones relativeto the recreation and conservation zones is empirically supported(standardized residual > 1.96). There were insufficient markersmapped inside of reference areas to infer any conclusion about thismanagement zone. Other significant experience/zone associationsinclude: conservation and remote zones had the highest proportionof track impact conditions; historic areas had the highest propor-tion of noise; conservation and recreation zones had the highestproportion of rubblish/litter impacts; and remote zones had pro-portionately fewer campsite impacts.
3.7. Management zone indicators by experiences and impacts
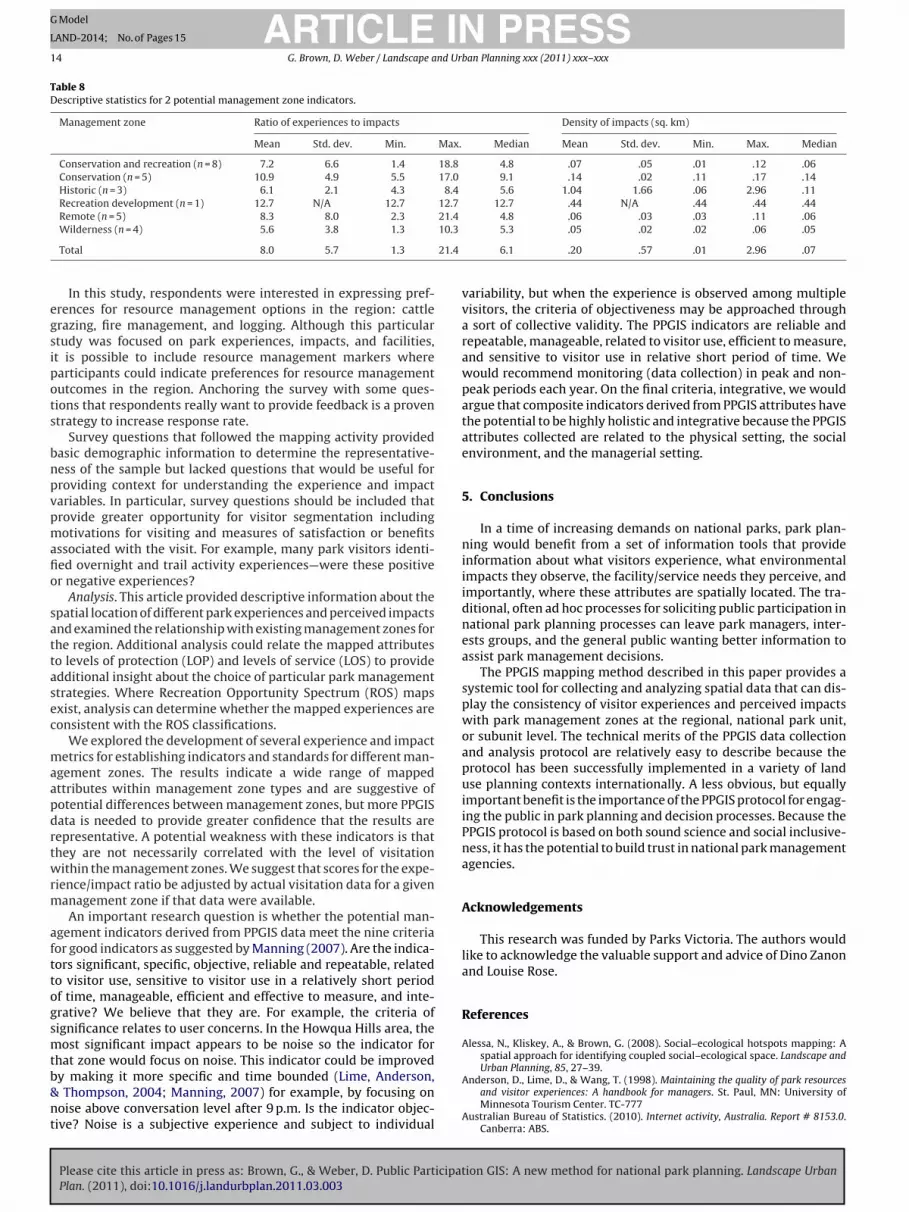
Table 8 presents the empirical results of experiences and envi-ronmental impacts by type of management zone for 2 possibleindicators: ratio of experiences to impacts, and the density ofimpacts. The ratio can be considered an overall standard for a zone.The ratio of experiences to impacts ranged from a low of 5.5:1in wilderness zones to a high of 12.7:1 in the recreation develop-
ion GIS: A new method for national park planning. Landscape Urban
ment zone. The mean of impact densities per zone ranged from alow of .0468 per sq. kilometer in wilderness zones to 1.6 in historiczones. The standard deviation and range statistics for the ratiosindicate a high degree of variability within a given type of zon-ing classification. With a normative standard of the ratio falling

ARTICLE IN PRESSG Model
LAND-2014; No. of Pages 15
G. Brown, D. Weber / Landscape and Urban Planning xxx (2011) xxx–xxx 11
Great
w(za
4
piiarw(tamfm
P
dpwo
Fig. 6. Density “hotspot” map of all perceived environmental impacts in the
ithin one standard deviation of the mean ratio on the low endi.e., higher impacts relative to experiences) only one managementone, a wilderness zone, would be flagged for potential managementttention.
. Discussion
This study was the first to evaluate the effectiveness of a publicarticipation geographic information system (PPGIS) for identify-
ng national park visitor experiences and perceived environmentalmpacts. As a pilot effort, the project had mixed results. The positivespects of the research project included: (1) an acceptable responseate from park visitors contacted to participate (50%), (2) a PPGISebsite that was robust and continuously available for mapping,
3) general respondent agreement that the PPGIS website was easyo use, and (4) results that provided basic descriptive informationbout the distribution of visitor experiences and perceived environ-ental impacts in the Greater Alpine region, which park planners
elt would provide a useful platform for developing an integratedanagement plan for the region.There are multiple areas where future implementation of a
PGIS project with similar goals could be improved.
Please cite this article in press as: Brown, G., & Weber, D. Public ParticipatPlan. (2011), doi:10.1016/j.landurbplan.2011.03.003
Sampling. The response rates from Parks Victoria staff wereisappointing. One of the project objectives was to compare theerceptions of impacts from professional and management staffith visitors. The research literature indicates that park managers
ften observe impacts that visitors do not. With the low par-
er Alpine Region with insets showing enlarged areas to assist interpretation.
ticipation rate of PV staff (about 25%), comparative results areonly suggestive of potential differences between the samplinggroups. PV staff identified proportionately more track and campsiteimpacts than visitors while visitors identified more noise, rubbish,wildlife, and water impacts. It is likely that higher usage by somevisitor segments in more remote sections of parks would result invisitors noticing some impacts not identified by parks managers.Likewise, visitors engaging in specialized activities such as bird-watching might be more likely to notice impacts associated withtheir interest. One potential application of this data could be thedevelopment of an ongoing, public park monitoring program thatfocuses on impacts such as noise, rubbish, wildlife and water. Sucha program would need clear and objective indicators that could eas-ily be measured by visitors and compared to standards establishedby managers.
The visitor sampling effort was concentrated during two peri-ods – Australia Day long weekend and Easter School Holidays – andwhile attempts were made to spatially stratify the data collection,weather conditions and fire events contributed to greater popu-lations using parks in the January period compared to April. As aresult, the sample is geographically focused on the western reachof the Alpine region. Ideally, the sampling effort would be more spa-
ion GIS: A new method for national park planning. Landscape Urban
tially and temporally stratified and would include more residentsthat live in the region, not just those that visit the parks (in thisstudy 15.6% of the sample resided in the region). In addition it islikely that weekday visitors had different experiences than week-end visitors who comprise the majority of this sample, and hence a

Pleasecite
this
articlein
press
as:B
rown
,G.,&
Weber,D
.Public
Participation
GIS:
An
ewm
ethod
forn
ationalp
arkp
lann
ing.Landscape
Urban
Plan.(2011),doi:10.1016/j.lan
du
rbplan
.2011.03.003
AR
TIC
LE
IN P
RE
SS
GM
odel
LAN
D-2014;
No.of
Pages15
12G
.Brown,D
.Weber
/Landscapeand
Urban
Planningxxx (2011) xxx–xxx
Table 5Rank correlation coefficients of park experiences between park units. Bold/underlined values are statistically significant.
Park Unit Alpine National Park Avon Wilderness Baw Baw N.P. Errinundra N.P. Grant H.A. Howqua Hills H.A. Mount Buffalo N.P. Mount Wills H.A. Snowy River N.P. Walhalla H.A.
Alpine National Park – 0.850 0.917 0.717 0.225 0.058 0.833 0.625 0.700 0.675Avon Wilderness Park 0.850 – 0.683 0.867 0.208 −0.075 0.533 0.458 0.567 0.508Baw Baw National Park 0.917 0.683 – 0.467 0.125 0.125 0.917 0.692 0.783 0.575Errinundra National Park 0.717 0.867 0.467 – 0.258 −0.175 0.417 0.425 0.550 0.592Grant H.A. 0.225 0.208 0.125 0.258 – 0.700 −0.008 0.617 −0.208 0.717Howqua Hills H.A. 0.058 −0.075 0.125 −0.175 0.700 – 0.025 0.450 −0.175 0.467Mount Buffalo National Park 0.833 0.533 0.917 0.417 −0.008 0.025 – 0.508 0.767 0.508Mount Wills H.A. 0.625 0.458 0.692 0.425 0.617 0.450 0.508 – 0.542 0.850Snowy River National Park 0.700 0.567 0.783 0.550 −0.208 −0.175 0.767 0.542 – 0.375Walhalla H.A. 0.675 0.508 0.575 0.592 0.717 0.467 0.508 0.850 0.375 –
Table 6Visitor experiences by management zone classification. Cells with bold fonts indicate significantly larger and cells with parentheses significantly smaller than expected contributions to overall chi-square (standardizedresiduals > 1.96).
Management zone Conservation (n = 5) Conservation and recreation (n = 8) Historic (n = 3) Recreation development (n = 1) Remote (n = 5) Wilderness (n = 3) Total
Experience category Scenic/aesthetic Count 134 137 (36) 20 78 41 451% 24.68% 16.69% (12.37%) 21.51% 20.69% 25.47% 19.47%
Crowding/congestion (11) 64 36 4 (7) 14 136(2.03%) 7.80% 12.37% 4.30% (1.86%) 8.70% 5.87%
Learning/discovery 34 52 37 7 19 10 162
6.26% 6.33% 12.71% 7.53% 5.04% 6.21% 6.99%Overnight stay 96 163 66 18 81 30 461
17.68% 19.85% 22.68% 19.35% 21.49% 18.63% 19.91%Physical activity 52 101 19 13 34 (7) 228
9.58% 12.30% 6.53% 13.98% 9.02% (4.35%) 9.84%Social interaction 35 49 36 7 15 5 148
6.45% 5.97% 12.37% 7.53% 3.98% 3.11% 6.39%Solitude 78 116 (16) (5) 66 32 318
14.36% 14.13% (5.50%) (5.38%) 17.51% 19.88% 13.73%Trail activity 81 91 25 16 58 14 289
14.92% 11.08% 8.59% 17.20% 15.38% 8.70% 12.48%Wildlife Viewing 22 48 20 3 19 8 123
4.05% 5.85% 6.87% 3.23% 5.04% 4.97% 5.31%Total 543 821 291 93 377 161 2316
100.00% 100.00% 100.00% 100.00% 100.00% 100.00% 100.00%

Please cite this article in press as: Brown, G., & Weber, D. Public ParticipatPlan. (2011), doi:10.1016/j.landurbplan.2011.03.003
ARTICLE ING Model
LAND-2014; No. of Pages 15
G. Brown, D. Weber / Landscape and Ur
Tab
le7
Perc
eive
den
viro
nm
enta
lim
pac
tsby
man
agem
entz
one
clas
sifi
cati
on.C
ells
wit
hbo
ldfo
nts
ind
icat
esi
gnifi
can
tly
larg
eran
dce
lls
wit
hp
aren
thes
essi
gnifi
can
tly
smal
lert
han
exp
ecte
dco
ntr
ibu
tion
sto
over
allc
hi-
squ
are
(sta
nd
ard
ized
resi
du
als
>1.
96).
Man
agem
ent
zon
eC
onse
rvat
ion
(n=
5)C
onse
rvat
ion
and
recr
eati
on(n
=8)
His
tori
c(n
=3)
Rec
reat
ion
dev
elop
men
t(n
=1)
Rem
ote
(n=
5)W
ild
ern
ess
(n=
3)To
tal
Imp
act
cate
gory
Cam
psi
teco
nd
itio
ns
Cou
nt
940
123
(2)
571
%15
.52%
22.4
7%18
.18%
37.5
0%(3
.92%
)16
.67%
17.1
5%N
oise
720
211
86
6312
.07%
11.2
4%31
.82%
12.5
0%15
.69%
20.0
0%15
.22%
Ru
bbis
h/l
itte
r6
4010
1(1
)3
6610
.34%
22.4
7%15
.15%
12.5
0%(1
.96%
)10
.00%
15.9
4%Tr
ack
(tra
il)
con
dit
ion
s23
31(6
)0
249
9339
.66%
17.4
2%(9
.09%
)0.
00%
47.0
6%30
.00%
22.4
6%V
eget
atio
n9
265
19
360
15.5
2%14
.61%
7.58
%12
.50%
17.6
5%10
.00%
14.4
9%W
ater
qual
ity
218
81
33
403.
45%
10.1
1%12
.12%
12.5
0%5.
88%
10.0
0%9.
66%
Wil
dli
fe(s
ick/
dea
d)
2(3
)4
14
121
3.45
%(1
.69%
)6.
06%
12.5
0%7.
84%
3.33
%5.
07%
Tota
l58
178
668
5130
414
100.
00%
100.
00%
100.
00%
100.
00%
100.
00%
100.
00%
100.
00%
PRESSban Planning xxx (2011) xxx–xxx 13
larger sample comprising more weekday users may yield differentresults.
The sampling for this particular study provides a snapshot ofpark experiences in peak periods. However, that also means resultsshould be viewed in that context. For example, while Howqua HillsHistoric Area may appear to have a noise and crowding problemon Australia Day weekend, one should not conclude the problemexists throughout the rest of the year.
Sampling was the major expense associated with this study.This study used professional interviewers based in Melbourne andthe large geographic area meant this approach was not cost effec-tive. It is suggested that future PPGIS studies consider the use oftrained park staff or local residents to make the visitor contacts.The growth in professional online research panels is also worthconsideration. Such groups can provide access to a comprehensivecross section of demographic, psychographic, and socioeconomicgroups and can screen members for particular characteristics (e.g.,recreation experience in the Victorian Alpine parks). The costs ofengaging such panels may prove less expensive when consideringtravel and interviewer expenses.
Research questions. The list of spatial attributes and survey ques-tions appear reasonable and respondents were able to map allattributes. However, in the future, the spatial attributes would ben-efit from refinement. For example, the vegetation impact couldhave been divided into two categories, one for dead or trampledvegetation and one for invasive species (i.e., weeds). Review ofthe additional comments provided by respondents suggests inva-sive weeds was an issue some respondents were very concernedabout but the impact was defined as “I observed dead or unhealthyvegetation” meaning observation of pest plants were unlikely tobe mapped. Also, the web interface should more strongly encour-age annotation of mapped attributes, especially for variables suchas facility or service changes. This was an example of a variablewhere not having specific information as to whether the markerindicated the facility or service needed to be better maintained,changed or added, limited the usefulness of such information; onlyhalf of the facilities/services markers were annotated by respon-dents. Comments from a number of study participants indicatedthey would have liked more map markers (the application provided6 markers per attribute). In the future, an option can be included toincrease the number of available markers. Similarly, other method-ologies that allow “on the spot” mapping and assessment could beemployed, for example using GPS-equipped data loggers or remotedevice/smartphones (e.g., iPhone) applications. While this wouldappear unnecessary for mapping experiences that seem to havegreater retention with visitors, it would add an improved dimen-sion to mapping impacts. Not only would it be more accurate,but it would provide a prompt for people to be actively look-ing for impacts, rather than trying to remember them after thefact.
This study can inform similar future park studies and this pro-cess should begin with a discussion of the application potential withboth planners and managers. The mapping of some PPGIS attributesis likely to be more useful than others. For example, wildlife viewingappears to be a ubiquitous visitor activity but other than its market-ing potential, the value of such information, given the results, maybe of limited use. Another issue that should be discussed in terms ofmethodology is the ground-truthing of results. Our intention wasto compare visitor data with PV staff data but it was not possibledue to the low PV sample. An additional complication was peoplemapping attributes from previous experiences. Although survey-
ion GIS: A new method for national park planning. Landscape Urban
ors requested respondents to map experiences from that trip, itwas obvious from the response patterns that some people mappedareas from previous trips. This raises the question about the accu-racy of some data, as an impact that existed two years ago, may notcurrently exist.
ARTICLE IN PRESSG Model
LAND-2014; No. of Pages 15
14 G. Brown, D. Weber / Landscape and Urban Planning xxx (2011) xxx–xxx
Table 8Descriptive statistics for 2 potential management zone indicators.
Management zone Ratio of experiences to impacts Density of impacts (sq. km)
Mean Std. dev. Min. Max. Median Mean Std. dev. Min. Max. Median
Conservation and recreation (n = 8) 7.2 6.6 1.4 18.8 4.8 .07 .05 .01 .12 .06Conservation (n = 5) 10.9 4.9 5.5 17.0 9.1 .14 .02 .11 .17 .14Historic (n = 3) 6.1 2.1 4.3 8.4 5.6 1.04 1.66 .06 2.96 .11Recreation development (n = 1) 12.7 N/A 12.7 12.7 12.7 .44 N/A .44 .44 .44
21.410.3
21.4
egsipots
bnpvpmafio
sattasec
maapdrtwrm
afttogsmtb&nt
Remote (n = 5) 8.3 8.0 2.3Wilderness (n = 4) 5.6 3.8 1.3
Total 8.0 5.7 1.3
In this study, respondents were interested in expressing pref-rences for resource management options in the region: cattlerazing, fire management, and logging. Although this particulartudy was focused on park experiences, impacts, and facilities,t is possible to include resource management markers wherearticipants could indicate preferences for resource managementutcomes in the region. Anchoring the survey with some ques-ions that respondents really want to provide feedback is a proventrategy to increase response rate.
Survey questions that followed the mapping activity providedasic demographic information to determine the representative-ess of the sample but lacked questions that would be useful forroviding context for understanding the experience and impactariables. In particular, survey questions should be included thatrovide greater opportunity for visitor segmentation includingotivations for visiting and measures of satisfaction or benefits
ssociated with the visit. For example, many park visitors identi-ed overnight and trail activity experiences—were these positiver negative experiences?
Analysis. This article provided descriptive information about thepatial location of different park experiences and perceived impactsnd examined the relationship with existing management zones forhe region. Additional analysis could relate the mapped attributeso levels of protection (LOP) and levels of service (LOS) to providedditional insight about the choice of particular park managementtrategies. Where Recreation Opportunity Spectrum (ROS) mapsxist, analysis can determine whether the mapped experiences areonsistent with the ROS classifications.
We explored the development of several experience and impactetrics for establishing indicators and standards for different man-
gement zones. The results indicate a wide range of mappedttributes within management zone types and are suggestive ofotential differences between management zones, but more PPGISata is needed to provide greater confidence that the results areepresentative. A potential weakness with these indicators is thathey are not necessarily correlated with the level of visitationithin the management zones. We suggest that scores for the expe-
ience/impact ratio be adjusted by actual visitation data for a givenanagement zone if that data were available.An important research question is whether the potential man-
gement indicators derived from PPGIS data meet the nine criteriaor good indicators as suggested by Manning (2007). Are the indica-ors significant, specific, objective, reliable and repeatable, relatedo visitor use, sensitive to visitor use in a relatively short periodf time, manageable, efficient and effective to measure, and inte-rative? We believe that they are. For example, the criteria ofignificance relates to user concerns. In the Howqua Hills area, theost significant impact appears to be noise so the indicator for
Please cite this article in press as: Brown, G., & Weber, D. Public ParticipatPlan. (2011), doi:10.1016/j.landurbplan.2011.03.003
hat zone would focus on noise. This indicator could be improvedy making it more specific and time bounded (Lime, Anderson,Thompson, 2004; Manning, 2007) for example, by focusing on
oise above conversation level after 9 p.m. Is the indicator objec-ive? Noise is a subjective experience and subject to individual
4.8 .06 .03 .03 .11 .065.3 .05 .02 .02 .06 .05
6.1 .20 .57 .01 2.96 .07
variability, but when the experience is observed among multiplevisitors, the criteria of objectiveness may be approached througha sort of collective validity. The PPGIS indicators are reliable andrepeatable, manageable, related to visitor use, efficient to measure,and sensitive to visitor use in relative short period of time. Wewould recommend monitoring (data collection) in peak and non-peak periods each year. On the final criteria, integrative, we wouldargue that composite indicators derived from PPGIS attributes havethe potential to be highly holistic and integrative because the PPGISattributes collected are related to the physical setting, the socialenvironment, and the managerial setting.
5. Conclusions
In a time of increasing demands on national parks, park plan-ning would benefit from a set of information tools that provideinformation about what visitors experience, what environmentalimpacts they observe, the facility/service needs they perceive, andimportantly, where these attributes are spatially located. The tra-ditional, often ad hoc processes for soliciting public participation innational park planning processes can leave park managers, inter-ests groups, and the general public wanting better information toassist park management decisions.
The PPGIS mapping method described in this paper provides asystemic tool for collecting and analyzing spatial data that can dis-play the consistency of visitor experiences and perceived impactswith park management zones at the regional, national park unit,or subunit level. The technical merits of the PPGIS data collectionand analysis protocol are relatively easy to describe because theprotocol has been successfully implemented in a variety of landuse planning contexts internationally. A less obvious, but equallyimportant benefit is the importance of the PPGIS protocol for engag-ing the public in park planning and decision processes. Because thePPGIS protocol is based on both sound science and social inclusive-ness, it has the potential to build trust in national park managementagencies.
Acknowledgements
This research was funded by Parks Victoria. The authors wouldlike to acknowledge the valuable support and advice of Dino Zanonand Louise Rose.
References
Alessa, N., Kliskey, A., & Brown, G. (2008). Social–ecological hotspots mapping: Aspatial approach for identifying coupled social–ecological space. Landscape and
ion GIS: A new method for national park planning. Landscape Urban
Urban Planning, 85, 27–39.Anderson, D., Lime, D., & Wang, T. (1998). Maintaining the quality of park resources
and visitor experiences: A handbook for managers. St. Paul, MN: University ofMinnesota Tourism Center. TC-777
Australian Bureau of Statistics. (2010). Internet activity, Australia. Report # 8153.0.Canberra: ABS.

ING
L
nd Ur
B
B
B
B
B
B
B
B
B
C
C
C
D
D
G
H
H
L
M
M
M
M
ARTICLEModel
AND-2014; No. of Pages 15
G. Brown, D. Weber / Landscape a
everly, J., Uto, K., Wilkes, J., & Bothwell, P. (2008). Assessing spatial attributes offorest landscape values: An internet-based participatory mapping approach.Canadian Journal of Forest Research, 38, 289–303.
rown, G. (2003). A method for assessing highway qualities to integrate values inhighway planning. Journal of Transport Geography, 11, 271–283.
rown, G. (2005). Mapping spatial attributes in survey research for natural resourcemanagement: Methods and applications. Society & Natural Resources, 18, 1–23.
rown, G. (2006). Mapping landscape values and development preferences: Amethod for tourism and residential development planning. International Journalof Tourism Research, 8, 101–113.
rown, G. (2008). A theory of urban park geography. Journal of Leisure Research, 40,589–607.
rown, G., Koth, B., Kreag, G., & Weber, D. (2006). Managing Australia’s protectedareas: A review of visitor management models frameworks and processes. GoldCoast, Queensland: CRC for Sustainable Tourism.
rown, G., & Raymond, C. (2007). The relationship between place attachment andlandscape values: Toward mapping place attachment. Applied Geography, 27,89–111.
rown, G., & Reed, P. (2000). Validation of a forest values typology for use in nationalforest planning. Forest Science, 46, 240–247.
rown, G., & Reed, P. (2009). Public Participation GIS: A new method for nationalforest planning. Forest Science, 55, 166–182.
hilman, K., Foster, D., & Everson, A. (1990). Updating the recreational carryingcapacity process: Recent refinements. In D. Lime (Ed.), Managing America’senduring wilderness resource (pp. 234–238). St. Paul: University of Minnesota.
lark, R., Hendee, J., & Campbell, F. (1971). Depreciative behavior in forest camp-grounds: An exploratory study. In USDA Forest Service Research Paper PNW-161.
lement, J. M., & Cheng, A. S. (2010). Using analyses of public value orientations,attitudes and preferences to inform national forest planning in Colorado andWyoming. Applied Geography, 31, 393–400.
illman, D. A. (2000). Mail and Internet surveys: The tailored design method (2nd ed.).New York: Wiley & Sons.
river, B. L., & Brown, P. J. (1978). The opportunity spectrum concept and behavioralinformation in outdoor recreation resource supply inventories: A rationale. InG. Lund, V. LaBau, P. Folliet, D. Robinson (Tech. Eds.), Integrated inventories ofrenewable natural resources. General Technical Report RM-55. Fort Collins, CO:USDA Forest Service, Rocky Mountain Forest and Range Experiment Station.
raefe, A., Kuss, F., & Vaske, J. (1990). Visitor impact management: The planning frame-work. Washington, DC: National Parks and Conservation Association.
all, T., Shelby, B., & Rolloff, D. (1996). Effect of varied question format on boaters’norms. Leisure Sciences, 18, 193–204.
of, M., & Lime, D. (1997). Visitor Experience and Resource Protection frameworkin the national park system: Rationale, current status and future direction. InS. McCool, & D. (Comps. ) Cole (Eds.), Proceedings—Limits of Acceptable Changeand related planning processes: Progress and future directions, USDA Forest ServiceGeneral Technical Report INT-371 (pp. 26–29). Ogden, UT: U.S. Department ofAgriculture, Forest Service, Intermountain Research Station.
ime, D. W., Anderson, D. H., & Thompson, J. L. (2004). Identifying and monitoringindicators of visitor experience and resource quality: A handbook for recreationresource managers. St. Paul, MN: Department of Forest Resources.
anning, R. (2007). Parks and carrying capacity: Commons without tragedy. Wash-ington, DC: Island Press.
anning, R., Graefe, A., & McCool, S. (1996). Trends in carrying capacity planningand management. In J. Thompson, D. Lime, B. Gartner, & W. (Comps. ) Sames(Eds.), Proceedings of the fourth international outdoor recreation and tourism trendssymposium (pp. 334–341). St. Paul: University of Minnesota.
Please cite this article in press as: Brown, G., & Weber, D. Public ParticipatPlan. (2011), doi:10.1016/j.landurbplan.2011.03.003
artinson, K., & Shelby, B. (1992). Encounter and proximity norms for salmonanglers in California and New Zealand. North American Journal of Fisheries Man-agement, 12, 559–567.
cCool, S., & Cole, D. (1997). Experiencing limits of acceptable change: Somethoughts after a decade of implementation. In S. McCool, & D. (Comps. ) Cole(Eds.), Proceedings—Limits of acceptable change and related planning processes:
PRESSban Planning xxx (2011) xxx–xxx 15
Progress and future directions. USDA Forest Service General Technical Report INT-371 (pp. 20–22). Ogden, UT: U.S. Department of Agriculture, Forest Service,Intermountain Research Station.
McIntyre, N., Moore, J., & Yuan, M. (2008). A place-based, values-centered approachto managing recreation on Canadian crown lands. Society & Natural Resources,21, 8.
Nielsen. (2009). Internet usage statistics. Nielson Market Report, August 2009.Parks Canada. (1991). Visitor activity concept. Ottawa: Parks Canada.Parks Victoria. (2009). About us. Vision, purpose, values.
<http://www.parkweb.vic.gov.au/1process content.cfm?section=17&page=18>Accessed 01.03.11.
Parks and Wildlife Service Tasmania. (2003). Walking track management manual:Environmental and planning issues. Hobart, Australia: Department of Tourism,Parks, Heritage and the Arts.
Pocewicz, A., Schnitzer, R., Nielsen-Pincus, M. (2010). The social geographyof southern Wyoming: Important places, development, and natural resourcemanagement, The Nature Conservancy, Lander, WY, 16 pp. Available from:http://www.nature.org/wherewework/northamerica/states/wyoming/files/science mapping social values 2010.pdf. Accessed 01.03.11.
Pfueller, S., Xuan, Z., Whitelaw, P., & Winter, C. (2009). Spatial mapping of communityvalues for tourism planning and conservation in the Murray River Reserves, Victoria,Australia. Gold Coast, Queensland: CRC for Sustainable Tourism.
Rambaldi, G., Kwaku Kyem, A. P., Mbile, P., McCall, M., & Weiner, D. (2006). Par-ticipatory spatial information management and communication in developingcountries. EJISDC, 25, 1.
Raymond, C., & Brown, G. (2007). A spatial method for assessing resident and vis-itor attitudes toward tourism growth and development. Journal of SustainableTourism, 15, 520–540.
Reed, P., & Brown, G. (2003). Values Suitability Analysis: A methodology for identi-fying and integrating public perceptions of forest ecosystem values in nationalforest planning. Journal of Environmental Planning and Management, 46, 643–658.
Roggenbuck, J., Williams, D., & Watson, A. (1993). Defining acceptable conditions inwilderness. Environmental Management, 17, 187–197.
Sawicki, D., & Peterman, D. (2002). Surveying the extent of PPGIS practice in theUnited States. In W. Craig, T. Harris, & D. Weiner (Eds.), Community participationand geographic information systems (pp. 17–36). London: Taylor & Francis.
Sieber, R. (2006). Public participation geographic information systems: A litera-ture review and framework. Annals of Association of American Geographers, 96,491–507.
Stankey, G. (1980). Wilderness carrying capacity: Management and researchprogress in the United States. Land Resources, 5, 6–11.
Stankey, G., Cole, D., Lucas, R., Peterson, M., Frissel, S., & Wasburne, R. (1985). TheLimits of Acceptable Change (LAC) Systems for wilderness planning. In USDAForest Service General Technical Report INT-176.
Tulloch, D. (2007). Public Participation GIS (PPGIS). Encyclopedia ofgeographic information science. SAGE Publications., <http://www.sage-ereference.com/geoinfoscience/Article n165.html> Accessed 01.03.11
TOMM. (2006). Kangaroo Island Tourism Optimisation Management Model.<http://www.tomm.info/indicators/index.aspx> Accessed 01.03.11.
Vaske, J., Graefe, B., Shelby, B., & Heberlein, T. (1986). Backcountry encounter norms:Theory, method and empirical evidence. Journal of Leisure Research, 18, 137–153.
Weber, D. (2007). Personal benefits and place attachment of visitors to four metropoli-tan and regional protected areas in Australia. Unpublished thesis. University ofQueensland, School of Social Science.
Wilkinson, T. (1995). Crowd control. National Parks, 69, 36–40.Williams, D., Roggenbuck, J., Patterson, M., & Watson, A. (1992). The variability of
ion GIS: A new method for national park planning. Landscape Urban
user based social impact standards for wilderness management. Forest Science,38, 738–756.
Young, J., Williams, D., & Roggenbuck, J. (1991). The role of involvement in identifyingusers’ preferences for social standards in the Cohutta Wilderness. In Proceedingsof the 1990 Southeast Recreation Conference, USDA Forest Service General TechnicalReport SE-67 (pp. 173–183).