Embed Size (px)
Citation preview
Peter-Paul deWolf
Public Use Files of EU-SILC andEU-LFS data
Introduction
Eurostat provides access to EU microdata:— Secure Use Files— Scien fic Use Files
Ge ng access takes me (up to 10 weeks...)
It it worth the effort?
Perhaps a PUF could help?
Specific Grant Agreement launched to produce PUFs
2
Introduction
Eurostat provides access to EU microdata:— Secure Use Files— Scien fic Use Files
Ge ng access takes me (up to 10 weeks...)
It it worth the effort?
Perhaps a PUF could help?
Specific Grant Agreement launched to produce PUFs
2

Introduction
Why Public Use Files?
— Aid in decision on effort— Start with research— Training file?
3

Introduction
Why Public Use Files?
— Aid in decision on effort— Start with research— Training file?
3
Approach EU-SILC
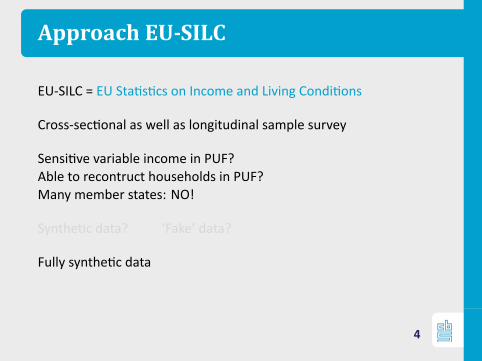
EU-SILC = EU Sta s cs on Income and Living Condi ons
Cross-sec onal as well as longitudinal sample survey
Sensi ve variable income in PUF?Able to recontruct households in PUF?Many member states: NO!
Synthe c data? ‘Fake’ data?
Fully synthe c data
Only cross-sec onal data
4
Approach EU-SILC
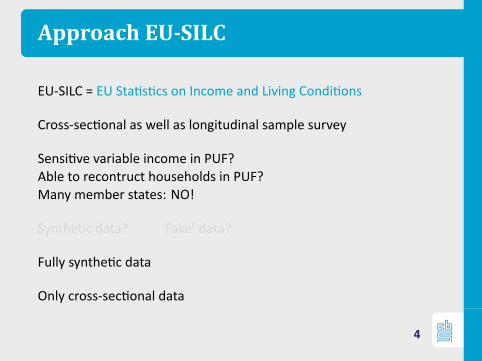
EU-SILC = EU Sta s cs on Income and Living Condi ons
Cross-sec onal as well as longitudinal sample survey
Sensi ve variable income in PUF?Able to recontruct households in PUF?Many member states: NO!
Synthe c data? ‘Fake’ data?
Fully synthe c data
Only cross-sec onal data
4
Approach EU-SILC
EU-SILC = EU Sta s cs on Income and Living Condi ons
Cross-sec onal as well as longitudinal sample survey
Sensi ve variable income in PUF?Able to recontruct households in PUF?Many member states: NO!
Synthe c data? ‘Fake’ data?
Fully synthe c data
Only cross-sec onal data
4
Approach EU-SILC
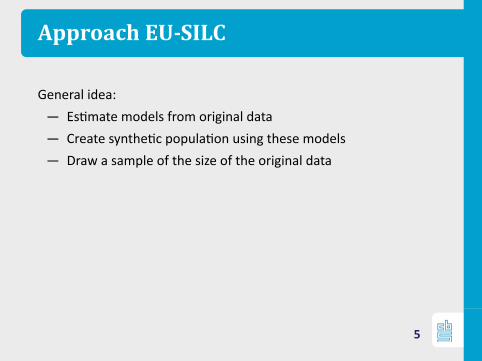
General idea:— Es mate models from original data— Create synthe c popula on using these models— Draw a sample of the size of the original data
Per regional stratum:— Setup household structure— Simulate categorical variables— Simulate (semi) con nuous variables— Split (semi) con nuous variables into components
5
Approach EU-SILC
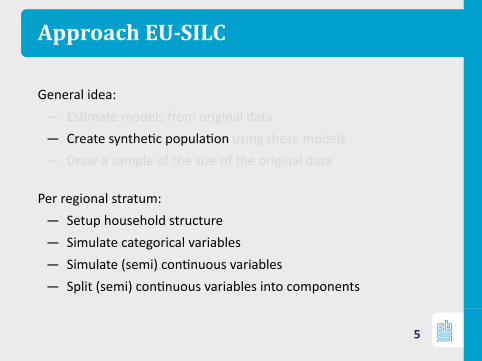
General idea:— Es mate models from original data— Create synthe c popula on using these models— Draw a sample of the size of the original data
Per regional stratum:— Setup household structure— Simulate categorical variables— Simulate (semi) con nuous variables— Split (semi) con nuous variables into components
5
Approach EU-SILC
Setup hh-structure:— Es mate number of hh by hh-size (HT-es mate)— Generate that number of hh to construct the popula on— For each hh of size h, using resampling, draw hh-structure
from hh of size h in original data
To prevent illogical hh-structures (age/sex distribu on)
6
Approach EU-SILC
Simula on categorical variables— Sequen ally; condi onally on previously simulated variables— Mul nomial logis c regression fi ed on original data with
previously generated variables as predictors— Variables: economic status, ci zenship, marital status,
educa on, occupa on (1 digit, second drawn randomly),NACE (1 digit)
7
Approach EU-SILC
Simula on (semi) con nuous variables— Mapped to discre zed version (e.g. income classes)— Apply method like with categorical variables— Draw randomly within category/class to obtain con nuous
value
8
Approach EU-SILC
Split into components— Use propor ons of donor record— Independently for hh income and person income
Construct sample— Stra fied simple random sampling with replacement— Stratum is region— Sampling unit is hh
9
Approach EU-SILC
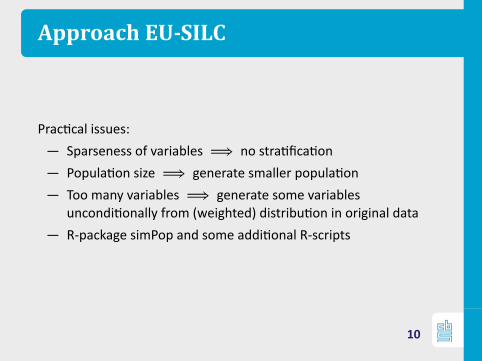
Prac cal issues:— Sparseness of variables ⟹ no stra fica on— Popula on size ⟹ generate smaller popula on— Too many variables ⟹ generate some variables
uncondi onally from (weighted) distribu on in original data— R-package simPop and some addi onal R-scripts
10
Approach EU-LFS
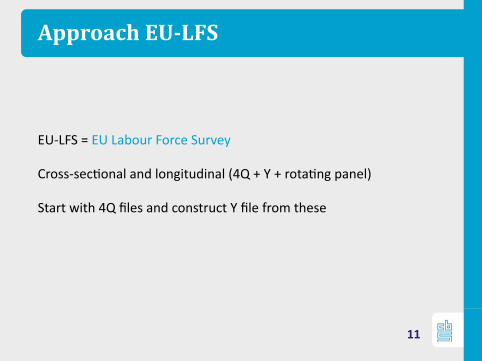
EU-LFS = EU Labour Force Survey
Cross-sec onal and longitudinal (4Q + Y + rota ng panel)
Start with 4Q files and construct Y file from these
11
Approach EU-LFS
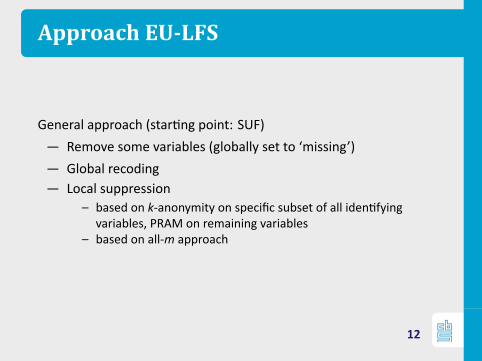
General approach (star ng point: SUF)— Remove some variables (globally set to ‘missing’)— Global recoding— Local suppression
– based on k-anonymity on specific subset of all iden fyingvariables, PRAM on remaining variables
– based on all-m approach
12
Approach EU-LFS
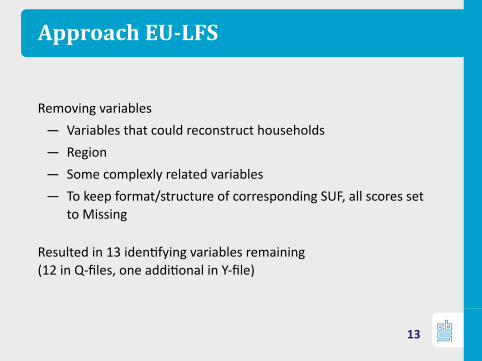
Removing variables— Variables that could reconstruct households— Region— Some complexly related variables— To keep format/structure of corresponding SUF, all scores set
to Missing
Resulted in 13 iden fying variables remaining(12 in Q-files, one addi onal in Y-file)
13
Approach EU-LFS
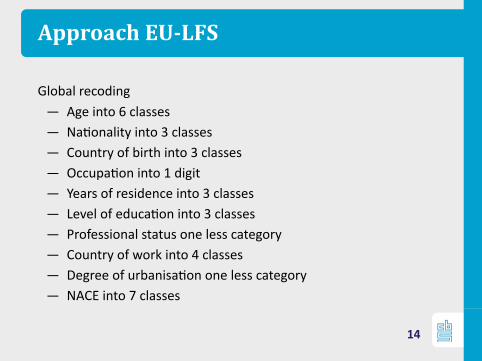
Global recoding— Age into 6 classes— Na onality into 3 classes— Country of birth into 3 classes— Occupa on into 1 digit— Years of residence into 3 classes— Level of educa on into 3 classes— Professional status one less category— Country of work into 4 classes— Degree of urbanisa on one less category— NACE into 7 classes
14
Approach EU-LFS
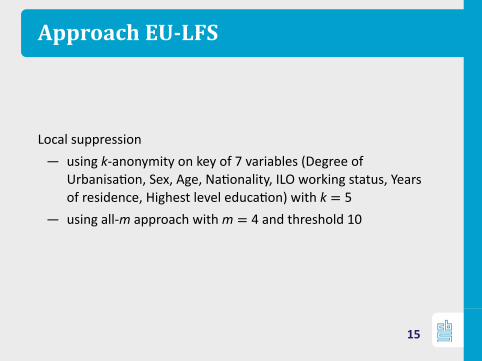
Local suppression— using k-anonymity on key of 7 variables (Degree of
Urbanisa on, Sex, Age, Na onality, ILO working status, Yearsof residence, Highest level educa on) with k = 5
— using all-m approach withm = 4 and threshold 10
15
Disclosure risk
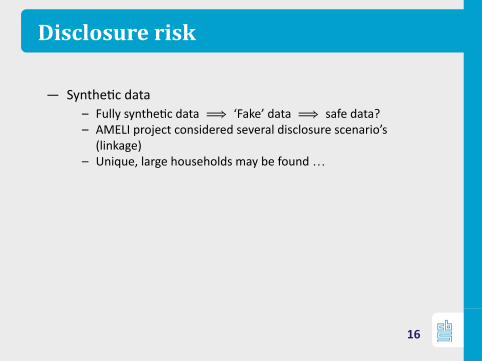
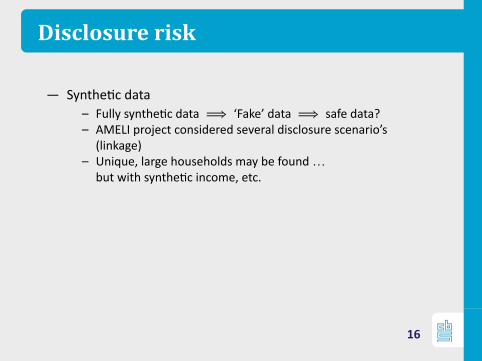
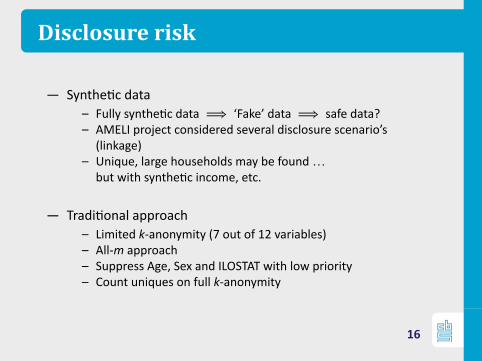
— Synthe c data– Fully synthe c data ⟹ ‘Fake’ data ⟹ safe data?– AMELI project considered several disclosure scenario’s
(linkage)– Unique, large households may be found …
but with synthe c income, etc.
— Tradi onal approach– Limited k-anonymity (7 out of 12 variables)– All-m approach– Suppress Age, Sex and ILOSTAT with low priority– Count uniques on full k-anonymity
16
Disclosure risk
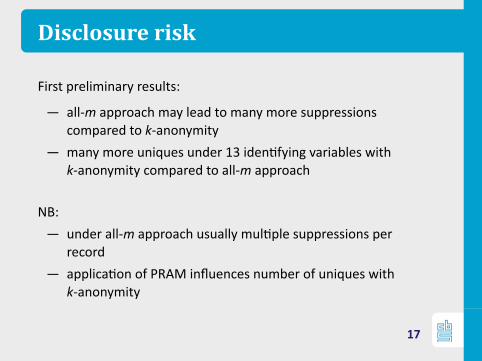
First preliminary results:
— all-m approach may lead to many more suppressionscompared to k-anonymity
— many more uniques under 13 iden fying variables withk-anonymity compared to all-m approach
NB:— under all-m approach usually mul ple suppressions per
record— applica on of PRAM influences number of uniques with
k-anonymity
17
Utility
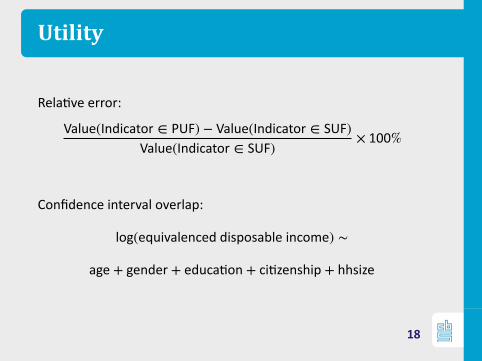
Rela ve error:
Value(Indicator ∈ PUF) − Value(Indicator ∈ SUF)Value(Indicator ∈ SUF) × 100%
Confidence interval overlap:
log(equivalenced disposable income) ∼
age + gender + educa on + ci zenship + hhsize
18
Utility
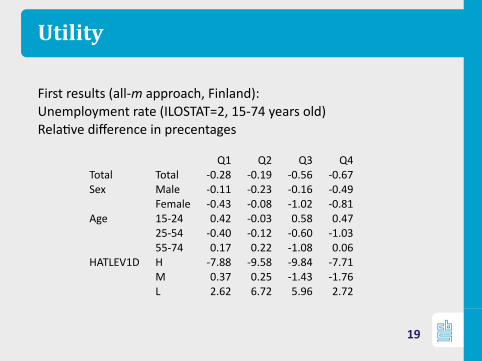
First results (all-m approach, Finland):Unemployment rate (ILOSTAT=2, 15-74 years old)Rela ve difference in precentages
Q1 Q2 Q3 Q4Total Total -0.28 -0.19 -0.56 -0.67Sex Male -0.11 -0.23 -0.16 -0.49
Female -0.43 -0.08 -1.02 -0.81Age 15-24 0.42 -0.03 0.58 0.47
25-54 -0.40 -0.12 -0.60 -1.0355-74 0.17 0.22 -1.08 0.06
HATLEV1D H -7.88 -9.58 -9.84 -7.71M 0.37 0.25 -1.43 -1.76L 2.62 6.72 5.96 2.72
19
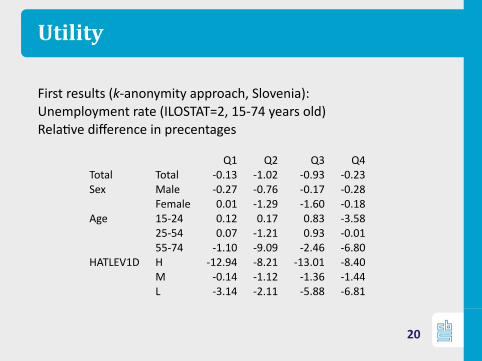
Utility
First results (k-anonymity approach, Slovenia):Unemployment rate (ILOSTAT=2, 15-74 years old)Rela ve difference in precentages
Q1 Q2 Q3 Q4Total Total -0.13 -1.02 -0.93 -0.23Sex Male -0.27 -0.76 -0.17 -0.28
Female 0.01 -1.29 -1.60 -0.18Age 15-24 0.12 0.17 0.83 -3.58
25-54 0.07 -1.21 0.93 -0.0155-74 -1.10 -9.09 -2.46 -6.80
HATLEV1D H -12.94 -8.21 -13.01 -8.40M -0.14 -1.12 -1.36 -1.44L -3.14 -2.11 -5.88 -6.81
20
Conclusions
— First results look promising— Need more detailed look at
– U lity (different measures)– Risk (two approaches to same dataset)
21


