Embed Size (px)
Citation preview
www.elsevier.com/locate/cemconcomp
Cement & Concrete Composites 29 (2007) 409–420
Punching shear strength of interior concrete slab–columnconnections reinforced with steel fibers
Kyoung-Kyu Choi a,*, Mahmoud M. Reda Taha a, Hong-Gun Park b, Arup K. Maji a
a Department of Civil Engineering, University of New Mexico, Albuquerque, NM 87131, United Statesb Department of Architecture, Seoul National University, San 56-1, Shinlim-dong, Kwanak-gu, Seoul 151-742, Republic of Korea
Received 20 February 2006; received in revised form 13 December 2006; accepted 14 December 2006Available online 3 January 2007
Abstract
A theoretical study was performed to investigate the punching shear strength of interior slab–column connections made of steel fiberreinforced concrete (FRC). In the steel FRC slab–column connection, the shear force applied to the critical section is resisted by both thecompression zone and the tension zone at the critical section. The shear capacity of the compression zone was defined by considering theinteraction between the shear and the normal stresses developed at the critical section. The shear capacity of the tension zone was definedby considering the post-cracking tensile strength of FRC. By using the shear capacity, a new strength model for the punching shearstrength of steel FRC slab–column connections was developed. The proposed strength model was verified using existing test resultsand showed very good accuracy. For convenience in design, a simplified design equation was also developed.� 2007 Elsevier Ltd. All rights reserved.
Keywords: Flat plate; Punching shear; Failure mechanism; Fiber reinforced concrete; Slab–column connection
1. Introduction
The slab–column connection of a flat plate is susceptibleto punching shear failure. Once punching shear failureoccurs, the overall resistance of the structure against grav-ity load is considerably reduced, which causes the separa-tion of the slab and column, and might even causeprogressive collapse of the whole structure [1–3].
According to previous experimental studies, the addi-tion of steel fibers to concrete effectively improves the shearstrength of beams [4,5] and slab–column connections [6,7].The ability of steel fibers to enhance shear strength of con-crete is attributed to the possible transfer of tensile stressesacross crack surfaces, that is known as crack-bridging,when steel fibers are incorporated [8,9]. This phenomenonpermits fiber reinforced concrete (FRC) to have more duc-tile failure than normal concrete [9,10].
0958-9465/$ - see front matter � 2007 Elsevier Ltd. All rights reserved.
doi:10.1016/j.cemconcomp.2006.12.003
* Corresponding author. Tel.: +1 505 277 7481; fax: +1 505 277 1988.E-mail address: [email protected] (K.-K. Choi).
Swamy and Ali [6] and Harajli et al. [11] reported thatwhen fibers were added in a slab–column connection, theresidual strength of the slab–column connection afterpunching shear failure increased significantly due to theenhanced structural integrity between the slab and thecolumn. Traditional shear reinforcing method usingstirrups is inapplicable to slabs with shallow depth less than150 mm [12]. New reinforcing technique such as usingheaded-studs [13] or incorporating steel fibers in the slab–column connections [14] might be good alternatives. More-over, such alternatives have also been proven effective inseismic design because of their ability to improve energydissipation capacity of structures [15,16].
Currently, there are various existing strength models forslab–column connections including ACI 318 [12], EC 2[17], CEB-FIP MC 90 [18], and BS 8110 [19]. These existingmodels were developed for normal concrete slab–columnconnections, thus they might not be applicable to FRCslab–column connections. While some models for punchingshear of FRC exist (for example, [11]), these models do not
410 K.-K. Choi et al. / Cement & Concrete Composites 29 (2007) 409–420
directly link the failure criterion of FRC to the punchingshear capacity of slab–column connections.
Here, we present a theoretical approach to model thepunching shear strength of interior slab–column connec-tions using steel FRC. To evaluate the punching shearstrength of the slab–column connections, material failurecriteria of FRC were studied. A new strength model basedon the FRC failure criteria was developed to accuratelyestimate the punching shear strength of steel FRC slab–column connections. The proposed strength model wasverified using existing test results. For easy application ofthe strength model in design, a simplified design equationwas developed.
2. Methods
2.1. Material strength of fiber reinforced concrete
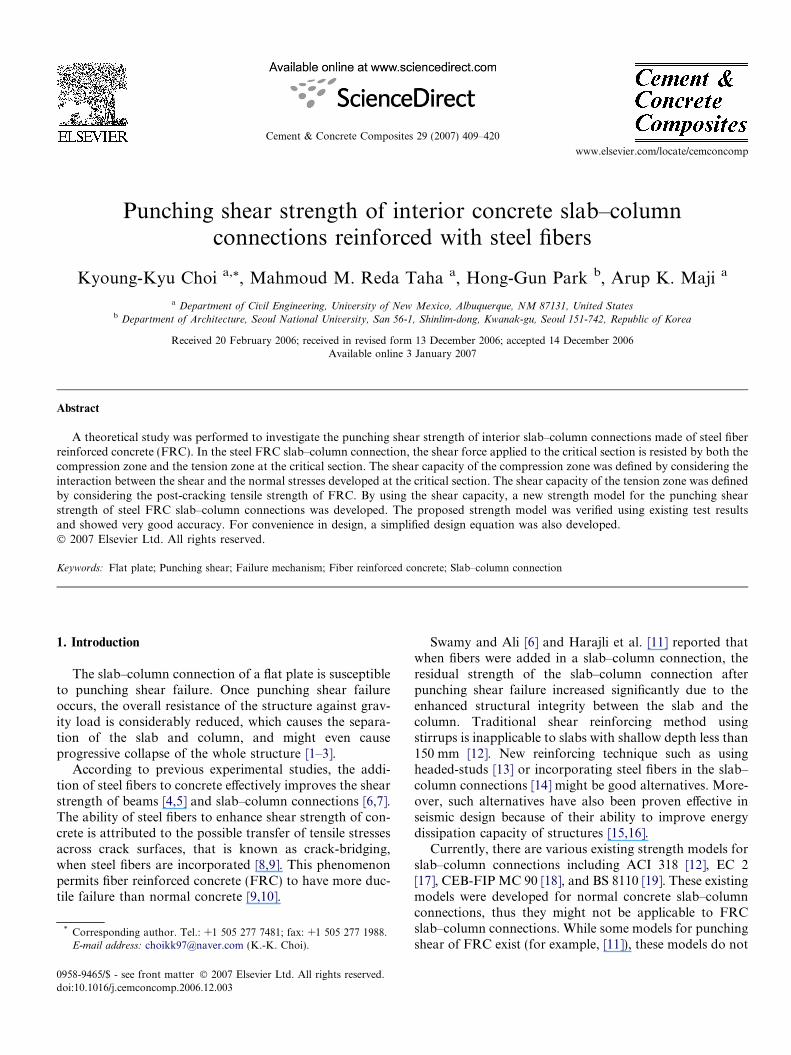
FRC exhibits material strengths enhanced from those ofnormal concrete: compressive strength, f 0cf , tensile strength,fct, and post-cracking tensile strength, fpc as shown inFig. 1. According to Narayanan and Darwish [5] andKhuntia et al. [20], the post-cracking tensile strength, fpc,has the most significant effect on the structural perfor-mance of FRC.
Naaman and Reinhardt [21] showed that the strength ofFRC is significantly affected by the fiber volume ratio, Vf,aspect ratio, L/D, and shape. Through probabilistic analy-sis based on the experimental investigations of FRC[21,22], the compressive strength, f 0cf , tensile strength, fct,and post-cracking tensile strength, fpc of FRC were definedas
f 0cf ¼ 1:9V fðL=DÞbþ f 0c ðMPaÞ ð1aÞfct ¼ ftð1� V fÞ þ a1a2sV fðL=DÞ ð1bÞfpc ¼ k1k2k3V fðL=DÞsb ð1cÞ
where f 0c is the compressive strength of an equivalent nor-mal concrete without fibers, ft = tensile strength of concreteunder pure tension evaluated as ft ¼ 0:292
ffiffiffiffif 0c
pðMPaÞ,
following the work of Oluokun [23] and Reda Taha et al.[24]. L = length of fiber; D = diameter of fiber; a1 = coeffi-cient representing the fraction of bond mobilized at firstmatrix cracking; a2 = efficiency factor of fiber orientation
Compression
Concrete
Steel FRC
εcofεcoε
cf '
cff '–
–
σ
Fig. 1. Stress–strain re
in the uncracked state of the composite; s = average interfa-cial bond strength of fiber matrix; k1 = expected pull-outlength ratio; k2 = efficiency factor of orientation in thecracked state; and k3 = group reduction factor associatedwith the number of fiber pulling-out per unit area. The coef-ficients a1 (�0.5) and a2 (�0.1) were reported to be consid-erably small numerical values, thus it can be assumedthat fct = ft. Also the coefficients k1 = 0.25, k2 = 1.2, andk3=1.0 can be used [25]. b accounts for the effect of fibershape and concrete type after Khuntia et al. [20] such thatb = 1 for hooked or crimped steel fibers; b = 2/3 for plainor round steel fibers with normal concrete; and b = 3/4for hooked or crimped steel fibers with lightweight concrete.Moreover, interfacial bond strength, s, between steel fibersand concrete is an important parameter determining thepost-cracking behavior of FRC [10,24]. The interfacialbond strength is strongly affected by the quality of concreteand fiber geometry and shape [24,25]. We therefore relatethe bond strength of FRC to the tensile strength of theconcrete such as s = 2ft [25]. Finally, the compressivestress–strain constitutive relationship of FRC was assumedto follow a simple parabola such that
rcðeÞ ¼ f 0cf 2e
ecof
� �� e
ecof
� �2" #
ð2Þ
where ecof is the compressive strain corresponding tothe compressive strength of FRC taken equal to0:00079 � V fðL=DÞ þ 0:0041ðf 0cf=f 0cÞ following the work ofFanella and Naaman [22], e is the strain at any point inthe cross-section, and rc(e) is the compressive strain at thispoint.
2.2. Failure criteria of fiber reinforced concrete
Generally, since a flat plate has a large span-to-thicknessratio, its behavior is dominated by flexural deformation.Flexural cracking and yielding of reinforcing bars thatoccur prior to punching shear failure have been observedexperimentally [26,27]. The maximum observed flexuralcrack width at slab–column connections was about 4 mm[27]. Such crack width would significantly downplay shearcontributions due to aggregate interlock and dowel actions[26,28,29]. Shear strength in flexure-dominated members
Tension
ctf
ε
σ
pcfpcpc ff 6.0=
tf Steel FRC
Concrete
lationship of FRC.
K.-K. Choi et al. / Cement & Concrete Composites 29 (2007) 409–420 411
was attributed to the compression zone of intact concretewhich prevented shear-slip of the crack surfaces [26,30].
Based on the results, we assume that shear resistance ofthe FRC slab–column connections is provided mainly bythe contribution of the intact concrete in the compressionzone. This assumption is supported with many observa-tions of other studies on normal concrete slab–column con-nections [31–33]. However, the major difference in FRCslab–column connections, is that after cracking occurs,tensile stress is transferred across the crack surfaces bythe fibers. Therefore, unlike conventional concrete slab–column connections, the tension zone of FRC slab–columnconnections contributes to the shear resistance by means ofthe post-cracking tensile strength. Therefore, the overallshear strength of FRC slab–column connections is definedas the sum of contributions of the compression and thetension zones.
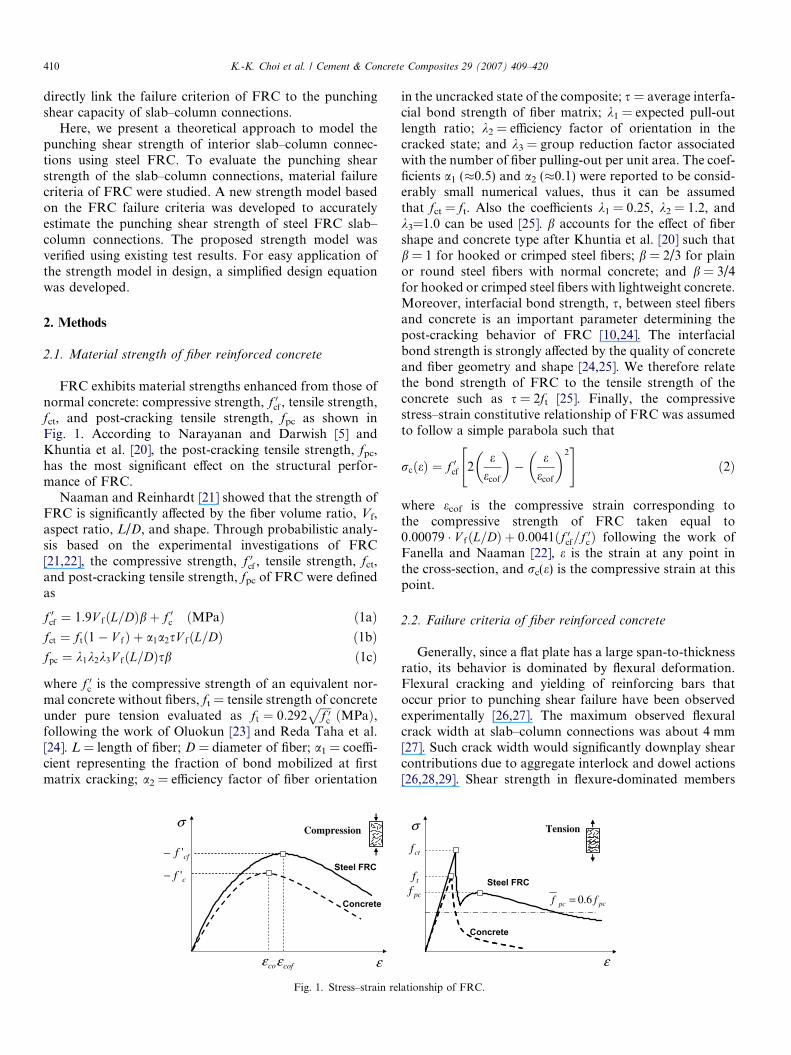
Fig. 2 shows the governing stress components develop-ing in the compression zone of the critical section at theslab–column connection. The compression zone of the crit-ical section is subjected to combined normal and shearstresses. Therefore, the interaction between these stresscomponents must be considered to accurately evaluatethe punching shear strength of the slab–column connection[32]. Fig. 2 shows the development of three-dimensionalstresses at the critical section: two orthogonal normal stres-ses (rc1 and rc2) and shear stresses (vc1 and vc2). The normalstress (rc2) and shear stress (vc2) acting on the face orthog-onal to the cross-section might affect the punching shearstrength of the slab–column connection. However, becauseof the high rigidity of the slab–column joint, these stressesare directly transmitted to the column through the cornerof the column section [34]. Thus, the three-dimensionalstresses that develop at the critical section can be simpli-fied as two-dimensional compressive and shear stresses,
Tensilefailure
Compressivefailure
N.A.z
Three-dimensionalstresses
Simplified two-dimensionalstresses
1cσ 1cσ1cv
ctf
1cσ
1cv
1cv–
1cv
cff '
1cσ2cv
2cσ
2cσ
1σ2σ
Fig. 2. Rankine’s failure criteria of fiber reinforced concrete.
rc (=rc1) and vc (=vc1), acting on the cross-section of thecompression zone, following the work of the Eurocode 2[17] and the CEB-FIP [18].
Considering the normal and shear stress states at thecross-section, the constitutive material failure mechanismcan be defined using Rankine’s failure criterion [35]. In thisfailure criterion, material failure occurs when the principalstress resulting from the combined stresses reaches thematerial strength. When the principal compressive stressreaches the compressive strength of FRC – f 0cf , a failurecontrolled by compression occurs, and when the principaltensile stress reaches the tensile strength fct (=ft), a failurecontrolled by tension occurs. The failure criteria of thecompression zone thus can be defined as
r1 ¼ �rc
2�
ffiffiffiffiffiffiffiffiffiffiffiffiffiffiffiffiffiffiffiffiffiffirc
2
� �2
þ v2c
r¼ �f 0cf
for failure controlled by compression ð3aÞ
r2 ¼ �rc
2þ
ffiffiffiffiffiffiffiffiffiffiffiffiffiffiffiffiffiffiffiffiffiffirc
2
� �2
þ v2c
r¼ fct
for failure controlled by tension ð3bÞ
r1 and r2 = principal compressive and tensile stresses,respectively. rc (P0) and vc = compressive normal stressand shear stress of FRC, respectively.
As the contribution of FRC to punching shear strengthis taken into account, the effect of the multi-axial state ofstress on the tensile strength of FRC shall also be consid-ered [36]. In the present study, it was assumed that FRCfollows a similar trend to that of conventional concrete;In tension–compression, the tensile strength of concrete,ft, is reduced by the transverse compressive stress, r1
(Fig. 3). Thus the reduced tensile strength of FRC f 0ct,was considered as
f 0ct
fct
� �¼ f 0t
ft
� �¼ 1� 0:5
ft
f 0c
� �r1
r2
� �� ��1
6 1 ð4Þ
where r1 6 0 and r2 > 0.
cf '1σ
Kupfer et al. [36]Simplified failure surface
1.0
cf '2σ
1σ
2σ
[Eq. (4)] Tension
Compression
Fig. 3. Plane stress failure criteria of concrete.
(b) Curvature (Strain)
(c) Normal stress of concrete
(d) Maximum shear stress controlled by compression
crcof εαε <
cff '
(e) Maximum shear stress controlled by tension
Stage A
crcof εαε =
cff '
Stage B
V
M
A
M
N.A.
E
B
D
cff '
Stage C
N.A.
Stage E
cofcof εαε >cofε
cff '
C
cff '
Stage D
cofcof εαε =uc
N.A.
uc
pcf pcf pcf
cff '
ctf ' ctf 'ctf '
ctf ' ctf '
Curvature(a) Cross section and Moment-curvature relationship
Concrete cover
zz
z
zzz
o
B
C
E
Shea
r ca
paci
ty, V
u
AD
Curve 1
Shear capacity controlled by tension [Eqs. (6b) and (7b)]
A B
C
D
E
Shear capacity controlled by compression [Eqs. (6a) and (7a)]
Curve 2
412 K.-K. Choi et al. / Cement & Concrete Composites 29 (2007) 409–420
From Eq. (2), the maximum shear stress can be definedas a function of the normal stress. Since the compressivestress in the compression zone, rc, varies with the distancefrom the neutral axis, the maximum shear stress at eachlocation in the compression zone is defined as a functionof the distance from the neutral axis z as
vcðzÞ ¼ffiffiffiffiffiffiffiffiffiffiffiffiffiffiffiffiffiffiffiffiffiffiffiffiffiffiffiffiffif 0cf ½f 0cf � rcðzÞ�
qfor failure controlled by compression ð5aÞ
vcðzÞ ¼ffiffiffiffiffiffiffiffiffiffiffiffiffiffiffiffiffiffiffiffiffiffiffiffiffiffiffiffif 0ct½f 0ct þ rcðzÞ�
qfor failure controlled by tension ð5bÞ
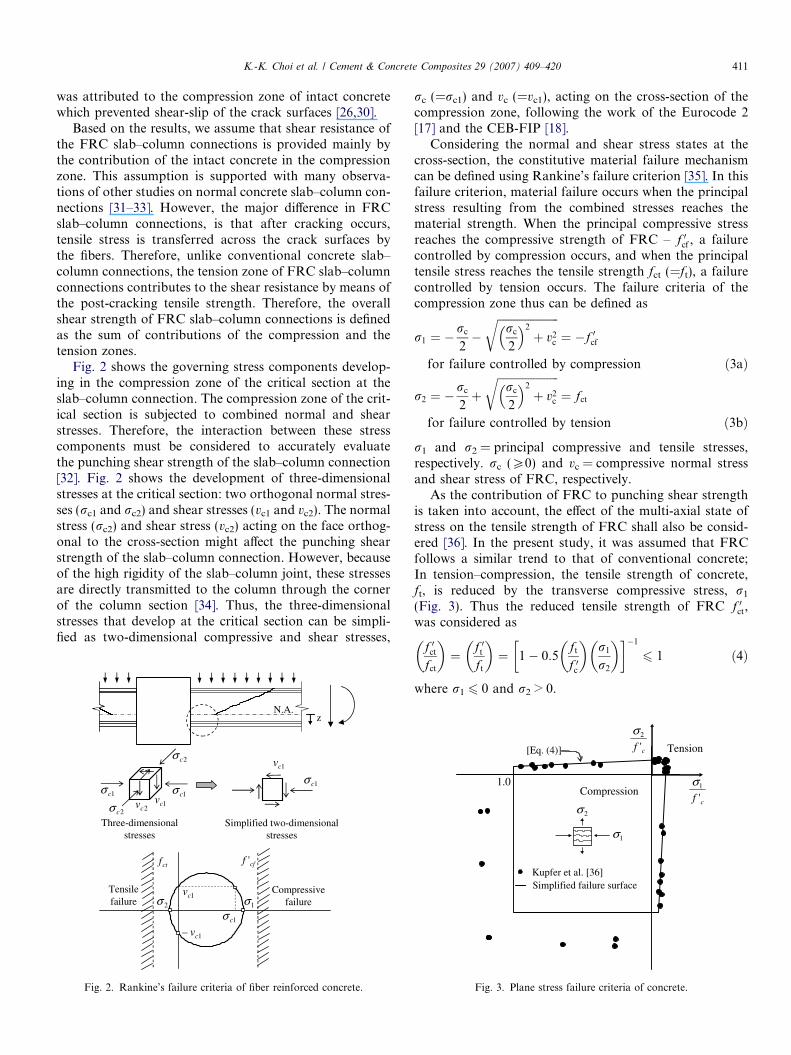
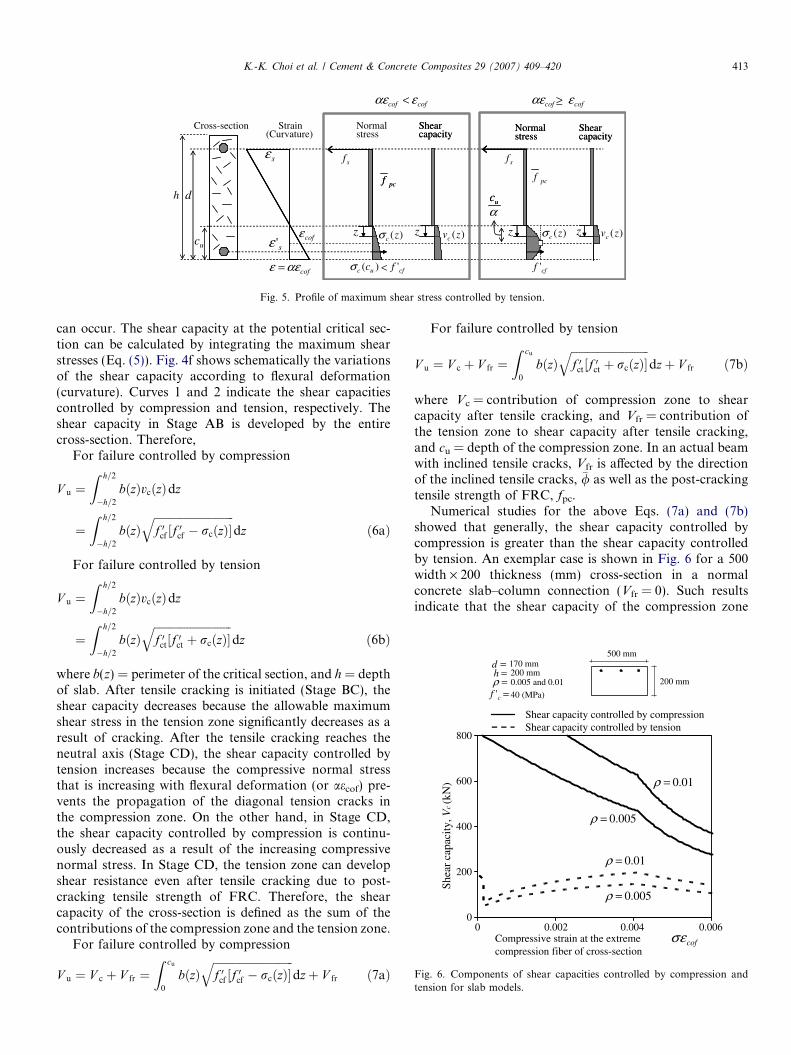
At a cross-section of a flexure-dominated member, thedistribution of compressive normal stress is affected bythe curvature (Fig. 4a and b) of the cross-section as wellas the amount of flexural reinforcement. Fig. 4c showsthe variations of the compressive normal stress, andFig. 4d and e shows the variations of the maximum shearstress according to the curvature of the cross-section. Inthese figures, aecof = compressive strain at the extremecompression fiber of a cross-section, and ecof = compres-sive strain corresponding to the compressive strength ofFRC. Fig. 5 presents closely the variation of maximumshear stress controlled by tension.
As the curvature of the cross-section (representing thedegree of flexural damage) increases, the depth of the com-pression zone decreases, and the distribution of compres-sive stress and maximum shear stress varies. Beforeflexural cracking occurs in the tension zone (Stage AB inFig. 4), the shear force is resisted by the entire cross-sectionand the neutral axis is approximately located at the cen-troid of the cross-section. After the flexural cracking (StageBC), the tensile crack propagates to the neutral axis andthe shear resistance developed by the tension zone signifi-cantly decreases. After the tensile crack reaches the neutralaxis (Stage CE), the compression zone of intact concretemainly develops the shear resistance, and the magnitudeand distribution of the maximum shear stress at the com-pression zone is affected by the compressive normal stress(Figs. 4c, d and e and 5, and Eqs. (5a) and (5b)). Afterthe compressive normal stress at the extreme compressionfiber of the cross-section reaches the compressive strengthof concrete (aecof > ecof), it is assumed that the part of thecompression zone experiencing compressive damage nolonger develops shear resistance (Fig. 5). Therefore, theshear capacity of the cross-section is provided only by theremaining part of the compression zone that did not expe-rience compression softening (0 6 z 6 cu/a). As a result,the shear capacity of the cross-section decreases as thedeformation of the cross-section increases.
cofαεCompressive strain at the extreme compression fiber of cross-section
(f) Variation of shear capacity with maximum compressive strain
Fig. 4. Variations of normal stress and corresponding shear capacityaccording to curvature at slab–column connection.
2.3. Punching shear capacity at a cross-section
At the potential critical section of a slab–column con-nection, a failure controlled by compression or tension
Cross-section Strain (Curvature)
Normalstress
Shear capacity
Normalstress
Shear capacity
sfsε
cofαεε =
uc
dh
sf
cfuc fc ')( >σ
z )(zcσ z )(zvc
cff '
z )(zcσ z )(zvc
s'ε cofε
pcf pcf
cofcof εαε < cofcof εαε ≥
αuc
Shear capacity
Normalstress
Shear capacity
pcf
uc
Fig. 5. Profile of maximum shear stress controlled by tension.
0
200
400
600
800
0 0.002 0.004 0.006
Shea
r ca
paci
ty, V
c (k
N)
Compressive strain at the extreme compression fiber of cross-section
cofεσ
005.0=ρ
0.005=ρ
01.0=ρ
01.0=ρ
=d
=ρ=cf ' 40 (MPa)
500 mm170 mm
=h 200 mm0.005 and 0.01 200 mm
Shear capacity controlled by tension Shear capacity controlled by compression
Fig. 6. Components of shear capacities controlled by compression andtension for slab models.
K.-K. Choi et al. / Cement & Concrete Composites 29 (2007) 409–420 413
can occur. The shear capacity at the potential critical sec-tion can be calculated by integrating the maximum shearstresses (Eq. (5)). Fig. 4f shows schematically the variationsof the shear capacity according to flexural deformation(curvature). Curves 1 and 2 indicate the shear capacitiescontrolled by compression and tension, respectively. Theshear capacity in Stage AB is developed by the entirecross-section. Therefore,
For failure controlled by compression
V u ¼Z h=2
�h=2
bðzÞvcðzÞdz
¼Z h=2
�h=2
bðzÞffiffiffiffiffiffiffiffiffiffiffiffiffiffiffiffiffiffiffiffiffiffiffiffiffiffiffiffiffif 0cf ½f 0cf � rcðzÞ�
qdz ð6aÞ
For failure controlled by tension
V u ¼Z h=2
�h=2
bðzÞvcðzÞdz
¼Z h=2
�h=2
bðzÞffiffiffiffiffiffiffiffiffiffiffiffiffiffiffiffiffiffiffiffiffiffiffiffiffiffiffiffif 0ct½f 0ct þ rcðzÞ�
qdz ð6bÞ
where b(z) = perimeter of the critical section, and h = depthof slab. After tensile cracking is initiated (Stage BC), theshear capacity decreases because the allowable maximumshear stress in the tension zone significantly decreases as aresult of cracking. After the tensile cracking reaches theneutral axis (Stage CD), the shear capacity controlled bytension increases because the compressive normal stressthat is increasing with flexural deformation (or aecof) pre-vents the propagation of the diagonal tension cracks inthe compression zone. On the other hand, in Stage CD,the shear capacity controlled by compression is continu-ously decreased as a result of the increasing compressivenormal stress. In Stage CD, the tension zone can developshear resistance even after tensile cracking due to post-cracking tensile strength of FRC. Therefore, the shearcapacity of the cross-section is defined as the sum of thecontributions of the compression zone and the tension zone.
For failure controlled by compression
V u ¼ V c þ V fr ¼Z cu
0
bðzÞffiffiffiffiffiffiffiffiffiffiffiffiffiffiffiffiffiffiffiffiffiffiffiffiffiffiffiffiffif 0cf ½f 0cf � rcðzÞ�
qdzþ V fr ð7aÞ
For failure controlled by tension
V u ¼ V c þ V fr ¼Z cu
0
bðzÞffiffiffiffiffiffiffiffiffiffiffiffiffiffiffiffiffiffiffiffiffiffiffiffiffiffiffiffif 0ct½f 0ct þ rcðzÞ�
qdzþ V fr ð7bÞ
where Vc = contribution of compression zone to shearcapacity after tensile cracking, and Vfr = contribution ofthe tension zone to shear capacity after tensile cracking,and cu = depth of the compression zone. In an actual beamwith inclined tensile cracks, Vfr is affected by the directionof the inclined tensile cracks, �/ as well as the post-crackingtensile strength of FRC, fpc.
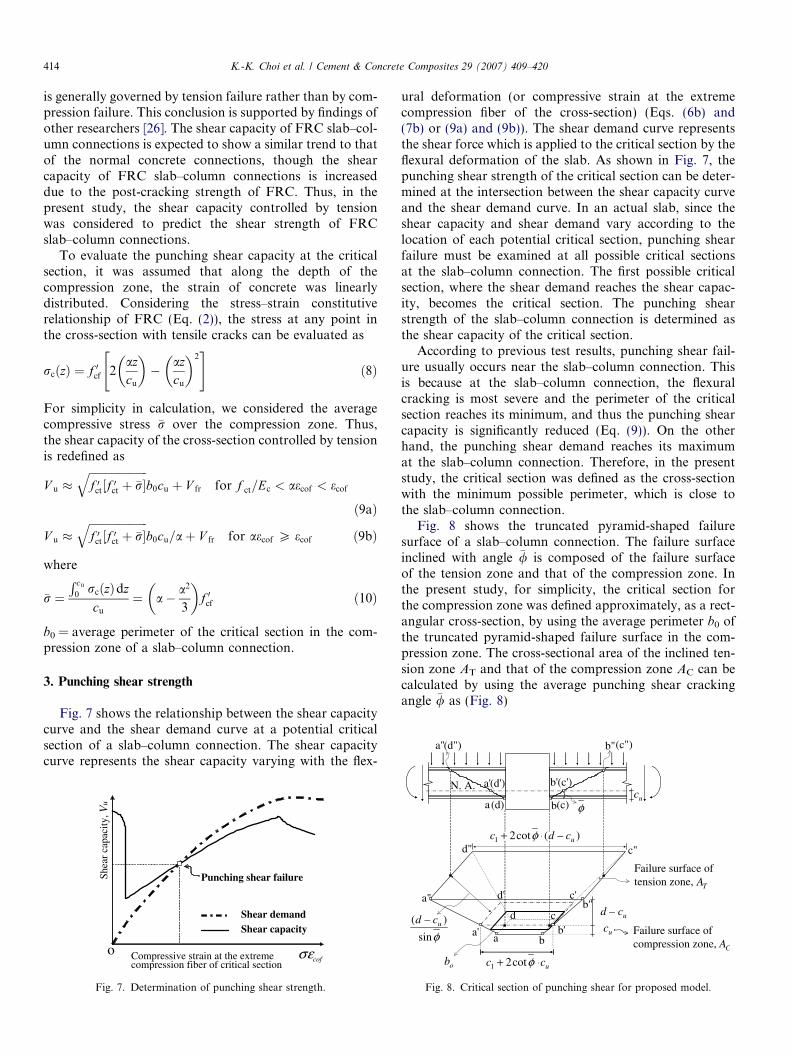
Numerical studies for the above Eqs. (7a) and (7b)showed that generally, the shear capacity controlled bycompression is greater than the shear capacity controlledby tension. An exemplar case is shown in Fig. 6 for a 500width · 200 thickness (mm) cross-section in a normalconcrete slab–column connection (Vfr = 0). Such resultsindicate that the shear capacity of the compression zone
b"a"(d") (c")
414 K.-K. Choi et al. / Cement & Concrete Composites 29 (2007) 409–420
is generally governed by tension failure rather than by com-pression failure. This conclusion is supported by findings ofother researchers [26]. The shear capacity of FRC slab–col-umn connections is expected to show a similar trend to thatof the normal concrete connections, though the shearcapacity of FRC slab–column connections is increaseddue to the post-cracking strength of FRC. Thus, in thepresent study, the shear capacity controlled by tensionwas considered to predict the shear strength of FRCslab–column connections.
To evaluate the punching shear capacity at the criticalsection, it was assumed that along the depth of thecompression zone, the strain of concrete was linearlydistributed. Considering the stress–strain constitutiverelationship of FRC (Eq. (2)), the stress at any point inthe cross-section with tensile cracks can be evaluated as
rcðzÞ ¼ f 0cf 2azcu
� �� az
cu
� �2" #
ð8Þ
For simplicity in calculation, we considered the averagecompressive stress �r over the compression zone. Thus,the shear capacity of the cross-section controlled by tensionis redefined as
V u �ffiffiffiffiffiffiffiffiffiffiffiffiffiffiffiffiffiffiffiffiffif 0ct½f 0ct þ �r�
qb0cu þ V fr for f ct=Ec < aecof < ecof
ð9aÞ
V u �ffiffiffiffiffiffiffiffiffiffiffiffiffiffiffiffiffiffiffiffiffif 0ct½f 0ct þ �r�
qb0cu=aþ V fr for aecof P ecof ð9bÞ
where
�r ¼R cu
0 rcðzÞdzcu
¼ a� a2
3
� �f 0cf ð10Þ
b0 = average perimeter of the critical section in the com-pression zone of a slab–column connection.
3. Punching shear strength
Fig. 7 shows the relationship between the shear capacitycurve and the shear demand curve at a potential criticalsection of a slab–column connection. The shear capacitycurve represents the shear capacity varying with the flex-
cofεσo Compressive strain at the extreme compression fiber of critical section
Shea
r ca
paci
ty, V
u
Shear demand
Punching shear failure
Shear capacity
Fig. 7. Determination of punching shear strength.
ural deformation (or compressive strain at the extremecompression fiber of the cross-section) (Eqs. (6b) and(7b) or (9a) and (9b)). The shear demand curve representsthe shear force which is applied to the critical section by theflexural deformation of the slab. As shown in Fig. 7, thepunching shear strength of the critical section can be deter-mined at the intersection between the shear capacity curveand the shear demand curve. In an actual slab, since theshear capacity and shear demand vary according to thelocation of each potential critical section, punching shearfailure must be examined at all possible critical sectionsat the slab–column connection. The first possible criticalsection, where the shear demand reaches the shear capac-ity, becomes the critical section. The punching shearstrength of the slab–column connection is determined asthe shear capacity of the critical section.
According to previous test results, punching shear fail-ure usually occurs near the slab–column connection. Thisis because at the slab–column connection, the flexuralcracking is most severe and the perimeter of the criticalsection reaches its minimum, and thus the punching shearcapacity is significantly reduced (Eq. (9)). On the otherhand, the punching shear demand reaches its maximumat the slab–column connection. Therefore, in the presentstudy, the critical section was defined as the cross-sectionwith the minimum possible perimeter, which is close tothe slab–column connection.
Fig. 8 shows the truncated pyramid-shaped failuresurface of a slab–column connection. The failure surfaceinclined with angle �/ is composed of the failure surfaceof the tension zone and that of the compression zone. Inthe present study, for simplicity, the critical section forthe compression zone was defined approximately, as a rect-angular cross-section, by using the average perimeter b0 ofthe truncated pyramid-shaped failure surface in the com-pression zone. The cross-sectional area of the inclined ten-sion zone AT and that of the compression zone AC can becalculated by using the average punching shear crackingangle �/ as (Fig. 8)
a' b'
a b
N. A.
φ
a ba' b'
b"a"
uc
ucd –
ucc
c'
c"d"
d'
d
Failure surface oftension zone,
Failure surface ofcompression zone,
ucc + φcot21
TA
φsin
)( ucd –
CA
)(cot21 ucdc –+ φ
ob
(d') (c')
(c)(d)
Fig. 8. Critical section of punching shear for proposed model.
0
100
200
300
400
0 0.002 0.004 0.006
Shea
r ca
paci
ty, V
u(k
N)
Shear demand curve (using effective beam) [Eq. (14)]
cofεσCompressive strain at extreme compression fiber of critical section
Shear capacity curve controlled by tension [Eq. (9)]
Punching shear failure
Fig. 11. Determination of punching shear strength of Theodorakopoulosand Swamy’s [7] FS-2.
K.-K. Choi et al. / Cement & Concrete Composites 29 (2007) 409–420 415
AT ¼ ð2c1 þ 2c2 þ 4 cot �/ � dÞðd � cuÞ= sin �/ ð11ÞAC ¼ b0cu ¼ ð2c1 þ 2c2 þ 4 cot �/ � cuÞcu ð12Þ
Considering the shear capacity in the tension zone to beprovided by only post-cracking tensile strength �fpc, an aver-age post-cracking tensile strength, �fpc ¼ 0:6f pc, can be usedfollowing the work of Naaman and Reinhardt [37]. Theshear strength provided by the tension zone Vfr is definedas Eq. (13) with �fpc (Fig. 9).
V fr ¼ �fpcAT cos �/ ð13Þ
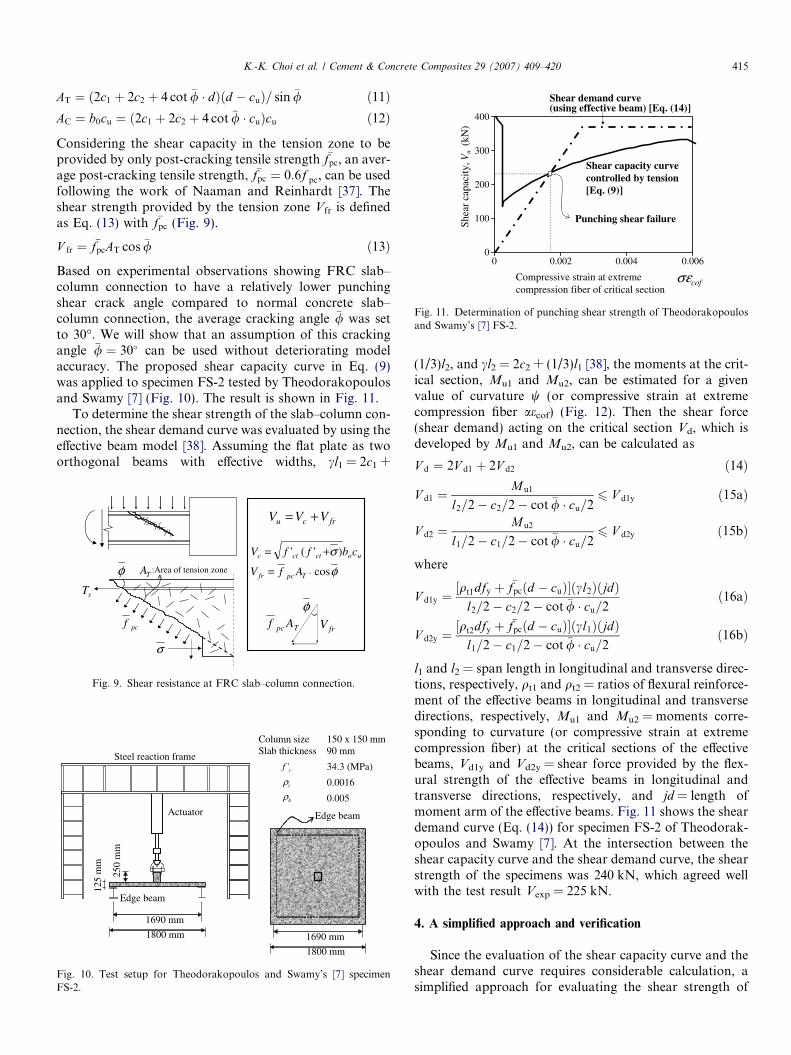
Based on experimental observations showing FRC slab–column connection to have a relatively lower punchingshear crack angle compared to normal concrete slab–column connection, the average cracking angle �/ was setto 30�. We will show that an assumption of this crackingangle �/ ¼ 30� can be used without deteriorating modelaccuracy. The proposed shear capacity curve in Eq. (9)was applied to specimen FS-2 tested by Theodorakopoulosand Swamy [7] (Fig. 10). The result is shown in Fig. 11.
To determine the shear strength of the slab–column con-nection, the shear demand curve was evaluated by using theeffective beam model [38]. Assuming the flat plate as twoorthogonal beams with effective widths, cl1 = 2c1 +
Actuator
250
mm
125
mm
Steel reaction frame
Edge beam
1800 mm
Edge beam
Column size 150 x 150 mmSlab thickness 90 mm
34.3 (MPa)
0.0016
0.005
cf '
tρ
bρ
1690 mm
1800 mm
1690 mm
Fig. 10. Test setup for Theodorakopoulos and Swamy’s [7] specimenFS-2.
φ
pcf
σ
frcu VVV +=
uoctctc cbffV )'(' σ+=
Tpc Af frV
φcos= Tpcfr AfV
φ
:Area of tension zoneTA
sT
.
Fig. 9. Shear resistance at FRC slab–column connection.
(1/3)l2, and cl2 = 2c2 + (1/3)l1 [38], the moments at the crit-ical section, Mu1 and Mu2, can be estimated for a givenvalue of curvature w (or compressive strain at extremecompression fiber aecof) (Fig. 12). Then the shear force(shear demand) acting on the critical section Vd, which isdeveloped by Mu1 and Mu2, can be calculated as
V d ¼ 2V d1 þ 2V d2 ð14Þ
V d1 ¼Mu1
l2=2� c2=2� cot �/ � cu=26 V d1y ð15aÞ
V d2 ¼Mu2
l1=2� c1=2� cot �/ � cu=26 V d2y ð15bÞ
where
V d1y ¼½qt1dfy þ �fpcðd � cuÞ�ðcl2ÞðjdÞ
l2=2� c2=2� cot �/ � cu=2ð16aÞ
V d2y ¼½qt2dfy þ �fpcðd � cuÞ�ðcl1ÞðjdÞ
l1=2� c1=2� cot �/ � cu=2ð16bÞ
l1 and l2 = span length in longitudinal and transverse direc-tions, respectively, qt1 and qt2 = ratios of flexural reinforce-ment of the effective beams in longitudinal and transversedirections, respectively, Mu1 and Mu2 = moments corre-sponding to curvature (or compressive strain at extremecompression fiber) at the critical sections of the effectivebeams, Vd1y and Vd2y = shear force provided by the flex-ural strength of the effective beams in longitudinal andtransverse directions, respectively, and jd = length ofmoment arm of the effective beams. Fig. 11 shows the sheardemand curve (Eq. (14)) for specimen FS-2 of Theodorak-opoulos and Swamy [7]. At the intersection between theshear capacity curve and the shear demand curve, the shearstrength of the specimens was 240 kN, which agreed wellwith the test result Vexp = 225 kN.
4. A simplified approach and verification
Since the evaluation of the shear capacity curve and theshear demand curve requires considerable calculation, asimplified approach for evaluating the shear strength of
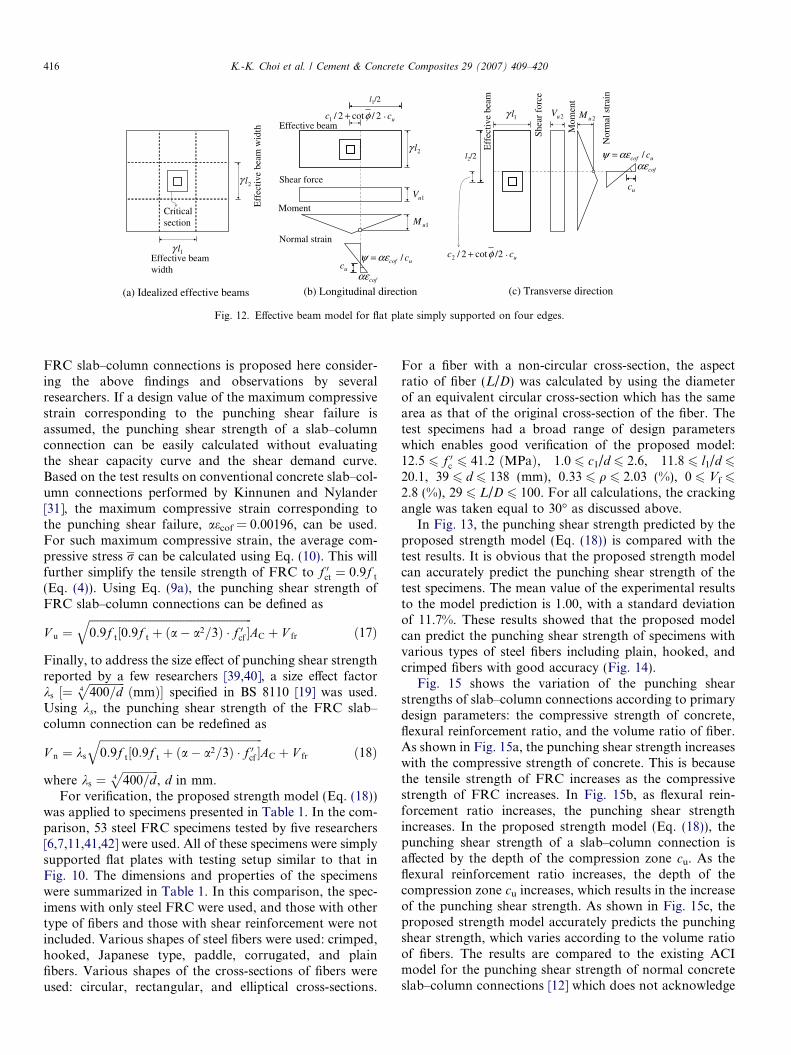
Eff
ectiv
e be
am w
idth
Effective beam width
Critical section
(a) Idealized effective beams (b) Longitudinal direction
l1/2
ucc + 2 ./cot2/1 φEffective beam
Shear force
1uV
1uM
ucof c/αεψ =uc
cofαε
Moment
Normal strain
l2/2
ucc + 2 . /cot2/2 φ
2uV2uM
ucof c/αεψ =
uc
Eff
ectiv
e be
am
Shea
r fo
rce
Mom
ent
Nor
mal
str
ain
(c) Transverse direction
cofαε
1lγ
γ 2l
2lγ
1lγ
Fig. 12. Effective beam model for flat plate simply supported on four edges.
416 K.-K. Choi et al. / Cement & Concrete Composites 29 (2007) 409–420
FRC slab–column connections is proposed here consider-ing the above findings and observations by severalresearchers. If a design value of the maximum compressivestrain corresponding to the punching shear failure isassumed, the punching shear strength of a slab–columnconnection can be easily calculated without evaluatingthe shear capacity curve and the shear demand curve.Based on the test results on conventional concrete slab–col-umn connections performed by Kinnunen and Nylander[31], the maximum compressive strain corresponding tothe punching shear failure, aecof = 0.00196, can be used.For such maximum compressive strain, the average com-pressive stress r can be calculated using Eq. (10). This willfurther simplify the tensile strength of FRC to f 0ct ¼ 0:9f t
(Eq. (4)). Using Eq. (9a), the punching shear strength ofFRC slab–column connections can be defined as
V u ¼ffiffiffiffiffiffiffiffiffiffiffiffiffiffiffiffiffiffiffiffiffiffiffiffiffiffiffiffiffiffiffiffiffiffiffiffiffiffiffiffiffiffiffiffiffiffiffiffiffiffiffiffiffiffiffiffiffiffiffi0:9f t½0:9f t þ ða� a2=3Þ � f 0cf �
qAC þ V fr ð17Þ
Finally, to address the size effect of punching shear strengthreported by a few researchers [39,40], a size effect factorks ½¼
ffiffiffiffiffiffiffiffiffiffiffiffiffi400=d4
pðmmÞ� specified in BS 8110 [19] was used.
Using ks, the punching shear strength of the FRC slab–column connection can be redefined as
V n ¼ ks
ffiffiffiffiffiffiffiffiffiffiffiffiffiffiffiffiffiffiffiffiffiffiffiffiffiffiffiffiffiffiffiffiffiffiffiffiffiffiffiffiffiffiffiffiffiffiffiffiffiffiffiffiffiffiffiffiffiffiffi0:9f t½0:9f t þ ða� a2=3Þ � f 0cf �
qAC þ V fr ð18Þ
where ks ¼ffiffiffiffiffiffiffiffiffiffiffiffiffi400=d4
p, d in mm.
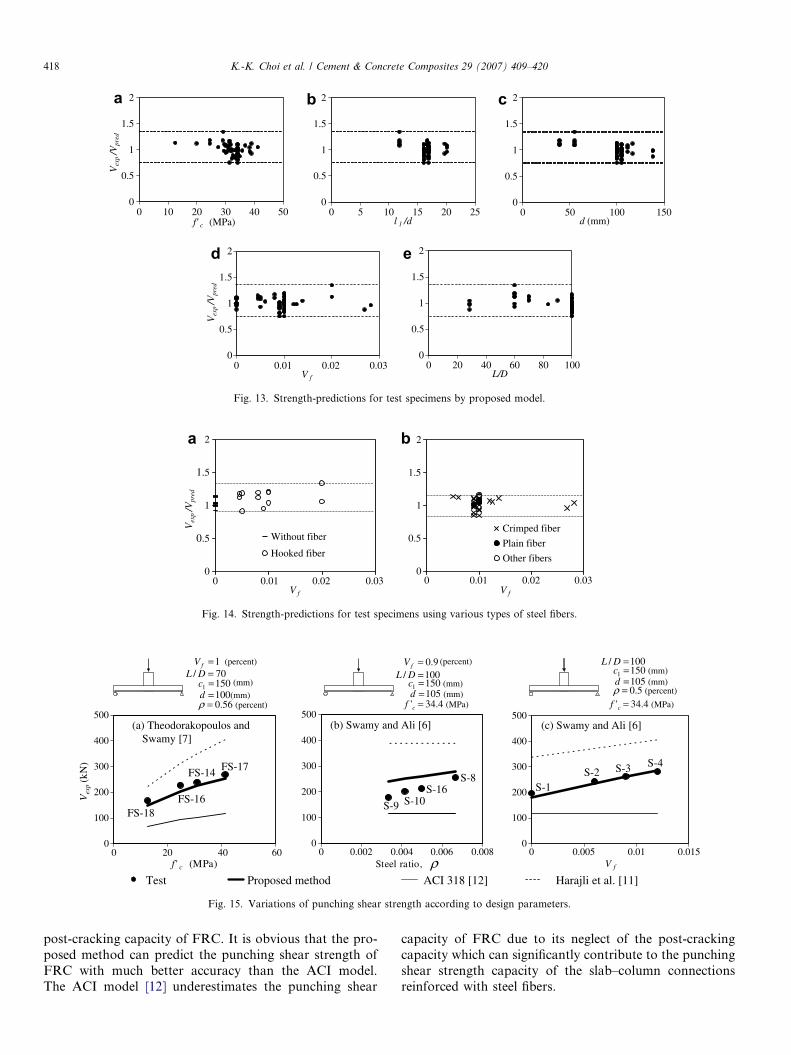
For verification, the proposed strength model (Eq. (18))was applied to specimens presented in Table 1. In the com-parison, 53 steel FRC specimens tested by five researchers[6,7,11,41,42] were used. All of these specimens were simplysupported flat plates with testing setup similar to that inFig. 10. The dimensions and properties of the specimenswere summarized in Table 1. In this comparison, the spec-imens with only steel FRC were used, and those with othertype of fibers and those with shear reinforcement were notincluded. Various shapes of steel fibers were used: crimped,hooked, Japanese type, paddle, corrugated, and plainfibers. Various shapes of the cross-sections of fibers wereused: circular, rectangular, and elliptical cross-sections.
For a fiber with a non-circular cross-section, the aspectratio of fiber (L/D) was calculated by using the diameterof an equivalent circular cross-section which has the samearea as that of the original cross-section of the fiber. Thetest specimens had a broad range of design parameterswhich enables good verification of the proposed model:12:5 6 f 0c 6 41:2 ðMPaÞ, 1.0 6 c1/d 6 2.6, 11.8 6 l1/d 620.1, 39 6 d 6 138 (mm), 0.33 6 q 6 2.03 (%), 0 6 Vf 6
2.8 (%), 29 6 L/D 6 100. For all calculations, the crackingangle was taken equal to 30� as discussed above.
In Fig. 13, the punching shear strength predicted by theproposed strength model (Eq. (18)) is compared with thetest results. It is obvious that the proposed strength modelcan accurately predict the punching shear strength of thetest specimens. The mean value of the experimental resultsto the model prediction is 1.00, with a standard deviationof 11.7%. These results showed that the proposed modelcan predict the punching shear strength of specimens withvarious types of steel fibers including plain, hooked, andcrimped fibers with good accuracy (Fig. 14).
Fig. 15 shows the variation of the punching shearstrengths of slab–column connections according to primarydesign parameters: the compressive strength of concrete,flexural reinforcement ratio, and the volume ratio of fiber.As shown in Fig. 15a, the punching shear strength increaseswith the compressive strength of concrete. This is becausethe tensile strength of FRC increases as the compressivestrength of FRC increases. In Fig. 15b, as flexural rein-forcement ratio increases, the punching shear strengthincreases. In the proposed strength model (Eq. (18)), thepunching shear strength of a slab–column connection isaffected by the depth of the compression zone cu. As theflexural reinforcement ratio increases, the depth of thecompression zone cu increases, which results in the increaseof the punching shear strength. As shown in Fig. 15c, theproposed strength model accurately predicts the punchingshear strength, which varies according to the volume ratioof fibers. The results are compared to the existing ACImodel for the punching shear strength of normal concreteslab–column connections [12] which does not acknowledge
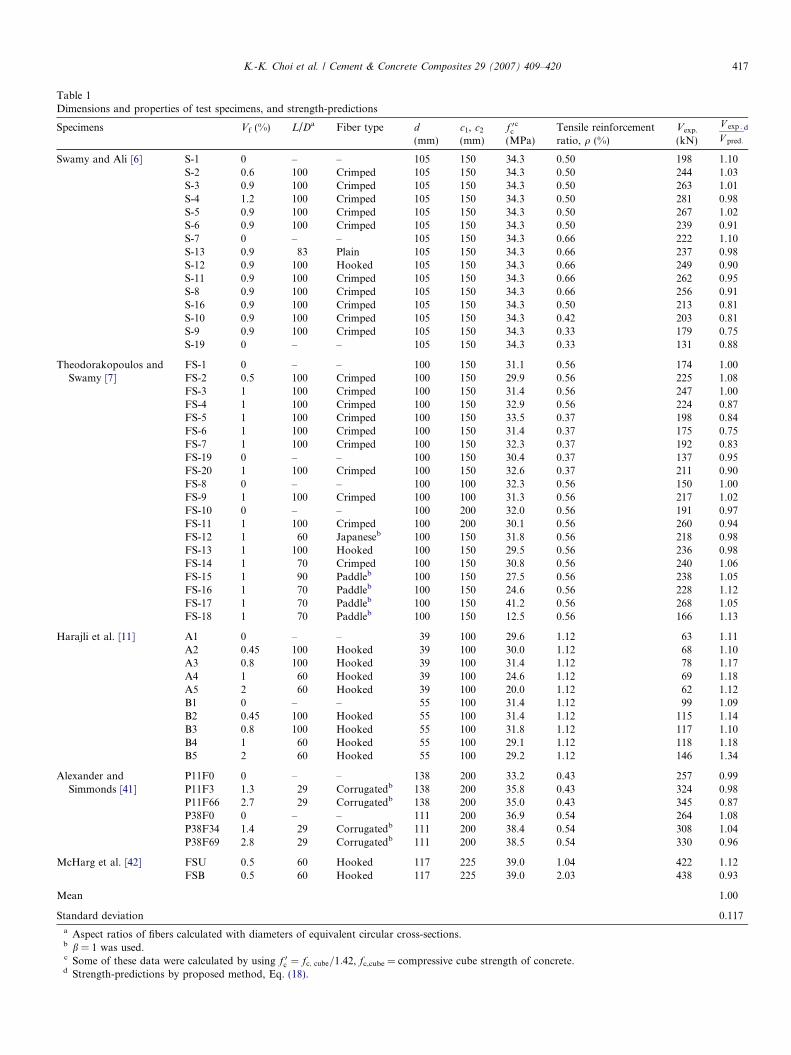
Table 1Dimensions and properties of test specimens, and strength-predictions
Specimens Vf (%) L/Da Fiber type d
(mm)c1, c2
(mm)f 0c
c
(MPa)Tensile reinforcementratio, q (%)
Vexp.
(kN)
V exp :
V pred:
d
Swamy and Ali [6] S-1 0 – – 105 150 34.3 0.50 198 1.10S-2 0.6 100 Crimped 105 150 34.3 0.50 244 1.03S-3 0.9 100 Crimped 105 150 34.3 0.50 263 1.01S-4 1.2 100 Crimped 105 150 34.3 0.50 281 0.98S-5 0.9 100 Crimped 105 150 34.3 0.50 267 1.02S-6 0.9 100 Crimped 105 150 34.3 0.50 239 0.91S-7 0 – – 105 150 34.3 0.66 222 1.10S-13 0.9 83 Plain 105 150 34.3 0.66 237 0.98S-12 0.9 100 Hooked 105 150 34.3 0.66 249 0.90S-11 0.9 100 Crimped 105 150 34.3 0.66 262 0.95S-8 0.9 100 Crimped 105 150 34.3 0.66 256 0.91S-16 0.9 100 Crimped 105 150 34.3 0.50 213 0.81S-10 0.9 100 Crimped 105 150 34.3 0.42 203 0.81S-9 0.9 100 Crimped 105 150 34.3 0.33 179 0.75S-19 0 – – 105 150 34.3 0.33 131 0.88
Theodorakopoulos andSwamy [7]
FS-1 0 – – 100 150 31.1 0.56 174 1.00FS-2 0.5 100 Crimped 100 150 29.9 0.56 225 1.08FS-3 1 100 Crimped 100 150 31.4 0.56 247 1.00FS-4 1 100 Crimped 100 150 32.9 0.56 224 0.87FS-5 1 100 Crimped 100 150 33.5 0.37 198 0.84FS-6 1 100 Crimped 100 150 31.4 0.37 175 0.75FS-7 1 100 Crimped 100 150 32.3 0.37 192 0.83FS-19 0 – – 100 150 30.4 0.37 137 0.95FS-20 1 100 Crimped 100 150 32.6 0.37 211 0.90FS-8 0 – – 100 100 32.3 0.56 150 1.00FS-9 1 100 Crimped 100 100 31.3 0.56 217 1.02FS-10 0 – – 100 200 32.0 0.56 191 0.97FS-11 1 100 Crimped 100 200 30.1 0.56 260 0.94FS-12 1 60 Japaneseb 100 150 31.8 0.56 218 0.98FS-13 1 100 Hooked 100 150 29.5 0.56 236 0.98FS-14 1 70 Crimped 100 150 30.8 0.56 240 1.06FS-15 1 90 Paddleb 100 150 27.5 0.56 238 1.05FS-16 1 70 Paddleb 100 150 24.6 0.56 228 1.12FS-17 1 70 Paddleb 100 150 41.2 0.56 268 1.05FS-18 1 70 Paddleb 100 150 12.5 0.56 166 1.13
Harajli et al. [11] A1 0 – – 39 100 29.6 1.12 63 1.11A2 0.45 100 Hooked 39 100 30.0 1.12 68 1.10A3 0.8 100 Hooked 39 100 31.4 1.12 78 1.17A4 1 60 Hooked 39 100 24.6 1.12 69 1.18A5 2 60 Hooked 39 100 20.0 1.12 62 1.12B1 0 – – 55 100 31.4 1.12 99 1.09B2 0.45 100 Hooked 55 100 31.4 1.12 115 1.14B3 0.8 100 Hooked 55 100 31.8 1.12 117 1.10B4 1 60 Hooked 55 100 29.1 1.12 118 1.18B5 2 60 Hooked 55 100 29.2 1.12 146 1.34
Alexander andSimmonds [41]
P11F0 0 – – 138 200 33.2 0.43 257 0.99P11F3 1.3 29 Corrugatedb 138 200 35.8 0.43 324 0.98P11F66 2.7 29 Corrugatedb 138 200 35.0 0.43 345 0.87P38F0 0 – – 111 200 36.9 0.54 264 1.08P38F34 1.4 29 Corrugatedb 111 200 38.4 0.54 308 1.04P38F69 2.8 29 Corrugatedb 111 200 38.5 0.54 330 0.96
McHarg et al. [42] FSU 0.5 60 Hooked 117 225 39.0 1.04 422 1.12FSB 0.5 60 Hooked 117 225 39.0 2.03 438 0.93
Mean 1.00
Standard deviation 0.117
a Aspect ratios of fibers calculated with diameters of equivalent circular cross-sections.b b = 1 was used.c Some of these data were calculated by using f 0c ¼ fc; cube=1:42, fc,cube = compressive cube strength of concrete.d Strength-predictions by proposed method, Eq. (18).
K.-K. Choi et al. / Cement & Concrete Composites 29 (2007) 409–420 417
0
0.5
1
1.5
2
0 20 40 60 80 100L/D
0
0.5
1
1.5
2
0 0.01 0.02 0.03V f
Vex
p/V
pred
0
0.5
1
1.5
2
0 50 100 150d (mm)
0
0.5
1
1.5
2
0 5 10 15 20 25l 1 /d
0
0.5
1
1.5
2
0 10 20 30 40 50f' c (MPa)
Vex
p/V
pred
Fig. 13. Strength-predictions for test specimens by proposed model.
0
0.5
1
1.5
2
0 0.01 0.02 0.03V fV f
Crimped fiber
Plain fiber
Other fibers0
0.5
1
1.5
2
0 0.01 0.02 0.03
Vex
p /V
pred
Without fiber
Hooked fiber
Fig. 14. Strength-predictions for test specimens using various types of steel fibers.
0
100
200
300
400
500
0 0.005 0.01 0.015V f
(c) Swamy and Ali [6]
S-2 S-3 S-4
105 (mm)=d
34.4 (MPa)' =cf0.5 (percent)=ρ
150 (mm)1 =c100/ =DL
Test Proposed method ACI 318 [12] Harajli et al. [11]
0
100
200
300
400
500
0 0.002 0.004 0.006 0.008Steel ratio,
0
100
200
300
400
500
0 20 40 60f' c (MPa)
Vex
p(k
N)
S-1
(a) Theodorakopoulos and Swamy [7]
(b) Swamy and Ali [6]
FS-18FS-16
FS-14 FS-17
S-9 S-10S-16
S-8
100(mm)=d0.56 (percent)=ρ
1501 =c
1=fV
(mm)
(percent)70/ =DL
105 (mm)=d34.4 (MPa)' =cf
150 (mm)1 =c
9.0=fV (percent)
100/ =DL
ρ
Fig. 15. Variations of punching shear strength according to design parameters.
418 K.-K. Choi et al. / Cement & Concrete Composites 29 (2007) 409–420
post-cracking capacity of FRC. It is obvious that the pro-posed method can predict the punching shear strength ofFRC with much better accuracy than the ACI model.The ACI model [12] underestimates the punching shear
capacity of FRC due to its neglect of the post-crackingcapacity which can significantly contribute to the punchingshear strength capacity of the slab–column connectionsreinforced with steel fibers.
K.-K. Choi et al. / Cement & Concrete Composites 29 (2007) 409–420 419
It is noted that the proposed strength model with propermodification developed in the present study may be applica-ble to the other types of connections subjected to unbal-anced moment. However, since experimental studies onedge or corner connections using steel fibers were rarely per-formed, it is difficult to verify the model applicability to edgeand corner connections. Therefore, the scope of the presentstudy was limited to interior slab–column connections.
5. Conclusions
A theoretical model for evaluating the punching shearstrength of slab–column connections reinforced with steelfibers was developed. The contributions of the compressionzone and the tension zone at the critical section wereconsidered. The contribution of the compression zone wasevaluated by considering the variation of the compressivestress developed by the flexural moment. The contributionof the tension zone was evaluated by considering the effectof the post-cracking tensile strength which is an importantcharacteristic of FRC. A simplified strength model fordesign purpose was developed. The proposed strengthmodel was verified by the comparisons with the existing testresults of slab–column connections reinforced with steelfibers. The punching shear capacity of the compression zoneas well as that of the tension zone was controlled by tensioncracking rather than compression crushing. The shearcapacities of the compression zone and the tension zonewere strongly affected by the depth of the compression zoneand the post-cracking tensile strength of FRC, respectively.The use of FRC significantly enhanced the punching shearcapacity of slab–column connections.
Acknowledgements
The financial support by the Defense Threat ReductionAgency (DTRA)-University of New Mexico Strategic Part-nership and the Ministry of Construction and Transporta-tion of Korea (04R&D C02-02) is greatly appreciated.
References
[1] Feld J. Lessons from failures of concrete structures. ACI monograph,vol. 1. Detroit: American Concrete Institute/Iowa State UniversityPress; 1964. p. 30–2.
[2] Building collapse blamed on design, construction. Eng News-Rec1971;187:19.
[3] Collapse kills five and destroys large portion of 26-story buildingunder way. Eng News-Rec 1973;190(10):12.
[4] Mansur MA, Ong KCG, Paramsivam P. Shear strength of fibrousconcrete beams without stirrups. J Struct Eng 1986;112(9):2066–79.
[5] Narayanan R, Darwish IYS. Use of steel fibers as shear reinforce-ment. ACI Struct J 1987;84(3):216–27.
[6] Swamy RN, Ali SAR. Punching shear behavior of reinforced slab–column connections made with steel fiber concrete. ACI J1982;79(6):392–406.
[7] Theodorakopoulos DD, Swamy N. Contribution of steel fibers to thestrength characteristics of lightweight concrete slab–column connec-tions falling in punching shear. ACI Struct J 1993;90(4):342–55.
[8] Cox BN, Marshall DB. Concepts for bridged cracks in fracture andfatigue. Acta Metall J 1994;42(2):341–63.
[9] Bentur A, Mindess S. Fiber reinforced cementitious compos-ites. NY: Elsevier Applied Science; 1990. 620 pp.
[10] Beaudoin JJ. Handbook of fiber-reinforced concrete, principles,properties, developments and applications. Noyes Publications;1990. 332 pp.
[11] Harajli MH, Maalouf D, Khatib H. Effect of fibers on the punchingshear strength of slab–column connections. Cem Concr Compos1995;17:161–70.
[12] ACI Committee 318. Building code requirements for structuralconcrete (ACI 318-02), vol. 87 (3). 1990. p. 350–61.
[13] Elgabry AA, Ghali A. Design of stud-shear reinforcement for slabs.ACI Strcut J 1990;87(3):350–61.
[14] Li V, Ward R, Hamza AM. Steel and synthetic fibers as shearreinforcement. ACI Mater J 1992;89(5):499–508.
[15] Parra-Montesinos GJ, Wight JK. Seismic response of exterior RCcolumn-to-steel beam connections. J Struct Eng 2000;126(10):1112–21.
[16] Megally S, Ghali A. Punching shear design of earthquake-resistantslab–column connections. ACI Struct J 2000;97(5):720–30.
[17] EC 2. Design of concrete structures, part I: general rules and rules forbuildings. European Committee for Standardization Brussels;1991.
[18] CEB-FIP MC 90. Design of concrete structures. CEB-FIP-Model-Code 1990. Thomas Telford; 1993.
[19] BS 8110. Structural use of concrete, part 1, code of practice for designand construction. British Standards Institution; 1997.
[20] Khuntia M, Stojadinovic B, Goel SC. Shear strength of normal andhigh-strength fiber reinforced concrete beams without stirrups. ACIStruct J 1999;96(2):282–9.
[21] Naaman AE, Reinhardt HW. High performance fiber reinforcedcement composites: HPFRCC 4. In: RILEM proceedings Pro30. RILEM Publications SARL; 2003.
[22] Fanella DA, Naaman AE. Stress–strain properties of fiber reinforcedmortar in compression. ACI J 1985;82(3):475–82.
[23] Oluokun FA. Prediction of concrete tensile strength from compres-sive strength: evaluation of existing relations for normal weightconcrete. ACI Mater J 1991;88(3):302–9.
[24] Reda Taha MM, Shrive NG. Enhancing fracture toughness of highperformance carbon fibre cement composites. ACI Mater J 2001;98(2):168–78.
[25] Naaman AE, Najm H. Bond-slip mechanisms of steel fibers inconcrete. ACI Mater J 1991;88(2):135–45.
[26] Kotsovos MD, Pavlovic MN. Ultimate limit-sate design of concretestructures: a new approach. London: Thomas Telford; 1998. 208 pp.
[27] Farhey DN, Adin MA, Yankelevsky DZ. Flat slab–column subas-semblages under lateral loading. J Struct Eng 1993;119(6):1903–16.
[28] Reinhartd HW, Walraven JC. Crack in concrete subject to shear.J Struct Div 1982;108(ST1):207–24.
[29] Jelic I, Pavlovic MN, Kotsovos MD. A study of dowel action inreinforced concrete beams. Mag Concr Res 1999(April).
[30] Zararis PD, Papadakis GC. Diagonal shear failure and size effect inRC beams without web reinforcement. J Struct Eng 2001;127(7):733–42.
[31] Kinnunen S, Nylander H. Punching of concrete slabs without shearreinforcement. Transactions no. 158. Royal Institute of Technology,Stockholm; 1960. p. 112.
[32] Zaghool ERF, Rawdon de Paiva HA. Strength analysis of cornercolumn–slab connections. J Struct Div 1973;99(ST1):53–70.
[33] Theodorakopoulos DD, Swamy RN. Ultimate punching shearstrength analysis of slab–column connections. Cem Concr Compos2002;24:509–21.
[34] Regan PE, Braestrup MW. Punching shear in reinforced concrete—astate-of-art report by CEB Bull. 168, Lausanne, January 1985. p. 232.
[35] Chen WF. Plasticity in reinforced concrete. New York: McGraw-Hill; 1982. p. 204–5.
420 K.-K. Choi et al. / Cement & Concrete Composites 29 (2007) 409–420
[36] Kupfer HB, Hildorf HK, Rusch H. Behavior of concrete underbiaxial stresses. ACI J 1969;66(8):656–66.
[37] Naaman AE, Reinhardt HW. High performance fiber reinforcedcement composites: HPFRCC 2. RILEM, E&FN SPON; 1996. p.291–347.
[38] Fraser DJ. Elastic analysis of laterally loaded frames. J Struct Eng1983;109(6):1479–89.
[39] Bazant ZP, Cao Z. Size effect in punching shear failure of slabs. ACIStruct J 1987;84(1):44–53.
[40] Marzouk H, Osman M, Hussein A. Punching shear of slabs: cracksize and size effects. Mag Concr Res 2002;54(1):13–21.
[41] Alexander SDB, Simmonds SH. Punching shear tests of concreteslab–column joints containing fiber reinforcement. ACI Struct J1992;89(4):425–32.
[42] McHarg PJ, Cook WD, Mitchell D, Yoon Young-Soo. Benefits ofconcentrated slab reinforcement and steel fibers on performance ofslab–column connections. ACI Struct J 2000;97(2):225–34.


