Embed Size (px)
Citation preview
Revision: R1D0 Effective date: 8/19/2008 This is an UNCONTROLLED DOCUMENT.
Flow Monitoring Quality Management System Planning Document
Quality Assurance Project Plan Genesee Basin Flow Monitoring Study
Prepared by CH2M HILL
Revision: R1D0
Effective date: 8/19/2008
Seattle Public Utilities
Seattle , Washington
This document is part of the Science Information Quality System providing in one place a clear, concise, and complete plan for environmental data management and its quality objectives, and for identifying key project personnel.
WA 1.0 - GENESEE BASIN FLOW MONITORING STUDY PAGE i OF 62 QUALITY ASSURANCE PROJECT PLAN
Revision: R1D0 Effective date: 8/19/2008 This is an UNCONTROLLED DOCUMENT.
1. TITLE AND APPROVAL SHEET
Quality Assurance Project Plan Genesee Basin Flow Monitoring Study
Internal Review and Approval
Title (Name) Signature Date
Quality Assurance Facilitator- Vacant
CIP Project Manager- Ed Mirabella, Utilities Systems Management, SPU
Deputy CIP Project Manager- Kathy Robertson, Pickets Engineering, LLC
Study Project Manager- Ben Marré, Utilities Systems Management, SPU
Data Manager- Mike Hinson, Utilities Systems Management, SPU
Deputy Data Manager- Laura Reed, Utilities Systems Management, SPU
Reviewer- Tom Fawthrop, Engineering Services, SPU
Reviewer- Eleanor Jackson, Engineering Services, SPU
Reviewer- Patrick Murphy, Engineering Services, SPU
Reviewer- Naomi Chechowitz, Engineering Services, SPU
Reviewer- Shanti Colwell, Scientific & Technical Services, SPU
Reviewer- Jason Sharpley, Utilities Systems Management, SPU
WA 1.0 - GENESEE BASIN FLOW MONITORING STUDY PAGe ii OF 62 QUALITY ASSURANCE PROJECT PLAN
Revision: R1D0 Effective date: 8/19/2008 This is an UNCONTROLLED DOCUMENT.
External Review and Approval
Title (Name) Signature Date
Project QA Coordinator- Dan O’Leary, CH2M Hill
Deputy Project QA Coordinator- Tyler Jantzen, CH2M Hill
Reviewer- Eric Bergstrom, HDR
Reviewer- Gillian Woodward, ADS Environmental
WA 1.0 - GENESEE BASIN FLOW MONITORING STUDY PAGe iii OF 62 QUALITY ASSURANCE PROJECT PLAN
Revision: R1D0 Effective date: 8/19/2008 This is an UNCONTROLLED DOCUMENT.
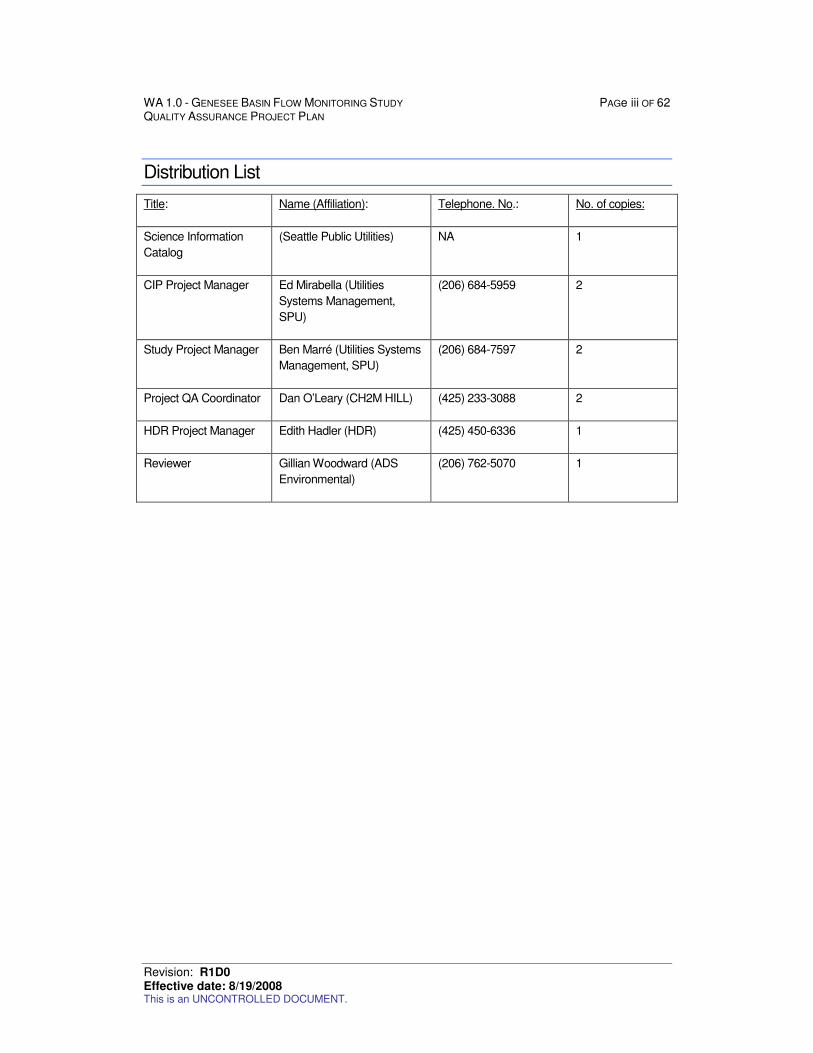
Distribution List
Title: Name (Affiliation): Telephone. No.: No. of copies:
Science Information
Catalog
(Seattle Public Utilities) NA 1
CIP Project Manager Ed Mirabella (Utilities
Systems Management,
SPU)
(206) 684-5959 2
Study Project Manager Ben Marré (Utilities Systems
Management, SPU)
(206) 684-7597 2
Project QA Coordinator Dan O’Leary (CH2M HILL) (425) 233-3088 2
HDR Project Manager Edith Hadler (HDR) (425) 450-6336 1
Reviewer Gillian Woodward (ADS
Environmental)
(206) 762-5070 1

WA 1.0 - GENESEE BASIN FLOW MONITORING STUDY PAGe iv OF 62 QUALITY ASSURANCE PROJECT PLAN
Revision: R1D0 Effective date: 8/19/2008 This is an UNCONTROLLED DOCUMENT.
Acronyms
AV Area-Velocity
BMP Best Management Practice
CSI Combined Sewer Inflow
CSO Combined Sewer Overflow
CSS Combined Sewer System
CWA Clean Water Act
DOC Demonstration of Capability
DMP Data Management Plan
DMRG Data Management Reference Guide
DQO Data Quality Objective
EPA Environmental Protection Agency
ETV Environmental Technology Verification
GIS Geographic Information System
GPM Gallons Per Minute
MH Maintenance Hole
NPDES National Pollutant Discharge Elimination System
NPS Nonpoint Source
PO Project Officer
QA/QC Quality Assurance/Quality Control
QAM Quality Assurance Manual
QAO Quality Assurance Officer
QAPP Quality Assurance Project Plan
QAS Quality Assurance Specialist
QMP Quality Management Plan
RPD Relative Percent Difference
SIC Science Information Catalog
SLOC Station Location Form
SOP Standard Operating Procedure
NPS Nonpoint Source
WQI Water Quality Indicator
WA 1.0 - GENESEE BASIN FLOW MONITORING STUDY PAGe v OF 62 QUALITY ASSURANCE PROJECT PLAN
Revision: R1D0 Effective date: 8/19/2008 This is an UNCONTROLLED DOCUMENT.
2. TABLE OF CONTENTS
1. Title and Approval Sheet .............................................................................................................i Distribution List ................................................................................................................................. iii Acronyms.......................................................................................................................................... iv 2. Table of Contents .......................................................................................................................v 3. Background ................................................................................................................................8
3.1. Modeling Background .............................................................................................................9 3.2. Study Area ............................................................................................................................10
3.2.1. King County Facilities ....................................................................................................12 3.2.2. Logistical Problems........................................................................................................15 3.2.3. History............................................................................................................................15
3.3. Parameters of Concern .........................................................................................................15 3.3.1. Previous Studies ............................................................................................................16 3.3.2. Criteria and/or Standards...............................................................................................17
4. Project Description....................................................................................................................18 4.1. Project Goals.........................................................................................................................18 4.2. Project Objectives .................................................................................................................18 4.3. Information Requirements.....................................................................................................19 4.4. Target Population..................................................................................................................19 4.5. Study Boundaries..................................................................................................................20 4.6. Practical Constraints .............................................................................................................22 4.7. Data Collection......................................................................................................................23 4.8. Decision-making....................................................................................................................23
5. Organization and Schedule ......................................................................................................24 5.1. Roles and Responsibilities ....................................................................................................24 5.2. Special Training Needs/Certification .....................................................................................25 5.3. Timeline/project schedule .....................................................................................................26
5.3.1. Project Deliverables .......................................................................................................27 5.3.2. Project Success Factors ................................................................................................27
5.4. Document and Records ........................................................................................................28 5.4.1. Data Reports..................................................................................................................28 5.4.2. Electronic Data...............................................................................................................28 5.4.3. Records and Documents Retention Requirements ........................................................28 5.4.4. Revisions to the Flow Monitoring Plan ...........................................................................29 5.4.5. Expedited Changes........................................................................................................29
6. Quality Objectives.....................................................................................................................29 6.1. Measurement Quality Objectives ..........................................................................................29
6.1.1. Precision ........................................................................................................................29 6.1.2. Bias................................................................................................................................30 6.1.3. Representativeness .......................................................................................................30 6.1.4. Completeness ................................................................................................................31 6.1.5. Comparability .................................................................................................................31 6.1.6. Sensitivity (Reporting Limits)..........................................................................................32
6.2. Data Quality Objectives.........................................................................................................32 6.2.1. Raw Data Quality ...........................................................................................................33 6.2.2. Data Quality ...................................................................................................................33 6.2.3. QA/QC Data Quality.......................................................................................................33
7. Sampling Process Design (Experimental Design) ....................................................................33 7.1. Permanent Monitoring Locations...........................................................................................34 7.2. Temporary Monitoring Locations...........................................................................................35 7.3. SCADA Monitoring Locations................................................................................................36 7.4. King County Monitoring Locations.........................................................................................40 7.5. Rainfall Monitoring Locations ................................................................................................40
8. Sampling Procedures ...............................................................................................................42
WA 1.0 - GENESEE BASIN FLOW MONITORING STUDY PAGe vi OF 62 QUALITY ASSURANCE PROJECT PLAN
Revision: R1D0 Effective date: 8/19/2008 This is an UNCONTROLLED DOCUMENT.
8.1. Sample Handling and Custody..............................................................................................42 8.2. Documentation of Field Sampling Activities ..........................................................................42 8.3. Non-direct Measurements.....................................................................................................42
9. Measurement Procedures ........................................................................................................42 10. Quality Control ..........................................................................................................................43
10.1. Analytical Quality Control..............................................................................................46 10.2. Field Quality Control .....................................................................................................46
10.2.1. QC Samples.............................................................................................................46 10.2.2. Instrument/Equipment Testing, Inspection, and Maintenance..................................46 10.2.3. Instrument/Equipment Calibration and Frequency ...................................................46 10.2.4. Inspection/Acceptance of Supplies and Consumables ............................................46
11. Data Management Procedures.................................................................................................46 11.1. Data Path......................................................................................................................47 11.2. Record-keeping and Data Storage ...............................................................................47 11.3. Data Verification/Validation...........................................................................................47 11.4. Forms and Checklists ...................................................................................................47 11.5. Data Handling ...............................................................................................................48 11.6. Hardware and Software Requirements.........................................................................48 11.7. Information Resource Management Requirements ......................................................48
12. Audits and Reports ..................................................................................................................48 12.1. Audits and Response Actions.......................................................................................49 12.2. Deficiencies, Nonconformances, and Corrective Action ...............................................50 12.3. Reports to Management ...............................................................................................50
13. Data Verification and Validation................................................................................................51 13.1. Data Review, Verification, and Validation .....................................................................51 13.2. Verification and Validation Methods..............................................................................51
14. Data Quality (Usability) Assessment.........................................................................................52 14.1. Data Assessment Approach, Methods, and Presentation.............................................52 14.2. Roles and Responsibility...............................................................................................52 14.3. Documentation..............................................................................................................53
References ......................................................................................................................................53 List of Revisions...............................................................................................................................53 Appendix A: Summary of Previous Data Review Appendix B: Monitoring Location Maps and Schematic Appendix C: Site Installation Sheets Appendix D: Meter Specifications Appendix E: Data Review Templates Appendix F: ADS QA and Implementation Plan Appendix G: ADS Health and Safety Plan Appendix H: Standard Operating Procedures
WA 1.0 - GENESEE BASIN FLOW MONITORING STUDY PAGe vii OF 62 QUALITY ASSURANCE PROJECT PLAN
Revision: R1D0 Effective date: 8/19/2008 This is an UNCONTROLLED DOCUMENT.
List of Tables
Table 1. Basin Land Uses..................................................................................................... 10 Table 2. Genesee Basin Characteristics............................................................................... 11 Table 3. Genesee Basin- CSO Facilities............................................................................... 11 Table 4. Monitoring NPDES Outfall Basins........................................................................... 21 Table 5. Stormwater Basin Monitoring .................................................................................. 21 Table 6. Monitoring Hydrobrake Performance ...................................................................... 21 Table 7. Monitoring Storage Facility Performance ................................................................ 22 Table 8. Roles and Responsibilities ...................................................................................... 24 Table 9. Project Schedule..................................................................................................... 26 Table 10. Project Deliverables and Schedule ......................................................................... 27 Table 11. ADS Sensor Reporting Limits ................................................................................. 32 Table 12. Permanent Monitoring Locations Summary ............................................................ 34 Table 13. Temporary Monitoring Locations Summary ............................................................ 37 Table 14. Audit and Assessment Schedule ............................................................................ 49
List of Figures Figure 1: S. Genesee CSO Basin Study Area ................................................................................ 13 Figure 2: King County CSO Outfalls ............................................................................................... 14 Figure 3: SPU Rain Gages Near Genesee Basin ........................................................................... 41 Figure 4: 2008-2009 Genesee Flow Monitoring............................................................................. 45
Appendices Appendix A: Summary of Previous Data Review Appendix B: Monitoring Location Maps and Schematic Appendix C: Site Installation Sheets Appendix D: Meter Specifications Appendix E: Data Review Templates Appendix F: ADS QA and Implementation Plan Appendix G: ADS Health and Safety Plan Appendix H: Standard Operating Procedures

WA 1.0 - GENESEE BASIN FLOW MONITORING STUDY PAGE 8 OF 62 QUALITY ASSURANCE PROJECT PLAN
Revision: R1D0 Effective date: 8/19/2008 This is an UNCONTROLLED DOCUMENT.
Quality Assurance Project Plan Genesee Basin Flow Monitoring Study
This Flow Monitoring Plan prepared by CH2M HILL describes the quality assurance process for flow monitoring of the combined sewer system within the South Genesee basin. The flow monitoring data will be used for the S. Genesee Combined Sewer Overflow (CSO) Reduction Project and partially fulfills the requirements for Monitoring and Planning in support of the Facilities Plan due to the Washington State Department of Ecology by December 31, 2010. The primary uses of the Genesee flow monitoring will be to calibrate the basin model and develop rating curves of the basin’s control structures (hydrobrakes and weirs). To achieve these objectives, the flow monitoring data that consists of simultaneous measurements of depth, velocity, and precipitation must have high availability of valid data. The primary goal of this Flow Monitoring Plan is to define procedures that assure the quality of data, the representativeness of the results, the precision and accuracy of the analyses, the completeness of the data, and to ultimately deliver defensible products and decisions.
This document is a Flow Monitoring Plan in the form of a Quality Assurance Project Plan (QAPP), and was developed with guidance from the Department of Ecology, Guidelines for Preparing Quality Assurance Project Plans for Environmental Studies (Ecology 2004). In addition, the SPU Science Information Quality System document template for QAPPs was used. The Flow Monitoring Plan was developed in coordination with the Genesee CSO Reduction Project team members: SPU, CH2M HILL, and ADS Environmental.
3. BACKGROUND
The Genesee Basin is served primarily by a partially separated sanitary sewer system, which conveys wastewater and runoff from directly connected rooftops and area drains to the King County Mainline that runs along Charleston Street, into the Rainier Avenue Lift Station, and ultimately to the King County West Point Treatment Plant. CSO outfalls discharge directly to Lake Washington. Separated stormwater is discharged to Lake Washington through multiple storm drain outfalls.
The Washington State Department of Ecology (Ecology) administers the City of Seattle’s (the City’s) National Pollutant Discharge Elimination System (NPDES) permit for combined sewer overflow (CSO) outfalls. The City developed the Combined Sewer Overflow Reduction Plan Amendment in December 2001 and subsequently issued an amendment update in 2005, which outlines plans to comply with permit conditions. The City is required to abide with a compliance schedule designed to achieve the greatest reasonable reduction of CSOs at the earliest possible date. The City’s goal is to reduce CSOs to the Washington State Regulation of an average of one untreated CSO per year per outfall by the year 2020. Review of Water Quality Standards is being performed by SPU’s Water Quality Business Unit, which will provide input on how to meet Water Quality Standards.

WA 1.0 - GENESEE BASIN FLOW MONITORING STUDY PAGE 9 OF 62 QUALITY ASSURANCE PROJECT PLAN
Revision: R1D0 Effective date: 8/19/2008 This is an UNCONTROLLED DOCUMENT.
The objectives of the 2001 Plan Amendment are:
� Control CSOs to an average of one (1) untreated discharge per CSO site per year
� Develop a plan that is technically feasible and financially responsible
� Coordinate the CSO program with King County‘s wastewater program
� Coordinate with affected communities
The 2001 Plan describes a series of projects intended to comply with regulatory requirements through a mix of Best Management Practices (BMPs), off-line storage, and structural modifications to existing facilities. The Genesee Basin was identified as one of the project areas and comprises eight sub-basins corresponding to CSO outfalls designated by NPDES Nos. 37, 38, 39, 40, 41, 42, 43, and 165.
Recent CSO reporting to Ecology and a review of historical CSO volumes from 1998 to 2007 indicate that CSO sub-basin 37 is controlled and sub-basins 38, 40, 41, 42, 43, and 165 are not controlled to Ecology standards. Controlled basins are defined as those that meet the one untreated CSO event per year. The 2005 Plan Amendment indicated an anticipated construction completion date of 2015 for the South Genesee CSO Storage Project.
3.1. Modeling Background
One component of the 2001 Plan Amendment was a planning-level hydrologic/hydraulic model. This model was created in InfoWorks software and was produced to assist in determining and developing alternative design concepts to achieve an average of one (1) overflow per year per outfall. These alternatives are documented in the Plan Amendment and associated Modeling & Assessment reports. This model was updated in 2006 with system configuration changes and new data.
In order to meet the City of Seattle objectives and schedule set forth in the 2001 Plan Amendment and 2005 Plan Amendment Update, a model capable of facilitating preliminary and design engineering is required. The existing 2006 model needs to be expanded to include basins 37 and 38, and refined for the more rigorous demands of preliminary engineering and design. In preparation for updating the model, SPU and CH2M HILL evaluated the availability of monitoring data to meet the project objectives. Recent flow monitoring data was deemed insufficient, and SPU authorized CH2M HILL to expand the existing program and select flow monitoring locations that meet the immediate needs of the project. These project data needs include the following:
� Measuring the volume, performance, and frequency of overflows at each of the basin’s outfall locations.
� Depth and velocity to develop stage discharge curves at the CSO control facilities (hydrobrakes).
WA 1.0 - GENESEE BASIN FLOW MONITORING STUDY PAGE 10 OF 62 QUALITY ASSURANCE PROJECT PLAN
Revision: R1D0 Effective date: 8/19/2008 This is an UNCONTROLLED DOCUMENT.
� Measured flow at strategic points to support allocating flow upstream within the outfall basins for both dry weather and wet weather conditions.
Monitoring will consist of simultaneous measurements of velocity and depth at strategic points within the system and precipitation over the Genesee basin. “Temporary” flow monitors will complement the “permanent ” or “existing” flow monitors currently installed on the basin’s outfalls. The existing tipping-bucket rain gage located within the basin will be used to measure precipitation.
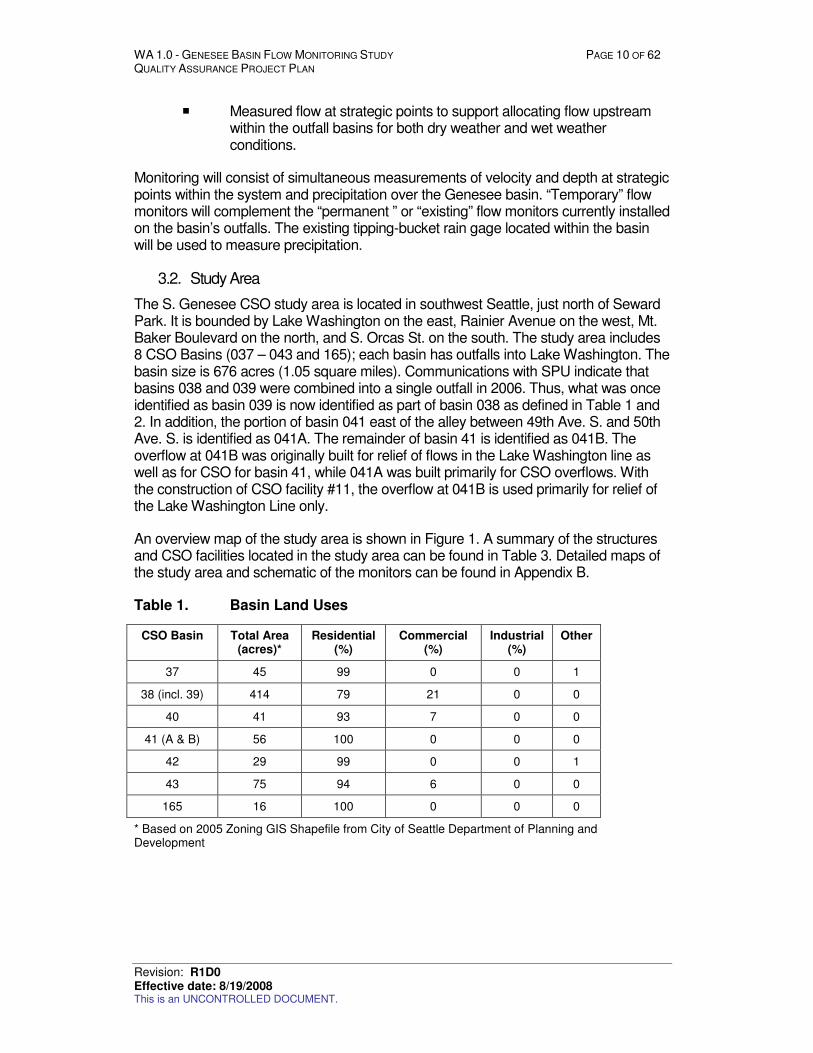
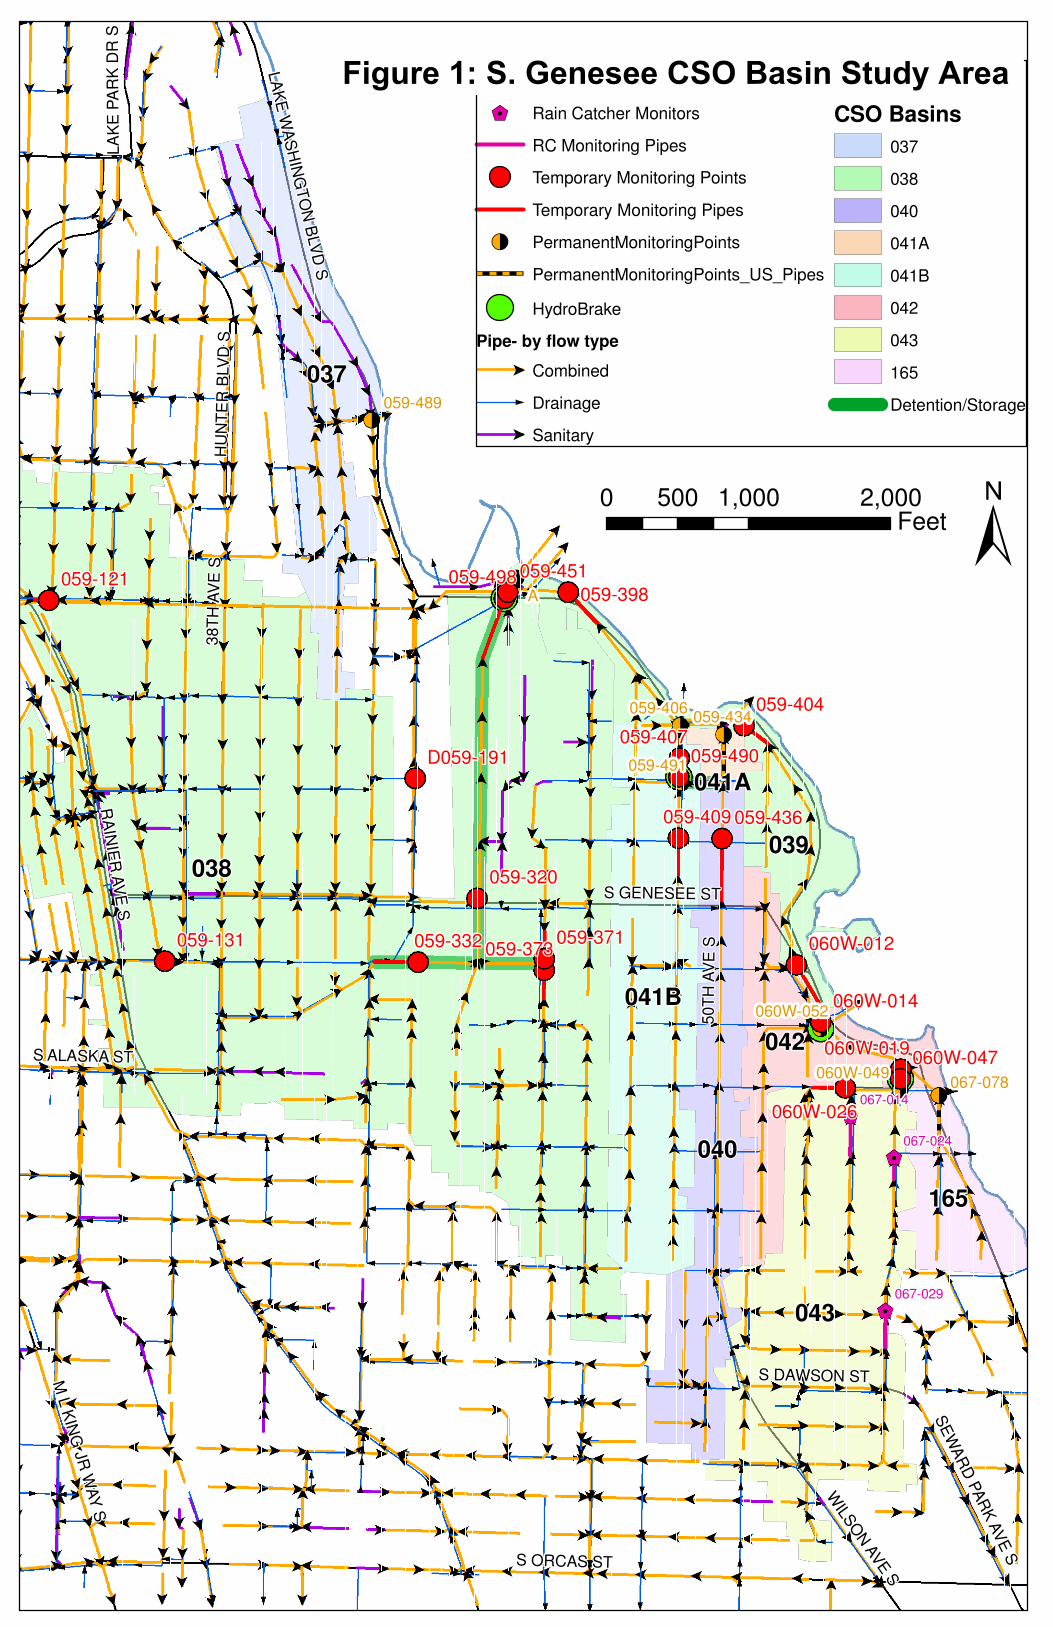
3.2. Study Area
The S. Genesee CSO study area is located in southwest Seattle, just north of Seward Park. It is bounded by Lake Washington on the east, Rainier Avenue on the west, Mt. Baker Boulevard on the north, and S. Orcas St. on the south. The study area includes 8 CSO Basins (037 – 043 and 165); each basin has outfalls into Lake Washington. The basin size is 676 acres (1.05 square miles). Communications with SPU indicate that basins 038 and 039 were combined into a single outfall in 2006. Thus, what was once identified as basin 039 is now identified as part of basin 038 as defined in Table 1 and 2. In addition, the portion of basin 041 east of the alley between 49th Ave. S. and 50th Ave. S. is identified as 041A. The remainder of basin 41 is identified as 041B. The overflow at 041B was originally built for relief of flows in the Lake Washington line as well as for CSO for basin 41, while 041A was built primarily for CSO overflows. With the construction of CSO facility #11, the overflow at 041B is used primarily for relief of the Lake Washington Line only.
An overview map of the study area is shown in Figure 1. A summary of the structures and CSO facilities located in the study area can be found in Table 3. Detailed maps of the study area and schematic of the monitors can be found in Appendix B.
Table 1. Basin Land Uses
CSO Basin Total Area (acres)*
Residential (%)
Commercial (%)
Industrial (%)
Other
37 45 99 0 0 1
38 (incl. 39) 414 79 21 0 0
40 41 93 7 0 0
41 (A & B) 56 100 0 0 0
42 29 99 0 0 1
43 75 94 6 0 0
165 16 100 0 0 0
* Based on 2005 Zoning GIS Shapefile from City of Seattle Department of Planning and Development
WA 1.0 - GENESEE BASIN FLOW MONITORING STUDY PAGE 11 OF 62 QUALITY ASSURANCE PROJECT PLAN
Revision: R1D0 Effective date: 8/19/2008 This is an UNCONTROLLED DOCUMENT.
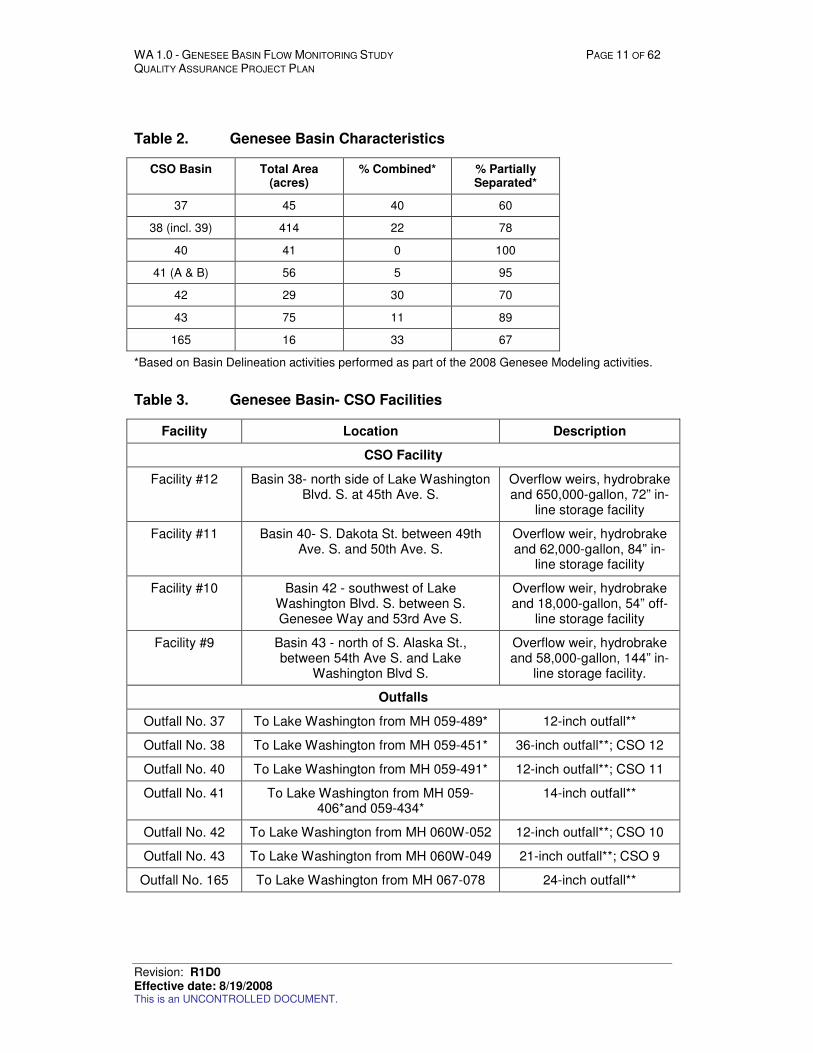
Table 2. Genesee Basin Characteristics
CSO Basin Total Area (acres)
% Combined* % Partially Separated*
37 45 40 60
38 (incl. 39) 414 22 78
40 41 0 100
41 (A & B) 56 5 95
42 29 30 70
43 75 11 89
165 16 33 67
*Based on Basin Delineation activities performed as part of the 2008 Genesee Modeling activities.
Table 3. Genesee Basin- CSO Facilities
Facility Location Description
CSO Facility
Facility #12 Basin 38- north side of Lake Washington Blvd. S. at 45th Ave. S.
Overflow weirs, hydrobrake and 650,000-gallon, 72” in-
line storage facility
Facility #11 Basin 40- S. Dakota St. between 49th Ave. S. and 50th Ave. S.
Overflow weir, hydrobrake and 62,000-gallon, 84” in-
line storage facility
Facility #10 Basin 42 - southwest of Lake Washington Blvd. S. between S. Genesee Way and 53rd Ave S.
Overflow weir, hydrobrake and 18,000-gallon, 54” off-
line storage facility
Facility #9 Basin 43 - north of S. Alaska St., between 54th Ave S. and Lake
Washington Blvd S.
Overflow weir, hydrobrake and 58,000-gallon, 144” in-
line storage facility.
Outfalls
Outfall No. 37 To Lake Washington from MH 059-489* 12-inch outfall**
Outfall No. 38 To Lake Washington from MH 059-451* 36-inch outfall**; CSO 12
Outfall No. 40 To Lake Washington from MH 059-491* 12-inch outfall**; CSO 11
Outfall No. 41 To Lake Washington from MH 059-406*and 059-434*
14-inch outfall**
Outfall No. 42 To Lake Washington from MH 060W-052 12-inch outfall**; CSO 10
Outfall No. 43 To Lake Washington from MH 060W-049 21-inch outfall**; CSO 9
Outfall No. 165 To Lake Washington from MH 067-078 24-inch outfall**
WA 1.0 - GENESEE BASIN FLOW MONITORING STUDY PAGE 12 OF 62 QUALITY ASSURANCE PROJECT PLAN
Revision: R1D0 Effective date: 8/19/2008 This is an UNCONTROLLED DOCUMENT.
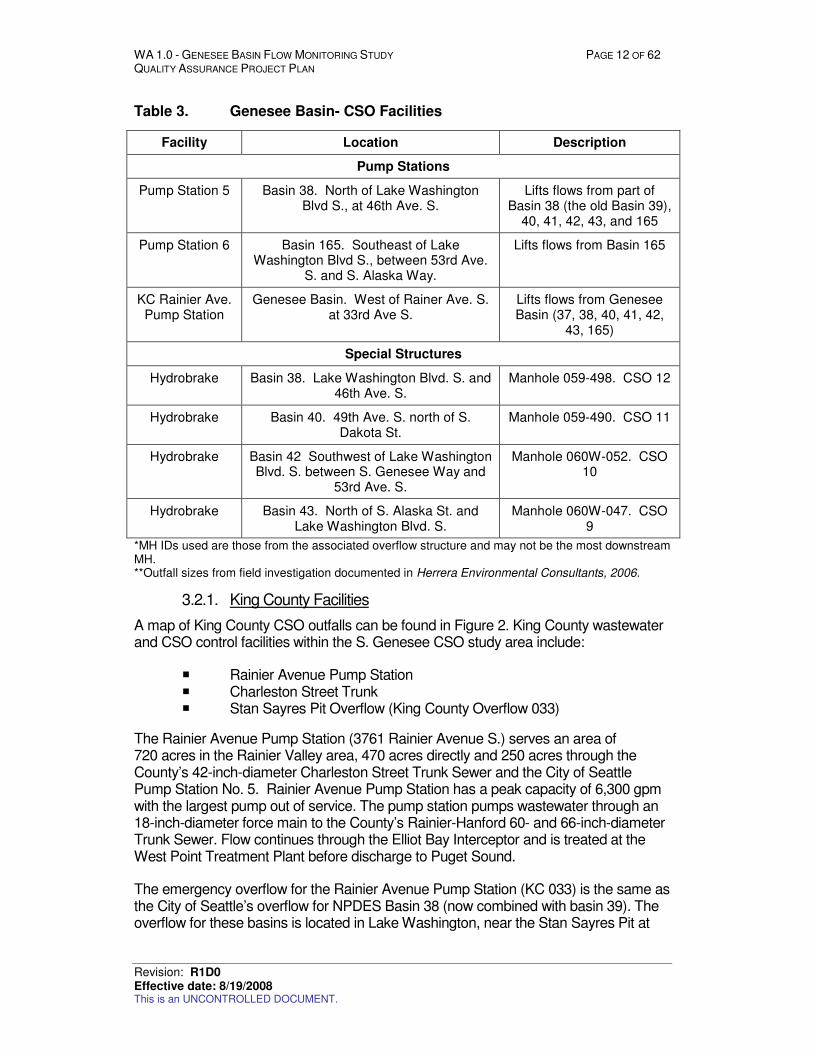
Table 3. Genesee Basin- CSO Facilities
Facility Location Description
Pump Stations
Pump Station 5 Basin 38. North of Lake Washington Blvd S., at 46th Ave. S.
Lifts flows from part of Basin 38 (the old Basin 39),
40, 41, 42, 43, and 165
Pump Station 6 Basin 165. Southeast of Lake Washington Blvd S., between 53rd Ave.
S. and S. Alaska Way.
Lifts flows from Basin 165
KC Rainier Ave. Pump Station
Genesee Basin. West of Rainer Ave. S. at 33rd Ave S.
Lifts flows from Genesee Basin (37, 38, 40, 41, 42,
43, 165)
Special Structures
Hydrobrake Basin 38. Lake Washington Blvd. S. and 46th Ave. S.
Manhole 059-498. CSO 12
Hydrobrake Basin 40. 49th Ave. S. north of S. Dakota St.
Manhole 059-490. CSO 11
Hydrobrake Basin 42 Southwest of Lake Washington Blvd. S. between S. Genesee Way and
53rd Ave. S.
Manhole 060W-052. CSO 10
Hydrobrake Basin 43. North of S. Alaska St. and Lake Washington Blvd. S.
Manhole 060W-047. CSO 9
*MH IDs used are those from the associated overflow structure and may not be the most downstream MH. **Outfall sizes from field investigation documented in Herrera Environmental Consultants, 2006.
3.2.1. King County Facilities
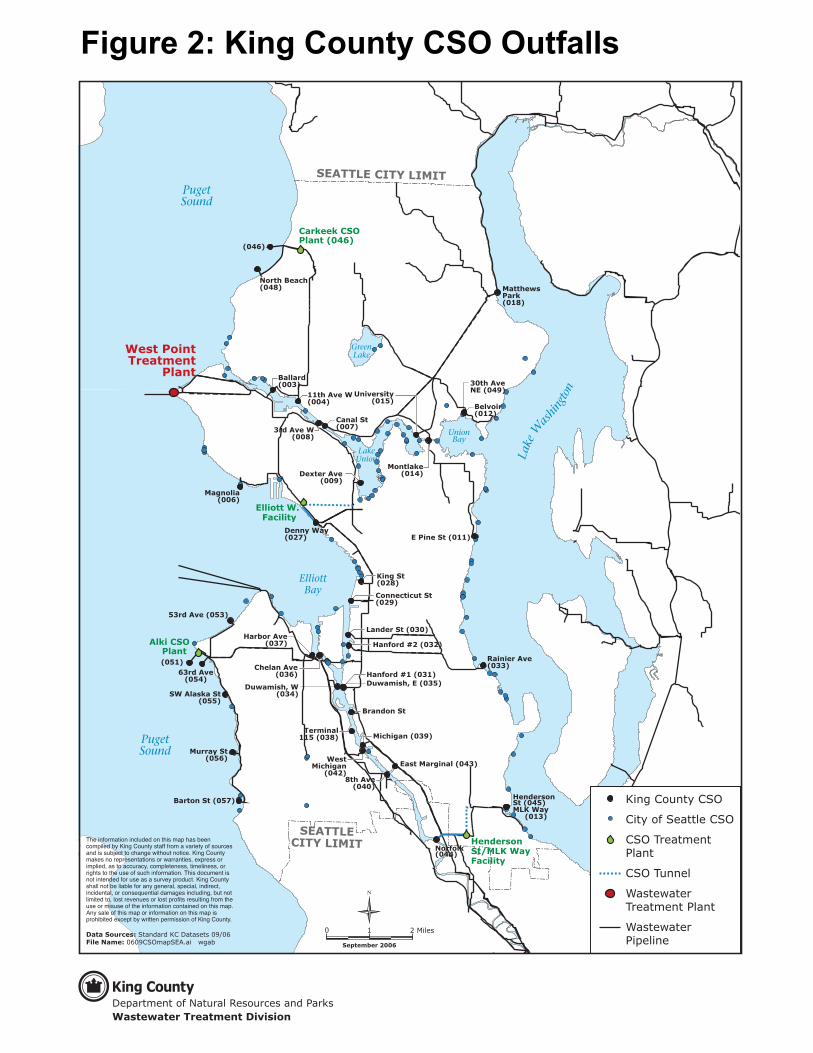
A map of King County CSO outfalls can be found in Figure 2. King County wastewater and CSO control facilities within the S. Genesee CSO study area include:
� Rainier Avenue Pump Station � Charleston Street Trunk � Stan Sayres Pit Overflow (King County Overflow 033)
The Rainier Avenue Pump Station (3761 Rainier Avenue S.) serves an area of 720 acres in the Rainier Valley area, 470 acres directly and 250 acres through the County’s 42-inch-diameter Charleston Street Trunk Sewer and the City of Seattle Pump Station No. 5. Rainier Avenue Pump Station has a peak capacity of 6,300 gpm with the largest pump out of service. The pump station pumps wastewater through an 18-inch-diameter force main to the County’s Rainier-Hanford 60- and 66-inch-diameter Trunk Sewer. Flow continues through the Elliot Bay Interceptor and is treated at the West Point Treatment Plant before discharge to Puget Sound.
The emergency overflow for the Rainier Avenue Pump Station (KC 033) is the same as the City of Seattle’s overflow for NPDES Basin 38 (now combined with basin 39). The overflow for these basins is located in Lake Washington, near the Stan Sayres Pit at
067-029
067-024
067-014
059-451
059-398
059-320
059-490059-407
059-371059-131
059-498
059-373059-332
059-404
059-436
059-121
059-409
D059-191
060W-047060W-019
060W-026
060W-014
060W-012
A
059-489
067-078
059-491
059-434059-406
060W-049
060W-052
038
043
037
040
041B
039
042
165
041A
S ORCAS ST
RA
INIE
R A
VE
S
LA
KE
WA
SH
ING
TO
N B
LVD
S
50T
H A
VE
S
S GENESEE ST
38T
H A
VE
SW
ILSO
N A
VE S
M L
KIN
G J
R W
AY
S
SE
WA
RD
PA
RK
AV
E S
S DAWSON ST
S ALASKA ST
LA
KE
PA
RK
DR
S
HU
NT
ER
BLV
D S
Genesee Overview
�� Rain Catcher Monitors
RC Monitoring Pipes
Temporary Monitoring Points
Temporary Monitoring Pipes
�� PermanentMonitoringPoints
PermanentMonitoringPoints_US_Pipes
HydroBrake
Pipe- by flow type
� Combined
Drainage
� Sanitary
CSO Basins
037
038
040
041A
041B
042
043
165
Detention/Storage
�0 1,000 2,000500
Feet
Figure 1: S. Genesee CSO Basin Study Area
(051)
Carkeek CSOPlant (046)
Alki CSOPlant
West PointTreatment
Plant
PugetSound
ElliottBay
GreenLake
LakeUnion
UnionBay
PugetSound
Lake
W
ashi
ngto
n 30th Ave
NE (049)
East Marginal (043)
Duwamish, E (035)Duwamish, W
(034)
Harbor Ave(037)
Rainier Ave (033)
E Pine St (011)
Norfolk(044)
HendersonSt/MLK WayFacility
Denny Way(027)
SW Alaska St(055)
63rd Ave(054)
53rd Ave (053)
Belvoir(012)
Matthews Park(018)
Canal St(007)
Barton St (057)HendersonSt (045)MLK Way (013)
Michigan (039)
Brandon St
WestMichigan
(042)
Terminal115 (038)
University(015)
3rd Ave W(008)
Magnolia(006)
8th Ave(040)
Murray St(056)
Hanford #2 (032)
Lander St (030)
King St(028)
Montlake(014)
11th Ave W(004)
Ballard(003)
North Beach(048)
(046)
Dexter Ave(009)
Connecticut St(029)
Chelan Ave(036) Hanford #1 (031)
Elliott W.Facility
SEATTLECITY LIMIT
SEATTLE CITY LIMIT
0 1 2 Miles
N
September 2006
King County CSO
City of Seattle CSO
CSO Treatment Plant
CSO Tunnel
Wastewater Treatment Plant
Wastewater Pipeline
The information included on this map has been compiled by King County staff from a variety of sources and is subject to change without notice. King County makes no representations or warranties, express or implied, as to accuracy, completeness, timeliness, or rights to the use of such information. This document is not intended for use as a survey product. King County shall not be liable for any general, special, indirect, incidental, or consequential damages including, but not limited to, lost revenues or lost profits resulting from the use or misuse of the information contained on this map. Any sale of this map or information on this map is prohibited except by written permission of King County.
Data Sources: Standard KC Datasets 09/06File Name: 0609CSOmapSEA.ai wgab
King County CSO Locator Map
Department of Natural Resources and Parks
Wastewater Treatment Division
Figure 2: King County CSO Outfalls

WA 1.0 - GENESEE BASIN FLOW MONITORING STUDY PAGE 15 OF 62 QUALITY ASSURANCE PROJECT PLAN
Revision: R1D0 Effective date: 8/19/2008 This is an UNCONTROLLED DOCUMENT.
45th Avenue S. and Lake Washington Boulevard. During normal flow events, sewage flows to the Charleston Street Trunk Sewer. The 72-inch-diameter overflow line connects to the outfall structure and extends into Lake Washington. An overflow at this location is assigned to both the City of Seattle and King County.
3.2.2. Logistical Problems
Logistical concerns include access and safety. The monitors are located within SPU-owned maintenance holes located on the right-of-way of either the Seattle Department of Transportation or the property of the Seattle Parks Department. No special access permissions or permits are required on property of the City of Seattle. Because many of the sites are located on the street, traffic control measures will be used for safety of field personnel while disrupting traffic to the minimum extent possible. The ADS Health and Safety Plan is included in Appendix G. Sites were visited prior to installation to verify location, pipe connectivity, access, and suitable hydraulic conditions existed.
Monitor installation and site-verifications will require maintenance hole entry. Maintenance holes and vaults are considered a confined space. Personnel will follow confined space entry protocols and permitting when entry is needed. Personnel will be unable to access the maintenance hole/vault during or following periods of precipitation or operational practices that result in highly surcharged conditions. Such situations will be rare and not expected to affect the quality of the data.
3.2.3. History
SPU has installed and maintained monitoring equipment within the Genesee Basin on the basin outfalls as well as interior within the basin. These monitors were used to provide data for previous CSO management update plans and to comply with their wastewater permit requirements.
To improve the reliability and accuracy of the monitoring data within the basin, functional data requirements were identified and standard operating practices were updated in the summer of 2007. Flow monitoring instrumentation was replaced at each of the basin’s outfall diversion structures, and are referred to as the “permanent” flow monitoring locations.
Temporary flow monitors used primarily for model calibration, hydraulic loading, and developing discharge curves for the hydrobrakes will be installed for a period of 18 months from the 2007/08 winter to spring 2009.
3.3. Parameters of Concern
Parameters of concern for rain gages include spatial density, temporal continuity of record, measurement quality, and bias. The spatial density of rain gages should be driven by the most demanding data uses. The temporal continuity of record is addressed by filling in missing or invalid data collected by a gage with the data of another near by gage. Measurement quality is reviewed and validated according to the SPU Meteorology SOP METR Q1100 - Data Validation (located in Appendix H), and is further discussed in Section 10.
Parameters of concern for CSO Flow Monitoring include flow rates, flow volumes, and water surface levels. Flow rates can be determined using a combination of measured
WA 1.0 - GENESEE BASIN FLOW MONITORING STUDY PAGE 16 OF 62 QUALITY ASSURANCE PROJECT PLAN
Revision: R1D0 Effective date: 8/19/2008 This is an UNCONTROLLED DOCUMENT.
velocity and flow area, or measured velocity and flow level and hydraulic conditions. Water surface levels can be measured directly using an ultrasonic instrument or using pressure as a proxy where free surface conditions exist.
The typical configuration of instrumentation within the S. Genesee basin includes an Area/Velocity (AV) monitor in a pipe upstream of a maintenance hole (MH). In addition, an ultrasonic sensor is used to measure flow depth over a weir. Specific configurations vary by site and are reported in Section 7.1.
During the monitoring period, site verifications will be performed to ensure the monitors are accurately measuring velocity and depth, two parameters used to calculate flow. Site gain (peak to average velocity ratio) and any depth adjustments will be evaluated throughout the monitoring period. Measurement quality is reviewed and validated according to the SPU Hydraulics SOP HYDR Q1100- Data Review, Assessment, Validation & Verification (located in Appendix H), and is further discussed in Section 10.
Parameters of concern for pump station SCADA system include instrument locations, level sensors, and availability to measure or calculate flow. Instruments should be placed at locations that provide the least amount of bias to the overall accuracy of the data. Level sensors should be positioned in a specific location within the wet-well so the cleaning and calibration will have the least impact on the instrument bias. The SPU lift stations are not equipped with flow meters. As a result, flow through the lift station will be based on wet-well levels, pump station on/off cycles and drawdown tests completed by CH2M HILL to verify lift station capacity. Data must be available in resolution sufficient to determine flow (less than 1 minute polling periods). The King County Rainier Avenue lift station is equipped with a flow monitor on the pump discharge header in 15-minute polling periods. Data from the flow monitoring and wet-well level are the parameters of concern for the Rainier Avenue lift station.
Draw down tests for the SPU pump stations were performed by CH2M HILL to verify capacity of the pump stations. This information will be compared to and used with SCADA data and flow monitoring data as a check of flow monitor and lift station performance. In the case that irreconcilable differences between the SCADA and flow monitoring data exist, flow monitoring data will be assumed to be correct. Flow balances will be performed at each lift station, and flow adjustments will be evaluated throughout the monitoring period.
3.3.1. Previous Studies
In 2007 Northwest Hydraulic Consultants, CH2M HILL, and RH 2 helped SPU develop Q1100 “Data Review, Assessment, Validation, and Verification” standard operation procedures (SOPs) for CSO monitors, rain gages, and pump stations. The SOPs present an introduction to the procedures to be used to consistently review, verify, and validate rain gage, flow monitor, stream gage, and pump performance data. These data are needed for hydrologic and hydrodynamic analyses to help SPU minimize pollution and flooding damage resulting from rainfall or snowmelt. SOPs relevant to this monitoring plan can be found in Appendix F.
In 2001 Earth Tech, Inc., released the “Sewerage System Modeling and Assessment Project – Basin Group C Model Development Report” that addressed the operation of combined sanitary sewer facilities that were modeled in the City’s CSO Plan
WA 1.0 - GENESEE BASIN FLOW MONITORING STUDY PAGE 17 OF 62 QUALITY ASSURANCE PROJECT PLAN
Revision: R1D0 Effective date: 8/19/2008 This is an UNCONTROLLED DOCUMENT.
Amendment. The report described the methodology used in the development of the computer models and the documented simulation results. The report focused on the modeling of basins 39, 40, 41, 42, 43, and 165 within the Genesee Basin. The model was calibrated from flow monitoring data collected between February 2000 to April 2000, with the exception of Basin 43, which is calibrated for the period November 7th through the 28th of 1999.
EarthTech updated the model in the summer of 2006 and tried to further calibrate the model with raw data collected from September 2004 to January 2006. An updated modeling report was provided. Additional flow data was collected at 17 locations in Genesee approximately from 2006 to 2007 and reviewed by SPU personnel for data quality and completeness. The period of record appears to contain data from Geotivity, ISCO, and ADS monitoring equipment. Using the same period of data, CH2M HILL evaluated the data to determine if data was sufficient to calibrate and verify the extended hydraulic model. As presented to SPU in August 2007, the data was determined insufficient to meet the project needs. Appendix A presents a summary of SPU and CH2M HILL reviews of the data conducted in 2007.
Since 1998, there has been permanent monitoring at the basin outfalls consisting primarily of depth measurements. This data was used to provide information on CSO frequency.
SPU has maintained a network of rain gages since 1978. One of these existing gages is located within the Genesee Basin and will be used to provide the needed precipitation data for the Genesee CSO Reduction Project.
3.3.2. Criteria and/or Standards
ADS is installing and maintaining the flow monitoring equipment used for the S. Genesee CSO Reduction Project. The monitors used are ADS FlowShark area velocity meters. Sensors using the same technology as those attached to the FlowShark flow meter were verified through the Environmental Protection Agency’s (EPA) Environmental Technology Verification (ETV) program. The significant difference between the flow meter type verified during the program and the FlowShark meter is the upgrade to digital signal processing in the FlowShark. Established in 1995 by EPA, the ETV Program develops testing protocols and verifies the performance of innovative technologies. During the verification process, the ADS equipment achieved an average of 1.2 percent accuracy in the laboratory. In the field, the same equipment tested achieved 3.8 percent accuracy. This difference is expected, and is due to the inherent monitoring difficulties encountered in field operations. Where site hydraulics are unknown, a realistic industry standard for flow monitoring accuracy is 10 percent. The difference in lab versus field results for this particular test is the result of the dissimilarity between the controlled laminar flow surface in the lab and the wavy surface in the actual field test. Such field hydraulic conditions are not uncommon. Using high-precision sensing equipment such as the ADS system minimizes potential variances resulting from field hydraulic conditions, but they are never eliminated. ADS standard quality assurance procedures (see Appendix F) result in the field data that is as accurate as possible given the limits of the site hydraulics.
Additional information regarding the certification process obtained by ADS on the monitors is available in the following link:

WA 1.0 - GENESEE BASIN FLOW MONITORING STUDY PAGE 18 OF 62 QUALITY ASSURANCE PROJECT PLAN
Revision: R1D0 Effective date: 8/19/2008 This is an UNCONTROLLED DOCUMENT.
http://www.epa.gov/etv/index.html
The procedures used by ADS to install the monitors conform to the “EPA’s Guidance Manual for Flow Monitoring and Modeling” as well as the SPU August 2007 Drainage/Wastewater (DWW) I-SCADA Field Equipment Improvements Functional Requirements and the SPU SOPs developed for the installation, operations, and maintenance of rain gages, CSO monitors, and pump stations November 2007 (not yet implemented).
Due to fast and shallow flow, a DataGator monitor will be used at MH 060W-026. Specifications for this type of monitor can be found in Appendix D, along with a cutsheet of the ADS FlowShark monitor used throughout this project.
4. PROJECT DESCRIPTION
This section includes a description of the project’s goals and objectives as well as a summary of the information that is expected to be needed and provided by this monitoring program. Lastly, this section provides a summary of practical constraints, data collection and decision-making related to this program.
4.1. Project Goals
The overall goal of the CSO Reduction Project is to develop cost-effective, environmentally sensitive alternatives SPU can implement to achieve and maintain adopted CSO level of service for the CSO system. One step towards the attainment of this goal is the development of a comprehensive flow monitoring program within the Genesee CSO basin. The primary goal of this monitoring program is to characterize the performance of the combined sewer system and existing facilities in order to support basin modeling and to verify basin performance.
Relationships between parameters within the basin model (such as average dry weather flow, dry weather flow, diurnal patterns, peak wet weather flow rates, wet weather hydrologic responses, and time of concentration ) and the resultant CSO flows will be developed based on the data collected during this program. Additionally, the relationship between pressure head and discharge will be developed for each hydrobrake using data from this program. These two series of relationships are needed to calibrate and refine the existing hydraulic models, and quantify uncertainty associated with the model. The results from this model will assist in the development of CSO reduction alternatives and ultimately in the selection of a single alternative. In the future, the updated model may be used to support other programs beyond CSO management to include planning, maintenance, coordination with King County, development review, and fluid disposals regulated by permit
4.2. Project Objectives
The objective of the flow monitoring program is to adequately and accurately characterize the performance of the combined sewer system and existing facilities before, during, and after storm events that do cause overflows as well as before, during, and after those storm events that do not cause overflows. This range includes approximately two storm events that are mild enough to not cause overflows and two medium storm events that cause some overflow (not necessarily in each of the outfalls in the basin). Although statistically unlikely, it is also beneficial for system
WA 1.0 - GENESEE BASIN FLOW MONITORING STUDY PAGE 19 OF 62 QUALITY ASSURANCE PROJECT PLAN
Revision: R1D0 Effective date: 8/19/2008 This is an UNCONTROLLED DOCUMENT.
characterization to capture two heavier storm events that cause overflow in all eight of the outfalls. These objectives relate directly to the project success factors discussed in Section 5.2.2.
The flow monitoring information will be of sufficient resolution (i.e., at enough locations) to characterize both the hydrologic response of individual monitoring sub-basins, as well as the operation and performance of significant facilities (e.g., HydroBrakes, inline and offline storage, CSO regulator structures) within the basins that comprise the Genesee CSO basin. In addition, the flow monitoring information will be used to characterize the amount of flow entering the combined sewer system (CSS) and support alternative development/evaluation, including limited storm water treatment at one storm water outfall. In terms of the basin model, the flow monitoring information will be of sufficient quality and quantity to facilitate wet weather calibration in which predicted peak flows and flow volumes are between 20% above and 15% below metered flow. These initial targets are based on team discussion, and may be revised as monitoring and modeling progresses. Any changes to these objectives or to the overall monitoring plan will be the decision of the team. As discussed in Section 4.8, the monitoring data will be evaluated with respect to these objectives during monthly monitoring meetings.
4.3. Information Requirements
Information required to accurately characterize the performance of the combined sewer system and existing facilities before, during, and after storm events via the CSO flow modeling includes the following:
� Flow monitoring data for model calibration and verification including a record of level and velocity at each of the 20 temporary and 8 permanent monitoring sites.
� Detailed data from the surrounding rain gages indicating the number of tips (each tip representing 0.01 inches of rain) per hour.
� SCADA data from the King County regional combined sewer conveyance system for instances in which their system causes backups in the SPU system.
� Detailed information regarding the operation of the pump stations receiving tributary flow from the basins. Information should include historic levels and flows.
� Sewer pipeline connectivity for model development. This will be based primarily on SPU geographical information system (GIS), but supplemented by survey and as-built information.
4.4. Target Population
The target population for this study is the hydraulic response of subcatchments and hydraulic performance of strategic structures within the S. Genesee CSO basin. These two series of elements will be characterized by combined sewer flow rates and precipitation within the basin from January to approximately June of 2008. Monitors whose purpose is to characterize the hydraulic response of subcatchments (also called
WA 1.0 - GENESEE BASIN FLOW MONITORING STUDY PAGE 20 OF 62 QUALITY ASSURANCE PROJECT PLAN
Revision: R1D0 Effective date: 8/19/2008 This is an UNCONTROLLED DOCUMENT.
“flow loading”) are used to break up the total basin into smaller areas (monitoring sub-basins), allowing for more refined model calibration and validation. The goal for each of these locations is to determine flow through a specific point. Maps of the individual site locations can be found in Appendix B as well as a schematic detailing the monitors, hydrobrakes, CSO outfalls, and related CSO storage facilities. The flow monitors are recording the instantaneous flow at 5-minute intervals, and the rain gages are recording the totalized precipitation depth to 1-minute intervals.
The second category of monitors is used to develop a more accurate stage-discharge curve for the four hydrobrakes located throughout the basin (located at MH IDs 059-490, 060W-052, 060W-047 and 059-498). Because of local pipe network conditions, the hydrobrakes are expected to experience tail-water conditions. In these cases, monitors are needed downstream of the hydrobrake. Because the monitors recommended for hydrobrake stage-discharge curve development measure flow, they also serve to assist with flow loading of the model.
Lastly, a single monitor is being used to measure flow from the stormwater basin whose outfall is adjacent to the outfall of CSO Basin 38. The purpose of this monitor is to gather general information about the performance of the stormwater system as it relates to flows that do not enter the Combined Sewer System (CSS).
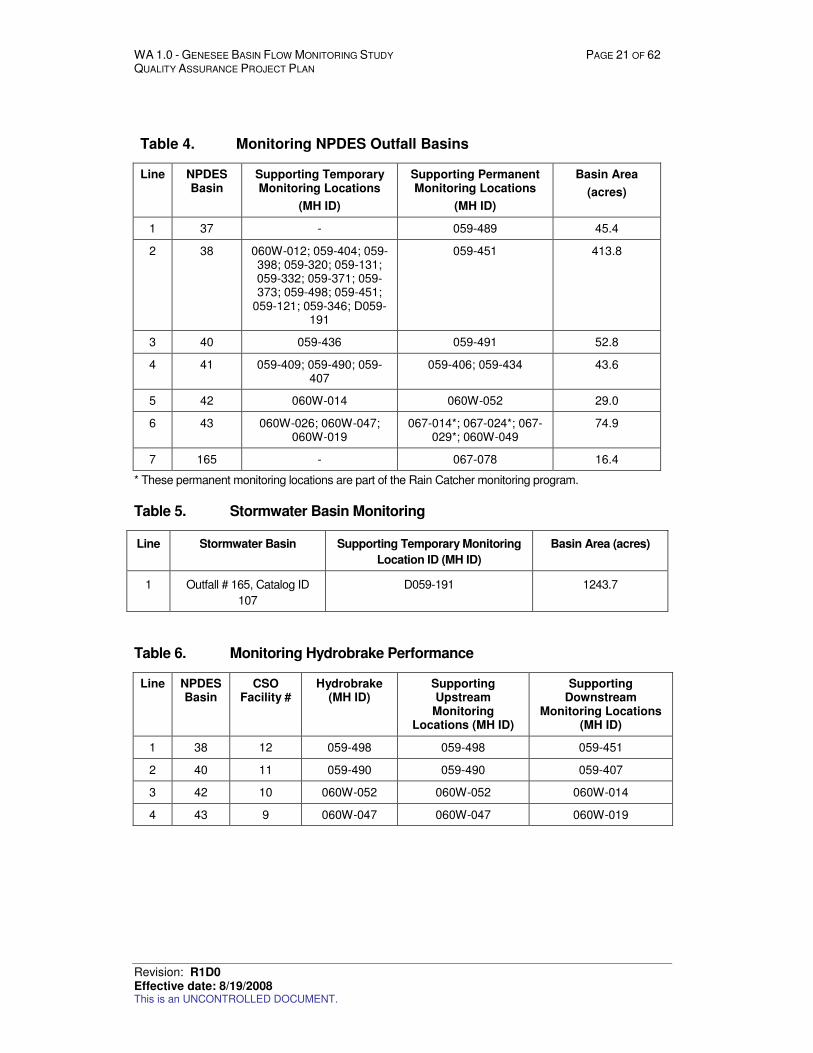
A list of the outfall basin, stormwater, hydrobrakes, and storage facilities being characterized by the data collected in this study is presented in Tables 4, 6 and 7, respectively. Eight permanent and 20 temporary flow locations are targeted specifically and are listed in Section 4.5.
4.5. Study Boundaries
The study area is the S. Genesee CSO basin, which includes NPDES CSO basins 37, 38, 40, 41, 42, 43 and 165. The S. Genesee CSO basin occupies 676 acres (1.05 square miles) in southwest Seattle. Study boundaries include 20 temporary flow monitors and 8 permanent monitors within the S. Genesee basin, as well as one rain gage. The monitoring sub-basins that are tributary to each monitoring station are all within the 676 acres comprising the study area. The selection of the temporary monitoring locations, as well as an evaluation of temporary and permanent monitoring locations, are discussed in detail in Section 7. The temporal scale of this study includes the monitoring period scheduled to last from January to June of 2008. The monitoring period may be adjusted as needed as determined by the project team.
WA 1.0 - GENESEE BASIN FLOW MONITORING STUDY PAGE 21 OF 62 QUALITY ASSURANCE PROJECT PLAN
Revision: R1D0 Effective date: 8/19/2008 This is an UNCONTROLLED DOCUMENT.
Table 4. Monitoring NPDES Outfall Basins
Line NPDES Basin
Supporting Temporary Monitoring Locations
(MH ID)
Supporting Permanent Monitoring Locations
(MH ID)
Basin Area
(acres)
1 37 - 059-489 45.4
2 38 060W-012; 059-404; 059-398; 059-320; 059-131; 059-332; 059-371; 059-373; 059-498; 059-451;
059-121; 059-346; D059-191
059-451 413.8
3 40 059-436 059-491 52.8
4 41 059-409; 059-490; 059-407
059-406; 059-434 43.6
5 42 060W-014 060W-052 29.0
6 43 060W-026; 060W-047; 060W-019
067-014*; 067-024*; 067-029*; 060W-049
74.9
7 165 - 067-078 16.4
* These permanent monitoring locations are part of the Rain Catcher monitoring program.
Table 5. Stormwater Basin Monitoring
Line Stormwater Basin Supporting Temporary Monitoring
Location ID (MH ID)
Basin Area (acres)
1 Outfall # 165, Catalog ID
107
D059-191 1243.7
Table 6. Monitoring Hydrobrake Performance
Line NPDES Basin
CSO Facility #
Hydrobrake (MH ID)
Supporting Upstream
Monitoring Locations (MH ID)
Supporting Downstream
Monitoring Locations (MH ID)
1 38 12 059-498 059-498 059-451
2 40 11 059-490 059-490 059-407
3 42 10 060W-052 060W-052 060W-014
4 43 9 060W-047 060W-047 060W-019
WA 1.0 - GENESEE BASIN FLOW MONITORING STUDY PAGE 22 OF 62 QUALITY ASSURANCE PROJECT PLAN
Revision: R1D0 Effective date: 8/19/2008 This is an UNCONTROLLED DOCUMENT.
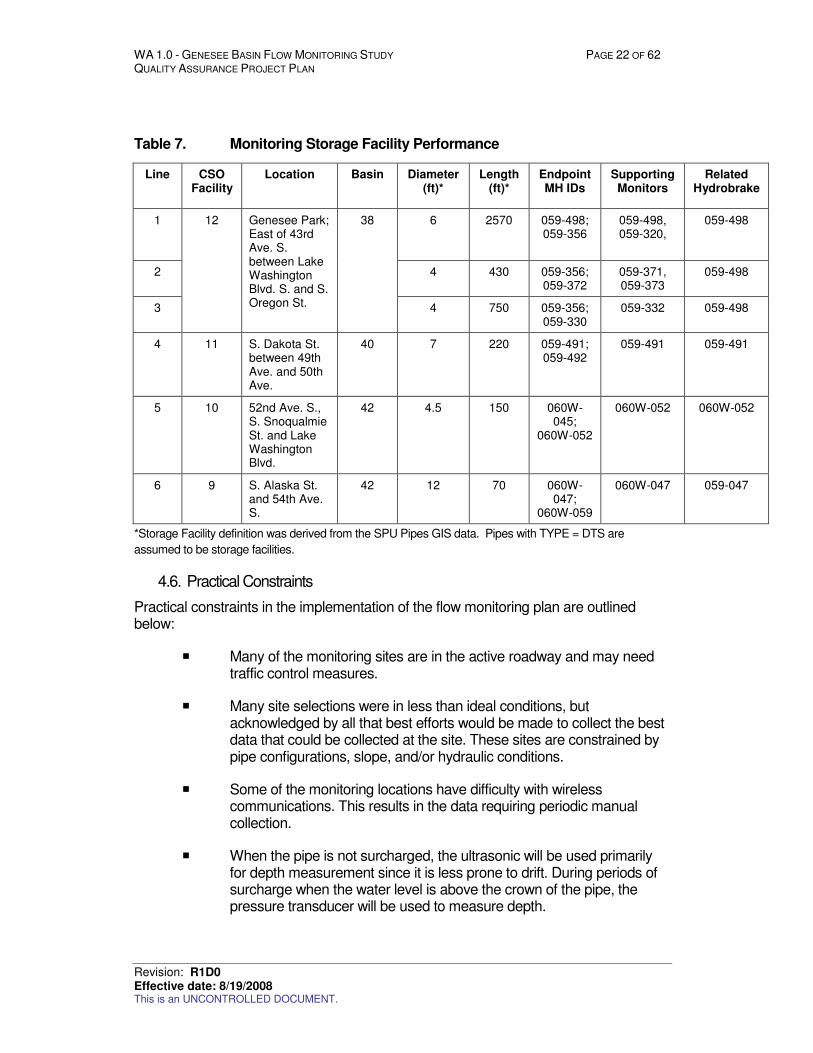
Table 7. Monitoring Storage Facility Performance
Line CSO Facility
Location Basin Diameter (ft)*
Length (ft)*
Endpoint MH IDs
Supporting Monitors
Related Hydrobrake
1 6 2570 059-498; 059-356
059-498, 059-320,
059-498
2 4 430 059-356; 059-372
059-371, 059-373
059-498
3
12 Genesee Park; East of 43rd Ave. S. between Lake Washington Blvd. S. and S. Oregon St.
38
4 750 059-356; 059-330
059-332 059-498
4 11 S. Dakota St. between 49th Ave. and 50th Ave.
40 7 220 059-491; 059-492
059-491 059-491
5 10 52nd Ave. S., S. Snoqualmie St. and Lake Washington Blvd.
42 4.5 150 060W-045;
060W-052
060W-052 060W-052
6 9 S. Alaska St. and 54th Ave. S.
42 12 70 060W-047;
060W-059
060W-047 059-047
*Storage Facility definition was derived from the SPU Pipes GIS data. Pipes with TYPE = DTS are
assumed to be storage facilities.
4.6. Practical Constraints
Practical constraints in the implementation of the flow monitoring plan are outlined below:
� Many of the monitoring sites are in the active roadway and may need traffic control measures.
� Many site selections were in less than ideal conditions, but acknowledged by all that best efforts would be made to collect the best data that could be collected at the site. These sites are constrained by pipe configurations, slope, and/or hydraulic conditions.
� Some of the monitoring locations have difficulty with wireless communications. This results in the data requiring periodic manual collection.
� When the pipe is not surcharged, the ultrasonic will be used primarily for depth measurement since it is less prone to drift. During periods of surcharge when the water level is above the crown of the pipe, the pressure transducer will be used to measure depth.

WA 1.0 - GENESEE BASIN FLOW MONITORING STUDY PAGE 23 OF 62 QUALITY ASSURANCE PROJECT PLAN
Revision: R1D0 Effective date: 8/19/2008 This is an UNCONTROLLED DOCUMENT.
� Over time the monitors may drift, particularly the pressure depth sensor. Quality control measures are in place to identify and adjust for drift to improve accuracy.
� Debris and silt build-up in the system will influence the data recorded by the monitors
� Precipitation during the monitoring event is needed in order to characterize the hydraulics with the model under varying storm events
4.7. Data Collection
Flow monitoring meters have been installed by ADS Environmental Services. The data will be automatically downloaded daily through wireless transfer. Project team members will be able to access the information through the Web-based Intelliserve the next day. Intelliserve can also interface with each monitor for alarm conditions. Continuous review by SPU and ADS personnel (each reviewing the data 2 days per week) on the Intelliserve data will ensure the availability of data. A primary result of this continuous review is to issue work orders if the quality of the data is suspect and field crews need to be mobilized to verify monitor performance. In addition, every 2 weeks CH2M HILL is also reviewing the data available on Intelliserve to verify data meets project objectives. The data on Intelliserve is regarded as raw, unadjusted data.
Within one month of data upload to Intelliserve, ADS analysts will flag suspect data and remove it from the dataset. This reviewed data (now referred to as “preliminary”) will be uploaded to the FlowView Portal, the primary repository of data for the project and also upload the data to Sliicer—the ADS web-based analysis tool CH2M HILL will use to perform additional analysis on the data. Using data from the FlowView Portal and from Sliicer, CH2M HILL will evaluate the data for quality and availability to meet the project objectives and prepare documentation for monthly meetings with SPU.
As the monitoring progresses, CH2M HILL will recommend to SPU if data is sufficient in terms of quality and availability. Upon completion of the temporary flow monitoring period, ADS will perform final adjustments to the data and supplement missing data as available (e.g., using a fitted mannings depth curve for a flowrate if velocity sensor fails). Final data will be provided to the project team in an Excel format.
4.8. Decision-making
Continuously during the project, team members will be evaluating the monitoring data both in terms of quality and whether data being collected supports the objectives of the project. These evaluations and decisions will occur at regular intervals, but the monthly review meetings will be the primary mechanism for discussions and decisions from the project team. Expected issues to be discussed include relocating monitors and issuing work orders to verify hydraulics at suspect sites or to perform maintenance of the monitor or rain gage. Procedures for field response on data anomalies are addressed in the ADS QA and Implementation Plan in Appendix F and the SOPs in Appendix H.
Decisions regarding monitor relocations will be made by the project team, authorized by SPU, and communicated by SPU to ADS and CH2M HILL. For the flow monitors, consistency with previous readings will impact when field crews are mobilized to verify the depth and velocity measurements. If flow is laminar with low variability in depth, a

WA 1.0 - GENESEE BASIN FLOW MONITORING STUDY PAGE 24 OF 62 QUALITY ASSURANCE PROJECT PLAN
Revision: R1D0 Effective date: 8/19/2008 This is an UNCONTROLLED DOCUMENT.
bias of 0.25 inches will most likely be considered acceptable for depth and a bias of 20% considered acceptable in the velocity. If the site exhibits a greater variation in velocity or depth (for example, those sites impacted by lift stations), the threshold for mobilizing field personnel may be increased. Depth-velocity scattergraphs will be used to determine if field verification is needed.
Any decisions regarding the quality and need to adjust monitoring duration or new locations will be made jointly among project team members.
5. ORGANIZATION AND SCHEDULE
The purpose of this section is to describe the roles and responsibilities of the project team, the project timeline and schedule, and the project documentation requirements.
5.1. Roles and Responsibilities
In general, ADS Environmental is responsible for installing and maintaining the flow monitors, as well as performing initial data review. CH2M HILL is responsible for determining if the final data is sufficient (both in accuracy and in availability) to meet the project objectives. These and other roles are described in greater detail in Table 8.
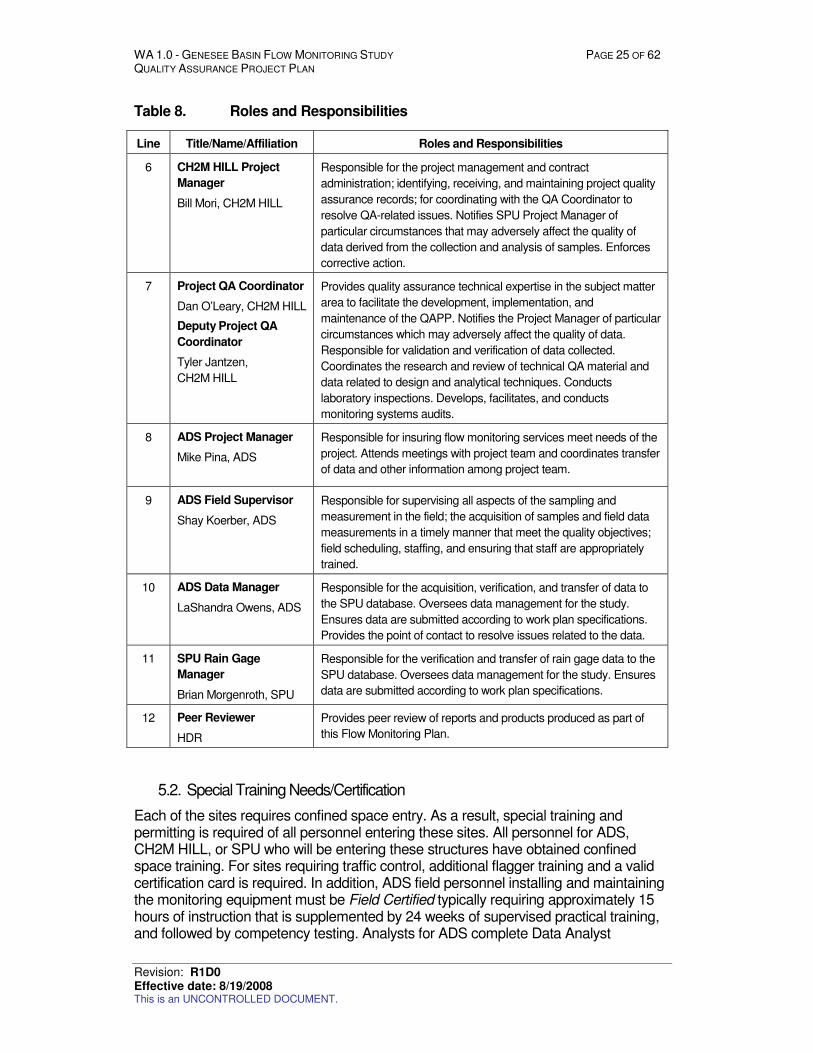
Table 8. Roles and Responsibilities
Line Title/Name/Affiliation Roles and Responsibilities
1 SPU Quality Assurance
Facilitator
Vacant, SPU
Responsible for management and oversight of the SPU Quality
Management System Program. Oversees the development of QA
guidance for the QMS program. Monitors the effectiveness of the
program quality system. Reviews and approves all QAPPs, internal
QA audits, corrective actions, reports, work plans, and contracts.
Enforces corrective action, as required. Ensures SPU personnel are
fully trained and adequately staffed.
2 SPU CIP Project
Manager
Ed Mirabella, SPU
Deputy CIP Project
Manager
Kathy Robertson, Pickets
Engineering, LLC
Responsible for ensuring tasks and other requirements in the
contract are executed on time and are of acceptable quality.
Monitors and assesses the quality of work. Coordinates attendance
at conference calls, training, meetings, and related project activities.
Enforces corrective action requirements.
3 SPU Study Project
Manager
Ben Marré, SPU
Responsible for verifying the Flow Monitoring Plan is followed and
the project is producing data of known and acceptable quality.
Ensures adequate training and supervision of all monitoring and
data collection activities.
4 Data Manager
Mike Hinson, SPU
Deputy Data Manager
Laura Reed, SPU
Responsible for the acquisition, verification, and transfer of data to
the SPU database. Oversees data management for the study.
Ensures data are submitted according to work plan specifications.
Provides the point of contact to resolve issues related to the data.
5 Regulatory CSO
NPDES Reporting
Hai Bach, SPU
Responsible for preparing and submitting CSO reporting for NPDES
permit compliance.
WA 1.0 - GENESEE BASIN FLOW MONITORING STUDY PAGE 25 OF 62 QUALITY ASSURANCE PROJECT PLAN
Revision: R1D0 Effective date: 8/19/2008 This is an UNCONTROLLED DOCUMENT.
Table 8. Roles and Responsibilities
Line Title/Name/Affiliation Roles and Responsibilities
6 CH2M HILL Project
Manager
Bill Mori, CH2M HILL
Responsible for the project management and contract
administration; identifying, receiving, and maintaining project quality
assurance records; for coordinating with the QA Coordinator to
resolve QA-related issues. Notifies SPU Project Manager of
particular circumstances that may adversely affect the quality of
data derived from the collection and analysis of samples. Enforces
corrective action.
7 Project QA Coordinator
Dan O’Leary, CH2M HILL
Deputy Project QA
Coordinator
Tyler Jantzen,
CH2M HILL
Provides quality assurance technical expertise in the subject matter
area to facilitate the development, implementation, and
maintenance of the QAPP. Notifies the Project Manager of particular
circumstances which may adversely affect the quality of data.
Responsible for validation and verification of data collected.
Coordinates the research and review of technical QA material and
data related to design and analytical techniques. Conducts
laboratory inspections. Develops, facilitates, and conducts
monitoring systems audits.
8 ADS Project Manager
Mike Pina, ADS
Responsible for insuring flow monitoring services meet needs of the
project. Attends meetings with project team and coordinates transfer
of data and other information among project team.
9 ADS Field Supervisor
Shay Koerber, ADS
Responsible for supervising all aspects of the sampling and
measurement in the field; the acquisition of samples and field data
measurements in a timely manner that meet the quality objectives;
field scheduling, staffing, and ensuring that staff are appropriately
trained.
10 ADS Data Manager
LaShandra Owens, ADS
Responsible for the acquisition, verification, and transfer of data to
the SPU database. Oversees data management for the study.
Ensures data are submitted according to work plan specifications.
Provides the point of contact to resolve issues related to the data.
11 SPU Rain Gage
Manager
Brian Morgenroth, SPU
Responsible for the verification and transfer of rain gage data to the
SPU database. Oversees data management for the study. Ensures
data are submitted according to work plan specifications.
12 Peer Reviewer
HDR
Provides peer review of reports and products produced as part of
this Flow Monitoring Plan.
5.2. Special Training Needs/Certification
Each of the sites requires confined space entry. As a result, special training and permitting is required of all personnel entering these sites. All personnel for ADS, CH2M HILL, or SPU who will be entering these structures have obtained confined space training. For sites requiring traffic control, additional flagger training and a valid certification card is required. In addition, ADS field personnel installing and maintaining the monitoring equipment must be Field Certified typically requiring approximately 15 hours of instruction that is supplemented by 24 weeks of supervised practical training, and followed by competency testing. Analysts for ADS complete Data Analyst
WA 1.0 - GENESEE BASIN FLOW MONITORING STUDY PAGE 26 OF 62 QUALITY ASSURANCE PROJECT PLAN
Revision: R1D0 Effective date: 8/19/2008 This is an UNCONTROLLED DOCUMENT.
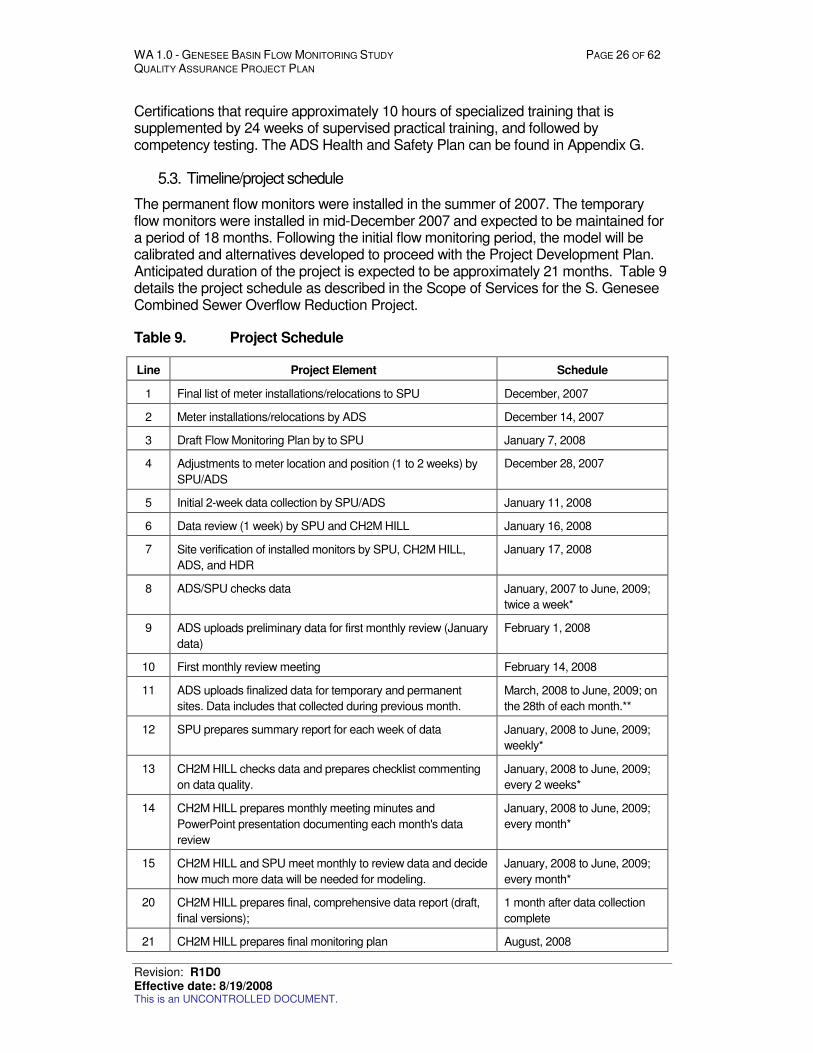
Certifications that require approximately 10 hours of specialized training that is supplemented by 24 weeks of supervised practical training, and followed by competency testing. The ADS Health and Safety Plan can be found in Appendix G.
5.3. Timeline/project schedule
The permanent flow monitors were installed in the summer of 2007. The temporary flow monitors were installed in mid-December 2007 and expected to be maintained for a period of 18 months. Following the initial flow monitoring period, the model will be calibrated and alternatives developed to proceed with the Project Development Plan. Anticipated duration of the project is expected to be approximately 21 months. Table 9 details the project schedule as described in the Scope of Services for the S. Genesee Combined Sewer Overflow Reduction Project.
Table 9. Project Schedule
Line Project Element Schedule
1 Final list of meter installations/relocations to SPU December, 2007
2 Meter installations/relocations by ADS December 14, 2007
3 Draft Flow Monitoring Plan by to SPU January 7, 2008
4 Adjustments to meter location and position (1 to 2 weeks) by
SPU/ADS
December 28, 2007
5 Initial 2-week data collection by SPU/ADS January 11, 2008
6 Data review (1 week) by SPU and CH2M HILL January 16, 2008
7 Site verification of installed monitors by SPU, CH2M HILL,
ADS, and HDR
January 17, 2008
8 ADS/SPU checks data January, 2007 to June, 2009;
twice a week*
9 ADS uploads preliminary data for first monthly review (January
data)
February 1, 2008
10 First monthly review meeting February 14, 2008
11 ADS uploads finalized data for temporary and permanent
sites. Data includes that collected during previous month.
March, 2008 to June, 2009; on
the 28th of each month.**
12 SPU prepares summary report for each week of data January, 2008 to June, 2009;
weekly*
13 CH2M HILL checks data and prepares checklist commenting
on data quality.
January, 2008 to June, 2009;
every 2 weeks*
14 CH2M HILL prepares monthly meeting minutes and
PowerPoint presentation documenting each month's data
review
January, 2008 to June, 2009;
every month*
15 CH2M HILL and SPU meet monthly to review data and decide
how much more data will be needed for modeling.
January, 2008 to June, 2009;
every month*
20 CH2M HILL prepares final, comprehensive data report (draft,
final versions);
1 month after data collection
complete
21 CH2M HILL prepares final monitoring plan August, 2008

WA 1.0 - GENESEE BASIN FLOW MONITORING STUDY PAGE 27 OF 63 QUALITY ASSURANCE PROJECT PLAN
Revision: R0D3(DRAFT) Draft revised on: 8/19/2008 This is an UNCONTROLLED DOCUMENT.
* Regular data review may be decreased following the first 6 months of data collection if warranted by
overall high data quality or periods of decreased precipitation, and agreed to by project team
**During the first 6 months of data collection, monthly data submittals will include preliminary data to be
finalized after the first 6 months of monitoring.
5.3.1. Project Deliverables
Project deliverables for Genesee CSO Flow Monitoring are listed in Table 10. Additional task assumptions such as outline and draft report submittals, intermediate data review and communications expectations can be found under Task 2 of the Scope of Services for the S. Genesee Combined Sewer Overflow Reduction Project.
Table 10. Project Deliverables and Schedule
Line Project Deliverable (Responsible Party) Schedule
1 List of meter installation recommendations (CH2M HILL ) December, 2007
2 Data summary report (SPU) Weekly during monitoring (approximately
January 2007 to June 2009)*
3 Data quality checklist (CH2M HILL) Every 2 weeks during monitoring*
4 Finalized data report (ADS)** On the 28th of the month after each month
of monitoring
5 PowerPoint presentation documenting data review
(CH2M HILL)
Monthly during monitoring
6 Meeting minutes summarizing data review (CH2M HILL) Monthly during monitoring
7 Flow Monitoring Plan (CH2M HILL) (January 23, 2007; Draft) August, 2008;
Final
8 Review of Flow and Rainfall Monitoring Data - Technical
Report (CH2M HILL)
1 month after data collection completed;
Final
* Regular data review may be decreased following the first 6 months of data collection if warranted by
overall high data quality or periods of decreased precipitation, and agreed to by project team
**During the first 6 months of data collection, monthly data submittals will include preliminary data, to be
finalized after the first 6 months of monitoring.
5.3.2. Project Success Factors
The critical success factor is to obtain sufficient quantity of acceptable data in order to calibrate the hydraulic model. As defined in the Project Objectives in Section 4.2, this includes quality data from two storms in both of the following categories:
� Smaller storms that do not cause overflows in any of the CSO overflow basin outfalls
� Medium storms that cause some, but not all of basin outfalls to overflow
While not a critical success factor, hydraulic model calibration will also benefit significantly from data from large storms. Thus, data from two storms in the following category is included as an optimal modeling factor:
� Large storms that cause all of the basin outfalls to overflow

WA 1.0 - GENESEE BASIN FLOW MONITORING STUDY PAGE 28 OF 62 QUALITY ASSURANCE PROJECT PLAN
Revision: R1D0 Effective date: 8/19/2008 This is an UNCONTROLLED DOCUMENT.
Per the Functional Requirements Report, the raw data quality for the flow monitors should be 95 percent valid and available over a time period of one month. Reviewing and supplementing depth data with manually measured site data may improve the data availability to 97 percent. Of quality data captured from the six storm events listed above, a selection of at least three storm events is required to calibrate the model. As discussed in Section 4.8, monitoring data will be evaluated with respect to project objectives and success factors during monthly monitoring data review meetings.
5.4. Document and Records
The purpose of this section is to describe the information to be included in data reports and to identify all project records and documents that will be produced. In addition, this section describes the requirements for final disposition of records and documents, including location and length of retention period.
5.4.1. Data Reports
SPU will prepare a summary report for each week of data. These weekly reports will include the data itself (time series of velocity, level, and flow data for each monitor), as well as a description of any issues and maintenance related to meter operation and data quality. CH2M HILL will review the data presented in these reports as well as Intelliserve and will complete a checklist evaluating data quality every 2 weeks.
Monthly data reports will be prepared by ADS 2 weeks after the end of each month of monitoring. The first and second cycles will vary slightly, with the first report covering only the first 2 weeks of data collection and the second report covering the subsequent 6 weeks of data collection.
5.4.2. Electronic Data
As described in Section 4.7, Data Collection, the data available in Intelliserve will be the repository of raw unadjusted data from the monitors. After scrubbing and flagging suspect data, the data is regarded as “preliminary” and accessible through the Web-based FlowView Portal, a data viewer, and in Sliicer, a data analysis tool. At conclusion of the monitoring period, data will be regarded as “final” after data substitution and adjustment. ADS will provide the final data in Excel format. The finalized data supporting electronic documents will be stored on SPU’s internal network.
Data security is maintained by allowing read-only permission through user login access. Individual user access is authorized by SPU and communicated by ADS.
In addition, any changes to the data are tracked internally by ADS and reports of the flagged data available through FlowView Portal.
5.4.3. Records and Documents Retention Requirements
Field maintenance reports, analyst notes, and at the conclusion of the project spreadsheets containing the monitoring and precipitation data will be compiled for the team. Data will be saved to SPU’s internal network and a database backup to be retained by ADS will be available for a period of 7 years.

WA 1.0 - GENESEE BASIN FLOW MONITORING STUDY PAGE 29 OF 62 QUALITY ASSURANCE PROJECT PLAN
Revision: R1D0 Effective date: 8/19/2008 This is an UNCONTROLLED DOCUMENT.
5.4.4. Revisions to the Flow Monitoring Plan
Until the work described is completed, this Flow Monitoring Plan shall be revised and reissued within 120 days of significant changes, whichever is sooner. The approved version of the QAPP shall remain in effect until revised versions have been approved.
5.4.5. Expedited Changes
Expedited Changes to the QAPP should be approved before implementation to reflect changes in project organization, tasks, schedules, objectives, and methods, address deficiencies and non-conformance, improve operational efficiency, and accommodate unique or unanticipated circumstances. Requests for expedited changes are directed from the Project Manager to the CIP Project Manager in writing. The changes are effective immediately upon approval by the CIP Project Manager and Quality Assurance Coordinator, or their designees, and any regulatory authority if needed.
Justifications, summaries, and details of expedited changes to the QAPP will be documented and distributed to all persons on the QAPP distribution list by the Project Manager. Expedited changes will be reviewed, approved, and incorporated into a revised QAPP during the annual revision process or within 120 days of the initial approval in cases of significant changes.
6. QUALITY OBJECTIVES
The principal indicators of data quality are its Bias and Precision, which when combined express its accuracy. This section addresses these components as well Representativeness, Completeness, Comparability, and Sensitivity. Data quality review is discussed further in Section 10 of this report. Functional requirements in relation to quality objectives are discussed in greater detail in Drainage/Wastewater (DWW) I-SCADA Field Equipment Improvements Functional Requirements, a report prepared for SPU.
6.1. Measurement Quality Objectives
Measurement quality objectives (MQOs) specify how relevant the data must be in order to meet the objectives of this monitoring plan. MQOs are the performance or acceptance thresholds or goals for the project’s data, based primarily on the data quality indicators precision, bias, and sensitivity as outlined below.
6.1.1. Precision
Precision is a statistical measure of the variability of a measurement when a collection or an analysis is repeated and includes components of random error. It is strictly defined as the degree of mutual agreement among independent measurements as the result of repeated application of the same process under similar conditions. Or expressed another way, precision is a measure of the closeness with which multiple readings of a given sample agree with each other.
For this flow monitoring program, velocity and depth scattergraphs will be reviewed to evaluate the precision of the data set. However, because the physical entities being measured (depth and velocity) change with each sample point taken, the data set as a whole must be viewed for relative precision, rather than the preciseness of each point to another. While the meter and sensor technology is highly repeatable (see equipment
WA 1.0 - GENESEE BASIN FLOW MONITORING STUDY PAGE 30 OF 62 QUALITY ASSURANCE PROJECT PLAN
Revision: R1D0 Effective date: 8/19/2008 This is an UNCONTROLLED DOCUMENT.
specification sheets in Appendix D), data collected from flow metering sites indicates varying relationships between depth and velocity (the relationship referred to as the hydraulic signature). The hydraulic signature is expected to stay fairly constant during a period of dry weather. However, debris in the system and the transitioning presence of silt are just some of the factors that result in this signature changing. Such changes in data signature will be a key focus of the bi-weekly and monthly data reviews discussed in Section 10. Sites that show patterns inconsistent or invalid shifts (a data set on a scattergraph that moves vertically or horizontally usually indicates a fault with either the depth or velocity sensing device), or reveal no determinate hydraulic signature will be reviewed by the project team and recommendations made for improvement (e.g., modification of O&M procedures, relocation, or removal).
6.1.2. Bias
Bias is a statistical measurement of correctness and includes multiple components of systematic error. A measurement is considered unbiased when the value reported does not differ from the true value. Bias is revealed in flow metering data sets by conducting field verifications. On the depth side, this is a comparison of a manual reading taken with a ruler in the flow against the meter depth reading. On the velocity side, this is a comparison of a manual velocity taken with a handheld velocity meter against the meter peak velocity reading. As part of the standard ADS data analysis procedure, bias adjustments may be applied to the data set upon additional verification and shall be noted in the site commentaries. As a rule of thumb, if the confirmations indicate a bias of less than +/- 0.25” or a +/- less than the +/_ given by the field crew onsite (for example, a site where the flow surface has standing waves may be given a manual measurement confidence of +/- 0.5 0” by the field crew taking the manual reading), then a depth adjustment will not be made to the meter data. If an adjustment is to be made, first an attempt is made to determine if any of the following measurements contribute to that bias – pip height, offset of ultrasonic sensor to crown of pipe, offset of the pressure sensor. As a rule of thumb, the handheld peak velocity measurement should be within 20% of the meter reading. Adjustments for velocity are affected through the gain value, which is discussed further in Section 10. Discussion of any site confirmations and reviews of bias are included as part of the monthly review process, also discussed in Section 10.
For rain gages, wind is generally the largest source of bias resulting in a volumetric loss of between 2 to 10 percent of the actual rain fall. Rain gage site verifications will be performed to ensure the gages are accurately recording depth.
6.1.3. Representativeness
Representativeness is ensured by a well-defined sampling strategy designed to collect measurements that represent the average properties of the site. This is ensured by collecting a sufficient number of samples to characterize the site or collecting measurements that appropriately define the site characteristics. Means of collection and standard methods used to collect flow measurements are defined in the body of this document. It should be remembered that representative data are defined by the method of collection and the manner in which the method is implemented. Therefore, collecting representative data is dependent upon individual or site-specific facts, including the instrument of choice for measuring a particular flow, survey methods used

WA 1.0 - GENESEE BASIN FLOW MONITORING STUDY PAGE 31 OF 62 QUALITY ASSURANCE PROJECT PLAN
Revision: R1D0 Effective date: 8/19/2008 This is an UNCONTROLLED DOCUMENT.
for instrument placement, determining whether flow is turbulent or laminar, and placement of the sensors in the site.
The duration of this study is approximately 540 days and encompasses both the traditional wet and dry periods of weather in the Pacific Northwest. It is anticipated that the length of the data set over this period of time will be representative of the hydraulic characteristics of each site and include the effects of high groundwater in the antecedent soils. Classification of storm events with respect to historical frequency is included as part of the monthly data reviews discussed in Chapter 10.
6.1.4. Completeness
Raw Data Completeness Test 1, as defined for this project, addresses the question, “Are communications to and from the field instrument functional?” This defines the total number of missing measurements the utility is willing to accept over a defined period as a result of equipment malfunction. This project established a 95 percent target value. Missing measurements means the raw data does not exist. This is calculated as:
Raw Data Completeness Test 1= 100 * (Total Number of Collected Points) ÷ (Total Number of Possible Data Points)
Furthermore, Raw Data Completeness Test 2 as defined for this project addresses the question, “Is the raw data hydraulically valid?”
This test defines the total number of non-valid measurements the utility is willing to accept over a defined period as a result of site hydraulics. This project established a 95 percent target value. Exceptions to this might include monitors that are knowingly installed in turbulent sites, where data are needed even if the quality is below this standard (see Section 6.1.1). A valid data point in this instance is defined as a point that has passed a gross error check and a range check.
Raw Data Completeness Test 2 = (Number of Valid Data Points) ÷ (Total Number of Possible Data Points)
Final or QA/QC’d data completeness shall be defined as complete if 95 percent of available data is determined hydraulically valid. This is calculated as:
Final Data Completeness = (Number of Valid Data Points) ÷ (Total Number of Possible Data Points)
Data completeness is evaluated in the bi-weekly and monthly data reviews, discussed further in Section 10.
6.1.5. Comparability
Comparability is generally achieved by the use of standard methods. This makes collected data comparable to other sites or projects that have similarly defined situations. Standardizing methods for the collection of flow data is one of the objectives of this document. Confidence in the comparability of data sets for this project is based on the commitment of project staff to use only approved sampling and analysis methods and QA/QC protocols in accordance with quality system requirements and as described in this Flow Monitoring Plan and in the associated SOPs. ADS is an ISO
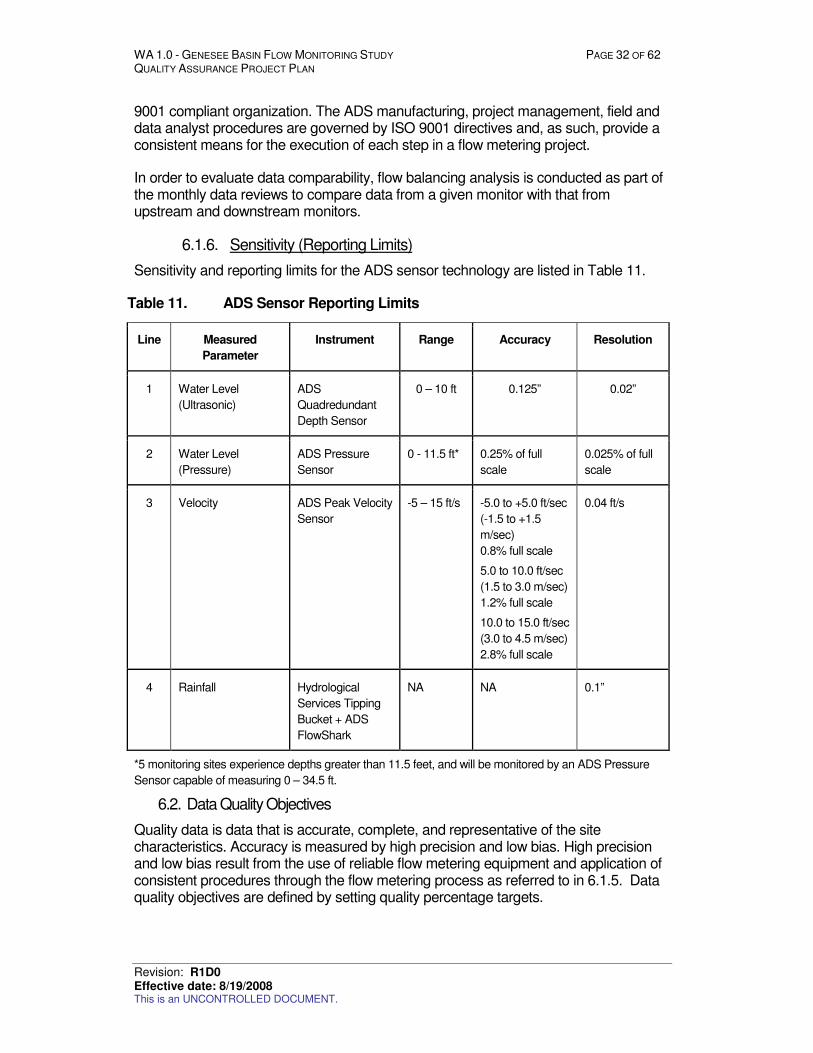
WA 1.0 - GENESEE BASIN FLOW MONITORING STUDY PAGE 32 OF 62 QUALITY ASSURANCE PROJECT PLAN
Revision: R1D0 Effective date: 8/19/2008 This is an UNCONTROLLED DOCUMENT.
9001 compliant organization. The ADS manufacturing, project management, field and data analyst procedures are governed by ISO 9001 directives and, as such, provide a consistent means for the execution of each step in a flow metering project.
In order to evaluate data comparability, flow balancing analysis is conducted as part of the monthly data reviews to compare data from a given monitor with that from upstream and downstream monitors.
6.1.6. Sensitivity (Reporting Limits)
Sensitivity and reporting limits for the ADS sensor technology are listed in Table 11.
Table 11. ADS Sensor Reporting Limits
Line Measured
Parameter
Instrument Range Accuracy Resolution
1 Water Level
(Ultrasonic)
ADS
Quadredundant
Depth Sensor
0 – 10 ft 0.125” 0.02”
2 Water Level
(Pressure)
ADS Pressure
Sensor
0 - 11.5 ft* 0.25% of full
scale
0.025% of full
scale
3 Velocity ADS Peak Velocity
Sensor
-5 – 15 ft/s -5.0 to +5.0 ft/sec
(-1.5 to +1.5
m/sec)
0.8% full scale
5.0 to 10.0 ft/sec
(1.5 to 3.0 m/sec)
1.2% full scale
10.0 to 15.0 ft/sec
(3.0 to 4.5 m/sec)
2.8% full scale
0.04 ft/s
4 Rainfall Hydrological
Services Tipping
Bucket + ADS
FlowShark
NA NA 0.1”
*5 monitoring sites experience depths greater than 11.5 feet, and will be monitored by an ADS Pressure
Sensor capable of measuring 0 – 34.5 ft.
6.2. Data Quality Objectives
Quality data is data that is accurate, complete, and representative of the site characteristics. Accuracy is measured by high precision and low bias. High precision and low bias result from the use of reliable flow metering equipment and application of consistent procedures through the flow metering process as referred to in 6.1.5. Data quality objectives are defined by setting quality percentage targets.
WA 1.0 - GENESEE BASIN FLOW MONITORING STUDY PAGE 33 OF 62 QUALITY ASSURANCE PROJECT PLAN
Revision: R1D0 Effective date: 8/19/2008 This is an UNCONTROLLED DOCUMENT.
6.2.1. Raw Data Quality
Percentage raw data quality is defined as the total number of measurements that pass gross error checks and range checks. The Field Equipment Improvements Functional Requirements report established a 95 percent target value for raw data quality as defined by the equation below:
Percentage Raw Data Quality = 100 * (Total Number of Valid Data Points) ÷ (Total Number of Collected Data Points)
A valid data point is defined as a point that has passed a gross error check and a range check.
6.2.2. Data Quality
As defined by the Field Equipment Improvements Functional Requirements, the data set for the flow monitors should have a data quality of 95 percent over a time period of 1 month. Exceptions to this might include monitors that are knowingly installed in turbulent sites, where data availability is essential even if the quality is below this standard.
Data quality is a percentage measure of the amount of valid raw data obtained from the measurement system. Data quality can be calculated using this equation:
Data Quality = (Number of Valid Data Points) ÷ (Total Number of Possible Data Points)
A valid data point is defined as a point that has passed a gross error check and a range check.
6.2.3. QA/QC Data Quality
QA/QC data quality further improves raw data quality and seeks to weed out spurious data. The Field Equipment Improvements Functional Requirements established a target level of 97 percent for QA/QC data quality (based total number of possible data points), which represents the ability of the flow monitoring contractor to find and correct spurious data (2 percent) that can be snapped to the valid locations within the data set.
QA/QC Data Quality = 100 * (Total Number of QC Valid Data Points) ÷ (Total Number of Collected Data Points)
7. SAMPLING PROCESS DESIGN (EXPERIMENTAL DESIGN)
The purpose of this section is to provide a description and justification for the experimental design strategy. This includes a discussion of the sample size as represented by the number of monitors and the duration of monitoring. It also includes contingency plans should monitoring sites become inoperable or be determined of insufficient quality. The data to be collected in order to meet the project objectives described in Section 4.2 will be gathered from a combination of the following categories of monitoring locations:
� Permanent monitors that were existing prior to this study
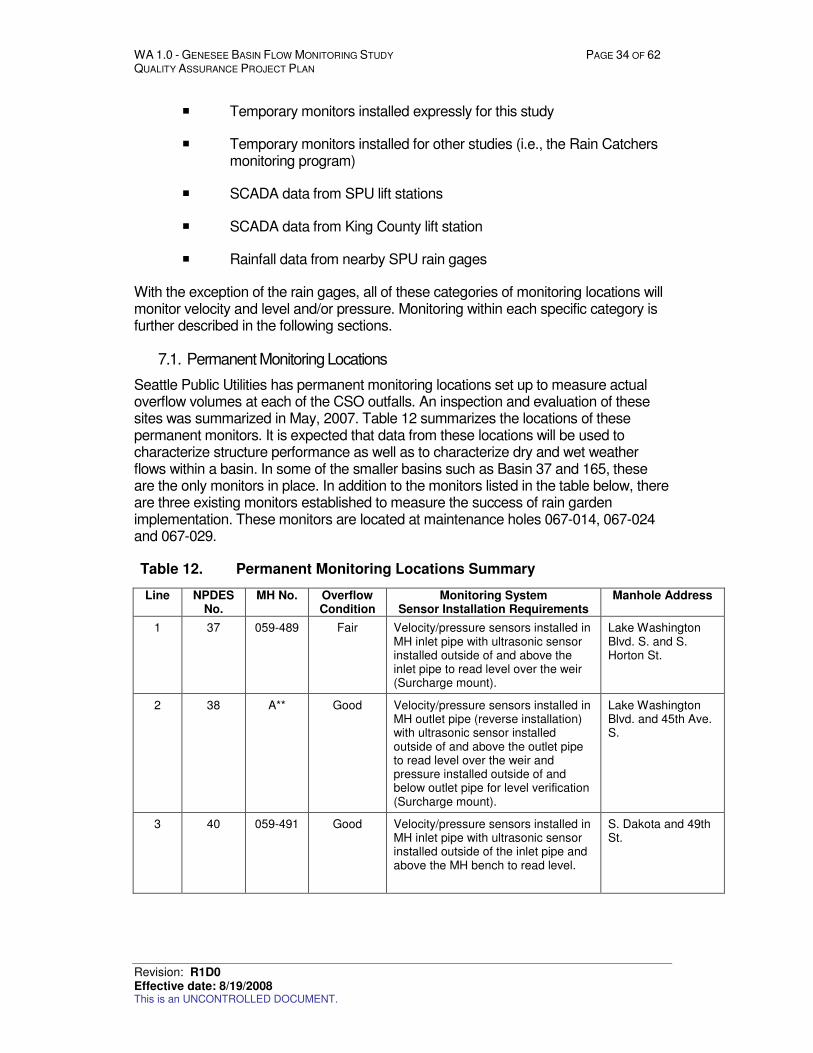
WA 1.0 - GENESEE BASIN FLOW MONITORING STUDY PAGE 34 OF 62 QUALITY ASSURANCE PROJECT PLAN
Revision: R1D0 Effective date: 8/19/2008 This is an UNCONTROLLED DOCUMENT.
� Temporary monitors installed expressly for this study
� Temporary monitors installed for other studies (i.e., the Rain Catchers monitoring program)
� SCADA data from SPU lift stations
� SCADA data from King County lift station
� Rainfall data from nearby SPU rain gages
With the exception of the rain gages, all of these categories of monitoring locations will monitor velocity and level and/or pressure. Monitoring within each specific category is further described in the following sections.
7.1. Permanent Monitoring Locations
Seattle Public Utilities has permanent monitoring locations set up to measure actual overflow volumes at each of the CSO outfalls. An inspection and evaluation of these sites was summarized in May, 2007. Table 12 summarizes the locations of these permanent monitors. It is expected that data from these locations will be used to characterize structure performance as well as to characterize dry and wet weather flows within a basin. In some of the smaller basins such as Basin 37 and 165, these are the only monitors in place. In addition to the monitors listed in the table below, there are three existing monitors established to measure the success of rain garden implementation. These monitors are located at maintenance holes 067-014, 067-024 and 067-029.
Table 12. Permanent Monitoring Locations Summary
Line NPDES No.
MH No. Overflow Condition
Monitoring System Sensor Installation Requirements
Manhole Address
1 37 059-489 Fair Velocity/pressure sensors installed in MH inlet pipe with ultrasonic sensor installed outside of and above the inlet pipe to read level over the weir (Surcharge mount).
Lake Washington Blvd. S. and S. Horton St.
2 38 A** Good Velocity/pressure sensors installed in MH outlet pipe (reverse installation) with ultrasonic sensor installed outside of and above the outlet pipe to read level over the weir and pressure installed outside of and below outlet pipe for level verification (Surcharge mount).
Lake Washington Blvd. and 45th Ave. S.
3 40 059-491 Good Velocity/pressure sensors installed in MH inlet pipe with ultrasonic sensor installed outside of the inlet pipe and above the MH bench to read level.
S. Dakota and 49th St.
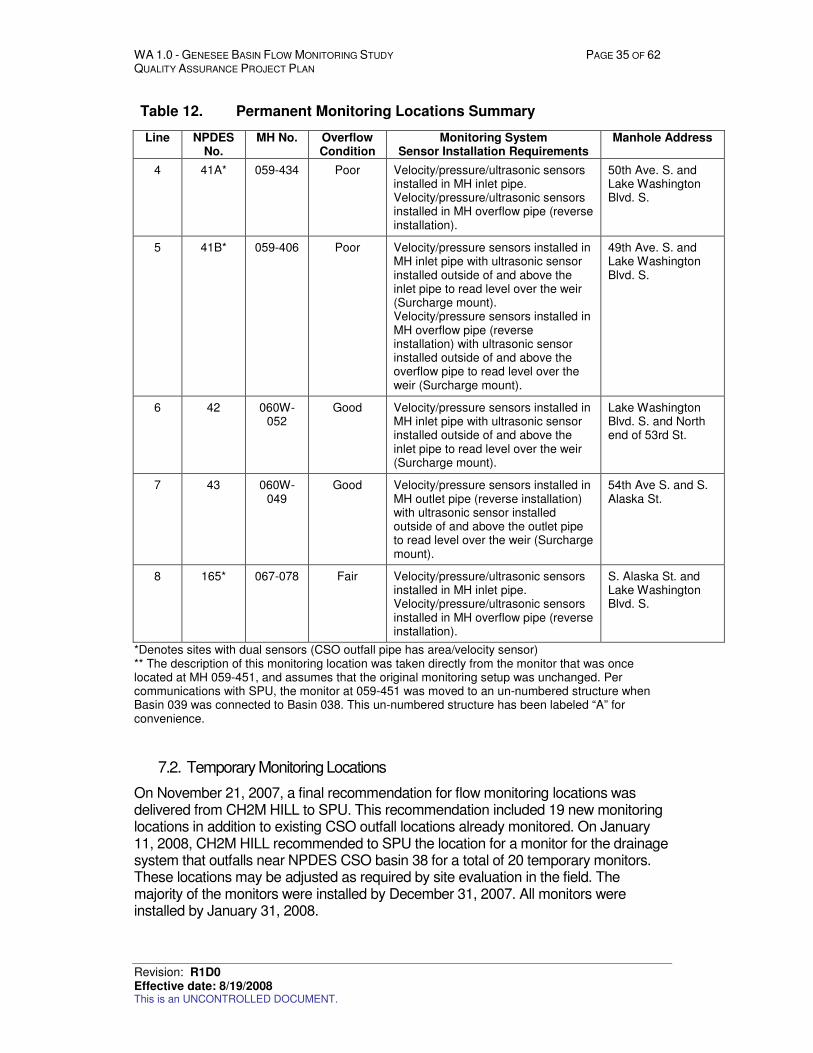
WA 1.0 - GENESEE BASIN FLOW MONITORING STUDY PAGE 35 OF 62 QUALITY ASSURANCE PROJECT PLAN
Revision: R1D0 Effective date: 8/19/2008 This is an UNCONTROLLED DOCUMENT.
Table 12. Permanent Monitoring Locations Summary
Line NPDES No.
MH No. Overflow Condition
Monitoring System Sensor Installation Requirements
Manhole Address
4 41A* 059-434 Poor Velocity/pressure/ultrasonic sensors installed in MH inlet pipe. Velocity/pressure/ultrasonic sensors installed in MH overflow pipe (reverse installation).
50th Ave. S. and Lake Washington Blvd. S.
5 41B* 059-406 Poor Velocity/pressure sensors installed in MH inlet pipe with ultrasonic sensor installed outside of and above the inlet pipe to read level over the weir (Surcharge mount). Velocity/pressure sensors installed in MH overflow pipe (reverse installation) with ultrasonic sensor installed outside of and above the overflow pipe to read level over the weir (Surcharge mount).
49th Ave. S. and Lake Washington Blvd. S.
6 42 060W-052
Good Velocity/pressure sensors installed in MH inlet pipe with ultrasonic sensor installed outside of and above the inlet pipe to read level over the weir (Surcharge mount).
Lake Washington Blvd. S. and North end of 53rd St.
7 43 060W-049
Good Velocity/pressure sensors installed in MH outlet pipe (reverse installation) with ultrasonic sensor installed outside of and above the outlet pipe to read level over the weir (Surcharge mount).
54th Ave S. and S. Alaska St.
8 165* 067-078 Fair Velocity/pressure/ultrasonic sensors installed in MH inlet pipe. Velocity/pressure/ultrasonic sensors installed in MH overflow pipe (reverse installation).
S. Alaska St. and Lake Washington Blvd. S.
*Denotes sites with dual sensors (CSO outfall pipe has area/velocity sensor) ** The description of this monitoring location was taken directly from the monitor that was once located at MH 059-451, and assumes that the original monitoring setup was unchanged. Per communications with SPU, the monitor at 059-451 was moved to an un-numbered structure when Basin 039 was connected to Basin 038. This un-numbered structure has been labeled “A” for convenience.
7.2. Temporary Monitoring Locations
On November 21, 2007, a final recommendation for flow monitoring locations was delivered from CH2M HILL to SPU. This recommendation included 19 new monitoring locations in addition to existing CSO outfall locations already monitored. On January 11, 2008, CH2M HILL recommended to SPU the location for a monitor for the drainage system that outfalls near NPDES CSO basin 38 for a total of 20 temporary monitors. These locations may be adjusted as required by site evaluation in the field. The majority of the monitors were installed by December 31, 2007. All monitors were installed by January 31, 2008.
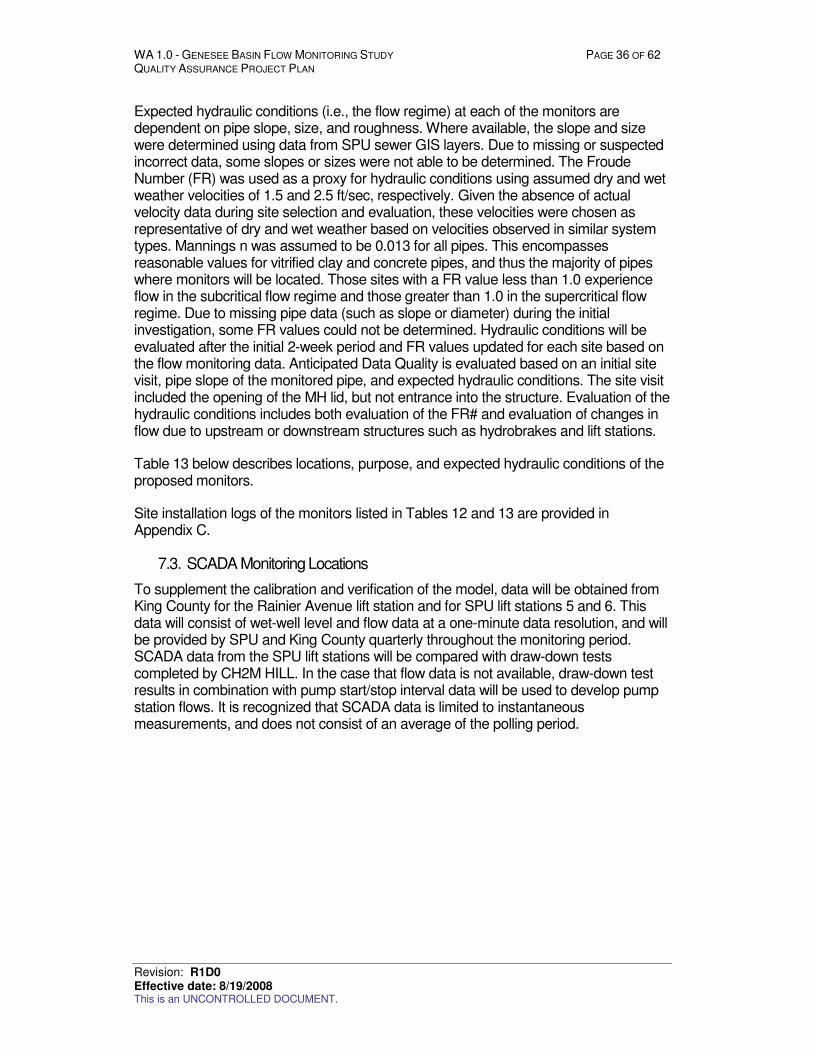
WA 1.0 - GENESEE BASIN FLOW MONITORING STUDY PAGE 36 OF 62 QUALITY ASSURANCE PROJECT PLAN
Revision: R1D0 Effective date: 8/19/2008 This is an UNCONTROLLED DOCUMENT.
Expected hydraulic conditions (i.e., the flow regime) at each of the monitors are dependent on pipe slope, size, and roughness. Where available, the slope and size were determined using data from SPU sewer GIS layers. Due to missing or suspected incorrect data, some slopes or sizes were not able to be determined. The Froude Number (FR) was used as a proxy for hydraulic conditions using assumed dry and wet weather velocities of 1.5 and 2.5 ft/sec, respectively. Given the absence of actual velocity data during site selection and evaluation, these velocities were chosen as representative of dry and wet weather based on velocities observed in similar system types. Mannings n was assumed to be 0.013 for all pipes. This encompasses reasonable values for vitrified clay and concrete pipes, and thus the majority of pipes where monitors will be located. Those sites with a FR value less than 1.0 experience flow in the subcritical flow regime and those greater than 1.0 in the supercritical flow regime. Due to missing pipe data (such as slope or diameter) during the initial investigation, some FR values could not be determined. Hydraulic conditions will be evaluated after the initial 2-week period and FR values updated for each site based on the flow monitoring data. Anticipated Data Quality is evaluated based on an initial site visit, pipe slope of the monitored pipe, and expected hydraulic conditions. The site visit included the opening of the MH lid, but not entrance into the structure. Evaluation of the hydraulic conditions includes both evaluation of the FR# and evaluation of changes in flow due to upstream or downstream structures such as hydrobrakes and lift stations.
Table 13 below describes locations, purpose, and expected hydraulic conditions of the proposed monitors.
Site installation logs of the monitors listed in Tables 12 and 13 are provided in Appendix C.
7.3. SCADA Monitoring Locations
To supplement the calibration and verification of the model, data will be obtained from King County for the Rainier Avenue lift station and for SPU lift stations 5 and 6. This data will consist of wet-well level and flow data at a one-minute data resolution, and will be provided by SPU and King County quarterly throughout the monitoring period. SCADA data from the SPU lift stations will be compared with draw-down tests completed by CH2M HILL. In the case that flow data is not available, draw-down test results in combination with pump start/stop interval data will be used to develop pump station flows. It is recognized that SCADA data is limited to instantaneous measurements, and does not consist of an average of the polling period.
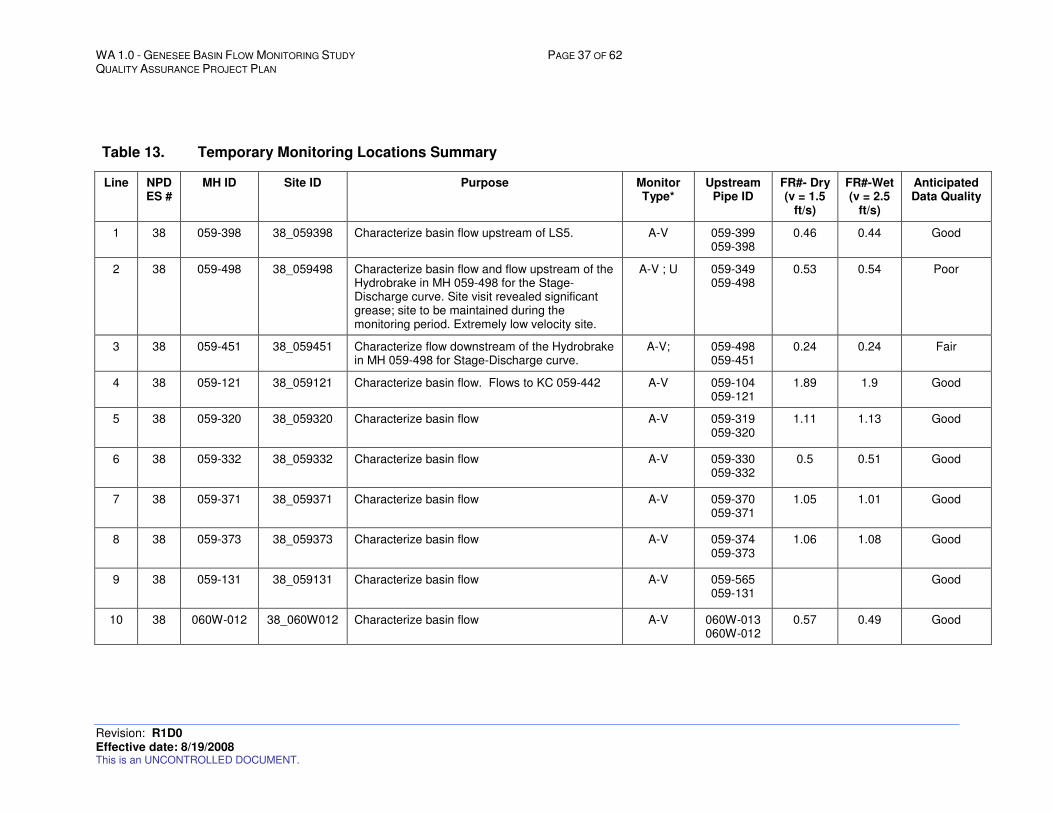
WA 1.0 - GENESEE BASIN FLOW MONITORING STUDY PAGE 37 OF 62 QUALITY ASSURANCE PROJECT PLAN
Revision: R1D0 Effective date: 8/19/2008 This is an UNCONTROLLED DOCUMENT.
Table 13. Temporary Monitoring Locations Summary
Line NPDES #
MH ID Site ID Purpose Monitor Type*
Upstream Pipe ID
FR#- Dry (v = 1.5
ft/s)
FR#-Wet (v = 2.5
ft/s)
Anticipated Data Quality
1 38 059-398 38_059398 Characterize basin flow upstream of LS5. A-V 059-399 059-398
0.46 0.44 Good
2 38 059-498 38_059498 Characterize basin flow and flow upstream of the Hydrobrake in MH 059-498 for the Stage-Discharge curve. Site visit revealed significant grease; site to be maintained during the monitoring period. Extremely low velocity site.
A-V ; U 059-349 059-498
0.53 0.54 Poor
3 38 059-451 38_059451 Characterize flow downstream of the Hydrobrake in MH 059-498 for Stage-Discharge curve.
A-V; 059-498 059-451
0.24 0.24 Fair
4 38 059-121 38_059121 Characterize basin flow. Flows to KC 059-442 A-V 059-104 059-121
1.89 1.9 Good
5 38 059-320 38_059320 Characterize basin flow A-V 059-319 059-320
1.11 1.13 Good
6 38 059-332 38_059332
Characterize basin flow A-V 059-330 059-332
0.5 0.51 Good
7 38 059-371 38_059371
Characterize basin flow A-V 059-370 059-371
1.05 1.01 Good
8 38 059-373 38_059373
Characterize basin flow A-V 059-374 059-373
1.06 1.08 Good
9 38 059-131 38_059131
Characterize basin flow A-V 059-565 059-131
Good
10 38 060W-012 38_060W012 Characterize basin flow A-V 060W-013 060W-012
0.57 0.49 Good
WA 1.0 - GENESEE BASIN FLOW MONITORING STUDY PAGE 38 OF 62 QUALITY ASSURANCE PROJECT PLAN
Revision: R1D0 Effective date: 8/19/2008 This is an UNCONTROLLED DOCUMENT.
Table 13. Temporary Monitoring Locations Summary
Line NPDES #
MH ID Site ID Purpose Monitor Type*
Upstream Pipe ID
FR#- Dry (v = 1.5
ft/s)
FR#-Wet (v = 2.5
ft/s)
Anticipated Data Quality
11 38 059-404 38_059404
Characterize basin flow A-V 060W-004 059-404
0.57 0.49 Good
12 40 059-407 40_059407
Characterize flow downstream of the Hydrobrake in MH 059-490 for Stage-Discharge curve.
A-V 059-490 059-407
1.98 1.8 Fair
13 40 059-490 40_059490
Characterize basin flow and flow upstream of the Hydrobrake in MH 059-490 for the Stage-Discharge curve.
A-V; U 059-495 059-490
1.84 1.77 Fair
14 40 059-409 40_059409 Characterize basin flow A-V 059-410 059-409
1.48 1.22 Fair
15 41A 059-436 41_059436 Characterize basin flow A-V 059-437 059-436
1.13 1.08 Fair
16 42 060W-014 42_060W014 Characterize flow downstream of the Hydrobrake in MH 060W-052 for Stage-Discharge curve.
A-V 060W-052 060W-014
1.29 1.18 Good
17 42 060W-047 42_060W047 Characterize basin flow and flow upstream of the Hydrobrake in MH 060W-047 for the Stage-Discharge curve.
A-V 060W-048 060W-047
1.01 1.05 Good
18 42 060W-019 42_060W019 Characterize flow downstream of the Hydrobrake in MH 060W0-047 for Stage-Discharge. SPU will check and verify quality of location. May be affected by discharge from LS 6.
A-V 060W-047 060W-019
Poor
19 43 060W-026 43_060W026 Characterize basin flow. DataGator, as discussed in field on 1/17/08.
A-V 060W-027 060W-026
Good
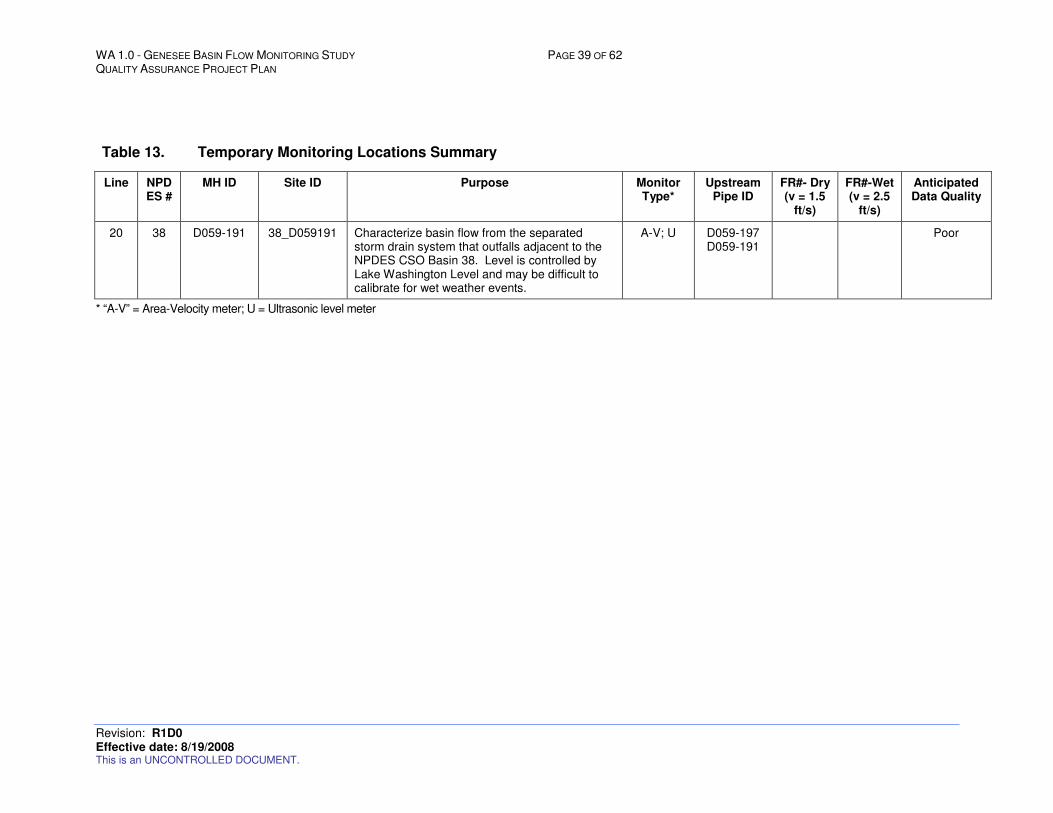
WA 1.0 - GENESEE BASIN FLOW MONITORING STUDY PAGE 39 OF 62 QUALITY ASSURANCE PROJECT PLAN
Revision: R1D0 Effective date: 8/19/2008 This is an UNCONTROLLED DOCUMENT.
Table 13. Temporary Monitoring Locations Summary
Line NPDES #
MH ID Site ID Purpose Monitor Type*
Upstream Pipe ID
FR#- Dry (v = 1.5
ft/s)
FR#-Wet (v = 2.5
ft/s)
Anticipated Data Quality
20 38 D059-191 38_D059191 Characterize basin flow from the separated storm drain system that outfalls adjacent to the NPDES CSO Basin 38. Level is controlled by Lake Washington Level and may be difficult to calibrate for wet weather events.
A-V; U D059-197 D059-191
Poor
* “A-V” = Area-Velocity meter; U = Ultrasonic level meter
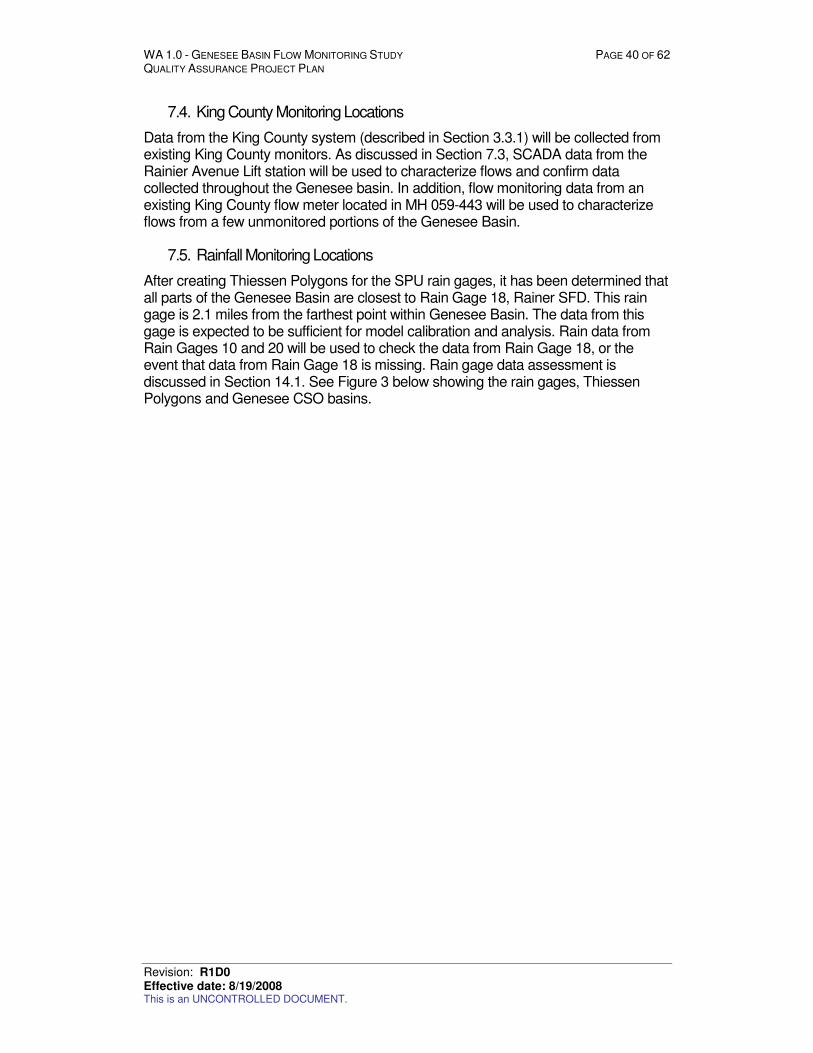
WA 1.0 - GENESEE BASIN FLOW MONITORING STUDY PAGE 40 OF 62 QUALITY ASSURANCE PROJECT PLAN
Revision: R1D0 Effective date: 8/19/2008 This is an UNCONTROLLED DOCUMENT.
7.4. King County Monitoring Locations
Data from the King County system (described in Section 3.3.1) will be collected from existing King County monitors. As discussed in Section 7.3, SCADA data from the Rainier Avenue Lift station will be used to characterize flows and confirm data collected throughout the Genesee basin. In addition, flow monitoring data from an existing King County flow meter located in MH 059-443 will be used to characterize flows from a few unmonitored portions of the Genesee Basin.
7.5. Rainfall Monitoring Locations
After creating Thiessen Polygons for the SPU rain gages, it has been determined that all parts of the Genesee Basin are closest to Rain Gage 18, Rainer SFD. This rain gage is 2.1 miles from the farthest point within Genesee Basin. The data from this gage is expected to be sufficient for model calibration and analysis. Rain data from Rain Gages 10 and 20 will be used to check the data from Rain Gage 18, or the event that data from Rain Gage 18 is missing. Rain gage data assessment is discussed in Section 14.1. See Figure 3 below showing the rain gages, Thiessen Polygons and Genesee CSO basins.
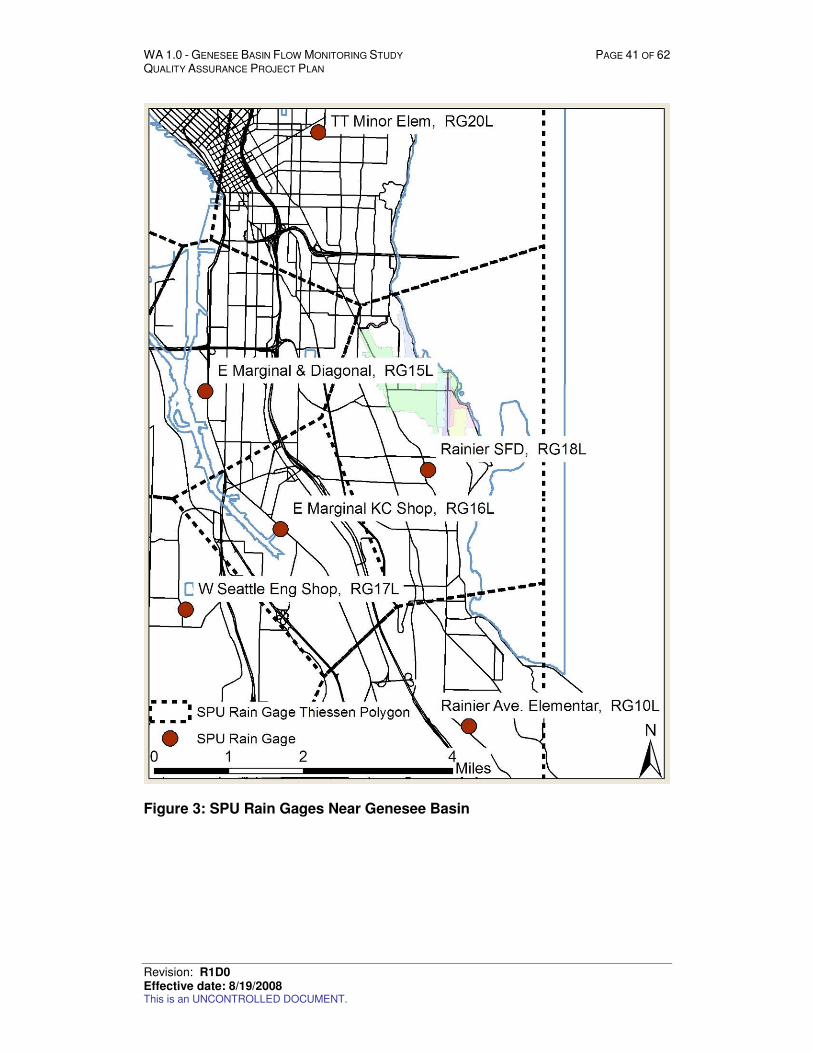
WA 1.0 - GENESEE BASIN FLOW MONITORING STUDY PAGE 41 OF 62 QUALITY ASSURANCE PROJECT PLAN
Revision: R1D0 Effective date: 8/19/2008 This is an UNCONTROLLED DOCUMENT.
Figure 3: SPU Rain Gages Near Genesee Basin
WA 1.0 - GENESEE BASIN FLOW MONITORING STUDY PAGE 42 OF 62 QUALITY ASSURANCE PROJECT PLAN
Revision: R1D0 Effective date: 8/19/2008 This is an UNCONTROLLED DOCUMENT.
8. SAMPLING PROCEDURES
This section describes the procedures for sample collection during the Genesee Flow Monitoring program. Samples for this program consist of depth, level, and velocity measurements of combined sewer flow. In addition, rain gage data will be collected. The flow and rain data will be used to meet the objective of characterizing the performance of the combined sewer system.
8.1. Sample Handling and Custody
The data is collected by automatic flow monitors in-situ. As such, there are no handling or custody issues of note. Data handling and management procedures are discussed in Section 11.1.
8.2. Documentation of Field Sampling Activities
Installation of flow monitors by ADS is documented using standard site install reports, provided in Appendix C. Site visits by ADS personnel (e.g., site verification visits requested through work orders to verify accuracy) will be recorded using site visit logs. Site verification visits will include comparing actual depth measurements to the monitor depth and comparison of peak velocity to monitor peak velocity. Rain gages will be manually “tipped” to confirm correct operation. Any adjustments to monitoring equipment or changes to the site reported on the site visit logs will be recorded in weekly data summary reports by SPU. Finally, monthly data reports will also record any adjustments to the site. Site verification visits will include comparing actual depth measurements to the monitor depth. Site visits will conform to the SOPs that are provided in Appendix H.
8.3. Non-direct Measurements
GIS data describing the SPU combined sewer pipe network will be used to determine maintenance hole depths, pipe invert elevations, slopes, pipe diameters, maintenance hole types and designations, and other information pertinent to flow monitoring and modeling. Information from these layers is used to calculate Mannings Q and Froude Number. These data layers are assumed to be of reasonable quality. GIS data may be verified with as-built record drawings, which are assumed to be a highly accurate representation of the physical sewer system.
9. MEASUREMENT PROCEDURES
Comparisons will be made between manual field measurements (known as confirmations) and monitor values. Confirmations are obtained in-situ at the sensor location in the pipe. Manual depth measurements will be taken with a ruler and manual velocity measurements by a calibrated, portable velocity meter. A velocity profile across varying depths will be obtained if sufficient depth of flow exists in the pipe (greater than 5 inches). If there is insufficient depth, the average velocity of the flow is assumed to be 0.9 of the peak velocity of the flow measured. Measurement procedures are described in the ADS Quality Assurance and Implementation Plan in Appendix F.
WA 1.0 - GENESEE BASIN FLOW MONITORING STUDY PAGE 43 OF 62 QUALITY ASSURANCE PROJECT PLAN
Revision: R1D0 Effective date: 8/19/2008 This is an UNCONTROLLED DOCUMENT.
The following SPU SOPs will be followed when and where they are applicable. The full text of each of these SOPs can be found in Appendix H.
� Hydraulics Program
o HYDR C3100_R1D0 – Piped Flow Gravity
o HYDR C3110_R1D0 – Piped Flow Gravity: Equipment and Site Selection
o HYDR C3120_R1D0 – Piped Flow Gravity: Equipment Installation
o HYDR C3130_R1D0 – Piped Flow Gravity: Field Calibration and Maintenance
o HYDR C3140_R1D0 – Piped Flow Gravity: Field Inspections
o HYDR Q1100_R1D0 – Data Validation (review and verification, validation, assessment)
� Rain Gage Program (Meteorology)
o METR Q1100_R0D7 (Draft) – Data Validation (review and verification, validation, assessment)
o METR Q1200_R0D3 (Draft) – Data Management (retrieval through archiving)
o METR Q1300_R0D2 (Draft) – Data Requests
Specifications and descriptions of the measurement methods for the flow meters used in this project can be found in Appendix D.
10. QUALITY CONTROL
Critical to the project is ensuring that the data that is collected is accurate and reflects the actual hydraulic conditions at each site. Prior to installation, personnel from SPU, ADS, and CH2M HILL representing the different users of the data (hydraulic modeling, reporting and alarms, engineering, management, etc.) evaluated each site to ensure data would meet project objectives and hydraulic conditions existed resulting in reliable data. Quality control processes are described in the following section, as well as in Figure 4, Section 6 and Section 14.
Two weeks after installation, CH2M HILL is tasked with providing to SPU an assessment of the quality and suitability of the data to support the project objectives. Adjustments to monitoring locations or methodology may be made in coordination with the project team members. Flow balancing will also be performed as an additional level of quality control.
Throughout the monitoring period, the data will be reviewed by ADS analysts and SPU and CH2M HILL engineers. Reviewers will specifically rely on velocity and depth

WA 1.0 - GENESEE BASIN FLOW MONITORING STUDY PAGE 44 OF 62 QUALITY ASSURANCE PROJECT PLAN
Revision: R1D0 Effective date: 8/19/2008 This is an UNCONTROLLED DOCUMENT.
scattergraphs, site visit logs, and consistency with previous measurements. Inconsistent or apparent changes in hydraulic conditions will result in a work order to visit the site to verify the accuracy of the monitor—poor depth or velocity values will be flagged. Appendix E contains the template that will be used to guide the weekly and biweekly review of the data.
At conclusion of the project, the preliminary data will be post-processed to adjust the data to the verification visits. A minimum of two velocity and depth verifications will be performed at each site. Site verifications will include comparing actual depth measurements to the monitor depth. The profile of velocity measurements at varying depths will be used to determine average velocity. The site’s gain (peak to average velocity ratio) will be determined for each site.
SPU is committed to obtaining high-quality data for the project through both internal and external processes. This commitment is evident in the following:
� Obtaining input and review from the primary users of the data (modeling, engineering, maintenance, public notification, etc.).
� Requiring the daily download and access to the data through ADS Intelliserve and requiring all users to be trained in accessing the data.
� On-going review of the data in triplicate by SPU, the flow monitoring contractor (ADS) and the consultant (CH2M HILL) throughout the monitoring period to ensure the monitors are collecting accurate and reliable data.
� Requiring regular and periodic data review at various levels of detail. These reviews are shown in Figure 4.
� Establishing benchmark decision points throughout the project where collected data will be evaluated in meeting the project objectives.
� Establishing protocols by which to resolve and correct data quality issues. These protocols are discussed in Section 12.
Additional quality control procedures are documented in the ADS Quality Assurance and Implementation Plan provided in Appendix F and the SOP HYDR Q1100 in Appendix H.
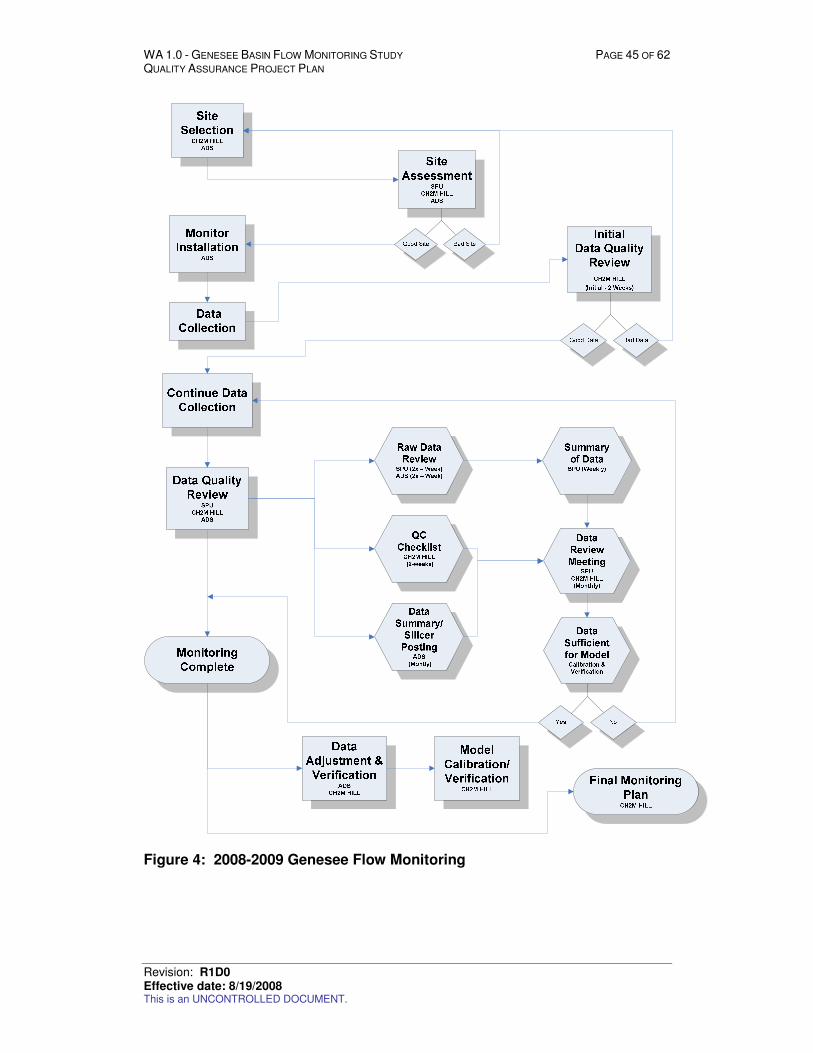
WA 1.0 - GENESEE BASIN FLOW MONITORING STUDY PAGE 45 OF 62 QUALITY ASSURANCE PROJECT PLAN
Revision: R1D0 Effective date: 8/19/2008 This is an UNCONTROLLED DOCUMENT.
Figure 4: 2008-2009 Genesee Flow Monitoring
WA 1.0 - GENESEE BASIN FLOW MONITORING STUDY PAGE 46 OF 62 QUALITY ASSURANCE PROJECT PLAN
Revision: R1D0 Effective date: 8/19/2008 This is an UNCONTROLLED DOCUMENT.
10.1. Analytical Quality Control
See ADS QA/QC plan in Appendix F and the SOP HYDR Q1100 in Appendix H.
A section on QC Samples is not applicable to project.
10.2. Field Quality Control
A portable velocity meter is used to verify the velocity measurements recorded by the installed monitors. A ruler will be used to verify the depth measurements. See the ADS QA/QC plan in the Appendix F and the SOP HYDR Q1100 in Appendix H.
10.2.1. QC Samples
Not applicable to project.
10.2.2. Instrument/Equipment Testing, Inspection, and Maintenance
The specifications for the portable velocity meter used to verify the velocity recorded by the installed monitor are included in Appendix F.
10.2.3. Instrument/Equipment Calibration and Frequency
The specifications for the portable velocity meter used to verify the velocity in the field is included as part of the ADS QA Plan in Appendix F and the SOPs in Appendix H.
10.2.4. Inspection/Acceptance of Supplies and Consumables
Expected consumables for this project include batteries, desiccant, and cable ties. The voltage at each site is monitored through Intelliserve, and desiccant should be blue in color indicating it has not been exposed to moisture.
11. DATA MANAGEMENT PROCEDURES
This section describes the procedures that will be used to manage the data collected as part of the Genesee Flow Monitoring program. This section includes the following elements:
� Data path (from generation to final use and storage)
� Record keeping, data storage and retrieval
� Error detection and correction, data loss prevention, data reporting and data entry
� Forms and checklists being used
� Data handling equipment and procedures
� Hardware and software requirements
� Information resource management requirements
WA 1.0 - GENESEE BASIN FLOW MONITORING STUDY PAGE 47 OF 62 QUALITY ASSURANCE PROJECT PLAN
Revision: R1D0 Effective date: 8/19/2008 This is an UNCONTROLLED DOCUMENT.
Data management procedures are also documented in the ADS Quality Assurance and Implementation Plan provided in Appendix F.
11.1. Data Path
The following access has been granted to the project team members:
� Raw data Intelliserve link: http://206.166.227.10/windermere/. � Preliminary data FlowView Portal link: http:/www.flowview.com � Final data FlowView Portal link: http:/www.flowview.com
For each of these data paths, SPU or CH2M HILL personnel will not have write access privileges and can not change the data. ADS analysts can change the data, but adjustments are documented.
11.2. Record-keeping and Data Storage
Field notes and standardized field forms will be stored within a project file in the ADS offices or at a secure off-site document archiving facility. Electronic data will be stored on the ADS network server and backed-up on a regular basis to a secure storage media that is maintained off-site.
At conclusion of the project, all electronic data and site verification logs will be distributed to project team members and archived. SPU will maintain its records on the SPU internal network for a minimum of 6 years..
11.3. Data Verification/Validation
Site verifications to ensure the monitor is accurately measuring depth and velocity will be completed a minimum of two times and in accordance with HYDR - Q1100 SOP “Genesee Basin Flow Monitoring Study” (see Appendix H). Site verification procedures require evaluating the difference between actual measurements and the values recorded by the monitor. Ongoing review of the data by project team members through the Intelliserve Web link will result in suspect data being flagged and maintenance personnel mobilized to determine if the hydraulics have changed at the site or the monitor is no longer accurately measuring the flow. Each month, the data will be downloaded to Sliicer, the ADS processing tool. CH2M HILL engineers will assess the data for accuracy and suitability in meeting the project objectives and provide recommendations to the team. .
11.4. Forms and Checklists
Forms used in the project will be ADS site verification logs, work orders, and data review sheets (incorporating analysts’ comments). Confined space entry permits will be included in the daily log sheets.
Forms, templates, reports, and checklists to be prepared by CH2M HILL include:
� Outline of Flow Monitoring Plan, Report No. 1
� Draft of Flow Monitoring Plan, Report No. 1
� Final Flow Monitoring Plan, Report No. 1
WA 1.0 - GENESEE BASIN FLOW MONITORING STUDY PAGE 48 OF 62 QUALITY ASSURANCE PROJECT PLAN
Revision: R1D0 Effective date: 8/19/2008 This is an UNCONTROLLED DOCUMENT.
� Outline of Technical Report No. 2
� Draft of Technical Report No. 2
� Final Technical Report No. 2
� Draft monthly meeting minutes and PowerPoint presentation template for review by the SPU project team
� Monthly meeting minutes summarizing the technical review of flow and rainfall monitoring data containing the following:
• Monthly PowerPoint presentations that present the technical review of the flow and rainfall monitoring data.
• Biweekly flow monitoring data checklist
11.5. Data Handling
See Section 4.7, Data Collection.
11.6. Hardware and Software Requirements
In order to view the data from Intelliserve, the following hardware and software are required:
� Pentium II processor (ADS recommends a Pentium III)
� 128 MB RAM (ADS recommends 256 MB RAM)
� ADS recommends a 17-inch monitor or larger be used and select the 1024 x 768 pixel provides optimal viewing.
� Microsoft Office applications to upload and view documents through the IntelliServe User interface. The application(s) needed (e.g., MS Word®)) will depend on the document formats. In addition, MS Excel® is needed to download data exported in Excel or .CSV format from the IntelliServe Export Wizard.
11.7. Information Resource Management Requirements
Does not apply to this project.
12. AUDITS AND REPORTS
The following section describes the procedures in place to ensure that the methods described in this QAPP are adhered to and that the data collected is of a quality sufficient to meet project objectives. It also defines the actions to be taken in the case of deviations from this document, or in the case that data quality is not sufficient.
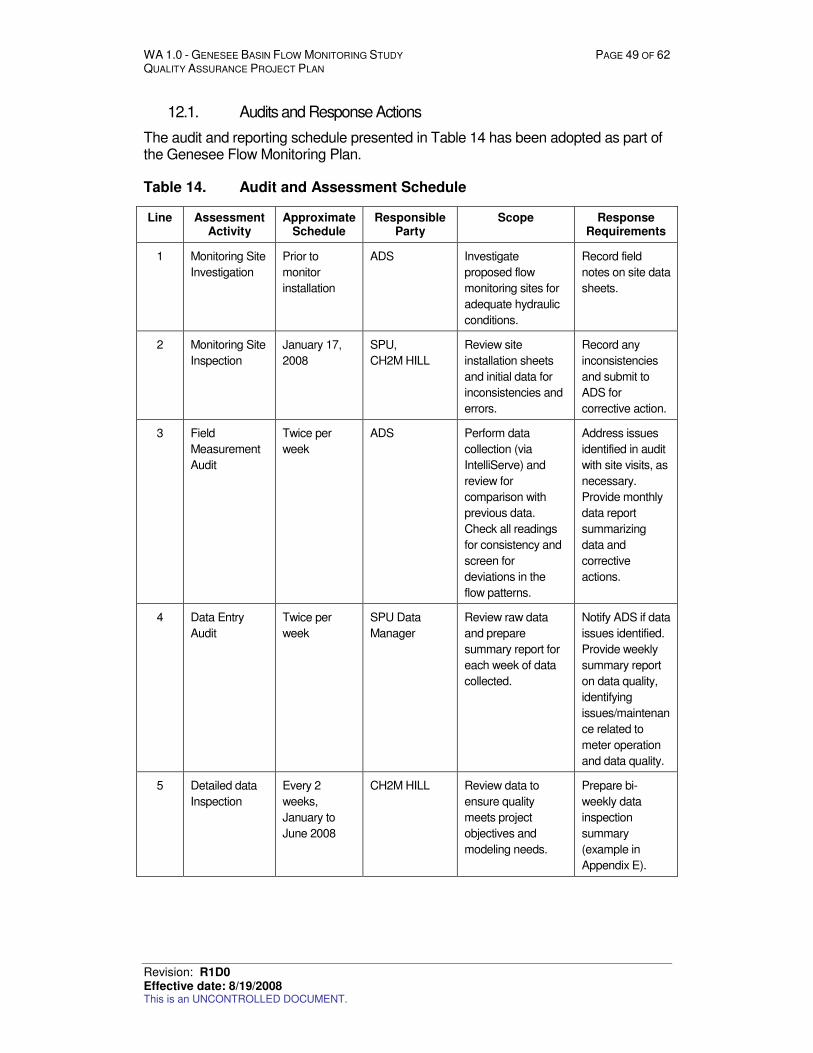
WA 1.0 - GENESEE BASIN FLOW MONITORING STUDY PAGE 49 OF 62 QUALITY ASSURANCE PROJECT PLAN
Revision: R1D0 Effective date: 8/19/2008 This is an UNCONTROLLED DOCUMENT.
12.1. Audits and Response Actions
The audit and reporting schedule presented in Table 14 has been adopted as part of the Genesee Flow Monitoring Plan.
Table 14. Audit and Assessment Schedule
Line Assessment Activity
Approximate Schedule
Responsible Party
Scope Response Requirements
1 Monitoring Site
Investigation
Prior to
monitor
installation
ADS Investigate
proposed flow
monitoring sites for
adequate hydraulic
conditions.
Record field
notes on site data
sheets.
2 Monitoring Site
Inspection
January 17,
2008
SPU,
CH2M HILL
Review site
installation sheets
and initial data for
inconsistencies and
errors.
Record any
inconsistencies
and submit to
ADS for
corrective action.
3 Field
Measurement
Audit
Twice per
week
ADS Perform data
collection (via
IntelliServe) and
review for
comparison with
previous data.
Check all readings
for consistency and
screen for
deviations in the
flow patterns.
Address issues
identified in audit
with site visits, as
necessary.
Provide monthly
data report
summarizing
data and
corrective
actions.
4 Data Entry
Audit
Twice per
week
SPU Data
Manager
Review raw data
and prepare
summary report for
each week of data
collected.
Notify ADS if data
issues identified.
Provide weekly
summary report
on data quality,
identifying
issues/maintenan
ce related to
meter operation
and data quality.
5 Detailed data
Inspection
Every 2
weeks,
January to
June 2008
CH2M HILL Review data to
ensure quality
meets project
objectives and
modeling needs.
Prepare bi-
weekly data
inspection
summary
(example in
Appendix E).
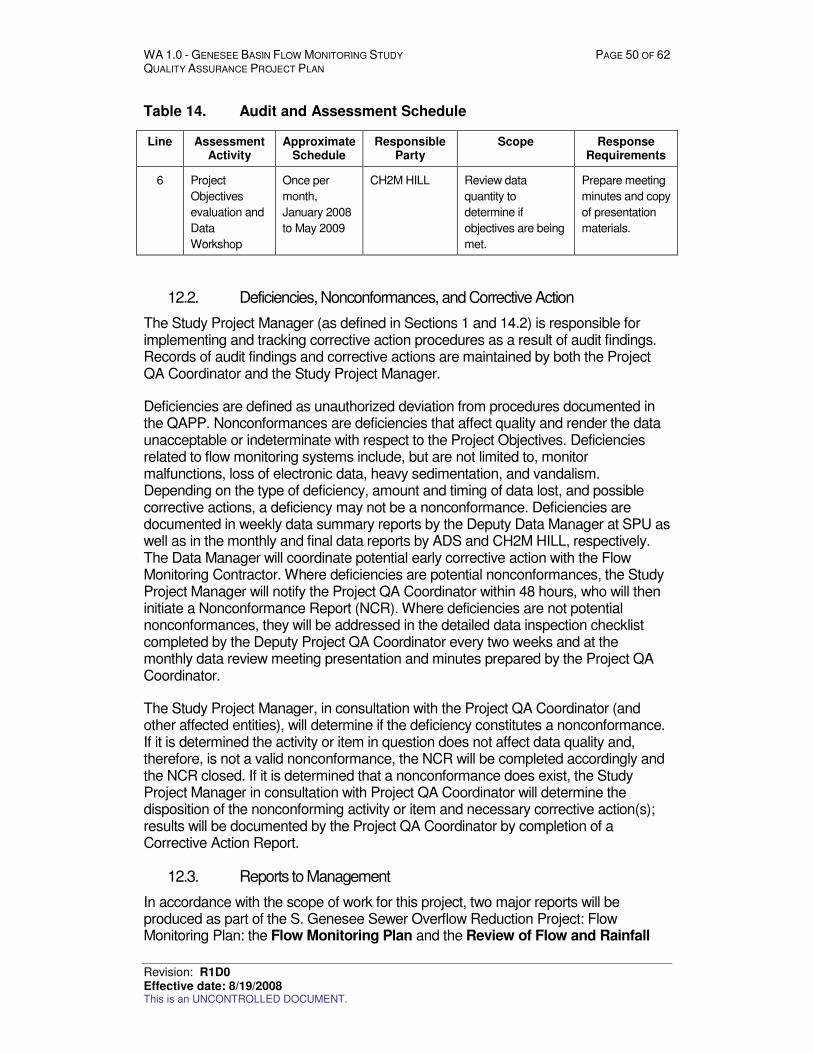
WA 1.0 - GENESEE BASIN FLOW MONITORING STUDY PAGE 50 OF 62 QUALITY ASSURANCE PROJECT PLAN
Revision: R1D0 Effective date: 8/19/2008 This is an UNCONTROLLED DOCUMENT.
Table 14. Audit and Assessment Schedule
Line Assessment Activity
Approximate Schedule
Responsible Party
Scope Response Requirements
6 Project
Objectives
evaluation and
Data
Workshop
Once per
month,
January 2008
to May 2009
CH2M HILL Review data
quantity to
determine if
objectives are being
met.
Prepare meeting
minutes and copy
of presentation
materials.
12.2. Deficiencies, Nonconformances, and Corrective Action
The Study Project Manager (as defined in Sections 1 and 14.2) is responsible for implementing and tracking corrective action procedures as a result of audit findings. Records of audit findings and corrective actions are maintained by both the Project QA Coordinator and the Study Project Manager.
Deficiencies are defined as unauthorized deviation from procedures documented in the QAPP. Nonconformances are deficiencies that affect quality and render the data unacceptable or indeterminate with respect to the Project Objectives. Deficiencies related to flow monitoring systems include, but are not limited to, monitor malfunctions, loss of electronic data, heavy sedimentation, and vandalism. Depending on the type of deficiency, amount and timing of data lost, and possible corrective actions, a deficiency may not be a nonconformance. Deficiencies are documented in weekly data summary reports by the Deputy Data Manager at SPU as well as in the monthly and final data reports by ADS and CH2M HILL, respectively. The Data Manager will coordinate potential early corrective action with the Flow Monitoring Contractor. Where deficiencies are potential nonconformances, the Study Project Manager will notify the Project QA Coordinator within 48 hours, who will then initiate a Nonconformance Report (NCR). Where deficiencies are not potential nonconformances, they will be addressed in the detailed data inspection checklist completed by the Deputy Project QA Coordinator every two weeks and at the monthly data review meeting presentation and minutes prepared by the Project QA Coordinator.
The Study Project Manager, in consultation with the Project QA Coordinator (and other affected entities), will determine if the deficiency constitutes a nonconformance. If it is determined the activity or item in question does not affect data quality and, therefore, is not a valid nonconformance, the NCR will be completed accordingly and the NCR closed. If it is determined that a nonconformance does exist, the Study Project Manager in consultation with Project QA Coordinator will determine the disposition of the nonconforming activity or item and necessary corrective action(s); results will be documented by the Project QA Coordinator by completion of a Corrective Action Report.
12.3. Reports to Management
In accordance with the scope of work for this project, two major reports will be produced as part of the S. Genesee Sewer Overflow Reduction Project: Flow Monitoring Plan: the Flow Monitoring Plan and the Review of Flow and Rainfall
WA 1.0 - GENESEE BASIN FLOW MONITORING STUDY PAGE 51 OF 62 QUALITY ASSURANCE PROJECT PLAN
Revision: R1D0 Effective date: 8/19/2008 This is an UNCONTROLLED DOCUMENT.
Monitoring Data Technical Report. A Final version of the Technical Report will be produced within one month of the availability of finalized data and report from ADS. This finalized data and report will be available 45 days after the conclusion of flow monitoring activities. Flow monitoring is anticipated to proceed through June 2008, with the option given to lengthen or shorten the monitoring period based on the need and ability for the data to meet project objectives.
The Flow Monitoring Plan (this report) follows the format and guidelines of SPU’s Quality Assurance Project Plan (QAPP). The Review of Flow and Rainfall Monitoring Data Technical Report will include a summary of the overall monitoring efforts, as well as the results of past technical reports, results of the ongoing monthly data reports, and a review of the Genesee flow monitoring program.
13. DATA VERIFICATION AND VALIDATION
This section discusses data review, verification, and validation procedures used as part of the Genesee Flow Monitoring program.
13.1. Data Review, Verification, and Validation
For the purposes of this document, data verification is a systematic process for evaluating performance and compliance of a set of data to ascertain its completeness, correctness, and consistency using the methods and criteria defined in this quality assurance project plan. Validation means those processes taken independently of the data-generation processes to evaluate the technical usability of the verified data with respect to the planned objectives or intention of the project. Additionally, validation can provide a level of overall confidence in the reporting of the data based on the methods used.
All data obtained from field and laboratory measurements will be reviewed and verified for conformance to project requirements, and then validated against the data quality objectives which are listed in Section 6. Only those data that are supported by appropriate quality control data and meet the measurement performance specification defined for this project will be considered acceptable and used in the project.
13.2. Verification and Validation Methods
Standard Operating Procedures SOP-WQD1300, SOP-WQD1400, and HYDR – Q1100 describe the procedures used to validate and verify data. This includes how computer entries are compared to field data sheets; how data gaps are identified; how calculations are checked; how raw data are examined for outliers or nonsensical readings; etc.
All data will be verified to ensure they are representative of the samples analyzed and locations where measurements were made, and that the data and associated quality control data conform to project specifications. The staff and management of the respective field, laboratory, and data management tasks are responsible for the integrity, validation, and verification of the data each task generates or handles throughout each process. The field and laboratory tasks ensure the verification of raw data, electronically generated data, and data on chain-of-custody forms and hard copy output from instruments.
WA 1.0 - GENESEE BASIN FLOW MONITORING STUDY PAGE 52 OF 62 QUALITY ASSURANCE PROJECT PLAN
Revision: R1D0 Effective date: 8/19/2008 This is an UNCONTROLLED DOCUMENT.
14. DATA QUALITY (USABILITY) ASSESSMENT
This section describes the process for determining whether the data meet project objectives once the data results are compiled.
14.1. Data Assessment Approach, Methods, and Presentation
Data quality and usability with respect to the Project Objectives will be assessed periodically as part of the Quality Control process. The Quality Control process is addressed in Section 10 of this Plan. Figure 4 summarizes the various processes in place as part of Quality Control.
Raw Data Review and QC Checklist (bi-weekly) reviews will be performed using raw data available on Intelliserve. During these reviews, hydrographs and scattergraphs will be assessed for data completeness and usability for the modeling objective. Special attention is paid to changes in the data signature, missing data, and data response during wet weather events. The results of these reviews are compiled in weekly and bi-weekly data review forms. Examples of the forms used to perform Raw Data Review and QC Checklist can be found in Appendix E.
Preliminary data will be available monthly through the FlowView and Sliicer portal interfaces. The tools built into these Websites allow for more detailed data review. The product of these monthly reviews will be a Data Review Meeting, presentation slides, and meeting minutes. As in the Raw Data Review and QC Checklist, hydrographs and scattergraphs are reviewed for data completeness with respect to the modeling objective. In addition, overall data trends and patterns, structure response to flows, and capture of wet weather events will be reviewed as part of this monthly review meeting. The balancing of flows with other data sources, such as the SPU pump stations, will also take place during the monthly reviews. Rainfall data will be summarized and compared with nearby rain gages within the SPU network. Storm events will be categorized and frequencies evaluated for multiple durations. Special attention will be paid to these aspects as they relate to the ultimate use of the data during modeling. Summary hydrographs and scattergraphs will be included in the meeting slides.
Ultimately, data collected by the flow monitors within the SPU SCADA system will be on the IMS server once it is implemented by SPU, for access by modelers and other end-users.
14.2. Roles and Responsibility
ADS is the flow monitoring contractor, and is contracted directly to SPU to install and maintain the monitors. ADS and SPU analysts will perform initial data quality reviews. SPU and CH2M HILL are responsible for determining if the final data is sufficient (both in accuracy and in availability) to meet the project objectives. Table 8 in Section 5.1 describes in greater detail the project team roles and responsibilities. Roles and responsibilities are described fully in the Work Assignment Form Attachment 1: Scope of Services for the S. Genesee Combined Sewer Overflow Reduction Project.
WA 1.0 - GENESEE BASIN FLOW MONITORING STUDY PAGE 53 OF 62 QUALITY ASSURANCE PROJECT PLAN
Revision: R1D0 Effective date: 8/19/2008 This is an UNCONTROLLED DOCUMENT.
14.3. Documentation
CH2M HILL will develop and submit a comprehensive data report as part of the modeling report documenting the accuracy and completeness of the flow monitoring data. The documentation process is further described in Sections 5.2.1 and 11.4 .
References
CH2M HILL et al. Drainage/Wastewater (DWW) I-SCADA Field Equipment Improvements Functional Requirements. Submitted to Seattle Public Utilities. August 2007.
Earthtech, Sewerage System Modeling and Assessment Project. Prepared for Seattle Public Utilities: Seattle, WA 2001.
Earthtech, Genesee Project Development-Level Model. Prepared for Seattle Public Utilities: Seattle, WA 2001. December 2006.
Ecology. Guidelines for Preparing Quality Assurance Project Plans for Environmental Studies. Publication No. 04-03-030 Revision of Publication No. 01-03-003. http://www.ecy.wa.gov/pubs/0403030.pdf. July 2004.
USEPA. Guidance on Systematic Planning Using the Data Quality Objectives Process EPA QA/G-4. United States Environmental Protection Agency, Office of Environmental Information Washington, DC 20460. EPA/240/B-06/001 http://www.epa.gov/quality/qs-docs/g4-final.pdf. February 2006
Peeling the Onion of Meter Accuracy Two Steps to Evaluating Flow Meter Data Patrick L. Stevens, PE ADS Environmental Services
Herrera Environmental Consultants. Outfall Evaluation Report: NPDES Permit Documentation. August 2006.
List of Revisions
The current list of revisions for this QAPP follows.
Revision
Number
Effective
Date
Review
Status
Revised by Revision Summary
R0D1 1/7/2008 Draft CH2M HILL Created draft document
R0D2 7/30/2008 Draft CH2M HILL Edited in response to SPU comments
dated 2/6/08 and 2/8/08
R0D3 8/19/2008 Draft CH2M HILL Changes made in response to SPU
comments on 8/7/08.
R1D0 8/19/2008 Approved CH2M HILL Changes from previous drafts approved.
Document prepared for final printing.

WA 1.0 - GENESEE BASIN FLOW MONITORING STUDY PAGE 54 OF 62 QUALITY ASSURANCE PROJECT PLAN
Revision: R1D0 Effective date: 8/19/2008 This is an UNCONTROLLED DOCUMENT.
Appendix A: Summary of Previous Data Review
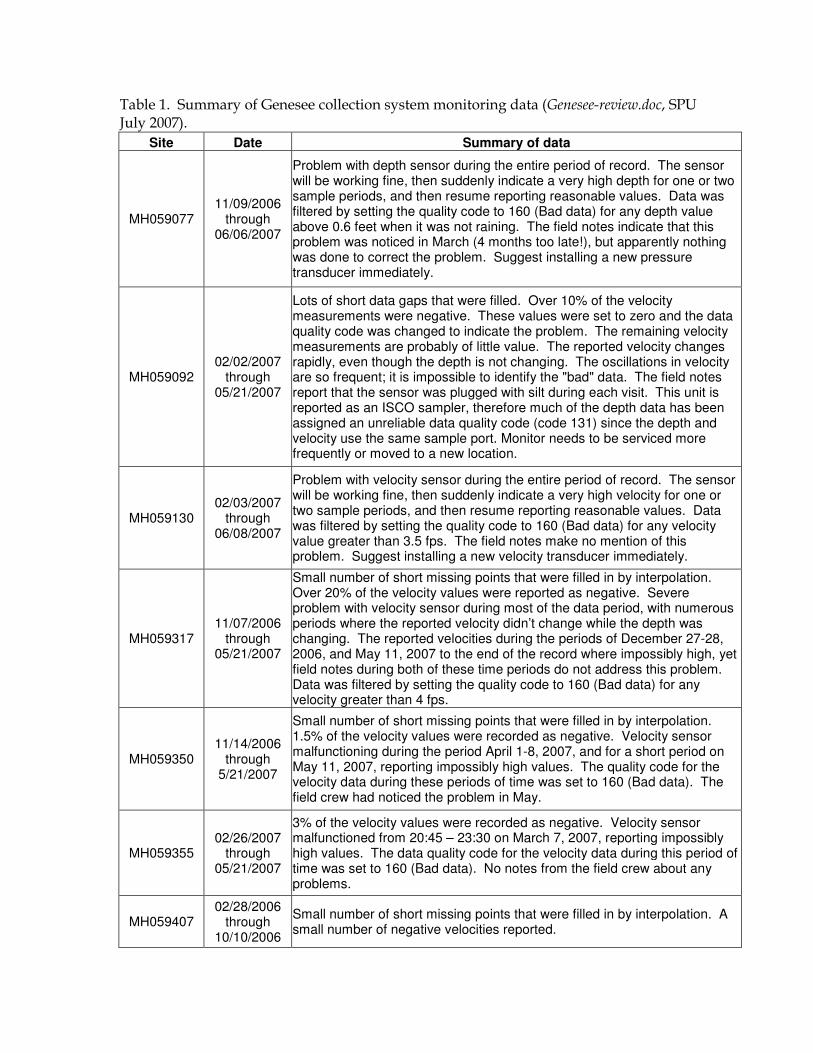
Table 1. Summary of Genesee collection system monitoring data (Genesee-review.doc, SPU July 2007).
Site Date Summary of data
MH059077 11/09/2006
through 06/06/2007
Problem with depth sensor during the entire period of record. The sensor will be working fine, then suddenly indicate a very high depth for one or two sample periods, and then resume reporting reasonable values. Data was filtered by setting the quality code to 160 (Bad data) for any depth value above 0.6 feet when it was not raining. The field notes indicate that this problem was noticed in March (4 months too late!), but apparently nothing was done to correct the problem. Suggest installing a new pressure transducer immediately.
MH059092 02/02/2007
through 05/21/2007
Lots of short data gaps that were filled. Over 10% of the velocity measurements were negative. These values were set to zero and the data quality code was changed to indicate the problem. The remaining velocity measurements are probably of little value. The reported velocity changes rapidly, even though the depth is not changing. The oscillations in velocity are so frequent; it is impossible to identify the "bad" data. The field notes report that the sensor was plugged with silt during each visit. This unit is reported as an ISCO sampler, therefore much of the depth data has been assigned an unreliable data quality code (code 131) since the depth and velocity use the same sample port. Monitor needs to be serviced more frequently or moved to a new location.
MH059130 02/03/2007
through 06/08/2007
Problem with velocity sensor during the entire period of record. The sensor will be working fine, then suddenly indicate a very high velocity for one or two sample periods, and then resume reporting reasonable values. Data was filtered by setting the quality code to 160 (Bad data) for any velocity value greater than 3.5 fps. The field notes make no mention of this problem. Suggest installing a new velocity transducer immediately.
MH059317 11/07/2006
through 05/21/2007
Small number of short missing points that were filled in by interpolation. Over 20% of the velocity values were reported as negative. Severe problem with velocity sensor during most of the data period, with numerous periods where the reported velocity didn’t change while the depth was changing. The reported velocities during the periods of December 27-28, 2006, and May 11, 2007 to the end of the record where impossibly high, yet field notes during both of these time periods do not address this problem. Data was filtered by setting the quality code to 160 (Bad data) for any velocity greater than 4 fps.
MH059350 11/14/2006
through 5/21/2007
Small number of short missing points that were filled in by interpolation. 1.5% of the velocity values were recorded as negative. Velocity sensor malfunctioning during the period April 1-8, 2007, and for a short period on May 11, 2007, reporting impossibly high values. The quality code for the velocity data during these periods of time was set to 160 (Bad data). The field crew had noticed the problem in May.
MH059355 02/26/2007
through 05/21/2007
3% of the velocity values were recorded as negative. Velocity sensor malfunctioned from 20:45 – 23:30 on March 7, 2007, reporting impossibly high values. The data quality code for the velocity data during this period of time was set to 160 (Bad data). No notes from the field crew about any problems.
MH059407 02/28/2006
through 10/10/2006
Small number of short missing points that were filled in by interpolation. A small number of negative velocities reported.
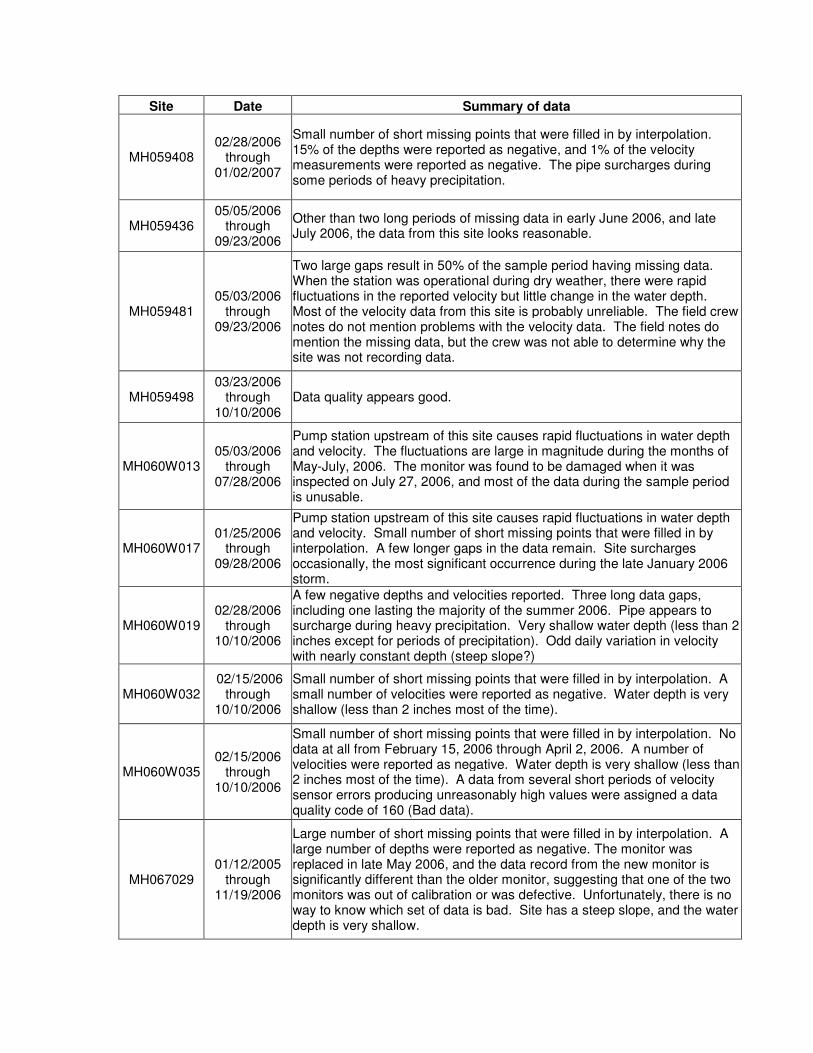
Site Date Summary of data
MH059408 02/28/2006
through 01/02/2007
Small number of short missing points that were filled in by interpolation. 15% of the depths were reported as negative, and 1% of the velocity measurements were reported as negative. The pipe surcharges during some periods of heavy precipitation.
MH059436 05/05/2006
through 09/23/2006
Other than two long periods of missing data in early June 2006, and late July 2006, the data from this site looks reasonable.
MH059481 05/03/2006
through 09/23/2006
Two large gaps result in 50% of the sample period having missing data. When the station was operational during dry weather, there were rapid fluctuations in the reported velocity but little change in the water depth. Most of the velocity data from this site is probably unreliable. The field crew notes do not mention problems with the velocity data. The field notes do mention the missing data, but the crew was not able to determine why the site was not recording data.
MH059498 03/23/2006
through 10/10/2006
Data quality appears good.
MH060W013 05/03/2006
through 07/28/2006
Pump station upstream of this site causes rapid fluctuations in water depth and velocity. The fluctuations are large in magnitude during the months of May-July, 2006. The monitor was found to be damaged when it was inspected on July 27, 2006, and most of the data during the sample period is unusable.
MH060W017 01/25/2006
through 09/28/2006
Pump station upstream of this site causes rapid fluctuations in water depth and velocity. Small number of short missing points that were filled in by interpolation. A few longer gaps in the data remain. Site surcharges occasionally, the most significant occurrence during the late January 2006 storm.
MH060W019 02/28/2006
through 10/10/2006
A few negative depths and velocities reported. Three long data gaps, including one lasting the majority of the summer 2006. Pipe appears to surcharge during heavy precipitation. Very shallow water depth (less than 2 inches except for periods of precipitation). Odd daily variation in velocity with nearly constant depth (steep slope?)
MH060W032 02/15/2006
through 10/10/2006
Small number of short missing points that were filled in by interpolation. A small number of velocities were reported as negative. Water depth is very shallow (less than 2 inches most of the time).
MH060W035 02/15/2006
through 10/10/2006
Small number of short missing points that were filled in by interpolation. No data at all from February 15, 2006 through April 2, 2006. A number of velocities were reported as negative. Water depth is very shallow (less than 2 inches most of the time). A data from several short periods of velocity sensor errors producing unreasonably high values were assigned a data quality code of 160 (Bad data).
MH067029 01/12/2005
through 11/19/2006
Large number of short missing points that were filled in by interpolation. A large number of depths were reported as negative. The monitor was replaced in late May 2006, and the data record from the new monitor is significantly different than the older monitor, suggesting that one of the two monitors was out of calibration or was defective. Unfortunately, there is no way to know which set of data is bad. Site has a steep slope, and the water depth is very shallow.
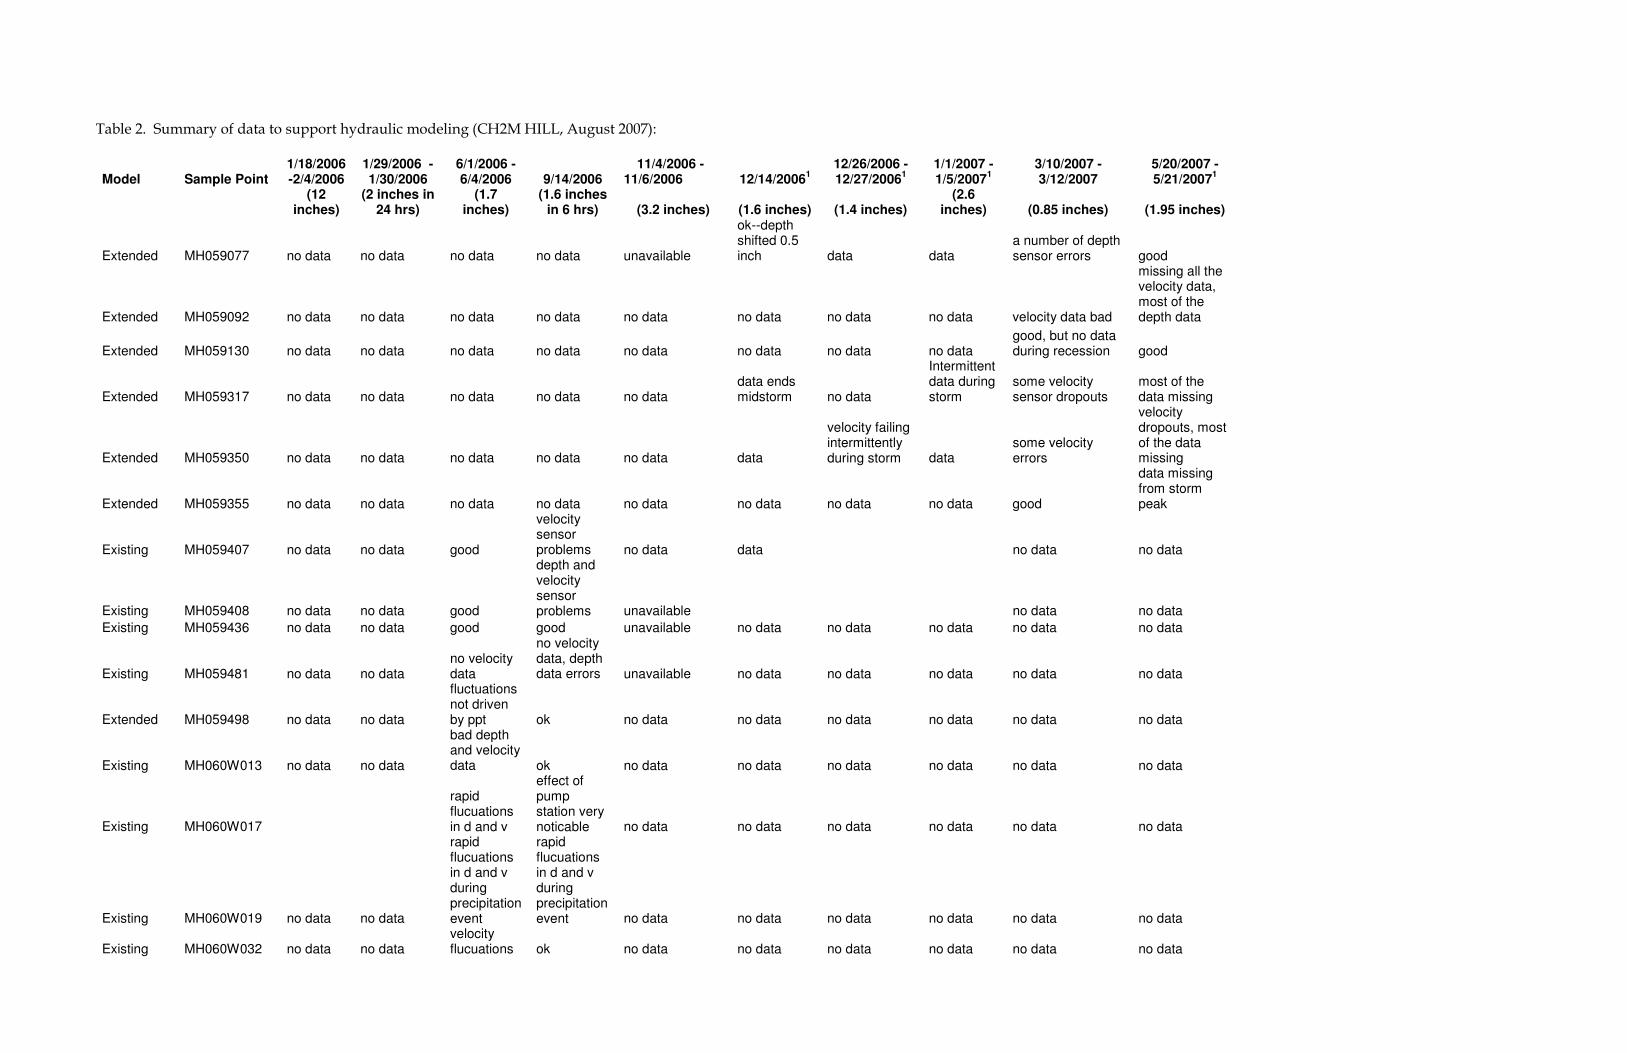
Table 2. Summary of data to support hydraulic modeling (CH2M HILL, August 2007):
Model Sample Point 1/18/2006 -2/4/2006
1/29/2006 -1/30/2006
6/1/2006 - 6/4/2006 9/14/2006
11/4/2006 - 11/6/2006 12/14/2006
1
12/26/2006 - 12/27/2006
1
1/1/2007 - 1/5/2007
1
3/10/2007 - 3/12/2007
5/20/2007 - 5/21/2007
1
(12
inches) (2 inches in
24 hrs) (1.7
inches) (1.6 inches
in 6 hrs) (3.2 inches) (1.6 inches) (1.4 inches) (2.6
inches) (0.85 inches) (1.95 inches)
Extended MH059077 no data no data no data no data unavailable
ok--depth shifted 0.5 inch data data
a number of depth sensor errors good
Extended MH059092 no data no data no data no data no data no data no data no data velocity data bad
missing all the velocity data, most of the depth data
Extended MH059130 no data no data no data no data no data no data no data no data good, but no data during recession good
Extended MH059317 no data no data no data no data no data data ends midstorm no data
Intermittent data during storm
some velocity sensor dropouts
most of the data missing
Extended MH059350 no data no data no data no data no data data
velocity failing intermittently during storm data
some velocity errors
velocity dropouts, most of the data missing
Extended MH059355 no data no data no data no data no data no data no data no data good
data missing from storm peak
Existing MH059407 no data no data good
velocity sensor problems no data data no data no data
Existing MH059408 no data no data good
depth and velocity sensor problems unavailable no data no data
Existing MH059436 no data no data good good unavailable no data no data no data no data no data
Existing MH059481 no data no data no velocity data
no velocity data, depth data errors unavailable no data no data no data no data no data
Extended MH059498 no data no data
fluctuations not driven by ppt ok no data no data no data no data no data no data
Existing MH060W013 no data no data
bad depth and velocity data ok no data no data no data no data no data no data
Existing MH060W017
rapid flucuations in d and v
effect of pump station very noticable no data no data no data no data no data no data
Existing MH060W019 no data no data
rapid flucuations in d and v during precipitation event
rapid flucuations in d and v during precipitation event no data no data no data no data no data no data
Existing MH060W032 no data no data velocity flucuations ok no data no data no data no data no data no data
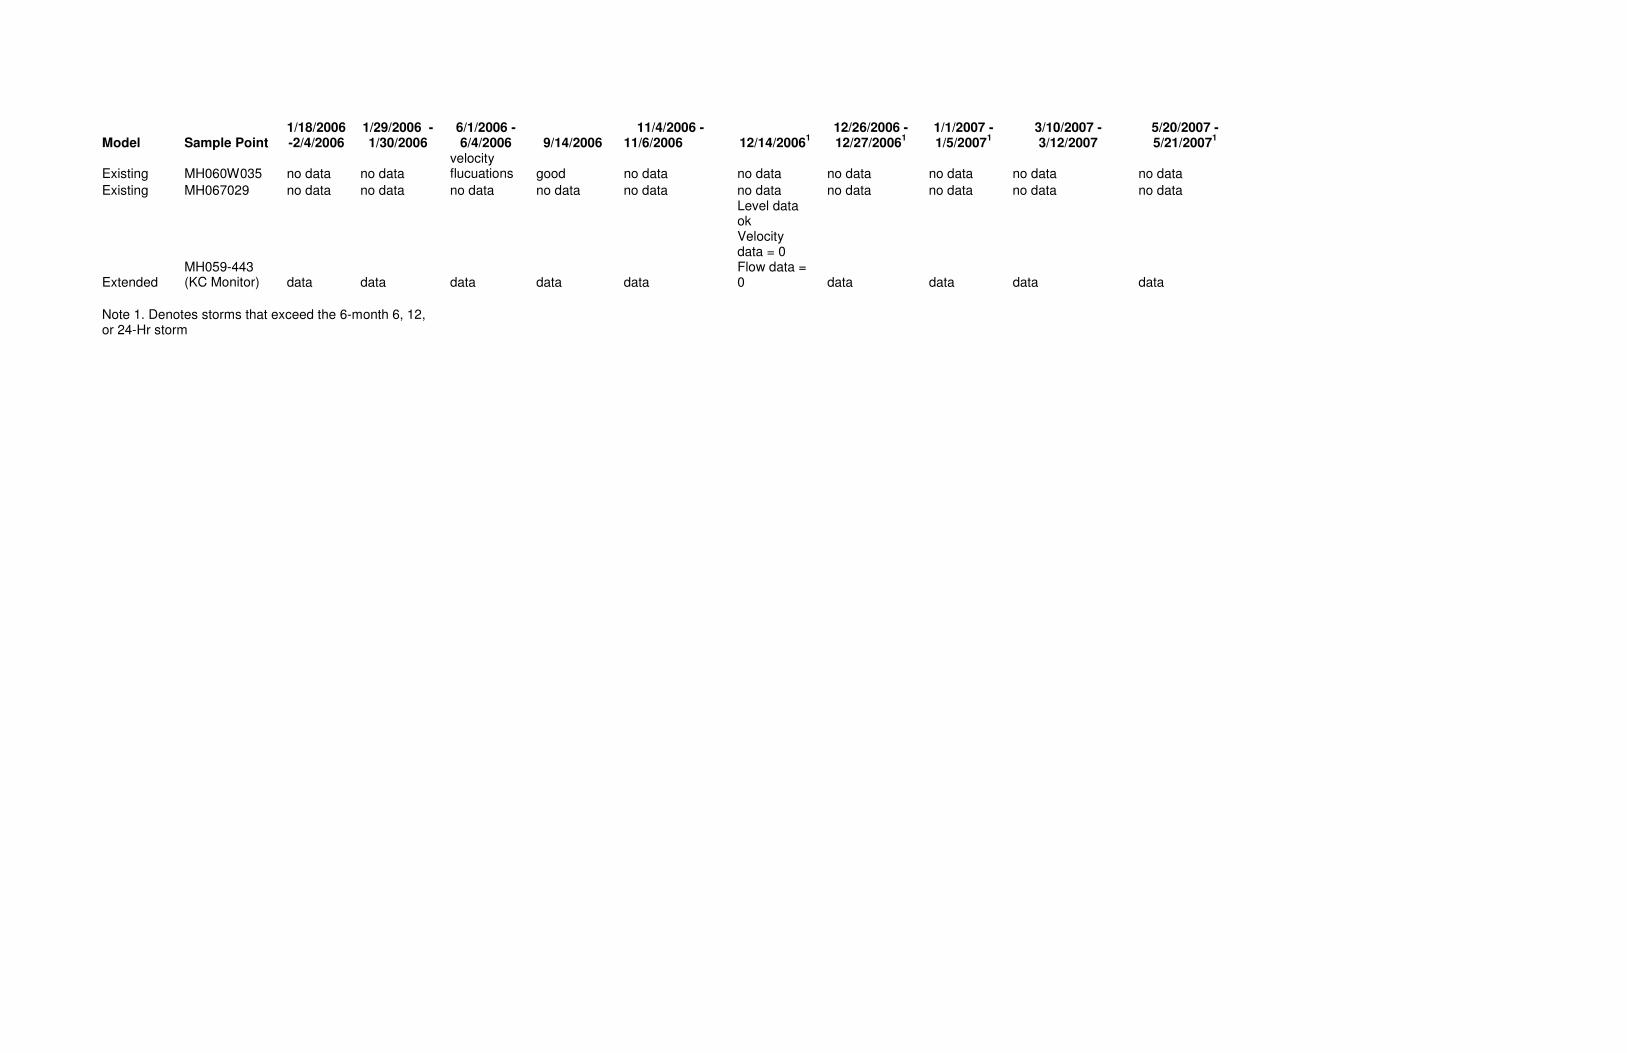
Model Sample Point 1/18/2006 -2/4/2006
1/29/2006 -1/30/2006
6/1/2006 - 6/4/2006 9/14/2006
11/4/2006 - 11/6/2006 12/14/2006
1
12/26/2006 - 12/27/2006
1
1/1/2007 - 1/5/2007
1
3/10/2007 - 3/12/2007
5/20/2007 - 5/21/2007
1
Existing MH060W035 no data no data velocity flucuations good no data no data no data no data no data no data
Existing MH067029 no data no data no data no data no data no data no data no data no data no data
Extended MH059-443 (KC Monitor) data data data data data
Level data ok Velocity data = 0 Flow data = 0 data data data data
Note 1. Denotes storms that exceed the 6-month 6, 12, or 24-Hr storm

WA 1.0 - GENESEE BASIN FLOW MONITORING STUDY PAGE 55 OF 62 QUALITY ASSURANCE PROJECT PLAN
Revision: R1D0 Effective date: 8/19/2008 This is an UNCONTROLLED DOCUMENT.
Appendix B: Monitoring Location Maps and Schematic
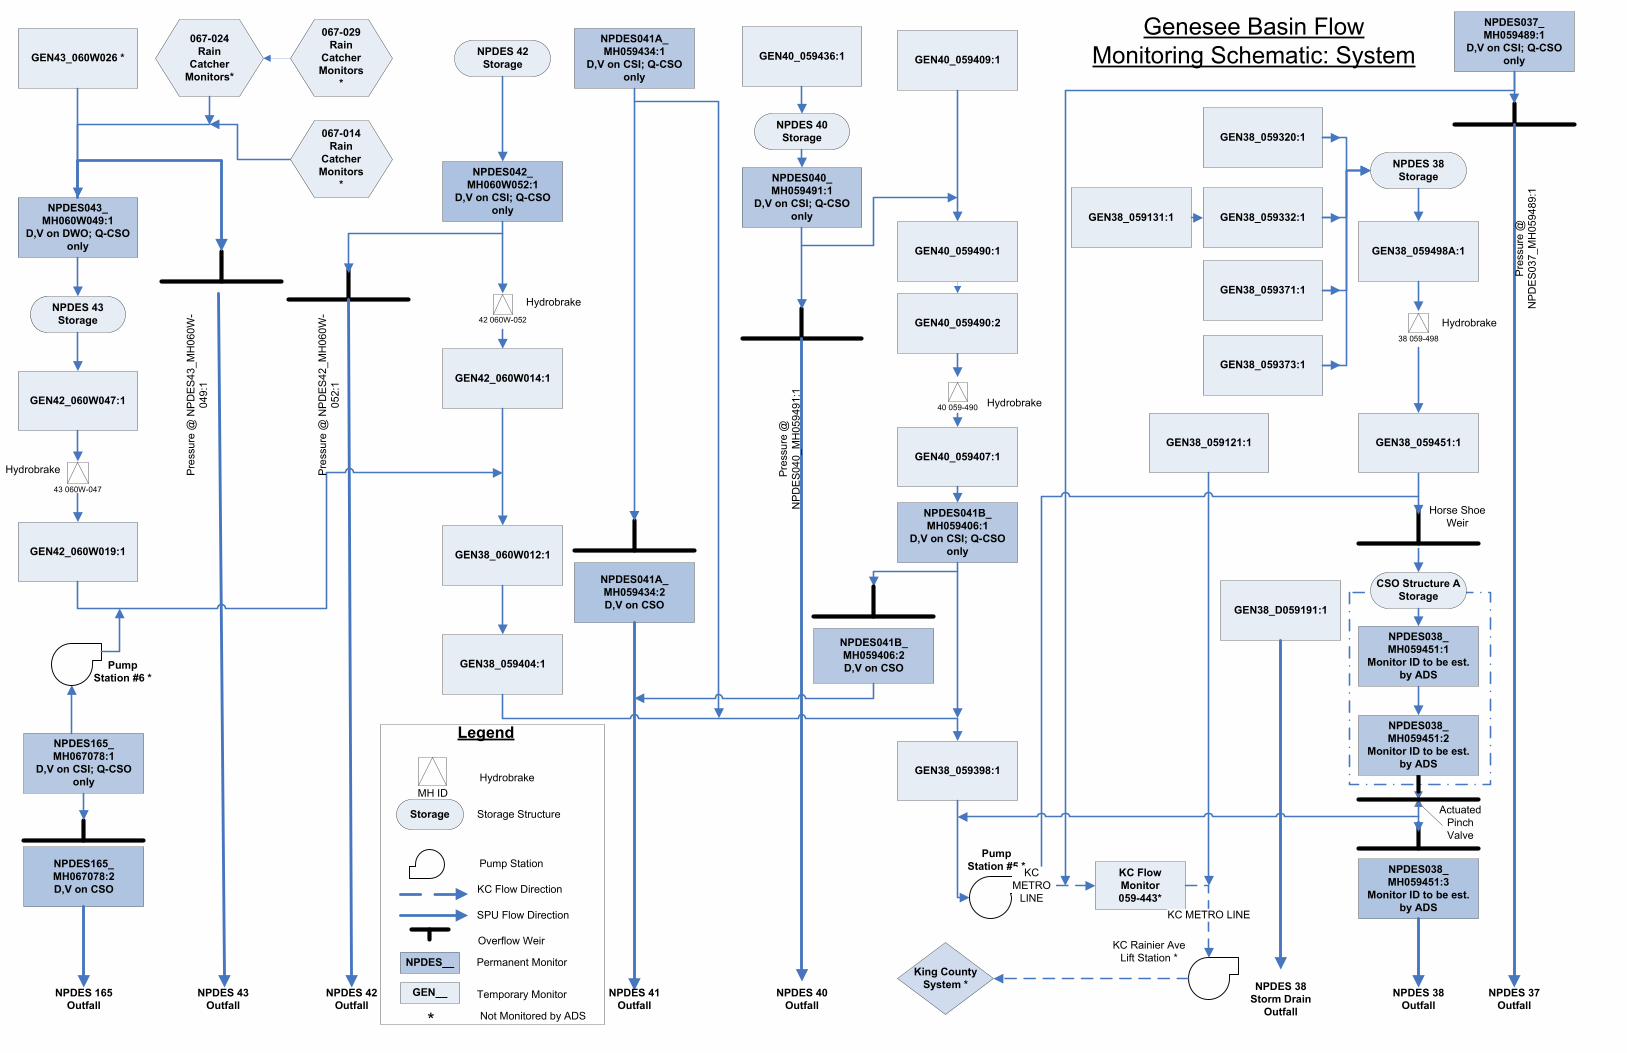
NPDES165_
MH067078:1
D,V on CSI; Q-CSO
only
NPDES165_
MH067078:2
D,V on CSO
NPDES 165
Outfall
Pump
Station #6 *
NPDES043_
MH060W049:1
D,V on DWO; Q-CSO
only
43 060W-047
NPDES 43
Storage
NPDES 43
Outfall
GEN42_060W047:1
GEN42_060W019:1
GEN43_060W026 *
067-024
Rain
Catcher
Monitors*
067-014
Rain
Catcher
Monitors
*NPDES042_
MH060W052:1
D,V on CSI; Q-CSO
only
NPDES 42
Outfall
GEN42_060W014:1
42 060W-052
NPDES 42
Storage
GEN38_060W012:1
GEN38_059404:1
GEN40_059409:1
GEN40_059490:1
NPDES 40
Storage
40 059-490
NPDES040_
MH059491:1
D,V on CSI; Q-CSO
only
GEN40_059407:1
NPDES041B_
MH059406:1
D,V on CSI; Q-CSO
only
NPDES 40
Outfall
GEN38_059398:1
GEN38_059320:1
GEN38_059332:1
GEN38_059371:1
GEN38_059373:1
NPDES 38
Storage
GEN38_059498A:1
38 059-498
NPDES038_
MH059451:1
Monitor ID to be est.
by ADS
NPDES038_
MH059451:3
Monitor ID to be est.
by ADS
NPDES 38
Outfall
GEN38_059131:1
NPDES037_
MH059489:1
D,V on CSI; Q-CSO
only
NPDES 37
Outfall
Pump
Station #5 *
King County
System *
GEN38_059121:1
NPDES041A_
MH059434:1
D,V on CSI; Q-CSO
only
NPDES041A_
MH059434:2
D,V on CSO
NPDES 41
Outfall
NPDES041B_
MH059406:2
D,V on CSO
`
GEN40_059436:1
CSO Structure A
Storage
Actuated
Pinch
Valve
KC Rainier Ave
Lift Station *
KC
METRO
LINE
Hydrobrake
Hydrobrake
Hydrobrake
Hydrobrake
Horse Shoe
Weir
Pressure @
NPDES43_MH060W-
049:1
Pressure @
NPDES42_MH060W-
052:1
GEN38_D059191:1
Pressure @
NPDES040_MH059491:1
GEN40_059490:2
Pressure @
NPDES037_MH059489:1
NPDES 38
Storm Drain
Outfall
067-029
Rain
Catcher
Monitors
*
GEN38_059451:1
KC Flow
Monitor
059-443*
KC METRO LINE
NPDES038_
MH059451:2
Monitor ID to be est.
by ADS
NPDES__
GEN__
Storage
MH ID
Temporary Monitor
Permanent Monitor
Overflow Weir
SPU Flow Direction
KC Flow Direction
Pump Station
Storage Structure
Hydrobrake
Not Monitored by ADS*
Legend
Genesee Basin Flow
Monitoring Schematic: System
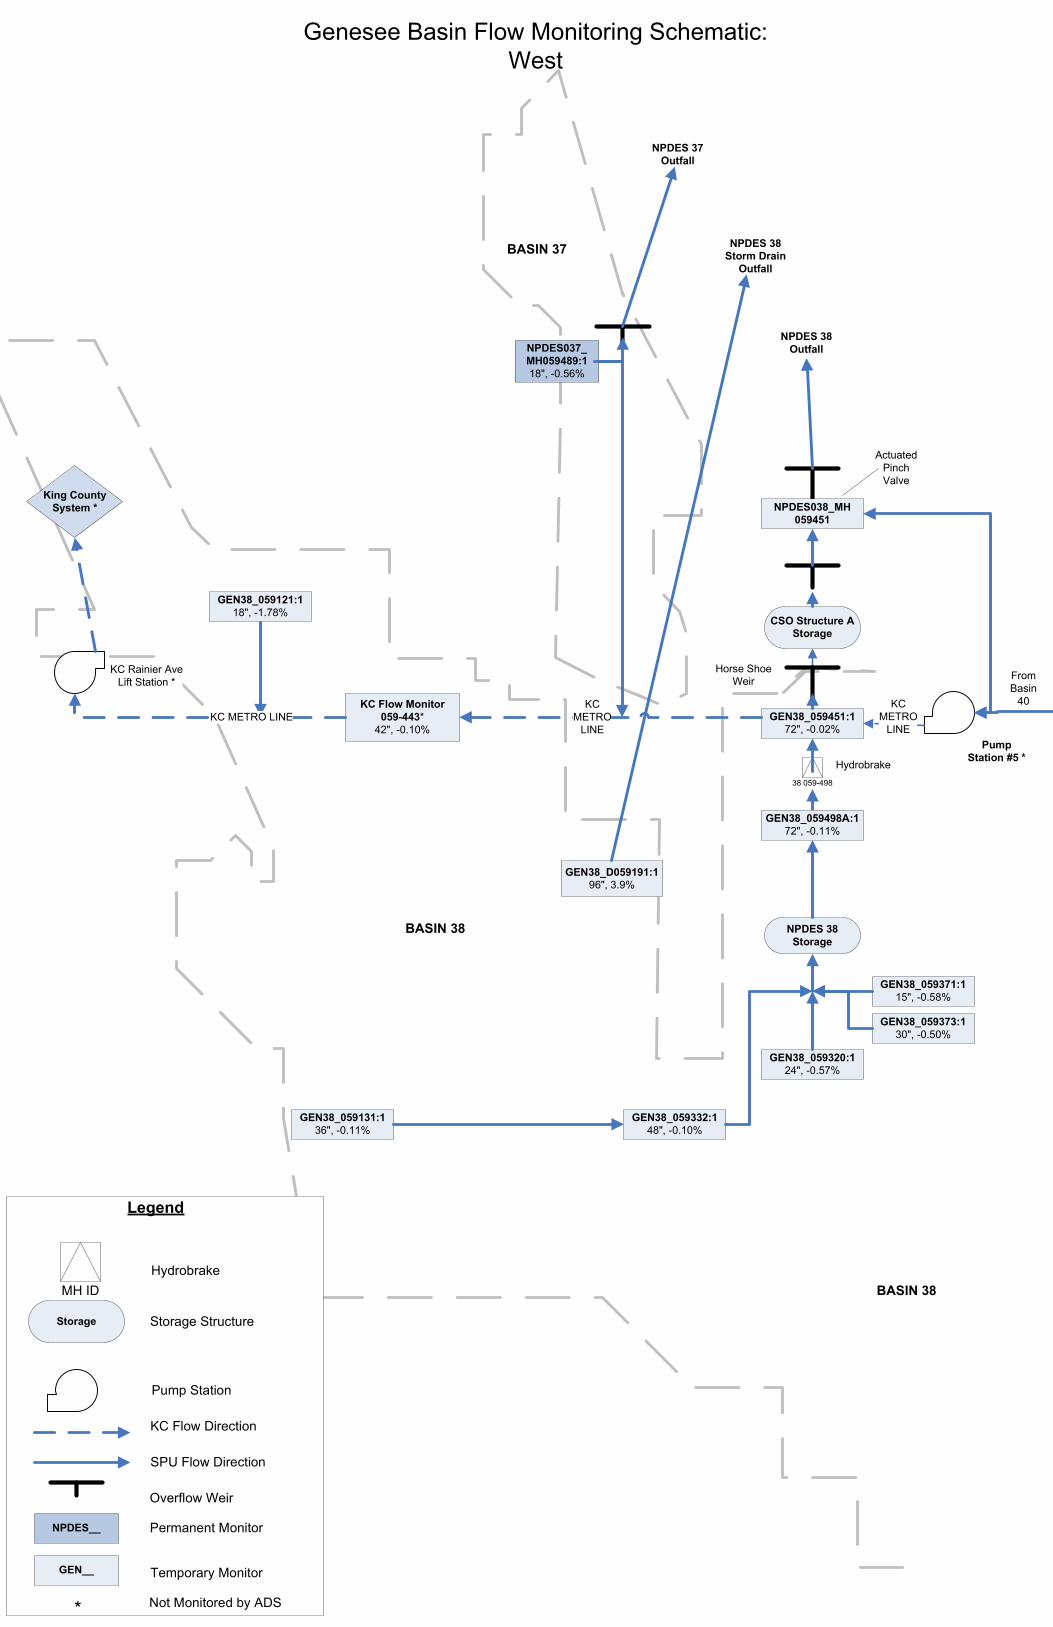
GEN38_059320:1
24", -0.57%
GEN38_059332:1
48", -0.10%
GEN38_059371:1
15", -0.58%
GEN38_059373:1
30", -0.50%
NPDES 38
Storage
38 059-498
GEN38_059131:1
36", -0.11%
NPDES037_
MH059489:1
18", -0.56%
NPDES 37
Outfall
Pump
Station #5 *
King County
System *
KC Rainier Ave
Lift Station *
KC
METRO
LINE
Hydrobrake
GEN38_D059191:1
96", 3.9%
NPDES 38
Storm Drain
Outfall
GEN38_059451:1
72", -0.02%
KC Flow Monitor
059-443*
42", -0.10%
KC METRO LINE
NPDES 38
Outfall
`Horse Shoe
Weir
CSO Structure A
Storage
Actuated
Pinch
Valve
GEN38_059121:1
18", -1.78%
GEN38_059498A:1
72", -0.11%
KC
METRO
LINE
NPDES038_MH
059451
BASIN 37
BASIN 38
BASIN 38
NPDES__
GEN__
Storage
MH ID
Temporary Monitor
Permanent Monitor
Overflow Weir
SPU Flow Direction
KC Flow Direction
Pump Station
Storage Structure
Hydrobrake
Not Monitored by ADS*
Legend
Genesee Basin Flow Monitoring Schematic:
West
From
Basin
40
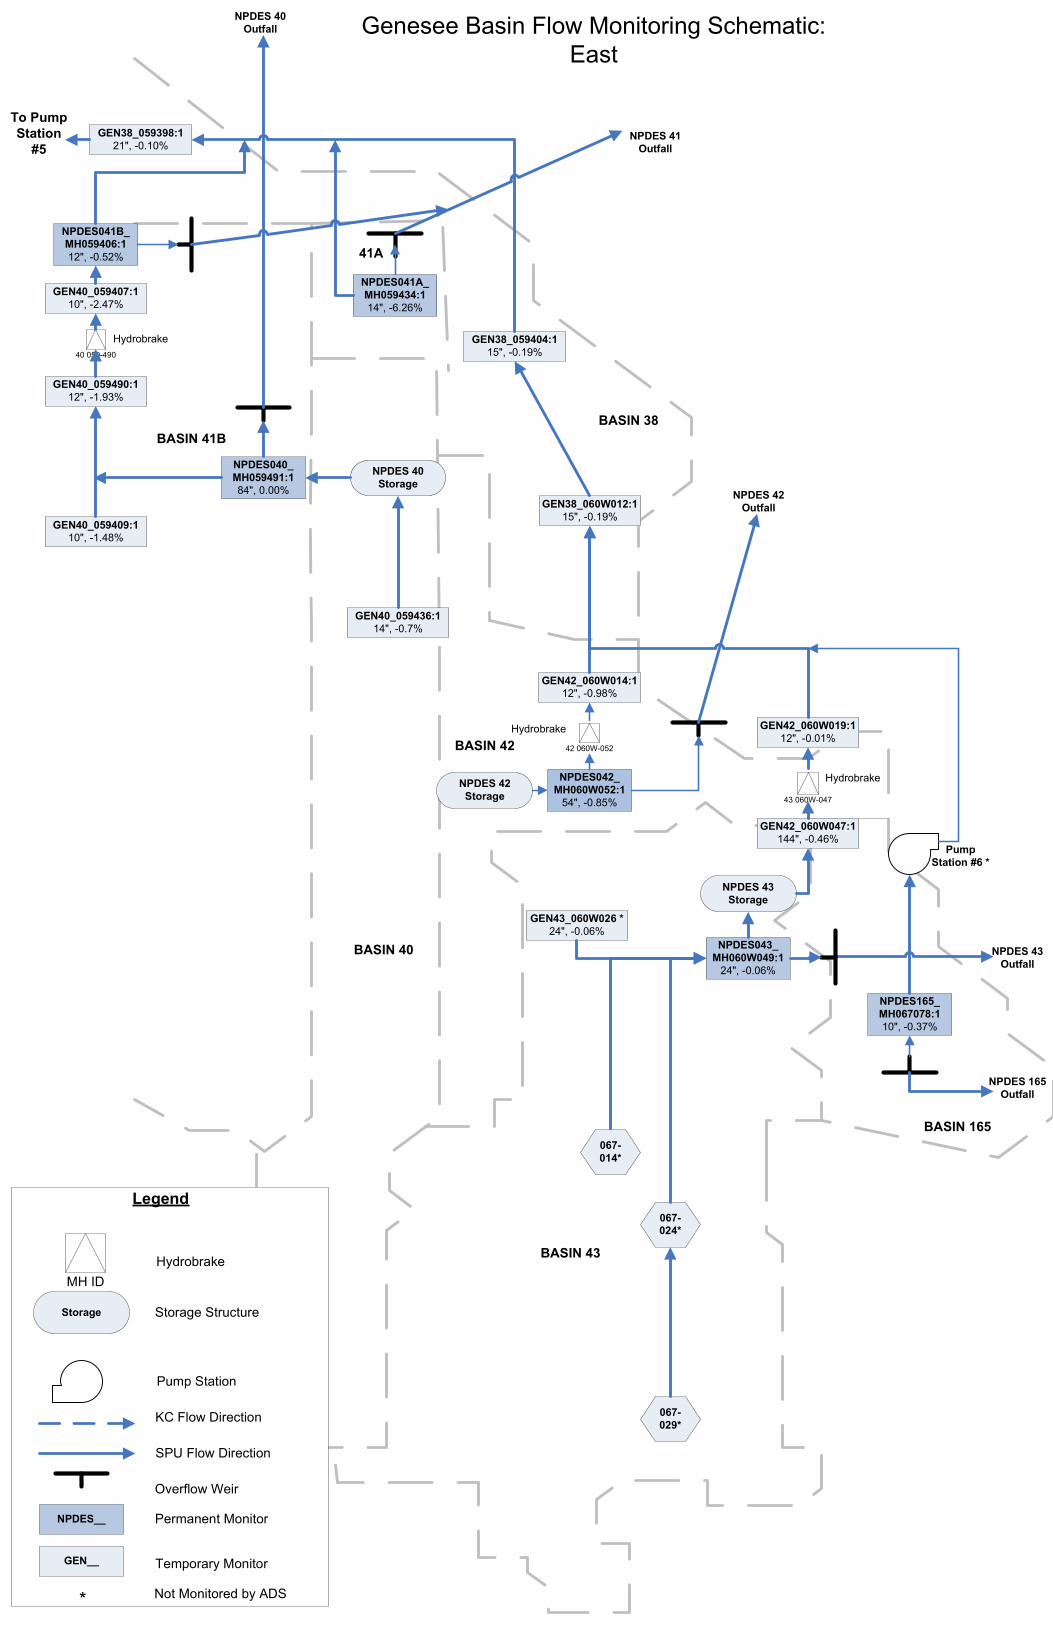
BASIN 38
41A
BASIN 41B
BASIN 42
BASIN 43
BASIN 165
BASIN 40
NPDES165_
MH067078:1
10", -0.37%
NPDES 165
Outfall
Pump
Station #6 *
NPDES043_
MH060W049:1
24", -0.06%
43 060W-047
NPDES 43
Storage
NPDES 43
Outfall
GEN42_060W047:1
144", -0.46%
GEN42_060W019:1
12", -0.01%
GEN43_060W026 *
24", -0.06%
067-
024*
067-
014*
NPDES042_
MH060W052:1
54", -0.85%
NPDES 42
Outfall
GEN42_060W014:1
12", -0.98%
42 060W-052
NPDES 42
Storage
GEN38_059404:1
15", -0.19%
GEN40_059409:1
10", -1.48%
GEN40_059490:1
12", -1.93%
NPDES 40
Storage
40 059-490
NPDES040_
MH059491:1
84", 0.00%
GEN40_059407:1
10", -2.47%
NPDES041B_
MH059406:1
12", -0.52%
NPDES 40
Outfall
GEN38_059398:1
21", -0.10%
NPDES041A_
MH059434:1
14", -6.26%
NPDES 41
Outfall
`
GEN40_059436:1
14", -0.7%
Hydrobrake
Hydrobrake
Hydrobrake
067-
029*
GEN38_060W012:1
15", -0.19%
To Pump
Station
#5
NPDES__
GEN__
Storage
MH ID
Temporary Monitor
Permanent Monitor
Overflow Weir
SPU Flow Direction
KC Flow Direction
Pump Station
Storage Structure
Hydrobrake
Not Monitored by ADS*
Legend
Genesee Basin Flow Monitoring Schematic:
East
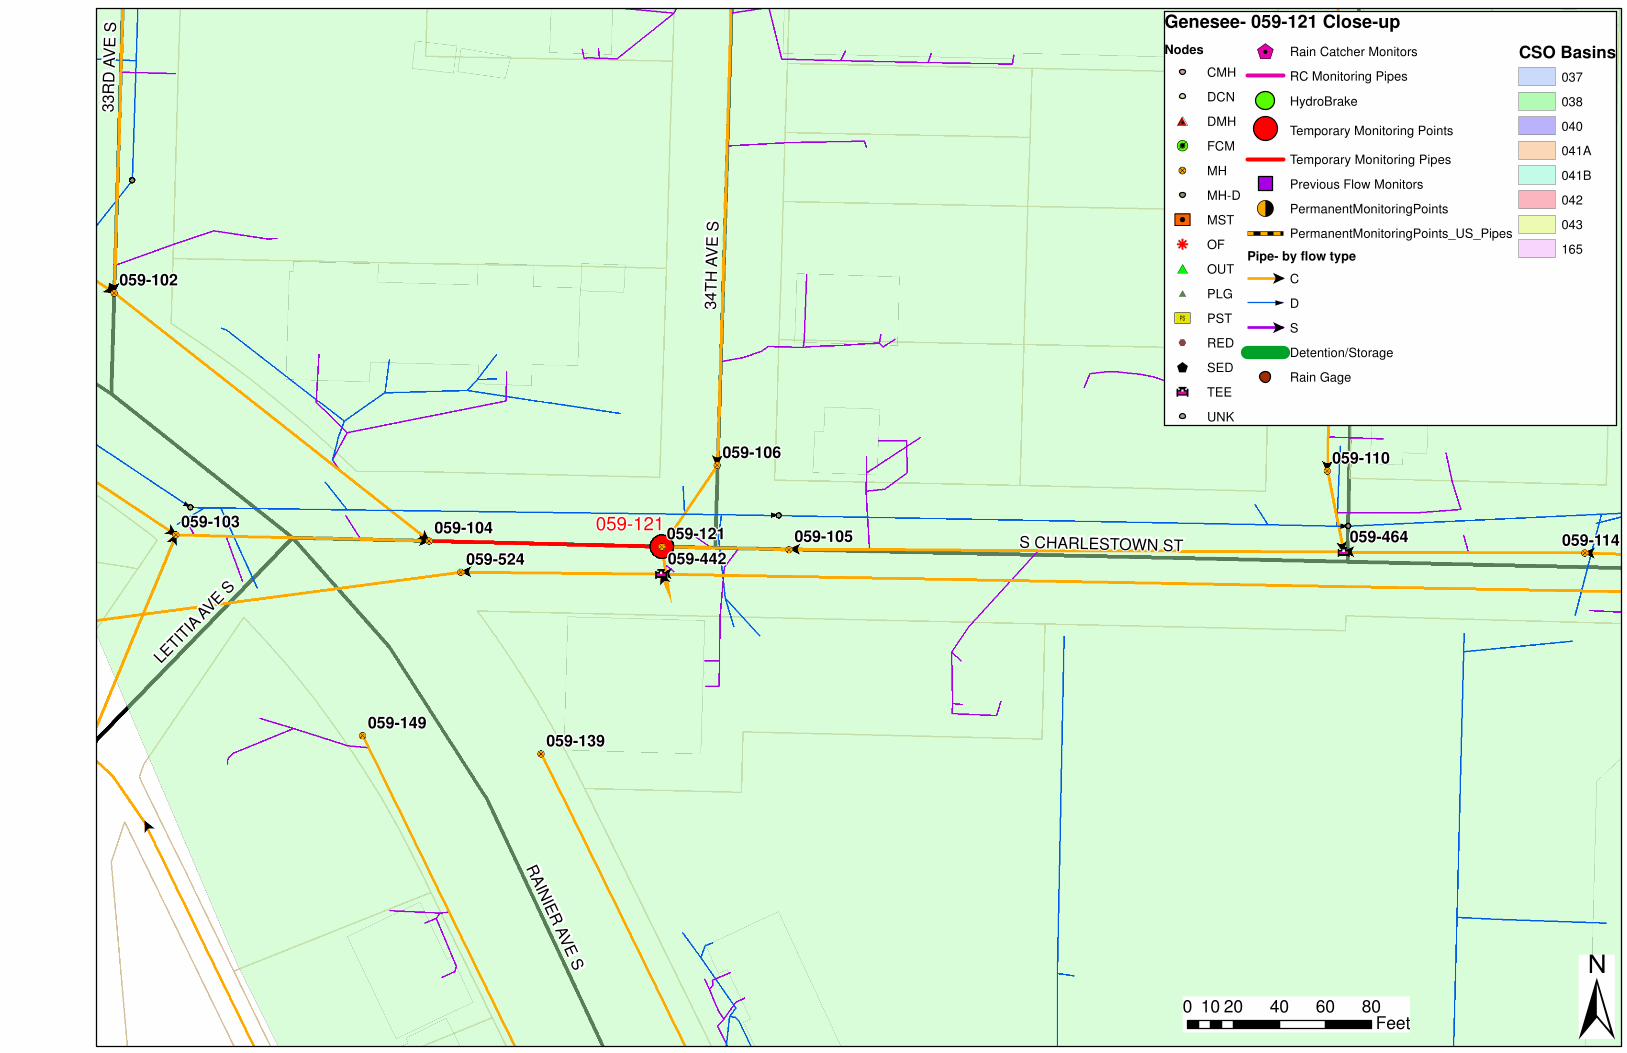
059-139059-149
059-442059-524059-114059-464059-105059-121059-104059-103
059-110059-106
059-102
059-121S CHARLESTOWN STS CHARLESTOWN ST
RA
INIE
R A
VE
S
RA
INIE
R A
VE
S
35
TH
AV
E S
35
TH
AV
E S
34
TH
AV
E S
34
TH
AV
E S
33
RD
AV
E S
33
RD
AV
E S
LETIT
IA A
VE S
LETIT
IA A
VE S
Genesee- 059-121 Close-up
Nodes
CMH
DCN
#0 DMH
!¶R FCM
�? MH
MH-D
PO MST
h OF
#* OUT
#* PLG
�� PST
%, RED
$ SED
Ð�î�
" TEE
UNK
$1 Rain Catcher Monitors
RC Monitoring Pipes
HydroBrake
Temporary Monitoring Points
Temporary Monitoring Pipes
Previous Flow Monitors
!< PermanentMonitoringPoints
PermanentMonitoringPoints_US_Pipes
Pipe- by flow type
$ C
D
$ S
Detention/Storage
Rain Gage
CSO Basins
037
038
040
041A
041B
042
043
165
±0 20 40 60 8010Feet
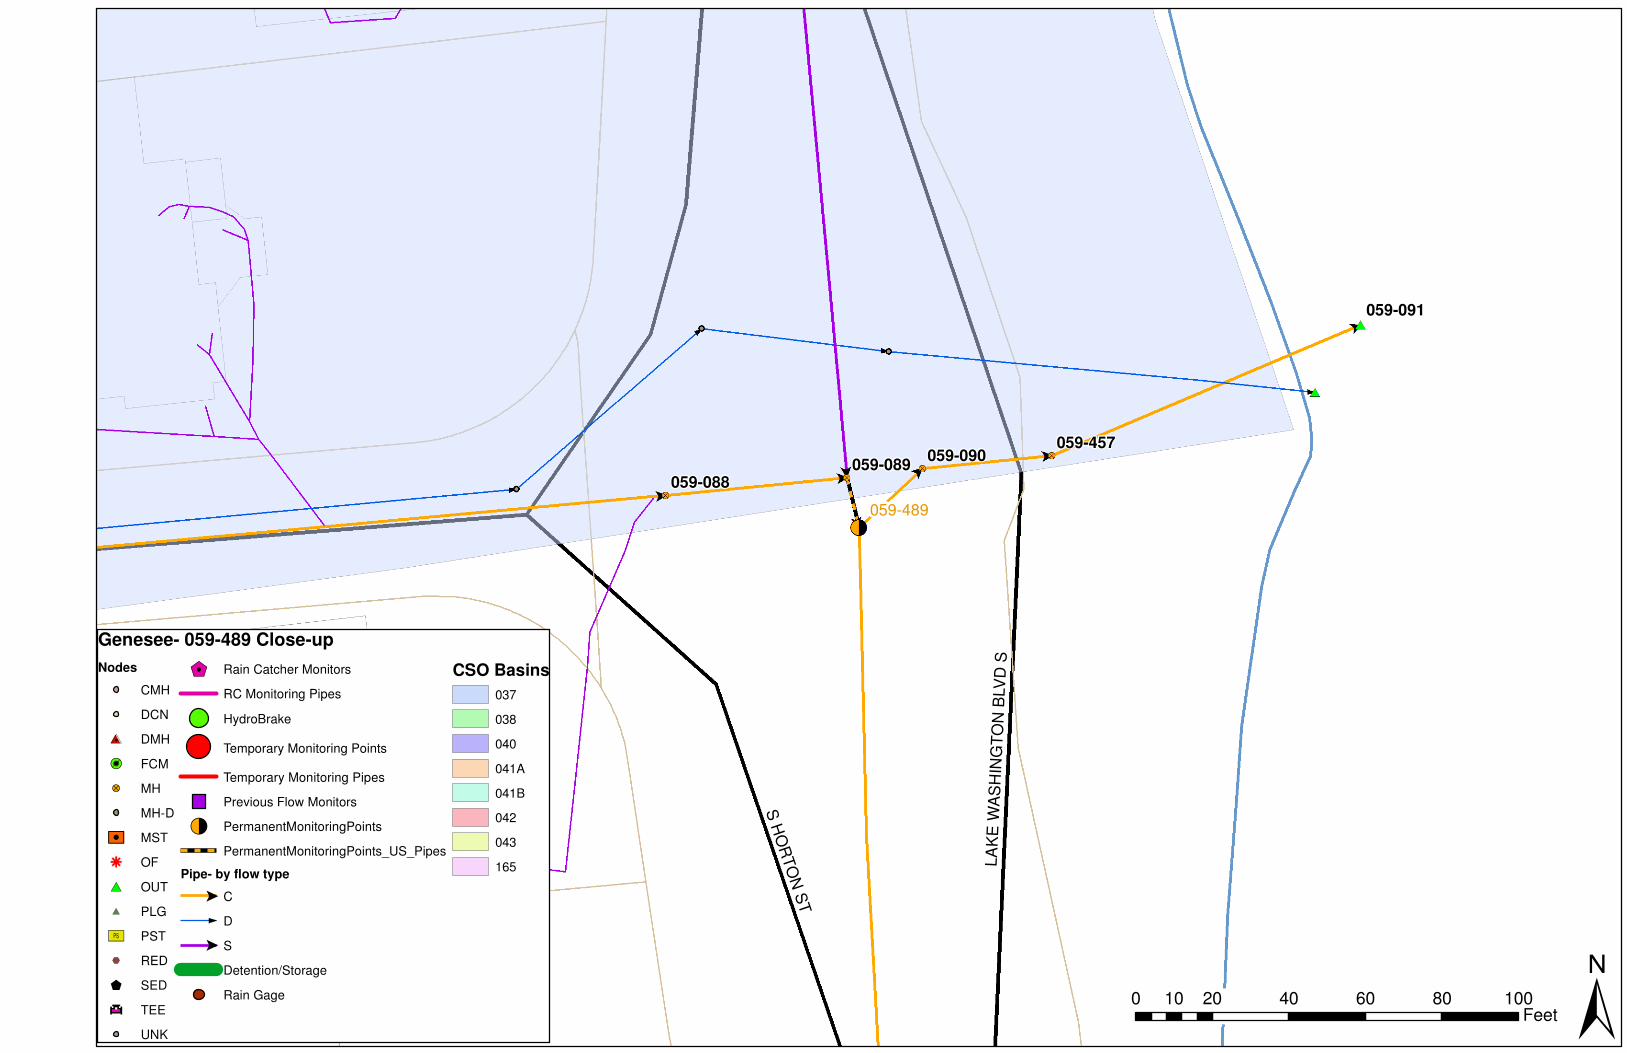
059-091
059-088059-089
059-090059-457
059-489
S H
OR
TO
N S
T
S H
OR
TO
N S
T
LA
KE
WA
SH
ING
TO
N B
LVD
SLA
KE
WA
SH
ING
TO
N B
LVD
S
Genesee- 059-489 Close-up
Nodes
CMH
DCN
#0 DMH
!¶R FCM
�? MH
MH-D
PO MST
h OF
#* OUT
#* PLG
�� PST
%, RED
$ SED
Ð�î�
" TEE
UNK
$1 Rain Catcher Monitors
RC Monitoring Pipes
HydroBrake
Temporary Monitoring Points
Temporary Monitoring Pipes
Previous Flow Monitors
!< PermanentMonitoringPoints
PermanentMonitoringPoints_US_Pipes
Pipe- by flow type
$ C
D
$ S
Detention/Storage
Rain Gage
CSO Basins
037
038
040
041A
041B
042
043
165
±0 20 40 60 80 10010Feet
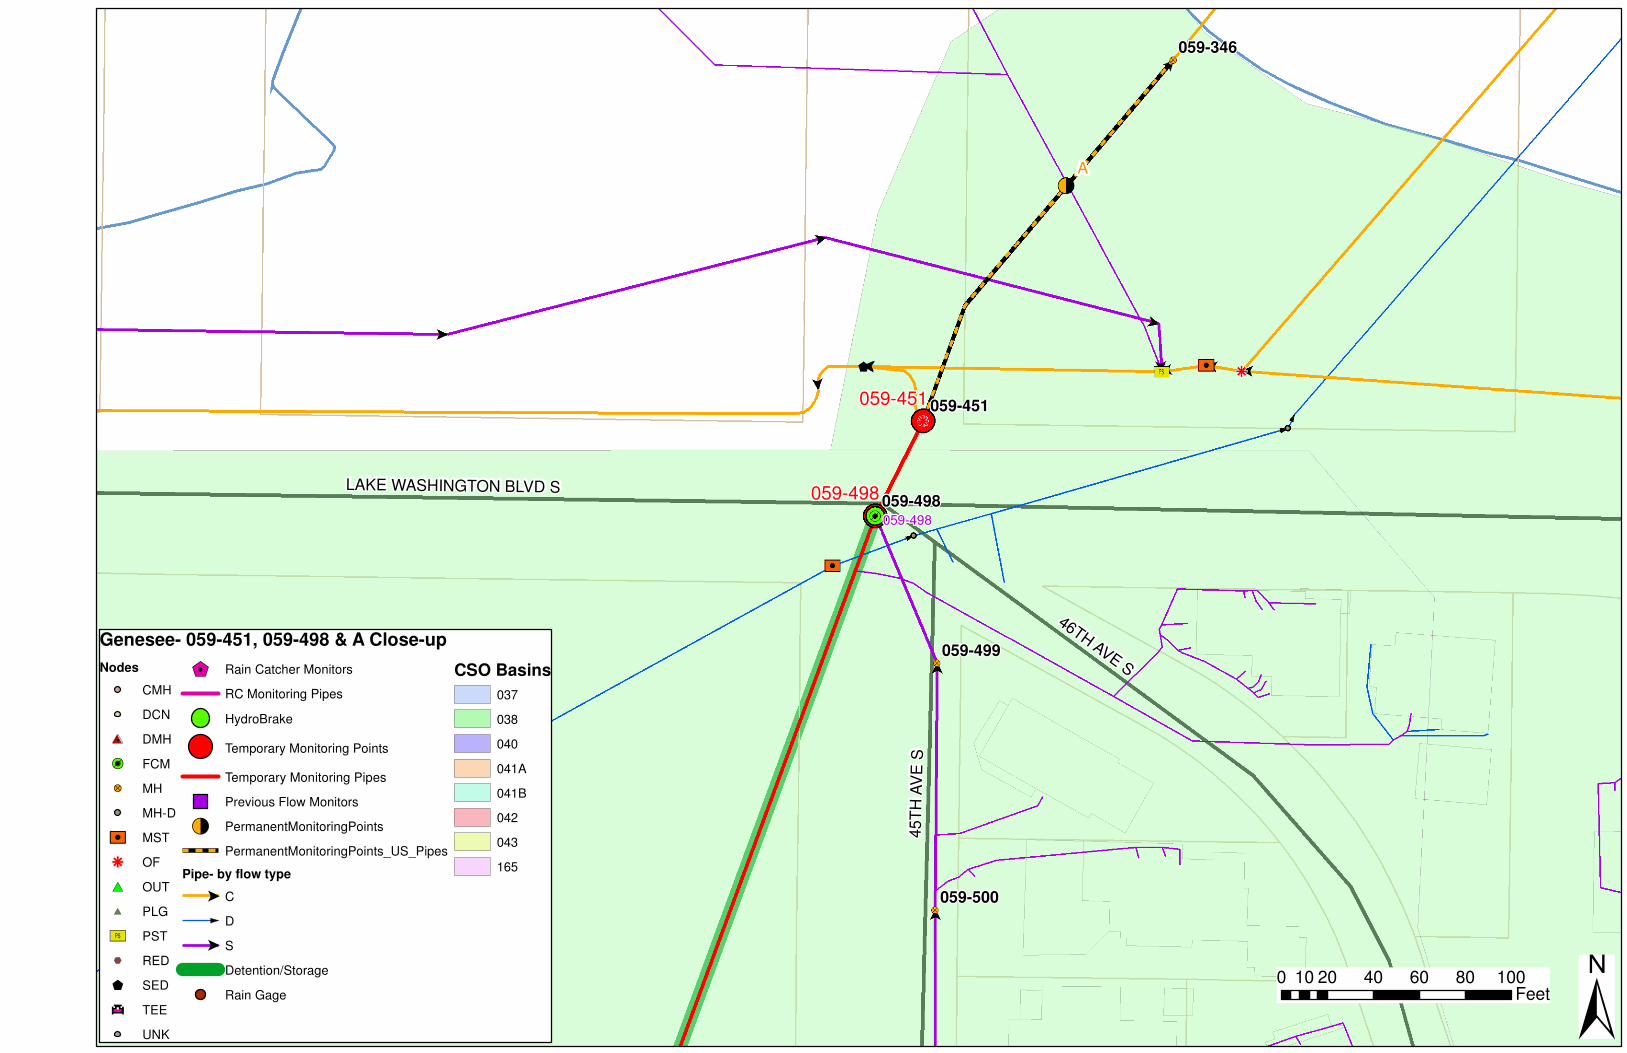
059-346
059-451
059-500
059-499
059-498
059-451
059-498
059-498
A
46TH AVE S
46TH AVE S
LAKE WASHINGTON BLVD SLAKE WASHINGTON BLVD S
45
TH
AV
E S
45
TH
AV
E S
Genesee- 059-451, 059-498 & A Close-up
Nodes
CMH
DCN
#0 DMH
!¶R FCM
�? MH
MH-D
PO MST
h OF
#* OUT
#* PLG
�� PST
%, RED
$ SED
Ð�î�
" TEE
UNK
$1 Rain Catcher Monitors
RC Monitoring Pipes
HydroBrake
Temporary Monitoring Points
Temporary Monitoring Pipes
Previous Flow Monitors
!< PermanentMonitoringPoints
PermanentMonitoringPoints_US_Pipes
Pipe- by flow type
$ C
D
$ S
Detention/Storage
Rain Gage
CSO Basins
037
038
040
041A
041B
042
043
165
±0 20 40 60 80 10010
Feet
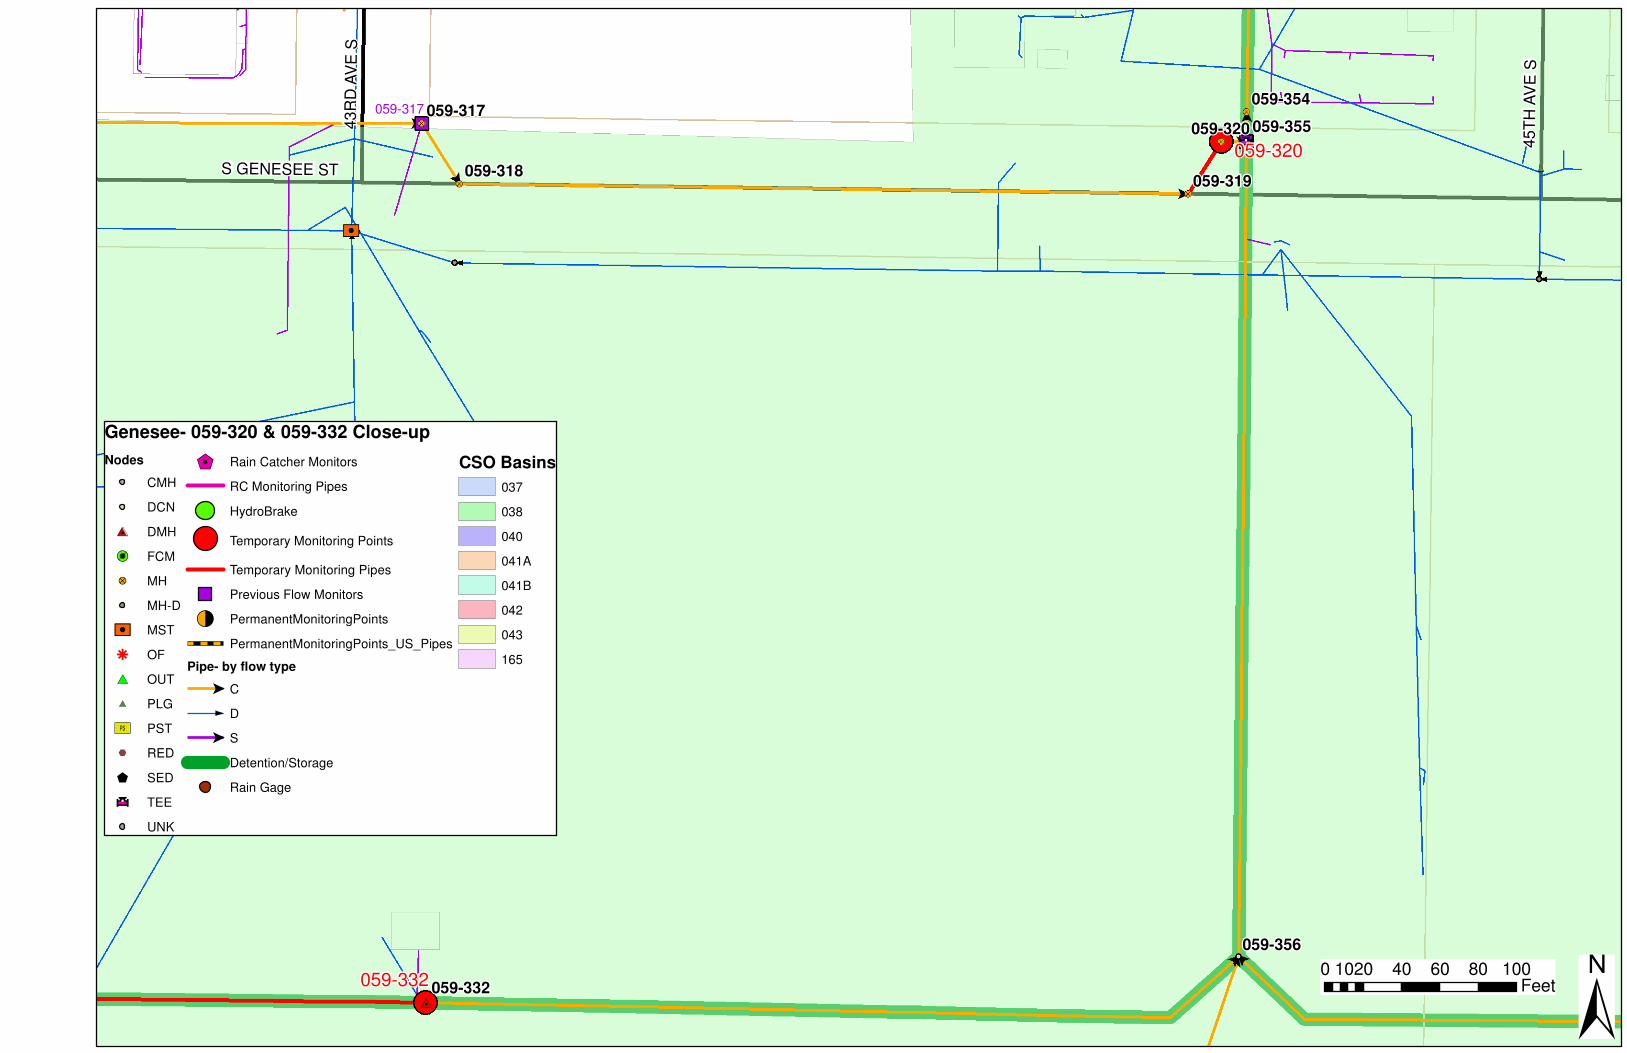
059-317
059-332
059-356
059-319059-318
059-355059-320
059-354
059-320
059-332
059-317
S GENESEE STS GENESEE ST
45
TH
AV
E S
45
TH
AV
E S
43
RD
AV
E S
43
RD
AV
E S
Genesee- 059-320 & 059-332 Close-up
Nodes
CMH
DCN
#0 DMH
!¶R FCM
�? MH
MH-D
PO MST
h OF
#* OUT
#* PLG
�� PST
%, RED
$ SED
Ð�î�
" TEE
UNK
$1 Rain Catcher Monitors
RC Monitoring Pipes
HydroBrake
Temporary Monitoring Points
Temporary Monitoring Pipes
Previous Flow Monitors
!< PermanentMonitoringPoints
PermanentMonitoringPoints_US_Pipes
Pipe- by flow type
$ C
D
$ S
Detention/Storage
Rain Gage
CSO Basins
037
038
040
041A
041B
042
043
165
±0 20 40 60 80 10010
Feet
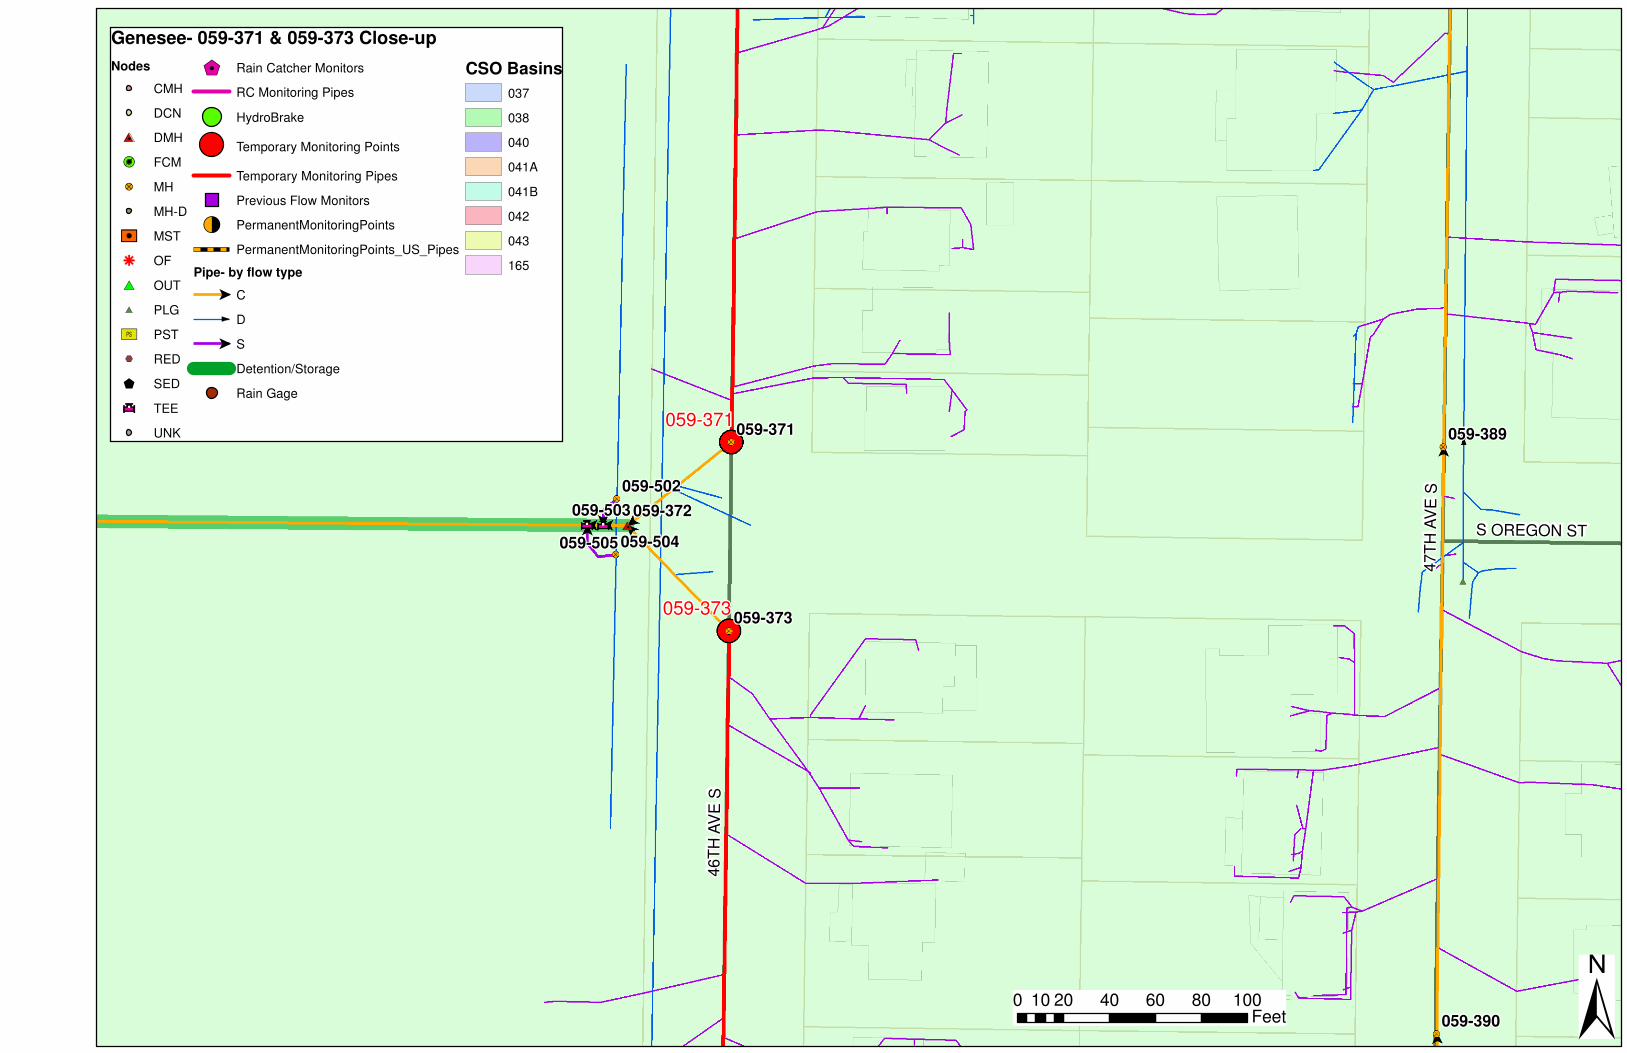
059-390
059-373
059-504
059-372059-503
059-505
059-502
059-389059-371059-371
059-373
47
TH
AV
E S
47
TH
AV
E S
46
TH
AV
E S
46
TH
AV
E S
S OREGON STS OREGON ST
Genesee- 059-371 & 059-373 Close-up
Nodes
CMH
DCN
#0 DMH
!¶R FCM
�? MH
MH-D
PO MST
h OF
#* OUT
#* PLG
�� PST
%, RED
$ SED
Ð�î�
" TEE
UNK
$1 Rain Catcher Monitors
RC Monitoring Pipes
HydroBrake
Temporary Monitoring Points
Temporary Monitoring Pipes
Previous Flow Monitors
!< PermanentMonitoringPoints
PermanentMonitoringPoints_US_Pipes
Pipe- by flow type
$ C
D
$ S
Detention/Storage
Rain Gage
CSO Basins
037
038
040
041A
041B
042
043
165
±0 20 40 60 80 10010Feet
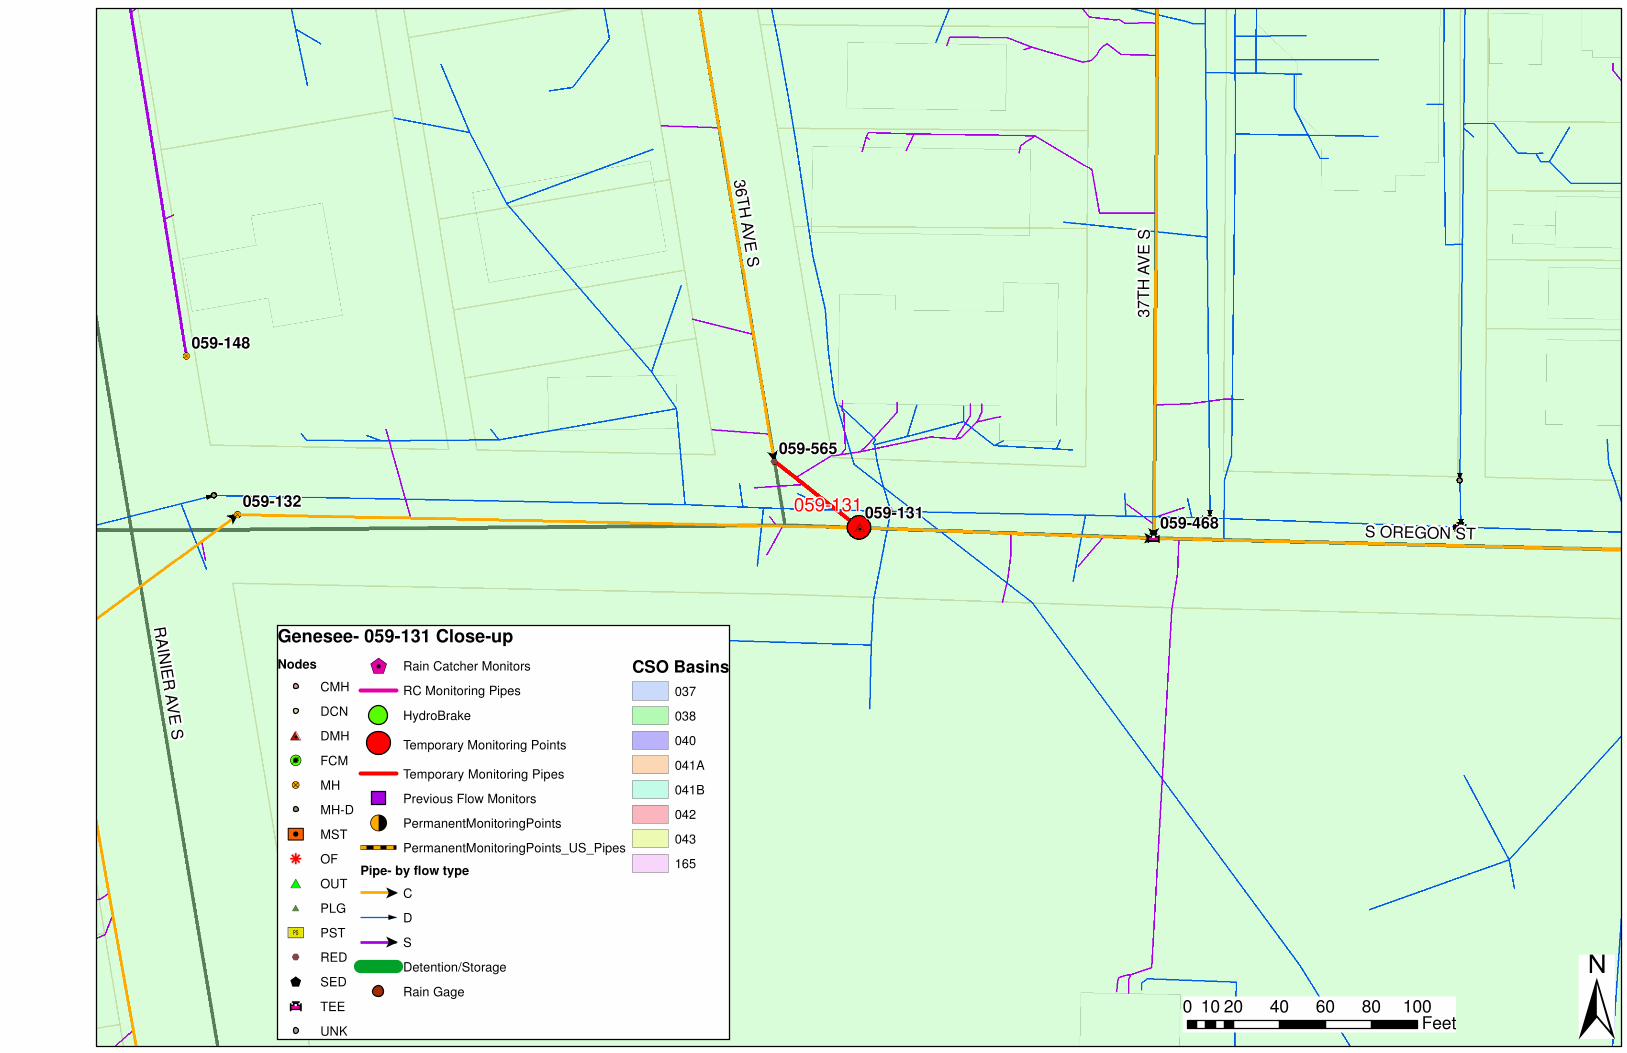
059-468059-131
059-132
059-565
059-148
059-131
S OREGON STS OREGON ST
RA
INIE
R A
VE
SR
AIN
IER
AV
E S
37
TH
AV
E S
37
TH
AV
E S
36
TH
AV
E S
36
TH
AV
E S
Genesee- 059-131 Close-up
Nodes
CMH
DCN
#0 DMH
!¶R FCM
�? MH
MH-D
PO MST
h OF
#* OUT
#* PLG
�� PST
%, RED
$ SED
Ð�î�
" TEE
UNK
$1 Rain Catcher Monitors
RC Monitoring Pipes
HydroBrake
Temporary Monitoring Points
Temporary Monitoring Pipes
Previous Flow Monitors
!< PermanentMonitoringPoints
PermanentMonitoringPoints_US_Pipes
Pipe- by flow type
$ C
D
$ S
Detention/Storage
Rain Gage
CSO Basins
037
038
040
041A
041B
042
043
165
±0 20 40 60 80 10010Feet
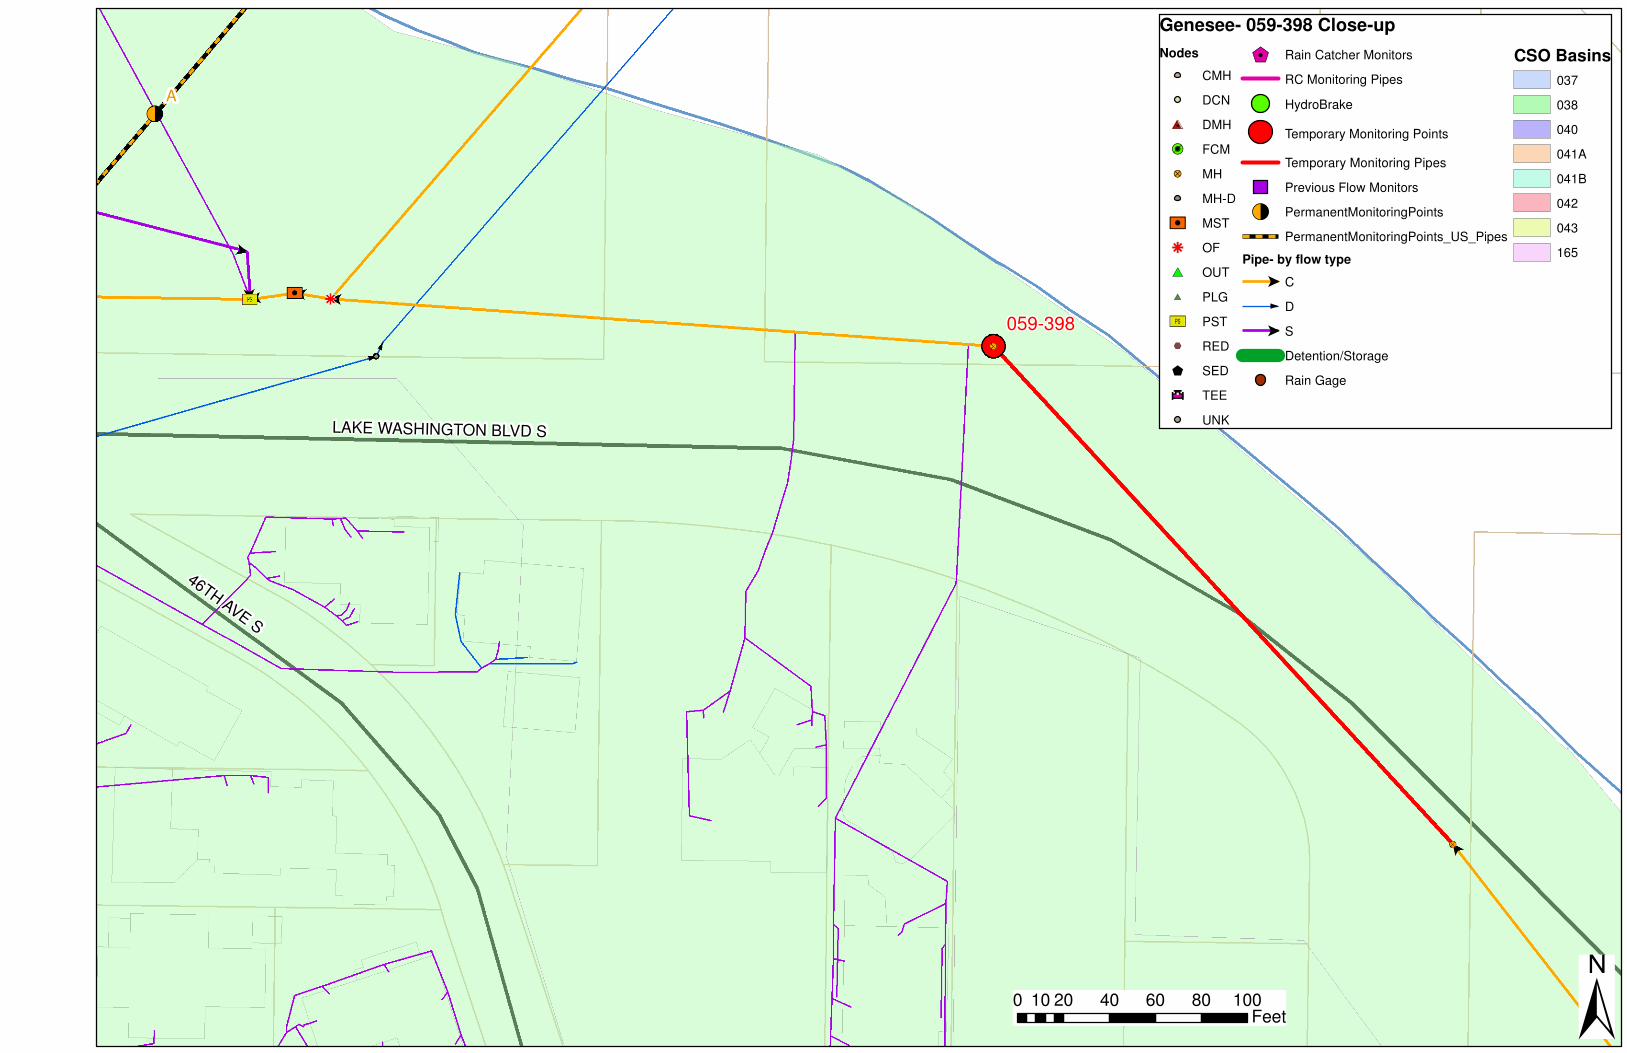
059-398
A
LAKE WASHINGTON BLVD SLAKE WASHINGTON BLVD S
46TH AVE S
46TH AVE S
Genesee- 059-398 Close-up
Nodes
CMH
DCN
#0 DMH
!¶R FCM
�? MH
MH-D
PO MST
h OF
#* OUT
#* PLG
�� PST
%, RED
$ SED
Ð�î�
" TEE
UNK
$1 Rain Catcher Monitors
RC Monitoring Pipes
HydroBrake
Temporary Monitoring Points
Temporary Monitoring Pipes
Previous Flow Monitors
!< PermanentMonitoringPoints
PermanentMonitoringPoints_US_Pipes
Pipe- by flow type
$ C
D
$ S
Detention/Storage
Rain Gage
CSO Basins
037
038
040
041A
041B
042
043
165
±0 20 40 60 80 10010Feet
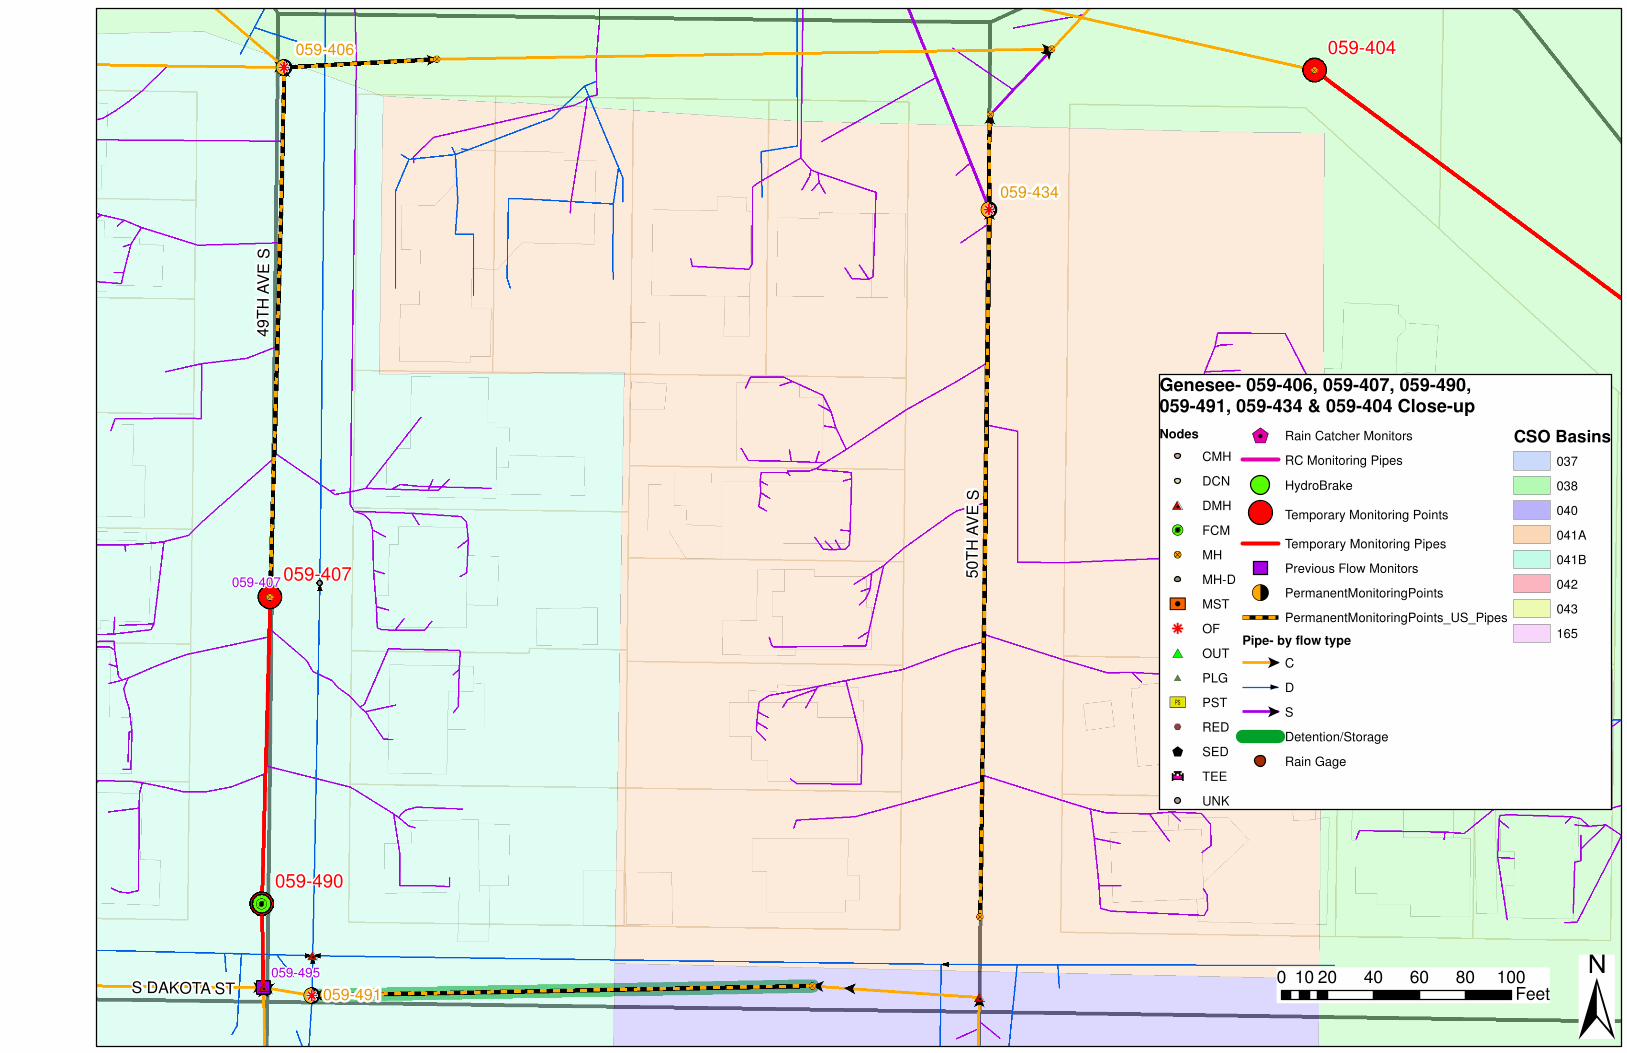
059-490
059-407
059-404
059-495
059-407
059-491
059-434
059-406
S DAKOTA STS DAKOTA ST
49
TH
AV
E S
49
TH
AV
E S
50
TH
AV
E S
50
TH
AV
E S
Genesee- 059-406, 059-407, 059-490, 059-491, 059-434 & 059-404 Close-up
Nodes
CMH
DCN
#0 DMH
!¶R FCM
�? MH
MH-D
PO MST
h OF
#* OUT
#* PLG
�� PST
%, RED
$ SED
Ð�î�
" TEE
UNK
$1 Rain Catcher Monitors
RC Monitoring Pipes
HydroBrake
Temporary Monitoring Points
Temporary Monitoring Pipes
Previous Flow Monitors
!< PermanentMonitoringPoints
PermanentMonitoringPoints_US_Pipes
Pipe- by flow type
$ C
D
$ S
Detention/Storage
Rain Gage
CSO Basins
037
038
040
041A
041B
042
043
165
±0 20 40 60 80 10010
Feet
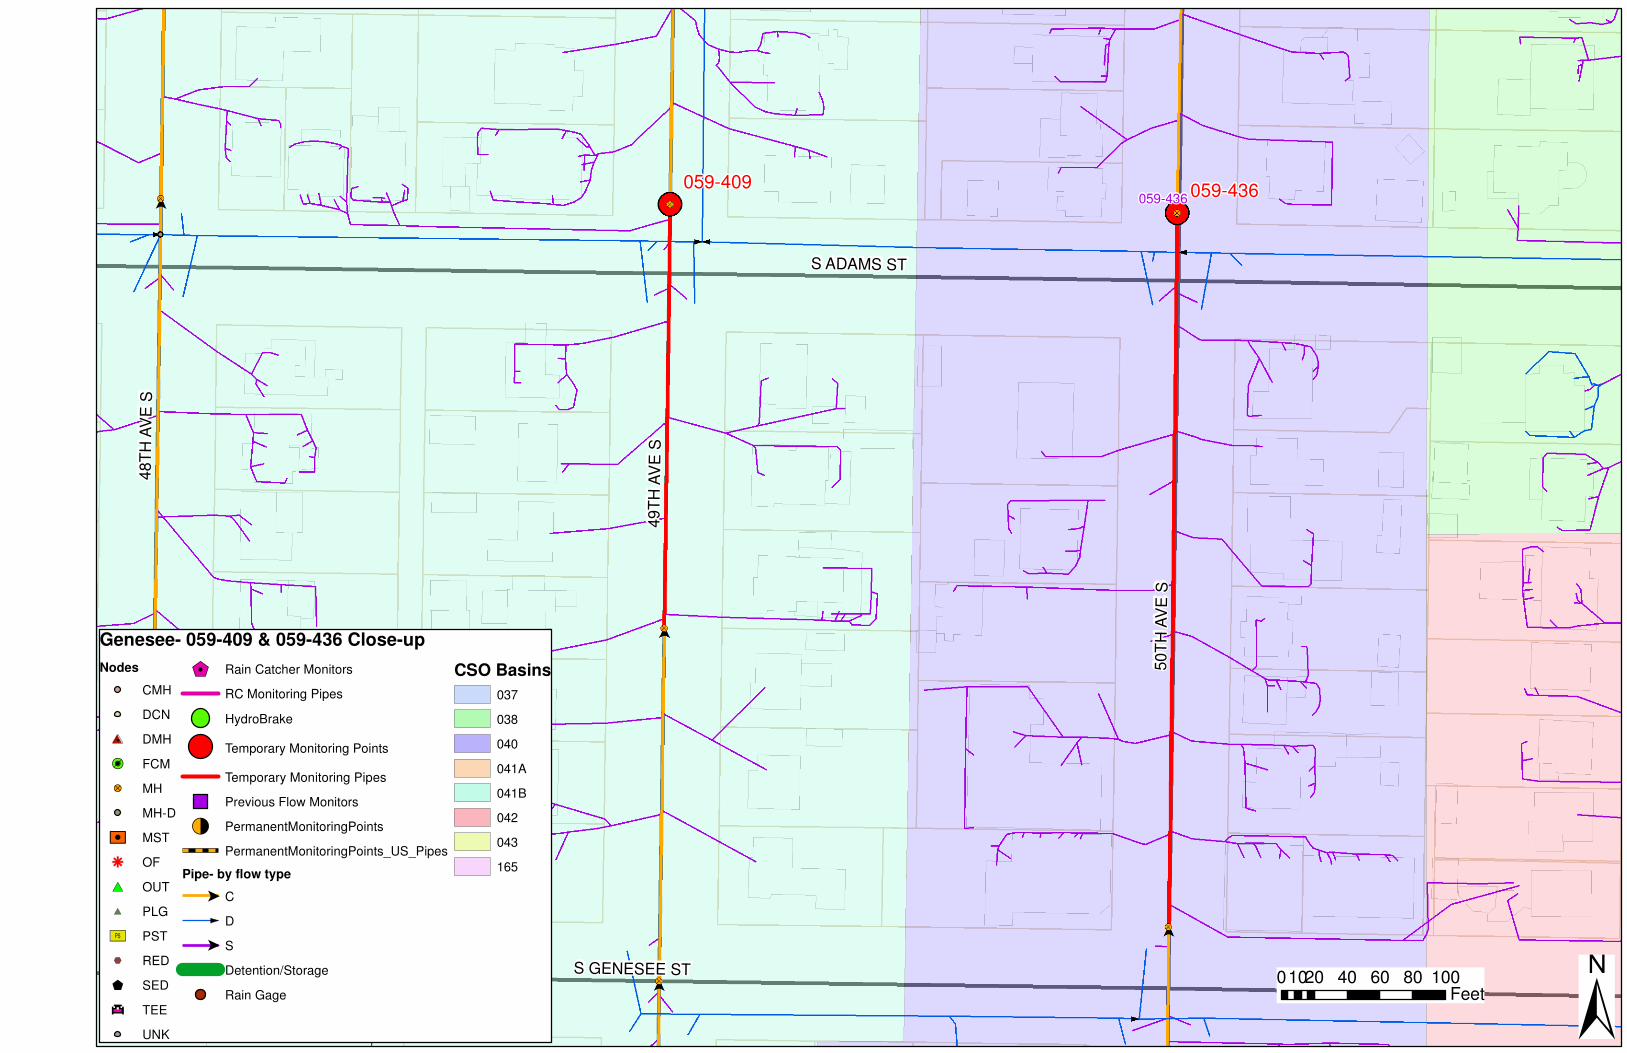
059-436059-409059-436
S ADAMS STS ADAMS ST
S GENESEE STS GENESEE ST
50
TH
AV
E S
50
TH
AV
E S
49
TH
AV
E S
49
TH
AV
E S
48
TH
AV
E S
48
TH
AV
E S
Genesee- 059-409 & 059-436 Close-up
Nodes
CMH
DCN
#0 DMH
!¶R FCM
�? MH
MH-D
PO MST
h OF
#* OUT
#* PLG
�� PST
%, RED
$ SED
Ð�î�
" TEE
UNK
$1 Rain Catcher Monitors
RC Monitoring Pipes
HydroBrake
Temporary Monitoring Points
Temporary Monitoring Pipes
Previous Flow Monitors
!< PermanentMonitoringPoints
PermanentMonitoringPoints_US_Pipes
Pipe- by flow type
$ C
D
$ S
Detention/Storage
Rain Gage
CSO Basins
037
038
040
041A
041B
042
043
165
±0 20 40 60 80 10010
Feet
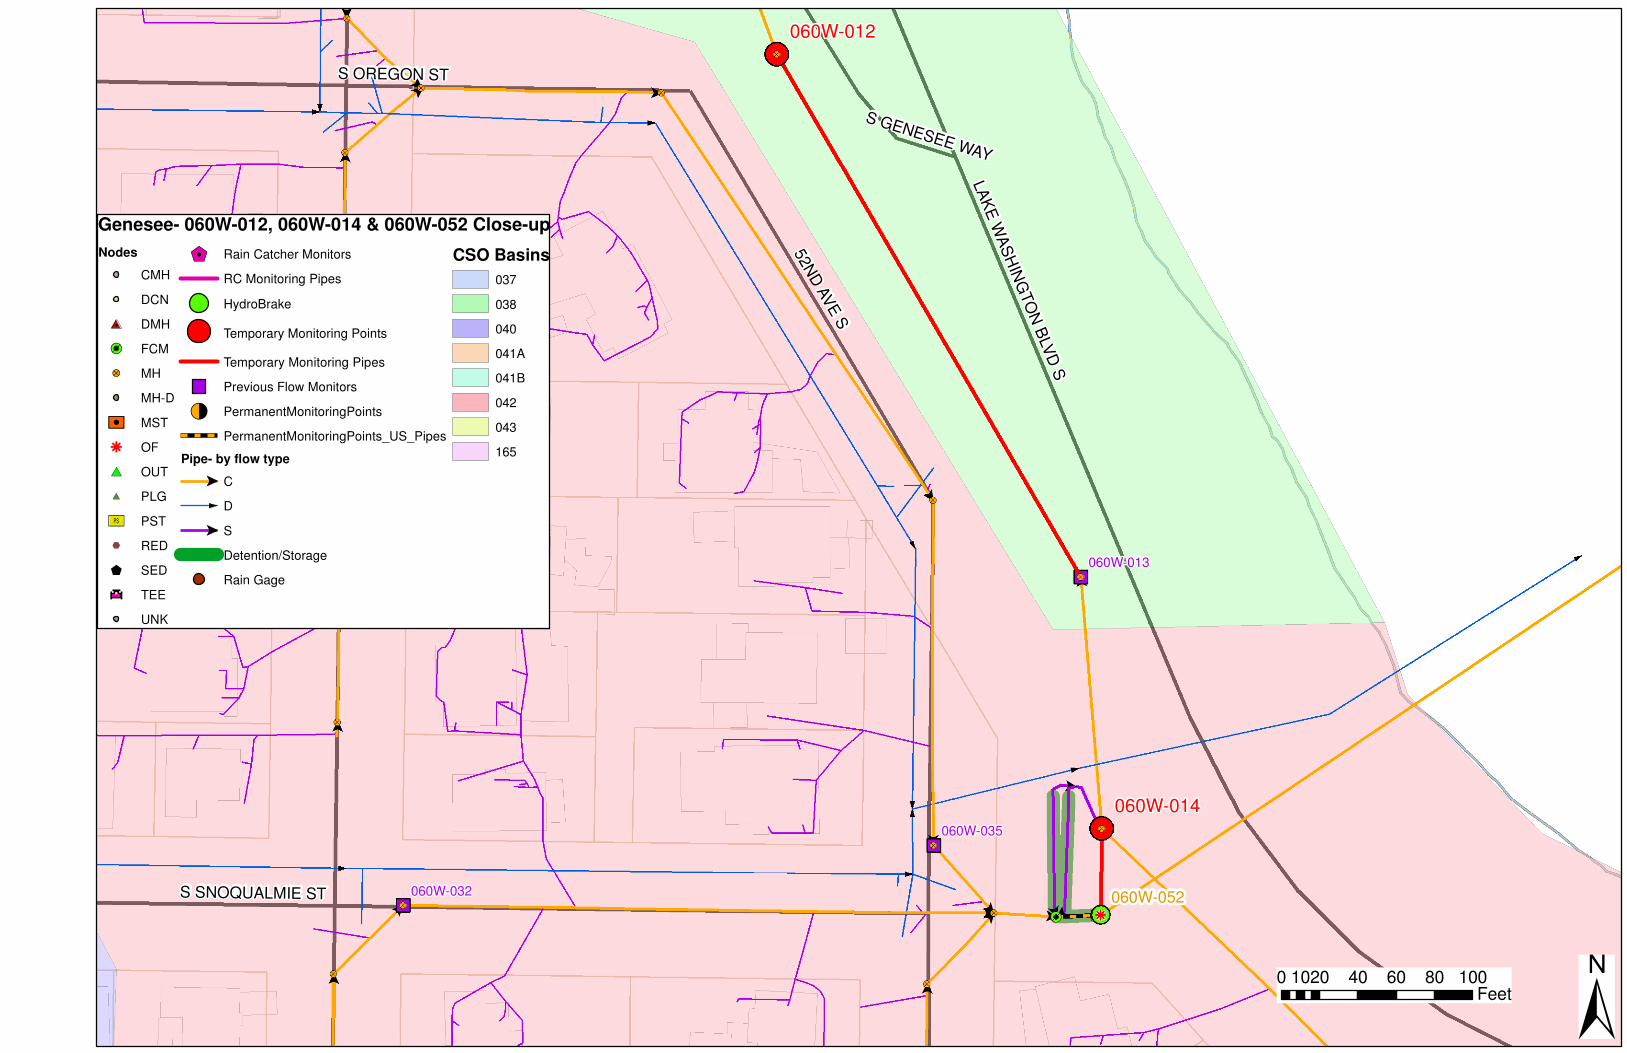
060W-014
060W-012
060W-032
060W-035
060W-013
060W-052
51
ST
AV
E S
51
ST
AV
E S
52ND
AV
E S
52ND
AV
E S
S SNOQUALMIE STS SNOQUALMIE ST
LA
KE
WA
SH
ING
TO
N B
LVD
S
LA
KE
WA
SH
ING
TO
N B
LVD
S
S OREGON STS OREGON ST
S GENESEE WAY
S GENESEE WAY
Genesee- 060W-012, 060W-014 & 060W-052 Close-up
Nodes
CMH
DCN
#0 DMH
!¶R FCM
�? MH
MH-D
PO MST
h OF
#* OUT
#* PLG
�� PST
%, RED
$ SED
Ð�î�
" TEE
UNK
$1 Rain Catcher Monitors
RC Monitoring Pipes
HydroBrake
Temporary Monitoring Points
Temporary Monitoring Pipes
Previous Flow Monitors
!< PermanentMonitoringPoints
PermanentMonitoringPoints_US_Pipes
Pipe- by flow type
$ C
D
$ S
Detention/Storage
Rain Gage
CSO Basins
037
038
040
041A
041B
042
043
165
±0 20 40 60 80 10010
Feet
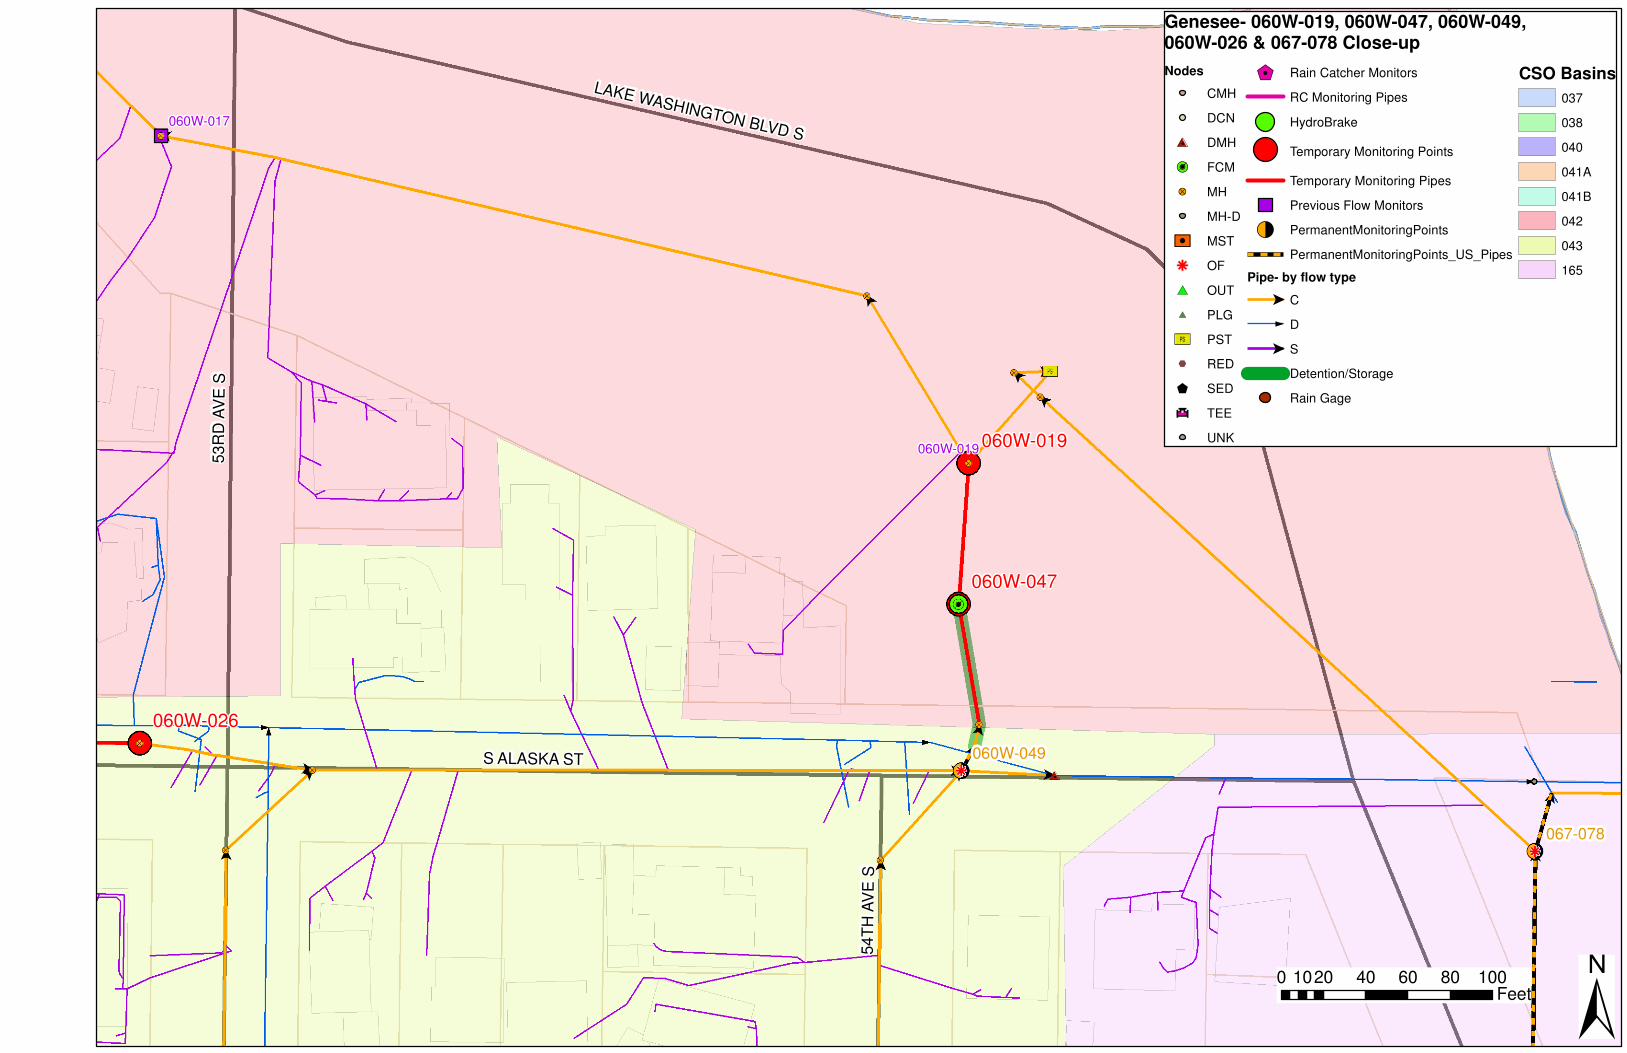
060W-047
060W-019
060W-026
060W-019
060W-017
067-078
060W-049S ALASKA STS ALASKA ST
53
RD
AV
E S
53
RD
AV
E S
LAKE WASHINGTON BLVD S
LAKE WASHINGTON BLVD S
54
TH
AV
E S
54
TH
AV
E S
Genesee- 060W-019, 060W-047, 060W-049,060W-026 & 067-078 Close-up
Nodes
CMH
DCN
#0 DMH
!¶R FCM
�? MH
MH-D
PO MST
h OF
#* OUT
#* PLG
�� PST
%, RED
$ SED
Ð�î�
" TEE
UNK
$1 Rain Catcher Monitors
RC Monitoring Pipes
HydroBrake
Temporary Monitoring Points
Temporary Monitoring Pipes
Previous Flow Monitors
!< PermanentMonitoringPoints
PermanentMonitoringPoints_US_Pipes
Pipe- by flow type
$ C
D
$ S
Detention/Storage
Rain Gage
CSO Basins
037
038
040
041A
041B
042
043
165
±0 20 40 60 80 10010
Feet
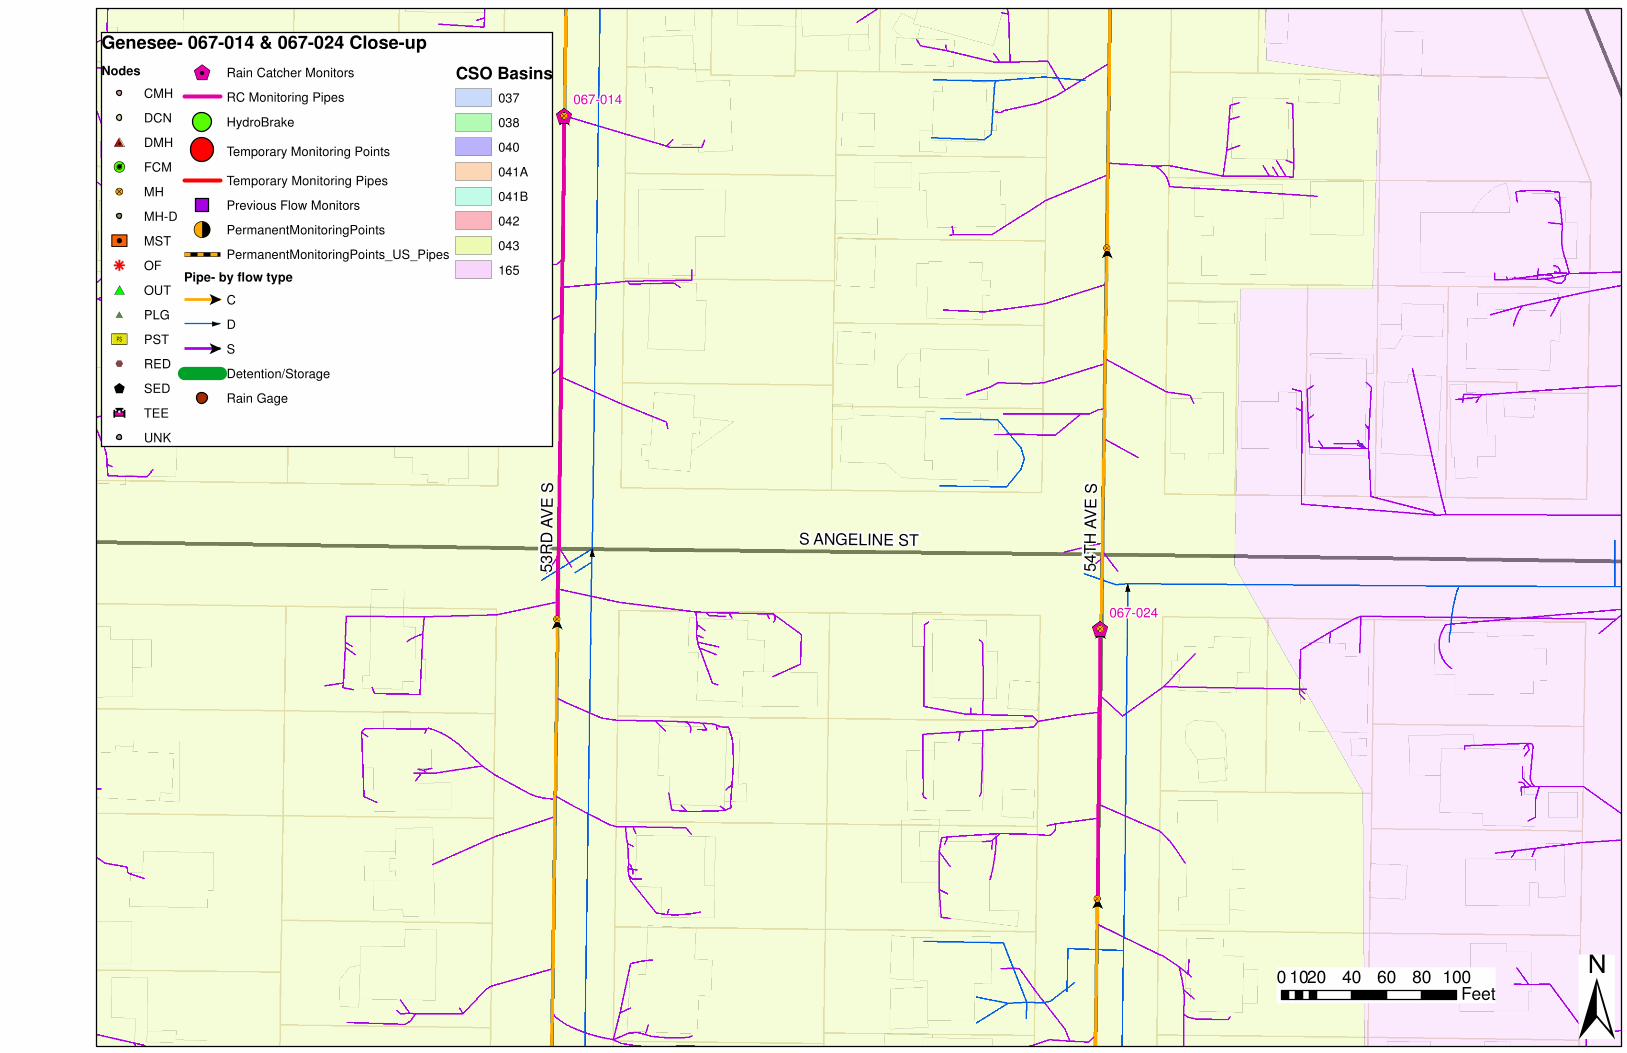
067-024
067-014
S ANGELINE STS ANGELINE ST
54
TH
AV
E S
54
TH
AV
E S
53
RD
AV
E S
53
RD
AV
E S
Genesee- 067-014 & 067-024 Close-up
Nodes
CMH
DCN
#0 DMH
!¶R FCM
�? MH
MH-D
PO MST
h OF
#* OUT
#* PLG
�� PST
%, RED
$ SED
Ð�î�
" TEE
UNK
$1 Rain Catcher Monitors
RC Monitoring Pipes
HydroBrake
Temporary Monitoring Points
Temporary Monitoring Pipes
Previous Flow Monitors
!< PermanentMonitoringPoints
PermanentMonitoringPoints_US_Pipes
Pipe- by flow type
$ C
D
$ S
Detention/Storage
Rain Gage
CSO Basins
037
038
040
041A
041B
042
043
165
±0 20 40 60 80 10010
Feet
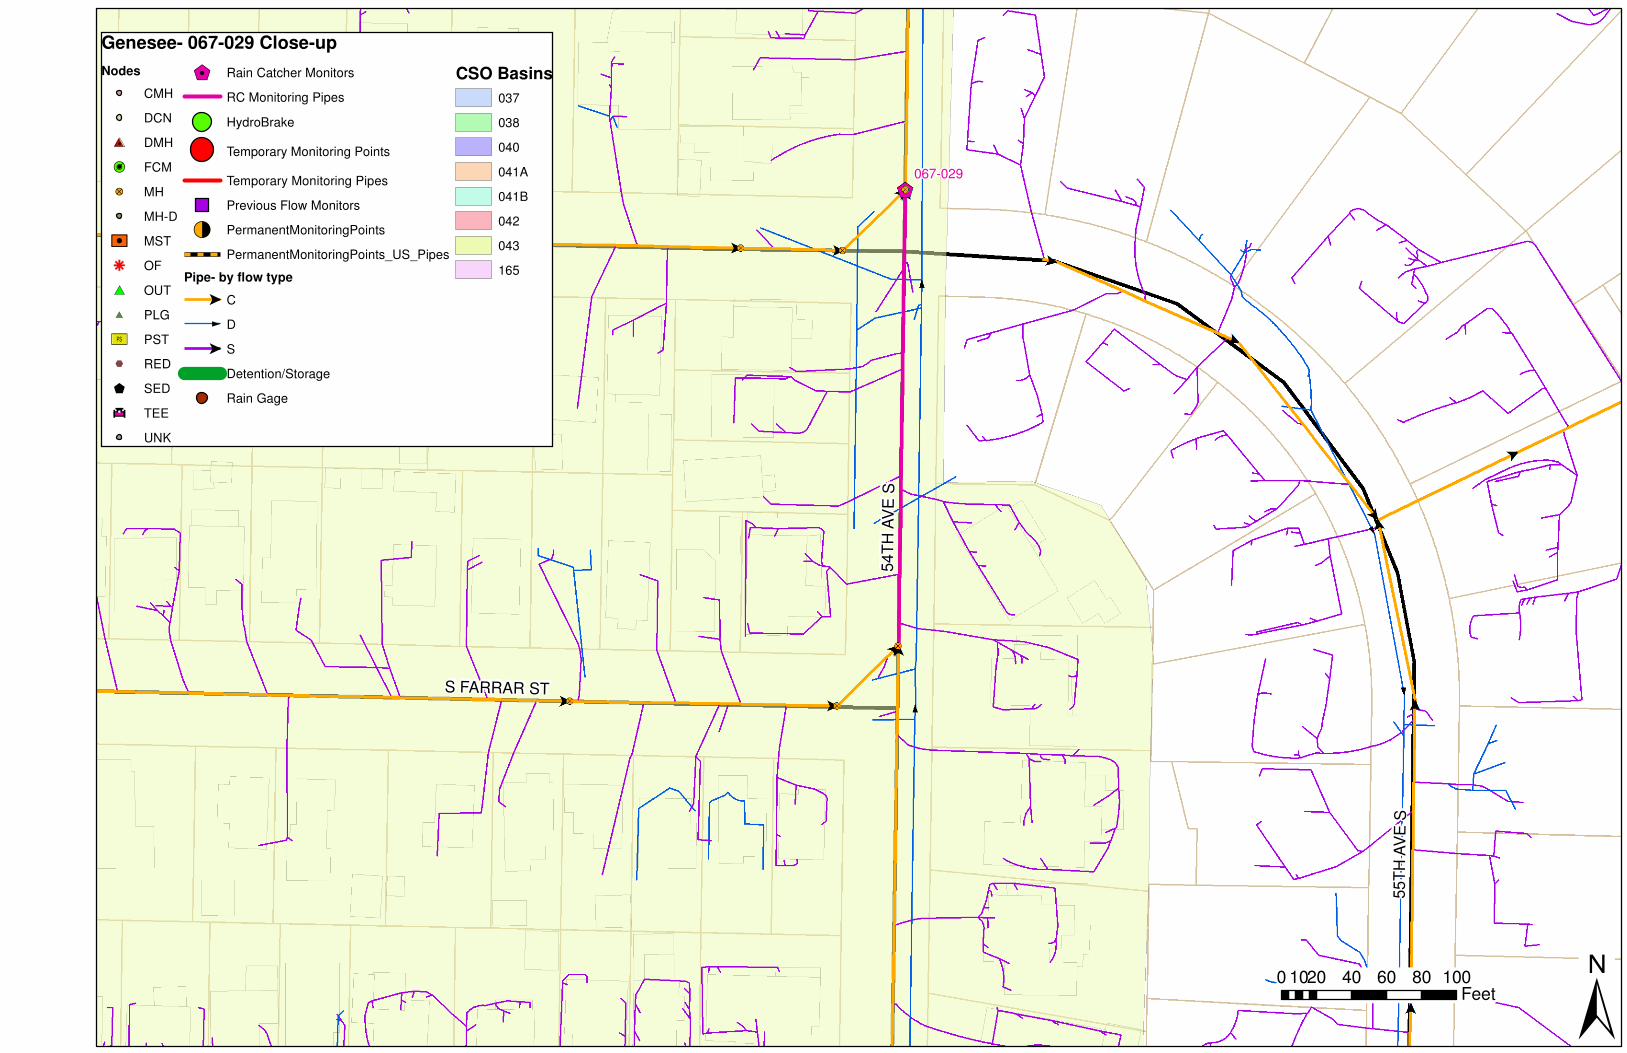
067-029
54
TH
AV
E S
54
TH
AV
E S
55
TH
AV
E S
55
TH
AV
E S
S PEARL STS PEARL ST
S FARRAR STS FARRAR ST
Genesee- 067-029 Close-up
Nodes
CMH
DCN
#0 DMH
!¶R FCM
�? MH
MH-D
PO MST
h OF
#* OUT
#* PLG
�� PST
%, RED
$ SED
Ð�î�
" TEE
UNK
$1 Rain Catcher Monitors
RC Monitoring Pipes
HydroBrake
Temporary Monitoring Points
Temporary Monitoring Pipes
Previous Flow Monitors
!< PermanentMonitoringPoints
PermanentMonitoringPoints_US_Pipes
Pipe- by flow type
$ C
D
$ S
Detention/Storage
Rain Gage
CSO Basins
037
038
040
041A
041B
042
043
165
±0 20 40 60 80 10010
Feet
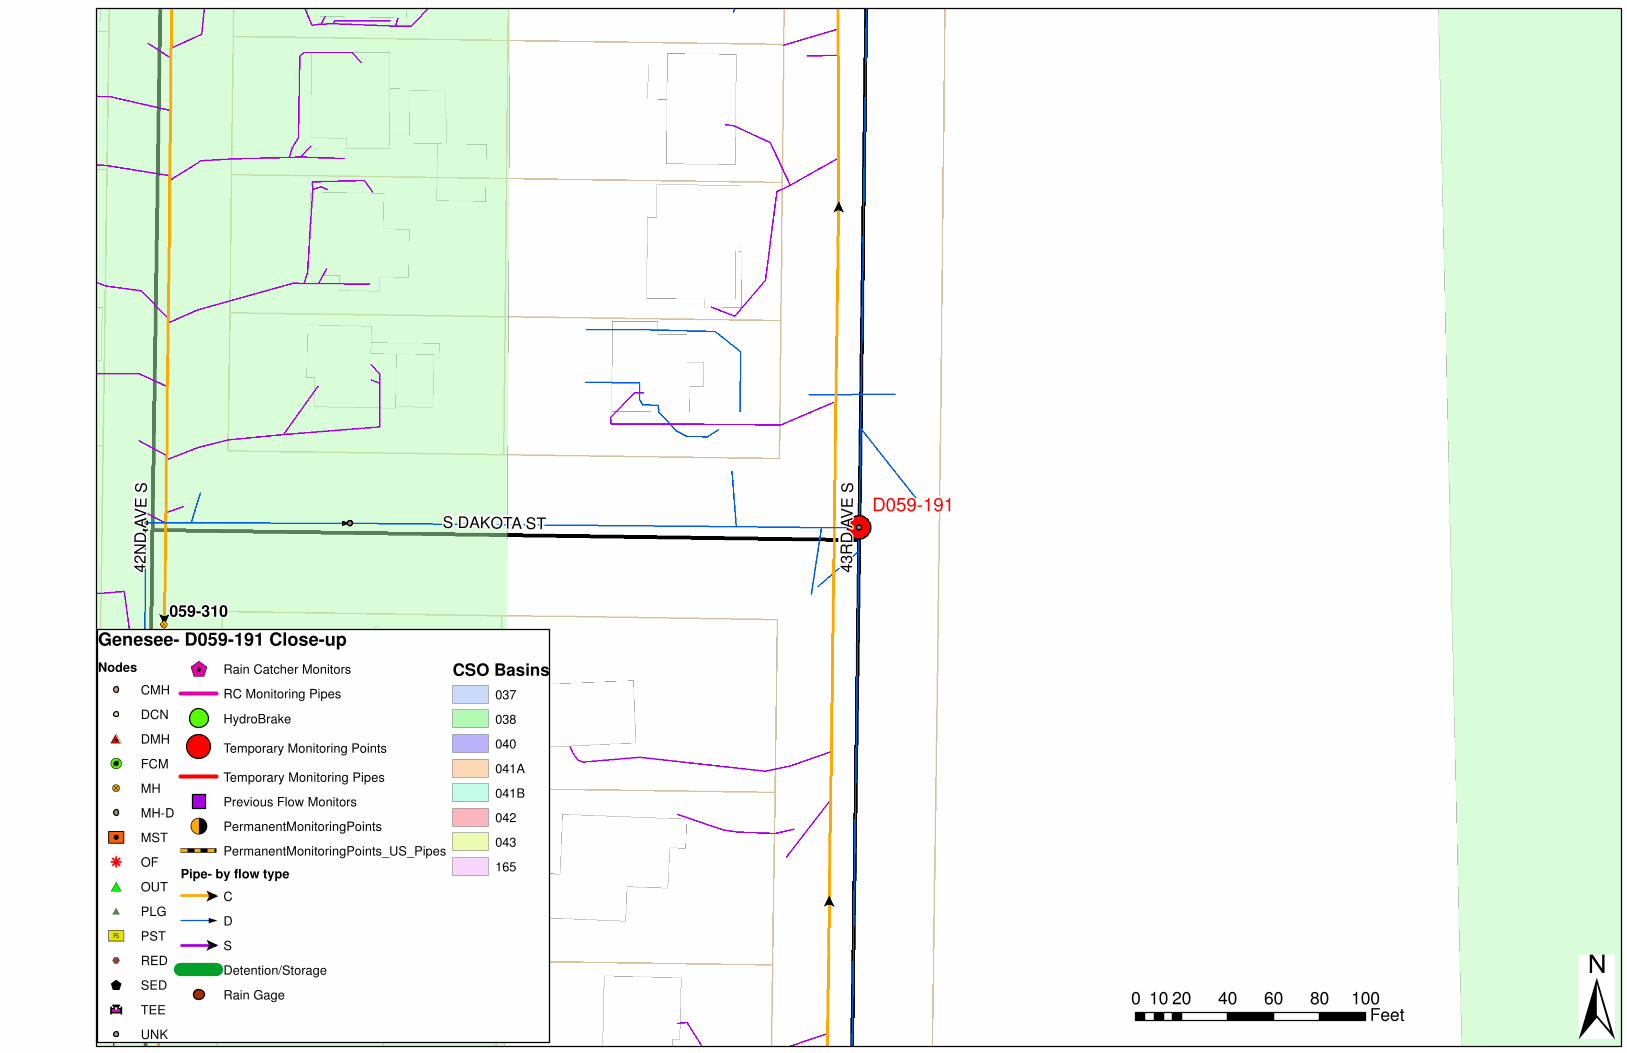
059-310
D059-191
42
ND
AV
E S
42
ND
AV
E S
43
RD
AV
E S
43
RD
AV
E S
S DAKOTA STS DAKOTA ST
Genesee- D059-191 Close-up
Nodes
CMH
DCN
#0 DMH
!¶R FCM
�? MH
MH-D
PO MST
h OF
#* OUT
#* PLG
�� PST
%, RED
$ SED
Ð�î�
" TEE
UNK
$1 Rain Catcher Monitors
RC Monitoring Pipes
HydroBrake
Temporary Monitoring Points
Temporary Monitoring Pipes
Previous Flow Monitors
!< PermanentMonitoringPoints
PermanentMonitoringPoints_US_Pipes
Pipe- by flow type
$ C
D
$ S
Detention/Storage
Rain Gage
CSO Basins
037
038
040
041A
041B
042
043
165
±0 20 40 60 80 10010Feet

WA 1.0 - GENESEE BASIN FLOW MONITORING STUDY PAGE 56 OF 62 QUALITY ASSURANCE PROJECT PLAN
Revision: R1D0 Effective date: 8/19/2008 This is an UNCONTROLLED DOCUMENT.
Appendix C: Site Installation Sheets
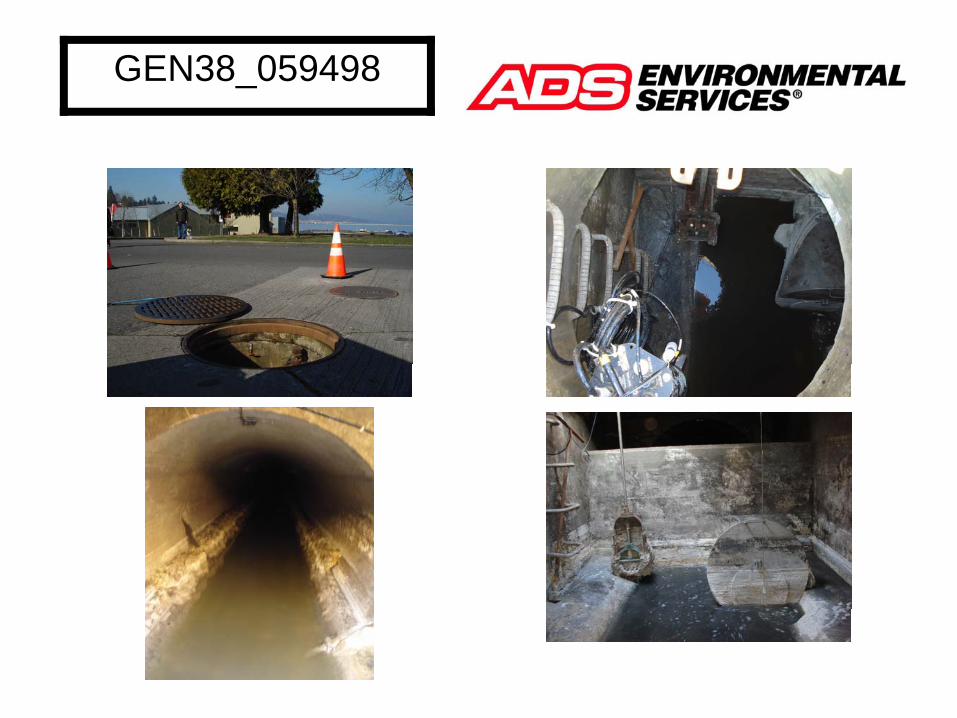
GEN38_059498
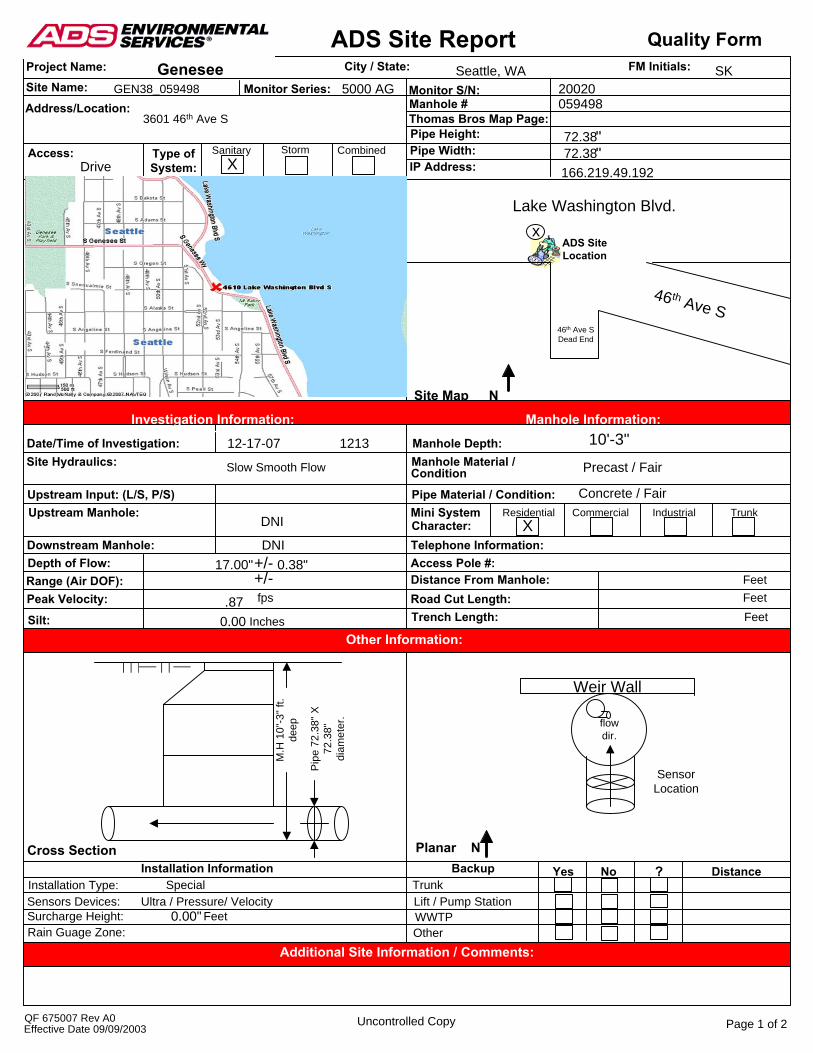
ADS Site ReportFM Initials:Project Name:
Site Name: Monitor Series:
City / State:
Access: Type ofSystem:
Sanitary
Site MapInvestigation Information:
Manhole Depth:Manhole Material /
Pipe Material / Condition:Mini System Commercial
Telephone Information:Access Pole #:Distance From Manhole:Road Cut Length:Trench Length: Feet
FeetFeet
Date/Time of Investigation:Site Hydraulics:
Upstream Input: (L/S, P/S)Upstream Manhole:
Downstream Manhole:Depth of Flow:Range (Air DOF):Peak Velocity:
Silt: Inches
fps
+/-+/-
Cross Section PlanarInstallation Information
Installation Type: SpecialSensors Devices: Ultra / Pressure/ Velocity Surcharge Height:Rain Guage Zone:
Feet
Backup Yes No ? DistanceTrunkLift / Pump StationWWTPOther
QF 675007 Rev A0 Uncontrolled Copy
Monitor S/N:
Thomas Bros Map Page:Pipe Height:Pipe Width:IP Address:
Manhole #
""
Quality Form
Address/Location:
Genesee Seattle, WA SKGEN38_059498
DriveStorm Combined
X
Manhole Information:Investigation Information:
DNI
Slow Smooth Flow
12-17-07 1213
DNI
Condition
Character:TrunkResidential Industrial
N
Precast / Fair
Other Information:
Additional Site Information / Comments:
N
Effective Date 09/09/2003 Page 1 of 2
Pip
e 72
.38"
X
72.3
8"
diam
eter
.
M.H
10"
-3" f
t. de
ep
3601 46th Ave S
0.00
X
059498
0.00"
72.38
0.38"
10'-3"
Concrete / Fair
5000 AG
ADS SiteLocation
20020
166.219.49.192
17.00"
Lake Washington Blvd.
46th Ave S
72.38
x
.87
SensorLocation
flowdir.
Weir Wall
46th Ave SDead End
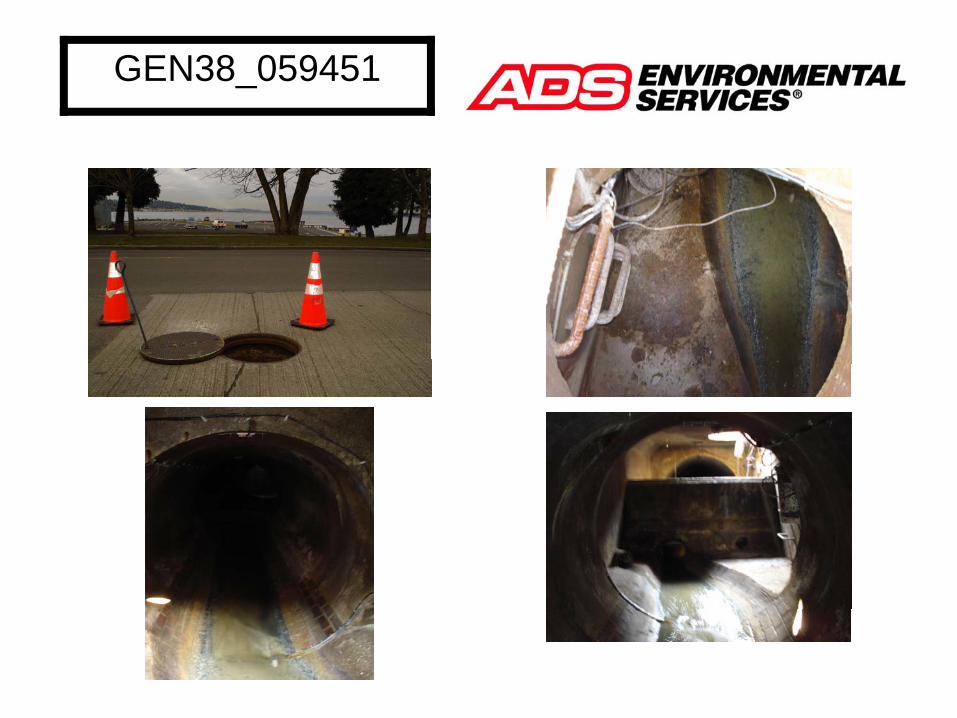
GEN38_059451
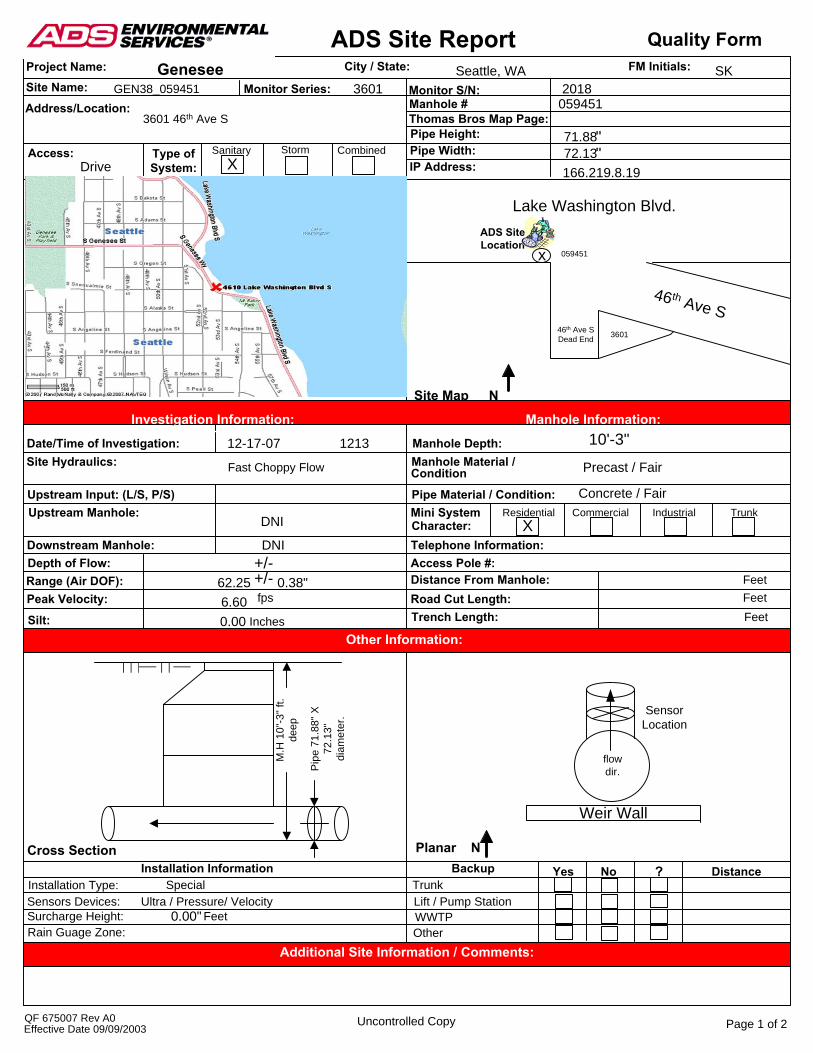
ADS Site ReportFM Initials:Project Name:
Site Name: Monitor Series:
City / State:
Access: Type ofSystem:
Sanitary
Site MapInvestigation Information:
Manhole Depth:Manhole Material /
Pipe Material / Condition:Mini System Commercial
Telephone Information:Access Pole #:Distance From Manhole:Road Cut Length:Trench Length: Feet
FeetFeet
Date/Time of Investigation:Site Hydraulics:
Upstream Input: (L/S, P/S)Upstream Manhole:
Downstream Manhole:Depth of Flow:Range (Air DOF):Peak Velocity:
Silt: Inches
fps
+/-+/-
Cross Section PlanarInstallation Information
Installation Type: SpecialSensors Devices: Ultra / Pressure/ Velocity Surcharge Height:Rain Guage Zone:
Feet
Backup Yes No ? DistanceTrunkLift / Pump StationWWTPOther
QF 675007 Rev A0 Uncontrolled Copy
Monitor S/N:
Thomas Bros Map Page:Pipe Height:Pipe Width:IP Address:
Manhole #
""
Quality Form
Address/Location:
Genesee Seattle, WA SKGEN38_059451
DriveStorm Combined
X
Manhole Information:Investigation Information:
DNI
Fast Choppy Flow
12-17-07 1213
DNI
Condition
Character:TrunkResidential Industrial
N
Precast / Fair
Other Information:
Additional Site Information / Comments:
N
Effective Date 09/09/2003 Page 1 of 2
Pip
e 71
.88"
X
72.1
3"
diam
eter
.
M.H
10"
-3" f
t. de
ep
3601 46th Ave S
0.00
X
059451
0.00"
71.88
0.38"
10'-3"
Concrete / Fair
3601
ADS SiteLocation
2018
166.219.8.19
62.25
Lake Washington Blvd.
46th Ave S
72.13
x 059451
6.60
SensorLocation
flowdir.
Weir Wall
46th Ave SDead End 3601
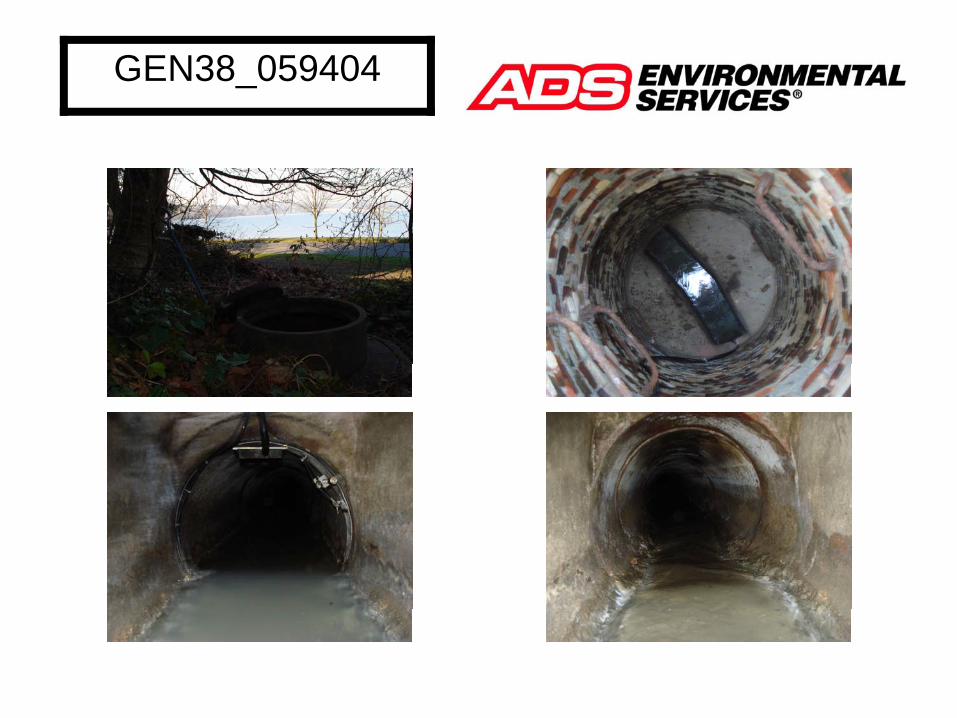
GEN38_059404
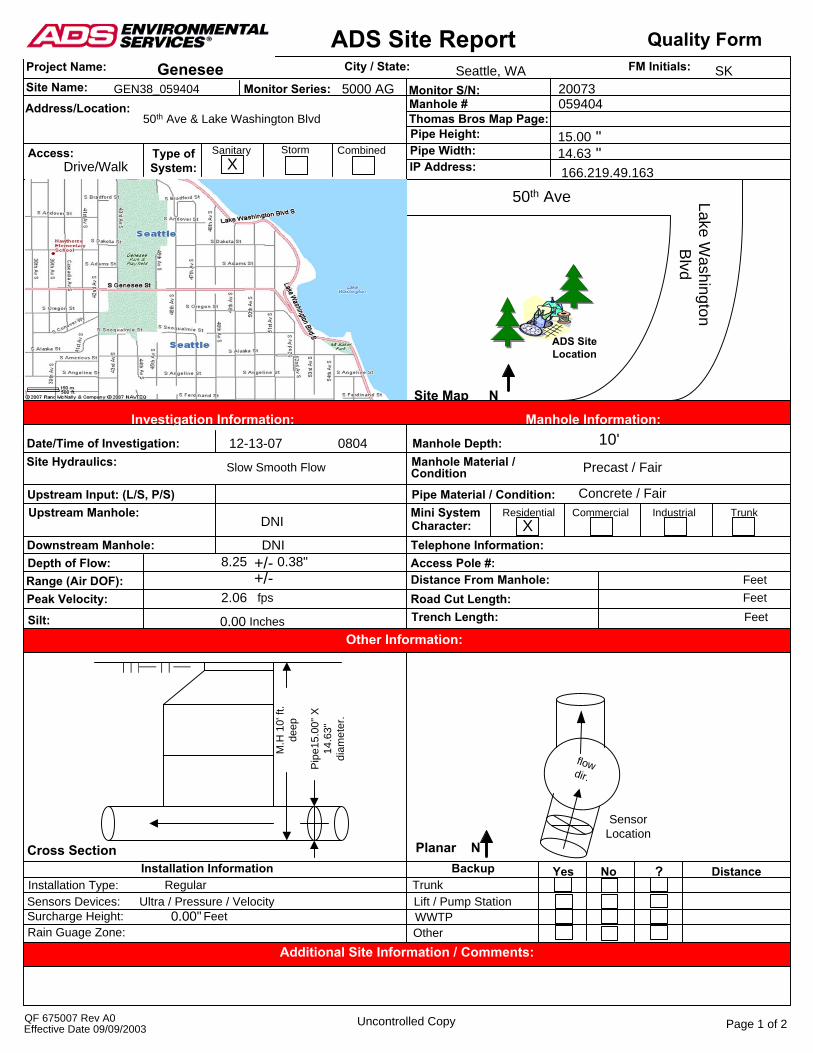
ADS Site ReportFM Initials:Project Name:
Site Name: Monitor Series:
City / State:
Access: Type ofSystem:
Sanitary
Site MapInvestigation Information:
Manhole Depth:Manhole Material /
Pipe Material / Condition:Mini System Commercial
Telephone Information:Access Pole #:Distance From Manhole:Road Cut Length:Trench Length: Feet
FeetFeet
Date/Time of Investigation:Site Hydraulics:
Upstream Input: (L/S, P/S)Upstream Manhole:
Downstream Manhole:Depth of Flow:Range (Air DOF):Peak Velocity:
Silt: Inches
fps
+/-+/-
Cross Section PlanarInstallation Information
Installation Type: Regular Sensors Devices: Ultra / Pressure / VelocitySurcharge Height:Rain Guage Zone:
Feet
Backup Yes No ? DistanceTrunkLift / Pump StationWWTPOther
QF 675007 Rev A0 Uncontrolled Copy
Monitor S/N:
Thomas Bros Map Page:Pipe Height:Pipe Width:IP Address:
Manhole #
""
Quality Form
Address/Location:
Genesee Seattle, WA SKGEN38_059404
Drive/WalkStorm Combined
X
Manhole Information:Investigation Information:
DNI
Slow Smooth Flow
12-13-07 0804
DNI
Condition
Character:TrunkResidential Industrial
N
Precast / Fair
Other Information:
Additional Site Information / Comments:
N
Effective Date 09/09/2003 Page 1 of 2
SensorLocation
Pip
e15.
00" X
14
.63"
di
amet
er.
M.H
10'
ft.
deep
50th Ave & Lake Washington Blvd
0.00
X
flowdir.
059404
0.00"
15.0014.63
0.38"
10'
Concrete / Fair
5000 AG
ADS SiteLocation
20073
166.219.49.163
8.25
2.06
50th Ave Lake Washington
Blvd
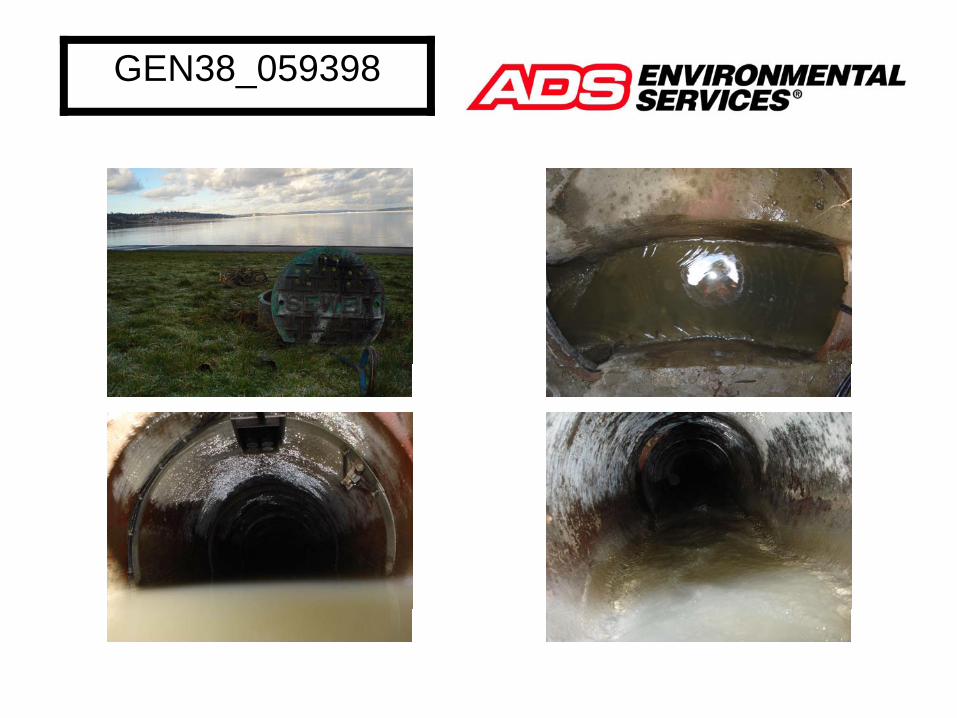
GEN38_059398
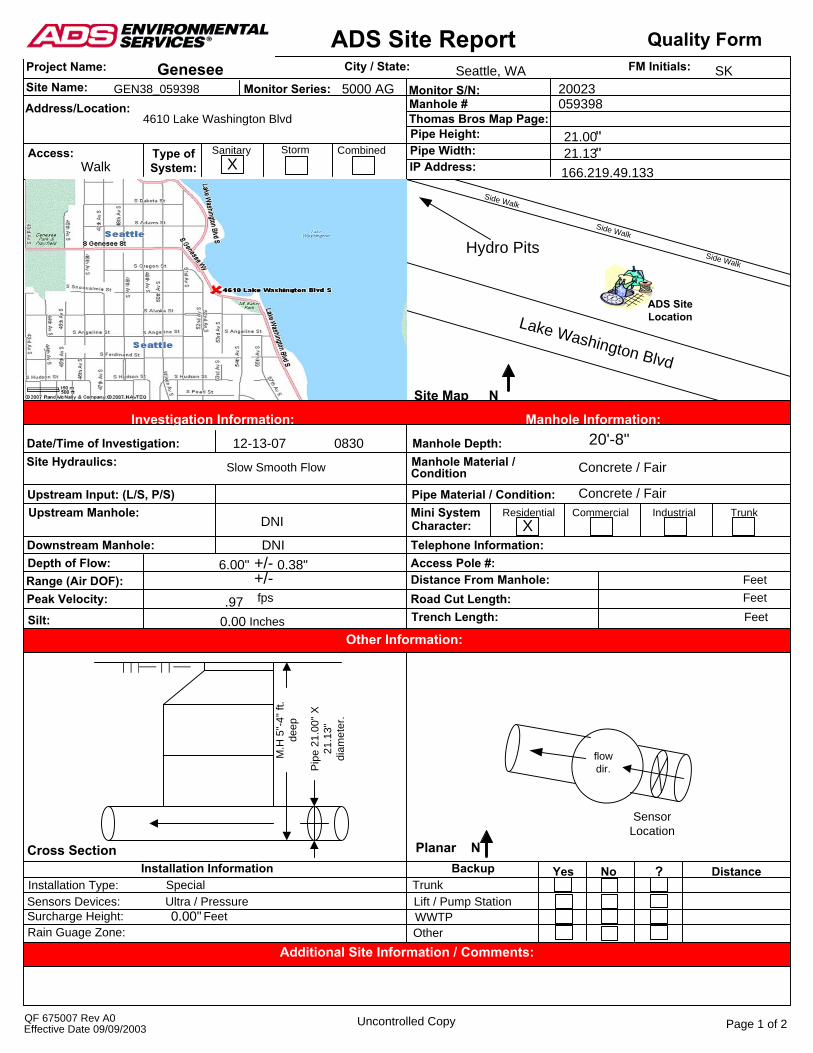
ADS Site ReportFM Initials:Project Name:
Site Name: Monitor Series:
City / State:
Access: Type ofSystem:
Sanitary
Site MapInvestigation Information:
Manhole Depth:Manhole Material /
Pipe Material / Condition:Mini System Commercial
Telephone Information:Access Pole #:Distance From Manhole:Road Cut Length:Trench Length: Feet
FeetFeet
Date/Time of Investigation:Site Hydraulics:
Upstream Input: (L/S, P/S)Upstream Manhole:
Downstream Manhole:Depth of Flow:Range (Air DOF):Peak Velocity:
Silt: Inches
fps
+/-+/-
Cross Section PlanarInstallation Information
Installation Type: SpecialSensors Devices: Ultra / Pressure Surcharge Height:Rain Guage Zone:
Feet
Backup Yes No ? DistanceTrunkLift / Pump StationWWTPOther
QF 675007 Rev A0 Uncontrolled Copy
Monitor S/N:
Thomas Bros Map Page:Pipe Height:Pipe Width:IP Address:
Manhole #
""
Quality Form
Address/Location:
Genesee Seattle, WA SKGEN38_059398
WalkStorm Combined
X
Manhole Information:Investigation Information:
DNI
Slow Smooth Flow
12-13-07 0830
DNI
Condition
Character:TrunkResidential Industrial
N
Concrete / Fair
Other Information:
Additional Site Information / Comments:
N
Effective Date 09/09/2003 Page 1 of 2
SensorLocation
Pip
e 21
.00"
X
21.1
3"
diam
eter
.
M.H
5"-
4" ft
. de
ep
4610 Lake Washington Blvd
0.00
X
flowdir.
059398
0.00"
21.00
0.38"
20'-8"
Concrete / Fair
5000 AG
ADS SiteLocation
20023
166.219.49.133
6.00"
Lake Washington Blvd
21.13
Side Walk Side Walk Side Walk
Hydro Pits
.97
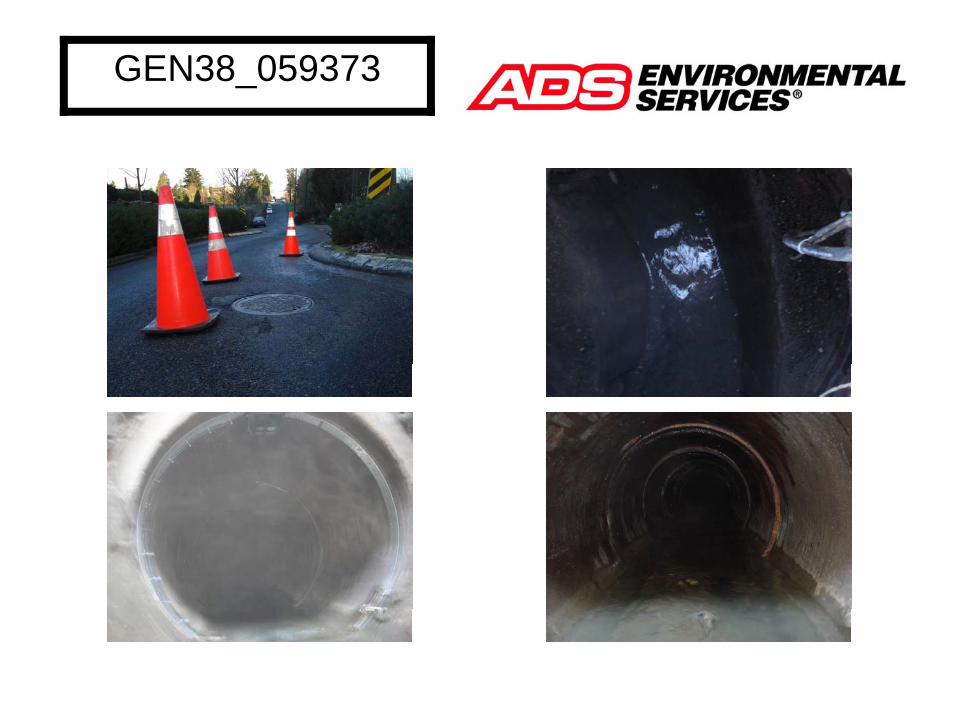
GEN38_059373
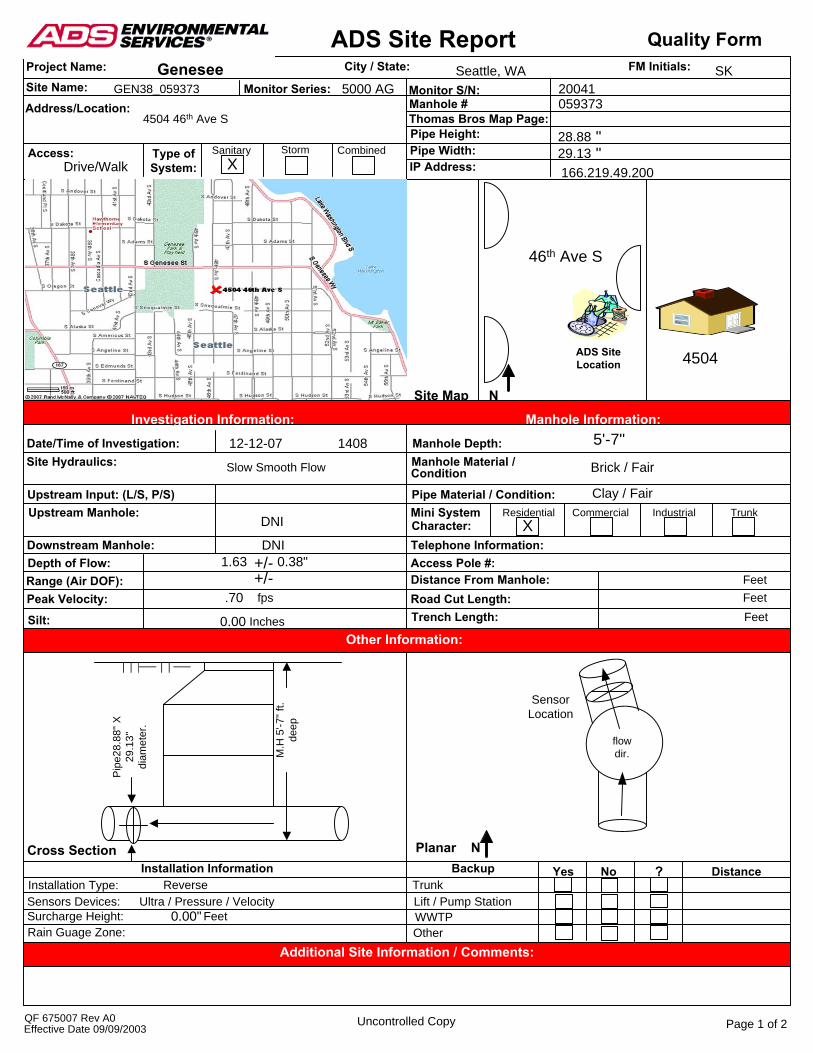
ADS Site ReportFM Initials:Project Name:
Site Name: Monitor Series:
City / State:
Access: Type ofSystem:
Sanitary
Site MapInvestigation Information:
Manhole Depth:Manhole Material /
Pipe Material / Condition:Mini System Commercial
Telephone Information:Access Pole #:Distance From Manhole:Road Cut Length:Trench Length: Feet
FeetFeet
Date/Time of Investigation:Site Hydraulics:
Upstream Input: (L/S, P/S)Upstream Manhole:
Downstream Manhole:Depth of Flow:Range (Air DOF):Peak Velocity:
Silt: Inches
fps
+/-+/-
Cross Section PlanarInstallation Information
Installation Type: ReverseSensors Devices: Ultra / Pressure / VelocitySurcharge Height:Rain Guage Zone:
Feet
Backup Yes No ? DistanceTrunkLift / Pump StationWWTPOther
QF 675007 Rev A0 Uncontrolled Copy
Monitor S/N:
Thomas Bros Map Page:Pipe Height:Pipe Width:IP Address:
Manhole #
""
Quality Form
Address/Location:
Genesee Seattle, WA SKGEN38_059373
Drive/WalkStorm Combined
X
Manhole Information:Investigation Information:
DNI
Slow Smooth Flow
12-12-07 1408
DNI
Condition
Character:TrunkResidential Industrial
N
Brick / Fair
Other Information:
Additional Site Information / Comments:
N
Effective Date 09/09/2003 Page 1 of 2
SensorLocation
Pipe
28.8
8" X
29
.13"
di
amet
er.
M.H
5'-7
" ft.
deep
4504 46th Ave S
0.00
X
flowdir.
059373
0.00"
28.8829.13
0.38"
5'-7"
Clay / Fair
5000 AG
ADS SiteLocation
20041
166.219.49.200
1.63
4504
.70
46th Ave S
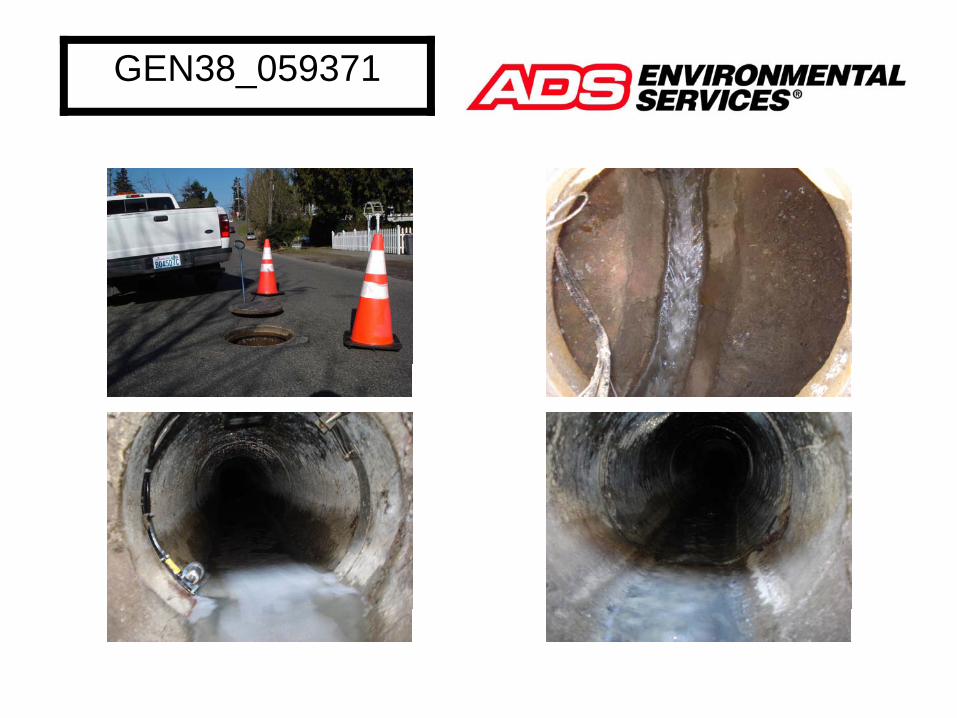
GEN38_059371
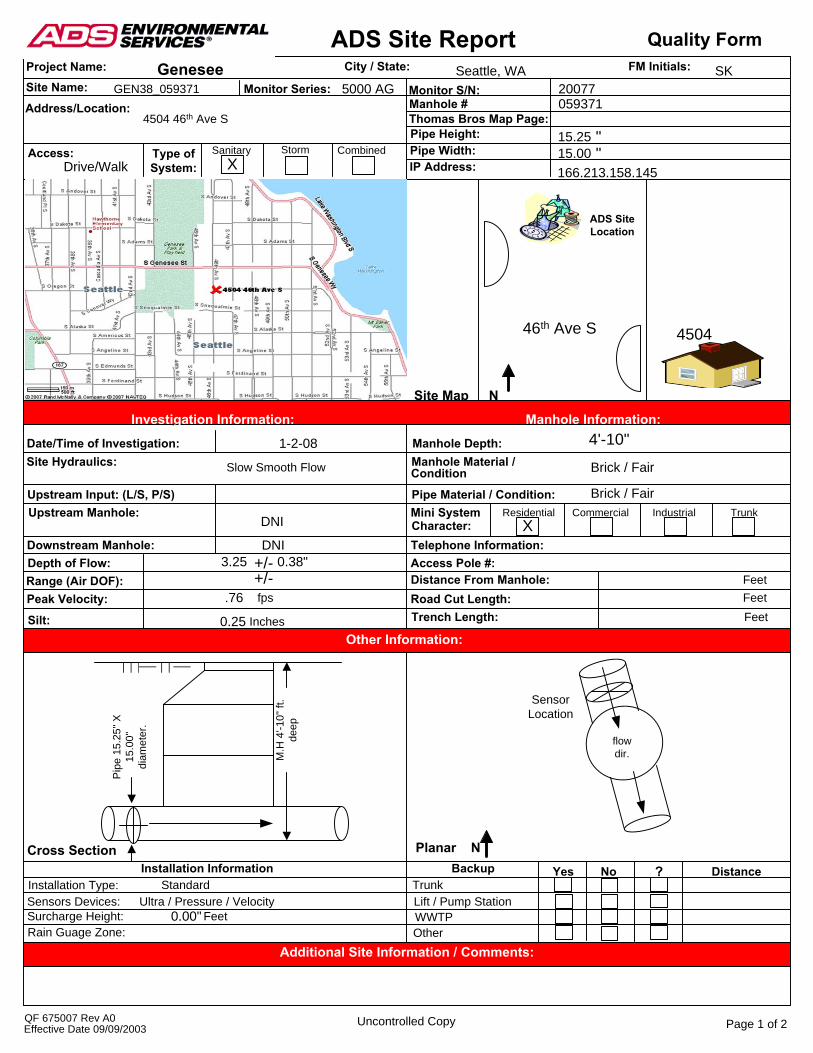
ADS Site ReportFM Initials:Project Name:
Site Name: Monitor Series:
City / State:
Access: Type ofSystem:
Sanitary
Site MapInvestigation Information:
Manhole Depth:Manhole Material /
Pipe Material / Condition:Mini System Commercial
Telephone Information:Access Pole #:Distance From Manhole:Road Cut Length:Trench Length: Feet
FeetFeet
Date/Time of Investigation:Site Hydraulics:
Upstream Input: (L/S, P/S)Upstream Manhole:
Downstream Manhole:Depth of Flow:Range (Air DOF):Peak Velocity:
Silt: Inches
fps
+/-+/-
Cross Section PlanarInstallation Information
Installation Type: StandardSensors Devices: Ultra / Pressure / VelocitySurcharge Height:Rain Guage Zone:
Feet
Backup Yes No ? DistanceTrunkLift / Pump StationWWTPOther
QF 675007 Rev A0 Uncontrolled Copy
Monitor S/N:
Thomas Bros Map Page:Pipe Height:Pipe Width:IP Address:
Manhole #
""
Quality Form
Address/Location:
Genesee Seattle, WA SKGEN38_059371
Drive/WalkStorm Combined
X
Manhole Information:Investigation Information:
DNI
Slow Smooth Flow
1-2-08
DNI
Condition
Character:TrunkResidential Industrial
N
Brick / Fair
Other Information:
Additional Site Information / Comments:
N
Effective Date 09/09/2003 Page 1 of 2
SensorLocation
Pip
e 15
.25"
X
15.0
0"
diam
eter
.
M.H
4'-1
0" ft
. de
ep
4504 46th Ave S
0.25
X
flowdir.
059371
0.00"
15.2515.00
0.38"
4'-10"
Brick / Fair
5000 AG
ADS SiteLocation
20077
166.213.158.145
3.25
4504
.76
46th Ave S
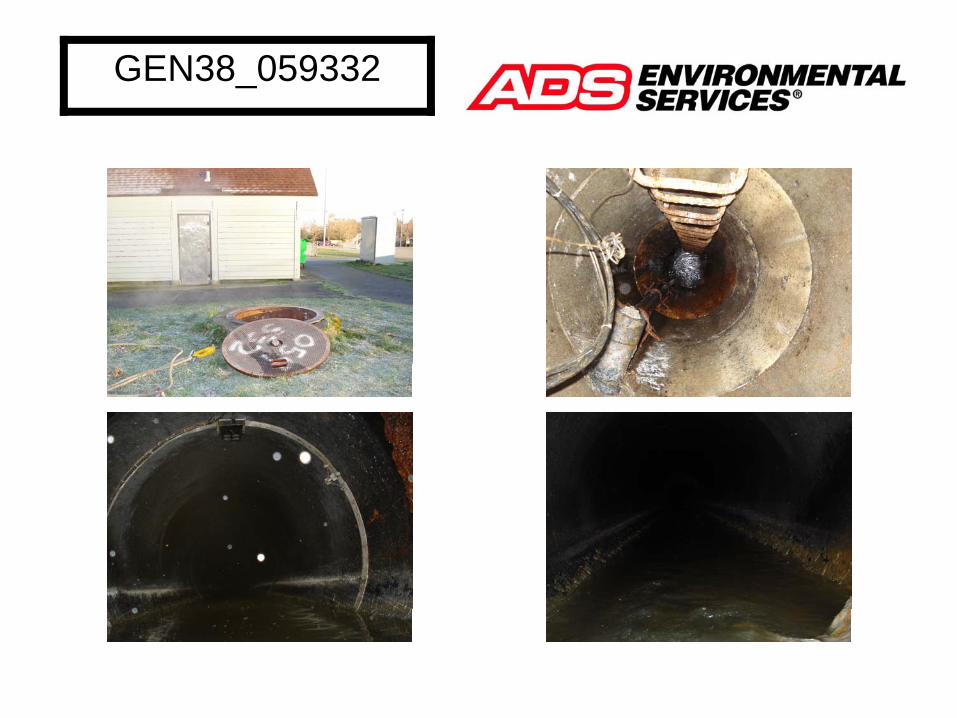
GEN38_059332
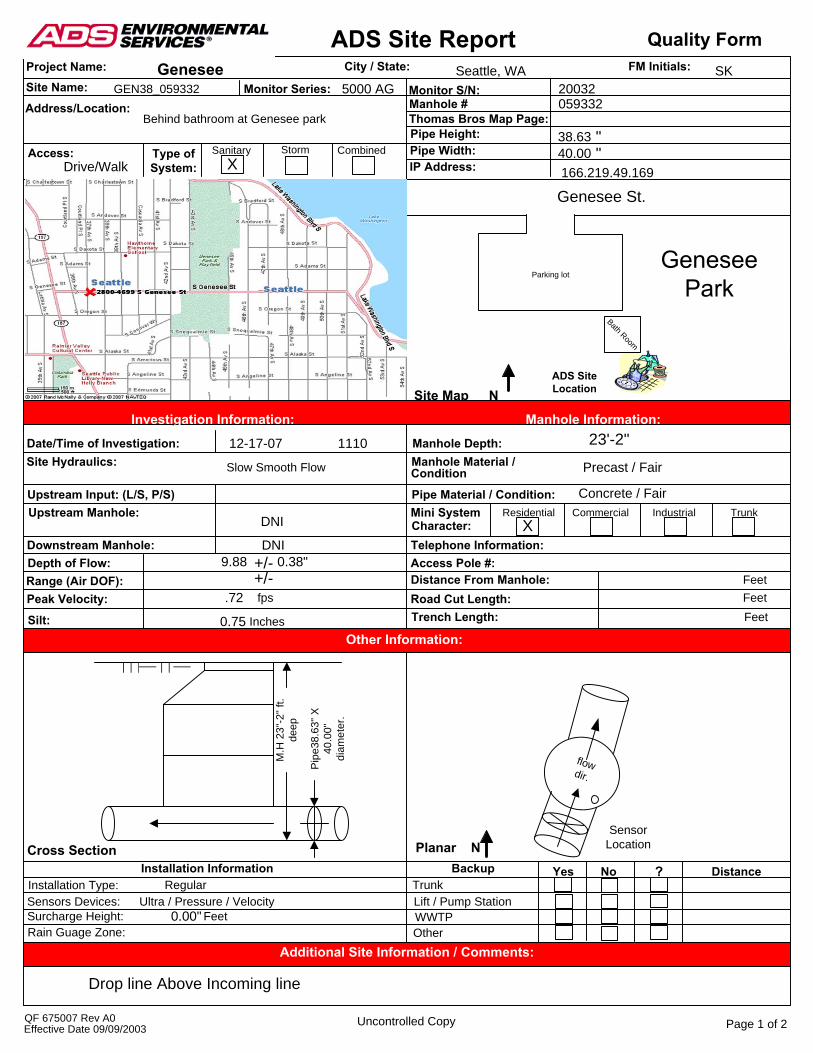
ADS Site ReportFM Initials:Project Name:
Site Name: Monitor Series:
City / State:
Access: Type ofSystem:
Sanitary
Site MapInvestigation Information:
Manhole Depth:Manhole Material /
Pipe Material / Condition:Mini System Commercial
Telephone Information:Access Pole #:Distance From Manhole:Road Cut Length:Trench Length: Feet
FeetFeet
Date/Time of Investigation:Site Hydraulics:
Upstream Input: (L/S, P/S)Upstream Manhole:
Downstream Manhole:Depth of Flow:Range (Air DOF):Peak Velocity:
Silt: Inches
fps
+/-+/-
Cross Section PlanarInstallation Information
Installation Type: Regular Sensors Devices: Ultra / Pressure / VelocitySurcharge Height:Rain Guage Zone:
Feet
Backup Yes No ? DistanceTrunkLift / Pump StationWWTPOther
QF 675007 Rev A0 Uncontrolled Copy
Monitor S/N:
Thomas Bros Map Page:Pipe Height:Pipe Width:IP Address:
Manhole #
""
Quality Form
Address/Location:
Genesee Seattle, WA SKGEN38_059332
Drive/WalkStorm Combined
X
Manhole Information:Investigation Information:
DNI
Slow Smooth Flow
12-17-07 1110
DNI
Condition
Character:TrunkResidential Industrial
N
Precast / Fair
Other Information:
Additional Site Information / Comments:
N
Effective Date 09/09/2003 Page 1 of 2
SensorLocation
Pip
e38.
63" X
40
.00"
di
amet
er.
M.H
23"
-2" f
t. de
ep
Behind bathroom at Genesee park
0.75
X
flowdir.
059332
0.00"
38.6340.00
0.38"
23'-2"
Concrete / Fair
5000 AG
ADS SiteLocation
20032
166.219.49.169
9.88
.72
Bath Room
Parking lot
Genesee St.
Drop line Above Incoming line
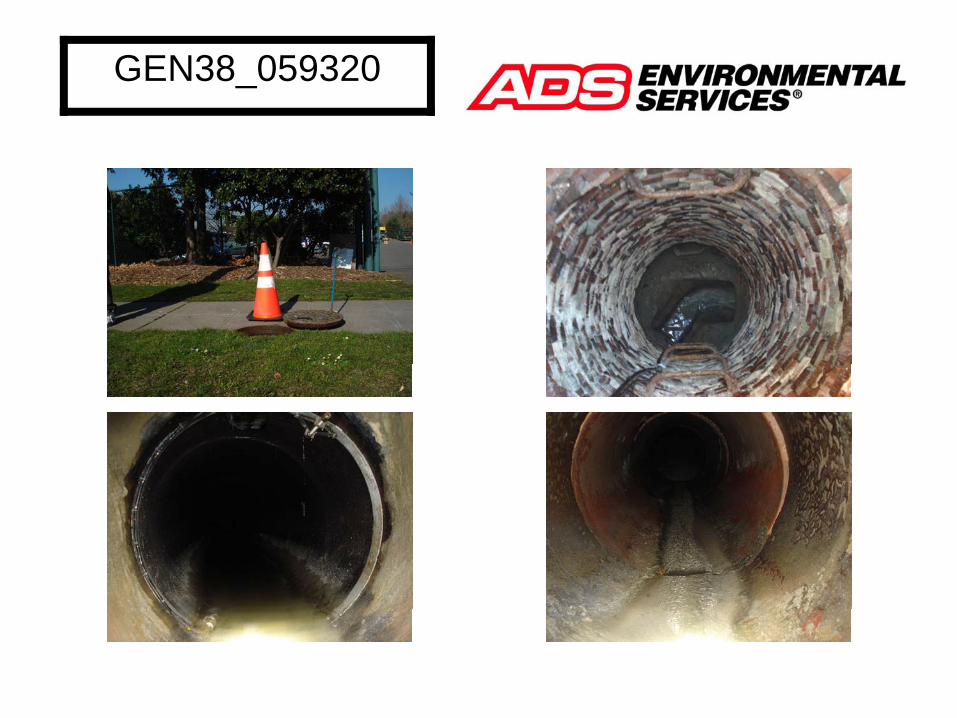
GEN38_059320
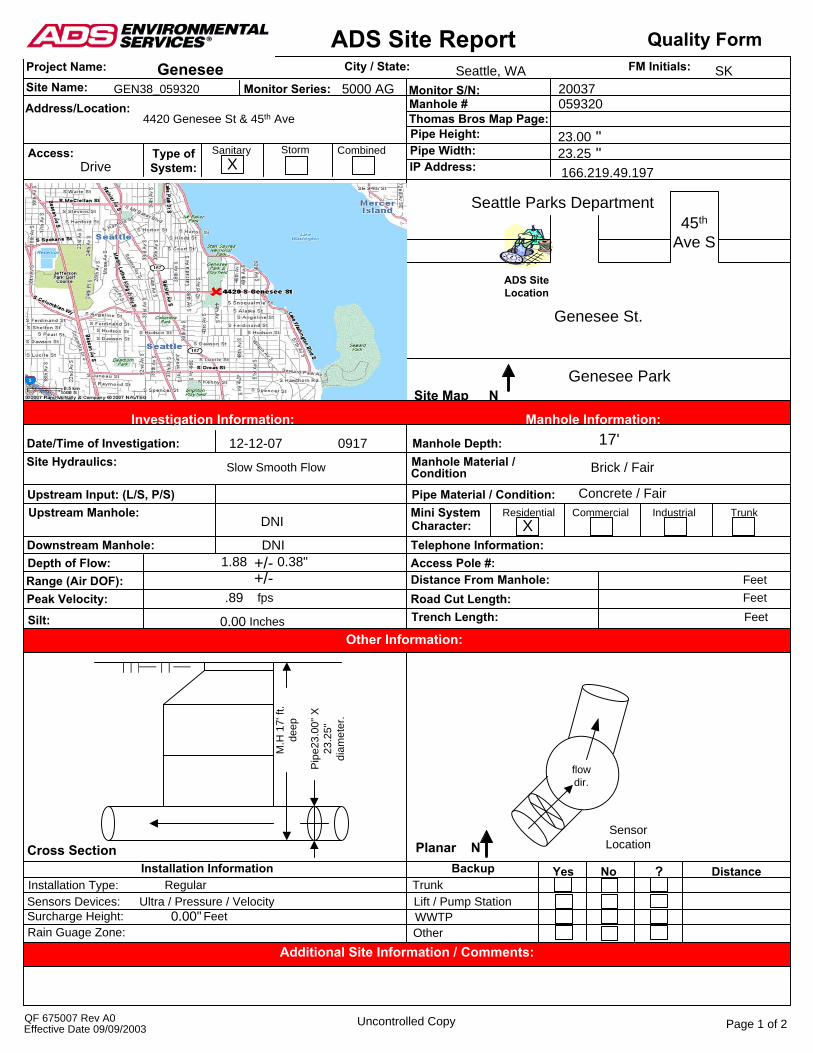
ADS Site ReportFM Initials:Project Name:
Site Name: Monitor Series:
City / State:
Access: Type ofSystem:
Sanitary
Site MapInvestigation Information:
Manhole Depth:Manhole Material /
Pipe Material / Condition:Mini System Commercial
Telephone Information:Access Pole #:Distance From Manhole:Road Cut Length:Trench Length: Feet
FeetFeet
Date/Time of Investigation:Site Hydraulics:
Upstream Input: (L/S, P/S)Upstream Manhole:
Downstream Manhole:Depth of Flow:Range (Air DOF):Peak Velocity:
Silt: Inches
fps
+/-+/-
Cross Section PlanarInstallation Information
Installation Type: Regular Sensors Devices: Ultra / Pressure / VelocitySurcharge Height:Rain Guage Zone:
Feet
Backup Yes No ? DistanceTrunkLift / Pump StationWWTPOther
QF 675007 Rev A0 Uncontrolled Copy
Monitor S/N:
Thomas Bros Map Page:Pipe Height:Pipe Width:IP Address:
Manhole #
""
Quality Form
Address/Location:
Genesee Seattle, WA SKGEN38_059320
DriveStorm Combined
X
Manhole Information:Investigation Information:
DNI
Slow Smooth Flow
12-12-07 0917
DNI
Condition
Character:TrunkResidential Industrial
N
Brick / Fair
Other Information:
Additional Site Information / Comments:
N
Effective Date 09/09/2003 Page 1 of 2
SensorLocation
Pip
e23.
00" X
23
.25"
di
amet
er.
M.H
17'
ft.
deep
4420 Genesee St & 45th Ave
0.00
X
flowdir.
059320
0.00"
23.0023.25
0.38"
17'
Concrete / Fair
5000 AG
ADS SiteLocation
20037
166.219.49.197
1.88
.89
Genesee St.
Seattle Parks Department45th
Ave S
Genesee Park
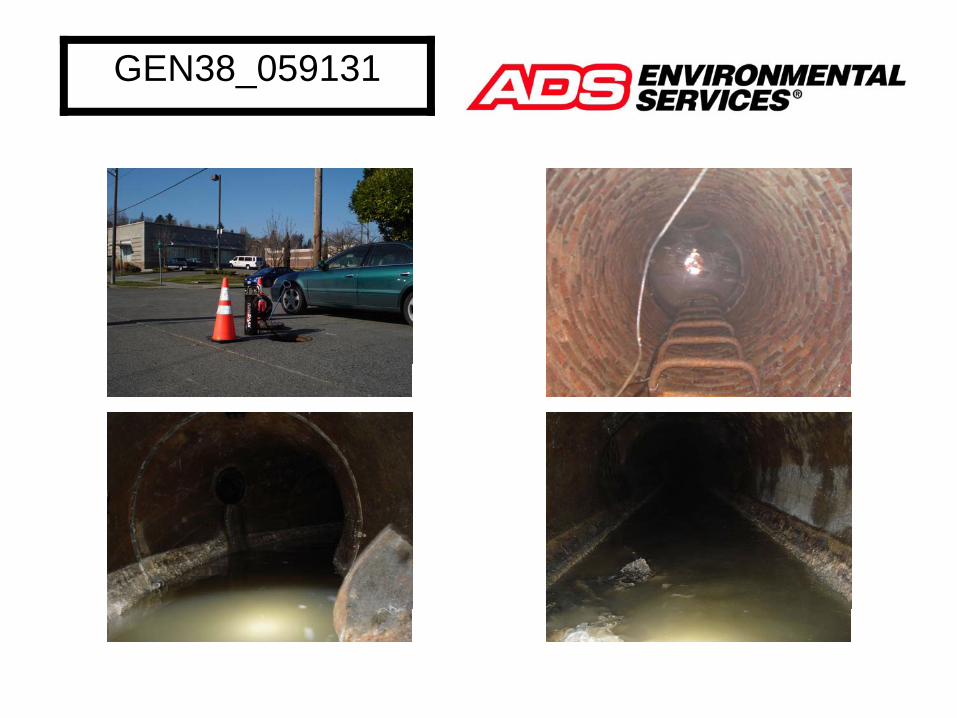
GEN38_059131
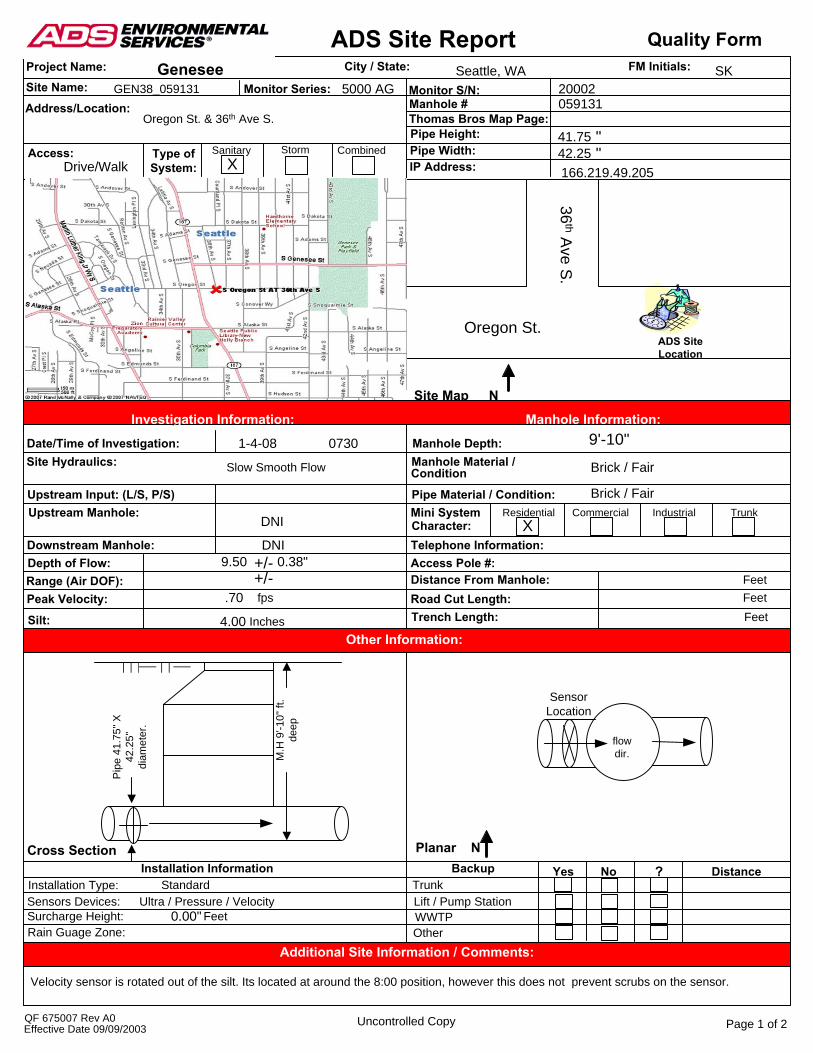
ADS Site ReportFM Initials:Project Name:
Site Name: Monitor Series:
City / State:
Access: Type ofSystem:
Sanitary
Site MapInvestigation Information:
Manhole Depth:Manhole Material /
Pipe Material / Condition:Mini System Commercial
Telephone Information:Access Pole #:Distance From Manhole:Road Cut Length:Trench Length: Feet
FeetFeet
Date/Time of Investigation:Site Hydraulics:
Upstream Input: (L/S, P/S)Upstream Manhole:
Downstream Manhole:Depth of Flow:Range (Air DOF):Peak Velocity:
Silt: Inches
fps
+/-+/-
Cross Section PlanarInstallation Information
Installation Type: StandardSensors Devices: Ultra / Pressure / VelocitySurcharge Height:Rain Guage Zone:
Feet
Backup Yes No ? DistanceTrunkLift / Pump StationWWTPOther
QF 675007 Rev A0 Uncontrolled Copy
Monitor S/N:
Thomas Bros Map Page:Pipe Height:Pipe Width:IP Address:
Manhole #
""
Quality Form
Address/Location:
Genesee Seattle, WA SKGEN38_059131
Drive/WalkStorm Combined
X
Manhole Information:Investigation Information:
DNI
Slow Smooth Flow
1-4-08 0730
DNI
Condition
Character:TrunkResidential Industrial
N
Brick / Fair
Other Information:
Additional Site Information / Comments:
N
Effective Date 09/09/2003 Page 1 of 2
SensorLocation
Pip
e 41
.75"
X
42.2
5"
diam
eter
.
M.H
9'-1
0" ft
. de
ep
Oregon St. & 36th Ave S.
4.00
X
flowdir.
059131
0.00"
41.7542.25
0.38"
9'-10"
Brick / Fair
5000 AG
ADS SiteLocation
20002
166.219.49.205
9.50
.70
36th A
ve S.
Oregon St.
Velocity sensor is rotated out of the silt. Its located at around the 8:00 position, however this does not prevent scrubs on the sensor.
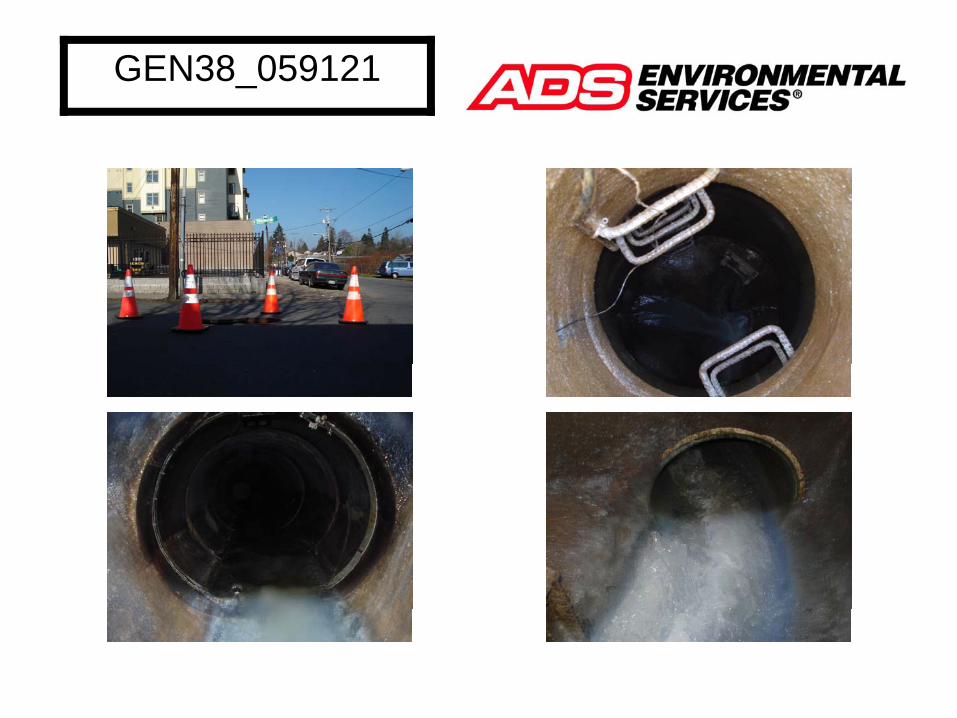
GEN38_059121
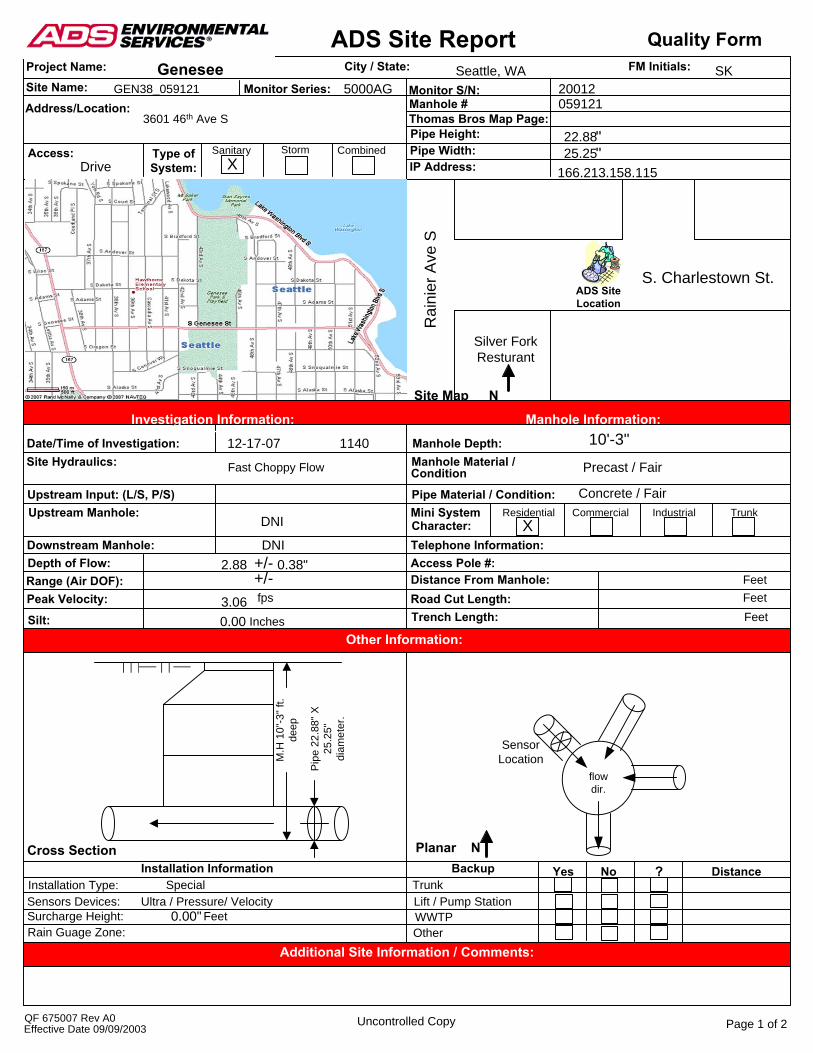
ADS Site ReportFM Initials:Project Name:
Site Name: Monitor Series:
City / State:
Access: Type ofSystem:
Sanitary
Site MapInvestigation Information:
Manhole Depth:Manhole Material /
Pipe Material / Condition:Mini System Commercial
Telephone Information:Access Pole #:Distance From Manhole:Road Cut Length:Trench Length: Feet
FeetFeet
Date/Time of Investigation:Site Hydraulics:
Upstream Input: (L/S, P/S)Upstream Manhole:
Downstream Manhole:Depth of Flow:Range (Air DOF):Peak Velocity:
Silt: Inches
fps
+/-+/-
Cross Section PlanarInstallation Information
Installation Type: SpecialSensors Devices: Ultra / Pressure/ Velocity Surcharge Height:Rain Guage Zone:
Feet
Backup Yes No ? DistanceTrunkLift / Pump StationWWTPOther
QF 675007 Rev A0 Uncontrolled Copy
Monitor S/N:
Thomas Bros Map Page:Pipe Height:Pipe Width:IP Address:
Manhole #
""
Quality Form
Address/Location:
Genesee Seattle, WA SKGEN38_059121
DriveStorm Combined
X
Manhole Information:Investigation Information:
DNI
Fast Choppy Flow
12-17-07 1140
DNI
Condition
Character:TrunkResidential Industrial
N
Precast / Fair
Other Information:
Additional Site Information / Comments:
N
Effective Date 09/09/2003 Page 1 of 2
Pip
e 22
.88"
X
25.2
5"
diam
eter
.
M.H
10"
-3" f
t. de
ep
3601 46th Ave S
0.00
X
059121
0.00"
22.88
0.38"
10'-3"
Concrete / Fair
5000AG
ADS SiteLocation
20012
166.213.158.115
2.88
S. Charlestown St.
Rai
nier
Ave
S
25.25
3.06
SensorLocation
flowdir.
Silver Fork Resturant
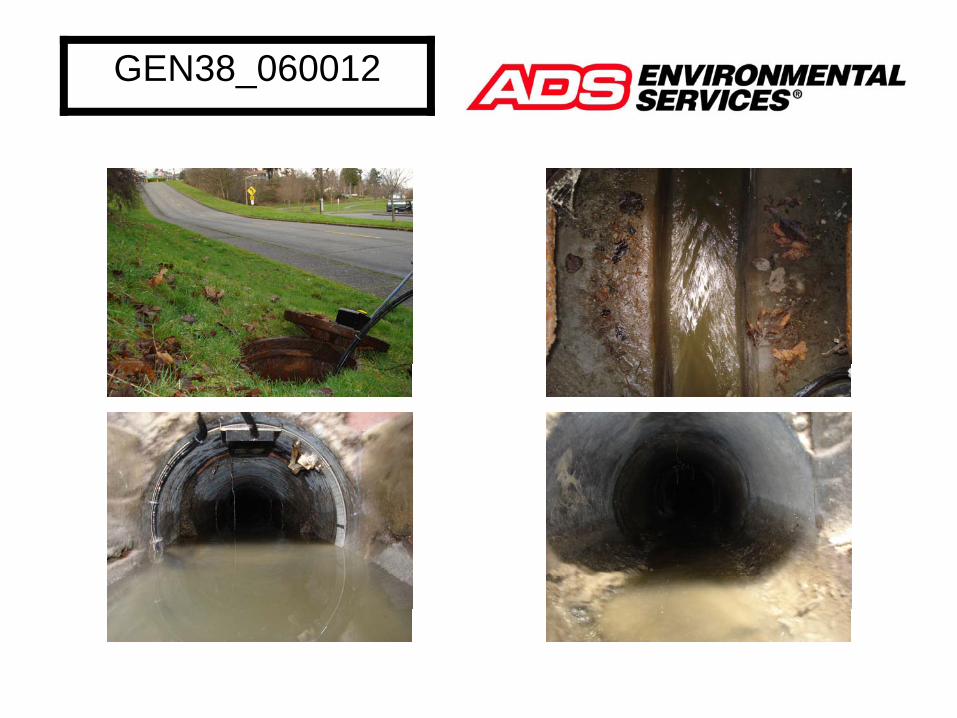
GEN38_060012
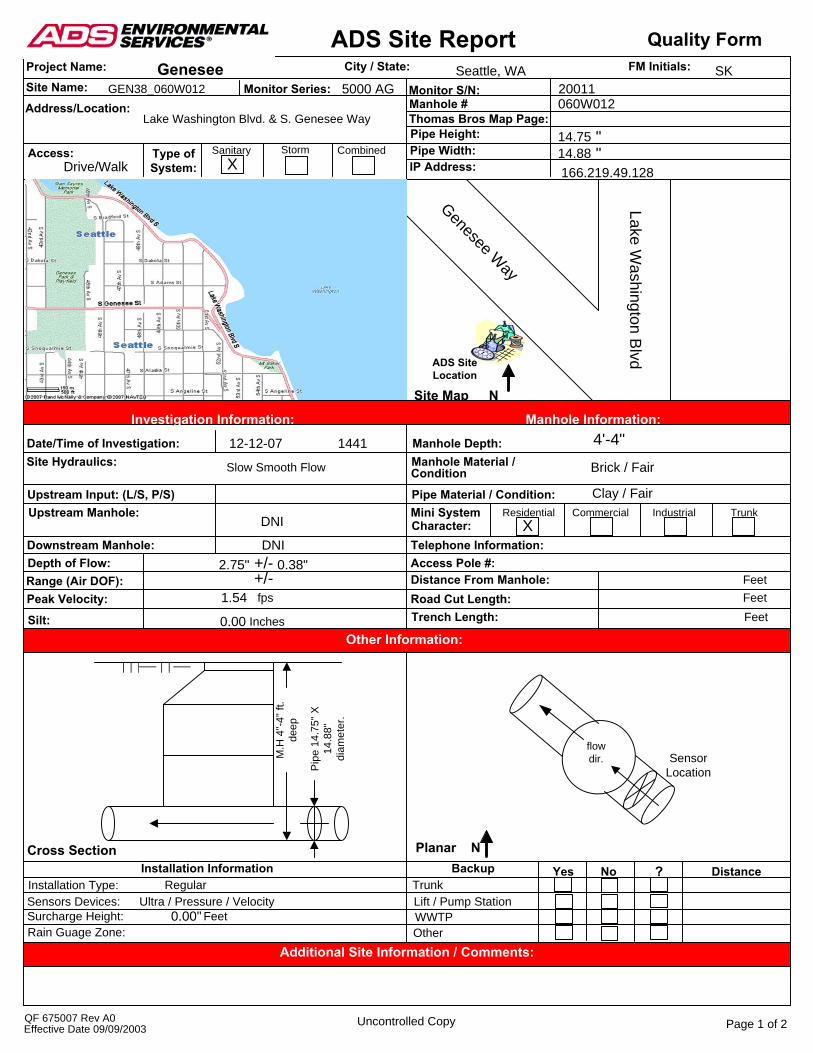
ADS Site ReportFM Initials:Project Name:
Site Name: Monitor Series:
City / State:
Access: Type ofSystem:
Sanitary
Site MapInvestigation Information:
Manhole Depth:Manhole Material /
Pipe Material / Condition:Mini System Commercial
Telephone Information:Access Pole #:Distance From Manhole:Road Cut Length:Trench Length: Feet
FeetFeet
Date/Time of Investigation:Site Hydraulics:
Upstream Input: (L/S, P/S)Upstream Manhole:
Downstream Manhole:Depth of Flow:Range (Air DOF):Peak Velocity:
Silt: Inches
fps
+/-+/-
Cross Section PlanarInstallation Information
Installation Type: Regular Sensors Devices: Ultra / Pressure / VelocitySurcharge Height:Rain Guage Zone:
Feet
Backup Yes No ? DistanceTrunkLift / Pump StationWWTPOther
QF 675007 Rev A0 Uncontrolled Copy
Monitor S/N:
Thomas Bros Map Page:Pipe Height:Pipe Width:IP Address:
Manhole #
""
Quality Form
Address/Location:
Genesee Seattle, WA SKGEN38_060W012
Drive/WalkStorm Combined
X
Manhole Information:Investigation Information:
DNI
Slow Smooth Flow
12-12-07 1441
DNI
Condition
Character:TrunkResidential Industrial
N
Brick / Fair
Other Information:
Additional Site Information / Comments:
N
Effective Date 09/09/2003 Page 1 of 2
SensorLocationP
ipe
14.7
5" X
14
.88"
di
amet
er.
M.H
4"-
4" ft
. de
ep
Lake Washington Blvd. & S. Genesee Way
0.00
X
flowdir.
060W012
0.00"
14.7514.88
0.38"
4'-4"
Clay / Fair
5000 AG
ADS SiteLocation
20011
166.219.49.128
2.75"
Genesee Way
1.54
Lake Washington B
lvd
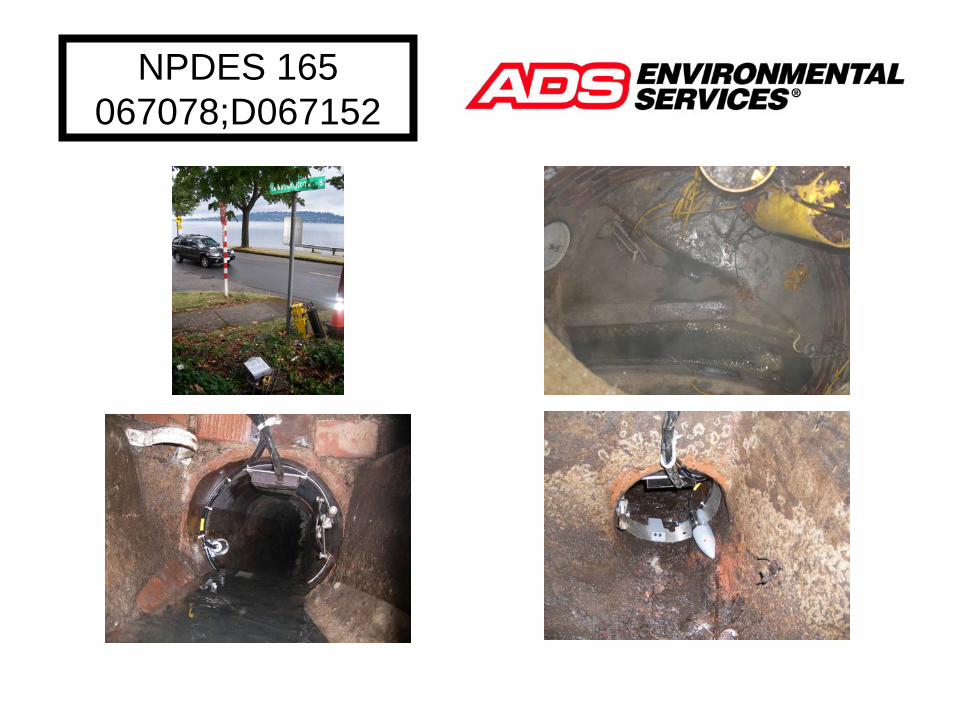
NPDES 165 067078;D067152
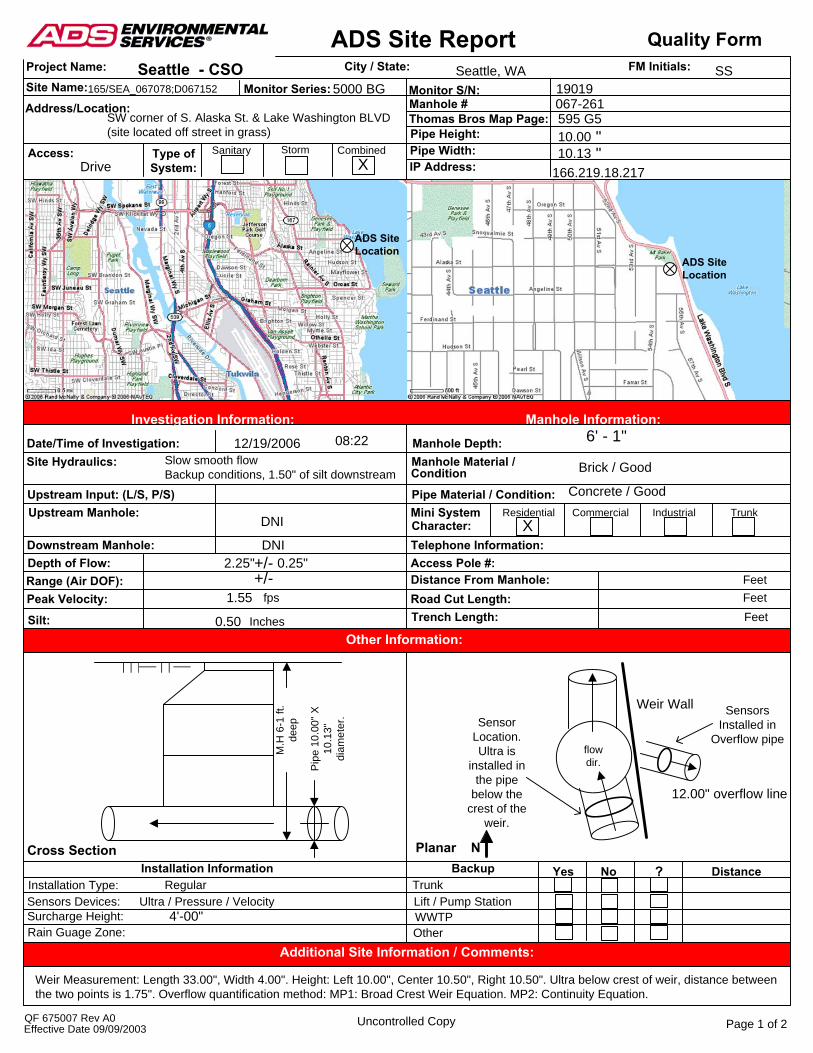
ADS Site ReportFM Initials:Project Name:
Site Name: Monitor Series:
City / State:
Access: Type ofSystem:
Sanitary
Access Map
Site MapInvestigation Information:
Manhole Depth:Manhole Material /
Pipe Material / Condition:Mini System Commercial
Telephone Information:Access Pole #:Distance From Manhole:Road Cut Length:Trench Length: Feet
FeetFeet
Date/Time of Investigation:Site Hydraulics:
Upstream Input: (L/S, P/S)Upstream Manhole:
Downstream Manhole:Depth of Flow:Range (Air DOF):Peak Velocity:
Silt: Inches
fps
+/-+/-
Cross Section PlanarInstallation Information
Installation Type: Regular Sensors Devices: Ultra / Pressure / VelocitySurcharge Height:Rain Guage Zone:
Backup Yes No ? DistanceTrunkLift / Pump StationWWTPOther
QF 675007 Rev A0 Uncontrolled Copy
Monitor S/N:
Thomas Bros Map Page:Pipe Height:Pipe Width:IP Address:
Manhole #
""
Quality Form
Address/Location:
Seattle - CSO Seattle, WA SS165/SEA_067078;D067152
DriveStorm Combined
X
Manhole Information:Investigation Information:
DNI
Slow smooth flowBackup conditions, 1.50" of silt downstream
12/19/2006
DNI
Condition
Character:TrunkResidential Industrial
NN
Brick / Good
Other Information:
Additional Site Information / Comments:
N
Effective Date 09/09/2003 Page 1 of 2
SensorLocation.Ultra is
installed in the pipe
below the crest of the
weir.
Pip
e 10
.00"
X
10.1
3"
diam
eter
.
M.H
6-1
ft.
deep
SW corner of S. Alaska St. & Lake Washington BLVD(site located off street in grass)
X
flowdir.
067-261595 G5
4'-00"
Weir Wall
10.0010.13
ADS SiteLocation
2.25" 0.25"
1.55
0.50
6' - 1"
Concrete / Good
12.00" overflow line
Weir Measurement: Length 33.00", Width 4.00". Height: Left 10.00", Center 10.50", Right 10.50". Ultra below crest of weir, distance between the two points is 1.75". Overflow quantification method: MP1: Broad Crest Weir Equation. MP2: Continuity Equation.
ADS SiteLocation
08:22
5000 BG 19019
166.219.18.217
SensorsInstalled in
Overflow pipe
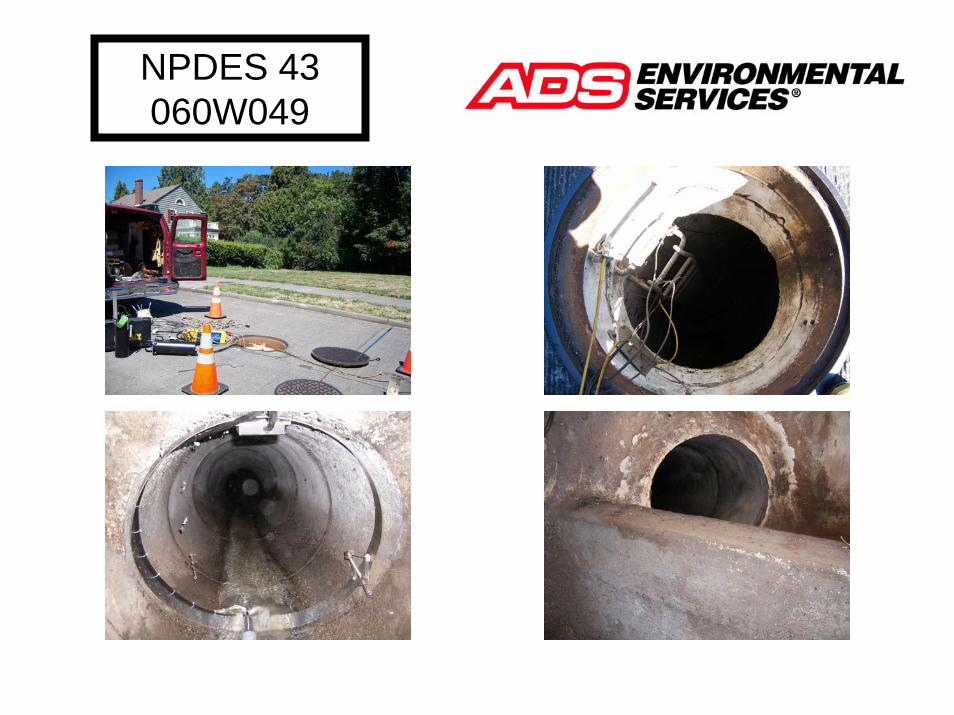
NPDES 43060W049
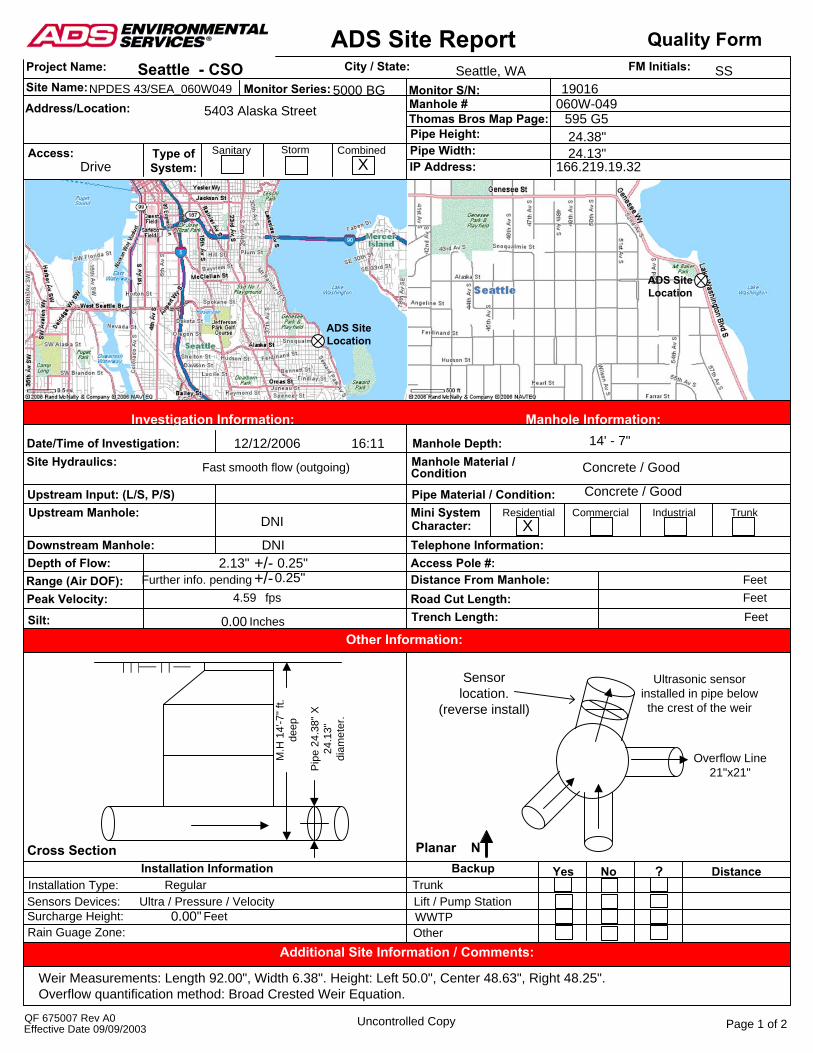
ADS Site ReportFM Initials:Project Name:
Site Name: Monitor Series:
City / State:
Access: Type ofSystem:
Sanitary
Access Map
Site MapInvestigation Information:
Manhole Depth:Manhole Material /
Pipe Material / Condition:Mini System Commercial
Telephone Information:Access Pole #:Distance From Manhole:Road Cut Length:Trench Length: Feet
FeetFeet
Date/Time of Investigation:Site Hydraulics:
Upstream Input: (L/S, P/S)Upstream Manhole:
Downstream Manhole:Depth of Flow:Range (Air DOF):Peak Velocity:
Silt: Inches
fps
+/-+/-
Cross Section PlanarInstallation Information
Installation Type: Regular Sensors Devices: Ultra / Pressure / VelocitySurcharge Height:Rain Guage Zone:
Feet
Backup Yes No ? DistanceTrunkLift / Pump StationWWTPOther
QF 675007 Rev A0 Uncontrolled Copy
Monitor S/N:
Thomas Bros Map Page:Pipe Height:Pipe Width:IP Address:
Manhole #
Quality Form
Address/Location:
Seattle - CSO Seattle, WA SSNPDES 43/SEA_060W049
DriveStorm Combined
X
Manhole Information:Investigation Information:
DNI
Fast smooth flow (outgoing)
16:1112/12/2006
DNI
Condition
Character:TrunkResidential Industrial
NN
Concrete / Good
Other Information:
Additional Site Information / Comments:
N
Effective Date 09/09/2003 Page 1 of 2
Pip
e 24
.38"
X
24.1
3"
diam
eter
.
M.H
14'
-7" f
t. de
ep
5403 Alaska Street
X
060W-049
0.00"
Weir Measurements: Length 92.00", Width 6.38". Height: Left 50.0", Center 48.63", Right 48.25".Overflow quantification method: Broad Crested Weir Equation.
24.13"24.38"
Further info. pending
Concrete / Good
Overflow Line21"x21"
595 G5
2.13" 0.25"0.25"
ADS SiteLocation
ADS SiteLocation
0.00
4.59
14' - 7"
Sensorlocation.
(reverse install)
5000 BG 19016
166.219.19.32
Ultrasonic sensorinstalled in pipe belowthe crest of the weir
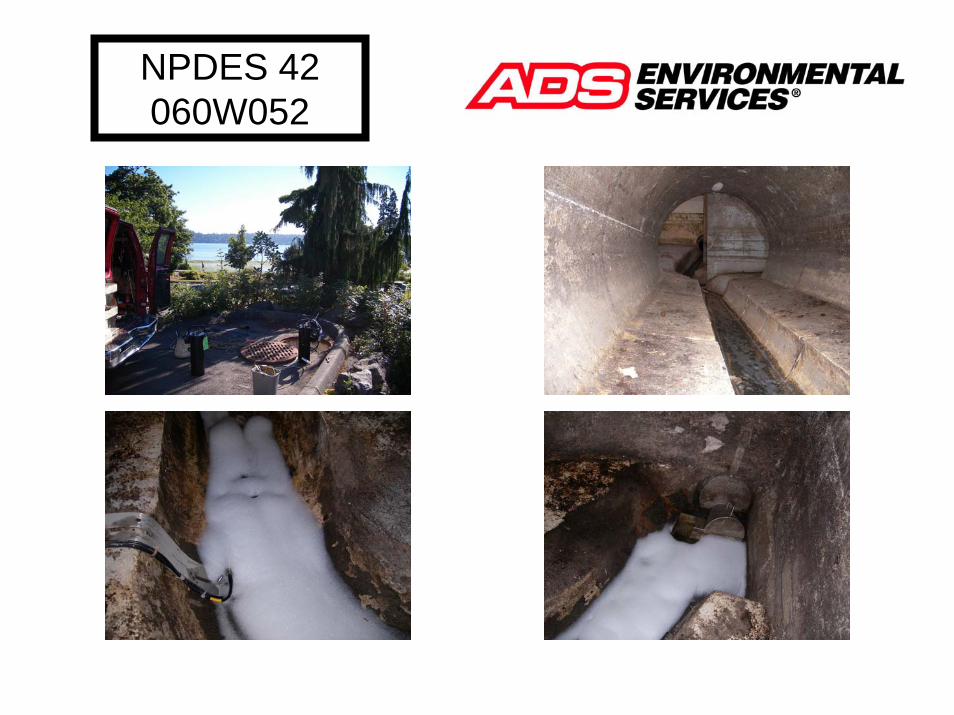
NPDES 42060W052
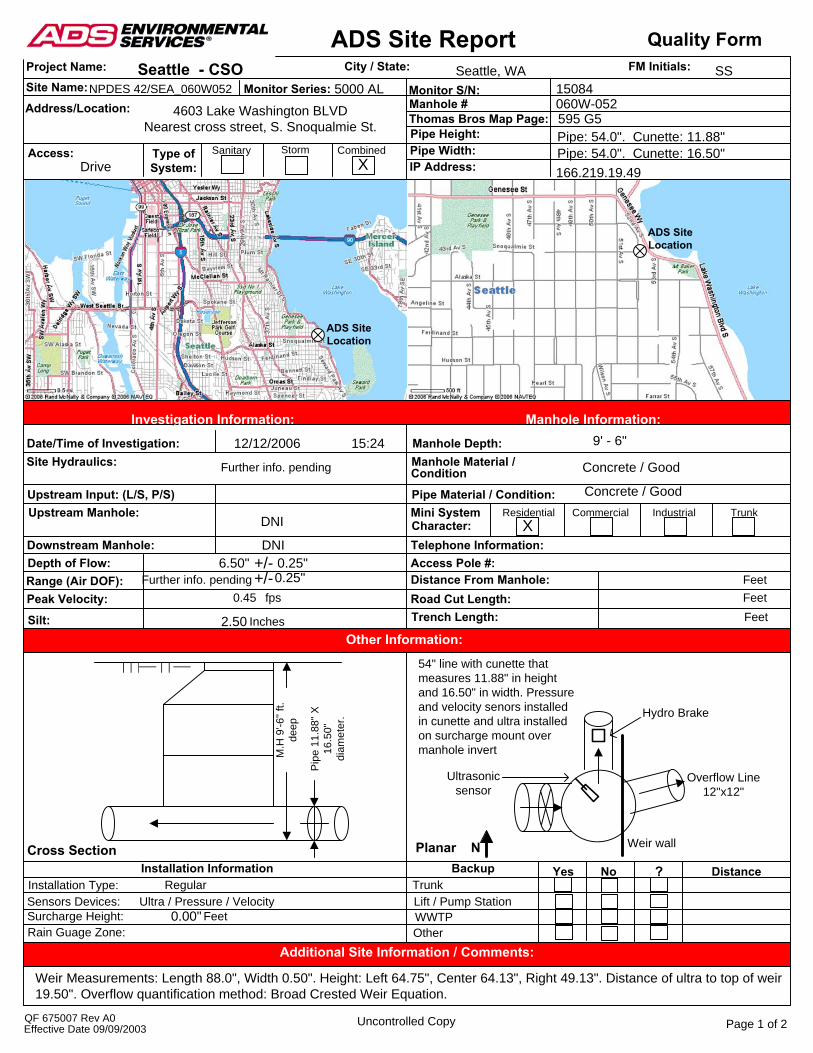
ADS Site ReportFM Initials:Project Name:
Site Name: Monitor Series:
City / State:
Access: Type ofSystem:
Sanitary
Access Map
Site MapInvestigation Information:
Manhole Depth:Manhole Material /
Pipe Material / Condition:Mini System Commercial
Telephone Information:Access Pole #:Distance From Manhole:Road Cut Length:Trench Length: Feet
FeetFeet
Date/Time of Investigation:Site Hydraulics:
Upstream Input: (L/S, P/S)Upstream Manhole:
Downstream Manhole:Depth of Flow:Range (Air DOF):Peak Velocity:
Silt: Inches
fps
+/-+/-
Cross Section PlanarInstallation Information
Installation Type: Regular Sensors Devices: Ultra / Pressure / VelocitySurcharge Height:Rain Guage Zone:
Feet
Backup Yes No ? DistanceTrunkLift / Pump StationWWTPOther
QF 675007 Rev A0 Uncontrolled Copy
Monitor S/N:
Thomas Bros Map Page:Pipe Height:Pipe Width:IP Address:
Manhole #
Quality Form
Address/Location:
Seattle - CSO Seattle, WA SSNPDES 42/SEA_060W052
DriveStorm Combined
X
Manhole Information:Investigation Information:
DNI
Further info. pending
15:2412/12/2006
DNI
Condition
Character:TrunkResidential Industrial
NN
Concrete / Good
Other Information:
Additional Site Information / Comments:
N
Effective Date 09/09/2003 Page 1 of 2
Pip
e 11
.88"
X
16.5
0"
diam
eter
.
M.H
9'-6
" ft.
deep
4603 Lake Washington BLVDNearest cross street, S. Snoqualmie St.
X
060W-052
0.00"
Weir Measurements: Length 88.0", Width 0.50". Height: Left 64.75", Center 64.13", Right 49.13". Distance of ultra to top of weir 19.50". Overflow quantification method: Broad Crested Weir Equation.
Pipe: 54.0". Cunette: 16.50"Pipe: 54.0". Cunette: 11.88"
Further info. pending
Concrete / Good
Overflow Line12"x12"
595 G5
6.50" 0.25"0.25"
ADS SiteLocation
ADS SiteLocation
2.50
0.45
9' - 6"
Hydro Brake
5000 AL 15084
Weir wall
166.219.19.49
54" line with cunette thatmeasures 11.88" in heightand 16.50" in width. Pressureand velocity senors installedin cunette and ultra installed on surcharge mount over manhole invert
Ultrasonicsensor
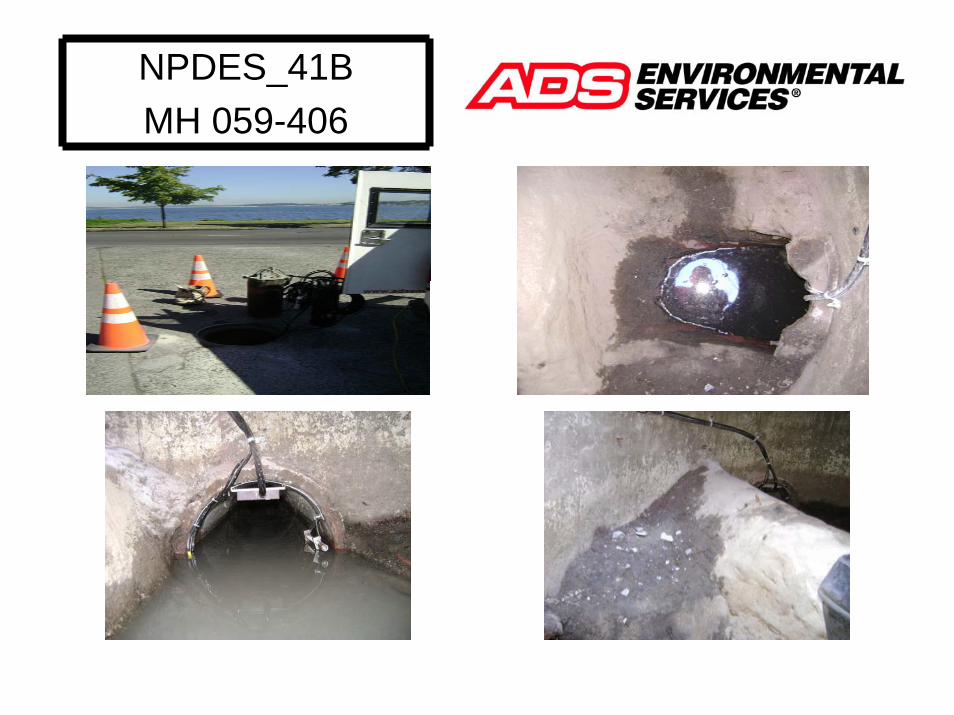
NPDES_41BMH 059-406
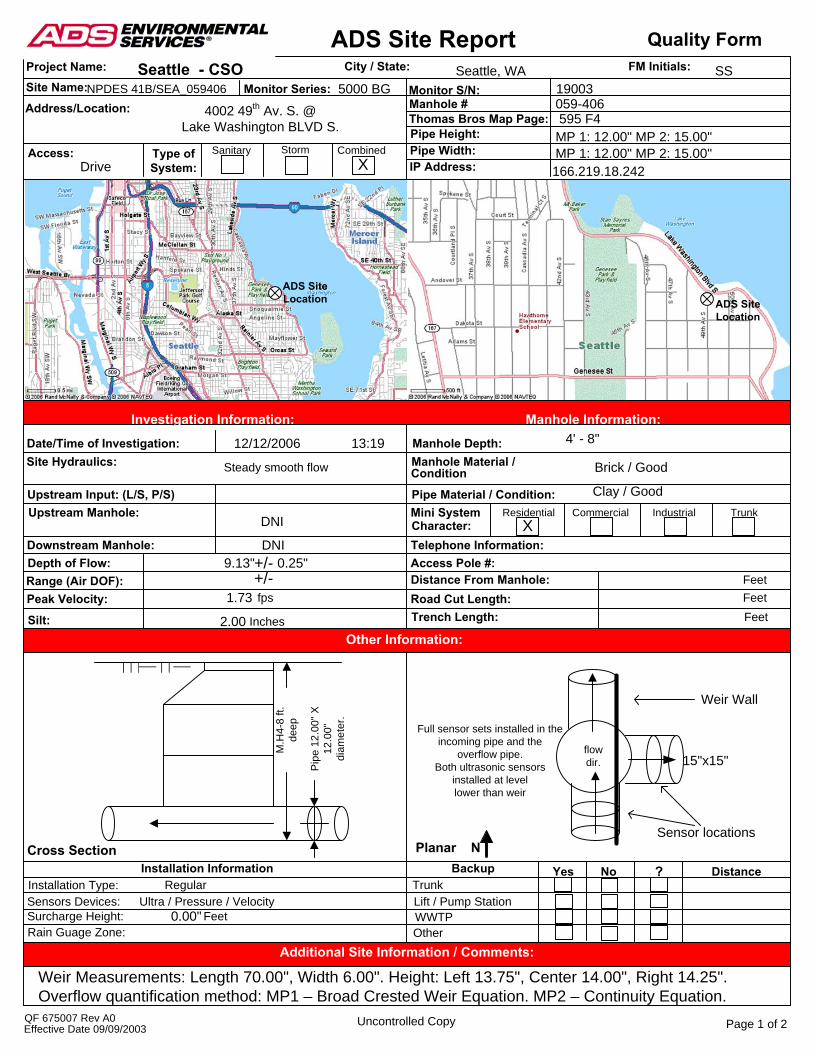
ADS Site ReportFM Initials:Project Name:
Site Name: Monitor Series:
City / State:
Access: Type ofSystem:
Sanitary
Access Map
Site MapInvestigation Information:
Manhole Depth:Manhole Material /
Pipe Material / Condition:Mini System Commercial
Telephone Information:Access Pole #:Distance From Manhole:Road Cut Length:Trench Length: Feet
FeetFeet
Date/Time of Investigation:Site Hydraulics:
Upstream Input: (L/S, P/S)Upstream Manhole:
Downstream Manhole:Depth of Flow:Range (Air DOF):Peak Velocity:
Silt: Inches
fps
+/-+/-
Cross Section PlanarInstallation Information
Installation Type: Regular Sensors Devices: Ultra / Pressure / VelocitySurcharge Height:Rain Guage Zone:
Feet
Backup Yes No ? DistanceTrunkLift / Pump StationWWTPOther
QF 675007 Rev A0 Uncontrolled Copy
Monitor S/N:
Thomas Bros Map Page:Pipe Height:Pipe Width:IP Address:
Manhole #
Quality Form
Address/Location:
Seattle - CSO Seattle, WA SSNPDES 41B/SEA_059406
DriveStorm Combined
X
Manhole Information:Investigation Information:
DNI
Steady smooth flow
13:1912/12/2006
DNI
Condition
Character:TrunkResidential Industrial
NN
Brick / Good
Other Information:
Additional Site Information / Comments:
N
Effective Date 09/09/2003 Page 1 of 2
Pip
e 12
.00"
X
12.0
0"
diam
eter
.
M.H
4-8
ft.
deep
4002 49th Av. S. @Lake Washington BLVD S.
2.00
X
flowdir.
059-406595 F4
0.00"
Weir Wall
MP 1: 12.00" MP 2: 15.00"MP 1: 12.00" MP 2: 15.00"
ADS SiteLocation ADS Site
Location
9.13" 0.25"
1.73
4' - 8"
Clay / Good
15"x15"
5000 BG 19003
166.219.18.242
Weir Measurements: Length 70.00", Width 6.00". Height: Left 13.75", Center 14.00", Right 14.25".Overflow quantification method: MP1 – Broad Crested Weir Equation. MP2 – Continuity Equation.
Full sensor sets installed in the incoming pipe and the
overflow pipe. Both ultrasonic sensors
installed at levellower than weir
Sensor locations
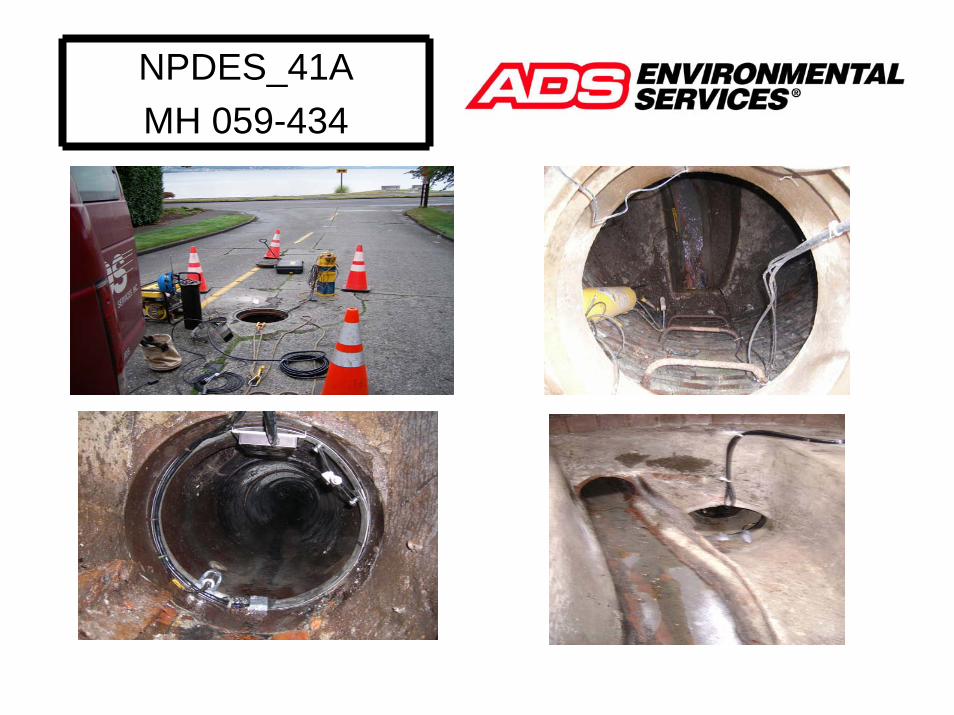
NPDES_41AMH 059-434
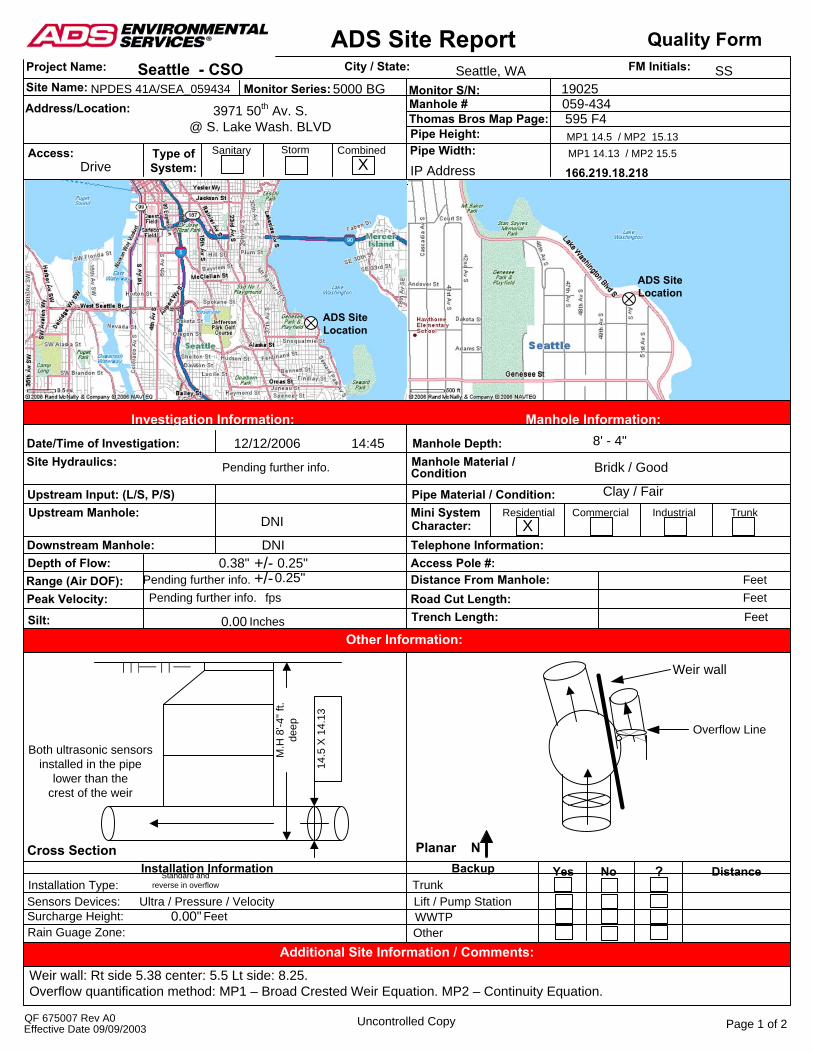
IP Address
ADS Site ReportFM Initials:Project Name:
Site Name: Monitor Series:
City / State:
Access: Type ofSystem:
Sanitary
Access Map
Site MapInvestigation Information:
Manhole Depth:Manhole Material /
Pipe Material / Condition:Mini System Commercial
Telephone Information:Access Pole #:Distance From Manhole:Road Cut Length:Trench Length: Feet
FeetFeet
Date/Time of Investigation:Site Hydraulics:
Upstream Input: (L/S, P/S)Upstream Manhole:
Downstream Manhole:Depth of Flow:Range (Air DOF):Peak Velocity:
Silt: Inches
fps
+/-+/-
Cross Section PlanarInstallation Information
Installation Type:Standard and
reverse in overflow
Sensors Devices: Ultra / Pressure / VelocitySurcharge Height:Rain Guage Zone:
Feet
Backup Yes No ? DistanceTrunkLift / Pump StationWWTPOther
QF 675007 Rev A0 Uncontrolled Copy
Monitor S/N:
Thomas Bros Map Page:Pipe Height:Pipe Width:
166.219.18.218
Manhole #
Quality Form
Address/Location:
Seattle - CSO Seattle, WA SSNPDES 41A/SEA_059434
DriveStorm Combined
X
Manhole Information:Investigation Information:
DNI
Pending further info.
14:4512/12/2006
DNI
Condition
Character:TrunkResidential Industrial
NN
Bridk / Good
Other Information:
Additional Site Information / Comments:
N
Effective Date 09/09/2003 Page 1 of 2
14.5
X 1
4.13
M.H
8'-4
" ft.
deep
3971 50th Av. S.@ S. Lake Wash. BLVD
X
059-434
0.00"
Weir wall: Rt side 5.38 center: 5.5 Lt side: 8.25.Overflow quantification method: MP1 – Broad Crested Weir Equation. MP2 – Continuity Equation.
MP1 14.13 / MP2 15.5MP1 14.5 / MP2 15.13
Pending further info.
Clay / Fair
Overflow Line
595 F4
0.38" 0.25"0.25"
ADS SiteLocation
0.00
Pending further info.
8' - 4"
ADS SiteLocation
Weir wall
190255000 BG
Both ultrasonic sensorsinstalled in the pipe
lower than the crest of the weir
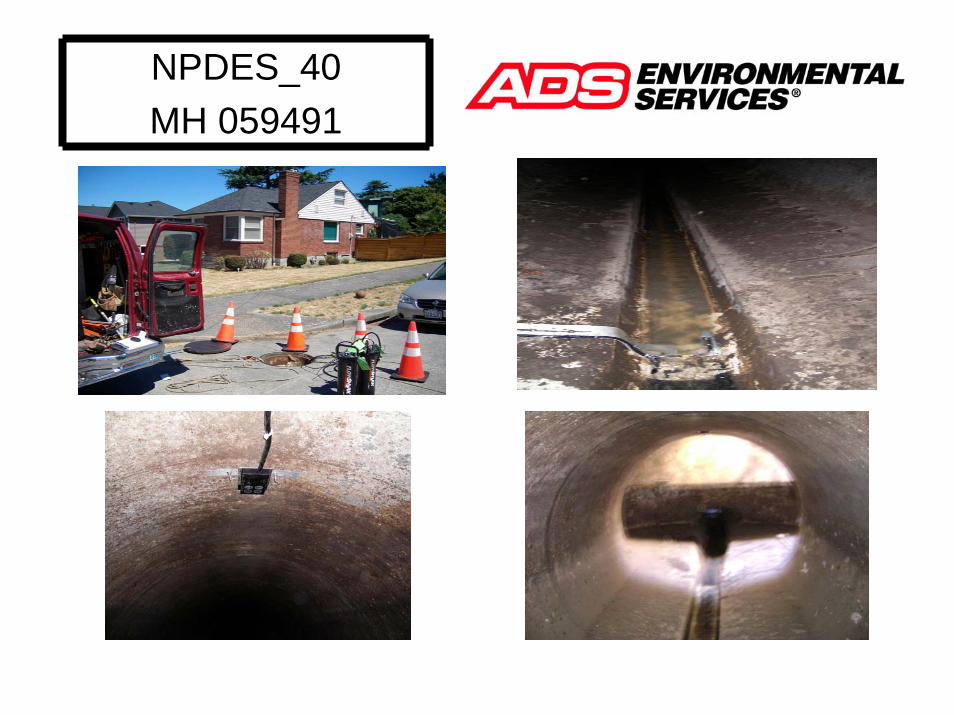
NPDES_40MH 059491
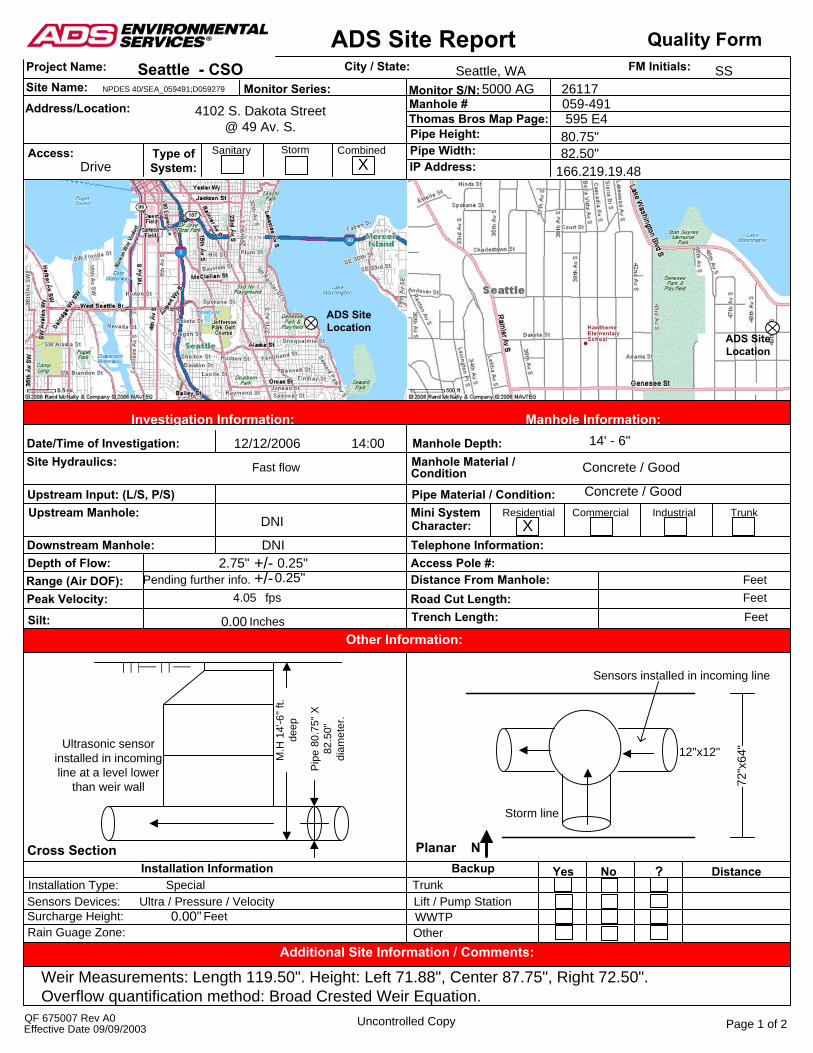
ADS Site ReportFM Initials:Project Name:
Site Name: Monitor Series:
City / State:
Access: Type ofSystem:
Sanitary
Access Map
Site MapInvestigation Information:
Manhole Depth:Manhole Material /
Pipe Material / Condition:Mini System Commercial
Telephone Information:Access Pole #:Distance From Manhole:Road Cut Length:Trench Length: Feet
FeetFeet
Date/Time of Investigation:Site Hydraulics:
Upstream Input: (L/S, P/S)Upstream Manhole:
Downstream Manhole:Depth of Flow:Range (Air DOF):Peak Velocity:
Silt: Inches
fps
+/-+/-
Cross Section PlanarInstallation Information
Installation Type: SpecialSensors Devices: Ultra / Pressure / VelocitySurcharge Height:Rain Guage Zone:
Feet
Backup Yes No ? DistanceTrunkLift / Pump StationWWTPOther
QF 675007 Rev A0 Uncontrolled Copy
Monitor S/N:
Thomas Bros Map Page:Pipe Height:Pipe Width:IP Address:
Manhole #
Quality Form
Address/Location:
Seattle - CSO Seattle, WA SSNPDES 40/SEA_059491;D059279
DriveStorm Combined
X
Manhole Information:Investigation Information:
DNI
Fast flow
14:0012/12/2006
DNI
Condition
Character:TrunkResidential Industrial
NN
Concrete / Good
Other Information:
Additional Site Information / Comments:
N
Effective Date 09/09/2003 Page 1 of 2
Pip
e 80
.75"
X
82.5
0"
diam
eter
.
M.H
14'
-6" f
t. de
ep
4102 S. Dakota Street@ 49 Av. S.
X
059-491
0.00"
82.50"80.75"
Pending further info.
Concrete / Good
595 E4
2.75" 0.25"0.25"
ADS SiteLocation
0.00
4.05
14' - 6"
ADS SiteLocation
12"x12"72
"x64
"
Storm line
5000 AG 26117
166.219.19.48
Weir Measurements: Length 119.50". Height: Left 71.88", Center 87.75", Right 72.50". Overflow quantification method: Broad Crested Weir Equation.
Sensors installed in incoming line
Ultrasonic sensorinstalled in incoming line at a level lower
than weir wall
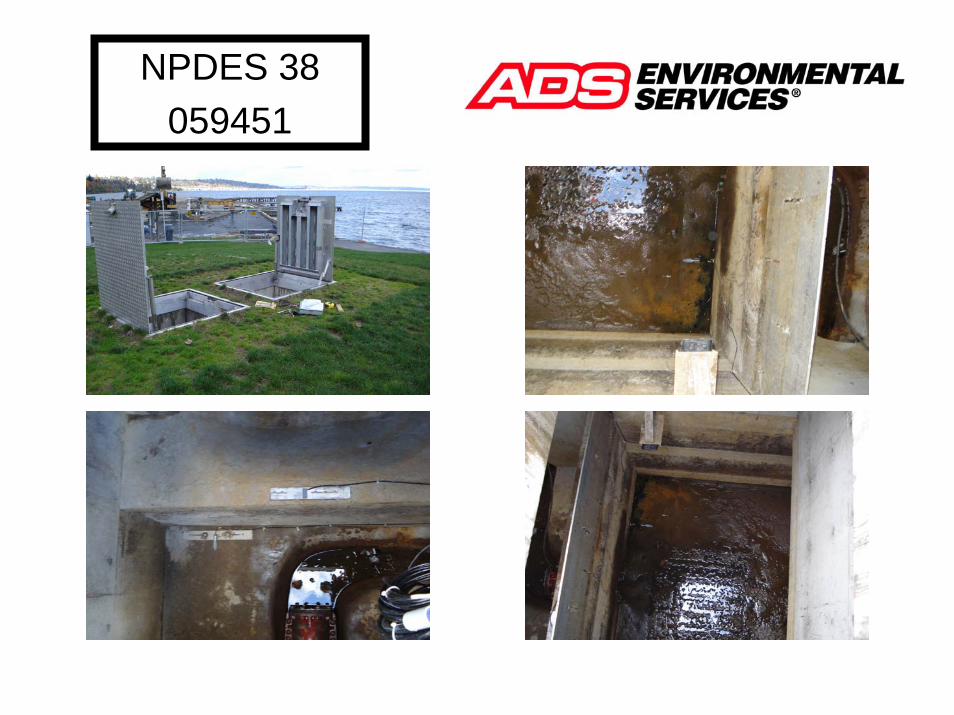
NPDES 38059451
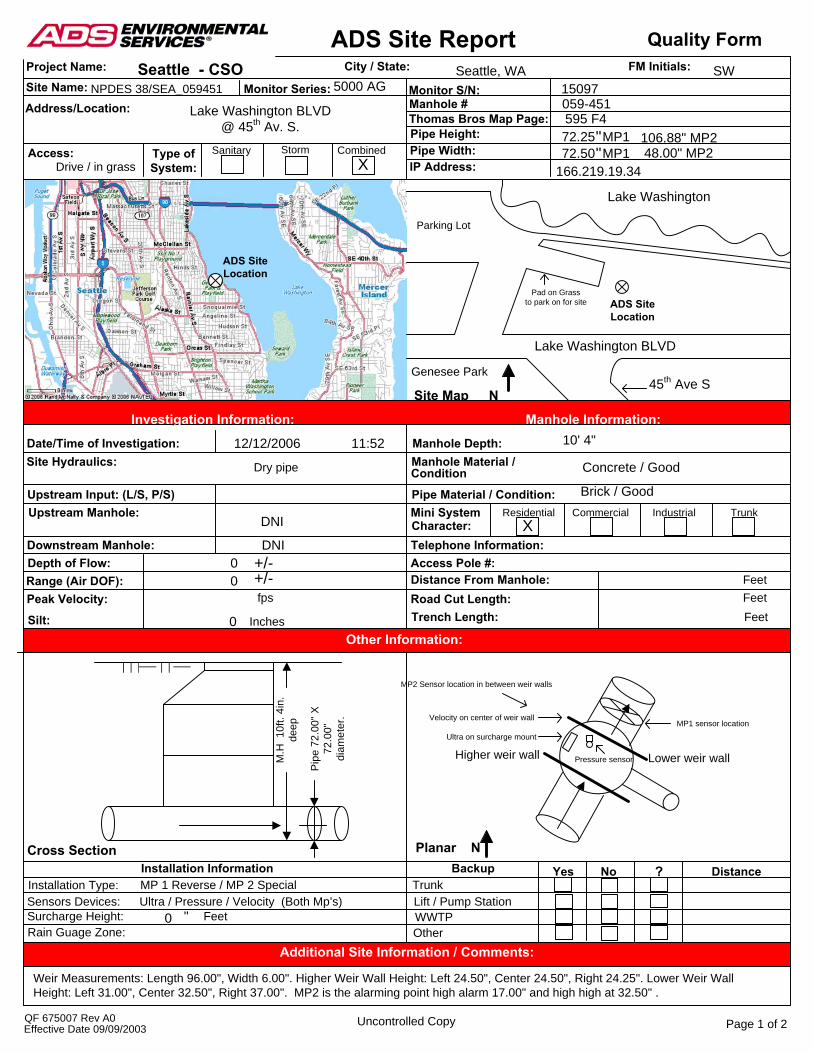
ADS Site ReportFM Initials:Project Name:
Site Name: Monitor Series:
City / State:
Access: Type ofSystem:
Sanitary
Access Map
Site MapInvestigation Information:
Manhole Depth:Manhole Material /
Pipe Material / Condition:Mini System Commercial
Telephone Information:Access Pole #:Distance From Manhole:Road Cut Length:Trench Length: Feet
FeetFeet
Date/Time of Investigation:Site Hydraulics:
Upstream Input: (L/S, P/S)Upstream Manhole:
Downstream Manhole:Depth of Flow:Range (Air DOF):Peak Velocity:
Silt: Inches
fps
+/-+/-
Cross Section PlanarInstallation Information
Installation Type: MP 1 Reverse / MP 2 Special Sensors Devices: Ultra / Pressure / Velocity (Both Mp’s)Surcharge Height:Rain Guage Zone:
Feet
Backup Yes No ? DistanceTrunkLift / Pump StationWWTPOther
QF 675007 Rev A0 Uncontrolled Copy
Monitor S/N:
Thomas Bros Map Page:Pipe Height:Pipe Width:IP Address:
Manhole #
""
Quality Form
Address/Location:
Seattle - CSO Seattle, WA SWNPDES 38/SEA_059451
Drive / in grassStorm Combined
X
Manhole Information:Investigation Information:
DNI
Dry pipe
11:5212/12/2006
DNI
Condition
Character:TrunkResidential Industrial
NN
Concrete / Good
Other Information:
Additional Site Information / Comments:
N
Effective Date 09/09/2003 Page 1 of 2
Pip
e 72
.00"
X
72.0
0"
diam
eter
.
M.H
10f
t. 4i
n.
deep
Lake Washington BLVD@ 45th Av. S.
0
X
059-451595 F4
"
72.25 MP172.50 MP1
ADS SiteLocation
ADS SiteLocation
00
Brick / Good
5000 AG 15097
166.219.19.34
Weir Measurements: Length 96.00", Width 6.00". Higher Weir Wall Height: Left 24.50", Center 24.50", Right 24.25". Lower Weir Wall Height: Left 31.00", Center 32.50", Right 37.00". MP2 is the alarming point high alarm 17.00" and high high at 32.50" .
Lower weir wallHigher weir wall Pressure sensor
Ultra on surcharge mount
Velocity on center of weir wallMP1 sensor location
MP2 Sensor location in between weir walls
10' 4"
0
106.88" MP248.00" MP2
Lake Washington BLVD
45th Ave S
Parking Lot
Pad on Grass to park on for site
Lake Washington
Genesee Park
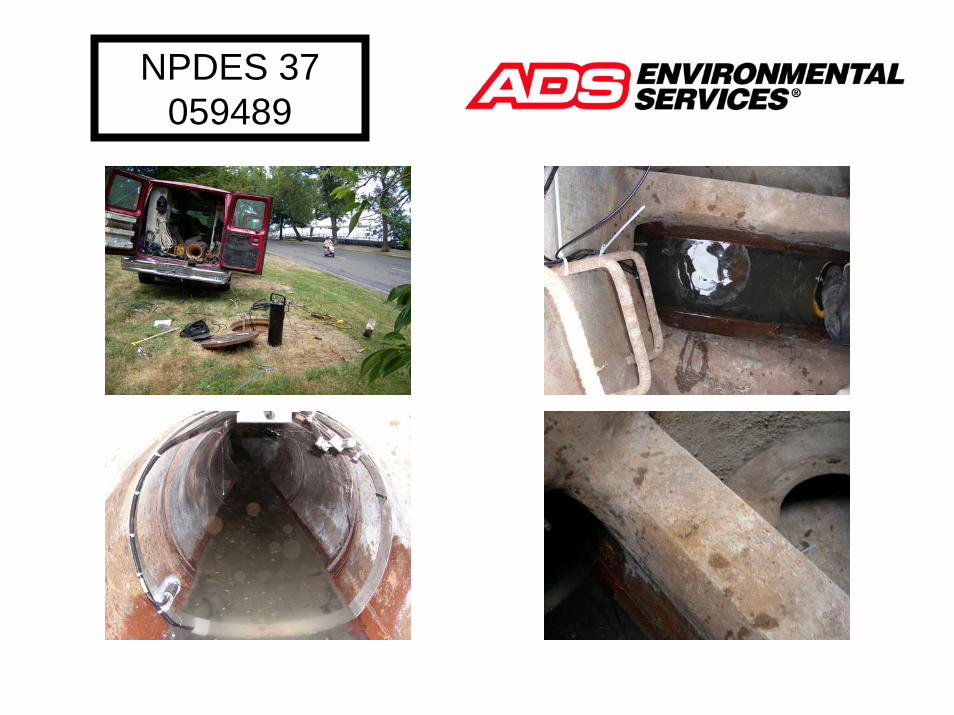
NPDES 37059489
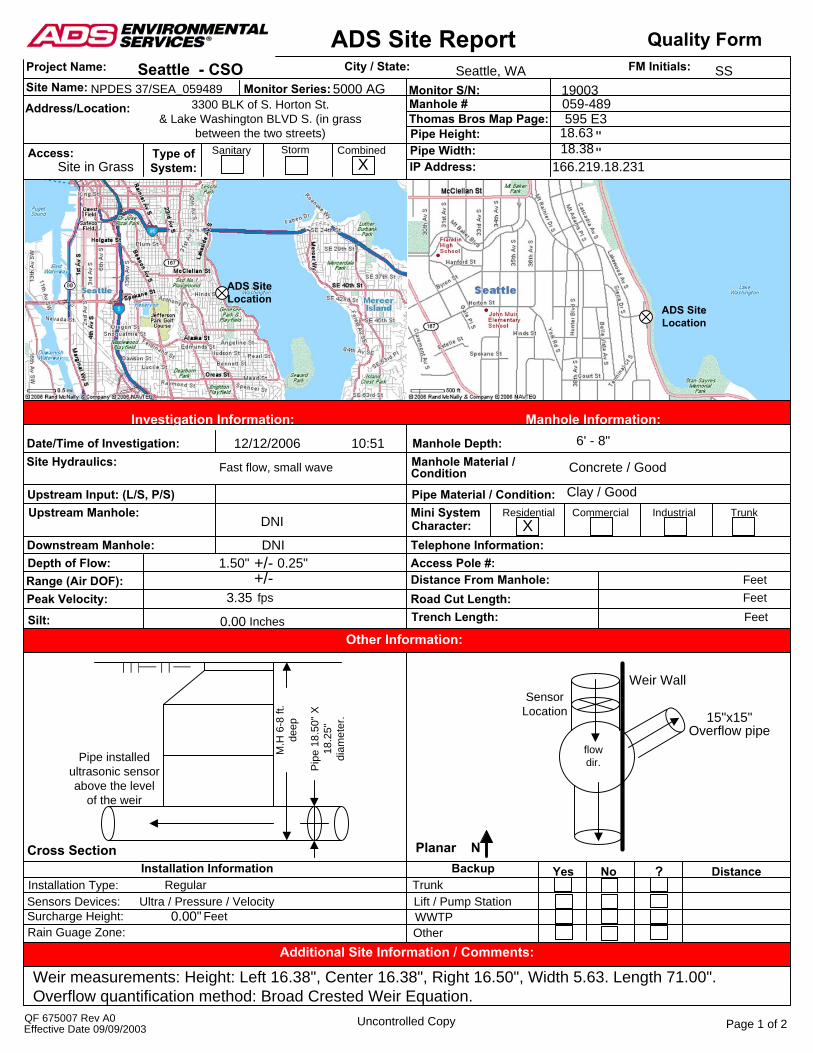
ADS Site ReportFM Initials:Project Name:
Site Name: Monitor Series:
City / State:
Access: Type ofSystem:
Sanitary
Access Map
Site MapInvestigation Information:
Manhole Depth:Manhole Material /
Pipe Material / Condition:Mini System Commercial
Telephone Information:Access Pole #:Distance From Manhole:Road Cut Length:Trench Length: Feet
FeetFeet
Date/Time of Investigation:Site Hydraulics:
Upstream Input: (L/S, P/S)Upstream Manhole:
Downstream Manhole:Depth of Flow:Range (Air DOF):Peak Velocity:
Silt: Inches
fps
+/-+/-
Cross Section PlanarInstallation Information
Installation Type: Regular Sensors Devices: Ultra / Pressure / VelocitySurcharge Height:Rain Guage Zone:
Feet
Backup Yes No ? DistanceTrunkLift / Pump StationWWTPOther
QF 675007 Rev A0 Uncontrolled Copy
Monitor S/N:
Thomas Bros Map Page:Pipe Height:Pipe Width:IP Address:
Manhole #
""
Quality Form
Address/Location:
Seattle - CSO Seattle, WA SSNPDES 37/SEA_059489
Site in GrassStorm Combined
X
Manhole Information:Investigation Information:
DNI
Fast flow, small wave
10:5112/12/2006
DNI
Condition
Character:TrunkResidential Industrial
NN
Concrete / Good
Other Information:
Additional Site Information / Comments:
N
Effective Date 09/09/2003 Page 1 of 2
SensorLocation
Pip
e 18
.50"
X
18.2
5"
diam
eter
.
M.H
6-8
ft.
deep
3300 BLK of S. Horton St.& Lake Washington BLVD S. (in grass
between the two streets)
0.00
X
flowdir.
059-489595 E3
0.00"
Weir Wall
18.6318.38
ADS SiteLocation
ADS SiteLocation
1.50" 0.25"
3.35
6' - 8"
Clay / Good
15"x15"Overflow pipe
5000 AG 19003
166.219.18.231
Weir measurements: Height: Left 16.38", Center 16.38", Right 16.50", Width 5.63. Length 71.00". Overflow quantification method: Broad Crested Weir Equation.
Pipe installedultrasonic sensorabove the level
of the weir
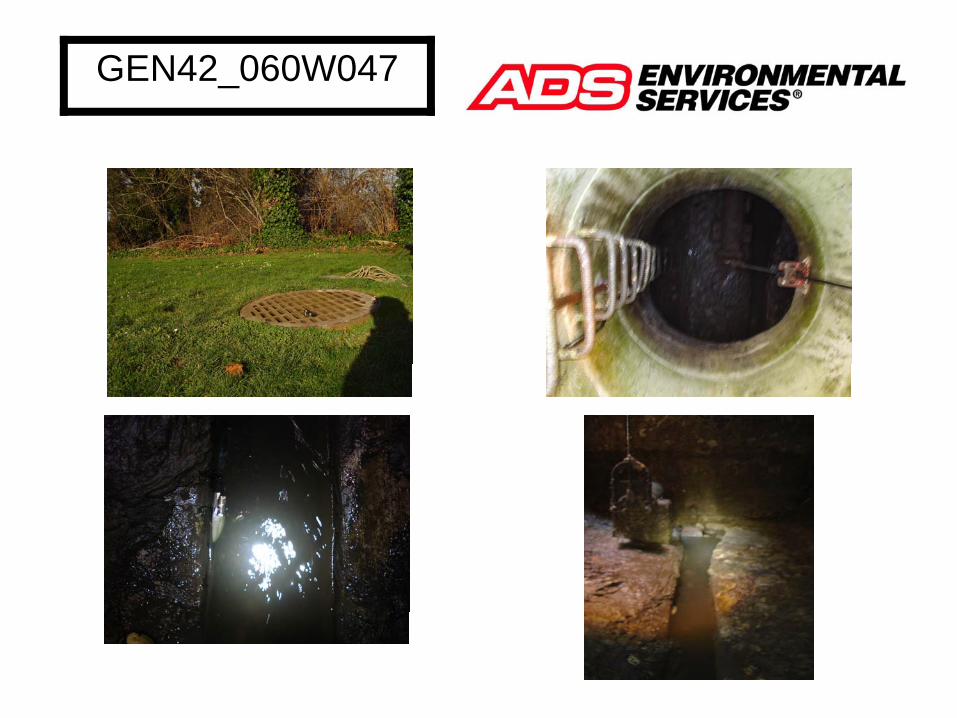
GEN42_060W047
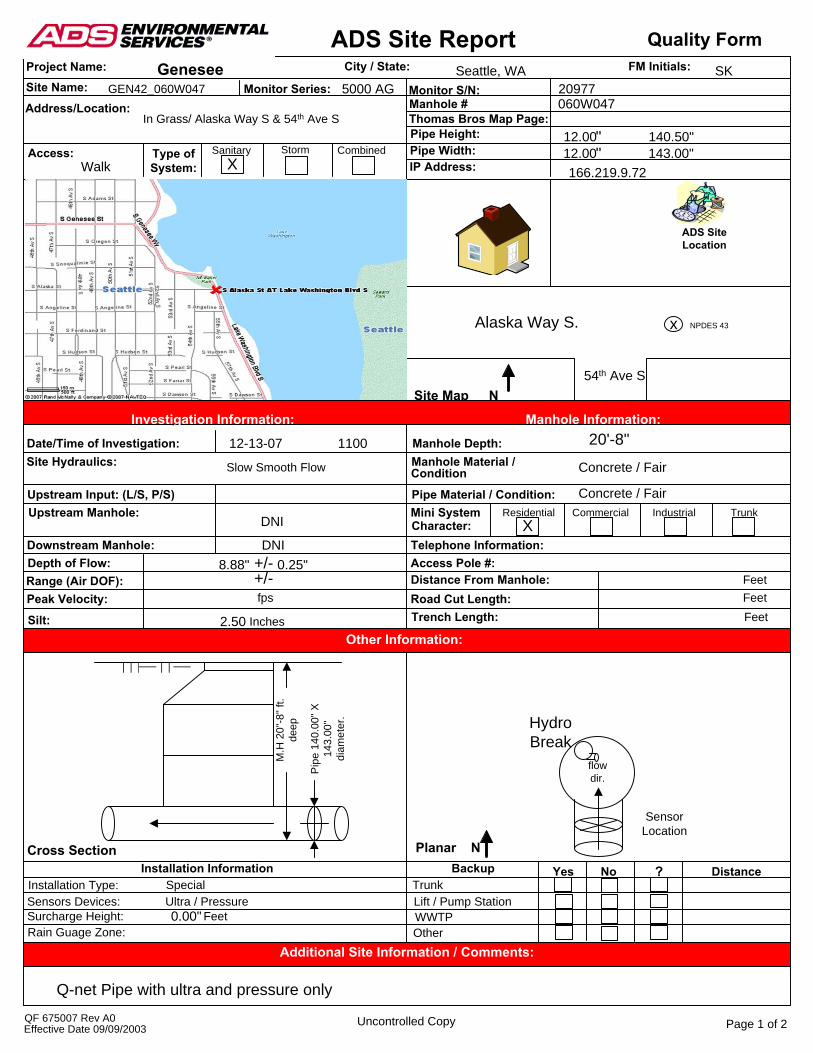
ADS Site ReportFM Initials:Project Name:
Site Name: Monitor Series:
City / State:
Access: Type ofSystem:
Sanitary
Site MapInvestigation Information:
Manhole Depth:Manhole Material /
Pipe Material / Condition:Mini System Commercial
Telephone Information:Access Pole #:Distance From Manhole:Road Cut Length:Trench Length: Feet
FeetFeet
Date/Time of Investigation:Site Hydraulics:
Upstream Input: (L/S, P/S)Upstream Manhole:
Downstream Manhole:Depth of Flow:Range (Air DOF):Peak Velocity:
Silt: Inches
fps
+/-+/-
Cross Section PlanarInstallation Information
Installation Type: SpecialSensors Devices: Ultra / Pressure Surcharge Height:Rain Guage Zone:
Feet
Backup Yes No ? DistanceTrunkLift / Pump StationWWTPOther
QF 675007 Rev A0 Uncontrolled Copy
Monitor S/N:
Thomas Bros Map Page:Pipe Height:Pipe Width:IP Address:
Manhole #
""
Quality Form
Address/Location:
Genesee Seattle, WA SKGEN42_060W047
WalkStorm Combined
X
Manhole Information:Investigation Information:
DNI
Slow Smooth Flow
12-13-07 1100
DNI
Condition
Character:TrunkResidential Industrial
N
Concrete / Fair
Other Information:
Additional Site Information / Comments:
N
Effective Date 09/09/2003 Page 1 of 2
SensorLocation
Pip
e 14
0.00
" X
143.
00"
diam
eter
.
M.H
20"
-8" f
t. de
ep
In Grass/ Alaska Way S & 54th Ave S
2.50
X
flowdir.
060W047
0.00"
12.00 140.50"
0.25"
20'-8"
Concrete / Fair
5000 AG
ADS SiteLocation
20977
166.219.9.72
8.88"
Alaska Way S.
54th Ave S
12.00 143.00"
Q-net Pipe with ultra and pressure only
x NPDES 43
Hydro Break
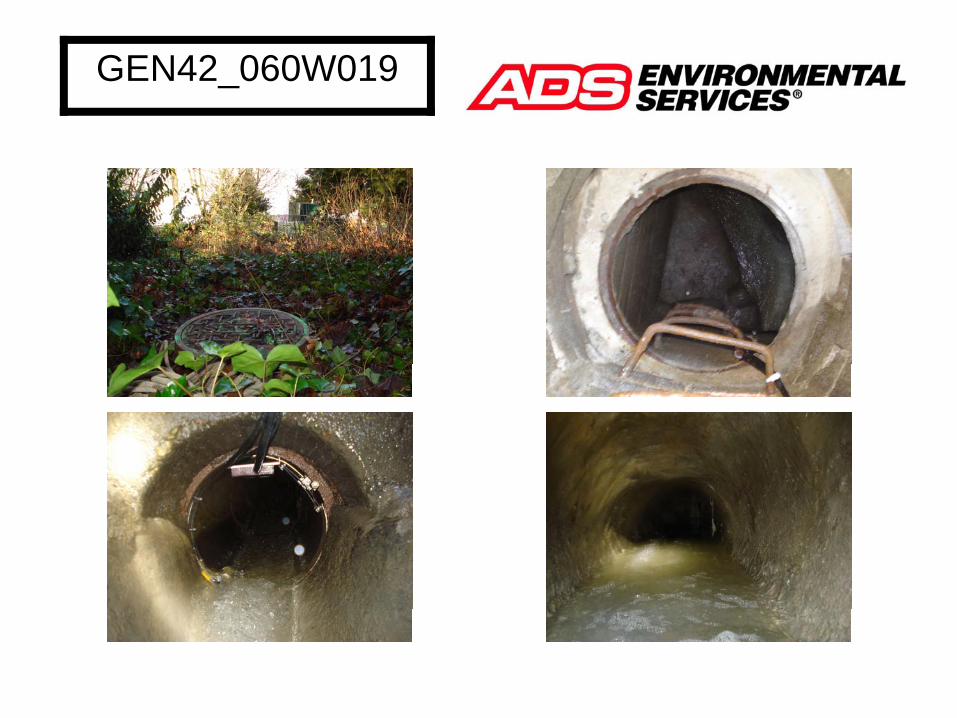
GEN42_060W019
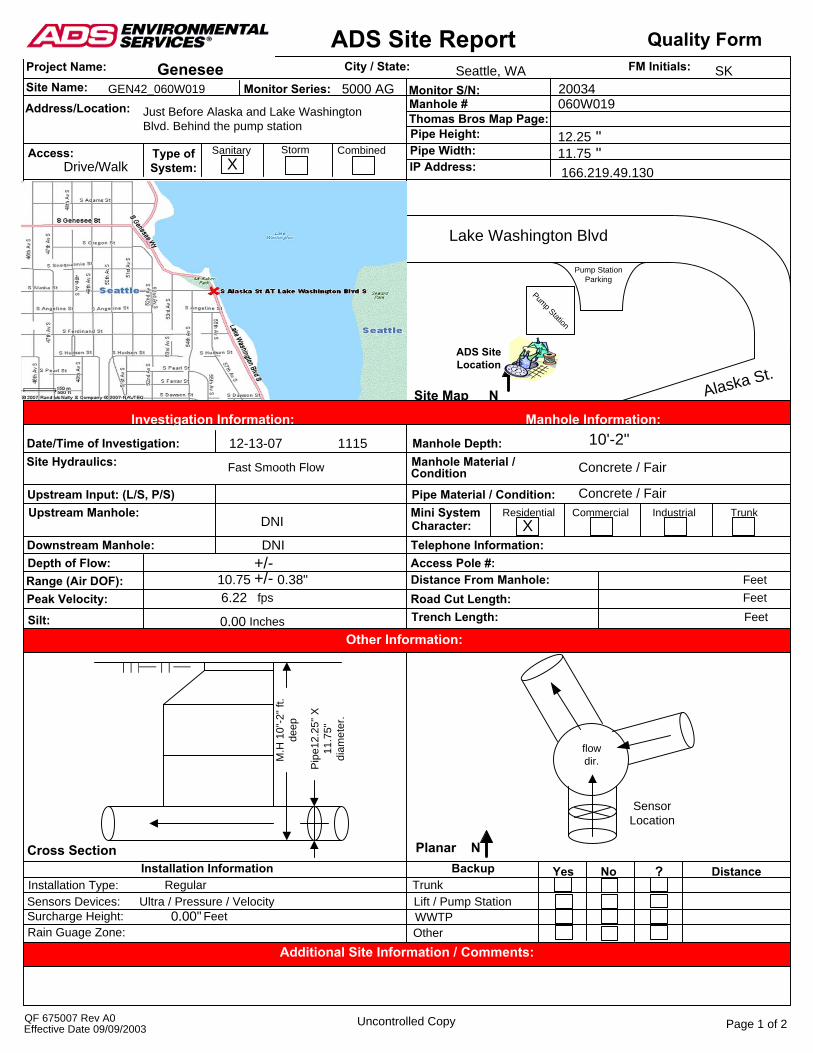
ADS Site ReportFM Initials:Project Name:
Site Name: Monitor Series:
City / State:
Access: Type ofSystem:
Sanitary
Site MapInvestigation Information:
Manhole Depth:Manhole Material /
Pipe Material / Condition:Mini System Commercial
Telephone Information:Access Pole #:Distance From Manhole:Road Cut Length:Trench Length: Feet
FeetFeet
Date/Time of Investigation:Site Hydraulics:
Upstream Input: (L/S, P/S)Upstream Manhole:
Downstream Manhole:Depth of Flow:Range (Air DOF):Peak Velocity:
Silt: Inches
fps
+/-+/-
Cross Section PlanarInstallation Information
Installation Type: Regular Sensors Devices: Ultra / Pressure / VelocitySurcharge Height:Rain Guage Zone:
Feet
Backup Yes No ? DistanceTrunkLift / Pump StationWWTPOther
QF 675007 Rev A0 Uncontrolled Copy
Monitor S/N:
Thomas Bros Map Page:Pipe Height:Pipe Width:IP Address:
Manhole #
""
Quality Form
Address/Location:
Genesee Seattle, WA SKGEN42_060W019
Drive/WalkStorm Combined
X
Manhole Information:Investigation Information:
DNI
Fast Smooth Flow
12-13-07 1115
DNI
Condition
Character:TrunkResidential Industrial
N
Concrete / Fair
Other Information:
Additional Site Information / Comments:
N
Effective Date 09/09/2003 Page 1 of 2
SensorLocation
Pip
e12.
25" X
11
.75"
di
amet
er.
M.H
10"
-2" f
t. de
ep
Just Before Alaska and Lake Washington Blvd. Behind the pump station
0.00
X
flowdir.
060W019
0.00"
12.2511.75
0.38"
10'-2"
Concrete / Fair
5000 AG
ADS SiteLocation
20034
166.219.49.130
10.75
Alaska St.
6.22
Lake Washington Blvd
Pump Station
Pump Station Parking
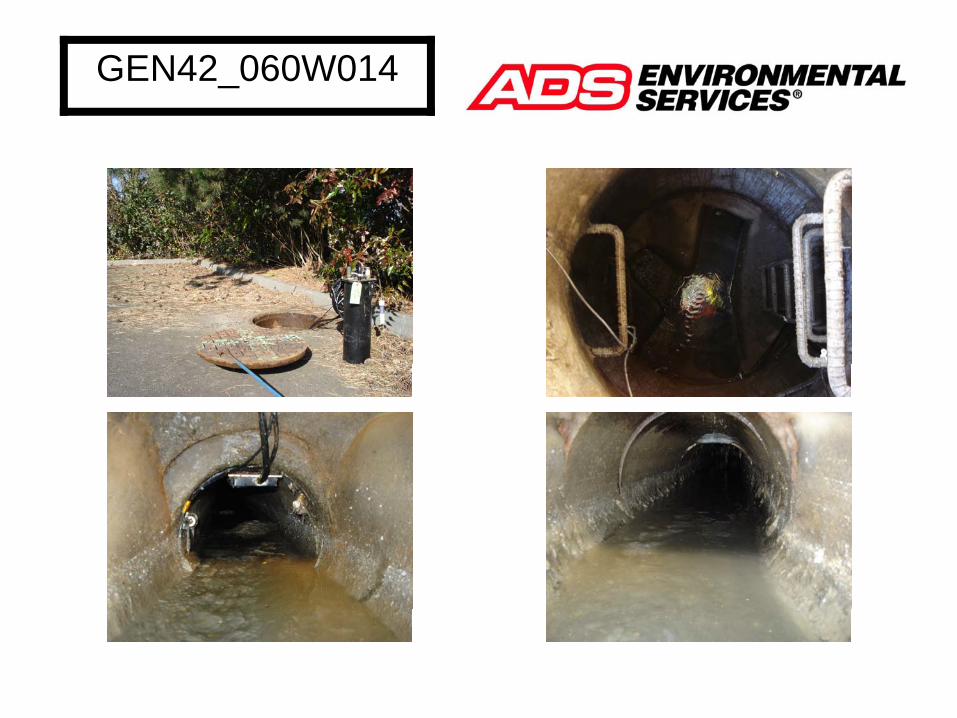
GEN42_060W014
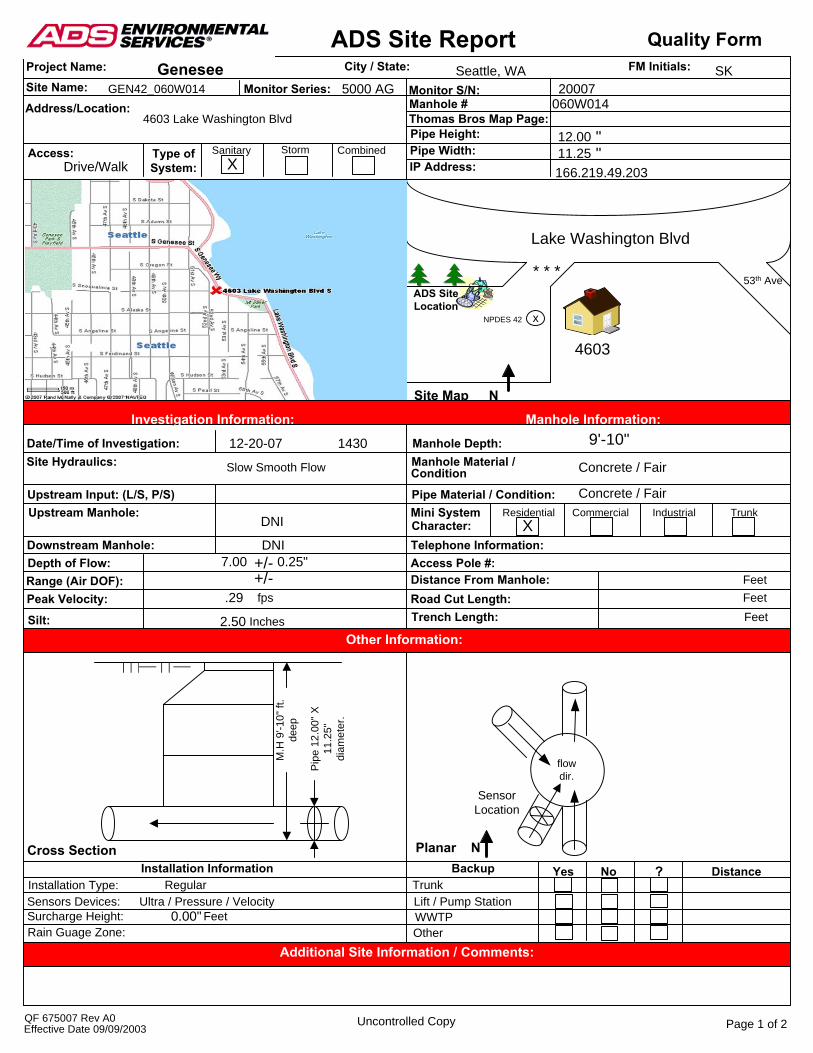
ADS Site ReportFM Initials:Project Name:
Site Name: Monitor Series:
City / State:
Access: Type ofSystem:
Sanitary
Site MapInvestigation Information:
Manhole Depth:Manhole Material /
Pipe Material / Condition:Mini System Commercial
Telephone Information:Access Pole #:Distance From Manhole:Road Cut Length:Trench Length: Feet
FeetFeet
Date/Time of Investigation:Site Hydraulics:
Upstream Input: (L/S, P/S)Upstream Manhole:
Downstream Manhole:Depth of Flow:Range (Air DOF):Peak Velocity:
Silt: Inches
fps
+/-+/-
Cross Section PlanarInstallation Information
Installation Type: Regular Sensors Devices: Ultra / Pressure / VelocitySurcharge Height:Rain Guage Zone:
Feet
Backup Yes No ? DistanceTrunkLift / Pump StationWWTPOther
QF 675007 Rev A0 Uncontrolled Copy
Monitor S/N:
Thomas Bros Map Page:Pipe Height:Pipe Width:IP Address:
Manhole #
""
Quality Form
Address/Location:
Genesee Seattle, WA SKGEN42_060W014
Drive/WalkStorm Combined
X
Manhole Information:Investigation Information:
DNI
Slow Smooth Flow
12-20-07 1430
DNI
Condition
Character:TrunkResidential Industrial
N
Concrete / Fair
Other Information:
Additional Site Information / Comments:
N
Effective Date 09/09/2003 Page 1 of 2
SensorLocation
Pip
e 12
.00"
X
11.2
5"
diam
eter
.
M.H
9'-1
0" ft
. de
ep
4603 Lake Washington Blvd
2.50
X
flowdir.
060W014
0.00"
12.0011.25
0.25"
9'-10"
Concrete / Fair
5000 AG
ADS SiteLocation
20007
166.219.49.203
7.00
.29
53th Ave
Lake Washington Blvd
* * *
xNPDES 42
4603
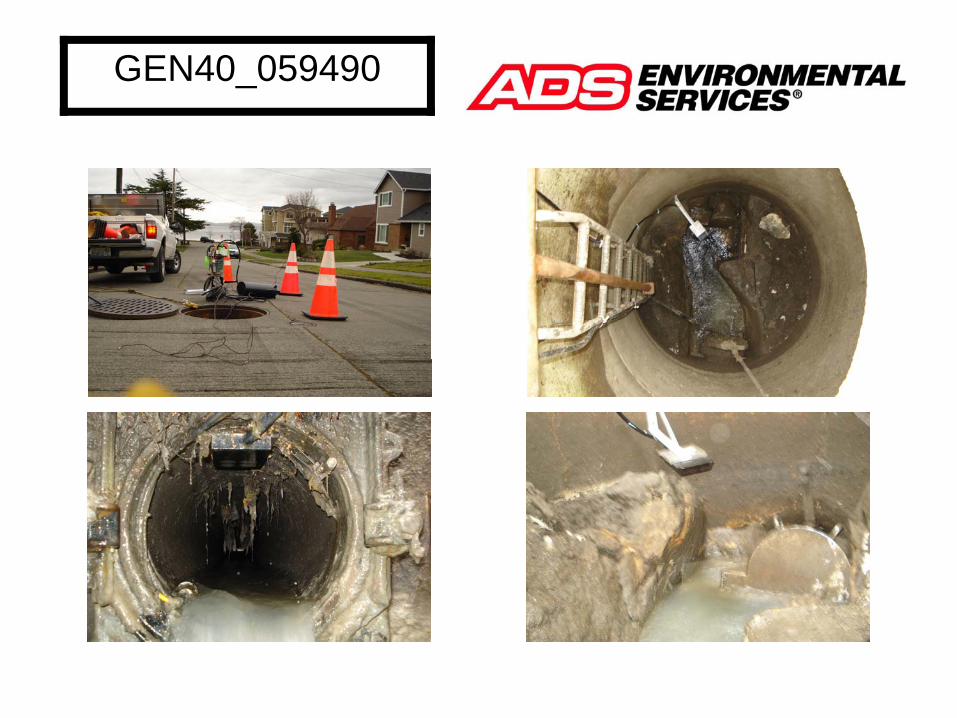
GEN40_059490
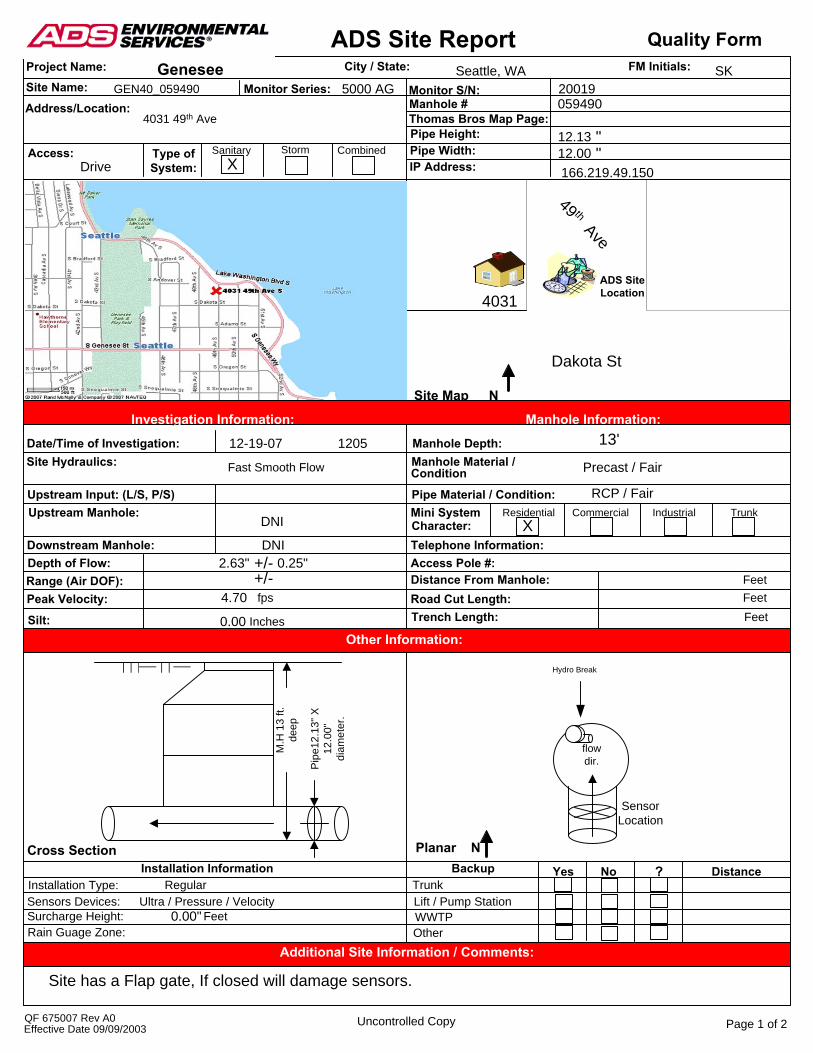
ADS Site ReportFM Initials:Project Name:
Site Name: Monitor Series:
City / State:
Access: Type ofSystem:
Sanitary
Site MapInvestigation Information:
Manhole Depth:Manhole Material /
Pipe Material / Condition:Mini System Commercial
Telephone Information:Access Pole #:Distance From Manhole:Road Cut Length:Trench Length: Feet
FeetFeet
Date/Time of Investigation:Site Hydraulics:
Upstream Input: (L/S, P/S)Upstream Manhole:
Downstream Manhole:Depth of Flow:Range (Air DOF):Peak Velocity:
Silt: Inches
fps
+/-+/-
Cross Section PlanarInstallation Information
Installation Type: Regular Sensors Devices: Ultra / Pressure / VelocitySurcharge Height:Rain Guage Zone:
Feet
Backup Yes No ? DistanceTrunkLift / Pump StationWWTPOther
QF 675007 Rev A0 Uncontrolled Copy
Monitor S/N:
Thomas Bros Map Page:Pipe Height:Pipe Width:IP Address:
Manhole #
""
Quality Form
Address/Location:
Genesee Seattle, WA SKGEN40_059490
DriveStorm Combined
X
Manhole Information:Investigation Information:
DNI
Fast Smooth Flow
12-19-07 1205
DNI
Condition
Character:TrunkResidential Industrial
N
Precast / Fair
Other Information:
Additional Site Information / Comments:
N
Effective Date 09/09/2003 Page 1 of 2
SensorLocation
Pip
e12.
13" X
12
.00"
di
amet
er.
M.H
13
ft.
deep
4031 49th Ave
0.00
X
flowdir.
059490
0.00"
12.1312.00
0.25"
13'
RCP / Fair
5000 AG
ADS SiteLocation
20019
166.219.49.150
2.63"
49 th Ave
4.70
Hydro Break
Dakota St
Site has a Flap gate, If closed will damage sensors.
4031
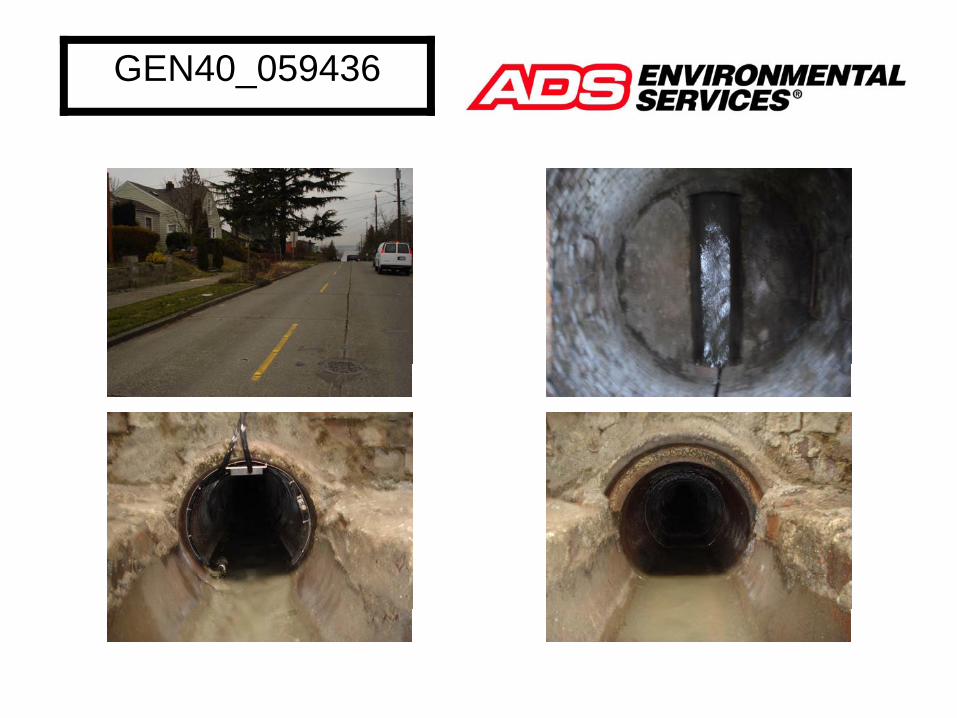
GEN40_059436
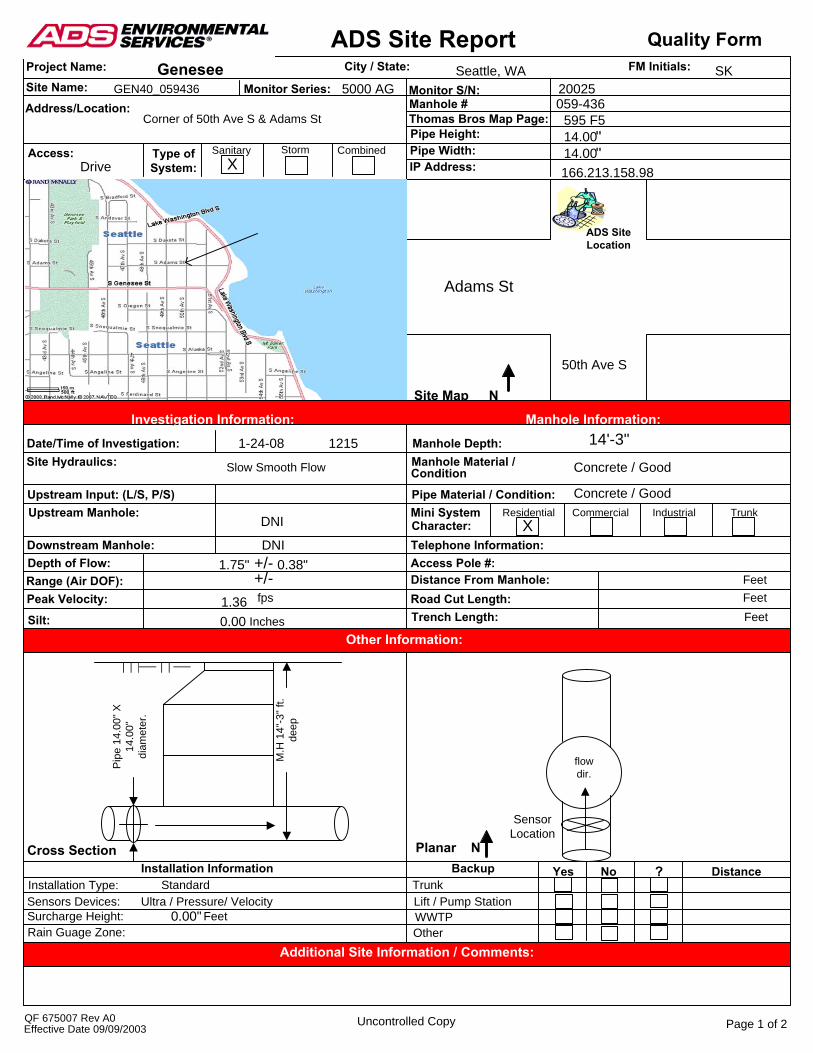
ADS Site ReportFM Initials:Project Name:
Site Name: Monitor Series:
City / State:
Access: Type ofSystem:
Sanitary
Site MapInvestigation Information:
Manhole Depth:Manhole Material /
Pipe Material / Condition:Mini System Commercial
Telephone Information:Access Pole #:Distance From Manhole:Road Cut Length:Trench Length: Feet
FeetFeet
Date/Time of Investigation:Site Hydraulics:
Upstream Input: (L/S, P/S)Upstream Manhole:
Downstream Manhole:Depth of Flow:Range (Air DOF):Peak Velocity:
Silt: Inches
fps
+/-+/-
Cross Section PlanarInstallation Information
Installation Type: StandardSensors Devices: Ultra / Pressure/ Velocity Surcharge Height:Rain Guage Zone:
Feet
Backup Yes No ? DistanceTrunkLift / Pump StationWWTPOther
QF 675007 Rev A0 Uncontrolled Copy
Monitor S/N:
Thomas Bros Map Page:Pipe Height:Pipe Width:IP Address:
Manhole #
""
Quality Form
Address/Location:
Genesee Seattle, WA SKGEN40_059436
DriveStorm Combined
X
Manhole Information:Investigation Information:
DNI
Slow Smooth Flow
1-24-08 1215
DNI
Condition
Character:TrunkResidential Industrial
N
Concrete / Good
Other Information:
Additional Site Information / Comments:
N
Effective Date 09/09/2003 Page 1 of 2
SensorLocation
Pip
e 14
.00"
X
14.0
0"
diam
eter
.
M.H
14"
-3" f
t. de
ep
Corner of 50th Ave S & Adams St
0.00
X
flowdir.
059-436
0.00"
14.00
0.38"
14'-3"
Concrete / Good
5000 AG
ADS SiteLocation
20025
166.213.158.98
1.75"
Adams St
50th Ave S
14.00
1.36
595 F5
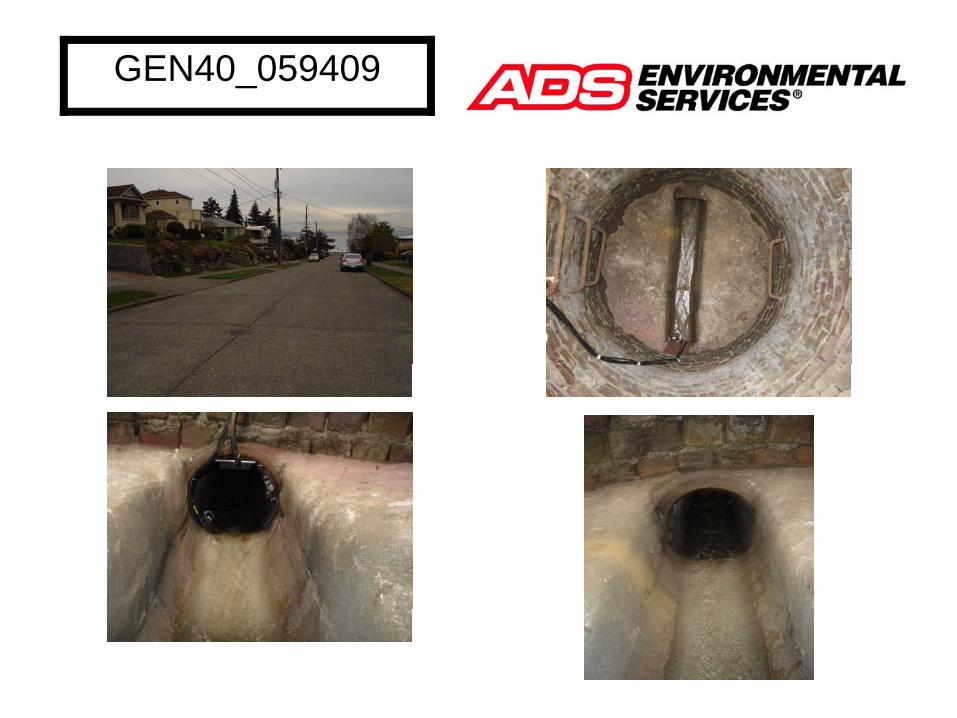
GEN40_059409
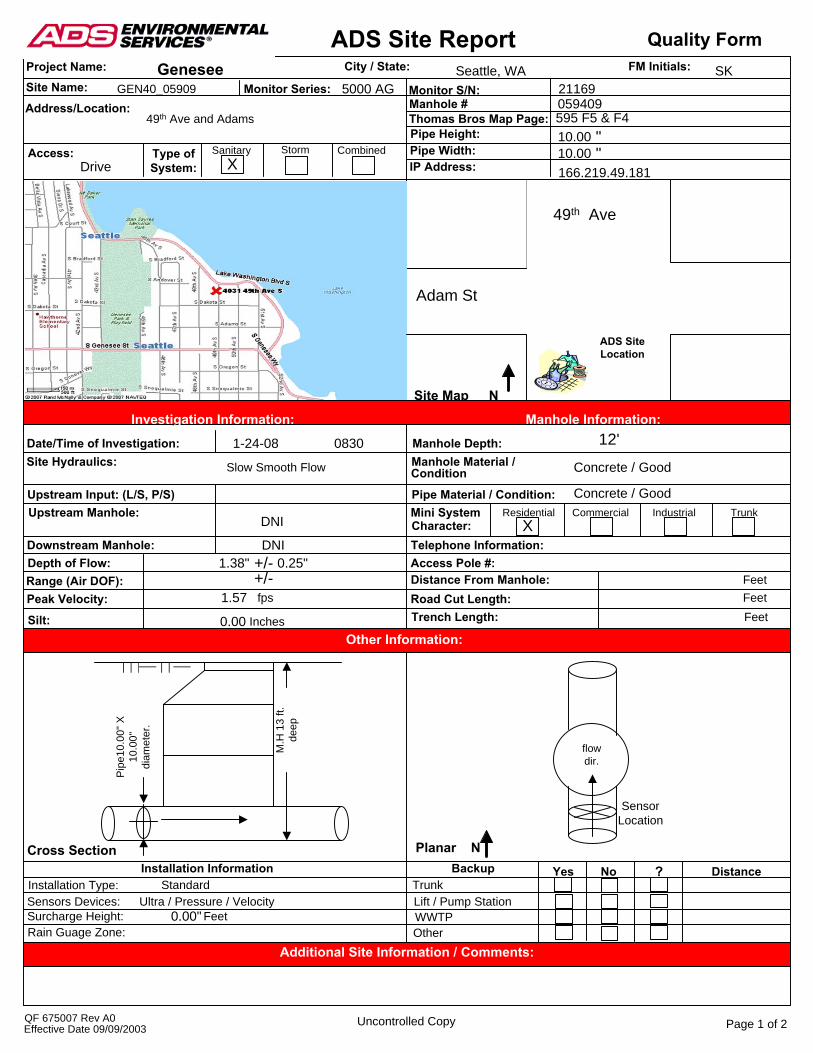
ADS Site ReportFM Initials:Project Name:
Site Name: Monitor Series:
City / State:
Access: Type ofSystem:
Sanitary
Site MapInvestigation Information:
Manhole Depth:Manhole Material /
Pipe Material / Condition:Mini System Commercial
Telephone Information:Access Pole #:Distance From Manhole:Road Cut Length:Trench Length: Feet
FeetFeet
Date/Time of Investigation:Site Hydraulics:
Upstream Input: (L/S, P/S)Upstream Manhole:
Downstream Manhole:Depth of Flow:Range (Air DOF):Peak Velocity:
Silt: Inches
fps
+/-+/-
Cross Section PlanarInstallation Information
Installation Type: StandardSensors Devices: Ultra / Pressure / VelocitySurcharge Height:Rain Guage Zone:
Feet
Backup Yes No ? DistanceTrunkLift / Pump StationWWTPOther
QF 675007 Rev A0 Uncontrolled Copy
Monitor S/N:
Thomas Bros Map Page:Pipe Height:Pipe Width:IP Address:
Manhole #
""
Quality Form
Address/Location:
Genesee Seattle, WA SKGEN40_05909
DriveStorm Combined
X
Manhole Information:Investigation Information:
DNI
Slow Smooth Flow
1-24-08 0830
DNI
Condition
Character:TrunkResidential Industrial
N
Concrete / Good
Other Information:
Additional Site Information / Comments:
N
Effective Date 09/09/2003 Page 1 of 2
SensorLocation
Pipe
10.0
0" X
10
.00"
di
amet
er.
M.H
13
ft.
deep
49th Ave and Adams
0.00
X
flowdir.
059409
0.00"
10.0010.00
0.25"
12'
Concrete / Good
5000 AG
ADS SiteLocation
21169
166.219.49.181
1.38"
49th Ave
1.57
595 F5 & F4
Adam St
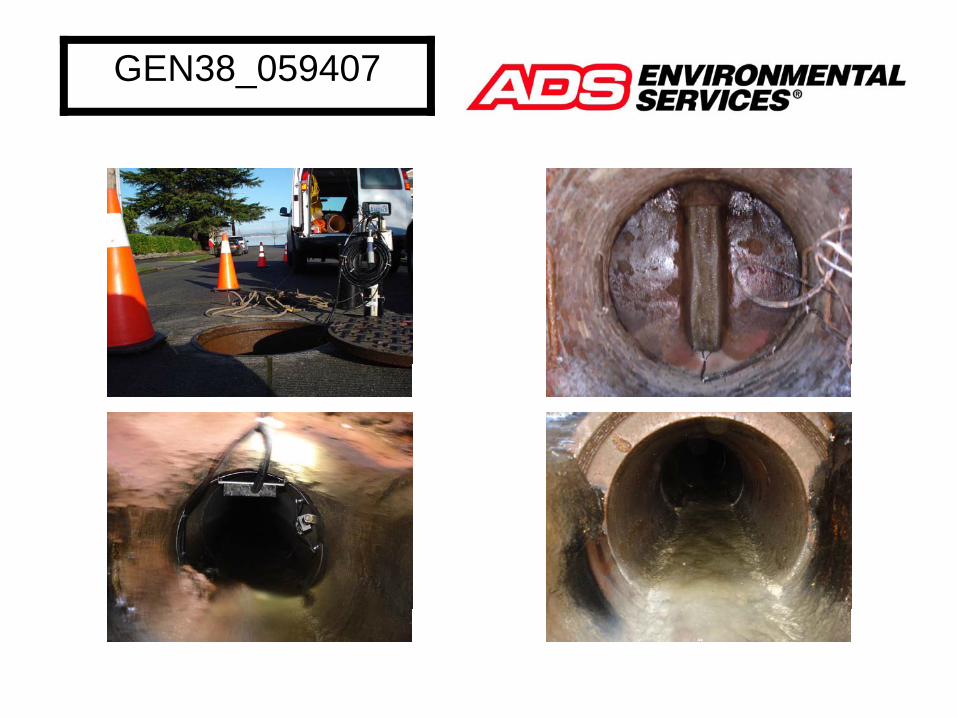
GEN38_059407
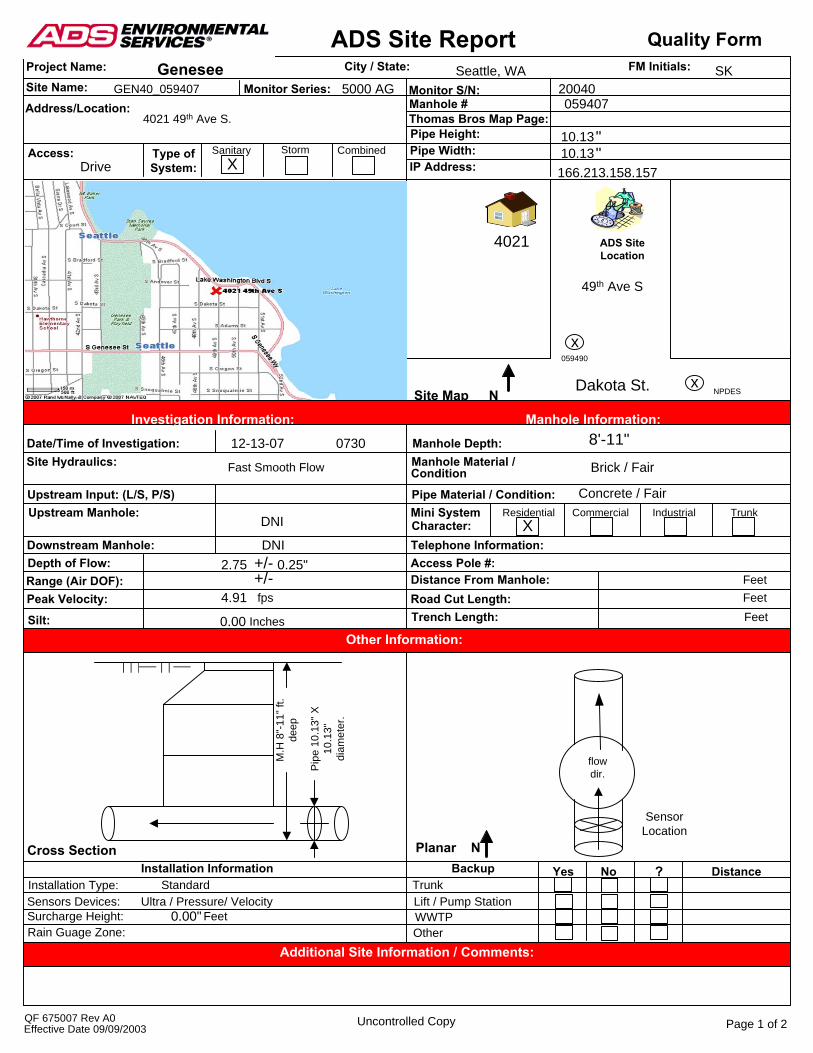
ADS Site ReportFM Initials:Project Name:
Site Name: Monitor Series:
City / State:
Access: Type ofSystem:
Sanitary
Site MapInvestigation Information:
Manhole Depth:Manhole Material /
Pipe Material / Condition:Mini System Commercial
Telephone Information:Access Pole #:Distance From Manhole:Road Cut Length:Trench Length: Feet
FeetFeet
Date/Time of Investigation:Site Hydraulics:
Upstream Input: (L/S, P/S)Upstream Manhole:
Downstream Manhole:Depth of Flow:Range (Air DOF):Peak Velocity:
Silt: Inches
fps
+/-+/-
Cross Section PlanarInstallation Information
Installation Type: StandardSensors Devices: Ultra / Pressure/ Velocity Surcharge Height:Rain Guage Zone:
Feet
Backup Yes No ? DistanceTrunkLift / Pump StationWWTPOther
QF 675007 Rev A0 Uncontrolled Copy
Monitor S/N:
Thomas Bros Map Page:Pipe Height:Pipe Width:IP Address:
Manhole #
""
Quality Form
Address/Location:
Genesee Seattle, WA SKGEN40_059407
DriveStorm Combined
X
Manhole Information:Investigation Information:
DNI
Fast Smooth Flow
12-13-07 0730
DNI
Condition
Character:TrunkResidential Industrial
N
Brick / Fair
Other Information:
Additional Site Information / Comments:
N
Effective Date 09/09/2003 Page 1 of 2
SensorLocation
Pip
e 10
.13"
X
10.1
3"
diam
eter
.
M.H
8"-
11" f
t. de
ep
4021 49th Ave S.
0.00
X
flowdir.
059407
0.00"
10.13
0.25"
8'-11"
Concrete / Fair
5000 AG
ADS SiteLocation
20040
166.213.158.157
2.75
Dakota St.
49th Ave S
10.13
xNPDES
4021
4.91
x059490
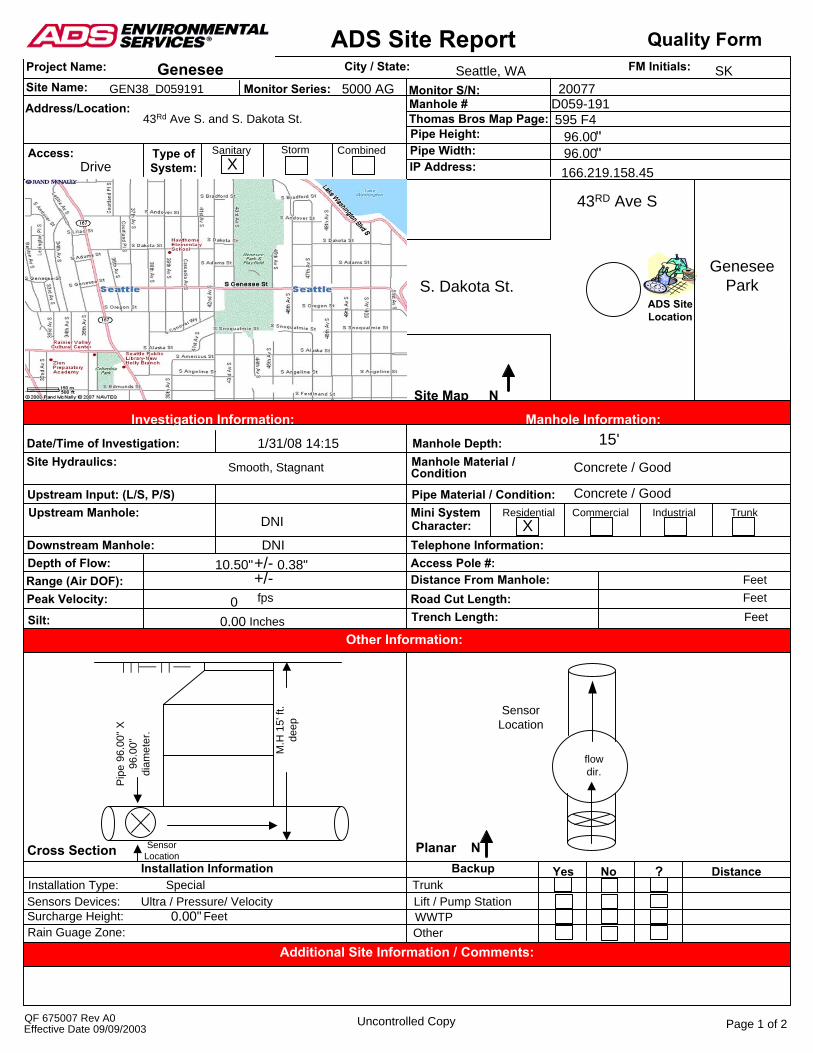
ADS Site ReportFM Initials:Project Name:
Site Name: Monitor Series:
City / State:
Access: Type ofSystem:
Sanitary
Site MapInvestigation Information:
Manhole Depth:Manhole Material /
Pipe Material / Condition:Mini System Commercial
Telephone Information:Access Pole #:Distance From Manhole:Road Cut Length:Trench Length: Feet
FeetFeet
Date/Time of Investigation:Site Hydraulics:
Upstream Input: (L/S, P/S)Upstream Manhole:
Downstream Manhole:Depth of Flow:Range (Air DOF):Peak Velocity:
Silt: Inches
fps
+/-+/-
Cross Section PlanarInstallation Information
Installation Type: SpecialSensors Devices: Ultra / Pressure/ Velocity Surcharge Height:Rain Guage Zone:
Feet
Backup Yes No ? DistanceTrunkLift / Pump StationWWTPOther
QF 675007 Rev A0 Uncontrolled Copy
Monitor S/N:
Thomas Bros Map Page:Pipe Height:Pipe Width:IP Address:
Manhole #
""
Quality Form
Address/Location:
Genesee Seattle, WA SKGEN38_D059191
DriveStorm Combined
X
Manhole Information:Investigation Information:
DNI
Smooth, Stagnant
1/31/08 14:15
DNI
Condition
Character:TrunkResidential Industrial
N
Concrete / Good
Other Information:
Additional Site Information / Comments:
N
Effective Date 09/09/2003 Page 1 of 2
SensorLocation
Pip
e 96
.00"
X
96.0
0"
diam
eter
.
M.H
15'
ft.
deep
43Rd Ave S. and S. Dakota St.
0.00
X
flowdir.
D059-191
0.00"
96.00
0.38"
15'
Concrete / Good
5000 AG
ADS SiteLocation
20077
166.219.158.45
10.50"
96.00
0
595 F4
43RD Ave S
S. Dakota St.Genesee
Park
SensorLocation

WA 1.0 - GENESEE BASIN FLOW MONITORING STUDY PAGE 57 OF 62 QUALITY ASSURANCE PROJECT PLAN
Revision: R1D0 Effective date: 8/19/2008 This is an UNCONTROLLED DOCUMENT.
Appendix D: Meter Specifications
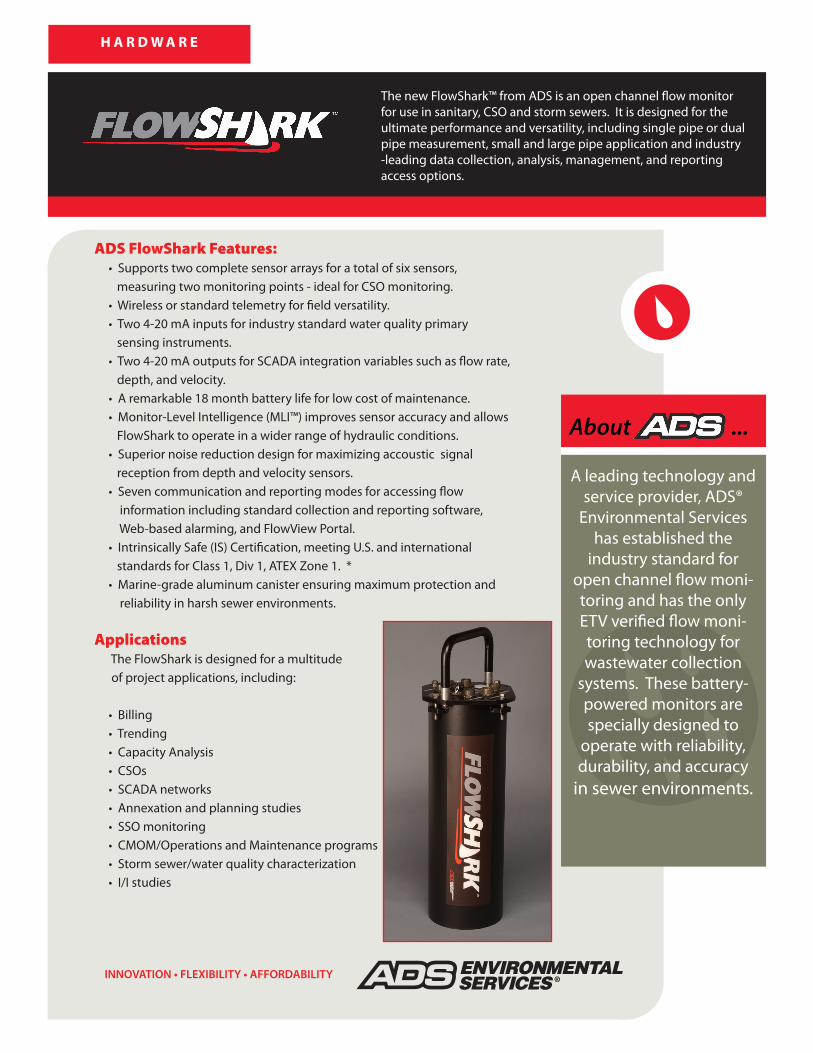
ADS FlowShark Features: • Supports two complete sensor arrays for a total of six sensors, measuring two monitoring points - ideal for CSO monitoring. • Wireless or standard telemetry for field versatility. • Two 4-20 mA inputs for industry standard water quality primary sensing instruments. • Two 4-20 mA outputs for SCADA integration variables such as flow rate, depth, and velocity. • A remarkable 18 month battery life for low cost of maintenance. • Monitor-Level Intelligence (MLI™) improves sensor accuracy and allows FlowShark to operate in a wider range of hydraulic conditions. • Superior noise reduction design for maximizing accoustic signal reception from depth and velocity sensors. • Seven communication and reporting modes for accessing flow information including standard collection and reporting software, Web-based alarming, and FlowView Portal. • Intrinsically Safe (IS) Certification, meeting U.S. and international standards for Class 1, Div 1, ATEX Zone 1. * • Marine-grade aluminum canister ensuring maximum protection and reliability in harsh sewer environments. Applications The FlowShark is designed for a multitude of project applications, including:
• Billing • Trending • Capacity Analysis • CSOs • SCADA networks • Annexation and planning studies • SSO monitoring • CMOM/Operations and Maintenance programs • Storm sewer/water quality characterization • I/I studies
H A R D W A R E
About ...
A leading technology and service provider, ADS®
Environmental Services has established the
industry standard for open channel flow moni-toring and has the only ETV verified flow moni-toring technology for wastewater collection
systems. These battery-powered monitors are specially designed to
operate with reliability, durability, and accuracy
in sewer environments.
The new FlowShark™ from ADS is an open channel flow monitor for use in sanitary, CSO and storm sewers. It is designed for the ultimate performance and versatility, including single pipe or dual pipe measurement, small and large pipe application and industry -leading data collection, analysis, management, and reporting access options.
INNOVATION • FLEXIBILITY • AFFORDABILITY
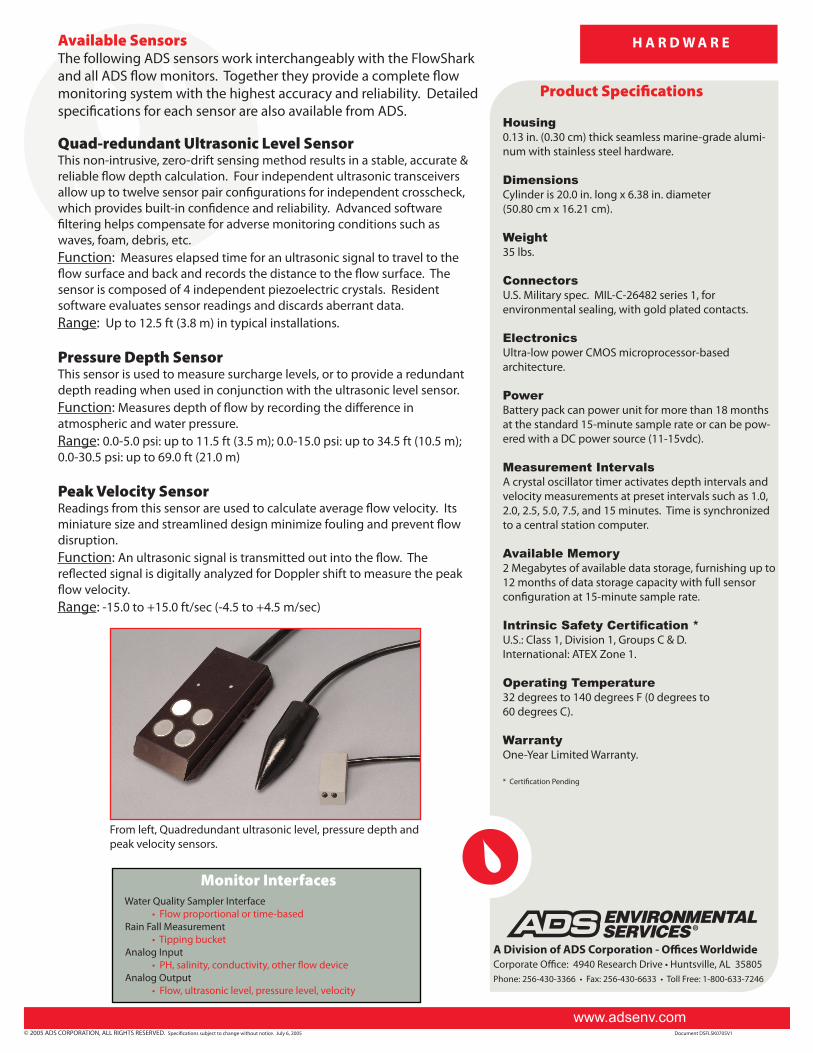
Monitor Interfaces Water Quality Sampler Interface • Flow proportional or time-based Rain Fall Measurement • Tipping bucket Analog Input • PH, salinity, conductivity, other flow device Analog Output • Flow, ultrasonic level, pressure level, velocity
© 2005 ADS CORPORATION, ALL RIGHTS RESERVED. Specifications subject to change without notice. July 6, 2005 Document DSFLSK0705V1
A Division of ADS Corporation - Offices Worldwide Corporate Office: 4940 Research Drive • Huntsville, AL 35805 Phone: 256-430-3366 • Fax: 256-430-6633 • Toll Free: 1-800-633-7246
www.adsenv.com
H A R D W A R EAvailable SensorsThe following ADS sensors work interchangeably with the FlowShark and all ADS flow monitors. Together they provide a complete flow monitoring system with the highest accuracy and reliability. Detailed specifications for each sensor are also available from ADS.
Product Specifications
Housing0.13 in. (0.30 cm) thick seamless marine-grade alumi-num with stainless steel hardware.
DimensionsCylinder is 20.0 in. long x 6.38 in. diameter (50.80 cm x 16.21 cm).
Weight35 lbs.
ConnectorsU.S. Military spec. MIL-C-26482 series 1, for environmental sealing, with gold plated contacts.
ElectronicsUltra-low power CMOS microprocessor-based architecture.
PowerBattery pack can power unit for more than 18 months at the standard 15-minute sample rate or can be pow-ered with a DC power source (11-15vdc).
Measurement IntervalsA crystal oscillator timer activates depth intervals and velocity measurements at preset intervals such as 1.0, 2.0, 2.5, 5.0, 7.5, and 15 minutes. Time is synchronized to a central station computer.
Available Memory2 Megabytes of available data storage, furnishing up to 12 months of data storage capacity with full sensor configuration at 15-minute sample rate.
Intrinsic Safety Certification *U.S.: Class 1, Division 1, Groups C & D.International: ATEX Zone 1.
Operating Temperature32 degrees to 140 degrees F (0 degrees to 60 degrees C).
WarrantyOne-Year Limited Warranty.
* Certification Pending
Quad-redundant Ultrasonic Level SensorThis non-intrusive, zero-drift sensing method results in a stable, accurate & reliable flow depth calculation. Four independent ultrasonic transceivers allow up to twelve sensor pair configurations for independent crosscheck, which provides built-in confidence and reliability. Advanced software filtering helps compensate for adverse monitoring conditions such as waves, foam, debris, etc.Function: Measures elapsed time for an ultrasonic signal to travel to the flow surface and back and records the distance to the flow surface. The sensor is composed of 4 independent piezoelectric crystals. Resident software evaluates sensor readings and discards aberrant data.Range: Up to 12.5 ft (3.8 m) in typical installations.
Pressure Depth SensorThis sensor is used to measure surcharge levels, or to provide a redundant depth reading when used in conjunction with the ultrasonic level sensor.Function: Measures depth of flow by recording the difference in atmospheric and water pressure.Range: 0.0-5.0 psi: up to 11.5 ft (3.5 m); 0.0-15.0 psi: up to 34.5 ft (10.5 m); 0.0-30.5 psi: up to 69.0 ft (21.0 m) Peak Velocity SensorReadings from this sensor are used to calculate average flow velocity. Its miniature size and streamlined design minimize fouling and prevent flow disruption. Function: An ultrasonic signal is transmitted out into the flow. The reflected signal is digitally analyzed for Doppler shift to measure the peak flow velocity.Range: -15.0 to +15.0 ft/sec (-4.5 to +4.5 m/sec)
From left, Quadredundant ultrasonic level, pressure depth and peak velocity sensors.
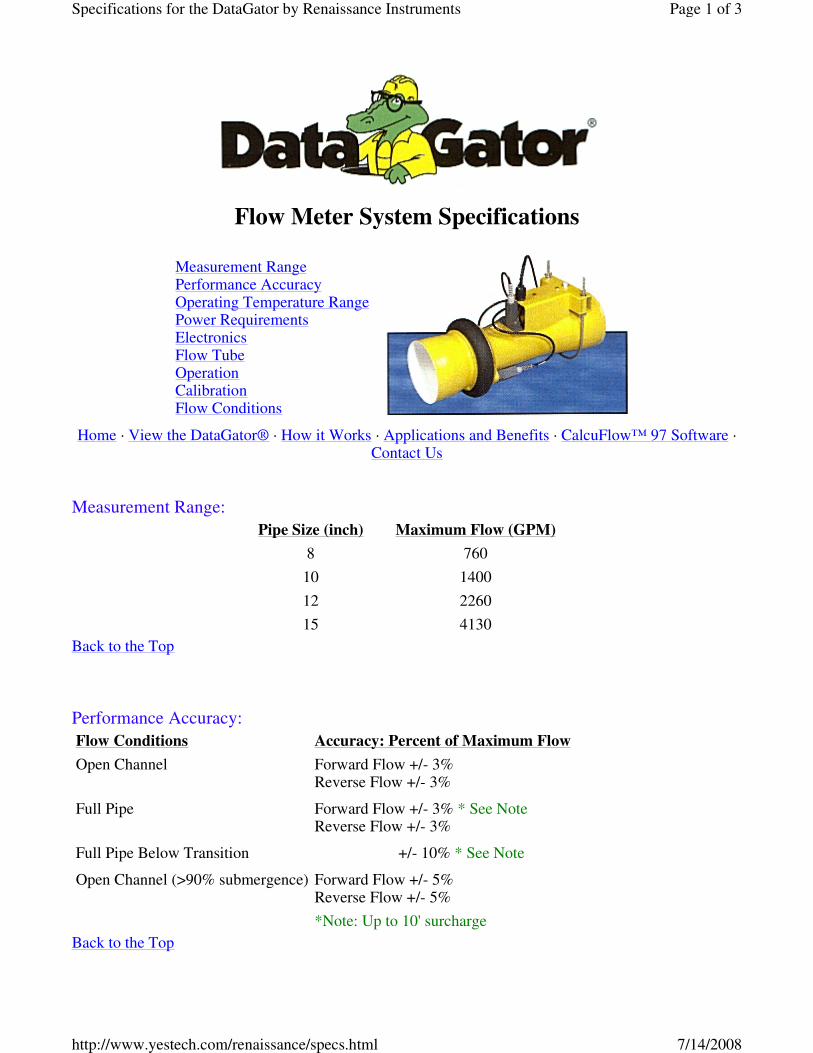
Flow Meter System Specifications
Home · View the DataGator® · How it Works · Applications and Benefits · CalcuFlow™ 97 Software · Contact Us
Measurement Range:
Back to the Top
Performance Accuracy:
Back to the Top
Measurement Range Performance Accuracy Operating Temperature Range Power Requirements Electronics Flow Tube Operation Calibration Flow Conditions
Pipe Size (inch) Maximum Flow (GPM)
8 760
10 1400
12 2260
15 4130
Flow Conditions Accuracy: Percent of Maximum Flow
Open Channel Forward Flow +/- 3% Reverse Flow +/- 3%
Full Pipe Forward Flow +/- 3% * See Note Reverse Flow +/- 3%
Full Pipe Below Transition +/- 10% * See Note
Open Channel (>90% submergence) Forward Flow +/- 5% Reverse Flow +/- 5%
*Note: Up to 10' surcharge
Page 1 of 3Specifications for the DataGator by Renaissance Instruments
7/14/2008http://www.yestech.com/renaissance/specs.html

Operating Temperature Range:
Back to the Top
Power Requirements:
Back to the Top
Electronics:
Back to the Top
Flow Tube: (weights and dimensions shown below)
Sizes: 8, 10, 12, and 15 inches (consult factory for additional flow tube sizes) Material: fiberglass reinforced isophthalic polyester resin. Inside surface of white gelcoat. Hardware: stainless steel, bubble level with aluminum e, sampler event, and rainfall
Sensors 32° to 120°F (0° to 50°C)
Electronics - 5° to 120°F (- 17° to 50°C)
Standard: Battery powered 8 each D-Cell alkaline; 1 each 9 volt alkaline (memory backup) (Minimum battery life of 90 days at 15 minute data logging intervals)
Optional: 115/ 230VAC ± 15%, 50/ 60Hz, 12VA, w/ 8 each D-Cell NiCd (primary backup) and 1 each 9 volt alkaline (memory backup)
Enclosure Material: Lightweight structural foam resin
Rating: NEMA 6P submersible (6.0ft for 24 hours)
Dimensions: 12-5/8" x 13-3/4" x 5-7/8" deep
Weight: 15 lbs. (6.8 kg) including standard batteries, sensors, and 25 ft. cable
Desiccant protected
Sensors Type: Stainless steel submersible pressure transducers
Cable: 25 ft. (7.6m) polyurethane outer jacket
Housing: Sealed, watertight PVC (submersible)
Over Range: 11 psi (25 ft. Water)
Air Intake: Atmospheric pressure reference protected by hydrophobic filter
Communications
Data Retrieval: IBM compatible computer
Transfer Protocol: RS-232 at 9600 baud
Optional: Modem at 1200 baud (9600 baud available)
Page 2 of 3Specifications for the DataGator by Renaissance Instruments
7/14/2008http://www.yestech.com/renaissance/specs.html

Back to the Top
Calibration: NO FIELD CALIBRATION OR FLOW PROFILING REQUIRED Flow tube pre-calibrated at a NIST traceable flow laboaratory. Back to the Top
Flow Conditions: Open channel, Full Pipe, Surcharged, Submerged, and Reverse Back to the Top
Home · View the DataGator® · How it Works · Applications and Benefits · CalcuFlow™ 97 Software ·
Contact Us
© 1998 Renaissance Instruments
Software: CalcuFlow™ 97 (for Windows® 95)
Page 3 of 3Specifications for the DataGator by Renaissance Instruments
7/14/2008http://www.yestech.com/renaissance/specs.html

WA 1.0 - GENESEE BASIN FLOW MONITORING STUDY PAGE 58 OF 62 QUALITY ASSURANCE PROJECT PLAN
Revision: R1D0 Effective date: 8/19/2008 This is an UNCONTROLLED DOCUMENT.
Appendix E: Data Review Templates
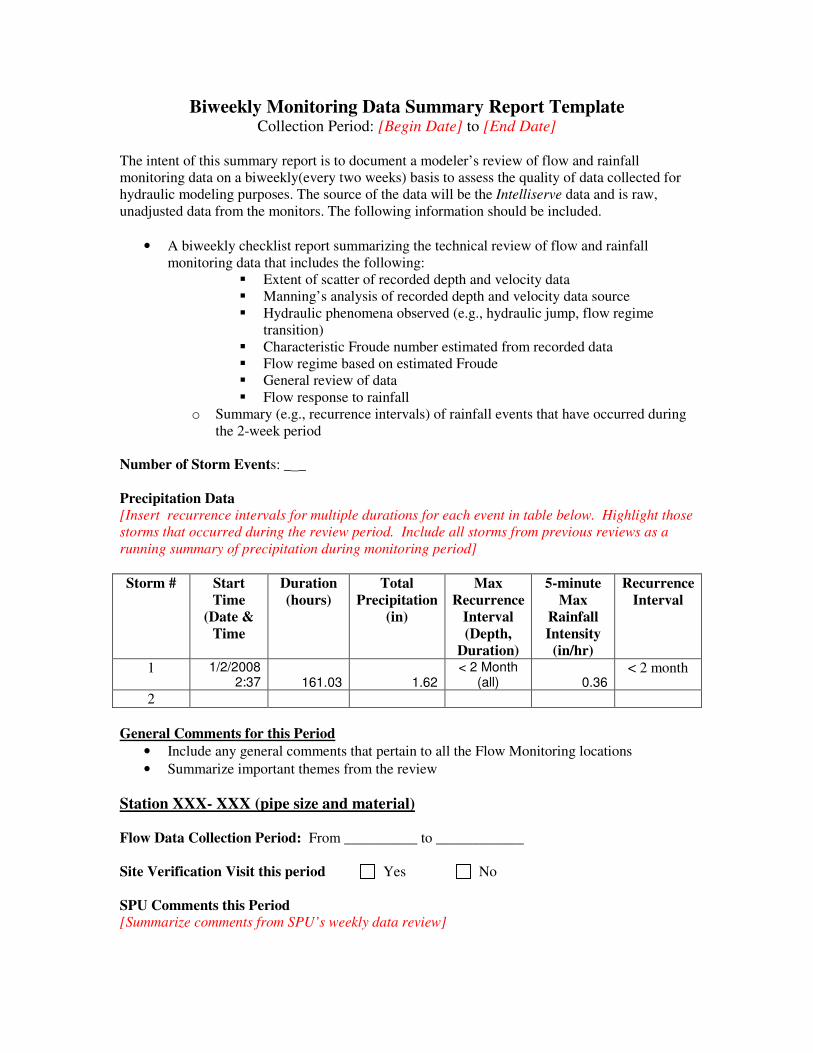
Biweekly Monitoring Data Summary Report Template Collection Period: [Begin Date] to [End Date]
The intent of this summary report is to document a modeler’s review of flow and rainfall
monitoring data on a biweekly(every two weeks) basis to assess the quality of data collected for
hydraulic modeling purposes. The source of the data will be the Intelliserve data and is raw,
unadjusted data from the monitors. The following information should be included.
• A biweekly checklist report summarizing the technical review of flow and rainfall
monitoring data that includes the following:
� Extent of scatter of recorded depth and velocity data
� Manning’s analysis of recorded depth and velocity data source
� Hydraulic phenomena observed (e.g., hydraulic jump, flow regime
transition)
� Characteristic Froude number estimated from recorded data
� Flow regime based on estimated Froude
� General review of data
� Flow response to rainfall
o Summary (e.g., recurrence intervals) of rainfall events that have occurred during
the 2-week period
Number of Storm Events: _ _
Precipitation Data
[Insert recurrence intervals for multiple durations for each event in table below. Highlight those
storms that occurred during the review period. Include all storms from previous reviews as a
running summary of precipitation during monitoring period]
Storm # Start
Time
(Date &
Time
Duration
(hours)
Total
Precipitation
(in)
Max
Recurrence
Interval
(Depth,
Duration)
5-minute
Max
Rainfall
Intensity
(in/hr)
Recurrence
Interval
1 1/2/2008 2:37 161.03 1.62
< 2 Month (all) 0.36
< 2 month
2
General Comments for this Period
• Include any general comments that pertain to all the Flow Monitoring locations
• Summarize important themes from the review
Station XXX- XXX (pipe size and material)
Flow Data Collection Period: From __________ to ____________
Site Verification Visit this period Yes No
SPU Comments this Period
[Summarize comments from SPU’s weekly data review]
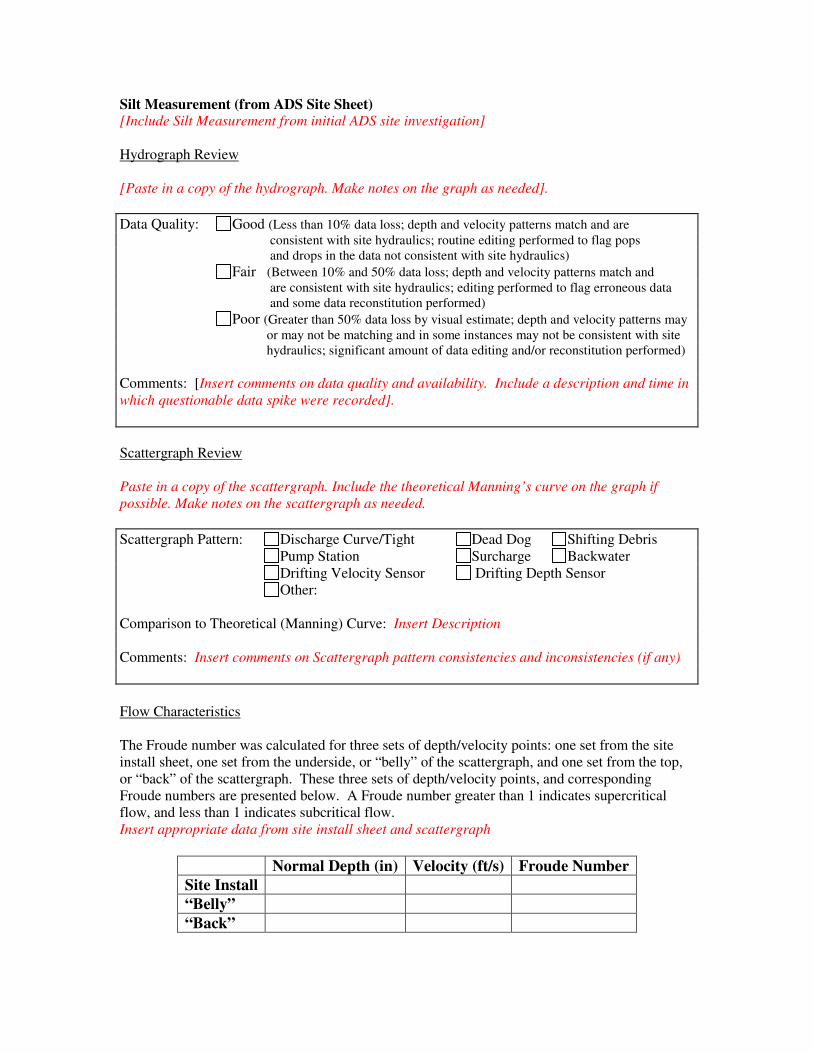
Silt Measurement (from ADS Site Sheet) [Include Silt Measurement from initial ADS site investigation]
Hydrograph Review
[Paste in a copy of the hydrograph. Make notes on the graph as needed].
Scattergraph Review
Paste in a copy of the scattergraph. Include the theoretical Manning’s curve on the graph if
possible. Make notes on the scattergraph as needed.
Flow Characteristics
The Froude number was calculated for three sets of depth/velocity points: one set from the site
install sheet, one set from the underside, or “belly” of the scattergraph, and one set from the top,
or “back” of the scattergraph. These three sets of depth/velocity points, and corresponding
Froude numbers are presented below. A Froude number greater than 1 indicates supercritical
flow, and less than 1 indicates subcritical flow.
Insert appropriate data from site install sheet and scattergraph
Normal Depth (in) Velocity (ft/s) Froude Number
Site Install
“Belly”
“Back”
Data Quality: Good (Less than 10% data loss; depth and velocity patterns match and are
consistent with site hydraulics; routine editing performed to flag pops
and drops in the data not consistent with site hydraulics) Fair (Between 10% and 50% data loss; depth and velocity patterns match and
are consistent with site hydraulics; editing performed to flag erroneous data
and some data reconstitution performed)
Poor (Greater than 50% data loss by visual estimate; depth and velocity patterns may
or may not be matching and in some instances may not be consistent with site
hydraulics; significant amount of data editing and/or reconstitution performed)
Comments: [Insert comments on data quality and availability. Include a description and time in
which questionable data spike were recorded].
Scattergraph Pattern: Discharge Curve/Tight Dead Dog Shifting Debris
Pump Station Surcharge Backwater
Drifting Velocity Sensor Drifting Depth Sensor
Other:
Comparison to Theoretical (Manning) Curve: Insert Description
Comments: Insert comments on Scattergraph pattern consistencies and inconsistencies (if any)
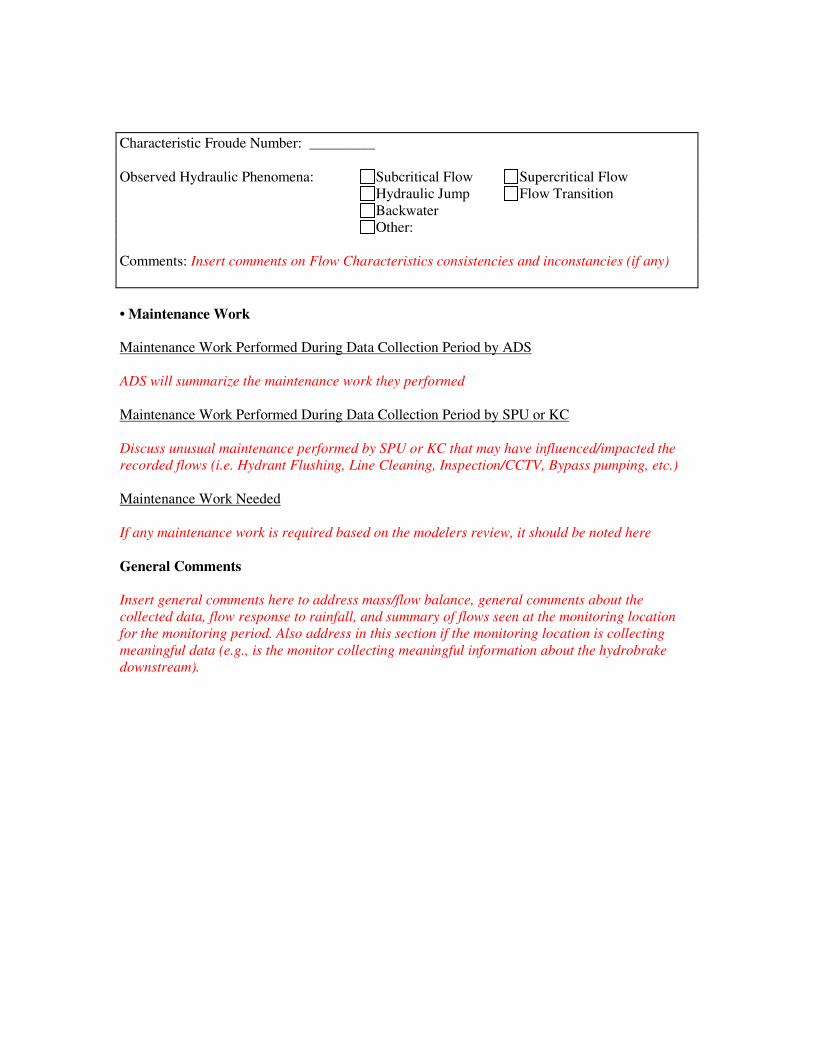
• Maintenance Work
Maintenance Work Performed During Data Collection Period by ADS
ADS will summarize the maintenance work they performed
Maintenance Work Performed During Data Collection Period by SPU or KC
Discuss unusual maintenance performed by SPU or KC that may have influenced/impacted the
recorded flows (i.e. Hydrant Flushing, Line Cleaning, Inspection/CCTV, Bypass pumping, etc.)
Maintenance Work Needed
If any maintenance work is required based on the modelers review, it should be noted here
General Comments
Insert general comments here to address mass/flow balance, general comments about the
collected data, flow response to rainfall, and summary of flows seen at the monitoring location
for the monitoring period. Also address in this section if the monitoring location is collecting
meaningful data (e.g., is the monitor collecting meaningful information about the hydrobrake
downstream).
Characteristic Froude Number: _________
Observed Hydraulic Phenomena: Subcritical Flow Supercritical Flow
Hydraulic Jump Flow Transition
Backwater
Other:
Comments: Insert comments on Flow Characteristics consistencies and inconstancies (if any)
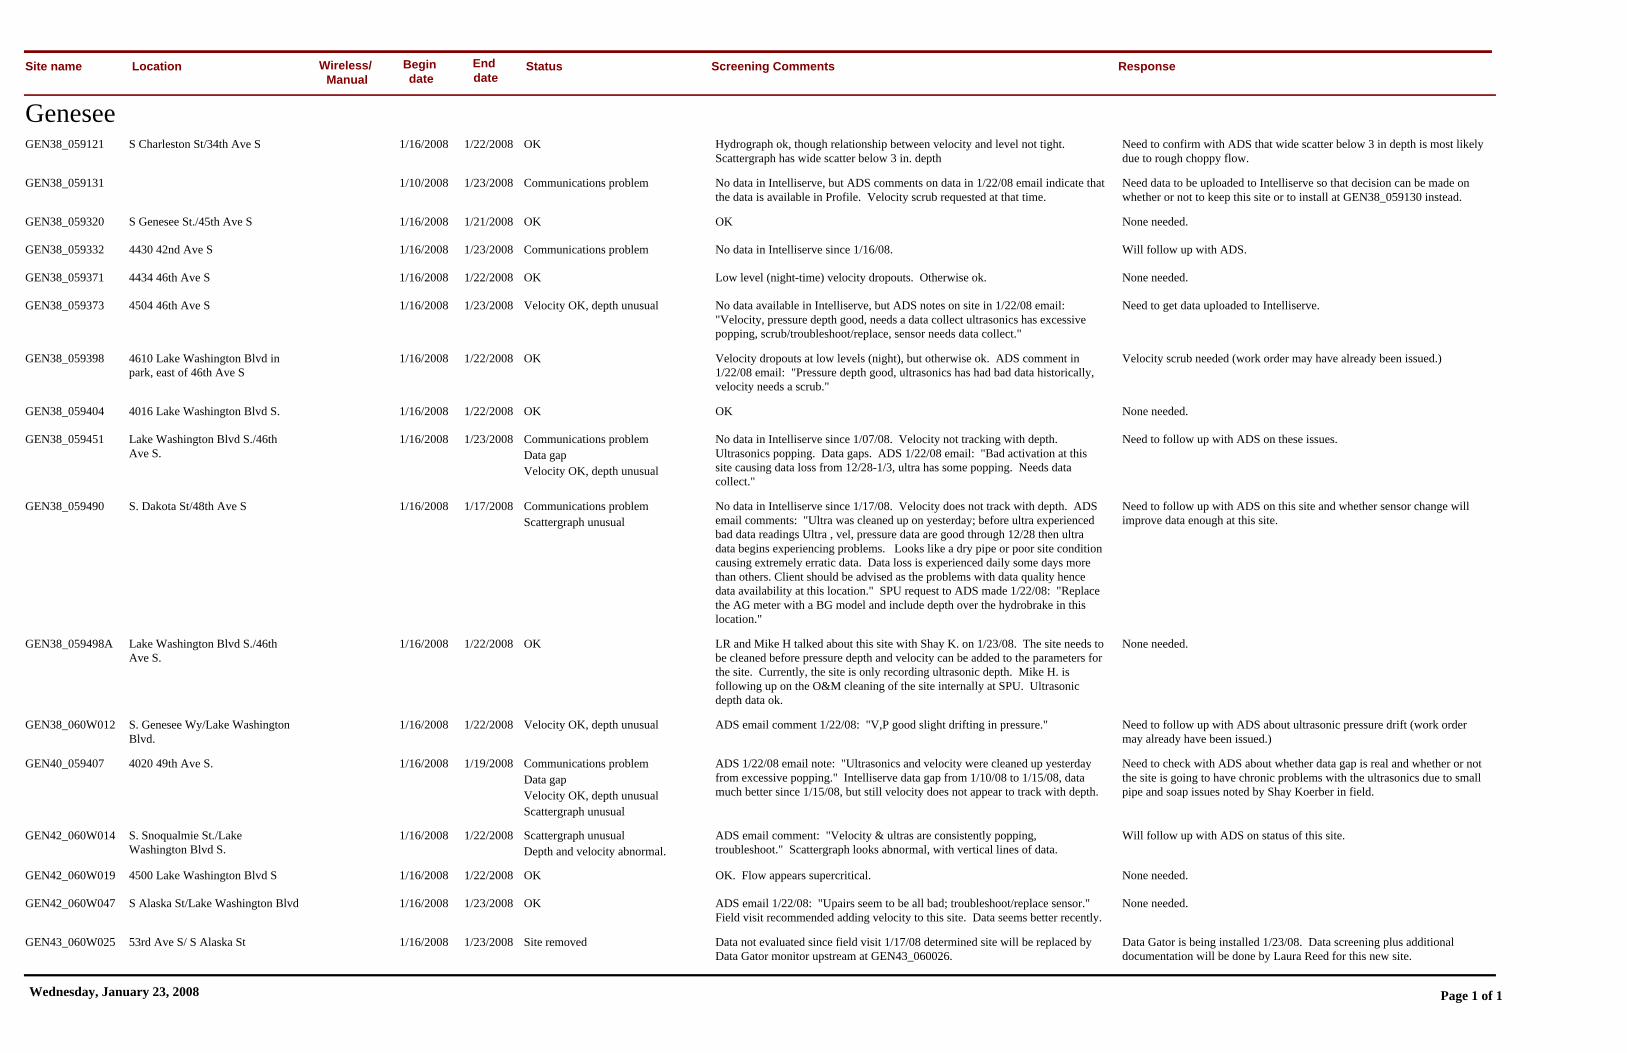
Site name Location Begin date
End date
Status Screening Comments ResponseWireless/ Manual
GeneseeGEN38_059121 S Charleston St/34th Ave S 1/16/2008 1/22/2008 Hydrograph ok, though relationship between velocity and level not tight.
Scattergraph has wide scatter below 3 in. depthNeed to confirm with ADS that wide scatter below 3 in depth is most likely due to rough choppy flow.
OK
GEN38_059131 1/10/2008 1/23/2008 No data in Intelliserve, but ADS comments on data in 1/22/08 email indicate that the data is available in Profile. Velocity scrub requested at that time.
Need data to be uploaded to Intelliserve so that decision can be made on whether or not to keep this site or to install at GEN38_059130 instead.
Communications problem
GEN38_059320 S Genesee St./45th Ave S 1/16/2008 1/21/2008 OK None needed.OK
GEN38_059332 4430 42nd Ave S 1/16/2008 1/23/2008 No data in Intelliserve since 1/16/08. Will follow up with ADS.Communications problem
GEN38_059371 4434 46th Ave S 1/16/2008 1/22/2008 Low level (night-time) velocity dropouts. Otherwise ok. None needed.OK
GEN38_059373 4504 46th Ave S 1/16/2008 1/23/2008 No data available in Intelliserve, but ADS notes on site in 1/22/08 email: "Velocity, pressure depth good, needs a data collect ultrasonics has excessive popping, scrub/troubleshoot/replace, sensor needs data collect."
Need to get data uploaded to Intelliserve.Velocity OK, depth unusual
GEN38_059398 4610 Lake Washington Blvd in park, east of 46th Ave S
1/16/2008 1/22/2008 Velocity dropouts at low levels (night), but otherwise ok. ADS comment in 1/22/08 email: "Pressure depth good, ultrasonics has had bad data historically, velocity needs a scrub."
Velocity scrub needed (work order may have already been issued.)OK
GEN38_059404 4016 Lake Washington Blvd S. 1/16/2008 1/22/2008 OK None needed.OK
GEN38_059451 Lake Washington Blvd S./46th Ave S.
1/16/2008 1/23/2008 No data in Intelliserve since 1/07/08. Velocity not tracking with depth. Ultrasonics popping. Data gaps. ADS 1/22/08 email: "Bad activation at this site causing data loss from 12/28-1/3, ultra has some popping. Needs data collect."
Need to follow up with ADS on these issues.Communications problemData gapVelocity OK, depth unusual
GEN38_059490 S. Dakota St/48th Ave S 1/16/2008 1/17/2008 No data in Intelliserve since 1/17/08. Velocity does not track with depth. ADS email comments: "Ultra was cleaned up on yesterday; before ultra experienced bad data readings Ultra , vel, pressure data are good through 12/28 then ultra data begins experiencing problems. Looks like a dry pipe or poor site condition causing extremely erratic data. Data loss is experienced daily some days more than others. Client should be advised as the problems with data quality hence data availability at this location." SPU request to ADS made 1/22/08: "Replace the AG meter with a BG model and include depth over the hydrobrake in this location."
Need to follow up with ADS on this site and whether sensor change will improve data enough at this site.
Communications problemScattergraph unusual
GEN38_059498A Lake Washington Blvd S./46th Ave S.
1/16/2008 1/22/2008 LR and Mike H talked about this site with Shay K. on 1/23/08. The site needs to be cleaned before pressure depth and velocity can be added to the parameters for the site. Currently, the site is only recording ultrasonic depth. Mike H. is following up on the O&M cleaning of the site internally at SPU. Ultrasonic depth data ok.
None needed.OK
GEN38_060W012 S. Genesee Wy/Lake Washington Blvd.
1/16/2008 1/22/2008 ADS email comment 1/22/08: "V,P good slight drifting in pressure." Need to follow up with ADS about ultrasonic pressure drift (work order may already have been issued.)
Velocity OK, depth unusual
GEN40_059407 4020 49th Ave S. 1/16/2008 1/19/2008 ADS 1/22/08 email note: "Ultrasonics and velocity were cleaned up yesterday from excessive popping." Intelliserve data gap from 1/10/08 to 1/15/08, data much better since 1/15/08, but still velocity does not appear to track with depth.
Need to check with ADS about whether data gap is real and whether or not the site is going to have chronic problems with the ultrasonics due to small pipe and soap issues noted by Shay Koerber in field.
Communications problemData gapVelocity OK, depth unusualScattergraph unusual
GEN42_060W014 S. Snoqualmie St./Lake Washington Blvd S.
1/16/2008 1/22/2008 ADS email comment: "Velocity & ultras are consistently popping, troubleshoot." Scattergraph looks abnormal, with vertical lines of data.
Will follow up with ADS on status of this site.Scattergraph unusualDepth and velocity abnormal.
GEN42_060W019 4500 Lake Washington Blvd S 1/16/2008 1/22/2008 OK. Flow appears supercritical. None needed.OK
GEN42_060W047 S Alaska St/Lake Washington Blvd 1/16/2008 1/23/2008 ADS email 1/22/08: "Upairs seem to be all bad; troubleshoot/replace sensor." Field visit recommended adding velocity to this site. Data seems better recently.
None needed.OK
GEN43_060W025 53rd Ave S/ S Alaska St 1/16/2008 1/23/2008 Data not evaluated since field visit 1/17/08 determined site will be replaced by Data Gator monitor upstream at GEN43_060026.
Data Gator is being installed 1/23/08. Data screening plus additional documentation will be done by Laura Reed for this new site.
Site removed
Wednesday, January 23, 2008 Page 1 of 1

WA 1.0 - GENESEE BASIN FLOW MONITORING STUDY PAGE 59 OF 62 QUALITY ASSURANCE PROJECT PLAN
Revision: R1D0 Effective date: 8/19/2008 This is an UNCONTROLLED DOCUMENT.
Appendix F: ADS QA and Implementation Plan
ADS Quality Assurance and Implementation Plan SPU Genesee Sewer Temporary Flow Monitoring Study ________________________________________________________________
ADS Environmental Services
7/22/2008 Revision 3
ADS Quality Assurance and
Implementation Plan
Prepared for: Seattle Public Utilities Project: Genesee
ADS Quality Assurance and Implementation Plan SPU Genesee Sewer Temporary Flow Monitoring Study ________________________________________________________________
ADS Environmental Services
7/22/2008 Revision 3
Table of Contents
CCHHAAPPTTEERR 11 INTRODUCTION .................................................................................. 3
1.1 Background ..................................................................................................... 3
1.2 Project Scope .................................................................................................. 3
1.3 Health and Safety Plan ................................................................................... 4
CHAPTER 2 EQUIPMENT AND METHODOLOGY ................................................. 5
2.1 Flow Quantification Methods......................................................................... 5
2.2 Flow Monitoring Equipment........................................................................... 5
2.3 Installation....................................................................................................... 7
2.4 Special Installations ....................................................................................... 9
2.5 Data Collection, Confirmation, and Quality Assurance............................... 9
CCHHAAPPTTEERR 33 DATA ANALYSIS AND PRESENTATION......................................... 11
3.1 Data Analysis ................................................................................................ 11
3.2 Data Presentation ......................................................................................... 12
CCOONNTTAACCTT LLIISSTT FFOORR AADDSS PPEERRSSOONNNNEELL .............................................................. 15

________________________________________________________________
7/22/2008 3
ADS QA and Implementation Plan SPU Temporary Flow Metering - Genesee
Revision 3
CCHHAAPPTTEERR 11 Introduction
1.1 Background
Seattle Public Utilities (SPU) contracted ADS Environmental Services to conduct flow
monitoring at 17 combined sewer locations in Seattle, WA. The objective of this study is
to measure depth, velocity and to quantify sewer flows for the intended use in model
calibration. Chapter 2 of this report outlines the flow quantification methods, equipment,
and installation procedures. Chapter 3 outlines the meter data evaluation and
presentation procedures and format.
1.2 Project Scope
The scope of this study involves using temporary flow monitors to quantify wastewater
flow at 17 combined sewer locations: Specifically, the study included the following key
components.
• Investigation of the proposed flow-monitoring sites for adequate hydraulic conditions.
• Flow monitor installation.
• Flow monitor confirmations and data collections.
• Flow monitor data analysis
The flow metering tasks and their intended start dates are listed below:
• Investigation 11/27/2007 – 12/4/2007
• Installation 12/5/2007 – 12/13/2007
• Complete Installation 12/28/2007 except GEN 131 and 371 (completed 01/04/2008)
• Flow Metering Study Start 12/29/2007 except GEN 131 and 371 (start 01/05/2008)
• Two week data review (to occur one week after two weeks of data has been collected)
________________________________________________________________
7/22/2008 4
ADS QA and Implementation Plan SPU Temporary Flow Metering - Genesee
Revision 3
• Ongoing Weekly:
Daily data collection (via IntelliServe®), data review
• Ongoing Monthly (after the first two months of data has been collected):
Provide Preliminary Data
• Flow Metering Study End Date 06/25/2008 except GEN 131 and 371 (end 07/02/2008)
• Flow Metering Final Report 08/02/2008
1.3 Health and Safety Plan
The ADS Health and Safety Plan is a separate document. The ADS Health and Safety plan includes emergency procedures.
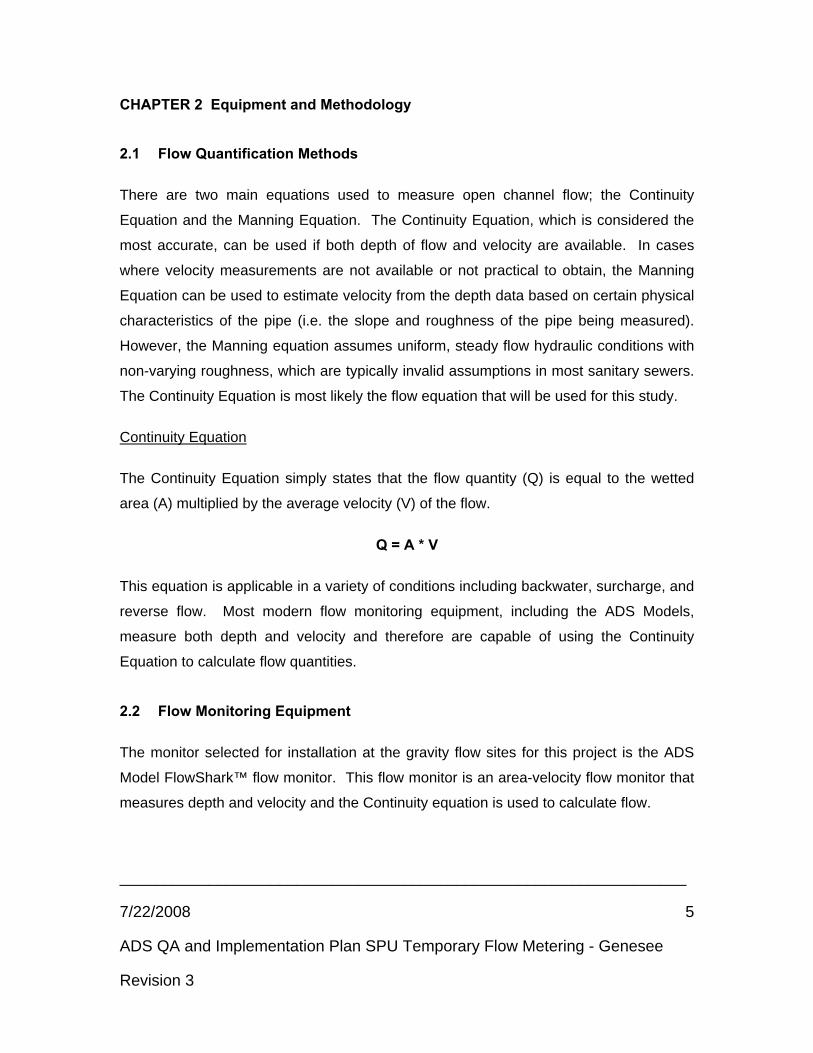
________________________________________________________________
7/22/2008 5
ADS QA and Implementation Plan SPU Temporary Flow Metering - Genesee
Revision 3
CHAPTER 2 Equipment and Methodology
2.1 Flow Quantification Methods
There are two main equations used to measure open channel flow; the Continuity
Equation and the Manning Equation. The Continuity Equation, which is considered the
most accurate, can be used if both depth of flow and velocity are available. In cases
where velocity measurements are not available or not practical to obtain, the Manning
Equation can be used to estimate velocity from the depth data based on certain physical
characteristics of the pipe (i.e. the slope and roughness of the pipe being measured).
However, the Manning equation assumes uniform, steady flow hydraulic conditions with
non-varying roughness, which are typically invalid assumptions in most sanitary sewers.
The Continuity Equation is most likely the flow equation that will be used for this study.
Continuity Equation
The Continuity Equation simply states that the flow quantity (Q) is equal to the wetted
area (A) multiplied by the average velocity (V) of the flow.
Q = A * V
This equation is applicable in a variety of conditions including backwater, surcharge, and
reverse flow. Most modern flow monitoring equipment, including the ADS Models,
measure both depth and velocity and therefore are capable of using the Continuity
Equation to calculate flow quantities.
2.2 Flow Monitoring Equipment
The monitor selected for installation at the gravity flow sites for this project is the ADS
Model FlowShark™ flow monitor. This flow monitor is an area-velocity flow monitor that
measures depth and velocity and the Continuity equation is used to calculate flow.
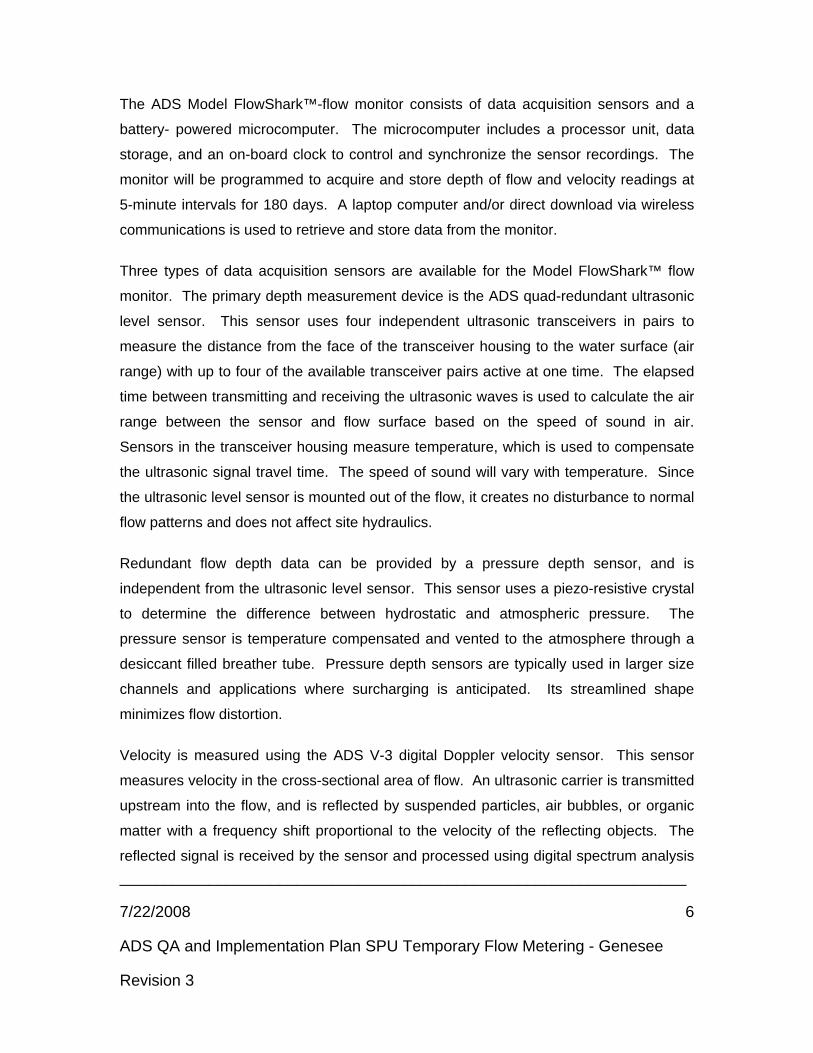
________________________________________________________________
7/22/2008 6
ADS QA and Implementation Plan SPU Temporary Flow Metering - Genesee
Revision 3
The ADS Model FlowShark™-flow monitor consists of data acquisition sensors and a
battery- powered microcomputer. The microcomputer includes a processor unit, data
storage, and an on-board clock to control and synchronize the sensor recordings. The
monitor will be programmed to acquire and store depth of flow and velocity readings at
5-minute intervals for 180 days. A laptop computer and/or direct download via wireless
communications is used to retrieve and store data from the monitor.
Three types of data acquisition sensors are available for the Model FlowShark™ flow
monitor. The primary depth measurement device is the ADS quad-redundant ultrasonic
level sensor. This sensor uses four independent ultrasonic transceivers in pairs to
measure the distance from the face of the transceiver housing to the water surface (air
range) with up to four of the available transceiver pairs active at one time. The elapsed
time between transmitting and receiving the ultrasonic waves is used to calculate the air
range between the sensor and flow surface based on the speed of sound in air.
Sensors in the transceiver housing measure temperature, which is used to compensate
the ultrasonic signal travel time. The speed of sound will vary with temperature. Since
the ultrasonic level sensor is mounted out of the flow, it creates no disturbance to normal
flow patterns and does not affect site hydraulics.
Redundant flow depth data can be provided by a pressure depth sensor, and is
independent from the ultrasonic level sensor. This sensor uses a piezo-resistive crystal
to determine the difference between hydrostatic and atmospheric pressure. The
pressure sensor is temperature compensated and vented to the atmosphere through a
desiccant filled breather tube. Pressure depth sensors are typically used in larger size
channels and applications where surcharging is anticipated. Its streamlined shape
minimizes flow distortion.
Velocity is measured using the ADS V-3 digital Doppler velocity sensor. This sensor
measures velocity in the cross-sectional area of flow. An ultrasonic carrier is transmitted
upstream into the flow, and is reflected by suspended particles, air bubbles, or organic
matter with a frequency shift proportional to the velocity of the reflecting objects. The
reflected signal is received by the sensor and processed using digital spectrum analysis
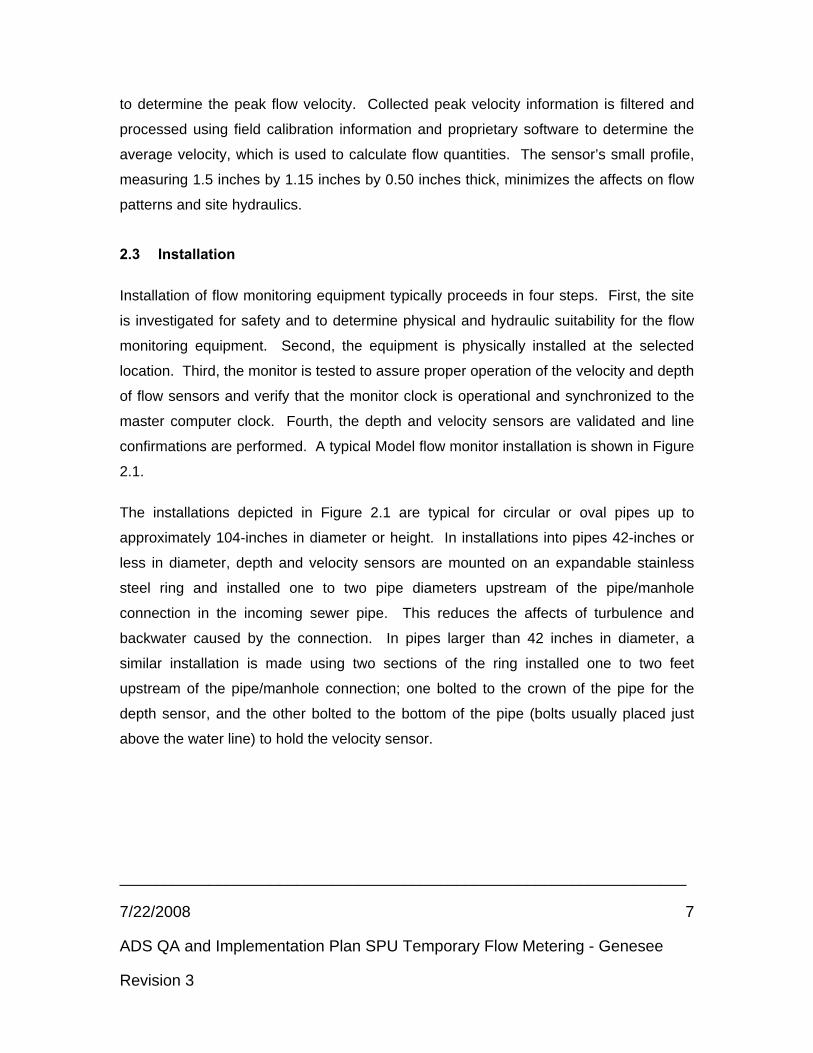
________________________________________________________________
7/22/2008 7
ADS QA and Implementation Plan SPU Temporary Flow Metering - Genesee
Revision 3
to determine the peak flow velocity. Collected peak velocity information is filtered and
processed using field calibration information and proprietary software to determine the
average velocity, which is used to calculate flow quantities. The sensor’s small profile,
measuring 1.5 inches by 1.15 inches by 0.50 inches thick, minimizes the affects on flow
patterns and site hydraulics.
2.3 Installation
Installation of flow monitoring equipment typically proceeds in four steps. First, the site
is investigated for safety and to determine physical and hydraulic suitability for the flow
monitoring equipment. Second, the equipment is physically installed at the selected
location. Third, the monitor is tested to assure proper operation of the velocity and depth
of flow sensors and verify that the monitor clock is operational and synchronized to the
master computer clock. Fourth, the depth and velocity sensors are validated and line
confirmations are performed. A typical Model flow monitor installation is shown in Figure
2.1.
The installations depicted in Figure 2.1 are typical for circular or oval pipes up to
approximately 104-inches in diameter or height. In installations into pipes 42-inches or
less in diameter, depth and velocity sensors are mounted on an expandable stainless
steel ring and installed one to two pipe diameters upstream of the pipe/manhole
connection in the incoming sewer pipe. This reduces the affects of turbulence and
backwater caused by the connection. In pipes larger than 42 inches in diameter, a
similar installation is made using two sections of the ring installed one to two feet
upstream of the pipe/manhole connection; one bolted to the crown of the pipe for the
depth sensor, and the other bolted to the bottom of the pipe (bolts usually placed just
above the water line) to hold the velocity sensor.
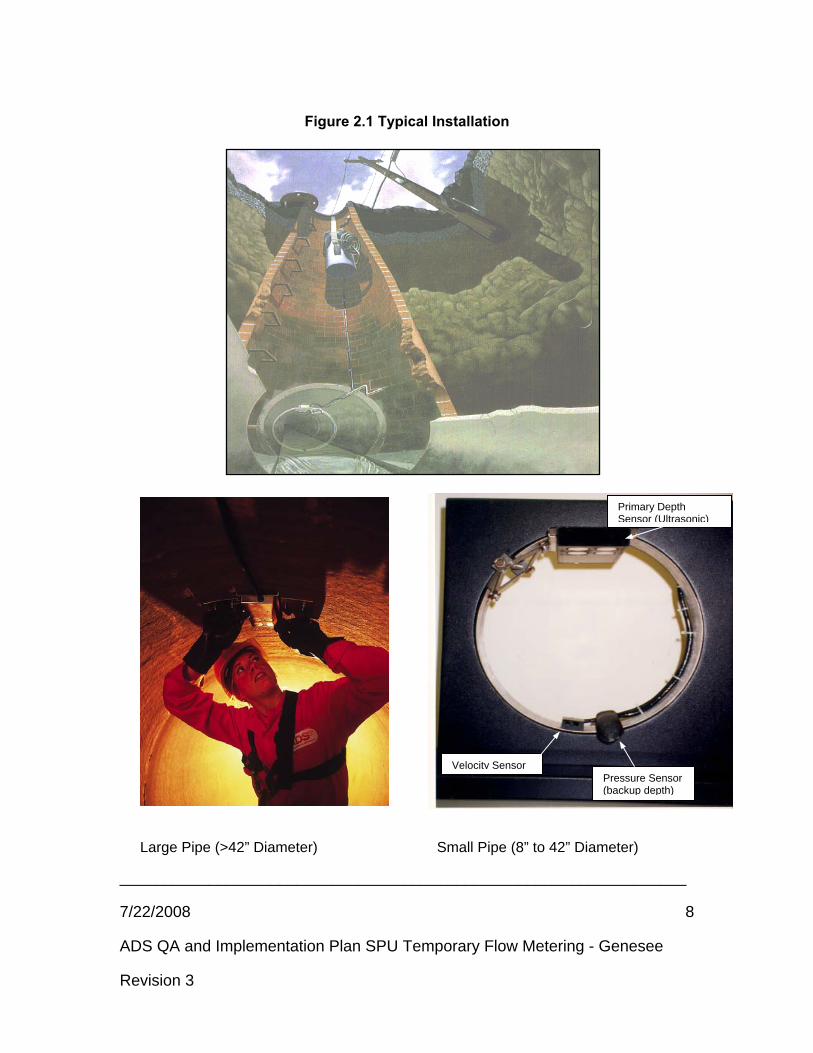
________________________________________________________________
7/22/2008 8
ADS QA and Implementation Plan SPU Temporary Flow Metering - Genesee
Revision 3
Figure 2.1 Typical Installation
Large Pipe (>42” Diameter) Small Pipe (8” to 42” Diameter)
Pressure Sensor (backup depth)
Primary Depth Sensor (Ultrasonic)
Velocity Sensor
________________________________________________________________
7/22/2008 9
ADS QA and Implementation Plan SPU Temporary Flow Metering - Genesee
Revision 3
2.4 Special Installations
Some of the installations performed require additional consideration for sensor
placement to record the data intended for the use of a project. It is important for these
types of sites that where possible, dedicated discussions and site visits take place with
representatives from SPU, modelers, engineers and ADS so that all parties understand
the flow metering requirements and limitations.
An example of a site requiring special installation is where flow calculation results from
the ultrasonic sensor detecting flow over a weir and in sites where a Hydro-Brake® is
installed. Installation at these sites is considered non standard and due to the various
configurations that may occur, it is best to refer to the ADS generated site report for site
specific detailed related to installation.
2.5 Data Collection, Confirmation, and Quality Assurance
During the monitoring period, field crews visit each monitoring location to retrieve data,
verify proper monitor operation, and document field conditions. The following quality
assurance steps are taken to assure the integrity of the data collected:
Measure Power Supply: The monitor is powered by a dry cell battery pack. Power
levels are recorded and battery packs replaced, if necessary. A separate battery
provides back-up power to memory, which allows the primary battery to be replaced
without the loss of data.
Maintenance: Perform maintenance as requested by data analyst or determined by
field crew. Maintenance tasks include sensor “scrubbing” (removal of debris) and
replacement of system parts if a malfunction of that part occurs. Maintenance is both
preventative and reactive for the flow meter and sensors.
Perform Pipe Line Confirmations and Validate Depth and Velocity: Once equipment
and sensor installation is accomplished, a member of the field crew descends into the
manhole to perform a field measurement of flow rate, depth and velocity to confirm they
________________________________________________________________
7/22/2008 10
ADS QA and Implementation Plan SPU Temporary Flow Metering - Genesee
Revision 3
are in agreement with the monitor. Since the ADS V-3 velocity sensor measures peak
velocity in the wetted cross-sectional area of flow, velocity profiles are also taken to
develop a relationship between peak and average velocity in lines that meet the
hydraulic criteria.
Measure Silt Level: During site confirmation, a member of the field crew descends into
the manhole and measures and records the depth of silt at the bottom of the pipe. This
data is used to compute the true area of flow.
Confirm Monitor Synchronization: The field crew checks the flow monitor’s clock for
accuracy. If the monitor and computer time are different by more than 5 minutes, the
monitor will be activated with the current computer time. The data for this project is also
to be synchronized with that of the permanent flow monitors and rain gages (CSO
NPDES network).
Upload and Review Data: Data collected by the monitor is uploaded and reviewed for
comparison with previous data. Data for this project is to be collected remotely via
wireless communication. In the event that the signal strength does not permit remote
data collection, the data will be collected via serial download to a laptop once a week.
All readings are checked for consistency and screened for deviations in the flow
patterns, which indicate system anomalies or equipment failure.
________________________________________________________________
7/22/2008 11
ADS QA and Implementation Plan SPU Temporary Flow Metering - Genesee
Revision 3
CCHHAAPPTTEERR 33 Data Analysis and Presentation
3.1 Data Analysis
A flow monitor is programmed to collect data at 15-minute intervals throughout the
monitoring period unless circumstances dictate a more frequent sample rate (e.g. rapidly
changing flows due to pump station influence). For this study the flow meter will be
programmed to collect data at 5-minute intervals per the request of the client. The
monitor stores raw data consisting of (1) the air range (distance from sensor to top of
flow) for each active ultrasonic depth sensor pair and (2) the peak velocity. If the
monitor is equipped with a pressure sensor, then a depth reading from this sensor may
also be stored. When the data is collected by the field personnel, the air range is
converted to depth data based on the pipe height and physical offset (distance from the
top of the pipe to the surface of the ultrasonic sensor). The data is imported into ADS’s
Profile™ software and is examined by a data analyst to verify its integrity. The data
analyst also reviews the daily field reports and site visit records to identify conditions that
would affect the collected data.
Velocity profiles and line confirmation data developed by the field personnel are
reviewed by the data analyst to identify inconsistencies and verify data integrity. Velocity
profiles are reviewed and an average to peak velocity ratio is calculated for the site.
This ratio is used in converting the peak velocity measured by the sensor to the average
velocity used in the Continuity equation.
The data analyst reviews the meter selection for which depth sensor entity is used to
calculate the final depth information. Any silt levels present at each site visit are
reviewed and representative silt levels established.
Selections for the above parameters can be constant or can change during the
monitoring period. While the data analysis process is described in a linear manner, it
often requires an iterative approach to accurately complete.
________________________________________________________________
7/22/2008 12
ADS QA and Implementation Plan SPU Temporary Flow Metering - Genesee
Revision 3
3.2 Data Presentation
This type of flow monitoring project generates a large volume of data. To facilitate
additional review by SPU staff of the data for this project, raw data will be uploaded daily
to a project specific IntelliServe® website. Raw data has not been reviewed by an ADS
data analyst, but it has undergone processing using Monitor Level Intelligence® (MLI®).
MLI® is a user configurable device that enables the ADS flow meters to perform a
variety of functions in addition to recording depth and velocity data (such as alarming
and sampling). The default setting of MLI® being used on this project results in the
meter learning its hydraulic signature, so that in the event there is a deviation from the
signature the meter takes another depth and velocity sample to verify if the previous
sample was an anomaly, or a new hydraulic signature is being developed. The default
setting also results in the pressure sensor depth being checked against the ultrasonic
depth once a day automatically.
Preliminary data will be uploaded once a month to a project specific Flowview Portal®
website. Here data can be plotted in graphical and tabular formats for user defined
periods of time. Preliminary data has undergone data analyst review based on
information that becomes available throughout the study period which could include
confirmations, cursory editing, unusual site hydraulic investigation and flow balancing.
Finalized data will be uploaded for viewing at the end of the project. Finalized data has
undergone a data analyst and senior data analyst comprehensive review of site
information: confirmations, final editing, data reconstitution, unusual site hydraulic
investigations and flow balancing. Final report data will be accessible on the project
website approximately 45 days after the study completion date. Access to the FlowView
Portal® website will be at SPU’s discretion.
The following explanation of terms may aid in interpretation of the tables, hydrographs
and scattergraphs:
UNIDEPTH – Recorded (raw) ultrasonic depth measurement (in inches)
________________________________________________________________
7/22/2008 13
ADS QA and Implementation Plan SPU Temporary Flow Metering - Genesee
Revision 3
PDEPTH – Recorded (raw) pressure depth data (in inches)
RAWVEL – Recorded (raw) peak velocity data (in feet per second)
QCONTINUITY – Preliminary calculated flow rate (MGD)
DFINAL – Preliminary/Final calculated depth measurement (in inches)
VFINAL – Preliminary/Final calculated average flow velocity (in feet per second)
QFINAL – Preliminary/Final calculated flow rate (in MGD)
AVERAGE – The average depth, velocity, and flow observed over the period indicated.
Based on an average of all valid 5-minute data points.
MINIMUM -- The minimum depth, velocity, and flow observed over the period indicated.
Derived from 5-minute interval data points.
MAXIMUM -- The maximum depth, velocity, and flow observed over the period indicated.
Derived from 5-minute interval data points.
________________________________________________________________
7/22/2008 14
ADS QA and Implementation Plan SPU Temporary Flow Metering - Genesee
Revision 3
References
ADS FlowShark™ Operation Manual
ADS Profile™ Manual
ADS IntelliServe™ Online Help Manual
Pat Stevens PE and Kevin Enfinger PE “Scattergraph Principles and Practice”
Pat Stevens PE and Kevin Enfinger PE “Scattergraph Poster”
ADS Health & Safety Plan
ADS Data Analysis Standard Operating Procedure QP 684002 (ISO 9001 controlled document)
ADS Field Support Standard Operating Procedire QP 662020 (ISO 9001 controlled document)

________________________________________________________________
7/22/2008 15
ADS QA and Implementation Plan SPU Temporary Flow Metering - Genesee
Revision 3
CCoonnttaacctt LLiisstt ffoorr AADDSS PPeerrssoonnnneell
Mike Pina, Project Manager 309 South Cloverdale, Ste D-38 Seattle WA, 98108 Office: 206-762-5070 Cell: 206-793-8064 [email protected]
Sean Winder, Senior Field Representative
309 South Cloverdale, Ste D-38
Seattle WA, 98108
Office: 206-762-5070
Cell: 206-423-3453
Jackie Crutcher, Data Manager
4940 Research Drive
Huntsville, AL 35805
Phone: 800-633-7246 ext. 6472

________________________________________________________________
7/22/2008 16
ADS QA and Implementation Plan SPU Temporary Flow Metering - Genesee
Revision 3
Kara Rogers, Data Analyst
309 South Cloverdale, Ste D-38
Seattle WA, 98108
Office: 206-762-5070
Katonya Sledge, Data Analyst
4940 Research Drive
Huntsville, AL 35805
Phone: 800-633-7246 ext. 6472
Gillian Woodward, Business Development Manager
309 South Cloverdale, Ste D-38
Seattle WA, 98108
Office: 206-762-5070
Cell: 206-255-6904

WA 1.0 - GENESEE BASIN FLOW MONITORING STUDY PAGE 60 OF 62 QUALITY ASSURANCE PROJECT PLAN
Revision: R1D0 Effective date: 8/19/2008 This is an UNCONTROLLED DOCUMENT.
Appendix G: ADS Health and Safety Plan
ADS Environmental Services A Division of ADS LLC
Field Safety Manual
Copy Provided for:
Seattle Public Utilities, WA
February 2008
ADS LLC 4940 Research Drive Huntsville, AL 35805
(256) 430-3366
Copyright © 2000 ADS Corporation
NOTICE
This manual is the property of ADS Corporation for use by employees of ADS Corporation, its subsidiaries, and subcontractors only. It is not the intent of this manual to be comprehensive for use by other firms or organizations. ADS Corporation will not be responsible for the accuracy of any information contained in this manual and will not be held liable for the content as interpreted or utilized by those outside ADS Corporation.
July 2000
ADS Corporation
FOREWORD
This Field Safety Manual has been designed to provide employees of ADS Corporation, its subsidiaries, and subcontractors with current policies, procedures, and information relating to the safe conduct of field operations.
The policies and procedures contained in this manual are minimum safety standards and are not intended to supersede existing federal, state, or local safety regulations. Where a conflict exists, employees are to contact their immediate supervisor or the Safety Manager.
The terms he, she, his or hers, as they may appear in this manual are not intended to be gender-specific.
i
Contents
Chapter 1 Introduction 1-1 Safety Policies....................................................................................1-3
Safety and Health (Safety Program) ............................................1-3 Blood Borne Pathogens and Control ...........................................1-8 Hearing Conservation ..................................................................1-10 Confined Space Entry ..................................................................1-12 Personal Protective Equipment ....................................................1-15 Electrical Safety...........................................................................1-16 Supplied Air Respirators..............................................................1-17 Driver Safety................................................................................1-18 Hazard Communication ...............................................................1-20
The 10 Field Safety Commandments.................................................1-23
Chapter 2 Safe Work Practices 2-1 Getting Started ...................................................................................2-2
Standard Preparation and Procedures ..........................................2-2 Crew Requirements......................................................................2-3 The Attendant's Duties.................................................................2-3 Standard Required Equipment .....................................................2-5 Special Safety Equipment ............................................................2-5
Traffic Control ...................................................................................2-7 Evaluating Traffic ........................................................................2-7 Setting Up Control in Traffic.......................................................2-8 Basic Traffic Control Setup .........................................................2-10 Flagging and Two-Way Traffic Control ......................................2-18 Procedures For Controlling Traffic..............................................2-19
Worksite Safety..................................................................................2-23 Reaching the Worksite.................................................................2-23 Opening Manholes .......................................................................2-23 Carrying and Storing Tools at the Worksite ................................2-26 Other Worksite Safety..................................................................2-27
Confined Space Entry ........................................................................2-28 Training........................................................................................2-28 Hazard Identification ...................................................................2-29 Atmospheric Testing....................................................................2-32 Ventilation ...................................................................................2-36 Respirators ...................................................................................2-38 Rigging and Rope Work ..............................................................2-40
ii ADS Field Safety Manual
Special Situations...............................................................................2-53 Deep Lines and Chambers ...........................................................2-53 Horizontal Work Spaces ..............................................................2-56 Multiple Chambers ......................................................................2-57 Pump Stations ..............................................................................2-59 Storm and Combined Systems .....................................................2-60 Treatment Plants ..........................................................................2-60 Industrial (Process) Sites .............................................................2-61 Physical Inspection ......................................................................2-61 TV Inspection ..............................................................................2-62 Smoke Testing .............................................................................2-63 Flow Isolation ..............................................................................2-64 Dye Testing..................................................................................2-64
Chapter 3 Equipment Operation and Maintenance 3-1 Personal Safety Equipment ................................................................3-2 Gas Meter...........................................................................................3-4 Respirator...........................................................................................3-5
Respirator Use..............................................................................3-5 Respirator Components................................................................3-6 Air Supply Setup..........................................................................3-8 Face Mask Setup..........................................................................3-9 Air Unit Maintenance ..................................................................3-9
Air Blower/Smoke Blower ................................................................3-10 Starting Techniques .....................................................................3-10 Vital Routine Maintenance ..........................................................3-10
Grigri..................................................................................................3-12 Rigging.........................................................................................3-13 Descent.........................................................................................3-15 Retrieval.......................................................................................3-15 Maintenance.................................................................................3-16
Ladders...............................................................................................3-17 Road Cut Machines............................................................................3-18 Trencher Machines ............................................................................3-19 Cleaner/Combo Units.........................................................................3-20 Easement Kits ....................................................................................3-22
Chapter 4 Emergencies, First Aid, and Hygiene 4-1 Emergencies.......................................................................................4-2
Confined Space Rescue................................................................4-2 Getting Help.................................................................................4-3
First Aid .............................................................................................4-5 Gas Poisoning ..............................................................................4-7 Heat Injuries.................................................................................4-8 Cold Injuries ................................................................................4-10

Contents iii
Hygiene ..............................................................................................4-13 Hygiene Guidelines......................................................................4-13 Field Office Housekeeping ..........................................................4-14 Care of Clothing...........................................................................4-14 Medical Examinations .................................................................4-14 Blood Borne Pathogens ...............................................................4-14
Glossary of Terms Gl-1
Index In-Error! Bookmark not defined.

Gl-1
Glossary of Terms
air blower This machine is used to ventilate manholes to eliminate or dilute hazardous atmospheres. ADS typically uses a gasoline-powered air blower rated at a nominal 1450 cubic feet per minute output though an 8-inch diameter flexible hose.
air line manifold This piece of metal has multiple airline connections that allow two air units to operate off the same tank.
air tank This is usually a air tank from an industrial oxygen or air supplier. Each tank has enough air to supply approximately 2 hours of work, depending on the amount of worker activity and leakage from the mask.
air tank regulator This is the primary regulator which steps down the pressure from the tank pressure (2500 psi on average) to the operating pressure of the hose and face plate regulator (60 to 125 psi). It has two gauges: one reporting supply tank pressure and the other indicating air line pressure.
ascenders Ascenders give anyone pulling on a rope a better grip than just grasping the rope itself. They also provide an effective one-way ratchet effect that allows the worker to pull on a rope, secure what they have pulled, and recover the next length to be pulled by sliding the ascender along to its next grip point.
carabiniers These are metal loops used as the basic means of attaching and securing harnesses and ropes. The carabinier’s opening gates should be spring-loaded with a screw collar closure. They are used to attach ropes and pulleys to the sit harness, close
Gl-2 ADS Field Safety Manual
the chest harness, secure ascenders and, usually, to secure the climbing rope at the top of the manhole.
chest harness Vital for rescue purposes, the chest harness keeps the rope close to the chest to prevent an unconscious victim from rotating to a horizontal position and getting jammed sideways during a rescue attempt. The chest harness can be ready-made or constructed from a loop of nylon webbing closed with a carabinier.
chocks This is any device placed under the wheels of a vehicle to prevent it from moving.
combined sewers This is a collection system that carries both wastewater and stormwater.
confined space This is any enclosed area that is not designed for human occupancy, has restricted entry and exit, and contains known or potential hazards. Confined spaces include manholes, sewer lines, pump station wet wells and dry sides, diversion or control structures, tide gates, overflow structures, siphon chambers, retention tanks, or any other structure that fits the same criteria.
emergency card This is a card containing emergency numbers and a simplified map with routes to the closest emergency hospitals clearly marked. This card should be posted prominently on the visor of each field van.
escape bottle This is a small metal bottle that hangs on your belt and is used with supplied-air respirator systems (SARs). If the main air supply is cut off, this bottle will supply up to 5 minutes of emergency escape air when it is fully charged. The bottle is manually operated and has a built-in air pressure gauge.
figure-8 device This is a friction device attached to the topside attendant's harness that allows the attendant to control the descent worker's rate of descent and to stop that descent by simply cinching the rope feeding through it.
Glossary Gl-3
fire extinguisher This is a pressurized cylinder containing a fire extinguishing agent (usually a dry chemical or carbon dioxide). It is used to extinguish small fires and is rated depending on the type of fire (caused by combustibles, liquids, electricity, etc.).
first aid kit This contains supplies for giving emergency first aid at the scene of an accident. The kits used by ADS are designed specifically for use in the field; all components fit into a single container that is kept in the vehicle.
four-way flashers These are the lights located at the front (amber) and rear (red) of a vehicle for warning other motorists that the vehicle is stopped for an extended period or is disabled. These lights support the vehicle beacon in alerting other motorists of our presence. They also can be operated independently of the ignition system.
frostbite Frostbite is the freezing of parts of the body due to exposure to very low tempera-tures. Frostbite occurs when ice crystals form in the fluid in the cells of the skin and other body tissues. The toes, fingers, nose, and ears are most often affected. Often the victim is not aware he or she has frostbite until someone else notices the symptoms. The symptoms may include any or all of the following:
In the early stages, pain is often present. The skin appears red.
In advanced stages, the skin becomes white or grayish yellow. It appears and feels waxy and firm. The skin feels very cold and numb, and the pain disappears. Blisters may appear.
full-face mask This mask is part of the supplied-air respirator (SAR). It seals the entire face off from the outside atmosphere. A regulator constantly bleeds a small amount of air into the mask to provide the positive pressure and adds a burst of air when the wearer inhales.
functional test This is the process in which a gas meter’s sensors are exposed to a calibration gas to test its accuracy. The calibration gas contains a known concentration of a hazardous gas (e.g., hydrogen sulfide). If the functional test shows that the gas meter reads the gas concentration accurately (within 10%), no further action is required. If the readings are out of tolerance, then the instrument must be calibrated.
Gl-4 ADS Field Safety Manual
Grigri The Grigri is a belaying device that is used by ADS for vertical descent and retrieval. It combines the functions of both a pulley and an ascender into a single, lightweight device. It has a 5,000-pound load rating, and it is designed for use only with 10-11 mm (7/16-inch) diameter rope.
hard hat This is a article of personal protective equipment designed to protect the head from trauma. The hard hat consists of a high impact plastic shell and an adjustable suspension harness.
harness See SAR harness.
heat cramps Heat cramps are muscle pains and spasms caused by a loss of salt from the body due to heavy sweating. Strenuous activity in hot temperatures can lead to heat cramps. Usually the muscles of the stomach and legs are affected first. Heat cramps may also be a symptom of heat exhaustion. The symptoms may include any or all of the following:
painful muscle cramping and spasms
heavy sweating
possible convulsions
heatstroke Heatstroke (also known as sunstroke) is a life-threatening emergency. It is a breakdown of the body's ability to regulate its own temperature. It is caused by extremely high body temperature due to heat exposure. The symptoms may include any or all of the following:
extremely high body temperature (often 106 degrees or higher)
hot, red, and dry skin (the victim does not sweat)
rapid, strong pulse
possible unconsciousness or confusion
high-level warning device This is a standard traffic control sign placed on a tripod base and 8-foot mast. Also known as highboys, these signs are often required for high-speed roads and crowded urban areas where visibility over traffic is required.
Glossary Gl-5
hypothermia Hypothermia is the severe chilling of the entire body and is life threatening. Hypothermia risks are much higher when cold and wet conditions exist. The first line of defense against hypothermia is to stay warm and dry. Symptoms of hypothermia may include any or all of the following:
shivering (often uncontrollable)
numbness
drowsiness, sleepiness, or mental confusion
muscle weakness or loss of coordination
low body temperature
loss of consciousness
invert elevation This is the elevation of the invert above mean sea level.
J-hook This is a J-shaped tool that allows the worker to remove the manhole cover without bending over. The worker hooks it through the venthole and then lifts the covers using strength from the legs. This is also known as a manhole hook.
LEL See lower explosion limit.
lower explosion limit (LEL) This is the point where the amount of a combustible gas present in the air is sufficient to ignite.
manhole hook See J-hook.
NIOSH NIOSH is the National Institute for Occupational Safety and Health. This organization conducts research, education, and testing related to occupational safety and health.
Gl-6 ADS Field Safety Manual
pinch point This is any area in operating machinery where loose clothing or body parts could get caught easily, causing an injury.
pulley This piece of hardware, which attaches to the entry worker's sit harness, effectively halves the weight an attendant must lift when pulling a worker up from a manhole. It allows the rope to form a loop down into the manhole, back through the pulley, and up to the manhole entrance. Only approved mountain climbing pulleys with known weight ratings are acceptable.
rebreather This is a respirator designed to be carried into a confined space. These units provide 30 to 60+ minutes of air depending on the model used.
reflective cone collar This is a strip of highly reflective tape or material attached to a traffic cone to increase its visibility at night.
roof beacon See vehicle beacon.
rope A safety rope is a special type of rope used mainly for caving and rock climbing. It is a bundle of fibers covered with a woven mantle; almost all the support is provided by the internal fibers. The mantle exists mainly to protect the fibers from abrasion and cutting. The rope is designed to withstand forces of falls that are many times greater than the demands put on the rope in typical ADS applications. A part of basic field equipment, the ADS standard issue rope is 100 feet long and 11 millimeters in diameter.
safety card See emergency card.
safety vests See traffic vests.
SAR See supplied air respirator.
Glossary Gl-7
SAR harness This is a belt and across-the-shoulder strap combination that takes the strain off the hose, provides a mounting point for connecting the supply hose to the worker's low-pressure hose, and holds the 5-minute escape bottle.
SCBA See self-contained breathing apparatus.
scouring velocity This is the velocity at which flow clears the pipe of debris.
self-contained breathing apparatus (SCBA) This is a respirator that supplies air to the wearer using a compressed air tank, similar to the SCUBA tank a diver wears, that is connected to a face mask. These units are designed to be carried into a confined space. The length of time that air is provided to the wearer depends on the size of the tank, pressure, and activity level of the wearer.
sit harness Also known as a seat harness, a sit harness distributes the worker’s weight and hanging balance point around their hips and upper legs. The rope attaches to loops in the front at the harness buckle. A sit harness with the rope attached is also worn by the attendant aboveground. This frees the attendant's hands and allows the attendant's hips and legs to support the weight on the rope.
steel-toed boots These are personal protective equipment designed to protect the feet, especially the toes, from crushing injuries due to falling and/or heavy objects. These boots may be leather or rubber and come in a variety of sizes and styles.
storm sewer This is a collection system that carries storm water.
sunstroke See heatstroke.
supplied-air respirator (SAR) This is a respirator that supplies air to the wearer by putting constant positive air pressure into a full-face mask. The pressure inside makes it likely that even with
Gl-8 ADS Field Safety Manual
a leak around the edge seals, no gas from the outside will enter the mask. An additional burst of air is supplied every time the wearer breathes. The SAR uses a large tank that supplies air through a hose up to 250 feet long. The length of time that air is provided to the wearer depends on the size of the tank, pressure, and activity level of the wearer.
traffic control This is the process of warning motorists and redirecting vehicular traffic around an active work site.
traffic control equipment This equipment is used in traffic control activities. It includes warning signs, traffic cones, and stop/slow paddles.
traffic vests These are personal protective equipment designed to warn motorists of an individual’s presence on or near a roadway, especially at night. This vest is highly visible during the day and has reflective material attached for increased visibility at night.
tripod This special device sets up over a manhole and is used for inserting and retrieving a manhole worker. The type used by ADS is equipped with a special pulley that gives a 2:1 mechanical advantage and has built-in fall protection during raising and lowering. It is generally used when the crew feels it is safer to use the tripod (e.g., in deep manholes), local regulations require the use of the tripod, and/or the manhole worker must hang suspended to do work while the topside worker moves around to provide assistance.
vehicle beacon This warning light consists of a flashing light or fixed light with a rotating reflector mounted inside an orange lens. The unit is mounted either temporarily (with a magnetic base) or permanently to the roof of the vehicle. It is used to warn motorists of a vehicle engaged in utility work.
warning beacon See vehicle beacon.

In-1
1-1
C H A P T E R 1
Introduction
A 21-year-old sewer worker was trying to clean and unclog a 4-foot diameter by 8-foot deep sewage holding tank when he collapsed and fell face down in 6 inches of water. A second worker attempted a rescue and also collapsed. The first worker died in the tank. His would-be rescuer died 2 weeks later. The cause of death was asphyxiation by methane gas. Neither worker was wearing a safety line or a breathing apparatus.
A sewer crew had set up a flag-controlled lane on a busy suburban street. A motorist ignored traffic signals and sped into the controlled lane without stopping or slowing. He ran head-on into a vehicle a crew member had signaled to proceed from the other direction. The same motorist who caused the accident then sued and won an $86,000 judgment because a jury ruled the flag and traffic controls were improper and the personnel poorly trained.
A worker attempted to move one end of a railroad tie away from a manhole without requesting assistance from another worker. He also neglected to exercise a proper lifting technique. Consequently, the worker suffered a severe back injury resulting in a permanent disability.
Working in a 24-inch sewer line, a worker slipped and fell with his legs down the line and his body blocking the output. The growing water pressure from the constant flow wedged him further into the output pipe, preventing him from getting to his feet. His desperate struggling and the safety crew's rescue efforts saved him from drowning.
A sewer worker performing maintenance in the dry side of a pump station was trapped when the pressure of the sewage blew off a pump cover and flooded the station. A coworker, a supervisor, and a policeman attempted rescues and died. Two of the victims drowned; the others were overcome by sewer gas.
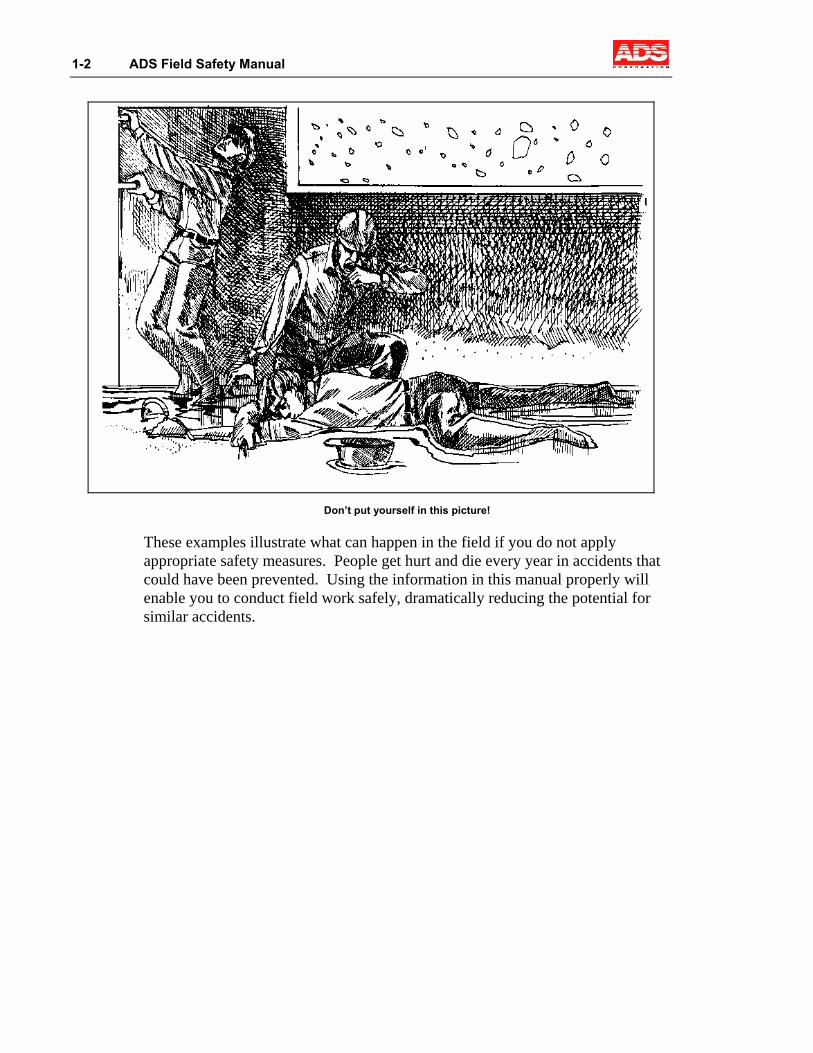
1-2 ADS Field Safety Manual
Don’t put yourself in this picture!
These examples illustrate what can happen in the field if you do not apply appropriate safety measures. People get hurt and die every year in accidents that could have been prevented. Using the information in this manual properly will enable you to conduct field work safely, dramatically reducing the potential for similar accidents.
Introduction 1-3
Safety Policies This section lists the principal safety policies for ADS Corporation. For information on a specific policy, refer to the following pages:
Safety and Health (Safety Program), see page 1-3
Blood Borne Pathogens and Control, see page 1-8
Hearing Conservation, see page 1-10
Confined Space Entry, see page 1-12
Personal Protective Equipment, see page 1-15
Electrical Safety, see page 1-15
Supplied Air Respirators, see page 1-17
Driver Safety, see page 1-18
Hazard Communication, see page 1-18
Safety and Health (Safety Program) ADS is committed to the safety of all of our employees. We do not consider any operation or process successful if an injury or vehicle incident occurs. Our mission is to accomplish the following:
Provide the safest possible working environment for all employees
Promote safe and healthful work practices as key elements of day-to-day operations
Work to continually improve the safety process
Implementation The Safety Manager has the overall responsibility for implementing this program and reports to the Vice President of Human Resources in matters relating to employee safety and health. All managers are responsible for implementing this program within their geographic or functional areas.
Responsibilities All executive, administrative, and managerial employees are responsible for the general administration of safety in their work areas and in jobs under their control. All supervisors are responsible for safety on a daily basis. They must ensure that all work is performed by qualified personnel, using the proper tools, and following all safety rules, policies, and guidelines. Each employee is responsible for knowing the basic rules and procedures set forth in this program
1-4 ADS Field Safety Manual
as well as the specific laws, rules, procedures, and safe practices that apply to his/her own job. Employees also are responsible for using good judgment and common sense on all jobs at all times during their employment with ADS.
The Safety Manager serves as ADS's representative in daily coordination of company safety activities. Unless such responsibility is assigned or delegated to someone else pursuant to this program, the Safety Manager is responsible for the following:
Knowing applicable safety and health laws and regulations and the appropriate means and methods for maintaining a safe and healthful workplace
Advising both management and employees when necessary or desired
Maintaining safety records, investigating accidents, and coordinating safety meetings
Monitoring safety practices through periodic site visits
Conducting safety training, when necessary
Interpreting safety rules
Arranging for on-the-job employee medical treatment when necessary
Specifying requirements for safety and protective equipment and tools
General Safety Procedures ADS personnel will perform all work in accordance with applicable federal, state, and local occupational safety and health regulations.
Employees shall not perform work for which they are not qualified. Any employee who has uncertainty regarding anything mentioned in this program, the safe methods and procedures for performing any task, or his/her individual qualification for any job assignment must inform their supervisor immediately. Questions or problems that cannot be satisfactorily answered or resolved between the supervisor and the employee shall be referred up the supervisory channel for investigation and resolution.
Every employee (including staff and supervisors) must report the following to his/her supervisor immediately:
Anything they believe may be an occupational safety or health hazard
Any injury or illness they think may be the result of working at ADS
Training All employees will receive the training necessary to perform their jobs in a safe manner and in compliance with applicable federal and state regulations. New employees and employees who receive new or different job assignments will receive the appropriate training prior to beginning work. The Safety Manager
Introduction 1-5
will assess the safety training needs of employees, coordinate the safety training, and maintain safety training records.
Safety training will conform to the requirements of the Code of Federal Regulations, Title 29 (OSHA), and other applicable federal and state regulations. Personnel also will receive appropriate training whenever any one of the following occur:
New substances, processes, procedures, or equipment are introduced to the workplace that produce a new hazard
A new or previously unrecognized hazard is disclosed
The statements, action, or conduct of any employee of the company demonstrates that additional training is necessary or desirable
Visitors to the field will participate in a Level 1 Field Safety Orientation. ADS will provide visitors with the appropriate personal protective equipment (PPE) for the site visit.
Compliance Working safely is a condition of employment at ADS. Employees must comply with all safety policies and procedures during daily work activities. Any employee displaying a willful disregard for his/her own safety or the safety of others or endangering the safety of coworkers intentionally or through negligence will be subject to immediate dismissal.
Except as noted above, when an employee fails to follow safety policies or procedures, the immediate supervisor or manager will determine the cause of the failure and take the appropriate action. Whenever possible, management's response to unsafe behavior will be corrective in nature rather than punitive.
If the failure to conform to safety policy occurred based on factors outside of the employee's control, the supervisor will take the appropriate action to correct the deficiency and prevent reoccurrence.
If the failure occurred through willful disregard on the part of the employee, the supervisor will take corrective action. This disciplinary action may involve a written reprimand, counseling (depending on the nature and/or frequency of the failure), suspension, or dismissal.
Communications It is company policy to effectively communicate applicable and required health and safety matters to our employees. This policy is carried out through training, meetings, voicemail communication, and the distribution and posting of written communications. All supervisors are responsible for communicating any information concerning relevant job hazards and all applicable health and safety requirements, precautions, and protective measures to each employee under their immediate control.
1-6 ADS Field Safety Manual
A safety meeting will be held weekly at all active field projects to permit employees to discuss health and safety concerns and receive necessary instruction and training.
ADS will prominently post the OSHA workplace poster Job Safety and Health Protection (or its country or state equivalent) at all times in permanent facilities and the annual summary of all recordable injuries and illnesses from February 1 to March 1 each year. We also will post, distribute, or provide other safety-related materials when required by law or in support of the Safety Program.
ADS will not discharge, discipline, or discriminate against in any manner any employee for reporting any hazardous condition or practice, reporting any occupational injury or illness, complaining of any occupational safety or health conditions, or exercising any legal right relating thereto. Employees may report hazardous conditions or practices or infractions of any provision of this Policy anonymously in any manner permitted by law or through an unsigned, written statement mailed or submitted to the Safety Manager or Executive Vice President.
We encourage each employee to submit any suggestions and recommendations for improving job safety and health conditions to your immediate supervisor or to the Safety Manager. Supervisors should recognize employees who consistently work safely and support the safety effort, and provide positive reinforcement for such behavior.
Hazard Identification and Abatement ADS will accomplish hazard identification by worksite analysis, assessment, review, and analysis of injury and illness reports as well as reports from employees and external customers.
The Safety Manager will conduct a worksite analysis to identify all existing hazards; all conditions, practices, and operations that create hazards; and all areas where hazards may develop. The manager will update the analysis as operations and/or processes change and review them at least once a year.
The Safety Manager or his designated representatives will conduct regular safety assessments of company facilities and operations. Local managers and supervisors will take appropriate action to correct any deficiencies found. The Safety Manager also will analyze injury and incident reports for occurrences or trends that identify new hazards or less than adequate procedures or equipment.
The supervisor responsible for the area, condition, equipment, substance, material, employee or process concerned will promptly investigate all reports of hazards or potential hazards. The supervisor will obtain additional assistance when necessary to identify the source or cause of the hazard or to effect appropriate corrective action.
The supervisor who discovers or becomes aware of an uncontrolled hazard will take immediate steps to either eliminate the hazard or remove employees (and all others) from the hazardous area. A hazard shall be considered uncontrolled if the
Introduction 1-7
nature and extent of the hazard or the lack of adequate procedures and protective equipment are such that serious injury or death could occur from continued exposure.
No employee, except those engaged in and properly trained and equipped in rescue and medical procedures or correcting the condition constituting the hazard, may enter or remain present in any place where a hazardous condition exists that is likely to cause death or serious physical harm. ADS will dismiss or reprimand employees who violate this safety policy according to the circumstances and gravity of the situation.
Injury and Incident Investigations The immediate supervisor of any employee who has sustained a work-related injury or illness will investigate the incident, take the appropriate recommend action, and report the incident to the Safety Manager. The Safety Manager will conduct a comprehensive investigation, when necessary, based on the nature or severity of the injury or illness or the circumstances of the incident.
Each investigation will involve executing any written reports, interviews, statements, and questionnaires ADS, this program, concerned insurance carriers, or local, state, or federal law or regulation may require.
Record Keeping The Safety Manager will document and maintain records of the following to comply with all applicable laws and regulations, establish and document accountability, and serve as useful references:
Steps taken to implement and administer the Safety Program
Work-related injuries and illnesses
Hazardous substances and conditions
Employee training and qualifications
Disciplinary actions
Investigations
Assessments
Other matters
The manager will keep records for a minimum of 3 years, unless otherwise required by applicable regulations.
1-8 ADS Field Safety Manual
Additional Programs The Safety Program covers general company occupational safety and health rules and policies. Additional work rules and separate programs may apply in particular situations and/or are required by regulations. ADS will add other programs or policies whenever required by applicable local, state, or federal law or regulation or when deemed necessary. All ADS employees must observe all additional rules and programs as implemented.
Blood Borne Pathogens and Control This policy applies to all employees to aid in their protection them from occupational exposure to blood borne pathogens and to ensure prompt medical assistance if exposure occurs. An exposure incident involves direct eye, mouth, mucous membrane, or non-intact skin contact with blood or other potentially infectious materials resulting from performing work activities.
Exposure Determination The potential for occupational exposure to blood borne pathogens exists in sewers at or immediately downstream of a medical or embalming facility. Exposure may occur when entering the sewer and/or when handling equipment that has been in contact with untreated wastewater at these sites. Any employee involved in operations involving discharge from these facilities is subject to exposure and must follow these procedures.
Protective Clothing Employees must wear the following when entering known or suspect sites:
Standard ADS protective clothing (including coveralls, hard hats, boots and rubber gloves; exam gloves may be worn for procedures that require tactile sensitivity and will not tear the glove)
Hooded coverall of TYVEK® QC or equivalent
Surgical type facemask and protective goggles
Hygiene Employees with unhealed facial cuts, sores, or abrasions must not enter subject manholes.
Introduction 1-9
Employees must wash their hands immediately (or as soon as feasible) after removing gloves or other personal protective equipment. Use cleaning and antiseptic towelettes as an interim measure until you can wash your hands with soap and water. All field project and service centers will provide handwashing facilities, and field crews will receive a supply of disposable cleaning and antiseptic towelettes for field use.
Employees must wash hands and any other skin surfaces with soap and water and/or flush mucous membranes with clean water immediately, or as soon as feasible, following contact with blood or other potentially infectious materials.
Decontamination, Disposal, and Laundering Personnel shall carry out decontamination immediately after work is complete (or as soon as feasible). They must thoroughly clean and rinse or wipe (with a disinfectant) durable equipment and protective equipment (such as boots). Articles of clothing must be machine-laundered separately from other clothing using hot water and bleach.
Personnel must place disposable coveralls and gloves in a plastic bag that is red or labeled "BIOHAZARD" for delivery to the appropriate facility for disposal. Disposal must occur in accordance with local regulations. Managers will coordinate disposal with the client or local medical facility.
Hepatitis B Vaccination ADS will offer all personnel whose job duties include entering sewer manholes and wet wells and/or handling equipment that has been in contact with untreated wastewater the hepatitis B virus (HBV) immunization, unless the individual has previously received the complete HBV vaccination series. Personnel who decline the immunization must sign the following declaration:
I understand that, due to my occupational exposure to blood or other potentially infectious materials, I may be at risk of acquiring a hepatitis B virus infection. I have been given the opportunity to be vaccinated with hepatitis B vaccine, at no charge to myself. However, I decline the hepatitis B vaccination at this time. I understand that by declining this vaccine, I continue to be at risk of acquiring hepatitis B, which is a serious disease. If in the future I continue to have occupational exposure to blood or other potentially infectious materials and I want to be vaccinated with hepatitis B vaccine, I can receive the vaccination series at no charge to me.
Post-Exposure Evaluation and Follow-Up Any employee who is occupationally exposed to blood or other potentially infectious material must notify their supervisor immediately. The supervisor then will notify the project, regional, and corporate Safety Manager.
1-10 ADS Field Safety Manual
The project manager will arrange for an immediate medical evaluation of the exposed employee. ADS will provide the following information to the healthcare professional conducting the evaluation:
Copy of the OSHA blood borne pathogen regulation
Description of the exposed employee's duties as they relate to the exposure incident
Documentation of the route(s) of exposure and circumstances under which exposure occurred
All medical records relevant to the appropriate treatment of the employee, including vaccination status (which are the employer's responsibility to maintain)
The project manager will contact the Human Resources and Safety departments to obtain documentation not available locally. The project, Safety, and Human Resources managers will coordinate all follow-up actions and communications to ensure that this process complies with the OSHA regulation.
Training All affected employees shall receive training prior to beginning their job duties and at least annually thereafter. Training records will be maintained by the Safety department.
Record Keeping The Human Resources manager shall ensure that the following information is made part of the medical record of an employee who has had an occupational exposure:
Copy of the employee's hepatitis B vaccination status including the dates of all the hepatitis B vaccinations and any medical records relative to the employee's ability to receive vaccination
Copy of all results of examinations, medical testing, and follow-up procedures
Employer's copy of the healthcare professional's written opinion
Copy of the information provided to the healthcare professional
Hearing Conservation It is the policy of ADS Corporation that employees receive protection from the harmful effects of excessive noise in the workplace. The policy and program elements comply with Title 29, Code of Federal Regulations, Part 1910.95.
Introduction 1-11
The Safety Manager is responsible for overall administration of this policy, including investigation of suspected high-noise processes, area and employees monitoring, and coordination of audiometric testing and training.
Regional Managers are responsible for compliance with this program within each region/division. Managers and supervisors at all levels will ensure that their employees comply with the requirements of this program. All employees are responsible for wearing hearing protectors, where and when required.
Monitoring Whenever it is suspected that a work process involves exposure to noise levels above the OSHA action level (8-hour time-weighted average of 85 decibels or greater), ADS will conduct both area and employee noise monitoring to determine the level of exposure. If exposure is at or above the action level, the requirements of this policy will apply to all employees involved in that work process. Follow-up monitoring will occur any time that equipment or procedure changes indicate a possible change in noise exposure.
Audiometric Testing All employees exposed to noise hazards will undergo initial baseline audiometric testing, and subsequent audiometric tests yearly. ADS will maintain the test results on file and provide a copy to the employee.
Hearing Protectors All field employees will receive disposable hearing protectors based on the noise levels encountered, Noise Reduction Rating (NRR) requirements, and comfort. Employees exposed to noise hazards will receive hearing protectors with a NRR sufficient to reduce the exposure to an acceptable level.
Training All employees exposed to noise hazards will receive annual training in hearing conservation. Specific training elements will include the following:
Effects of noise on hearing
Purpose, advantages, disadvantages, and attenuation of various hearing protectors
Selection, fitting, and care of hearing protectors
Purpose and procedures for audiometric testing
1-12 ADS Field Safety Manual
Confined Space Entry This policy establishes the basic operational requirements for conducting confined space entry operations that meet or exceed the requirements promulgated by OSHA and Cal-OSHA. For the purpose of this policy, a confined space is a space or area that exhibits the following characteristics:
It is large enough and configured in such a way that an employee can bodily enter and perform assigned work.
It has a limited or restricted means for entry or exit.
It is not designed for continuous occupancy.
Confined spaces include sanitary, storm, or combined collection systems; all lines (whether active or not), manholes, and pump station wet wells. When any doubt exists, employees will treat a worksite as a confined space. Entry means the action by which a person passes through an opening into a confined space. Entry includes ensuing work activities in that space and occurs as soon as any part of the entrant's body breaks the plane of an opening into the space.
Crew Size At least two people are required for a confined space entry. At least one attendant must be present at all times. The number of attendants necessary for multiple entrants will depend on the configuration of the confined space, the nature of work to be performed, and the communications equipment available. Normally, every two entrants require three attendants.
Crew Member Duties Entry Supervisor The senior person on a crew serves as the entry
supervisor and has overall responsibility for worksite safety. The entry supervisor also may be an authorized entrant or attendant. The entry supervisor shall be responsible for the following:
Determining the hazards that may exist during a specific entry, including information on the mode, signs or symptoms, and consequences of exposure to specific hazards
Ensuring that the crew has conducted atmospheric tests prior to entry and continuously while the confined space is occupied
Ensuring that all procedures and equipment required for safe entry are in place before certifying the space as safe for entry
Ensuring that the confined space entry log is properly filled out
Verifying that rescue services are available and that communication devices are operable
Certifying on the entry log that the space is safe for entry
Introduction 1-13
Authorized Entrant The employee entering the confined space serves as the entrant and shall be responsible for the following:
Knowing the hazards that may exist during entry
Properly using equipment as required by the Field Safety Manual and Entry Supervisor
Communicating with the attendant as necessary to enable the attendant to monitor entrant status
Alerting the attendant whenever the entrant recognizes any warning sign or symptom of exposure to a dangerous situation
Exiting from the permit space as quickly as possible whenever any of the following occurs:
− An order to evacuate is given by the attendant or the entry supervisor.
− The entrant recognizes any warning sign or symptom of exposure to a dangerous situation.
− An evacuation alarm is activated.
Attendant At least one attendant shall be present outside the confined space at all times during entry. The attendant shall be responsible for the following:
Knowing the hazards that may exist during entry
Detecting possible behavioral reactions the entrant may exhibit if exposed to hazards
Remaining outside the permit space during entry operations until relieved by another attendant
Monitoring activities inside and outside the space to determine whether it is safe for the entrant to remain in the space
Communicating with the entrant as necessary to monitor entrant status and to alert the entrant of the need to evacuate the space, when necessary
Performing non-entry retrieval as specified in the Field Safety Manual, when necessary
Summoning rescue and other emergency services as soon as the attendant determines that the entrant may need assistance to escape from the confined space or require medical attention
Warning unauthorized persons away from the confined space
Avoiding duties that might interfere with the attendant's primary duty to monitor and protect the authorized entrant
1-14 ADS Field Safety Manual
Ordering the entrant to evacuate the permit space immediately under any of the following conditions:
− The attendant detects the behavioral effects of hazard exposure in an entrant.
− The attendant detects a condition that could endanger the entrant.
− The attendant cannot effectively and safely perform all the duties required by this policy.
Atmospheric Monitoring Personnel must test confined spaces for oxygen deficiency and flammable and toxic gases prior to entry and continuously throughout occupancy. Using lead acetate paper and/or ventilation alone is not sufficient. Personnel must check gas meters for proper calibration at the interval recommended by the manufacturer and maintain calibration records with the instrument.
Retrieval System No employee will descend a vertical confined space or any vertical portion of any other confined space without an attached retrieval system. In confined spaces where horizontal movement is required and the risk of engulfment or being swept away exists, entrants will be belayed to a fixed object or cable system.
Personal Protection Equipment All personnel working at a confined space entry site will wear steel-toed safety shoes/boots, hardhats, and safety glasses. In addition, when performing work on or adjacent to a roadway, all personnel must wear approved traffic vests.
Confined Space Entry Log The confined space entry log must be maintained for any day in which a crew performs any confined space entries. The crew must maintain completed logs with project records for a period of 1 year and make them available for inspection.
Communications Worksite Continuous communications must be maintained with
confined space entrants at all times. This communication may occur in the form of visual line of sight, a sound-powered device, or electronic communications equipment.
Off-Site Each production crew must be able to summon rescue and/or emergency medical services to the worksite. Regional and project managers must ensure that appropriate equipment and communications procedures are in place at the start of each project. Project managers will
Introduction 1-15
include coordination with local rescue/EMS providers in determining appropriate communications procedures.
Field Safety Certification All personnel must receive field safety certification equivalent to the level required to safely and successfully accomplish their specific job duties. At a minimum, each worker must have Level 1 certification. Certification primarily involves hands-on training to demonstrate the proficiency required to receive final certification. Some levels of certification may require video-based and classroom training. Refer to Work Instruction SAF-13 for a detailed explanation of the certification process.
Personal Protective Equipment This policy requires that all personnel performing work with the potential for personal injury wear personal protective equipment (PPE). ADS will provide this equipment to all permanent employees at no cost to the employee. Temporary employees must receive PPE from their perspective agencies, and contract laborers must provide their own safety footwear. ADS will provide additional PPE to contract laborers as required.
All personnel must wear the following PPE:
Gloves Personnel must wear appropriate gloves at all times when working in a manhole; operating power tools; using knives, punches, or saws; handling equipment and ropes; and doing any work that may result in a hand injury.
Footwear Personnel must wear steel-toe footwear at all times at all worksites and in facility work areas. ADS will reimburse permanent employees up to $75 annually for the cost of approved safety footwear.
Eyewear Personnel must wear approved safety glasses at all times at all worksites and project work areas. These glasses must be worn when operating any power equipment, moving through wooded areas and heavy undergrowth, and performing any work that could result in an eye injury. Personnel must wear safety goggles when performing any task involving a potential splash hazard from wastewater or other liquids.
Hardhats Personnel must wear hardhats at all times at all worksites and project work areas.
Masks Personnel must wear surgical masks to protect the nose and mouth anytime wastewater from a drop connection, flow conditions, or the work environment presents a potential splash hazard.
1-16 ADS Field Safety Manual
Traffic Vests Personnel must wear approved traffic vests at all worksites located within or immediately adjacent to an active roadway or parking area.
ADS will provide other required PPE, such as respiratory protection and special clothing, for personnel when necessary.
!
Warning: All personnel who fail to wear the required PPE will be subject to disciplinary action.
Electrical Safety ADS Electronic Service Technicians should perform service calls (troubleshooting and component replacement) whenever possible. However, these technicians may not always be available to handle a service call from the field. When a technician is not available, a field crew may be dispatched. Crew selection should occur based on of their knowledge of electrical safety, AC-powered monitors in general, and the monitor to receive service. A technician must be available to provide guidance to the crew performing the service call.
All technicians and crews performing 4500/5500 service must read this policy and have it available for reference while performing the service. Following this policy minimizes the risks to people who service monitors.
Troubleshooting All personnel performing troubleshooting service on a monitor should adhere to the following guidelines and procedures:
Be extremely careful of the energized circuits when working with the monitor.
Have sufficient light to work safely.
Remove all jewelry, watches, etc.
Always wear rubber boots or rubber-soled work shoes for insulation, especially in wet locations.
Check the volt meter for any damage. Do not use a cracked or otherwise damaged meter.
Keep hands and tools clear of the monitor (use the volt meter probes only).
Use the volt meter to locate all energized AC circuits. Check all terminal strips, power supplies, and DIO board (if present). Know the location of the hazardous area.
If you have any questions or doubts, call a technician.
Introduction 1-17
Component Replacement All personnel performing component replacement service on a monitor should follow these procedures.
If a monitor break switch is present, turn it off (open).
Check all terminal strips and power supplies to make sure internal AC circuits are de-energized.
Check the incoming power. Have the client de-energize and lockout the power to the monitor. Make sure that the power is locked out and cannot be re-energized until the service is complete.
If a DIO board is present, some incoming data lines may carry AC current. You cannot de-energize these circuits by shutting off the monitor’s breaker switch. Have the client de-energize and lockout these incoming AC data lines.
Recheck all AC circuits and proceed with component replacement.
If you have any questions or doubts, call a technician.
Supplied Air Respirators This policy defines the atmospheric requirements for confined space entry (CSE) when using a Supplied Air Respirator (SAR). It applies to all ADS employees involved in CSE operations.
Under the following conditions, an ADS employee may wear a SAR to enter a confined space where Hydrogen Sulfide (H2S) and/or an Oxygen (O2) deficiency exists:
Explosive (flammable) gas has not been detected. ADS employees may not enter a confined space where explosive gas is present under any circumstances!
Ventilation has not eliminated the H2S and/or O2 deficiency or is not possible due to the depth, internal volume, or configuration of the confined space.
Entry cannot be postponed until conditions improve, or conditions are not likely to improve.
Entry has been approved by the project or operations manager.
The following operational requirements must be met prior to entry:
The individual must have received Field Safety Certification, received SAR training, and passed a field physical examination (which includes a Pulmonary Function test) within the last 3 years.

1-18 ADS Field Safety Manual
ADS SAR equipment must be available on-site and fully operational. The Safety Manager must approve the use of client or rental equipment (other than air tanks).
An additional Field Assistant must be available on site to tend the airline and monitor the air supply.
No other uncontrolled hazards or conditions that could endanger the entrant may exist.
ADS gives the entrant the final decision on whether or not it is safe to enter the confined space.
Driver Safety This policy exists to ensure that any ADS Corporation employee operating a company-owned or leased vehicle (on a continual or daily operational basis) possesses a valid license, completes an approved defensive driving course, and maintains an acceptable driving record. Some vehicles may require a commercial driver's license.
Driver Training All drivers must complete an approved 4-hour defensive driving course under the following circumstances:
Within 30 days of receiving a work assignment that will involve operating a company vehicle
Every 2 years within 90 days of the previous course anniversary date
Following a vehicle incident (as identified under Categories of Violations)
Note: The driver must successfully complete a remedial defensive driving course, offered by most municipalities, within 30 days of a driving incident. The project will cover all costs associated with the course. However, the driver must provide ADS proof of satisfactory completion of the course.
Motor Vehicle Records (MVRs) All drivers must give ADS authorization to obtain a copy of their MVRs for the following required driving record reviews:
Initial and annual reviews
Post-incident review where an ADS vehicle is involved
Driver probation review prior to lifting probation
Introduction 1-19
Driving Violations and Privileges Committing one of the following violations in the preceding 36 months may result in termination or re-assignment to a non-driving position (if available and employee meets qualifications):
One Type A violation
Two Type B violations
Three Type C violations
One Type B and two Type C violations
Note: ADS also reserves the right to rescind an offer for employment to an individual following a post-offer driving record investigation that reveals one of these violations.
ADS may place an individual under probation and require attendance at a remedial defensive driving course for committing one of the following violations in the preceding 36 months:
One Type B violation
Two Type C violations
Categories of Violations Type A This type of violation includes, but is not limited to, convictions
for DWI/DUI/ OWI/OUI; refusing a substance test; vehicular manslaughter or homicide; hit and run; reckless driving; drag racing; eluding the police; speeding in excess of 20 mph over the speed limit; or license suspension/revocation.
Type B This type of violation includes, but is not limited to, any vehicle incident in which a company owned or leased vehicle is involved in a collision with another vehicle or object. However, the following conditions do not constitute a vehicle incident:
Accident in which a vehicle is struck while legally parked and unattended or stopped in a properly controlled worksite during operations
Collision in which the ADS vehicle is struck from behind and the ADS driver does not receive a moving violation
Collision in which the police report cites the other (non-ADS) driver for the moving violation or charges the accident to the other driver
Type C This type of violation includes all moving violations that do not fall under the classification of Type A and B violations.
1-20 ADS Field Safety Manual
Hazard Communication It is the policy of ADS Corporation to maintain the safest possible work environment for all employees and to eliminate illness and/or injury caused by hazards in the workplace. The Hazard Communication policy is intended to make ADS employees aware of chemical hazards that exist in their workplace and the appropriate precautions to take when handling/using these products. This policy conforms with the requirements of the OSHA Hazard Communication Standard (29CFR1910.1200).
Hazards ADS field operations require personnel to use several chemical products. Although we neither store nor use any of these chemicals in bulk form, they do represent a hazard to employees and could cause illness or injury if adequate precautions are not taken.
Hazard Identification The program binder contains a list of hazardous chemicals used in the workplace as well as a Material Safety Data Sheets (MSDSs) for each hazardous chemical. ADS Corporation uses MSDSs, as supplied by the chemical manufacturer or vendor, for identification of chemical hazards. The Safety Manager will ensure that the hazardous chemicals list is updated as necessary; the project manager will ensure that the MSDS are updated as necessary.
Labels Project Managers should ensure that incoming chemical containers have been labeled by the manufacturer or vendor. Managers should return containers that are not properly labeled to the manufacturer or vendor. At a minimum, these labels should contain the following:
Identity of hazardous chemicals in the container
Appropriate hazard warnings
Name and address of the manufacturer
Portable/temporary containers used for any hazardous chemical will be labeled with the above information, unless all of the following conditions are exist:
Contents are for immediate and short-term use.
User controls the container and does not leave it unattended.
User properly disposes or safely cleans and stores the container immediately after use.
Introduction 1-21
Employee Notification Each regional or long-term project office will conspicuously display a sign informing employees of the location and availability of the company's written Hazard Communication Program, the hazardous chemicals list, and the MSDS for hazardous chemicals.
Employee Training All existing and new field employees will receive appropriate hazardous chemical training. This training will cover the following topics, at a minimum:
Requirements of the OSHA standard (29CFR1910.1200)
Identity of operations in the workplace where hazardous chemicals exist
Physical and health hazards of the chemicals in the workplace
Methods and observations for detecting the presence or release of hazardous chemicals in the workplace
Measures the employees can take to protect themselves from chemical hazards, including specific measures the company employs to protect employees from exposure to hazardous chemicals
Details of the Hazard Communication Program, including an explanation of labeling, MSDSs, and their use
Location and availability of the written program, list(s) of hazardous chemicals, and MSDSs
In addition, managers and supervisors will ensure that any employee using a particular hazardous chemical during routine work has received specific instructions on proper handling and use of the chemical, as well as any specific cautions and requirements for protective clothing and/or equipment.
Training Records Employees must sign a training record sheet provided and maintained by the Safety Manager.
Non-Routine Operations Prior to beginning any non-routine operation involving a hazardous chemical, supervisors will ensure that the employees are aware of associated hazards and required precautions. Employees are not allowed to commence any non-routine operation without the approval of their immediate supervisor.
Contractors and Visitors Contractors who will be performing work in any area where hazardous chemicals are present should be advised of related hazards and any required precautionary

1-22 ADS Field Safety Manual
measures. They should receive copies of appropriate MSDSs. They will be responsible for informing and training their own employees.
Contractors who will introduce any hazardous chemical into a work area must inform the ADS supervisor about the hazards associated with the chemical. The ADS supervisor will consult with the Safety Manager to determine the appropriate action to be taken.
Prior to entering any area where hazardous chemicals are present, ADS will advise visitors of the hazards present, communicate related precautionary measures, and provide any necessary protective clothing/equipment.
Introduction 1-23
The 10 Field Safety Commandments 1. Always test the atmosphere before and during any confined space entry. If
the test is positive, do not enter the confined space without ventilating the space until clear or wearing proper respiratory protection. If any gas alarm sounds while in a confined space, evacuate the space immediately.
2. Never descend a manhole without a properly rigged retrieval line, seat harness, and chest harness.
3. Unless in an approved and special situation, always have three people above ground when two descend the manhole.
4. Never descend a large (over 72-inch) combined or storm sewer during or immediately after a rain event. Obtain permission from the regional office prior to descending 36- to 72-inch storm or combined sewers during or immediately after a rain event.
5. Never perform any work on a road or street without proper traffic control.
6. Always have the equipment (radio or cellular phone) and phone number(s) necessary to summon rescue and/or emergency medical personnel available.
7. Wear steel-toed boots, hardhats, and safety glasses at all worksites at all times. Wear gloves while in the manhole, operating power tools, using sharp objects, and handling equipment or ropes. Wear safety vests (or orange safety shirts/coveralls) at all worksites located on or immediately adjacent to a roadway or parking area. Always wear a seatbelt when driving.
8. Always inspect your safety equipment at the beginning and end of each day. Always inspect your vehicle at the beginning of each day. Maintain your safety equipment properly and replace faulty equipment immediately. Tag faulty equipment appropriately to prevent future use.
9. Always report any injury to the main office as soon as possible. In addition, report accidents to the police and to the main office immediately.
10. Never work under the influence of drugs (prescription or otherwise) or alcohol.

2-1
C H A P T E R 2
Safe Work Practices
While the previous chapter focused primarily on the need for safety in field work and ADS’s basic program and policies, this chapter covers the practical aspect of working safely in the field. Safe work practices are procedures that assist you in performing your job safely.
Keep in mind that the field work environment changes from day to day. No two manholes are the same. Just following procedures and policies will not ensure safety at work; you must stay constantly alert for hazards on the street, at the worksite, and in the manhole. Remember, your life may depend on it.
2-2 ADS Field Safety Manual
Getting Started The time to start thinking about safety is long before your field work begins. Safety should be a constant concern that is applied in pre-project planning and before field work starts every day.
Standard Preparation and Procedures All supervisors are responsible for safety on a daily basis. They must ensure that all work is carried out only by qualified personnel using the proper tools and following all safety procedures, policies, and guidelines.
You are responsible for knowing the basic rules and procedures outlined in the safety policies (Chapter 1, Introduction) as well as the specific laws, rules, procedures, and safe practices that apply directly to your job. You must use good judgment and common sense on all jobs at all times while working for ADS.
Complete the following procedures before starting work each day:
Check your safety equipment. Make sure you have all the required safety equipment and that it is in good working order.
Perform all vehicle safety checks before leaving the field office.
Make sure you have a radio or cellular phone. You must be able to contact the project office and/or emergency medical services (EMS) in an emergency.
Post a safety card in the van that contains procedures and numbers for contacting the office and EMS.
Check the weather forecast for when you will be in the field. Weather may significantly impact your work as well as the equipment you will need to accomplish the day's task.
Complete the top portion of the confined space entry log for any day that may involve manhole or other confined space entry.
Check the calibration of your gas meter. The calibration interval varies depending on the type of instrument you are using. Check with your supervisor if you are unfamiliar with the process for calibrating your gas meter.
Safe Work Practices 2-3
Check for special safety instructions. Certain worksites require special safety procedures. Such sites may have a Safety Supplement Sheet accompanying the normal site sheet. The project supervisor may have other safety instructions.
Make sure the crew chief briefs any new crew members on emergency procedures.
Crew Requirements Never enter a manhole or underground structure, regardless of how shallow or innocent looking, without an attendant present.
Each attendant (also known as a field assistant) must be trained in safety and emergency procedures and pass a strength test prior to performing work. The strength test consists of retrieving, unassisted, a coworker of average weight from a manhole that is at least 15 feet deep.
The following situations require more than one attendant:
Any time local regulations call for two attendants for each entry worker
Any time more than one worker enters the manhole or underground structure, if not already specified by local regulations (the general rule is three attendants for every two entry workers)
Any traffic situation requiring more than one flagger
Any situation where one attendant may be unable to pull the entry worker to safety and a lifting device (such a tripod) is not an option
Any time the job requires special attention to equipment and material around the manhole, such as tending compressors and keeping cables untangled, forcing the attendant to leave the entry worker more than momentarily unattended
The Attendant's Duties
The attendant’s primary duty is to monitor and assist the manhole worker. If an emergency occurs in the manhole, the attendant and the retrieval system attached to the manhole worker may be the last chance for rescue. The attendant attention must never be absent from the manhole. Nothing is more important than the safety of the manhole worker during descent, work in the manhole, and ascent. The attendant should perform the following duties during manhole work:
Watch the work below and look for clues that the manhole worker could be in trouble (i.e., falling, slipping, or other clumsy movements).
2-4 ADS Field Safety Manual
Be aware of any hazards particular to the site and their possible effect on the manhole worker and yourself.
Stay on site. Never leave the worksite or enter the manhole for any reason unless another attendant is present.
Periodically check on the manhole worker's condition – calling down, "Are you all right?" Make sure you receive an answer with a nod or a wave. In some cases, you may need to use communication equipment to monitor the entrant.
Unless you are using communications equipment, do not let the manhole worker disappear from your sight for more than a moment in lines where they can move into the pipe. Periodically check on their condition by calling them back into sight.
Keep the safety rope, blower hose, and other lines running into the manhole untangled. The attendant should change position or have the manhole worker stop to untangle lines so that nothing will foul in an emergency.
Be prepared at any time to take the manhole worker's full weight and pull the worker up if the worker becomes unconscious, slips, and falls into the sewer line; the air blower quits; or any other emergencies arise.
Order the entrant to evacuate the manhole immediately if any of the following occur:
Gas meter alarm goes off.
Entry worker appears to be in trouble or does not answer your call.
You detect a hazard that could endanger them.
Something happens that prevents you from performing your duties.
Call for rescue and other emergency services as soon as you determine that the entrant may need assistance to escape from the confined space or requires medical attention.
Warn unauthorized persons away from the manhole.
Do not perform any work that might interfere with your primary duty – to monitor and protect the entrant.
Monitor the traffic control equipment in use at the site. If any equipment setup becomes displaced (e.g., a vehicle knocks a cone over), immediately call the entrant worker to the surface and set up traffic control again.
Safe Work Practices 2-5
Standard Required Equipment
Certain equipment is required regardless of the job type or location. Make sure all the following required equipment is in your personal working inventory and in usable condition:
Van Equipment Includes a safety cage, seatbelts, third seat (with seatbelt bolted in place), flashing or rotating roof beacon, fire extinguisher, and first aid kit
Traffic Control Equipment Includes a minimum of 18 cones, folding Road Work Ahead or Men Working warning signs, 8 warning flags (3 for each sign and 1 for each of 2 flaggers), traffic paddles, and reflective cone collars for night work
Personal Safety Gear Includes hardhats for yourself and all coworkers, steel-toed boots for yourself and coworkers, orange jump suits and traffic vests for everyone on the crew, gloves, approved safety goggles, surgical masks, gas meter, air blower, safety rope, sit and chest harnesses for yourself and coworker, Grigri™ device, 4 ascenders, 8 carabiniers, figure-8 device, hearing protection, manhole cover opening tools, and a lantern/flashlight
Note: Hardhats, steel-toed boots, and safety glasses must be worn at all worksites and project work areas at all times.
All this equipment must be in your work vehicle. While ADS is responsible to provide the equipment, it is your responsibility to check the equipment and restock any missing equipment before beginning work each day. It also is your responsibility to properly maintain this equipment.
Special Safety Equipment In addition to the standard equipment listed above, special circumstances may require additional or different safety equipment. All personnel are responsible for verifying they have the proper special safety equipment needed before departing for the job site. Situations requiring special equipment may include the following:
Special local confined space safety or traffic control regulations, such as requirements for more or different kinds of traffic signs or barriers, crew size regulations, or special gas testing and ventilating procedures
Vehicles, such as big rig cleaners, which fall under DOT regulations (these require an up-to-date log book and must include three reflective triangles in case of a breakdown)
2-6 ADS Field Safety Manual
Deep lines (these require longer ropes, additional lighting, extended ventilator hoses or a supplied air respirator (SAR), additional crew and/or lifting equipment, and, possibly, communication devices)
Gas sites where positive gas readings have been recorded (these may require personnel to use a supplied air respirator (SAR) or additional ventilation)
Night work (these may require additional above and below ground lighting, reflective vests for attendants, reflective cone collars, and, possibly, lights for inside of cones)
Drop connections or other wastewater sources that could create splashing, spray, or misting (these require personnel to wear surgical masks to avoid possible ingestion)
Safe Work Practices 2-7
Traffic Control Although work in a manhole has many hazards, working on roads with traffic presents the most immediate and frequent danger. Always be aware that a seemingly safe traffic situation can change almost instantly. ADS's basic approach to traffic is simple:
Never set up in traffic if you are not sure what to do, do not have the proper control devices, or feel it remains overly hazardous even with your best traffic control efforts.
Always give the traffic plenty of warning.
Always make sure the traffic clearly understands any detours or diversions you create.
Never create additional hazards with your traffic control measures.
This section presents general, practical guidelines for traffic safety. These never override local or state traffic control regulations that may apply to a specific traffic situation. Always be aware of local or special regulations. Whenever possible, keep a copy of these local regulations in your van. When necessary, ask your supervisor for guidance. For the San Diego flow monitoring project, the California WATCH Manual shall be used as the primary guideline for traffic control.
Evaluating Traffic You should evaluate traffic conditions first to determine how many crew members and what type of equipment are appropriate. This evaluation will help you determine whether you may need additional equipment or personnel (i.e., cones, specialized signs, flaggers), subcontractor traffic or police control, a state permit, or further advice/information from a person with more experience.
Consider the following questions to help you evaluate traffic:
What is the traffic speed and lane configuration?
Does a line-of-sight exist for through traffic? Are side streets and driveways present?
What are the weather and road conditions?
What is the best time of day (or night) to set up?
Does the site fall under the jurisdiction of the state highway department?
Do any control measures already exist?
2-8 ADS Field Safety Manual
Note: Most states require a work permit when setting up traffic control on state roads and interstate highways. Contact your state highway department for permits and more information.
Setting Up Control in Traffic The most dangerous time for workers in the roadway is when they first stop the truck and walk in the roadway to setup signs and cones. Therefore, be very careful during setup.
Warning Flashers, Beacons, and Lights Always use your warning beacons and four-way flashers when working in the roadway. Turn on flashers, beacons, and lights before positioning the van in traffic. Do not attempt to control traffic without warning lights, even when no traffic exists and your stop is very brief.
In daylight, keep your headlights on as an additional warning to oncoming drivers. At night, you may use headlights for warning and to illuminate a work area, but never use your high beams.
!
Warning: At night, high beams can blind oncoming drivers and keep them from seeing reflective cones and vests.
Drive Deliberately Do not make sudden stops, turns, or U-turns in traffic. Never back up to return to a manhole you have already passed. Turn around and take another pass at the position you want.
One of the most frequent vehicle incidents involves backing into another vehicle or object. Always use a ground guide when backing up because production vehicles have large blind spots and can be difficult to maneuver, especially in tight spots. Incidents that usually occur when backing up are preventable by following these guidelines:
Try to avoid situations that require backing the vehicle. Never back up at an intersection or when you have driven past a site.
When another person is with you, have them act as a ground guide for you. Have the person get out of the vehicle and stand off to one side in order to direct you. Agree on hand or voice signals ahead of time. Never allow anyone to stand directly behind your vehicle while backing.
When alone, try to chose parking spots that do not require backing up, if at all possible. However, it is sometimes easier to back into a space than out of it. If you must back into a space, move slowly. If it is a tight space and
Safe Work Practices 2-9
you are not sure whether your vehicle will fit, get out of the vehicle and check the space.
Priorities Traffic control priorities are, in order of importance, warning lights, signs, flaggers (if required), and cones. Once these are in place, take a moment to observe whether the controls are effective. Only then should you begin unloading equipment, doing paperwork, and other tasks.
Never Turn Your Back On Traffic When walking in a roadway either setting up or taking down traffic controls, walk with your face to the oncoming traffic. If you must turn your back, have a coworker watch oncoming traffic for you.
NEVER turn your back on traffic!
Test Your Setup In heavy or dangerous traffic, park your van at the side of the road. Set up traffic control signs and cones first. Check to see whether traffic has adapted to the control, and modify controls to improve safety, when necessary. Only then should you drive the van into the controlled area and position it for work.
Speed Is Essential Once committed to parking your vehicle in traffic, get the traffic controls in place as quickly as possible. Follow these guidelines:
Make sure every crew member is already wearing a hardhat, orange coveralls, a safety vest, steel-toed boots, and safety glasses. At night, all crew members must wear reflective road vests.
Before driving to position the van, review the control priorities and who will be responsible for which controls.
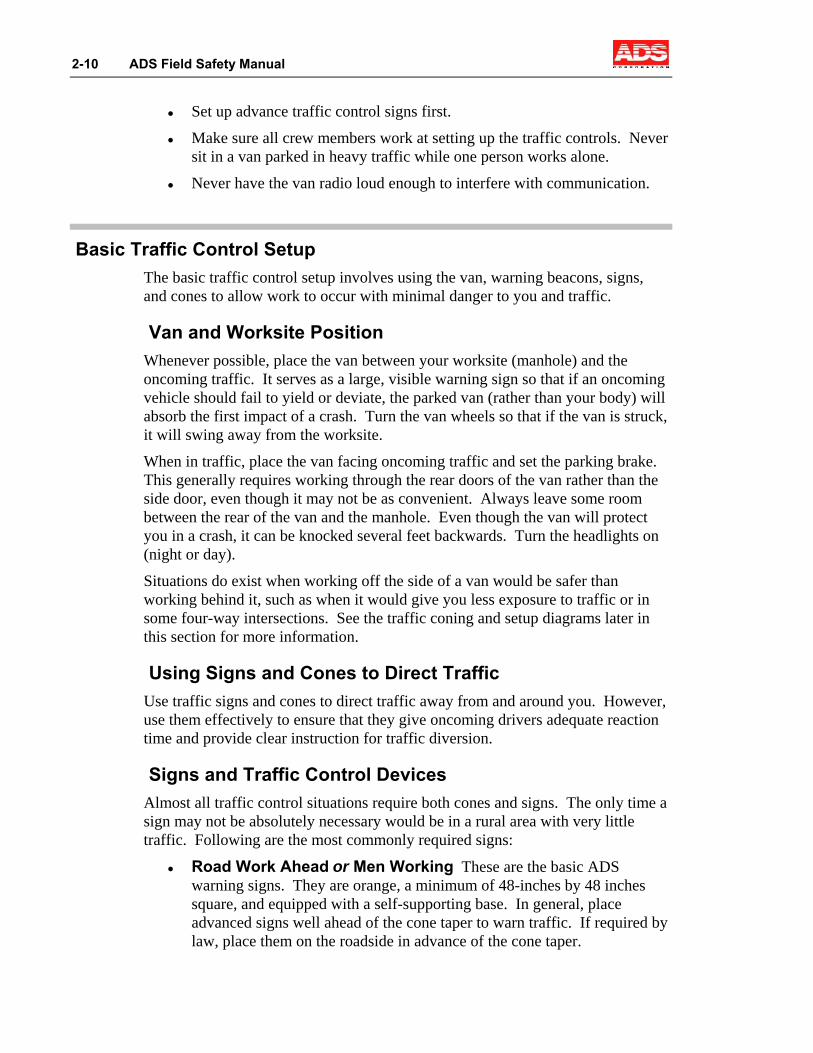
2-10 ADS Field Safety Manual
Set up advance traffic control signs first.
Make sure all crew members work at setting up the traffic controls. Never sit in a van parked in heavy traffic while one person works alone.
Never have the van radio loud enough to interfere with communication.
Basic Traffic Control Setup
The basic traffic control setup involves using the van, warning beacons, signs, and cones to allow work to occur with minimal danger to you and traffic.
Van and Worksite Position Whenever possible, place the van between your worksite (manhole) and the oncoming traffic. It serves as a large, visible warning sign so that if an oncoming vehicle should fail to yield or deviate, the parked van (rather than your body) will absorb the first impact of a crash. Turn the van wheels so that if the van is struck, it will swing away from the worksite.
When in traffic, place the van facing oncoming traffic and set the parking brake. This generally requires working through the rear doors of the van rather than the side door, even though it may not be as convenient. Always leave some room between the rear of the van and the manhole. Even though the van will protect you in a crash, it can be knocked several feet backwards. Turn the headlights on (night or day).
Situations do exist when working off the side of a van would be safer than working behind it, such as when it would give you less exposure to traffic or in some four-way intersections. See the traffic coning and setup diagrams later in this section for more information.
Using Signs and Cones to Direct Traffic Use traffic signs and cones to direct traffic away from and around you. However, use them effectively to ensure that they give oncoming drivers adequate reaction time and provide clear instruction for traffic diversion.
Signs and Traffic Control Devices Almost all traffic control situations require both cones and signs. The only time a sign may not be absolutely necessary would be in a rural area with very little traffic. Following are the most commonly required signs:
Road Work Ahead or Men Working These are the basic ADS warning signs. They are orange, a minimum of 48-inches by 48 inches square, and equipped with a self-supporting base. In general, place advanced signs well ahead of the cone taper to warn traffic. If required by law, place them on the roadside in advance of the cone taper.
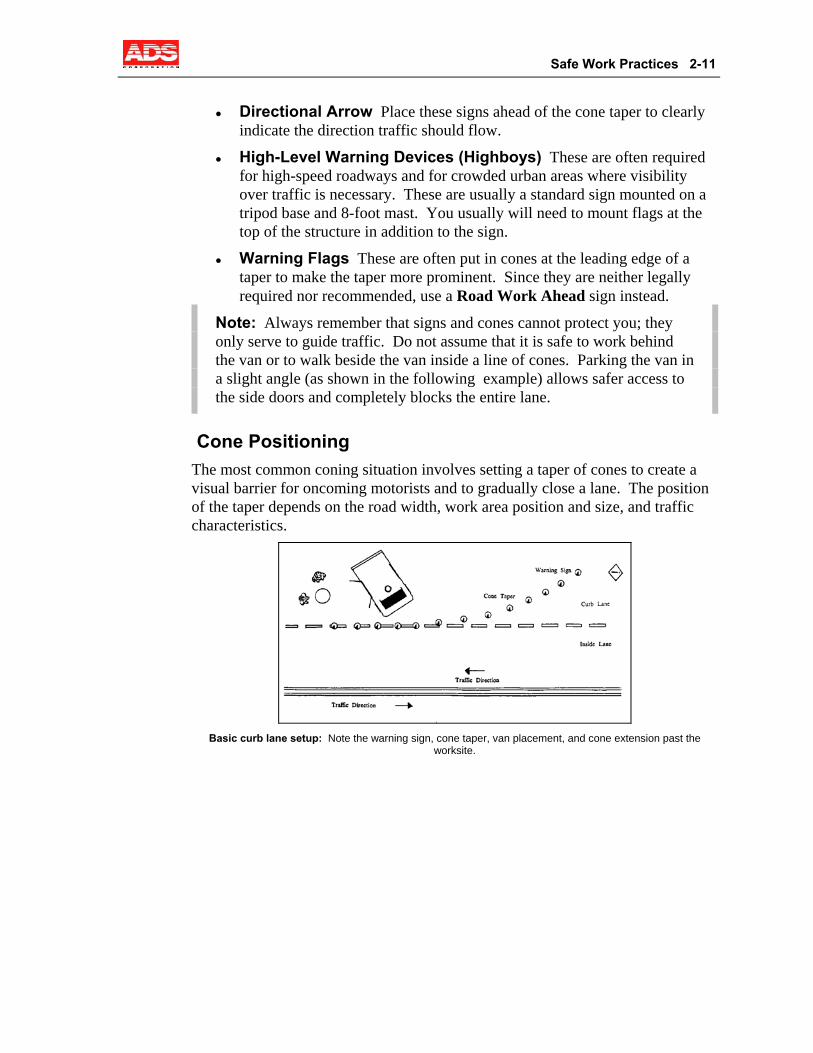
Safe Work Practices 2-11
Directional Arrow Place these signs ahead of the cone taper to clearly indicate the direction traffic should flow.
High-Level Warning Devices (Highboys) These are often required for high-speed roadways and for crowded urban areas where visibility over traffic is necessary. These are usually a standard sign mounted on a tripod base and 8-foot mast. You usually will need to mount flags at the top of the structure in addition to the sign.
Warning Flags These are often put in cones at the leading edge of a taper to make the taper more prominent. Since they are neither legally required nor recommended, use a Road Work Ahead sign instead.
Note: Always remember that signs and cones cannot protect you; they only serve to guide traffic. Do not assume that it is safe to work behind the van or to walk beside the van inside a line of cones. Parking the van in a slight angle (as shown in the following example) allows safer access to the side doors and completely blocks the entire lane.
Cone Positioning The most common coning situation involves setting a taper of cones to create a visual barrier for oncoming motorists and to gradually close a lane. The position of the taper depends on the road width, work area position and size, and traffic characteristics.
Basic curb lane setup: Note the warning sign, cone taper, van placement, and cone extension past the
worksite.
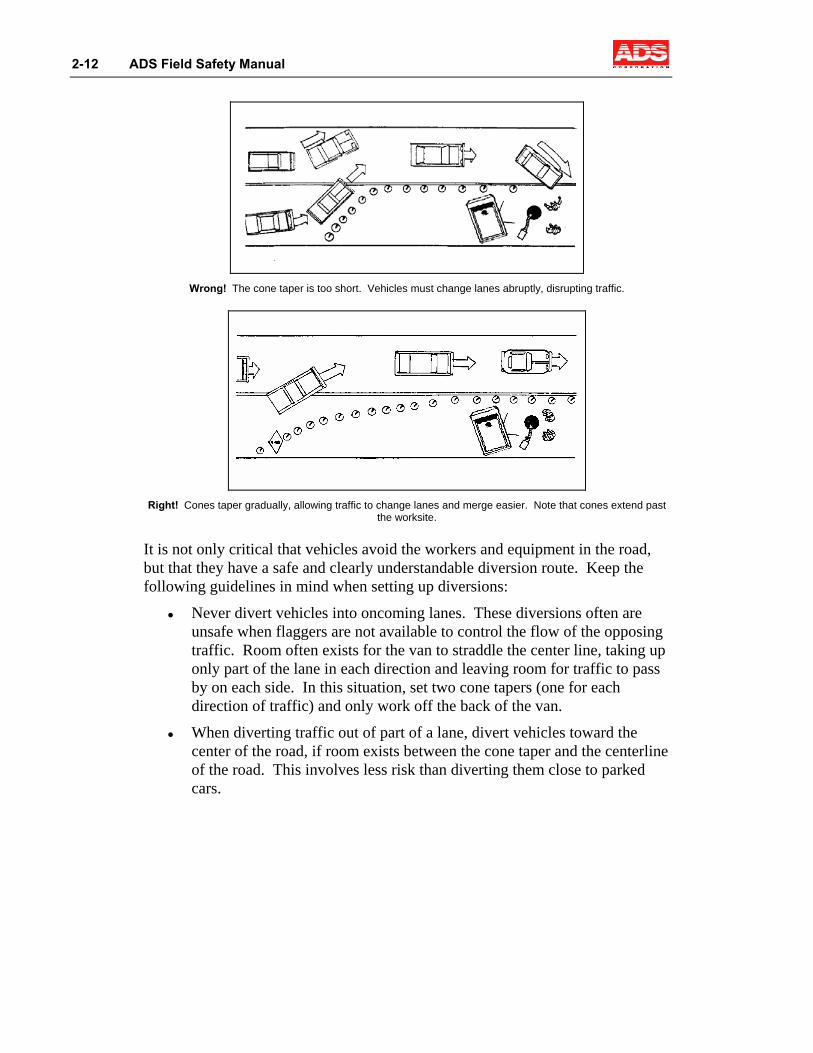
2-12 ADS Field Safety Manual
Wrong! The cone taper is too short. Vehicles must change lanes abruptly, disrupting traffic.
Right! Cones taper gradually, allowing traffic to change lanes and merge easier. Note that cones extend past
the worksite.
It is not only critical that vehicles avoid the workers and equipment in the road, but that they have a safe and clearly understandable diversion route. Keep the following guidelines in mind when setting up diversions:
Never divert vehicles into oncoming lanes. These diversions often are unsafe when flaggers are not available to control the flow of the opposing traffic. Room often exists for the van to straddle the center line, taking up only part of the lane in each direction and leaving room for traffic to pass by on each side. In this situation, set two cone tapers (one for each direction of traffic) and only work off the back of the van.
When diverting traffic out of part of a lane, divert vehicles toward the center of the road, if room exists between the cone taper and the centerline of the road. This involves less risk than diverting them close to parked cars.
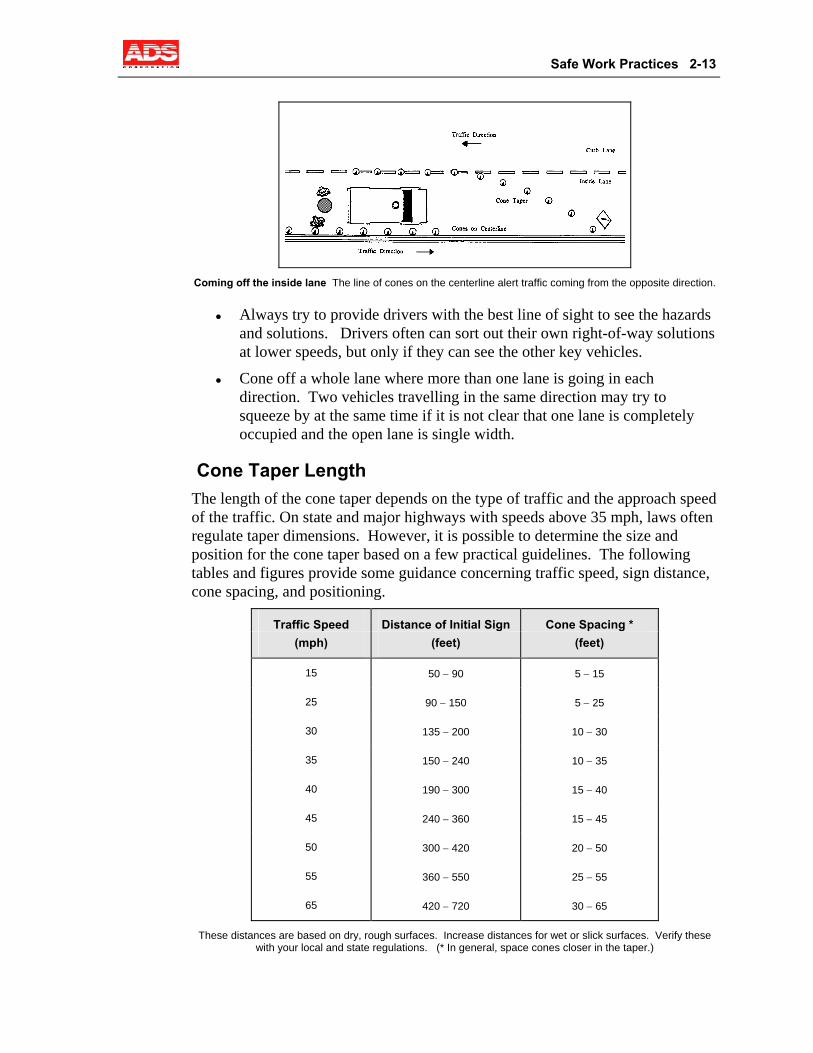
Safe Work Practices 2-13
Coming off the inside lane The line of cones on the centerline alert traffic coming from the opposite direction.
Always try to provide drivers with the best line of sight to see the hazards and solutions. Drivers often can sort out their own right-of-way solutions at lower speeds, but only if they can see the other key vehicles.
Cone off a whole lane where more than one lane is going in each direction. Two vehicles travelling in the same direction may try to squeeze by at the same time if it is not clear that one lane is completely occupied and the open lane is single width.
Cone Taper Length The length of the cone taper depends on the type of traffic and the approach speed of the traffic. On state and major highways with speeds above 35 mph, laws often regulate taper dimensions. However, it is possible to determine the size and position for the cone taper based on a few practical guidelines. The following tables and figures provide some guidance concerning traffic speed, sign distance, cone spacing, and positioning.
Traffic Speed Distance of Initial Sign Cone Spacing * (mph) (feet) (feet)
15 50 − 90 5 − 15
25 90 − 150 5 − 25
30 135 − 200 10 − 30
35 150 − 240 10 − 35
40 190 − 300 15 − 40
45 240 − 360 15 − 45
50 300 − 420 20 − 50
55 360 − 550 25 − 55
65 420 − 720 30 − 65
These distances are based on dry, rough surfaces. Increase distances for wet or slick surfaces. Verify these with your local and state regulations. (* In general, space cones closer in the taper.)
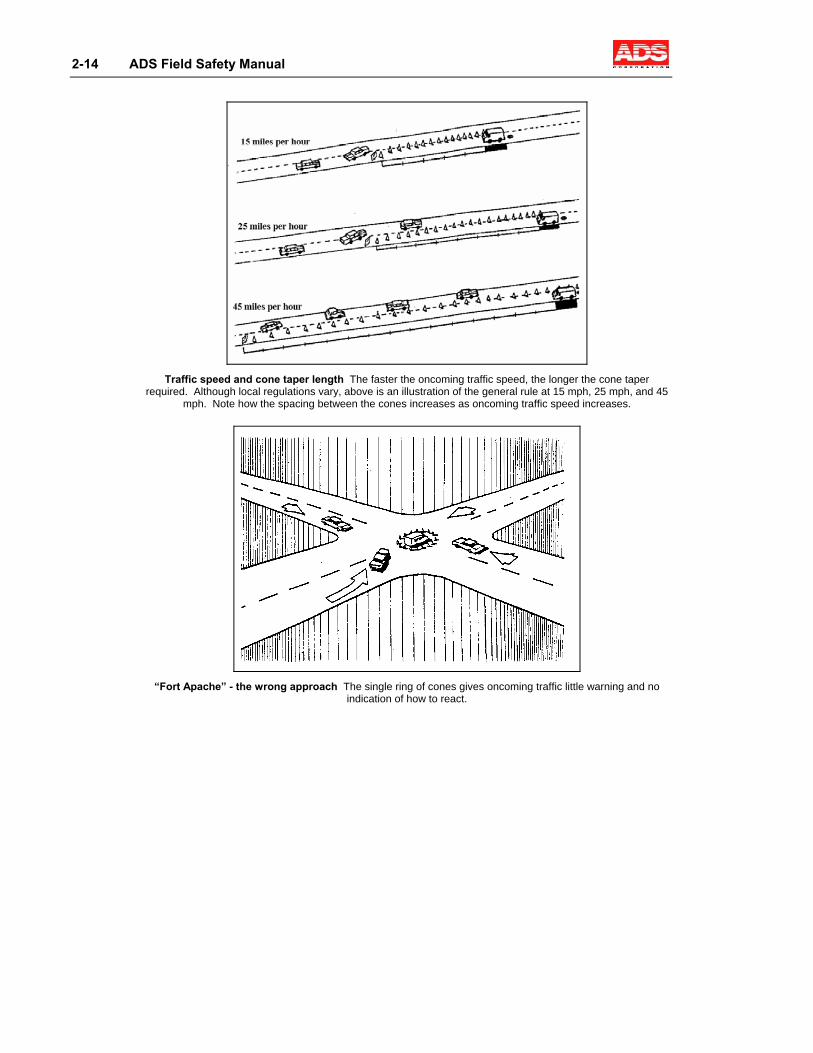
2-14 ADS Field Safety Manual
Traffic speed and cone taper length The faster the oncoming traffic speed, the longer the cone taper
required. Although local regulations vary, above is an illustration of the general rule at 15 mph, 25 mph, and 45 mph. Note how the spacing between the cones increases as oncoming traffic speed increases.
“Fort Apache” - the wrong approach The single ring of cones gives oncoming traffic little warning and no
indication of how to react.
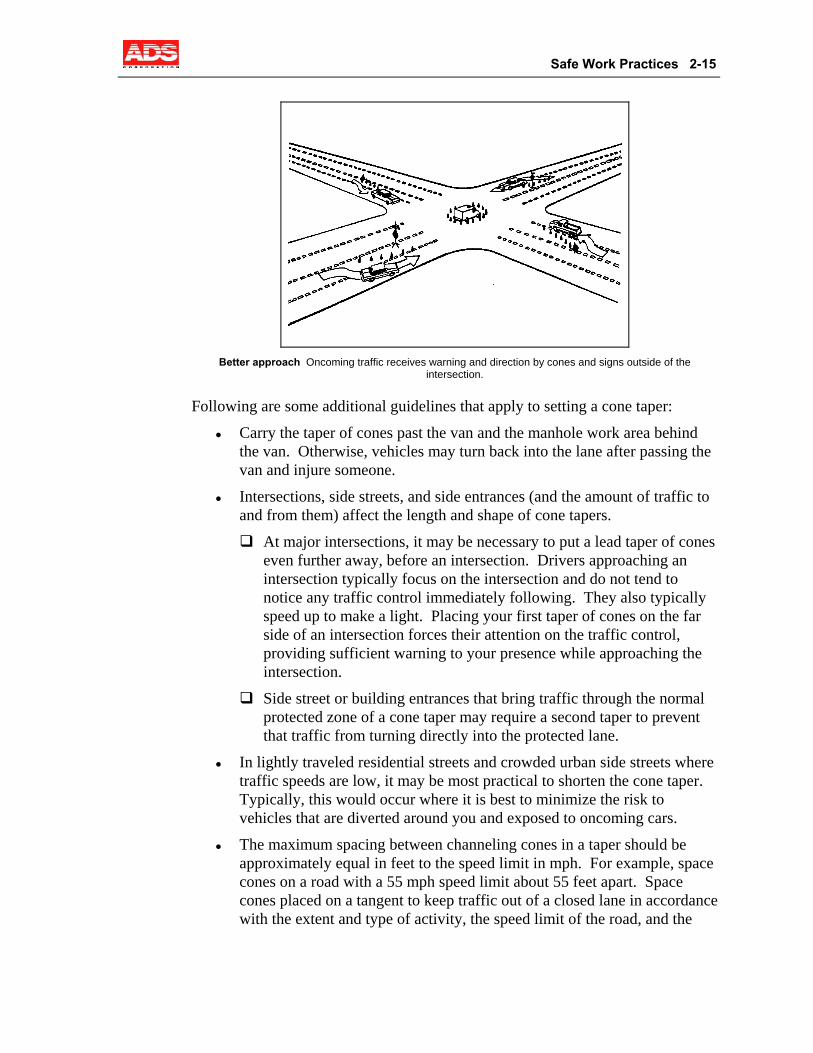
Safe Work Practices 2-15
Better approach Oncoming traffic receives warning and direction by cones and signs outside of the
intersection.
Following are some additional guidelines that apply to setting a cone taper:
Carry the taper of cones past the van and the manhole work area behind the van. Otherwise, vehicles may turn back into the lane after passing the van and injure someone.
Intersections, side streets, and side entrances (and the amount of traffic to and from them) affect the length and shape of cone tapers.
At major intersections, it may be necessary to put a lead taper of cones even further away, before an intersection. Drivers approaching an intersection typically focus on the intersection and do not tend to notice any traffic control immediately following. They also typically speed up to make a light. Placing your first taper of cones on the far side of an intersection forces their attention on the traffic control, providing sufficient warning to your presence while approaching the intersection.
Side street or building entrances that bring traffic through the normal protected zone of a cone taper may require a second taper to prevent that traffic from turning directly into the protected lane.
In lightly traveled residential streets and crowded urban side streets where traffic speeds are low, it may be most practical to shorten the cone taper. Typically, this would occur where it is best to minimize the risk to vehicles that are diverted around you and exposed to oncoming cars.
The maximum spacing between channeling cones in a taper should be approximately equal in feet to the speed limit in mph. For example, space cones on a road with a 55 mph speed limit about 55 feet apart. Space cones placed on a tangent to keep traffic out of a closed lane in accordance with the extent and type of activity, the speed limit of the road, and the
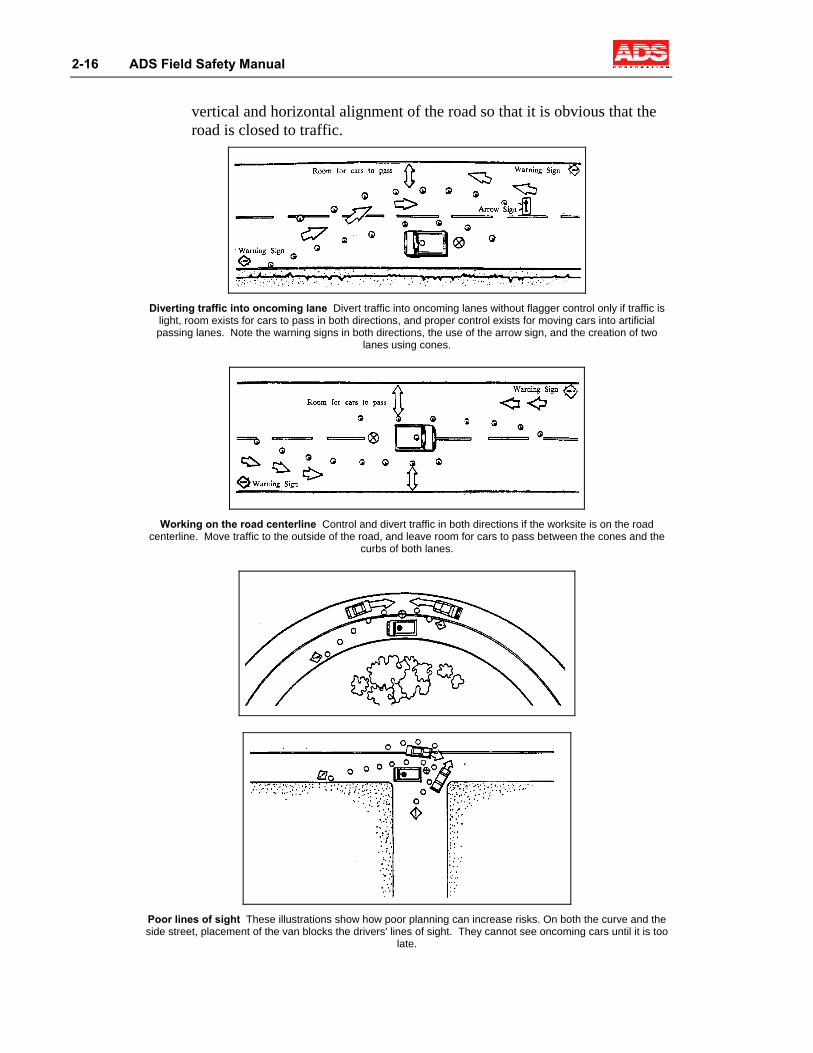
2-16 ADS Field Safety Manual
vertical and horizontal alignment of the road so that it is obvious that the road is closed to traffic.
Diverting traffic into oncoming lane Divert traffic into oncoming lanes without flagger control only if traffic is
light, room exists for cars to pass in both directions, and proper control exists for moving cars into artificial passing lanes. Note the warning signs in both directions, the use of the arrow sign, and the creation of two
lanes using cones.
Working on the road centerline Control and divert traffic in both directions if the worksite is on the road
centerline. Move traffic to the outside of the road, and leave room for cars to pass between the cones and the curbs of both lanes.
Poor lines of sight These illustrations show how poor planning can increase risks. On both the curve and the side street, placement of the van blocks the drivers' lines of sight. They cannot see oncoming cars until it is too
late.
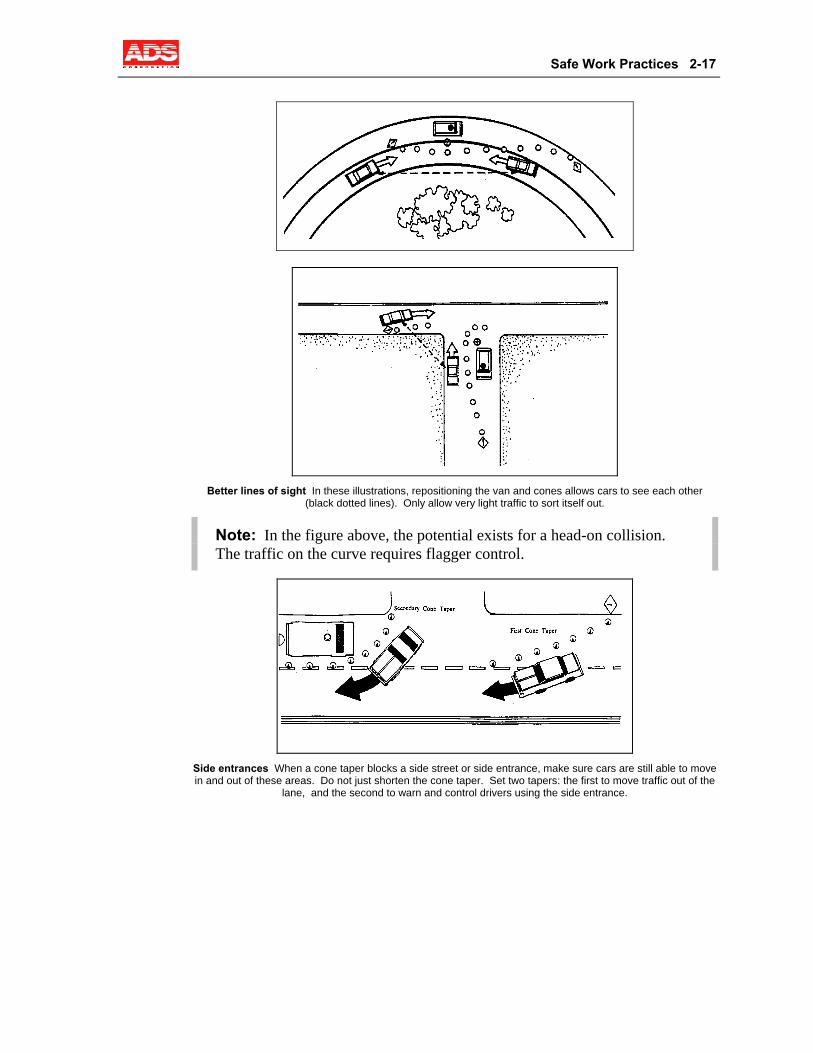
Safe Work Practices 2-17
Better lines of sight In these illustrations, repositioning the van and cones allows cars to see each other
(black dotted lines). Only allow very light traffic to sort itself out.
Note: In the figure above, the potential exists for a head-on collision. The traffic on the curve requires flagger control.
Side entrances When a cone taper blocks a side street or side entrance, make sure cars are still able to move in and out of these areas. Do not just shorten the cone taper. Set two tapers: the first to move traffic out of the
lane, and the second to warn and control drivers using the side entrance.
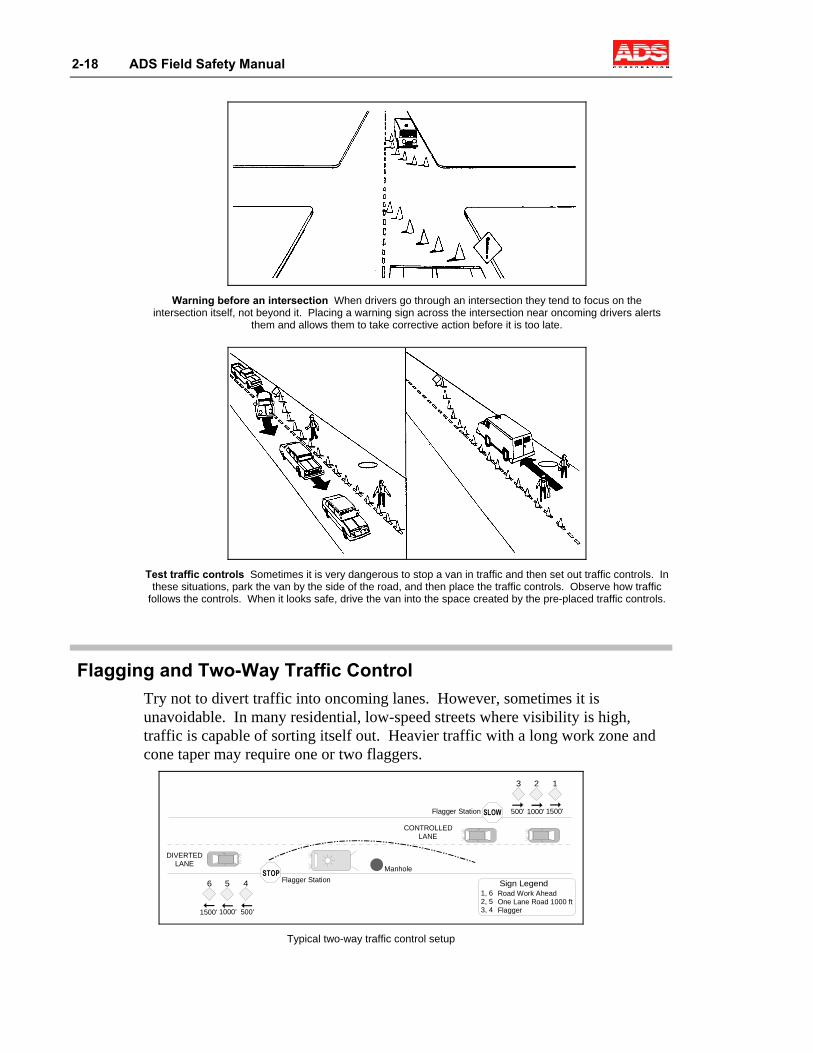
2-18 ADS Field Safety Manual
Warning before an intersection When drivers go through an intersection they tend to focus on the
intersection itself, not beyond it. Placing a warning sign across the intersection near oncoming drivers alerts them and allows them to take corrective action before it is too late.
Test traffic controls Sometimes it is very dangerous to stop a van in traffic and then set out traffic controls. In
these situations, park the van by the side of the road, and then place the traffic controls. Observe how traffic follows the controls. When it looks safe, drive the van into the space created by the pre-placed traffic controls.
Flagging and Two-Way Traffic Control Try not to divert traffic into oncoming lanes. However, sometimes it is unavoidable. In many residential, low-speed streets where visibility is high, traffic is capable of sorting itself out. Heavier traffic with a long work zone and cone taper may require one or two flaggers.
STOPFlagger Station
DIVERTEDLANE
1500' 1000' 500'
6 5 4
500' 1000' 1500'Flagger Station
3 2 1
CONTROLLEDLANE
Manhole
1, 62, 53, 4
Road Work AheadOne Lane Road 1000 ftFlagger
Sign Legend
SLOW
Typical two-way traffic control setup

Safe Work Practices 2-19
Equipment In addition to the standard hardhat, safety vest, and boots, the flagger should have a hand-held sign reading Slow and Stop on alternate sides. Consider using a red flag in addition to the stop sign to make directions more visible to motorists and for communicating with other flaggers. Some states and localities require warning signs of flag control in advance of the actual controlled lane. Make sure you know the regulations and your supervisor has provided the appropriate signs.
Number Of Flaggers In most situations that require flag control, two flaggers − one for controlling traffic in each direction − are the legal requirement. Flaggers should not have additional duties that distract them from their main task of controlling traffic.
A single flagger usually is not appropriate except where short distances, light traffic, clear lines of sight, and additional traffic control signs allow the flagger to control the flow of traffic in both directions. Limit using a single flagger to only the most brief instances, such as during cone and sign setup or removal. Using a single flagger may be appropriate when traffic is receiving warning concerning the correct direction, but not receiving direction into conflict with oncoming traffic.
Training Of Flaggers Do not allow flaggers to control traffic until they are thoroughly trained and have reviewed written instructions on directing traffic. Each flagger should know the proper attire, signs, communication procedures, and use of signs and flags.
Communication Between Flaggers Flaggers should maintain both visual and one other form of communication (either radios or hand/flag signals). Even if they use radios, flaggers should know the appropriate hand/flag signals. Before flag traffic control begins at any site, the crew should review both the procedures and communication signals. ADS prohibits playing music that might interfere with voice communication between flaggers or with motorists.
Procedures For Controlling Traffic Review the following procedures, and make sure that the appropriate signs are available before starting any kind of traffic control:
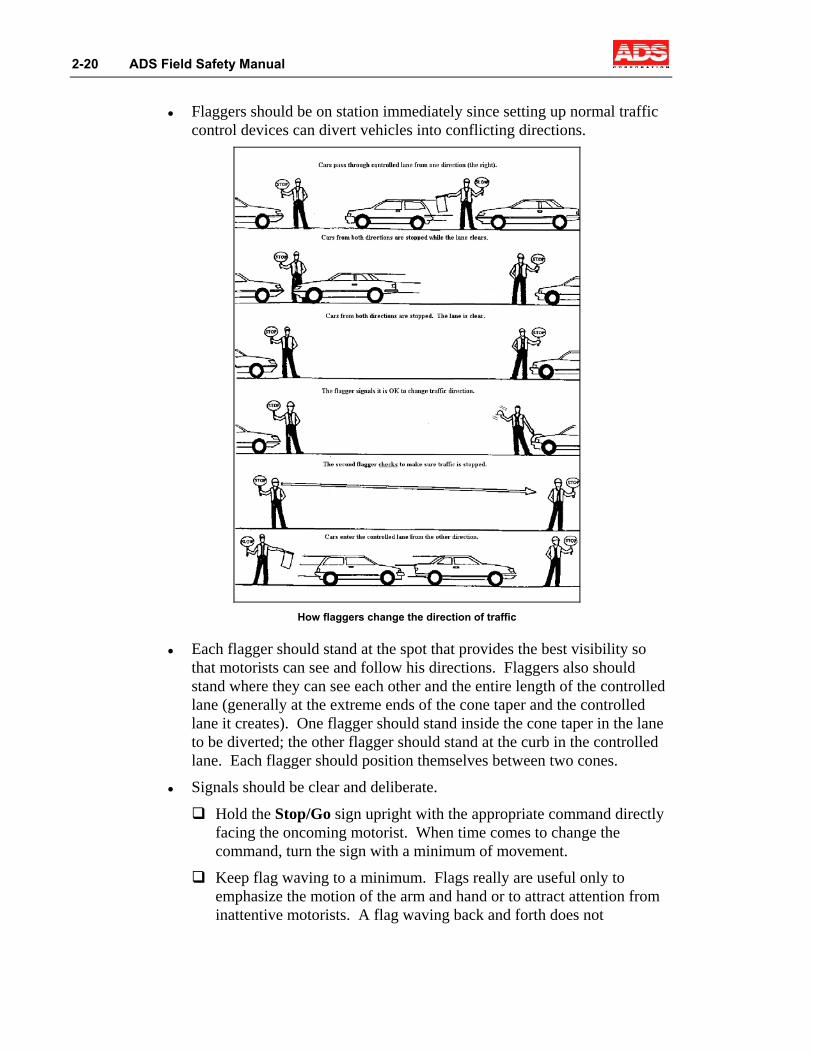
2-20 ADS Field Safety Manual
Flaggers should be on station immediately since setting up normal traffic control devices can divert vehicles into conflicting directions.
How flaggers change the direction of traffic
Each flagger should stand at the spot that provides the best visibility so that motorists can see and follow his directions. Flaggers also should stand where they can see each other and the entire length of the controlled lane (generally at the extreme ends of the cone taper and the controlled lane it creates). One flagger should stand inside the cone taper in the lane to be diverted; the other flagger should stand at the curb in the controlled lane. Each flagger should position themselves between two cones.
Signals should be clear and deliberate.
Hold the Stop/Go sign upright with the appropriate command directly facing the oncoming motorist. When time comes to change the command, turn the sign with a minimum of movement.
Keep flag waving to a minimum. Flags really are useful only to emphasize the motion of the arm and hand or to attract attention from inattentive motorists. A flag waving back and forth does not
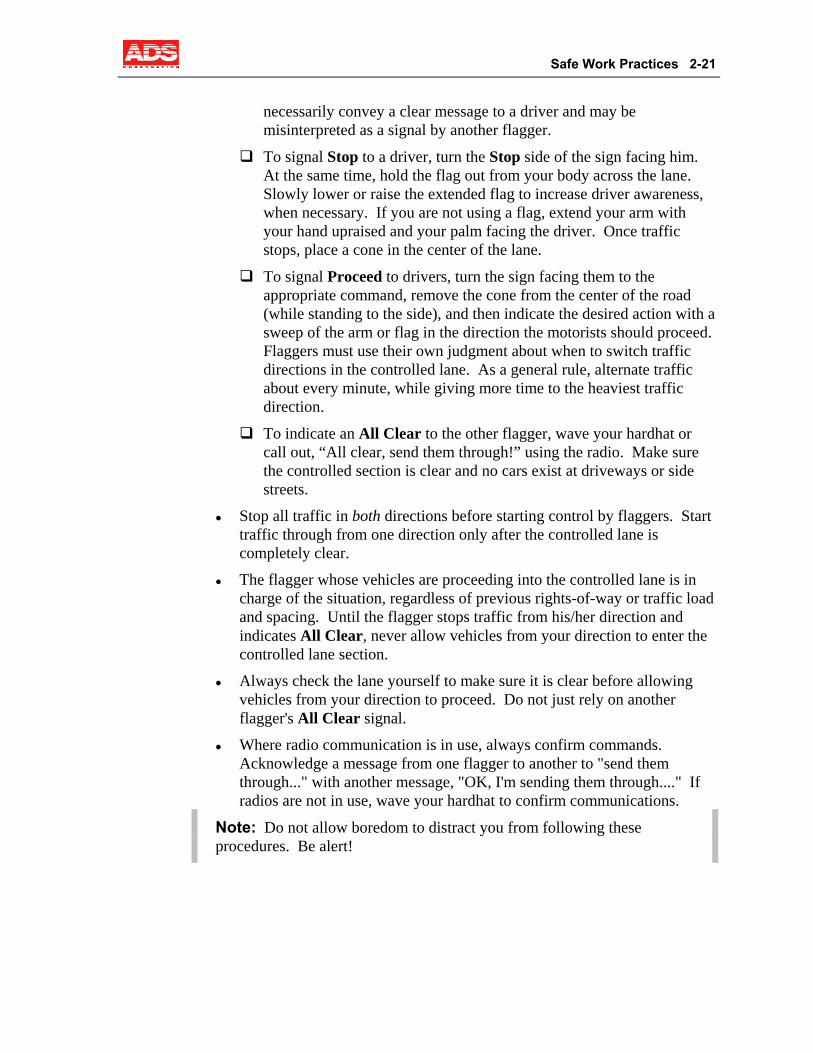
Safe Work Practices 2-21
necessarily convey a clear message to a driver and may be misinterpreted as a signal by another flagger.
To signal Stop to a driver, turn the Stop side of the sign facing him. At the same time, hold the flag out from your body across the lane. Slowly lower or raise the extended flag to increase driver awareness, when necessary. If you are not using a flag, extend your arm with your hand upraised and your palm facing the driver. Once traffic stops, place a cone in the center of the lane.
To signal Proceed to drivers, turn the sign facing them to the appropriate command, remove the cone from the center of the road (while standing to the side), and then indicate the desired action with a sweep of the arm or flag in the direction the motorists should proceed. Flaggers must use their own judgment about when to switch traffic directions in the controlled lane. As a general rule, alternate traffic about every minute, while giving more time to the heaviest traffic direction.
To indicate an All Clear to the other flagger, wave your hardhat or call out, “All clear, send them through!” using the radio. Make sure the controlled section is clear and no cars exist at driveways or side streets.
Stop all traffic in both directions before starting control by flaggers. Start traffic through from one direction only after the controlled lane is completely clear.
The flagger whose vehicles are proceeding into the controlled lane is in charge of the situation, regardless of previous rights-of-way or traffic load and spacing. Until the flagger stops traffic from his/her direction and indicates All Clear, never allow vehicles from your direction to enter the controlled lane section.
Always check the lane yourself to make sure it is clear before allowing vehicles from your direction to proceed. Do not just rely on another flagger's All Clear signal.
Where radio communication is in use, always confirm commands. Acknowledge a message from one flagger to another to "send them through..." with another message, "OK, I'm sending them through...." If radios are not in use, wave your hardhat to confirm communications.
Note: Do not allow boredom to distract you from following these procedures. Be alert!
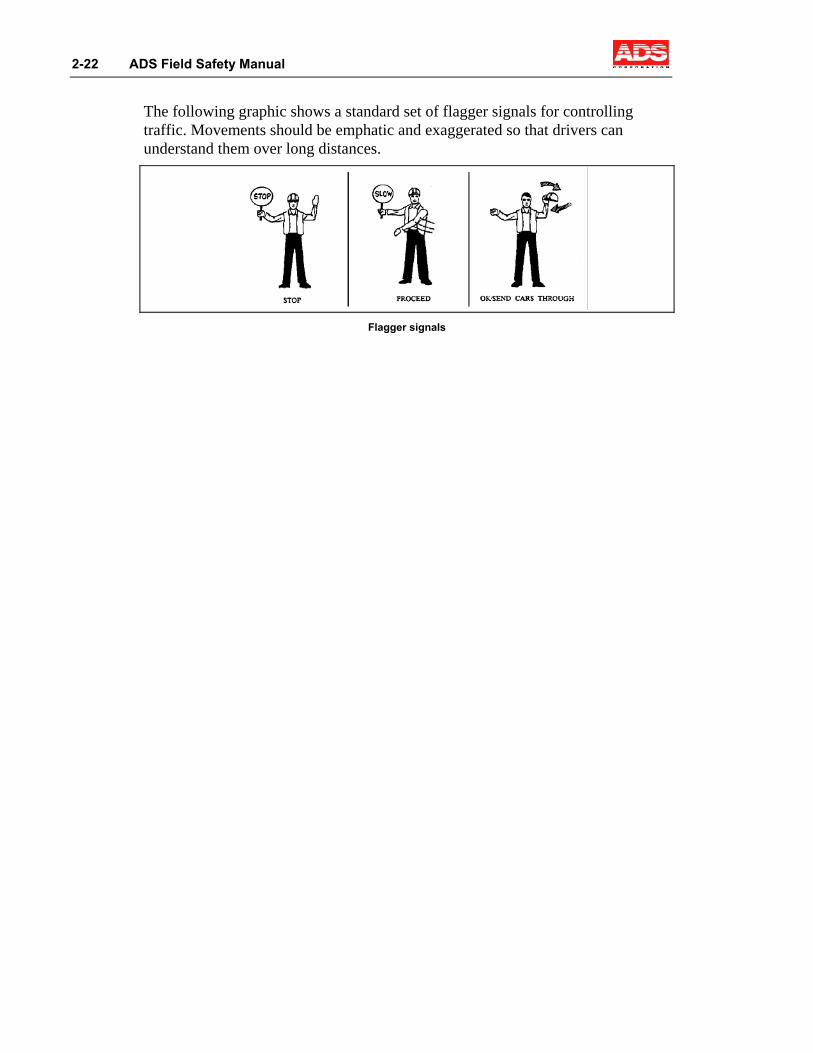
2-22 ADS Field Safety Manual
The following graphic shows a standard set of flagger signals for controlling traffic. Movements should be emphatic and exaggerated so that drivers can understand them over long distances.
Flagger signals
Safe Work Practices 2-23
Worksite Safety Our normal worksite is the entrance to a manhole or other underground structure and the surface area immediately adjacent to it. It also may include the coned-off area surrounding the truck.
Reaching the Worksite Although you can approach most manholes by van, some sites may be located in easements or remote areas that are inaccessible by a vehicle (sometimes called walker sites). Reaching these worksites often can be hazardous.
Terrain Crossing fields, fences, ravines, creeks, and heavily wooded areas can make walking difficult. Carrying equipment, especially blowers, increases the risk of a fall or sprain. Avoid crossing trestles, raised pipelines, and makeshift bridges whenever possible. If you need to work at a remote site, plan more time for these site visits, particularly at night or during bad weather.
Equipment Consider using a pole (or other device) for carrying equipment over rough terrain. Larger equipment (such as blowers and monitors) can be suspended under the pole and carried by two people. A machete helps to clear heavy undergrowth, especially during the summer. Use insect repellent and, if snakes are suspected (or known to be present), wear special chaps or leggings. Poison ivy is often present in remote areas; consider wearing long sleeves, pants, and gloves to these sites.
Opening Manholes Using improper techniques to open manholes has resulted in broken feet and fingers as well as disabling back injuries in young, strong, and healthy individuals. None thought it ever could happen to them. Remember, it only takes one moment of carelessness to have an accident.
Equipment Following is a list of the safest devices for opening manholes:
Manhole Hook This is a J-shaped tool that hooks through the vent hole on the manhole cover, allowing you to lift straight up using your legs.
Pick This tool enables you to slide manhole covers off sideways.
2-24 ADS Field Safety Manual
Wedge tools These tools (shovels, crowbars, large screwdrivers) are useful only for unseating the lid. Do not use these tools to move a manhole cover aside! Use another lifting device for this function once you have unseated the lid.
Crowbars This tool should be long enough to allow you to stand while sliding the manhole cover.
Rules and Techniques Following is a list of the general rules and safest techniques for opening manholes:
If the manhole is not located on a flat street, using manhole tools can be dangerous. Be extremely careful if you need to use your hands to remove a manhole cover. Remember to always use two people when lifting a cover off the ground.
Never try to move a manhole cover without wearing steel-toed protective boots.
Stand; do not kneel. Keep your feet parted with knees bent. Face the manhole. Keep your back straight, but not necessarily vertical.
Slide the manhole cover off, lifting only enough to break it loose and clear the rim.
Lift with your legs, not your back. Keep your arms in close to your body, and never try to move a manhole cover with just one arm.
Know your lifting limit. Get help with heavy covers.
Never look away while moving a manhole cover. They often will slip, roll, or wobble enough to severely injure a foot or hand.
To close manholes, slide the cover back into place. Always test the cover by stepping on the sides of the cover when it is in place. If it is unstable, re-open it, clean any debris from the lip of the rim, replace the cover, and retest.
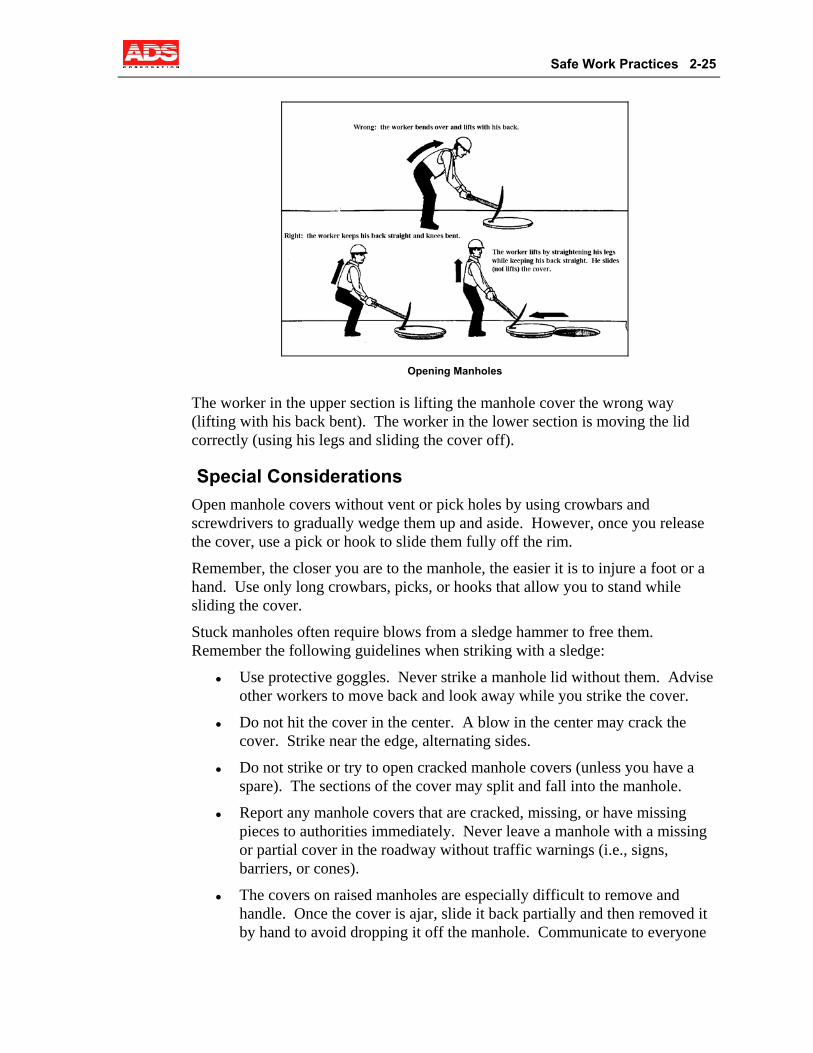
Safe Work Practices 2-25
Opening Manholes
The worker in the upper section is lifting the manhole cover the wrong way (lifting with his back bent). The worker in the lower section is moving the lid correctly (using his legs and sliding the cover off).
Special Considerations Open manhole covers without vent or pick holes by using crowbars and screwdrivers to gradually wedge them up and aside. However, once you release the cover, use a pick or hook to slide them fully off the rim.
Remember, the closer you are to the manhole, the easier it is to injure a foot or a hand. Use only long crowbars, picks, or hooks that allow you to stand while sliding the cover.
Stuck manholes often require blows from a sledge hammer to free them. Remember the following guidelines when striking with a sledge:
Use protective goggles. Never strike a manhole lid without them. Advise other workers to move back and look away while you strike the cover.
Do not hit the cover in the center. A blow in the center may crack the cover. Strike near the edge, alternating sides.
Do not strike or try to open cracked manhole covers (unless you have a spare). The sections of the cover may split and fall into the manhole.
Report any manhole covers that are cracked, missing, or have missing pieces to authorities immediately. Never leave a manhole with a missing or partial cover in the roadway without traffic warnings (i.e., signs, barriers, or cones).
The covers on raised manholes are especially difficult to remove and handle. Once the cover is ajar, slide it back partially and then removed it by hand to avoid dropping it off the manhole. Communicate to everyone

2-26 ADS Field Safety Manual
involved how to lift the cover and where to place it before attempting to remove it. Resetting the lid also is hazardous because you often cannot stand on it to seat it. In this case, take your time and use the tools available (e.g., a crowbar) to seat the cover.
Manhole lids are dangerous!
Manhole lids pose particular risks to fingers and feet. The worker on the left tried to lift a manhole cover with his hands; he should have used an opening tool. On the right, a manhole lid rolled several feet from the manhole onto the foot of a coworker. Steel-toed boots and alertness could have prevented this accident.
Carrying and Storing Tools at the Worksite Use the following guidelines for carrying and storing tools at the worksite:
Never carry picks or opening tools on your shoulder. Carry them alongside your hip. Hold picks where the wooden handle meets the metal head.
Store all opening tools in the van (or well away from the manhole) when they are not in use. Do not leave them hooked in the manhole cover. Someone could accidentally kick them into the hole. Keep hand tools at least 24 to 36 inches away from the manhole.
Keep all tools and equipment away from the cone perimeter. Never place tools or crowbars in cones. A car striking a cone or straying into the perimeter could send these tools flying into the air, potentially causing serious property damage or injury.
Safe Work Practices 2-27
Other Worksite Safety
Always use eye protection when drilling or chipping inside or outside the manhole.
Always wear protection (earplugs or headphone-type ear protectors) when working with power tools in the manhole.
Arrange your equipment to minimize the chance of tripping as well as unnecessary bending and lifting.
Replace the cover immediately once the manhole is clear (i.e., all workers, equipment, and lines are out). This will prevent anyone from accidentally stepping into an open manhole.
2-28 ADS Field Safety Manual
Confined Space Entry
Our field operations involve a variety of tasks, ranging from physical inspection to flow monitoring, cleaning, and TV inspection. However, all of these tasks have one thing in common – they all primarily occur in an environment commonly known as a confined space. A confined space is any enclosed area that satisfies the following parameters:
It is not designed for continuous human occupancy.
It has limited or restrictive entry and exit.
It is large enough and configured in such a way that an employee can bodily enter and perform assigned work.
Confined spaces include (but are not limited to) storage tanks, compartments or ships, process vessels, pits, silos, vats, degreasers, reaction vessels, boilers, ventilation and exhaust ducts, sewers, tunnels, underground utility vaults, and pipelines. ADS work activities primarily involve manholes, sewer lines, pump station wet wells and dry sides, diversion or control structures, tide gates, overflow structures, siphon chambers, retention tanks, or any structure that fits the criteria above.
Work in manholes, or in any confined space, carries several specific dangers. These hazards require specific safety equipment and procedures. This section describes the specific hazards associated with work in manholes and the basic equipment and procedures necessary for safe entry. It also discusses special situations, such as deep lines, treatment plants, and combined systems. The key elements in our confined space entry program are training, hazard identification, and hazard control.
Training
ADS employs both classroom and hands-on training. All field personnel also must participate in weekly safety meetings, which may include refresher and/or remedial training conducted by the project manager.
This manual is a critical element of training. Therefore, it is essential that you read this manual thoroughly and understand both the hazards inherent to your work and the procedures for eliminating or minimizing these hazards.
!
Warning: Entrants or attendants who work in confined spaces must be certified in confined space entry or under the direct, constant supervision of a certified individual.
Safe Work Practices 2-29
Hazard Identification
In order to work safely, you must be aware of the dangers present in you work environment. Following are the principal dangers in sewer manholes:
Atmospheric hazards
Engulfment
Falls
Falling objects
Infection
Hypothermia
Special hazards
Atmospheric Hazards Many different atmospheric dangers exist in manholes. Any one or all of them could be present at any time. More sewer workers die every year from atmospheric causes than from all other causes combined. In almost every documented case, following simple safety procedures would have saved their lives.
The atmosphere in a manhole has many dangers:
Flammable substances The manhole’s atmosphere can be explosive due to gas or vapors from flammable substances, such as gasoline, solvents, or methane.
Gasoline This usually enters sewers from leaking gas station tanks. It is explosive and fatally toxic at high concentrations. Hydrocarbon fuel oils and kerosene present similar dangers.
Solvents These include substances like toluene, benzene, xylene, and turpentine. These are common industrial solvents that usually enter the sewer system through industrial dumping. They generally are irritants in low concentrations, causing headaches, dizziness, and nausea; however, they can be fatal in high concentrations. Some solvents are suspected carcinogens (cancer-causing). These solvents are characterized by a strong odor.
Methane This colorless, odorless gas is the product of the natural breakdown of sewage usually found in the top of manholes, digesters, and wet wells. It can asphyxiate as well as explode.
Oxygen (O2) Deficiency A true oxygen deficiency is a decrease in the atmosphere’s oxygen content below the level that can sustain life. This deficiency can occur when aerobic breakdown of the sewage takes place, using up the oxygen available. An oxygen deficiency also occurs when
2-30 ADS Field Safety Manual
oxygen is displaced by another gas that cannot support life. This gas may or may not be harmful.
An oxygen deficiency is usually present in areas with little ventilation or air circulation that exhibit some sort of active biological or chemical process. An example may be a confined space containing water or sewage that is closed for long periods of time and experiences extensive oxidation (rust) occurs. Note the following oxygen levels and associated hazards:
Normal: 20.9%
Potential hazard: 20.8% - 19.5%
Legally "oxygen deficient": below 19.5%
Immediately dangerous to life: 16% and below
The following are common symptoms of oxygen deficiency:
Shortness of breath
Dizziness
Impaired vision
Loss of consciousness
Toxic Gases Gases produced by natural processes in the sewage or from certain chemicals dumped or leaked into the sewer are often toxic and can be fatal. Some gases, while not fatal, can cause mild to severe injury by irritating the eyes, respiratory tract, or skin. Hydrogen sulfide is the toxic gas you are most likely to encounter in a manhole.
Hydrogen Sulfide (H2S) This gas is the byproduct of the sewage and organic material decaying anaerobically (without oxygen). It can exist anywhere sewage has had the time to begin the biological breakdown process, particularly in wet wells or large trunk and interceptor sewers with slow-moving sewage. It is a colorless, heavy gas (heavier than air) typically found in the lower parts of a manhole. H2S is often carried in dissolved solution in the sewage. It is released by the normal movement of the sewage but is particularly bad in manholes with mixed sewage, such as wet wells, drop connections, and terminations of force mains.
H2S kills by paralyzing the respiratory center of the brain. Paralysis of the respiratory system followed by unconsciousness and death occur from concentrations of 500-1000 parts per million. It has a sulfur or rotten egg smell at first, but beware! One of the first effects of the gas is to anesthetize the sense of smell. Therefore, do not trust your sense of smell to detect H2S.
Symptoms of H2S poisoning include the following:
− Inflammation of eyes and lungs
Safe Work Practices 2-31
− Dizziness, loss of coordination, and weakness
− Difficulty breathing
− Loss of consciousness
− Cessation of breathing
Carbon Monoxide (CO) This chemical asphyxiant can be fatal in minutes in high concentrations. Colorless, odorless, and lighter than air, it is the product of almost any kind of combustion or hydrocarbon oxidation. Although it may be found in industrial areas or special industrial waste collection systems, the principle sources of this gas is the exhaust from your air blower and vehicle.
Chlorine This is fatal at low concentrations. You may detect it by its choking odor, irritant qualities, and yellow-green color. Chlorine is usually introduced industrially or in treatment processes.
Engulfment Any manhole with a pipe large enough for your legs to slip into the output presents a danger of drowning, even when flows are not particularly high. Fast flows combined with slippery footing can knock you into a helpless situation. In large lines, particularly combined sewers, the flow can rise dangerously in just a few seconds.
Falls The danger of falling is the prime reason for wearing a rope and safety harness. An injurious fall does not have to be a dramatic plunge from the top of the manhole to the bottom. A fall of only one foot can shatter an ankle, sprain a knee, or badly injure a back.
Falling Objects Working at the bottom of a manhole exposes you to possible bodily injuries from dropped tools and equipment or eye damage from dislodged dirt and debris.
Infection Inadvertent splashing can bring sewage into your eyes and mouth, risking possible infection. An exposed, small cut easily can become infected. Sewers seem to abound with rusty, sharp, bacteria-laden objects. They also can contain rusted and broken rungs and sharp concrete protrusions. Using power tools also increases the risk of cuts.
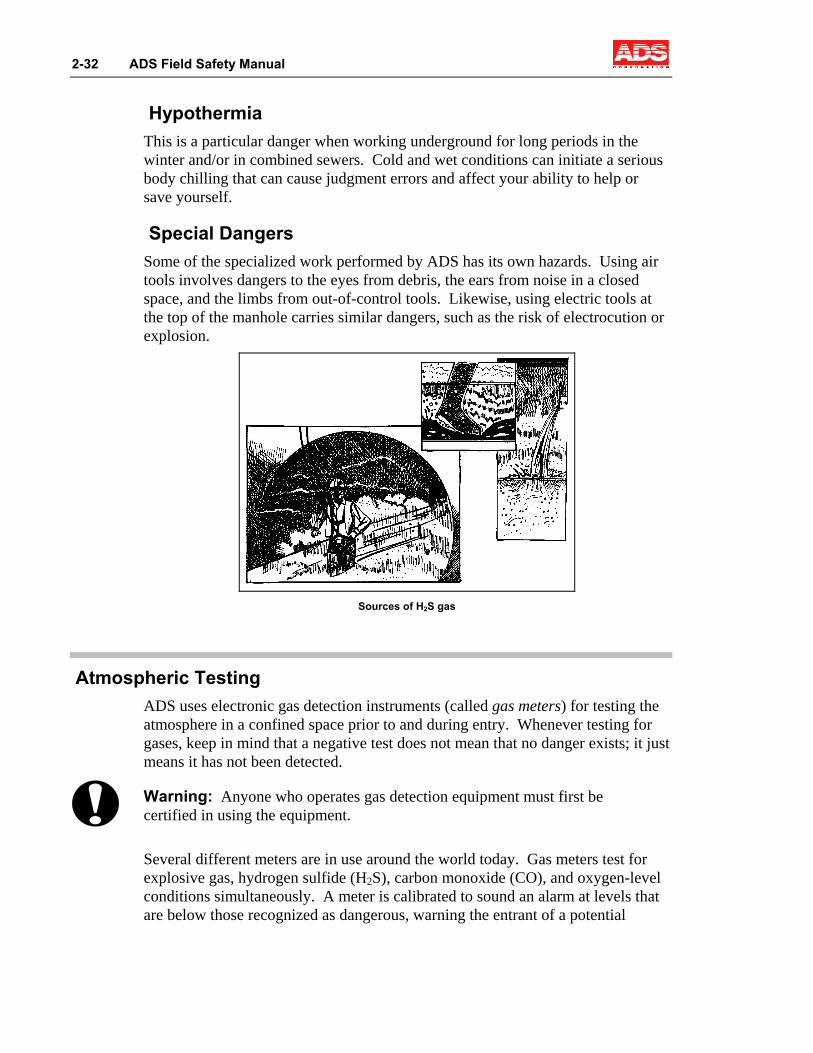
2-32 ADS Field Safety Manual
Hypothermia This is a particular danger when working underground for long periods in the winter and/or in combined sewers. Cold and wet conditions can initiate a serious body chilling that can cause judgment errors and affect your ability to help or save yourself.
Special Dangers Some of the specialized work performed by ADS has its own hazards. Using air tools involves dangers to the eyes from debris, the ears from noise in a closed space, and the limbs from out-of-control tools. Likewise, using electric tools at the top of the manhole carries similar dangers, such as the risk of electrocution or explosion.
Sources of H2S gas
Atmospheric Testing
ADS uses electronic gas detection instruments (called gas meters) for testing the atmosphere in a confined space prior to and during entry. Whenever testing for gases, keep in mind that a negative test does not mean that no danger exists; it just means it has not been detected.
!
Warning: Anyone who operates gas detection equipment must first be certified in using the equipment.
Several different meters are in use around the world today. Gas meters test for explosive gas, hydrogen sulfide (H2S), carbon monoxide (CO), and oxygen-level conditions simultaneously. A meter is calibrated to sound an alarm at levels that are below those recognized as dangerous, warning the entrant of a potential
Safe Work Practices 2-33
problem before the atmosphere becomes hazardous. The alarm levels exist as follows:
H2S − 10 parts per million (ppm)
CO − 35 ppm
Explosive − 10% of the lower explosive limit (LEL)
Low oxygen − 19.5%
High oxygen − 23%
Since your life may depend on this instrument, it is in your best interest to ensure that it is functioning correctly by performing proper operation and maintenance. The following general guidelines apply:
Make sure your meter is fully charged before use.
Check your meter for proper calibration at the recommended intervals or whenever you are not sure it has been calibrated. Record your results on the calibration log.
Initialize your meter in clean fresh air.
When practical, test the work area by remote sampling prior to entry. Test for a sufficient length of time; it takes approximately 40 to 50 seconds for a sample of air to be drawn through the 50-foot hose and into the meter.
Be familiar with the operation and maintenance instructions for your instrument.
Do not perform remote sampling unless you have installed the appropriate filters.
Note: ADS no longer authorizes using gas paper and H2S dosimeters. Discard all existing supplies.
Gas Meter Components Most gas meters on the market have four main components: the sampling unit, sensor unit, display/alarm area, and power unit.
Sampling is the process by which the meter tests the content of the atmosphere in a given area for the presence or absence of certain gases. This process involves sensors that use tiny chemical reactions or heated wires to determine presence or absence of gas.
Typically, two sampling modes exist: diffusion and remote. When sampling by diffusion, the surrounding air passes through slots in the instrument case and over the sensors. An immediate reaction occurs in response to the presence of a harmful gas. When conducting remote sampling, a pump draws air through a hose and across the sensors. The reaction time varies according to the length of the hose (usually allow one second per foot).
2-34 ADS Field Safety Manual
The display/alarm component is an electronic system that displays the gas levels and sounds an alarm when preset threshold levels are satisfied. This system also can display information such as time, battery voltage, and peak readings.
Gas meters typically are powered by a rechargeable lead acid or nickel cadmium battery. Recharging a battery may take 8 to 16 hours, depending on the meter’s make and model.
Note: This manual discusses gas meters in general. Consult the specific gas meter's documentation for more details concerning operation, calibration, and maintenance.
Testing Guidelines Whenever possible, test manholes for methane (an explosive gas) before removing the cover. If ventilation or pick holes are present, simply insert the remote sampling probe tip into the opening. If the manhole cover has no openings, pry one side of the cover up enough to insert the tip of the probe.
Some gas meters (such as the GasTech) can be used only in remote sampling mode. In this case, allow sufficient time for the pump to draw a sample of air across the sensors (about 1 second per foot of hose).
In order to reduce the risk of water damage to the gas meter, use the remote sampling mode to test vertical spaces prior to entry whenever possible. In shallow manholes (less than 15 feet deep) where no drop connections exist, lower the meter on a utility rope to test the atmosphere. Do not lower the meter into deep manholes or when the flow is not visible. In these cases, you could risk dipping the meter into the flow and damaging it.
Once you have tested the work area, switch the meter to diffusion mode and carry it with you into the manhole. Using the meter in diffusion mode eliminates the lag time associated with remote sampling and gives you the quickest notification of potential hazards. Remember to avoid dropping the meter into the flow or suspending it under an active drop connection.
In order to test deep manholes (or where the flow is not visible), perform remote sampling to the extent the sampling hose allows. Next, enter the manhole area just tested, carrying the meter or suspending it from your belt. As mentioned earlier, carrying the meter allows you to continually test the environment as you work.
Gas Meter Calibration Calibrating the gas meter ensures that it accurately reads and displays gas levels. Perform meter calibrations by supplying the meter with a known quantity of special calibration gas. Compare the meter display with the actual gas content to verify whether the meter is working properly.
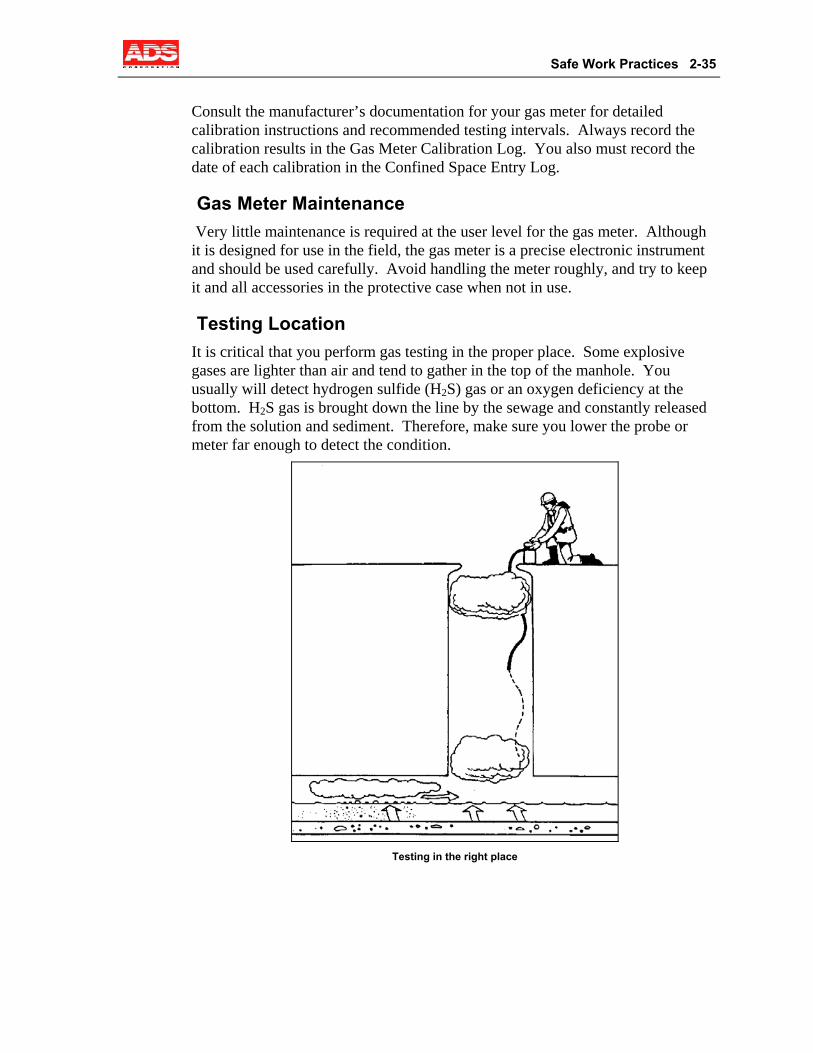
Safe Work Practices 2-35
Consult the manufacturer’s documentation for your gas meter for detailed calibration instructions and recommended testing intervals. Always record the calibration results in the Gas Meter Calibration Log. You also must record the date of each calibration in the Confined Space Entry Log.
Gas Meter Maintenance Very little maintenance is required at the user level for the gas meter. Although it is designed for use in the field, the gas meter is a precise electronic instrument and should be used carefully. Avoid handling the meter roughly, and try to keep it and all accessories in the protective case when not in use.
Testing Location It is critical that you perform gas testing in the proper place. Some explosive gases are lighter than air and tend to gather in the top of the manhole. You usually will detect hydrogen sulfide (H2S) gas or an oxygen deficiency at the bottom. H2S gas is brought down the line by the sewage and constantly released from the solution and sediment. Therefore, make sure you lower the probe or meter far enough to detect the condition.
Testing in the right place
2-36 ADS Field Safety Manual
Ventilation
Given the atmospheric hazards previously described, ADS has developed a standard approach for all manholes and confined spaces into which personnel will enter. The following rules and guidelines apply:
Never descend any manhole without first testing for gas.
A clean test does not mean the manhole is safe. Conditions can change in a manhole. Gas can come down the line or release from the sediment or flow. Therefore, test the manhole continuously.
If the alarm sounds, get out immediately. Do not finish your work or pack up your tools. Get out as fast and safely as possible.
Never smoke around a manhole. Smoking is not allowed within 15 feet of the manhole.
Never place the blower intake near the exhaust pipe of the van. This could force deadly exhaust fumes down into the manhole. Check to see whether the wind could blow the fumes toward the blower, and move the blower if this occurs.
When and How to Ventilate Use the following guidelines to determine when and how to ventilate a work area:.
Positive Gas Test If your initial gas test is positive (gas is present or an oxygen deficiency exists), ventilate the site. After ventilation, if the site no longer tests positive, the entrant must carry a rebreather or continue ventilation. If the site continues to test positive, the entrant must wear additional respiratory protection and receive permission from their regional manager prior to entry. A SAR or equivalent represents adequate respiratory protection; an escape pack is not permitted.
Negative Gas Test If your initial gas test is negative, proceed carefully and check for the following hazardous conditions:
If the site has a history of gas, keep a blower on standby and give the entrant a rebreather to carry or lower one into the manhole.
If conditions are favorable for producing gas upstream (e.g., anaerobic activity or industrial discharge), keep a blower on standby and give the entrant a rebreather to carry or lower one into the manhole.
If the site is a horizontal site (the entrant must travel up or down the line away from the point of entry), give the entrant a rebreather to carry.
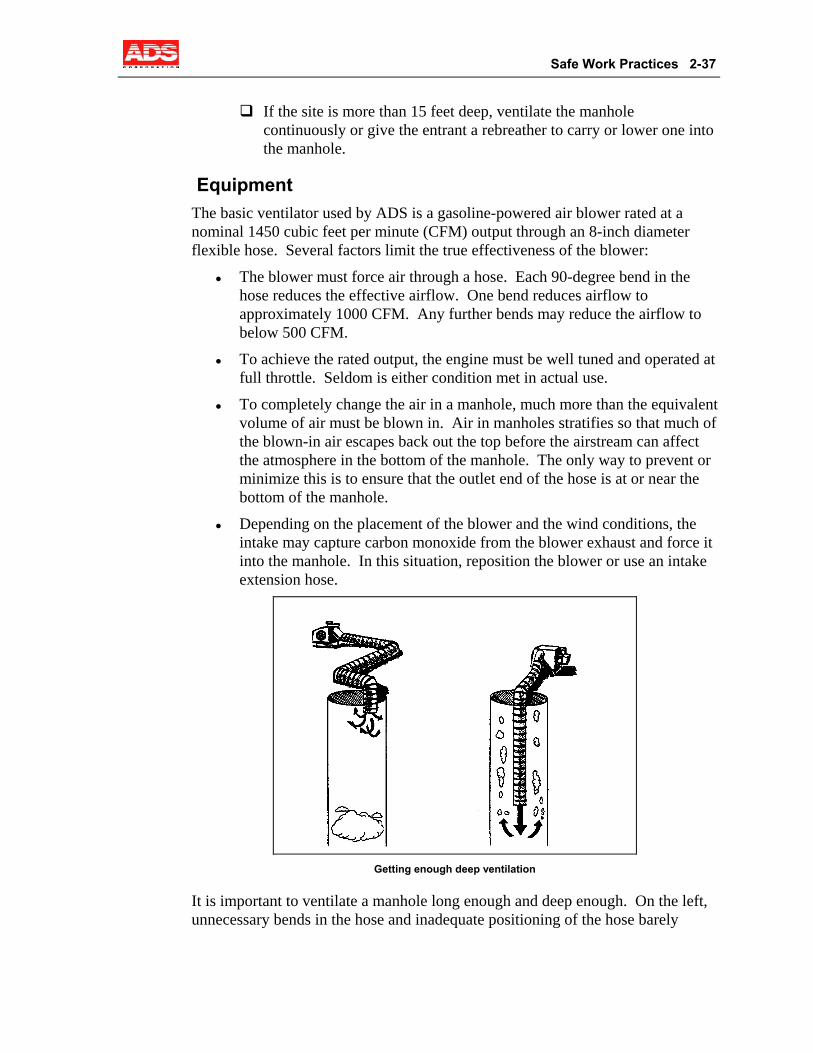
Safe Work Practices 2-37
If the site is more than 15 feet deep, ventilate the manhole continuously or give the entrant a rebreather to carry or lower one into the manhole.
Equipment The basic ventilator used by ADS is a gasoline-powered air blower rated at a nominal 1450 cubic feet per minute (CFM) output through an 8-inch diameter flexible hose. Several factors limit the true effectiveness of the blower:
The blower must force air through a hose. Each 90-degree bend in the hose reduces the effective airflow. One bend reduces airflow to approximately 1000 CFM. Any further bends may reduce the airflow to below 500 CFM.
To achieve the rated output, the engine must be well tuned and operated at full throttle. Seldom is either condition met in actual use.
To completely change the air in a manhole, much more than the equivalent volume of air must be blown in. Air in manholes stratifies so that much of the blown-in air escapes back out the top before the airstream can affect the atmosphere in the bottom of the manhole. The only way to prevent or minimize this is to ensure that the outlet end of the hose is at or near the bottom of the manhole.
Depending on the placement of the blower and the wind conditions, the intake may capture carbon monoxide from the blower exhaust and force it into the manhole. In this situation, reposition the blower or use an intake extension hose.
Getting enough deep ventilation
It is important to ventilate a manhole long enough and deep enough. On the left, unnecessary bends in the hose and inadequate positioning of the hose barely
2-38 ADS Field Safety Manual
inside the manhole significantly reduce the air flow. On the right, the lower position of the blower hose dissipates any gas or low oxygen conditions.
Respirators
Cartridge-type and supplied air respirators normally are not worn to enter manholes or other confined spaces because we use testing and ventilation to ensure that these spaces are clear prior to entry. However, drilling or ventilation may expose workers to nuisance dusts. For this reason, ADS strongly recommends and provides NIOSH-approved dust/mist respirators. These respirators filter out the dusts and particles frequently found in a manhole.
Supplied Air Respirator (SAR) A supplied air respirator (SAR) may be required for use in confined spaces where the risk from a dangerous atmosphere exists, even under clean gas test conditions. Some local authorities require using a SAR for any confined space work. If you cannot obtain a clean gas test, do not descend or enter the confined space without specific permission from your regional manager. However, even with a clean test, particularly in manholes that have tested positive before, a toxic or low oxygen condition could develop once work begins. In these cases a SAR may be necessary. Typically, these conditions would include the following:
Areas where gas alarm conditions are always present on first testing
Areas where special measures are needed to clear the line of gas
Areas where you have detected gas threats or reasonably can expect to develop a threat (near force mains, large interceptor lines, wet wells, diversion structures)
The supplied air units work by putting a constant positive air pressure into a full face mask. The pressure inside the mask makes it very unlikely that any gas from outside will enter the mask, even if a leak exists around the edge seals. The SAR provides an additional burst of air every time the wearer breathes.
SARs are complex systems, requiring specific government regulations regarding their use. Therefore, ADS requires that only persons certified by ADS on the correct operation of the supplied air units may operate them. Details on operation and maintenance are located in Chapter 3, Equipment Use and Maintenance.
Rebreather These units also are designed for the entrant to carry into a confined space. They provide 30 to 60 minutes of air, depending on the model used.
Note: A rebreather provides a 30- to 60-minute supply of air, given a normal work activity level. A person at rest (e.g., someone awaiting rescue) may be able to breathe using the unit for considerably longer.
Safe Work Practices 2-39
Escape Self-Contained Breathing Apparatus (ESCBA) These units are designed to be carried into a confined space. Personnel can don them quickly in an emergency, and they provide 5 to 15 minutes of air (depending on the model).
Respiratory Protection Program Following are the principal elements of our respiratory protection program:
Approved Respirators ADS procures and issues only NIOSH-approved respirators for personnel use.
Respirator Selection ADS has chosen respirators that provide the appropriate levels of protection under normal work conditions as well as in special circumstances.
Air Quality Standards Personnel may use only compressed air meeting the requirements for grade D breathable air in any supplied air system or to refill ESCBA units.
Work Area Surveillance Personnel should monitor the atmosphere in a confined space continuously. Project managers are responsible for monitoring the effects of respirator use on workers in the field, including environmental conditions, work intensity, and stress.
Training Personnel will receive initial training in the use of respirators and refresher training as needed. Training will cover the following topics:
Identifying hazards and consequences of improper respirator use
Existing engineering controls and using the respirator for additional protection (when applicable)
Selecting the proper respirator
Knowing the limitations of the selected respirator(s)
Donning, fitting, and checking the operation of the respirator
Wearing the respirator properly
Maintaining and storing the respirator
Handling emergency situations
Fit Checking Personnel using supplied air respirators must perform a face piece seal check prior to entering the confined space.
Maintenance Personnel must clean respirators (except for the disposable types) after each use and store and maintain them in accordance with manufacturer's recommendations. They also must inspect the respirators prior to each use or monthly when not in active use.
2-40 ADS Field Safety Manual
Medical Examinations Personnel who wear respirators should receive testing for pulmonary functions and medical qualifications. This is an integral part of initial and periodic medical examinations for field personnel.
The safety manager is responsible for evaluating the respiratory protection program as well as maintaining written operating procedures and related documents.
Rigging and Rope Work
The use of ropes and safety harnesses for workers entering manholes is the primary means of combating the dangers of falling and drowning. It also is the key to recovering a victim from a manhole. Because the role of the attendant is critical to this task, the duties of the attendant are reiterated below.
The attendant's primary duty is to serve as a safety person for the manhole worker. If an emergency occurs in the manhole, the attendant and the rope attached to the manhole worker may be the last chance for rescue. As an ADS employee, you are responsible for making sure the attendant knows the priorities. Never let the attendant's attention wander from the manhole. During descent, work in the manhole, and ascent, nothing is more important than the safety of the manhole worker.
Attendants should use the following guidelines during manhole work:
Watch the work below. Look for clues that the manhole worker could be in trouble, such as falling, slipping, or clumsy movements.
Periodically check on the manhole worker's condition. Yelling down, "Are you all right?" Receiving an answer with a nod or wave is sufficient.
Do not let the manhole worker disappear from sight more than momentarily in lines where the worker can move into the pipe. Check on the worker's condition by calling the worker back into sight.
Keep the safety rope, blower hose, and other lines running into the manhole untangled. Change position or have the manhole worker stop to untangle lines so that nothing will foul in an emergency.
Always be prepared to take the manhole worker's full weight and lift the worker up if the gas meter goes off, the worker becomes unconscious or slips and falls into the sewer line, the air blower quits, or any other cause for alarm occurs.
ADS workers use climbing gear for most normal descents and a tripod for deeper descents or situations where the descent worker must hang suspended for work.
Safe Work Practices 2-41
Basic Equipment Every crew or descent worker should be equipped with the following devices:
Rope The standard issue rope is a 7/16-inch (11 mm) diameter mountain climbing or caving rope that is 100 feet (30.5 meters) in length.
Sit Harness A sit harness is a harness that distributes your weight and hanging balance point around your hips and upper legs. The rope attaches to a D-ring in the front at the harness buckle. A sit harness with the rope attached is also worn by the attendant up top. The allows the attendant's hands to be free and allows the attendant's hips and legs to support the weight on the rope.
Chest Harness A chest harness is vital for rescue purposes. The chest harness keeps the rope close to the chest, preventing an unconscious victim from rotating to a horizontal position and getting jammed sideways during a rescue. The chest harness can be a ready-made or constructed from a loop of nylon webbing closed with a carabinier.
Carabiniers These metal loops are the basic means of attaching and securing harnesses and ropes. The opening gates should be spring-loaded with a screw-collar closure. They are used to attach ropes and Grigris or pulleys to the sit harness, close the chest harness, secure ascenders, and secure the climbing rope outside of the manhole.
Pulley Attached at the sit harness, the pulley allows the rope to form a loop down into the manhole, through the pulley, and back up to the top. It halves the weight an attendant must lift when pulling a worker from the hole. Only approved mountain climbing pulleys with known weight ratings are acceptable.
Grigri™ The Grigri is a special device that is replacing the pulley for most descents. It combines a pulley and an ascender into a single unit and allows the entrant complete control over the descent. Its use is explained in more detail in Chapter 3, Equipment Use and Maintenance.
Ascenders Ascenders give anyone pulling on a rope a better grip than just grasping the rope. They also provide an effective one-way ratchet effect that allows you to pull on a rope, secure what you have pulled, and recover the next length to be pulled by sliding the ascender along to its next grip point.
Figure-8 Descenders This friction device is attached to the topside attendant's harness and allows control over the manhole worker's rate of descent. The topside worker can stop the descent by simply cinching the rope feeding through this device.
Tripod The tripod is a special device used to insert and retrieve a worker from the manhole. The type used by ADS is equipped with a special pulley that gives a 2:1 mechanical advantage and has built-in fall
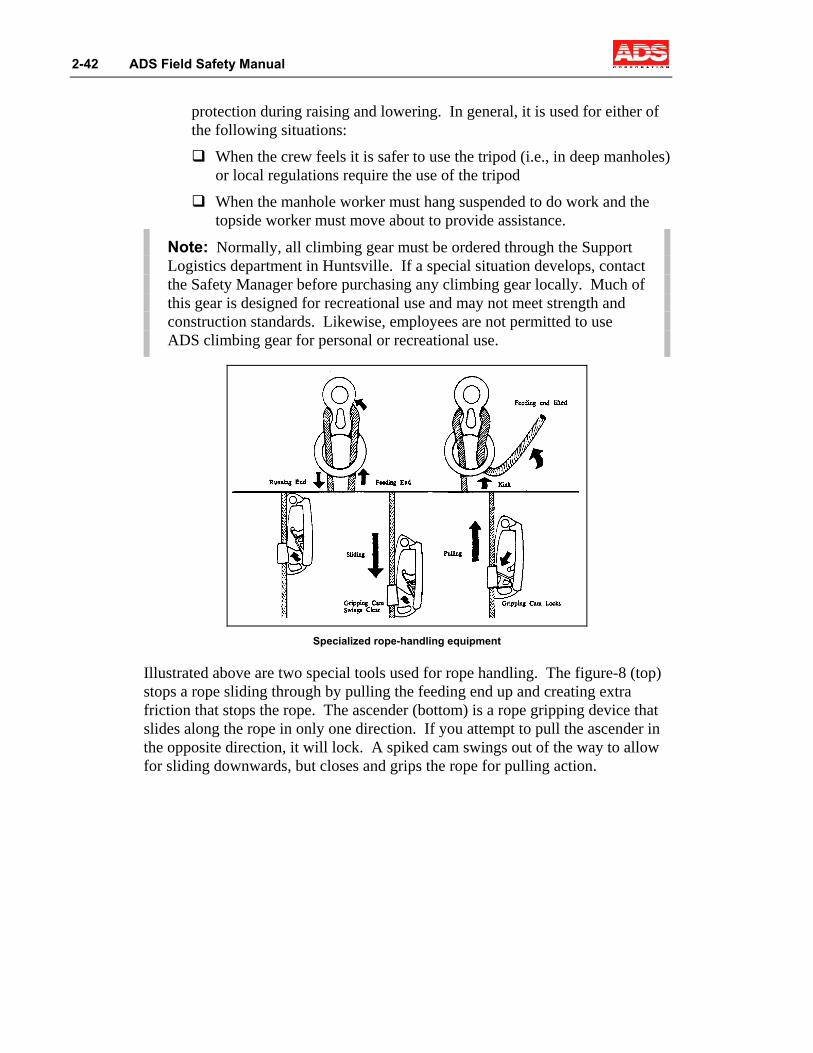
2-42 ADS Field Safety Manual
protection during raising and lowering. In general, it is used for either of the following situations:
When the crew feels it is safer to use the tripod (i.e., in deep manholes) or local regulations require the use of the tripod
When the manhole worker must hang suspended to do work and the topside worker must move about to provide assistance.
Note: Normally, all climbing gear must be ordered through the Support Logistics department in Huntsville. If a special situation develops, contact the Safety Manager before purchasing any climbing gear locally. Much of this gear is designed for recreational use and may not meet strength and construction standards. Likewise, employees are not permitted to use ADS climbing gear for personal or recreational use.
Specialized rope-handling equipment
Illustrated above are two special tools used for rope handling. The figure-8 (top) stops a rope sliding through by pulling the feeding end up and creating extra friction that stops the rope. The ascender (bottom) is a rope gripping device that slides along the rope in only one direction. If you attempt to pull the ascender in the opposite direction, it will lock. A spiked cam swings out of the way to allow for sliding downwards, but closes and grips the rope for pulling action.
Safe Work Practices 2-43
Rope Use The basic rope setup is used for 80 to 90 percent of the manhole work performed by ADS. The basic setup includes the following elements:
Looping the Rope The rope loop is a way of suspending the manhole worker so that the attendant up top only has to pull or support half the weight of that worker. The loop has a dead end, secured to a fixed object at the top of the manhole. This end supports half of the manhole worker's weight. The other half is the live end of the rope, which is the only end that moves (is taken in or let out). The attendant tends this end.
The dead end of the rope descends to the manhole worker and goes through the Grigri or pulley attached to the sit harness. What is now the live end of the rope goes up through the manhole worker's chest harness carabinier and back up to the attendant.
Securing the Rope Securing the dead end of the line usually means tying a loop around a solid fixed object. If a fixed object is not available, loop the rope around the van’s tire. A tail of rope long enough to reach back to the manhole should be left after the loop is secured around the tire. Use this extra rope to attach and secure an ascender for holding the live end of the rope.
!
Warning: Do not tie the rope to the van itself! If a vehicle crashes into the van while a worker is secured to the rope in a manhole, the impact of the crash could severely injure the worker. However, if the rope is looped around the bottom of the tire, the van would merely roll off the loop without pulling on the rope.
Tying Knots You can use many knots when working with rope in the field. One of the simplest is the figure-8 knot. Use this knot at the end of a rope or to tie a loop anywhere between the rope ends. Its main advantage over an overhand knot is that it is easier to untie, particularly after having been under load.
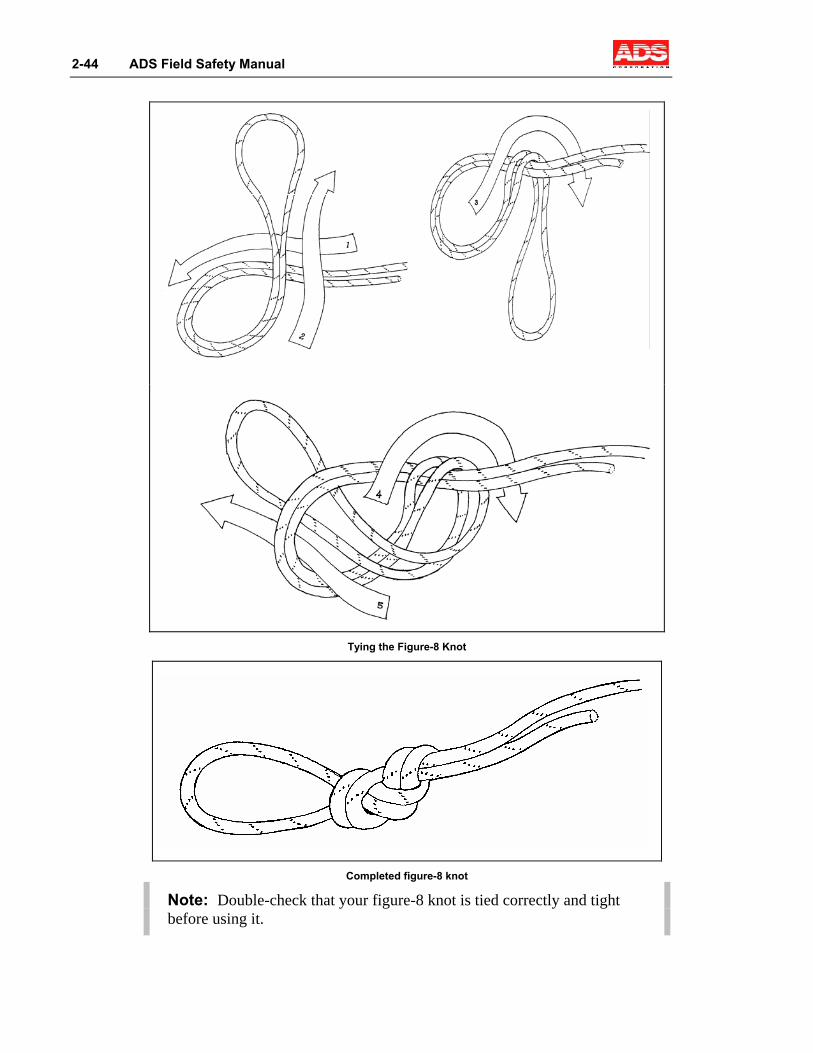
2-44 ADS Field Safety Manual
Tying the Figure-8 Knot
Completed figure-8 knot
Note: Double-check that your figure-8 knot is tied correctly and tight before using it.
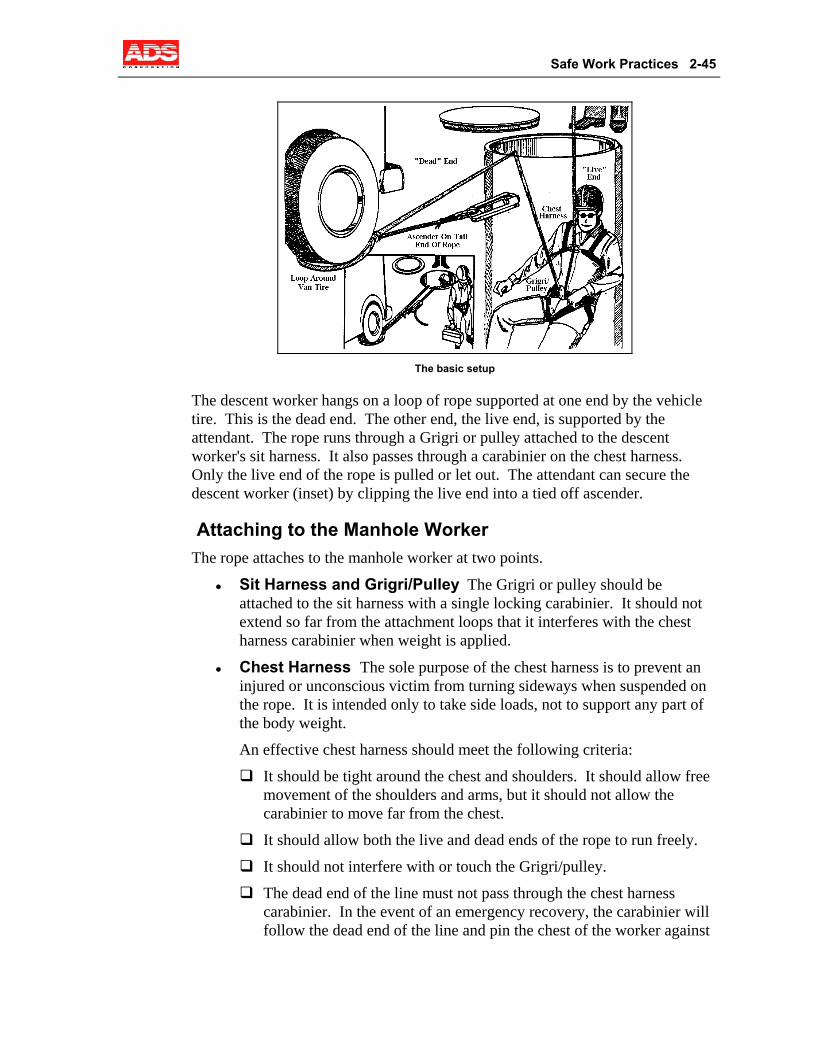
Safe Work Practices 2-45
The basic setup
The descent worker hangs on a loop of rope supported at one end by the vehicle tire. This is the dead end. The other end, the live end, is supported by the attendant. The rope runs through a Grigri or pulley attached to the descent worker's sit harness. It also passes through a carabinier on the chest harness. Only the live end of the rope is pulled or let out. The attendant can secure the descent worker (inset) by clipping the live end into a tied off ascender.
Attaching to the Manhole Worker The rope attaches to the manhole worker at two points.
Sit Harness and Grigri/Pulley The Grigri or pulley should be attached to the sit harness with a single locking carabinier. It should not extend so far from the attachment loops that it interferes with the chest harness carabinier when weight is applied.
Chest Harness The sole purpose of the chest harness is to prevent an injured or unconscious victim from turning sideways when suspended on the rope. It is intended only to take side loads, not to support any part of the body weight.
An effective chest harness should meet the following criteria:
It should be tight around the chest and shoulders. It should allow free movement of the shoulders and arms, but it should not allow the carabinier to move far from the chest.
It should allow both the live and dead ends of the rope to run freely.
It should not interfere with or touch the Grigri/pulley.
The dead end of the line must not pass through the chest harness carabinier. In the event of an emergency recovery, the carabinier will follow the dead end of the line and pin the chest of the worker against
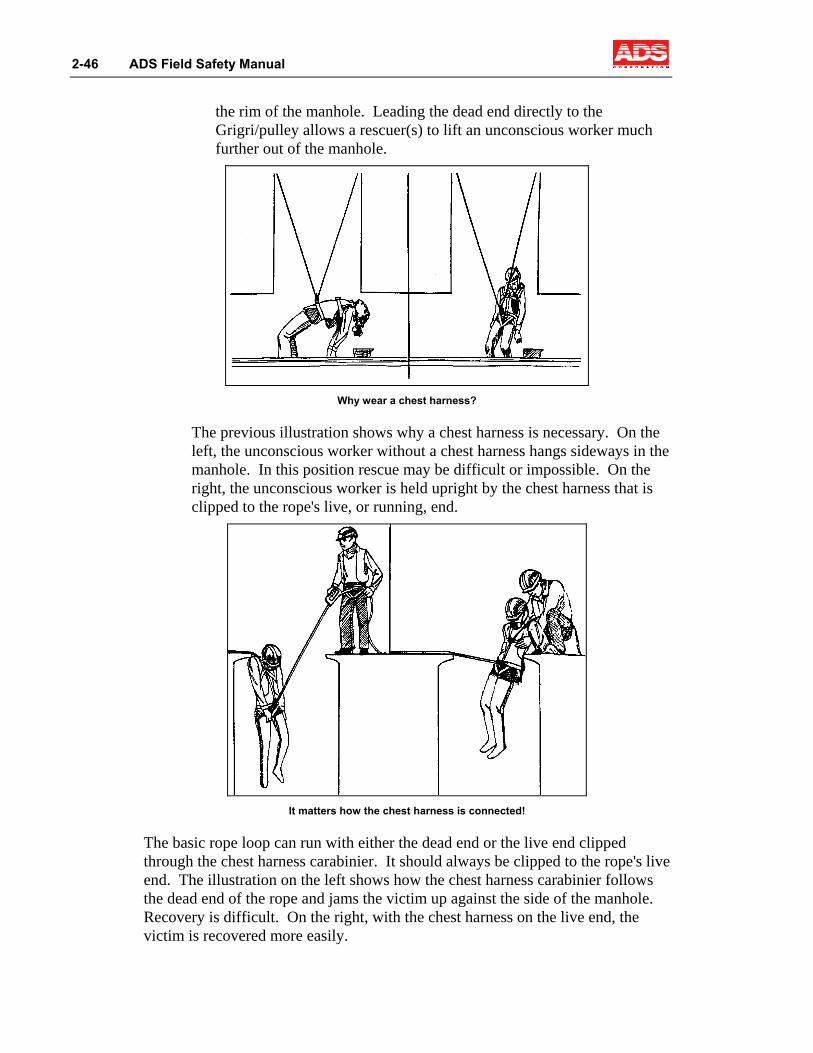
2-46 ADS Field Safety Manual
the rim of the manhole. Leading the dead end directly to the Grigri/pulley allows a rescuer(s) to lift an unconscious worker much further out of the manhole.
Why wear a chest harness?
The previous illustration shows why a chest harness is necessary. On the left, the unconscious worker without a chest harness hangs sideways in the manhole. In this position rescue may be difficult or impossible. On the right, the unconscious worker is held upright by the chest harness that is clipped to the rope's live, or running, end.
It matters how the chest harness is connected!
The basic rope loop can run with either the dead end or the live end clipped through the chest harness carabinier. It should always be clipped to the rope's live end. The illustration on the left shows how the chest harness carabinier follows the dead end of the rope and jams the victim up against the side of the manhole. Recovery is difficult. On the right, with the chest harness on the live end, the victim is recovered more easily.
Safe Work Practices 2-47
Tending the Live End of the Rope During descent, the constant support of the rope attached to the sit harness of the attendant protects the manhole worker from slipping and falling.
The live end of the rope is fed through the figure-8 descending device attached to the sit harness of the attendant. In the event of a fall, the sit harness transfers the force to the hips and legs of the attendant.
Never lower someone with your hands alone. In the event of a fall, hands – even gloved hands – cannot grip a rope with enough strength to stop and hold it.
The attendant should feed the rope out smoothly (without jerking) while maintaining a constant slight resistance to the descending worker. The descending worker should have to pull himself down. This technique assures that the line has no slack and a falling worker can be stopped in the shortest possible distance.
Be prepared for a sudden fall. Practice stopping and releasing the rope by cinching it around the figure-8.
Follow these procedures during the work in the manhole:
For short work periods or for situations requiring constant rope support and surveillance of the manhole worker, keep the rope attached to the attendant.
When the manhole worker is standing securely and has enough slack, the attendant should attach the ascender to the live end of the line below the figure-8, unhook the figure-8 from the sit harness carabinier, free the rope, and continue to hold the ascender or clip it to the sit harness. The manhole worker should wait until the transition is made before proceeding with work.
When the manhole worker needs full-time support or the attendant's assistance, make sure the live end of the rope is clogged off using an ascender tied to the dead end of the rope. The ascender is positioned at the lip of the manhole and attached to the tail of the dead end described previously. Once the proper rope length and worker position are determined, the ascender locks onto the live end and takes the weight of the manhole worker.
If the worker must hang over a line where the flow could carry him or her away after a fall, use a second deadline as a backup. Secure this deadline to an attachment point independent of the primary safety rope (e.g., to the top rung). Do not attach this second line as a short safety tether at the work level in the manhole. This will prevent recovery of the descent worker in an emergency.
2-48 ADS Field Safety Manual
Emergency Ascent For an unassisted emergency ascent, the attendant should pull the manhole worker up as fast as possible using the ascender to alternately grip, hold, and slide down for a new grip in a linked series that ratchets the line up. The key to removing a person using these steps is practice and technique. Use the following steps to rescue a descent worker:
As with every descent, the live end of the rope should be clogged off with an ascender on the rope loop. The figure-8 device on the seat harness’ D-ring should be replaced with a clogger/ascender. This ascender’s only purpose is to be used in rescuing the descent worker in an emergency. You are now ready to rescue the descent worker.
Attach the live end of the rope (in the ascender on the rope loop) to the ascender on your seat harness. Remove the rope from the ascender on the rope loop. Notice that the live end of the rope must always be attached to an ascender.
Hold the ascender in one hand and the live end of the rope in the other. Keeping your back straight, slide the ascender down the rope while moving into a squat position (your other hand is still holding the live end of the rope). Note that the further down you squat, the harder it is to stand up. Try only a half squat the first few times.
Stand up while pulling with both hands (one on the rope and one on the ascender). As you stand, the ascender grips the rope and pulls the descent worker towards you.
Repeat the previous two steps until the descent worker reaches the surface.
Grasp the descent worker’s chest harness and lift the worker out of the confined space while pulling the worker in the direction of the rope loop. Be careful to support the worker's head and neck as you lay the worker on the ground. (To properly remove the descent worker from the manhole, lift using a squatting position and stand up while keeping your back straight.)
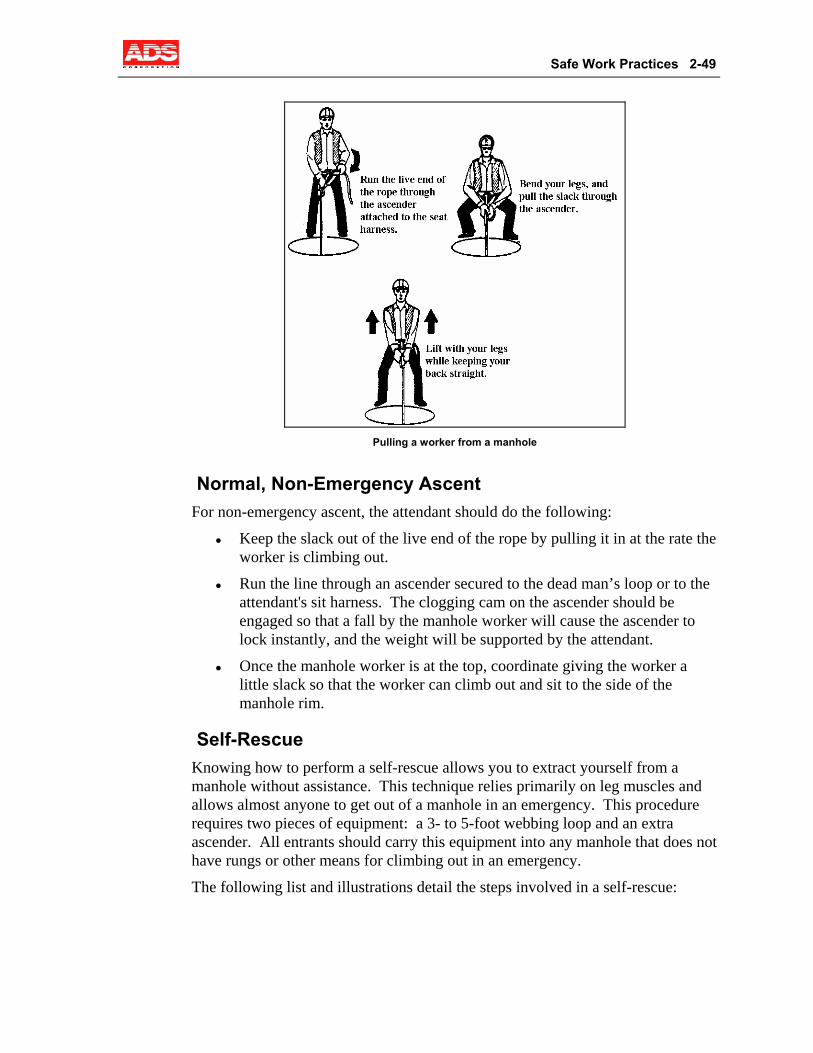
Safe Work Practices 2-49
Pulling a worker from a manhole
Normal, Non-Emergency Ascent For non-emergency ascent, the attendant should do the following:
Keep the slack out of the live end of the rope by pulling it in at the rate the worker is climbing out.
Run the line through an ascender secured to the dead man’s loop or to the attendant's sit harness. The clogging cam on the ascender should be engaged so that a fall by the manhole worker will cause the ascender to lock instantly, and the weight will be supported by the attendant.
Once the manhole worker is at the top, coordinate giving the worker a little slack so that the worker can climb out and sit to the side of the manhole rim.
Self-Rescue Knowing how to perform a self-rescue allows you to extract yourself from a manhole without assistance. This technique relies primarily on leg muscles and allows almost anyone to get out of a manhole in an emergency. This procedure requires two pieces of equipment: a 3- to 5-foot webbing loop and an extra ascender. All entrants should carry this equipment into any manhole that does not have rungs or other means for climbing out in an emergency.
The following list and illustrations detail the steps involved in a self-rescue:
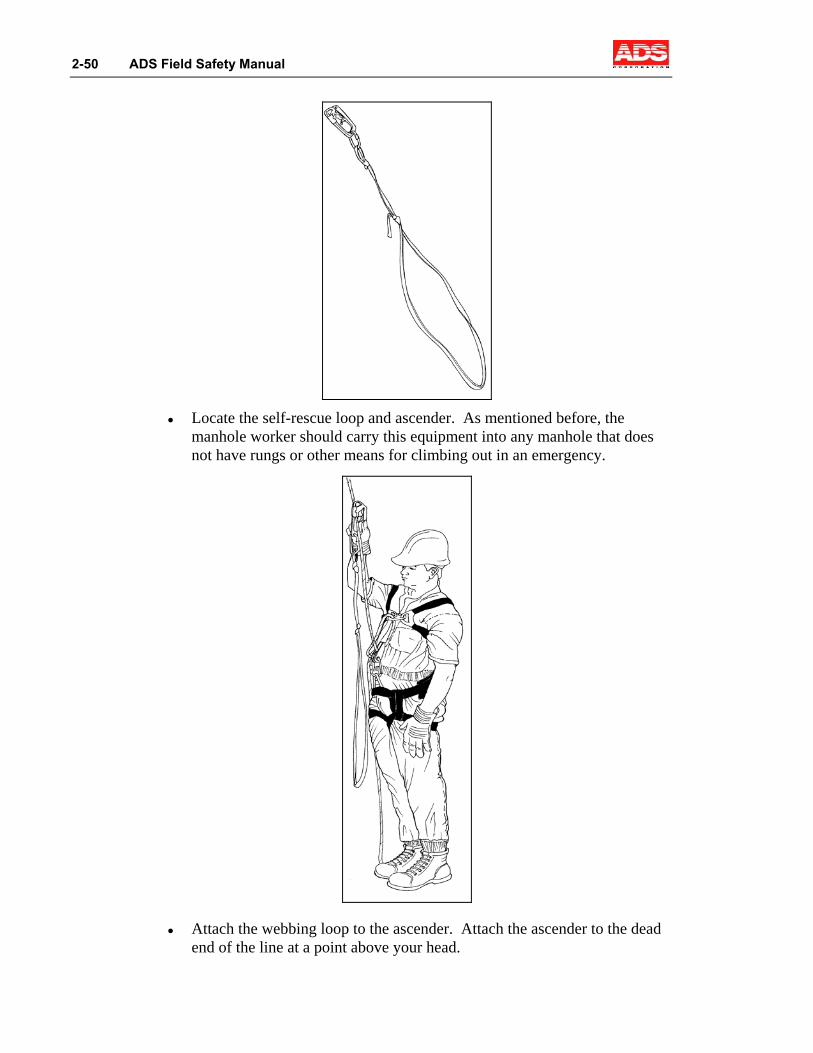
2-50 ADS Field Safety Manual
Locate the self-rescue loop and ascender. As mentioned before, the manhole worker should carry this equipment into any manhole that does not have rungs or other means for climbing out in an emergency.
Attach the webbing loop to the ascender. Attach the ascender to the dead end of the line at a point above your head.
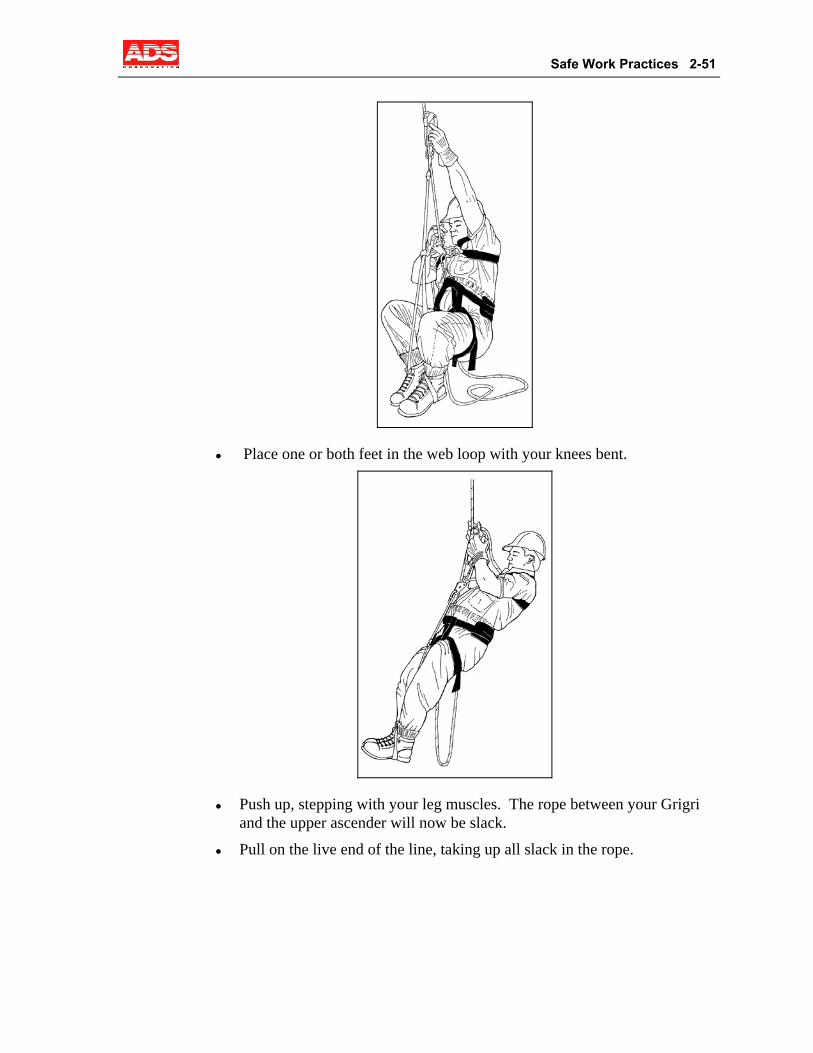
Safe Work Practices 2-51
Place one or both feet in the web loop with your knees bent.
Push up, stepping with your leg muscles. The rope between your Grigri and the upper ascender will now be slack.
Pull on the live end of the line, taking up all slack in the rope.
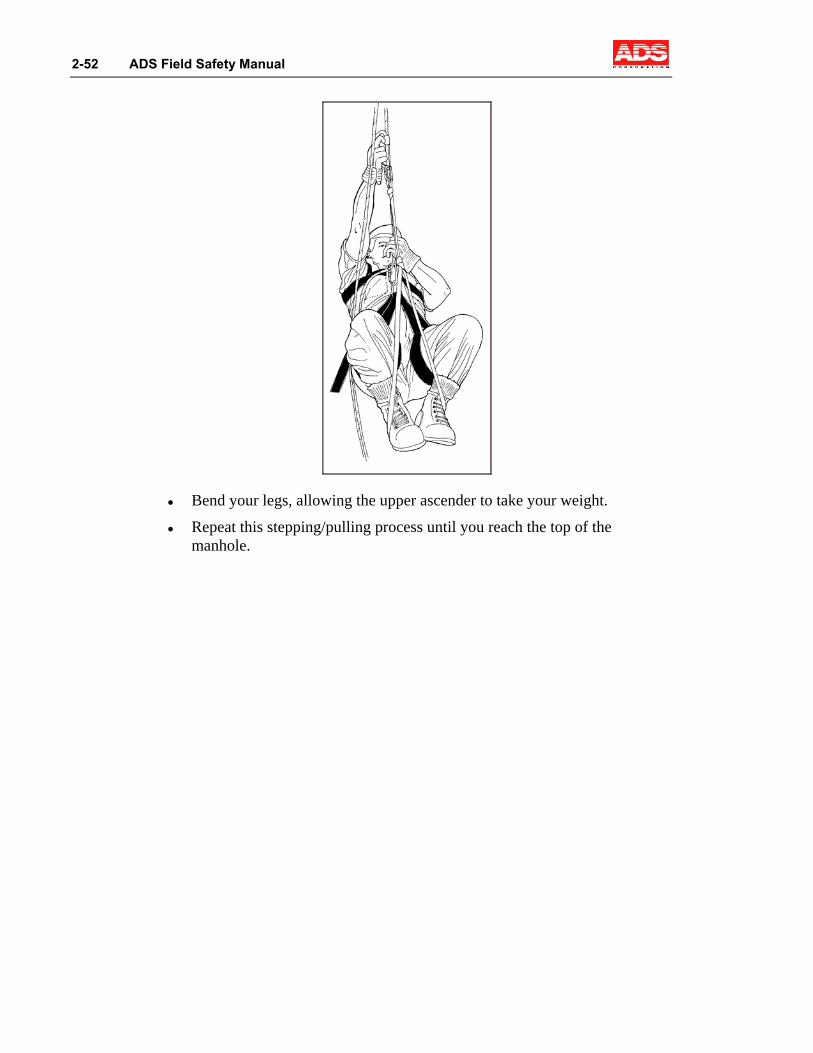
2-52 ADS Field Safety Manual
Bend your legs, allowing the upper ascender to take your weight.
Repeat this stepping/pulling process until you reach the top of the manhole.
Safe Work Practices 2-53
Special Situations The majority of our work occurs in manholes that are 5 to 20 feet deep. The previous safety procedures are sufficient to ensure your safety under these conditions. However, occasionally, there are environments in which we operate that require additional safety precautions. These environments may include the following:
Deep lines and chambers
Horizontal work spaces
Multiple chambers
Pump stations
Storm and combined systems
Treatment plants
Industrial (process) sites
This list does not cover every possible situation. The following guidelines are, in some cases, necessarily brief and general in nature. It is important to remember that every special situation is likely to be different and it would be impossible to develop detailed procedures to adequately cover every situation.
In cases where the rules and guidelines in this manual do not cover a given case or you are unsure of how to proceed, contact your project or regional manager as well as the Safety Manager. Some situations will require specialized equipment or additional crew. It also may become apparent that the specific job cannot be done safely, and you will have to discuss alternatives with the client.
Deep Lines and Chambers Deep lines present additional safety problems. Communication is hampered, ventilation is much less effective, gas and deep/fast water dangers exist, and access and retrieval in an emergency situation are much more difficult. It is vital that you understand this. Not only are the conditions different from those most commonly encountered, the price of failing to follow safety procedures could be much higher, as noted in the following:
Failure to respect the force and danger of large lines could result in you struggling against the current and the weight of water-filled boots while trying to gain any sort of handhold and being swept downstream.
Failure to provide additional ventilation or respiratory protection and to test for gas at the proper location could place you in a cloud of gas so toxic that you probably would not be able to reach the ladder (much less begin to climb to safety).
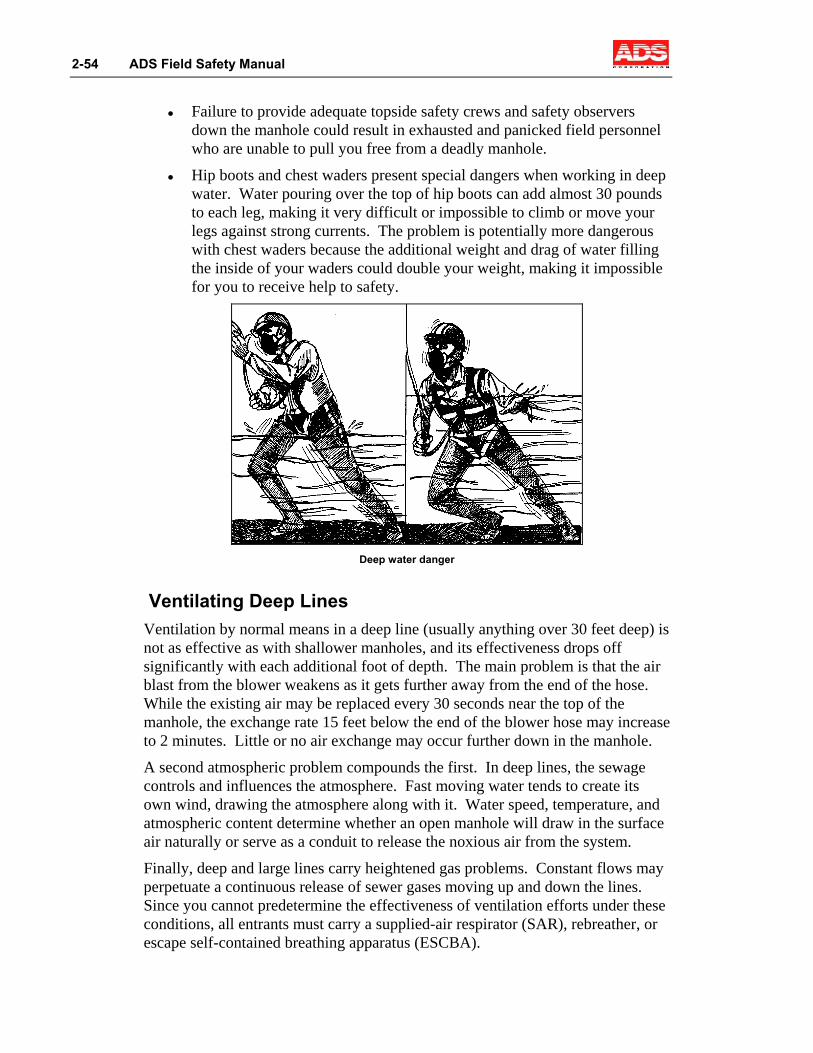
2-54 ADS Field Safety Manual
Failure to provide adequate topside safety crews and safety observers down the manhole could result in exhausted and panicked field personnel who are unable to pull you free from a deadly manhole.
Hip boots and chest waders present special dangers when working in deep water. Water pouring over the top of hip boots can add almost 30 pounds to each leg, making it very difficult or impossible to climb or move your legs against strong currents. The problem is potentially more dangerous with chest waders because the additional weight and drag of water filling the inside of your waders could double your weight, making it impossible for you to receive help to safety.
Deep water danger
Ventilating Deep Lines Ventilation by normal means in a deep line (usually anything over 30 feet deep) is not as effective as with shallower manholes, and its effectiveness drops off significantly with each additional foot of depth. The main problem is that the air blast from the blower weakens as it gets further away from the end of the hose. While the existing air may be replaced every 30 seconds near the top of the manhole, the exchange rate 15 feet below the end of the blower hose may increase to 2 minutes. Little or no air exchange may occur further down in the manhole.
A second atmospheric problem compounds the first. In deep lines, the sewage controls and influences the atmosphere. Fast moving water tends to create its own wind, drawing the atmosphere along with it. Water speed, temperature, and atmospheric content determine whether an open manhole will draw in the surface air naturally or serve as a conduit to release the noxious air from the system.
Finally, deep and large lines carry heightened gas problems. Constant flows may perpetuate a continuous release of sewer gases moving up and down the lines. Since you cannot predetermine the effectiveness of ventilation efforts under these conditions, all entrants must carry a supplied-air respirator (SAR), rebreather, or escape self-contained breathing apparatus (ESCBA).
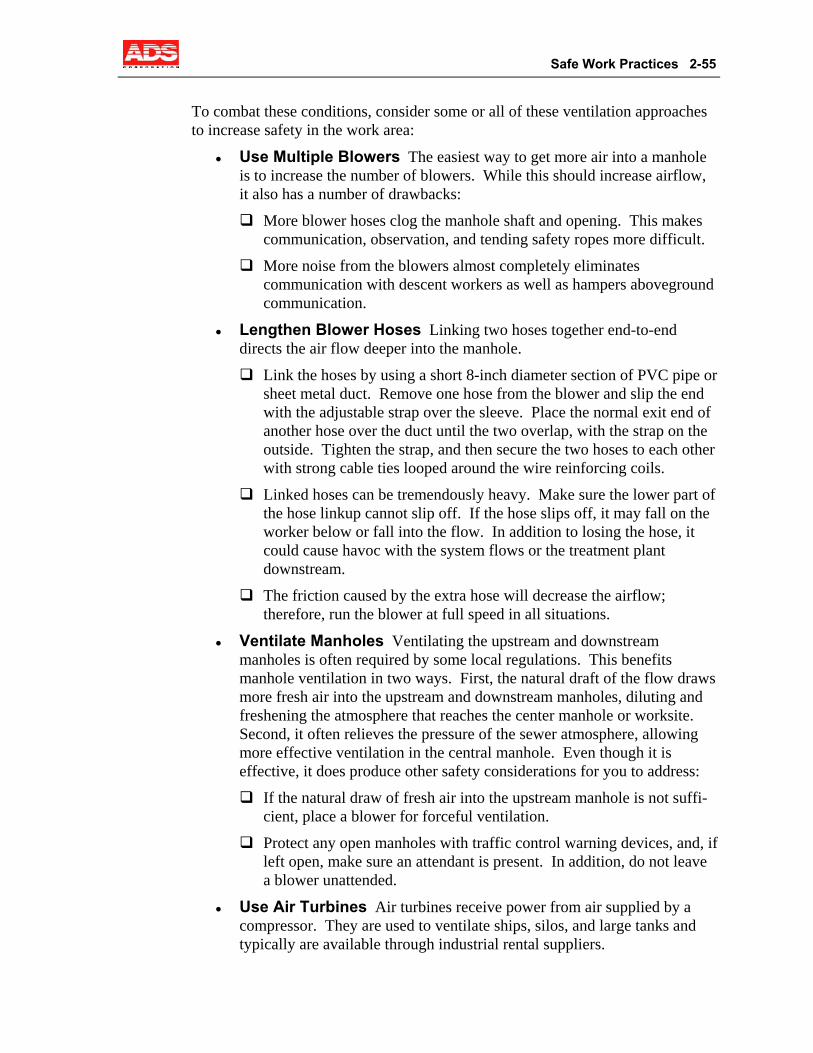
Safe Work Practices 2-55
To combat these conditions, consider some or all of these ventilation approaches to increase safety in the work area:
Use Multiple Blowers The easiest way to get more air into a manhole is to increase the number of blowers. While this should increase airflow, it also has a number of drawbacks:
More blower hoses clog the manhole shaft and opening. This makes communication, observation, and tending safety ropes more difficult.
More noise from the blowers almost completely eliminates communication with descent workers as well as hampers aboveground communication.
Lengthen Blower Hoses Linking two hoses together end-to-end directs the air flow deeper into the manhole.
Link the hoses by using a short 8-inch diameter section of PVC pipe or sheet metal duct. Remove one hose from the blower and slip the end with the adjustable strap over the sleeve. Place the normal exit end of another hose over the duct until the two overlap, with the strap on the outside. Tighten the strap, and then secure the two hoses to each other with strong cable ties looped around the wire reinforcing coils.
Linked hoses can be tremendously heavy. Make sure the lower part of the hose linkup cannot slip off. If the hose slips off, it may fall on the worker below or fall into the flow. In addition to losing the hose, it could cause havoc with the system flows or the treatment plant downstream.
The friction caused by the extra hose will decrease the airflow; therefore, run the blower at full speed in all situations.
Ventilate Manholes Ventilating the upstream and downstream manholes is often required by some local regulations. This benefits manhole ventilation in two ways. First, the natural draft of the flow draws more fresh air into the upstream and downstream manholes, diluting and freshening the atmosphere that reaches the center manhole or worksite. Second, it often relieves the pressure of the sewer atmosphere, allowing more effective ventilation in the central manhole. Even though it is effective, it does produce other safety considerations for you to address:
If the natural draw of fresh air into the upstream manhole is not suffi-cient, place a blower for forceful ventilation.
Protect any open manholes with traffic control warning devices, and, if left open, make sure an attendant is present. In addition, do not leave a blower unattended.
Use Air Turbines Air turbines receive power from air supplied by a compressor. They are used to ventilate ships, silos, and large tanks and typically are available through industrial rental suppliers.
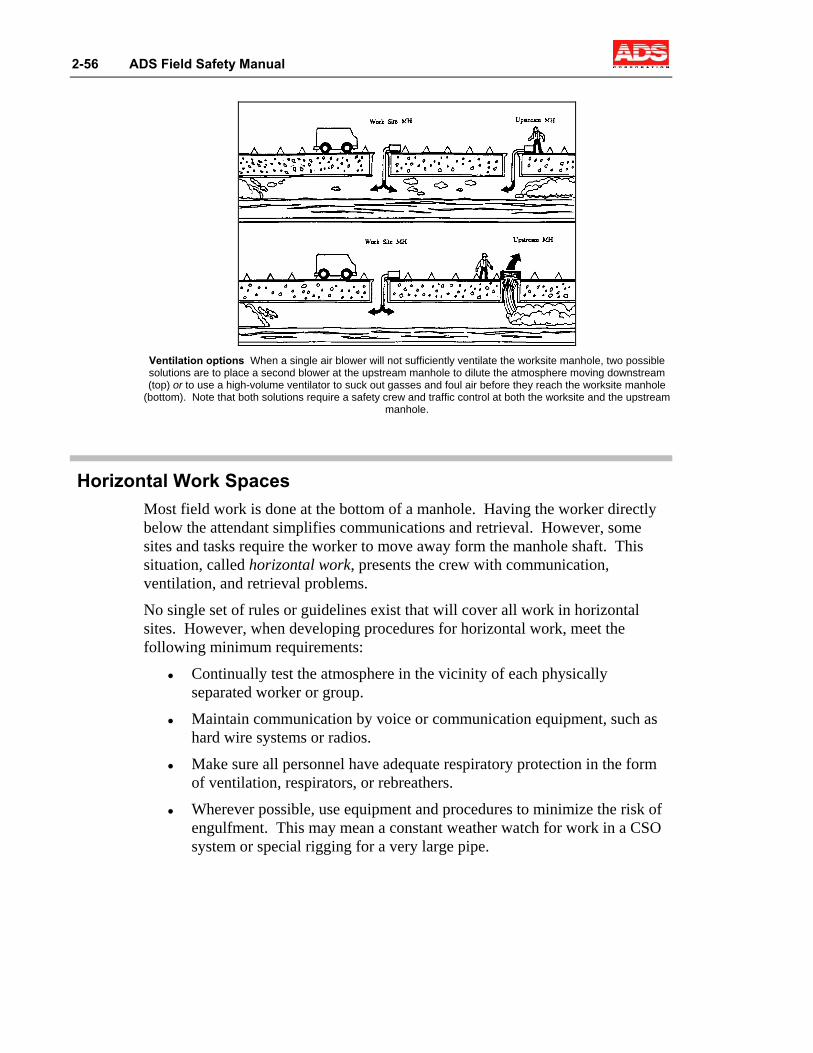
2-56 ADS Field Safety Manual
Ventilation options When a single air blower will not sufficiently ventilate the worksite manhole, two possible solutions are to place a second blower at the upstream manhole to dilute the atmosphere moving downstream (top) or to use a high-volume ventilator to suck out gasses and foul air before they reach the worksite manhole
(bottom). Note that both solutions require a safety crew and traffic control at both the worksite and the upstream manhole.
Horizontal Work Spaces Most field work is done at the bottom of a manhole. Having the worker directly below the attendant simplifies communications and retrieval. However, some sites and tasks require the worker to move away form the manhole shaft. This situation, called horizontal work, presents the crew with communication, ventilation, and retrieval problems.
No single set of rules or guidelines exist that will cover all work in horizontal sites. However, when developing procedures for horizontal work, meet the following minimum requirements:
Continually test the atmosphere in the vicinity of each physically separated worker or group.
Maintain communication by voice or communication equipment, such as hard wire systems or radios.
Make sure all personnel have adequate respiratory protection in the form of ventilation, respirators, or rebreathers.
Wherever possible, use equipment and procedures to minimize the risk of engulfment. This may mean a constant weather watch for work in a CSO system or special rigging for a very large pipe.
Safe Work Practices 2-57
Multiple Chambers Underground structures often have offset vertical shafts and/or many chambers. These conditions require some special considerations:
Unless you are using communication equipment, lower a second descent worker every time the line-of-sight is broken between the top safety crew and the descent worker to maintain communication and safety observations. Remember two key points:
Do not allow the descent worker to disappear or work out of sight any longer than momentarily.
You must have additional lighting, more than just a flashlight or the descent worker's hand lantern. The quartz-halogen lanterns used by ADS exist for this purpose. The observer must be able to see hand signals or behavior that might indicate the descent worker is in distress.
Every time a safety line must travel through a door, over a lip or wall, down an offset shaft, or through any other obstruction that would prevent an attendant from pulling an unconscious worker from the manhole, strategically place one or two (when necessary) secondary descent workers to keep safety lines clear and perform rescues if necessary.
When vertical shafts descend from underground chambers or are offset, the crew or equipment at the top of the underground shaft must be properly positioned and completely capable of performing emergency recovery. If the line is too deep for a single person to pull up a victim unassisted, a second or third worker must be sent down to tend the line.
Whenever you are sending a secondary descent worker or team below ground, augment the necessary aboveground support in the following way:
Increase the size of the topside crew.
Consider increasing the number of blowers.
Support each worker in a chain of workers with gas testing and safety ropes while underground.
Sometimes it can be safer and easier to supply the descent worker(s) with a SAR to avoid the problems with restricted ventilation. An SAR would be appropriate under either of the following circumstances:
A continuously safe atmosphere is not likely, even though you have obtained a clean gas test in the workspace.
Ventilation in the work space is not adequate, even when no immediate atmospheric danger exists.
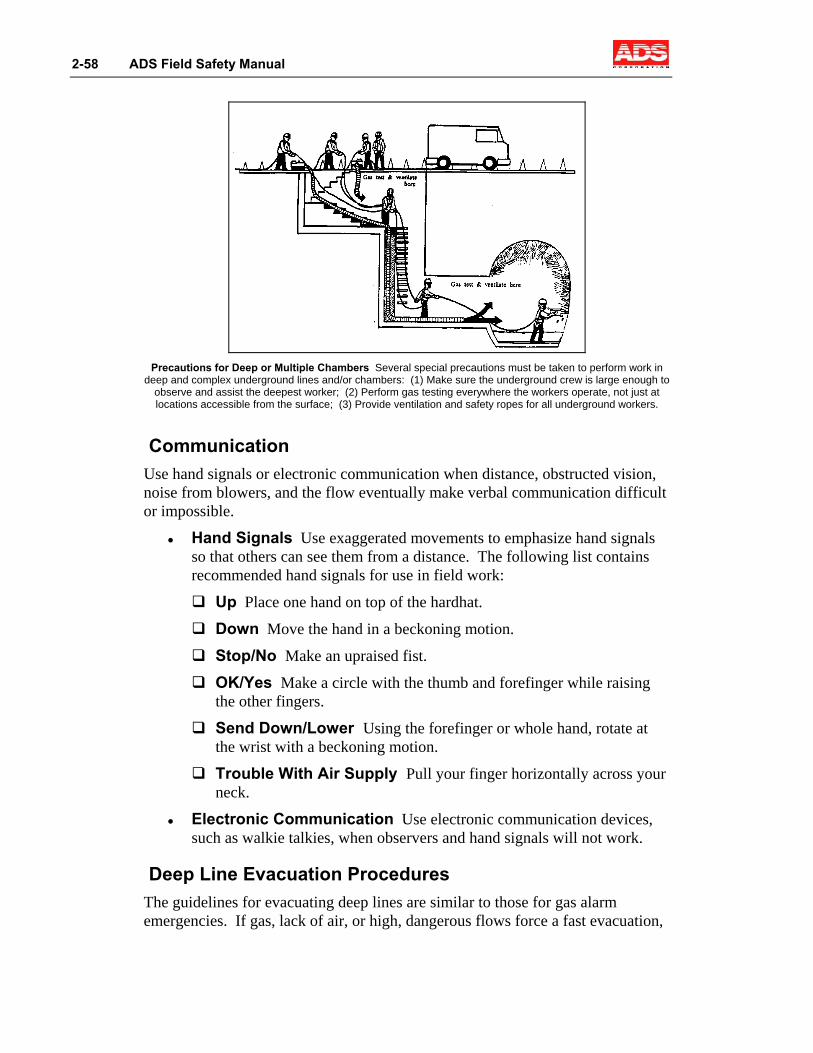
2-58 ADS Field Safety Manual
Precautions for Deep or Multiple Chambers Several special precautions must be taken to perform work in
deep and complex underground lines and/or chambers: (1) Make sure the underground crew is large enough to observe and assist the deepest worker; (2) Perform gas testing everywhere the workers operate, not just at locations accessible from the surface; (3) Provide ventilation and safety ropes for all underground workers.
Communication Use hand signals or electronic communication when distance, obstructed vision, noise from blowers, and the flow eventually make verbal communication difficult or impossible.
Hand Signals Use exaggerated movements to emphasize hand signals so that others can see them from a distance. The following list contains recommended hand signals for use in field work:
Up Place one hand on top of the hardhat.
Down Move the hand in a beckoning motion.
Stop/No Make an upraised fist.
OK/Yes Make a circle with the thumb and forefinger while raising the other fingers.
Send Down/Lower Using the forefinger or whole hand, rotate at the wrist with a beckoning motion.
Trouble With Air Supply Pull your finger horizontally across your neck.
Electronic Communication Use electronic communication devices, such as walkie talkies, when observers and hand signals will not work.
Deep Line Evacuation Procedures The guidelines for evacuating deep lines are similar to those for gas alarm emergencies. If gas, lack of air, or high, dangerous flows force a fast evacuation,
Safe Work Practices 2-59
leave your tools and nonessentials behind and concentrate only on getting out safely as fast as possible.
Evacuate an injured or the most vulnerable, exposed worker first. These require the in-manhole observer to get the primary manhole worker to the bottom of the manhole shaft or to his/her position before ascending.
Always rehearse evacuation procedures with topside safety workers and in-manhole crew members before beginning work in deep lines. Failing to exercise extraordinary caution in deep lines can have fatal consequences. When things begin to go wrong in deep lines, help is far away. Those who can help may not even know you are in trouble. Using common sense, exercising extraordinary caution, and following all safety procedures offers your greatest chance of getting back to the surface safely.
Pump Stations
Working in the line immediately upstream of a pump station may require having the pump(s) online to maintain a fairly constant flow level and prevent the flow from backing up and rising suddenly at your location. To ensure that the pumps remain online, make sure they are locked and attended while work is in progress. If you cannot get an attendant, take provisions, such as lock out-tag out, to prevent an inadvertent shutdown. The same precautions apply to gates or valves. When working in a wet well, make sure a qualified individual attends the pumps while work is in progress.
When working immediately downstream of a pump station, apply the same type of precautions. However, consider having the client turn the pumps off and close the gates/valves to prevent surges at your location. Planning and close coordination with the client or municipality are critical to working safely in these locations.
Note: H2S buildup is a frequent problem at pump stations. Be sure to check the atmosphere carefully.
2-60 ADS Field Safety Manual
Storm and Combined Systems
An additional hazard associated with working in these lines is the weather. Remember, never descend a large (over 72 inches) combined or storm sewer during or immediately following a rain event. Descend 36- to 72-inch lines during or immediately following a rain event only with permission from the main office. A rain event at or upstream of your location can cause a sudden and dramatic surge in the flow. The key in this situation is careful planning and close attention to weather reports in your area.
Treatment Plants
Another special situation involves installing and maintaining instrumentation at wastewater treatment plants. Several unique hazards are associated with this work:
Electrical Hazards Any installation or servicing of our equipment may involve working close to energized circuits. ADS prohibits our personnel from working on any electrical circuit rated at more than 50 volts unless the individual has had specialized training and certification in performing work of this nature. In many cases, this will require having authorized plant personnel de-energize circuits prior to our work.
Drowning Drowning is a very real hazard when working in and around clarifiers, aerator basins, flumes, and other exposed channels. Make sure you are secured by a safety harness and line and attended by an assistant.
Construction Take special care to prevent injury from construction vehicles, falling objects, and other construction-related activities. At these sites, wearing safety shoes and hardhats is mandatory.
Noise Noise hazards are present in certain areas of treatment plants. Make sure that you wear the hearing protectors provided.
The standard hazards and precautions that apply to other confined spaces, such as atmospheric testing and ventilation, apply at treatment plants as well.
Industrial Areas Discharging chemicals into a collection system is regulated by federal, state, and local authorities. However, instances may occur where hazardous chemicals are approved for release or discharged accidentally or illegally. This is most likely to occur in or downstream of industrial areas, especially where manufacturers produce or use chemicals in high quantities. Some areas may have received testing for illegal discharges. You may be able to get information, particularly historical test data and approved release information, through the client.
Safe Work Practices 2-61
pH Testing In many cases, chemicals will cause a distinct and/or unusual odor in the manhole. If the manhole smells funny or the flow appears unusual, do not enter the manhole without checking with the client. One method for checking sites that are in close proximity to an industrial facility is to test the pH of the flow. This also may be a good idea as part of investigations in industrial areas where the potential for chemical discharges exists.
In order to test for pH, use a wide-range pH paper with a resolution of 1 pH. This paper is available from Support Logistics in Huntsville. If time constraints require you to purchase pH locally, contact Huntsville for information on the type of paper to buy.
Dip the end of the paper into the flow, but do not submerge it. Compare the color of the wetted end of the paper to the color chart on the side of the dispenser. Wastewater should have a pH of 7 (neutral). A pH of less than 7 indicates the presence of acid, while a pH greater than 7 shows the presence of a base. Do not enter the manhole if the paper indicates a pH of 6 or less or a pH of 8 or greater. Notify the client, your project manager, and the Safety Department in Huntsville.
Remember that pH only indicates the presence of acids or bases. Although it is a primary indicator of industrial discharge, it does not indicate the presence of many hazardous chemicals. Communication with the client is critical if you suspect the presence of chemical in the flow.
Industrial (Process) Sites
These locations may present some of the same types of hazards found at wastewater treatment plants. The process flow's composition or temperature also may constitute a hazard. It is absolutely essential that you determine what, if any, chemicals are present in the flow and any dangers associated with those chemicals. The temperature of the flow may be critical, since it may change quickly.
Remember that careful planning and close coordination with plant personnel are critical.
Physical Inspection Physical inspection of a sewer system involves taking inventory of its manholes and line segments, locating and identifying individual system defects, and compiling an accurate database of system information. Physical inspection work is particularly demanding because of the fast pace and tight schedules typically involved. The heavy use of equipment demands timely inspections and maintenance. Replace any piece of equipment that is of questionable condition.
2-62 ADS Field Safety Manual
As always, pay close attention to safety setup and rigging. Use the following safety guidelines when conducting a physical inspection:
Be very careful when taking measurements between manholes in streets. Whenever possible, the field crew should use an off-road path that is parallel to the work area.
Avoid pole/line contact when using mirror poles near electrical lines.
When using hand-held mirrors, be careful not to blind motorists.
TV Inspection TV Inspection is a technique developed to review and evaluate sewer line defects that are difficult or impossible to reach in person. This technique uses a closed-circuit TV unit, including a TV vehicle, generator, camera, winch, and retraction equipment.
!
Warning: Verify that the power is disconnected before attempting any repairs to electrically-powered equipment.
Since all the TV equipment is wired together, be aware of the possibility of electric shock. If any piece of equipment is causing shocks, discontinue using it immediately until repairs can be made. Further damage to personnel and equipment is not acceptable.
The camera lights get extremely hot and, therefore, should be handled only with work gloves.
Lifting the winches and crawler cameras may take two people.
Some TV trucks only allow you to work out of the side door. Therefore, be very careful to check for traffic when entering and exiting the trucks.
Always stop the traffic at intersections when pulling power cords through to the next manhole.
Since the winch has a very low profile (about 12 inches), surround it with traffic cones and flags to increase its visibility. At a site with traffic, never leave the winch unattended, even when it is carefully marked. In all other settings, keep the winch clearly visible and easily accessible.
Sometimes you may have a TV truck blocking one traffic lane and a winch blocking the other. In this situation, deploy additional workers to help guide traffic.
Safe Work Practices 2-63
Smoke Testing Smoke Testing is a procedure in which a mechanical blower propels chemical smoke under low pressure into portions of the sewer system. Smoke exiting through various manhole and line defects (including service lines) helps personnel locate and identify system defects. Follow these guidelines when performing smoke testing:
Always use two people to lift the smoke blower.
Wear gloves and goggles to ignite and handle smoke bombs. Never cover the holes on the side of the smoke bomb with your hands.
Ignite smoke bombs well away from the manhole. When igniting the smoke bomb, do not point the ends toward yourself or anyone else.
Run the smoke blower on top of the manhole for at least 30 seconds before inserting the smoke bomb into the machine. Never put the smoke bomb into the manhole.
Always remove the smoke blower from the manhole before filling it with fuel. If the unit runs out of fuel while blowing a line segment, allow it to cool down for at least 3 minutes before filling it with fuel again.
Everyone working near an active smoke blower that is on or near a roadway must wear a reflective road vest.
If a line is blocked or a blower is not working correctly, the worksite area can fill with smoke. Never allow traffic to pass through a street filled with smoke. Deploy additional workers if the smoke is interfering with traffic. If necessary, hold the traffic until the smoke clears.
Never leave the smoke blower unattended.
Be very careful when smoke testing near schools, hospitals, and nursing homes. Notify three to four administrators in these buildings or plug the line to the building before starting the test. Keep in mind that a rushed evacuation could cause injuries, especially one involving young, sick, or elderly people.
Never enter a manhole to remove sewer line plugs because of the built-up pressure involved. Always remove the plugs from aboveground.
2-64 ADS Field Safety Manual
Flow Isolation Flow isolation involves dividing a mini-system into smaller systems (microsystems) to study infiltration. Because it is necessary to measure base system flows, flow isolation studies occur only at night. Flow quantities measured in different microsystems are compared to determine the location of infiltration. Follow these guidelines when performing flow isolation studies:
Because the work will occur at night, always notify a homeowner if you will be working in the homeowner's yard.
Never stay in the manhole for more than 45 minutes at a time, even when taking multiple readings.
Because flow isolation work occurs at night, clearly mark a path to the worksite. If the manhole is not easy to find, you may get lost trying to find your way back to the van in the dark.
Call the police immediately before going in the field. Give them the vehicle license plate numbers and the names of the streets on which you will be working. This communication allows the police to calm alarmed homeowners and may save you a visit from the police.
Wear an orange vest and reflective clothing. This will increase your visibility to motorists and help identify you as a field worker, not a burglar.
Dye Testing Dye testing is a method of quantifying inflow defects. Because leaks found by smoke testing may not allow water into the system, dye testing helps to determine the severity of the leaks. Dye testing involves saturating the ground around the defect with water and dye and then observing the manhole to see what enters the system. Follow these guidelines when conducting dye testing:
Use proper lifting techniques when removing the top of a storm drain catch basin.
If fire hoses attached to hydrants cross the path of traffic, passing cars could catch and drag the hose. In this situation, deploy additional workers to slow down and guide traffic through the hazardous area.
One type of dye dilution testing requires installing a water quality sampler in the manhole. These samplers are very heavy when full, so use two people to lift them out of the manhole.
3-1
C H A P T E R 3
Equipment Operation and Maintenance
This chapter provides instruction on operating and maintaining the standard field equipment used in ADS operations. In some situations, operating this equipment is inherently dangerous; however, certain equipment primarily functions to preserve life.
Read this chapter carefully, making sure you understand how to properly operate your equipment. Consult the manufacturer’s manual for detailed and specific information when necessary. Your life and the lives of your coworkers may depend on this knowledge.
3-2 ADS Field Safety Manual
Personal Safety Equipment The personal safety equipment used in ADS operations include safety rope, harnesses and webbing, ascenders, and carabiniers.
Safety Rope The safety rope is a special type of rope primarily used in caving and rescue. It consists of a bundle of fibers covered with a woven mantle. The internal fibers provide almost all the support; the mantle primarily protects the fibers from abrasion and cutting. The rope is designed to withstand forces of falls many times greater than the demands put on the rope for ADS applications. With proper care, a safety rope has an average life of 2 years.
!
Warning: Never use a rope if you are unsure of its condition. Replace any rope you suspect may have damage.
Many kinds of rope are available, but only one is suitable for use. Never purchase rope without first contacting the Safety or Purchasing Departments in Huntsville.
Follow these requirements for using and caring for the safety rope:
Never use your primary safety rope to pull a vehicle. This will ruin the rope.
Never walk or stand on a rope. This forces dirt and grit deep into the core, which may lead to failure.
Keep the rope free of oil and gasoline. These cause the fibers to deteriorate and weaken.
Dirt works its way through the mantle, abrading and weakening the rope fibers. Therefore, wash the rope in a washing machine with detergent to clean off dirt, oil, and gasoline. Then, lay out the rope in a clean area or hang it loosely to dry. Do not dry the rope in a dryer because the high heat may cause damage.
Inspect the rope daily, and look for cuts, frayed spots, or places where the internal fibers protrude through the mantle. Replace badly damaged ropes.
When removing a safety rope from front-line service, but keeping it as a utility rope, clearly identify or label it as a utility rope not to be used for safety. Mark utility ropes with orange (or contrasting color) paint at the ends and the center. Do not use these as safety ropes.

Equipment Operation and Maintenance 3-3
Harnesses and Webbing The same rules that apply to ropes apply to safety harnesses and webbing. Avoid gasoline and oil, check them daily for severely worn/cut sections or broken stitching, and wash them in a washing machine with detergent as necessary. If you need to cut the harness or the webbing, melt the cut ends to fuse them together to prevent unraveling.
Ascenders and Carabiniers These generally are durable and trouble-free and need only to be kept clean. However, check aluminum carabiniers often for small, hairline cracks that can occur when dropped or hit. Replace carabiniers that have cracks, do not completely close with spring action, or do not lock with a screw collar. Use only locking carabiniers.
Ascenders require a strong spring action on the spiked gripping cam to work effectively. Do not use ascenders with weak or broken springs. To test the ascender spring, move the gripping cam without the rope in place. The spring loading on the cam should push it to a stop against the ascender body.
3-4 ADS Field Safety Manual
Gas Meter
The gas meter is the principal life-support piece of equipment used in confined space entry. Therefore, you must perform a functional test of your gas meter on a regular basis and calibrate it as necessary. Because several gas meter makes and models are in use at ADS, consult your gas meter’s operator’s manual for detailed instructions on its proper use, operation, and maintenance.
Functional Testing and Calibration The term functional test refers to the process in which the gas meter’s sensors are exposed to a calibration gas. The calibration gas contains a known concentration of a hazardous gas (e.g., hydrogen sulfide). If the gas meter reads the gas concentration accurately (within 10 percent) during the functional test, no further action is required. If the readings are out of tolerance, you must calibrate the meter.
Refer to the manufacturer’s documentation for detailed information about functionally testing and calibrating your gas meter. Perform the tests at the time interval recommended by the manufacturer.
Record the results of each functional test and/or calibration on the ADS gas meter calibration record. Keep these forms with the gas meter at all times; they are subject to inspection.
Equipment Operation and Maintenance 3-5
Respirator
Two general types of respirators exist that supply air to the wearer. The first type is called a self-contained breathing apparatus (SCBA). These units have a compressed-air tank, similar to the SCUBA tank a diver wears, that is connected to a facemask. The second type is called a supplied air respirator (SAR). In this case, a much larger tank supplies air through a hose (up to 250 feet long) to the wearer. In both cases, the length of time the respirator provides air to the wearer depends on the tank size, tank pressure, and activity of the wearer. Both respirators have advantages and disadvantages, depending on the purpose and location for use.
ADS uses a supplied air respirator (SAR) for most situations that require more than a dust/mist respirator. By keeping the bulky air tank outside the manhole and supplying air through a hose, this setup is less awkward and safer than the backpack SCBA. Personnel typically will use SCBAs only in aboveground environments. One exception to this is the escape-type SCBA currently under evaluation for field use. All the units are pressure-demand types that provide air to breathe as well as maintain positive pressure inside a full-face mask to prevent toxic atmosphere from penetrating.
Respirator Use These are the general guidelines for using a respirator (SAR & SCBA):
You may not use a SAR or SCBA unless you have medical clearance and proper certification. ADS currently is implementing expanded medical examinations and developing an internal training and certification program for SAR and SCBA use.
Never use a SAR or SCBA unless your supervisor knows and approves its use, the location of its use, and the personnel using it.
All SAR kits must have two full-face masks and enough hose for each unit to operate independently. The second unit is a standby unit ⎯ required by law ⎯ for use in rescuing the wearer of the primary unit. Do not use the second unit as a spare if the primary unit fails. Two operable units must be on site during operations.
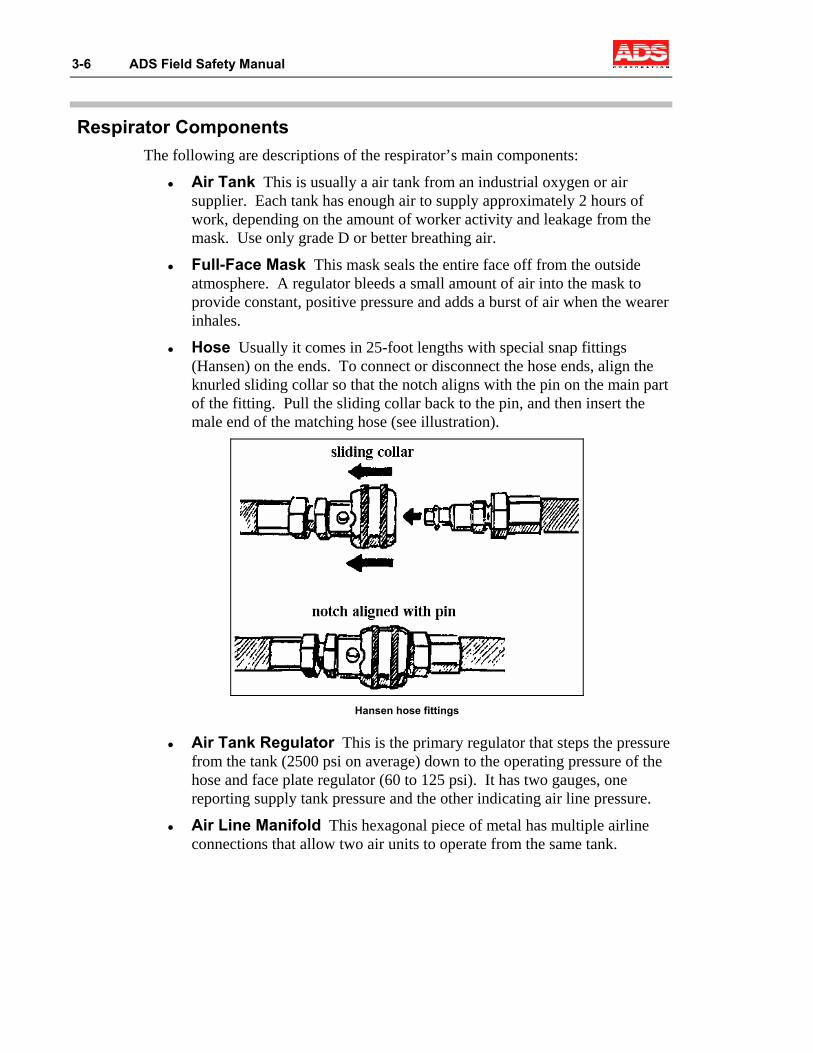
3-6 ADS Field Safety Manual
Respirator Components The following are descriptions of the respirator’s main components:
Air Tank This is usually a air tank from an industrial oxygen or air supplier. Each tank has enough air to supply approximately 2 hours of work, depending on the amount of worker activity and leakage from the mask. Use only grade D or better breathing air.
Full-Face Mask This mask seals the entire face off from the outside atmosphere. A regulator bleeds a small amount of air into the mask to provide constant, positive pressure and adds a burst of air when the wearer inhales.
Hose Usually it comes in 25-foot lengths with special snap fittings (Hansen) on the ends. To connect or disconnect the hose ends, align the knurled sliding collar so that the notch aligns with the pin on the main part of the fitting. Pull the sliding collar back to the pin, and then insert the male end of the matching hose (see illustration).
Hansen hose fittings
Air Tank Regulator This is the primary regulator that steps the pressure from the tank (2500 psi on average) down to the operating pressure of the hose and face plate regulator (60 to 125 psi). It has two gauges, one reporting supply tank pressure and the other indicating air line pressure.
Air Line Manifold This hexagonal piece of metal has multiple airline connections that allow two air units to operate from the same tank.
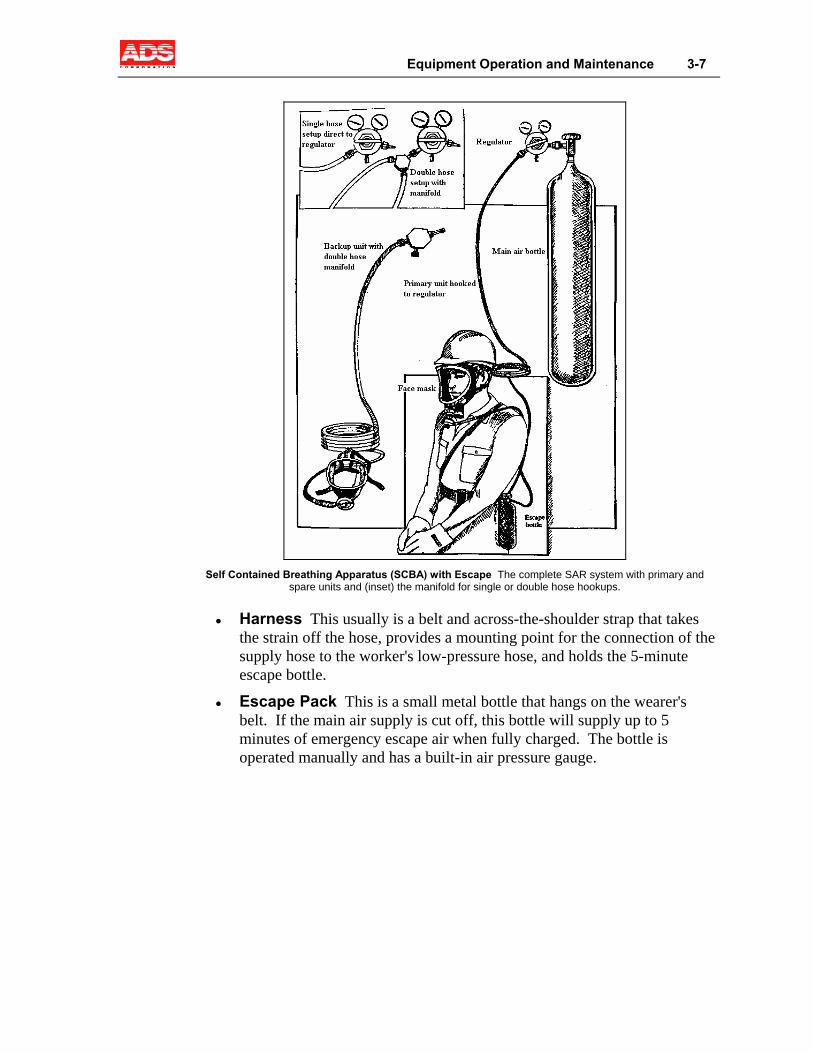
Equipment Operation and Maintenance 3-7
Self Contained Breathing Apparatus (SCBA) with Escape The complete SAR system with primary and
spare units and (inset) the manifold for single or double hose hookups.
Harness This usually is a belt and across-the-shoulder strap that takes the strain off the hose, provides a mounting point for the connection of the supply hose to the worker's low-pressure hose, and holds the 5-minute escape bottle.
Escape Pack This is a small metal bottle that hangs on the wearer's belt. If the main air supply is cut off, this bottle will supply up to 5 minutes of emergency escape air when fully charged. The bottle is operated manually and has a built-in air pressure gauge.
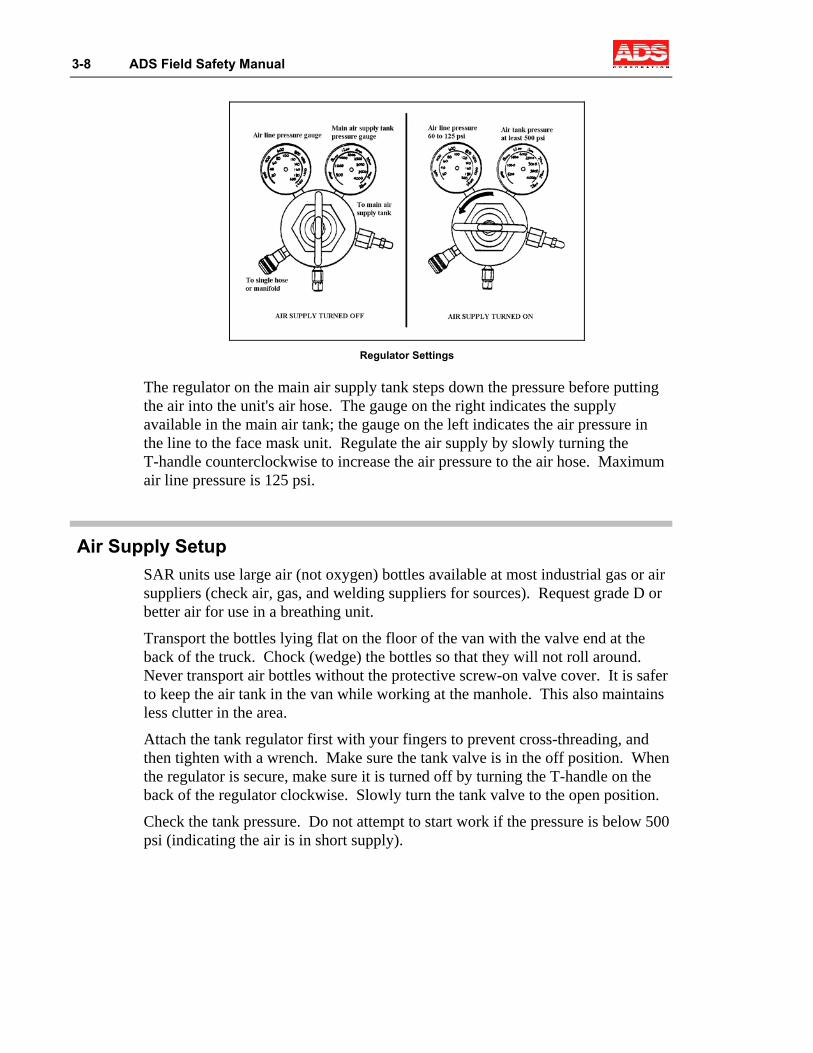
3-8 ADS Field Safety Manual
Regulator Settings
The regulator on the main air supply tank steps down the pressure before putting the air into the unit's air hose. The gauge on the right indicates the supply available in the main air tank; the gauge on the left indicates the air pressure in the line to the face mask unit. Regulate the air supply by slowly turning the T-handle counterclockwise to increase the air pressure to the air hose. Maximum air line pressure is 125 psi.
Air Supply Setup SAR units use large air (not oxygen) bottles available at most industrial gas or air suppliers (check air, gas, and welding suppliers for sources). Request grade D or better air for use in a breathing unit.
Transport the bottles lying flat on the floor of the van with the valve end at the back of the truck. Chock (wedge) the bottles so that they will not roll around. Never transport air bottles without the protective screw-on valve cover. It is safer to keep the air tank in the van while working at the manhole. This also maintains less clutter in the area.
Attach the tank regulator first with your fingers to prevent cross-threading, and then tighten with a wrench. Make sure the tank valve is in the off position. When the regulator is secure, make sure it is turned off by turning the T-handle on the back of the regulator clockwise. Slowly turn the tank valve to the open position.
Check the tank pressure. Do not attempt to start work if the pressure is below 500 psi (indicating the air is in short supply).
Equipment Operation and Maintenance 3-9
Face Mask Setup Connect both face mask units to the manifold and test them by slowly turning the T-handle on the back of the tank regulator. You should hear the hiss of air in the mask. Place the mask over your face and adjust the edge seal and straps so that no air leaks past the seal. Adjust the mask pressure by turning the tank regulator T-handle until the gauge reads between 60 and 125 psi. You should not hear any escaping air (hissing). Never turn the pressure to the hose and mask above 125 psi. Extra pressure can blow out a hose or damage the regulator on the mask.
Test the airflow by drawing a breath. The regulator should give you an extra burst of air. Break the seal around the edge of your face by lifting it with your finger. You should hear a hissing noise as the positive pressure escapes. This noise should stop when you release the seal.
Test both units, disconnect the spare, and keep it near the manhole. If you need the spare for a rescue, plug it into the manifold for a dual air supply. It is vital that you continue supplying air to the victim, even if the victim is unconscious. Both the rescuer and the victim should be hooked to the manifold and receiving air.
Air Unit Maintenance Most industrial air suppliers or scuba diving shops can fill the 5-minute escape bottles. Never try to fill the escape bottles using the main tank air via the hose. This is very dangerous and could cause injury.
Cleanliness is vital. Dirt and grit destroy connection seals, jam threads, and ruin the regulators. Always make sure the exhalation check valve on the mask regulator is free of loose dirt. To clean the face mask, remove the regulator and then clean the mask with soap and water.
3-10 ADS Field Safety Manual
Air Blower/Smoke Blower
The standard ADS air blower is a Homelite® powered by a Briggs and Stratton® engine and using an 8-inch flexible hose to direct the airflow. ADS has purchased other makes, but the power unit is the same for all of them.
Consult the manufacturer's manual for detailed operation and maintenance instructions. Following are a few key points concerning blower starting and maintenance.
Starting Techniques Each blower seems to have its own unique settings at which it will start. However, if a blower fails to start after repeated attempts, try the following steps:
Pull the spark plug wire off, and lay or hold it on the insulated portion so that the metal connector is almost touching the metal of the engine. Pull the starting chord, and look (and listen) for the spark discharge. The absence of a spark indicates an ignition problem. Go to the next step if a spark is present.
Remove the sparkplug. Check to see whether it is fouled with oil and carbon or wet with unburned fuel. If it is wet, replace it with a spare or dry it off by wiping and blowing. Hook the spark plug wire back to the plug and repeat the test (in the prior step) with the spark plug out of the cylinder and touching the metal of the engine. You should see a spark jump between the electrodes on the plug. If a spark does not appear, replace the plug. If it was wet, try less choke and/or less throttle when pulling the starter cord.
Vital Routine Maintenance The main reasons blower engines fail or will not start are vibration, dirt, and lack of maintenance. Not much can be done about vibration (blowers naturally vibrate); however, perform routine checks to make sure that parts have not vibrated loose and out of position (particularly the carburetor, throttle, and choke settings). You also can clean the blower and perform general maintenance based on the following guidelines:
Change the oil and clean the air filter every 25 hours of running time (3 to 4 weeks of average use)
Clean the sparkplug and reset the gap to 0.030 inch (0.76 mm) every 100 hours of running time (3 months use).

Equipment Operation and Maintenance 3-11
Remove the head and clean the carbon from the head, cylinder, and valves using a wire brush every 100 to 300 hours of running time (4 to 6 months use). Refer to the manufacturer's manual for detailed instructions, or take the engine to an engine shop.
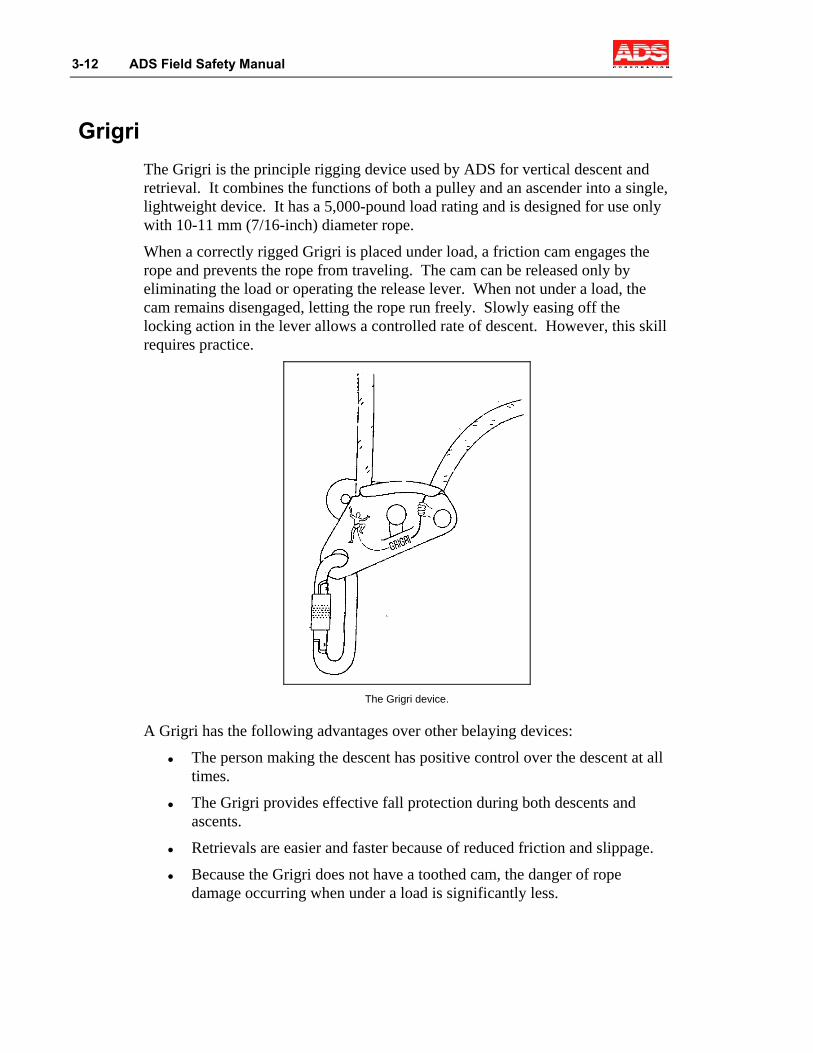
3-12 ADS Field Safety Manual
Grigri The Grigri is the principle rigging device used by ADS for vertical descent and retrieval. It combines the functions of both a pulley and an ascender into a single, lightweight device. It has a 5,000-pound load rating and is designed for use only with 10-11 mm (7/16-inch) diameter rope.
When a correctly rigged Grigri is placed under load, a friction cam engages the rope and prevents the rope from traveling. The cam can be released only by eliminating the load or operating the release lever. When not under a load, the cam remains disengaged, letting the rope run freely. Slowly easing off the locking action in the lever allows a controlled rate of descent. However, this skill requires practice.
The Grigri device.
A Grigri has the following advantages over other belaying devices:
The person making the descent has positive control over the descent at all times.
The Grigri provides effective fall protection during both descents and ascents.
Retrievals are easier and faster because of reduced friction and slippage.
Because the Grigri does not have a toothed cam, the danger of rope damage occurring when under a load is significantly less.
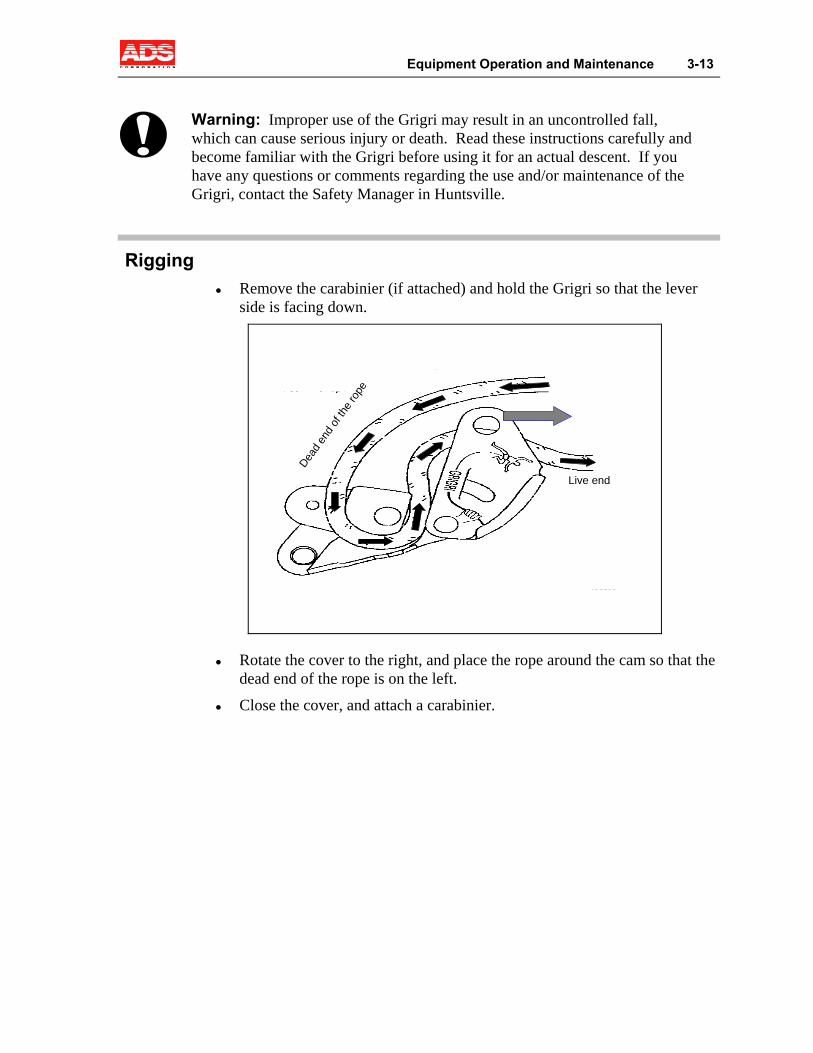
Equipment Operation and Maintenance 3-13
!
Warning: Improper use of the Grigri may result in an uncontrolled fall, which can cause serious injury or death. Read these instructions carefully and become familiar with the Grigri before using it for an actual descent. If you have any questions or comments regarding the use and/or maintenance of the Grigri, contact the Safety Manager in Huntsville.
Rigging Remove the carabinier (if attached) and hold the Grigri so that the lever
side is facing down. Dea
d end
of th
e rop
e
Live end
Rotate the cover to the right, and place the rope around the cam so that the dead end of the rope is on the left.
Close the cover, and attach a carabinier.
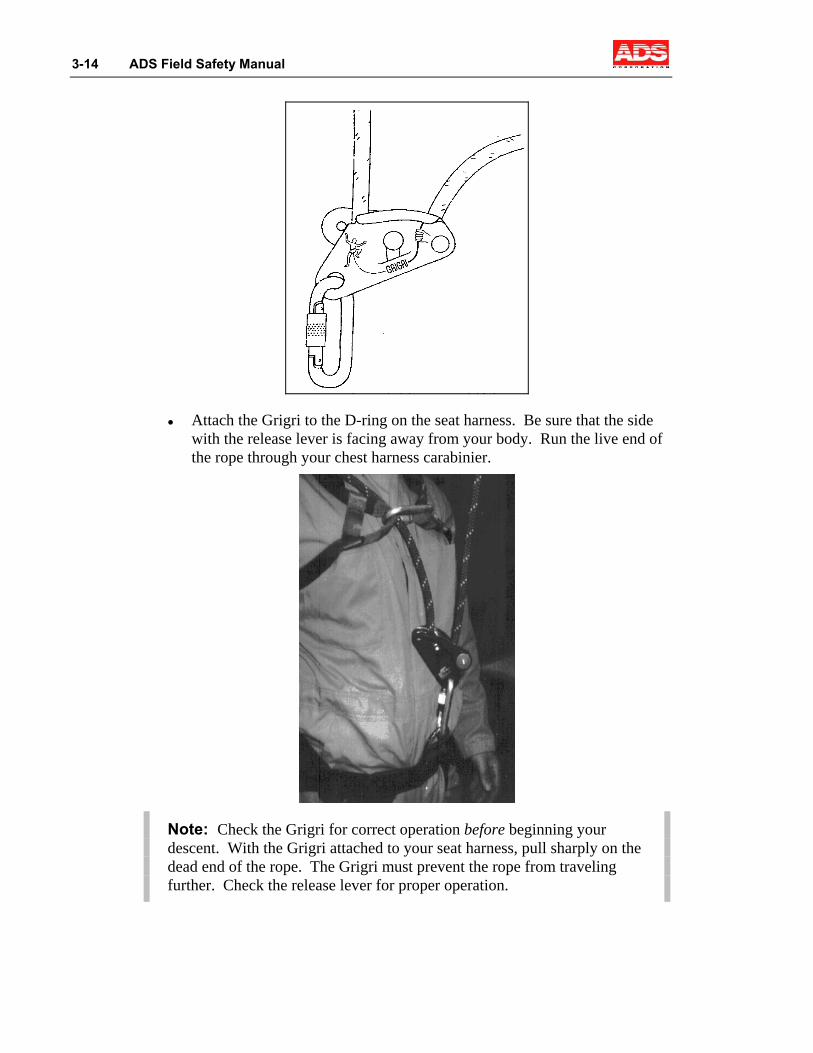
3-14 ADS Field Safety Manual
Attach the Grigri to the D-ring on the seat harness. Be sure that the side with the release lever is facing away from your body. Run the live end of the rope through your chest harness carabinier.
Note: Check the Grigri for correct operation before beginning your descent. With the Grigri attached to your seat harness, pull sharply on the dead end of the rope. The Grigri must prevent the rope from traveling further. Check the release lever for proper operation.
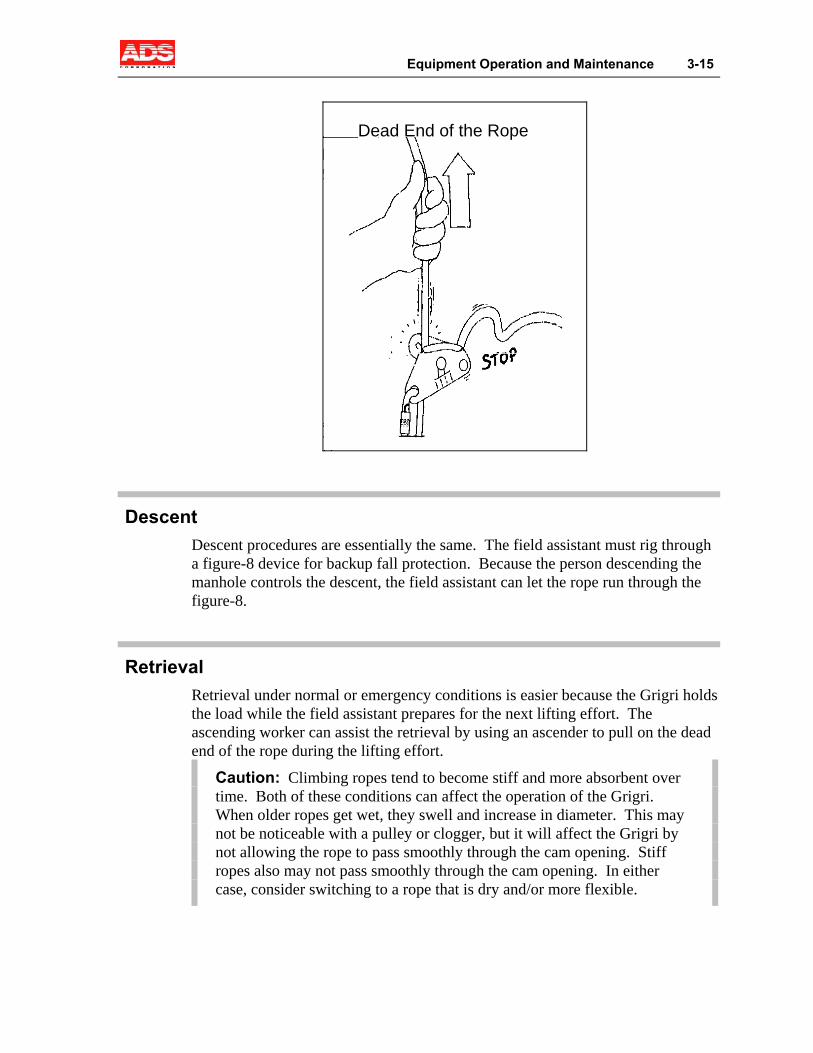
Equipment Operation and Maintenance 3-15
Dead End of the Rope
Descent Descent procedures are essentially the same. The field assistant must rig through a figure-8 device for backup fall protection. Because the person descending the manhole controls the descent, the field assistant can let the rope run through the figure-8.
Retrieval Retrieval under normal or emergency conditions is easier because the Grigri holds the load while the field assistant prepares for the next lifting effort. The ascending worker can assist the retrieval by using an ascender to pull on the dead end of the rope during the lifting effort.
Caution: Climbing ropes tend to become stiff and more absorbent over time. Both of these conditions can affect the operation of the Grigri. When older ropes get wet, they swell and increase in diameter. This may not be noticeable with a pulley or clogger, but it will affect the Grigri by not allowing the rope to pass smoothly through the cam opening. Stiff ropes also may not pass smoothly through the cam opening. In either case, consider switching to a rope that is dry and/or more flexible.
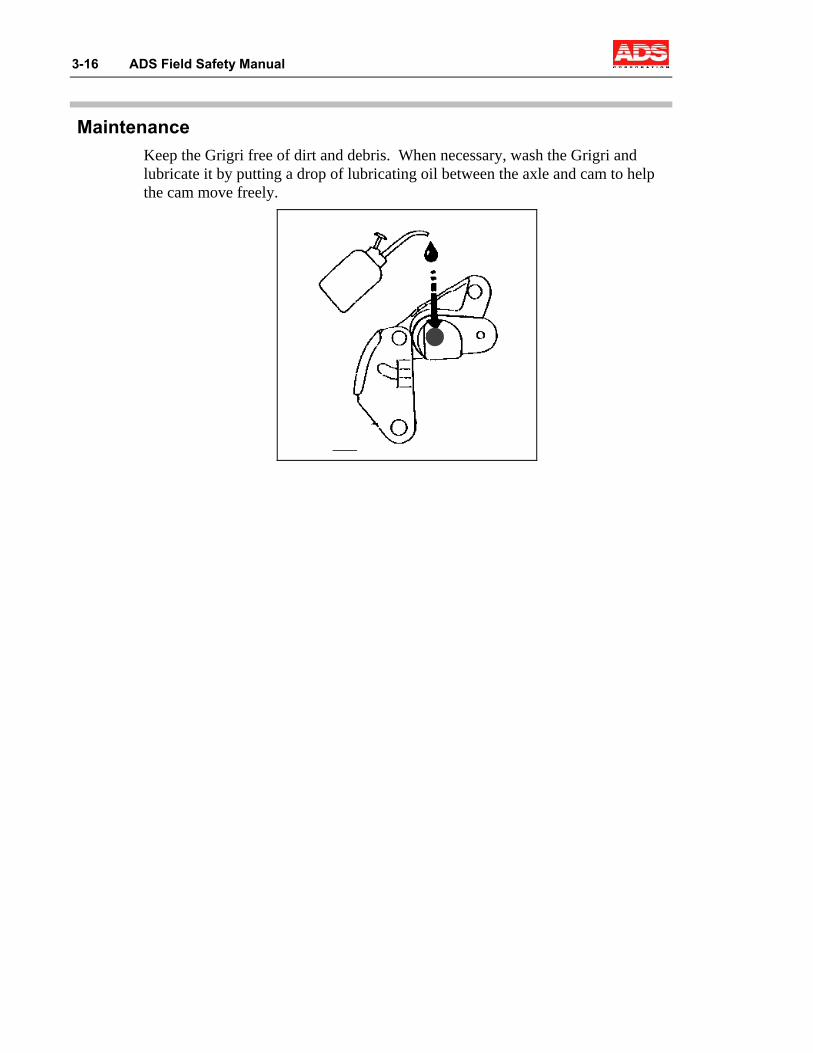
3-16 ADS Field Safety Manual
Maintenance Keep the Grigri free of dirt and debris. When necessary, wash the Grigri and lubricate it by putting a drop of lubricating oil between the axle and cam to help the cam move freely.
Equipment Operation and Maintenance 3-17
Ladders Although people routinely use ladders in a variety of situations without incident, they can be dangerous if used incorrectly in the field. Following these guidelines will help you avoid common safety pitfalls when using ladders in fieldwork:
If possible, always secure (tie off) the top of the ladder to stabilize it.
Place the ladder so that the horizontal distance from the base of the ladder to the structure is equal to 25 percent of the height to which the ladder is raised. Extend the top of the ladder beyond the top of a structure when you must access the top of the structure.
Use the ladder racks to carry ladders on top of field vans. Test the attachment to make sure the ladders are attached securely to the rack before moving the van.
Make sure the field assistant holds and stabilizes the ladder the entire time it is in use (someone is on it).
Always avoid contacting the ladder with any metal conduit or wires that come down from the top of telephone poles. Touching these wires with the ladder could result in electrocution.
Keep ladders in good condition. Repair or replace any ladder with obvious damage.
If you must place a ladder in a manhole, tie it to a stationary object. If possible, place the ladder against the flow for additional stabilization. Be careful not to become entangled in the ropes or the ladder.
3-18 ADS Field Safety Manual
Road Cut Machines A road cut machine cuts small trenches in concrete and asphalt for installing phone lines. Having a blade that rotates in excess of 2,000 rpm makes it a potentially dangerous machine. Therefore, follow these guidelines when working with road cut machines:
Only allow experienced personnel to operate a road cutter.
Never use a road cutter that is missing the protective guard over the front grinding wheel. Repair the guard before using the cutter.
Always wear safety goggles or face shields, dust masks, and hearing protection when using a road cutter. Make sure other crew members on site also wear goggles and hearing protection.
Make sure all crew members know the location of the emergency stop button (the kill switch). Never use a road cutter if this switch is inoperable.
Equipment Operation and Maintenance 3-19
Trencher Machines Trencher machines are similar to road cut machines. They are used to cut small trenches in easement areas (typically dirt or gravel) for phone line installation. They also have a rapidly moving blade that can be very dangerous. Therefore, follow these guidelines when working with trencher machines:
Make sure only experienced personnel operate a trencher.
Never use trencher machines that are missing any protective guards until they have been repaired.
Riding trenchers must have operational seat belts. Always wear the seatbelt while using the trencher.
Always check the area to be trenched thoroughly for underground utility lines. Call all utility companies several days prior to trenching. Consider special organizations that may be unique to your location. For example, you may need to contact some of the following agencies/parties before trenching:
Gas company
Phone company
Electric company
Cable company
Water company
Home/business owners (for sprinkler systems)
Park ranger
School principal
Make sure everyone on the worksite wears safety goggles (or face shields) and hearing protection while the trencher is in use.
Make sure all crew members know the location of the emergency stop button (the kill switch). Never use a trencher if this switch is inoperable.
If the trenching blade gets caught on debris, turn the unit off before freeing the blade.

3-20 ADS Field Safety Manual
Cleaner/Combo Units Cleaner/combo units are large trucks used to clean sewer lines. These trucks can weigh over 80,000 pounds and are equipped with an enormously powerful water pump. Combo units also have very powerful vacuums. Most of the dangers associated with these units involve the high pressure water their pumps produce that can exceed 2,200 psi. Using the following guidelines will help you prevent accidents when working with cleaner/combo units:
Be very careful when backing up in cleaner/combo units; always use a ground guide. They are difficult to maneuver and limit your vision.
Only take the cleaner/combo unit into an easement area when no danger exists of getting stuck or causing property damage.
Use chocks around the wheels of the cleaner/combo units while they are parked (filling or operating) on any slope or incline.
Train all new crew members on cleaner/combo unit safety procedures at the worksite. The training should include the function of all switches and levers, especially how to turn the water off.
Verify that the cleaner/combo unit pressure gauge is in good working order. You can test it when you turn up the throttle. Do not operate a cleaner/combo unit if the pressure gauge is not working.
Someone must be at the control box whenever the cleaner pump is running.
Everyone in the immediate vicinity of the manhole should wear face shields or goggles when the vacuum unit is in operation to protect them from spray and debris.
Everyone in the vicinity of the cleaner/combo unit must wear hearing protection.
Only turn the water on if the jet nozzle is inserted into the sewer line. Always turn the water off before removing the nozzle from the sewer line. If the water is on and the nozzle is free, you will have a “wild” hose which can cause serious injury. Do not attempt to capture/control a wild hose; first turn the water off.
Inspect the hose for any damage. Replace or repair any hose with obvious damage.
Beware of any fire hose crossing traffic lanes (e.g., connected to a hydrant). The hose could get caught by a car and pin someone to the ground or vehicle. In this situation, always have a flagman to slow traffic down near the hose.

Equipment Operation and Maintenance 3-21
Before vacuuming, verify that the unit’s pusher plate is completely retracted at the back of the debris collection area. If it is not fully retracted, debris can get caught behind it. If debris gets caught behind the pusher plate, shovel it out. However, treat the area like a confined space, ventilating it with a blower and testing it with a gas meter prior to entry.
Keep all crew members clear of the debris tank door while the unit is dumping.
Use extreme caution when swinging/moving the combo unit’s boom. Watch for traffic, coworkers, pedestrians, and overhead utility lines (i.e., electricity, cable, phones, etc.).
The root cutter attachment’s blade turns very quickly and is extremely dangerous. Disengage the power take off (PTO) switch when attaching or removing the root cutter from the hose.
Always keep an additional worker at the other end of the line to monitor when the root cutter has reached the end of the pipe.
Because there are many pinch points, turn the engine off and remove the key before performing any maintenance (e.g., lubricating the cleaners) on the cleaner/combo unit.
3-22 ADS Field Safety Manual
Easement Kits An easement kit carries extra hose into areas that are inaccessible to the cleaner/combo unit. One end of the hose is connected to the cleaner/combo unit, extending its capabilities. Observe the following guidelines for working safely with easement kits:
Make sure only trained personnel operate an easement kit. Operating an easement kit requires a minimum of three people:
One standing by the cleaner/combo unit shut-off point
One at the easement kit
One at the destination manhole as a spotter (to report progress)
Easement kits are very top heavy; therefore, use them with outriggers/stabilizing bars to prevent them from tipping over while in use.
Because easement kits are very front heavy, always back into and out of ditches. Travel very slowly, and keep other crew members at a distance.
Attach the hose on a cleaner/combo unit to an easement kit only if it has been inspected and is free from damage. Replace or repair any hose with obvious damage.
Make sure that the hose connection point with the cleaner/combo unit is a proper fit with a tight seal.
Verify that the easement kit pressure gauge is in good working order. You can test it when you turn up the throttle. Do not operate an easement kit if the pressure gauge is not working.
Keep all pedestrian traffic far away from all cleaning equipment.
4-1
C H A P T E R 4
Emergencies, First Aid, and Hygiene
The work ADS performs in the field is inherently dangerous. Therefore, despite all our safety equipment and procedures, it is vital that all field personnel know what to do in an emergency and how to perform basic first aid. It also is essential that all personnel understand how to exercise good personal hygiene. This is the single most important part of preventing disease and infection when working under these conditions. This chapter provides instructions on responding to emergencies, administering first aid, and practicing good hygiene.
For more information on a particular topic in this chapter, see the following pages:
Emergencies, see page 4-2
First Aid, see page 4-5
Hygiene, see page 4-13
4-2 ADS Field Safety Manual
Emergencies Despite your best efforts to work safely, emergencies can occur at any time. The key to handling an emergency is pre-planning. You must be prepared to respond when an incident occurs. In general, emergencies require three primary responses:
Retrieve the victim (if possible).
Call for help.
Start first aid.
The best way to plan for a rescue is to analyze each of the principal hazards that could lead to injury. Of course you cannot plan for every possible situation or circumstance, but general guidelines apply to each type of emergency. One overall guideline applies to all confined space rescue and serves as the basis of our entry equipment (ropes and harnesses) and procedures: Never enter a confined space to perform a rescue without the proper training and equipment and presence of additional rescuers.
Confined Space Rescue In a confined work space, the first thing you must do is get the victim out of the confined space. Going into a manhole to rescue a victim is not only dangerous, it is rarely necessary. In the past, 60 percent of confined space fatalities have been rescuers. The rigging system that ADS uses is designed to let you retrieve an injured worker without entering the manhole.
!
Warning: Do not enter a confined space to rescue a victim unless a rescue team or paramedics are present.
Following are the principal emergencies that may occur when performing confined space entry and the responses required:
Toxic or Combustible Gas Retrieve the victim immediately! This is a life-threatening situation! Toxic or combustible gas is the primary danger in a manhole. You must get them out of the manhole. Do not wait. Call for help after the victim is out of the manhole.
Engulfment (Drowning) Retrieve the victim immediately. This also is a life-threatening situation!
Falls Do not retrieve or move the victim initially unless gas is present or a danger of drowning exists. Call for help. This situation could be complex since a fall may involve broken bones or back/neck injuries. Consider the following conditions:
Emergencies, First Aid, and Hygiene 4-3
If gas or a danger of drowning exists, pull the victim out. While this may aggravate a broken bone or back/neck injury, it is less likely to kill them than gas or drowning.
If no gas or danger of drowning exists, do not move the victim. Call for help. If the victim is unconscious, continue to observe them until rescue personnel arrive.
If the victim is conscious or regains consciousness, have them remain as still and calm as possible. Ask them to describe any pain or obvious injury. If you suspect a broken bone or back/neck injury, have the victim remain still until rescue personnel arrive.
If rescue personnel have not arrived in a reasonable amount of time and both you and the victim feel that a retrieval would not aggravate the injuries, attempt the retrieval. However, go slow and stop if the victim complains of any new or increased pain.
Falling Objects The previous guidelines also apply to a victim struck by a falling object.
Getting Help In the previous cases, the key is to get help to the scene promptly. Since most, if not all, crews have a radio or cellular phone, contact the field office, another crew, or emergency personnel directly. Be sure to describe what has happened and where. If you do not have a radio or phone, send a coworker to get help or ask anyone in the vicinity to phone for help.
Transport the victim to the nearest hospital or medical clinic only under the following circumstances.
Immediate outside help is not available or has not arrived. However, verify the following before moving the victim:
The victim needs immediate medical attention or is not responding to first aid
It is safe to move the victim
Outside help was not requested or needed, and the victim requires medical attention beyond the scope of minor first aid treatment. If you have any doubt as to the severity of an injury, get the victim to a clinic or hospital immediately.
Note: Whenever possible, a supervisor should accompany the victim to the hospital.
4-4 ADS Field Safety Manual
Once you have made the decision to transport the victim, consult a map and drive carefully to the nearest clinic or hospital. Do not speed or disregard traffic signals. That will not save much time, and you will only increase your chances of having an accident and injuring yourself and the victim.
Informing the Doctors or Paramedics Inform doctors and paramedics that the victim is a sewer worker and describe the way the injury occurred. If the victim is having trouble breathing or you suspect poison gas, mention hydrogen sulfide gas as a possibility. Anything you remember (i.e., fumes, positive gas tests, odors, or known chemicals in the sewage) may be helpful. Detail any first aid treatment given to the victim prior to the arrival of medical personnel.
Obtain information from the doctors and paramedics concerning the following issues:
Diagnosis
Treatment
Work restrictions (if any)
Necessary follow up visits
This information may not be available immediately. Plan to follow up at a later date if you are unable to get the information.
Contacting the Company Immediately Anytime an injury or vehicle accident occurs, notify your supervisor and the main office at the first free moment. Call from the scene or from the emergency room. Call collect if necessary. Ask to speak with the Safety Manager or your operational division manager. Feel free to call any executive officer to deliver your message. If the accident occurs outside of normal working hours, call them at home.
Reporting the Incident This is vital for both company decisions and safety programs. It also is required by law and by the companies that insure ADS.
Emergencies, First Aid, and Hygiene 4-5
First Aid Note: This section is not intended to provide comprehensive instruction in first aid. It is merely an overview of the basics. For detailed instructions, consult your Red Cross First Aid Manual. Remember, the first rule is to get medical assistance as soon as possible.
If medical attention is necessary, retrieve the victim (when appropriate) and alert Emergency Medical Services (EMS). Notifying EMS is the top priority in any life-threatening situation. Keep site sheets on hand so that all crew members can access the site address easily. Then, administer the appropriate first aid. Our goal is to prevent death or to keep injuries from becoming worse. The next few sections describe the actions to take in a variety of emergency situations.
Perform Rescue Breathing Apply this technique until breathing is restored or help arrives. Only leave the victim momentarily to call EMS. Take the following steps to restore/maintain breathing:
Open the airway (head tilt/chin lift method).
Check (look and feel) for breathing.
Give two full, slow breaths.
Check for carotid pulse (side of neck). If you do not detect a pulse, continue with cardio-pulmonary resuscitation (CPR).
If the victim is not breathing, continue rescue breathing at the rate of 1 breath every 5 seconds.
Recheck the pulse after 1 minute.
Administer Cardio-Pulmonary Resuscitation (CPR) If the victim is not breathing and a pulse is absent, begin CPR to restore/maintain circulation in the following way:
Keep the victim’s airway open.
Locate the compression position (just above the base of the sternum).
Give 15 compressions over 9 to 11 seconds.
Give two full, slow breaths.
Repeat 3 cycles of 15 compressions and 2 slow breaths.
Recheck the carotid pulse and breathing.

4-6 ADS Field Safety Manual
If there is still no pulse, continue CPR. If there is no breathing, continue rescue breathing. If there is neither a pulse nor breathing, repeat the CPR/breathing cycles.
Control Heavy Bleeding When controlling heavy bleeding, look for spurting arterial flow. Control heavy bleeding in the following way.
Apply direct pressure to the wound. Use a clean dressing if available. If bleeding does not stop, go to the next step.
If necessary (and you do not suspect a fracture), elevate the wound and continue to apply direct pressure.
If bleeding continues, apply pressure at a pressure point while continuing the steps above.
Apply a pressure bandage. Be careful not to tighten the bandage so much that you slow down or stop circulation.
Three Ways To Fight Severe Bleeding First, and most effective, is applying direct pressure to the wound with a sterile dressing and a hand. Second is elevating the wounded limb. Third is placing pressure on a pressure
point (e.g., pinching off the artery between a hand and a bone). The body's pressure points appear as circles in the inset.
Continue Checking the Victim Keep a close watch on the victim’s breathing, pulse, and any severe bleeding until EMS arrives or you reach the hospital.
Note: If the victim is breathing, has a pulse, and severe bleeding is under control, they should be out of immediate danger.
Emergencies, First Aid, and Hygiene 4-7
Do Not Move the Victim Unnecessarily Often, victims of an accident have more than one injury. These injuries may not be visible or readily apparent. Moving a person with an undiscovered neck or back injury from a fall may cause additional injuries that are worse than the original. Never move a victim unless they are in a life-threatening situation, such as a manhole where gas or a drowning risk exists. Let trained medical personnel do the job. However, a person who is not breathing or is bleeding severely must receive immediate attention.
Examine the Victim Carefully Look for any other injuries that require treatment before help arrives. Any information you can provide to medical personnel is important.
Prevent or Treat Shock Shock is not a minor side effect of injury; it is always harmful and sometimes fatal when compounded with a victim's original injuries. Shock is the body's natural response to injury that involves a change in blood pressure, pulse rate, and blood circulation. It is particularly dangerous in cases involving serious bleeding. Take the following steps to prevent shock from occurring:
Keep the victim lying down, comfortable, and at a normal temperature.
Provide shade in a hot environment or provide protection from the cold both over and under the victim.
Do your best to comfort and calm the victim.
Elevate the feet and the injury (see illustration). Do not elevate any unsplinted fractures or if you suspect a broken bone.
If the victim has trouble breathing, place them in the position that makes breathing easier and elevate the head and shoulders.
The preceding sections have described the types of medical problems that may be present in any serious injury. The following sections describe several other medical problems that are particularly relevant to field work.
Gas Poisoning If the gas meter alarm indicates hydrogen sulfide (H2S) or the victim feels weak and complains of irritated eyes and throat, they probably have H2S gas poisoning. Get the victim to a hospital right away. When you get to the hospital, inform the doctor that you suspect the victim has been exposed to H2S.
4-8 ADS Field Safety Manual
Note: Other gases or fumes also can cause poisoning. If no H2S alarm went off, indicate to doctors that the victim is a sewer worker and that you suspect some type of gas or vapor poisoning. Inform the doctor concerning any unusual or identifiable odors, gases, or vapors.
Getting the victim out of the manhole and into fresh air is the first and most important step. If the symptoms are severe or persist and help has not yet arrived, give oxygen to the victim. Our first aid kits have a cylinder of oxygen for use in suspected gas poisonings. Follow these steps to administer the oxygen:
!
Warning: Do not give oxygen to a victim you suspect may be hyperventilating. Hyperventilation is an abnormal breathing condition characterized by prolonged, rapid, and deep breathing possibly brought on by panic or shock. Hyperventilation causes the victim to inhale too much oxygen. Administering oxygen will only aggravate this condition, potentially causing further damage to the victim. If you have any doubts, do not give oxygen.
Make sure the victim is conscious and breathing. Check the mouth and throat for obstructions. Make sure the victim is as comfortable as possible.
Remove the protective cap from the cylinder. Screw the regulator onto the cylinder (clockwise) until the gauge registers contents and oxygen flows.
Attach the tubing onto the barbed tip of the regulator. Place the mask over the victim's mouth and nose. Slip the retaining strap around the head and pull the end strap for comfort. Keep the chin pointing toward the ceiling to maintain an open airway.
Continue treatment until the bottle is empty or oxygen is no longer needed. Stop the oxygen flow by unscrewing the regulator (counterclockwise).
Heat Injuries Often work in the field requires that employees function in extreme heat or cold. Either condition presents serious risks to workers. Understand that what may appear to be routine discomfort may actually be an indication of a more serious problem.
There are three problems related to heat: heatstroke, heat exhaustion, and heat cramps. All are dangerous, and one is immediately life-threatening (heatstroke). Knowing the symptoms and first aid to apply is vital to your own protection and that of your coworkers.
Emergencies, First Aid, and Hygiene 4-9
Heatstroke (Sunstroke) Heatstroke is a life-threatening emergency. It is a breakdown of the body's ability to regulate its own temperature. It is caused by extremely high body temperature due to heat exposure. Following are common symptoms of heatstroke (any or all may be present):
Extremely high (often 106 degrees or higher) body temperature
Hot, red, and dry skin (the victim does not sweat)
Rapid and strong pulse
Unconsciousness or confusion
Perform the following for immediate treatment:
Give the victim plenty of cool water, if fully conscious.
Cool the victim off any way possible. Spray the victim with a hose; sponge them down with cold water; apply ice packs; or even submerge the victim in a tub of cold (but not iced) water.
Continue treatment until the body temperature has fallen to 101 or 102 degrees.
Do not overcool. Remember, the body cannot control its own tempera-ture, and overcooling can be dangerous.
Get medical attention immediately.
Perform the following for continued care:
Place the victim in front of a fan or air conditioner.
If the victim's temperature rises again, repeat the cooling process.
Do not give the victim alcoholic beverages or stimulants, such as coffee or tea.
Heat Exhaustion Heat exhaustion can occur after prolonged exposure to high temperatures and humidity. A victim of heat exhaustion demonstrates the following symptoms:
Normal or slightly above normal body temperature
Clammy and pale skin
Heavy sweating
Tiredness, weakness, dizziness, or nausea
Headache or muscle cramps
Fainting or vomiting
4-10 ADS Field Safety Manual
Perform the following for immediate treatment:
Move the victim into a shady or cool area.
Have the victim lie down.
Loosen their clothing and elevate their feet 8 to 12 inches.
If victim is not vomiting, give them clear juice or sips of cold water. Consider adding some salt to the liquid (up to 1 teaspoon per glass). Administer ½ glass of liquid every 15 minutes for 1 hour. Stop fluids if vomiting occurs.
Place cool wet cloths on the victim's forehead and body.
Use a fan or air conditioner to cool the victim.
If symptoms are severe, last more than 1 hour, or become worse, seek prompt medical help.
Heat Cramps Heat cramps are muscle pains and spasms caused by a loss of salt from the body due to heavy sweating. Strenuous activity in hot temperatures can lead to heat cramps. It usually affects the muscles of the stomach and legs first. Heat cramps also may be a symptom of heat exhaustion. Any or all of the following symptoms may be present:
Painful muscle cramping and spasms
Heavy sweating
Convulsions
Perform the following for immediate treatment:
Have the victim sit quietly in a cool place.
Apply firm hand pressure to the affected area, or gently massage the victim's cramped muscles.
If the victim is not vomiting, give them clear juice or sips of cool water. Add 1 teaspoon of salt to each glass of water. Give the victim ½ glass of liquid every 15 minutes for 1 hour.
Cold Injuries Two cold-related conditions can cause severe injury or death if left untreated: hypothermia and frostbite.
Hypothermia Hypothermia, the severe chilling of the entire body, is life-threatening. Hypothermia risks are much higher under cold and wet conditions. The first line
Emergencies, First Aid, and Hygiene 4-11
of defense against hypothermia is to stay warm and dry. Any of the following symptoms may be present:
Shivering (often uncontrollable)
Numbness
Drowsiness, sleepiness, or mental confusion
Muscle weakness or loss of coordination
Low body temperature
Loss of consciousness
Perform the following for immediate treatment:
Transport the victim to a warm place.
Maintain an open airway and, if necessary, restore breathing.
Remove wet clothes.
Wrap the victim in warm blankets, towels, additional clothing, etc.
Get medical assistance as soon as possible.
If the victim is conscious, give them warm (not hot) drinks such as coffee, tea, or soup. Do not give them alcoholic beverages.
Frostbite Frostbite involves body parts freezing due to exposure to very low temperatures. Frostbite occurs when ice crystals form in the fluid in the cells of the skin and other body tissues. It most often affects the toes, fingers, nose, and ears. Frequently, the victim is not aware of frostbite until someone else notices the symptoms. Any or all of the following symptoms may be present:
Pain is often present in the early stages, and the skin appears red.
Skin becomes white or grayish yellow in the advanced stages. It also appears and/or feels waxy, firm, very cold, and numb. Pain disappears, and blisters may appear.
Perform the following for immediate treatment:
Cover the frozen areas with extra clothing or a warm cloth. If your hand or fingers are frostbitten, put them under your armpit and next to your body for additional warmth.
Do not rub frostbitten areas with snow (or anything else).
Bring the victim out of the cold promptly.
Warm frostbitten areas rapidly. Submerge the frostbitten area in warm (not hot) water between 100 and 104 degrees. Test the water with a thermometer or by pouring it over the inside of your arm.
4-12 ADS Field Safety Manual
If warm water is unavailable, gently wrap the frostbitten area in blankets or other warm materials.
Do not use heat lamps, hot water bottles, or heating pads to warm a frostbitten area.
Do not allow the victim to place a frostbitten area near a hot stove or radiator. Frostbitten areas can burn before feeling returns.
Do not break blisters.
Stop the warming process when the skin becomes pink and/or feeling begins to return.
Perform the following for continued care:
Give the victim warm drinks, such as tea, coffee, or soup.
Have the victim exercise fingers and toes as soon as they are warm.
Do not allow a victim with frostbitten feet or toes to walk. This may cause further damage to frostbitten parts.
Keep frostbitten parts elevated.
Be very careful not to let frostbitten areas freeze again after thawing.
Contact medical help as soon as possible.
Emergencies, First Aid, and Hygiene 4-13
Hygiene Working in a sewer, you are continually in direct contact with raw wastewater and sludge. This places you at a high risk for getting an infection. Infections are spread through ingestion (water splashes, contaminated food, or cigarettes), inhaling infections agents, and unprotected cuts and abrasions.
Following some basic hygiene guidelines can significantly reduce your risk of infection. According to medical experts, keeping clean prevents illnesses for sewer workers more than immunizations, pills, or shots. Personal habits of washing your hands and face before meals and after work each day must become routine.
Hygiene Guidelines Use the following guidelines when working in the field:
Always wear gloves when you expect to be in contact with wastewater. Use thin, disposable latex gloves for light work and reinforced rubber gloves for heavier activities. Discard all torn work gloves immediately. Do not submerge your hand below the top of the glove.
Promptly treat all cuts and abrasions using appropriate first aid measures.
Avoid touching your hands to your face during work.
Eating, smoking, or using chewing tobacco without washing your hands increases the risk of infection. Always try to wash your forearms, face, and particularly facial hair before eating. If you eat food in the work vehicle, choose snacks you can hold with a wrapper to avoid touching the food with your hands.
Use a nail brush plus an abrasive soap, such as Lava®, to remove dirt from hands. Be sure to remove all dirt from under the fingernails. Wash with an antiseptic soap, such as Betadine®.
At the end of each day, clean all contaminated tools after use.
Try to avoid transferring contamination from the field to other locations. Even supposedly clean items, such as office equipment and paperwork, can become contaminated. Contamination can spread from the worksite to the van to the field office, and even back to the main office when shipping project paperwork.
4-14 ADS Field Safety Manual
Field Office Housekeeping Use the following guidelines for keeping the field office clean and free of contaminates.
Store street clothes separately from work clothes. If possible, do not bring your work clothes home (to prevent the transmission of diseases to your family).
Stock bathrooms with disposable towels. Everyone working on the project should keep the bathroom clean.
Use only disposable cups for drinks.
Remove trash daily.
Care of Clothing Wash all clothing after one wearing, even if overalls are worn over your normal work clothes. Wash your work clothes separately from other items to avoid contamination. Add chlorine bleach to all washes (not just whites) to help kill germs. Wash gloves along with clothes and uniforms.
Medical Examinations
Each new, permanent field employee must pass a medical examination and receive immunizations. At a minimum, the these should include the following:
Medical history and general examination
Blood and pulmonary function tests
Medical qualification for respirator use
Tetanus and diphtheria immunizations (if they are not up-to-date)
Medical examinations should be given every 2 years thereafter. Other immunizations will be given when required by regulations or operational necessity.
Blood Borne Pathogens Blood borne pathogens are harmful micro-organisms that are present in the blood and can cause disease. These pathogens include the hepatitis B virus (HBV) and human immunodeficiency virus (HIV). Current research has shown that HIV does not survive long in wastewater, except in very high concentrations. HBV is hardier and poses a greater risk to field workers.
Emergencies, First Aid, and Hygiene 4-15
Environmental Dangers The principle blood borne pathogen risk in sewers is from needlesticks and direct contact with blood or wastewater visibly tainted with blood. Blood can be present in the discharge stream of a medical or embalming facility. Since the blood is rapidly diluted in wastewater, the principle risk exists in a manhole with a service line coming from one of these locations. Intravenous drug users frequently discard used needles into the sewer system. Although the probability of contracting HIV from a random needlestick is low, the risk of contracting hepatitis is significantly greater.
An exposure incident is specific eye, mouth, other mucous membrane, or non-intact skin contact with blood or other potentially infectious materials that results from performing assigned duties.
Exposure Determination The greatest potential for occupational exposure to blood borne pathogens exists in sewers at or immediately downstream of a medical or embalming facility. Exposure may occur when entering the sewer and/or when handling equipment that has been in contact with untreated wastewater at these sites. Any employee involved in operations at or immediately downstream of a medical or embalming facility is subject to exposure.
Protective Clothing When entering known or suspect sites, wear the following items:
Standard ADS protective clothing, which includes coveralls, hard hats, steel-toed boots, and rubber gloves (surgical gloves may be worn for procedures that require tactile sensitivity and will not tear the glove)
Hooded TYVEK® QC coverall or equivalent
Surgical-type face mask and protective goggles
Hygiene Never enter a manhole you suspect may contain blood borne pathogens if you have unhealed facial cuts, sores, or abrasions.
Wash your hands immediately (or as soon as feasible) with soap and water after removing gloves or other personal protective equipment. Use antiseptic towelettes as an interim measure until you can wash your hands with soap and water at the office. Flush all mucous membranes with clean water as soon as possible following contact with blood or other potentially infectious materials.
Decontamination, Disposal, and Laundering Wash your equipment, including your boots, or wipe it with disinfectant after use. Use hot water and bleach when machine-laundering your clothing.
4-16 ADS Field Safety Manual
Place disposable coveralls and gloves in a plastic bag, and label it BIOHAZARD. These bags should be taken to an appropriate facility for disposal in accordance with local regulations. (Managers should coordinate disposal with the client or a local medical facility.)
Hepatitis B Vaccination ADS offers the HBV immunization to all personnel who must enter manholes and/or handle equipment that has been in contact with untreated wastewater (unless they have previously received the complete HBV vaccination series). If you decline the immunization, you must sign a declaration described in Chapter 1 under Blood Borne Pathogens and Control:
Post-Exposure Evaluation and Follow-Up If you are exposed to blood or other potentially infectious material, notify you supervisor immediately. Your supervisor will notify the project, regional, and corporate Safety Manager.
The project manager should arrange for you to have an immediate medical evaluation. Provide the following information to the healthcare professional who is conducting the evaluation:
Copy of the OSHA blood borne pathogen regulation
Description of the exposed employee's duties as they relate to the exposure incident
Documentation of the route(s) of exposure and circumstances under which exposure occurred
All medical records relevant to the appropriate treatment of the employee, including vaccination status (the employer is responsible for maintaining these records)
The project manager then should contact the Human Resources and Safety departments to obtain documentation that is not available locally. The project, Safety, and Human Resources managers will coordinate all follow-up actions and communications to ensure that the process complies with OSHA regulations.

WA 1.0 - GENESEE BASIN FLOW MONITORING STUDY PAGE 61 OF 62 QUALITY ASSURANCE PROJECT PLAN
Revision: R1D0 Effective date: 8/19/2008 This is an UNCONTROLLED DOCUMENT.
Appendix H: Standard Operating Procedures
Identifier:
METR Q1200
Revision:
R0D3(DRAFT)
Draft revised on:
6/20/2008
Custodian:
Brian Morgenroth
Authorization Authority:
Quality Assurance Facilitator (TBD)
Meteorology
Standard Operating Procedure
METR Q1200 - Data Management
Science, Sustainability, & Watersheds
Seattle Public Utilities
Seattle , Washington
This document is part of the Quality Management System and describes standard operating procedures to ensure a systematic consistent approach is followed for collecting, assessing, and documenting environmental data of known and documented quality.
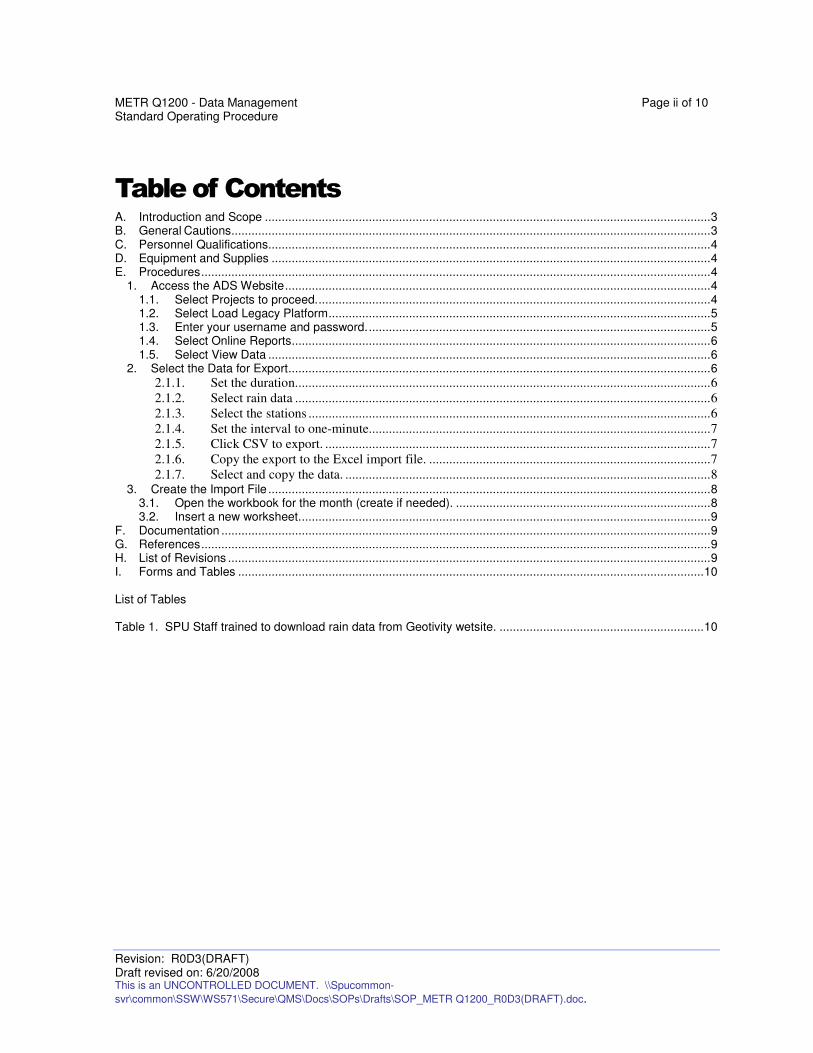
METR Q1200 - Data Management Page ii of 10 Standard Operating Procedure
Revision: R0D3(DRAFT) Draft revised on: 6/20/2008 This is an UNCONTROLLED DOCUMENT. \\Spucommon-
svr\common\SSW\WS571\Secure\QMS\Docs\SOPs\Drafts\SOP_METR Q1200_R0D3(DRAFT).doc.
Table of Contents A. Introduction and Scope .....................................................................................................................................3 B. General Cautions...............................................................................................................................................3 C. Personnel Qualifications....................................................................................................................................4 D. Equipment and Supplies ...................................................................................................................................4 E. Procedures........................................................................................................................................................4
1. Access the ADS Website...............................................................................................................................4 1.1. Select Projects to proceed......................................................................................................................4 1.2. Select Load Legacy Platform..................................................................................................................5 1.3. Enter your username and password.......................................................................................................5 1.4. Select Online Reports.............................................................................................................................6 1.5. Select View Data ....................................................................................................................................6
2. Select the Data for Export..............................................................................................................................6 2.1.1. Set the duration............................................................................................................................6 2.1.2. Select rain data ............................................................................................................................6 2.1.3. Select the stations ........................................................................................................................6 2.1.4. Set the interval to one-minute......................................................................................................7 2.1.5. Click CSV to export. ...................................................................................................................7 2.1.6. Copy the export to the Excel import file. ....................................................................................7 2.1.7. Select and copy the data. .............................................................................................................8
3. Create the Import File ....................................................................................................................................8 3.1. Open the workbook for the month (create if needed). ............................................................................8 3.2. Insert a new worksheet...........................................................................................................................9
F. Documentation ..................................................................................................................................................9 G. References........................................................................................................................................................9 H. List of Revisions ................................................................................................................................................9 I. Forms and Tables ...........................................................................................................................................10 List of Tables Table 1. SPU Staff trained to download rain data from Geotivity wetsite. .............................................................10
METR Q1200 - Data Management Page 3 of 10 Standard Operating Procedure
Revision: R0D3(DRAFT) Draft revised on: 6/20/2008 This is an UNCONTROLLED DOCUMENT. \\Spucommon-svr\common\SSW\WS571\Secure\QMS\Docs\SOPs\Drafts\SOP_METR
Q1200_R0D3(DRAFT).doc.
Meteorology
METR Q1200 - Data Management See also the following Standard Operating Procedures:
METR Q1000 General
METR Q1100 Data Review, Verification, & Validation
METR Q1200 Data Management
METR Q1300 Data Requests
METR C2010 Rain Gage Equipment & Site Selection
METR C2020 Rain Gage Equipment Installation
METR C2030 Rain Gage Field Calibration & Maintenance
METR C2040 Rain Gage Field Inspections
A. Introduction and Scope
This section presents standard operating procedures to be used to consistently manage meteorological data, beginning
with downloading the data and continuing through final archiving.
These procedures may include the following steps and will describe the data path: who is responsible for each step (the
data steward), the data format (paper, Excel, SCADA, etc), and the data location:
• Trace the path of data from generation to final use/storage;
• Describe the standard record keeping procedures, document control system, and the approach used for data storage and retrieval on electronic media;
• Discuss the control mechanism for detecting and correcting errors and for preventing loss of data during data reduction, data reporting, and data entry;
• Provide examples of any forms or checklists to be used;
• Describe data handling equipment and procedures to process, compile, and analyze the data, including any data from other sources;
• Describe the procedures used to demonstrate the acceptability of the required hardware/software configuration; and
• Describe the process for assuring that applicable information resource management requirements are satisfied
Currently, this SOP is limited to the procedure for downloading rain gage data from the ADS website. Data will be
downloaded on a weekly basis covering the period 00:00 hours on Sunday through 23:59 hours on Saturday.
This is the first step in a series of procedures leading to a fully qualified rain gage data set available for general use. The
second step is importing into the “Rain” database, reviewing, and qualifying the data, and the third step is importing the
data into Hydstra for general use.
B. General Cautions
Review the data that has been downloaded before importing to the data review software. Check for:
One-minute intervals,

METR Q1200 - Data Management Page 4 of 10 Standard Operating Procedure
Revision: R0D3(DRAFT) Draft revised on: 6/20/2008 This is an UNCONTROLLED DOCUMENT. \\Spucommon-svr\common\SSW\WS571\Secure\QMS\Docs\SOPs\Drafts\SOP_METR
Q1200_R0D3(DRAFT).doc.
Pacific Standard Time,
ADS errors – values of 0.16666
C. Personnel Qualifications
Given the critical use of the data and the need for timely access, a minimum of eight SPU staff members working
throughout the organization will be trained in this procedure. The Quality Assurance Officer (QAO) is responsible for
ensuring that the training status of SPU staff members listed in Table 1 is current.
D. Equipment and Supplies
This procedure does not require any equipment or supplies.
E. Procedures
Use the following protocols when downloading rain gage data from the ADS network.
1. ACCESS THE ADS WEBSITE
The ADS website is located at this address: http://www.geotivity.net/.
1.1. Select Projects to proceed.
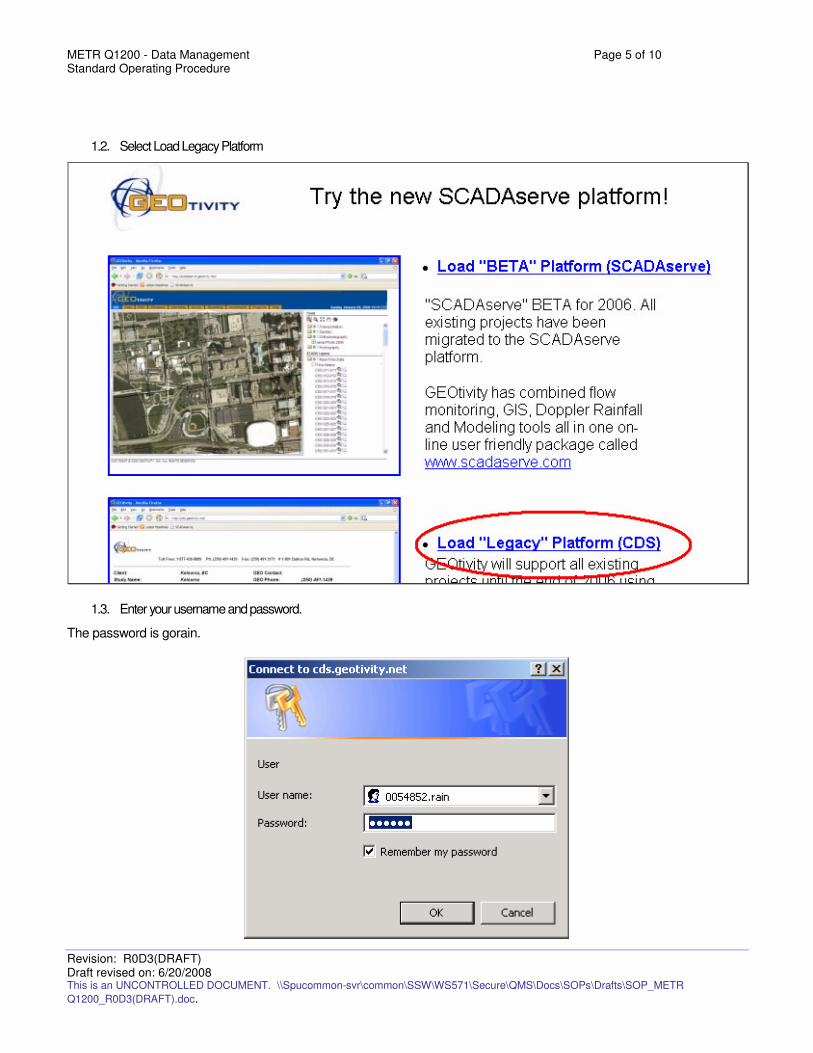
METR Q1200 - Data Management Page 5 of 10 Standard Operating Procedure
Revision: R0D3(DRAFT) Draft revised on: 6/20/2008 This is an UNCONTROLLED DOCUMENT. \\Spucommon-svr\common\SSW\WS571\Secure\QMS\Docs\SOPs\Drafts\SOP_METR
Q1200_R0D3(DRAFT).doc.
1.2. Select Load Legacy Platform
1.3. Enter your username and password.
The password is gorain.
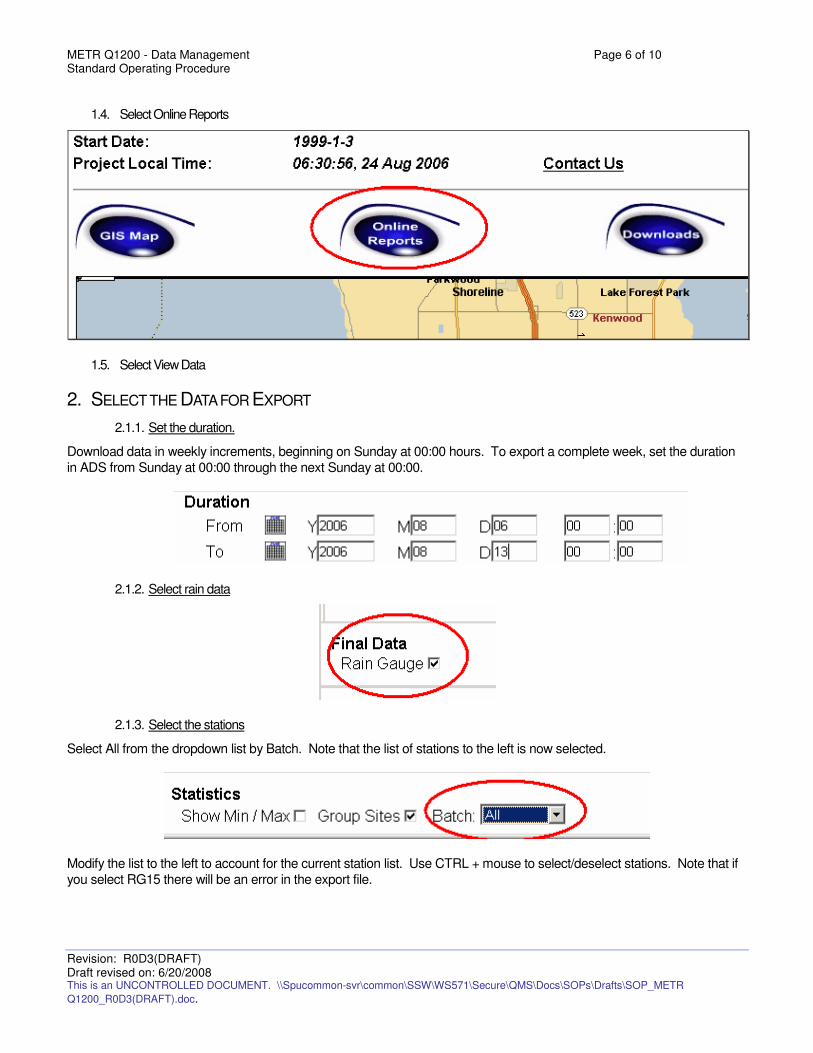
METR Q1200 - Data Management Page 6 of 10 Standard Operating Procedure
Revision: R0D3(DRAFT) Draft revised on: 6/20/2008 This is an UNCONTROLLED DOCUMENT. \\Spucommon-svr\common\SSW\WS571\Secure\QMS\Docs\SOPs\Drafts\SOP_METR
Q1200_R0D3(DRAFT).doc.
1.4. Select Online Reports
1.5. Select View Data
2. SELECT THE DATA FOR EXPORT
2.1.1. Set the duration.
Download data in weekly increments, beginning on Sunday at 00:00 hours. To export a complete week, set the duration
in ADS from Sunday at 00:00 through the next Sunday at 00:00.
2.1.2. Select rain data
2.1.3. Select the stations
Select All from the dropdown list by Batch. Note that the list of stations to the left is now selected.
Modify the list to the left to account for the current station list. Use CTRL + mouse to select/deselect stations. Note that if
you select RG15 there will be an error in the export file.
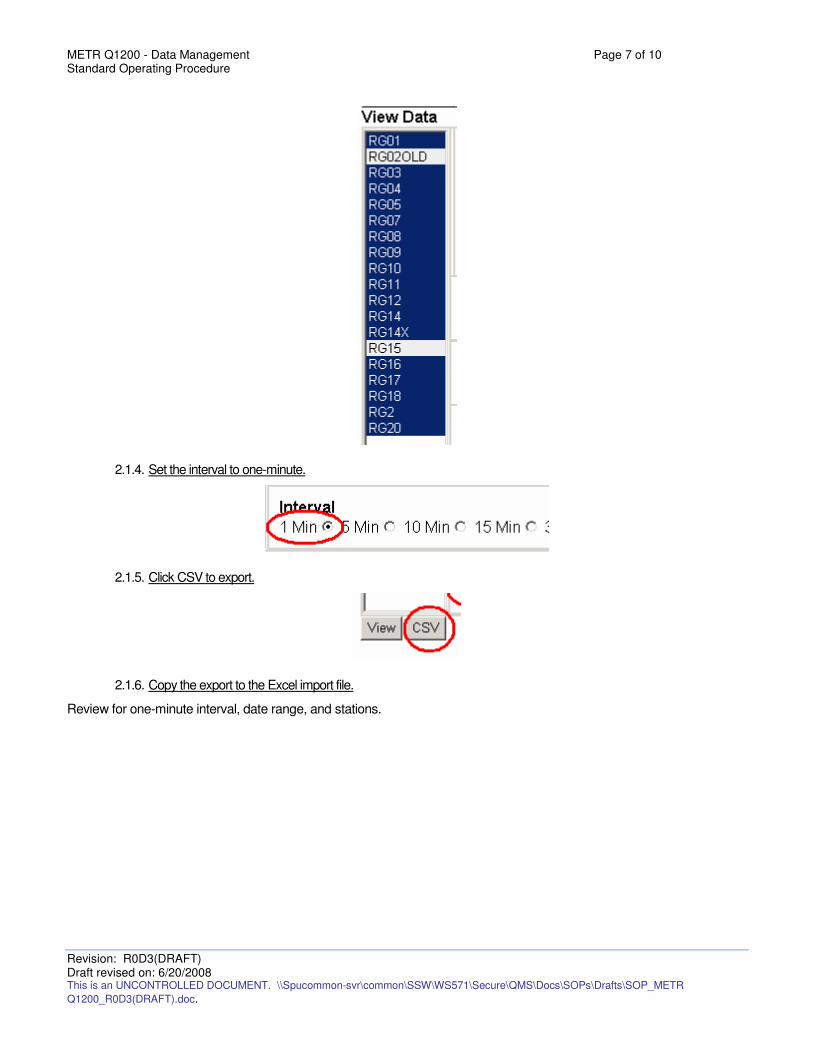
METR Q1200 - Data Management Page 7 of 10 Standard Operating Procedure
Revision: R0D3(DRAFT) Draft revised on: 6/20/2008 This is an UNCONTROLLED DOCUMENT. \\Spucommon-svr\common\SSW\WS571\Secure\QMS\Docs\SOPs\Drafts\SOP_METR
Q1200_R0D3(DRAFT).doc.
2.1.4. Set the interval to one-minute.
2.1.5. Click CSV to export.
2.1.6. Copy the export to the Excel import file.
Review for one-minute interval, date range, and stations.
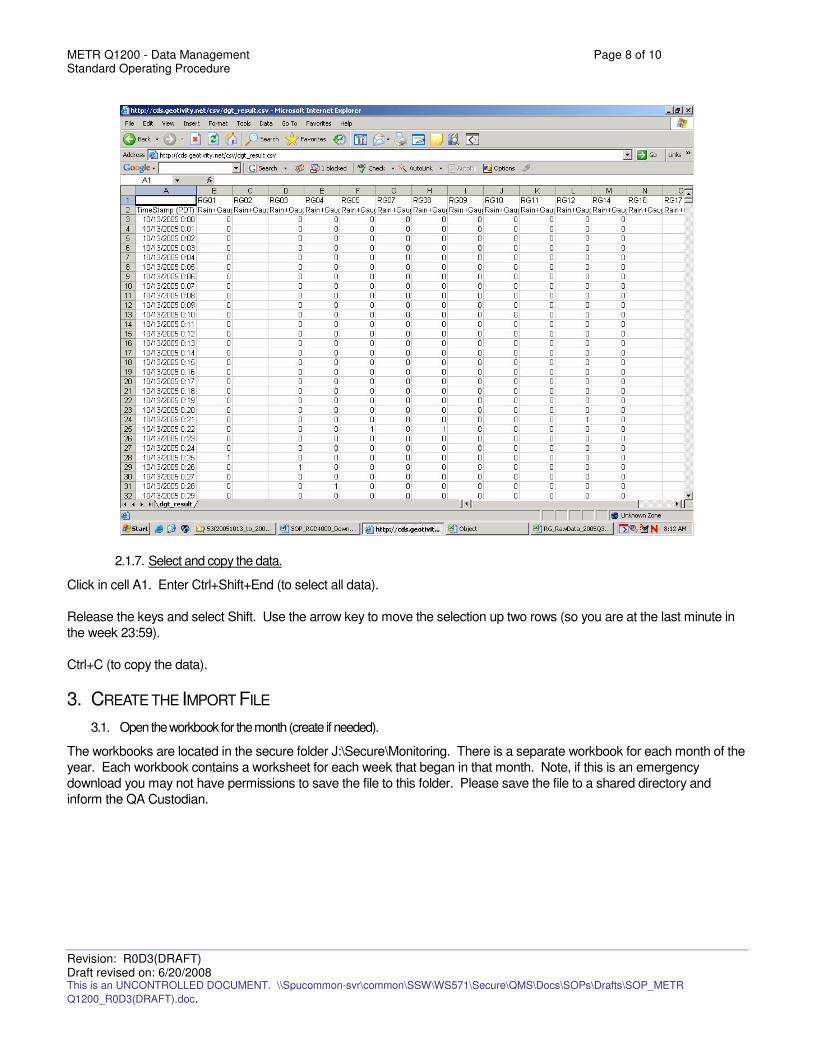
METR Q1200 - Data Management Page 8 of 10 Standard Operating Procedure
Revision: R0D3(DRAFT) Draft revised on: 6/20/2008 This is an UNCONTROLLED DOCUMENT. \\Spucommon-svr\common\SSW\WS571\Secure\QMS\Docs\SOPs\Drafts\SOP_METR
Q1200_R0D3(DRAFT).doc.
2.1.7. Select and copy the data.
Click in cell A1. Enter Ctrl+Shift+End (to select all data).
Release the keys and select Shift. Use the arrow key to move the selection up two rows (so you are at the last minute in
the week 23:59).
Ctrl+C (to copy the data).
3. CREATE THE IMPORT FILE
3.1. Open the workbook for the month (create if needed).
The workbooks are located in the secure folder J:\Secure\Monitoring. There is a separate workbook for each month of the
year. Each workbook contains a worksheet for each week that began in that month. Note, if this is an emergency
download you may not have permissions to save the file to this folder. Please save the file to a shared directory and
inform the QA Custodian.
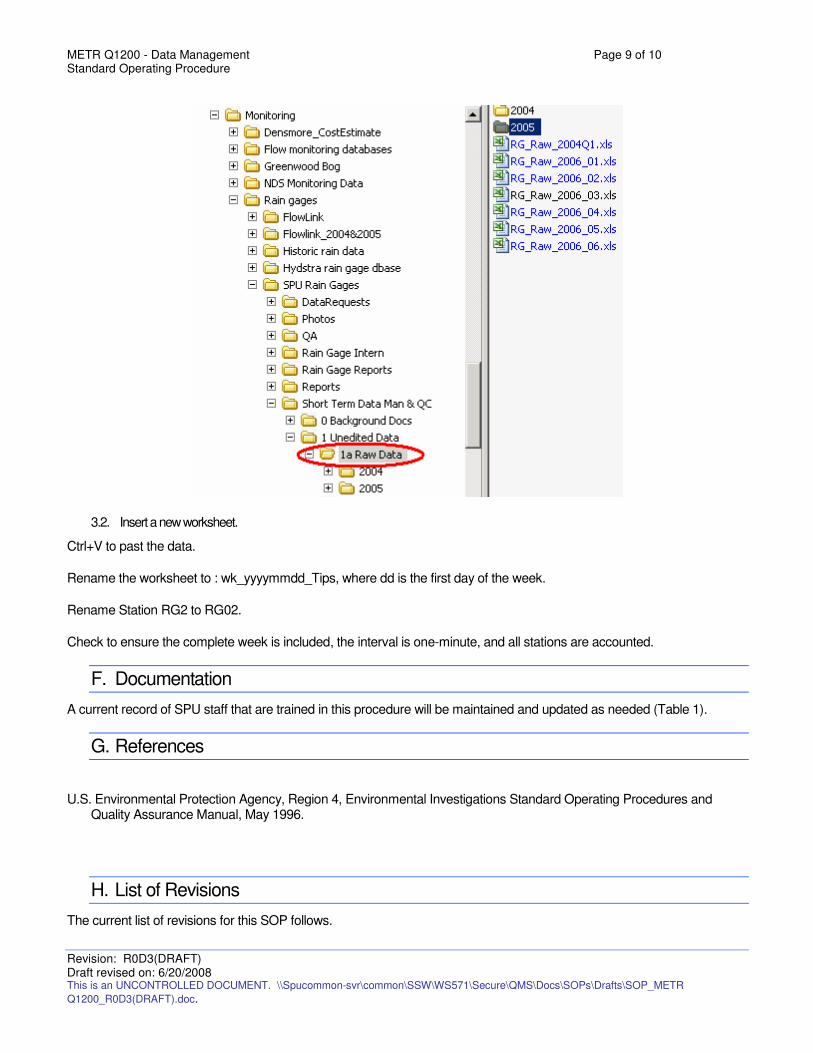
METR Q1200 - Data Management Page 9 of 10 Standard Operating Procedure
Revision: R0D3(DRAFT) Draft revised on: 6/20/2008 This is an UNCONTROLLED DOCUMENT. \\Spucommon-svr\common\SSW\WS571\Secure\QMS\Docs\SOPs\Drafts\SOP_METR
Q1200_R0D3(DRAFT).doc.
3.2. Insert a new worksheet.
Ctrl+V to past the data.
Rename the worksheet to : wk_yyyymmdd_Tips, where dd is the first day of the week.
Rename Station RG2 to RG02.
Check to ensure the complete week is included, the interval is one-minute, and all stations are accounted.
F. Documentation
A current record of SPU staff that are trained in this procedure will be maintained and updated as needed (Table 1).
G. References
U.S. Environmental Protection Agency, Region 4, Environmental Investigations Standard Operating Procedures and Quality Assurance Manual, May 1996.
H. List of Revisions
The current list of revisions for this SOP follows.
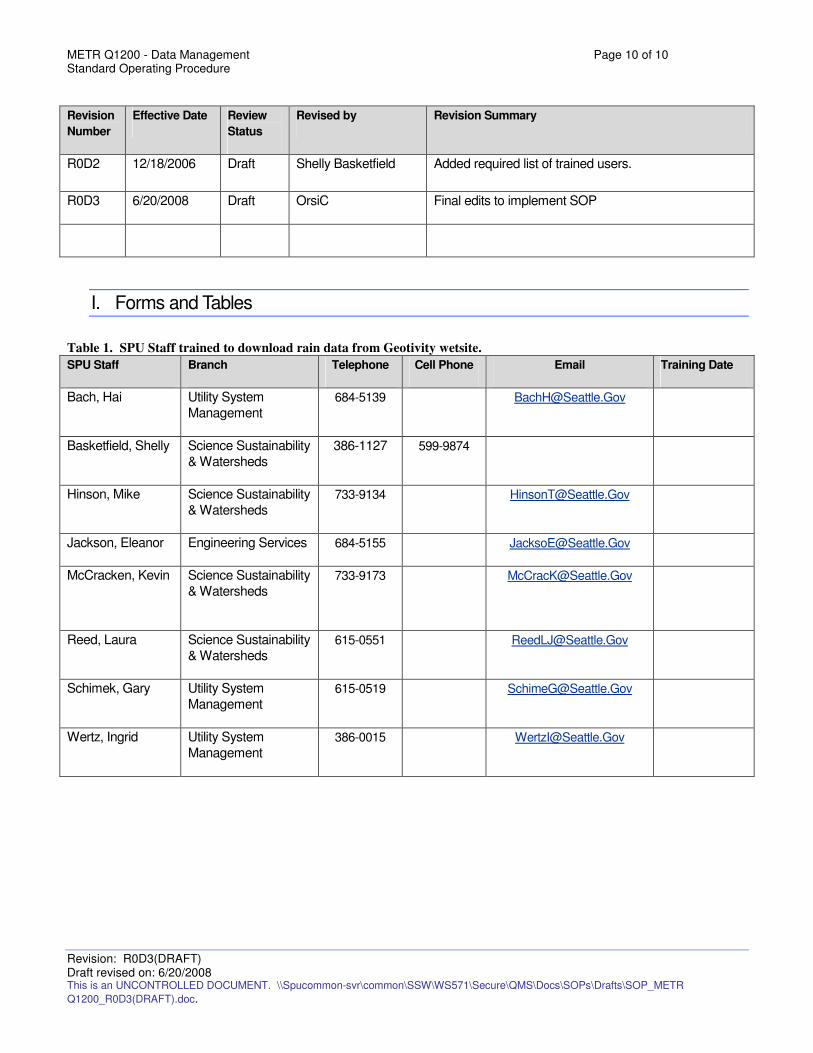
METR Q1200 - Data Management Page 10 of 10 Standard Operating Procedure
Revision: R0D3(DRAFT) Draft revised on: 6/20/2008 This is an UNCONTROLLED DOCUMENT. \\Spucommon-svr\common\SSW\WS571\Secure\QMS\Docs\SOPs\Drafts\SOP_METR
Q1200_R0D3(DRAFT).doc.
Revision
Number
Effective Date Review
Status
Revised by Revision Summary
R0D2 12/18/2006 Draft Shelly Basketfield Added required list of trained users.
R0D3 6/20/2008 Draft OrsiC Final edits to implement SOP
I. Forms and Tables
Table 1. SPU Staff trained to download rain data from Geotivity wetsite.
SPU Staff Branch Telephone Cell Phone Email Training Date
Bach, Hai Utility System
Management 684-5139 [email protected]
Basketfield, Shelly Science Sustainability
& Watersheds
386-1127 599-9874
Hinson, Mike Science Sustainability
& Watersheds 733-9134 [email protected]
Jackson, Eleanor Engineering Services 684-5155 [email protected]
McCracken, Kevin
Science Sustainability
& Watersheds 733-9173 [email protected]
Reed, Laura Science Sustainability
& Watersheds 615-0551 [email protected]
Schimek, Gary Utility System
Management 615-0519 [email protected]
Wertz, Ingrid Utility System
Management 386-0015 [email protected]
Identifier:
METR Q1100
Revision:
R0D7(DRAFT)
Draft revised on:
6/20/2008
Custodian:
Brian Morgenroth
Authorization Authority:
Quality Assurance Officer (TBD)
Meteorology
Standard Operating Procedure
METR Q1100 - Data Review & Validation
Seattle Public Utilities Seattle , Washington
This document is part of the Science Information Quality System and describes standard operating procedures to ensure a systematic consistent approach is followed for collecting, assessing, and documenting environmental data of known and documented quality.
METR Q1100 - Data Review & Validation Page ii of 13 Standard Operating Procedure
Revision: R0D7(DRAFT) Draft revised on: 6/20/2008 This is an UNCONTROLLED DOCUMENT. \\Spucommon-
svr\common\SSW\WS571\Secure\QMS\Docs\SOPs\Drafts\SOP_METR Q1100_R0D7(DRAFT).doc.
Table of Contents A. Introduction and Scope .....................................................................................................................................3 B. General Cautions ..............................................................................................................................................3 C. Personnel Qualifications ...................................................................................................................................4 D. Equipment and Supplies ...................................................................................................................................4 E. Procedures........................................................................................................................................................4
1. Data Review, Verification, and Validation......................................................................................................4 2. Verification and Validation Methods ..............................................................................................................6
2.1. Data Screening ......................................................................................................................................6 2.1.1. Over-reporting Screening Level Criteria (spikes) ....................................................................... 6 2.1.2. Missing Data Screening Level Criteria ....................................................................................... 7 2.1.3. Under-reporting Screening Level Criteria................................................................................... 7 2.1.4. Substitution ................................................................................................................................. 7
2.2. Manual Review.......................................................................................................................................9 2.3. Comparison Program (Future Development) .........................................................................................9 2.4. Further Evaluations ................................................................................................................................9
3. Performance Criteria .....................................................................................................................................9 3.1. Completeness ......................................................................................................................................10 3.2. Instrument Availability ..........................................................................................................................10
F. Documentation................................................................................................................................................10 G. References......................................................................................................................................................11 H. List of Revisions..............................................................................................................................................11 I. Forms and Tables ...........................................................................................................................................11 List of Tables
Table 1. Data validation levels (EPA 2000). ..................................................................................................... 4 Table 2. Data validation flag codes. ................................................................................................................... 5 Table 3. Spike identification criteria........................................................................................................................ 6 Table 4. Missing data substitution scheme. ............................................................................................................. 7 Table 5. Station substitution scheme. ..................................................................................................................... 8 Table 6. Performance criteria. ................................................................................................................................. 9 Table 7. SPU Staff trained to validate rain data from ADS wetsite. ............................................................ 11
METR Q1100 - Data Review & Validation Page 3 of 13 Standard Operating Procedure
Revision: R0D7(DRAFT) Draft revised on: 6/20/2008 This is an UNCONTROLLED DOCUMENT. \\Spucommon-svr\common\SSW\WS571\Secure\QMS\Docs\SOPs\Drafts\SOP_METR
Q1100_R0D7(DRAFT).doc.
Meteorology
METR Q1100 - Data Review & Validation See also the following Standard Operating Procedures:
METR Q1000 General
METR Q1100 Data Review, Verification, & Validation
METR Q1200 Data Management
METR Q1300 Data Requests
METR C2010 Rain Gage Equipment & Site Selection
METR C2020 Rain Gage Equipment Installation
METR C2030 Rain Gage Field Calibration & Maintenance
METR C2040 Rain Gage Field Inspections
A. Introduction and Scope
This Standard Operating Procedure (SOP) presents procedures to be used to consistently review, verify, and
validate rain gage data. In addition to presenting current procedures, this SOP presents procedures that
should be implemented but have not at this time. Current procedures are associated with a Level 1 Validation
(refer to Section E). Recommended procedures are those associated with Level 2 Validation (refer to Section E) and are indicated in italics throughout SOP. Please note that the QA/QC processes may be further refined in
the Quality Assurance Project Plan (QAPP) for I-SCADA IMS.
This SOP has been applied to Geotivity data collected since 2005.
This SOP may be expanded in the future to include verification, validation, and assessment of additional
meteorological data.
B. General Cautions
The Quality Assurance (QA) objectives are defined in terms of precision, accuracy, representativeness,
completeness, and comparability (PARCC) parameters.
The primary goal of this procedure is to assure the quality and integrity of the measurements, the
representativeness of the results, the precision and accuracy of the analyses, and the completeness of the data.
Data that meets the QA objectives and goals will be deemed acceptable. Data that do not meet objectives and
goals will be reviewed on a case-by-case basis to ascertain usefulness.
The data review and verification procedure should be completed in a timely manner so that if needed, data
transposition can be accomplished within the compliance period.
The quality of each measurement will be documented using the following procedures. Should any criterion
provided below be less stringent than a criterion specified in an applicable Quality Assurance Project Plan
(QAPP), the QAPP criterion will apply.
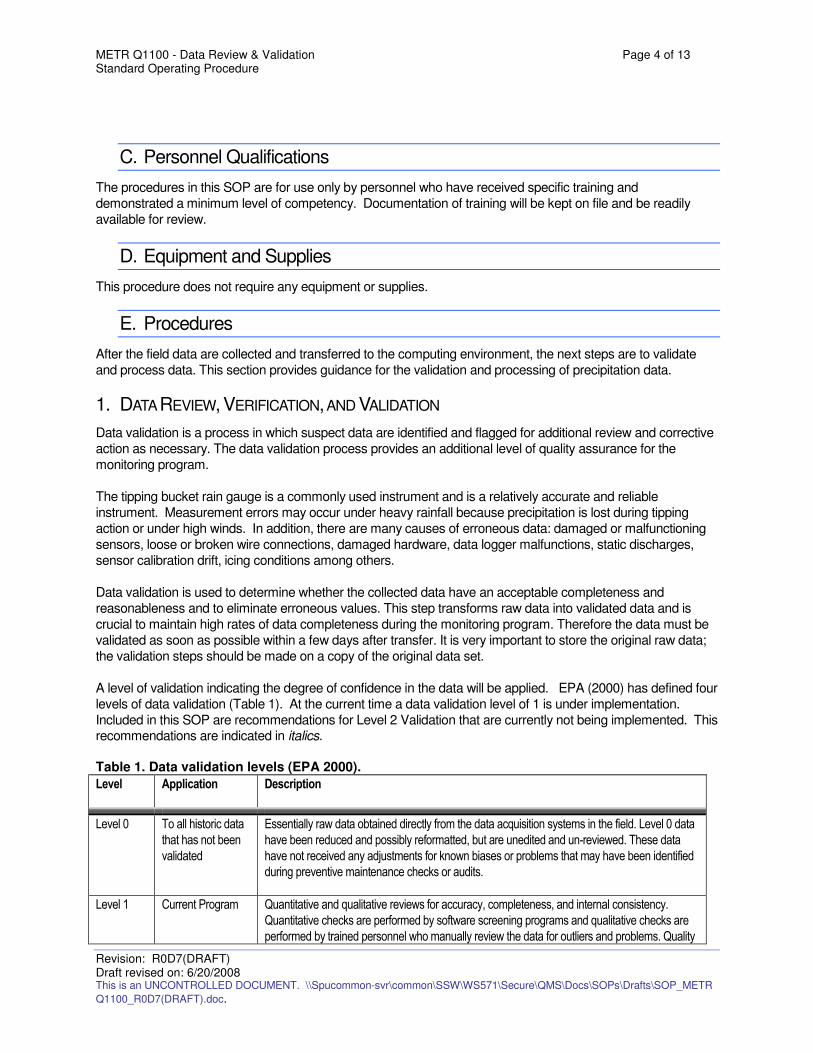
METR Q1100 - Data Review & Validation Page 4 of 13 Standard Operating Procedure
Revision: R0D7(DRAFT) Draft revised on: 6/20/2008 This is an UNCONTROLLED DOCUMENT. \\Spucommon-svr\common\SSW\WS571\Secure\QMS\Docs\SOPs\Drafts\SOP_METR
Q1100_R0D7(DRAFT).doc.
C. Personnel Qualifications
The procedures in this SOP are for use only by personnel who have received specific training and
demonstrated a minimum level of competency. Documentation of training will be kept on file and be readily
available for review.
D. Equipment and Supplies
This procedure does not require any equipment or supplies.
E. Procedures
After the field data are collected and transferred to the computing environment, the next steps are to validate
and process data. This section provides guidance for the validation and processing of precipitation data.
1. DATA REVIEW, VERIFICATION, AND VALIDATION
Data validation is a process in which suspect data are identified and flagged for additional review and corrective
action as necessary. The data validation process provides an additional level of quality assurance for the
monitoring program.
The tipping bucket rain gauge is a commonly used instrument and is a relatively accurate and reliable
instrument. Measurement errors may occur under heavy rainfall because precipitation is lost during tipping
action or under high winds. In addition, there are many causes of erroneous data: damaged or malfunctioning
sensors, loose or broken wire connections, damaged hardware, data logger malfunctions, static discharges,
sensor calibration drift, icing conditions among others.
Data validation is used to determine whether the collected data have an acceptable completeness and
reasonableness and to eliminate erroneous values. This step transforms raw data into validated data and is
crucial to maintain high rates of data completeness during the monitoring program. Therefore the data must be
validated as soon as possible within a few days after transfer. It is very important to store the original raw data;
the validation steps should be made on a copy of the original data set.
A level of validation indicating the degree of confidence in the data will be applied. EPA (2000) has defined four
levels of data validation (Table 1). At the current time a data validation level of 1 is under implementation.
Included in this SOP are recommendations for Level 2 Validation that are currently not being implemented. This recommendations are indicated in italics.
Table 1. Data validation levels (EPA 2000).
Level Application Description
Level 0 To all historic data
that has not been
validated
Essentially raw data obtained directly from the data acquisition systems in the field. Level 0 data
have been reduced and possibly reformatted, but are unedited and un-reviewed. These data
have not received any adjustments for known biases or problems that may have been identified
during preventive maintenance checks or audits.
Level 1 Current Program Quantitative and qualitative reviews for accuracy, completeness, and internal consistency.
Quantitative checks are performed by software screening programs and qualitative checks are
performed by trained personnel who manually review the data for outliers and problems. Quality
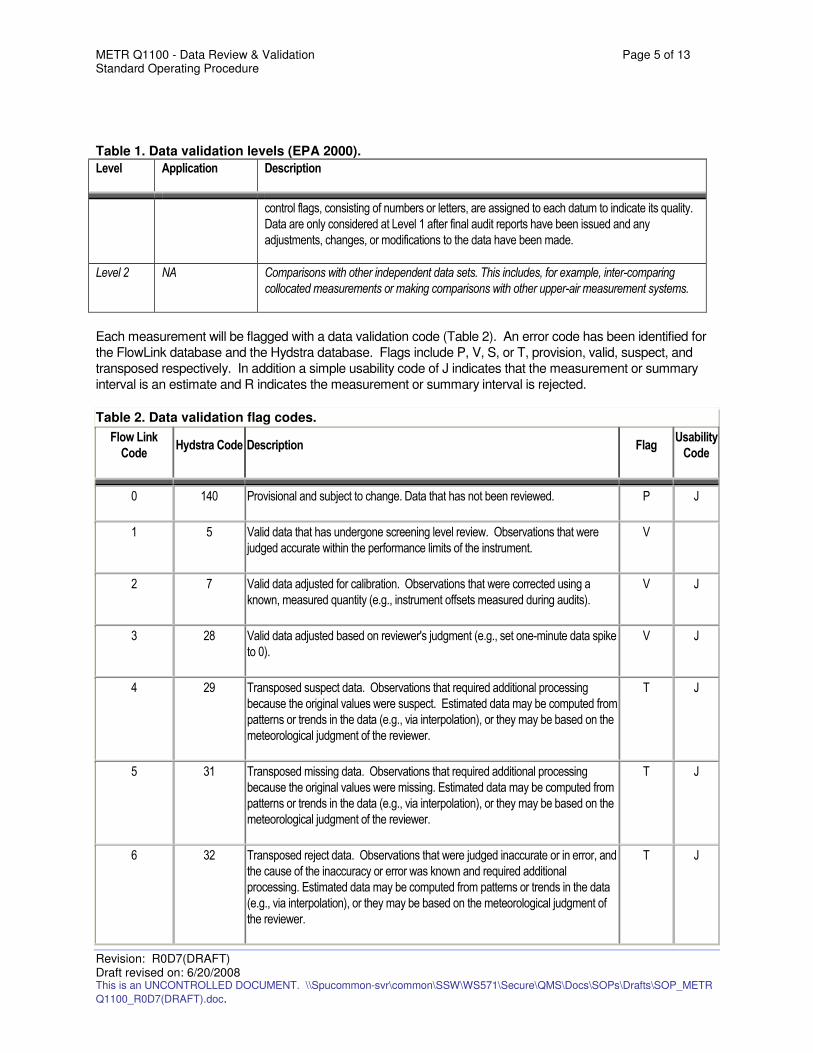
METR Q1100 - Data Review & Validation Page 5 of 13 Standard Operating Procedure
Revision: R0D7(DRAFT) Draft revised on: 6/20/2008 This is an UNCONTROLLED DOCUMENT. \\Spucommon-svr\common\SSW\WS571\Secure\QMS\Docs\SOPs\Drafts\SOP_METR
Q1100_R0D7(DRAFT).doc.
Table 1. Data validation levels (EPA 2000).
Level Application Description
control flags, consisting of numbers or letters, are assigned to each datum to indicate its quality.
Data are only considered at Level 1 after final audit reports have been issued and any
adjustments, changes, or modifications to the data have been made.
Level 2 NA Comparisons with other independent data sets. This includes, for example, inter-comparing
collocated measurements or making comparisons with other upper-air measurement systems.
Each measurement will be flagged with a data validation code (Table 2). An error code has been identified for
the FlowLink database and the Hydstra database. Flags include P, V, S, or T, provision, valid, suspect, and
transposed respectively. In addition a simple usability code of J indicates that the measurement or summary
interval is an estimate and R indicates the measurement or summary interval is rejected.
Table 2. Data validation flag codes.
Flow Link
Code Hydstra Code Description Flag
Usability
Code
0 140 Provisional and subject to change. Data that has not been reviewed. P J
1 5 Valid data that has undergone screening level review. Observations that were
judged accurate within the performance limits of the instrument.
V
2 7 Valid data adjusted for calibration. Observations that were corrected using a
known, measured quantity (e.g., instrument offsets measured during audits).
V J
3 28 Valid data adjusted based on reviewer's judgment (e.g., set one-minute data spike
to 0).
V J
4 29 Transposed suspect data. Observations that required additional processing
because the original values were suspect. Estimated data may be computed from
patterns or trends in the data (e.g., via interpolation), or they may be based on the
meteorological judgment of the reviewer.
T J
5 31 Transposed missing data. Observations that required additional processing
because the original values were missing. Estimated data may be computed from
patterns or trends in the data (e.g., via interpolation), or they may be based on the
meteorological judgment of the reviewer.
T J
6 32 Transposed reject data. Observations that were judged inaccurate or in error, and
the cause of the inaccuracy or error was known and required additional
processing. Estimated data may be computed from patterns or trends in the data
(e.g., via interpolation), or they may be based on the meteorological judgment of
the reviewer.
T J
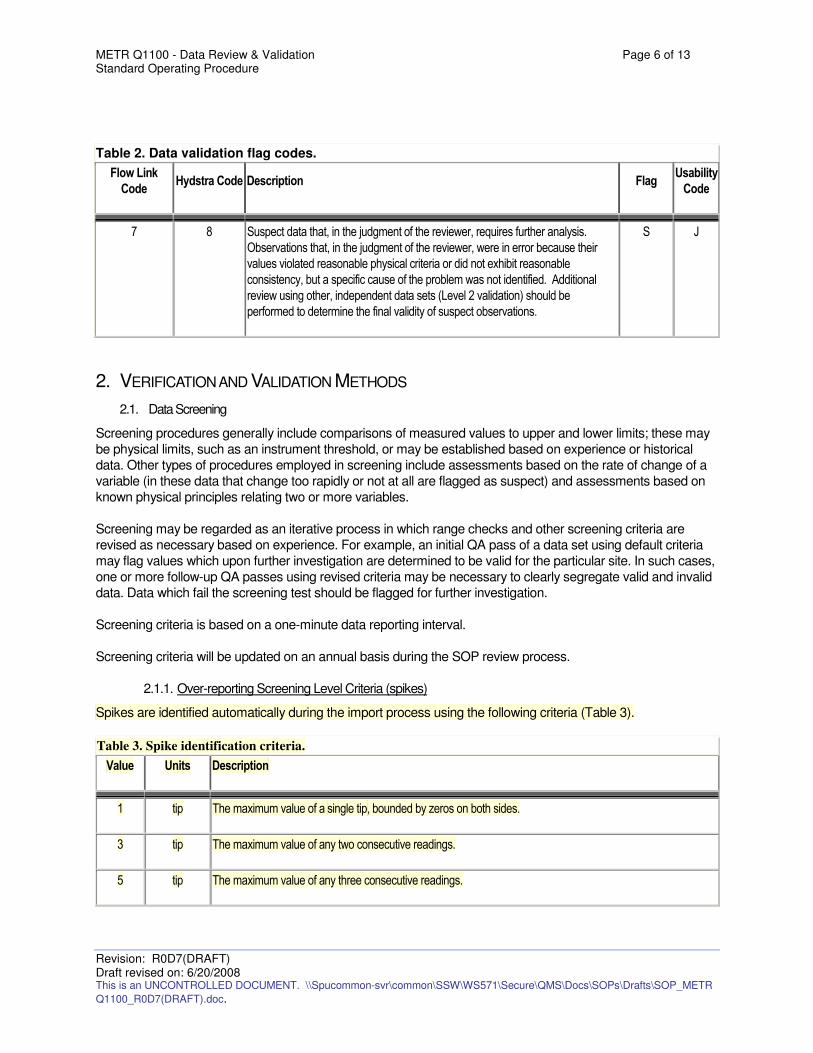
METR Q1100 - Data Review & Validation Page 6 of 13 Standard Operating Procedure
Revision: R0D7(DRAFT) Draft revised on: 6/20/2008 This is an UNCONTROLLED DOCUMENT. \\Spucommon-svr\common\SSW\WS571\Secure\QMS\Docs\SOPs\Drafts\SOP_METR
Q1100_R0D7(DRAFT).doc.
Table 2. Data validation flag codes.
Flow Link
Code Hydstra Code Description Flag
Usability
Code
7 8 Suspect data that, in the judgment of the reviewer, requires further analysis.
Observations that, in the judgment of the reviewer, were in error because their
values violated reasonable physical criteria or did not exhibit reasonable
consistency, but a specific cause of the problem was not identified. Additional
review using other, independent data sets (Level 2 validation) should be
performed to determine the final validity of suspect observations.
S J
2. VERIFICATION AND VALIDATION METHODS
2.1. Data Screening
Screening procedures generally include comparisons of measured values to upper and lower limits; these may
be physical limits, such as an instrument threshold, or may be established based on experience or historical
data. Other types of procedures employed in screening include assessments based on the rate of change of a
variable (in these data that change too rapidly or not at all are flagged as suspect) and assessments based on
known physical principles relating two or more variables.
Screening may be regarded as an iterative process in which range checks and other screening criteria are
revised as necessary based on experience. For example, an initial QA pass of a data set using default criteria
may flag values which upon further investigation are determined to be valid for the particular site. In such cases,
one or more follow-up QA passes using revised criteria may be necessary to clearly segregate valid and invalid
data. Data which fail the screening test should be flagged for further investigation.
Screening criteria is based on a one-minute data reporting interval.
Screening criteria will be updated on an annual basis during the SOP review process.
2.1.1. Over-reporting Screening Level Criteria (spikes)
Spikes are identified automatically during the import process using the following criteria (Table 3).
Table 3. Spike identification criteria.
Value Units Description
1 tip The maximum value of a single tip, bounded by zeros on both sides.
3 tip The maximum value of any two consecutive readings.
5 tip The maximum value of any three consecutive readings.
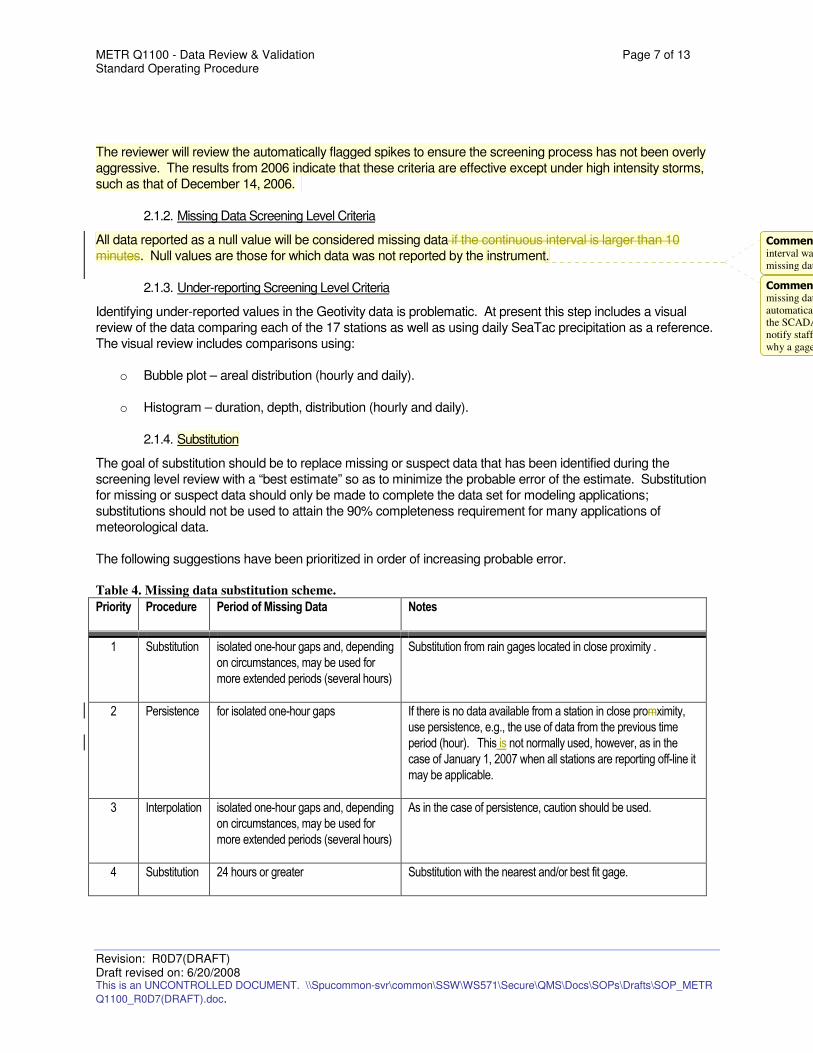
METR Q1100 - Data Review & Validation Page 7 of 13 Standard Operating Procedure
Revision: R0D7(DRAFT) Draft revised on: 6/20/2008 This is an UNCONTROLLED DOCUMENT. \\Spucommon-svr\common\SSW\WS571\Secure\QMS\Docs\SOPs\Drafts\SOP_METR
Q1100_R0D7(DRAFT).doc.
The reviewer will review the automatically flagged spikes to ensure the screening process has not been overly
aggressive. The results from 2006 indicate that these criteria are effective except under high intensity storms,
such as that of December 14, 2006.
2.1.2. Missing Data Screening Level Criteria
All data reported as a null value will be considered missing data if the continuous interval is larger than 10
minutes. Null values are those for which data was not reported by the instrument.
2.1.3. Under-reporting Screening Level Criteria
Identifying under-reported values in the Geotivity data is problematic. At present this step includes a visual
review of the data comparing each of the 17 stations as well as using daily SeaTac precipitation as a reference.
The visual review includes comparisons using:
o Bubble plot – areal distribution (hourly and daily).
o Histogram – duration, depth, distribution (hourly and daily).
2.1.4. Substitution
The goal of substitution should be to replace missing or suspect data that has been identified during the
screening level review with a “best estimate” so as to minimize the probable error of the estimate. Substitution
for missing or suspect data should only be made to complete the data set for modeling applications;
substitutions should not be used to attain the 90% completeness requirement for many applications of
meteorological data.
The following suggestions have been prioritized in order of increasing probable error.
Table 4. Missing data substitution scheme.
Priority Procedure Period of Missing Data Notes
1 Substitution isolated one-hour gaps and, depending
on circumstances, may be used for
more extended periods (several hours)
Substitution from rain gages located in close proximity .
2 Persistence for isolated one-hour gaps If there is no data available from a station in close promximity,
use persistence, e.g., the use of data from the previous time
period (hour). This is not normally used, however, as in the
case of January 1, 2007 when all stations are reporting off-line it
may be applicable.
3 Interpolation isolated one-hour gaps and, depending
on circumstances, may be used for
more extended periods (several hours)
As in the case of persistence, caution should be used.
4 Substitution 24 hours or greater Substitution with the nearest and/or best fit gage.
Comment [SGG4]: interval was due to the large amount o
missing data in the geotivity data sets.
Comment [SGG5]: missing data should be done
automatically before the data is used in
the SCADA system. It should be used to
notify staff to go into the field and see
why a gage is not working.
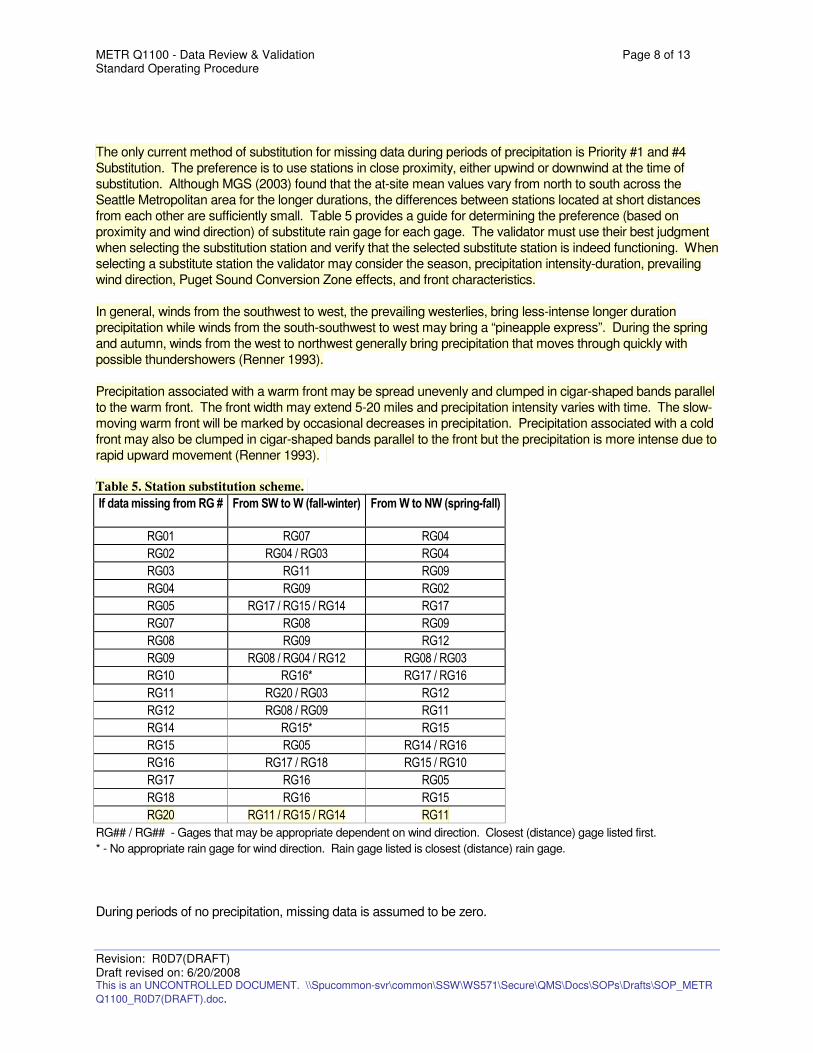
METR Q1100 - Data Review & Validation Page 8 of 13 Standard Operating Procedure
Revision: R0D7(DRAFT) Draft revised on: 6/20/2008 This is an UNCONTROLLED DOCUMENT. \\Spucommon-svr\common\SSW\WS571\Secure\QMS\Docs\SOPs\Drafts\SOP_METR
Q1100_R0D7(DRAFT).doc.
The only current method of substitution for missing data during periods of precipitation is Priority #1 and #4
Substitution. The preference is to use stations in close proximity, either upwind or downwind at the time of
substitution. Although MGS (2003) found that the at-site mean values vary from north to south across the
Seattle Metropolitan area for the longer durations, the differences between stations located at short distances
from each other are sufficiently small. Table 5 provides a guide for determining the preference (based on
proximity and wind direction) of substitute rain gage for each gage. The validator must use their best judgment
when selecting the substitution station and verify that the selected substitute station is indeed functioning. When
selecting a substitute station the validator may consider the season, precipitation intensity-duration, prevailing
wind direction, Puget Sound Conversion Zone effects, and front characteristics.
In general, winds from the southwest to west, the prevailing westerlies, bring less-intense longer duration
precipitation while winds from the south-southwest to west may bring a “pineapple express”. During the spring
and autumn, winds from the west to northwest generally bring precipitation that moves through quickly with
possible thundershowers (Renner 1993).
Precipitation associated with a warm front may be spread unevenly and clumped in cigar-shaped bands parallel
to the warm front. The front width may extend 5-20 miles and precipitation intensity varies with time. The slow-
moving warm front will be marked by occasional decreases in precipitation. Precipitation associated with a cold
front may also be clumped in cigar-shaped bands parallel to the front but the precipitation is more intense due to
rapid upward movement (Renner 1993).
Table 5. Station substitution scheme.
If data missing from RG # From SW to W (fall-winter) From W to NW (spring-fall)
RG01 RG07 RG04
RG02 RG04 / RG03 RG04
RG03 RG11 RG09
RG04 RG09 RG02
RG05 RG17 / RG15 / RG14 RG17
RG07 RG08 RG09
RG08 RG09 RG12
RG09 RG08 / RG04 / RG12 RG08 / RG03
RG10 RG16* RG17 / RG16
RG11 RG20 / RG03 RG12
RG12 RG08 / RG09 RG11
RG14 RG15* RG15
RG15 RG05 RG14 / RG16
RG16 RG17 / RG18 RG15 / RG10
RG17 RG16 RG05
RG18 RG16 RG15
RG20 RG11 / RG15 / RG14 RG11
RG## / RG## - Gages that may be appropriate dependent on wind direction. Closest (distance) gage listed first.
* - No appropriate rain gage for wind direction. Rain gage listed is closest (distance) rain gage.
During periods of no precipitation, missing data is assumed to be zero.
METR Q1100 - Data Review & Validation Page 9 of 13 Standard Operating Procedure
Revision: R0D7(DRAFT) Draft revised on: 6/20/2008 This is an UNCONTROLLED DOCUMENT. \\Spucommon-svr\common\SSW\WS571\Secure\QMS\Docs\SOPs\Drafts\SOP_METR
Q1100_R0D7(DRAFT).doc.
For data flagged above as missing, under-reporting, or over-reporting then the data will be substituted as noted
above and flagged with the data validation code (Table 2).
2.2. Manual Review
The manual review should result in a decision to accept or reject data flagged by the screening process. In
addition, manual review may help to identify outliers that were missed by screening. This review should be
performed by someone with the necessary training in meteorological monitoring.
In the typical manual review, data should be scanned to determine if the reported values are reasonable and in
the proper format. Periods of missing data should be investigated. Data should also be evaluated for temporal
consistency. This is particularly useful for identifying outliers in hourly data. Outliers should be reviewed with
reference to local meteorological conditions. Data are considered to be at Level 1 validation following the
manual review and can be used for analysis. Level 1 validation is the currently extent of data validation.
2.3. Comparison Program (Future Development)
This section represents recommendation for a Level 2 validation process which is currently not designed or
implemented.
After the data have passed through the screening program, they should be evaluated in a comparison program.
Randomly selected values should be manually compared with other available, reliable data (such as, data
obtained from the nearest National Weather Service observing station). At least one hour out of every 10 days
should be randomly selected. To account for hour-to-hour variability and the spatial displacement of the NWS
station, a block of several hours may be more desirable. All data selected should be checked against
corresponding measurements at the nearby station(s). In addition, monthly average values should be compared
with climatological normals, as determined by the National Weather Service from records over a 30-year period.
If discrepancies are found which can not be explained by the geographic difference in the measurement
locations or by regional climatic variations, the data should be flagged as questionable.
2.4. Further Evaluations
Any data which are flagged by the screening program or the comparison program should be evaluated by
personnel with meteorological expertise. Decisions must be made to either accept the flagged data, or discard and replace it with data from a nearby representative monitoring station, back-up data or interpolated data. Any
changes in the data due to the validation process should be documented as to the reasons for the change. If
problems in the monitoring system are identified, corrective actions should also be documented. Any edited
data should continue to be flagged so that its reliability can be considered in the interpretation of the results of any modeling analysis which employs the data. (Italics indicate items which are not part of the current Level 1
validation process).
3. PERFORMANCE CRITERIA
Measurement data will be compared against the following criteria to determine if QA objectives and goals are
deemed acceptable (Table 6).
Table 6. Performance criteria.
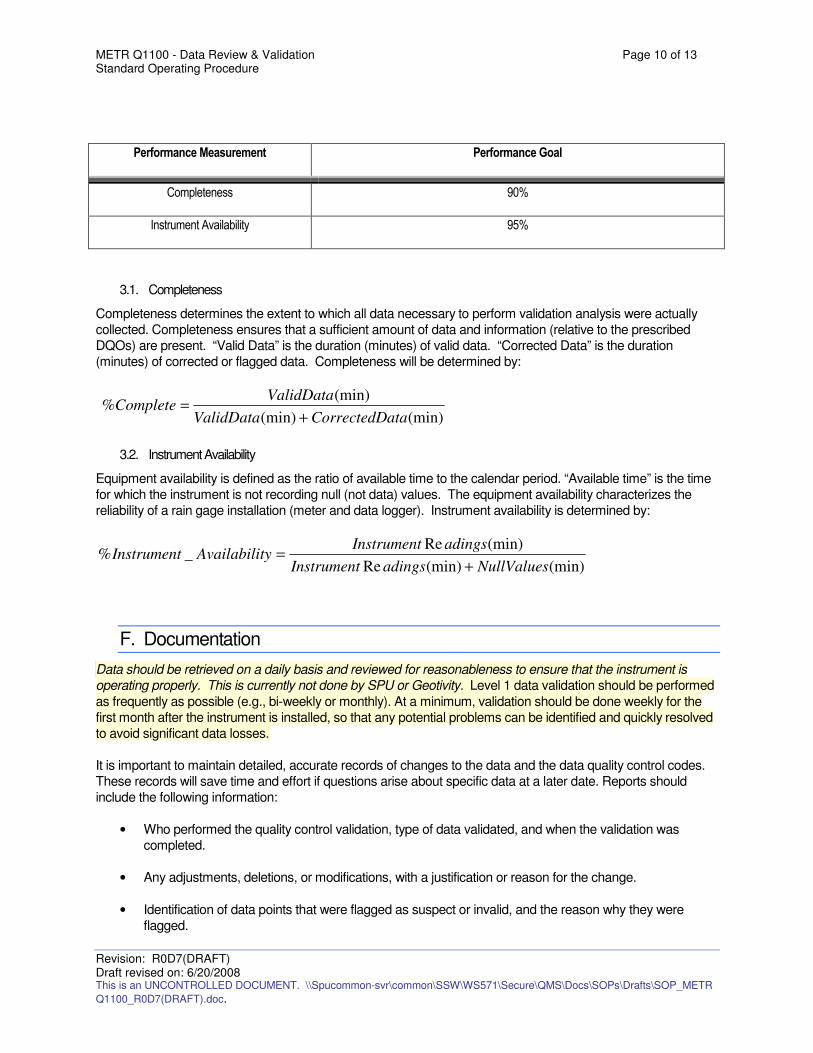
METR Q1100 - Data Review & Validation Page 10 of 13 Standard Operating Procedure
Revision: R0D7(DRAFT) Draft revised on: 6/20/2008 This is an UNCONTROLLED DOCUMENT. \\Spucommon-svr\common\SSW\WS571\Secure\QMS\Docs\SOPs\Drafts\SOP_METR
Q1100_R0D7(DRAFT).doc.
Performance Measurement Performance Goal
Completeness 90%
Instrument Availability 95%
3.1. Completeness
Completeness determines the extent to which all data necessary to perform validation analysis were actually
collected. Completeness ensures that a sufficient amount of data and information (relative to the prescribed
DQOs) are present. “Valid Data” is the duration (minutes) of valid data. “Corrected Data” is the duration
(minutes) of corrected or flagged data. Completeness will be determined by:
(min)(min)
(min)%
ataCorrectedDValidData
ValidDataComplete
+
=
3.2. Instrument Availability
Equipment availability is defined as the ratio of available time to the calendar period. “Available time” is the time
for which the instrument is not recording null (not data) values. The equipment availability characterizes the
reliability of a rain gage installation (meter and data logger). Instrument availability is determined by:
(min)(min)Re
(min)Re_%
NullValuesadingsInstrument
adingsInstrumenttyAvailabiliInstrument
+
=
F. Documentation
Data should be retrieved on a daily basis and reviewed for reasonableness to ensure that the instrument is
operating properly. This is currently not done by SPU or Geotivity. Level 1 data validation should be performed
as frequently as possible (e.g., bi-weekly or monthly). At a minimum, validation should be done weekly for the
first month after the instrument is installed, so that any potential problems can be identified and quickly resolved
to avoid significant data losses.
It is important to maintain detailed, accurate records of changes to the data and the data quality control codes.
These records will save time and effort if questions arise about specific data at a later date. Reports should
include the following information:
• Who performed the quality control validation, type of data validated, and when the validation was
completed.
• Any adjustments, deletions, or modifications, with a justification or reason for the change.
• Identification of data points that were flagged as suspect or invalid, and the reason why they were
flagged.
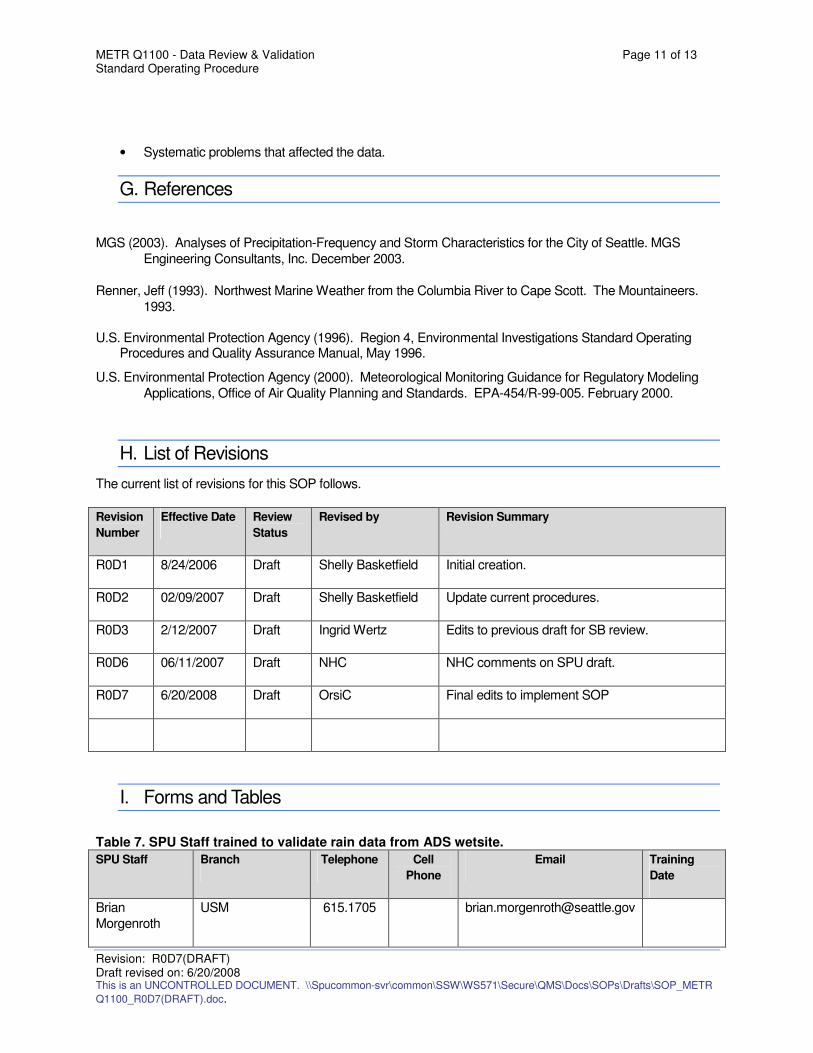
METR Q1100 - Data Review & Validation Page 11 of 13 Standard Operating Procedure
Revision: R0D7(DRAFT) Draft revised on: 6/20/2008 This is an UNCONTROLLED DOCUMENT. \\Spucommon-svr\common\SSW\WS571\Secure\QMS\Docs\SOPs\Drafts\SOP_METR
Q1100_R0D7(DRAFT).doc.
• Systematic problems that affected the data.
G. References
MGS (2003). Analyses of Precipitation-Frequency and Storm Characteristics for the City of Seattle. MGS
Engineering Consultants, Inc. December 2003.
Renner, Jeff (1993). Northwest Marine Weather from the Columbia River to Cape Scott. The Mountaineers.
1993.
U.S. Environmental Protection Agency (1996). Region 4, Environmental Investigations Standard Operating Procedures and Quality Assurance Manual, May 1996.
U.S. Environmental Protection Agency (2000). Meteorological Monitoring Guidance for Regulatory Modeling
Applications, Office of Air Quality Planning and Standards. EPA-454/R-99-005. February 2000.
H. List of Revisions
The current list of revisions for this SOP follows.
Revision
Number
Effective Date Review
Status
Revised by Revision Summary
R0D1 8/24/2006 Draft Shelly Basketfield Initial creation.
R0D2 02/09/2007 Draft Shelly Basketfield Update current procedures.
R0D3 2/12/2007 Draft Ingrid Wertz Edits to previous draft for SB review.
R0D6 06/11/2007 Draft NHC NHC comments on SPU draft.
R0D7 6/20/2008 Draft OrsiC Final edits to implement SOP
I. Forms and Tables
Table 7. SPU Staff trained to validate rain data from ADS wetsite.
SPU Staff Branch Telephone Cell
Phone
Email Training
Date
Brian
Morgenroth
USM 615.1705 [email protected]
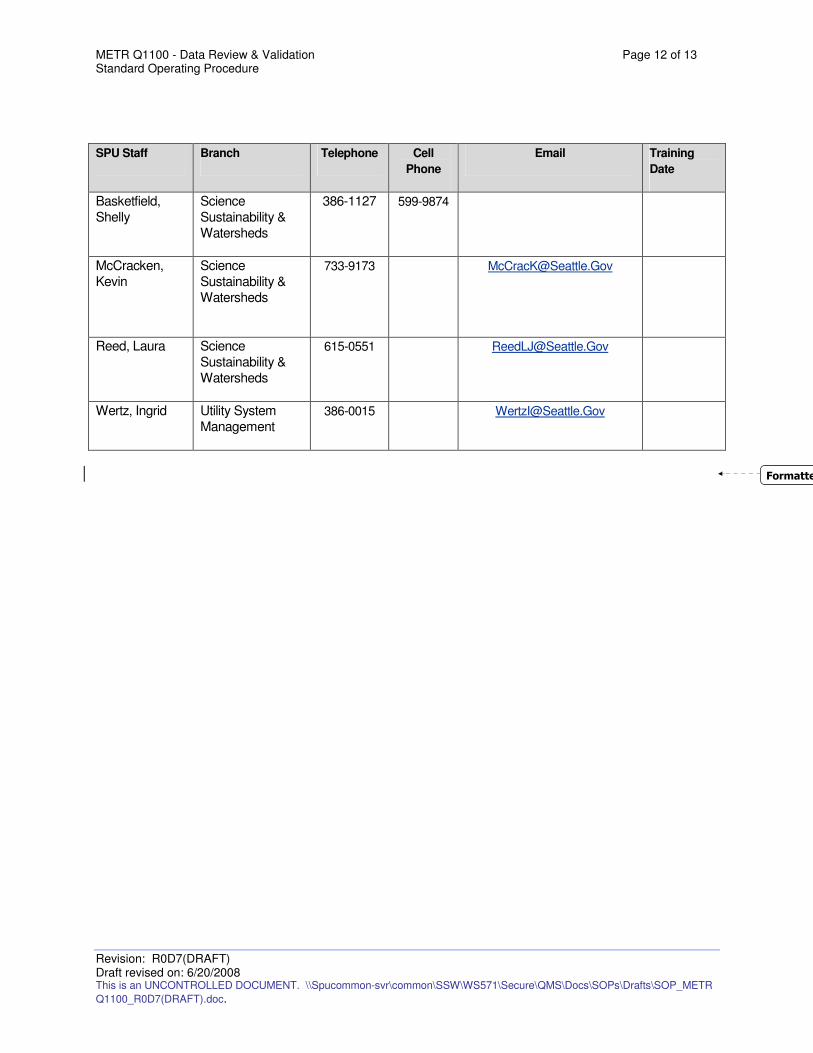
METR Q1100 - Data Review & Validation Page 12 of 13 Standard Operating Procedure
Revision: R0D7(DRAFT) Draft revised on: 6/20/2008 This is an UNCONTROLLED DOCUMENT. \\Spucommon-svr\common\SSW\WS571\Secure\QMS\Docs\SOPs\Drafts\SOP_METR
Q1100_R0D7(DRAFT).doc.
SPU Staff Branch Telephone Cell
Phone
Email Training
Date
Basketfield,
Shelly
Science
Sustainability &
Watersheds
386-1127 599-9874
McCracken,
Kevin
Science
Sustainability &
Watersheds
733-9173 [email protected]
Reed, Laura Science
Sustainability &
Watersheds
615-0551 [email protected]
Wertz, Ingrid Utility System
Management 386-0015 [email protected]
Formatted:

METR Q1100 - Data Review & Validation Page 13 of 13 Standard Operating Procedure
Revision: R0D7(DRAFT) Draft revised on: 6/20/2008 This is an UNCONTROLLED DOCUMENT. \\Spucommon-svr\common\SSW\WS571\Secure\QMS\Docs\SOPs\Drafts\SOP_METR
Q1100_R0D7(DRAFT).doc.
General Comments:
There is a lot of very useful information in the SOP_METR Q1100_ROD5_DRAFT; however, it is not
necessarily written as a procedure because section E of the document does not really provide step by step
instructions aimed at producing a QA/QC’d data set. It may be useful to break the QA\QC procedure into three
steps: an automated review that occurs continuously, a manual review that occurs on a bi-weekly or monthly
basis and a publication step.
The automated review would continuously track data to ensure that instruments are reporting data and that data
are within a reasonable range. Data meeting or not meeting simple criteria would be flagged to tag periods of
Missing Data or Spike values. The results from the automated review would be very useful for identifying
problems with rain gages that require SPU personnel to be sent into the field.
On a biweekly or monthly basis a manual review of the data should occur. The manual review would involve
review of the flags set by the automated review by a manual operator and any additional steps that require
trained personnel such as the Under Reporting Screening Level Criteria and Data Substitution. The manual
review should include all of the steps described in section 2.2 of the current SOP and should result in level 1
validation.
The final publication step would occur on a less frequent basis. It would require a review of the level 1 data sets
by a gatekeeper that is not involved with the normal manual review process.
Formatted:

Identifier:
HYDR Q1100
Revision:
R1D0
Effective date:
6/20/2008
Custodian:
Hai Bach
Authorization Authority:
Quality Assurance Officer (TBD)
Flow Monitor Network
Standard Operating Procedure
HYDR Q1100 - Data Review, Assessment, Validation, & Verification
Seattle Public Utilities
Seattle , Washington
This document is part of the Science Information Quality System and describes standard operating procedures that help ensure a systematic, consistent approach is followed for collecting, assessing, and documenting environmental data of known and documented quality.
HYDR Q1100 - DATA REVIEW, ASSESSMENT, VALIDATION, & VERIFICATION Page ii of 10 Standard Operating Procedure
Revision: R1D0 Effective date: 6/20/2008 This is an UNCONTROLLED DOCUMENT. \\Spucommon-
svr\common\SSW\WS571\Secure\QMS\Docs\SOPs\Drafts\SOP_HYDR Q1100_R0D8(DRAFT).doc.
Table of Contents A. Introduction and Scope .....................................................................................................................................3 B. General Cautions ..............................................................................................................................................3 C. Personnel Qualifications ...................................................................................................................................4 D. Equipment and Supplies ...................................................................................................................................4 E. Procedures........................................................................................................................................................4
1. Automated review of raw data .......................................................................................................................4 1.1. Objectives and Strategies for Automated Review ..................................................................................4 1.2. Data Tolerance Ranges for Questionable Data......................................................................................4 1.3. Identify and Flag Questionable Raw Data ..............................................................................................4 1.4. Alarm for Field Verification/Investigation ................................................................................................4 1.5. Uptime....................................................................................................................................................5
2. Quality Control Review of Data .....................................................................................................................5 2.1. Examining Flow Monitoring Data............................................................................................................5
2.1.1. Scatter graphs (Manning Curve, Iso-Q Curves) .......................................................................... 5 2.1.2. Examine the Scatter graphs......................................................................................................... 5 2.1.3. Depth, Velocity, and Flow Hydrographs .................................................................................... 6
2.2. Flow Balancing.......................................................................................................................................6 2.2.1. Correcting Imbalances ................................................................................................................ 7 2.2.2. Rechecking Confirmations.......................................................................................................... 7
2.3. Validating Rainfall Data..........................................................................................................................7 2.3.1. Hyetographs ................................................................................................................................ 7 2.3.2. Tabular Data................................................................................................................................ 7 2.3.3. Radar-Rainfall Data .................................................................................................................... 8
2.4. Finalization or verification of Validated Data ..........................................................................................8 2.4.1. Dfinal .......................................................................................................................................... 8 2.4.2. Vfinal .......................................................................................................................................... 8 2.4.3. Qfinal .......................................................................................................................................... 8 2.4.4. Rain Gauge Data ......................................................................................................................... 8 2.4.5. Radar Rainfall Data..................................................................................................................... 8
3. Publish Data ..................................................................................................................................................8 3.1. Manage Data..........................................................................................................................................8 3.2. Archive Data...........................................................................................................................................8 3.3. Maintain Accessibility of Data.................................................................................................................8
F. Documentation..................................................................................................................................................8 G. References........................................................................................................................................................9 H. List of Revisions..............................................................................................................................................10 I. Forms and Tables ...........................................................................................................................................10
HYDR Q1100 - DATA REVIEW, ASSESSMENT, VALIDATION, & VERIFICATION Page 3 of 10 Standard Operating Procedure
Revision: R1D0 Effective date: 6/20/2008 This is an UNCONTROLLED DOCUMENT. \\Spucommon-svr\common\SSW\WS571\Secure\QMS\Docs\SOPs\Drafts\SOP_HYDR
Q1100_R0D8(DRAFT).doc.
Flow Monitor Network
Q1100 – Data Review, Assessment, Validation, and Verification
See also the following Standard Operating Procedures:
HYDR Q1000 – General and Specific Program Needs Training, Roles and Responsibilities
HYDR Q1200 – Data Management, Archiving and Retrieval
HYDR Q1300 – Data Requests
HYDR C2000 – Open Channel Flow
HYDR C3100 – Piped Flow Gravity
HYDR C3200 – Piped Flow Pressure
HYDR C4000 – Pumps
A. Introduction and Scope
This Standard Operating Procedure (SOP) presents procedures to be used to consistently review, verify,
and validate rain gauge, flow monitor, stream gauge, and pump performance. In addition to presenting
current procedures, this SOP presents procedures that should be, but have not yet been, implemented.
Current procedures are associated with a Level 1 Validation (refer to Section E). Recommended procedures are those associated with Level 2 Validation (refer to Section E) and are indicated in italics
throughout SOP.
Understanding the Objective or Purpose of Data Review
This SOP is intended to be applied to rain gauges, flow monitors, stream gauges, and pumps starting
after acceptance in 2007.
B. General Cautions
Quality Assurance (QA) objectives are defined in terms of precision, bias, completeness, operability, and
comparability parameters.
The primary goal of the data review, assessment, validation, and verification procedure is to assure the
quality and integrity of the measurements, the precision and accuracy of the finalized data, and the
completeness of the data.
Data that meet the QA objectives and goals will be considered acceptable. Data that do not meet
objectives and goals will be reviewed on a case-by-case basis to ascertain usefulness and remedies.
The investigation, installation, data review, and verification procedures should be completed in a timely
manner so that sites can be finalized and data can be evaluated within the compliance periods.
The quality of each measurement will be documented using the procedures described in this document.
Should any criterion provided below be less stringent than a criterion specified in an applicable Quality
Assurance Project Plan (QAPP), the QAPP criterion will apply.
HYDR Q1100 - DATA REVIEW, ASSESSMENT, VALIDATION, & VERIFICATION Page 4 of 10 Standard Operating Procedure
Revision: R1D0 Effective date: 6/20/2008 This is an UNCONTROLLED DOCUMENT. \\Spucommon-svr\common\SSW\WS571\Secure\QMS\Docs\SOPs\Drafts\SOP_HYDR
Q1100_R0D8(DRAFT).doc.
C. Personnel Qualifications
The procedures in this SOP are for use only by personnel who have received specific training and
demonstrated a minimum level of competency. Documentation of training will be kept on file and be
readily available for review.
D. Equipment and Supplies
The referenced procedures will require ADS Profile® software, ADS Sliicer
® software, or SCADA software
with similar capabilities. Individuals using these products need to have been trained on the software,
procedures, and action items associated with these tasks. Refer to the SOPs listed in Section A for more
specific information about tasks.
E. Procedures
The procedures stated or referenced in this SOP provide direction for obtaining valid hydraulic and
hydrologic data to help manage and improve the performance of the SPU collection system. This section
provides general guidance for the review, assessment, validation and verification of flow-monitoring data
vital to this part of the SPU mission.
1. AUTOMATED REVIEW OF RAW DATA
1.1. Objectives and Strategies for Automated Review
The flow monitors are installed in collection systems that carry debris; therefore, maintenance is
required to keep the monitors working properly. Automated review is used to take a “first glance” at
the data and identify problems such as a malfunctioning flow meter or a debris blockage that causes
erroneous data.
1.2. Data Tolerance Ranges for Questionable Data
Acceptable parameters for data need to be defined at each flow monitor location. Defining these
parameters requires familiarity with the collection system at each flow monitor location. It also
requires knowledge of how the sewer system reacts to dry weather and wet weather events at the
flow monitor location. Each flow monitor will likely have unique tolerance ranges.
1.3. Identify and Flag Questionable Raw Data
Identify data that falls outside of the defined tolerance ranges. Should the data be unusually high or
low, considering the flow conditions at the time, then field personnel must physically check the
monitor and the monitoring site.
1.4. Alarm for Field Verification/Investigation
Send an alarm for the field personnel to physically check the flow monitor for malfunction, proper
installation, or debris blockage under the following conditions:
• A flow depth of 0 or negative
• Data that falls outside of the defined tolerance ranges
HYDR Q1100 - DATA REVIEW, ASSESSMENT, VALIDATION, & VERIFICATION Page 5 of 10 Standard Operating Procedure
Revision: R1D0 Effective date: 6/20/2008 This is an UNCONTROLLED DOCUMENT. \\Spucommon-svr\common\SSW\WS571\Secure\QMS\Docs\SOPs\Drafts\SOP_HYDR
Q1100_R0D8(DRAFT).doc.
• A flow monitor that fails to send data to the central location
• Periodic spikes in date (Low battery warning for ADS Flow Shark)
1.5. Uptime
Uptime is a percentage of available data points from a network of flow monitors. The higher the
uptime, the more reliable the data is. To determine the uptime, divide the number of available data
points by the number of data points that were meant to be recorded, and express the number as a
percent. Conditions such as surcharging may cause the meter to malfunction. Field crews must
proactively maintain the monitors when erroneous data is received to ensure a higher uptime.
2. QUALITY CONTROL REVIEW OF DATA
2.1. Examining Flow Monitoring Data
This step requires processing the data. When reviewing data from a specific site, the reviewer needs
access to pipe photos, field notes, silt level and other site condition info (ex. Proximity to pump station, always
flow or dry periods in pipe, etc.).
2.1.1. Scatter graphs (Manning Curve, Iso-Q Curves)
Plot data from each flow monitor into the following scatter graphs:
• Manning Curve. Based on the depth reading (flow monitor data), calculate the velocity of
flow. If the slope and channel are known, use Manning’s formula. If slope and channel
are unknown, use regression techniques to calculate the velocity. Possible regression
techniques include the Lanfear-Coll Method and the Stevens-Schutzbach Method, as
described in Modifying Manning’s Equation for Flow Rate Estimates (Lanfear and Coll,
1978). Velocity should be plotted in feet per second versus depth in decimal feet.
• Iso-Q Curve. Iso-A Curves are constant flow lines that are similar to contour lines on a
topographic map. More information on Iso-Q Curves can be found in Scattergraph
Principles and Practice – Tools and Techniques to Evaluate Sewer Capacity (Enfinger
and Stevens, 2006). Add Iso-Q Curves to the Manning Curve scatter graph.
2.1.2. Examine the Scatter graphs
The distribution of data may indicate silted sites, slow-moving flow sites, sites with downstream
bottlenecks, and/or sites operating below the designed capacity or sites that are operating
properly. For more information on interpreting scatter graphs, see
http://www.adsenv.com/scattergraph.
2.1.2.1 Identify Questionable Data
Identify outlying data such as high-depth/low-velocity data points and low-depth/high-velocity data points when compared with the majority of other data points for that flow monitor.
2.1.2.2 Field Verification/Investigation of Questionable Data
Field personnel must physically inspect the flow monitor; clear any debris blockages and check for installation problems that may be causing erroneous data; check for a low battery
HYDR Q1100 - DATA REVIEW, ASSESSMENT, VALIDATION, & VERIFICATION Page 6 of 10 Standard Operating Procedure
Revision: R1D0 Effective date: 6/20/2008 This is an UNCONTROLLED DOCUMENT. \\Spucommon-svr\common\SSW\WS571\Secure\QMS\Docs\SOPs\Drafts\SOP_HYDR
Q1100_R0D8(DRAFT).doc.
on the flow monitor; and fill out field report and notify the quality control reviewer of any issues discovered and remedied in the field.
Field personnel must measure the inner pipe diameter, document on the field report and notify the quality control reviewer of inner pipe diameter. If inner diameter is different from original data, then the quality control reviewer will replot scatter graphs and reexamine the data.
Contact the flow monitor vendor if the equipment is malfunctioning.
2.1.2.3 Generate Best Fit Curves
After removing or correcting the questionable data, generate a curve through the remaining data. Find the equation and R squared value of the curve. The R squared value ranges from 0 to 1. Values closer to 1 indicate a curve that better represents the data and is therefore more reliable. If outlying data points are not corrected or removed prior to generating the curve, then the R squared value will be closer to 0, resulting in a less reliable data set.
2.1.3. Depth, Velocity, and Flow Hydrographs
Use the flow monitoring depth and measured velocity to calculate the flow. Plot time versus flow
to obtain the hydrograph.
2.1.3.1 Identify Questionable Data
Identify outlying data such as sudden spikes or drops in the data and missing time periods of data. The flow monitor should be field verified and investigated to discover the cause of the outlying or missing data.
2.1.3.2 Field Verification and Investigation of Questionable Data
Field personnel must physically inspect the flow monitor; clear any debris blockages and check for installation problems that may be causing erroneous data; verify the pipe diameter; verify connectivity among upstream and downstream sewer to confirm that as-built conditions represent record drawings; check for a low battery on the flow monitor; and document on field report and notify the quality control reviewer of any issues discovered and remedied in the field.
Contact the flow monitor vendor if the equipment is malfunctioning.
2.1.3.3 Calculating Values for Missing Data
In general, it is not good practice to calculate or interpolate values between known data points to infer data points for missing time periods. Any calculated values need to be noted as such.
2.2. Flow Balancing
Corroborate data from the system of flow monitors. The sum of the flow from upstream flow monitors
must be less than the flow from the downstream flow monitors.
HYDR Q1100 - DATA REVIEW, ASSESSMENT, VALIDATION, & VERIFICATION Page 7 of 10 Standard Operating Procedure
Revision: R1D0 Effective date: 6/20/2008 This is an UNCONTROLLED DOCUMENT. \\Spucommon-svr\common\SSW\WS571\Secure\QMS\Docs\SOPs\Drafts\SOP_HYDR
Q1100_R0D8(DRAFT).doc.
2.2.1. Correcting Imbalances
Field personnel must physically inspect the monitor and verify the pipe dimensions. If the velocity
or depth is being read inaccurately, then they must recalibrate the sensor. If it is still being read
incorrectly, the sensor needs to be replaced.
If imbalances in the data continue, physical investigation of the connectivity of the collection
system is required. The actual flow routes may differ from the mapped flow routes.
2.2.2. Rechecking Confirmations
After corrections in the field have been made, flow balancing needs to be performed with new data to confirm that the problems have been solved or to determine if imbalances still exist.
2.3. Validating Rainfall Data
Rainfall can have a large impact on collection system flows through rainfall-dependent infiltration and
inflow (RDII). Knowing the quantity, intensity, and location of rainfall is key to understanding the flows
in the collection system.
Validating rainfall data will ensure that data from improperly functioning rain gauges does not get
used to create the rainfall distribution data set. If a given rain gauge was not functioning, then the
rainfall for that basin should be determined from nearby functioning rain gauges.
2.3.1. Hyetographs
Hyetographs are a visual representation of rainfall intensity. To create a hyetograph, plot Time
versus Rainfall in inches.
Plot hyetographs for each rain gauge using consistent units and compare the graphs to one
another. The hyetographs for each rain gauge should be similar to each other (but not identical).
2.3.1.1 Blocking Rain Gauge Data
Identify areas of missing data from the hyetographs and block them out to ensure that the data does not affect the rainfall distribution. Several software programs are available for this, including ADS Sliicer
®.
2.3.2. Tabular Data
2.3.2.1 Double Mass Balance Check
List all the rain gauge data in a spreadsheet, using one column for each rain gauge.
Find the sum for each column. The sum of each column should be approximately the same. If not, look more closely at the individual rain gauge data for periods that the gauge may have been under or over reporting.
Find the sum each column in increments of 24 hours worth of data. Using the row containing the sums, find the minimum and maximum values. Determine which rain gauge the minimum and maximum values came from. Compare this with minimum and maximum rain gauges from other 24-hour data sets. Rain gauges that continually have the minimum or maximum value may have been under or over reporting.
HYDR Q1100 - DATA REVIEW, ASSESSMENT, VALIDATION, & VERIFICATION Page 8 of 10 Standard Operating Procedure
Revision: R1D0 Effective date: 6/20/2008 This is an UNCONTROLLED DOCUMENT. \\Spucommon-svr\common\SSW\WS571\Secure\QMS\Docs\SOPs\Drafts\SOP_HYDR
Q1100_R0D8(DRAFT).doc.
Field personnel must physically inspect any rain gauge that may be under or over reporting. Ensure that the read switch is properly functioning.
2.3.3. Radar-Rainfall Data
Correlate the rainfall gauge data with radar-rainfall data using a software program such as
CALAMAR (Calcul de Lames d’eau avec l’Aide du Radar [Calculating Rain with the Aid of
Radar]). The software combines field-collected rain gauge data with the National Weather
Service’s radar to produce rainfall distribution with a typical accuracy of +/-10 percent.
2.4. Finalization or verification of Validated Data
2.4.1. Dfinal
Dfinal consists of validated tabular depth monitoring data.
2.4.2. Vfinal
Vfinal consists of validated tabular measured velocity data, raw velocity with a correction factor
(gain or loss).
2.4.3. Qfinal
Qfinal consists of validated tabular flow data calculated from Vfinal, Dfinal & pipe table data.
2.4.4. Rain Gauge Data
Rain gauge data consists of validated of tabular data from each rain gauge in the rain gauge
network.
2.4.5. Radar Rainfall Data
Radar rainfall data is a virtual basin rain gauge consisting of rainfall intensity values over a
1-square-kilometer area in 5-minute time steps.
3. PUBLISH DATA
3.1. Manage Data
Publish all validated data to the designated web site.
3.2. Archive Data
Archive the data to a DVD disc or external hard drive. Label the disc with the type of data, location
data was collected from, and the name of the quality control reviewer. DVDs shall be stored in
accordance with SPU standards.
3.3. Maintain Accessibility of Data
Ensure that data is available to interested parties. Ensure that data cannot be edited by anyone other
than the quality control reviewer.
F. Documentation
HYDR Q1100 - DATA REVIEW, ASSESSMENT, VALIDATION, & VERIFICATION Page 9 of 10 Standard Operating Procedure
Revision: R1D0 Effective date: 6/20/2008 This is an UNCONTROLLED DOCUMENT. \\Spucommon-svr\common\SSW\WS571\Secure\QMS\Docs\SOPs\Drafts\SOP_HYDR
Q1100_R0D8(DRAFT).doc.
Data processing and finalization are important parts of the data collection process. Installing gauges and
monitors and collecting data is expensive. Proper data processing and finalization ensures that all
collected data are validated and verified. Good data can prevent over sizing of facilities and save SPU
and its rate payers headaches and large sums of construction money by avoiding needless construction
and limiting disruption to both the human community and the natural communities in the service area.
Environmental data are crucial to many SPU planning and capital improvement projects, so it is important
to collect, evaluate, and document all the data processing steps. The following data should be collected
including documented field crew site visits on field reports:
• For what site were the data processed?
• For what periods were the data processed?
• Exactly which data were flagged, by whom, and for what reasons?
• What data or which gaps were replaced by calculations or estimates?
• For what periods of data were data adjusted based on confirmations?
• Who performed the quality control validation? What type of data was validated, and when was
validation completed?
• Any adjustments, deletions, or modifications must be accompanied with a justification or reason
for the change.
• What systematic problems, such as silt, affected the data?
G. References
Profile® Software User’s Guide, October 1996, ADS
® Environmental Services.
ADS® FlowShark™ Installation, Operation and Maintenance Manual, February, 2007, ADS
®
Environmental Services.
Enfinger, K.L. and Stevens, P.L., 2006, “Scattergraph Principles and Practice – Tools and Techniques to Evaluate Sewer Capacity,” Proceedings of the Pipeline Division Specialty Conference; Chicago, IL; American Society of Civil Engineers: Reston, VA.
Lanfear, K.J. and Coll, J.J., March 1978. “Modifying Manning’s Equation for Flow Rate Estimates,” Water and Sewage Works, pgs. 68-69.
http://www.adsenv.com/scattergraph.
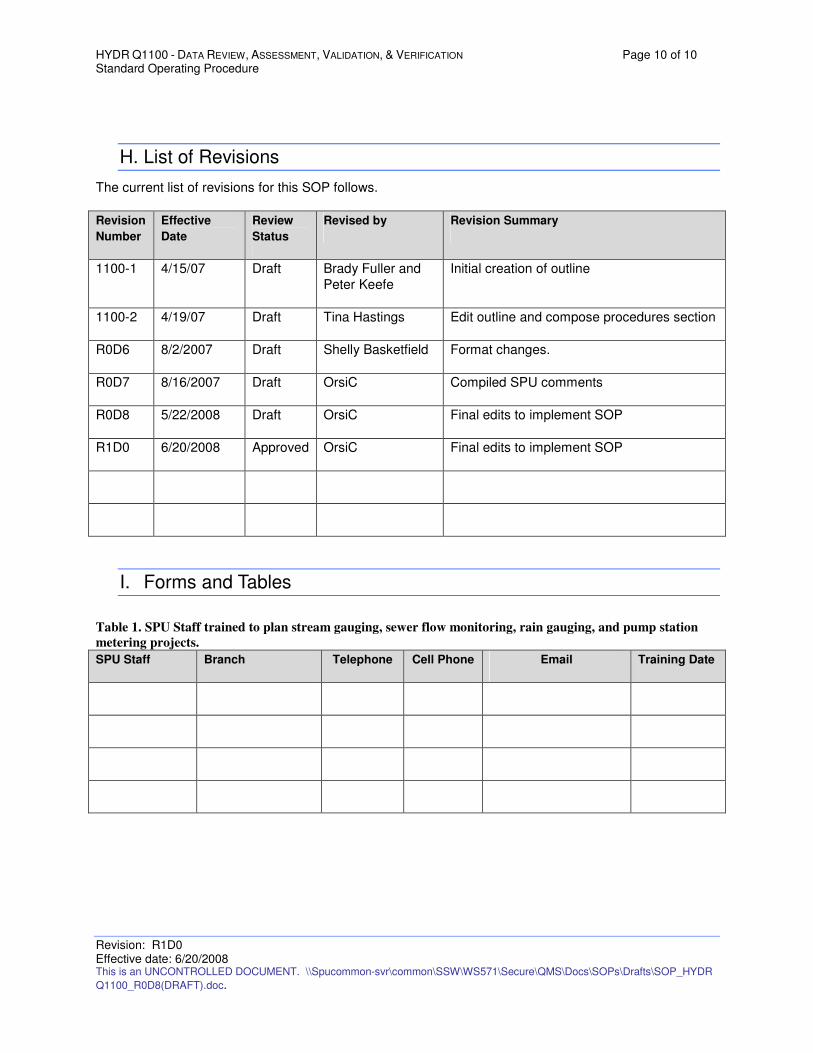
HYDR Q1100 - DATA REVIEW, ASSESSMENT, VALIDATION, & VERIFICATION Page 10 of 10 Standard Operating Procedure
Revision: R1D0 Effective date: 6/20/2008 This is an UNCONTROLLED DOCUMENT. \\Spucommon-svr\common\SSW\WS571\Secure\QMS\Docs\SOPs\Drafts\SOP_HYDR
Q1100_R0D8(DRAFT).doc.
H. List of Revisions
The current list of revisions for this SOP follows.
Revision
Number
Effective
Date
Review
Status
Revised by Revision Summary
1100-1 4/15/07 Draft Brady Fuller and
Peter Keefe
Initial creation of outline
1100-2 4/19/07 Draft Tina Hastings Edit outline and compose procedures section
R0D6 8/2/2007 Draft Shelly Basketfield Format changes.
R0D7 8/16/2007 Draft OrsiC Compiled SPU comments
R0D8 5/22/2008 Draft OrsiC Final edits to implement SOP
R1D0 6/20/2008 Approved OrsiC Final edits to implement SOP
I. Forms and Tables
Table 1. SPU Staff trained to plan stream gauging, sewer flow monitoring, rain gauging, and pump station
metering projects.
SPU Staff Branch Telephone Cell Phone Email Training Date

Identifier:
HYDR C3140
Revision:
R1D0
Effective date:
6/20/2008
Custodian:
Hai Bach
Authorization Authority:
QAO (TBD)
Flow Monitor Network
Standard Operating Procedure
HYDR C3140 - Field Inspections and Problem Diagnosis
Seattle Public Utilities
Seattle , Washington
This document is part of the Science Information Quality System and describes standard operating procedures that help ensure a systematic, consistent approach is followed for collecting, assessing, and documenting environmental data of known and documented quality.
HYDR C3140 - FIELD INSPECTIONS AND PROBLEM DIAGNOSIS Page ii of 40 Standard Operating Procedure
Revision: R1D0 Effective date: 6/20/2008 This is an UNCONTROLLED DOCUMENT. \\Spucommon-svr\common\SSW\WS571\Secure\QMS\Docs\SOPs\Drafts\SOP_HYDR C3140_R0D9(DRAFT).doc
Table of Contents A. Introduction and Scope .....................................................................................................................................4 B. General Cautions ..............................................................................................................................................4 C. Personnel Qualifications ...................................................................................................................................4 D. Equipment and Supplies ...................................................................................................................................5 E. Procedures........................................................................................................................................................5 1. Problem Identification and Diagnosis................................................................................................................5
1.1. All Sensor Plots .............................................................................................................................................5 2. Visual Inspection – Field ...................................................................................................................................8
2.1. Equipment .....................................................................................................................................................8 2.1.1. Verify Physical Placement of Device and Sensors.................................................................................8 2.1.2. Silt and Debris Build-up..........................................................................................................................9 2.1.3. Corrosion................................................................................................................................................9
2.2. Verify Physical Condition of Structure ...........................................................................................................9 2.3. Hydraulic Conditions .....................................................................................................................................9
2.3.1. Changes in Hydraulic Conditions ...........................................................................................................9 3. electrical inspection and testing ......................................................................................................................10
3.1. Power Supply ..............................................................................................................................................10 3.2. Communications Interface...........................................................................................................................10
3.2.1. Antenna and Cable Connections..........................................................................................................10 3.2.2. Serial Cable Connections.....................................................................................................................10 3.2.3. Collect and Save Data..........................................................................................................................10 3.2.4. Swapping Sensors ...............................................................................................................................10
3.3. Evaluate Depth and Velocity Data...............................................................................................................11 F. Documentation................................................................................................................................................11 G. References......................................................................................................................................................11 H. List of Revisions..............................................................................................................................................12 I. Forms and Tables ...........................................................................................................................................13 J. Scattergraph Samples ....................................................................................................................................13 Manning Equation ..................................................................................................................................................13
Design Method – Modifies Manning Equation Shown in Previous Manning Equation Example ...............14 Lanfear-Coll Method – modifies Design Manning method shown in previous example....................................15 Stevens-Schutzbach Method – new method for obtaining actual, in-field pipe curve .......................................16
Constant vs. Varying Roughness Coefficient .........................................................................................................17 Iso-Q (TM) Lines ....................................................................................................................................................18 Shifting Debris........................................................................................................................................................19 Surcharge ..............................................................................................................................................................20 Backwater and Surcharge Conditions ....................................................................................................................21 Dead Dog, Backwater and Orifice Flow .................................................................................................................22 Continuous Backwater ...........................................................................................................................................23 Downstream SSOs.................................................................................................................................................24 Upstream SSOs .....................................................................................................................................................25 Sanitary Sewer Overflow from Overflow Pipe ........................................................................................................26 Reverse Flow .........................................................................................................................................................27 Combined Sewer Overflow (End Weir) ..................................................................................................................28 Combined Sewer Overflow (Side Weir)..................................................................................................................29 Pump Station..........................................................................................................................................................30 Inverted Siphon......................................................................................................................................................31 Restrictor Plate.......................................................................................................................................................32 Hydraulic Hysteresis ..............................................................................................................................................33 Sewer in the News .................................................................................................................................................34 Iso-Froude Lines ....................................................................................................................................................35 Hydraulic Jump ......................................................................................................................................................36 Undulating Hydraulic Jump ....................................................................................................................................37
HYDR C3140 - FIELD INSPECTIONS AND PROBLEM DIAGNOSIS Page iii of 40 Standard Operating Procedure
Revision: R1D0 Effective date: 6/20/2008 This is an UNCONTROLLED DOCUMENT. \\Spucommon-svr\common\SSW\WS571\Secure\QMS\Docs\SOPs\Drafts\SOP_HYDR C3140_R0D9(DRAFT).doc
Drifting Depth Sensor.............................................................................................................................................38 Drifting Velocity Sensor..........................................................................................................................................39 Sewer Amusement.................................................................................................................................................40
List of Tables Table 1. SPU Staff trained to validate operation of and data from flow monitors................................................. 13
List of Figures Figure 1 - All sensor plot ......................................................................................................................................... 6 Figure 2 - Scattergraph ............................................................................................................................................ 7 Figure 3 - Broken pressure and velocity sensors from a CSO ................................................................................. 8

HYDR C3140 - FIELD INSPECTIONS AND PROBLEM DIAGNOSIS Page 4 of 40 Standard Operating Procedure
Revision: R1D0 Effective date: 6/20/2008 This is an UNCONTROLLED DOCUMENT. \\Spucommon-svr\common\SSW\WS571\Secure\QMS\Docs\SOPs\Drafts\SOP_HYDR C3140_R0D9(DRAFT).doc
Flow Monitor Network
C-3140 – Field Inspections See also the following Standard Operating Procedures:
HYDR C1000 – General (Field Planning & Mobilization, Field Decontamination)
HYDR C2000 – Open Channel Flow
HYDR C2010 – Equipment & Site Selection
HYDR C2020 – Equipment Installation
HYDR C2030 – Field Calibrations and Maintenance
HYDR C2040 – Field Inspections
HYDR C3100 – Piped Flow Gravity
HYDR C3120 – Equipment and Installation
HYDR C3130 – Field Calibrations and Maintenance
A. Introduction and Scope
This Standard Operating Procedure (SOP) presents procedures to be used to consistently inspect flow
monitoring data from ADS FlowShark™ and Isco 2150 flow monitors in a manner that will provide early
detection of possible monitoring problems and result in the best possible data. This SOP provides
guidance and procedures to help SPU personnel maintain the monitors in good working order; recognize,
troubleshoot, and fix problems; and check to make sure each sensor on each monitor is interpreting
hydraulic conditions accurately.
The techniques described herein are derived from Scattergraph Principles and Practice, ISO-748, ISO-7178, ISO-8363, ISO-9824, the Profile
® Software Users Guide, the FlowShark™ Manual, and the
Long Term Field Methods Manual, all referenced in Section G of this document. Section G also
references the following Isco manual: 2150 Area Velocity Flow Module and Sensor. This SOP has been
applied to field inspections and problem diagnosis since 2007.
B. General Cautions
Flow monitors and sensors require regular maintenance in order to function at over a 90 percent data-
availability level. While some monitor problems, such as battery failure or sensor failure, are easy to
diagnose, others, such as sensor drift, can be difficult to diagnose. This SOP concentrates on problem
diagnosis and treatment with the objective of maximizing the SPU availability of good data.
Flow monitoring locations in sewers are potentially dangerous because maintaining the monitors often
requires physical entry into the collection system. High flows, poisonous or suffocating gases, and a dirty,
corrosive environment await sewer workers. Sewers are defined by OSHA as confined spaces; therefore,
people servicing or inspecting them require SPU confined-space training and certification. This SOP is
intended to provide guidance that will maximize the SPU capture of the best possible flow monitoring from
every site.
C. Personnel Qualifications
Qualifications for this work are more specialized and restrictive than those mentioned in previous HYDR
series SOPs. In addition to the people who understand open channel flow hydraulics and the difficulties of
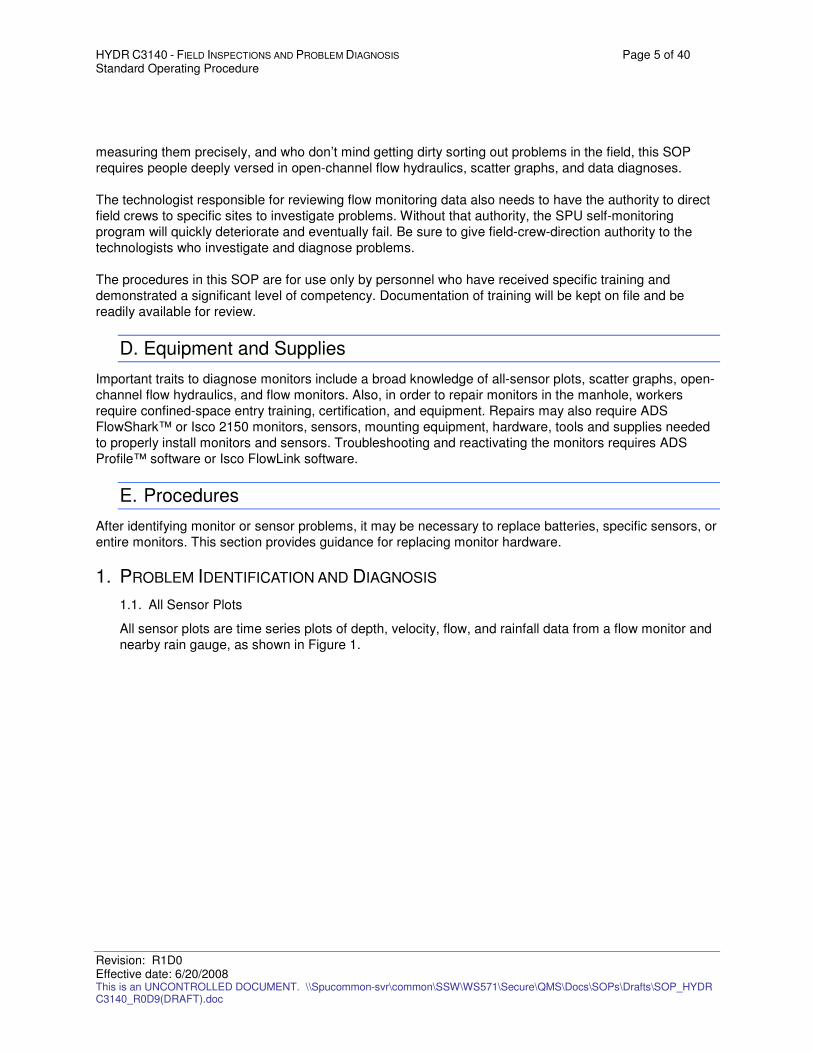
HYDR C3140 - FIELD INSPECTIONS AND PROBLEM DIAGNOSIS Page 5 of 40 Standard Operating Procedure
Revision: R1D0 Effective date: 6/20/2008 This is an UNCONTROLLED DOCUMENT. \\Spucommon-svr\common\SSW\WS571\Secure\QMS\Docs\SOPs\Drafts\SOP_HYDR C3140_R0D9(DRAFT).doc
measuring them precisely, and who don’t mind getting dirty sorting out problems in the field, this SOP
requires people deeply versed in open-channel flow hydraulics, scatter graphs, and data diagnoses.
The technologist responsible for reviewing flow monitoring data also needs to have the authority to direct
field crews to specific sites to investigate problems. Without that authority, the SPU self-monitoring
program will quickly deteriorate and eventually fail. Be sure to give field-crew-direction authority to the
technologists who investigate and diagnose problems.
The procedures in this SOP are for use only by personnel who have received specific training and
demonstrated a significant level of competency. Documentation of training will be kept on file and be
readily available for review.
D. Equipment and Supplies
Important traits to diagnose monitors include a broad knowledge of all-sensor plots, scatter graphs, open-
channel flow hydraulics, and flow monitors. Also, in order to repair monitors in the manhole, workers
require confined-space entry training, certification, and equipment. Repairs may also require ADS
FlowShark™ or Isco 2150 monitors, sensors, mounting equipment, hardware, tools and supplies needed
to properly install monitors and sensors. Troubleshooting and reactivating the monitors requires ADS
Profile™ software or Isco FlowLink software.
E. Procedures
After identifying monitor or sensor problems, it may be necessary to replace batteries, specific sensors, or
entire monitors. This section provides guidance for replacing monitor hardware.
1. PROBLEM IDENTIFICATION AND DIAGNOSIS
1.1. All Sensor Plots
All sensor plots are time series plots of depth, velocity, flow, and rainfall data from a flow monitor and
nearby rain gauge, as shown in Figure 1.
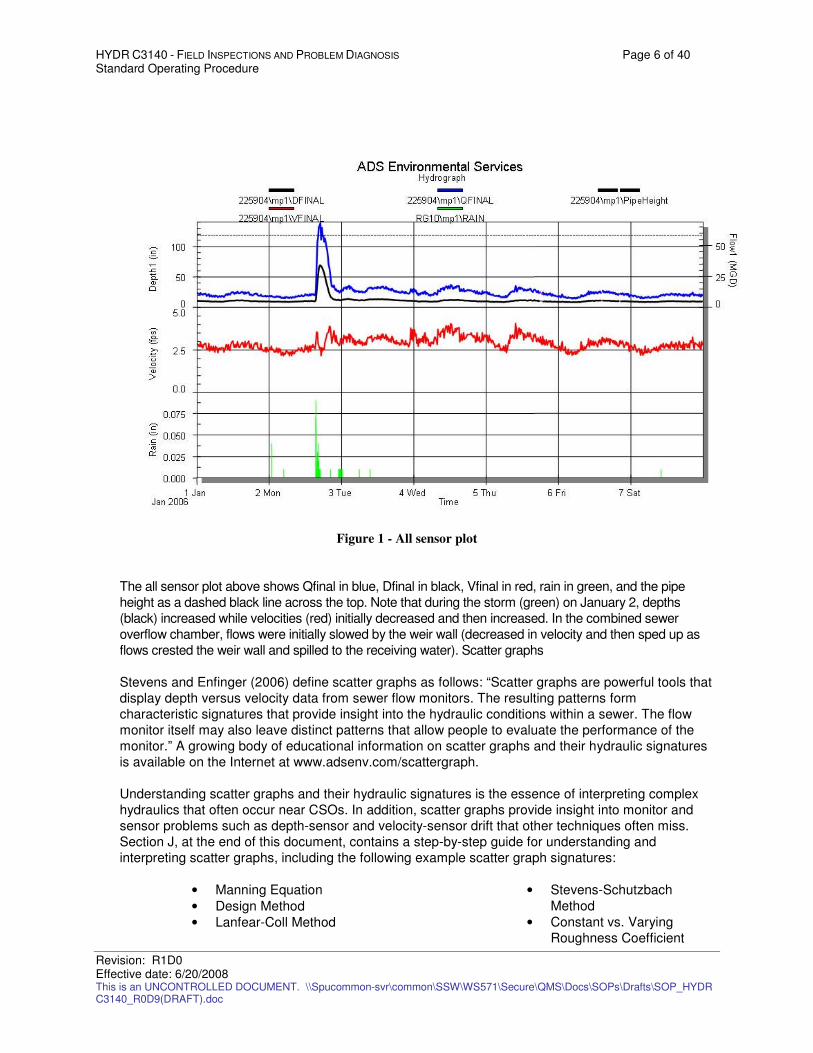
HYDR C3140 - FIELD INSPECTIONS AND PROBLEM DIAGNOSIS Page 6 of 40 Standard Operating Procedure
Revision: R1D0 Effective date: 6/20/2008 This is an UNCONTROLLED DOCUMENT. \\Spucommon-svr\common\SSW\WS571\Secure\QMS\Docs\SOPs\Drafts\SOP_HYDR C3140_R0D9(DRAFT).doc
Figure 1 - All sensor plot
The all sensor plot above shows Qfinal in blue, Dfinal in black, Vfinal in red, rain in green, and the pipe
height as a dashed black line across the top. Note that during the storm (green) on January 2, depths
(black) increased while velocities (red) initially decreased and then increased. In the combined sewer
overflow chamber, flows were initially slowed by the weir wall (decreased in velocity and then sped up as
flows crested the weir wall and spilled to the receiving water). Scatter graphs
Stevens and Enfinger (2006) define scatter graphs as follows: “Scatter graphs are powerful tools that
display depth versus velocity data from sewer flow monitors. The resulting patterns form
characteristic signatures that provide insight into the hydraulic conditions within a sewer. The flow
monitor itself may also leave distinct patterns that allow people to evaluate the performance of the
monitor.” A growing body of educational information on scatter graphs and their hydraulic signatures
is available on the Internet at www.adsenv.com/scattergraph.
Understanding scatter graphs and their hydraulic signatures is the essence of interpreting complex
hydraulics that often occur near CSOs. In addition, scatter graphs provide insight into monitor and
sensor problems such as depth-sensor and velocity-sensor drift that other techniques often miss.
Section J, at the end of this document, contains a step-by-step guide for understanding and
interpreting scatter graphs, including the following example scatter graph signatures:
• Manning Equation
• Design Method
• Lanfear-Coll Method
• Stevens-Schutzbach
Method
• Constant vs. Varying
Roughness Coefficient
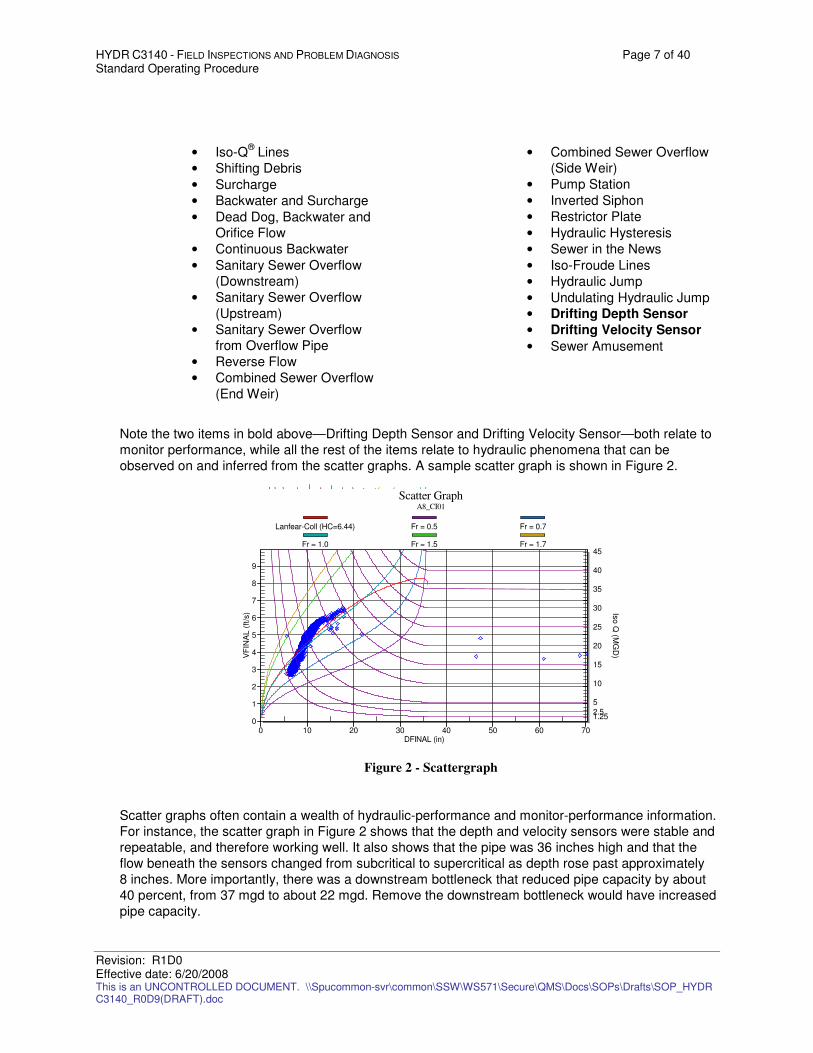
HYDR C3140 - FIELD INSPECTIONS AND PROBLEM DIAGNOSIS Page 7 of 40 Standard Operating Procedure
Revision: R1D0 Effective date: 6/20/2008 This is an UNCONTROLLED DOCUMENT. \\Spucommon-svr\common\SSW\WS571\Secure\QMS\Docs\SOPs\Drafts\SOP_HYDR C3140_R0D9(DRAFT).doc
• Iso-Q® Lines
• Shifting Debris
• Surcharge
• Backwater and Surcharge
• Dead Dog, Backwater and
Orifice Flow
• Continuous Backwater
• Sanitary Sewer Overflow
(Downstream)
• Sanitary Sewer Overflow
(Upstream)
• Sanitary Sewer Overflow
from Overflow Pipe
• Reverse Flow
• Combined Sewer Overflow
(End Weir)
• Combined Sewer Overflow
(Side Weir)
• Pump Station
• Inverted Siphon
• Restrictor Plate
• Hydraulic Hysteresis
• Sewer in the News
• Iso-Froude Lines
• Hydraulic Jump
• Undulating Hydraulic Jump
• Drifting Depth Sensor
• Drifting Velocity Sensor
• Sewer Amusement
Note the two items in bold above—Drifting Depth Sensor and Drifting Velocity Sensor—both relate to
monitor performance, while all the rest of the items relate to hydraulic phenomena that can be
observed on and inferred from the scatter graphs. A sample scatter graph is shown in Figure 2.
Figure 2 - Scattergraph
Scatter graphs often contain a wealth of hydraulic-performance and monitor-performance information.
For instance, the scatter graph in Figure 2 shows that the depth and velocity sensors were stable and
repeatable, and therefore working well. It also shows that the pipe was 36 inches high and that the
flow beneath the sensors changed from subcritical to supercritical as depth rose past approximately
8 inches. More importantly, there was a downstream bottleneck that reduced pipe capacity by about
40 percent, from 37 mgd to about 22 mgd. Remove the downstream bottleneck would have increased
pipe capacity.
0
1
2
3
4
5
6
7
8
9
0 10 20 30 40 50 60 70
1.252.5
5
10
15
20
25
30
35
40
45
Scatter GraphA8_CI01
VF
INA
L (
ft/s
) Iso
Q (M
GD
)
DFINAL (in)
Lanfear-Coll (HC=6.44) Fr = 0.5 Fr = 0.7
Fr = 1.0 Fr = 1.5 Fr = 1.7
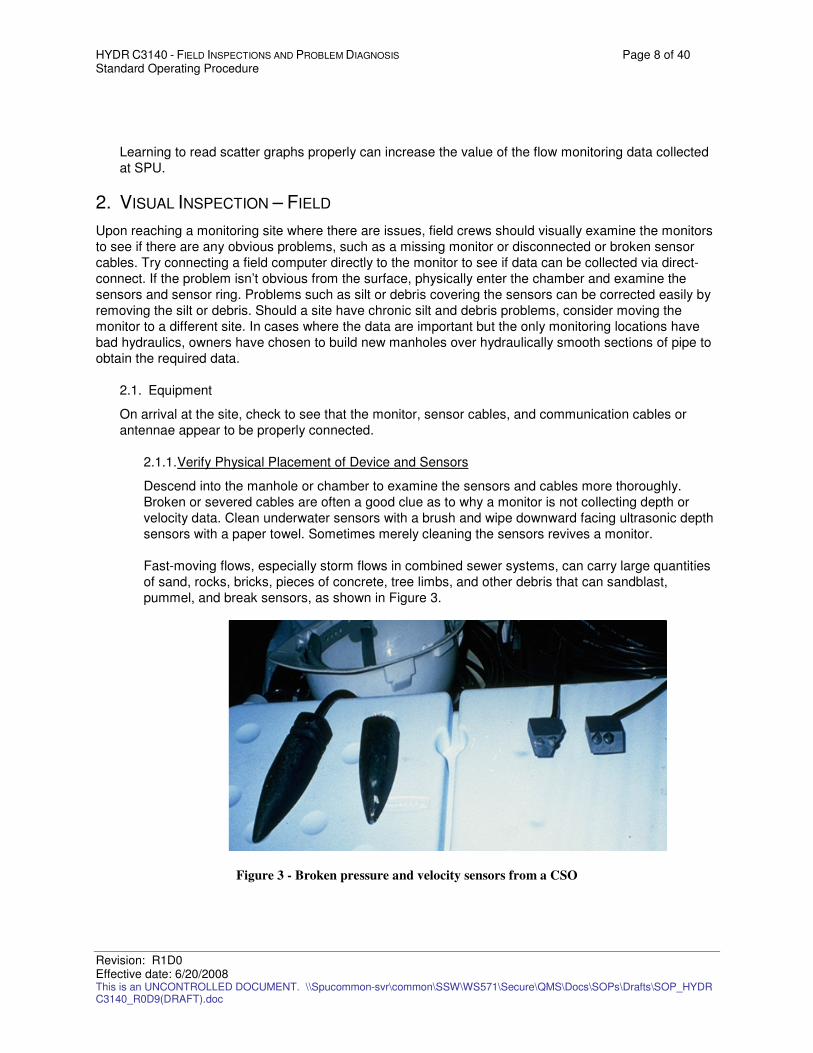
HYDR C3140 - FIELD INSPECTIONS AND PROBLEM DIAGNOSIS Page 8 of 40 Standard Operating Procedure
Revision: R1D0 Effective date: 6/20/2008 This is an UNCONTROLLED DOCUMENT. \\Spucommon-svr\common\SSW\WS571\Secure\QMS\Docs\SOPs\Drafts\SOP_HYDR C3140_R0D9(DRAFT).doc
Learning to read scatter graphs properly can increase the value of the flow monitoring data collected
at SPU.
2. VISUAL INSPECTION – FIELD
Upon reaching a monitoring site where there are issues, field crews should visually examine the monitors
to see if there are any obvious problems, such as a missing monitor or disconnected or broken sensor
cables. Try connecting a field computer directly to the monitor to see if data can be collected via direct-
connect. If the problem isn’t obvious from the surface, physically enter the chamber and examine the
sensors and sensor ring. Problems such as silt or debris covering the sensors can be corrected easily by
removing the silt or debris. Should a site have chronic silt and debris problems, consider moving the
monitor to a different site. In cases where the data are important but the only monitoring locations have
bad hydraulics, owners have chosen to build new manholes over hydraulically smooth sections of pipe to
obtain the required data.
2.1. Equipment
On arrival at the site, check to see that the monitor, sensor cables, and communication cables or
antennae appear to be properly connected.
2.1.1. Verify Physical Placement of Device and Sensors
Descend into the manhole or chamber to examine the sensors and cables more thoroughly.
Broken or severed cables are often a good clue as to why a monitor is not collecting depth or
velocity data. Clean underwater sensors with a brush and wipe downward facing ultrasonic depth
sensors with a paper towel. Sometimes merely cleaning the sensors revives a monitor.
Fast-moving flows, especially storm flows in combined sewer systems, can carry large quantities
of sand, rocks, bricks, pieces of concrete, tree limbs, and other debris that can sandblast,
pummel, and break sensors, as shown in Figure 3.
Figure 3 - Broken pressure and velocity sensors from a CSO
HYDR C3140 - FIELD INSPECTIONS AND PROBLEM DIAGNOSIS Page 9 of 40 Standard Operating Procedure
Revision: R1D0 Effective date: 6/20/2008 This is an UNCONTROLLED DOCUMENT. \\Spucommon-svr\common\SSW\WS571\Secure\QMS\Docs\SOPs\Drafts\SOP_HYDR C3140_R0D9(DRAFT).doc
2.1.2. Silt and Debris Build-up
Check the channel around the sensors for any signs of silt or debris build-up. Silt and debris
move through all sewer systems, with the greatest amount of movement occurring during storm
events. Scatter graphs often show evidence of downstream debris build-up, as shown in the
scatter graph entitled Dead Dog, Backwater, and Orifice Flow, in Section J. Clean any debris
found out of the channel.
2.1.3. Corrosion
Although some sensors have lasted for more than a decade, the harsh, corrosive environment of
sewers usually eats its way through protective sensor and cable coatings in less time than that.
Nevertheless, a good maintenance program combined with good monitors should be able to
provide at least 90 percent uptime with good data. Excellent maintenance programs provide
better than 95 percent good data availability.
Corrosion of the sewer conveyance facilities (e.g., manhole, pipes, structures) is more serious
than monitor and sensor corrosion and can eventually lead to sewer collapse. Look for soft brick,
soft concrete or exposed rebar in any site that you visit, as these are signs of corrosion and early
failure. Be sure to report to maintenance management any serious corrosion that you see or feel
in manholes, chambers, or sewers.
In addition to corroded sewer structures, many manholes have corroded or missing steps, or
corroded frames and lids.
2.2. Verify Physical Condition of Structure
Aside from corrosion, some structures are cracked, broken, or missing important pieces such as
manhole covers or steps. Report any physical or structural defects, or any significant sources of
infiltration, to your supervisor.
2.3. Hydraulic Conditions
See HYDR C3110, Section 1.3, for a discussion of the hydraulic conditions that are most and least
conducive to good flow monitoring. The section covers surface conditions, invert conditions, manhole
trough conditions, and surcharging conditions.
2.3.1. Changes in Hydraulic Conditions
Hydraulic conditions in sewers change frequently—more frequently than many people expect.
Those changes show up on scatter graphs. While plans and profile drawings show how sewers
were built, they don’t show what is being transported through the sewer inverts. Construction
debris, rocks, boards, bricks, and other objects move downstream, most prevalently during wet
weather. Pieces of debris that lodge temporarily in the sewer downstream of flow monitoring
locations create temporary, partial blockages that appear on scatter graphs from time to time.
See the scatter graph Shifting Debris in Section J for a graphic example of how scatter graphs
can display changes in hydraulic conditions.
HYDR C3140 - FIELD INSPECTIONS AND PROBLEM DIAGNOSIS Page 10 of 40 Standard Operating Procedure
Revision: R1D0 Effective date: 6/20/2008 This is an UNCONTROLLED DOCUMENT. \\Spucommon-svr\common\SSW\WS571\Secure\QMS\Docs\SOPs\Drafts\SOP_HYDR C3140_R0D9(DRAFT).doc
3. ELECTRICAL INSPECTION AND TESTING
3.1. Power Supply
If a problematic monitor checks out externally, the first thing to check inside the device is its power
supply. Each type of monitor has its own power supply or batteries, so check to see that the batteries
have sufficient voltage or that the AC power supply is live. Refer to the ADS FlowShark Manual or the Isco 2150 Manual for the correct reference voltages. If sufficient power is not available, collect the
data in the monitor before changing the batteries or, in the case of AC-powered monitors, check
the power supply back to a point where power exists and replace the intervening wire.
3.2. Communications Interface
Once power has been eliminated as a problem, check communication channels. Data can be
collected from either type of monitor in several ways, including direct connection through a serial port,
remote connection via phone lines, or remote connection via radio.
3.2.1. Antenna and Cable Connections
Check the antenna or phone cable connections for integrity. The phone cable should have a
background voltage of 2.5 volts. Should the background voltage be too low, contact the phone
company and inform them of the problem and request repair.
3.2.2. Serial Cable Connections
If the antenna or phone cable connections check out properly and the monitor still will not answer,
try a direct communication connection. Connect a serial cable from a field computer to the serial
connection on the monitor (see either the ADS FlowShark Manual or the Isco 2150 Manual for
more detail). If the monitor will not answer, then you will need to swap it for another unit and send
the faulty unit back to the manufacturer for service. Should the monitor answer via serial cable,
the problem can be better diagnosed.
3.2.3. Collect and Save Data
Once connected to the monitor, try to download all of the monitor’s data immediately, which might
prevent any loss of data. If you cannot download data and if the monitor is battery powered, then
leave the monitor powered up and bring it back to the shop for repair after replacing it with new
unit at the site.
Collect and look at the data. Plot the depth, velocity, and flow data on the field computer to make
sure that all the sensors are working. See Figure 1 for an example of an all sensor plot. Should
any of the data be missing, a sensor might be broken, indicating the time to replace a sensor or
two.
3.2.4. Swapping Sensors
3.2.4.1 Ultrasonic Depth Sensors
The quad redundant depth sensor is the most stable, most repeatable sensor available among sewer flow monitors in 2007. The sensor contains four transceivers and usually fails one transmitter or one receiver at a time. With 12 possible active sensor pairs, this sensor can lose six pairs and still collect good data. However, when it deteriorates to the point where only half the sensor pairs are functioning, it is time to replace it. Refer to the ADS FlowShark Manual for more detail on replacing it.
HYDR C3140 - FIELD INSPECTIONS AND PROBLEM DIAGNOSIS Page 11 of 40 Standard Operating Procedure
Revision: R1D0 Effective date: 6/20/2008 This is an UNCONTROLLED DOCUMENT. \\Spucommon-svr\common\SSW\WS571\Secure\QMS\Docs\SOPs\Drafts\SOP_HYDR C3140_R0D9(DRAFT).doc
3.2.4.2 Pressure Depth Sensors
Pressure depth sensor data can be plotted separately from ultrasonic depth sensor data for inspection purposes. Like all sensors, pressure sensors deteriorate with time. When pressure sensors start to drift, you need to either adjust the depth offsets weekly or replace the sensor. ADS pressure sensors are separate from the velocity sensor, while the Isco pressure sensors are combined with the Isco velocity sensor in a single housing. Refer to the ADS FlowShark Manual or the Isco 2150 Manual for more detailed information about changing pressure sensors in the field.
3.2.4.3 Velocity Sensors
Although the ADS and Isco velocity sensors use continuous-wave Doppler technology, they process the reflected sounds differently. The details of how they process the reflected noise are protected industrial secrets. Velocity sensors eventually wear out or break and need to be replaced. Refer to the respective manuals for details about how to replace velocity sensors.
3.3. Evaluate Depth and Velocity Data
The best way to evaluate monitor and sensor performance is through scatter graphs.
F. Documentation
Monitors should receive maintenance as soon as possible after problems or questionable data are
discovered. Data should be retrieved on a weekly basis and reviewed for reasonableness to confirm that
each instrument and each sensor is operating properly. Level 1 data validation should be performed
weekly. At a minimum, validation should be done weekly for the first month after the instrument is
installed so that any potential problems can be identified and quickly resolved to avoid significant data
losses.
It is important to maintain detailed, accurate records of changes to the hardware or firmware and to
record all changes and updates. Proper maintenance records will save time and effort if questions arise
about specific sites at a later date. Reports should include the following information:
• Who ordered or specified the field work
• Who performed the field work, type of work performed, and when the work was completed
• Any adjustments or modifications needed, with justifications or reasons for the modifications
• Identification of lingering problems at the site, if any, when the field crew left
G. References
Stevens, P., and Enfinger, K. “Scattergraph Principles and Practice.” ADS Environmental Services. 2006.
Available through http://www.adsenv.com/default.aspx?id=73.
ISO-748: 1997(E), “Measurement of Liquid Flow in Open Channels – Velocity-area Methods,” Third
Edition. 1997-08-01. International Standards Organization. Geneva, Switzerland.
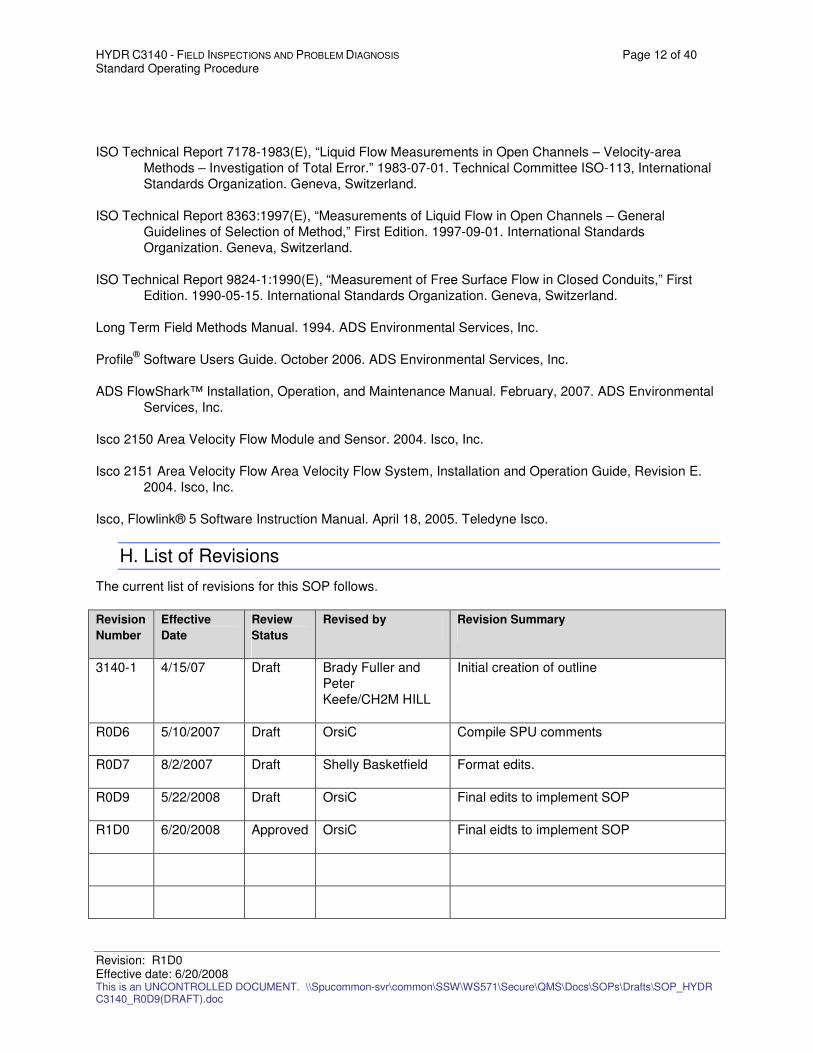
HYDR C3140 - FIELD INSPECTIONS AND PROBLEM DIAGNOSIS Page 12 of 40 Standard Operating Procedure
Revision: R1D0 Effective date: 6/20/2008 This is an UNCONTROLLED DOCUMENT. \\Spucommon-svr\common\SSW\WS571\Secure\QMS\Docs\SOPs\Drafts\SOP_HYDR C3140_R0D9(DRAFT).doc
ISO Technical Report 7178-1983(E), “Liquid Flow Measurements in Open Channels – Velocity-area
Methods – Investigation of Total Error.” 1983-07-01. Technical Committee ISO-113, International
Standards Organization. Geneva, Switzerland.
ISO Technical Report 8363:1997(E), “Measurements of Liquid Flow in Open Channels – General
Guidelines of Selection of Method,” First Edition. 1997-09-01. International Standards
Organization. Geneva, Switzerland.
ISO Technical Report 9824-1:1990(E), “Measurement of Free Surface Flow in Closed Conduits,” First
Edition. 1990-05-15. International Standards Organization. Geneva, Switzerland.
Long Term Field Methods Manual. 1994. ADS Environmental Services, Inc.
Profile® Software Users Guide. October 2006. ADS Environmental Services, Inc.
ADS FlowShark™ Installation, Operation, and Maintenance Manual. February, 2007. ADS Environmental
Services, Inc.
Isco 2150 Area Velocity Flow Module and Sensor. 2004. Isco, Inc.
Isco 2151 Area Velocity Flow Area Velocity Flow System, Installation and Operation Guide, Revision E.
2004. Isco, Inc.
Isco, Flowlink® 5 Software Instruction Manual. April 18, 2005. Teledyne Isco.
H. List of Revisions
The current list of revisions for this SOP follows.
Revision
Number
Effective
Date
Review
Status
Revised by Revision Summary
3140-1 4/15/07 Draft Brady Fuller and
Peter
Keefe/CH2M HILL
Initial creation of outline
R0D6 5/10/2007 Draft OrsiC Compile SPU comments
R0D7 8/2/2007 Draft Shelly Basketfield Format edits.
R0D9 5/22/2008 Draft OrsiC Final edits to implement SOP
R1D0 6/20/2008 Approved OrsiC Final eidts to implement SOP
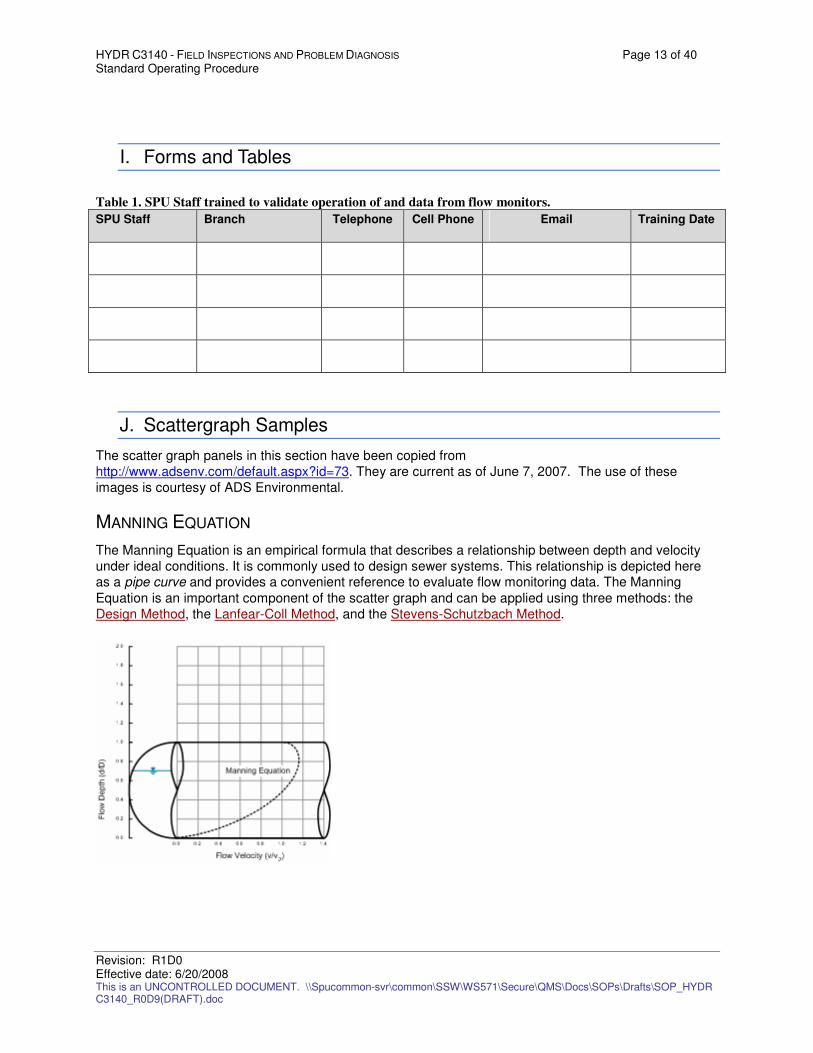
HYDR C3140 - FIELD INSPECTIONS AND PROBLEM DIAGNOSIS Page 13 of 40 Standard Operating Procedure
Revision: R1D0 Effective date: 6/20/2008 This is an UNCONTROLLED DOCUMENT. \\Spucommon-svr\common\SSW\WS571\Secure\QMS\Docs\SOPs\Drafts\SOP_HYDR C3140_R0D9(DRAFT).doc
I. Forms and Tables
Table 1. SPU Staff trained to validate operation of and data from flow monitors.
SPU Staff Branch Telephone Cell Phone Email Training Date
J. Scattergraph Samples
The scatter graph panels in this section have been copied from
http://www.adsenv.com/default.aspx?id=73. They are current as of June 7, 2007. The use of these
images is courtesy of ADS Environmental.
MANNING EQUATION
The Manning Equation is an empirical formula that describes a relationship between depth and velocity
under ideal conditions. It is commonly used to design sewer systems. This relationship is depicted here as a pipe curve and provides a convenient reference to evaluate flow monitoring data. The Manning
Equation is an important component of the scatter graph and can be applied using three methods: the
Design Method, the Lanfear-Coll Method, and the Stevens-Schutzbach Method.
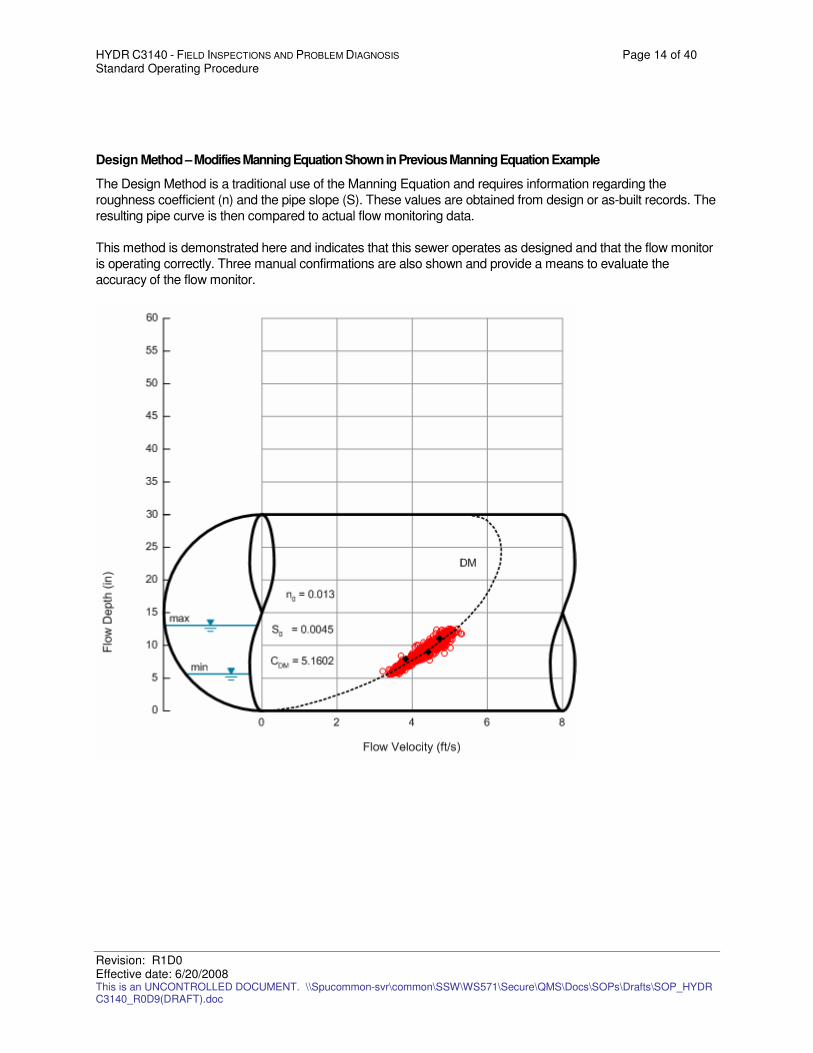
HYDR C3140 - FIELD INSPECTIONS AND PROBLEM DIAGNOSIS Page 14 of 40 Standard Operating Procedure
Revision: R1D0 Effective date: 6/20/2008 This is an UNCONTROLLED DOCUMENT. \\Spucommon-svr\common\SSW\WS571\Secure\QMS\Docs\SOPs\Drafts\SOP_HYDR C3140_R0D9(DRAFT).doc
Design Method – Modifies Manning Equation Shown in Previous Manning Equation Example
The Design Method is a traditional use of the Manning Equation and requires information regarding the
roughness coefficient (n) and the pipe slope (S). These values are obtained from design or as-built records. The
resulting pipe curve is then compared to actual flow monitoring data.
This method is demonstrated here and indicates that this sewer operates as designed and that the flow monitor
is operating correctly. Three manual confirmations are also shown and provide a means to evaluate the
accuracy of the flow monitor.
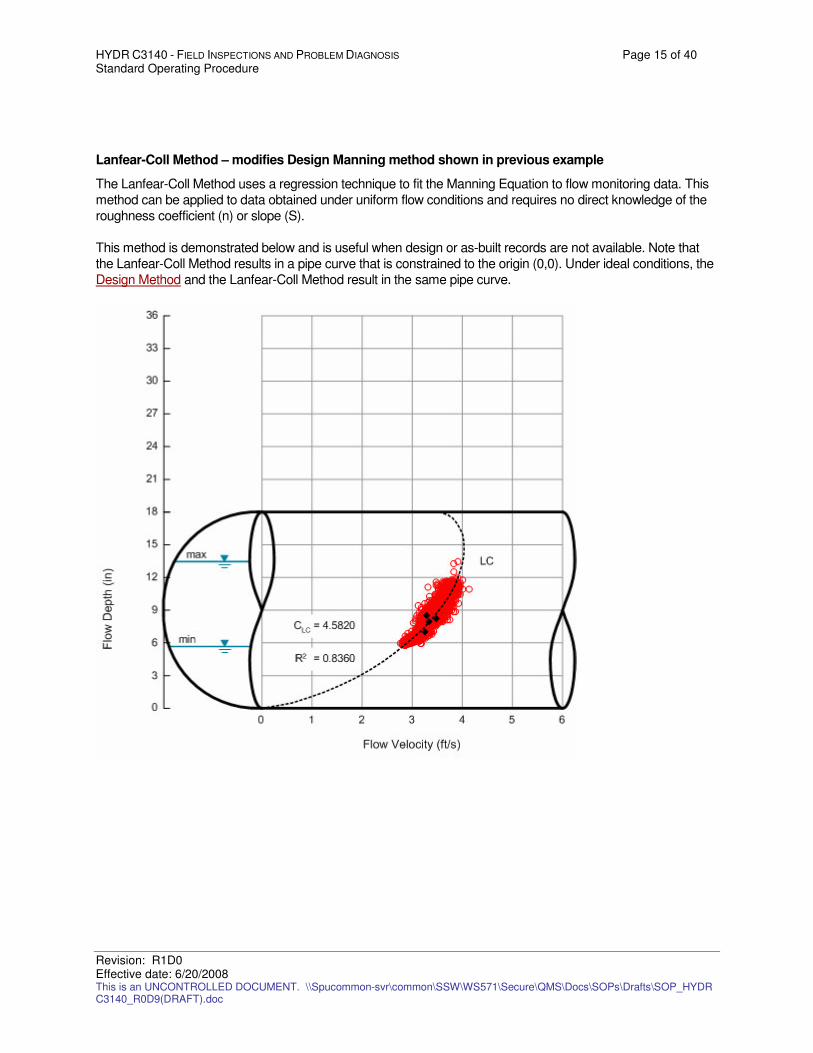
HYDR C3140 - FIELD INSPECTIONS AND PROBLEM DIAGNOSIS Page 15 of 40 Standard Operating Procedure
Revision: R1D0 Effective date: 6/20/2008 This is an UNCONTROLLED DOCUMENT. \\Spucommon-svr\common\SSW\WS571\Secure\QMS\Docs\SOPs\Drafts\SOP_HYDR C3140_R0D9(DRAFT).doc
Lanfear-Coll Method – modifies Design Manning method shown in previous example
The Lanfear-Coll Method uses a regression technique to fit the Manning Equation to flow monitoring data. This
method can be applied to data obtained under uniform flow conditions and requires no direct knowledge of the
roughness coefficient (n) or slope (S).
This method is demonstrated below and is useful when design or as-built records are not available. Note that
the Lanfear-Coll Method results in a pipe curve that is constrained to the origin (0,0). Under ideal conditions, the
Design Method and the Lanfear-Coll Method result in the same pipe curve.
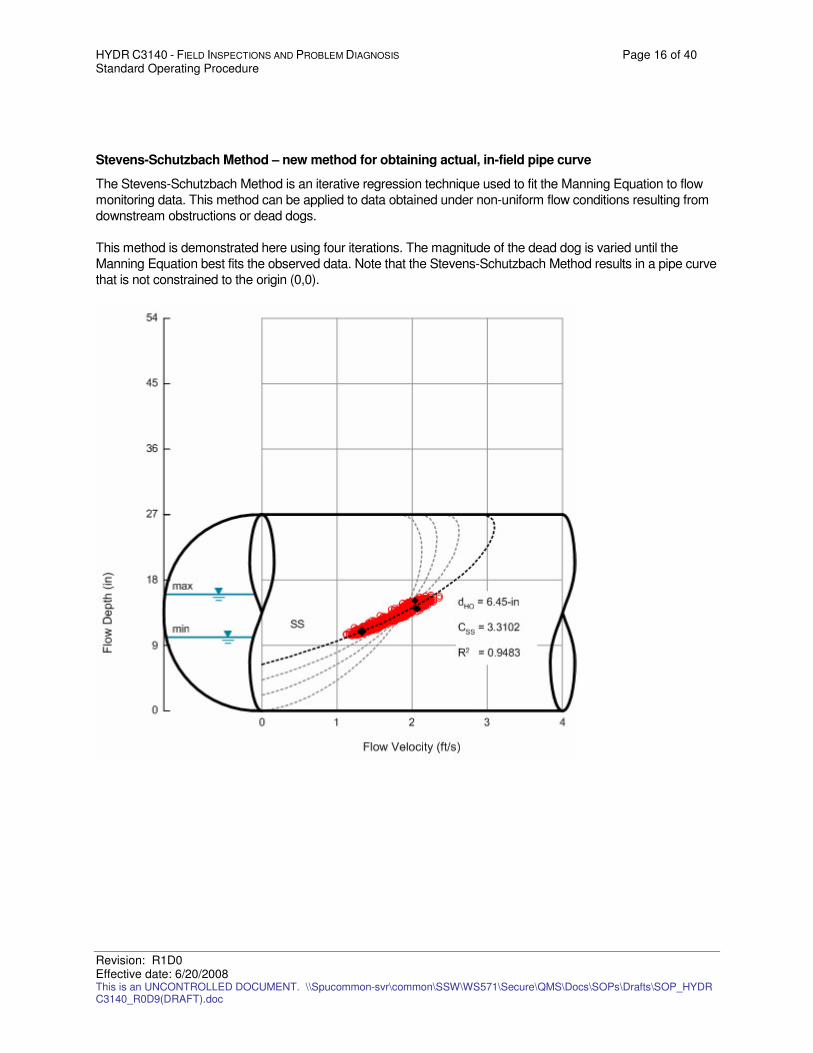
HYDR C3140 - FIELD INSPECTIONS AND PROBLEM DIAGNOSIS Page 16 of 40 Standard Operating Procedure
Revision: R1D0 Effective date: 6/20/2008 This is an UNCONTROLLED DOCUMENT. \\Spucommon-svr\common\SSW\WS571\Secure\QMS\Docs\SOPs\Drafts\SOP_HYDR C3140_R0D9(DRAFT).doc
Stevens-Schutzbach Method – new method for obtaining actual, in-field pipe curve
The Stevens-Schutzbach Method is an iterative regression technique used to fit the Manning Equation to flow
monitoring data. This method can be applied to data obtained under non-uniform flow conditions resulting from
downstream obstructions or dead dogs.
This method is demonstrated here using four iterations. The magnitude of the dead dog is varied until the
Manning Equation best fits the observed data. Note that the Stevens-Schutzbach Method results in a pipe curve
that is not constrained to the origin (0,0).
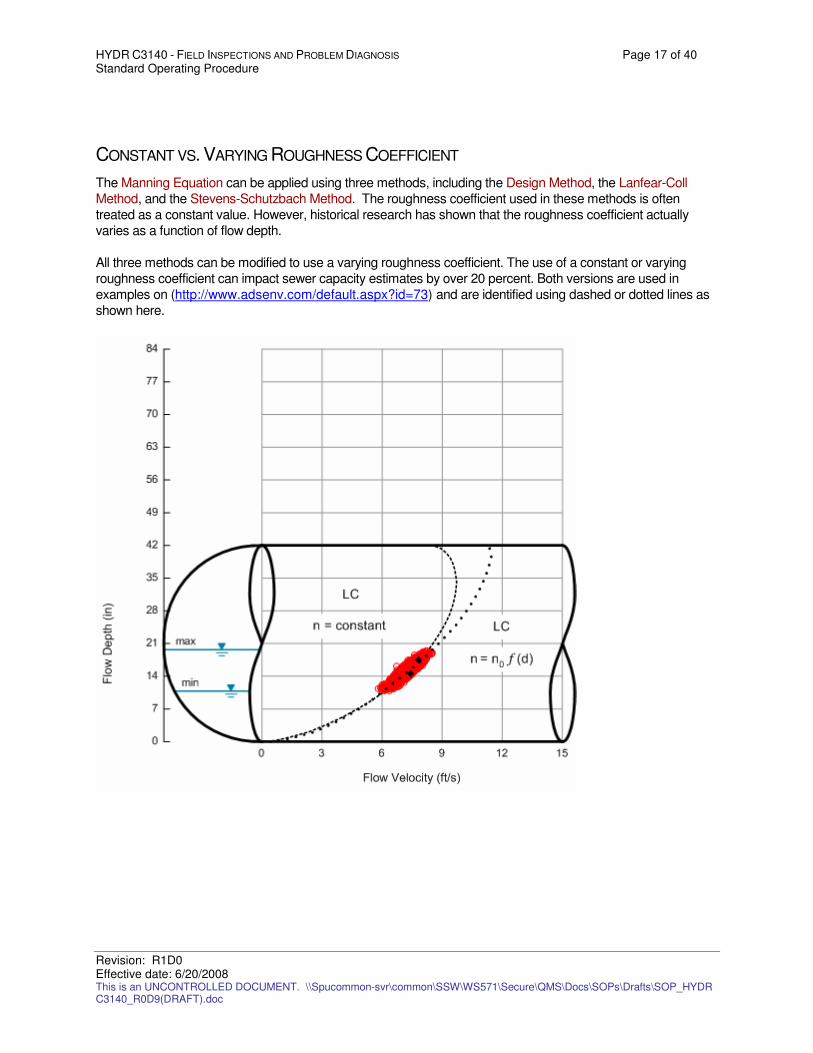
HYDR C3140 - FIELD INSPECTIONS AND PROBLEM DIAGNOSIS Page 17 of 40 Standard Operating Procedure
Revision: R1D0 Effective date: 6/20/2008 This is an UNCONTROLLED DOCUMENT. \\Spucommon-svr\common\SSW\WS571\Secure\QMS\Docs\SOPs\Drafts\SOP_HYDR C3140_R0D9(DRAFT).doc
CONSTANT VS. VARYING ROUGHNESS COEFFICIENT
The Manning Equation can be applied using three methods, including the Design Method, the Lanfear-Coll
Method, and the Stevens-Schutzbach Method. The roughness coefficient used in these methods is often
treated as a constant value. However, historical research has shown that the roughness coefficient actually
varies as a function of flow depth.
All three methods can be modified to use a varying roughness coefficient. The use of a constant or varying
roughness coefficient can impact sewer capacity estimates by over 20 percent. Both versions are used in
examples on (http://www.adsenv.com/default.aspx?id=73) and are identified using dashed or dotted lines as
shown here.
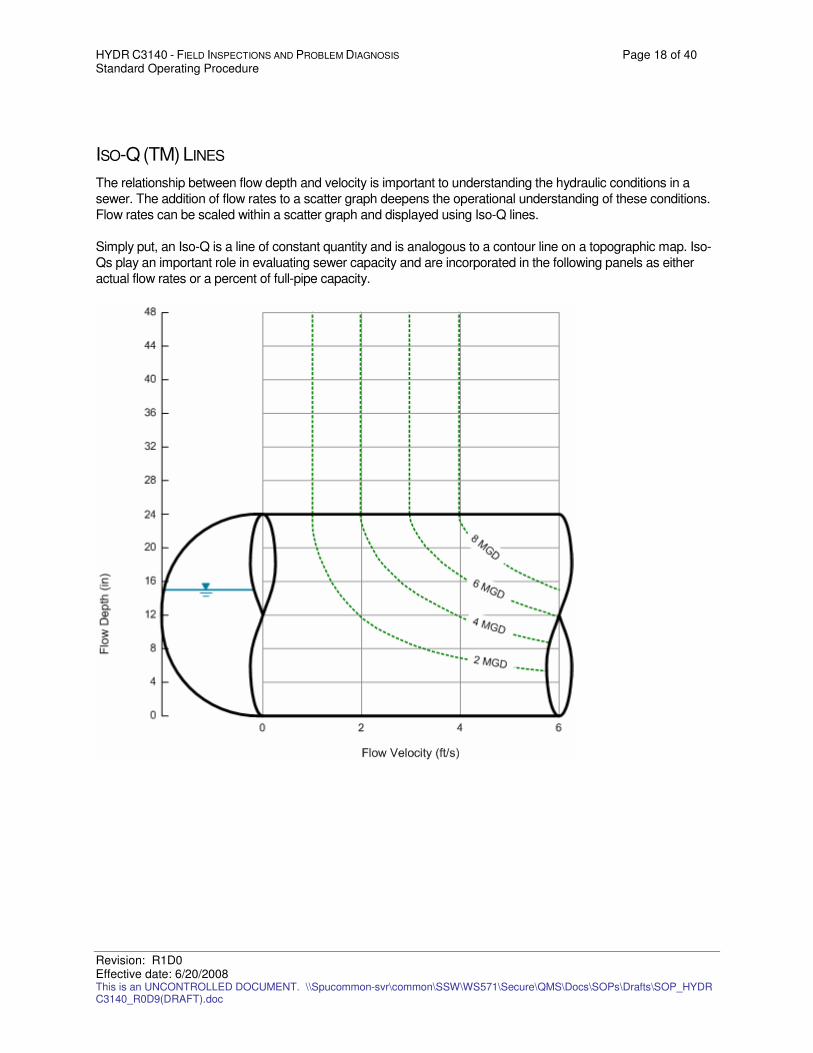
HYDR C3140 - FIELD INSPECTIONS AND PROBLEM DIAGNOSIS Page 18 of 40 Standard Operating Procedure
Revision: R1D0 Effective date: 6/20/2008 This is an UNCONTROLLED DOCUMENT. \\Spucommon-svr\common\SSW\WS571\Secure\QMS\Docs\SOPs\Drafts\SOP_HYDR C3140_R0D9(DRAFT).doc
ISO-Q (TM) LINES
The relationship between flow depth and velocity is important to understanding the hydraulic conditions in a
sewer. The addition of flow rates to a scatter graph deepens the operational understanding of these conditions.
Flow rates can be scaled within a scatter graph and displayed using Iso-Q lines.
Simply put, an Iso-Q is a line of constant quantity and is analogous to a contour line on a topographic map. Iso-
Qs play an important role in evaluating sewer capacity and are incorporated in the following panels as either
actual flow rates or a percent of full-pipe capacity.
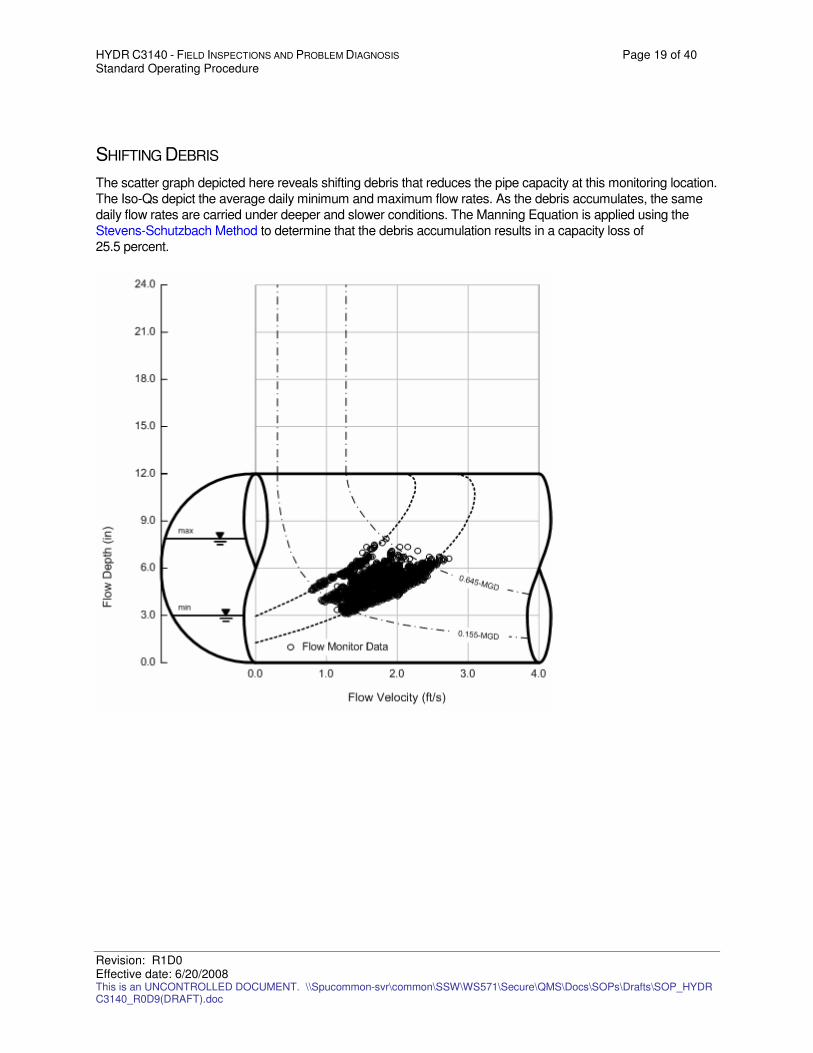
HYDR C3140 - FIELD INSPECTIONS AND PROBLEM DIAGNOSIS Page 19 of 40 Standard Operating Procedure
Revision: R1D0 Effective date: 6/20/2008 This is an UNCONTROLLED DOCUMENT. \\Spucommon-svr\common\SSW\WS571\Secure\QMS\Docs\SOPs\Drafts\SOP_HYDR C3140_R0D9(DRAFT).doc
SHIFTING DEBRIS
The scatter graph depicted here reveals shifting debris that reduces the pipe capacity at this monitoring location.
The Iso-Qs depict the average daily minimum and maximum flow rates. As the debris accumulates, the same
daily flow rates are carried under deeper and slower conditions. The Manning Equation is applied using the
Stevens-Schutzbach Method to determine that the debris accumulation results in a capacity loss of
25.5 percent.
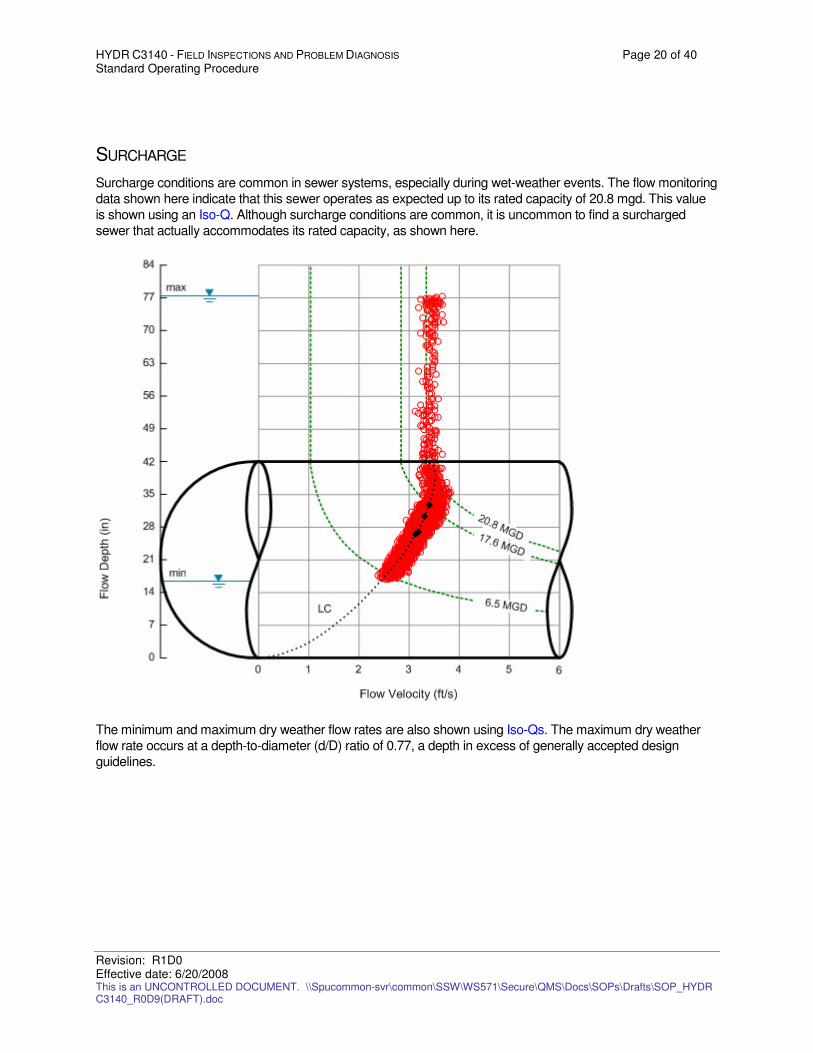
HYDR C3140 - FIELD INSPECTIONS AND PROBLEM DIAGNOSIS Page 20 of 40 Standard Operating Procedure
Revision: R1D0 Effective date: 6/20/2008 This is an UNCONTROLLED DOCUMENT. \\Spucommon-svr\common\SSW\WS571\Secure\QMS\Docs\SOPs\Drafts\SOP_HYDR C3140_R0D9(DRAFT).doc
SURCHARGE
Surcharge conditions are common in sewer systems, especially during wet-weather events. The flow monitoring
data shown here indicate that this sewer operates as expected up to its rated capacity of 20.8 mgd. This value
is shown using an Iso-Q. Although surcharge conditions are common, it is uncommon to find a surcharged
sewer that actually accommodates its rated capacity, as shown here.
The minimum and maximum dry weather flow rates are also shown using Iso-Qs. The maximum dry weather
flow rate occurs at a depth-to-diameter (d/D) ratio of 0.77, a depth in excess of generally accepted design
guidelines.
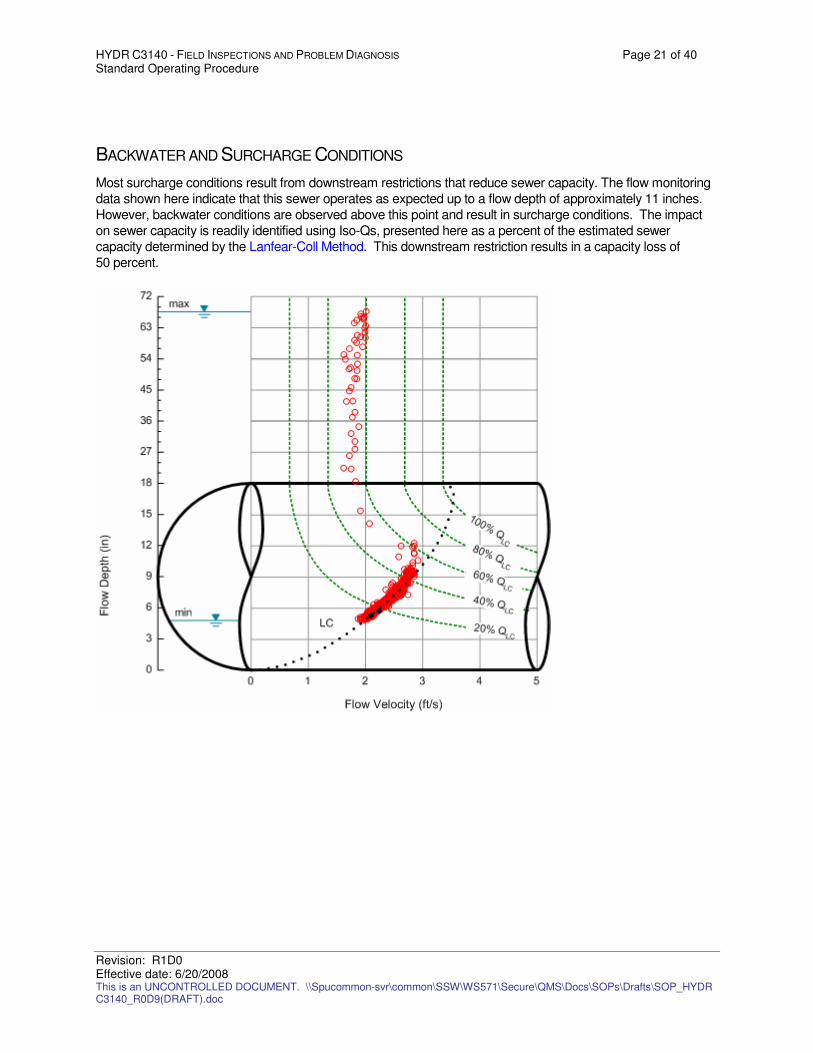
HYDR C3140 - FIELD INSPECTIONS AND PROBLEM DIAGNOSIS Page 21 of 40 Standard Operating Procedure
Revision: R1D0 Effective date: 6/20/2008 This is an UNCONTROLLED DOCUMENT. \\Spucommon-svr\common\SSW\WS571\Secure\QMS\Docs\SOPs\Drafts\SOP_HYDR C3140_R0D9(DRAFT).doc
BACKWATER AND SURCHARGE CONDITIONS
Most surcharge conditions result from downstream restrictions that reduce sewer capacity. The flow monitoring
data shown here indicate that this sewer operates as expected up to a flow depth of approximately 11 inches.
However, backwater conditions are observed above this point and result in surcharge conditions. The impact
on sewer capacity is readily identified using Iso-Qs, presented here as a percent of the estimated sewer
capacity determined by the Lanfear-Coll Method. This downstream restriction results in a capacity loss of
50 percent.
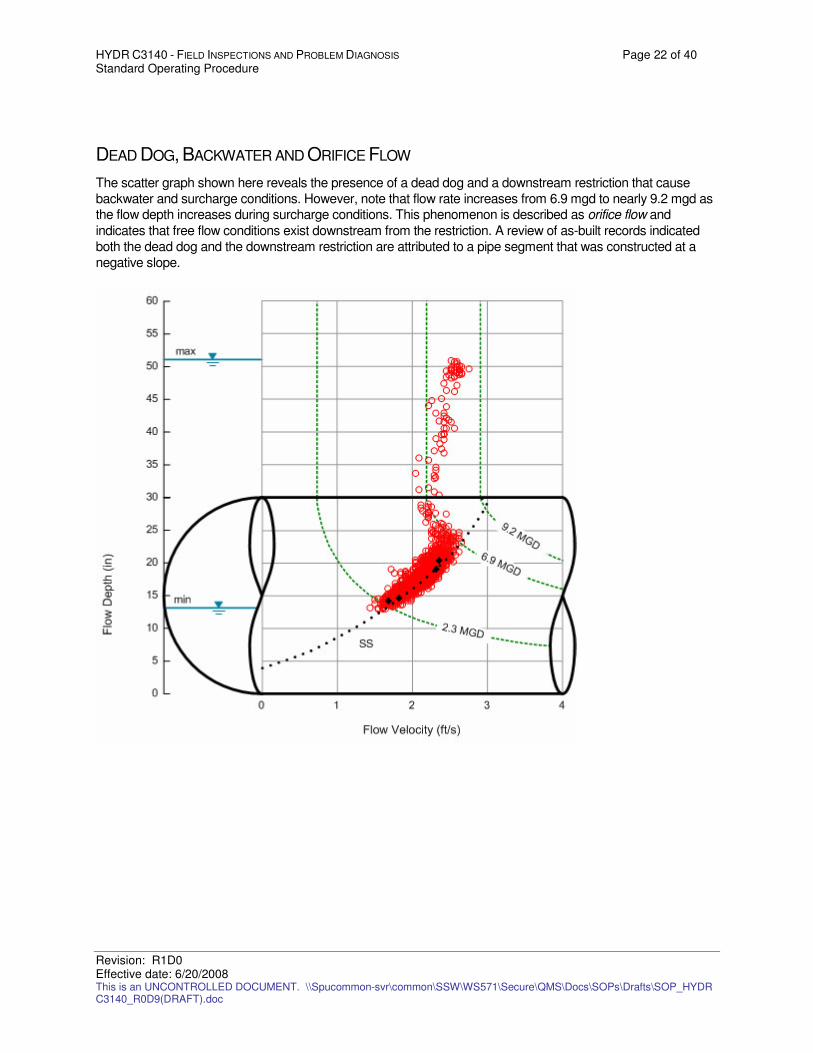
HYDR C3140 - FIELD INSPECTIONS AND PROBLEM DIAGNOSIS Page 22 of 40 Standard Operating Procedure
Revision: R1D0 Effective date: 6/20/2008 This is an UNCONTROLLED DOCUMENT. \\Spucommon-svr\common\SSW\WS571\Secure\QMS\Docs\SOPs\Drafts\SOP_HYDR C3140_R0D9(DRAFT).doc
DEAD DOG, BACKWATER AND ORIFICE FLOW
The scatter graph shown here reveals the presence of a dead dog and a downstream restriction that cause
backwater and surcharge conditions. However, note that flow rate increases from 6.9 mgd to nearly 9.2 mgd as the flow depth increases during surcharge conditions. This phenomenon is described as orifice flow and
indicates that free flow conditions exist downstream from the restriction. A review of as-built records indicated
both the dead dog and the downstream restriction are attributed to a pipe segment that was constructed at a
negative slope.
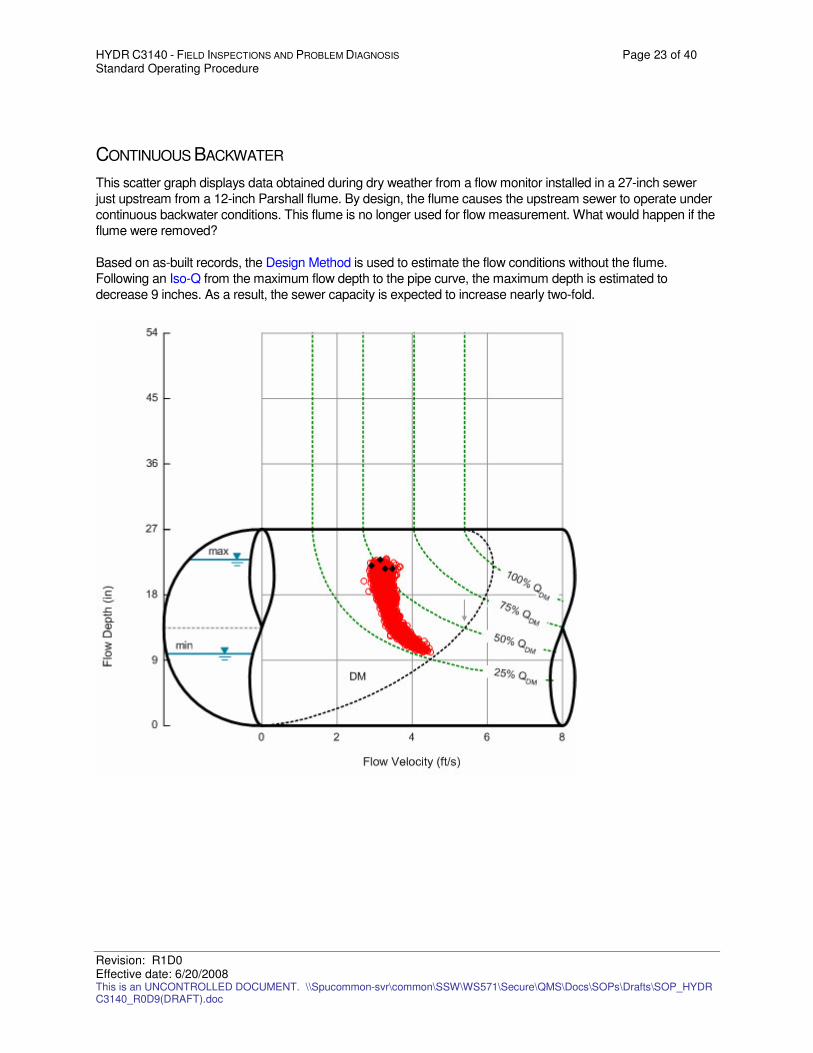
HYDR C3140 - FIELD INSPECTIONS AND PROBLEM DIAGNOSIS Page 23 of 40 Standard Operating Procedure
Revision: R1D0 Effective date: 6/20/2008 This is an UNCONTROLLED DOCUMENT. \\Spucommon-svr\common\SSW\WS571\Secure\QMS\Docs\SOPs\Drafts\SOP_HYDR C3140_R0D9(DRAFT).doc
CONTINUOUS BACKWATER
This scatter graph displays data obtained during dry weather from a flow monitor installed in a 27-inch sewer
just upstream from a 12-inch Parshall flume. By design, the flume causes the upstream sewer to operate under
continuous backwater conditions. This flume is no longer used for flow measurement. What would happen if the
flume were removed?
Based on as-built records, the Design Method is used to estimate the flow conditions without the flume.
Following an Iso-Q from the maximum flow depth to the pipe curve, the maximum depth is estimated to
decrease 9 inches. As a result, the sewer capacity is expected to increase nearly two-fold.
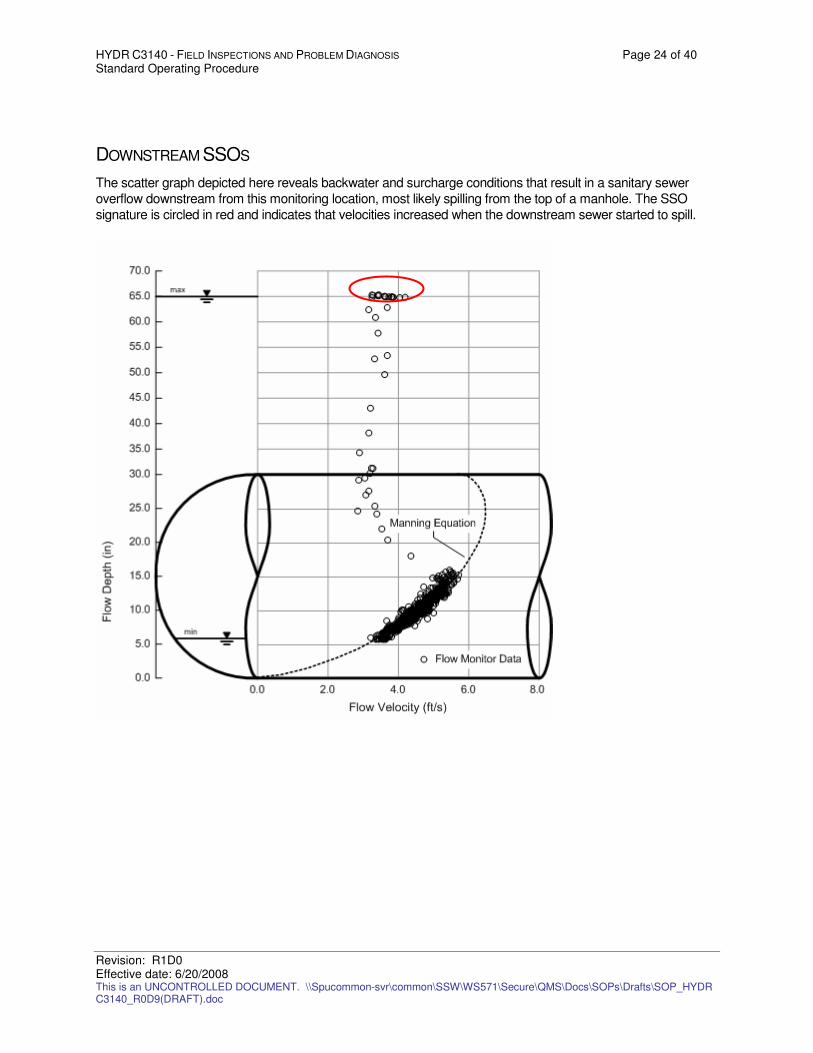
HYDR C3140 - FIELD INSPECTIONS AND PROBLEM DIAGNOSIS Page 24 of 40 Standard Operating Procedure
Revision: R1D0 Effective date: 6/20/2008 This is an UNCONTROLLED DOCUMENT. \\Spucommon-svr\common\SSW\WS571\Secure\QMS\Docs\SOPs\Drafts\SOP_HYDR C3140_R0D9(DRAFT).doc
DOWNSTREAM SSOS
The scatter graph depicted here reveals backwater and surcharge conditions that result in a sanitary sewer
overflow downstream from this monitoring location, most likely spilling from the top of a manhole. The SSO
signature is circled in red and indicates that velocities increased when the downstream sewer started to spill.
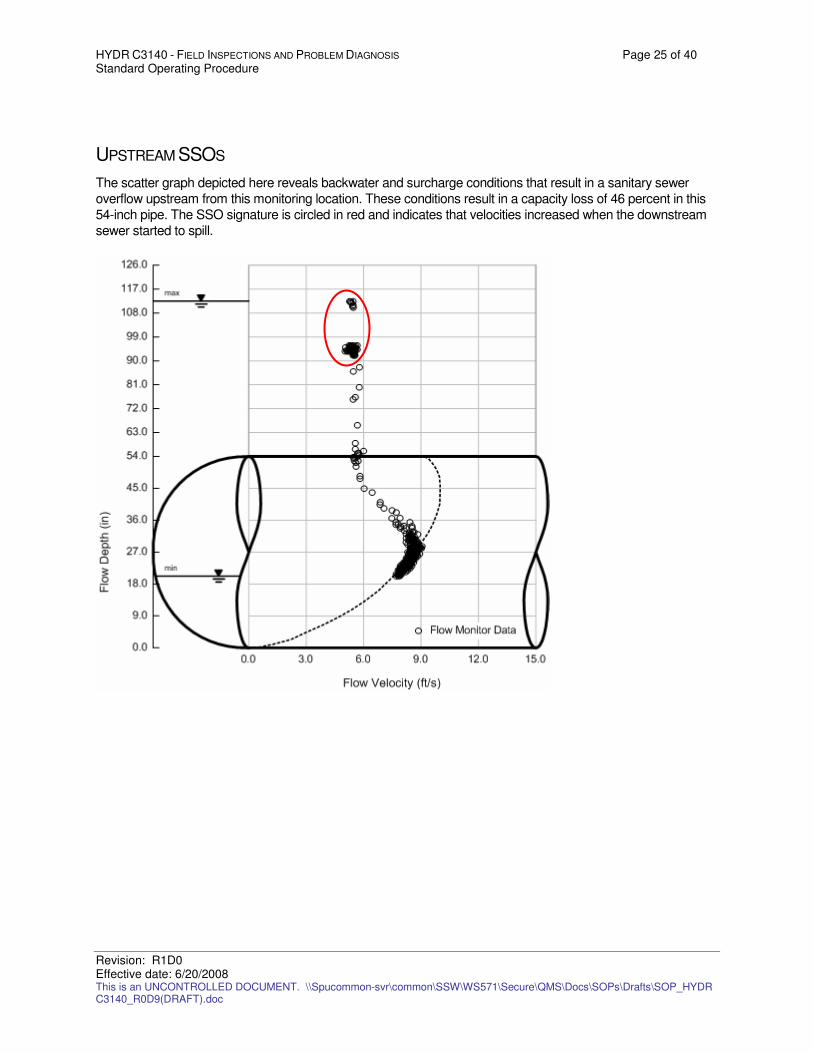
HYDR C3140 - FIELD INSPECTIONS AND PROBLEM DIAGNOSIS Page 25 of 40 Standard Operating Procedure
Revision: R1D0 Effective date: 6/20/2008 This is an UNCONTROLLED DOCUMENT. \\Spucommon-svr\common\SSW\WS571\Secure\QMS\Docs\SOPs\Drafts\SOP_HYDR C3140_R0D9(DRAFT).doc
UPSTREAM SSOS
The scatter graph depicted here reveals backwater and surcharge conditions that result in a sanitary sewer
overflow upstream from this monitoring location. These conditions result in a capacity loss of 46 percent in this
54-inch pipe. The SSO signature is circled in red and indicates that velocities increased when the downstream
sewer started to spill.
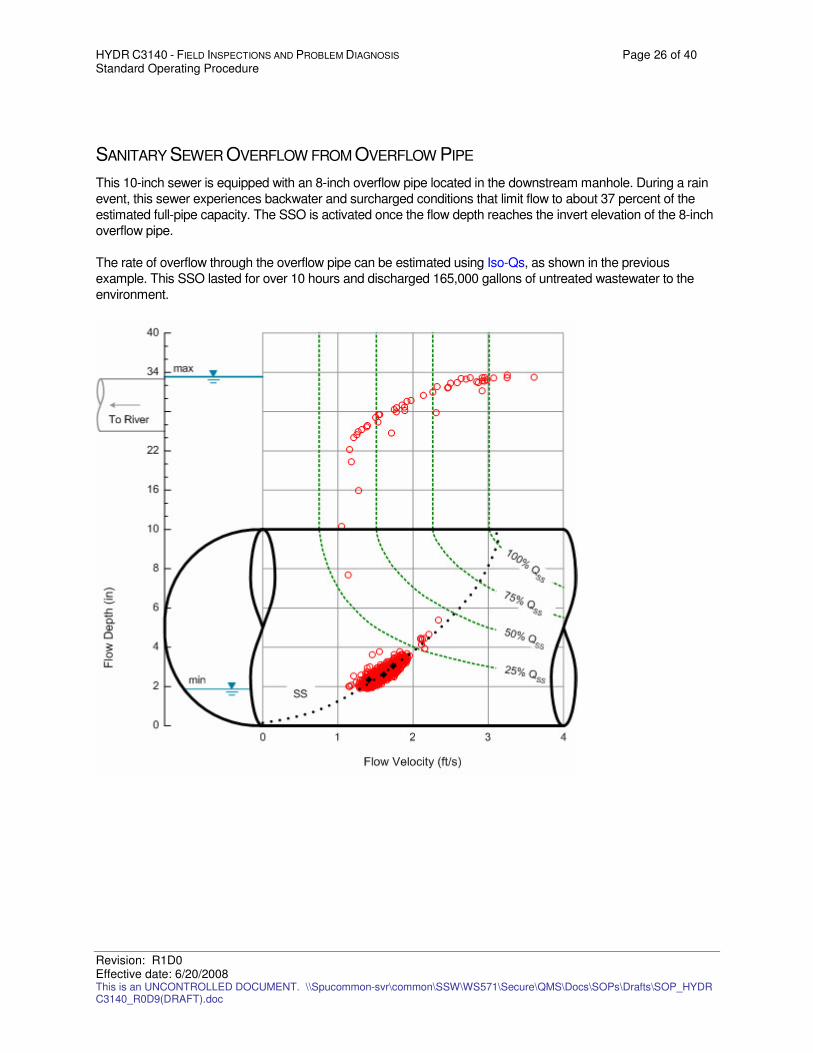
HYDR C3140 - FIELD INSPECTIONS AND PROBLEM DIAGNOSIS Page 26 of 40 Standard Operating Procedure
Revision: R1D0 Effective date: 6/20/2008 This is an UNCONTROLLED DOCUMENT. \\Spucommon-svr\common\SSW\WS571\Secure\QMS\Docs\SOPs\Drafts\SOP_HYDR C3140_R0D9(DRAFT).doc
SANITARY SEWER OVERFLOW FROM OVERFLOW PIPE
This 10-inch sewer is equipped with an 8-inch overflow pipe located in the downstream manhole. During a rain
event, this sewer experiences backwater and surcharged conditions that limit flow to about 37 percent of the
estimated full-pipe capacity. The SSO is activated once the flow depth reaches the invert elevation of the 8-inch
overflow pipe.
The rate of overflow through the overflow pipe can be estimated using Iso-Qs, as shown in the previous
example. This SSO lasted for over 10 hours and discharged 165,000 gallons of untreated wastewater to the
environment.
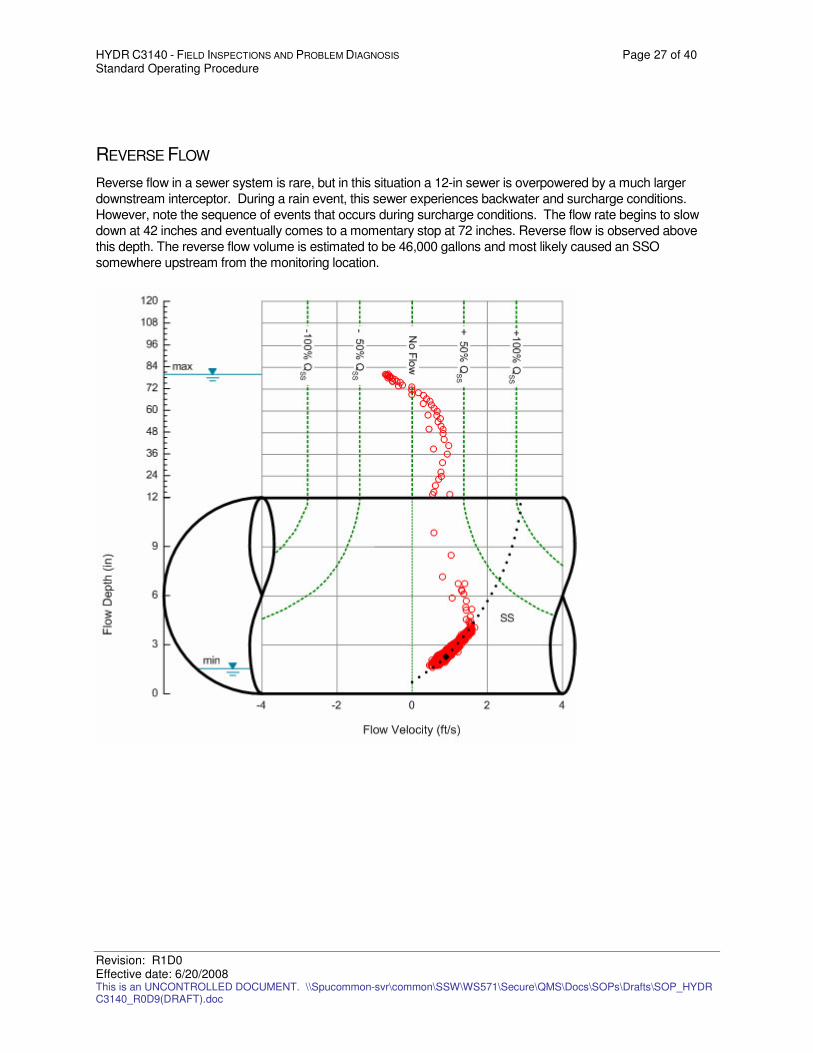
HYDR C3140 - FIELD INSPECTIONS AND PROBLEM DIAGNOSIS Page 27 of 40 Standard Operating Procedure
Revision: R1D0 Effective date: 6/20/2008 This is an UNCONTROLLED DOCUMENT. \\Spucommon-svr\common\SSW\WS571\Secure\QMS\Docs\SOPs\Drafts\SOP_HYDR C3140_R0D9(DRAFT).doc
REVERSE FLOW
Reverse flow in a sewer system is rare, but in this situation a 12-in sewer is overpowered by a much larger
downstream interceptor. During a rain event, this sewer experiences backwater and surcharge conditions.
However, note the sequence of events that occurs during surcharge conditions. The flow rate begins to slow
down at 42 inches and eventually comes to a momentary stop at 72 inches. Reverse flow is observed above
this depth. The reverse flow volume is estimated to be 46,000 gallons and most likely caused an SSO
somewhere upstream from the monitoring location.
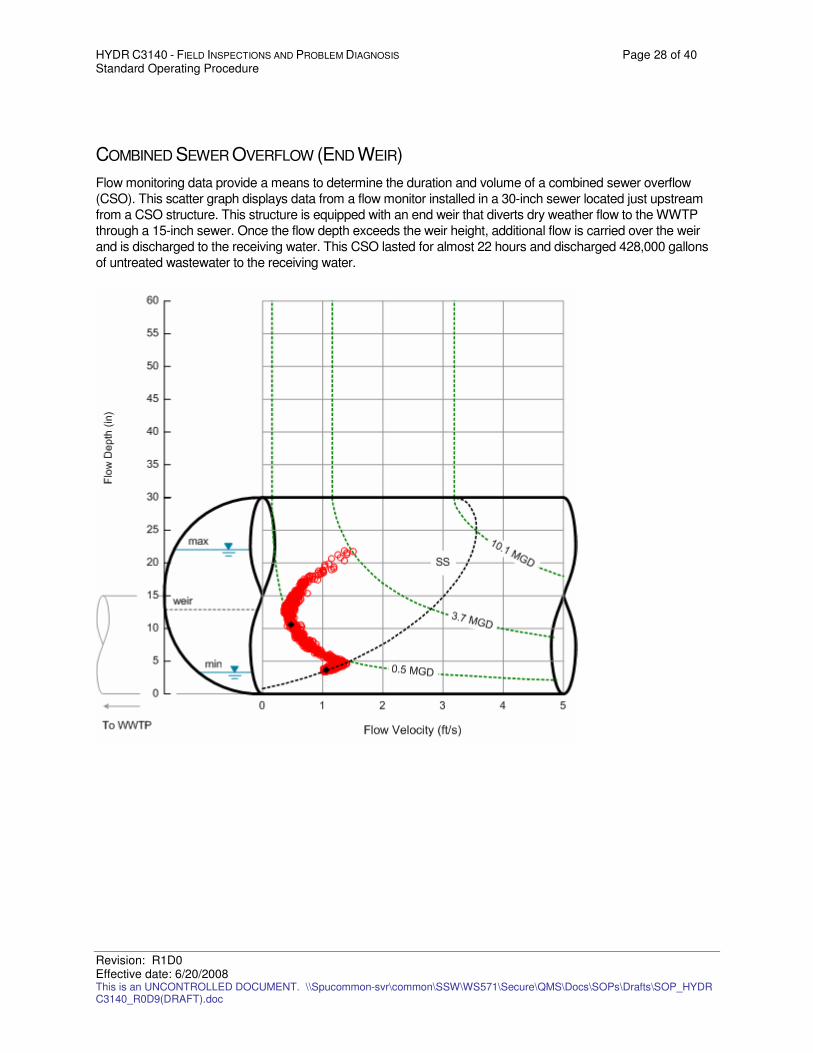
HYDR C3140 - FIELD INSPECTIONS AND PROBLEM DIAGNOSIS Page 28 of 40 Standard Operating Procedure
Revision: R1D0 Effective date: 6/20/2008 This is an UNCONTROLLED DOCUMENT. \\Spucommon-svr\common\SSW\WS571\Secure\QMS\Docs\SOPs\Drafts\SOP_HYDR C3140_R0D9(DRAFT).doc
COMBINED SEWER OVERFLOW (END WEIR)
Flow monitoring data provide a means to determine the duration and volume of a combined sewer overflow
(CSO). This scatter graph displays data from a flow monitor installed in a 30-inch sewer located just upstream
from a CSO structure. This structure is equipped with an end weir that diverts dry weather flow to the WWTP
through a 15-inch sewer. Once the flow depth exceeds the weir height, additional flow is carried over the weir
and is discharged to the receiving water. This CSO lasted for almost 22 hours and discharged 428,000 gallons
of untreated wastewater to the receiving water.
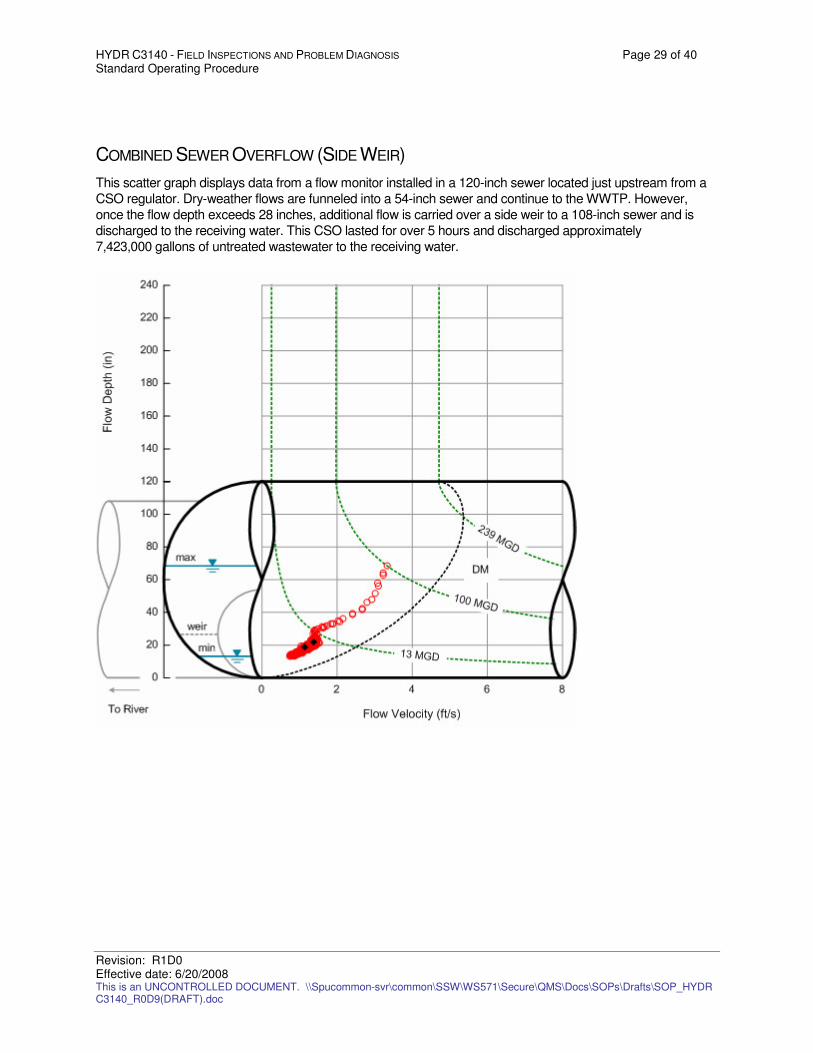
HYDR C3140 - FIELD INSPECTIONS AND PROBLEM DIAGNOSIS Page 29 of 40 Standard Operating Procedure
Revision: R1D0 Effective date: 6/20/2008 This is an UNCONTROLLED DOCUMENT. \\Spucommon-svr\common\SSW\WS571\Secure\QMS\Docs\SOPs\Drafts\SOP_HYDR C3140_R0D9(DRAFT).doc
COMBINED SEWER OVERFLOW (SIDE WEIR)
This scatter graph displays data from a flow monitor installed in a 120-inch sewer located just upstream from a
CSO regulator. Dry-weather flows are funneled into a 54-inch sewer and continue to the WWTP. However,
once the flow depth exceeds 28 inches, additional flow is carried over a side weir to a 108-inch sewer and is
discharged to the receiving water. This CSO lasted for over 5 hours and discharged approximately
7,423,000 gallons of untreated wastewater to the receiving water.
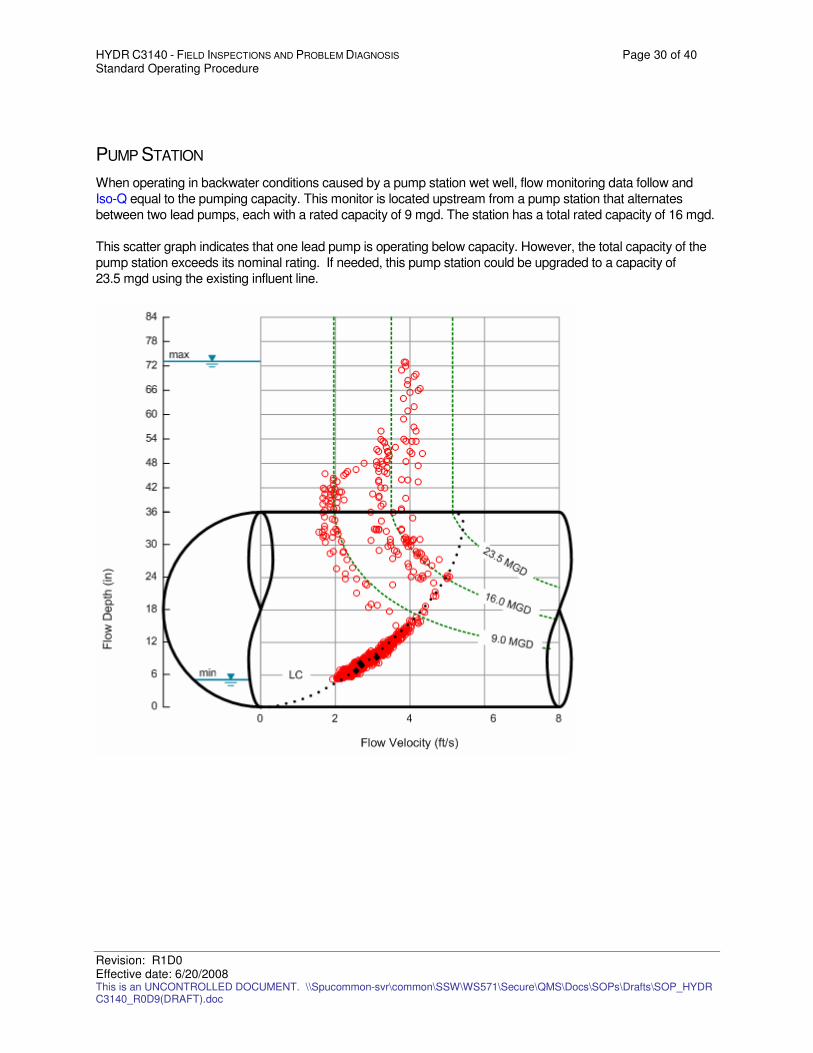
HYDR C3140 - FIELD INSPECTIONS AND PROBLEM DIAGNOSIS Page 30 of 40 Standard Operating Procedure
Revision: R1D0 Effective date: 6/20/2008 This is an UNCONTROLLED DOCUMENT. \\Spucommon-svr\common\SSW\WS571\Secure\QMS\Docs\SOPs\Drafts\SOP_HYDR C3140_R0D9(DRAFT).doc
PUMP STATION
When operating in backwater conditions caused by a pump station wet well, flow monitoring data follow and
Iso-Q equal to the pumping capacity. This monitor is located upstream from a pump station that alternates
between two lead pumps, each with a rated capacity of 9 mgd. The station has a total rated capacity of 16 mgd.
This scatter graph indicates that one lead pump is operating below capacity. However, the total capacity of the
pump station exceeds its nominal rating. If needed, this pump station could be upgraded to a capacity of
23.5 mgd using the existing influent line.
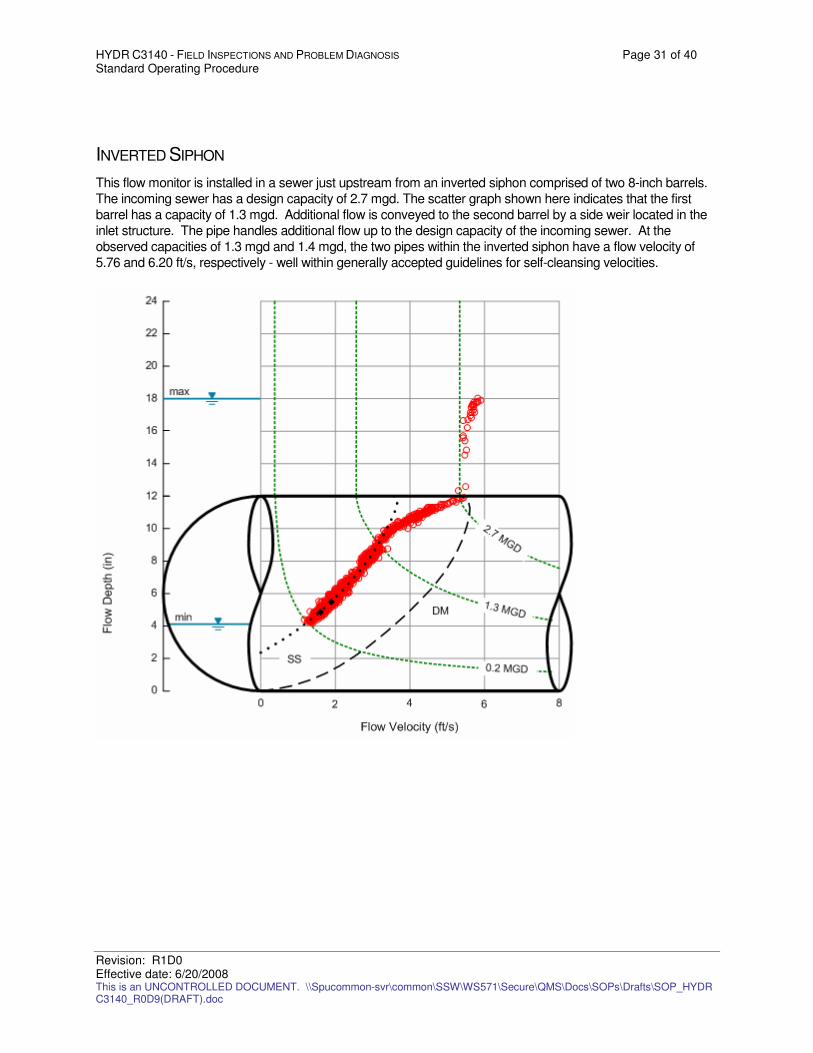
HYDR C3140 - FIELD INSPECTIONS AND PROBLEM DIAGNOSIS Page 31 of 40 Standard Operating Procedure
Revision: R1D0 Effective date: 6/20/2008 This is an UNCONTROLLED DOCUMENT. \\Spucommon-svr\common\SSW\WS571\Secure\QMS\Docs\SOPs\Drafts\SOP_HYDR C3140_R0D9(DRAFT).doc
INVERTED SIPHON
This flow monitor is installed in a sewer just upstream from an inverted siphon comprised of two 8-inch barrels.
The incoming sewer has a design capacity of 2.7 mgd. The scatter graph shown here indicates that the first
barrel has a capacity of 1.3 mgd. Additional flow is conveyed to the second barrel by a side weir located in the
inlet structure. The pipe handles additional flow up to the design capacity of the incoming sewer. At the
observed capacities of 1.3 mgd and 1.4 mgd, the two pipes within the inverted siphon have a flow velocity of
5.76 and 6.20 ft/s, respectively - well within generally accepted guidelines for self-cleansing velocities.

HYDR C3140 - FIELD INSPECTIONS AND PROBLEM DIAGNOSIS Page 32 of 40 Standard Operating Procedure
Revision: R1D0 Effective date: 6/20/2008 This is an UNCONTROLLED DOCUMENT. \\Spucommon-svr\common\SSW\WS571\Secure\QMS\Docs\SOPs\Drafts\SOP_HYDR C3140_R0D9(DRAFT).doc
RESTRICTOR PLATE
A satellite agency discharges wastewater to a receiving agency through this 27-inch sewer for subsequent
conveyance and treatment. The minimum and maximum dry weather flow rates are 0.6 mgd and 1.8 mgd.
Much greater flows were observed in wet weather, creating problems for the receiving agency. In an attempt to
regulate peak flows, the receiving agency installed a restrictor plate to limit the amount of inflow received from
the satellite agency. The restrictor plate was effective and limited the incoming flow to 6.4 mgd. This scatter
graph displays data from a flow monitor located just upstream from the restrictor plate.
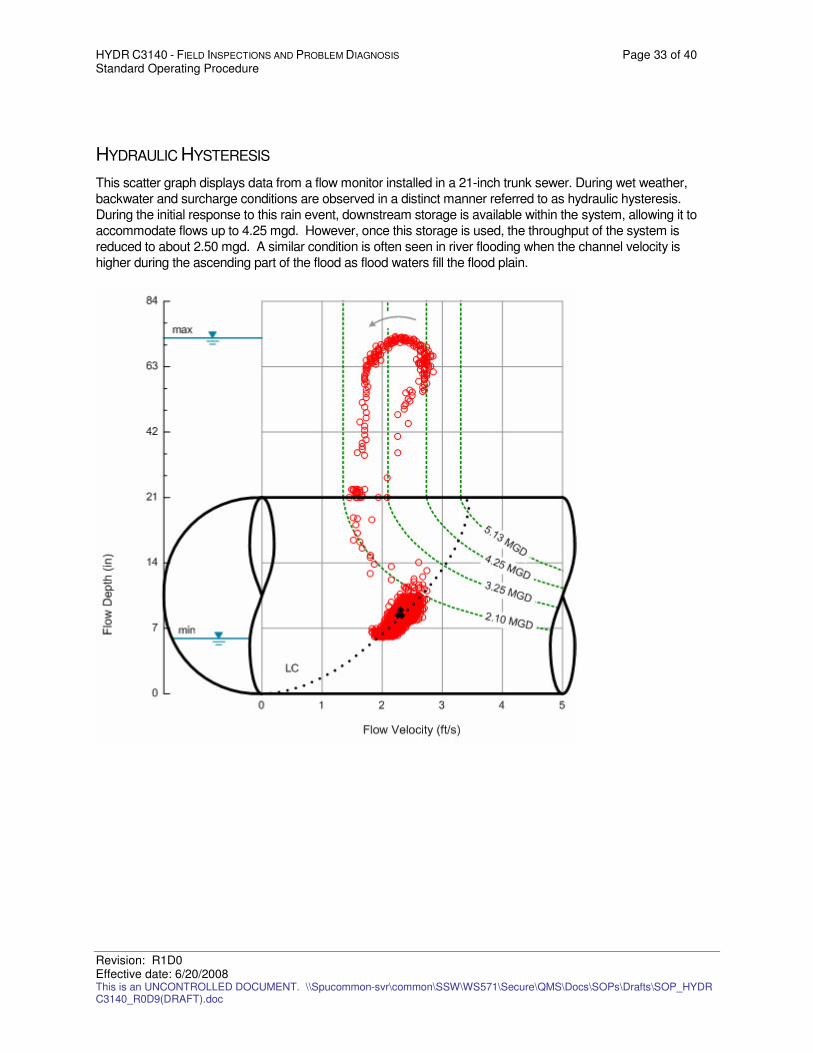
HYDR C3140 - FIELD INSPECTIONS AND PROBLEM DIAGNOSIS Page 33 of 40 Standard Operating Procedure
Revision: R1D0 Effective date: 6/20/2008 This is an UNCONTROLLED DOCUMENT. \\Spucommon-svr\common\SSW\WS571\Secure\QMS\Docs\SOPs\Drafts\SOP_HYDR C3140_R0D9(DRAFT).doc
HYDRAULIC HYSTERESIS
This scatter graph displays data from a flow monitor installed in a 21-inch trunk sewer. During wet weather,
backwater and surcharge conditions are observed in a distinct manner referred to as hydraulic hysteresis.
During the initial response to this rain event, downstream storage is available within the system, allowing it to
accommodate flows up to 4.25 mgd. However, once this storage is used, the throughput of the system is
reduced to about 2.50 mgd. A similar condition is often seen in river flooding when the channel velocity is
higher during the ascending part of the flood as flood waters fill the flood plain.
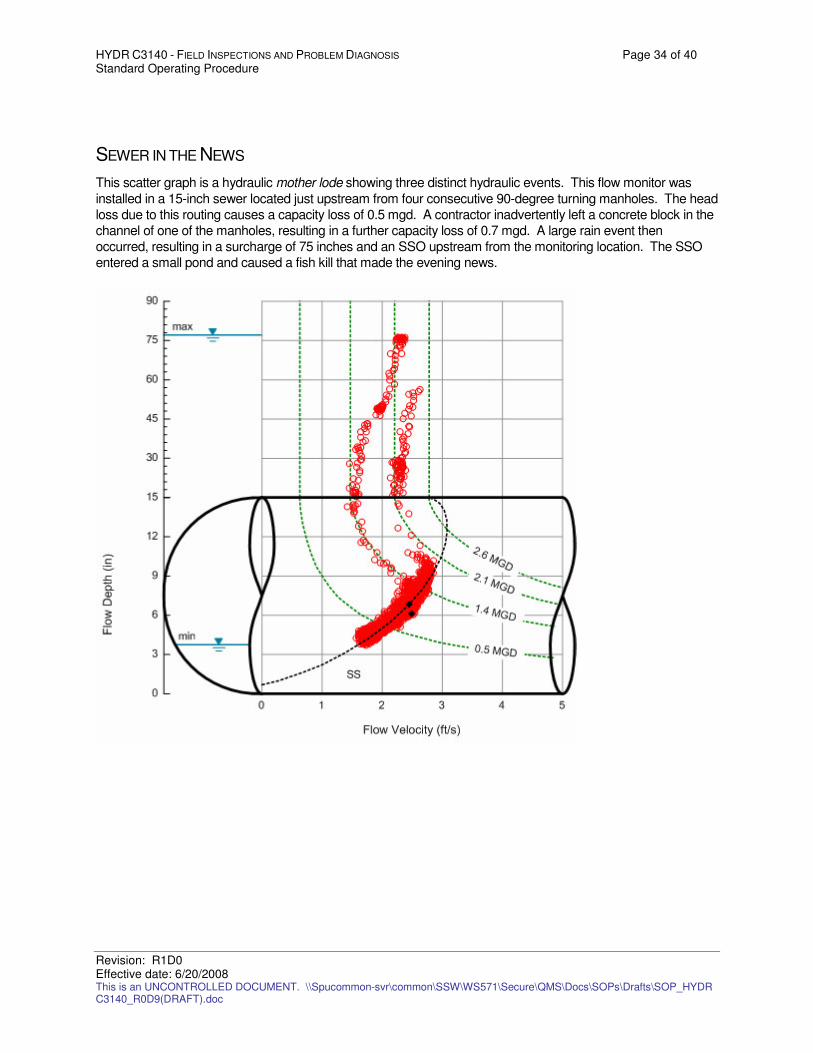
HYDR C3140 - FIELD INSPECTIONS AND PROBLEM DIAGNOSIS Page 34 of 40 Standard Operating Procedure
Revision: R1D0 Effective date: 6/20/2008 This is an UNCONTROLLED DOCUMENT. \\Spucommon-svr\common\SSW\WS571\Secure\QMS\Docs\SOPs\Drafts\SOP_HYDR C3140_R0D9(DRAFT).doc
SEWER IN THE NEWS
This scatter graph is a hydraulic mother lode showing three distinct hydraulic events. This flow monitor was
installed in a 15-inch sewer located just upstream from four consecutive 90-degree turning manholes. The head
loss due to this routing causes a capacity loss of 0.5 mgd. A contractor inadvertently left a concrete block in the
channel of one of the manholes, resulting in a further capacity loss of 0.7 mgd. A large rain event then
occurred, resulting in a surcharge of 75 inches and an SSO upstream from the monitoring location. The SSO
entered a small pond and caused a fish kill that made the evening news.
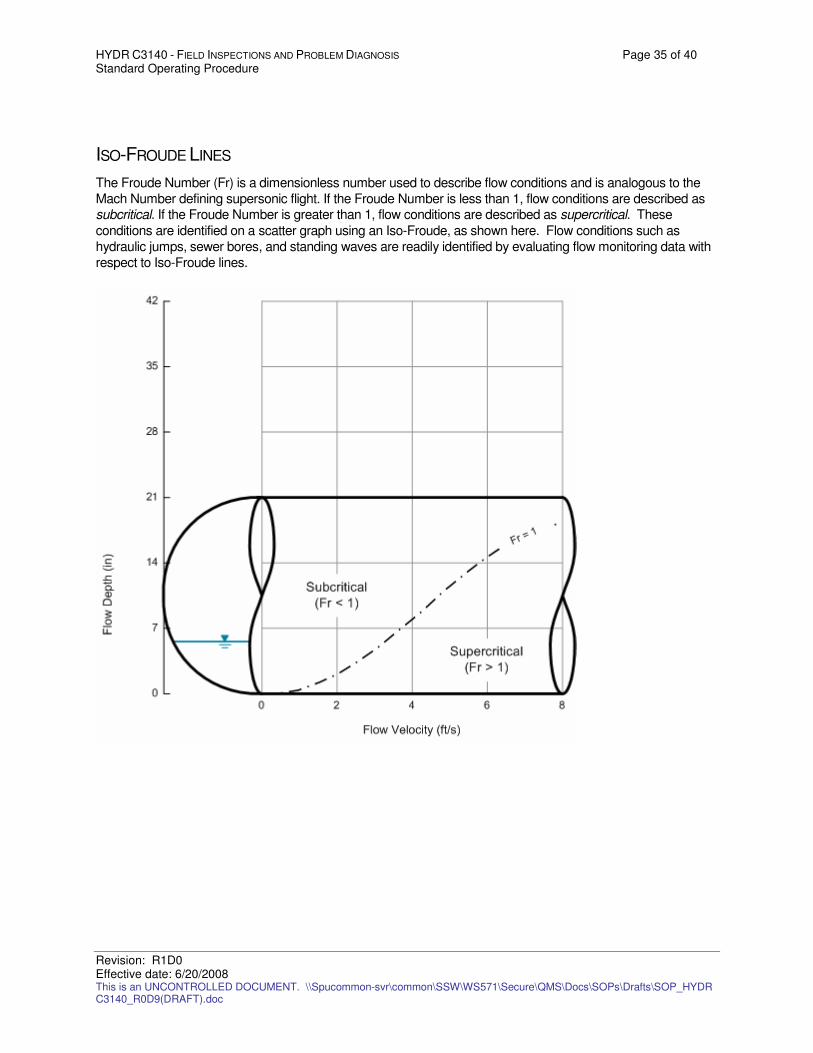
HYDR C3140 - FIELD INSPECTIONS AND PROBLEM DIAGNOSIS Page 35 of 40 Standard Operating Procedure
Revision: R1D0 Effective date: 6/20/2008 This is an UNCONTROLLED DOCUMENT. \\Spucommon-svr\common\SSW\WS571\Secure\QMS\Docs\SOPs\Drafts\SOP_HYDR C3140_R0D9(DRAFT).doc
ISO-FROUDE LINES
The Froude Number (Fr) is a dimensionless number used to describe flow conditions and is analogous to the
Mach Number defining supersonic flight. If the Froude Number is less than 1, flow conditions are described as subcritical. If the Froude Number is greater than 1, flow conditions are described as supercritical. These
conditions are identified on a scatter graph using an Iso-Froude, as shown here. Flow conditions such as
hydraulic jumps, sewer bores, and standing waves are readily identified by evaluating flow monitoring data with
respect to Iso-Froude lines.
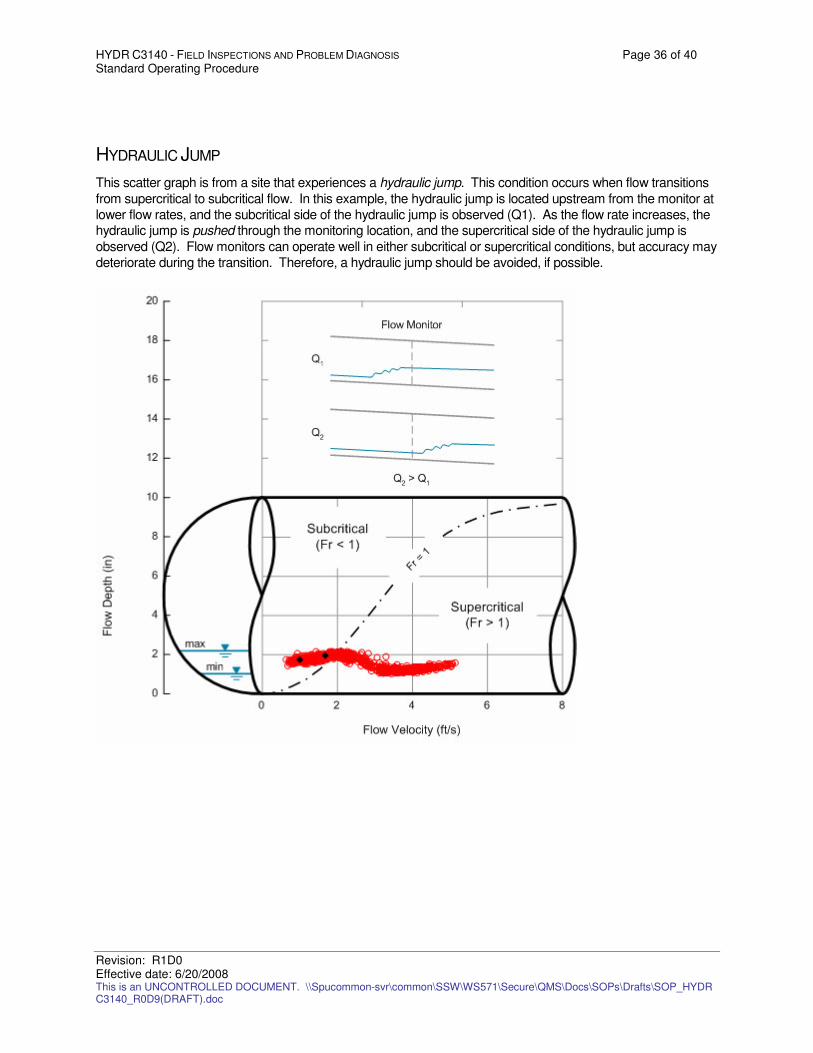
HYDR C3140 - FIELD INSPECTIONS AND PROBLEM DIAGNOSIS Page 36 of 40 Standard Operating Procedure
Revision: R1D0 Effective date: 6/20/2008 This is an UNCONTROLLED DOCUMENT. \\Spucommon-svr\common\SSW\WS571\Secure\QMS\Docs\SOPs\Drafts\SOP_HYDR C3140_R0D9(DRAFT).doc
HYDRAULIC JUMP
This scatter graph is from a site that experiences a hydraulic jump. This condition occurs when flow transitions
from supercritical to subcritical flow. In this example, the hydraulic jump is located upstream from the monitor at
lower flow rates, and the subcritical side of the hydraulic jump is observed (Q1). As the flow rate increases, the hydraulic jump is pushed through the monitoring location, and the supercritical side of the hydraulic jump is
observed (Q2). Flow monitors can operate well in either subcritical or supercritical conditions, but accuracy may
deteriorate during the transition. Therefore, a hydraulic jump should be avoided, if possible.
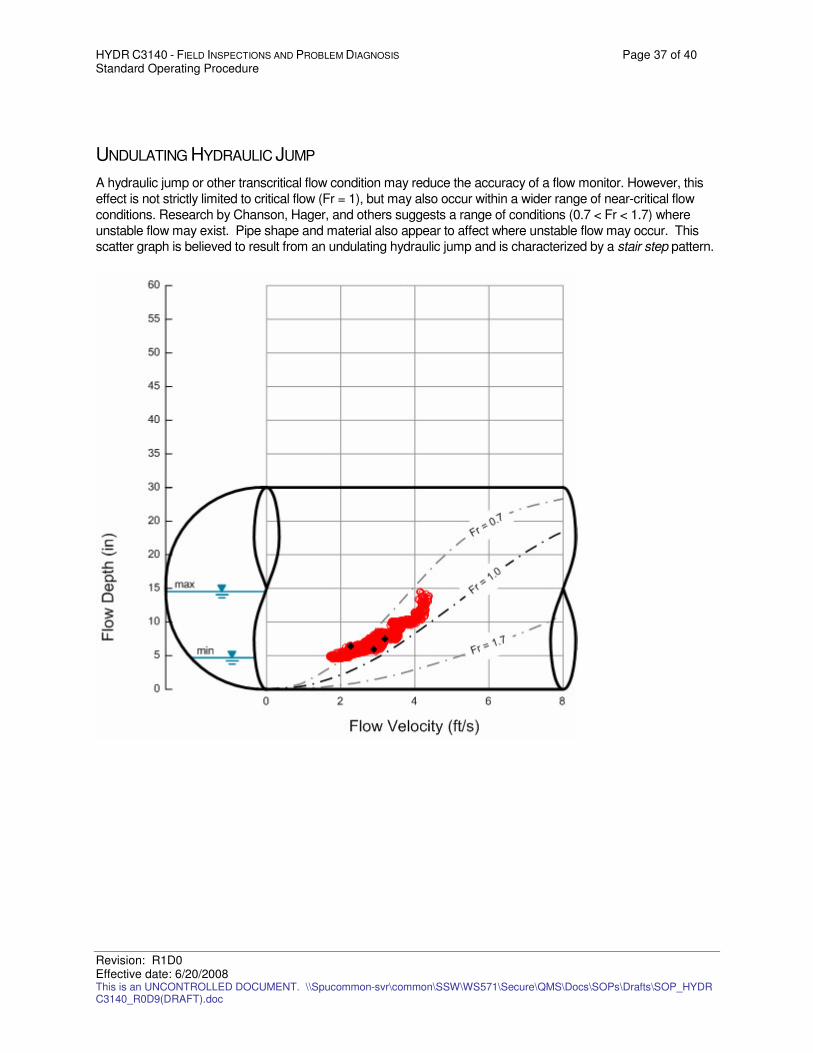
HYDR C3140 - FIELD INSPECTIONS AND PROBLEM DIAGNOSIS Page 37 of 40 Standard Operating Procedure
Revision: R1D0 Effective date: 6/20/2008 This is an UNCONTROLLED DOCUMENT. \\Spucommon-svr\common\SSW\WS571\Secure\QMS\Docs\SOPs\Drafts\SOP_HYDR C3140_R0D9(DRAFT).doc
UNDULATING HYDRAULIC JUMP
A hydraulic jump or other transcritical flow condition may reduce the accuracy of a flow monitor. However, this
effect is not strictly limited to critical flow (Fr = 1), but may also occur within a wider range of near-critical flow
conditions. Research by Chanson, Hager, and others suggests a range of conditions (0.7 < Fr < 1.7) where
unstable flow may exist. Pipe shape and material also appear to affect where unstable flow may occur. This scatter graph is believed to result from an undulating hydraulic jump and is characterized by a stair step pattern.
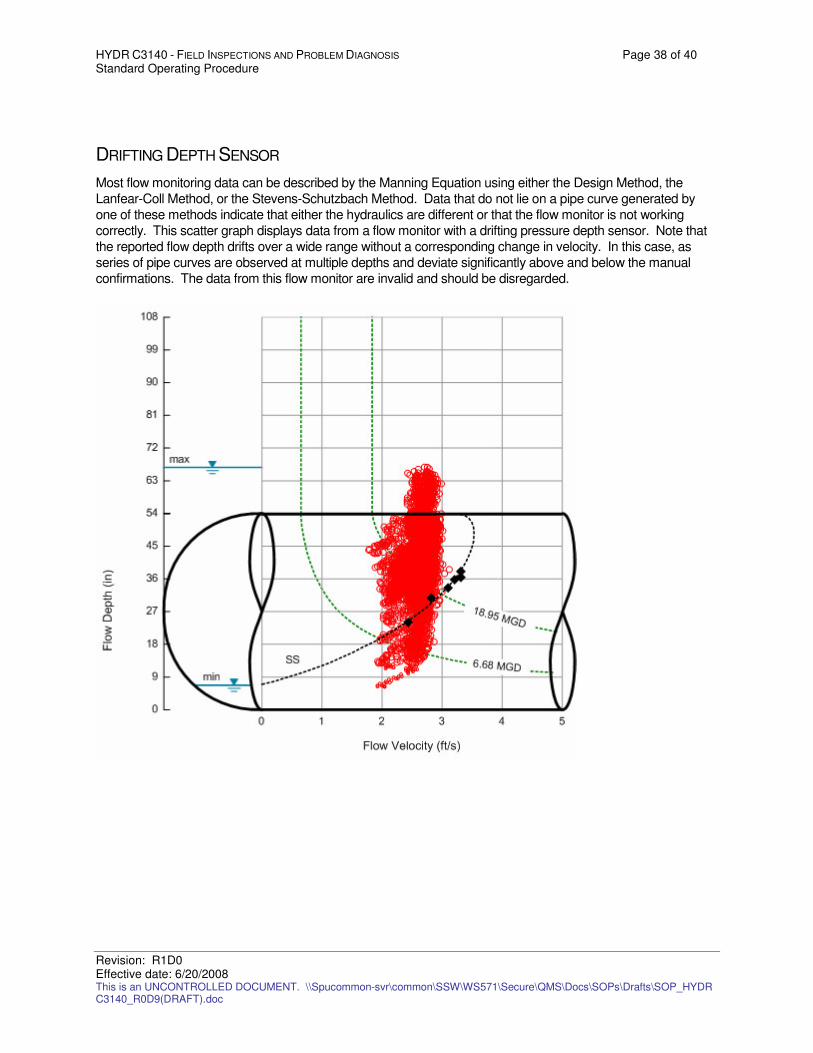
HYDR C3140 - FIELD INSPECTIONS AND PROBLEM DIAGNOSIS Page 38 of 40 Standard Operating Procedure
Revision: R1D0 Effective date: 6/20/2008 This is an UNCONTROLLED DOCUMENT. \\Spucommon-svr\common\SSW\WS571\Secure\QMS\Docs\SOPs\Drafts\SOP_HYDR C3140_R0D9(DRAFT).doc
DRIFTING DEPTH SENSOR
Most flow monitoring data can be described by the Manning Equation using either the Design Method, the
Lanfear-Coll Method, or the Stevens-Schutzbach Method. Data that do not lie on a pipe curve generated by
one of these methods indicate that either the hydraulics are different or that the flow monitor is not working
correctly. This scatter graph displays data from a flow monitor with a drifting pressure depth sensor. Note that
the reported flow depth drifts over a wide range without a corresponding change in velocity. In this case, as
series of pipe curves are observed at multiple depths and deviate significantly above and below the manual
confirmations. The data from this flow monitor are invalid and should be disregarded.
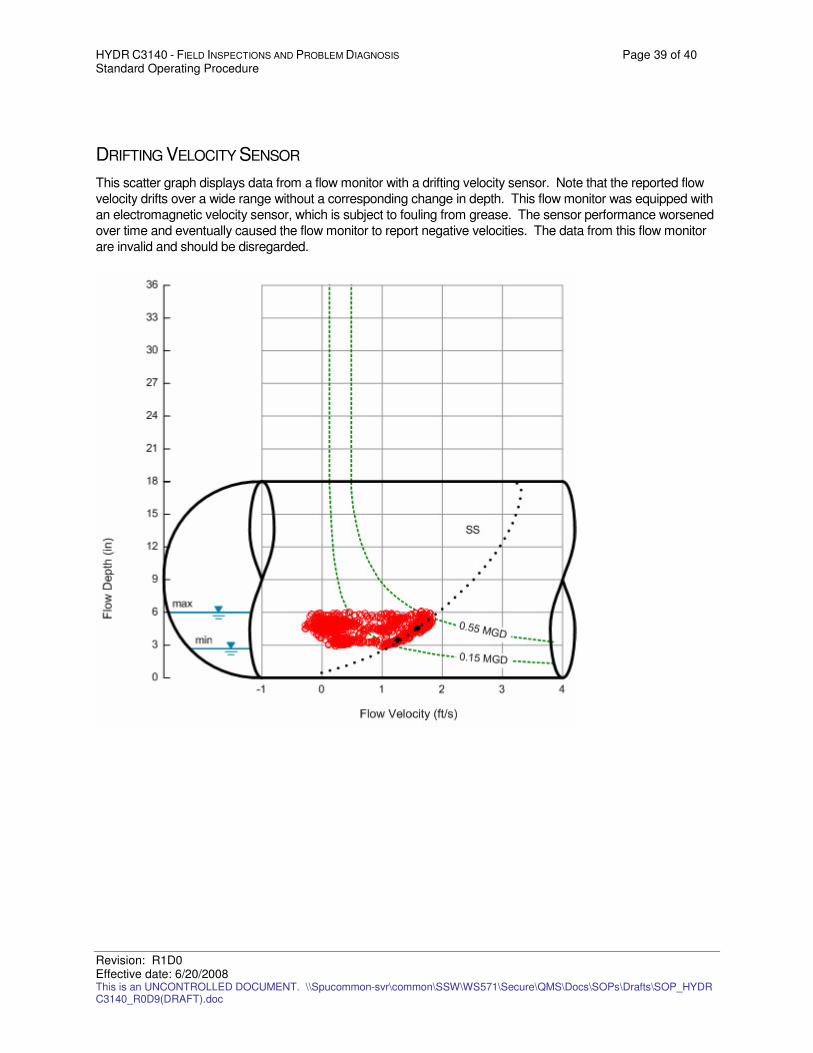
HYDR C3140 - FIELD INSPECTIONS AND PROBLEM DIAGNOSIS Page 39 of 40 Standard Operating Procedure
Revision: R1D0 Effective date: 6/20/2008 This is an UNCONTROLLED DOCUMENT. \\Spucommon-svr\common\SSW\WS571\Secure\QMS\Docs\SOPs\Drafts\SOP_HYDR C3140_R0D9(DRAFT).doc
DRIFTING VELOCITY SENSOR
This scatter graph displays data from a flow monitor with a drifting velocity sensor. Note that the reported flow
velocity drifts over a wide range without a corresponding change in depth. This flow monitor was equipped with
an electromagnetic velocity sensor, which is subject to fouling from grease. The sensor performance worsened
over time and eventually caused the flow monitor to report negative velocities. The data from this flow monitor
are invalid and should be disregarded.
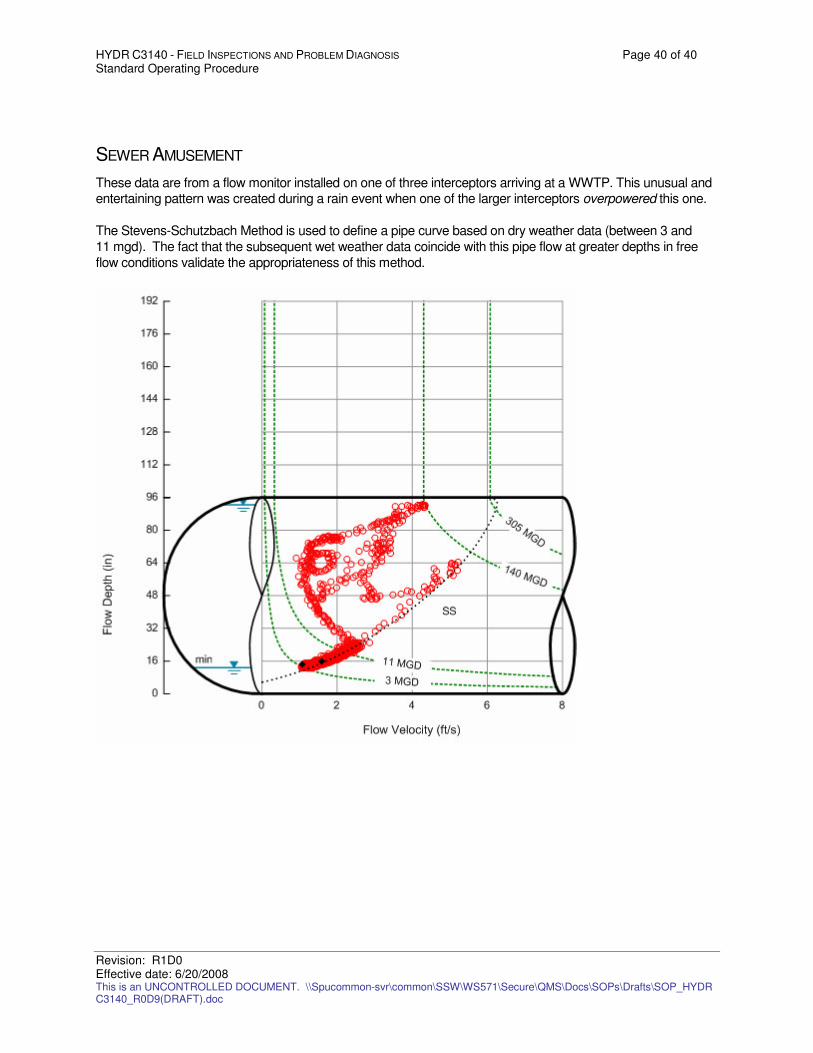
HYDR C3140 - FIELD INSPECTIONS AND PROBLEM DIAGNOSIS Page 40 of 40 Standard Operating Procedure
Revision: R1D0 Effective date: 6/20/2008 This is an UNCONTROLLED DOCUMENT. \\Spucommon-svr\common\SSW\WS571\Secure\QMS\Docs\SOPs\Drafts\SOP_HYDR C3140_R0D9(DRAFT).doc
SEWER AMUSEMENT
These data are from a flow monitor installed on one of three interceptors arriving at a WWTP. This unusual and entertaining pattern was created during a rain event when one of the larger interceptors overpowered this one.
The Stevens-Schutzbach Method is used to define a pipe curve based on dry weather data (between 3 and
11 mgd). The fact that the subsequent wet weather data coincide with this pipe flow at greater depths in free
flow conditions validate the appropriateness of this method.

Identifier:
HYDR C3130
Revision:
R1D0
Effective date:
6/20/2008
Custodian:
Hai Bach
Authorization Authority:
TBD
Flow Monitoring Network
Standard Operating Procedure
HYDR C3130 - Field Calibration and Maintenance
Seattle Public Utilities
Seattle , Washington
This document is part of the Science Information Quality System and describes standard operating procedures to ensure that a systematic, consistent approach is followed for collecting, assessing, and documenting environmental data of known and documented quality.
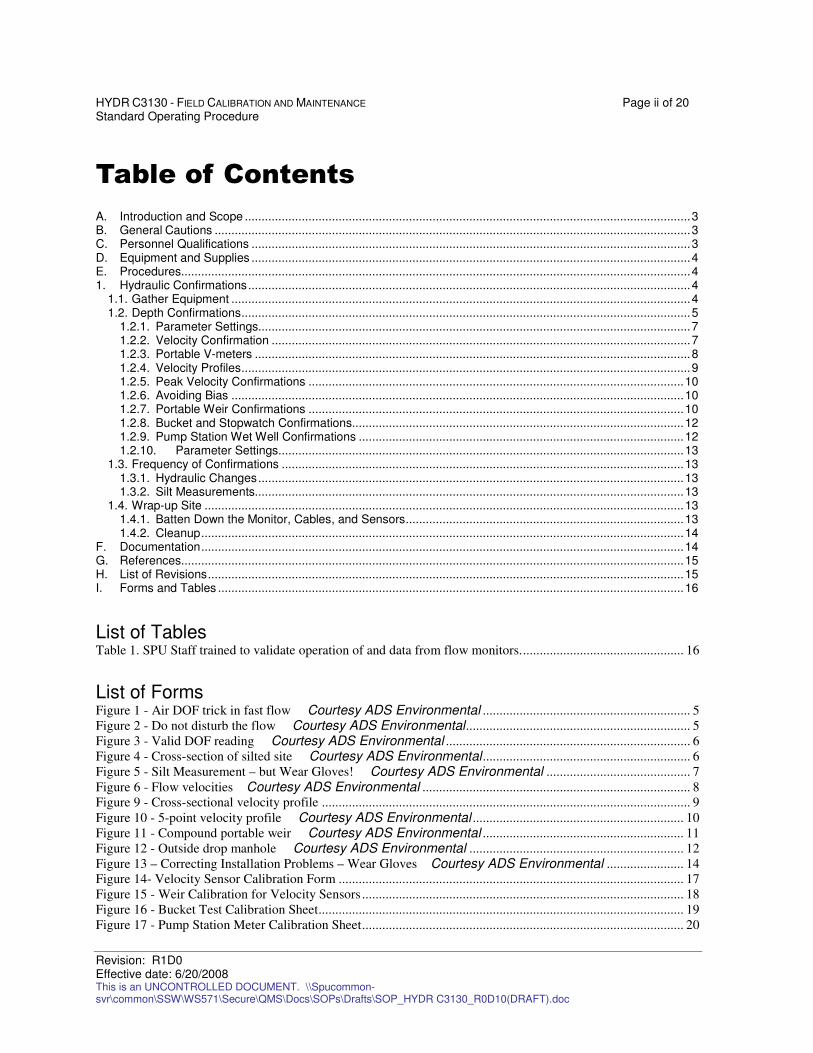
HYDR C3130 - FIELD CALIBRATION AND MAINTENANCE Page ii of 20 Standard Operating Procedure
Revision: R1D0 Effective date: 6/20/2008 This is an UNCONTROLLED DOCUMENT. \\Spucommon-svr\common\SSW\WS571\Secure\QMS\Docs\SOPs\Drafts\SOP_HYDR C3130_R0D10(DRAFT).doc
Table of Contents A. Introduction and Scope .....................................................................................................................................3 B. General Cautions ..............................................................................................................................................3 C. Personnel Qualifications ...................................................................................................................................3 D. Equipment and Supplies ...................................................................................................................................4 E. Procedures........................................................................................................................................................4 1. Hydraulic Confirmations....................................................................................................................................4
1.1. Gather Equipment .........................................................................................................................................4 1.2. Depth Confirmations......................................................................................................................................5
1.2.1. Parameter Settings.................................................................................................................................7 1.2.2. Velocity Confirmation .............................................................................................................................7 1.2.3. Portable V-meters ..................................................................................................................................8 1.2.4. Velocity Profiles......................................................................................................................................9 1.2.5. Peak Velocity Confirmations ................................................................................................................10 1.2.6. Avoiding Bias .......................................................................................................................................10 1.2.7. Portable Weir Confirmations ................................................................................................................10 1.2.8. Bucket and Stopwatch Confirmations...................................................................................................12 1.2.9. Pump Station Wet Well Confirmations .................................................................................................12 1.2.10. Parameter Settings.........................................................................................................................13
1.3. Frequency of Confirmations ........................................................................................................................13 1.3.1. Hydraulic Changes...............................................................................................................................13 1.3.2. Silt Measurements................................................................................................................................13
1.4. Wrap-up Site ...............................................................................................................................................13 1.4.1. Batten Down the Monitor, Cables, and Sensors...................................................................................13 1.4.2. Cleanup................................................................................................................................................14
F. Documentation................................................................................................................................................14 G. References......................................................................................................................................................15 H. List of Revisions..............................................................................................................................................15 I. Forms and Tables ...........................................................................................................................................16
List of Tables Table 1. SPU Staff trained to validate operation of and data from flow monitors................................................. 16
List of Forms Figure 1 - Air DOF trick in fast flow Courtesy ADS Environmental .............................................................. 5 Figure 2 - Do not disturb the flow Courtesy ADS Environmental................................................................... 5 Figure 3 - Valid DOF reading Courtesy ADS Environmental ......................................................................... 6 Figure 4 - Cross-section of silted site Courtesy ADS Environmental.............................................................. 6 Figure 5 - Silt Measurement – but Wear Gloves! Courtesy ADS Environmental ........................................... 7 Figure 6 - Flow velocities Courtesy ADS Environmental ................................................................................ 8 Figure 9 - Cross-sectional velocity profile .............................................................................................................. 9 Figure 10 - 5-point velocity profile Courtesy ADS Environmental ............................................................... 10 Figure 11 - Compound portable weir Courtesy ADS Environmental ............................................................ 11 Figure 12 - Outside drop manhole Courtesy ADS Environmental ................................................................ 12 Figure 13 – Correcting Installation Problems – Wear Gloves Courtesy ADS Environmental ....................... 14 Figure 14- Velocity Sensor Calibration Form ....................................................................................................... 17 Figure 15 - Weir Calibration for Velocity Sensors ................................................................................................ 18 Figure 16 - Bucket Test Calibration Sheet............................................................................................................. 19 Figure 17 - Pump Station Meter Calibration Sheet................................................................................................ 20

HYDR C3130 - FIELD CALIBRATION AND MAINTENANCE Page 3 of 20 Standard Operating Procedure
Revision: R1D0 Effective date: 6/20/2008 This is an UNCONTROLLED DOCUMENT. \\Spucommon-svr\common\SSW\WS571\Secure\QMS\Docs\SOPs\Drafts\SOP_HYDR C3130_R0D10(DRAFT).doc
Flow Monitor Network
C-3120 – Equipment and Installation See also the following Standard Operating Procedures:
HYDR C1000 – General (Field Planning & Mobilization, Field Decontamination)
HYDR C2000 – Open Channel Flow
HYDR C2010 – Equipment & Site Selection
HYDR C2020 – Equipment Installation
HYDR C2030 – Field Calibrations and Maintenance
HYDR C2040 – Field Inspections
HYDR C3100 – Piped Flow Gravity
HYDR C3120 – Equipment Installation
A. Introduction and Scope
This Standard Operating Procedure (SOP) presents procedures to be used to operate and maintain
sewer flow monitors as accurately and reliably as possible. Seattle Public Utilities (SPU) operates and
maintains a network of ADS® FlowShark™ and Isco 2150 sewer flow monitors in its sanitary and
combined sewer systems. Data from the monitors are crucial to environmental applications and for
planning purposes. This SOP provides guidance and procedures to help SPU personnel maintain the
monitors in good working order; recognize, troubleshoot and fix problems; and check to make sure each
sensor on each monitor is interpreting hydraulic conditions accurately.
The techniques described herein are derived from ISO-748, ISO-7178, ISO-8363, ISO-9824, the Profile
®
Software Users Guide, the FlowShark Manual and the Long Term Field Methods Manual, all referenced
in Section G of this document. Section G also references the following Isco manual: 2150 Area Velocity
Flow Module and Sensors. This SOP has been applied to flow monitor data collected since 2007.
B. General Cautions
Flow monitoring locations in sewers are potentially dangerous because monitor maintenance often
requires physical entry into the collection system. High flows, poisonous or suffocating gases, and a dirty,
corrosive environment await sewer workers when working within the collection system. Sewers are
defined by OSHA as confined spaces; therefore, people servicing or inspecting them require SPU
confined-space training and certification. Refer to the SPU “Safety Policy & Procedures in Confined
Space Entry” cited in Section G for local safety requirements. Also, in order to protect topside attendants,
pedestrians, cyclists and drivers in roadways or rights of way, refer to “Traffic Control Manual for In-Street
Work,” also cited in Section G.
This SOP is intended to provide guidance that will help maximize the SPU capture of the best possible
flow monitoring from every site.
C. Personnel Qualifications
Qualifications for this work are specialized. The job requires intelligent people who understand open-
channel flow hydraulics and the difficulties of measuring them precisely, and who don’t mind getting dirty
sorting out problems in the field. In order for field calibration and maintenance to be successful, the senior
member of the field crew needs to go into the manholes, not the junior member(s). The only exception to
HYDR C3130 - FIELD CALIBRATION AND MAINTENANCE Page 4 of 20 Standard Operating Procedure
Revision: R1D0 Effective date: 6/20/2008 This is an UNCONTROLLED DOCUMENT. \\Spucommon-svr\common\SSW\WS571\Secure\QMS\Docs\SOPs\Drafts\SOP_HYDR C3130_R0D10(DRAFT).doc
this is when a junior member of the field crew has demonstrated interest and knowledge about flow
monitoring requirements and has sufficient experience to make good hydraulic observations. The senior
crew member should always check junior members’ work, in person, by going down into the manholes.
The procedures described in this SOP are for use only by personnel who have received specific training
and demonstrated a significant level of competency. Documentation of training will be kept on file and be
readily available for review.
D. Equipment and Supplies
This procedure requires ADS FlowShark™ or Isco monitors, sensors, mounting equipment, hardware,
tools, and supplies to properly install the monitors and sensors. Changing monitors, sensors, or monitor
parameters will require a laptop computer, ADS Profile™ software or Isco Flowlink® software, and
possibly laptop-to-monitor communication cables. For a more complete list of equipment likely to be needed in the field, see Chapter 7 of the Long Term Field Methods Manual cited in Section G below.
E. Procedures
After the monitors have been installed and initially calibrated, the sensor confirmation and monitor
maintenance process begins. This section provides guidance for confirming that sensors are operating
properly, as well as maintaining, repairing, or swapping sensors and monitors as necessary.
Hydraulic confirmations differ from electronic calibrations. Electronic calibrations are intended to ensure
that instruments measure zero units or that they measure high and low points of their span correctly. On
flow monitors, the units could be depth, velocity, flow, or temperature. Hydraulic confirmations are
intended to confirm that depth sensors are measuring depth correctly and that velocity sensors are
measuring velocity correctly at any given time; as long as a flow monitor is measuring those two
parameters correctly, saving the readings, and transmitting the data to the central computer, then it is
working correctly.
1. HYDRAULIC CONFIRMATIONS
Hydraulic confirmations are intended to confirm that both depth and velocity sensors in the field are
accurately measuring the depths and velocities of the flow in the pipe. Since most sensors drift over time,
it is essential to check on the sensors quarterly. Some sensors, such pressure sensors, are more prone to
drift than ultrasonic sensors, so they may need to be confirmed more often. Similarly, non-redundant
sensors are more prone to drift than are redundant sensors, so non-redundant sensors may also need to
be confirmed more often than quarterly.
1.1. Gather Equipment
The following equipment is needed for field visits to maintain flow monitors:
• Fully equipped field vehicle (see HYDR-C3110, Section K)
• Sensor confirmation sheets for single-point velocity confirmations
• Sensor confirmation sheets for multiple-point velocity confirmations
• Sensor confirmation sheets for weir confirmations
• Sensor confirmation sheets for bucket and stopwatch confirmations
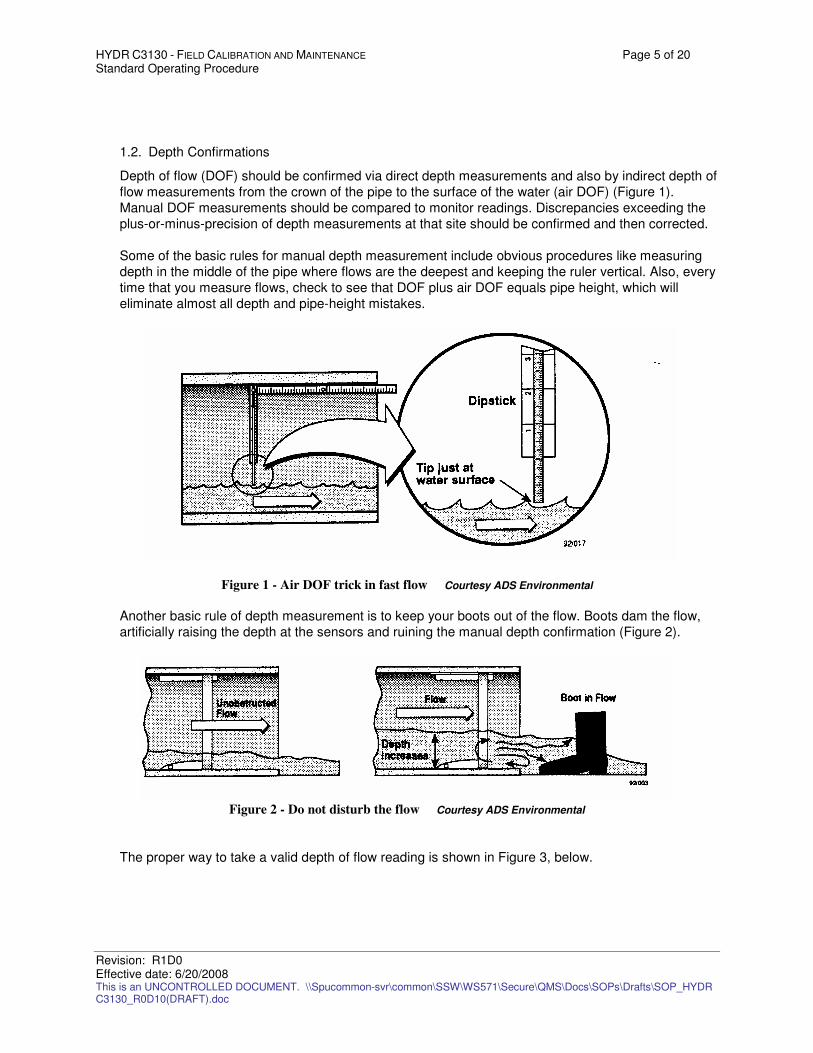
HYDR C3130 - FIELD CALIBRATION AND MAINTENANCE Page 5 of 20 Standard Operating Procedure
Revision: R1D0 Effective date: 6/20/2008 This is an UNCONTROLLED DOCUMENT. \\Spucommon-svr\common\SSW\WS571\Secure\QMS\Docs\SOPs\Drafts\SOP_HYDR C3130_R0D10(DRAFT).doc
1.2. Depth Confirmations
Depth of flow (DOF) should be confirmed via direct depth measurements and also by indirect depth of
flow measurements from the crown of the pipe to the surface of the water (air DOF) (Figure 1).
Manual DOF measurements should be compared to monitor readings. Discrepancies exceeding the
plus-or-minus-precision of depth measurements at that site should be confirmed and then corrected.
Some of the basic rules for manual depth measurement include obvious procedures like measuring
depth in the middle of the pipe where flows are the deepest and keeping the ruler vertical. Also, every
time that you measure flows, check to see that DOF plus air DOF equals pipe height, which will
eliminate almost all depth and pipe-height mistakes.
Figure 1 - Air DOF trick in fast flow Courtesy ADS Environmental
Another basic rule of depth measurement is to keep your boots out of the flow. Boots dam the flow,
artificially raising the depth at the sensors and ruining the manual depth confirmation (Figure 2).
Figure 2 - Do not disturb the flow Courtesy ADS Environmental
The proper way to take a valid depth of flow reading is shown in Figure 3, below.
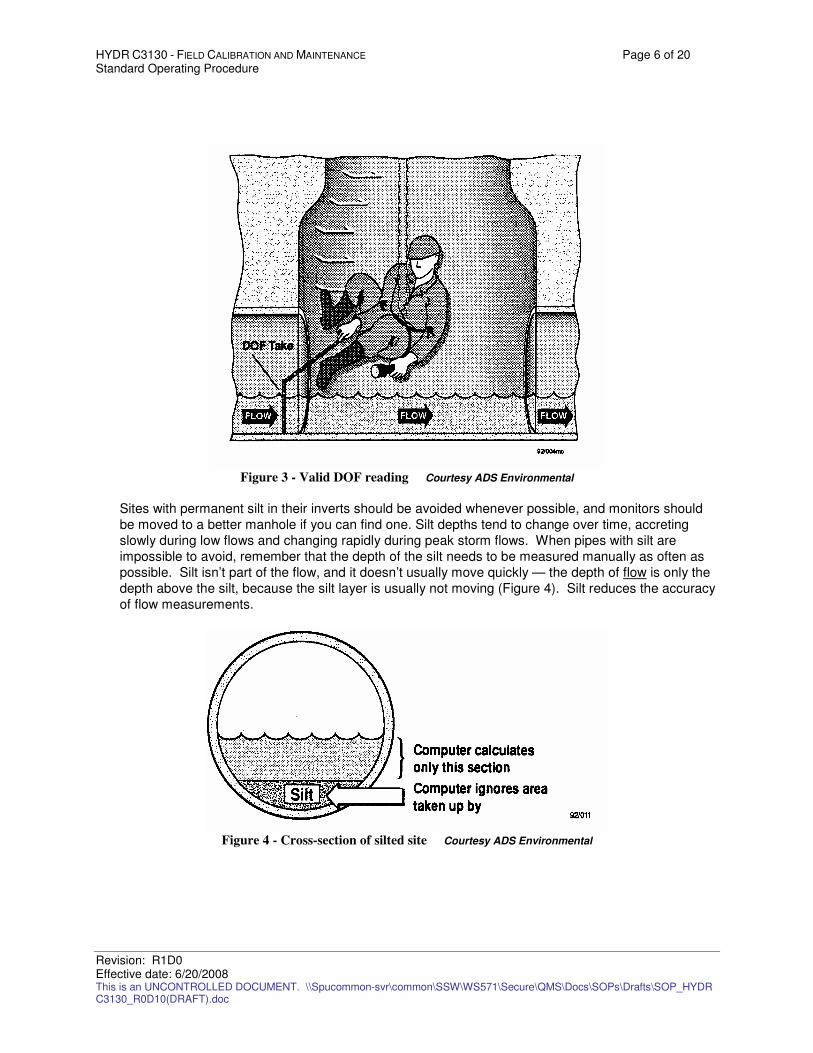
HYDR C3130 - FIELD CALIBRATION AND MAINTENANCE Page 6 of 20 Standard Operating Procedure
Revision: R1D0 Effective date: 6/20/2008 This is an UNCONTROLLED DOCUMENT. \\Spucommon-svr\common\SSW\WS571\Secure\QMS\Docs\SOPs\Drafts\SOP_HYDR C3130_R0D10(DRAFT).doc
Figure 3 - Valid DOF reading Courtesy ADS Environmental
Sites with permanent silt in their inverts should be avoided whenever possible, and monitors should
be moved to a better manhole if you can find one. Silt depths tend to change over time, accreting
slowly during low flows and changing rapidly during peak storm flows. When pipes with silt are
impossible to avoid, remember that the depth of the silt needs to be measured manually as often as
possible. Silt isn’t part of the flow, and it doesn’t usually move quickly — the depth of flow is only the
depth above the silt, because the silt layer is usually not moving (Figure 4). Silt reduces the accuracy
of flow measurements.
Figure 4 - Cross-section of silted site Courtesy ADS Environmental
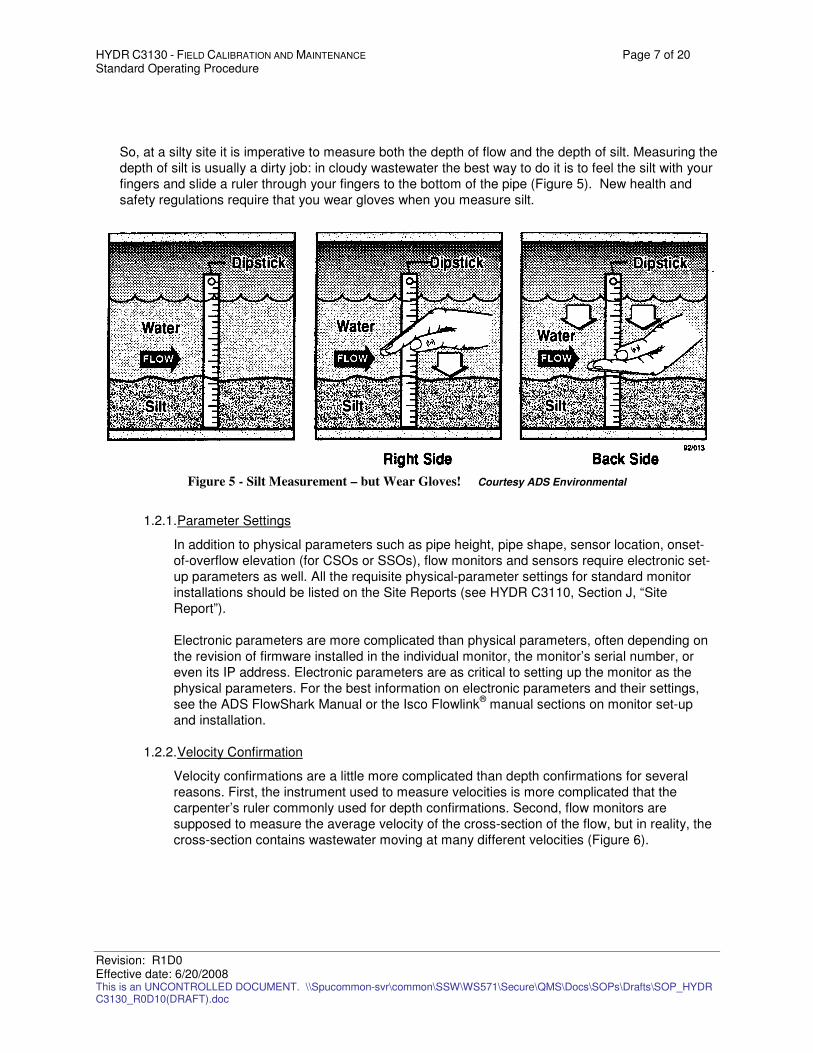
HYDR C3130 - FIELD CALIBRATION AND MAINTENANCE Page 7 of 20 Standard Operating Procedure
Revision: R1D0 Effective date: 6/20/2008 This is an UNCONTROLLED DOCUMENT. \\Spucommon-svr\common\SSW\WS571\Secure\QMS\Docs\SOPs\Drafts\SOP_HYDR C3130_R0D10(DRAFT).doc
So, at a silty site it is imperative to measure both the depth of flow and the depth of silt. Measuring the
depth of silt is usually a dirty job: in cloudy wastewater the best way to do it is to feel the silt with your
fingers and slide a ruler through your fingers to the bottom of the pipe (Figure 5). New health and
safety regulations require that you wear gloves when you measure silt.
Figure 5 - Silt Measurement – but Wear Gloves! Courtesy ADS Environmental
1.2.1. Parameter Settings
In addition to physical parameters such as pipe height, pipe shape, sensor location, onset-
of-overflow elevation (for CSOs or SSOs), flow monitors and sensors require electronic set-
up parameters as well. All the requisite physical-parameter settings for standard monitor
installations should be listed on the Site Reports (see HYDR C3110, Section J, “Site
Report”).
Electronic parameters are more complicated than physical parameters, often depending on
the revision of firmware installed in the individual monitor, the monitor’s serial number, or
even its IP address. Electronic parameters are as critical to setting up the monitor as the
physical parameters. For the best information on electronic parameters and their settings,
see the ADS FlowShark Manual or the Isco Flowlink® manual sections on monitor set-up
and installation.
1.2.2. Velocity Confirmation
Velocity confirmations are a little more complicated than depth confirmations for several
reasons. First, the instrument used to measure velocities is more complicated that the
carpenter’s ruler commonly used for depth confirmations. Second, flow monitors are
supposed to measure the average velocity of the cross-section of the flow, but in reality, the
cross-section contains wastewater moving at many different velocities (Figure 6).
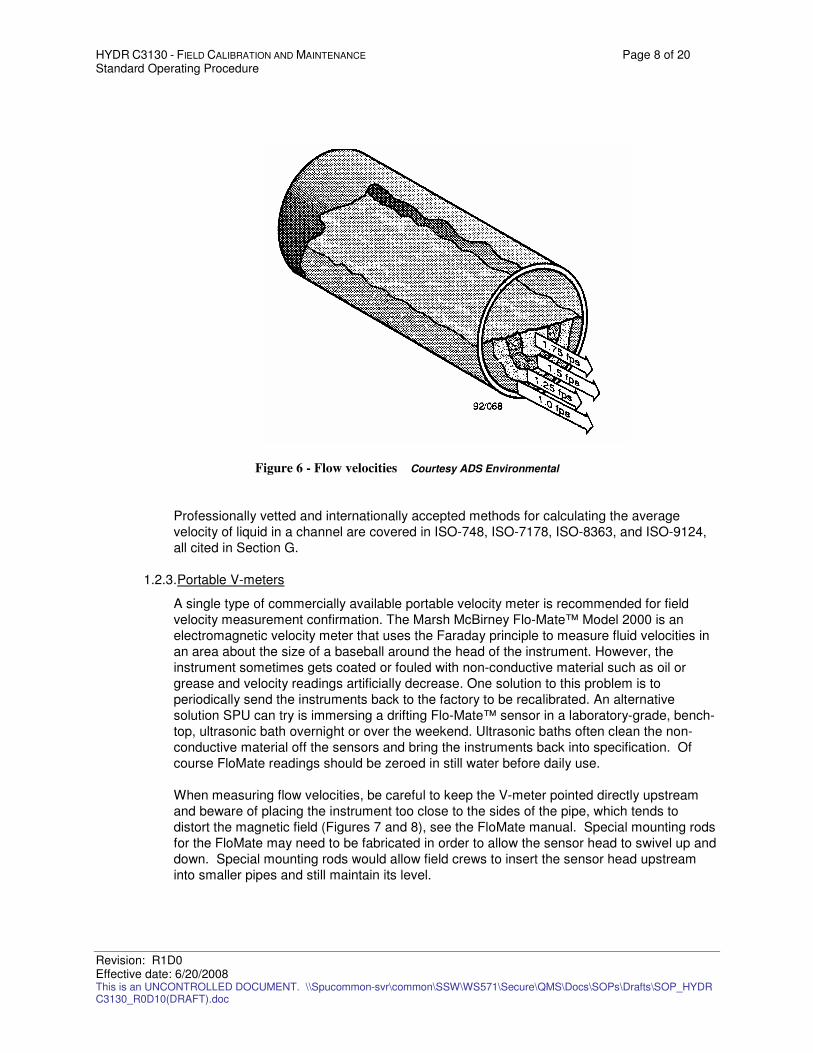
HYDR C3130 - FIELD CALIBRATION AND MAINTENANCE Page 8 of 20 Standard Operating Procedure
Revision: R1D0 Effective date: 6/20/2008 This is an UNCONTROLLED DOCUMENT. \\Spucommon-svr\common\SSW\WS571\Secure\QMS\Docs\SOPs\Drafts\SOP_HYDR C3130_R0D10(DRAFT).doc
Figure 6 - Flow velocities Courtesy ADS Environmental
Professionally vetted and internationally accepted methods for calculating the average
velocity of liquid in a channel are covered in ISO-748, ISO-7178, ISO-8363, and ISO-9124,
all cited in Section G.
1.2.3. Portable V-meters
A single type of commercially available portable velocity meter is recommended for field
velocity measurement confirmation. The Marsh McBirney Flo-Mate™ Model 2000 is an
electromagnetic velocity meter that uses the Faraday principle to measure fluid velocities in
an area about the size of a baseball around the head of the instrument. However, the
instrument sometimes gets coated or fouled with non-conductive material such as oil or
grease and velocity readings artificially decrease. One solution to this problem is to
periodically send the instruments back to the factory to be recalibrated. An alternative
solution SPU can try is immersing a drifting Flo-Mate™ sensor in a laboratory-grade, bench-
top, ultrasonic bath overnight or over the weekend. Ultrasonic baths often clean the non-
conductive material off the sensors and bring the instruments back into specification. Of
course FloMate readings should be zeroed in still water before daily use.
When measuring flow velocities, be careful to keep the V-meter pointed directly upstream
and beware of placing the instrument too close to the sides of the pipe, which tends to
distort the magnetic field (Figures 7 and 8), see the FloMate manual. Special mounting rods
for the FloMate may need to be fabricated in order to allow the sensor head to swivel up and
down. Special mounting rods would allow field crews to insert the sensor head upstream
into smaller pipes and still maintain its level.
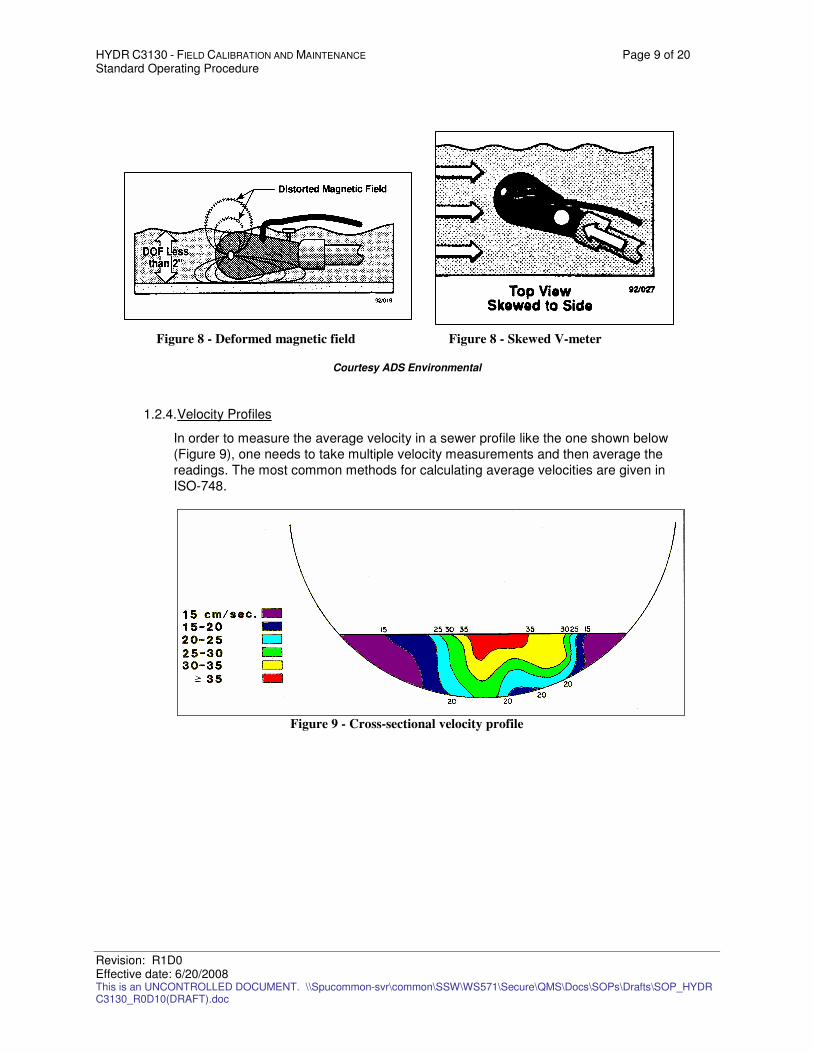
HYDR C3130 - FIELD CALIBRATION AND MAINTENANCE Page 9 of 20 Standard Operating Procedure
Revision: R1D0 Effective date: 6/20/2008 This is an UNCONTROLLED DOCUMENT. \\Spucommon-svr\common\SSW\WS571\Secure\QMS\Docs\SOPs\Drafts\SOP_HYDR C3130_R0D10(DRAFT).doc
Courtesy ADS Environmental
1.2.4. Velocity Profiles
In order to measure the average velocity in a sewer profile like the one shown below
(Figure 9), one needs to take multiple velocity measurements and then average the
readings. The most common methods for calculating average velocities are given in
ISO-748.
Figure 9 - Cross-sectional velocity profile
Figure 8 - Skewed V-meter
Figure 8 - Deformed magnetic field
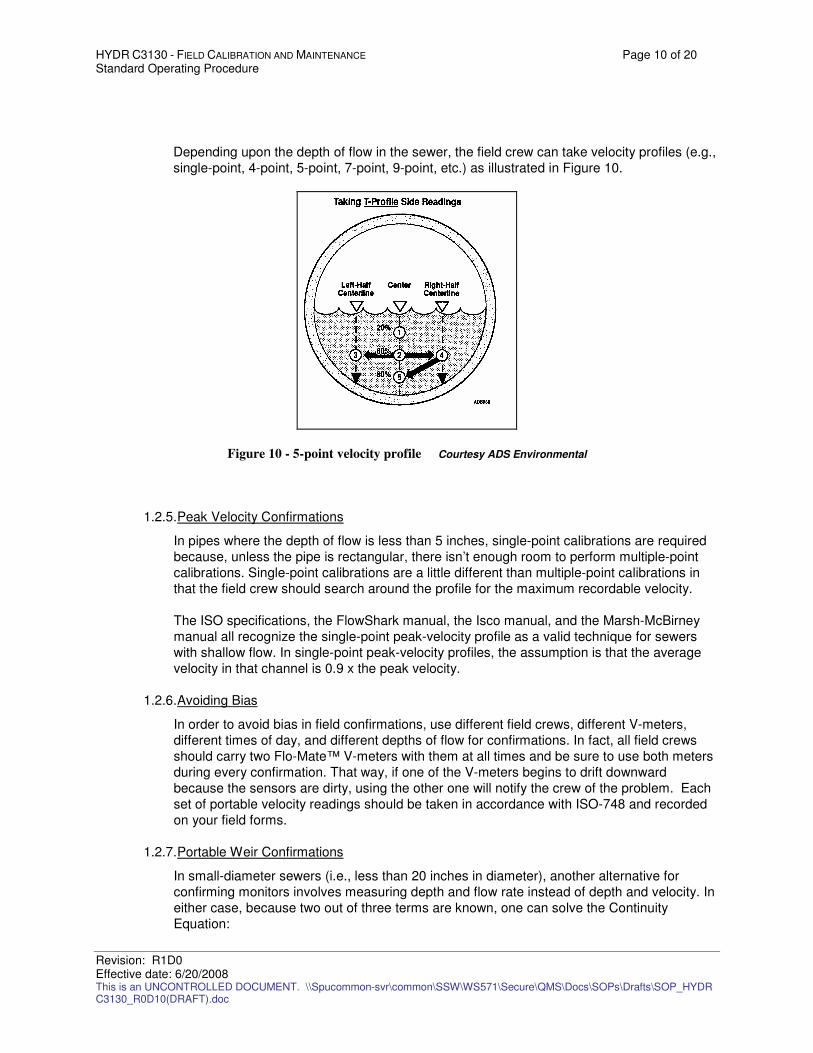
HYDR C3130 - FIELD CALIBRATION AND MAINTENANCE Page 10 of 20 Standard Operating Procedure
Revision: R1D0 Effective date: 6/20/2008 This is an UNCONTROLLED DOCUMENT. \\Spucommon-svr\common\SSW\WS571\Secure\QMS\Docs\SOPs\Drafts\SOP_HYDR C3130_R0D10(DRAFT).doc
Depending upon the depth of flow in the sewer, the field crew can take velocity profiles (e.g.,
single-point, 4-point, 5-point, 7-point, 9-point, etc.) as illustrated in Figure 10.
Figure 10 - 5-point velocity profile Courtesy ADS Environmental
1.2.5. Peak Velocity Confirmations
In pipes where the depth of flow is less than 5 inches, single-point calibrations are required
because, unless the pipe is rectangular, there isn’t enough room to perform multiple-point
calibrations. Single-point calibrations are a little different than multiple-point calibrations in
that the field crew should search around the profile for the maximum recordable velocity.
The ISO specifications, the FlowShark manual, the Isco manual, and the Marsh-McBirney
manual all recognize the single-point peak-velocity profile as a valid technique for sewers
with shallow flow. In single-point peak-velocity profiles, the assumption is that the average
velocity in that channel is 0.9 x the peak velocity.
1.2.6. Avoiding Bias
In order to avoid bias in field confirmations, use different field crews, different V-meters,
different times of day, and different depths of flow for confirmations. In fact, all field crews
should carry two Flo-Mate™ V-meters with them at all times and be sure to use both meters
during every confirmation. That way, if one of the V-meters begins to drift downward
because the sensors are dirty, using the other one will notify the crew of the problem. Each
set of portable velocity readings should be taken in accordance with ISO-748 and recorded
on your field forms.
1.2.7. Portable Weir Confirmations
In small-diameter sewers (i.e., less than 20 inches in diameter), another alternative for
confirming monitors involves measuring depth and flow rate instead of depth and velocity. In
either case, because two out of three terms are known, one can solve the Continuity
Equation:
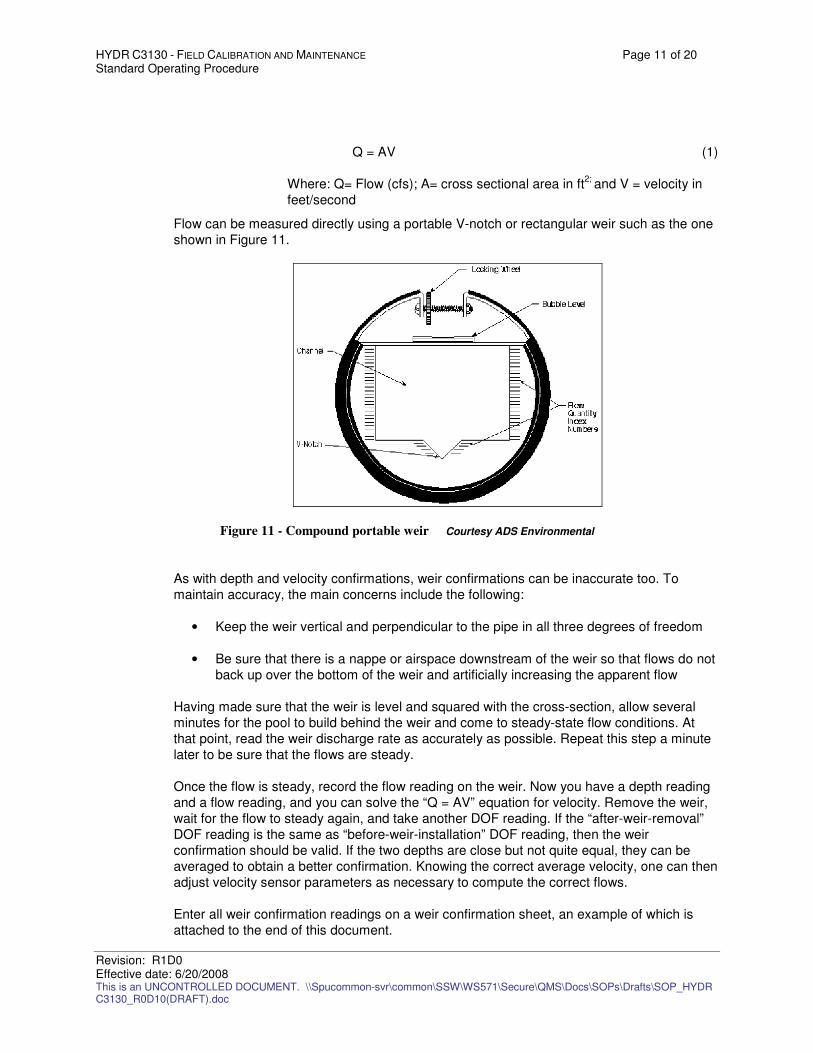
HYDR C3130 - FIELD CALIBRATION AND MAINTENANCE Page 11 of 20 Standard Operating Procedure
Revision: R1D0 Effective date: 6/20/2008 This is an UNCONTROLLED DOCUMENT. \\Spucommon-svr\common\SSW\WS571\Secure\QMS\Docs\SOPs\Drafts\SOP_HYDR C3130_R0D10(DRAFT).doc
Q = AV (1)
Where: Q= Flow (cfs); A= cross sectional area in ft2;
and V = velocity in
feet/second
Flow can be measured directly using a portable V-notch or rectangular weir such as the one
shown in Figure 11.
Figure 11 - Compound portable weir Courtesy ADS Environmental
As with depth and velocity confirmations, weir confirmations can be inaccurate too. To
maintain accuracy, the main concerns include the following:
• Keep the weir vertical and perpendicular to the pipe in all three degrees of freedom
• Be sure that there is a nappe or airspace downstream of the weir so that flows do not
back up over the bottom of the weir and artificially increasing the apparent flow
Having made sure that the weir is level and squared with the cross-section, allow several
minutes for the pool to build behind the weir and come to steady-state flow conditions. At
that point, read the weir discharge rate as accurately as possible. Repeat this step a minute
later to be sure that the flows are steady.
Once the flow is steady, record the flow reading on the weir. Now you have a depth reading
and a flow reading, and you can solve the “Q = AV” equation for velocity. Remove the weir,
wait for the flow to steady again, and take another DOF reading. If the “after-weir-removal”
DOF reading is the same as “before-weir-installation” DOF reading, then the weir
confirmation should be valid. If the two depths are close but not quite equal, they can be
averaged to obtain a better confirmation. Knowing the correct average velocity, one can then
adjust velocity sensor parameters as necessary to compute the correct flows.
Enter all weir confirmation readings on a weir confirmation sheet, an example of which is
attached to the end of this document.
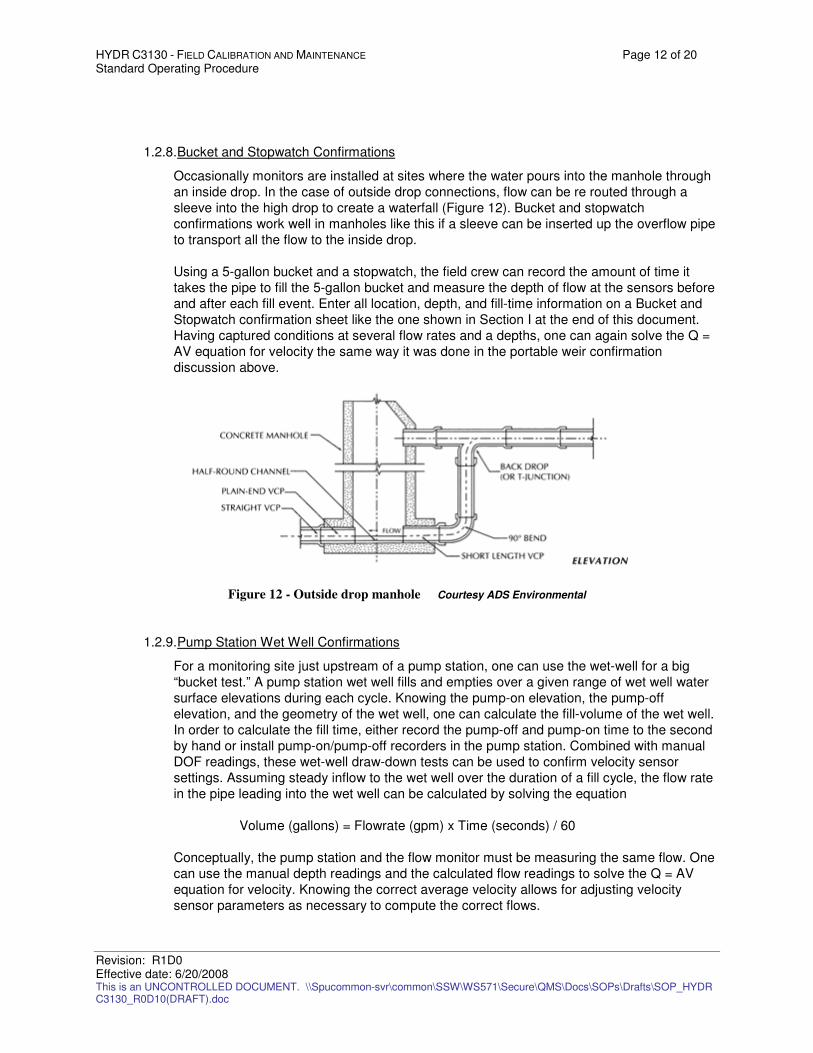
HYDR C3130 - FIELD CALIBRATION AND MAINTENANCE Page 12 of 20 Standard Operating Procedure
Revision: R1D0 Effective date: 6/20/2008 This is an UNCONTROLLED DOCUMENT. \\Spucommon-svr\common\SSW\WS571\Secure\QMS\Docs\SOPs\Drafts\SOP_HYDR C3130_R0D10(DRAFT).doc
1.2.8. Bucket and Stopwatch Confirmations
Occasionally monitors are installed at sites where the water pours into the manhole through
an inside drop. In the case of outside drop connections, flow can be re routed through a
sleeve into the high drop to create a waterfall (Figure 12). Bucket and stopwatch
confirmations work well in manholes like this if a sleeve can be inserted up the overflow pipe
to transport all the flow to the inside drop.
Using a 5-gallon bucket and a stopwatch, the field crew can record the amount of time it
takes the pipe to fill the 5-gallon bucket and measure the depth of flow at the sensors before
and after each fill event. Enter all location, depth, and fill-time information on a Bucket and
Stopwatch confirmation sheet like the one shown in Section I at the end of this document.
Having captured conditions at several flow rates and a depths, one can again solve the Q =
AV equation for velocity the same way it was done in the portable weir confirmation
discussion above.
Figure 12 - Outside drop manhole Courtesy ADS Environmental
1.2.9. Pump Station Wet Well Confirmations
For a monitoring site just upstream of a pump station, one can use the wet-well for a big
“bucket test.” A pump station wet well fills and empties over a given range of wet well water
surface elevations during each cycle. Knowing the pump-on elevation, the pump-off
elevation, and the geometry of the wet well, one can calculate the fill-volume of the wet well.
In order to calculate the fill time, either record the pump-off and pump-on time to the second
by hand or install pump-on/pump-off recorders in the pump station. Combined with manual
DOF readings, these wet-well draw-down tests can be used to confirm velocity sensor
settings. Assuming steady inflow to the wet well over the duration of a fill cycle, the flow rate
in the pipe leading into the wet well can be calculated by solving the equation
Volume (gallons) = Flowrate (gpm) x Time (seconds) / 60
Conceptually, the pump station and the flow monitor must be measuring the same flow. One
can use the manual depth readings and the calculated flow readings to solve the Q = AV
equation for velocity. Knowing the correct average velocity allows for adjusting velocity
sensor parameters as necessary to compute the correct flows.
HYDR C3130 - FIELD CALIBRATION AND MAINTENANCE Page 13 of 20 Standard Operating Procedure
Revision: R1D0 Effective date: 6/20/2008 This is an UNCONTROLLED DOCUMENT. \\Spucommon-svr\common\SSW\WS571\Secure\QMS\Docs\SOPs\Drafts\SOP_HYDR C3130_R0D10(DRAFT).doc
Enter all location, depth, and fill-time information on a Pump Station Wet Well confirmation
sheet like the one shown in Section I at the end of this document.
1.2.10. Parameter Settings
Each of the confirmation procedures discussed above (i.e., peak velocity, multi-point velocity
profile, weir, and bucket and stopwatch) are designed to manually determine the depth of
flow and the average velocity of the flow. The concept is to use the confirmation data to
properly adjust each sensor so that it reads actual depth or actual average velocity.
Each type of sensor requires its own parameter settings, and sometimes multiple parameter
settings. Rather than cloud the parameter setting issue, this SOP recommends referencing
the FlowShark manual or the Isco 2150 manual, referenced in Section G, for the most up-to-
date information on setting sensor parameters.
1.3. Frequency of Confirmations
Sensors should be reconfirmed whenever they drift off the mark. Some sensors, notably the quad
redundant ultrasonic depth sensor, are quite stable over time, while others, notably pressure sensors,
tend to drift more frequently. A good practice is to confirm sensors monthly soon after installation and
then, for sensors that remain stable over several months, back off to bimonthly confirmations for
several months. Some sensors may eventually become candidates for quarterly or even biannual
confirmations, while others may need to be confirmed weekly. Scatter graphs are good tools for
diagnosing sensor drift. Scatter graphs and other methods of diagnosing sensor problems are
discussed in much more detail in HYDR C3140, Field Inspections.
1.3.1. Hydraulic Changes
In addition to sensor drift, sometimes the flows at a site change because a brick, rock, or
other piece of debris becomes lodged downstream of the sensors, creating a backwater
pool. Most sewer obstructions are temporary, washing in or washing out during storm
events. In addition to debris, some pipes have a layer of silt on the bottom. Avoid monitoring
in silt sites wherever possible, but when it cannot be avoided; be sure to measure and re-
measure the depth of silt frequently, especially after rain events.
1.3.2. Silt Measurements
Silt depth measurement by hand is required to understand the portion of the pipe area that is
blocked.
1.4. Wrap-up Site
1.4.1. Batten Down the Monitor, Cables, and Sensors
Fast-moving water carrying gravel and rocks will destroy poorly installed sensors. Sensor
rings should be anchor bolted into place without any exposed lips or exposed sensors,
particularly in the upstream direction. Cables should be attached securely to the soffits of the
pipes and to the sides of the manholes or chambers with cable-ties and anchor bolts. Be
aware of any exposed leverage point that the water may have and eliminate or minimize
those points. Correct installation problems where they occur (Figure 13).
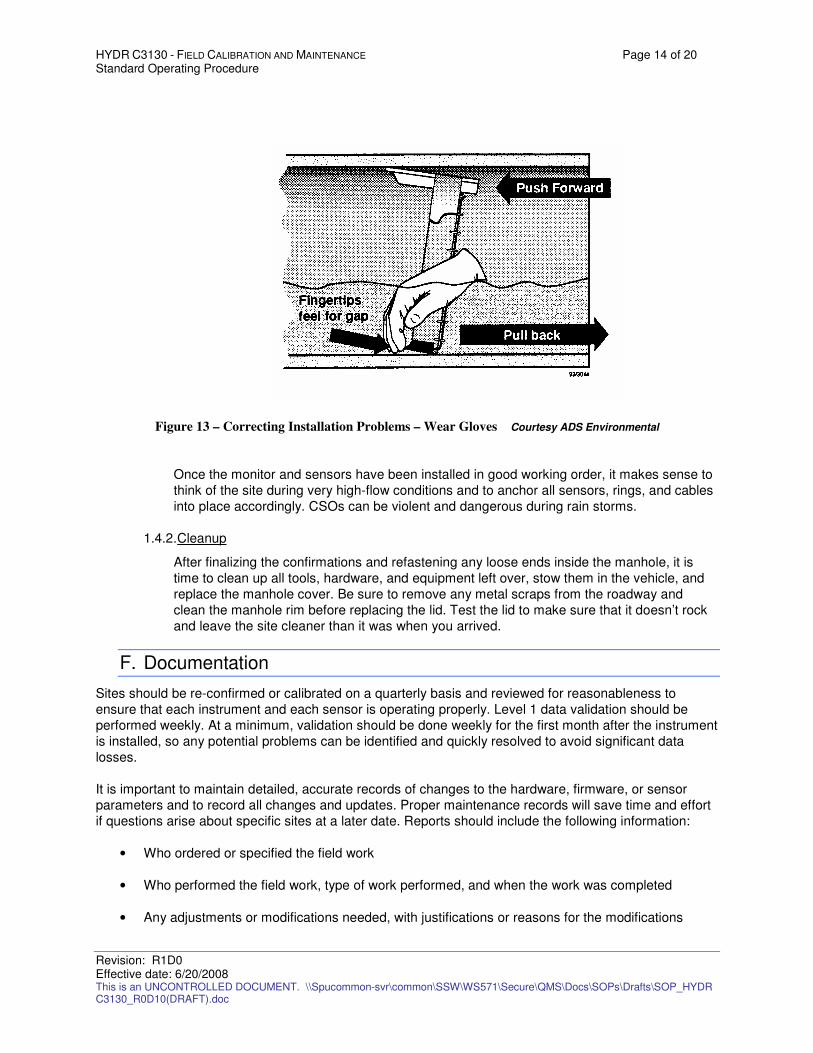
HYDR C3130 - FIELD CALIBRATION AND MAINTENANCE Page 14 of 20 Standard Operating Procedure
Revision: R1D0 Effective date: 6/20/2008 This is an UNCONTROLLED DOCUMENT. \\Spucommon-svr\common\SSW\WS571\Secure\QMS\Docs\SOPs\Drafts\SOP_HYDR C3130_R0D10(DRAFT).doc
Figure 13 – Correcting Installation Problems – Wear Gloves Courtesy ADS Environmental
Once the monitor and sensors have been installed in good working order, it makes sense to
think of the site during very high-flow conditions and to anchor all sensors, rings, and cables
into place accordingly. CSOs can be violent and dangerous during rain storms.
1.4.2. Cleanup
After finalizing the confirmations and refastening any loose ends inside the manhole, it is
time to clean up all tools, hardware, and equipment left over, stow them in the vehicle, and
replace the manhole cover. Be sure to remove any metal scraps from the roadway and
clean the manhole rim before replacing the lid. Test the lid to make sure that it doesn’t rock
and leave the site cleaner than it was when you arrived.
F. Documentation
Sites should be re-confirmed or calibrated on a quarterly basis and reviewed for reasonableness to
ensure that each instrument and each sensor is operating properly. Level 1 data validation should be
performed weekly. At a minimum, validation should be done weekly for the first month after the instrument
is installed, so any potential problems can be identified and quickly resolved to avoid significant data
losses.
It is important to maintain detailed, accurate records of changes to the hardware, firmware, or sensor
parameters and to record all changes and updates. Proper maintenance records will save time and effort
if questions arise about specific sites at a later date. Reports should include the following information:
• Who ordered or specified the field work
• Who performed the field work, type of work performed, and when the work was completed
• Any adjustments or modifications needed, with justifications or reasons for the modifications
HYDR C3130 - FIELD CALIBRATION AND MAINTENANCE Page 15 of 20 Standard Operating Procedure
Revision: R1D0 Effective date: 6/20/2008 This is an UNCONTROLLED DOCUMENT. \\Spucommon-svr\common\SSW\WS571\Secure\QMS\Docs\SOPs\Drafts\SOP_HYDR C3130_R0D10(DRAFT).doc
• Identification of lingering problems at the site, if any, when the field crew left
G. References
ISO-748: 1997(E), “Measurement of Liquid Flow in Open Channels – Velocity-area Methods,” Third
Edition 1997-08-01, International Standards Organization, Geneva, Switzerland.
ISO Technical Report 7178-1983(E), “Liquid Flow Measurements in Open Channels – Velocity-area
Methods – Investigation of Total Error,” 1983-07-01, Technical Committee ISO-113, International
Standards Organization, Geneva, Switzerland.
ISO Technical Report 8363:1997(E), “Measurements of Liquid Flow in Open Channels – General
Guidelines of Selection of Method,” First Edition 1997-09-01, International Standards
Organization, Geneva, Switzerland.
ISO Technical Report 9824-1:1990(E), “Measurement of Free Surface Flow in Closed Conduits,” First
Edition, 1990-05-15, International Standards Organization, Geneva, Switzerland.
Long Term Field Methods Manual, 1994, ADS Environmental Services, Inc.
Profile® Software Users Guide, October 2006, ADS Environmental Services, Inc.
ADS FlowShark™ Installation, Operation, and Maintenance Manual, February, 2007, ADS Environmental
Services, Inc.
Isco 2150 Area Velocity Flow Module and Sensor, 2004, Isco Inc.
Isco 2151 Area Velocity Flow Area Velocity Flow System, Installation and Operation Guide, Revision E,
2004, Isco Inc.
Isco, Flowlink® 5 Software Instruction Manual, April 18, 2005, Teledyne Isco.
H. List of Revisions
The current list of revisions for this SOP follows.
Revision
Number
Effective
Date
Review
Status
Revised by Revision Summary
3130-1 4/15/07 Draft Brady Fuller and
Peter
Keefe/CH2M HILL
Initial creation of outline
R0D6 5/10/2007 Draft OrsiC Compile SPU comments
R0D7 8/2/2007 Draft Shelly Basketfield Format edits.
HYDR C3130 - FIELD CALIBRATION AND MAINTENANCE Page 16 of 20 Standard Operating Procedure
Revision: R1D0 Effective date: 6/20/2008 This is an UNCONTROLLED DOCUMENT. \\Spucommon-svr\common\SSW\WS571\Secure\QMS\Docs\SOPs\Drafts\SOP_HYDR C3130_R0D10(DRAFT).doc
Revision
Number
Effective
Date
Review
Status
Revised by Revision Summary
R0D8 8/3/2007 Draft OrsiC Compiled SPU comments
R0D10 5/22/2008 Draft OrsiC Final edits to implement SOP
R1D0 6/20/2008 Approved OrsiC Final edits to implement SOP
I. Forms and Tables
Table 1. SPU Staff trained to validate operation of and data from flow monitors.
SPU Staff Branch Telephone Cell Phone Email Training Date
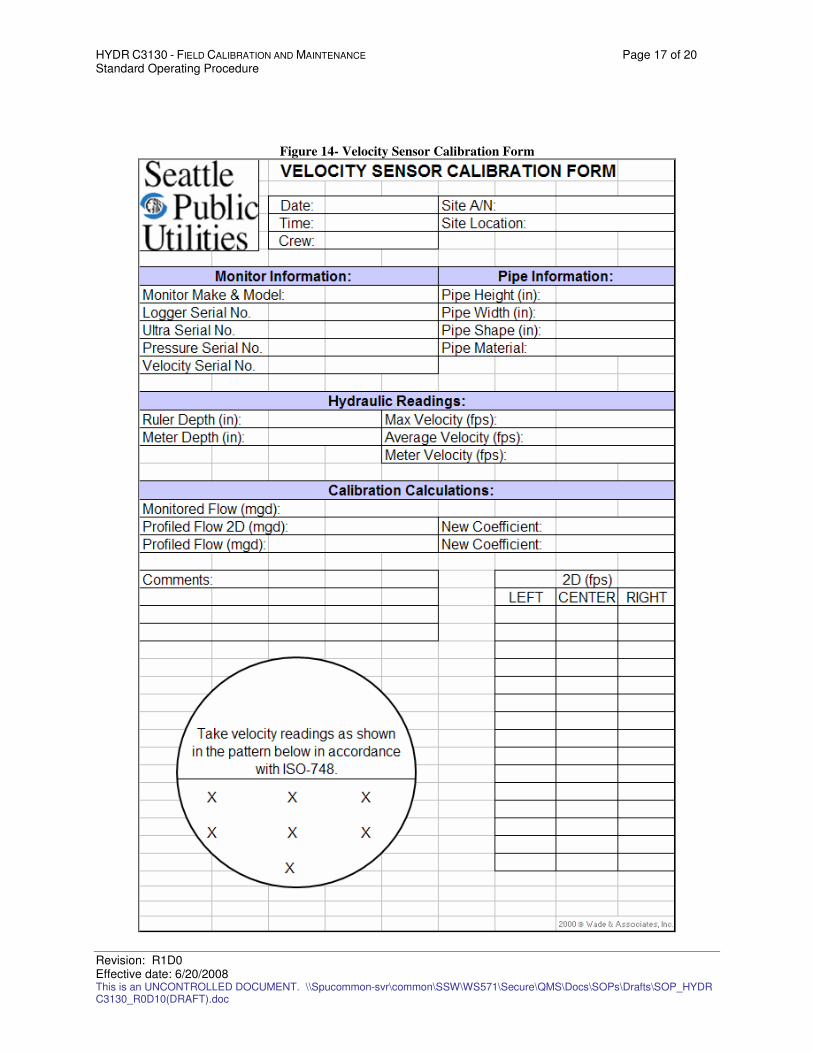
HYDR C3130 - FIELD CALIBRATION AND MAINTENANCE Page 17 of 20 Standard Operating Procedure
Revision: R1D0 Effective date: 6/20/2008 This is an UNCONTROLLED DOCUMENT. \\Spucommon-svr\common\SSW\WS571\Secure\QMS\Docs\SOPs\Drafts\SOP_HYDR C3130_R0D10(DRAFT).doc
Figure 14- Velocity Sensor Calibration Form
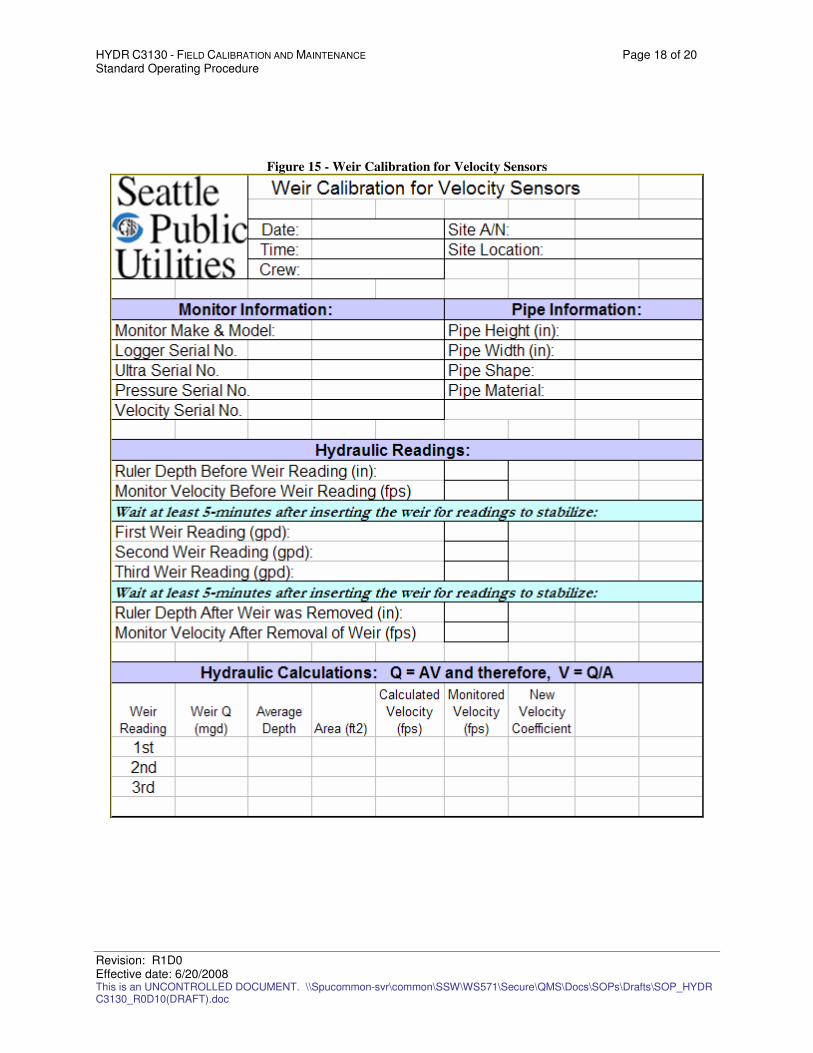
HYDR C3130 - FIELD CALIBRATION AND MAINTENANCE Page 18 of 20 Standard Operating Procedure
Revision: R1D0 Effective date: 6/20/2008 This is an UNCONTROLLED DOCUMENT. \\Spucommon-svr\common\SSW\WS571\Secure\QMS\Docs\SOPs\Drafts\SOP_HYDR C3130_R0D10(DRAFT).doc
Figure 15 - Weir Calibration for Velocity Sensors
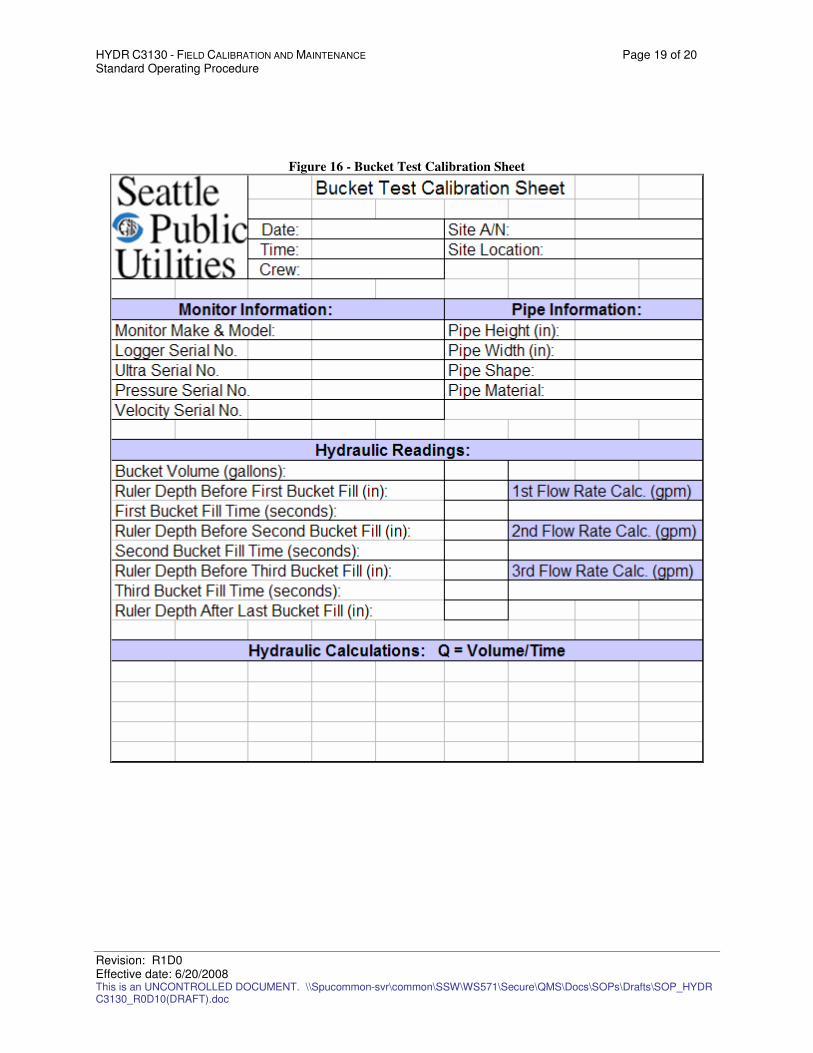
HYDR C3130 - FIELD CALIBRATION AND MAINTENANCE Page 19 of 20 Standard Operating Procedure
Revision: R1D0 Effective date: 6/20/2008 This is an UNCONTROLLED DOCUMENT. \\Spucommon-svr\common\SSW\WS571\Secure\QMS\Docs\SOPs\Drafts\SOP_HYDR C3130_R0D10(DRAFT).doc
Figure 16 - Bucket Test Calibration Sheet
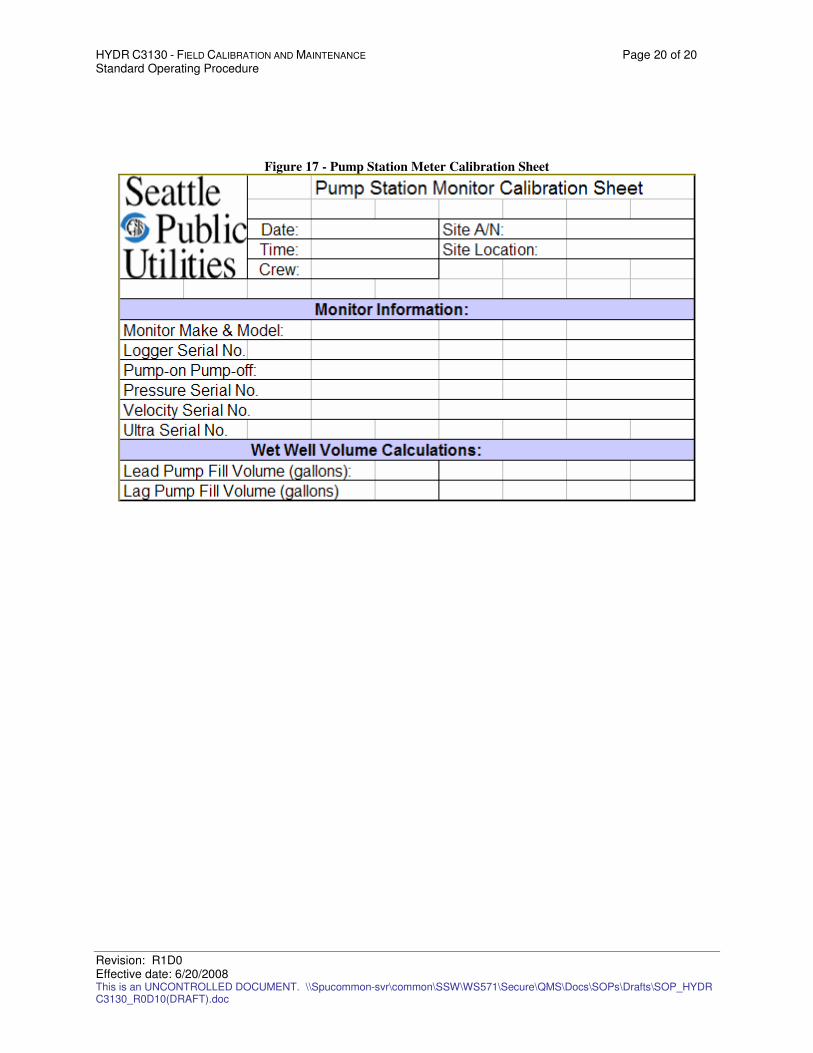
HYDR C3130 - FIELD CALIBRATION AND MAINTENANCE Page 20 of 20 Standard Operating Procedure
Revision: R1D0 Effective date: 6/20/2008 This is an UNCONTROLLED DOCUMENT. \\Spucommon-svr\common\SSW\WS571\Secure\QMS\Docs\SOPs\Drafts\SOP_HYDR C3130_R0D10(DRAFT).doc
Figure 17 - Pump Station Meter Calibration Sheet
Identifier:
HYDR C3120
Revision:
R1D0
Effective date:
6/20/2008
Custodian:
Hai Bach
Authorization Authority:
Quality Assurance Facilitator (TBD)
Sewer Flow Monitoring
Standard Operating Procedure
HYDR C3120 - Equipment Installation
Seattle Public Utilities
Seattle , Washington
This document is part of the Science Information Quality System and describes standard operating procedures to help ensure that a systematic, consistent approach is followed for collecting, assessing, and documenting environmental data of known and documented quality.
HYDR C3120 - EQUIPMENT INSTALLATION PAGE II OF 13 STANDARD OPERATING PROCEDURE
Revision: R1D0 Effective date: 6/20/2008 This is an UNCONTROLLED DOCUMENT. \\Spucommon-svr\common\SSW\WS571\Secure\QMS\Docs\SOPs\Drafts\SOP_HYDR C3120_R0D4(DRAFT).doc
Table of Contents A. HYDR C3100 – Piped Flow Gravity – Introduction, Scope, and Applicability ....................................................3 B. Training .............................................................................................................................................................3 C. General Considerations.....................................................................................................................................3 D. Equipment and Supplies ...................................................................................................................................4 E. Procedures........................................................................................................................................................4 1. Monitor and Sensor Installation.........................................................................................................................4
1.1. Gather Information Generated in C3110 – Piped Flow Gravity......................................................................4 1.2. Gather Equipment..........................................................................................................................................4 1.3. Activate the Monitors .....................................................................................................................................4 1.4. Sensor Placement and Preference................................................................................................................4
1.4.1. Sensor Ring............................................................................................................................................5 1.4.2. Physical Offset........................................................................................................................................5 1.4.3. Ultrasonic Depth .....................................................................................................................................6 1.4.4. Pressure Depth.......................................................................................................................................6 1.4.5. Pipe Height and Flow Depth...................................................................................................................7 1.4.6. Measuring Silt Depth ..............................................................................................................................8 1.4.7. Pipe Width ..............................................................................................................................................9
1.5. Field Measurements of Pipe Geometry .........................................................................................................9 1.5.1. Shape .....................................................................................................................................................9 1.5.2. Additional Measurements .......................................................................................................................9 1.5.3. Weirs and Overflows ............................................................................................................................10
1.6. Loading Site Data into Monitor ....................................................................................................................11 2. High Degree of Difficulty..................................................................................................................................11 F. Records and Documentation...........................................................................................................................11 G. References......................................................................................................................................................11 H. List of Revisions ..............................................................................................................................................13 I. Tables, Forms, and Figures ............................................................................................................................13
List of Figures
Figure 1 – U, P, and V sensor locations – silt contingency Courtesy ADS Environmental...................................5 Figure 2 - Ultrasonic depth sensor Courtesy ADS Environmental....................................................................6 Figure 5 - The art of measuring depth Courtesy ADS Environmental .............................................................8 Figure 6 - Measuring silt depth (Wear Gloves) Courtesy ADS Environmental ................................................8 Figure 7 - Horseshoe shaped pipe ............................................................................................................................9 Figure 8a – Odd Overflow Weir (SPU CSO #26)..................................................................................................10 Figure 9b – Traditional Overflow Weir (SPU CSO #141).....................................................................................10 Figure 10 - Drawdown ...........................................................................................................................................11
HYDR C3120 - EQUIPMENT INSTALLATION PAGE 3 OF 13 STANDARD OPERATING PROCEDURE
Revision: R1D0 Effective date: 6/20/2008 This is an UNCONTROLLED DOCUMENT. \\Spucommon-svr\common\SSW\WS571\Secure\QMS\Docs\SOPs\Drafts\SOP_HYDR C3120_R0D4(DRAFT).doc
Sewer Flow Monitoring
HYDR C3120 - Equipment Installation
See also the following Standard Operating Procedures:
HYDR C1000 – General (Field Planning & Mobilization, Field Decontamination)
HYDR C2000 – Open Channel Flow
HYDR C2010 – Equipment & Site Selection
HYDR C2020 – Equipment Installation
HYDR C2030 – Field Calibrations and Maintenance
HYDR C2040 – Field Inspections
A. HYDR C3100 – Piped Flow Gravity – Introduction, Scope, and Applicability
This Standard Operating Procedure (SOP) presents procedures for installing FlowShark or Isco flow monitors in
pipes so that they have the best chance of collecting the most accurate data possible. SPU operates and maintains
a network of ADS® FlowShark™ sewer flow monitors in its sanitary and combined sewer systems. Isco monitors
are deployed at other locations. In order to calculate flows, the monitors measure the depth and velocity of the flow
in the cross-section of the pipe in which the sensors are mounted. Depth and velocity measurements are used to
calculate flows, as described in this SOP. These procedures are applicable to pipes of any size and shape,
assuming that sensors can be installed and operated properly.
The techniques described in this SOP are based on information found in the FlowShark Manual; the 2151 Area
Velocity Flow Area Velocity Flow System, Installation and Operation Guide; and the Long Term Field Methods
Manual, all referenced in Section G of this document. This SOP has been applied to flow monitor data collected
since 2007.
B. Training
Qualifications for this work are specialized. The job requires intelligent people who understand open-channel flow
hydraulics and the difficulties of measuring them precisely, who have good mechanical and electronic skills, and
who don’t mind getting dirty sorting out problems in the field. In order for equipment installation to be successful,
the senior member of the field crew needs to enter the manholes, not the junior member(s). The only exception to
this is when a junior member of a field crew has demonstrated interest and knowledge about flow monitoring
requirements and has sufficient experience to make good hydraulic observations and judgments. The senior crew
member should always check the junior members’ work, in person, by going down into the manholes. The
procedures described in this SOP are for use only by personnel who have received specific training and
demonstrated a significant level of competency. Documentation of training will be kept on file and be readily
available for review.
C. General Considerations
Flow monitoring locations in sewers are potentially dangerous. High flows, poisonous or suffocating gases, and a
dirty, corrosive environment await sewer workers. Sewers are defined by OSHA as confined spaces; therefore,
people servicing or inspecting them will require SPU confined-space training and certification or private confined-
space training that is acceptable to SPU. Refer to the SPU “Safety Policy & Procedures in Confined Space Entry,”
cited in Section G, for local safety requirements. Also, in order to protect topside attendants, pedestrians, cyclists,
and drivers in roadways or rights of way, refer to “Traffic Control Manual for In-Street Work,” also cited in Section G.
HYDR C3120 - EQUIPMENT INSTALLATION PAGE 4 OF 13 STANDARD OPERATING PROCEDURE
Revision: R1D0 Effective date: 6/20/2008 This is an UNCONTROLLED DOCUMENT. \\Spucommon-svr\common\SSW\WS571\Secure\QMS\Docs\SOPs\Drafts\SOP_HYDR C3120_R0D4(DRAFT).doc
Properly installing flow monitors and sensors so that they can collect accurate, reliable sewer flow data is often
difficult and sometimes dangerous. This SOP is intended to provide procedural guidance for monitor and sensor
installation in order to help maximize the SPU capture of the best possible flow monitoring data from every site.
D. Equipment and Supplies
The equipment installation procedure requires confined-space entry training, equipment, and certification. It also
may require ADS FlowShark™ or Isco monitors, sensors, mounting equipment, hardware, tools, and supplies to
properly install FlowShark™ monitors and sensors. Activating the monitors will require either ADS Profile™
Software or Isco Flowlink® software.
E. Procedures
Procedures for flow monitoring include general site selection (mapping), specific site selection in the field, monitor
installation, sensor calibration and confirmation, monitor maintenance, data collection, data processing, data
QA/QC, troubleshooting data and monitor problems, data verification, data archiving, data retrieval, and data
sharing. This section provides guidance for the installation of flow monitors and sensors.
1. MONITOR AND SENSOR INSTALLATION
1.1. Gather Information Generated in C3110 – Piped Flow Gravity
For all the sites where you want to install flow meters, gather the site sheets and create location information
files on the field computers or, in the case of Isco monitors, create site info files. The location information files
for each site should include parameters such as location name, monitor serial number, phone number or IP
address, monitor communication ports, and others. See ADS Profile User’s Manual, Chapter 2, for a complete
list of parameters and procedures needed to set up, install, activate, and confirm a flow monitor. For Isco
monitors, the site info files should include all the physical parameters and monitor module parameters listed in
Section 3 of the 2151 Manual.
1.2. Gather Equipment
Tools needed for this work include the site sheets (described in C3110), field computers, confined-space entry
equipment, fully stocked field vehicles, communication cables, sensor rings, power tools, hand tools, and the
hardware, equipment, and appropriate measuring devices needed to properly install a flow monitor in the field.
For a more complete list of parts needed, see the ADS FlowShark Manual, Chapter 3 and Chapter 10; for Isco
monitors, see the 2151 Manual, Sections 2 and 3.
1.3. Activate the Monitors
Monitors can be activated either in the office or in the field. The advantage to activating monitors in the office
can be that the data analysts, familiar with all aspects of the software, may be more experienced than field
people in completing the set-up requirements properly. The advantage to activating the monitors in the field is
that you have all the necessary information about physical set-up parameters at your fingertips. Activate your
monitors where you feel most comfortable that you’ll get the set-up right. For ADS FlowShark monitors, consult
Chapter 6, Configuration and Activation, in the FlowShark Manual. For Isco monitors, consult Section 3,
Programming, in the 2151 Manual.
1.4. Sensor Placement and Preference
Multiple-sensor installations at a given site are always preferable to single-sensor installations. The ability to
separate pressure and velocity sensors comes in quite handy at Sanitary Sewer Overflows (SSOs) and
Combined Sewer Overflows (CSOs). Multiple-sensor installations are a little more time consuming to set up,
but they provide better, more complete data that are easier to interpret and evaluate than single-sensor
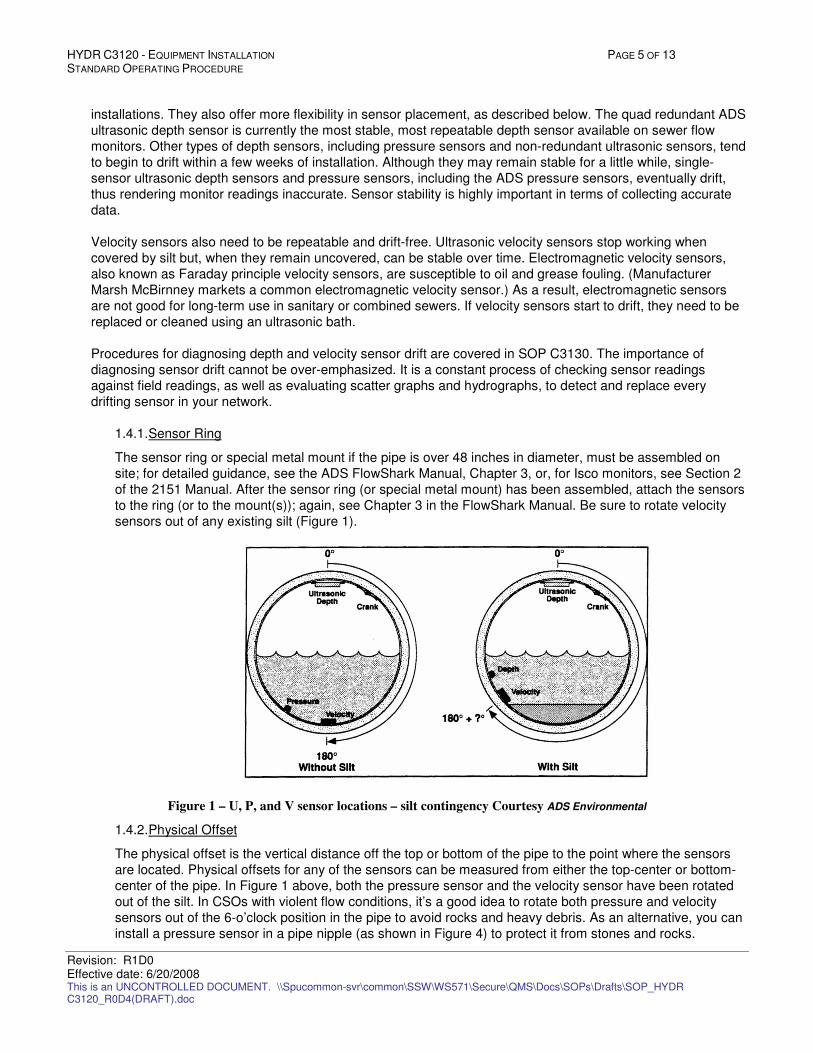
HYDR C3120 - EQUIPMENT INSTALLATION PAGE 5 OF 13 STANDARD OPERATING PROCEDURE
Revision: R1D0 Effective date: 6/20/2008 This is an UNCONTROLLED DOCUMENT. \\Spucommon-svr\common\SSW\WS571\Secure\QMS\Docs\SOPs\Drafts\SOP_HYDR C3120_R0D4(DRAFT).doc
installations. They also offer more flexibility in sensor placement, as described below. The quad redundant ADS
ultrasonic depth sensor is currently the most stable, most repeatable depth sensor available on sewer flow
monitors. Other types of depth sensors, including pressure sensors and non-redundant ultrasonic sensors, tend
to begin to drift within a few weeks of installation. Although they may remain stable for a little while, single-
sensor ultrasonic depth sensors and pressure sensors, including the ADS pressure sensors, eventually drift,
thus rendering monitor readings inaccurate. Sensor stability is highly important in terms of collecting accurate
data.
Velocity sensors also need to be repeatable and drift-free. Ultrasonic velocity sensors stop working when
covered by silt but, when they remain uncovered, can be stable over time. Electromagnetic velocity sensors,
also known as Faraday principle velocity sensors, are susceptible to oil and grease fouling. (Manufacturer
Marsh McBirnney markets a common electromagnetic velocity sensor.) As a result, electromagnetic sensors
are not good for long-term use in sanitary or combined sewers. If velocity sensors start to drift, they need to be
replaced or cleaned using an ultrasonic bath.
Procedures for diagnosing depth and velocity sensor drift are covered in SOP C3130. The importance of
diagnosing sensor drift cannot be over-emphasized. It is a constant process of checking sensor readings
against field readings, as well as evaluating scatter graphs and hydrographs, to detect and replace every
drifting sensor in your network.
1.4.1. Sensor Ring
The sensor ring or special metal mount if the pipe is over 48 inches in diameter, must be assembled on
site; for detailed guidance, see the ADS FlowShark Manual, Chapter 3, or, for Isco monitors, see Section 2
of the 2151 Manual. After the sensor ring (or special metal mount) has been assembled, attach the sensors
to the ring (or to the mount(s)); again, see Chapter 3 in the FlowShark Manual. Be sure to rotate velocity
sensors out of any existing silt (Figure 1).
Figure 1 – U, P, and V sensor locations – silt contingency Courtesy ADS Environmental
1.4.2. Physical Offset
The physical offset is the vertical distance off the top or bottom of the pipe to the point where the sensors
are located. Physical offsets for any of the sensors can be measured from either the top-center or bottom-
center of the pipe. In Figure 1 above, both the pressure sensor and the velocity sensor have been rotated
out of the silt. In CSOs with violent flow conditions, it’s a good idea to rotate both pressure and velocity
sensors out of the 6-o’clock position in the pipe to avoid rocks and heavy debris. As an alternative, you can
install a pressure sensor in a pipe nipple (as shown in Figure 4) to protect it from stones and rocks.
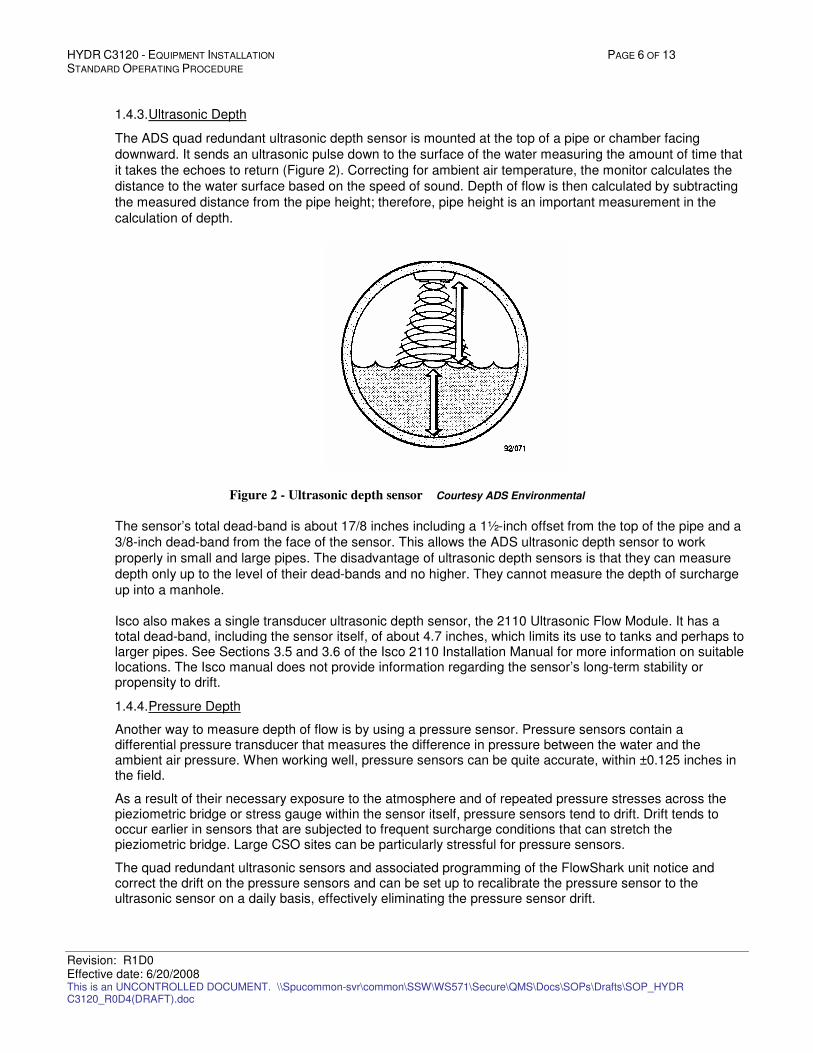
HYDR C3120 - EQUIPMENT INSTALLATION PAGE 6 OF 13 STANDARD OPERATING PROCEDURE
Revision: R1D0 Effective date: 6/20/2008 This is an UNCONTROLLED DOCUMENT. \\Spucommon-svr\common\SSW\WS571\Secure\QMS\Docs\SOPs\Drafts\SOP_HYDR C3120_R0D4(DRAFT).doc
1.4.3. Ultrasonic Depth
The ADS quad redundant ultrasonic depth sensor is mounted at the top of a pipe or chamber facing
downward. It sends an ultrasonic pulse down to the surface of the water measuring the amount of time that
it takes the echoes to return (Figure 2). Correcting for ambient air temperature, the monitor calculates the
distance to the water surface based on the speed of sound. Depth of flow is then calculated by subtracting
the measured distance from the pipe height; therefore, pipe height is an important measurement in the
calculation of depth.
Figure 2 - Ultrasonic depth sensor Courtesy ADS Environmental
The sensor’s total dead-band is about 17/8 inches including a 1½-inch offset from the top of the pipe and a
3/8-inch dead-band from the face of the sensor. This allows the ADS ultrasonic depth sensor to work
properly in small and large pipes. The disadvantage of ultrasonic depth sensors is that they can measure
depth only up to the level of their dead-bands and no higher. They cannot measure the depth of surcharge
up into a manhole.
Isco also makes a single transducer ultrasonic depth sensor, the 2110 Ultrasonic Flow Module. It has a total dead-band, including the sensor itself, of about 4.7 inches, which limits its use to tanks and perhaps to larger pipes. See Sections 3.5 and 3.6 of the Isco 2110 Installation Manual for more information on suitable locations. The Isco manual does not provide information regarding the sensor’s long-term stability or propensity to drift.
1.4.4. Pressure Depth
Another way to measure depth of flow is by using a pressure sensor. Pressure sensors contain a differential pressure transducer that measures the difference in pressure between the water and the ambient air pressure. When working well, pressure sensors can be quite accurate, within ±0.125 inches in the field.
As a result of their necessary exposure to the atmosphere and of repeated pressure stresses across the pieziometric bridge or stress gauge within the sensor itself, pressure sensors tend to drift. Drift tends to occur earlier in sensors that are subjected to frequent surcharge conditions that can stretch the pieziometric bridge. Large CSO sites can be particularly stressful for pressure sensors.
The quad redundant ultrasonic sensors and associated programming of the FlowShark unit notice and correct the drift on the pressure sensors and can be set up to recalibrate the pressure sensor to the ultrasonic sensor on a daily basis, effectively eliminating the pressure sensor drift.
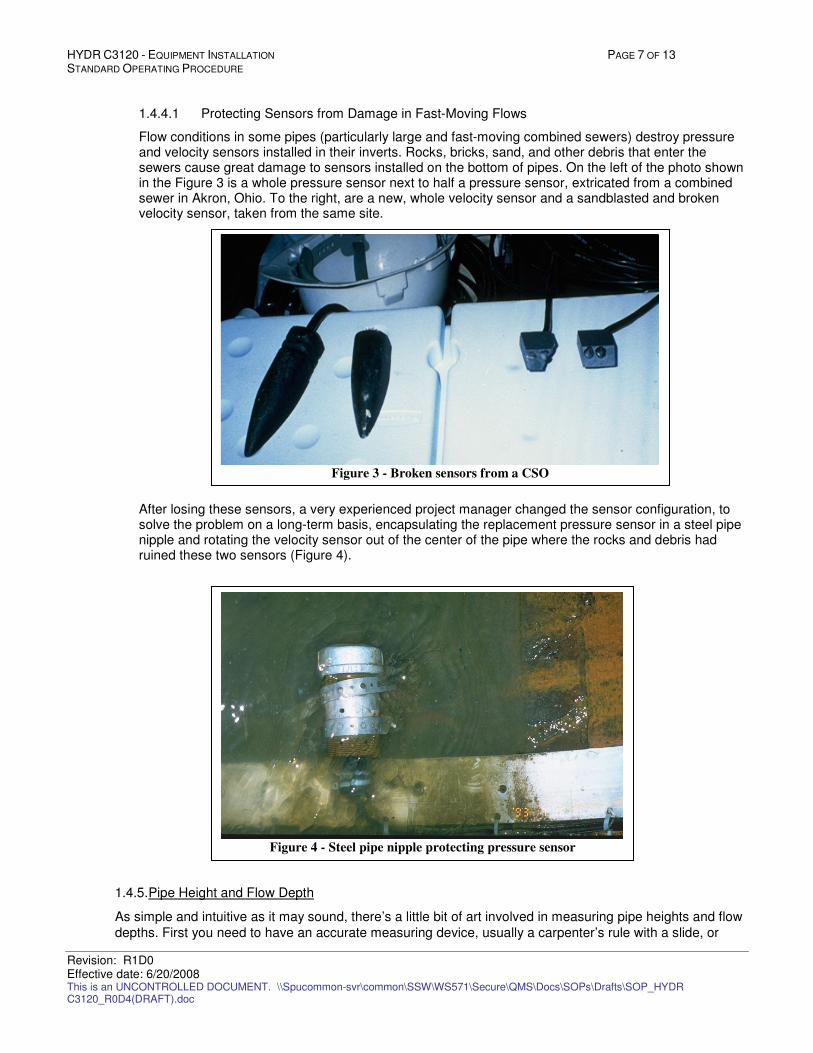
HYDR C3120 - EQUIPMENT INSTALLATION PAGE 7 OF 13 STANDARD OPERATING PROCEDURE
Revision: R1D0 Effective date: 6/20/2008 This is an UNCONTROLLED DOCUMENT. \\Spucommon-svr\common\SSW\WS571\Secure\QMS\Docs\SOPs\Drafts\SOP_HYDR C3120_R0D4(DRAFT).doc
1.4.4.1 Protecting Sensors from Damage in Fast-Moving Flows
Flow conditions in some pipes (particularly large and fast-moving combined sewers) destroy pressure and velocity sensors installed in their inverts. Rocks, bricks, sand, and other debris that enter the sewers cause great damage to sensors installed on the bottom of pipes. On the left of the photo shown in the Figure 3 is a whole pressure sensor next to half a pressure sensor, extricated from a combined sewer in Akron, Ohio. To the right, are a new, whole velocity sensor and a sandblasted and broken velocity sensor, taken from the same site.
After losing these sensors, a very experienced project manager changed the sensor configuration, to solve the problem on a long-term basis, encapsulating the replacement pressure sensor in a steel pipe nipple and rotating the velocity sensor out of the center of the pipe where the rocks and debris had ruined these two sensors (Figure 4).
1.4.5. Pipe Height and Flow Depth
As simple and intuitive as it may sound, there’s a little bit of art involved in measuring pipe heights and flow
depths. First you need to have an accurate measuring device, usually a carpenter’s rule with a slide, or
Figure 4 - Steel pipe nipple protecting pressure sensor
Figure 3 - Broken sensors from a CSO
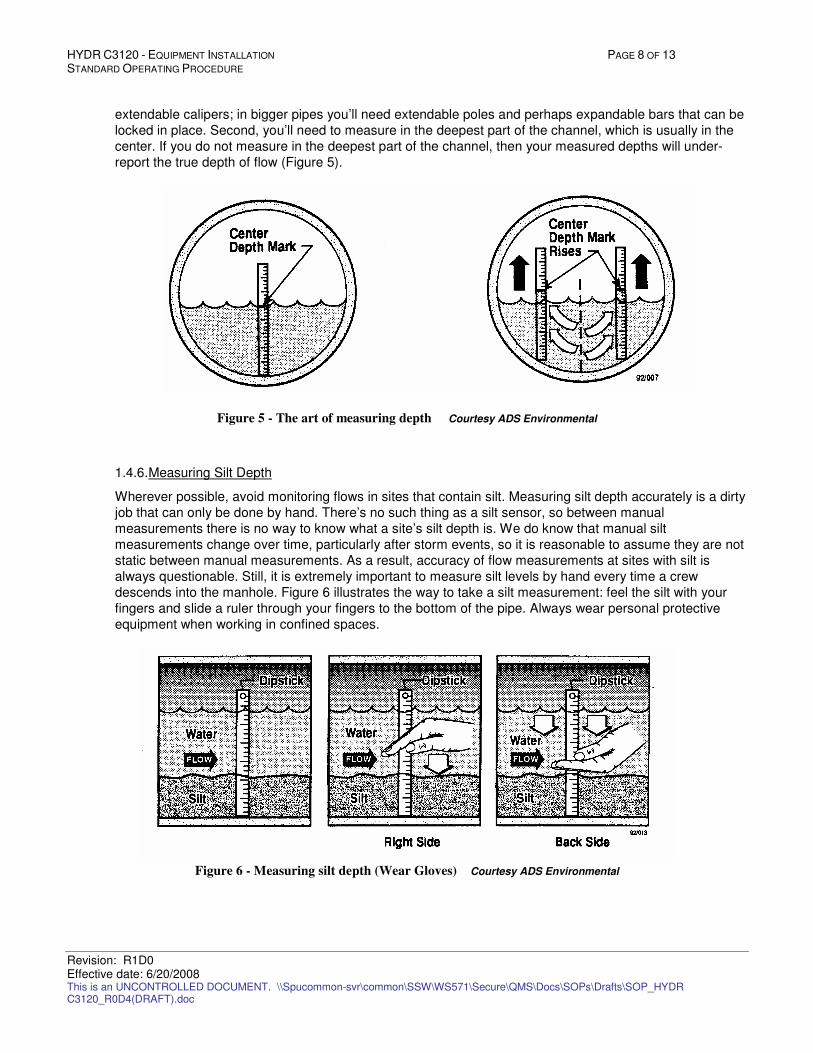
HYDR C3120 - EQUIPMENT INSTALLATION PAGE 8 OF 13 STANDARD OPERATING PROCEDURE
Revision: R1D0 Effective date: 6/20/2008 This is an UNCONTROLLED DOCUMENT. \\Spucommon-svr\common\SSW\WS571\Secure\QMS\Docs\SOPs\Drafts\SOP_HYDR C3120_R0D4(DRAFT).doc
extendable calipers; in bigger pipes you’ll need extendable poles and perhaps expandable bars that can be
locked in place. Second, you’ll need to measure in the deepest part of the channel, which is usually in the
center. If you do not measure in the deepest part of the channel, then your measured depths will under-
report the true depth of flow (Figure 5).
Figure 5 - The art of measuring depth Courtesy ADS Environmental
1.4.6. Measuring Silt Depth
Wherever possible, avoid monitoring flows in sites that contain silt. Measuring silt depth accurately is a dirty
job that can only be done by hand. There’s no such thing as a silt sensor, so between manual
measurements there is no way to know what a site’s silt depth is. We do know that manual silt
measurements change over time, particularly after storm events, so it is reasonable to assume they are not
static between manual measurements. As a result, accuracy of flow measurements at sites with silt is
always questionable. Still, it is extremely important to measure silt levels by hand every time a crew
descends into the manhole. Figure 6 illustrates the way to take a silt measurement: feel the silt with your
fingers and slide a ruler through your fingers to the bottom of the pipe. Always wear personal protective
equipment when working in confined spaces.
Figure 6 - Measuring silt depth (Wear Gloves) Courtesy ADS Environmental
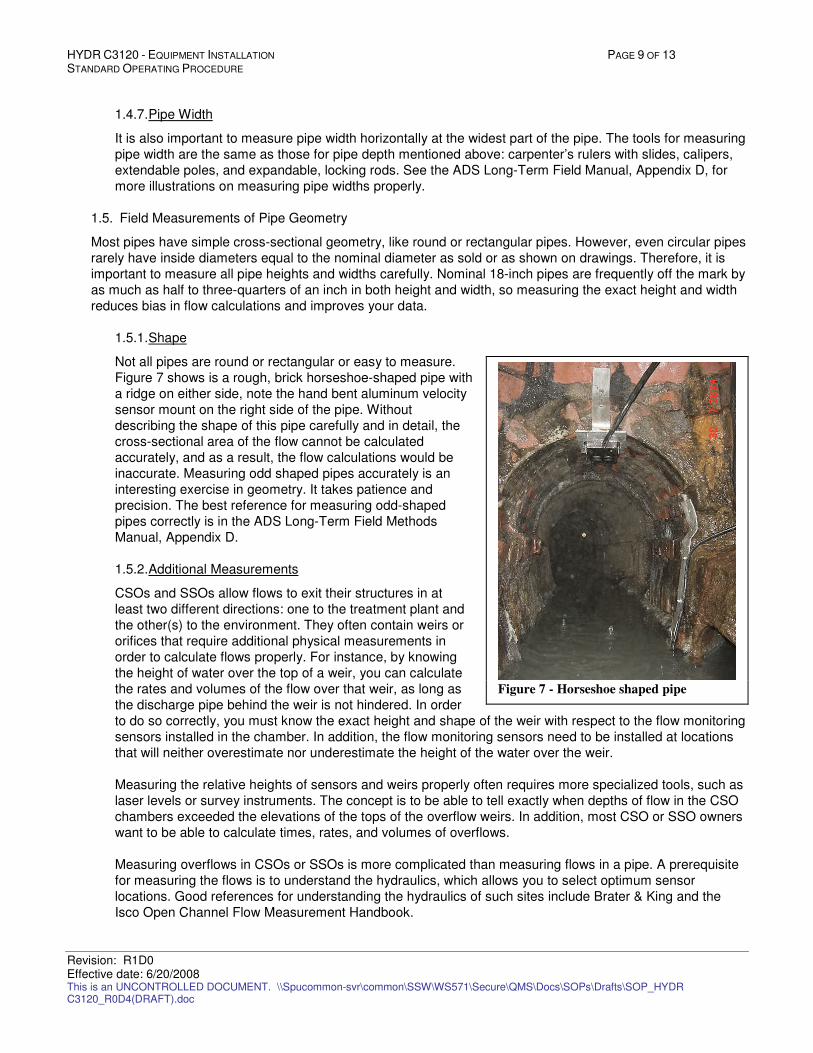
HYDR C3120 - EQUIPMENT INSTALLATION PAGE 9 OF 13 STANDARD OPERATING PROCEDURE
Revision: R1D0 Effective date: 6/20/2008 This is an UNCONTROLLED DOCUMENT. \\Spucommon-svr\common\SSW\WS571\Secure\QMS\Docs\SOPs\Drafts\SOP_HYDR C3120_R0D4(DRAFT).doc
1.4.7. Pipe Width
It is also important to measure pipe width horizontally at the widest part of the pipe. The tools for measuring
pipe width are the same as those for pipe depth mentioned above: carpenter’s rulers with slides, calipers,
extendable poles, and expandable, locking rods. See the ADS Long-Term Field Manual, Appendix D, for
more illustrations on measuring pipe widths properly.
1.5. Field Measurements of Pipe Geometry
Most pipes have simple cross-sectional geometry, like round or rectangular pipes. However, even circular pipes
rarely have inside diameters equal to the nominal diameter as sold or as shown on drawings. Therefore, it is
important to measure all pipe heights and widths carefully. Nominal 18-inch pipes are frequently off the mark by
as much as half to three-quarters of an inch in both height and width, so measuring the exact height and width
reduces bias in flow calculations and improves your data.
1.5.1. Shape
Not all pipes are round or rectangular or easy to measure.
Figure 7 shows is a rough, brick horseshoe-shaped pipe with
a ridge on either side, note the hand bent aluminum velocity
sensor mount on the right side of the pipe. Without
describing the shape of this pipe carefully and in detail, the
cross-sectional area of the flow cannot be calculated
accurately, and as a result, the flow calculations would be
inaccurate. Measuring odd shaped pipes accurately is an
interesting exercise in geometry. It takes patience and
precision. The best reference for measuring odd-shaped
pipes correctly is in the ADS Long-Term Field Methods
Manual, Appendix D.
1.5.2. Additional Measurements
CSOs and SSOs allow flows to exit their structures in at
least two different directions: one to the treatment plant and
the other(s) to the environment. They often contain weirs or
orifices that require additional physical measurements in
order to calculate flows properly. For instance, by knowing
the height of water over the top of a weir, you can calculate
the rates and volumes of the flow over that weir, as long as
the discharge pipe behind the weir is not hindered. In order
to do so correctly, you must know the exact height and shape of the weir with respect to the flow monitoring
sensors installed in the chamber. In addition, the flow monitoring sensors need to be installed at locations
that will neither overestimate nor underestimate the height of the water over the weir.
Measuring the relative heights of sensors and weirs properly often requires more specialized tools, such as
laser levels or survey instruments. The concept is to be able to tell exactly when depths of flow in the CSO
chambers exceeded the elevations of the tops of the overflow weirs. In addition, most CSO or SSO owners
want to be able to calculate times, rates, and volumes of overflows.
Measuring overflows in CSOs or SSOs is more complicated than measuring flows in a pipe. A prerequisite
for measuring the flows is to understand the hydraulics, which allows you to select optimum sensor
locations. Good references for understanding the hydraulics of such sites include Brater & King and the
Isco Open Channel Flow Measurement Handbook.
Figure 7 - Horseshoe shaped pipe
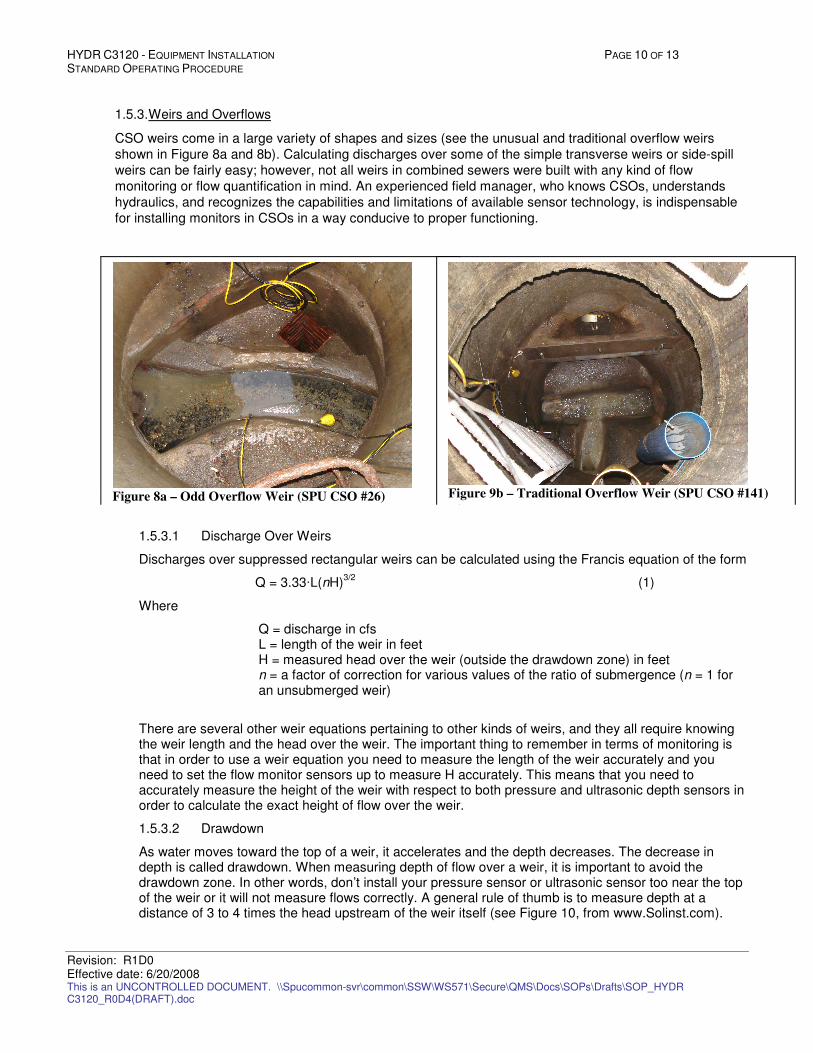
HYDR C3120 - EQUIPMENT INSTALLATION PAGE 10 OF 13 STANDARD OPERATING PROCEDURE
Revision: R1D0 Effective date: 6/20/2008 This is an UNCONTROLLED DOCUMENT. \\Spucommon-svr\common\SSW\WS571\Secure\QMS\Docs\SOPs\Drafts\SOP_HYDR C3120_R0D4(DRAFT).doc
1.5.3. Weirs and Overflows
CSO weirs come in a large variety of shapes and sizes (see the unusual and traditional overflow weirs
shown in Figure 8a and 8b). Calculating discharges over some of the simple transverse weirs or side-spill
weirs can be fairly easy; however, not all weirs in combined sewers were built with any kind of flow
monitoring or flow quantification in mind. An experienced field manager, who knows CSOs, understands
hydraulics, and recognizes the capabilities and limitations of available sensor technology, is indispensable
for installing monitors in CSOs in a way conducive to proper functioning.
1.5.3.1 Discharge Over Weirs
Discharges over suppressed rectangular weirs can be calculated using the Francis equation of the form
Q = 3.33·L(nH)3/2
(1)
Where
Q = discharge in cfs L = length of the weir in feet H = measured head over the weir (outside the drawdown zone) in feet n = a factor of correction for various values of the ratio of submergence (n = 1 for an unsubmerged weir)
There are several other weir equations pertaining to other kinds of weirs, and they all require knowing the weir length and the head over the weir. The important thing to remember in terms of monitoring is that in order to use a weir equation you need to measure the length of the weir accurately and you need to set the flow monitor sensors up to measure H accurately. This means that you need to accurately measure the height of the weir with respect to both pressure and ultrasonic depth sensors in order to calculate the exact height of flow over the weir.
1.5.3.2 Drawdown
As water moves toward the top of a weir, it accelerates and the depth decreases. The decrease in depth is called drawdown. When measuring depth of flow over a weir, it is important to avoid the drawdown zone. In other words, don’t install your pressure sensor or ultrasonic sensor too near the top of the weir or it will not measure flows correctly. A general rule of thumb is to measure depth at a distance of 3 to 4 times the head upstream of the weir itself (see Figure 10, from www.Solinst.com).
Figure 8a – Odd Overflow Weir (SPU CSO #26)
Figure 9b – Traditional Overflow Weir (SPU CSO #141)
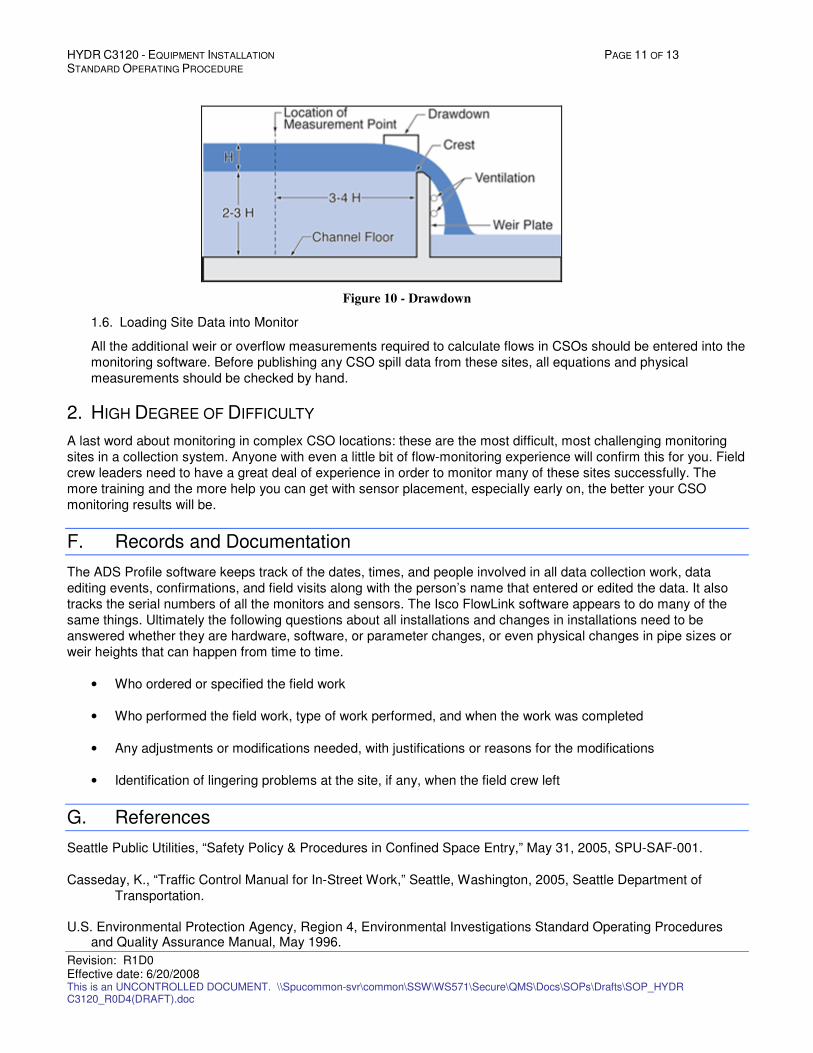
HYDR C3120 - EQUIPMENT INSTALLATION PAGE 11 OF 13 STANDARD OPERATING PROCEDURE
Revision: R1D0 Effective date: 6/20/2008 This is an UNCONTROLLED DOCUMENT. \\Spucommon-svr\common\SSW\WS571\Secure\QMS\Docs\SOPs\Drafts\SOP_HYDR C3120_R0D4(DRAFT).doc
Figure 10 - Drawdown
1.6. Loading Site Data into Monitor
All the additional weir or overflow measurements required to calculate flows in CSOs should be entered into the
monitoring software. Before publishing any CSO spill data from these sites, all equations and physical
measurements should be checked by hand.
2. HIGH DEGREE OF DIFFICULTY
A last word about monitoring in complex CSO locations: these are the most difficult, most challenging monitoring
sites in a collection system. Anyone with even a little bit of flow-monitoring experience will confirm this for you. Field
crew leaders need to have a great deal of experience in order to monitor many of these sites successfully. The
more training and the more help you can get with sensor placement, especially early on, the better your CSO
monitoring results will be.
F. Records and Documentation
The ADS Profile software keeps track of the dates, times, and people involved in all data collection work, data
editing events, confirmations, and field visits along with the person’s name that entered or edited the data. It also
tracks the serial numbers of all the monitors and sensors. The Isco FlowLink software appears to do many of the
same things. Ultimately the following questions about all installations and changes in installations need to be
answered whether they are hardware, software, or parameter changes, or even physical changes in pipe sizes or
weir heights that can happen from time to time.
• Who ordered or specified the field work
• Who performed the field work, type of work performed, and when the work was completed
• Any adjustments or modifications needed, with justifications or reasons for the modifications
• Identification of lingering problems at the site, if any, when the field crew left
G. References
Seattle Public Utilities, “Safety Policy & Procedures in Confined Space Entry,” May 31, 2005, SPU-SAF-001.
Casseday, K., “Traffic Control Manual for In-Street Work,” Seattle, Washington, 2005, Seattle Department of
Transportation.
U.S. Environmental Protection Agency, Region 4, Environmental Investigations Standard Operating Procedures and Quality Assurance Manual, May 1996.
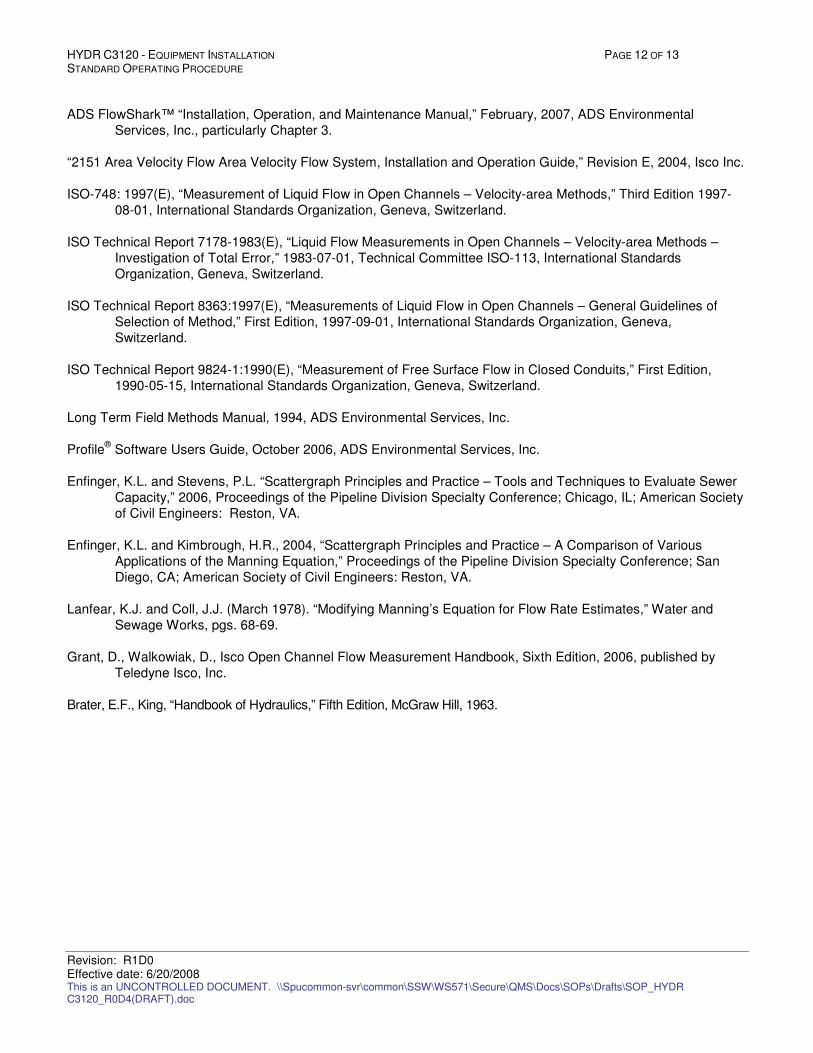
HYDR C3120 - EQUIPMENT INSTALLATION PAGE 12 OF 13 STANDARD OPERATING PROCEDURE
Revision: R1D0 Effective date: 6/20/2008 This is an UNCONTROLLED DOCUMENT. \\Spucommon-svr\common\SSW\WS571\Secure\QMS\Docs\SOPs\Drafts\SOP_HYDR C3120_R0D4(DRAFT).doc
ADS FlowShark™ “Installation, Operation, and Maintenance Manual,” February, 2007, ADS Environmental
Services, Inc., particularly Chapter 3.
“2151 Area Velocity Flow Area Velocity Flow System, Installation and Operation Guide,” Revision E, 2004, Isco Inc.
ISO-748: 1997(E), “Measurement of Liquid Flow in Open Channels – Velocity-area Methods,” Third Edition 1997-
08-01, International Standards Organization, Geneva, Switzerland.
ISO Technical Report 7178-1983(E), “Liquid Flow Measurements in Open Channels – Velocity-area Methods –
Investigation of Total Error,” 1983-07-01, Technical Committee ISO-113, International Standards
Organization, Geneva, Switzerland.
ISO Technical Report 8363:1997(E), “Measurements of Liquid Flow in Open Channels – General Guidelines of
Selection of Method,” First Edition, 1997-09-01, International Standards Organization, Geneva,
Switzerland.
ISO Technical Report 9824-1:1990(E), “Measurement of Free Surface Flow in Closed Conduits,” First Edition,
1990-05-15, International Standards Organization, Geneva, Switzerland.
Long Term Field Methods Manual, 1994, ADS Environmental Services, Inc.
Profile® Software Users Guide, October 2006, ADS Environmental Services, Inc.
Enfinger, K.L. and Stevens, P.L. “Scattergraph Principles and Practice – Tools and Techniques to Evaluate Sewer
Capacity,” 2006, Proceedings of the Pipeline Division Specialty Conference; Chicago, IL; American Society
of Civil Engineers: Reston, VA.
Enfinger, K.L. and Kimbrough, H.R., 2004, “Scattergraph Principles and Practice – A Comparison of Various
Applications of the Manning Equation,” Proceedings of the Pipeline Division Specialty Conference; San
Diego, CA; American Society of Civil Engineers: Reston, VA.
Lanfear, K.J. and Coll, J.J. (March 1978). “Modifying Manning’s Equation for Flow Rate Estimates,” Water and
Sewage Works, pgs. 68-69.
Grant, D., Walkowiak, D., Isco Open Channel Flow Measurement Handbook, Sixth Edition, 2006, published by
Teledyne Isco, Inc.
Brater, E.F., King, “Handbook of Hydraulics,” Fifth Edition, McGraw Hill, 1963.
HYDR C3120 - EQUIPMENT INSTALLATION PAGE 13 OF 13 STANDARD OPERATING PROCEDURE
Revision: R1D0 Effective date: 6/20/2008 This is an UNCONTROLLED DOCUMENT. \\Spucommon-svr\common\SSW\WS571\Secure\QMS\Docs\SOPs\Drafts\SOP_HYDR C3120_R0D4(DRAFT).doc
H. List of Revisions
The current list of revisions for this SOP follows.
Revision
Number
Effective Date Review
Status
Revised by Revision Summary
R0D1 5/15/2007 Draft CH2M HILL Draft
R0D2 8/2/2007 Draft Shelly Basketfield Updated formatting.
R0D4 5/22/2008 Draft OrsiC Final edits to implement SOP
R1D0 6/20/2008 Approved OrsiC Final edits to implement SOP
I. Tables, Forms, and Figures

Identifier:
HYDR C3110
Revision:
R1D0
Effective date:
6/20/2008
Custodian:
Hai Bach
Authorization Authority:
TBD
Flow Monitor Network
Standard Operating Procedure
HYDR C3110 - Piped Flow Gravity
Seattle Public Utilities
Seattle , Washington
This document is part of the Science Information Quality System and describes standard operating procedures to ensure that a systematic, consistent approach is followed for collecting, assessing, and documenting environmental data of known and documented quality.
HYDR C3110 - PIPED FLOW GRAVITY Page ii of 18 Standard Operating Procedure
Revision: \\simba\proj\SeattlePublicUtilCSO\369645WA1GENFlowMon\Deliverables\Flow_Monitoring_Plan\Draft_Working\Draft2\AppendixH_StandardOperatingProcedures\SOP_HYDR C3110_R1D0.doc Effective date: 6/20/2008 This is an UNCONTROLLED DOCUMENT SOP_HYDR C3110_R1D0.doc
Table of Contents A. Introduction and Scope .....................................................................................................................................3 B. General Cautions ..............................................................................................................................................3 C. Personnel Qualifications ...................................................................................................................................3 D. Equipment and Supplies ...................................................................................................................................4 E. Procedures........................................................................................................................................................4 1. Flow-Monitoring Planning and Site Investigations.............................................................................................5
1.1. Gather Maps; Mark Discrepancies and Ambiguities......................................................................................5 1.2. Locate and Assess Potential Monitoring Sites...............................................................................................5 1.3. Locate and Assess Potential Monitoring Sites...............................................................................................5
1.3.1. Site Investigations – Choosing the Best Site - Underground..................................................................6 1.3.2. Pipe Geometry .......................................................................................................................................7 1.3.3. Depth of Flow (DOF) Measurement .......................................................................................................7 1.3.4. Physical Access to the Manhole...........................................................................................................10 1.3.5. Access to Communications and Electricity...........................................................................................10 1.3.6. SCADA.................................................................................................................................................11
F. Documentation................................................................................................................................................11 G. References......................................................................................................................................................11 H. List of Revisions..............................................................................................................................................12 I. Forms and Tables ...........................................................................................................................................12
1. Flow-Monitoring Planning and Site Investigations .........................................................................................5
1.1. Gather Maps; Mark Discrepancies and Ambiguities...............................................................................5 1.2. Locate and Assess Potential Monitoring Sites .......................................................................................5 1.3. Locate and Assess Potential Monitoring Sites .......................................................................................5
1.3.1. Site Investigations – Choosing the Best Site - Underground ....................................................... 6 1.3.1.1 Surface Conditions ................................................................................................................. 6 1.3.1.2 Invert Conditions..................................................................................................................... 6 1.3.1.3 Grade Drop through Manhole ................................................................................................. 6 1.3.1.4 Hydraulic Cross-section.......................................................................................................... 7
1.3.2. Pipe Geometry............................................................................................................................. 7 1.3.3. Depth of Flow (DOF) Measurement............................................................................................. 7
1.3.3.1 Settled Silt and Debris ............................................................................................................ 7 1.3.3.2 Velocity Measurement ............................................................................................................ 8 1.3.3.3 Boot Dams.............................................................................................................................. 9
1.3.4. Physical Access to the Manhole ................................................................................................ 10 1.3.5. Access to Communications and Electricity ................................................................................ 10
1.3.5.1 Permits and Easements........................................................................................................ 10 1.3.6. SCADA ...................................................................................................................................... 11
List of Tables Table 1. SPU Staff trained to validate operation of and data from flow monitors................................................. 12
Figure 1 - Cutaway of standard monitor installation Courtesy ADS Environmental........................................... 4 Figure 2 - Monitor installation in a side weir CSO.................................................................................................. 4 Figure 3. Silt measurement (wear gloves) Courtesy ADS Environmental.......................................................... 8 Figure 4 – Two-dimensional velocity profile example............................................................................................ 9 Figure 5 - Boot dam ruins sensor confirmation readings Courtesy ADS Environmental ................................... 9 Figure 6 - Correct Sensor confirmation procedures leave flow undisturbed Courtesy ADS Environmental ... 10 Figure 7 Site Report Form. .................................................................................................................................... 14
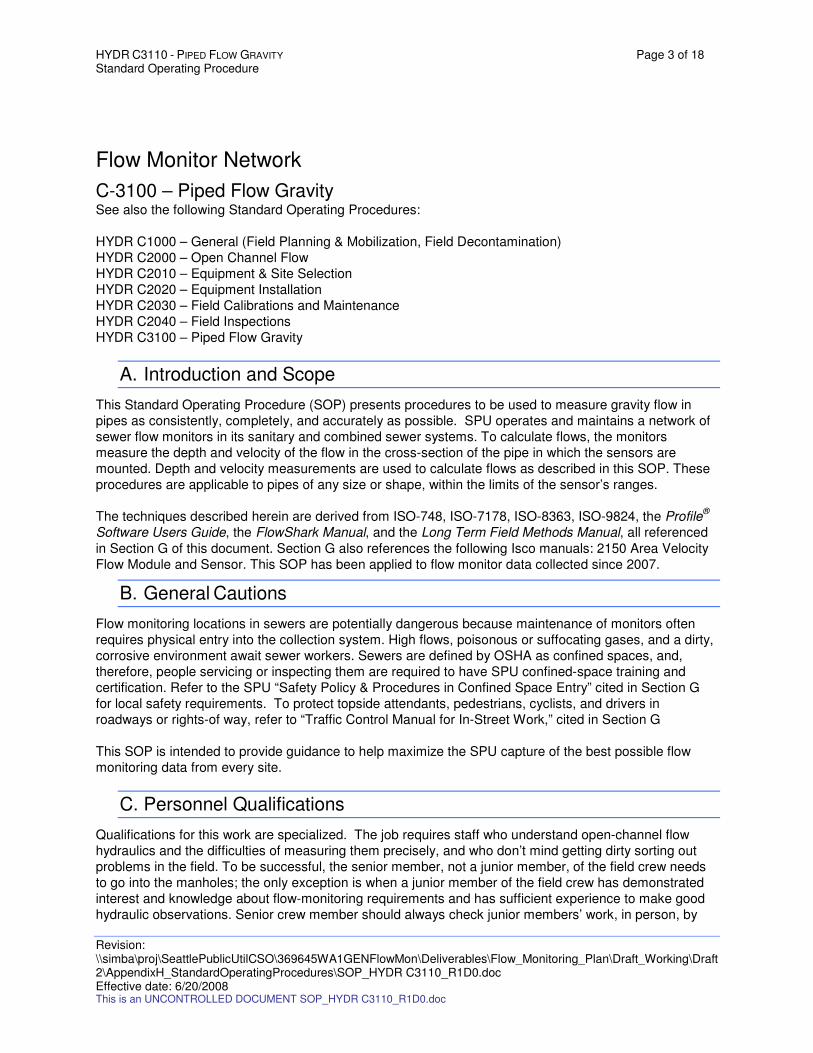
HYDR C3110 - PIPED FLOW GRAVITY Page 3 of 18 Standard Operating Procedure
Revision: \\simba\proj\SeattlePublicUtilCSO\369645WA1GENFlowMon\Deliverables\Flow_Monitoring_Plan\Draft_Working\Draft2\AppendixH_StandardOperatingProcedures\SOP_HYDR C3110_R1D0.doc Effective date: 6/20/2008 This is an UNCONTROLLED DOCUMENT SOP_HYDR C3110_R1D0.doc
Flow Monitor Network
C-3100 – Piped Flow Gravity See also the following Standard Operating Procedures:
HYDR C1000 – General (Field Planning & Mobilization, Field Decontamination)
HYDR C2000 – Open Channel Flow
HYDR C2010 – Equipment & Site Selection
HYDR C2020 – Equipment Installation
HYDR C2030 – Field Calibrations and Maintenance
HYDR C2040 – Field Inspections
HYDR C3100 – Piped Flow Gravity
A. Introduction and Scope
This Standard Operating Procedure (SOP) presents procedures to be used to measure gravity flow in
pipes as consistently, completely, and accurately as possible. SPU operates and maintains a network of
sewer flow monitors in its sanitary and combined sewer systems. To calculate flows, the monitors
measure the depth and velocity of the flow in the cross-section of the pipe in which the sensors are
mounted. Depth and velocity measurements are used to calculate flows as described in this SOP. These
procedures are applicable to pipes of any size or shape, within the limits of the sensor’s ranges.
The techniques described herein are derived from ISO-748, ISO-7178, ISO-8363, ISO-9824, the Profile
®
Software Users Guide, the FlowShark Manual, and the Long Term Field Methods Manual, all referenced
in Section G of this document. Section G also references the following Isco manuals: 2150 Area Velocity
Flow Module and Sensor. This SOP has been applied to flow monitor data collected since 2007.
B. General Cautions
Flow monitoring locations in sewers are potentially dangerous because maintenance of monitors often
requires physical entry into the collection system. High flows, poisonous or suffocating gases, and a dirty,
corrosive environment await sewer workers. Sewers are defined by OSHA as confined spaces, and,
therefore, people servicing or inspecting them are required to have SPU confined-space training and
certification. Refer to the SPU “Safety Policy & Procedures in Confined Space Entry” cited in Section G
for local safety requirements. To protect topside attendants, pedestrians, cyclists, and drivers in
roadways or rights-of way, refer to “Traffic Control Manual for In-Street Work,” cited in Section G
This SOP is intended to provide guidance to help maximize the SPU capture of the best possible flow
monitoring data from every site.
C. Personnel Qualifications
Qualifications for this work are specialized. The job requires staff who understand open-channel flow
hydraulics and the difficulties of measuring them precisely, and who don’t mind getting dirty sorting out
problems in the field. To be successful, the senior member, not a junior member, of the field crew needs
to go into the manholes; the only exception is when a junior member of the field crew has demonstrated
interest and knowledge about flow-monitoring requirements and has sufficient experience to make good
hydraulic observations. Senior crew member should always check junior members’ work, in person, by
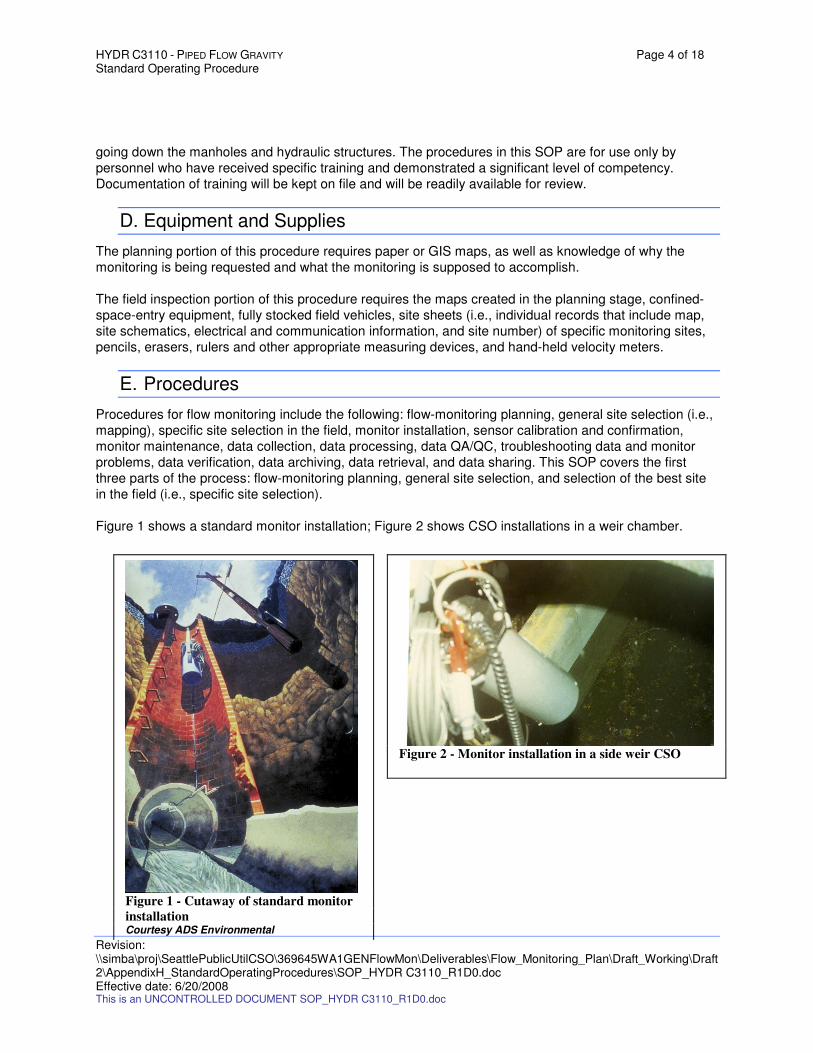
HYDR C3110 - PIPED FLOW GRAVITY Page 4 of 18 Standard Operating Procedure
Revision: \\simba\proj\SeattlePublicUtilCSO\369645WA1GENFlowMon\Deliverables\Flow_Monitoring_Plan\Draft_Working\Draft2\AppendixH_StandardOperatingProcedures\SOP_HYDR C3110_R1D0.doc Effective date: 6/20/2008 This is an UNCONTROLLED DOCUMENT SOP_HYDR C3110_R1D0.doc
going down the manholes and hydraulic structures. The procedures in this SOP are for use only by
personnel who have received specific training and demonstrated a significant level of competency.
Documentation of training will be kept on file and will be readily available for review.
D. Equipment and Supplies
The planning portion of this procedure requires paper or GIS maps, as well as knowledge of why the
monitoring is being requested and what the monitoring is supposed to accomplish.
The field inspection portion of this procedure requires the maps created in the planning stage, confined-
space-entry equipment, fully stocked field vehicles, site sheets (i.e., individual records that include map,
site schematics, electrical and communication information, and site number) of specific monitoring sites,
pencils, erasers, rulers and other appropriate measuring devices, and hand-held velocity meters.
E. Procedures
Procedures for flow monitoring include the following: flow-monitoring planning, general site selection (i.e.,
mapping), specific site selection in the field, monitor installation, sensor calibration and confirmation,
monitor maintenance, data collection, data processing, data QA/QC, troubleshooting data and monitor
problems, data verification, data archiving, data retrieval, and data sharing. This SOP covers the first
three parts of the process: flow-monitoring planning, general site selection, and selection of the best site
in the field (i.e., specific site selection).
Figure 1 shows a standard monitor installation; Figure 2 shows CSO installations in a weir chamber.
Figure 1 - Cutaway of standard monitor
installation Courtesy ADS Environmental
Figure 2 - Monitor installation in a side weir CSO
HYDR C3110 - PIPED FLOW GRAVITY Page 5 of 18 Standard Operating Procedure
Revision: \\simba\proj\SeattlePublicUtilCSO\369645WA1GENFlowMon\Deliverables\Flow_Monitoring_Plan\Draft_Working\Draft2\AppendixH_StandardOperatingProcedures\SOP_HYDR C3110_R1D0.doc Effective date: 6/20/2008 This is an UNCONTROLLED DOCUMENT SOP_HYDR C3110_R1D0.doc
1. FLOW-MONITORING PLANNING AND SITE INVESTIGATIONS
Understanding the goal is a key to successful flow monitoring, and some projects have multiple goals. Are
you trying to monitor discharges from a particular CSO? Are you trying to isolate flooding areas or
blockages? Are you trying to quantify infiltration and inflow (I/I), or are you trying to calibrate and verify a
model? Each of these functions may require different monitoring strategies. To start a job off on the right
foot, having a clear idea of the project and site goals, combined with a clear map, is important. On a
sewer map, locate the areas of the sewer system from which you need flow information. Circle or highlight
problem areas. Mark the pipe(s) or structures that need to be monitored. It is a good idea to mark
secondary monitoring locations—often one or two manholes upstream of the ideal monitoring locations—
which allows field crews to investigate monitoring locations should the ideal sites have poor flow
conditions.
1.1. Gather Maps; Mark Discrepancies and Ambiguities
Depending on the sources of your mapping data, you may find discrepancies on the maps, so it may
be important to check as-built records from the vault as well as GIS maps and surveys to understand
the nature of the flow system. Sometimes it is hard to determine which way a sewer flows. Clearly
mark all discrepancies that might impact your project. Have field crews remove manhole covers in the
field to verify flow direction and sewer connectivity. Once all the known discrepancies have been
corrected or clarified, it’s time to select potential monitoring locations.
1.2. Locate and Assess Potential Monitoring Sites
Based on sewer geometry and problem areas, mark the pipes where you can obtain the best
sewershed isolation or structure isolation to suit your needs. Also mark second and possibly third
choices for each site, if possible, in case the first choices have bad hydraulics.
While choosing monitor locations on a map, beware that subtraction of upstream flows from downstream flows to create net flows will multiply errors. Meters in the field are often no more
accurate than ±10 percent due to site conditions like: waves, ripples, bends, and silts see section 1.3.
As a result, computation of net flows can result in missing or exaggerated flow, especially when the
contributed flow between two metering locations is small compared to the magnitude of the flows at
monitored locations. These conditions will then not meet the functional requirements that SPU has
established for meter accuracy and precision. A solution to the problem of compounding-flow
inaccuracy is to add monitors or relocate monitors, usually the downstream monitor, to avoid
potentially large errors caused by subtraction.
Before going into the field, double-check the map for completeness, clarity, and purpose. It is better
to have one too many potential monitoring sites than one too few.
1.3. Locate and Assess Potential Monitoring Sites
Include, the project manager, a representative from the monitoring team, the project engineer and
field monitoring staff on site visits to each potential monitoring site to evaluate the physical conditions,
hydraulic conditions, accessibility, and safety conditions. Well-trained field crews will be able to
choose wisely between your first, second, and third choices for monitoring locations, thus improving
the quality of the data before a sensor is even installed.
HYDR C3110 - PIPED FLOW GRAVITY Page 6 of 18 Standard Operating Procedure
Revision: \\simba\proj\SeattlePublicUtilCSO\369645WA1GENFlowMon\Deliverables\Flow_Monitoring_Plan\Draft_Working\Draft2\AppendixH_StandardOperatingProcedures\SOP_HYDR C3110_R1D0.doc Effective date: 6/20/2008 This is an UNCONTROLLED DOCUMENT SOP_HYDR C3110_R1D0.doc
1.3.1. Site Investigations – Choosing the Best Site - Underground
The remainder of this SOP refers to field procedures and assumes that the reader has observed
and recorded flow conditions in the manholes or other hydraulic structures of interest.
Tools needed for this work include the maps created in the planning stage, confined-space-entry
equipment, fully stocked field vehicles, site sheets, pencils, erasers, rulers and other appropriate
measuring devices, and hand-held velocity meters. Street permits and traffic control plans are
needed if work is in street right of way.
When down in the manhole or in the hydraulic structure, field crews should look for the best site
for monitor installation. The best monitoring locations have good access for maintenance and
field work, straight, smooth approach pipes; a straight channel through the manhole; no side
sewer connections either upstream of or in the manhole; and smooth flow surfaces without silt or
debris in the pipe. In addition, the best sites are those with little or no harmful gases that can be
ventilated effectively and made reasonably safe and easy to access, and provided with required
instrument communications. Note that while the conditions listed above are ideal, very few sites in
the field will have all of them.
1.3.1.1 Surface Conditions
The surface of the flow should be as smooth as possible. The smoother the surface, the more accurate the field confirmations of sensor measurements will be. The rougher the surface, the more difficult it will be to confirm and calibrate sensors in the field. In other words, if you can’t measure the depth accurately with a ruler, how can you expect to set the depth sensors correctly? Pipes with steep slopes transporting flows with Froude numbers in excess of 1.7 tend to generate their own hydraulic jumps or waves. Helpful measurement techniques, designed to minimize error are discussed in Sections 1.32 through 1.34 below.
1.3.1.2 Pipe Slope
1.3.1.3 Invert Conditions
The invert of the pipe, from the influent sewer through the manhole and out through the exit pipe, should ideally be free of silt or debris. Pipes with flat slopes where peak velocities do not exceed 2-feet per second, are likely to trap silt and debris in their inverts. The more silt and debris there is in the invert, and the more it moves from storm to storm the worse the site is in terms of the ability to calculate an accurate cross-sectional flow area. Cross-section flow area represents the “A” in the basic open channel flow equation called the Continuity Equation, (1) below:
Q = A · V (1)
Therefore, sites with moving silt and debris can not produce accurate flow monitoring results.
1.3.1.4 Grade Drop through Manhole
Manhole troughs are sometimes too flat or too restrictive to allow flows to travel through the inverts without backing up a little. The best manholes or chambers have enough of a drop to allow flow to move through the structure without backing up.
HYDR C3110 - PIPED FLOW GRAVITY Page 7 of 18 Standard Operating Procedure
Revision: \\simba\proj\SeattlePublicUtilCSO\369645WA1GENFlowMon\Deliverables\Flow_Monitoring_Plan\Draft_Working\Draft2\AppendixH_StandardOperatingProcedures\SOP_HYDR C3110_R1D0.doc Effective date: 6/20/2008 This is an UNCONTROLLED DOCUMENT SOP_HYDR C3110_R1D0.doc
1.3.1.5 Hydraulic Cross-section
The hydraulic cross-section is the cross-section of the pipe in which the sensors are installed. In order to measure flows correctly and accurately, both depth and velocity sensors should be read in the same cross-section of the pipe.
The perfect hydraulic cross-section is one in which the pipe geometry is constant (i.e., same size and shape of pipe throughout); has been constant, in terms of both geometry and alignment, for 50 pipe diameters upstream; and where the hydraulic grade line is parallel to the slope of the pipe(Thus, making perfect sites rare). Imperfect hydraulic cross-sections increase the difficulty of obtaining accurate data from a monitoring site.
1.3.2. Pipe Geometry
Measuring pipe sizes and shapes accurately, in the hydraulic cross-section, is critical for accurate
flow monitoring. Measurements need to include CSO weirs, orifices and siphons where
applicable. If pipe sizes and shapes are not measured and recorded accurately, systematic bias
is introduced into all flow calculations. The bias can be disastrous if not corrected. See the ADS Long Term Field Methods Manual, Appendix D, Measuring Large and Odd Shaped Pipe, for
specific, illustrated, pipe-measurement details.
1.3.3. Depth of Flow (DOF) Measurement
Accurate depth measurement is also essential for accurate flow monitoring. In terms of
minimizing errors, accurate depth measurements are more important than accurate velocity
measurements. Measuring the depth of flow in a running sewer accurately is an art. The ruler
needs to be perfectly vertical and placed exactly in the center of the pipe and also in the hydraulic
cross-section being measured by the sensors. It may sound easy, but it’s not necessarily so.
High-velocity flows create rooster-tails around rulers with a prow wave on the upstream side and
a trough on the downstream side, so how do you estimate the true depth of flow? One good trick
is to measure the airspace from the top of the pipe to the surface of the water—called an “Air-
DOF.” Measuring the airspace above the flow can be much more accurate than measuring the depth directly in fast-moving flows. See Chapter 2, Field Basics, of the ADS Long Term Field
Methods Manual. Mathematically, the measurement is represented as follows:
DOF + Air DOF = Pipe Height
This means that by always measuring both DOF plus Air DOF and adding them up to see if they
equal pipe height, there is always a way of checking depth measurements in the field, and it is a
good practice to do so. However, be aware that pipe height and width are not necessarily equal to
the specified or planned height and width. For each site, measure and record the inside pipe
maximum height and maximum width in the field.
Waves on the surface of the flow create depth-measurement problems that are similar to those created by fast-moving flows. The true depth of flow is the average surface depth with the waves
removed. The average of multiple depth measurements, DOF + Air DOF, taken over several
minutes, can be used to avoid unrepeatable depth scatter created by waves.
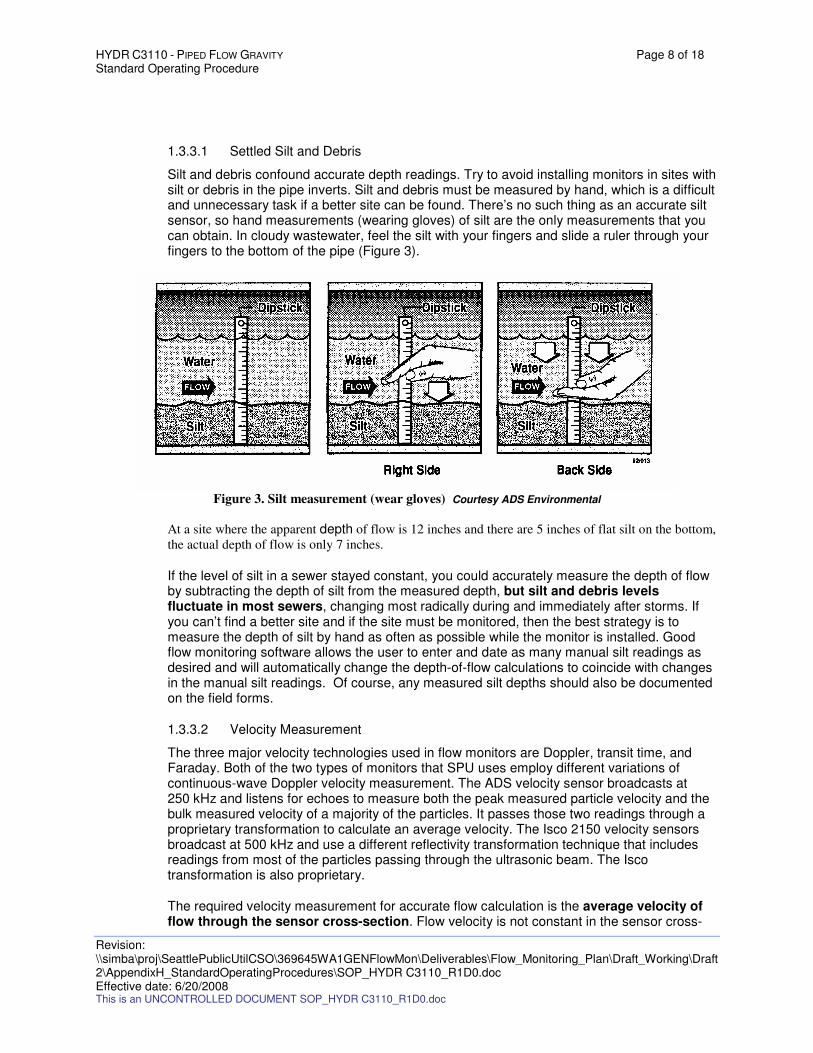
HYDR C3110 - PIPED FLOW GRAVITY Page 8 of 18 Standard Operating Procedure
Revision: \\simba\proj\SeattlePublicUtilCSO\369645WA1GENFlowMon\Deliverables\Flow_Monitoring_Plan\Draft_Working\Draft2\AppendixH_StandardOperatingProcedures\SOP_HYDR C3110_R1D0.doc Effective date: 6/20/2008 This is an UNCONTROLLED DOCUMENT SOP_HYDR C3110_R1D0.doc
1.3.3.1 Settled Silt and Debris
Silt and debris confound accurate depth readings. Try to avoid installing monitors in sites with silt or debris in the pipe inverts. Silt and debris must be measured by hand, which is a difficult and unnecessary task if a better site can be found. There’s no such thing as an accurate silt sensor, so hand measurements (wearing gloves) of silt are the only measurements that you can obtain. In cloudy wastewater, feel the silt with your fingers and slide a ruler through your fingers to the bottom of the pipe (Figure 3).
Figure 3. Silt measurement (wear gloves) Courtesy ADS Environmental
At a site where the apparent depth of flow is 12 inches and there are 5 inches of flat silt on the bottom,
the actual depth of flow is only 7 inches.
If the level of silt in a sewer stayed constant, you could accurately measure the depth of flow by subtracting the depth of silt from the measured depth, but silt and debris levels fluctuate in most sewers, changing most radically during and immediately after storms. If you can’t find a better site and if the site must be monitored, then the best strategy is to measure the depth of silt by hand as often as possible while the monitor is installed. Good flow monitoring software allows the user to enter and date as many manual silt readings as desired and will automatically change the depth-of-flow calculations to coincide with changes in the manual silt readings. Of course, any measured silt depths should also be documented on the field forms.
1.3.3.2 Velocity Measurement
The three major velocity technologies used in flow monitors are Doppler, transit time, and Faraday. Both of the two types of monitors that SPU uses employ different variations of continuous-wave Doppler velocity measurement. The ADS velocity sensor broadcasts at 250 kHz and listens for echoes to measure both the peak measured particle velocity and the bulk measured velocity of a majority of the particles. It passes those two readings through a proprietary transformation to calculate an average velocity. The Isco 2150 velocity sensors broadcast at 500 kHz and use a different reflectivity transformation technique that includes readings from most of the particles passing through the ultrasonic beam. The Isco transformation is also proprietary.
The required velocity measurement for accurate flow calculation is the average velocity of flow through the sensor cross-section. Flow velocity is not constant in the sensor cross-
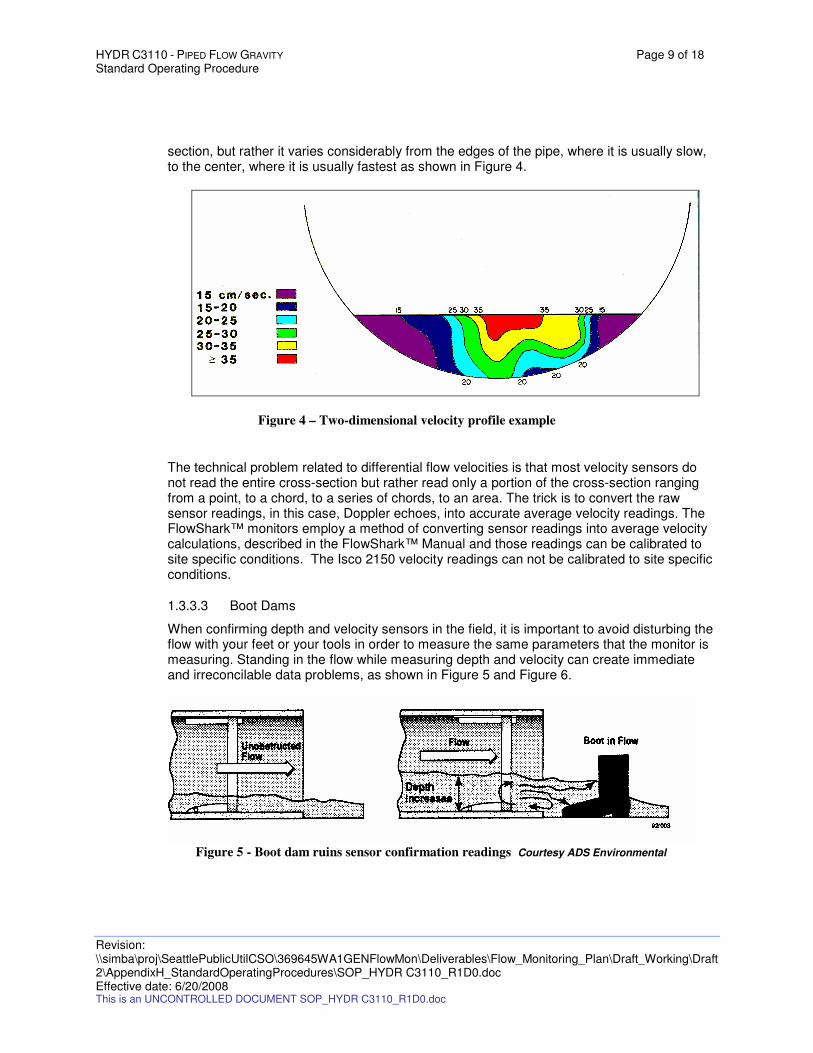
HYDR C3110 - PIPED FLOW GRAVITY Page 9 of 18 Standard Operating Procedure
Revision: \\simba\proj\SeattlePublicUtilCSO\369645WA1GENFlowMon\Deliverables\Flow_Monitoring_Plan\Draft_Working\Draft2\AppendixH_StandardOperatingProcedures\SOP_HYDR C3110_R1D0.doc Effective date: 6/20/2008 This is an UNCONTROLLED DOCUMENT SOP_HYDR C3110_R1D0.doc
section, but rather it varies considerably from the edges of the pipe, where it is usually slow, to the center, where it is usually fastest as shown in Figure 4.
Figure 4 – Two-dimensional velocity profile example
The technical problem related to differential flow velocities is that most velocity sensors do not read the entire cross-section but rather read only a portion of the cross-section ranging from a point, to a chord, to a series of chords, to an area. The trick is to convert the raw sensor readings, in this case, Doppler echoes, into accurate average velocity readings. The FlowShark™ monitors employ a method of converting sensor readings into average velocity calculations, described in the FlowShark™ Manual and those readings can be calibrated to site specific conditions. The Isco 2150 velocity readings can not be calibrated to site specific conditions.
1.3.3.3 Boot Dams
When confirming depth and velocity sensors in the field, it is important to avoid disturbing the flow with your feet or your tools in order to measure the same parameters that the monitor is measuring. Standing in the flow while measuring depth and velocity can create immediate and irreconcilable data problems, as shown in Figure 5 and Figure 6.
Figure 5 - Boot dam ruins sensor confirmation readings Courtesy ADS Environmental
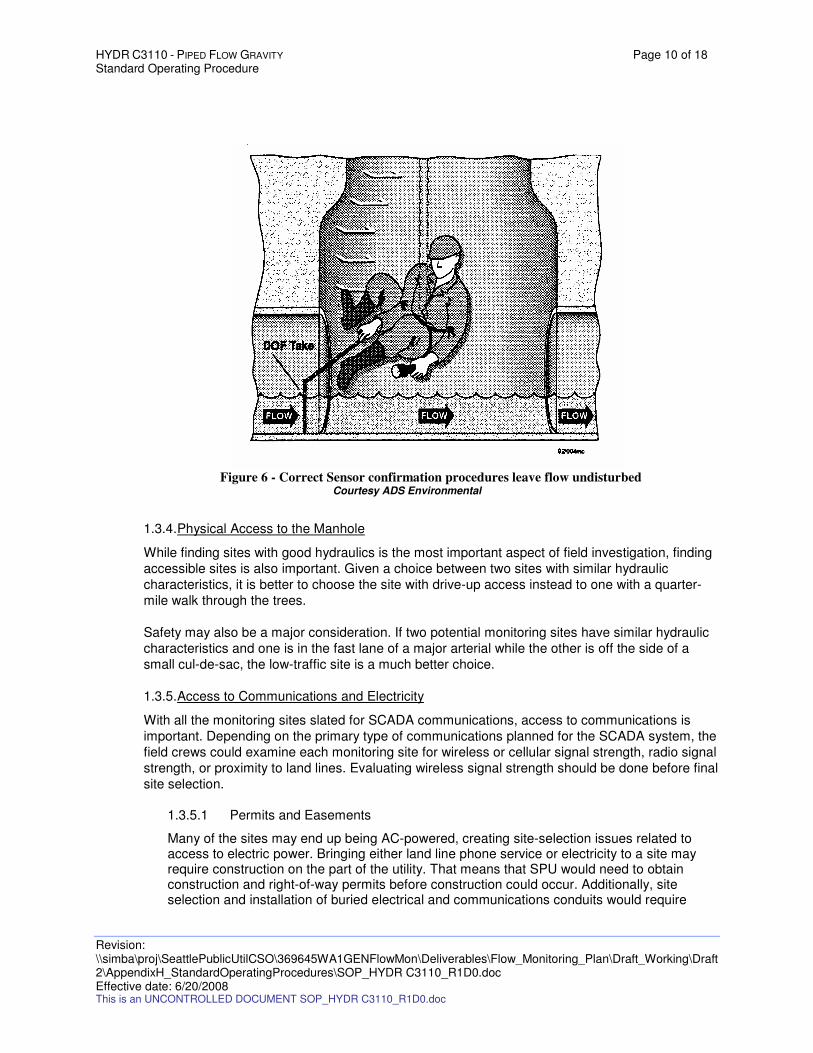
HYDR C3110 - PIPED FLOW GRAVITY Page 10 of 18 Standard Operating Procedure
Revision: \\simba\proj\SeattlePublicUtilCSO\369645WA1GENFlowMon\Deliverables\Flow_Monitoring_Plan\Draft_Working\Draft2\AppendixH_StandardOperatingProcedures\SOP_HYDR C3110_R1D0.doc Effective date: 6/20/2008 This is an UNCONTROLLED DOCUMENT SOP_HYDR C3110_R1D0.doc
Figure 6 - Correct Sensor confirmation procedures leave flow undisturbed
Courtesy ADS Environmental
1.3.4. Physical Access to the Manhole
While finding sites with good hydraulics is the most important aspect of field investigation, finding
accessible sites is also important. Given a choice between two sites with similar hydraulic
characteristics, it is better to choose the site with drive-up access instead to one with a quarter-
mile walk through the trees.
Safety may also be a major consideration. If two potential monitoring sites have similar hydraulic
characteristics and one is in the fast lane of a major arterial while the other is off the side of a
small cul-de-sac, the low-traffic site is a much better choice.
1.3.5. Access to Communications and Electricity
With all the monitoring sites slated for SCADA communications, access to communications is
important. Depending on the primary type of communications planned for the SCADA system, the
field crews could examine each monitoring site for wireless or cellular signal strength, radio signal
strength, or proximity to land lines. Evaluating wireless signal strength should be done before final
site selection.
1.3.5.1 Permits and Easements
Many of the sites may end up being AC-powered, creating site-selection issues related to access to electric power. Bringing either land line phone service or electricity to a site may require construction on the part of the utility. That means that SPU would need to obtain construction and right-of-way permits before construction could occur. Additionally, site selection and installation of buried electrical and communications conduits would require
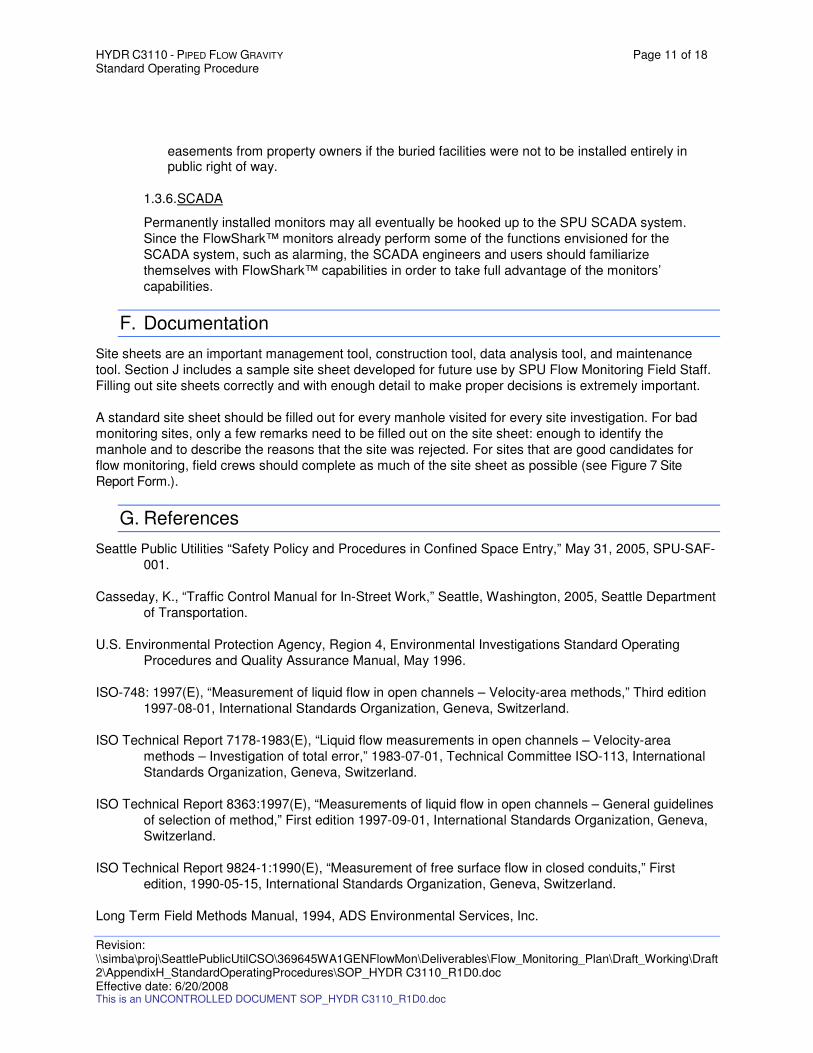
HYDR C3110 - PIPED FLOW GRAVITY Page 11 of 18 Standard Operating Procedure
Revision: \\simba\proj\SeattlePublicUtilCSO\369645WA1GENFlowMon\Deliverables\Flow_Monitoring_Plan\Draft_Working\Draft2\AppendixH_StandardOperatingProcedures\SOP_HYDR C3110_R1D0.doc Effective date: 6/20/2008 This is an UNCONTROLLED DOCUMENT SOP_HYDR C3110_R1D0.doc
easements from property owners if the buried facilities were not to be installed entirely in public right of way.
1.3.6. SCADA
Permanently installed monitors may all eventually be hooked up to the SPU SCADA system.
Since the FlowShark™ monitors already perform some of the functions envisioned for the
SCADA system, such as alarming, the SCADA engineers and users should familiarize
themselves with FlowShark™ capabilities in order to take full advantage of the monitors’
capabilities.
F. Documentation
Site sheets are an important management tool, construction tool, data analysis tool, and maintenance
tool. Section J includes a sample site sheet developed for future use by SPU Flow Monitoring Field Staff.
Filling out site sheets correctly and with enough detail to make proper decisions is extremely important.
A standard site sheet should be filled out for every manhole visited for every site investigation. For bad
monitoring sites, only a few remarks need to be filled out on the site sheet: enough to identify the
manhole and to describe the reasons that the site was rejected. For sites that are good candidates for
flow monitoring, field crews should complete as much of the site sheet as possible (see Figure 7 Site
Report Form.).
G. References
Seattle Public Utilities “Safety Policy and Procedures in Confined Space Entry,” May 31, 2005, SPU-SAF-
001.
Casseday, K., “Traffic Control Manual for In-Street Work,” Seattle, Washington, 2005, Seattle Department
of Transportation.
U.S. Environmental Protection Agency, Region 4, Environmental Investigations Standard Operating
Procedures and Quality Assurance Manual, May 1996.
ISO-748: 1997(E), “Measurement of liquid flow in open channels – Velocity-area methods,” Third edition
1997-08-01, International Standards Organization, Geneva, Switzerland.
ISO Technical Report 7178-1983(E), “Liquid flow measurements in open channels – Velocity-area
methods – Investigation of total error,” 1983-07-01, Technical Committee ISO-113, International
Standards Organization, Geneva, Switzerland.
ISO Technical Report 8363:1997(E), “Measurements of liquid flow in open channels – General guidelines
of selection of method,” First edition 1997-09-01, International Standards Organization, Geneva,
Switzerland.
ISO Technical Report 9824-1:1990(E), “Measurement of free surface flow in closed conduits,” First
edition, 1990-05-15, International Standards Organization, Geneva, Switzerland.
Long Term Field Methods Manual, 1994, ADS Environmental Services, Inc.
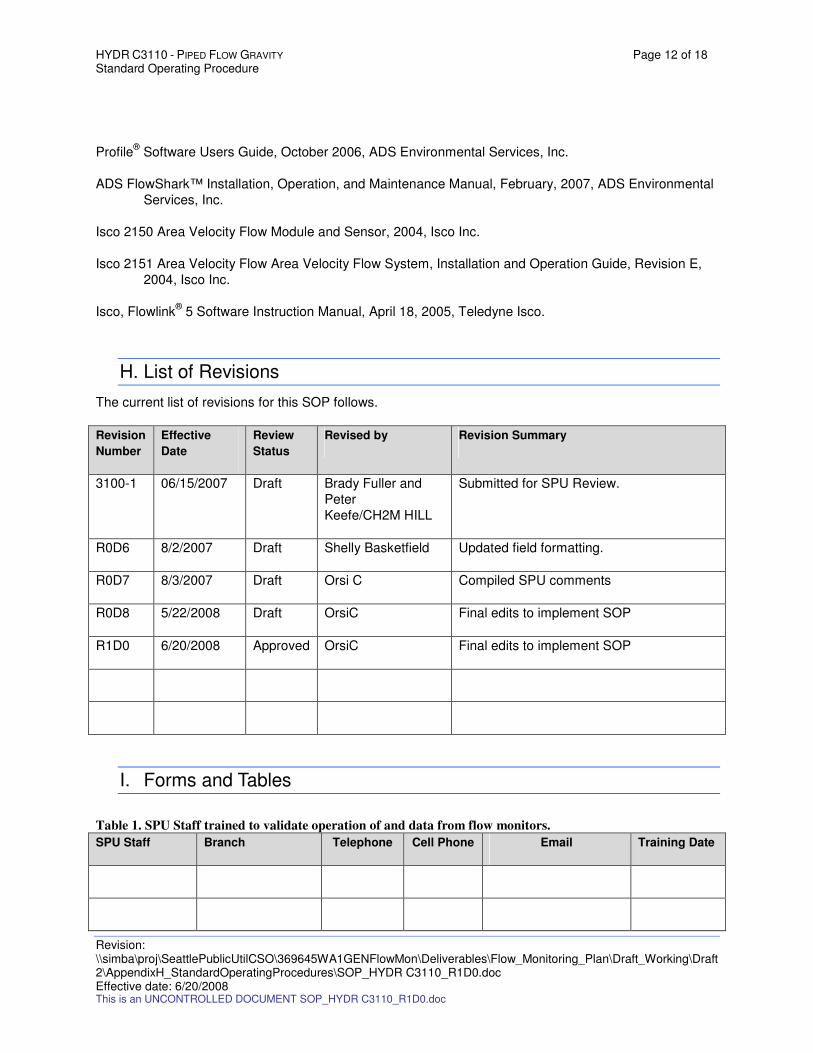
HYDR C3110 - PIPED FLOW GRAVITY Page 12 of 18 Standard Operating Procedure
Revision: \\simba\proj\SeattlePublicUtilCSO\369645WA1GENFlowMon\Deliverables\Flow_Monitoring_Plan\Draft_Working\Draft2\AppendixH_StandardOperatingProcedures\SOP_HYDR C3110_R1D0.doc Effective date: 6/20/2008 This is an UNCONTROLLED DOCUMENT SOP_HYDR C3110_R1D0.doc
Profile® Software Users Guide, October 2006, ADS Environmental Services, Inc.
ADS FlowShark™ Installation, Operation, and Maintenance Manual, February, 2007, ADS Environmental
Services, Inc.
Isco 2150 Area Velocity Flow Module and Sensor, 2004, Isco Inc.
Isco 2151 Area Velocity Flow Area Velocity Flow System, Installation and Operation Guide, Revision E,
2004, Isco Inc.
Isco, Flowlink® 5 Software Instruction Manual, April 18, 2005, Teledyne Isco.
H. List of Revisions
The current list of revisions for this SOP follows.
Revision
Number
Effective
Date
Review
Status
Revised by Revision Summary
3100-1 06/15/2007 Draft Brady Fuller and
Peter
Keefe/CH2M HILL
Submitted for SPU Review.
R0D6 8/2/2007 Draft Shelly Basketfield Updated field formatting.
R0D7 8/3/2007 Draft Orsi C Compiled SPU comments
R0D8 5/22/2008 Draft OrsiC Final edits to implement SOP
R1D0 6/20/2008 Approved OrsiC Final edits to implement SOP
I. Forms and Tables
Table 1. SPU Staff trained to validate operation of and data from flow monitors.
SPU Staff Branch Telephone Cell Phone Email Training Date

HYDR C3110 - PIPED FLOW GRAVITY Page 13 of 18 Standard Operating Procedure
Revision: \\simba\proj\SeattlePublicUtilCSO\369645WA1GENFlowMon\Deliverables\Flow_Monitoring_Plan\Draft_Working\Draft2\AppendixH_StandardOperatingProcedures\SOP_HYDR C3110_R1D0.doc Effective date: 6/20/2008 This is an UNCONTROLLED DOCUMENT SOP_HYDR C3110_R1D0.doc
SPU Staff Branch Telephone Cell Phone Email Training Date

HYDR C3110 - PIPED FLOW GRAVITY Page 14 of 18 Standard Operating Procedure
Revision: \\simba\proj\SeattlePublicUtilCSO\369645WA1GENFlowMon\Deliverables\Flow_Monitoring_Plan\Draft_Working\Draft2\AppendixH_StandardOperatingProcedures\SOP_HYDR C3110_R1D0.doc Effective date: 6/20/2008 This is an UNCONTROLLED DOCUMENT SOP_HYDR C3110_R1D0.doc
Figure 7 Site Report Form.
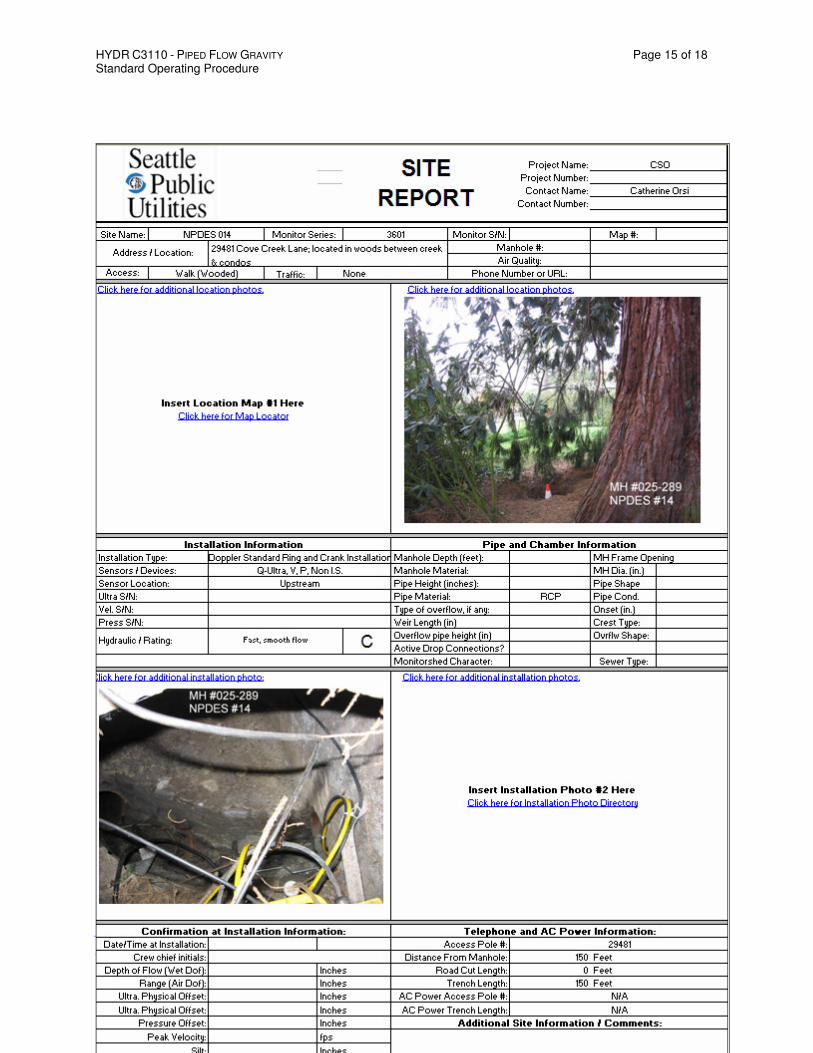
HYDR C3110 - PIPED FLOW GRAVITY Page 15 of 18 Standard Operating Procedure
Revision: \\simba\proj\SeattlePublicUtilCSO\369645WA1GENFlowMon\Deliverables\Flow_Monitoring_Plan\Draft_Working\Draft2\AppendixH_StandardOperatingProcedures\SOP_HYDR C3110_R1D0.doc Effective date: 6/20/2008 This is an UNCONTROLLED DOCUMENT SOP_HYDR C3110_R1D0.doc
HYDR C3110 - PIPED FLOW GRAVITY Page 16 of 18 Standard Operating Procedure
Revision: \\simba\proj\SeattlePublicUtilCSO\369645WA1GENFlowMon\Deliverables\Flow_Monitoring_Plan\Draft_Working\Draft2\AppendixH_StandardOperatingProcedures\SOP_HYDR C3110_R1D0.doc Effective date: 6/20/2008 This is an UNCONTROLLED DOCUMENT SOP_HYDR C3110_R1D0.doc
The equipment needed in field vehicles depends on the tasks that need to be accomplished. In all cases, safety equipment is needed. Field investigations do not need as much equipment as installations and so forth. Always be sure to bring enough equipment to do the job. Equipment inventory
• 24 traffic cones
• Confined space entry logs
• Steel toed boots
• Protective manhole diving suits
• Site sheets with hospital location(s) listed
• Letter of authorization
• Field computer
• Fresh air blower
• Blower hose
• Calibrated gas meter
• 2 sets of gas meter filters
• 2 portable velocity meters
• 2 100-foot climbing ropes or 2 tripods with sufficient cable to reach the deepest sites
• Gas can for the blowers
• Fluorescent safety vests
• Pencils and pens
• 100-foot extension cord
• Battery-powered hammer drill
• Steel masonry drill bit set with extra 5/16-inch and 7/16-inch drill bits
• Titanium masonry drill bit set
• Manhole-opening tools, including two crowbars and a j-hook
• 3 flashlights
• Paper towels
• 2 pairs of rubber gloves
• Large sledge hammer
• 3 carpenter’s rules with slide sticks (DOF sticks)
• 3 hard hats
• Safety glasses
• 2 emergency flasher beacons
• Two slow/stop signs
• 50-foot tape measure
• Extendable pole for measuring large pipe heights and widths
• 2 complete body harnesses for the tripods or the ropes
• 8 carabiners
• 4 ascenders
• Figure-eight ring
• Rescue pulley or Grigri belay device
• 4 orange safety flags
• Calibrated bucket
• Stopwatch
HYDR C3110 - PIPED FLOW GRAVITY Page 17 of 18 Standard Operating Procedure
Revision: \\simba\proj\SeattlePublicUtilCSO\369645WA1GENFlowMon\Deliverables\Flow_Monitoring_Plan\Draft_Working\Draft2\AppendixH_StandardOperatingProcedures\SOP_HYDR C3110_R1D0.doc Effective date: 6/20/2008 This is an UNCONTROLLED DOCUMENT SOP_HYDR C3110_R1D0.doc
Additional Equipment
• A 110-volt AC power generator
• 100 large, 200 medium, and 500 small cable ties
• 2 cans of ScotchKote sealant
• Large crescent wrench
• Needle nose pliers
• 2 pair of diagonal cutters
• 2 medium- and large-sized Phillips-head screwdrivers
• Small-, medium-. and large-sized slotted screwdrivers
• Small sledge hammer
• Hack saw
• Hack saw blades
• Vise grips
• 2 bubble levels
• 7/16-inch nut driver
• 5/16-inch nut driver
• 20-foot utility rope
• Wet-weather gear
• A pack of 100 anchor bolts
• 10 extra sets of ring assembly hardware
• A short crank handle and a long crank handle
• 6 feet of blank ring material for special installs
• 2 special ultrasonic mounting plates
• 3 extra of each type of sensor mounting plate
• Volt meter
• Traffic signs with stands
• Car battery jumper cables
• Battery charger
• Hand broom
• Water cooler
• Fire extinguisher
• First aid kit
• Medium sized plastic trash can
• Dose meter
• Dose meter refill
• Gas Meter Calibration kit
• Disposable ear plugs
• Insulated protective clothing in cold weather
• Leather work gloves
• Shoulder-length gloves
• Disposable surgical gloves
• Flash light batteries
• Floating lantern
• Halogen lamp
• Allen wrench set
• Large channel pliers
• Claw hammer
• Nut driver set
• Power strip for computer and other tools
HYDR C3110 - PIPED FLOW GRAVITY Page 18 of 18 Standard Operating Procedure
Revision: \\simba\proj\SeattlePublicUtilCSO\369645WA1GENFlowMon\Deliverables\Flow_Monitoring_Plan\Draft_Working\Draft2\AppendixH_StandardOperatingProcedures\SOP_HYDR C3110_R1D0.doc Effective date: 6/20/2008 This is an UNCONTROLLED DOCUMENT SOP_HYDR C3110_R1D0.doc
• Punch and chisel set
• Socket set and drivers
• Soldering iron with tips
• Solder
• Tap and die set with several taps
• Large tool box
• Small plastic tool box
• Box cutter
• Box cutter blades
• Wire brush
• Wire stripper
• Box end or open end wrench set
• Equipment bag
• Short hoe
• Machete with sheath
• Padlock
• Spray paint for locating manholes and sensors
• Two-way radios
• Shovel
• Telephone test set
• Disinfectant or bleach solution
Identifier:
HYDR C3100
Revision:
R1D0
Effective date:
6/20/2008
Custodian:
Brian Morgenroth
Authorization Authority:
TBD
Flow Monitor Network
Standard Operating Procedure
HYDR C3100 - PIPED FLOW GRAVITY (ADMINISTRATIVE)
Seattle Public Utilities
Seattle , Washington
This document is part of the Science Information Quality System and describes standard operating procedures to ensure a systematic consistent approach is followed for collecting, assessing, and documenting environmental data of known and documented quality.
HYDR C3100 - PIPED FLOW GRAVITY (ADMINISTRATIVE) Page ii of 6 Standard Operating Procedure
Revision: R1D0 Effective date: 6/20/2008 This is an UNCONTROLLED DOCUMENT. \\Spucommon-
svr\common\SSW\WS571\Secure\QMS\Docs\SOPs\Drafts\SOP_HYDR C3100_R0D4(DRAFT).doc.
Table of Contents A. Introduction and Scope .....................................................................................................................................3 B. General Cautions ..............................................................................................................................................3 C. Personnel Qualifications ...................................................................................................................................4 D. Equipment and Supplies ...................................................................................................................................4 E. Procedures........................................................................................................................................................4 F. Documentation..................................................................................................................................................5 G. References........................................................................................................................................................6 H. List of Revisions................................................................................................................................................6 I. Forms and Tables .............................................................................................................................................6

HYDR C3100 - PIPED FLOW GRAVITY (ADMINISTRATIVE) Page 3 of 6 Standard Operating Procedure
Revision: R1D0 Effective date: 6/20/2008 This is an UNCONTROLLED DOCUMENT. \\Spucommon-svr\common\SSW\WS571\Secure\QMS\Docs\SOPs\Drafts\SOP_HYDR
C3100_R0D4(DRAFT).doc.
Flow Monitor Network
C-3100 – Piped Flow Gravity (Administrative) See also the following Standard Operating Procedures:
HYDR C1000 – General (Field Planning & Mobilization, Field Decontamination)
HYDR C2000 – Open Channel Flow
HYDR C2010 – Equipment & Site Selection
HYDR C2020 – Equipment Installation
HYDR C2030 – Field Calibrations and Maintenance
HYDR C2040 – Field Inspections
A. Introduction and Scope
This administrative Standard Operating Procedure (SOP) provides guidance and specific instructions concerning the organization and use of four sub-procedures to be used to measure gravity flow in pipes. These SOPs are part of the quality system, and assist in meeting the following objectives: 1) Identify, implement and promote quality assurance policies and procedures that will produce data of a known and verifiable quality, 2) Create and/or identify and follow SOPs for all activities, both technical and administrative, 3) Monitor adherence to the established policies, procedures and written SOPs, 4) Establish and use procedures for continual improvement through both corrective and preventive action policies, and 5) Monitor the quality of the organization's product.
Specifically, these SOPs present the procedures to be used to measure gravity flow in pipes as consistently, as
completely and as accurately as possible. SPU operates and maintains a network of ADS® FlowShark™ sewer
flow monitors as well as some Isco 2150 meters in their sanitary and combined sewer systems. The Piped
Flow Gravity series of standard operating procedures is divided into four detailed parts as follows:
HYDR C3110 – Flow Monitoring Planning and Investigation
HYDR C3120 – Equipment Installation
HYDR C3130 – Field Calibrations and Maintenance and
HYDR C3140 – Field Inspections and Diagnosis
This SOP contains a description of what the user can expect to find in the detailed SOPs listed above.
The techniques described herein are derived from ISO-748, ISO-7178, ISO-8363, ISO-9824, the Profile®
Software Users Guide, the FlowShark Manual and the Long Term Field Methods Manual, all referenced in
Section G of this document. This SOP has been applied to flow monitor data collected since 2007.
B. General Cautions
Flow monitoring locations in sewers are potentially quite dangerous. High flows, poisonous or suffocating gases
and a dirty, corrosive environment await sewer workers. Sewers are defined by OSHA as confined spaces and
therefore, people servicing or inspecting them will require SPU confined space training and certification.
Collecting accurate, reliable sewer flow data is often difficult and sometimes dangerous. This SOP is intended
to provide guidance that will maximize the SPU capture of good, accurate, reliable data.
HYDR C3100 - PIPED FLOW GRAVITY (ADMINISTRATIVE) Page 4 of 6 Standard Operating Procedure
Revision: R1D0 Effective date: 6/20/2008 This is an UNCONTROLLED DOCUMENT. \\Spucommon-svr\common\SSW\WS571\Secure\QMS\Docs\SOPs\Drafts\SOP_HYDR
C3100_R0D4(DRAFT).doc.
C. Personnel Qualifications
Qualifications for this work are unusual. The job requires an understanding of open channel flows, the
difficulties of measuring them precisely, and willingness to get dirty sorting out problems in the field. The
procedures in this SOP are for use only by personnel who have received specific training and demonstrated a
minimum level of competency. Documentation of training will be kept on file and be readily available for review.
D. Equipment and Supplies
The detailed SOPs involve field work, office work and computer work. Detailed lists of equipment and supplies
needed to install, operate and maintain networks of flow monitors are given in those SOPs.
E. Procedures
Procedures for flow monitoring include: general site selection (mapping), specific site selection in the field,
monitor installation, sensor calibration and confirmation, monitor maintenance, data collection, data processing,
data QA/QC, troubleshooting problems, solving data and monitor problems, data verification, data archiving,
data retrieval and data sharing. This SOP describes the information to be found in the detailed SOPs.
In general the steps are planning, investigation, installation, data collection, data processing, problem
recognition, troubleshooting, repair and maintenance.
Clear instructions should be obtained from the Program Manager/Project Manager/Engineer on the
purpose of the monitoring program and the specific areas where monitoring is needed. Recommended
and alternative sites should be approved by the Program Manager/Project Manager/Engineer.
Prior to proceeding to install equipment individuals should check-in with the USM DWW Monitoring Group
(Andrew Lee, Brian Morgenroth and Hai Bach) who manage the monitoring program.
1. 3110 – FLOW MONITORING PLANNING & SITE INVESTIGATIONS
Understanding the problem is a key to success. Are you trying to monitor discharges from a particular
CSO? Are you trying to isolate flooding areas or blockages? Are you trying to quantify or are you trying to
calibrate and verify a model. Each of those functions implies different monitoring strategies; some projects
have multiple goals. A clear idea of the project goals and of the site goals combined with a clear map starts
the job off on the right foot.
This SOP discusses the planning process – the process of selecting good candidate flow monitoring
locations.
2. 3120 – MONITOR AND SENSOR INSTALLATION
For all the sites where you want to install flow meters, gather the Site Sheets and create Location
Information Files on the field computers or in the case of Isco monitors create Site Info files. The location
information files for each site should include parameters like location name, monitor serial number, phone
number or IP address monitor communication ports and others. See ADS Profile User’s Manual, Chapter 2
for a complete list of parameters and procedures needed to set-up, install, activate and confirm a flow
monitor. For Isco monitors, the Site Info files should include all the physical parameters and monitor
module parameters listed in Section 3 of the 2151 Manual.
HYDR C3100 - PIPED FLOW GRAVITY (ADMINISTRATIVE) Page 5 of 6 Standard Operating Procedure
Revision: R1D0 Effective date: 6/20/2008 This is an UNCONTROLLED DOCUMENT. \\Spucommon-svr\common\SSW\WS571\Secure\QMS\Docs\SOPs\Drafts\SOP_HYDR
C3100_R0D4(DRAFT).doc.
This SOP discusses the procedures, skills, tools and equipment needed to install monitors correctly.
3. 3130 – HYDRAULIC CONFIRMATIONS
Hydraulic confirmations are intended to confirm that both depth and velocity sensors in the field are
accurately measuring the depths and velocities of the flow in the pipe. Since most sensors drift over time, it
is essential to check on the sensors quarterly. Some sensors, like pressure sensors, are more prone to drift
than ultrasonic sensors so they may need to be confirmed more often. Similarly, non-redundant sensors
are more prone to drift than are redundant sensors, so non-redundant sensors may also need to be
confirmed more often than quarterly.\
This SOP discusses the procedures, equipment, skills and tools needed to properly calibrate a flow monitor
so that it is reading depth, velocity and flow correctly.
4. 3140 - PROBLEM IDENTIFICATION AND DIAGNOSIS
Problem identification is a skill needed to keep a network of flow monitors up and running at peak
performance.
5. 3140 – VISUAL INSPECTION – FIELD
Upon reaching a monitoring site with problems, field crews should visually examine the monitor to see if
there are any obvious problems, like a missing monitor or disconnected or broken sensor cables and
etc…. Try connecting a field computer directly to the monitor to see if data can be collected via direct-
connect. If the problem isn’t obvious from the surface, descend into the chamber and examine the
sensors and sensor ring. Problems like silt or debris covering the sensors can be corrected easily by
removing the silt or debris. Should a site have chronic silt and debris problems, consider moving the
monitor to a different site. In a few cases where the data are important, but the only monitoring
locations have bad hydraulics, owners have actually built new manholes over hydraulically smooth
sections of pipe to obtain the requisite data.
6. 3140 – ELECTRICAL INSPECTION AND TESTING
If a problematic monitor checks out physically, then the first thing to check inside the monitor is its
power supply. Each type of monitor has its own power supply or batteries, so check to see that the
batteries have sufficient voltage or that the AC power supply is live. Reference the ADS FlowShark manual or the Isco 2150 Manual for the correct reference voltages. If sufficient power is not available
collect the data in the monitor before changing the batteries or in the case of AC powered monitors,
check the power supply back to a point where power exists and replace the intervening wire.
F. Documentation
Documentation is important in flow monitoring in order to link any changes in monitor or sensor layout to
changes in the data.
• Site Sheets and Daily Work Task sheets allow data analysts to keep track of what was done when and
by whom to the meters.
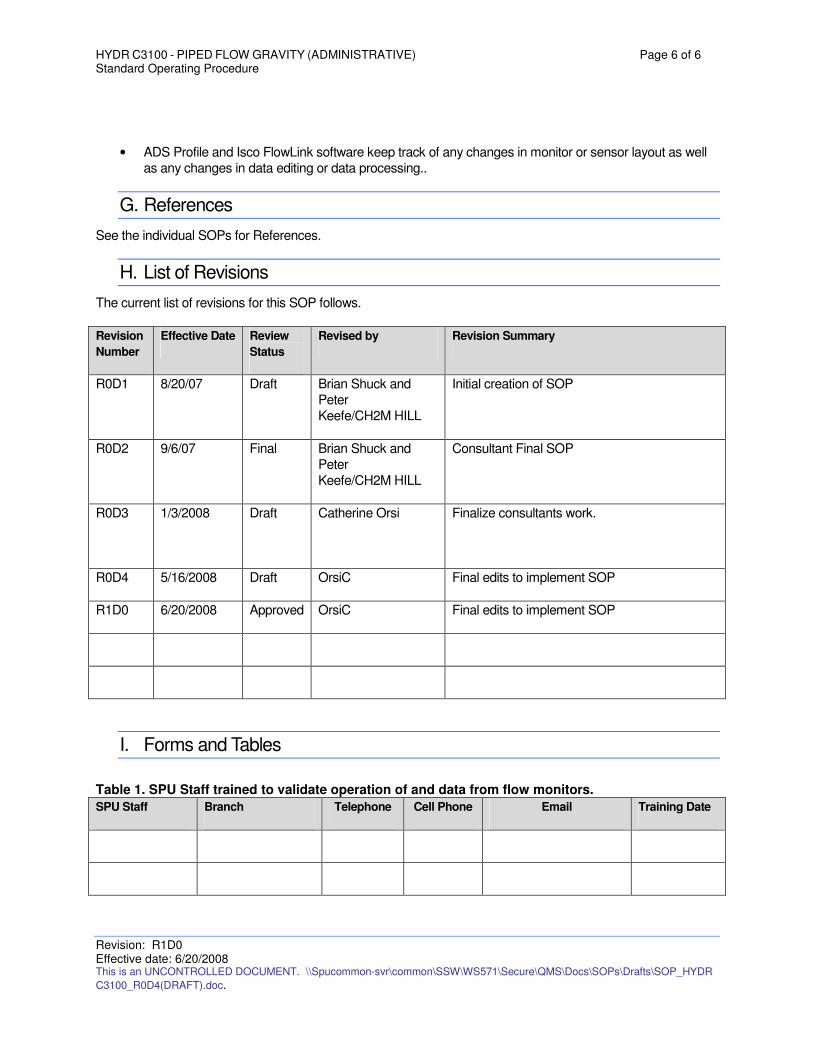
HYDR C3100 - PIPED FLOW GRAVITY (ADMINISTRATIVE) Page 6 of 6 Standard Operating Procedure
Revision: R1D0 Effective date: 6/20/2008 This is an UNCONTROLLED DOCUMENT. \\Spucommon-svr\common\SSW\WS571\Secure\QMS\Docs\SOPs\Drafts\SOP_HYDR
C3100_R0D4(DRAFT).doc.
• ADS Profile and Isco FlowLink software keep track of any changes in monitor or sensor layout as well
as any changes in data editing or data processing..
G. References
See the individual SOPs for References.
H. List of Revisions
The current list of revisions for this SOP follows.
Revision
Number
Effective Date Review
Status
Revised by Revision Summary
R0D1 8/20/07 Draft Brian Shuck and
Peter
Keefe/CH2M HILL
Initial creation of SOP
R0D2 9/6/07 Final Brian Shuck and
Peter
Keefe/CH2M HILL
Consultant Final SOP
R0D3 1/3/2008 Draft Catherine Orsi
Finalize consultants work.
R0D4 5/16/2008 Draft OrsiC Final edits to implement SOP
R1D0 6/20/2008 Approved OrsiC Final edits to implement SOP
I. Forms and Tables
Table 1. SPU Staff trained to validate operation of and data from flow monitors.
SPU Staff Branch Telephone Cell Phone Email Training Date

Identifier:
METR Q1300
Revision:
R0D2(DRAFT)
Draft revised on:
6/20/2008
Custodian:
Brian Morgenroth
Authorization Authority:
Quality Assurance Facilitator (TBD)
Meteorology
Standard Operating Procedure
METR Q1300 - Data Requests
Seattle Public Utilities
Seattle , Washington
This document is part of the Science Information Quality System and describes standard operating procedures to ensure a systematic consistent approach is followed for collecting, assessing, and documenting environmental data of known and documented quality.
METR Q1300 - Data Requests Page ii of 4 Standard Operating Procedure
Revision: R0D2(DRAFT) Draft revised on: 6/20/2008 This is an UNCONTROLLED DOCUMENT. \\Spucommon-
svr\common\SSW\WS571\Secure\QMS\Docs\SOPs\Drafts\SOP_METR Q1300_R0D2(DRAFT).doc.
Table of Contents A. Introduction and Scope .....................................................................................................................................3 B. General Cautions...............................................................................................................................................3 C. Equipment and Supplies ...................................................................................................................................3 D. Procedures........................................................................................................................................................3
1. Log the Data Request....................................................................................................................................3 1.1. Procedure Subtopic ................................................................................................................................3
1.1.1. Procedure Subtopic next..............................................................................................................4 E. References........................................................................................................................................................4 F. List of Revisions ................................................................................................................................................4
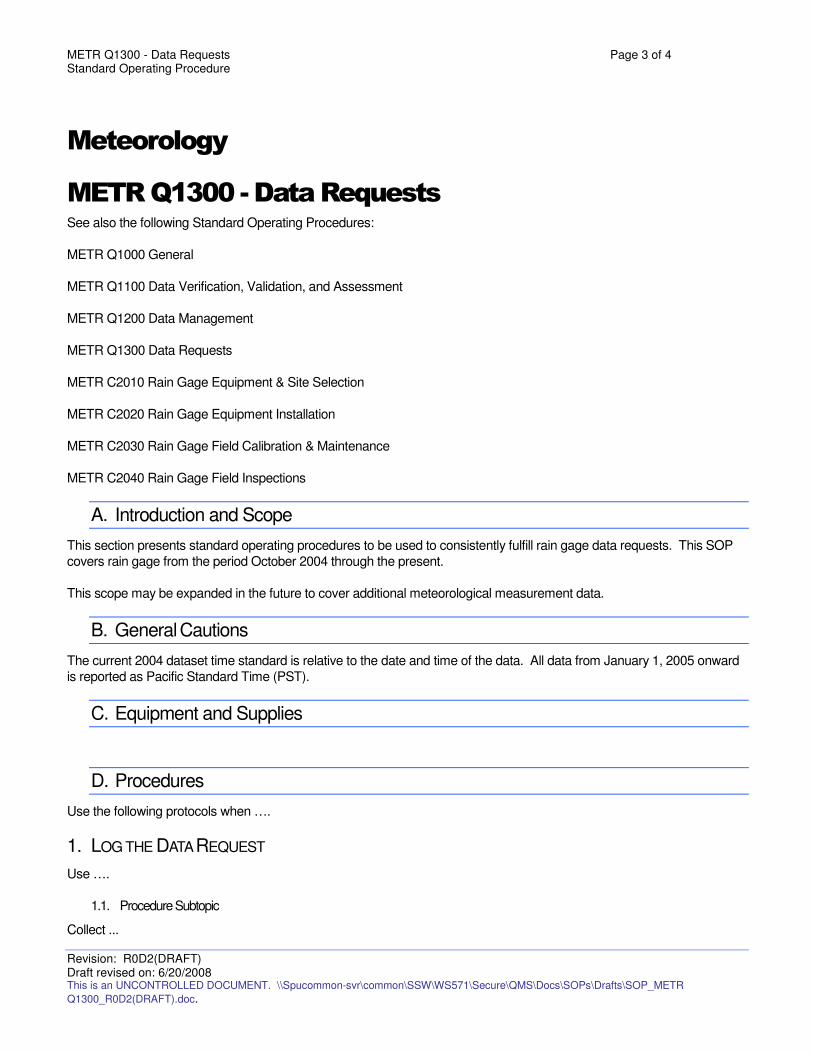
METR Q1300 - Data Requests Page 3 of 4 Standard Operating Procedure
Revision: R0D2(DRAFT) Draft revised on: 6/20/2008 This is an UNCONTROLLED DOCUMENT. \\Spucommon-svr\common\SSW\WS571\Secure\QMS\Docs\SOPs\Drafts\SOP_METR
Q1300_R0D2(DRAFT).doc.
Meteorology
METR Q1300 - Data Requests See also the following Standard Operating Procedures:
METR Q1000 General
METR Q1100 Data Verification, Validation, and Assessment
METR Q1200 Data Management
METR Q1300 Data Requests
METR C2010 Rain Gage Equipment & Site Selection
METR C2020 Rain Gage Equipment Installation
METR C2030 Rain Gage Field Calibration & Maintenance
METR C2040 Rain Gage Field Inspections
A. Introduction and Scope
This section presents standard operating procedures to be used to consistently fulfill rain gage data requests. This SOP
covers rain gage from the period October 2004 through the present.
This scope may be expanded in the future to cover additional meteorological measurement data.
B. General Cautions
The current 2004 dataset time standard is relative to the date and time of the data. All data from January 1, 2005 onward
is reported as Pacific Standard Time (PST).
C. Equipment and Supplies
D. Procedures
Use the following protocols when ….
1. LOG THE DATA REQUEST
Use ….
1.1. Procedure Subtopic
Collect ...
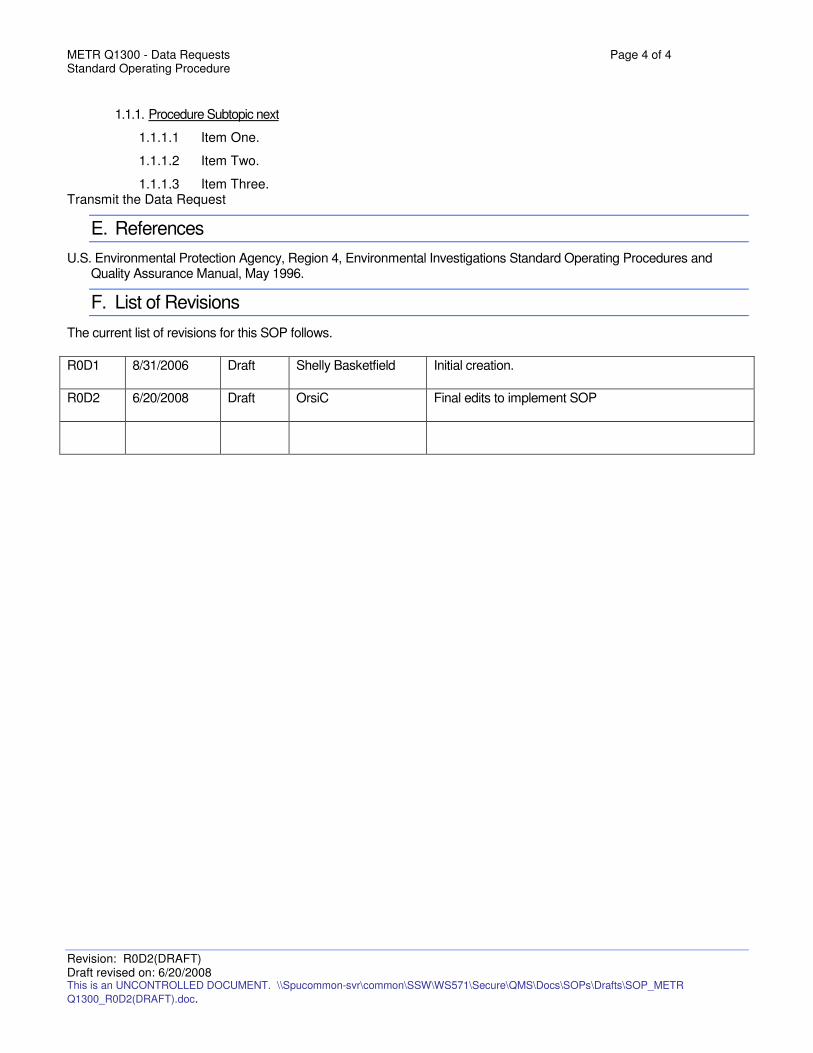
METR Q1300 - Data Requests Page 4 of 4 Standard Operating Procedure
Revision: R0D2(DRAFT) Draft revised on: 6/20/2008 This is an UNCONTROLLED DOCUMENT. \\Spucommon-svr\common\SSW\WS571\Secure\QMS\Docs\SOPs\Drafts\SOP_METR
Q1300_R0D2(DRAFT).doc.
1.1.1. Procedure Subtopic next
1.1.1.1 Item One.
1.1.1.2 Item Two.
1.1.1.3 Item Three. Transmit the Data Request
E. References
U.S. Environmental Protection Agency, Region 4, Environmental Investigations Standard Operating Procedures and Quality Assurance Manual, May 1996.
F. List of Revisions
The current list of revisions for this SOP follows.
R0D1 8/31/2006 Draft Shelly Basketfield Initial creation.
R0D2 6/20/2008 Draft OrsiC Final edits to implement SOP


