Embed Size (px)
Citation preview
Spatial and Spatio-temporal Epidemiology 3 (2012) 55–67
Contents lists available at SciVerse ScienceDirect
Spatial and Spatio-temporal Epidemiology
journal homepage: www.elsevier .com/locate /sste
Quantifying the magnitude of environmental exposuremisclassification when using imprecise address proxiesin public health research
Martin A. Healy, Jason A. Gilliland ⇑The University of Western Ontario, 1151 Richmond St. N, London, Ontario, Canada N6A 5C2
a r t i c l e i n f o
Article history:Available online 11 February 2012
Keywords:Geographic information systemsGeocodingAccessibilityEnvironmental healthPublic health
1877-5845/$ - see front matter � 2012 Elsevier Ltddoi:10.1016/j.sste.2012.02.006
⇑ Corresponding author. Tel.: +1 (519) 661 2111x661 3750.
E-mail address: [email protected] (J.A. Gilliland).
a b s t r a c t
In spatial epidemiologic and public health research it is common to use spatially aggre-gated units such as centroids of postal/zip codes, census tracts, dissemination areas, blocksor block groups as proxies for sample unit locations. Few studies, however, address thepotential problems associated with using these units as address proxies. The purpose ofthis study is to quantify the magnitude of distance errors and accessibility misclassificationthat result from using several commonly-used address proxies in public health research.The impact of these positional discrepancies for spatial epidemiology is illustrated byexamining misclassification of accessibility to several health-related facilities, includinghospitals, public recreation spaces, schools, grocery stores, and junk food retailers through-out the City of London and Middlesex County, Ontario, Canada. Positional errors are quan-tified by multiple neighborhood types, revealing that address proxies are most problematicwhen used to represent residential locations in small towns and rural areas compared tosuburban and urban areas. Findings indicate that the shorter the threshold distance usedto measure accessibility between subject population and health-related facility, the greaterthe proportion of misclassified addresses. Using address proxies based on large aggregatedunits such as centroids of census tracts or dissemination areas can result in very large posi-tional discrepancies (median errors up to 343 and 2088 m in urban and rural areas, respec-tively), and therefore should be avoided in spatial epidemiologic research. Even smaller,commonly-used, proxies for residential address such as postal code centroids can havelarge positional discrepancies (median errors up to 109 and 1363 m in urban and ruralareas, respectively), and are prone to misrepresenting accessibility in small towns and ruralCanada; therefore, postal codes should only be used with caution in spatial epidemiologicresearch.
� 2012 Elsevier Ltd. All rights reserved.
1. Introduction
Recent advances in the analytical capacity of desktopgeographic information system (GIS) software, combinedwith the increasing availability of spatially-referencedhealth and environmental data in digital format, have cre-ated new opportunities for making breakthroughs in spa-
. All rights reserved.
81239; fax: +1 (519)
tial epidemiology (Zandbergen, 2008). As digital mappingis an abstraction of reality, the spatial data used for visual-izing and analyzing geographic phenomena will always beinaccurate to some degree. Such inaccuracies can be com-pounded when spatially aggregated units are used as loca-tional proxies for mapping and analyzing spatialrelationships, rather than more precise geographic loca-tions. In environmental and public health research, it iscommon to use proxies for sample unit locations, such ascentroids of postal/zip codes, census tracts, disseminationareas, blocks, or lots; however, it is very uncommon for
56 M.A. Healy, J.A. Gilliland / Spatial and Spatio-temporal Epidemiology 3 (2012) 55–67
studies to address, or even mention, the potential prob-lems ensuing from the positional discrepancies associatedwith using imprecise address proxies. It is the responsibil-ity of the researcher to identify, quantify, interpret, and at-tempt to reduce any errors associated with using particularspatial data and locational proxies, so that they do notinterfere with any conclusions and recommendations tobe made from the findings (Fotheringham, 1989; Anselin,2006).
Researchers in spatial epidemiology have long beenconcerned about the absolute or relative spatial accuracyof the address points used to map sample populations orphenomena within a GIS (Goldberg, 2008). Numerousresearchers have examined the ‘positional errors’ whichoccur when the address from a database is located on adigital map, but the point is not located at the true positionof the address (Cayo and Talbot, 2003; Ward et al., 2005;Schootman et al., 2007; Strickland et al., 2007; Zandbergenand Green, 2007; Jacquez and Rommel, 2009). In manyprevious studies, positional errors are reported as Euclid-ian distance errors, or errors in the X and Y dimension.While much has been said about positional errors, muchless has been said about how study results might be af-fected when researchers use spatially aggregated units(which themselves might be positionally accurate) as ad-dress proxies. Very few studies measure and compare thepositional discrepancies between address proxies and theexact address they are used to represent (Bow et al., 2004).
A major area of investigation in the fields of spatial epide-miology, health geography, and public health attempts toassess the levels of accessibility or ‘exposure’ of subject pop-ulations to elements in their local environments that are be-lieved to be health-promoting or health-damaging, and arerelated to certain health-related behaviors or outcomes.Accessibility is typically measured in relation to the distancebetween subject populations and selected environmentalfeatures, and is often operationalized as a binary variable(i.e., accessible/inaccessible, exposed/not exposed) or a den-sity variable (i.e., number of sites within, volume of contam-inant within) in relation to an areal unit or ‘buffer’ of acertain threshold distance (radius) around the subject’s ad-dress. There is much variability, but unfortunately not muchdebate, regarding the particular threshold distances to beused in accessibility studies; however, most authors do at-tempt to justify their choice of threshold distances basedon human behavior (e.g. ‘walking distance’) or perhapssome characteristic of contaminant source (e.g. 150 m fromroadway). The chosen accessibility thresholds also typicallyvary by study population (e.g. children vs. adults), setting(e.g. urban vs. rural), and by health-related outcome (e.g.physical activity vs. asthma). In their study of the environ-mental influences on whether or not a child will walk or biketo school, for example, Larsen and colleagues (2009) justifythe choice of a 1600 m neighborhood buffer based on the lo-cal school board cut-off distance for providing school busservice (see also Schlossberg et al., 2006; Muller et al.,2008; Brownson et al., 2009; Panter et al., 2009). Studieswhich have focussed on access to neighborhood resourcessuch as public parks and recreation spaces have utilized avariety of threshold distances, typically between 400 and1600 m (compare Lee et al., 2007; Bjork et al., 2008; Tucker
et al., 2008; Maroko et al., 2009); however, we submit athreshold distance of 500 m is ideal, as it represents a short5–7 min walk, therefore easily accessible for populations ofall ages (see Tucker et al., 2008; Sarmiento et al., 2010; Wol-ch et al., 2010). The 5–7 min walk zone, as represented bythe 500 m buffer around a home or public school, is also acommon distance used in studies exploring the relationshipbetween access to junk food and obesity (see Austin et al.,2005; Morland and Evenson, 2009; Gilliland, 2010). Studiesof ‘food deserts’ (disadvantaged areas with poor access toretailers of healthy and affordable food) and the potentialimpact of poor access to grocery stores on dietary habitsand obesity have tended to focus on longer distances(800 m or greater), and vary according to urban vs. rural set-ting (see Wang et al., 2007; Larsen and Gilliland, 2008;Pearce et al., 2008; Sharkey, 2009; Sadler et al., 2011). Forthe purpose of this analysis, we focus on 1000 m, or the10–15 min walk zone around a grocery store, as has beenidentified in previous studies of food deserts in Canadian cit-ies (Apparicio et al., 2007; Larsen and Gilliland, 2008).Explorations of how distance from a patient’s home to emer-gency services available at hospitals is associated with in-creased risk of mortality are more likely to use muchlarger threshold distances than standard ‘walk zones’ (e.g.greater than 5 km) (see Jones et al., 1997; Cudnick et al.,2010; Nicholl et al., 2007; Acharya et al., 2011). Nicholland colleagues (2007), for example, discovered that a10 km increase in straight-line distance to hospital is associ-ated with a 1% increase in mortality. As hospitals tend to be aregional, rather than a neighborhood facility, we will use thethreshold distance of 10 km for our analyses.
Rushton and colleagues (2006) have argued that whenshort distances between subject population and environ-mental features are associated with health effects in epide-miologic studies, the geocoding result must have apositional accuracy that is sufficient to resolve whethersuch effects are truly present. The purpose of this study isto quantify the magnitude of the positional discrepanciesin terms of distance errors and accessibility misclassifi-cation that result from using several commonly-used ad-dress proxies in public health research. Positional errorshave been shown to vary greatly by setting (Bonner et al.,2003; Cayo and Talbot, 2003; Ward et al., 2005); therefore,we quantify errors by multiple neighborhood types: urban,suburban, small town, and rural. We also attempt to ascribe‘meaning’ to these errors for spatial epidemiologic studiesby examining errors in distance and accessibility misclassi-fication with respect to several health-related features,including hospitals, public recreation facilities, schools,grocery stores, and junk food retailers.
2. Methods
2.1. Study area and data
The City of London (population 350,200) and MiddlesexCounty (population 69,024) in Southwestern Ontario,Canada are ideal study areas for examining the geocodingerrors in accessibility studies as they encompass a mix ofurban, suburban, small town, and rural agricultural areas
M.A. Healy, J.A. Gilliland / Spatial and Spatio-temporal Epidemiology 3 (2012) 55–67 57
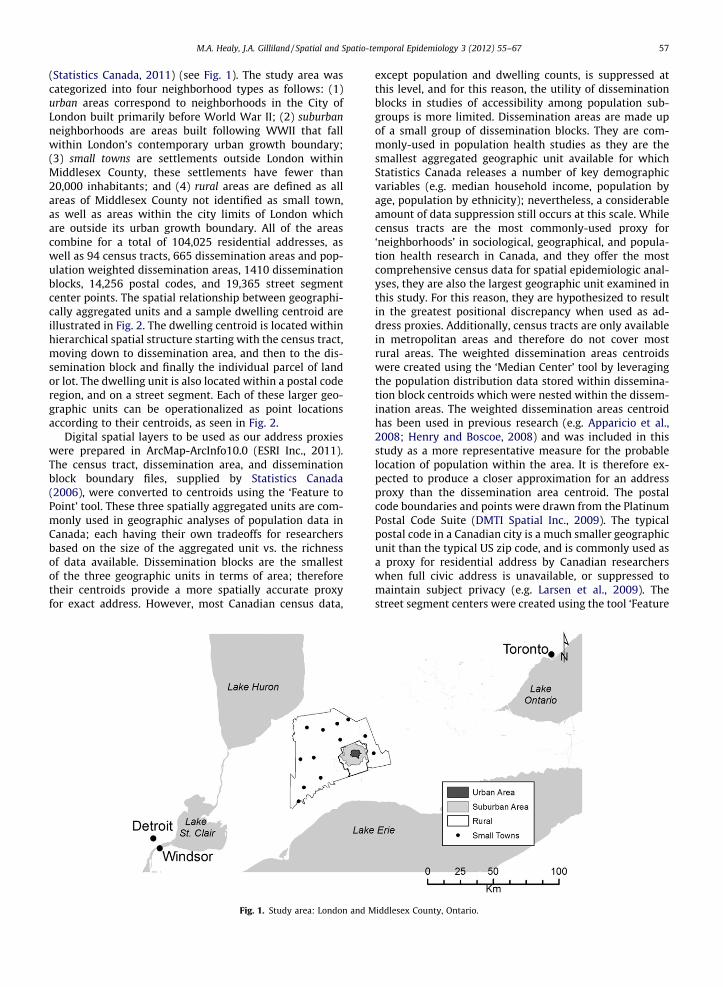
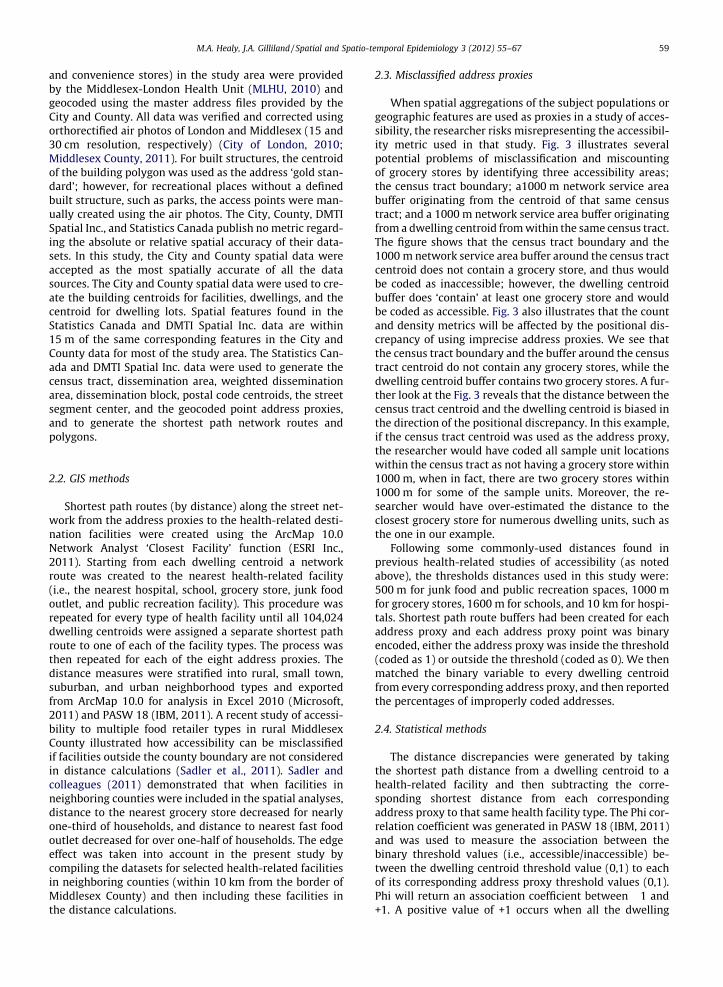
(Statistics Canada, 2011) (see Fig. 1). The study area wascategorized into four neighborhood types as follows: (1)urban areas correspond to neighborhoods in the City ofLondon built primarily before World War II; (2) suburbanneighborhoods are areas built following WWII that fallwithin London’s contemporary urban growth boundary;(3) small towns are settlements outside London withinMiddlesex County, these settlements have fewer than20,000 inhabitants; and (4) rural areas are defined as allareas of Middlesex County not identified as small town,as well as areas within the city limits of London whichare outside its urban growth boundary. All of the areascombine for a total of 104,025 residential addresses, aswell as 94 census tracts, 665 dissemination areas and pop-ulation weighted dissemination areas, 1410 disseminationblocks, 14,256 postal codes, and 19,365 street segmentcenter points. The spatial relationship between geographi-cally aggregated units and a sample dwelling centroid areillustrated in Fig. 2. The dwelling centroid is located withinhierarchical spatial structure starting with the census tract,moving down to dissemination area, and then to the dis-semination block and finally the individual parcel of landor lot. The dwelling unit is also located within a postal coderegion, and on a street segment. Each of these larger geo-graphic units can be operationalized as point locationsaccording to their centroids, as seen in Fig. 2.
Digital spatial layers to be used as our address proxieswere prepared in ArcMap-ArcInfo10.0 (ESRI Inc., 2011).The census tract, dissemination area, and disseminationblock boundary files, supplied by Statistics Canada(2006), were converted to centroids using the ‘Feature toPoint’ tool. These three spatially aggregated units are com-monly used in geographic analyses of population data inCanada; each having their own tradeoffs for researchersbased on the size of the aggregated unit vs. the richnessof data available. Dissemination blocks are the smallestof the three geographic units in terms of area; thereforetheir centroids provide a more spatially accurate proxyfor exact address. However, most Canadian census data,
Fig. 1. Study area: London and M
except population and dwelling counts, is suppressed atthis level, and for this reason, the utility of disseminationblocks in studies of accessibility among population sub-groups is more limited. Dissemination areas are made upof a small group of dissemination blocks. They are com-monly-used in population health studies as they are thesmallest aggregated geographic unit available for whichStatistics Canada releases a number of key demographicvariables (e.g. median household income, population byage, population by ethnicity); nevertheless, a considerableamount of data suppression still occurs at this scale. Whilecensus tracts are the most commonly-used proxy for‘neighborhoods’ in sociological, geographical, and popula-tion health research in Canada, and they offer the mostcomprehensive census data for spatial epidemiologic anal-yses, they are also the largest geographic unit examined inthis study. For this reason, they are hypothesized to resultin the greatest positional discrepancy when used as ad-dress proxies. Additionally, census tracts are only availablein metropolitan areas and therefore do not cover mostrural areas. The weighted dissemination areas centroidswere created using the ‘Median Center’ tool by leveragingthe population distribution data stored within dissemina-tion block centroids which were nested within the dissem-ination areas. The weighted dissemination areas centroidhas been used in previous research (e.g. Apparicio et al.,2008; Henry and Boscoe, 2008) and was included in thisstudy as a more representative measure for the probablelocation of population within the area. It is therefore ex-pected to produce a closer approximation for an addressproxy than the dissemination area centroid. The postalcode boundaries and points were drawn from the PlatinumPostal Code Suite (DMTI Spatial Inc., 2009). The typicalpostal code in a Canadian city is a much smaller geographicunit than the typical US zip code, and is commonly used asa proxy for residential address by Canadian researcherswhen full civic address is unavailable, or suppressed tomaintain subject privacy (e.g. Larsen et al., 2009). Thestreet segment centers were created using the tool ‘Feature
iddlesex County, Ontario.
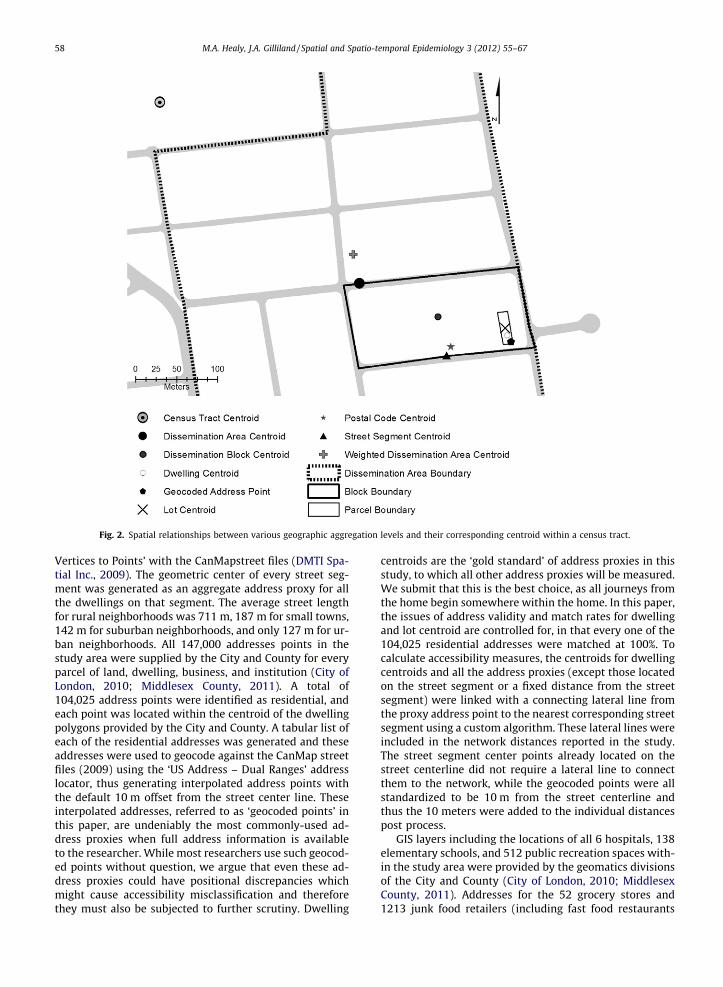
Fig. 2. Spatial relationships between various geographic aggregation levels and their corresponding centroid within a census tract.
58 M.A. Healy, J.A. Gilliland / Spatial and Spatio-temporal Epidemiology 3 (2012) 55–67
Vertices to Points’ with the CanMapstreet files (DMTI Spa-tial Inc., 2009). The geometric center of every street seg-ment was generated as an aggregate address proxy for allthe dwellings on that segment. The average street lengthfor rural neighborhoods was 711 m, 187 m for small towns,142 m for suburban neighborhoods, and only 127 m for ur-ban neighborhoods. All 147,000 addresses points in thestudy area were supplied by the City and County for everyparcel of land, dwelling, business, and institution (City ofLondon, 2010; Middlesex County, 2011). A total of104,025 address points were identified as residential, andeach point was located within the centroid of the dwellingpolygons provided by the City and County. A tabular list ofeach of the residential addresses was generated and theseaddresses were used to geocode against the CanMap streetfiles (2009) using the ‘US Address – Dual Ranges’ addresslocator, thus generating interpolated address points withthe default 10 m offset from the street center line. Theseinterpolated addresses, referred to as ‘geocoded points’ inthis paper, are undeniably the most commonly-used ad-dress proxies when full address information is availableto the researcher. While most researchers use such geocod-ed points without question, we argue that even these ad-dress proxies could have positional discrepancies whichmight cause accessibility misclassification and thereforethey must also be subjected to further scrutiny. Dwelling
centroids are the ‘gold standard’ of address proxies in thisstudy, to which all other address proxies will be measured.We submit that this is the best choice, as all journeys fromthe home begin somewhere within the home. In this paper,the issues of address validity and match rates for dwellingand lot centroid are controlled for, in that every one of the104,025 residential addresses were matched at 100%. Tocalculate accessibility measures, the centroids for dwellingcentroids and all the address proxies (except those locatedon the street segment or a fixed distance from the streetsegment) were linked with a connecting lateral line fromthe proxy address point to the nearest corresponding streetsegment using a custom algorithm. These lateral lines wereincluded in the network distances reported in the study.The street segment center points already located on thestreet centerline did not require a lateral line to connectthem to the network, while the geocoded points were allstandardized to be 10 m from the street centerline andthus the 10 meters were added to the individual distancespost process.
GIS layers including the locations of all 6 hospitals, 138elementary schools, and 512 public recreation spaces with-in the study area were provided by the geomatics divisionsof the City and County (City of London, 2010; MiddlesexCounty, 2011). Addresses for the 52 grocery stores and1213 junk food retailers (including fast food restaurants
M.A. Healy, J.A. Gilliland / Spatial and Spatio-temporal Epidemiology 3 (2012) 55–67 59
and convenience stores) in the study area were providedby the Middlesex-London Health Unit (MLHU, 2010) andgeocoded using the master address files provided by theCity and County. All data was verified and corrected usingorthorectified air photos of London and Middlesex (15 and30 cm resolution, respectively) (City of London, 2010;Middlesex County, 2011). For built structures, the centroidof the building polygon was used as the address ‘gold stan-dard’; however, for recreational places without a definedbuilt structure, such as parks, the access points were man-ually created using the air photos. The City, County, DMTISpatial Inc., and Statistics Canada publish no metric regard-ing the absolute or relative spatial accuracy of their data-sets. In this study, the City and County spatial data wereaccepted as the most spatially accurate of all the datasources. The City and County spatial data were used to cre-ate the building centroids for facilities, dwellings, and thecentroid for dwelling lots. Spatial features found in theStatistics Canada and DMTI Spatial Inc. data are within15 m of the same corresponding features in the City andCounty data for most of the study area. The Statistics Can-ada and DMTI Spatial Inc. data were used to generate thecensus tract, dissemination area, weighted disseminationarea, dissemination block, postal code centroids, the streetsegment center, and the geocoded point address proxies,and to generate the shortest path network routes andpolygons.
2.2. GIS methods
Shortest path routes (by distance) along the street net-work from the address proxies to the health-related desti-nation facilities were created using the ArcMap 10.0Network Analyst ‘Closest Facility’ function (ESRI Inc.,2011). Starting from each dwelling centroid a networkroute was created to the nearest health-related facility(i.e., the nearest hospital, school, grocery store, junk foodoutlet, and public recreation facility). This procedure wasrepeated for every type of health facility until all 104,024dwelling centroids were assigned a separate shortest pathroute to one of each of the facility types. The process wasthen repeated for each of the eight address proxies. Thedistance measures were stratified into rural, small town,suburban, and urban neighborhood types and exportedfrom ArcMap 10.0 for analysis in Excel 2010 (Microsoft,2011) and PASW 18 (IBM, 2011). A recent study of accessi-bility to multiple food retailer types in rural MiddlesexCounty illustrated how accessibility can be misclassifiedif facilities outside the county boundary are not consideredin distance calculations (Sadler et al., 2011). Sadler andcolleagues (2011) demonstrated that when facilities inneighboring counties were included in the spatial analyses,distance to the nearest grocery store decreased for nearlyone-third of households, and distance to nearest fast foodoutlet decreased for over one-half of households. The edgeeffect was taken into account in the present study bycompiling the datasets for selected health-related facilitiesin neighboring counties (within 10 km from the border ofMiddlesex County) and then including these facilities inthe distance calculations.
2.3. Misclassified address proxies
When spatial aggregations of the subject populations orgeographic features are used as proxies in a study of acces-sibility, the researcher risks misrepresenting the accessibil-ity metric used in that study. Fig. 3 illustrates severalpotential problems of misclassification and miscountingof grocery stores by identifying three accessibility areas;the census tract boundary; a1000 m network service areabuffer originating from the centroid of that same censustract; and a 1000 m network service area buffer originatingfrom a dwelling centroid from within the same census tract.The figure shows that the census tract boundary and the1000 m network service area buffer around the census tractcentroid does not contain a grocery store, and thus wouldbe coded as inaccessible; however, the dwelling centroidbuffer does ‘contain’ at least one grocery store and wouldbe coded as accessible. Fig. 3 also illustrates that the countand density metrics will be affected by the positional dis-crepancy of using imprecise address proxies. We see thatthe census tract boundary and the buffer around the censustract centroid do not contain any grocery stores, while thedwelling centroid buffer contains two grocery stores. A fur-ther look at the Fig. 3 reveals that the distance between thecensus tract centroid and the dwelling centroid is biased inthe direction of the positional discrepancy. In this example,if the census tract centroid was used as the address proxy,the researcher would have coded all sample unit locationswithin the census tract as not having a grocery store within1000 m, when in fact, there are two grocery stores within1000 m for some of the sample units. Moreover, the re-searcher would have over-estimated the distance to theclosest grocery store for numerous dwelling units, such asthe one in our example.
Following some commonly-used distances found inprevious health-related studies of accessibility (as notedabove), the thresholds distances used in this study were:500 m for junk food and public recreation spaces, 1000 mfor grocery stores, 1600 m for schools, and 10 km for hospi-tals. Shortest path route buffers had been created for eachaddress proxy and each address proxy point was binaryencoded, either the address proxy was inside the threshold(coded as 1) or outside the threshold (coded as 0). We thenmatched the binary variable to every dwelling centroidfrom every corresponding address proxy, and then reportedthe percentages of improperly coded addresses.
2.4. Statistical methods
The distance discrepancies were generated by takingthe shortest path distance from a dwelling centroid to ahealth-related facility and then subtracting the corre-sponding shortest distance from each correspondingaddress proxy to that same health facility type. The Phi cor-relation coefficient was generated in PASW 18 (IBM, 2011)and was used to measure the association between thebinary threshold values (i.e., accessible/inaccessible) be-tween the dwelling centroid threshold value (0,1) to eachof its corresponding address proxy threshold values (0,1).Phi will return an association coefficient between �1 and+1. A positive value of +1 occurs when all the dwelling
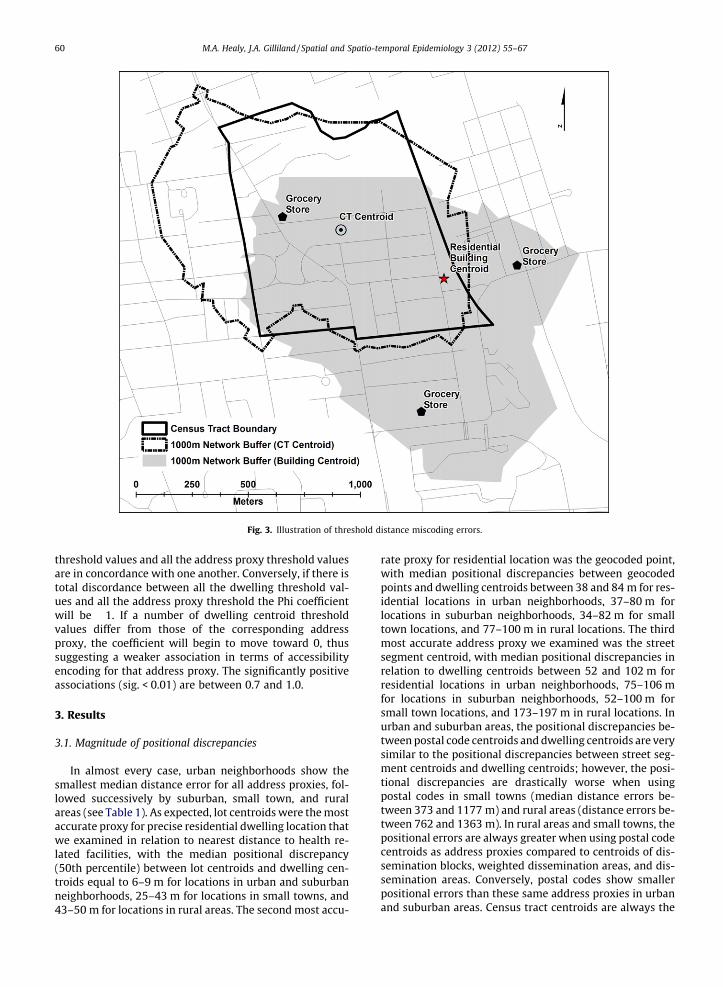
Fig. 3. Illustration of threshold distance miscoding errors.
60 M.A. Healy, J.A. Gilliland / Spatial and Spatio-temporal Epidemiology 3 (2012) 55–67
threshold values and all the address proxy threshold valuesare in concordance with one another. Conversely, if there istotal discordance between all the dwelling threshold val-ues and all the address proxy threshold the Phi coefficientwill be �1. If a number of dwelling centroid thresholdvalues differ from those of the corresponding addressproxy, the coefficient will begin to move toward 0, thussuggesting a weaker association in terms of accessibilityencoding for that address proxy. The significantly positiveassociations (sig. < 0.01) are between 0.7 and 1.0.
3. Results
3.1. Magnitude of positional discrepancies
In almost every case, urban neighborhoods show thesmallest median distance error for all address proxies, fol-lowed successively by suburban, small town, and ruralareas (see Table 1). As expected, lot centroids were the mostaccurate proxy for precise residential dwelling location thatwe examined in relation to nearest distance to health re-lated facilities, with the median positional discrepancy(50th percentile) between lot centroids and dwelling cen-troids equal to 6–9 m for locations in urban and suburbanneighborhoods, 25–43 m for locations in small towns, and43–50 m for locations in rural areas. The second most accu-
rate proxy for residential location was the geocoded point,with median positional discrepancies between geocodedpoints and dwelling centroids between 38 and 84 m for res-idential locations in urban neighborhoods, 37–80 m forlocations in suburban neighborhoods, 34–82 m for smalltown locations, and 77–100 m in rural locations. The thirdmost accurate address proxy we examined was the streetsegment centroid, with median positional discrepancies inrelation to dwelling centroids between 52 and 102 m forresidential locations in urban neighborhoods, 75–106 mfor locations in suburban neighborhoods, 52–100 m forsmall town locations, and 173–197 m in rural locations. Inurban and suburban areas, the positional discrepancies be-tween postal code centroids and dwelling centroids are verysimilar to the positional discrepancies between street seg-ment centroids and dwelling centroids; however, the posi-tional discrepancies are drastically worse when usingpostal codes in small towns (median distance errors be-tween 373 and 1177 m) and rural areas (distance errors be-tween 762 and 1363 m). In rural areas and small towns, thepositional errors are always greater when using postal codecentroids as address proxies compared to centroids of dis-semination blocks, weighted dissemination areas, and dis-semination areas. Conversely, postal codes show smallerpositional errors than these same address proxies in urbanand suburban areas. Census tract centroids are always the
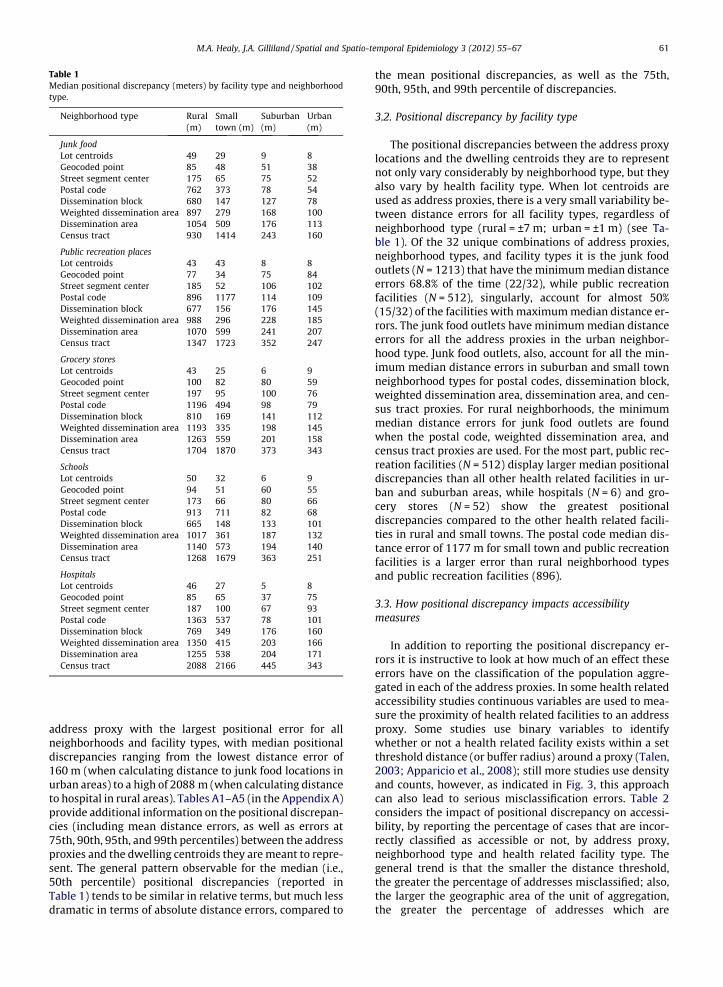
Table 1Median positional discrepancy (meters) by facility type and neighborhoodtype.
Neighborhood type Rural(m)
Smalltown (m)
Suburban(m)
Urban(m)
Junk foodLot centroids 49 29 9 8Geocoded point 85 48 51 38Street segment center 175 65 75 52Postal code 762 373 78 54Dissemination block 680 147 127 78Weighted dissemination area 897 279 168 100Dissemination area 1054 509 176 113Census tract 930 1414 243 160
Public recreation placesLot centroids 43 43 8 8Geocoded point 77 34 75 84Street segment center 185 52 106 102Postal code 896 1177 114 109Dissemination block 677 156 176 145Weighted dissemination area 988 296 228 185Dissemination area 1070 599 241 207Census tract 1347 1723 352 247
Grocery storesLot centroids 43 25 6 9Geocoded point 100 82 80 59Street segment center 197 95 100 76Postal code 1196 494 98 79Dissemination block 810 169 141 112Weighted dissemination area 1193 335 198 145Dissemination area 1263 559 201 158Census tract 1704 1870 373 343
SchoolsLot centroids 50 32 6 9Geocoded point 94 51 60 55Street segment center 173 66 80 66Postal code 913 711 82 68Dissemination block 665 148 133 101Weighted dissemination area 1017 361 187 132Dissemination area 1140 573 194 140Census tract 1268 1679 363 251
HospitalsLot centroids 46 27 5 8Geocoded point 85 65 37 75Street segment center 187 100 67 93Postal code 1363 537 78 101Dissemination block 769 349 176 160Weighted dissemination area 1350 415 203 166Dissemination area 1255 538 204 171Census tract 2088 2166 445 343
M.A. Healy, J.A. Gilliland / Spatial and Spatio-temporal Epidemiology 3 (2012) 55–67 61
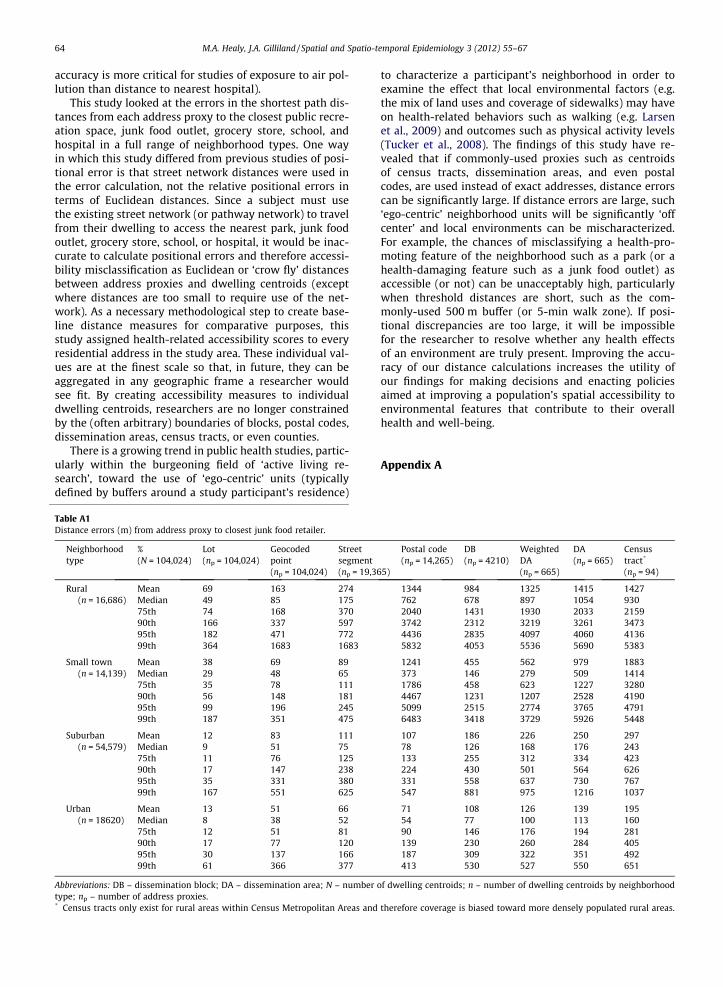
address proxy with the largest positional error for allneighborhoods and facility types, with median positionaldiscrepancies ranging from the lowest distance error of160 m (when calculating distance to junk food locations inurban areas) to a high of 2088 m (when calculating distanceto hospital in rural areas). Tables A1–A5 (in the Appendix A)provide additional information on the positional discrepan-cies (including mean distance errors, as well as errors at75th, 90th, 95th, and 99th percentiles) between the addressproxies and the dwelling centroids they are meant to repre-sent. The general pattern observable for the median (i.e.,50th percentile) positional discrepancies (reported inTable 1) tends to be similar in relative terms, but much lessdramatic in terms of absolute distance errors, compared to
the mean positional discrepancies, as well as the 75th,90th, 95th, and 99th percentile of discrepancies.
3.2. Positional discrepancy by facility type
The positional discrepancies between the address proxylocations and the dwelling centroids they are to representnot only vary considerably by neighborhood type, but theyalso vary by health facility type. When lot centroids areused as address proxies, there is a very small variability be-tween distance errors for all facility types, regardless ofneighborhood type (rural = ±7 m; urban = ±1 m) (see Ta-ble 1). Of the 32 unique combinations of address proxies,neighborhood types, and facility types it is the junk foodoutlets (N = 1213) that have the minimum median distanceerrors 68.8% of the time (22/32), while public recreationfacilities (N = 512), singularly, account for almost 50%(15/32) of the facilities with maximum median distance er-rors. The junk food outlets have minimum median distanceerrors for all the address proxies in the urban neighbor-hood type. Junk food outlets, also, account for all the min-imum median distance errors in suburban and small townneighborhood types for postal codes, dissemination block,weighted dissemination area, dissemination area, and cen-sus tract proxies. For rural neighborhoods, the minimummedian distance errors for junk food outlets are foundwhen the postal code, weighted dissemination area, andcensus tract proxies are used. For the most part, public rec-reation facilities (N = 512) display larger median positionaldiscrepancies than all other health related facilities in ur-ban and suburban areas, while hospitals (N = 6) and gro-cery stores (N = 52) show the greatest positionaldiscrepancies compared to the other health related facili-ties in rural and small towns. The postal code median dis-tance error of 1177 m for small town and public recreationfacilities is a larger error than rural neighborhood typesand public recreation facilities (896).
3.3. How positional discrepancy impacts accessibilitymeasures
In addition to reporting the positional discrepancy er-rors it is instructive to look at how much of an effect theseerrors have on the classification of the population aggre-gated in each of the address proxies. In some health relatedaccessibility studies continuous variables are used to mea-sure the proximity of health related facilities to an addressproxy. Some studies use binary variables to identifywhether or not a health related facility exists within a setthreshold distance (or buffer radius) around a proxy (Talen,2003; Apparicio et al., 2008); still more studies use densityand counts, however, as indicated in Fig. 3, this approachcan also lead to serious misclassification errors. Table 2considers the impact of positional discrepancy on accessi-bility, by reporting the percentage of cases that are incor-rectly classified as accessible or not, by address proxy,neighborhood type and health related facility type. Thegeneral trend is that the smaller the distance threshold,the greater the percentage of addresses misclassified; also,the larger the geographic area of the unit of aggregation,the greater the percentage of addresses which are
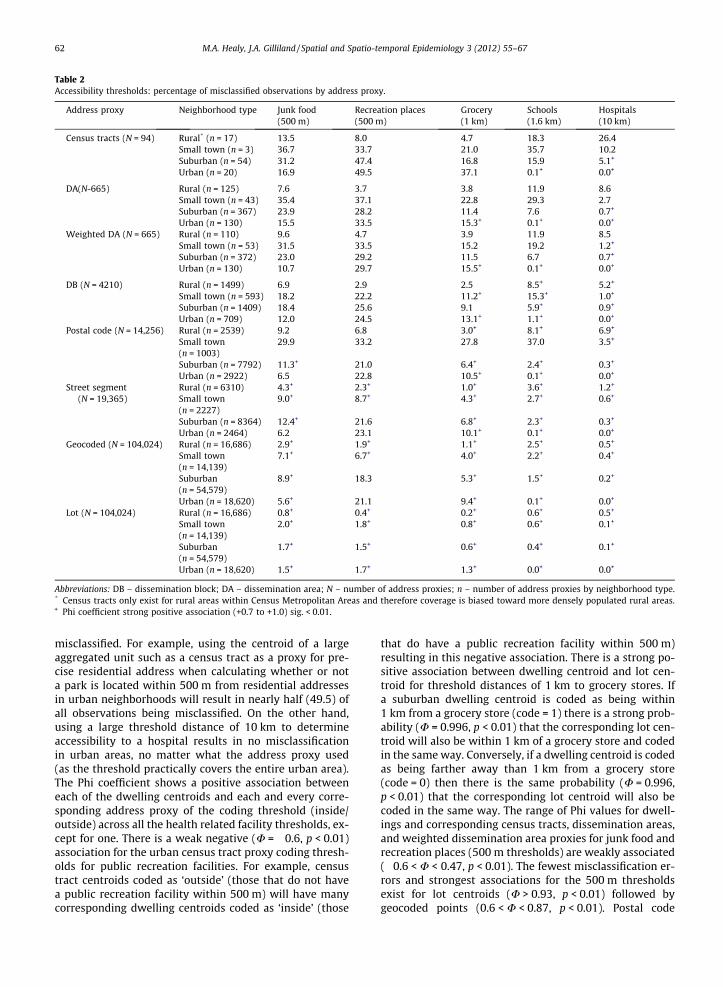
Table 2Accessibility thresholds: percentage of misclassified observations by address proxy.
Address proxy Neighborhood type Junk food(500 m)
Recreation places(500 m)
Grocery(1 km)
Schools(1.6 km)
Hospitals(10 km)
Census tracts (N = 94) Rural* (n = 17) 13.5 8.0 4.7 18.3 26.4Small town (n = 3) 36.7 33.7 21.0 35.7 10.2Suburban (n = 54) 31.2 47.4 16.8 15.9 5.1+
Urban (n = 20) 16.9 49.5 37.1 0.1+ 0.0+
DA(N-665) Rural (n = 125) 7.6 3.7 3.8 11.9 8.6Small town (n = 43) 35.4 37.1 22.8 29.3 2.7Suburban (n = 367) 23.9 28.2 11.4 7.6 0.7+
Urban (n = 130) 15.5 33.5 15.3+ 0.1+ 0.0+
Weighted DA (N = 665) Rural (n = 110) 9.6 4.7 3.9 11.9 8.5Small town (n = 53) 31.5 33.5 15.2 19.2 1.2+
Suburban (n = 372) 23.0 29.2 11.5 6.7 0.7+
Urban (n = 130) 10.7 29.7 15.5+ 0.1+ 0.0+
DB (N = 4210) Rural (n = 1499) 6.9 2.9 2.5 8.5+ 5.2+
Small town (n = 593) 18.2 22.2 11.2+ 15.3+ 1.0+
Suburban (n = 1409) 18.4 25.6 9.1 5.9+ 0.9+
Urban (n = 709) 12.0 24.5 13.1+ 1.1+ 0.0+
Postal code (N = 14,256) Rural (n = 2539) 9.2 6.8 3.0+ 8.1+ 6.9+
Small town(n = 1003)
29.9 33.2 27.8 37.0 3.5+
Suburban (n = 7792) 11.3+ 21.0 6.4+ 2.4+ 0.3+
Urban (n = 2922) 6.5 22.8 10.5+ 0.1+ 0.0+
Street segment(N = 19,365)
Rural (n = 6310) 4.3+ 2.3+ 1.0+ 3.6+ 1.2+
Small town(n = 2227)
9.0+ 8.7+ 4.3+ 2.7+ 0.6+
Suburban (n = 8364) 12.4+ 21.6 6.8+ 2.3+ 0.3+
Urban (n = 2464) 6.2 23.1 10.1+ 0.1+ 0.0+
Geocoded (N = 104,024) Rural (n = 16,686) 2.9+ 1.9+ 1.1+ 2.5+ 0.5+
Small town(n = 14,139)
7.1+ 6.7+ 4.0+ 2.2+ 0.4+
Suburban(n = 54,579)
8.9+ 18.3 5.3+ 1.5+ 0.2+
Urban (n = 18,620) 5.6+ 21.1 9.4+ 0.1+ 0.0+
Lot (N = 104,024) Rural (n = 16,686) 0.8+ 0.4+ 0.2+ 0.6+ 0.5+
Small town(n = 14,139)
2.0+ 1.8+ 0.8+ 0.6+ 0.1+
Suburban(n = 54,579)
1.7+ 1.5+ 0.6+ 0.4+ 0.1+
Urban (n = 18,620) 1.5+ 1.7+ 1.3+ 0.0+ 0.0+
Abbreviations: DB – dissemination block; DA – dissemination area; N – number of address proxies; n – number of address proxies by neighborhood type.* Census tracts only exist for rural areas within Census Metropolitan Areas and therefore coverage is biased toward more densely populated rural areas.+ Phi coefficient strong positive association (+0.7 to +1.0) sig. < 0.01.
62 M.A. Healy, J.A. Gilliland / Spatial and Spatio-temporal Epidemiology 3 (2012) 55–67
misclassified. For example, using the centroid of a largeaggregated unit such as a census tract as a proxy for pre-cise residential address when calculating whether or nota park is located within 500 m from residential addressesin urban neighborhoods will result in nearly half (49.5) ofall observations being misclassified. On the other hand,using a large threshold distance of 10 km to determineaccessibility to a hospital results in no misclassificationin urban areas, no matter what the address proxy used(as the threshold practically covers the entire urban area).The Phi coefficient shows a positive association betweeneach of the dwelling centroids and each and every corre-sponding address proxy of the coding threshold (inside/outside) across all the health related facility thresholds, ex-cept for one. There is a weak negative (U = �0.6, p < 0.01)association for the urban census tract proxy coding thresh-olds for public recreation facilities. For example, censustract centroids coded as ‘outside’ (those that do not havea public recreation facility within 500 m) will have manycorresponding dwelling centroids coded as ‘inside’ (those
that do have a public recreation facility within 500 m)resulting in this negative association. There is a strong po-sitive association between dwelling centroid and lot cen-troid for threshold distances of 1 km to grocery stores. Ifa suburban dwelling centroid is coded as being within1 km from a grocery store (code = 1) there is a strong prob-ability (U = 0.996, p < 0.01) that the corresponding lot cen-troid will also be within 1 km of a grocery store and codedin the same way. Conversely, if a dwelling centroid is codedas being farther away than 1 km from a grocery store(code = 0) then there is the same probability (U = 0.996,p < 0.01) that the corresponding lot centroid will also becoded in the same way. The range of Phi values for dwell-ings and corresponding census tracts, dissemination areas,and weighted dissemination area proxies for junk food andrecreation places (500 m thresholds) are weakly associated(�0.6 < U < 0.47, p < 0.01). The fewest misclassification er-rors and strongest associations for the 500 m thresholdsexist for lot centroids (U > 0.93, p < 0.01) followed bygeocoded points (0.6 < U < 0.87, p < 0.01). Postal code
M.A. Healy, J.A. Gilliland / Spatial and Spatio-temporal Epidemiology 3 (2012) 55–67 63
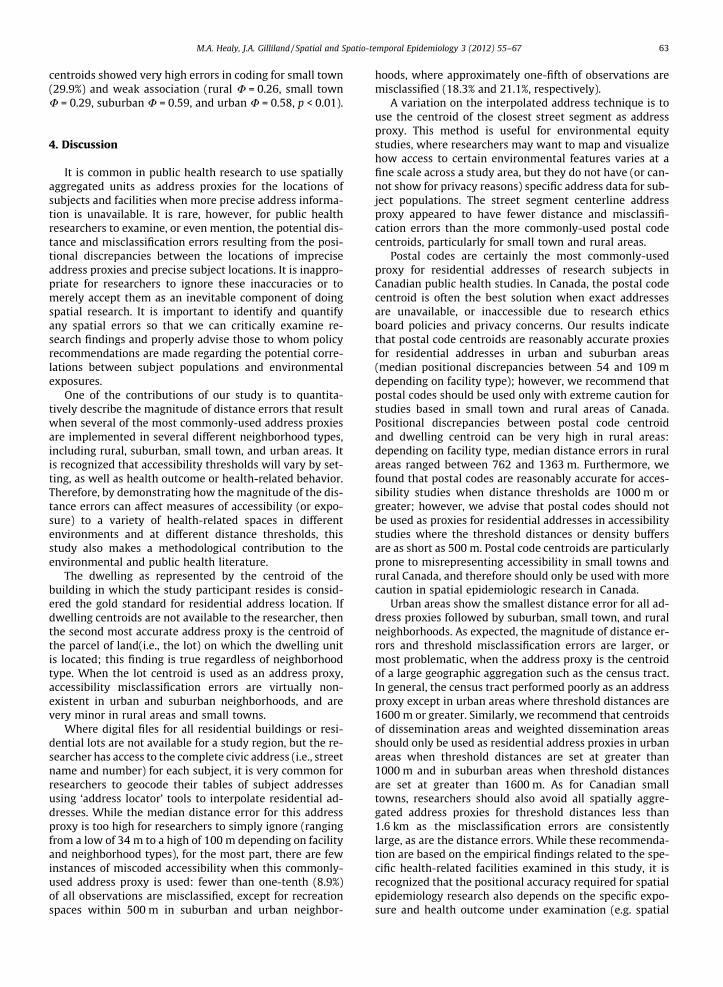
centroids showed very high errors in coding for small town(29.9%) and weak association (rural U = 0.26, small townU = 0.29, suburban U = 0.59, and urban U = 0.58, p < 0.01).
4. Discussion
It is common in public health research to use spatiallyaggregated units as address proxies for the locations ofsubjects and facilities when more precise address informa-tion is unavailable. It is rare, however, for public healthresearchers to examine, or even mention, the potential dis-tance and misclassification errors resulting from the posi-tional discrepancies between the locations of impreciseaddress proxies and precise subject locations. It is inappro-priate for researchers to ignore these inaccuracies or tomerely accept them as an inevitable component of doingspatial research. It is important to identify and quantifyany spatial errors so that we can critically examine re-search findings and properly advise those to whom policyrecommendations are made regarding the potential corre-lations between subject populations and environmentalexposures.
One of the contributions of our study is to quantita-tively describe the magnitude of distance errors that resultwhen several of the most commonly-used address proxiesare implemented in several different neighborhood types,including rural, suburban, small town, and urban areas. Itis recognized that accessibility thresholds will vary by set-ting, as well as health outcome or health-related behavior.Therefore, by demonstrating how the magnitude of the dis-tance errors can affect measures of accessibility (or expo-sure) to a variety of health-related spaces in differentenvironments and at different distance thresholds, thisstudy also makes a methodological contribution to theenvironmental and public health literature.
The dwelling as represented by the centroid of thebuilding in which the study participant resides is consid-ered the gold standard for residential address location. Ifdwelling centroids are not available to the researcher, thenthe second most accurate address proxy is the centroid ofthe parcel of land(i.e., the lot) on which the dwelling unitis located; this finding is true regardless of neighborhoodtype. When the lot centroid is used as an address proxy,accessibility misclassification errors are virtually non-existent in urban and suburban neighborhoods, and arevery minor in rural areas and small towns.
Where digital files for all residential buildings or resi-dential lots are not available for a study region, but the re-searcher has access to the complete civic address (i.e., streetname and number) for each subject, it is very common forresearchers to geocode their tables of subject addressesusing ‘address locator’ tools to interpolate residential ad-dresses. While the median distance error for this addressproxy is too high for researchers to simply ignore (rangingfrom a low of 34 m to a high of 100 m depending on facilityand neighborhood types), for the most part, there are fewinstances of miscoded accessibility when this commonly-used address proxy is used: fewer than one-tenth (8.9%)of all observations are misclassified, except for recreationspaces within 500 m in suburban and urban neighbor-
hoods, where approximately one-fifth of observations aremisclassified (18.3% and 21.1%, respectively).
A variation on the interpolated address technique is touse the centroid of the closest street segment as addressproxy. This method is useful for environmental equitystudies, where researchers may want to map and visualizehow access to certain environmental features varies at afine scale across a study area, but they do not have (or can-not show for privacy reasons) specific address data for sub-ject populations. The street segment centerline addressproxy appeared to have fewer distance and misclassifi-cation errors than the more commonly-used postal codecentroids, particularly for small town and rural areas.
Postal codes are certainly the most commonly-usedproxy for residential addresses of research subjects inCanadian public health studies. In Canada, the postal codecentroid is often the best solution when exact addressesare unavailable, or inaccessible due to research ethicsboard policies and privacy concerns. Our results indicatethat postal code centroids are reasonably accurate proxiesfor residential addresses in urban and suburban areas(median positional discrepancies between 54 and 109 mdepending on facility type); however, we recommend thatpostal codes should be used only with extreme caution forstudies based in small town and rural areas of Canada.Positional discrepancies between postal code centroidand dwelling centroid can be very high in rural areas:depending on facility type, median distance errors in ruralareas ranged between 762 and 1363 m. Furthermore, wefound that postal codes are reasonably accurate for acces-sibility studies when distance thresholds are 1000 m orgreater; however, we advise that postal codes should notbe used as proxies for residential addresses in accessibilitystudies where the threshold distances or density buffersare as short as 500 m. Postal code centroids are particularlyprone to misrepresenting accessibility in small towns andrural Canada, and therefore should only be used with morecaution in spatial epidemiologic research in Canada.
Urban areas show the smallest distance error for all ad-dress proxies followed by suburban, small town, and ruralneighborhoods. As expected, the magnitude of distance er-rors and threshold misclassification errors are larger, ormost problematic, when the address proxy is the centroidof a large geographic aggregation such as the census tract.In general, the census tract performed poorly as an addressproxy except in urban areas where threshold distances are1600 m or greater. Similarly, we recommend that centroidsof dissemination areas and weighted dissemination areasshould only be used as residential address proxies in urbanareas when threshold distances are set at greater than1000 m and in suburban areas when threshold distancesare set at greater than 1600 m. As for Canadian smalltowns, researchers should also avoid all spatially aggre-gated address proxies for threshold distances less than1.6 km as the misclassification errors are consistentlylarge, as are the distance errors. While these recommenda-tion are based on the empirical findings related to the spe-cific health-related facilities examined in this study, it isrecognized that the positional accuracy required for spatialepidemiology research also depends on the specific expo-sure and health outcome under examination (e.g. spatial
64 M.A. Healy, J.A. Gilliland / Spatial and Spatio-temporal Epidemiology 3 (2012) 55–67
accuracy is more critical for studies of exposure to air pol-lution than distance to nearest hospital).
This study looked at the errors in the shortest path dis-tances from each address proxy to the closest public recre-ation space, junk food outlet, grocery store, school, andhospital in a full range of neighborhood types. One wayin which this study differed from previous studies of posi-tional error is that street network distances were used inthe error calculation, not the relative positional errors interms of Euclidean distances. Since a subject must usethe existing street network (or pathway network) to travelfrom their dwelling to access the nearest park, junk foodoutlet, grocery store, school, or hospital, it would be inac-curate to calculate positional errors and therefore accessi-bility misclassification as Euclidean or ‘crow fly’ distancesbetween address proxies and dwelling centroids (exceptwhere distances are too small to require use of the net-work). As a necessary methodological step to create base-line distance measures for comparative purposes, thisstudy assigned health-related accessibility scores to everyresidential address in the study area. These individual val-ues are at the finest scale so that, in future, they can beaggregated in any geographic frame a researcher wouldsee fit. By creating accessibility measures to individualdwelling centroids, researchers are no longer constrainedby the (often arbitrary) boundaries of blocks, postal codes,dissemination areas, census tracts, or even counties.
There is a growing trend in public health studies, partic-ularly within the burgeoning field of ‘active living re-search’, toward the use of ‘ego-centric’ units (typicallydefined by buffers around a study participant’s residence)
Table A1Distance errors (m) from address proxy to closest junk food retailer.
Neighborhoodtype
%(N = 104,024)
Lot(np = 104,024)
Geocodedpoint(np = 104,024)
Streetsegment(np = 19,3
Rural(n = 16,686)
Mean 69 163 274Median 49 85 17575th 74 168 37090th 166 337 59795th 182 471 77299th 364 1683 1683
Small town(n = 14,139)
Mean 38 69 89Median 29 48 6575th 35 78 11190th 56 148 18195th 99 196 24599th 187 351 475
Suburban(n = 54,579)
Mean 12 83 111Median 9 51 7575th 11 76 12590th 17 147 23895th 35 331 38099th 167 551 625
Urban(n = 18620)
Mean 13 51 66Median 8 38 5275th 12 51 8190th 17 77 12095th 30 137 16699th 61 366 377
Abbreviations: DB – dissemination block; DA – dissemination area; N – numbertype; np – number of address proxies.* Census tracts only exist for rural areas within Census Metropolitan Areas and
to characterize a participant’s neighborhood in order toexamine the effect that local environmental factors (e.g.the mix of land uses and coverage of sidewalks) may haveon health-related behaviors such as walking (e.g. Larsenet al., 2009) and outcomes such as physical activity levels(Tucker et al., 2008). The findings of this study have re-vealed that if commonly-used proxies such as centroidsof census tracts, dissemination areas, and even postalcodes, are used instead of exact addresses, distance errorscan be significantly large. If distance errors are large, such‘ego-centric’ neighborhood units will be significantly ‘offcenter’ and local environments can be mischaracterized.For example, the chances of misclassifying a health-pro-moting feature of the neighborhood such as a park (or ahealth-damaging feature such as a junk food outlet) asaccessible (or not) can be unacceptably high, particularlywhen threshold distances are short, such as the com-monly-used 500 m buffer (or 5-min walk zone). If posi-tional discrepancies are too large, it will be impossiblefor the researcher to resolve whether any health effectsof an environment are truly present. Improving the accu-racy of our distance calculations increases the utility ofour findings for making decisions and enacting policiesaimed at improving a population’s spatial accessibility toenvironmental features that contribute to their overallhealth and well-being.
Appendix A
65)
Postal code(np = 14,265)
DB(np = 4210)
WeightedDA(np = 665)
DA(np = 665)
Censustract*
(np = 94)
1344 984 1325 1415 1427762 678 897 1054 9302040 1431 1930 2033 21593742 2312 3219 3261 34734436 2835 4097 4060 41365832 4053 5536 5690 5383
1241 455 562 979 1883373 146 279 509 14141786 458 623 1227 32804467 1231 1207 2528 41905099 2515 2774 3765 47916483 3418 3729 5926 5448
107 186 226 250 29778 126 168 176 243133 255 312 334 423224 430 501 564 626331 558 637 730 767547 881 975 1216 1037
71 108 126 139 19554 77 100 113 16090 146 176 194 281139 230 260 284 405187 309 322 351 492413 530 527 550 651
of dwelling centroids; n – number of dwelling centroids by neighborhood
therefore coverage is biased toward more densely populated rural areas.
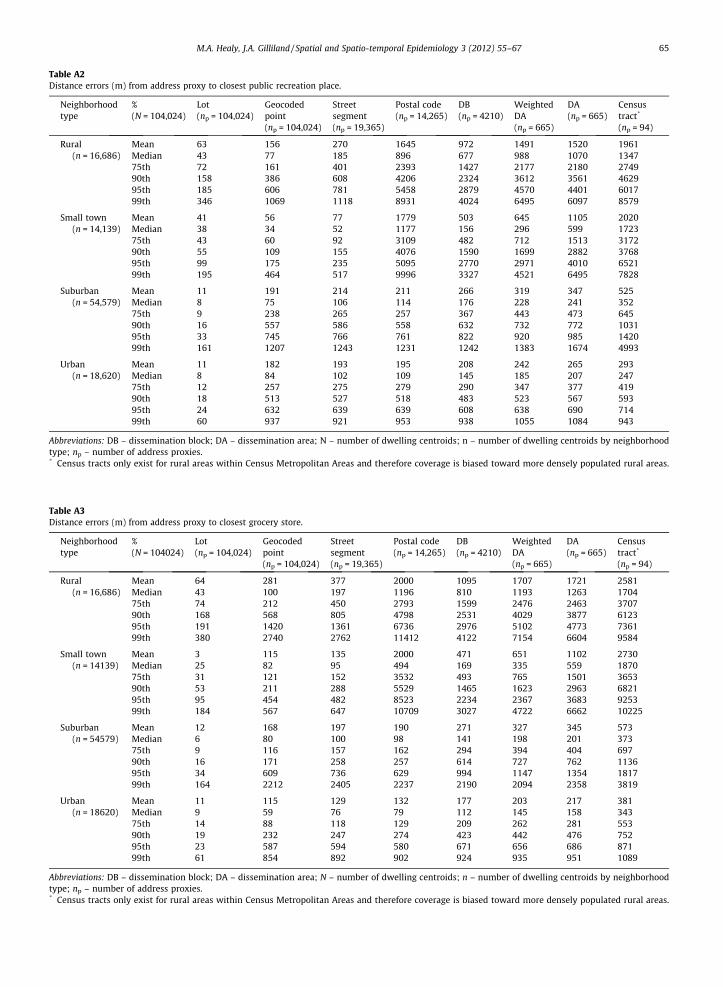
Table A2Distance errors (m) from address proxy to closest public recreation place.
Neighborhoodtype
%(N = 104,024)
Lot(np = 104,024)
Geocodedpoint(np = 104,024)
Streetsegment(np = 19,365)
Postal code(np = 14,265)
DB(np = 4210)
WeightedDA(np = 665)
DA(np = 665)
Censustract*
(np = 94)
Rural(n = 16,686)
Mean 63 156 270 1645 972 1491 1520 1961Median 43 77 185 896 677 988 1070 134775th 72 161 401 2393 1427 2177 2180 274990th 158 386 608 4206 2324 3612 3561 462995th 185 606 781 5458 2879 4570 4401 601799th 346 1069 1118 8931 4024 6495 6097 8579
Small town(n = 14,139)
Mean 41 56 77 1779 503 645 1105 2020Median 38 34 52 1177 156 296 599 172375th 43 60 92 3109 482 712 1513 317290th 55 109 155 4076 1590 1699 2882 376895th 99 175 235 5095 2770 2971 4010 652199th 195 464 517 9996 3327 4521 6495 7828
Suburban(n = 54,579)
Mean 11 191 214 211 266 319 347 525Median 8 75 106 114 176 228 241 35275th 9 238 265 257 367 443 473 64590th 16 557 586 558 632 732 772 103195th 33 745 766 761 822 920 985 142099th 161 1207 1243 1231 1242 1383 1674 4993
Urban(n = 18,620)
Mean 11 182 193 195 208 242 265 293Median 8 84 102 109 145 185 207 24775th 12 257 275 279 290 347 377 41990th 18 513 527 518 483 523 567 59395th 24 632 639 639 608 638 690 71499th 60 937 921 953 938 1055 1084 943
Abbreviations: DB – dissemination block; DA – dissemination area; N – number of dwelling centroids; n – number of dwelling centroids by neighborhoodtype; np – number of address proxies.* Census tracts only exist for rural areas within Census Metropolitan Areas and therefore coverage is biased toward more densely populated rural areas.
Table A3Distance errors (m) from address proxy to closest grocery store.
Neighborhoodtype
%(N = 104024)
Lot(np = 104,024)
Geocodedpoint(np = 104,024)
Streetsegment(np = 19,365)
Postal code(np = 14,265)
DB(np = 4210)
WeightedDA(np = 665)
DA(np = 665)
Censustract*
(np = 94)
Rural(n = 16,686)
Mean 64 281 377 2000 1095 1707 1721 2581Median 43 100 197 1196 810 1193 1263 170475th 74 212 450 2793 1599 2476 2463 370790th 168 568 805 4798 2531 4029 3877 612395th 191 1420 1361 6736 2976 5102 4773 736199th 380 2740 2762 11412 4122 7154 6604 9584
Small town(n = 14139)
Mean 3 115 135 2000 471 651 1102 2730Median 25 82 95 494 169 335 559 187075th 31 121 152 3532 493 765 1501 365390th 53 211 288 5529 1465 1623 2963 682195th 95 454 482 8523 2234 2367 3683 925399th 184 567 647 10709 3027 4722 6662 10225
Suburban(n = 54579)
Mean 12 168 197 190 271 327 345 573Median 6 80 100 98 141 198 201 37375th 9 116 157 162 294 394 404 69790th 16 171 258 257 614 727 762 113695th 34 609 736 629 994 1147 1354 181799th 164 2212 2405 2237 2190 2094 2358 3819
Urban(n = 18620)
Mean 11 115 129 132 177 203 217 381Median 9 59 76 79 112 145 158 34375th 14 88 118 129 209 262 281 55390th 19 232 247 274 423 442 476 75295th 23 587 594 580 671 656 686 87199th 61 854 892 902 924 935 951 1089
Abbreviations: DB – dissemination block; DA – dissemination area; N – number of dwelling centroids; n – number of dwelling centroids by neighborhoodtype; np – number of address proxies.* Census tracts only exist for rural areas within Census Metropolitan Areas and therefore coverage is biased toward more densely populated rural areas.
M.A. Healy, J.A. Gilliland / Spatial and Spatio-temporal Epidemiology 3 (2012) 55–67 65
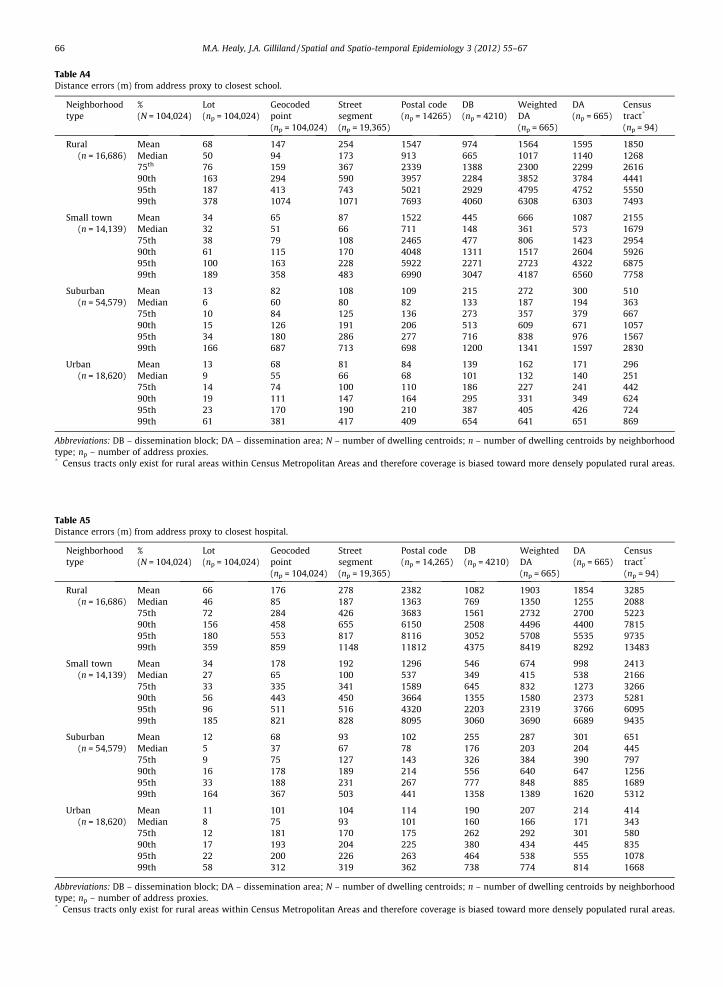
Table A4Distance errors (m) from address proxy to closest school.
Neighborhoodtype
%(N = 104,024)
Lot(np = 104,024)
Geocodedpoint(np = 104,024)
Streetsegment(np = 19,365)
Postal code(np = 14265)
DB(np = 4210)
WeightedDA(np = 665)
DA(np = 665)
Censustract*
(np = 94)
Rural(n = 16,686)
Mean 68 147 254 1547 974 1564 1595 1850Median 50 94 173 913 665 1017 1140 126875th 76 159 367 2339 1388 2300 2299 261690th 163 294 590 3957 2284 3852 3784 444195th 187 413 743 5021 2929 4795 4752 555099th 378 1074 1071 7693 4060 6308 6303 7493
Small town(n = 14,139)
Mean 34 65 87 1522 445 666 1087 2155Median 32 51 66 711 148 361 573 167975th 38 79 108 2465 477 806 1423 295490th 61 115 170 4048 1311 1517 2604 592695th 100 163 228 5922 2271 2723 4322 687599th 189 358 483 6990 3047 4187 6560 7758
Suburban(n = 54,579)
Mean 13 82 108 109 215 272 300 510Median 6 60 80 82 133 187 194 36375th 10 84 125 136 273 357 379 66790th 15 126 191 206 513 609 671 105795th 34 180 286 277 716 838 976 156799th 166 687 713 698 1200 1341 1597 2830
Urban(n = 18,620)
Mean 13 68 81 84 139 162 171 296Median 9 55 66 68 101 132 140 25175th 14 74 100 110 186 227 241 44290th 19 111 147 164 295 331 349 62495th 23 170 190 210 387 405 426 72499th 61 381 417 409 654 641 651 869
Abbreviations: DB – dissemination block; DA – dissemination area; N – number of dwelling centroids; n – number of dwelling centroids by neighborhoodtype; np – number of address proxies.* Census tracts only exist for rural areas within Census Metropolitan Areas and therefore coverage is biased toward more densely populated rural areas.
Table A5Distance errors (m) from address proxy to closest hospital.
Neighborhoodtype
%(N = 104,024)
Lot(np = 104,024)
Geocodedpoint(np = 104,024)
Streetsegment(np = 19,365)
Postal code(np = 14,265)
DB(np = 4210)
WeightedDA(np = 665)
DA(np = 665)
Censustract*
(np = 94)
Rural(n = 16,686)
Mean 66 176 278 2382 1082 1903 1854 3285Median 46 85 187 1363 769 1350 1255 208875th 72 284 426 3683 1561 2732 2700 522390th 156 458 655 6150 2508 4496 4400 781595th 180 553 817 8116 3052 5708 5535 973599th 359 859 1148 11812 4375 8419 8292 13483
Small town(n = 14,139)
Mean 34 178 192 1296 546 674 998 2413Median 27 65 100 537 349 415 538 216675th 33 335 341 1589 645 832 1273 326690th 56 443 450 3664 1355 1580 2373 528195th 96 511 516 4320 2203 2319 3766 609599th 185 821 828 8095 3060 3690 6689 9435
Suburban(n = 54,579)
Mean 12 68 93 102 255 287 301 651Median 5 37 67 78 176 203 204 44575th 9 75 127 143 326 384 390 79790th 16 178 189 214 556 640 647 125695th 33 188 231 267 777 848 885 168999th 164 367 503 441 1358 1389 1620 5312
Urban(n = 18,620)
Mean 11 101 104 114 190 207 214 414Median 8 75 93 101 160 166 171 34375th 12 181 170 175 262 292 301 58090th 17 193 204 225 380 434 445 83595th 22 200 226 263 464 538 555 107899th 58 312 319 362 738 774 814 1668
Abbreviations: DB – dissemination block; DA – dissemination area; N – number of dwelling centroids; n – number of dwelling centroids by neighborhoodtype; np – number of address proxies.* Census tracts only exist for rural areas within Census Metropolitan Areas and therefore coverage is biased toward more densely populated rural areas.
66 M.A. Healy, J.A. Gilliland / Spatial and Spatio-temporal Epidemiology 3 (2012) 55–67
M.A. Healy, J.A. Gilliland / Spatial and Spatio-temporal Epidemiology 3 (2012) 55–67 67
References
Acharya A, Nyirenda J, Higgs G, Bloomfield M, Cruz-Flores S, Connor L,et al. Distance from home to hospital and thrombolytic utilization foracute ischemic stroke. J Stroke Cerebrovasc Dis 2011;20(4):295–301.
Anselin L. How (not) to lie with spatial statistics. Am J Prev Med2006;30(2):S3–6.
Apparicio P, Cloutier M, Shearmur R. The case of Montréal’s missing fooddeserts: evaluation of accessibility to food supermarkets. Int J HealthGeog 2007;6(4):12.
Apparicio P, Abdelmajid M, Riva M, Shearmur R. Comparing alternativeapproaches to measuring the geographical accessibility of urbanhealth services: distance types and aggregation-error issues. Int JHealth Geogr 2008;7(7).
Austin S, Melly S, Sanchez B, Patel A, Buka S, Gortmaker A. Clustering offast-food restaurants around schools: a novel application of spatialstatistics to the study of food environments. Am J Public Health2005;95(9):1575–81.
Bjork J, Albin M, Grahn P, Jacobsson H, Ardo J, Wadbro J, et al. Recreationalvalues of the natural environment in relation to neighbourhoodsatisfaction, physical activity, obesity and wellbeing. J EpidemiolCommunity Health 2008;62(2).
Bonner M, Daikwon H, Nie J, Rogerson P, Vena J, Freudenheim J. Positionalaccuracy of geocoded addresses in epidemiologic research.Epidemiology 2003;14:408–12.
Bow C, Jennifer D, Waters N, Faris P, Seidel J, Galbraith D, et al. Accuracy ofcity postal code coordinates as a proxy for location of residence. Int JHealth Geogr 2004;3(5).
Brownson R, Hoehner C, Day K, Forsyth A, Sallis J. Measuring the builtenvironment for physical activity: state of the science. Am J Prev Med2009;36(S4):S99–S123.
Cayo M, Talbot T. Positional error in automated geocoding of residentialaddresses. Int J Health Geogr 2003;2(10).
City of London. Parcels, buildings, address points, and health facilities GISfiles [DVD]. London (ON): Geomatics Division; 2010.
Cudnick M, Schmicke R, Vaillancourt C, Newgard C, Christenson J, Davis,et al. A geospatial assessment of transport distance and survival todischarge in out of hospital cardiac arrest patients: Implications forresuscitation centers. Resuscitation 2010;81:518–23.
DMTI Spatial Inc. Database of postal code centroids and street centerlineGIS files [Internet], Ottawa(On);2009. Available from <http://equinox.uwo.ca>.
Fotheringham S. Scale-independent spatial analysis. In: Goodchild M,Gopal S, editors. Accuracy of spatial data. London: Taylor & Francis;1989. p. 221–8.
Gilliland J. The Built environment and obesity: trimming waistlinesthrough neighbourhood design. In: Bunting, Filion, Walker, editors.Canadian cities in transition. 4th ed. Oxford Univ Press; 2010. p. 391–410.
Goldberg D. A Geocoding Best Practices Guide. Springfield, IL North AmAssoc Cent Cancer Registries;2008.
Henry K, Boscoe F. Estimating the accuracy of geographical imputation.Int J Health Geogr 2008;7(3).
Jacquez G, Rommel R. Local indicators of geocoding accuracy (LIGA):theory and application. Int J Health Geogr 2009;8(60).
Jones A, Bentham G, Horwell C. Health service accessibility and deathsfrom asthma in 401 local authority districts in England and Wales,1988–92. Thorax 1997;52:218–22.
Larsen K, Gilliland J. Mapping the evolution of ‘food deserts’ in a Canadiancity: supermarket accessibility in London, Ontario, 1961–2005. Int JHealth Geogr 2008;7(16).
Larsen K, Gilliland J, Hess P, Tucker P, Irwin J, He M. The influence of thephysical environment and sociodemographic characteristics onchildren’s mode of travel to and from school. Am J Public Health2009;99(3):520–6.
Lee R, Cubbin C, Winkleby M. Contribution of neighbourhoodsocioeconomic status and physical activity resources to physicalactivity among women. J Epidemiol Community Health 2007;61:882–90.
Maroko A, Maantay J, Sohler N, Grady K, Arno P. The complexities ofmeasuring access to parks and physical activity sites in New York
city: a quantitative and qualitative approach. Int J Health Geogr2009;8(34).
Middlesex County. Database of parcels, address point, aerial photos, andhealth facilities GIS files [DVD]. London (ON): Middlesex CountyPlanning Dept.;2011.
Middlesex-London Health Unit. Database of food retailers [DVD].London(ON): Middlesex County Food Inspection Dept.;2010.
Morland K, Evenson K. Obesity prevalence and the local foodenvironment. Health Place 2009;15:491–5.
Muller S, Tscharaktschiew S, Haase K. Travel-to-school mode choicemodelling and patterns of school choice in urban areas. J TransportGeog 2008;16:342–57.
Nicholl J, West J, Goodacre S, Turner J. The relationship between distanceto hospital and patient mortality in emergencies: an observationalstudy. Emerg Med J 2007;24:665–8.
Panter J, Jones A, van Sluijs E, Griffin S. Attitudes, social support andenvironmental perceptions as predictors of active commutingbehaviour in school children. J Epidemiol Community Health2009;61:389–95.
Pearce J, Hiscok R, Blakely T, Witten K. The contextual effects ofneighbourhood access to supermarkets and convenience stores onindividual fruit and vegetable consumption. J Epidemiol CommunityHealth 2008;62:198–201.
Rushton G, Armstrong M, Gittler J, Greene B, Pavlik C, West M,Zimmerman D. Geocoding in Cancer Research. Am J Prev Med2006;30(2):S16–24.
Sadler R, Gilliland J, Arku G. An application of the edge effect in measuringaccessibility to multiple food retailer types in Southwestern Ontario,Canada. Int J Health Geogr 2011;10:34.
Sarmiento OL, Schmid TL, Parra DC, Diaz-del-Castillo A, Gomez LF, PrattM, Jacoby E, Pinzon JD, Duperly J. Quality of life, physical activity, andbuilt environment characteristics among Columbian adults. J Phys ActHealth 2010;2010 7(S2):S181–95.
Schlossberg M, Greene J, Phillips P, Johnson B, Barker B. School trips:effects of urban form and distance on travel mode. Am Plann Assoc: JAm Plann Assoc 2006;72(3):337–46.
Schootman M, Sterling D, Struthersa J, Yan Y, Laboubea T, Emo B, et al.Positional accuracy and geographic bias of four methods of geocodingin epidemiologic research. Ann Epidemiol 2007;17(6):464–70.
Sharkey J. Measuring potential access to food stores and food-serviceplaces in rural areas in the US. Am J Prev Med 2009;36(4):S151–5.
Statistics Canada. Census boundary files [Internet]. Ottawa (On); DataLiberation Initiative;c2006. Available from <http://equinox.uwo.ca>.
Statistics Canada. Rural and Small Town Canada Analysis Bulletin 2011.Available from <http://www.statcan.gc.ca/pub/21-006-x/21-006-x2001003-eng.pdf>.
Strickland M, Siffel C, Gardner B, Berzen A, Correa A. Quantifying geocodelocation error using GIS methods. Environ Health 2007;6:10.
Talen E. Neighborhoods as service providers: a methodology forevaluating pedestrian access. Environ Plann B Plann Des2003;30(2):181–200.
Tucker P, Irwin J, Gillliland J, Larsen K, He M, Hess P. Environmentalinfluences on physical activity levels in youth. Health Place2008;15(1):357–63.
Wang M, Kim S, Gonzalez A, MacLeod K, Winkleby M. Socioeconomic andfood-related physical characteristics of the neighbourhoodenvironment are associated with body mass index. J EpidemiolCommunity Health 2007;61:491–8.
Ward M, Nuckols J, Giglierano J, Bonner M, Wolter C, Airola M, et al.Positional accuracy of two methods of geocoding. Epidemiology2005;16(4):542–7.
Wolch J, Jerrett M, Reynolds K, McConnell R, Chang R, Dahmann N, BradyK, Gilliland F, Su JG, Berhane K. Childhood obesity and proximity toparks and recreational resources: a longitudinal cohort study. HealthPlace 2010;17(1):207–14.
Zandbergen P, Green J. Error and bias in determining exposure potentialof children at school locations using proximity-based GIS techniques.Environ Health Perspect 2007;115(9):1363–70.
Zandbergen P. A comparison of address point, parcel and street geocodingtechniques. Comput Environ Urban Syst 2008;32(3):214–32.


