Embed Size (px)
Citation preview

Journal of Immunological Methods 349 (2009) 45–55
Contents lists available at ScienceDirect
Journal of Immunological Methods
j ourna l homepage: www.e lsev ie r.com/ locate / j im
Research paper
Quantitative analysis of cytokine-induced vascular toxicity and vascular leakin the mouse brain
Yetty Y. Irwan a,b, Yi Feng c, H. Michael Gach d, James T. Symanowski e, John R. McGregor a,Gopalkrishna Veni d, Matthias Schabel f, Wolfram E. Samlowski a,⁎a Section of Melanoma, Renal Cancer and Immunotherapy, Nevada Cancer Institute, Las Vegas, United Statesb Department of Pathology, University of Utah, Salt Lake City, United Statesc Department of Drug Development, Nevada Cancer Institute, Las Vegas, United Statesd Department of Research Imaging, Nevada Cancer Institute, Las Vegas, United Statese Department of Biostatistics, Nevada Cancer Institute, Las Vegas, United Statesf Department of Radiology, Utah Center for Advanced Imaging Research/Center for Advanced Medical Technologies, University of Utah, Salt Lake City, United States
a r t i c l e i n f o
Abbreviations: IL-2, interleukin-2; VLS, vascularnitric oxide; MRI, magnetic resonance imaging; BBBNaFl, sodium fluorescein; Iso-B4, isolectin GS-IB4; vFactor; ROI, region of interest; SI, signal intensity; PDdynamic contrast enhanced.⁎ Corresponding author. Nevada Cancer Institute, On
Las Vegas, NV 89135, United States. Tel.: +1 702 822 52347.
E-mail address: [email protected] (W.E. S
0022-1759/$ – see front matter © 2009 Elsevier B.V.doi:10.1016/j.jim.2009.07.014
a b s t r a c t
Article history:Received 26 May 2009Received in revised form 25 July 2009Accepted 28 July 2009Available online 5 August 2009
A stormof inflammatory cytokines is releasedduring treatmentwithpro-inflammatory cytokines,such as interleukin-2 (IL-2), closely approximating changes initially observed during sepsis. Thesesignals induce profound changes in neurologic function and cognition. Little is known about themechanisms involved. We evaluated a number of experimental methods to quantify changes inbrain blood vessel integrity in awell-characterized IL-2 treatmentmousemodel. Measurement ofwet versus dry weight and direct measurement of small molecule accumulation (e.g. [3H]–H2O,sodium fluorescein) were not sensitive or reliable enough to detect small changes inmouse brainvascular permeability. Estimation of brainwater content using protondensitymagnetic resonanceimaging (MRI) measurements using a 7 T mouse MRI system was sensitive to 1–2% changes inbrainwater content, butwas difficult to reproduce in replicate experiments. Successful techniquesincluded use of immunohistochemistry using specific endothelialmarkers to identify vasodilationin carefully matched regions of brain parenchyma and dynamic contrast enhanced (DCE) MRI.Both techniques indicated that IL-2 treatment induced vasodilation of the brain blood vessels. DCEMRI further showed a 2-fold increase in the brain blood vessel permeability to gadolinium in IL-2treatedmice compared to controls. Both immunohistochemistry andDCEMRI data suggested thatIL-2 induced toxicity in the brain results fromvasodilation of the brain blood vessels and increasedmicrovascular permeability, resulting in perivascular edema. These experimental techniquesprovide uswith the tools to further characterize themechanism responsible for cytokine-inducedneuropsychiatric toxicity.
© 2009 Elsevier B.V. All rights reserved.
Keywords:Interleukin-2CytokinesBrain edemaNeuropsychiatric toxicityMouse modelDCE MRI
leak syndrome; NO,, blood-brain barrier;WF, von Willebrand, proton density; DCE,
e Breakthrough Way,215; fax: +1 702 944
amlowski).
All rights reserved.
1. Introduction
Cytokines are important signaling proteins secreted bycells to regulate the immune system. Interleukin-2 (IL-2) is a15 kDa cytokine which activates lymphocytes via its well-characterized heterotrimeric receptor (Nakarai et al., 1994;Sana et al., 1994). IL-2 plays an important role in the develop-ment of cell-mediated immunity (Mertelsmann and Welte,1986). In the presence of properly processed and presented

46 Y.Y. Irwan et al. / Journal of Immunological Methods 349 (2009) 45–55
antigenic peptides, low concentrations (10–100 IU/ml) of IL-2are essential for the activationof cytolytic lymphocytes and theirclonal expansion (Weiss, 1993). Additionally, when murine orhuman lymphocytes are exposed to high concentrations of IL-2(N600 IU/ml) over 3–4 days either in vitro or in vivo, IL-2 rapidlyactivates a population of cytotoxic lymphocytes called lympho-kine-activated killer (LAK) cells (Lotze et al., 1981). LAK cells aretermed “non-specific” killer cells as their cytotoxicity does notrequire antigen presentation in the context of self-MHC ontarget cells nor is it tumor-specific. LAK cells demonstratecytotoxicity against almost all freshly isolated and culturedmalignant cells (Rayner et al., 1985;Hanket al., 1988), includingmultidrug-resistant tumor cells (Harker et al., 1990).
Activation of lymphocyte cytotoxicity against tumor cellsin vitro by IL-2 led to evaluation of this cytokine as an anti-cancer therapy. In preclinical studies, concomitant IL-2 and LAKcell administrations on tumor-bearing mice resulted in regres-sion of lung and liver metastases (Lafreniere and Rosenberg,1985; Papa et al., 1986a). Tumor regression in experimentalmice was associated with prolonged survival (Eberlein et al.,1982; Mule et al., 1985). In clinical studies, high-dose i.v bolusIL-2 treatment induced 5–7% complete and 10–15% partialresponses in patientswithmalignantmelanomaandmetastaticrenal cell carcinoma(Rosenberg et al., 1994;Atkins et al., 1999).Approximately 60% of complete responses to high-dose IL-2proved durable, with up to 20 years of follow-up (Atkins et al.,2000).
Currently, IL-2 therapy is FDA approved for treatment ofmetastatic renal cell carcinoma and melanoma. IL-2 remainsthe only agent that can induce durable complete remissions ofmetastatic RC in approximately 5% of patients. Despite thedramatic increase in treatment options for metastatic renalcancer (RC) in the past 4 years, including agents that inhibitvascular endothelial growth factor (VEGF) and mammaliantarget of rapamycin (mTOR) pathways (Samlowski et al.,2008), these agents predominantly induce disease arrest,requiring ongoing administration of expensive drugs tomain-tain a response. At the present time, IL-2 also remains the onlyclinically available remission-inducing agent for treatment ofmetastatic melanoma.
IL-2 therapy strongly induces synthesis of inflammatorycytokines termeda “cytokine storm” (Panelli et al., 2004). Thesesecondarily released cytokines, which include IFN-γ, tumornecrosis factor (TNFα, TNFβ), IL-1α, IL-1β, IL-5, and IL-6(Gemlo et al., 1988; Mier et al., 1988; Jablons et al., 1989;Schaafsma et al., 1991) reach high levels in patient serum andare believed to trigger severe toxicities during IL-2 treatment.This pattern of cytokine secretion has strong similarities to the“cytokine storm” elicited by bacterial endotoxin (Martin et al.,1988; Maruo et al., 1992; Nooteboom et al., 2002). Thesesecondarily released cytokines may also contribute to the ther-apeutic response to IL-2, ashighdose steroidsblock IL-2 toxicitybut also abrogate the therapeutic effectiveness of this agent(Papa et al., 1986b).
The major dose-limiting toxicities of IL-2 are vascular leaksyndrome (VLS) and hypotension. IL-2 induced VLS is general-ized and dose dependent, characterized by loss of intravascularfluid into interstitial tissues. VLS is associatedwithmarked fluidretention (weight gain), reversible renal dysfunction, and non-cardiac pulmonary edema (Mann et al., 1990). IL-2 inducedhypotension is due to a marked decrease in systemic vascular
resistance, resulting in hypoperfusion of vital organs, such asheart and kidneys (Ognibene et al., 1988), in conjunction withVLS and intravascular volume depletion. It has also been re-cognized that reversible neuropsychiatric toxicity representsthe third IL-2 dose-limiting toxicity. Denicoff et al. (1987)showed that there were striking neuropsychiatric changes inthe majority of patients after the onset of IL-2 treatment, with30–50% of patients experienced severe behavioral and cognitivechanges. All patients returned to their baseline cognitive scoresat follow-up (Denicoff et al., 1987). It should be noted that thepattern of hypotension, VLS, and delirium following IL-2therapy in patients appears very similar to the clinical pre-sentation of patients who have severe bacterial infection andseptic shock (Ognibene et al., 1988). The major apparentdifference is the complete resolution of renal function changesfollowing completion of IL-2 therapy, unlike the high incidenceof acute tubular necrosis during septic shock. It has becomeincreasingly clear that even if hypotension and VLS can beattenuated, dose limitations related neuropsychiatric toxicityprevent effective IL-2 dose escalation.
To date, the effects of inflammatory cytokines that triggerneuropsychiatric toxicity in the brain are not well under-stood. Moreover, technical challenges exist to study theseeffects after 4–5 days of IL-2 treatment (similar to treatmentsequence used in human patients). Studies in patients andanimal models have suggested that brain edema could play arole (Ellison et al., 1987; Alexander et al., 1989; Saris et al.,1989; Watts et al., 1989). However, Alexander et al. (1989)suggested that IL-2 induced brain edema occurred predom-inantly in tumor-bearing rat brain but not in normal brain.Since tumors are known to have abnormal blood vesselpermeability, it is strongly believed that this could result inincreased brain edema following IL-2 treatment. We there-fore evaluated a number of potential approaches to moredirectly evaluate cytokine effects on the non-tumor bearingcentral nervous system (CNS) using IL-2 treatment as amodelin a well-characterized murine system (Yim et al., 1995;Samlowski et al., 2003).
2. Materials and methods
2.1. Mice
Pathogen-free C3H/HeN mice were obtained from CharlesRiver Laboratories. Mice were maintained under guidelinesestablished by the Institutional Animal Care and UseCommittee (IACUC). The IACUC also approved all the animalexperimental protocols. Mice were age- and sex-matched ineach experiment.
2.2. IL-2 treatment
IL-2 treated mice received 150,000 IU of IL-2 (AldesleukinProleukin®; Novartis, Emeryville, CA) in 0.2 ml PBS (phos-phate buffered saline) intraperitoneally (i.p.), b.i.d. (twice aday) for 5 days (10 doses total) in all experiments, except inexperiments usingMRI. ForMRI studies,mice received8 dosesof 150,000 IU of IL-2 in 0.2 ml PBS i.p., b.i.d. (4 days). Controlmice received no treatment, except in wet versus dry brainweight experiments, where controlmicewere treatedwith anequivalent volume of PBS (without IL-2).

47Y.Y. Irwan et al. / Journal of Immunological Methods 349 (2009) 45–55
2.3. Comparison of wet versus dry brain weight
Brains were harvested from each IL-2 treated and controlmouse after 5 days of IL-2 and PBS treatment, respectively.Each brain was weighed before and after drying by Hetovacuum centrifuge (ATR, Laurel, Maryland) overnight in60 °C. The water content of the brain was calculated as:
% tissue water =wet weight−dry weight
wet weight× 100:
2.4. [125I]-labeled albumin extravasation in the mouse brain
Approximately 100,000 counts per minute (cpm) of [125I]-labeled albumin (specific activity 1–5 μCi/μg) in 100 µl PBSwas injected intravenously (i.v.) into the tail veins of mice 2 hafter the last dose of IL-2. Mice were sacrificed 6 h after thelast dose of IL-2 and the brains excised. Each brain wasanalyzed for albumin accumulation. Data was calculated asfollow:
%cpm =brain cpm × 100%
total cpm recovered from the mouse:
2.5. Tritiated water ([3H]–H2O) extravasation as a potentialmarker of IL-2 induced VLS
IL-2 treated or control mice were injected with approxi-mately 300,000 cpm of [3H]–H2O in 100 µl PBS i.v. into the tailvein 2 h after the last dose of IL-2 or no treatment (control).Mice were then sacrificed at 4, 12, or 18 h after [3H]–H2Oinjection. The brainwas harvested from eachmouse, weighed,and homogenized in 1 ml PBS using Tissumizer (Tekmar,Cincinnati, OH). The homogenate (100 µl) was added into2 ml scintillationfluid andquantified in a scintillation counter.To correct for tissue quenching, 100 µl brain homogenate froma normal mouse was directly mixed with 300,000 cpm [3H]–H2O in 100 µl PBS and 2 ml scintillationfluid, and quantified ina scintillation counter. The cpm recovered was expressed aspercentage of 300,000 cpm and was used to correct theapparent cpm from the IL-2 treated and control mouse brainhomogenates. The [3H]–H2O extravasation in each brainhomogenate of IL-2 and control mice was expressed as cpmper gram tissue as follow:
cpm= gramtissue =homogenate cpm × 100%
% cpm recovered ðquenchingÞ × tissue weight ðgÞ:
2.6. Sodium fluorescein extravasation inmouse pleural fluid, lungs,and brain as an indicator of VLS
IL-2 treated or control mice were injected with 1.5 mgfluorescein sodium salt (NaFl; Sigma-Aldrich, St. Louis, MO) in100 µl PBS i.v. via tail vein, 4 h after the last dose of IL-2. Themice were sacrificed 10 min after NaFl injection. The pleuralfluid from IL-2 treated mice was collected and the volume wasmeasured. Since control mice did not have detectable pleuralfluid, the thoracic cavity was irrigated with 500 µl PBS, which
was collected. The lungs and brain were also harvested andwerehomogenized in1 mlPBSeach, usingTissumizer (Tekmar,Cincinnati, OH). After centrifugation for 5 min, 100 µl of eachhomogenatewas added in triplicate into a 96-well plate. Also intriplicate, 100 µl of the pleural fluid from each mouse wastransferred into another 96-well plate. Plateswere read using aSynergy 2 microplate reader (BioTek Instruments, Winooski,Vermont) at 519 nm emission and 495 nm excitation wave-lengths. For the pleural fluid, the fluorescence was quantifiedusing a standard curve and multiplied by the total volumerecovered to calculate the total amount of NaFl (in µg) thatleaked into the pleural fluid. In lung or brain homogenates, thefluorescencewas corrected for tissue quenching and quantifiedusing a standard curve. Data were expressed as µg NaFl/organbased on the total volume of homogenate.
2.7. Evaluation of brain blood vessel morphologyusing immunohistochemistry
Brainswere excised from IL-2 treated or controlmice. Eachbrain was embedded in Tissue-Tek O.C.T. Compound (TedPella, Redding, CA) and frozen at −20 °C overnight beforesectioning. Matched sections (6 µm) of the mid-brain (Fig. 1)were dual-stained with Isolectin GS-IB4 (Iso-B4) from Griffo-nia simplicifolia, conjugated to Alexa Fluor® 568 (MolecularProbes, Eugene, OR) and rabbit anti-human von WillebrandFactor (vWF; Sigma-Aldrich, St. Louis, MO), followed by asecondary Dichlorotriazinyl-aminofluorescein (DTAF)-conju-gated donkey anti-rabbit IgG (Jackson ImmunoResearchLaboratories, West Grove, PA). Digital images of 20 specificregions of interest (4 different areas in the left cortex, rightcortex, left striatum, right striatum, and the cerebral fissure;Fig. 1) in the stained brain sections were acquired usingOlympus BX51 fluorescent microscope mounted with Olym-pus DP70 camera. Using ImageJ software (National Institutesof Health, NIH), the blood vessels (dual stained tubularstructures) in each digital image were manually outlinedand analyzed for the total number and average size of vessels.
2.8. Evaluation of brain water content using MRI protondensity measurements
MRI was performed using a Bruker 7T/20 scanner, a3.5 cm ID (inner diameter) quadrature transceiver coil, and a7 cm ID unshielded gradient. Mice were anesthetized by i.p.injection of 80 mg/kg ketamine (Vetalar®; Aveco, FortDodge, IA) and maintained inside the magnet usingisoflurane (Attane™; Minrad, Bethlehem, PA) inhalationalanesthesia as required. Mouse temperature inside the mag-net was maintained using a circulating warm water system.Each mouse was scanned both before and after IL-2 treat-ment. Proton density MRI was sequenced using a Fast SpinEcho sequence with a repetition time (TR) of 24 s, an echotime (TE) of 7.5 ms, and an echo train length of 4. Slicethickness was 1 mm, field of view was 2×2 cm2, and matrixsize was 256×192 pixels. The slice thickness and matrix sizewere optimized to detect proton density changes in themouse brain of N1%. The total scan time was 14 min and 24 s.Regions of interest (ROIs) were drawnmanually on matchedpre- and post-IL-2 mouse's brain DICOM (Digital Imagingand Communications in Medicine) images using OsiriX

Fig. 1. Cross section drawing of themouse mid-brain section, which includes the cortex and striatum anatomic regions, derived from Dorr et al. (2007). Inset figurerepresents the position at which the tissue slice was taken (Bregma 0.62–0.38 mm). The drawing shows the name ofmajor cerebral vasculature structures found inthe specific section. azPA= azygos pericallosal artery. Boxes show the locations of 19–20 digital images obtained from each section for vessel analysis. On the righare representative sections from the control and IL-2 treated mice, which were matched as closely as possible to the drawing on the left, stained with hematoxylinand eosin. These representative sections are located right by the sections used in the immunohistochemistry experiment.
48 Y.Y. Irwan et al. / Journal of Immunological Methods 349 (2009) 45–55
imaging software (http://www.osirix-viewer.com/). Thesignal intensity (SI) of each brain slice was normalizedusing a set of phantoms (60–100% H2O/D2O in 10%increment) and expressed as the percentage of protondensity (%PD). We averaged the %PD over 8 MRI brainimage slices for each mouse and compared the average %PDbefore and after IL-2 treatment.
2.9. Dynamic contrast enhanced (DCE) MRI
TheMRI system and anesthesia were described above. Eachmouse was scanned before and after IL-2 treatment, serving asits own control. Prior to imaging, the tail vein of each mousewas catheterized using a 30-gauge needle connected to anapproximately 1m long, 0.28 mm ID tube pre-filled withheparinized PBS (approximately 100 µl). DCE-MRI was per-formed using 2D-FLASH (Fast Low-Angle Shot): TR=93.5 ms,TE= 3.1 ms, fl ip angel = 30°, FOV= 2 × 2 cm, ma-trix=128×128, slice thickness=1 mm,number of slices=11,single scan time=9 s, number of repetitions=54. After thefirst 5 repetitions, 0.1 mmol/kg contrast agent (gadobenatedimeglumine; MultiHance®, Bracco) was administered bybolus injection via the catheter. CustomizedMATLAB programs(The MathWorks, Natick, MA) were used to calculate the SI ofthe whole brain ROI in matched mid-brain sections of pre- andpost-IL-2 DICOM images. The signal intensities of the left andright maxillary veins were averaged to derive the contrastagent concentrations in the blood pool. The average SI of ROIbefore contrast agent injection was used as the baseline and
t
subtracted from all SI after contrast agent injection to calculatethe increase in SI (ΔSI). ΔSI was assumed to be proportional tothe change in contrast agent concentration when a lowconcentration of contrast agent was used (Shames et al.,1993). A two-compartmentmodel was originally developed byShames et al. (1993) to characterize tumor vasculature andadapted by Feng et al. (2008) to calculate the tumor fractionalplasma volume (f PV), endothelium transfer coefficient (KPS),and permeability surface area product (PS). This method wassimilarly used to characterize the brain microvasculature.
2.10. Statistical analysis
All data are expressed asmean±standard error of themean(SEM). Statistical analyses on MRI data were performed bypaired Student's 2-tailed t-test using GraphPad PRISM soft-ware (GraphPad Software, La Jolla, CA). The immunohisto-chemistry data were analyzed using 2-factor analysis ofvariance (ANOVA) with a blocking factor for region of thebrain.All theotherdatawere analyzedusing2-sample Student's2-tailed t-test. A p-value≤0.05 was considered significant.
3. Results
3.1. Comparison of wet versus dry brain weight in IL-2treated mice
Difference inwet versus dry tissueweight is assumed to beapproximately the volume of interstitial fluid in the tissue. It

ig. 3. Evaluation of IL-2 induced vascular leak in the brain using [125I]-labeledlbumin. Mice (n=6) were injected with approximately 100,000 cpm of25I]-labeled albumin in 100 µl PBS via tail vein 2 h after the last dose of IL-2r no treatment (control). After 4 h, mice were sacrificed, the brains excisednd analyzed for [125I]-labeled albumin accumulation. The results werexpressed as percentage of radiolabeled albumin recovered from the brainith the total amount recovered from the animal.
49Y.Y. Irwan et al. / Journal of Immunological Methods 349 (2009) 45–55
was not certain whether this technique was sensitive enoughto detect the small fluid shifts that were likely in the mousebrain related to cytokine treatment. We excised brains fromIL-2 treated or control mice (treated with an equivalentvolume of PBS) after 5 days of treatment and weighed eachbrain before and after drying by speed vacuum. The averagebrain water content of IL-2 treated mice was 43.05±1.84% ofthewetweightwhile the controlmice had amean brainwatercontent of 42.6±1.524% (p=0.85; Fig. 2). It became clearfrom these results that this method lacked sensitivity toidentify relatively small changes in the brain water content ofmice related to IL-2 treatment.
3.2. [125I]-labeled albumin extravasation in the mouse brain
Radioactive labeled [125I]-bovine serum albumin has oftenbeen used to study IL-2 induced VLS in mice tissues(Ettinghausen et al., 1988). However, it had not beenquantified as a VLS marker in the mouse brain. To test this,we injected IL-2 treated or control mice with [125I]-labeledalbumin bolus via tail vein. After 4 h, mice were sacrificed andthe brains excised. The amount of [125I]-labeled albuminrecovered in the brain was quantified and expressed as apercentage of the total amount of [125I]-labeled albuminrecovered from the mouse. Analysis of [125I]-labeled albuminaccumulation in the brain showed no significant increasefollowing IL-2 treatment (p=0.17; Fig. 3). The amount of[125I]-labeled albumin recovered from the brain of IL-2 treatedmicewas 0.2172±0.04%while the controlmice had 0.1364±0.04%. The small percentage of [125I]-labeled albumin recov-ered from the mouse brain demonstrated that this meth-od also lacked the sensitivity to measure a small increase in[125I]-labeled albumin extravasation in the mouse brain in-duced by IL-2.
3.3. Tritiated water ([3H]–H2O) extravasation as a potentialmarker of IL-2 induced VLS
We hypothesized that vascular leak in the brain shouldcorrelate with the ability of water molecules (H2O) to cross
Fig. 2. Direct comparison of wet versus dry brain weight from IL-2 treatedmice. Brains were excised from IL-2 treated and control mice (n=9). Eachmouse brain was weighed before and after drying in a vacuum centrifugeovernight in 60 °C. The wet and dry weight difference was expressed as apercentage of wet weight. Error bars represent SEM. The result was notsignificant (NS), pN0.05.
Fa[1
oaew
the BBB. To test [3H]–H2O as a potentialmarker of IL-2 inducedfluid shifts in the mouse brain, IL-2 treated or control micewere injected with [3H]–H2O bolus via tail vein. At specifiedtimes, mice were sacrificed and the brain excised. Each brainwas weighed and homogenized. The homogenate was quan-tified in a scintillation counter, and corrected for quenching ofcounts by tissue homogenate. At 4 and 12 h after the last IL-2dose, significant [3H]–H2O retention in the brain of IL-2 treat-ed mice could not be detected compared to the control mice(Fig. 4). At 4 h after the last IL-2 dose, there were 787.3±36.48 cpm [3H]–H2O/g brain in the IL-2 treated mice com-pared to 742.7±17.39 cpm [3H]–H2O/g brain in the controlmice (p=0.332). By 12 h, there were 713±37.29 cpm [3H]–H2O/g brain in the IL-2 treated mice and 653.5±24.28 cpm[3H]–H2O/g brain in the control mice (p=0.2024). There was
Fig. 4. Evaluation of changes in brain water content using tritiated water([3H]–H2O). Two hours after the last IL-2 dose or no treatment (control),mice (n=3 at 4 h, n=8 at 12 and 18 h) were injected with ~300,000 cpm[3H]–H2O in 100 µl PBS via tail vein. The brain was harvested from eachcohort of control and IL-2-treated mice at the specified time (4 h, 12 h, or18 h) after [3H]–H2O injection. Brains were homogenized and 100 µl wascounted in 2 ml scintillation fluid on a scintillation counter. The results werecorrected for tissue quenching and expressed as cpm/gram tissue. ⁎ indicatesp=0.003.

50 Y.Y. Irwan et al. / Journal of Immunological Methods 349 (2009) 45–55
a trend toward increased [3H]–H2O retention in the brain of IL-2 treated mice at 18 h (810.8±70.82 cpm [3H]–H2O/g brain)compared to the control mice (552±24.03 cpm [3H]–H2O/gbrain), p=0.003 (Fig. 4). Despite use of syngeneic mice and aprecisely timed treatment schedule, this technique exhibitedquite a bit of variability between experiments. This led us toconclude that measurement of [3H]–H2O retention was not areliable means of measuring IL-2 induced fluid shifts in themouse brain.
3.4. Measurement of sodium fluorescein (NaFl) extravasation inthe mouse pleural fluid, lungs, and brain
NaFl is a small fluorescent molecule (MW=376.27). Thisprobe may provide increased sensitivity for detection of BBBdisruption induced by IL-2 and decrease tissue quenchingand volume of distribution problems related to the use of[3H]–H2O. We evaluated NaFl as an indicator for IL-2 in-duced VLS, based on its prior use as a marker for fluorescenceimaging of BBB disruption in rats (Kawamura and Yasui, 1994;Hawkins and Egleton, 2006). Control and IL-2 treated micewere injected with 1.5 mg NaFl in 100 µl PBS via tail vein andsacrificed after 10 min. Pleural fluid was collected directlyfrom the thoracic cavity of IL-2 treated mice whereas thethoracic cavity of the control mice was irrigated with 500 µlPBS, which was then collected. The entire recovered volumewas quantified. Fluorescence was measured by spectrofluo-rometer. Using a standard curve, the concentration of NaFlrecovered from each mouse was quantified. By multiplyingthe concentration of NaFl by the total volume of the fluidrecovered, we calculated the total amount of NaFl leak. IL-2treatment increased NaFl extravasation into the pleural spaceby 9-fold (9.59±0.82 µg total NaFl) compared to the controlmice (1.09±0.13 µg total NaFl), pb0.0001 (Fig. 5A).
In order to evaluate the usefulness of this technique forsolid organs, the lungs and brain from these mice were ex-cised. Each tissue was homogenized in 1 ml PBS, and theamount of NaFl in the homogenate quantified. Followingcorrection of tissue-specific fluorescence quenching, wefound 10.34±0.82 µg total NaFl in the lungs of IL-2 treated
Fig. 5. Evaluation of blood vessel permeability using sodium fluorescein (NaFl) in the1.5 mg NaFl in 100 µl PBS via tail vein 4 h after the last IL-2 dose or no treatment (cothe brains and lungs were excised from each mouse. The lungs and brain were homopleural fluid was quantified by spectrofluorometer. The total amount (µg) of NaFl iquenching, and then multiplied by the total volume of organ homogenate (1 ml) o
mice. There was no detectable difference compared to NaFlcontent in lungs of the control mice (8.88±1.21 µg total NaFl,p=0.35; Fig. 5B). There was also no detectable difference inthe amount of total NaFl in the brains of IL-2 treated mice(1.06±0.05 µg total NaFl) compared to the control (1.14±0.06 µg total NaFl), p=0.34 (Fig. 5C). This method proveduseful in demonstrating small molecule leak resulting inpleural effusions, but not into solid organs of IL-2 treatedmice. Perfusion of mice with saline to decrease intravascularNaFl retention did not seem to influence results in the brain(data not shown).
3.5. Evaluation of brain blood vessel morphologyusing immunohistochemistry
It is well known that nitric oxide (NO) produced by endo-thelial cells or from pharmacologic donors induces vasodila-tion (Brenner et al., 1989; Vallance et al., 1989; Torfgard andAhlner, 1994). We therefore evaluated whether vasodilationcould be identified in brain blood vessels via immunohisto-chemistry. We prepared 6 µm sections from carefully definedanatomic region of the mouse mid-brain (Fig. 1) chosen toreflect highly vascular areas based on a study by Dorr et al.(2007). Areas selected included the cerebral fissure, thestriatum and the cortex in the highly vascularized anatomicregion shown (Fig. 1). We tested a number of putative endo-thelial cell-specific antibodies, CD34, CD144 (VE-cadherin),and anti-von Willebrand Factor (vWF). All of them showedspeckled endothelial cell staining (data not shown). As vWF isspecifically produced in blood vessels, this marker wasselected. However, the granular nature of the stain made itdifficult to outline vessels tomeasure the area. Isolectin GS-IB4(Iso-B4) demonstrates strong staining of perivascular cells.Unfortunately, Iso-B4 is also known to stain brain microglialcells. By using dual staining of vWF and Iso-B4,wewere able toidentify the circumference of blood vessels in themouse brainsection.We obtained twenty 20×magnification digital imagesfrom precise anatomic locations of the brain section (4 of eachleft cortex area, right cortex, left striatum, right striatum, andthe cerebral fissure) using fluorescence microscopy and
mouse A) pleural fluid, B) lungs, and C) brain. Mice (n=5)were injectedwithntrol). After 10 min, mice were sacrificed. The pleural fluid was collected andgenized in 1 ml PBS and 100 µl of each homogenate or 100 µl of the collectedn each sample was calculated by using a standard curve, corrected for tissuer the measured volume of the collected pleural fluid.
51Y.Y. Irwan et al. / Journal of Immunological Methods 349 (2009) 45–55
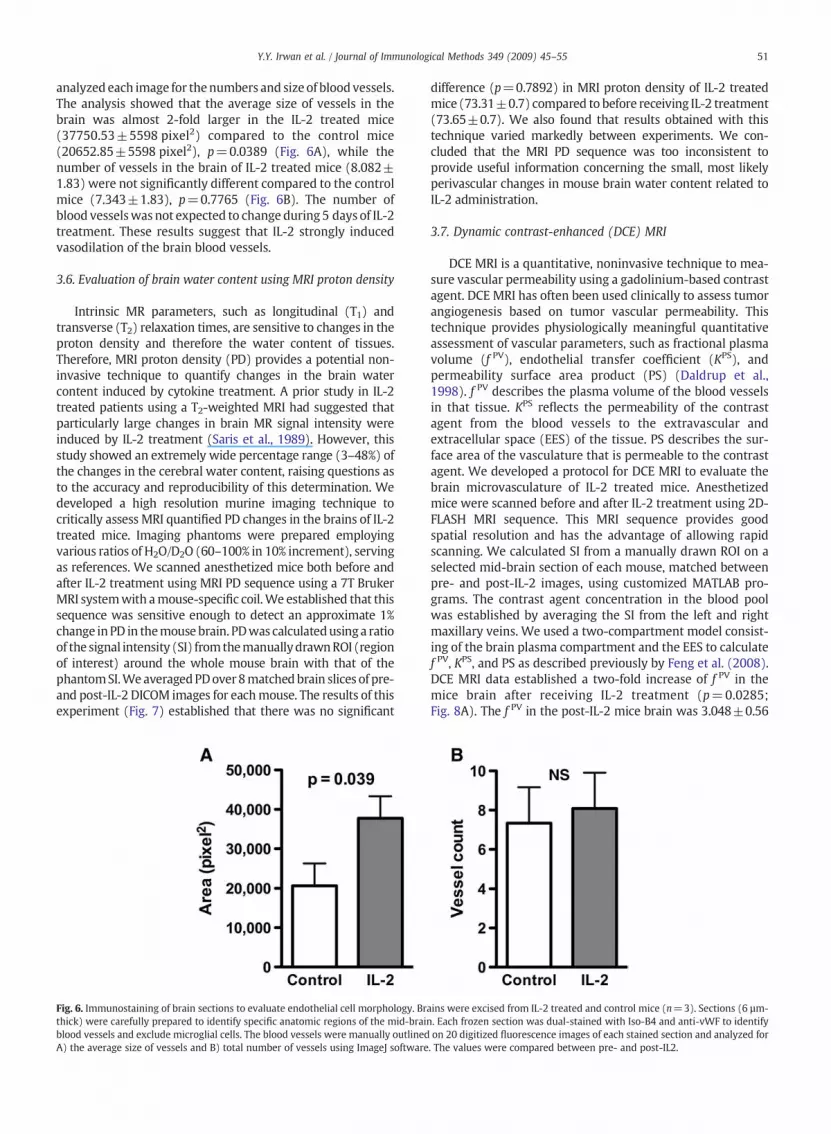
analyzed each image for thenumbers and size of blood vessels.The analysis showed that the average size of vessels in thebrain was almost 2-fold larger in the IL-2 treated mice(37750.53±5598 pixel2) compared to the control mice(20652.85±5598 pixel2), p=0.0389 (Fig. 6A), while thenumber of vessels in the brain of IL-2 treated mice (8.082±1.83) were not significantly different compared to the controlmice (7.343±1.83), p=0.7765 (Fig. 6B). The number ofblood vesselswas not expected to change during 5 days of IL-2treatment. These results suggest that IL-2 strongly inducedvasodilation of the brain blood vessels.
3.6. Evaluation of brain water content using MRI proton density
Intrinsic MR parameters, such as longitudinal (T1) andtransverse (T2) relaxation times, are sensitive to changes in theproton density and therefore the water content of tissues.Therefore, MRI proton density (PD) provides a potential non-invasive technique to quantify changes in the brain watercontent induced by cytokine treatment. A prior study in IL-2treated patients using a T2-weighted MRI had suggested thatparticularly large changes in brain MR signal intensity wereinduced by IL-2 treatment (Saris et al., 1989). However, thisstudy showed an extremely wide percentage range (3–48%) ofthe changes in the cerebral water content, raising questions asto the accuracy and reproducibility of this determination. Wedeveloped a high resolution murine imaging technique tocritically assess MRI quantified PD changes in the brains of IL-2treated mice. Imaging phantoms were prepared employingvarious ratios of H2O/D2O (60–100% in 10% increment), servingas references. We scanned anesthetized mice both before andafter IL-2 treatment using MRI PD sequence using a 7T BrukerMRI systemwith amouse-specific coil.We established that thissequence was sensitive enough to detect an approximate 1%change inPD in themouse brain. PDwas calculatedusing a ratioof the signal intensity (SI) fromthemanuallydrawnROI (regionof interest) around the whole mouse brain with that of thephantomSI.We averagedPDover8matchedbrain slices of pre-and post-IL-2 DICOM images for eachmouse. The results of thisexperiment (Fig. 7) established that there was no significant
Fig. 6. Immunostaining of brain sections to evaluate endothelial cell morphology. Brthick) were carefully prepared to identify specific anatomic regions of the mid-braiblood vessels and exclude microglial cells. The blood vessels were manually outlinedA) the average size of vessels and B) total number of vessels using ImageJ software
difference (p=0.7892) in MRI proton density of IL-2 treatedmice (73.31±0.7) compared to before receiving IL-2 treatment(73.65±0.7). We also found that results obtained with thistechnique varied markedly between experiments. We con-cluded that the MRI PD sequence was too inconsistent toprovide useful information concerning the small, most likelyperivascular changes in mouse brain water content related toIL-2 administration.
3.7. Dynamic contrast-enhanced (DCE) MRI
DCE MRI is a quantitative, noninvasive technique to mea-sure vascular permeability using a gadolinium-based contrastagent. DCE MRI has often been used clinically to assess tumorangiogenesis based on tumor vascular permeability. Thistechnique provides physiologically meaningful quantitativeassessment of vascular parameters, such as fractional plasmavolume (f PV), endothelial transfer coefficient (KPS), andpermeability surface area product (PS) (Daldrup et al.,1998). f PV describes the plasma volume of the blood vesselsin that tissue. KPS reflects the permeability of the contrastagent from the blood vessels to the extravascular andextracellular space (EES) of the tissue. PS describes the sur-face area of the vasculature that is permeable to the contrastagent. We developed a protocol for DCE MRI to evaluate thebrain microvasculature of IL-2 treated mice. Anesthetizedmice were scanned before and after IL-2 treatment using 2D-FLASH MRI sequence. This MRI sequence provides goodspatial resolution and has the advantage of allowing rapidscanning. We calculated SI from a manually drawn ROI on aselected mid-brain section of each mouse, matched betweenpre- and post-IL-2 images, using customized MATLAB pro-grams. The contrast agent concentration in the blood poolwas established by averaging the SI from the left and rightmaxillary veins. We used a two-compartment model consist-ing of the brain plasma compartment and the EES to calculatef PV, KPS, and PS as described previously by Feng et al. (2008).DCE MRI data established a two-fold increase of f PV in themice brain after receiving IL-2 treatment (p=0.0285;Fig. 8A). The f PV in the post-IL-2 mice brain was 3.048±0.56
ains were excised from IL-2 treated and control mice (n=3). Sections (6 µm-n. Each frozen section was dual-stained with Iso-B4 and anti-vWF to identifyon 20 digitized fluorescence images of each stained section and analyzed for. The values were compared between pre- and post-IL2.

Fig. 7. Evaluation of proton density in the brains of IL-2 treated mice using a7TMRI system.Mice (n=5)were scanned both before and after 4 days of IL-2treatment (150,000 U i.p, b.i.d.) using a MRI PD sequence as described in theMaterials andmethods. Regions of interest weremanually drawn onmatchedsections of mouse brain using OsiriX software and expressed as % protondensity (PD) based on the phantoms (created using 60–100% H2O/D2O in 10%increment). The %PD was averaged over 8 slices for each mouse andcompared between pre- and post-IL-2 treatment scans derived from the samemouse.
Fig. 8. Evaluation of IL-2 induced changes in the brain blood vessel permeabiand after 4 days of IL-2 treatment (150,000 U i.p, b.i.d.) using 2D-FLASH0.1 mmol/kg contrast agent was administered by bolus injection via tailintensities from manually drawn ROI on a selected 1-mm mid-brain sectionagent concentration in the blood pool and a two-compartment model was us(KPS), and C) permeability surface area product (PS). IL-2 treatment signific
52 Y.Y. Irwan et al. / Journal of Immunological Methods 349 (2009) 45–55
whereas in the pre-IL-2mice brainwas 1.554±0.21. This resultsuggested vasodilation of the brain blood vessels following IL-2treatment, independently verifying the results of brain immu-nohistochemical staining. DCE MRI also showed that IL-2 sig-nificantly increased brain microvascular permeability to thecontrast agent by two-fold (p=0.0079; Fig. 8B). KPS value inthe mice brain after receiving IL-2 treatment was 0.4305±0.05 ml/min/100cm3 whereas prior to IL-2 treatment was0.2039±0.04 ml/min/100cm3. Finally, the PS was 1.275±0.22 ml/min/100cm3 in the mice after receiving IL-2 while inthe mice prior to the IL-2 treatment was 0.2953±0.05 ml/min/100cm3 (Fig. 8C). Thesedata suggested a significant (p=0.0083)four-fold increase in the blood vessel surface area that was“leaky” to the contrast agent after IL-2 treatment. These changesin brain vascular parameters identified using DCE MRI estab-
lity by dMRI seqvein catof eached to caantly in
lished that IL-2 induces vasodilation of the brain blood vesselsand increases perivascular permeability of these vessels.
4. Discussion
Sepsis causes an estimated 215,000 deaths (9.3% of alldeaths) in the US and considerablemorbidity, mortality, healthcare utilization, and cost (O'Brien et al., 2007). Patients of earlystages of sepsis develop similar symptoms to the side effects ofIL-2 therapy, particularly hypotension, vascular leak, andneuropsychiatric toxicity (i.e. delirium). However, as sepsisprogresses, patients experience irreversible organ failure, andeventually death. IL-2 dose limiting toxicities are reversible andtherefore may provide useful to model the early cardiovascularand neuropsychiatric effects of sepsis.
A poorly characterized percentage of patients receiving IL-2therapy becomementally slowed or confused (perhaps as highas 40% in our experience) andapproximately 10–20%of patientsbecome agitated, sometimes with hallucinations or delusions.The pathophysiology of IL-2 induced neuropsychiatric toxicityremains poorly understood. It is likely that the “cytokine storm”
released during IL-2 treatment and sepsis induces changes inbrain microvasculature, such as vascular leak and brain edema,which relate to changes in the CNS function and thus causeneuropsychiatric toxicity. We therefore evaluated a number ofpotential experimental methods to quantify the effect ofcytokine-induced changes on brain blood vessels, utilizing awell-characterized IL-2 treatment murine model.
We have performed extensive studies of different dosesof IL-2 in mice. The dose of IL-2 chosen for the current exper-iments (150–180,000 IU twice daily) is based on dose andtime response studies previously performed in our lab toevaluate changes in systemic vascular permeability and hypo-tension in our murine model, and is approximately the LD10(lethal dose for ~10% of mice) in C3H/HeN mouse strain.It was designed to mirror the effect of massive doses ofIL-2 administered to human patients (600,000 IU/kg q8h for14 doses).
ynamic contrast enhanced (DCE) MRI. Mice (n=5)were scanned both beforeuence as described in the Materials and methods. After baseline imagingheterization. Customized MATLAB programs were used to calculate signamouse. We averaged the left and right maxillary veins to derive the contraslculate A) fractional plasma volume (f PV), B) endothelium transfer coefficiencreased f PV and KPS by two-fold, and PS by four-fold.
,ltt

53Y.Y. Irwan et al. / Journal of Immunological Methods 349 (2009) 45–55
Previous studies have been attempted to delineate themechanisms of IL-2 dose-limiting toxicities with the eventualgoal of blocking these toxicities without affecting the ther-apeutic effectiveness of IL-2. Nitric oxide (NO) and superox-ide have been identified as key players in systemic IL-2induced VLS and hypotension, respectively (Samlowski,2001; Samlowski et al., 2003). The role of these mediatorsin the brain is currently unknown. Saris et al. (1989) havelooked at the effects of IL-2 in the brain of patients withextracranial cancer without evidence of intracranial metas-tases. This study used T2-weighted MRI to look at changes insignal intensities in the brain, which correlated with changesin cerebral water content, before and after IL-2 therapy. Eventhough their results suggested a massive increase of cerebralwater content in both the white matter (17±6.2%) and graymatter (12.6±7.3%) after IL-2 therapy, only 3 out of these 7patients were mildly lethargic (Saris et al., 1989). Moreover,the range of these measurements varied from 3% to 48%,raising questions concerning the accuracy of these determi-nations in critically ill patients. The magnitude of these ap-parent proton density increases are difficult to believe, sincethey are far greater magnitude than vascular leak measuredin any other organ or even overall weight changes in theintact IL-2 treated animals or patients.
In cats and rats, a single bolus intravenous injection ofrecombinant IL-2 increased permeability of horseradishperoxidase into the brain, suggesting that IL-2 disrupted theblood-brain barrier (BBB) and cerebrovascular morphologicalintegrity (Ellison et al., 1987; Watts et al., 1989). A study onthe effect of IL-2 on the BBB in gliosarcoma rat modelsuggested that IL-2 increased the transfer constant ofcarbon-14-labeled aminoisobutyric acid from BBB into thebrain in tumor-bearing rat brain but not in normal brain(Alexander et al., 1989). However, tumors are known to haveabnormal blood vessel permeability and are suspected ofcontributing to increased brain edema following IL-2 treat-ment, raising uncertainty concerning the significance ofAlexander et al. (1989) finding.
Our results showed no detectable differences in the mousebrain interstitial fluid between IL-2 treated and controlsmeasured using wet versus dry brain weight (Fig. 2), quanti-fication of radioactive labeled [125I]-bovine serum albumin(Fig. 3), tritiatedwater retention (Fig. 4) orfluorescencemarker(Fig. 5C), andMRI protondensitymeasurements (Fig. 7). This islikely due to the small magnitude of changes in brain watercontent or edema (b5%) that produces symptoms. In addition,quenching of the signal related to tritiated water, and to somedegree tissue fluorescence (for NaFl) required compensation,further decreasing sensitivity. Another problem was that evenin syngeneicmice treated on a very precise schedule, therewassubstantial inter-experiment variability. This further limitedthe usefulness of these techniques.
However, our mouse brain immunohistochemical staining(Fig. 6A) and DCE MRI f PV values (Fig. 8A) independentlydemonstrated a two-fold increase in the area and volume ofthe brain blood vessels, respectively, in IL-2 treated mice.These data indicated vasodilation of the brain blood vessels.Further characterization of the brain blood vessels by DCEMRIalso showed a two-fold increase of the mouse brain bloodvessel permeability (KPS) to the contrast agent after IL-2treatment (Fig. 8B). These increases in DCE MRI f PV and KPS
values induced by IL-2 resulted in a four-fold increase in thesurface area of the mouse brain blood vessels that become“leaky” to the contrast agent (Fig. 8C).
We established that additional methods quantifyingchanges in brain interstitial fluid induced by cytokines inmice were not informative. We used microscopy to evaluatechanges in fixable Alexa Fluor® 594-conjugated dextran(10,000 MW; Molecular Probes, Oregon) or Hoechst 33342(616 MW; Aldrich Chem., Milwaukee) staining in the mousebrain (Nitta et al., 2003) following IL-2 treatment (data notshown). None of these dyes were able to accurately quantifythe small changes in brain interstitial fluid in mice related toIL-2 therapy. A normal mouse brain weighs about 0.5 g.Approximately 5% of the mouse brain weight (25 mg)represents interstitial/or extracellular fluid. Assuming thatIL-2 changes the mouse brain fluid content by 5–7%, amagnitude similar to the maximum increase in the mousebody weight during IL-2 treatment (data not shown), onlyabout 1–2 mg changes in weight or 1–2 µl changes in watervolume are predicted to occur within the brain parenchyma.Thisminiscule amount could not bemeasured accurately usingsmall molecule probes in homogenates of brain tissue or bymicroscopy.
Despite failure to measure changes in the brain interstitialfluid after IL-2 therapy using NaFl, a significant 9-fold increaseof NaFl was detected in pleural fluid of IL-2 treated mice,p=0.0003 (Fig. 5A), consistent with the non-cardiac pulmo-nary edema and vascular leak experienced by patients re-ceiving IL-2 therapy (Mann et al., 1990). However, we did notdetect a significant difference of NaFl in the lung parenchymaafter IL-2 treatment, p=0.47 (Fig. 5B). Our studies indicatethat NaFl quantification in pleural fluid appears to be asensitive marker for systemic VLS in mice. This result appearsto contradict prior studies of IL-2 induced VLS in the mouselungs, which have been described using [125I]-albumin andEvans Blue dye (Ettinghausen et al., 1988; Hornyak et al.,2005). It became apparent to us that evenminimal carry-overof pleural fluid during excision of lungs in these experimentscould induce a significant error.
Dual staining using anti-von Willebrand Factor (vWF) andisolectin GS-IB4 (Iso-B4) specifically identifies the blood vesselsin the mouse brain sections and was able to show brain bloodvessel vasodilation induced by IL-2. One difficulty using thistechnique was to closely match all the brain cross-sections. Wechose to analyze a section through the mid-brain including thecerebral cortex and striatum as both of these regions are graymatter, which consists of neuronal cell bodies, glial cells(oligodendrocytes and astroglia), neuropil (axons and den-drites), and capillary blood vessels. The striatum is best knownfor its role in cognitive processeswhile the cerebral cortex playsan essential role in attention, thought, memory, perceptualawareness, and consciousness. Previous studies in humansreceiving IL-2 have suggested that these processes aresignificantly affected during IL-2 induced neuropsychiatrictoxicity (Denicoff et al., 1987). Vasodilation in these specificanatomic regions therefore appears to strongly correlate withthe IL-2 induced behavior and cognitive changes in treatedpatients.
Although we established a MRI sequence that was sen-sitive enough to detect approximately 1% change in phantomsusing a 7T Bruker MRI system with a mouse-specific coil, the

54 Y.Y. Irwan et al. / Journal of Immunological Methods 349 (2009) 45–55
PD changes in the mouse brain obtained with this techniquewere markedly different between replicate experiments.There are four potential issues why the MRI PD data exhibitedsuch variation. First, it was difficult to completely alignmatched MRI coronal sections between pre- and post-IL-2scans of each individual mouse. Second, we obtained 1-mmthick axial slices throughout the mouse brain. This thicknesswas needed to increase the signal to noise ratio of the MRIimages. However, it decreased the sensitivity to measuresmall or localized changes of PD in the mouse brain. This isparticularly relevant, since the permeability surface coeffi-cient derived from DCE-MRI studies suggests that IL-2induced changes in brain water content may be perivascularrather than evenly distributed throughout the brain paren-chyma. The third potential problem using a 7TMRImay relateto inhomogeneity of the static and rotating magnetic fields(B0 and B1). We attempted to minimize these effects bystandardized placement of the mouse and phantoms withinthe coil. The final caveat was that manual segmentation of themouse brain on the images proved somewhat error prone. Itis not possible to perfectly outline the brain, resulting in somevariability due to inadvertent inclusions of CSF water densitypixels. With a relatively large standard deviation of the SI, theaccuracy of measuring proton density changes is furtherdecreased. It is possible that an automated MATLAB dataextraction algorithm could be written to better exclude thispotential artifact and improve reproducibility.
As measurement of IL-2 induced changes in averagemouse brain water content proved problematic, a quantita-tive assessment of the vascular permeability to a smallmolecule contrast agent over a period of time using DCE MRIseemed more effective. DCE MRI is non-invasive, whichallows for the same mice being scanned before and after IL-2treatment, eliminating brain variability between individualmice. The 2D-FLASH MRI sequence provided a good spatialresolution and was fast. One major advantage using thistechnique is simultaneous characterization of the mousebrain blood vessel area and permeability to a small molecularprobe. This method can be used to show increased vascularpermeability changes in other tissues, such as liver and lungs.For example, changes in tumor blood vessel permeability arecommonly studied using DCE MRI (Mross et al., 2005; Rosenand Schnall, 2007; Dafni et al., 2008). However, this addsadditional technical challenges, such as compensation fororgan movement due to breathing and heartbeat. Gating willbe required and this prolongs scanning time, which may bedetrimental in critically ill and unstable mice or patients.
To our knowledge, there are currently no published data ofDCE MRI technique in patients with sepsis or receiving inflam-matory cytokine administration. These processes are virtuallyimpossible to study in critically ill human patients, who gen-erally are hospitalized in intensive care units. Once thesepatients exhibit neuropsychiatric toxicity (delirium), it wouldbe quite difficult to perform DCE MRI studies, as they are fre-quently intubated and receiving intravenous pressor agentsand would not be stable enough to undergo MRI studies.Another concern is that gadolinium-based contrast agent,which is mainly used for DCE MRI, has been shown to beassociatedwith the development of nephrogenic fibrosing der-mopathy (NFD) and nephrogenic systemic fibrosis (NSF) inpatients with kidney dysfunction (Kribben et al., 2009;
Perazella, 2009; Pietsch et al., 2009). Therefore, this contrastagent may have an adverse effect in IL-2 treated or sepsispatients, who usually have at least some element of acute renaldysfunction.
In conclusion, we were able to show that IL-2 inducedvasodilation of the brain blood vessels and increased per-meability of these vessels in mice, suggesting that IL-2 in-duced neuropsychiatric toxicity may correlate with smallblood vessel vasodilation in the brain as well as small in-creases in brain water content (edema). We are currentlyusing these methods to evaluate the neuropsychiatric toxicityof IL-2 induced vascular leak in the brain. The long term goal isto identify pharmacologic inhibitors that block hypotension,vascular leak, and neuropsychiatric toxicity for testing inpatients following inflammatory cytokine administration orwith sepsis.
Acknowledgement
We thank Chiron (Novartis) for providing IL-2 used in thesestudies.
References
Alexander, J.T., Saris, S.C., Oldfield, E.H., 1989. The effect of interleukin-2 on theblood-brain barrier in the 9 L gliosarcoma rat model. J. Neurosurg. 70, 92.
Atkins,M.B., Lotze,M.T.,Dutcher, J.P., Fisher, R.I.,Weiss,G.,Margolin,K., Abrams, J.,Sznol, M., Parkinson, D., Hawkins, M., Paradise, C., Kunkel, L., Rosenberg, S.A.,1999. High-dose recombinant interleukin 2 therapy for patients withmetastatic melanoma: analysis of 270 patients treated between 1985 and1993. J. Clin. Oncol. 17, 2105.
Atkins, M.B., Kunkel, L., Sznol, M., Rosenberg, S.A., 2000. High-dose recom-binant interleukin-2 therapy in patients with metastatic melanoma:long-term survival update. Cancer J. Sci. Am. 6 (Suppl 1), S11.
Brenner, B.M., Troy, J.L., Ballermann, B.J., 1989. Endothelium-dependentvascular responses. Mediators and mechanisms. J. Clin. Invest. 84, 1373.
Dafni, H., Kim, S.J., Bankson, J.A., Sankaranarayanapillai, M., Ronen, S.M.,2008. Macromolecular dynamic contrast-enhanced (DCE)-MRI detectsreduced vascular permeability in a prostate cancer bone metastasismodel following anti-platelet-derived growth factor receptor (PDGFR)therapy, indicating a drop in vascular endothelial growth factor receptor(VEGFR) activation. Magn. Reson. Med. 60, 822.
Daldrup, H., Shames, D.M.,Wendland,M., Okuhata, Y., Link, T.M., Rosenau,W.,Lu, Y., Brasch, R.C., 1998. Correlation of dynamic contrast-enhanced MRimagingwith histologic tumor grade: comparison ofmacromolecular andsmall-molecular contrast media. AJR Am. J. Roentgenol. 171, 941.
Denicoff, K.D., Rubinow, D.R., Papa, M.Z., Simpson, C., Seipp, C.A., Lotze, M.T.,Chang, A.E., Rosenstein, D., Rosenberg, S.A., 1987. The neuropsychiatriceffects of treatment with interleukin-2 and lymphokine-activated killercells. Ann. Intern. Med. 107, 293.
Dorr, A., Sled, J.G., Kabani, N., 2007. Three-dimensional cerebral vasculature ofthe CBA mouse brain: a magnetic resonance imaging and micro computedtomography study. Neuroimage 35, 1409.
Eberlein, T.J., Rosenstein, M., Rosenberg, S.A., 1982. Regression of a dis-seminated syngeneic solid tumor by systemic transfer of lymphoid cellsexpanded in interleukin 2. J. Exp. Med. 156, 385.
Ellison, M.D., Povlishock, J.T., Merchant, R.E., 1987. Blood-brain barrierdysfunction in cats following recombinant interleukin-2 infusion. CancerRes. 47, 5765.
Ettinghausen, S.E., Puri, R.K., Rosenberg, S.A., 1988. Increased vascular perme-ability in organs mediated by the systemic administration of lymphokine-activated killer cells and recombinant interleukin-2 in mice. J. Natl. CancerInst. 80, 177.
Feng, Y., Jeong, E.K., Mohs, A.M., Emerson, L., Lu, Z.R., 2008. Characterization oftumor angiogenesis with dynamic contrast-enhanced MRI and biodegrad-ablemacromolecular contrast agents inmice. Magn. Reson. Med. 60, 1347.
Gemlo, B.T., Palladino Jr., M.A., Jaffe, H.S., Espevik, T.P., Rayner, A.A., 1988.Circulating cytokines in patients with metastatic cancer treated withrecombinant interleukin 2 and lymphokine-activated killer cells. CancerRes. 48, 5864.
Hank, J.A., Kohler, P.C., Weil-Hillman, G., Rosenthal, N., Moore, K.H., Storer, B.,Minkoff, D., Bradshaw, J., Bechhofer, R., Sondel, P.M., 1988. In vivo induction

55Y.Y. Irwan et al. / Journal of Immunological Methods 349 (2009) 45–55
of the lymphokine-activated killer phenomenon: interleukin 2-dependenthuman non-major histocompatibility complex-restricted cytotoxicity gen-erated in vivo during administration of human recombinant interleukin 2.Cancer Res. 48, 1965.
Harker, W.G., Tom, C., McGregor, J.R., Slade, L., Samlowski, W.E., 1990. Humantumor cell line resistance to chemotherapeutic agents does not predictresistance to natural killer or lymphokine-activated killer cell-mediatedcytolysis. Cancer Res. 50, 5931.
Hawkins, B.T., Egleton, R.D., 2006. Fluorescence imaging of blood-brain barrierdisruption. J. Neurosci. Methods 151, 262.
Hornyak, S.C., Orentas, D.M., Karavodin, L.M., Gehlsen, K.R., 2005. Histamineimproves survival and protects against interleukin-2-induced pulmo-nary vascular leak syndrome in mice. Vascul. Pharmacol. 42, 187.
Jablons, D.M., Mule, J.J., McIntosh, J.K., Sehgal, P.B., May, L.T., Huang, C.M.,Rosenberg, S.A., Lotze, M.T., 1989. IL-6/IFN-beta-2 as a circulatinghormone. Induction by cytokine administration in humans. J. Immunol.142, 1542.
Kawamura, S., Yasui, N., 1994. In vivo effects of the Ca2+ entry blockernilvadipine on brain surface microvessels in rats. Neurol. Med.-Chir.(Tokyo) 34, 663.
Kribben, A., Witzke, O., Hillen, U., Barkhausen, J., Daul, A.E., Erbel, R., 2009.Nephrogenic systemic fibrosis: pathogenesis, diagnosis, and therapy.J. Am. Coll. Cardiol. 53, 1621.
Lafreniere, R., Rosenberg, S.A., 1985. Successful immunotherapy of murineexperimental hepatic metastases with lymphokine-activated killer cellsand recombinant interleukin 2. Cancer Res. 45, 3735.
Lotze, M.T., Grimm, E.A., Mazumder, A., Strausser, J.L., Rosenberg, S.A., 1981.Lysis of fresh and cultured autologous tumor by human lymphocytescultured in T-cell growth factor. Cancer Res. 41, 4420.
Mann, H.,Ward, J.H., Samlowski,W.E., 1990. Vascular leak syndrome associatedwith interleukin-2: chest radiographic manifestations. Radiology 176, 191.
Martin, S., Maruta, K., Burkart, V., Gillis, S., Kolb, H., 1988. IL-1 and IFN-gammaincrease vascular permeability. Immunology 64, 301.
Maruo, N., Morita, I., Shirao, M., Murota, S., 1992. IL-6 increases endothelialpermeability in vitro. Endocrinology 131, 710.
Mertelsmann, R., Welte, K., 1986. Human interleukin 2: molecular biology,physiology and clinical possibilities. Immunobiology 172, 400.
Mier, J.W., Vachino, G., van derMeer, J.W., Numerof, R.P., Adams, S., Cannon, J.G.,Bernheim,H.A., Atkins,M.B., Parkinson,D.R., Dinarello, C.A., 1988. Inductionof circulating tumor necrosis factor (TNF alpha) as the mechanism for thefebrile response to interleukin-2 (IL-2) in cancer patients. J. Clin. Immunol.8, 426.
Mross, K., Drevs, J., Muller, M., Medinger, M., Marme, D., Hennig, J., Morgan, B.,Lebwohl, D., Masson, E., Ho, Y.Y., Gunther, C., Laurent, D., Unger, C., 2005.Phase I clinical and pharmacokinetic study of PTK/ZK, a multiple VEGFreceptor inhibitor, in patients with liver metastases from solid tumours.Eur. J. Cancer 41, 1291.
Mule, J.J., Shu, S., Rosenberg, S.A., 1985. The anti-tumor efficacy of lymphokine-activated killer cells and recombinant interleukin 2 in vivo. J. Immunol.135, 646.
Nakarai, T., Robertson,M.J., Streuli,M.,Wu, Z., Ciardelli, T.L., Smith, K.A., Ritz, J.,1994. Interleukin 2 receptor gamma chain expression on resting andactivated lymphoid cells. J. Exp. Med. 180, 241.
Nitta, T., Hata, M., Gotoh, S., Seo, Y., Sasaki, H., Hashimoto, N., Furuse, M.,Tsukita, S., 2003. Size-selective loosening of the blood-brain barrier inclaudin-5-deficient mice. J. Cell Biol. 161, 653.
Nooteboom, A., Van Der Linden, C.J., Hendriks, T., 2002. Tumor necrosisfactor-alpha and interleukin-1beta mediate endothelial permeabilityinduced by lipopolysaccharide-stimulated whole blood. Crit. Care Med.30, 2063.
O'Brien Jr., J.M., Ali, N.A., Aberegg, S.K., Abraham, E., 2007. Sepsis. Am. J. Med.120, 1012.
Ognibene, F.P., Rosenberg, S.A., Lotze, M., Skibber, J., Parker, M.M., Shelhamer,J.H., Parrillo, J.E., 1988. Interleukin-2 administration causes reversiblehemodynamic changes and left ventricular dysfunction similar to thoseseen in septic shock. Chest 94, 750.
Panelli,M.C.,White, R., Foster,M.,Martin, B.,Wang, E., Smith, K.,Marincola, F.M.,2004. Forecasting the cytokine storm following systemic interleukin (IL)-2administration. J. Transl. Med. 2, 17.
Papa, M.Z., Mule, J.J., Rosenberg, S.A., 1986a. Antitumor efficacy of lymphokine-activated killer cells and recombinant interleukin 2 in vivo: successfulimmunotherapy of established pulmonary metastases from weakly im-munogenic and nonimmunogenic murine tumors of three district his-tological types. Cancer Res. 46, 4973.
Papa, M.Z., Vetto, J.T., Ettinghausen, S.E., Mule, J.J., Rosenberg, S.A., 1986b.Effect of corticosteroid on the antitumor activity of lymphokine-activatedkiller cells and interleukin 2 in mice. Cancer Res. 46, 5618.
Perazella, M.A., 2009. Current status of gadolinium toxicity in patients withkidney disease. Clin. J. Am. Soc. Nephrol. 4, 461.
Pietsch, H., Lengsfeld, P., Steger-Hartmann, T., Lowe, A., Frenzel, T., Hutter, J.,Sieber, M.A., 2009. Impact of renal impairment on long-term retention ofgadolinium in the rodent skin following the administration of gadolinium-based contrast agents. Invest. Radiol. 44, 226.
Rayner, A.A., Grimm, E.A., Lotze, M.T., Wilson, D.J., Rosenberg, S.A., 1985.Lymphokine-activated killer (LAK) cell phenomenon. IV. Lysis by LAKcell clones of fresh human tumor cells from autologous and multipleallogeneic tumors. J. Natl. Cancer Inst. 75, 67.
Rosen, M.A., Schnall, M.D., 2007. Dynamic contrast-enhanced magneticresonance imaging for assessing tumor vascularity and vascular effects oftargeted therapies in renal cell carcinoma. Clin. Cancer Res. 13, 770s.
Rosenberg, S.A., Yang, J.C., Topalian, S.L., Schwartzentruber, D.J., Weber, J.S.,Parkinson, D.R., Seipp, C.A., Einhorn, J.H., White, D.E., 1994. Treatment of283 consecutive patients with metastatic melanoma or renal cell cancerusing high-dose bolus interleukin 2. JAMA 271, 907.
Samlowski, W.E., 2001. Nitric oxide as a mediator of interleukin-2 inducedcardiovascular toxicity and antitumor activity. In: Salvemini, D., Billiar, T.R.,Vodovotz, Y. (Eds.), Nitric Oxide and Inflammation. Birkhäuser Verlag,Basel, p. 249.
Samlowski, W.E., Petersen, R., Cuzzocrea, S., Macarthur, H., Burton, D.,McGregor, J.R., Salvemini, D., 2003. A nonpeptidyl mimic of superoxidedismutase, M40403, inhibits dose-limiting hypotension associated withinterleukin-2 and increases its antitumor effects. Nat. Med. 9, 750.
Samlowski, W.E., Wong, B., Vogelzang, N.J., 2008. Management of renalcancer in the tyrosine kinase inhibitor era: a view from 3 years on. BJUInt. 102, 162.
Sana, T.R., Wu, Z., Smith, K.A., Ciardelli, T.L., 1994. Expression and ligandbinding characterization of the beta-subunit (p75) ectodomain of theinterleukin-2 receptor. Biochemistry 33, 5838.
Saris, S.C., Patronas,N.J., Rosenberg, S.A., Alexander, J.T., Frank, J., Schwartzentruber,D.J., Rubin, J.T., Barba, D., Oldfield, E.H., 1989. The effect of intravenousinterleukin-2 on brain water content. J. Neurosurg. 71, 169.
Schaafsma, M.R., Falkenburg, J.H., Landegent, J.E., Duinkerken, N., Osanto, S.,Ralph, P., Kaushansky, K.,Wagemaker, G., VanDamme, J.,Willemze, R., et al.,1991. In vivo production of interleukin-5, granulocyte-macrophage colony-stimulating factor, macrophages colony-stimulating factor, and interleukin-6 during intravenous administration of high-dose interleukin-2 in cancerpatients. Blood 78, 1981.
Shames, D.M., Kuwatsuru, R., Vexler, V., Muhler, A., Brasch, R.C., 1993. Mea-surement of capillary permeability to macromolecules by dynamic mag-netic resonance imaging: a quantitative noninvasive technique. Magn.Reson. Med. 29, 616.
Torfgard, K.E., Ahlner, J., 1994. Mechanisms of action of nitrates. Cardiovasc.Drugs Ther. 8, 701.
Vallance, P., Collier, J., Moncada, S., 1989. Effects of endothelium-derivednitric oxide on peripheral arteriolar tone in man. Lancet 2, 997.
Watts, R.G., Wright, J.L., Atkinson, L.L., Merchant, R.E., 1989. Histopatholog-ical and blood-brain barrier changes in rats induced by an intracerebralinjection of human recombinant interleukin 2. Neurosurgery 25, 202.
Weiss, A., 1993. T lymphocyte activation. In: Paul, W. (Ed.), FundamentalImmunology. Raven Press, New York, p. 467.
Yim, C.Y.,McGregor, J.R., Kwon, O.D., Bastian,N.R., Rees,M.,Mori,M., Hibbs Jr., J.B.,Samlowski, W.E., 1995. Nitric oxide synthesis contributes to IL-2-inducedantitumor responses against intraperitoneal Meth A tumor. J. Immunol.155, 4382.


