Embed Size (px)
Citation preview

Human and Ecological Risk Assessment, 18: 261–328, 2012Copyright C© Taylor & Francis Group, LLCISSN: 1080-7039 print / 1549-7860 onlineDOI: 10.1080/10807039.2012.650582
RISK ASSESSMENT ARTICLES
Quantitative Assessment of Current Risksto Harlequin Ducks in Prince William Sound, Alaska,from the Exxon Valdez Oil Spill
Mark A. Harwell,1 John H. Gentile,2 Keith R. Parker,3 Stephen M. Murphy,4
Robert H. Day,4 A. Edward Bence,5 Jerry M. Neff,6 and John A. Wiens7
1Harwell Gentile & Associates, LC, Port Orange, FL, USA; 2Harwell Gentile &Associates, LC, Brewster, MA, USA; 3Data Analysis Group, Cloverdale, CA, USA;4ABR, Inc.—Environmental Research & Services, Fairbanks, AK, USA; 5AEBServices, LLC, Corpus Christi, TX, USA; 6Neff & Associates, LLC, Duxbury, MA,USA; 7PRBO Conservation Science, Petaluma, CA, USA
ABSTRACTHarlequin Ducks (Histrionicus histrionicus) were adversely affected by the Exxon
Valdez oil spill (EVOS) in Prince William Sound (PWS), Alaska, and some havesuggested effects continue two decades later. We present an ecological risk assess-ment evaluating quantitatively whether PWS seaducks continue to be at-risk frompolycyclic aromatic hydrocarbons (PAHs) in residual Exxon Valdez oil. Potential path-ways for PAH exposures are identified for initially oiled and never-oiled referencesites. Some potential pathways are implausible (e.g., a seaduck excavating subsur-face oil residues), whereas other pathways warrant quantification. We used data onPAH concentrations in PWS prey species, sediments, and seawater collected during2001–2008 to develop a stochastic individual-based model projecting assimilateddoses to seaducks. We simulated exposures to 500,000 individuals in each of eightage/gender classes, capturing the variability within a population of seaducks livingin PWS. Doses to the maximum-exposed individuals are ∼400–4,000 times lowerthan chronic toxicity reference values established using USEPA protocols for sea-ducks. These exposures are so low that no individual-level effects are plausible, evenwithin a simulated population that is orders-of-magnitude larger than exists in PWS.We conclude that toxicological risks to PWS seaducks from residual Exxon Valdez oiltwo decades later are essentially non-existent.
Received 8 April 2010; revised manuscript 20 July 2010.The opinions and conclusions expressed herein are strictly those of the authors and do notnecessarily represent the opinions of ExxonMobil.Address correspondence to Mark A. Harwell, Harwell Gentile & Associates, LC, P.O. Box291267, Port Orange, FL 32137, USA. E-mail: [email protected]
261

M. A. Harwell et al.
Key Words: seaducks, Exxon Valdez oil spill, ecological risk assessment, PAHs,Prince William Sound, ecotoxicology, individual-based models.
INTRODUCTION
Harlequin Ducks (Histrionicus histrionicus) are small seaducks that breed alongclear, fast-flowing streams and inhabit shallow marine intertidal zones off rockyshorelines during winter (Robertson and Goudie 1999). The western North Americapopulation of Harlequin Ducks winters along the coast from northern California toBritish Columbia, southeastern and south-central Alaska, and the Aleutian Islands(Robertson and Goudie 1999). Harlequin Ducks are present throughout the year inPrince William Sound (PWS), Alaska. Peak abundances in PWS occur during the falland winter, when migrating and wintering birds are present (Iverson and Esler 2006;authors’ observations). Harlequin Ducks are particularly vulnerable to the directeffects of oil spills because they exhibit high site-fidelity and spend most of theirtime in intertidal and nearshore waters where they feed on epibenthic invertebrates(King and Sanger 1979; Piatt et al . 1990; Day et al. 1995, 1997; Holland-Bartels et al .1998; Esler et al . 2000; Iverson and Esler 2006).
The Exxon Valdez oil spill (EVOS) in March 1989 released more than 250,000barrels of crude oil, approximately 40% of which was stranded along ∼783 km(about 16%) of the PWS shoreline (Wolfe et al. 1994; Neff et al. 1995). Based on late-winter population estimates and retrieval rates of carcasses, an estimated 500–1,000Harlequin Ducks (approximately 3–7% of the wintering population) were killed asa result of direct exposure to Exxon Valdez oil (EVO) during and immediately afterthe spill (Esler et al. 2002; Rosenberg et al. 2005; Rice et al. 2007). Within weeks of theoil spill, concerns were expressed about potential persistent adverse toxic effects onHarlequin Ducks from ingesting oiled prey, especially mussels (Patten et al. 2000).
The potential for long-term, post-spill effects on Harlequin Duck populations isthe subject of continuing discussion. Some studies have reported decreased abun-dance, linking it to: (1) reduced overwintering survival of females and/or unsuc-cessful reproduction (Esler et al. 2000; Patten et al. 2000); (2) degraded habitatquality (Day et al. 1995, 1997; Irons et al . 2000; Wiens et al. 2004); or (3) exposure tohydrocarbons and, by inference, continuing toxic effects from EVOS, as indicatedby elevated cytochrome P4501A [CYP1A] activity (Trust et al. 2000; Esler et al. 2002;Esler 2008). The Exxon Valdez Oil Spill Trustee Council (EVOSTC) concluded fromstudies conducted from 1997 through 2005 that Harlequin Ducks are recovering,but have not fully recovered from the effects of the oil spill (EVOSTC 2006, 2010).
Habitat quality has been posited as one possible variable governing the recov-ery of seaducks in PWS. By using a repeated-measures, multiple-lines-of-evidenceapproach, Wiens et al. (2004) analyzed habitat use by marine birds, including theHarlequin Duck, during 1989–2001 in ten bays in PWS that spanned a range of ini-tial oiling levels, from unoiled or outside the spill zone to some of the most heavilyoiled locations in the Sound (Day et al. 1995, 1997; Wiens et al. 1996; Murphy et al.1997). The habitat-based approach assumes that birds recognize and respond tohabitat conditions following a large environmental perturbation such as an oil spill,so the resulting patterns of habitat occupancy and use provide an indirect measure
262 Hum. Ecol. Risk Assess. Vol. 18, No. 2, 2012
Current Risks to Harlequin Ducks
of the health of the environment (Wiens 1995; Wiens et al . 2004). This habitat-basedapproach demonstrated that by 1994 all species of marine-oriented birds had reoc-cupied initially oiled bays in PWS at levels that would be expected in the absence ofan oil spill (Wiens et al . 1996).
Although interpretingpopulation and demographic data for Harlequin Ducks inPWS has its challenges (e.g., accounting for variation in sampling design amongstudies, seasonal and interannual variation, absence of pre-spill data for HarlequinDucks in PWS; Integral 2006), several studies have examined trends in abundanceand demography in oiled versus unoiled portions of the spill area (Day et al. 1995,1997; Murphy et al. 1997; Rosenberg and Petrula 1998; Wiens et al. 2004; Parker andWiens 2005; Rosenberg et al. 2005; McKnight et al. 2006; Wiens et al. 2010). Wienset al. (2010) reviewed a compilation of population estimates of Harlequin Ducksin PWS during the months of March, July, and August of 1972–2005 (McKnightet al . 2006) and concluded that there was no discernable decline in abundance inthe unoiled parts of PWS during this period. McKnight et al . (2006) also found nodeclining population trends since the spill; however, they concluded that HarlequinDucks were not fully recovered in the oiled areas because there was not a positivepopulation trend. These differing interpretations of the same data likely derive fromdifferences in the definition of recovery (Parker and Wiens 2005).
In a comprehensive analysis of sex- and age-composition during winter, Rosenberget al. (2005) concluded that Harlequin Duck demographics in oiled areas weresimilar to elsewhere in their range and that age ratios, which are used as an indexof recruitment, were similar between oiled and unoiled areas, indicating that recentproductivity is not adversely affected by remnants of EVOS. Further, the higherrates of mortality for females overwintering in oiled parts of PWS that had beendocumented during the 1990s (Esler et al. 2000) have dissipated in more recentyears (Bodkin et al. 2003), with no difference in winter survival rates in femalesbetween oiled and unoiled sites by 2000–2003 (Esler and Iverson 2010).
Harlequin Ducks were sufficiently abundant in PWS during mid-summer to per-mit repeated, within-year analyses for all years of the Wiens et al . (2004) weight-of-evidence study. Those analyses indicated a negative relationship between abundanceand oiling level in 1989–1991 that was not present in 1996–2001 (Table 2 in Wienset al . 2004). These results suggested an initial impact of the oil spill on utilizationof oiled habitats by Harlequin Ducks that was no longer apparent by 1996. How-ever, when habitat variables were included in the analysis, none of the within-yearanalyses indicated a negative relationship with oiling level (Table 1 in Wiens et al .2004); instead, the patterns seemed to be associated more closely with habitat differ-ences among the bays than with oiling level. The pre-spill data indicate that in 1984(and in most post-spill years) Harlequin Ducks were substantially more abundantin those bays that later escaped oiling, and the apparently negative relationship inthe oiling analysis disappeared when both habitat and oiling were included in theanalysis (Wiens et al . 2004). Consequently, the post-spill differences in abundanceof Harlequin Ducks between oiled and unoiled areas were not significantly differentfrom those seen prior to the spill. The only exception was in 2001, when the unoiledbays showed a significant relative increase over oiled bays. However, that differenceoccurred only when the glaciated fjords in the northern part of the Sound wereincluded as part of the reference area. When those glaciated bays were omitted,
Hum. Ecol. Risk Assess. Vol. 18, No. 2, 2012 263

M. A. Harwell et al.
thereby providing a more appropriate reference area for the parts of the Sound thatwere oiled by EVOS, the marked increase in abundance in the unoiled region didnot emerge (Wiens et al. 2010). Thus, the overall habitat assessments suggested thatdifferences among habitats, rather than oiling, were the primary cause of variationsin abundances in the bays examined. There was no indication of an impact fromEVOS on habitat occupancy by Harlequin Ducks after 1991.
Thus, based on a weight-of-evidence evaluation from the aforementioned studies,Wiens et al. (2010) concluded that there appears to be no indication of continu-ing population-level impacts, either to abundance or demographics, on HarlequinDucks from EVOS. On the other hand, while EVOSTC (2010) recognized that nodifferences in population trends of Harlequin Ducks were observed between oiledand unoiled areas of PWS after 1997, they concluded that there continues to be arisk of exposure to hydrocarbons from EVOS (Esler 2008).
The role of biomarkers (i.e., biochemical indicators of exposure), in this caseCYP1A, remains an intensely discussed issue in assessing the recovery of HarlequinDucks. Trust et al. (2000) found statistically significant differences in CYP1A activity inMarch–April 1998 between Harlequin Ducks sampled on unoiled Montague Islandand those sampled in initially oiled sites on Crafton Island and Main Bay, with meanCYP1A at oiled areas exceeding those at reference areas by a factor of ∼3 (205 vs.71 pmol·min−1·mg−1). Studies by Bodkin et al. (2003) indicated that CYP1A levels inHarlequin populations from oiled and unoiled areas had subsequently converged,although Esler (2008) suggested that statistically different levels returned in 2005,and Esler et al . (2010) reported differences remained during 2005–2009. Overall,there appeared to be a decreasing trend in CYP1A induction through 2005 (Integral2006).
Interpretation of the CYP1A data, however, is confounded because CYP1A re-sponds more strongly to pyrogenic than petrogenic hydrocarbons (Anderson andLee 2006) and because biomarker-inducing pyrogenic PAHs (e.g., chrysene andbenzo(a)pyrene) occur throughout the spill zone (Page et al. 1999, 2002, 2004;Huggett et al. 2003). Anderson and Lee (2006) also noted that a number of otherfactors, including gender, sexual maturity, age, ambient temperature, and season,affect CYP1A levels in marine animals. Moreover, CYP1A induction is not diagnosticof exposure to PAHs; rather, it can be induced in marine animals by exposure tomany other chemicals, with a particularly strong CYP-induction response caused bymany polychlorinated biphenyl (PCB) congeners (Houde et al. 2005). As Trust et al .(2000) and Ricca et al . (2010) reported, CYP1A-inducing PCBs do exist in PWS andare found in Harlequin Duck and sea otter tissues. Moreover, Figure 3 in Trust et al .(2000) shows a threshold response of CYP1A-induction by the PCB congener 138:in all cases where PCB 138 concentrations exceeded ∼2 ppb, CYP1A-induction rateswere 50–100% higher than all of the other samples. In fact, the highest CYP1A leveloccurred for a seaduck at an unoiled site that had the highest concentration of PCB138. Similarly, Ricca et al . (2010; Table 1) reported that another strong CYP-inducer,PCB congener 81, had more than double the geometric mean concentration inHarlequin Duck blood samples from oiled areas compared to unoiled areas (basedon the same 1998 samples reported in Trust et al . 2000). These data suggest that theinfluence of locally elevated PCBs on CYP1A levels cannot be dismissed, irrespec-tive of whether any associated ecological effects occurred. Given the confounding
264 Hum. Ecol. Risk Assess. Vol. 18, No. 2, 2012

Current Risks to Harlequin Ducks
factors discussed above, it is problematic to attribute activation of this biomarker inHarlequin Ducks in PWS solely to exposure from EVOS-derived PAHs.
Nevertheless, there continues to be speculation that remnant subsurface oilresidues (SSOR) pose a risk to species such as seaducks that feed within the in-tertidal zone (ITZ) at northern Knight Island (NKI) (Bodkin et al. 2002; Short et al.2006). Esler et al. (2002) and Bodkin et al. (2003) suggested that the foraging behav-ior of Harlequin Ducks on small invertebrates either attached to or beneath gravelor cobble results in the bioturbation of surficial sediments. According to this argu-ment, this bioturbation would release SSOR, with subsequent oiling of the seaduck’splumage and ingestion of contaminated prey, leading to exposure to PAHs in theresidual SSOR. Using data from the NOAA 2003 survey of SSOR, Short et al. (2006;Table 3) estimated probabilities of randomly encountering SSOR from digging intointertidal sediments averaged over all tidal elevations and averaged separately forthe upper-half and lower-half of the ITZ (i.e., they did not limit their probability as-sessment to the tidal zone where sea otters actually forage). Those authors asserted“these encounter probabilities are sufficient to ensure that sea otters and ducks thatroutinely excavate sediments while foraging within the ITZ would likely encountersubsurface oil repeatedly during the course of a year.” Rice et al . (2007) stated that“population effects on Harlequin Ducks are evident still” and that “poor recovery isprobably due to foraging for intertidal invertebrates in oiled sediments.”
A qualitative ecological risk assessment of the potential continuing effects onHarlequin Ducks from EVOS (Wiens 2007) discussed sources of variability in thePWS environment that might affect the seaducks; differences between presence ofindividual-level biomarkers, such as the CYP1A activity, and effects on populations;and difficulties in defining and assessing recovery, particularly in the presence ofuncertainty. Wiens (2007) concluded that the likelihood of continuing effects fromEVOS on the PWS Harlequin Duck population seemed remote.
Here we take the next step to conduct a detailed, quantitative, probabilistic ecologi-cal risk assessment. Specifically, our objective is to use a risk-based assessment strategy(USEPA 1992, 1998; Gentile et al. 1993) to evaluate systematically and quantitativelythe question: Is the Harlequin Duck population of Prince William Sound presentlyat-risk from EVOS-derived PAHs in the environment? The risk-based approach usedin this study has as its foundation a conceptual ecological model presented here thatdescribes the suite of exposure pathways by which Harlequin Ducks in PWS couldplausibly be exposed to EVOS-derived PAHs in the environment. These exposurepathways are quantified using the most-recent available empirical data and are sim-ulated in a stochastic, predictive model to estimate the total exposure of HarlequinDucks to PAHs in PWS.
We then forecast the average daily assimilated doses to a hypothetical populationof 500,000 Harlequin Ducks, capturing the characteristics of the Harlequin Ducksand the variability of the PAH sources as they exist in PWS. The output from thesesimulations results in a distribution of doses from which we extract the doses as-similated by the 99.9% quantile (1-in-1,000th) most-exposed individuals. The lattervalues are compared to appropriate toxicological benchmarks to provide a conser-vative, quantitative estimate of the current toxicological risks from EVOS to theHarlequin Ducks of PWS, with conservative defined here as resulting in a higherestimate of risk. Further, the projected individual-level effects are extrapolated to
Hum. Ecol. Risk Assess. Vol. 18, No. 2, 2012 265

M. A. Harwell et al.
provide an assessment of the potential for population-level effects. By following thiscomprehensive, quantitative ecological risk-based approach and applying conserva-tive data and model assumptions to the assessment, we are able to provide a clearanswer to the question whether the Harlequin Duck population of Prince WilliamSound is presently at-risk from EVOS-derived PAHs.
CHARACTERISTICS OF HARLEQUIN DUCKS USEDTO PARAMETERIZE THE MODEL
Several characteristics of Harlequin Ducks were used to parameterize the risk-assessment model (i.e., assign specific values to all of the model parameters) so thatit realistically simulates the toxicological risks to Harlequin Ducks in PWS from rem-nant EVOS-derived PAHs. The characteristics of importance relate to the exposurepathways of Harlequin Ducks to PAHs and to the factors controlling the effects ofsuch exposures. These factors include body mass, energetic requirements, dietarypreferences, ingestion of seawater and sediments, and toxic effects from chronicexposure to PAHs. We present information that has been collated and synthesizedspecifically for Harlequin Ducks and their prey species, whenever possible, with pri-ority given to information from PWS if available and from other areas as necessary. Ina few cases, however, we relied upon information characterizing similar species whenthat information was all that was available. Throughout the model development andparameterization, we followed a conservative approach (i.e., selecting parametersthat tended to increase the estimate of risk).
Body Mass
The body mass of Harlequin Ducks changes with age and fluctuates seasonallyin response to shifts in energy demands and food availability. When Robertson andGoudie (1999) compiled mean weights of Harlequin Ducks across North America,few data on winter weights were available. Recent studies in PWS (Esler 2008) andBritish Columbia (Bond and Esler 2006), as well as in the Aleutian Islands (Fis-cher 1998; Fischer and Griffin 2000), have increased our knowledge about seasonalchanges in body mass in Harlequin Ducks in western North America.
Female Harlequin Ducks in western and eastern North America are smallerand lighter than males (age classes not distinguished; Robertson and Goudie1999). Esler (2008) reported capture data covering 10 yr (1995–1998, 2000–2002,and 2005–2007), which indicated that weights consistently differed among adults,subadults, and hatching-year birds in both fall and winter. Hatching-year birds in-crease in weight from fall to winter as they mature but remain the lightest age-classuntil the following summer. Crowley (1999) reported that the mean body weight ofbreeding (adult) females during June was greater than that of subadults and thatpaired subadult females were on average heavier than non-paired females.
The body mass of adult Harlequin Ducks varies seasonally, caused by such factorsas ingestion of large amounts of herring eggs (when herring are spawning in largenumbers), weight gain prior to migration, weight gain prior to egg-laying, weightloss in females during most of the rest of the breeding season, weight variabilityassociated with molting, and rigors of overwintering life (Rosenberg and Petrula
266 Hum. Ecol. Risk Assess. Vol. 18, No. 2, 2012

Current Risks to Harlequin Ducks
Table 1. Mean body mass ± standard deviations of Harlequin Ducks by gender,age-class, and season in Prince William Sound, Alaska.a
Body Mass (in g)
Gender/Age-Class Summer (a) Late Winter (b)
Adult Females (c) 592 ± 36 (n = 761) 553 ± 33 (n = 53)Juvenile Females (d) 425 ± 75 (n = 11) 514 ± 31 (n = 8)Adult Males (c) 661 ± 39 (n = 457) 628 ± 29 (n = 92)Juvenile Males (d) 473 ± 60 (n = 7) 588 ± 16 (n = 4)
aSource Esler (2008).Notes:(a) Data collected during 20 Aug – 15 Sep in 1995, 1996, 1997, 2000, 2001.(b) Data collected during 20 Feb – 9 Apr in 1997, 1998, 2002, 2005, 2007.(c) Age3 1 year.(d) Age ≥1 year.
1998; Robertson and Goudie 1999; Bond and Esler 2006). Because of this variability,we estimated the body biomass for four gender/age classes and two seasons for usein the model (Table 1).
Diet
Patten et al . (2000) reported on the marine diet of 89 Harlequin Ducks collectedin PWS in 1989–1990. Data were presented as frequency-of-occurrence and as alength-importance index (LII) (considered here to be a surrogate for relative im-portance index; Robertson and Goudie 1999), based on the number and size oforganisms consumed. The prey for Harlequin Ducks in PWS were epifaunal speciesliving in rocky-intertidal or nearshore-subtidal habitats. (Note that the diet is quitedifferent when the Harlequin Ducks are in their upland nesting habitat near largestreams.) Diet was dominated by mollusks, especially gastropods (including peri-winkles [Littorina sp.], chink shells [Lacuna sp.], and limpets [Lottia sp. and Acmaeasp.]), bivalves (especially blue mussels [Mytilus trossulus] and various clam species),and chitons (Tonicella sp.). Fish eggs were next in importance, primarily from Pacificherring (Clupea pallasi) and secondarily from pink salmon (Oncorhynchus gorbuscha).The diet also included crustaceans (e.g., hermit crabs [Pagurus sp.]) and echino-derms of various species (including a sea urchin, sea cucumber, and starfish). Onepolychaete (Nereis sp.) was the only annelid recorded, and the only fish was one sandlance (Ammodytes sp.).
The Patten et al . (2000) data are consistent with other studies in the northeastPacific on Harlequin Duck diet (Vermeer 1983; Dzinbal and Jarvis 1984; Gainesand Fitzner 1987; Fischer and Griffin 2000).Goudie and Ankney (1986) suggestedthat because of high energetic needs in winter, seaducks are trophic generalists andopportunists, feeding on high-energy prey when available. Thus, the Patten et al .(2000) data are typical for feeding in coastal marine habitats in winter, and providean appropriate database with sufficient sample size to describe the PWS HarlequinDuck diet. The approximately 30 species of prey listed in Patten et al. (2000) were
Hum. Ecol. Risk Assess. Vol. 18, No. 2, 2012 267

M. A. Harwell et al.
Table 2. Diet of Harlequin Ducks in Prince William Sound, Alaska, in1989–1990.a
Prey Category Relative Importance (%)
Gastropods 59.8Mussels 12.3Fish eggs 12.0Crustaceans 9.6Clams 2.3Other invertebrates 4.0
Total 100.0
aData are from Patten et al . (2000; Table 6) and refer to the length-importance index, whichwas normalized to 100% total. The data for the model were aggregated across seasons andinto the six prey categories listed here. Because the total of the 10 food items that wererepresented by a trace (<1% each) in Table 6 from Patten et al . (2000) constituted 3.0% ofthe total length-importance index, each was assigned the value of 0.3% and aggregated intothe appropriate prey category.
aggregated into six prey categories for parameterizing the Harlequin Duck riskmodel (Table 2).
Bioenergetic Requirements
Because no published studies have quantified the daily bioenergetic requirementsof Harlequin Ducks, the estimates used here were based on studies of related birdspecies. Both Birt-Friesen et al . (1989) and Nagy et al . (1999) summarized informa-tion on field metabolic rates (FMR) for a wide range of wild terrestrial vertebratespecies as determined by the doubly-labeled-water technique. (In that method, theanimal consumes 3H- and 18O-labeled water; the difference in the rate of loss of eachradioisotope provides a measure of CO2 production and, therefore, a direct measureof the metabolic rate of the animal; Speakman 1998.) Nagy et al. (1999) estimatedthe FMR for various groups of mammals, birds, and reptiles using the following allo-metric equation, and Birt-Friesen et al . (1989) estimated similar allometric equationsfor FMR of various groups of seabirds:
FMR(kJ · day−1) = a ∗ (body mass[grams])b (1)
The Nagy et al. (1999) fitted-parameters, a (linear multiplier) and b (slope in semi-log plot), for their marine birds category are very similar to the Birt-Friesen et al .(1989) fitted-parameters for their all seabirds category, with similar r2 values for therespective slopes of the equation (0.923 and 0.91, respectively). Here we selected theNagy et al . (1999) parameters for the category marine birds because: (1) that coversthe widest group of birds that spend most of their lives at sea (36 species for Nagyet al . 1999 vs. 23 species for Birt-Friesen et al . 1989); (2) the r2 value is somewhathigher for the Nagy et al . (1999) equation than for the Birt-Friesen et al . (1989)equation; and (3) the Nagy et al . (1999) values for marine birds yield the highestestimates of daily FMR. The latter seems to be particularly applicable to a specieslike the Harlequin Duck that occurs at high latitudes and is flight-capable. The Nagy
268 Hum. Ecol. Risk Assess. Vol. 18, No. 2, 2012
Current Risks to Harlequin Ducks
et al. (1999) parameters also lead to a more conservative value for the model (i.e.,tending to increase the projected doses).
Seasonal Variation in Bioenergetics
The Harlequin Duck’s resting metabolic rate, daily energy expenditure (DEE),and body mass vary seasonally. In PWS, adult females are in coastal habitats from Au-gust to early June, specifically during the fall wing-molt (August–September), over-wintering (October–April), and the herring-spawning and spring-migration periods(late April and May). Breeding Harlequin Ducks then shift to freshwater habitatsfor pre-laying, incubation, and brood-rearing (June–August), with males presentonly during the pre-laying period. Males and non-breeding or failed-breeding fe-males return to coastal environments soon after nest initiation. Confounding factorsdetermining seasonal variation in energetics for wild birds include environmentalvariation, behavioral modification, and intrinsic seasonal variation in physiology.Seasonal variations in the environment, especially winter ambient air and watertemperatures, also affect energetic needs. Water temperature is important, primar-ily because the rate of thermal transfer in water is about 25 times the rate in air, so therate of thermal loss increases dramatically in cold waters. In addition, a bird’s bodytemperature is ∼40◦C, whereas water temperatures may be at or below 0◦C, leadingto a great disparity in temperatures and the possibility of rapid energy loss to the en-vironment. As a result, some authors have suggested that water temperatures may bean important factor limiting the wintering distribution of some seaducks (de Leeuwet al. 1999). In winter high winds may increase the DEE of seaducks substantially,and ingesting cold prey further adds to the energetic costs of thermoregulation(Brinkman et al. 2003; McKinney and McWilliams 2005).
Bioenergetic needs may be reduced behaviorally. For example, seaducks needincreased energy to replace all of the feathers in the complete post-nuptial molt;however, they may substantially reduce total energy needs by remaining flightless(Guillemette et al. 2007) or by getting out of the water and sitting on rocks to reduceheat loss, both during the molt and in extremely cold temperatures (de Vries andvan Eerden 1995; Adams et al . 2000). Physiological variability also may cause changesin energetic needs; as one example, body mass declines as the bird enters winter(Guillemette et al. 2007) because of reduced feeding, even when food is unlimitedand access is unrestricted (Portugal et al . 2007). Conversely, between late winter andpre-migration, seaducks store fat and increase mass in preparation for migration andbreeding; for example, female Harlequin Duck mass in British Columbia increased7% during this period (Bond and Esler 2006).
No published studies of Harlequin Duck energetics are available, but there isinformation for two related seaducks, the Common Eider (Somateria mollissima) andthe Tufted Duck (Aythya fuligula). Brinkman et al . (2003) developed an energy andheat model for Common Eiders wintering in the Baltic and North seas, estimatingDEE at ∼1,550 kJ·day−1 in the summer and ∼3,050 kJ·day−1 during the coldest part ofthe winter, an increase of 97%. Nehls (1995, cited in Brinkman et al . 2003) estimatedDEE as ∼2,100 kJ·day−1 in the summer and ∼3,000 kJ·day−1 in the winter. Brinkmanet al . (2003) estimated that summer DEE rates varied by 35%, and de Leeuw et al .(1999) found that DEE rates in Tufted Ducks increased 68% from the summer to
Hum. Ecol. Risk Assess. Vol. 18, No. 2, 2012 269

M. A. Harwell et al.
the winter. Because these various studies on seasonal variation in bioenergetics showincreases ranging from 43% to 97%, we examined the potential importance of thisvariability through a model sensitivity analysis, discussed below, that doubled theenergy needs and, thereby, dietary intake, providing a conservative estimate of therange of natural variability.
Water Intake
Seaducks can drink seawater because they have salt glands that secrete a sodiumchloride solution that is more concentrated than seawater (Schmidt-Nielsen andKim 1964). Adult seaducks apparently do not leave the ocean to drink freshwater,although adult females commonly take their broods from the ocean to freshwaterto drink (Nystrom and Pehrsson 1988) because the ducklings have a lower osmoreg-ulatory capacity (Nystrom and Pehrsson 1988; DeVink et al . 2005). Few studies havemeasured the amount of water consumed by seaducks or other waterfowl, and thereis no direct evidence that Harlequin Ducks deliberately ingest seawater. Neverthe-less, to be conservative, we added the seawater-ingestion route of exposure to theconceptual model, irrespective of whether such ingestion is done deliberately orinadvertently while feeding. Fletcher and Holmes (1968) measured daily water in-take in domestic Mallards (Anas platyrhynchos) in a laboratory and found that theamount of water ingested declined when freshwater was replaced with saline water.At higher salinities, however, one must be cautious in assuming that fluid intake willbe similar between domestic Mallards and seaducks because Mallards have a lowerphysiological capacity for osmoregulation than do seaducks (Bennett and Hughes2003). Further, several studies have shown that birds raised in marine environmentsand/or with highly developed salt glands have higher salinity thresholds than otherbirds (Schmidt-Nielsen and Kim 1964; Harriman 1967; Walter and Hughes 1978;Bennett 2002; Bennett and Hughes 2003; Bennett et al . 2003). For example, Bar-row’s Goldeneyes (Bucephala islandica) are able to drink water of higher salinitywithout changing fluid intake, whereas Mallards must decrease fluid intake at evenmoderate salinity levels (Bennett and Hughes 2003).
Another approach for estimating bird drinking-water rates uses doubly-labeled-water studies to estimate daily water influx (i.e., water that is drunk + water in food +metabolic water). No studies have been conducted specifically for Harlequin Ducks,but USEPA (1993) recommended the Nagy and Peterson (1988) allometric modelfor estimating daily water influx based on body mass and taxonomic group:
Daily Water Flux [ml] = a ∗ (body mass[kg])b (2)
The Central Science Laboratory (CSL 2007) enhanced the Nagy and Peterson(1988) water-flux model by incorporating data from doubly-labeled-water studies,thereby expanding the number of species analyzed and creating separate modelsfor various categories of 39 species of birds, including seabirds. These two methods(Nagy and Peterson 1988; CSL 2007) for estimating the volume of drinking waterconsumed daily by female Harlequin Ducks produced estimates that differed byonly 20%. Here, we selected Fletcher and Holmes’ (1968) estimate of freshwaterdrinking rates for Mallards to approximate the daily seawater intake for HarlequinDucks, normalized to body weight. We used this higher value, rather than the value
270 Hum. Ecol. Risk Assess. Vol. 18, No. 2, 2012

Current Risks to Harlequin Ducks
for Mallards drinking saline water, because the latter were under osmotic stress andreduced their daily intake accordingly. In addition, the use of this higher numberresults in a higher estimated daily intake of water for Harlequin Ducks and thus ismore conservative, leading to a higher estimate of risk.
Ingestion of Grit and Sediments
Harlequin Ducks may deliberately ingest sediments for dietary purposes or mayconsume sediments inadvertently while foraging, particularly in softer substrates.Many bird species ingest grit or sediment to aid in the mechanical breakdown offood items or for nutrients. Several studies (Fischer and Griffin 2000; Rodway andCooke 2002) reported the presence of grit in the gizzard, proventriculus, and/orfecal matter of Harlequin Ducks, although none measured the particle size or thevolume of grit. Several studies have reported food contents in the gullet (esophagusand proventriculus) of Harlequin Ducks (Kenyon 1961; Vermeer 1983; Goudie andAnkney 1986; Gaines and Fitzner 1987; Goudie and Ryan 1991; Fischer and Griffin2000; Patten et al . 2000), but none includes information on grit characteristics.
The occurrence of grit in Harlequin Duck feces varies seasonally in BritishColumbia, increasing from 12% (n = 25) of fecal samples tested in the early fall(August–September) to 90% (n = 83) by late winter (April) (Rodway and Cooke2002). During the breeding season, Robert and Cloutier (2001) reported sand in50% (n = 42) of the Harlequin Duck fecal samples from eastern North Americanrivers; these authors also classified 21% of the fecal samples containing sand ashaving “large quantities” of sand, although no quantitative measurements were pro-vided. The percentage of sediment in the diet can be estimated by calculating theacid-insoluble ash (AIA) content of the digesta from both the gizzard and gullet andincorporating information on the digestion rate of food items and the estimated AIAcontent of ingested sediment. Using this technique, Beyer et al. (2008) estimatedthat the sediment portion of the diet of seven seaduck species varied from ∼2% to14% and concluded that grit ingestion in waterfowl was related to diet and substrate.Although Harlequin Ducks are not discussed by Beyer et al. (2008), Common Gold-eneyes (Bucephala clangula) were characterized. This species is ecologically similarto Harlequin Ducks in PWS: both species are year-round residents but primarily usePWS for overwintering; both forage in nearshore and intertidal habitats; and bothhave overlapping diets that include mussels, littorine snails, and crustaceans (Pattenet al . 2000; Bourget et al . 2007; Beyer et al . 2008). Beyer et al . (2008) reported thatthe mean percent grit in the diet of Common Goldeneyes was 5.2% of ingestedmass. We regard the latter to be the best estimate of grit consumption for HarlequinDucks to use in the risk-assessment model; a sensitivity analysis doubles this rate to10.4%.
Avian Chronic Toxicity Reference Values
Wildlife Toxicity Reference Values (TRVs) are species- and chemical-specific es-timates of an exposure or dose concentration that is unlikely to cause adverseecological effects (e.g., growth, reproduction, or survival) (USARMY 2000; USEPA2005). The chronic TRV is defined as the dose above which ecologically relevanteffects might occur to wildlife species following chronic exposures and below which
Hum. Ecol. Risk Assess. Vol. 18, No. 2, 2012 271

M. A. Harwell et al.
it is reasonably expected that such effects would not occur (USEPA 2005). There arethree categories of TRVs: dose-, concentration-, and tissue-based estimates of expo-sure that are used to determine the no-observed-adverse-effects level (NOAEL) andthe lowest-observed-adverse-effects level (LOAEL). Dose-based TRVs (expressed inunits of mg contaminant·kg−1 body wt·day−1) are typically used when evaluatingchronic risks to wildlife via ingestion pathways (USEPA 2005) and is the approachfollowed here.
Guidance for developing TRVs (USARMY 2000; USEPA 2005) provides minimumdata criteria that must be satisfied to estimate TRVs. These criteria include, but arenot limited to, the following: (1) selecting endpoints that are most clearly linkedto population sustainability; (2) employing an oral route of exposure that consistsof a suitable control and at least two experimental concentrations that bracket theexpected effects levels; (3) continuing exposures for a sufficient duration to qualifyas a chronic study; (4) clearly reporting details on the duration of exposure, concen-trations applied, and frequency of the dose; and (5) quantifying effects on growth,survival, or reproduction that are most clearly associated with no-to-low adverse ef-fects (i.e., NOAEL and LOAEL). These criteria provide a systematic framework fordetermining which avian toxicology data are sufficient and appropriate for estimat-ing a TRV for seaducks.
As a component of the USEPA’s Ecological Soil Screening Level (Eco-SSL) Guid-ance, an extensive literature search identified 5,478 papers that contained PAHtoxicity data for avian and mammalian species that potentially could be suitablefor developing mammalian and avian toxicity reference values (USEPA 2005, At-tachment 4-2). Of the 46 potentially suitable papers (i.e., those studies that met allof the USARMY 2000 and USEPA [2005] minimum data criteria), only two con-tained data for avian species; these were scored following the Eco-SSL guidance(USEPA 2005; Attachment 4-3 and 4-4). Within these two studies, there were dataavailable for only one species exposed to low- and high-molecular-weight PAHs, re-spectively. Specifically, the low-molecular-weight TRV was for 13-day-old BobwhiteQuail (Colinus virginianus) exposed to naphthalene for a period of 5 days. The re-ported NOAEL (5620 mg·kg−1 diet) resulted in a TRV of 1653 mg·kg−1·day−1 forboth mortality and growth (Landis 1985). The high-molecular-weight TRV was de-rived from exposing 9-day-old European Starlings (Sturnus vulgaris) for 5 days to7, 12-dimethylbenz(a)anthracene at 0, 2, or 20 mg·kg−1 body wgt·day−1 (Trust et al .1994). The NOAEL TRV was determined to be 2 mg·kg−1·day−1 and the LOAELTRV was 20 mg·kg−1·day−1 for growth measured as changes in body weight. How-ever, these two studies failed to meet the minimum criteria developed in the USEPAguidance for TRVs (specifically requiring at least three toxicity values for two speciesfor mortality, growth, or reproduction and at least two chronic LOAELs and onechronic NOAEL). Moreover, additional extrapolation uncertainties limit the useof these data for our study. In particular, these values are for two terrestrial birdspecies and therefore can only provide general information concerning the magni-tude that might be expected for avian TRVs for petroleum hydrocarbons to marinebirds. Additionally, these values are for exposures to a single low- or high-molecular-weight PAH and thus cannot be directly converted to the TPAH exposures that areevaluated in this study.
272 Hum. Ecol. Risk Assess. Vol. 18, No. 2, 2012

Current Risks to Harlequin Ducks
Table 3. Chronic toxicity reference valuesa for average daily doses of tpah forHarlequin Ducks (mg·kg body weight–1·day–1)a.
NOAEL LOAEL
Female 2.14 22.01Male 2.00 19.56
aTRVs derived from toxicity studies on Mallard Ducks reported in Stubblefield et al.(1995a,b), following protocols of USEPA (2005, 2007).
The Mallard Duck,which lives in freshwater, estuarine, or marine environments,is one of the most commonly used species in toxicological studies on avian aquaticspecies exposure to petroleum hydrocarbons (Hartung and Hunt 1966; Holmeset al . 1978a,b, 1979; Coon and Dieter 1981; Gorsline and Holmes 1982; Cavanaughet al . 1983; Holmes and Cavanaugh 1990; Stubblefield et al . 1995a,b). After carefulreview of these and other studies (including Szaro et al . 1978, 1981; Albers 1979;Patton and Dieter 1980; Vanglider and Peterle 1980; Hoffman and Gay 1981; Ca-vanaugh and Holmes 1982, 1987; Rocke et al . 1984), we concluded that the studiesby Stubblefield et al. (1995a,b) on Mallard Ducks using weathered EVO uniquelyprovided a reasonable basis for assigning TRV values that are applicable to theHarlequin Duck and to exposure to EVOS-derived PAHs. Accordingly, we followedthe USEPA protocols (USEPA 2005, 2007) to derive the TRVs from those studies asfollows.
Stubblefield et al. (1995a,b) conducted 22-week dosing experiments with MallardDucks that were fed ad libitum a diet containing weathered Exxon Valdez crude oil(WEVC), which was analyzed as having 9.252 mg·g−1 TPAH. Five nominal dosesof WEVC were fed to the Mallards: 0, 200, 2,000, or 20,000 mg WEVC·kg−1 diet.These authors measured a suite of endpoints, including two population-relevantparameters of particular importance here: eggshell thickness and eggshell strength.We used the results from the toxicity experiments on these two endpoints to developgender-specific chronic NOAEL and LOAEL TRVs normalized to body weight (Table3). (Note that none of the other endpoints measured by Stubblefield et al. 1995a,bshowed effects at any dose level.) Because the Stubblefield et al. (1995a,b) toxicityexperiments used weathered Exxon Valdez crude oil, TRVs could only be derived forTPAH, not for the separate PAH ring classes. TRVs were estimated by converting thenominal WEVC doses to TPAH doses in the feed, then converting the daily feedingrate for each experimental class to a per-weight basis. The no-effects and lowest-effects doses for both males and females for both endpoints were the 2,000 and20,000 mg nominal dietary exposures, respectively. Differences between the TRVsfor males and females reflect slight differences in the actual feeding quantities ofthe dosed diet.
Although only the Stubblefield et al . (1995a,b) studies are deemed appropri-ate for developing the TRVs for TPAH exposures to Harlequin Ducks, otherstudies that failed to meet the USEPA criteria nevertheless provide a relativecomparison with our derived TRV values, adding confidence to the appropriate-ness of our values. Because the release of petroleum hydrocarbons into coastal
Hum. Ecol. Risk Assess. Vol. 18, No. 2, 2012 273

M. A. Harwell et al.
marine environments is of global importance (NRC 1985), many laboratoryand field studies have examined behavioral, biochemical, physiological, mor-phological, histopathological, hematological, immunological, mortality, growth,and/or reproductive endpoints of coastal species. Studies appropriate for com-parison with our TRVs include those on Cassin’s Auklets (Ainley et al. 1981),Black Oystercatchers (Andres 1999), Leach’s Storm-Petrels (Butler et al . 1988),Sanderlings (Burger and Tsipoura 1998), Common Murres (Fry and Lowens-tine 1985), Wedge-tailed Shearwaters (Fry et al . 1986), Black-legged Kittiwakes(Koth and Vauk-Hentzelt 1988), and Herring Gulls and Atlantic Puffins (Leighton1993).
Ainley et al . (1981) found that there were no significant differences in the numberof eggs laid between controls and Cassin’s Auklets (Ptychoramphus aleuticus) fed asingle dose of up to 600 mg of Bunker C fuel oil, although there was a significantdifference in the percentage of eggs hatched at 1,000 mg. The results of reproductivesuccess studies with Leach’s Storm-Petrels (Oceandodroma leucorhoa) exposed in thefield to Prudhoe Bay crude oil (PBCO) indicate that hatching success was affectedby a single dose of ≥200 mg (Butler et al . 1988). Breeding Wedge-tailed Shearwaters(Puffinus pacificus) exposed to a single dose of 2,000 mg weathered Santa Barbaracrude oil approximately 30 days prior to egg-laying showed reduced laying, breedingsuccess, and survival of chicks (Fry et al. 1986). Peakall et al . (1982) reported thata single dose (∼1,000 mg) of PBCO administered to nestling Herring Gulls (Larusargentatus) reduced bodyweight.
While these studies clearly indicate that petroleum hydrocarbons at certain levelsare toxic to a variety of avian species inhabiting coastal waters, the studies do notcontain sufficient information to develop a defensible marine avian TRV followingthe USEPA methodology because of extensive extrapolation uncertainties associatedwith source, dose, exposure, and/or species-to-species extrapolations. However, us-ing a series of conservative default assumptions for the missing information fromthese studies, our estimates of potential TRVs from those studies are all greaterthan the NOAEL and LOAEL TRVs that we calculated for the surrogate species(Mallard Duck) using weathered Exxon Valdez oil (USEPA 2005). Thus, we con-clude that the Stubblefield et al. (1995a,b) studies provide conservative estimates forTRVs.
ASSESSMENT APPROACH
The toxicological risk assessment for the Harlequin Duck is based on a conceptualmodel describing the potential pathways of PAH exposures in the PWS environment,including potential exposures from PAHs derived from residual EVO (Figure 1). Indeveloping this conceptual model, we considered these potential exposure pathways:(1) direct encounter with surface oil residues (SOR); (2) direct encounter withsubsurface oil residues (SSOR); (3) consumption of prey tissues containing PAHs;(4) consumption of sediments containing PAHs; and (5) consumption of seawatercontaining PAHs.
274 Hum. Ecol. Risk Assess. Vol. 18, No. 2, 2012

Current Risks to Harlequin Ducks
Figure 1. Harlequin Duck risk assessment framework. Pathways conceptual modelshowing: (a) the sources of PAHs in the PWS environment in refer-ence and initially oiled sites; (b) concentrations of PAHs in sediments,seawater, and prey tissues; (c) risk assessment model inputs, includ-ing characteristics of Harlequin Ducks in PWS and their prey; (d) ele-ments of the risk assessment model; (e) generation of assimilated doses;(f) development of chronic toxicity reference values for HarlequinDucks; and (g) assessment of individual- and population-level effects.
Surface and Subsurface Oil Residues from EVOS
With respect to the source material associated with remnant residues from EVOS,much of the EVO on the shore disappeared rapidly after the spill through naturalweathering processes, particularly from winter storms, enhanced by intensive shore-line cleanup activities in 1989–1991 (Neff et al. 1995). The average annual rate ofoil loss from the shore was ∼80% from 1989 to 1992, decreasing to ∼22% from1992 to 2001 and ∼4% after 2001 (Wolfe et al. 1994; Short et al. 2004, 2007). By
Hum. Ecol. Risk Assess. Vol. 18, No. 2, 2012 275

M. A. Harwell et al.
2001 the extent of ITZ shoreline with SOR or SSOR had decreased by ∼99% fromthe area initially oiled to an estimated 11.3 ha (Short et al. 2004), affecting only≤0.05% of the PWS shoreline length. Further reduction from the 2001 estimateswould be expected by 2012, even at the slower degradation rate estimated by Shortet al. (2007).
Taylor and Reimer (2008) reported that most surveyed sites in PWS in 2002had very little or no SOR. Where SOR did exist, it had weathered to patches ofhard, asphalt “pavement” or highly weathered tar splats, similar to other sites wherecrude oil had been stranded and exposed to sunlight and biodegradation. Totalcoverage of weathered SOR was <0.2% of the total surface area of the surveyedsites. SOR was located primarily in middle and upper intertidal zones (MITZ andUITZ, respectively) and up to supratidal zones on beaches characterized by cobble,boulder, and pebble cover in moderate-to-low-wave-energy locations. Because theseare not the tidal zones in which Harlequin Ducks feed (Robertson and Goudie1999), the asphaltic residues are very unlikely targets in the Harlequin Duck diet,and the SOR is so highly weathered that their PAHs are essentially not bioavailable(Integral 2006; Taylor and Reimer 2008), consumption of SOR is not consideredto be a plausible pathway for current PAH exposures to the Harlequin Ducks andtherefore was not modeled.
The SSOR has also been surveyed repeatedly since 2001, as discussed in Shortet al. (2004, 2006), Michel et al. (2006), Boehm et al . (2008), and Taylor and Reimer(2008). The patches of SSOR occurred primarily in the MITZ and UITZ, with 88.3%of the SSOR found at locations ≥ +0.8 m above mean lower-low water (Short et al.2006). The SSOR was located under a 15–25-cm-thick layer of clean sediments(Hayes and Michel 1999; Hayes et al . 2010), which in turn were located under asurface covering of stable armor composed of coarse gravel, cobble, and boulders(Hayes and Michel 1999; Michel et al. 2006; Taylor and Reimer 2008; Hayes et al .2010). SSOR rarely occurred in unarmored finer-grained sediments. Thus, within afew years after EVOS, most SSOR was found at locations where physical disturbanceof the sediments occurs only rarely (Hayes and Michel 1999; Michel et al. 2006; Shortet al. 2007; Taylor and Reimer 2008). Consequently, the possibility that a HarlequinDuck would directly excavate the SSOR at the depth at which it exists under surface-armored sediments in the MITZ and UITZ is extremely unlikely because: (1) theirdiet is largely epibenthic, collected from the lower intertidal zone (LITZ); and (2)Harlequin Ducks do not have the physical capability to dig in such sediments tothose depths or under such armoring (see Robertson and Goudie 1999; Eadie et al.1995, 2000). Consequently, we consider the pathway in which a Harlequin Duckexcavated sediments and intercepted SSOR as being too implausible to warrantmodeling.
On the other hand, a potential pathway of exposure to these seaducks couldoccur if bioturbation of SSOR occurred by another organism that brought SSOR tothe surface for subsequent contact by seaducks. Two possibilities exist in PWS: fatinnkeeper worms and sea otters. The tube-dwelling fat innkeeper worm (Echiurusechiurus alaskensis) lives in the fine-grained LITZ sediments; therefore, it potentiallycould intersect SSOR when it excavates its burrow. However, the amount of SSORthat could be brought to the surface by fat innkeepers would be very small, as they
276 Hum. Ecol. Risk Assess. Vol. 18, No. 2, 2012

Current Risks to Harlequin Ducks
are microphagous-feeders (Pickford 1964; Ax 2000) (i.e., collecting food particlessuspended in the water or in surface detritus). Unpublished stable-isotope datasuggest they are low-level predators, possibly feeding on harpacticoid copepodsand constituents of surface detritus, but they are not sediment processors, as theirfecal deposits do not contain significant quantities of sediment (RC Highsmith, perscomm). As a result, essentially only the volume of the excavated burrow sediments atSSOR depth would be transported to the surface by the worm. Moreover, almost 90%of SSOR occurs above the LITZ life-zone of the fat innkeepers (Short et al. 2006).Consequently, the pathway by which a fat innkeeper worm would bring SSOR to thesurface and present an exposure risk to Harlequin Ducks is not sufficiently plausibleto warrant modeling.
On the other hand, sea otters regularly excavate sediments to depths of 50 cmwhile foraging in the LITZ and subtidal zone (STZ) (Shimek and Monk 1977; Calkins1978; Hines and Loughlin 1980; Kvitek et al. 1988) and therefore would appear tobe a potential source of bioturbation into SSOR (Harwell et al. 2010a). Thus, apotential route of exposure to Harlequin Ducks theoretically could exist if a seaotter excavated a pit that intersected SSOR and a seaduck immediately thereaftercollected prey from that pit. A field survey by Boehm et al . (2007a) qualitativelyshowed that there is a low probability that sea otters would intercept SSOR becauseof the vertical (tidal) and horizontal spatial separation of the sea otter foragingareas from the SSOR sites. In a detailed quantitative risk assessment, Harwell et al .(2010a) used empirical data from NKI on sea otter foraging habits and the spatialdistribution of SSOR to estimate that the rate at which a sea otter pit could intersectSSOR is 1–5 times per 10,000 hr (i.e., an hourly probability of ∼10−4). That rate isalso the maximal hourly rate that a seaduck could come into contact with SSOR, butthat rate would ensue only if there were a direct association between sea otters andHarlequin Ducks while both are foraging.
Associations between feeding seabirds and feeding marine mammals are knownto exist. Harrison (1979) and Grebmeier and Harrison (1992), for example, docu-mented feeding association between at least 13 species of seabirds (but not includingHarlequin Ducks) and gray whales (Eschrichtius robustus) in the Bering Sea, wherebyinfaunal invertebrates stirred up by feeding whales were made available to feedingflocks of seabirds. Similarly, in Alaska, the order of prey selected (urchin, limpet,chiton, barnacle, mussel) by Glaucous-winged Gulls (Larus glaucescens) depends onenvironmental factors, including competition with sea otters (Trapp 1979; Haywardand Verbeek 2008); these birds have been observed by one co-author (RHD) feedingwith sea otters in both the Aleutians and PWS.
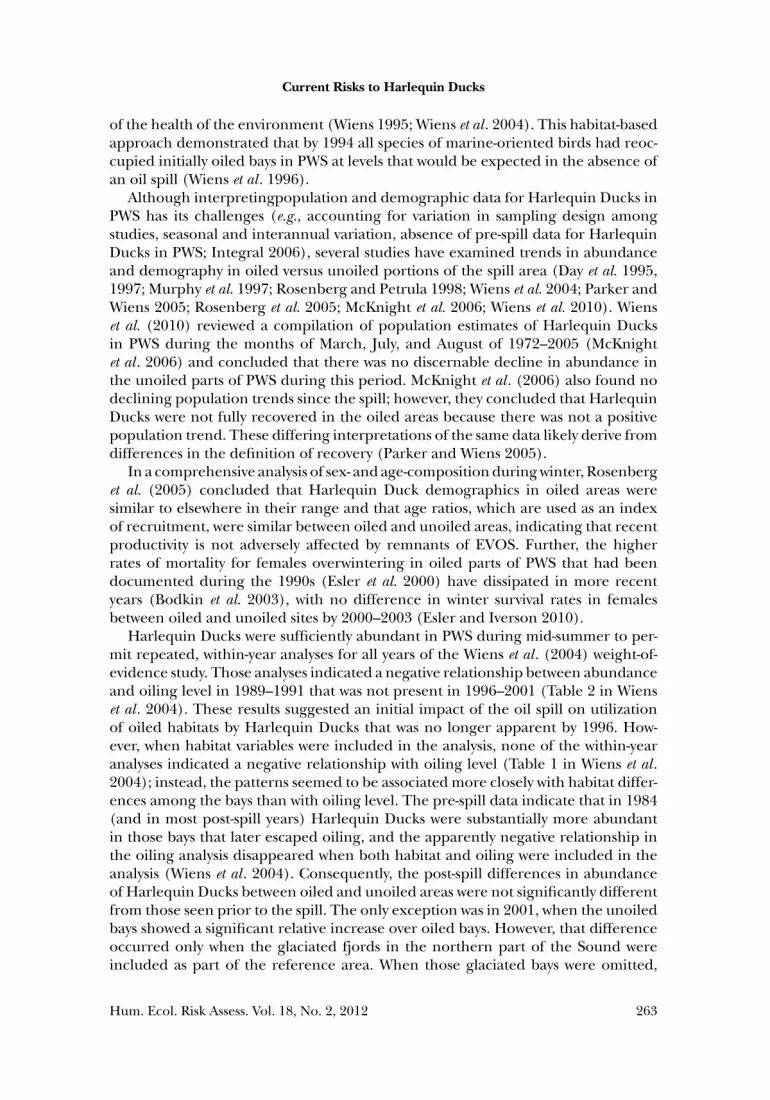
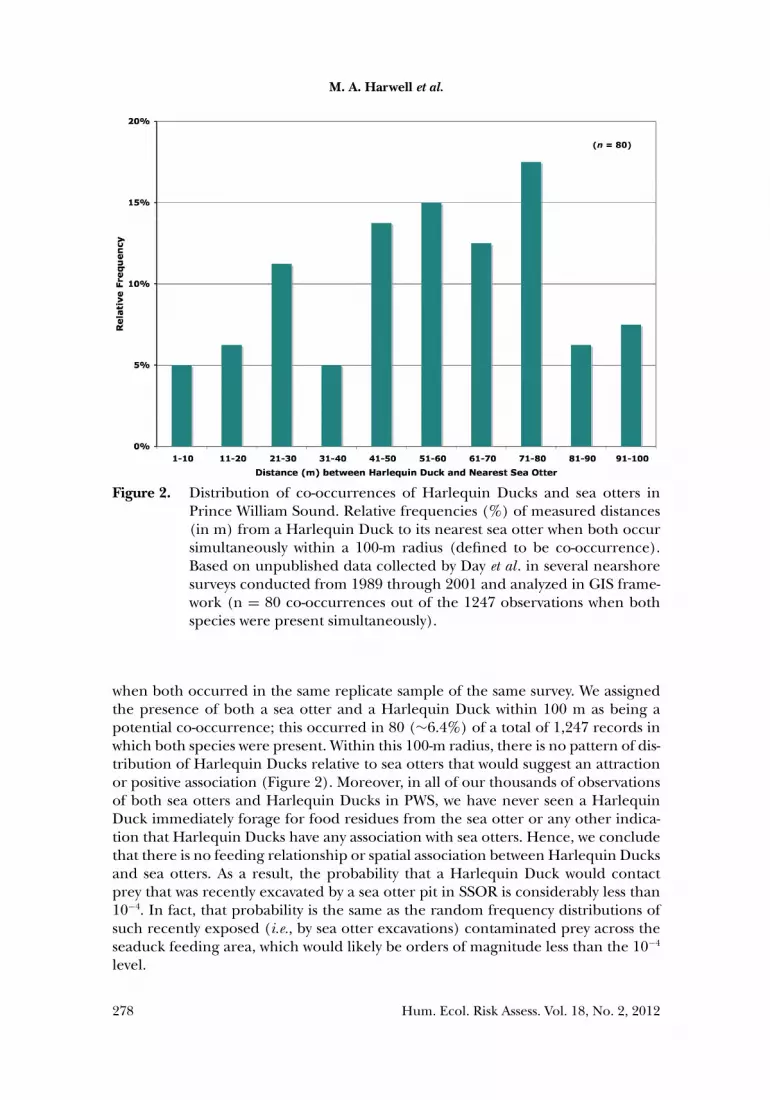
We conducted field studies in PWS that allow us to examine whether such asso-ciations exist between sea otters and Harlequin Ducks. Data were collected duringnearshore wildlife surveys on 14 research cruises conducted in PWS between 1989and 2001, covering all seasons of the year (Day et al. 1995, 1997; Day et al., un-published data). These surveys were conducted by small boat in ten bays (six oiledand four unoiled) and were designed to count and map the locations of all wildlifeoccurring within 200 m seaward of the shorelines, in the ITZ, and in the near-shoresupratidal zone. For this analysis of co-occurrence, we digitized the mapped loca-tions of all Harlequin Ducks and sea otters, then used GIS software to calculatethe nearest distance of a sea otter to each individual or group of Harlequin Ducks
Hum. Ecol. Risk Assess. Vol. 18, No. 2, 2012 277
M. A. Harwell et al.
Figure 2. Distribution of co-occurrences of Harlequin Ducks and sea otters inPrince William Sound. Relative frequencies (%) of measured distances(in m) from a Harlequin Duck to its nearest sea otter when both occursimultaneously within a 100-m radius (defined to be co-occurrence).Based on unpublished data collected by Day et al . in several nearshoresurveys conducted from 1989 through 2001 and analyzed in GIS frame-work (n = 80 co-occurrences out of the 1247 observations when bothspecies were present simultaneously).
when both occurred in the same replicate sample of the same survey. We assignedthe presence of both a sea otter and a Harlequin Duck within 100 m as being apotential co-occurrence; this occurred in 80 (∼6.4%) of a total of 1,247 records inwhich both species were present. Within this 100-m radius, there is no pattern of dis-tribution of Harlequin Ducks relative to sea otters that would suggest an attractionor positive association (Figure 2). Moreover, in all of our thousands of observationsof both sea otters and Harlequin Ducks in PWS, we have never seen a HarlequinDuck immediately forage for food residues from the sea otter or any other indica-tion that Harlequin Ducks have any association with sea otters. Hence, we concludethat there is no feeding relationship or spatial association between Harlequin Ducksand sea otters. As a result, the probability that a Harlequin Duck would contactprey that was recently excavated by a sea otter pit in SSOR is considerably less than10−4. In fact, that probability is the same as the random frequency distributions ofsuch recently exposed (i.e., by sea otter excavations) contaminated prey across theseaduck feeding area, which would likely be orders of magnitude less than the 10−4
level.
278 Hum. Ecol. Risk Assess. Vol. 18, No. 2, 2012

Current Risks to Harlequin Ducks
Even if there were a positive association between the two species, it is extremelyunlikely that a Harlequin Duck would be harmed by direct exposure to SSOR thathad been recently excavated by a sea otter because: (1) the frequency of a sea otterexcavating SSOR is very low (on order of 10−4 h−1); (2) both the sea otter and theHarlequin Duck feed exclusively underwater, either in the subtidal zone or in theintertidal zone when covered by the tide; thus, a recently excavated sea otter pitwould not be visible to the Harlequin Duck above the surface; (3) if a HarlequinDuck foraged in a freshly excavated sea otter pit, the amount of contaminated preycollected would be only a small fraction of the prey collected during its daily feeding(i.e., the average surface area of a sea otter pit is about 0.25 m2 [Harwell et al .2010a], a very small area compared to what the Harlequin Duck would forage overduring a day); and (4) any such assimilated dose would be quite low and from aone-time event, so no chronic exposure could occur. Moreover, for there to be arisk to the Harlequin Duck population, there would have to be many thousands ofsuch encounters over a prolonged period of time. Thus, we conclude that there isno plausible risk to Harlequin Ducks from direct exposure to SSOR. Consequentlythis route is not considered further here.
By contrast, routes of chronic exposure to PAHs in the Sound that occur throughprey, sediments, and drinking water do warrant modeling to evaluate the assimilateddoses that seaducks could receive. Each route is captured in the pathways conceptualmodel (Figure 1) and quantified in a simulation model using empirical data on PAHdistributions in the PWS ecosystem. We next consider the potential sources of thesePAHs.
Sources of PAHs in PWS Prey, Sediments, and Seawater
Hydrocarbons, including PAHs, derived from natural and anthropogenic sourcesare widespread in marine coastal environments (Brassell and Eglinton 1980; Neff2002). Studies conducted in PWS and the Gulf of Alaska (GOA) prior to EVOS indi-cated that petrogenic PAHs existed in subtidal sediments (Kaplan and Venkatesan1981). Page et al . (1995, 1996) conducted a comprehensive analysis of PAHs in PWSsubtidal sediments following EVOS. The natural sources of petrogenic hydrocarbonsin PWS include eroding Tertiary sedimentary rocks (petroliferous shales) and asso-ciated natural oil seeps in the eastern GOA. Current anthropogenic sources includeoil residues from EVOS; oil releases from commercial- and pleasure-vessel opera-tions (e.g., cruise liners, fishing fleet, Alaska Marine Highway ferries, oil tankers)(Page et al . 1995; Bence et al . 1996, 2007); spills of diesel and asphalt refined fromCook Inlet crude and Alaska North Slope Crude (Short et al . 1999, 2004; Page et al .2002); and heavy Monterey fuel oil and asphalt released into the Sound from stor-age tanks during the 1964 Great Alaska Earthquake (Kvenvolden et al . 1993; USGS2004). Hydrocarbons from eroding sedimentary rocks and natural seeps containthe same suite of PAH analytes as EVO, confounding interpretation. Fortunately,the relative amounts of individual PAH analytes from different sources are differentand therefore can be used to characterize the various sources of PAHs (Bence andBurns 1995; Boehm et al . 1997; Burns et al . 1997).
Pyrogenic inputs of PAHs into PWS include combustion products from burningof coal, fuel oil, and wood; emissions from vessel engines; and atmospheric inputs
Hum. Ecol. Risk Assess. Vol. 18, No. 2, 2012 279

M. A. Harwell et al.
from forest fires and global industrial sources (Page et al . 1995, 1999). In addition,historic human-activity sites, including recreation, fish-processing plants, sawmills,and mining activities, have released both petrogenic and pyrogenic hydrocarbonsinto PWS. For example, Boehm et al . (2004) reported TPAH concentrations of2–12,056 µg·kg−1 (ppb) in mussel samples from 14 sites affected by past industrialactivity but not oiled by EVOS, indicating that residual PAH from historical activitiesconstitute a continuing source of bioavailable PAHs in PWS. Moreover, those authorsfound that TPAH values from the sampled human activity sites were at least an orderof magnitude greater than those from any sampled non-human-activity sites, whetheroiled by EVOS or not.
For the purposes of assessing the potential risks from EVO-derived PAHs, we focuson two categories each of prey, sediments, and seawater: (1) those collected on ornear shorelines that were initially oiled by EVOS (labeled here oiled), which may ormay not continue to have SSOR; and (2) those collected on or near shorelines thatdid not receive EVOS oiling (labeled reference). Even though the above discussionindicates that multiple sources of PAHs exist in PWS, we conservatively assume fornow that any differences in the PAH concentrations between these two categories areattributable only to EVOS. By doing so, an upper bound of the current toxicologicalrisks to PWS Harlequin Ducks from EVOS can be quantitatively and conservativelyassessed. However, by quantifying the seaduck exposures to the individual PAH ana-lytes from all pathways, we are able to evaluate the relative frequencies of each PAHwithin the assimilated TPAH doses. We then use the assimilated PAHs as fingerprintsto gain insights into the various sources of PAHs, including EVO, that contribute tothe PAH concentrations in the prey, sediments, and seawater, and, in turn, to thedoses assimilated by the Harlequin Ducks in the model.
Model Parameterization
A quantitative model was developed to assess the toxicological risks using thesimulation language StellaTM (ver. 9.1.2; C© isee systems, inc. [www.iseesystems.com];)to simulate each exposure pathway shown in Figure 1 based on empirical data. Therisk assessment model developed here is an individual-based model (DeAngelis andGross 1992) in which a Harlequin Duck is assigned characteristics reflective of PWSseaducks and each plausible pathway of exposure is simulated using data that reflectthe measured PAH concentrations in the various media in PWS. During each dailytime step, the model randomly samples from lognormal distributions that capturethe variability of conditions in PWS and calculates the assimilated doses for theindividual seaduck from each of the three pathways of exposure to PAHs (prey,sediments, and seawater) (Figure 1). The StellaTM random lognormal function inthe model was chosen because the measured PAH concentrations in prey tissues,sediments, and seawater were bounded by zero, skewed to the right, and shown tobe lognormally distributed (Evans et al . 1993) when plotted as Q-Q plots (Venablesand Ripley 2002), a common situation for environmental data.
Each of 40 PAH analytes was modeled separately, and the daily assimilated dosewas reported for each PAH and for TPAH. By repeating the simulation for millions ofseaduck-days, the full distribution of assimilated doses was projected, capturing therange of variability in daily exposures to the Harlequin Duck population that would
280 Hum. Ecol. Risk Assess. Vol. 18, No. 2, 2012

Current Risks to Harlequin Ducks
be expected in PWS. These daily assimilated doses were converted into average dailydoses that are comparable to relevant chronic toxicity reference values in orderto assess the potential for individual-level health effects. Several model parameterswere also varied in a suite of sensitivity analyses to explore the effects of uncertaintyor alternate model parameters.
The risk assessment model was parameterized based on the following information.
Prey
For the route of exposure via ingestion of prey, the relative frequency of preyspecies in the diet of PWS Harlequin Ducks was taken from the mean percentlength-importance index reported in Patten et al. (2000) (Table 2). The quantity ofprey consumed per day was modeled by: (1) estimating the daily energetics needsof the Harlequin Duck; (2) apportioning that quantity to the prey categories basedon their relative frequencies in the diet; and (3) calculating the mass of each preycategory needed to contribute the assigned energy required, based on the energydensity of each prey species. Once the mass of prey tissues is calculated, the modelassigns a value during each time step for the PAH analytes in each prey-tissue categoryby randomly sampling from a lognormal distribution of TPAH values parameterizedusing the mean, standard deviation, and PAH distributions from the empirical datafor prey tissues collected in PWS at oiled and reference sites (discussed below).
Thus, modeling this pathway required the parameterization of: (1) the body massof the various categories of ducks (Table 1); (2) the a and b fitted-parameters for theFMR (Equation 1) from Nagy et al. (1999) for the marine birds category (specificallya = 14.25, and b = 0.659); (3) the energy density of the prey tissues; and (4) themeasured concentrations of each PAH analyte in each prey category.
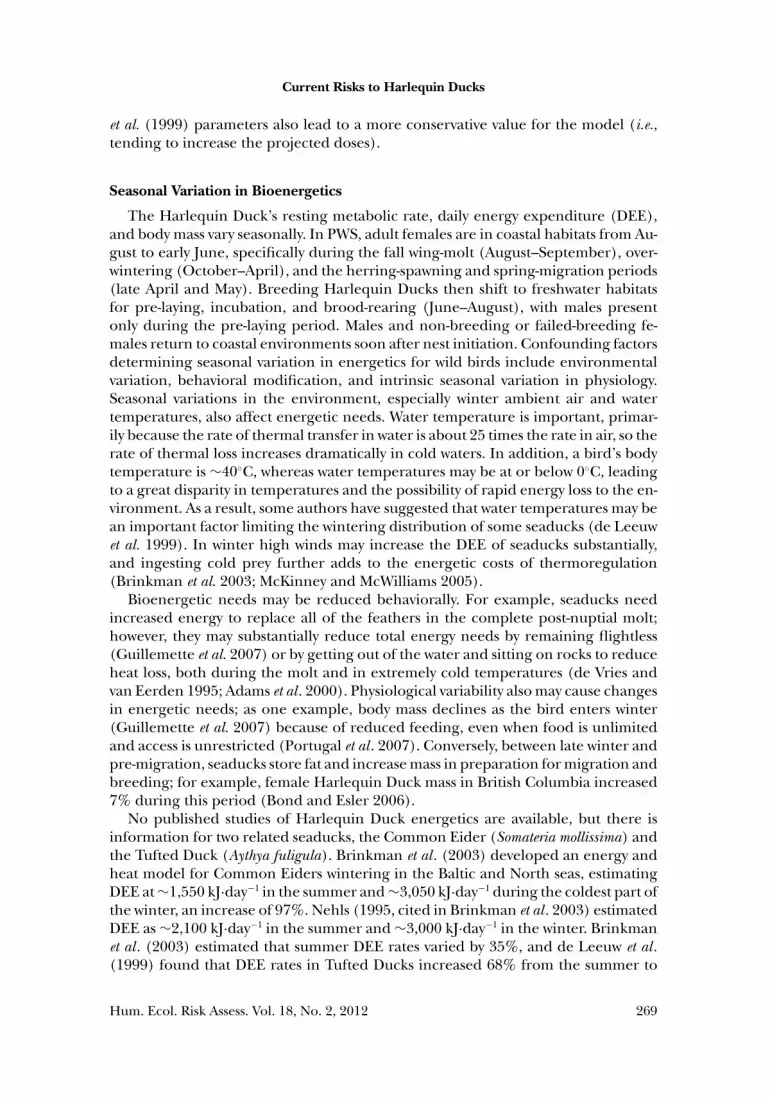
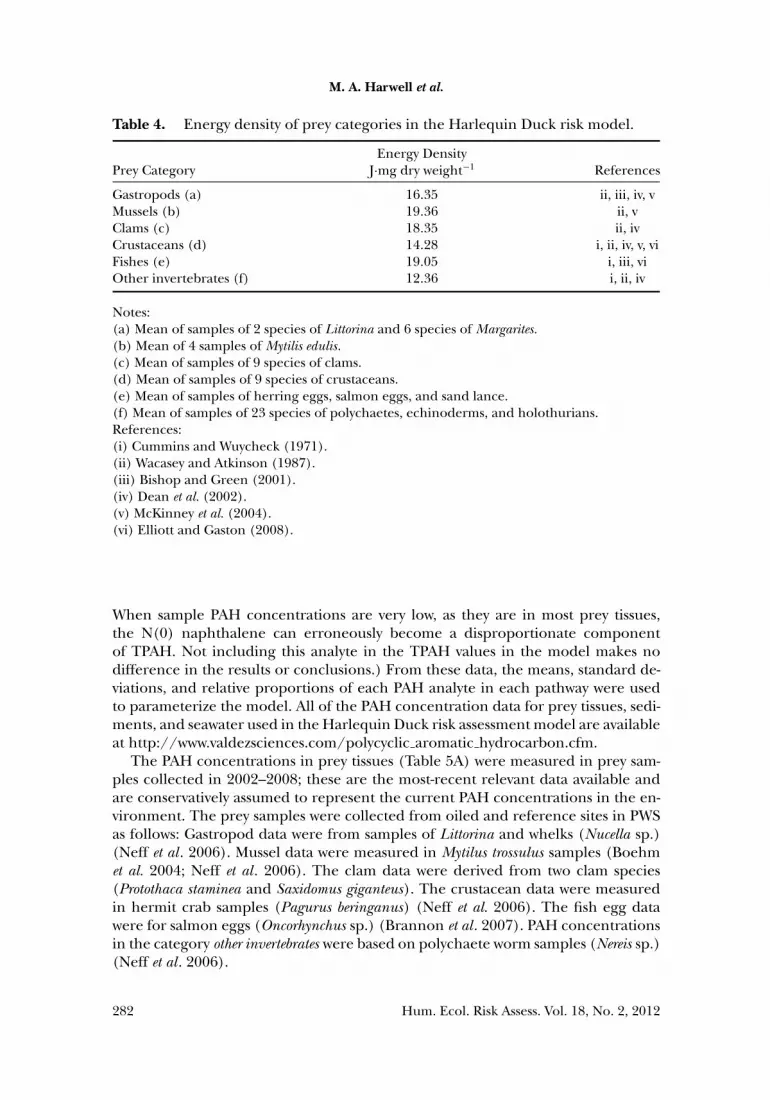
The energy density (in J·mg dry weight−1) of each prey category was estimatedfrom published data (Cummins and Wuycheck 1971; Wacasey and Atkinson 1987;Bishop and Green 2001; Dean et al . 2002; McKinney et al . 2004; Elliott and Gaston2008; Cummins pers. comm.) for species identical or similar to those recorded in theHarlequin Duck diet (Patten et al. 2000) and aggregated into the six prey categoriesparameterized in the model (Table 4).
All analyses of the concentrations of each of 40 PAHs in prey tissues (as wellas sediments and seawater, discussed below) were conducted at Battelle OceanScience, Duxbury, MA, using methods described elsewhere (Page et al . 1995; Dou-glas et al . 2004; Neff et al . 2006; Boehm et al . 2007b). The samples were solvent-extracted, cleaned up by column chromatography (sediment and tissues only), andanalyzed by gas chromatography/mass spectrometry (GC/MS) following USEPASW-846 Method 8270 (USEPA 2001), modified to include the alkylated PAHs andwith selected ion monitoring (SIM) to achieve lower detection limits (followinge-CFR 2009). Corrections for surrogate recoveries were applied to all analytes.Method Detection Limits (MDL) were calculated following USEPA (2001). If asample was recorded as non-detected, the PAH concentration was assigned thevalue of 1
2MDL, the best estimate to use following USEPA (1991). The reported
TPAH is the sum of the 40 analytes. (Note, we did not include the parent com-pound non-alkylated or N(0) naphthalene in the TPAH because this analyte is avery common low-level laboratory contaminant, found in many cleaning agents.
Hum. Ecol. Risk Assess. Vol. 18, No. 2, 2012 281
M. A. Harwell et al.
Table 4. Energy density of prey categories in the Harlequin Duck risk model.
Energy DensityPrey Category J·mg dry weight−1 References
Gastropods (a) 16.35 ii, iii, iv, vMussels (b) 19.36 ii, vClams (c) 18.35 ii, ivCrustaceans (d) 14.28 i, ii, iv, v, viFishes (e) 19.05 i, iii, viOther invertebrates (f) 12.36 i, ii, iv
Notes:(a) Mean of samples of 2 species of Littorina and 6 species of Margarites.(b) Mean of 4 samples of Mytilis edulis.(c) Mean of samples of 9 species of clams.(d) Mean of samples of 9 species of crustaceans.(e) Mean of samples of herring eggs, salmon eggs, and sand lance.(f) Mean of samples of 23 species of polychaetes, echinoderms, and holothurians.References:(i) Cummins and Wuycheck (1971).(ii) Wacasey and Atkinson (1987).(iii) Bishop and Green (2001).(iv) Dean et al. (2002).(v) McKinney et al. (2004).(vi) Elliott and Gaston (2008).
When sample PAH concentrations are very low, as they are in most prey tissues,the N(0) naphthalene can erroneously become a disproportionate componentof TPAH. Not including this analyte in the TPAH values in the model makes nodifference in the results or conclusions.) From these data, the means, standard de-viations, and relative proportions of each PAH analyte in each pathway were usedto parameterize the model. All of the PAH concentration data for prey tissues, sedi-ments, and seawater used in the Harlequin Duck risk assessment model are availableat http://www.valdezsciences.com/polycyclic aromatic hydrocarbon.cfm.
The PAH concentrations in prey tissues (Table 5A) were measured in prey sam-ples collected in 2002–2008; these are the most-recent relevant data available andare conservatively assumed to represent the current PAH concentrations in the en-vironment. The prey samples were collected from oiled and reference sites in PWSas follows: Gastropod data were from samples of Littorina and whelks (Nucella sp.)(Neff et al . 2006). Mussel data were measured in Mytilus trossulus samples (Boehmet al. 2004; Neff et al . 2006). The clam data were derived from two clam species(Protothaca staminea and Saxidomus giganteus). The crustacean data were measuredin hermit crab samples (Pagurus beringanus) (Neff et al. 2006). The fish egg datawere for salmon eggs (Oncorhynchus sp.) (Brannon et al . 2007). PAH concentrationsin the category other invertebrates were based on polychaete worm samples (Nereis sp.)(Neff et al . 2006).
282 Hum. Ecol. Risk Assess. Vol. 18, No. 2, 2012

Current Risks to Harlequin Ducks
Table 5. Prey, sediments, and seawater tpah data for the Harlequin Duck riskmodel.a,b
A) PREY TISSUES (ng·g−1 dry weight)
Oiled-Site Prey TPAH Reference-Site Prey TPAH
Prey Standard Sample Standard SampleCategory Mean Deviation Size Mean Deviation Size
Gastropods 23.04 8.09 26 20.76 8.42 7Mussels 45.87 28.99 96 33.11 17.99 27Clams 72.08 68.88 54 42.69 22.14 12Crustaceans 25.54 4.80 15 31.07 7.85 4Fish eggs 53.07 3.09 12 54.15 3.87 23Other inverts 107.65 102.43 26 47.82 24.25 6
B) SEDIMENTS (ng·g−1)
Oiled-Site Sediments TPAH Reference-Site Sediments TPAH
Standard Sample Standard SampleMean Deviation Size Mean Deviation Size
63.21 132.37 51 28.27 33.27 27
C) SEAWATER (ng·L−1)c
Oiled-Site Seawater TPAH Reference Seawater TPAH
Standard Sample Standard SampleMean Deviation Size Mean Deviation Size
8.48 3.57 23 7.62 1.54 12
aSee text for data sources; all data available at http://www.valdezsciences.com/polycyclic aromatic hydrocarbon.cfmbAll PAH data in the base risk assessment model substitute 1
2 MDL for each non-detectanalysis; some sensitivity analyses were conducted using other substitutions for non-detects;see text for details.cOiled seawater samples were collected off initially oiled shorelines that were found to haveSSOR. Reference seawater samples were collected off initially oiled shorelines that did nothave SSOR, as no seawater samples exist for never-oiled shorelines.
Sediments
The model estimates the PAH doses from the sediment pathway, in which theseaduck consumes sediments at an assigned fraction (5.2% by weight) of the totalfood ingested. This value was based on the Beyer et al . (2008) measurements of themean percent sediment in the diet of Common Goldeneyes. A sensitivity analysisdoubled this fraction to 10.4%. The PAH concentrations in sediments were basedon grid samples collected in the ITZ from oiled and reference sites in PWS (Table5B). The sediment sampling procedure (described in Page et al. 2005) for both theoiled and reference sediments was to dig a 50-cm-deep pit (or to bedrock if less than50 cm), collect the fine-grained fraction of sediments from the full height of the sidesof the pit walls, and homogenize these sediments to create a mixture representative
Hum. Ecol. Risk Assess. Vol. 18, No. 2, 2012 283

M. A. Harwell et al.
of the 50-cm column. Because these are the only appropriate sediment data available,they are used to represent the surface sediments even though most of each samplecomes from much greater sediment depths than a Harlequin Duck could contact(and, thus, this sampling procedure provides an overestimate of the concentrationsof oil residues that seaducks could encounter). Approximately 300 g (wet weight) ofsediment was collected from each pit. The homogenized sediments were aliquoted,and ∼35–50 g of each was extracted and analyzed by GC/MS for PAHs following thelaboratory procedures described by Neff et al. (2006).
The oiled sediment samples were taken in 2007 from shoreline segments onKnight, Smith, and Eleanor Islands that had been oiled by EVOS and surveyed forthe presence or absence of SSOR. In the surveys, the amount of SSOR oiling presentwas assigned based on a qualitative visual assessment (e.g., the category dark colors film[HAZMAT 1996] was considered heavy oil residue [HOR]). If no visible oil was seen(i.e., no sheens, pore fillings, or films on sediment particles), then the sampled pit wasassigned the NONE category. From the survey data, we selected the NONE categoryof sediments to represent the oiled site-sediments because the Harlequin Duck riskpathways do not involve direct contact with SSOR; thus, the other categories ofSSOR would not be appropriate. These samples are conservative because the PAHconcentrations in sediments from shorelines that had SSOR are likely to be higherthan those from shorelines in which no SSOR was found. Additionally, the PAHconcentrations in the 50-cm sediment column are likely to be higher than the PAHconcentrations at the surface where seaducks forage because of the natural loss of oilfrom near-surface sediments (Hayes and Michel 1999). Reference sediment sampleswere collected in the same manner in 2002 and 2004 from shorelines on Green,Knight, Little Green, and Storey Islands that were never oiled by EVOS.
Seawater
The model also estimates assimilated PAH and TPAH doses contributed fromseawater (Table 5C) ingested by the Harlequin Duck at the rate of 117 mg·kg bodyweight−1·day−1. This is a conservative estimate based on the freshwater drinking ratefor Mallards measured by Fletcher and Holmes (1968) and is consistent with analysesby CSL (2007).
Seawater samples were collected in 2005 in the NKI area of PWS as 2.8-L samplestaken at 1-m depth from nearshore sites (10–50 m offshore) midway through a fallingtide when water was flowing off the shore (Boehm et al. 2007b). The 1-m depth isappropriate for the potential drinking water as Harlequin Ducks typically dive intothe water column when feeding and it is likely that consumption of seawater occursduring feeding. Collecting the water at this depth avoids potential contaminationfrom a surface film or bottom sediments, which are not the likely locations at whichseaducks drink seawater. The shorelines at all of the sampling sites had been initiallyoiled by EVOS, as these were the only appropriate data available (i.e., no data wereavailable from unoiled shorelines). The oiled seawater samples were taken fromsites near shorelines that contained SSOR as found in the NOAA 2001 or 2003surveys (EVOSTC 2008). The reference seawater samples were taken from sites nearshorelines that did not contain SSOR as indicated in the joint Exxon–ADEC surveysin 1990 and 1991 (ADNR 1996a,b; Table 5C).
284 Hum. Ecol. Risk Assess. Vol. 18, No. 2, 2012

Current Risks to Harlequin Ducks
Calculating the Assimilated Dose in the Risk Assessment Model
During each daily time step in the model, an individual Harlequin Duck con-sumes a specified mass of prey tissues, sediments, and seawater, each containingTPAH at model-selected concentrations based on lognormal distributions derivedfrom the empirical data from PWS. This stochasticity allows the simulated popu-lation of Harlequin Ducks to be exposed to the TPAHs analogously to how thechemicals are actually heterogeneously distributed in the environment of PWS. Thespecific mass of each PAH is also calculated by applying the relative frequency ofthe TPAH contributed by each of 40 PAH analytes, again based on the empiri-cal data for prey tissues, sediment, and seawater from PWS. All ingested PAHs areassumed to be completely bioavailable (i.e., 100% assimilation efficiency), a conser-vative assumption for sediment-bound PAHs because of solubility and sediment-partitioning constraints (Di Toro and McGrath 2000). Using this information,the model calculates the assimilated dose during each time step for each PAHingested by the seaduck from the prey-, sediment-, and seawater-based routes ofexposure.
We followed this approach to simulate separately a total of 500,000 individualsfor each of eight classes of Harlequin Ducks (both summer and winter seasons foradult female, adult male, juvenile female, and juvenile male categories), generatingan initial distribution of daily assimilated doses (in mg·kg body weight−1·day−1) foreach PAH analyte and for TPAH. From this model output initial distribution, 30 dayswere randomly sampled with replacement to generate a secondary distribution ofaverage daily assimilated dose for a month in the life of a Harlequin Duck in PWS.This sampling process was repeated 5 times in sets of 100,000 samples each, therebyrepresenting a total population of 500,000 seaducks of each class living under PWS-specific conditions. The purpose of this simulation and post-processing approachis to convert the initial model-generated daily assimilated doses into a month-longperiod of average daily assimilated doses. The latter is required in order to comparethe modeled doses with the chronic TRVs to assess effects. A hazard quotient is theratio of an assimilated dose to the TRV, where HQ ≥ 1 indicates the exposure couldlead to chronic effects and HQ < 1 indicates no ecologically relevant adverse chroniceffect would occur.
Using this individual-based modeling approach (DeAngelis and Gross 1992) togenerate a large population of Harlequin Ducks allows the identification of themaximum-exposed individuals for a conservative assessment of risks, capturing thevariability that exists in the PWS environment. The model outputs also allow theassimilated dose to be partitioned into the relative contributions by each of thethree exposure pathways and the relative frequency distribution of the PAH analytesassimilated into the Harlequin Ducks. This partitioning provides the quantitativebasis to assess the relative importance of each route of exposure.
Each model (i.e., the eight base models and the eight models for each of theeight sensitivity analyses discussed below) was subject to extensive quality assurance(QA) to examine model structure, equations, parameters, data sources, documen-tation, and each simulation output, following a USEPA-approved QA plan devel-oped by the authors for a previous model. All models, parameters, QA runs, andsimulation outputs have been archived for further analysis and reproducibility. Al-together, 72 scenarios were simulated for each of the oiled and reference situations,
Hum. Ecol. Risk Assess. Vol. 18, No. 2, 2012 285

M. A. Harwell et al.
representing a total modeled population of more than 7 × 10⁶ Harlequin Ducksliving under PWS conditions or under variations of the environment to test modelsensitivities.
Sensitivity Analyses
The base models, as described earlier, constitute the conservative, quantitativeassessment tool that uses the best-available information on Harlequin Duck charac-teristics and behavior, the measured concentrations of PAHs as distributed in mediawithin PWS, and the plausible routes of PAH exposures to the seaducks. In order toexplore how changes in model parameters would affect the outputs, we conducteda series of sensitivity analyses. In each case, only a single parameter was changed toallow direct comparison with the base model. The following sensitivity analyses wereconducted:
1. No MDL. Rather than substitute the value of 12
MDL for non-detects in the analysisof each prey tissue sample, the value of zero was used. This sensitivity analysisallows examination of the effect of differential detection limits across variousPAHs on the model-projected distribution of PAHs in the assimilated doses, andillustrates the measured prey-tissue PAH concentrations vis a vis backgroundconcentrations.
2. Full MDL. In this sensitivity analysis, the value of the non-detects was set at theMDL value, providing the upper bound of PAH concentrations in the variousmedia.
3. Upper 10%. The daily assimilated dose outputs from the base model were rank-ordered and the highest 10% (based on TPAH concentrations) became thedistribution from which the average daily assimilated doses were derived. Thisapproach simulates the doses that would be received by individuals who remainedat a location that happened to have elevated PAHs compared to other sites,providing a conservative upper-bound estimate of assimilated doses based onlarger-scale spatial heterogeneity.
4. +KN136 . To the base-model PAH data set for prey tissues, we added PAH sam-ples collected at the KN136 site, a small (∼0.1 ha), highly non-representativeshoreline for PWS (NOAA 2007) of semi-enclosed intertidal peat bog containingresidual EVO. Although this area is poor habitat for Harlequin Ducks, and thusis not included in the base model data, this sensitivity analysis was conducted toassess the potential effects on Harlequin Ducks who hypothetically foraged at thissite. When the KN136 samples were included in the input data, the oiled prey-tissue PAH concentrations increased 3.1 times for mussels (mean = 142.48 ppb;standard deviation = 507.20), 1.2 times for clams (mean = 90.94 ppb; standarddeviation = 138.50), and 2 times for other invertebrates (mean = 214.89 ppb;standard deviation = 566.65); all other prey concentrations remained the sameas reported in Table 5.
5. Doubled FMR. The FMR was doubled to simulate the range of energetics needsas discussed previously with respect to environmental, molting stress, or otherfactors.
286 Hum. Ecol. Risk Assess. Vol. 18, No. 2, 2012

Current Risks to Harlequin Ducks
6. Doubled sediments. To examine the effect of uncertainty in the amount of sedimentsconsumed by the seaduck, the proportion of sediments in the diet was doubled(to 10.4% by weight).
7. Mussels only. To assess the effect of uncertainty in the distribution of prey speciesin the diet, the prey category Mussels was assigned to be 100% of the diet. Thissensitivity analysis is comparable to the assessment presented in Boehm et al .(2004) and is consistent with the concerns of Patten et al. (2000) about PAHsin mussels. It captures the assimilated doses that could result from a HarlequinDuck feeding exclusively in mussel beds, a habitat that typically had higher PAHconcentrations than other seaduck habitats after the oil spill.
8. HQ = 1 Sensitivity analyses. A final set of sensitivity analyses was conducted onthe adult female/winter model to explore the range of TPAH concentrationsin the PWS environment that would be necessary in order to reach an HQ = 1for each threshold (i.e., NOAEL and LOAEL). In each sensitivity simulation, amultiplicative factor was applied to the extant PWS environmental TPAH valuesto generate hypothetical environmental TPAH concentrations for each route ofexposure. One series of multiplicative factors was selected to bracket the NOAELHQ = 1 threshold and another series to bracket the LOAEL HQ = 1 threshold.Because the model-projected doses are essentially linear with the PAH concen-trations of the input sources, we used the results of the base-model simulations toestimate the range of multiplicative factors to apply to the extant PWS environ-mental TPAH values for the sensitivity analyses. A single multiplicative factor wasselected for each sensitivity analysis and applied as follows: For each time step andfor each exposure source (i.e., sediments, seawater, and each prey category), thebase-model-assigned TPAH value was multiplied by the specified factor to createthe sensitivity-analysis-assigned TPAH value. The resulting model-generated as-similated dose was converted to individual-level effects for varying fractions of theindividuals within the simulated population (ranging from the 99.9% quantile[maximum-exposed individual] down to the 50% quantile [median individual]).The latter allows conversion of the model-generated individual-level effects toexpected population-level effects.
RESULTS AND RISK CHARACTERIZATION
Results of Quantitative Modeling
The results of the individual-based modeling and the post-processing to derive apopulation of chronic doses of PAHs for each class of Harlequin Ducks are shown inTable 6. We report the average daily assimilated dose of TPAH (in mg·kg−1·day−1),showing the mean, median, and 99.9% quantile highest exposures, the latter rep-resenting the maximum-exposed individuals (i.e., the 1-in-1,000th highest exposedindividuals in the population of 500,000 Harlequin Ducks that was simulated). Byfocusing on the maximum-exposed individuals, we present a very conservative assess-ment of potential risks to the Harlequin Duck population of PWS. By reporting thepaired results for oiled and reference conditions and conservatively assuming that alldifferences between the two are attributable solely to EVO-derived PAHs, we obtain
Hum. Ecol. Risk Assess. Vol. 18, No. 2, 2012 287

Tab
le6.
Har
lequ
inD
uck
mod
elre
sult
s(b
ase
mod
el)
aver
age
daily
dose
TPA
H(m
g·kg−1
·day−1
)to
sim
ulat
edpo
pula
tion
of50
0,00
0H
arle
quin
Duc
ks.
Oile
dR
efer
ence
99.9
%99
.9%
Mea
nM
edia
nQ
uant
ileM
ean
Med
ian
Qua
ntile
A.)
Adu
ltFe
mal
eSu
mm
erM
ean
0.00
370
0.00
368
0.00
493
Mea
n0.
0029
40.
0029
40.
0035
7C
V(%
)(a
)0.
02%
0.02
%0.
70%
CV
(%)
0.01
%0.
02%
0.17
%W
inte
rM
ean
0.00
379
0.00
376
0.00
505
Mea
n0.
0030
10.
0030
10.
0036
6C
V(%
)0.
02%
0.02
%0.
69%
CV
(%)
0.02
%0.
02%
0.18
%B
.)A
dult
Mal
eSu
mm
erM
ean
0.00
356
0.00
354
0.00
475
Mea
n0.
0028
40.
0028
30.
0034
4C
V(%
)0.
02%
0.02
%0.
61%
CV
(%)
0.02
%0.
02%
0.17
%W
inte
rM
ean
0.00
363
0.00
360
0.00
483
Mea
n0.
0028
90.
0028
80.
0035
0C
V(%
)0.
01%
0.02
%0.
53%
CV
(%)
0.03
%0.
03%
0.19
%C
.Juv
enile
Fem
ale
Sum
mer
Mea
n0.
0041
40.
0041
20.
0055
2M
ean
0.00
330
0.00
329
0.00
400
CV
(%)
0.01
%0.
02%
0.53
%C
V(%
)0.
01%
0.02
%0.
17%
Win
ter
Mea
n0.
0038
80.
0038
60.
0051
7M
ean
0.00
309
0.00
308
0.00
375
CV
(%)
0.01
%0.
02%
0.53
%C
V(%
)0.
03%
0.03
%0.
19%
D.J
uven
ileM
ale
Sum
mer
Mea
n0.
0039
90.
0039
70.
0053
2M
ean
0.00
318
0.00
317
0.00
385
CV
(%)
0.01
%0.
02%
0.53
%C
V(%
)0.
03%
0.03
%0.
19%
Win
ter
Mea
n0.
0037
10.
0036
90.
0049
4M
ean
0.00
295
0.00
294
0.00
358
CV
(%)
0.01
%0.
02%
0.53
%C
V(%
)0.
03%
0.03
%0.
19%
(a)
CV
=co
effi
cien
tofv
aria
bilit
y
288

Current Risks to Harlequin Ducks
an upper-bound of plausible continuing risks attributable to EVOS. The actual risksare likely to be smaller.
In Table 6 (and the other model-output tables) is reported the coefficient ofvariation (CV) across the five sets of secondary distributions that were created. TheseCVs are very low in all scenarios, demonstrating that there is a sufficient numberof simulations to represent accurately the variability of PAHs in the environmentas captured in the assimilated doses. The distributions across individuals in thepopulation are relatively narrow: the mean and median values are almost identicalwithin each scenario, and the 99.9% quantile value is only modestly higher thanthe associated mean values (∼33% for oiled and ∼21% for reference). In all cases,the oiled mean and median values are ∼25% higher than the associated referencevalues, and the 99.9% quantile values are ∼38% higher for the oiled than the pairedreference (Table 6).
We show in Table 7 the HQs for each of the NOAEL and LOAEL TRVs for boththe modeled oiled and reference conditions for the maximum-exposed HarlequinDuck. The actual threshold of effects is expected to be between the two values, withan HQ based on the NOAEL value being more conservative. The table also showsthe multiplicative factor less than the effects threshold for each HQ value (i.e., 1 ÷HQ).
These quantitative projections from the base model constitute our conservativebest estimate of chronic doses and effects that could occur to the maximum-exposedHarlequin Ducks in PWS. These results (Table 7) demonstrate that the NOAEL andLOAEL hazard quotients for the 1-in-1,000th highest-exposed individuals at oiledsites are about 2.5 × 10⁻³ and 2.5 × 10⁻⁴, respectively, which is approximately375–4,500 times lower than the no-effects thresholds. Similarly, the NOAEL andLOAEL HQs for the reference sites are about 1.8 × 10⁻³ and 1.8 × 10⁻⁴, respectively,or approximately 520–6,200 times lower than the no-effects thresholds. Juvenileseaducks have slightly higher exposures than the adults, but there is little variabilityacross age/gender classes or between seasons. Because these HQs are so low andrepresent the 99.9% quantile highest exposures, it is extremely unlikely that anyof the projected exposures represent a health risk to any Harlequin Duck. Thedifferences between reference and oiled doses and effects are modest: in all casesthe reference effects are about 72% of the oiled effects (compare the paired Oiledand Reference data in Table 7).
The extremely low probability of individual effects is further demonstrated byexamination of the cumulative frequency distribution of the average daily assimi-lated doses for the adult female in winter across all 500,000 simulations each forthe oiled and reference conditions (Figure 3; similar results occurred for all of theother modeled classes). The full range of the simulations covers only a factor of2.3 for oiled sites (0.00276–0.00654) and a factor of 1.8 for reference conditions(0.00226–0.00397). This is in marked contrast to the separation of the assimilateddoses from the NOAEL and LOAEL TRVs (more than 2–3 orders of magnitude,respectively). Because the maximal single seaduck (i.e., the highest one out of all500,000 individuals simulated for the adult females in winter) had an assimilatedaverage daily dose of 0.00654 mg·kg·day−1, its NHQ and LHQ were 3.06 × 10⁻³ and2.97 × 10−4, respectively, or 327 and 3,367 times lower than the HQ = 1 thresholds.This represents the extreme upper end of the population of 500,000 seaducks.
Hum. Ecol. Risk Assess. Vol. 18, No. 2, 2012 289

M. A. Harwell et al.
The simulation results for the assimilated average daily doses projected underthe various sensitivity analyses are presented in Tables 8A–H. Shown in Tables 9 and10 are the NOAEL and LOAEL HQs for the oiled and reference sensitivity analyses,respectively.
Allocation of Risks across Pathways
Within each simulation, the model accumulates the PAHs assimilated from eachof the three pathways: prey, sediments, and drinking water. By summing across allsimulations for a given pathway within a scenario, the relative contributions of thepathways can be determined (Table 11). These results demonstrate that consump-tion of prey constitutes the dominant pathway (∼90%), most of the remainder of
Table 7. Hazard quotients for maximum-exposed Harlequin Ducks.a,b
Factor Below Threshold
NOAEL HQ LOAEL HQ NOAEL LOAEL
Base Model OiledAdult Female
Summer 0.00231 0.00022 434 4461Winter 0.00236 0.00023 424 4358
Adult MaleSummer 0.00237 0.00024 422 4120Winter 0.00241 0.00025 415 4049
Juvenile FemaleSummer 0.00258 0.00025 388 3989Winter 0.00242 0.00023 414 4256
Juvenile MaleSummer 0.00266 0.00027 376 3676Winter 0.00247 0.00025 405 3959
Base Model ReferenceAdult Female
Summer 0.00167 0.00016 599 6162Winter 0.00171 0.00017 585 6020
Adult MaleSummer 0.00172 0.00018 583 5691Winter 0.00175 0.00018 572 5589
Juvenile FemaleSummer 0.00187 0.00018 535 5503Winter 0.00175 0.00017 571 5875
Juvenile MaleSummer 0.00192 0.00020 520 5074Winter 0.00179 0.00018 560 5465
aHazard Quotient is the ratio of an assimilated dose to the TRV, where HQ ≥ 1 indicates theexposure could lead to chronic effects and HQ < 1 indicates no ecologically relevantadverse chronic effect would occur.bMaximum-Exposed Harlequin Duck receives the 99.9% quantile (1-in-1000th) highestexposures out of the simulated population of 500,000 seaducks.
290 Hum. Ecol. Risk Assess. Vol. 18, No. 2, 2012

Current Risks to Harlequin Ducks
Figure 3. Cumulative frequency distribution of average daily assimilated doses (inmg·kg−1·day−1) for Harlequin Ducks under oiled and reference condi-tions. Base model results for adult female Harlequin Duck in winter(n = 500,000) (note: very similar results occurred for all other classesof seaducks). Also shown are the NOAEL and LOAEL toxicity refer-ence values, and the 99.9% quantile of assimilated doses (maximum-exposed individuals). Note that all model input PAH concentration datafor PWS prey tissues, sediments, and seawater are available online athttp://www.valdezsciences.com/polycyclic aromatic hydrocarbon.cfm.
the doses derives from sediments (∼10%), and seawater provides only a trivial doseof PAHs (≤0.03%). The values reported here are for adult female Harlequin Ducks;however, results did not differ by age/gender class within a scenario, indicating thatthe pathway apportionment is independent of the age/gender characteristics of theseaducks. This result is further demonstrated by the close similarity shown betweenthe proportions for the base model and the model with doubled FMR (Table 11),representing a sensitivity analysis on a Harlequin Duck characteristic. In contrast,differences appear in the proportions when different source PAH concentrationsare used, as in the No MDL, Full MDL, and +KN136 sensitivity analyses.
Distribution of PAHs in Assimilated Doses
The relative frequency of the individual PAH analytes is calculated by summingthe assimilated dose of each analyte across all 500,000 simulations within a scenario.In essence, the Harlequin Ducks act as integrators of the PAHs from the various
Hum. Ecol. Risk Assess. Vol. 18, No. 2, 2012 291

M. A. Harwell et al.
Table 8A Harlequin Duck model results: No MDL sensitivity analysis. Averagedaily dose TPAH (mg·kg−1·day−1).
Oiled Reference
99.9% 99.9%Mean Median Quantile Mean Median Quantile
A.) Adult FemaleSummer
Mean 0.00149 0.00146 0.00269 0.00076 0.00075 0.00124CV (%) 0.04% 0.06% 1.15% 0.05% 0.06% 0.69%
WinterMean 0.00153 0.00150 0.00276 0.00078 0.00076 0.00128CV (%) 0.05% 0.06% 1.26% 0.04% 0.04% 0.67%
B.) Adult MaleSummer
Mean 0.00144 0.00141 0.00258 0.00073 0.00072 0.00120CV (%) 0.03% 0.05% 1.03% 0.05% 0.06% 0.69%
WinterMean 0.00146 0.00143 0.00263 0.00074 0.00073 0.00122CV (%) 0.03% 0.05% 1.03% 0.05% 0.06% 0.69%
C. Juvenile FemaleSummer
Mean 0.00167 0.00164 0.00300 0.00079 0.00078 0.00131CV (%) 0.03% 0.04% 1.03% 0.05% 0.06% 0.56%
WinterMean 0.00156 0.00153 0.00282 0.00079 0.00078 0.00131CV (%) 0.03% 0.05% 1.03% 0.05% 0.06% 0.69%
D. Juvenile MaleSummer
Mean 0.00161 0.00158 0.00290 0.00082 0.00081 0.00134CV (%) 0.03% 0.05% 1.03% 0.05% 0.06% 0.69%
WinterMean 0.00149 0.00147 0.00269 0.00076 0.00075 0.00125CV (%) 0.03% 0.05% 1.03% 0.05% 0.06% 0.69%
sources in PWS, so that the modeled distributions of assimilated PAHs providediagnostic information on the sources of PAHs that are ingested by the seaducks.Illustrated in Figures 4–6 are the PAH distributions under oiled and referenceconditions for the assimilated doses in adult females, winter scenario, in the basemodel and in the No MDL sensitivity analysis (the other age/gender classes have verysimilar distributions). Those PAHs assimilated from the base-model prey pathway(Figures 4A and 4B) are graphically distinguished from those derived from thebase-model sediments pathway (Figures 6A and 6B). The PAH distributions fromthe prey pathways in the No MDL sensitivity analysis are shown in Figures 5A and5B. Seawater is not shown because of its trivial contribution to the total assimilateddose (Table 11).
292 Hum. Ecol. Risk Assess. Vol. 18, No. 2, 2012

Current Risks to Harlequin Ducks
Table 8B Harlequin Duck model results: Full MDL sensitivity analysis. Averagedaily dose TPAH (mg·kg−1·day−1).
Oiled Reference
99.9% 99.9%Mean Median Quantile Mean Median Quantile
A.) Adult FemaleSummer
Mean 0.00591 0.00588 0.00744 0.00515 0.00514 0.00617CV (%) 0.01% 0.02% 0.30% 0.02% 0.03% 0.09%
WinterMean 0.00605 0.00602 0.00762 0.00527 0.00526 0.00632CV (%) 0.02% 0.02% 0.14% 0.01% 0.02% 0.15%
B.) Adult MaleSummer
Mean 0.00569 0.00567 0.00717 0.00496 0.00495 0.00594CV (%) 0.02% 0.02% 0.14% 0.01% 0.02% 0.15%
WinterMean 0.00579 0.00577 0.00732 0.00505 0.00504 0.00604CV (%) 0.02% 0.02% 0.14% 0.03% 0.03% 0.15%
C. Juvenile FemaleSummer
Mean 0.00662 0.00659 0.00834 0.00577 0.00576 0.00691CV (%) 0.02% 0.02% 0.14% 0.01% 0.01% 0.13%
WinterMean 0.00620 0.00618 0.00781 0.00541 0.00539 0.00648CV (%) 0.02% 0.02% 0.14% 0.01% 0.02% 0.15%
D. Juvenile MaleSummer
Mean 0.00638 0.00635 0.00804 0.00556 0.00555 0.00666CV (%) 0.01% 0.04% 0.18% 0.01% 0.02% 0.15%
WinterMean 0.00592 0.00590 0.00746 0.00516 0.00515 0.00619CV (%) 0.02% 0.02% 0.14% 0.01% 0.02% 0.15%
Prey-Pathway PAH Contributions
The close similarity between the oiled and reference distributions of PAHs inthe base model’s assimilated doses in the Harlequin Ducks from the prey path-way indicates that oiled-site prey (Figure 4A) can no longer be distinguished fromreference-site prey (Figure 4B). That is, the prey-derived assimilated doses, whichconstitute ∼90% of the total dose, exhibit concentrations and distributions of PAHsthat are essentially identical to background. These two distributions suggest thatthere was little if any remaining signal from EVOS in prey tissues by the time thesamples were collected (2002 through 2007); the small differences between theoiled-site and reference-site distributions do not reflect significant amounts of addi-tional petrogenic PAHs in the oiled sites, whether from EVOS or other petrogenicsources.
Hum. Ecol. Risk Assess. Vol. 18, No. 2, 2012 293

M. A. Harwell et al.
Table 8C Harlequin Duck model results: Upper 10% sensitivity analysis. Averagedaily dose TPAH (mg·kg−1·day−1).
Oiled Reference
99.9% 99.9%Mean Median Quantile Mean Median Quantile
A.) Adult FemaleSummer
Mean 0.00737 0.00733 0.00924 0.00294 0.00294 0.00357CV (%) 0.01% 0.01% 0.29% 0.01% 0.02% 0.17%
WinterMean 0.00755 0.00751 0.00945 0.00301 0.00301 0.00366CV (%) 0.02% 0.01% 0.11% 0.02% 0.02% 0.18%
B.) Adult MaleSummer
Mean 0.00710 0.00706 0.00890 0.00284 0.00283 0.00344CV (%) 0.01% 0.01% 0.24% 0.03% 0.03% 0.19%
WinterMean 0.00722 0.00719 0.00904 0.00289 0.00288 0.00350CV (%) 0.01% 0.02% 0.52% 0.01% 0.02% 0.17%
C. Juvenile FemaleSummer
Mean 0.00825 0.00821 0.01034 0.00330 0.00329 0.00400CV (%) 0.01% 0.01% 0.29% 0.01% 0.02% 0.17%
WinterMean 0.00774 0.00770 0.00970 0.00309 0.00308 0.00375CV (%) 0.01% 0.01% 0.24% 0.03% 0.03% 0.19%
D. Juvenile MaleSummer
Mean 0.00796 0.00792 0.00997 0.00318 0.00317 0.00385CV (%) 0.01% 0.01% 0.29% 0.03% 0.03% 0.19%
WinterMean 0.00739 0.00735 0.00925 0.00295 0.00294 0.00358CV (%) 0.01% 0.01% 0.29% 0.03% 0.03% 0.19%
The role of the Method Detection Limits is very important in projecting the as-similated doses from the prey-based pathway (as well as the seawater-based pathway).This is because about 75% of the PAH analytes in the prey samples collected fromoiled- and reference-site locations were less than their specific MDL values (Table12), reflecting the fact that the background concentrations of individual PAH ana-lytes in PWS prey are very low, barely above their detection limits. In fact, none ofthe 87 gastropod, crustacean, or fish samples from either oiled or reference siteshad any TPAH values that exceeded their respective detection limits (calculated asthe sum of the detection limits of the individual PAHs). Similarly, seawater analyseswere more than 90% non-detects. Only in sediment samples, discussed below, didthe majority of the analytes exceed the respective detection limits.
As a net result of the large fraction of non-detects in the primary route of ex-posure (i.e., the prey tissues in the Harlequin Duck diet), the modeled assimilated
294 Hum. Ecol. Risk Assess. Vol. 18, No. 2, 2012

Current Risks to Harlequin Ducks
Table 8D Harlequin Duck model results: +KN136 sensitivity analysis. Averagedaily dose TPAH (mg·kg−1·day−1).
Oiled Reference
99.9% 99.9%Mean Median Quantile Mean Median Quantile
A.) Adult FemaleSummer
Mean 0.00529 0.00496 0.01842 0.00294 0.00294 0.00357CV (%) 0.09% 0.05% 0.71% 0.01% 0.02% 0.17%
WinterMean 0.00542 0.00507 0.01886 0.00301 0.00301 0.00366CV (%) 0.09% 0.05% 0.71% 0.01% 0.02% 0.17%
B.) Adult MaleSummer
Mean 0.00510 0.00478 0.01775 0.00284 0.00283 0.00344CV (%) 0.08% 0.07% 0.81% 0.01% 0.02% 0.17%
WinterMean 0.00519 0.00486 0.01806 0.00289 0.00288 0.00350CV (%) 0.09% 0.05% 0.71% 0.01% 0.02% 0.17%
C. Juvenile FemaleSummer
Mean 0.00592 0.00555 0.02061 0.00330 0.00329 0.00400CV (%) 0.11% 0.06% 1.06% 0.01% 0.02% 0.17%
WinterMean 0.00555 0.00520 0.01933 0.00309 0.00308 0.00375CV (%) 0.09% 0.05% 0.71% 0.01% 0.03% 0.16%
D. Juvenile MaleSummer
Mean 0.00571 0.00535 0.01989 0.00318 0.00317 0.00386CV (%) 0.09% 0.05% 0.71% 0.01% 0.02% 0.17%
WinterMean 0.00530 0.00497 0.01858 0.00295 0.00294 0.00357CV (%) 0.08% 0.09% 1.40% 0.01% 0.03% 0.27%
doses to Harlequin Ducks were substantially driven by the values substituted forthe non-detects in the input data. A separate analysis of PAH proportions was con-ducted on prey-tissue PAH concentration data with “0” values for the non-detects(Figure 5); this was done in order to remove any effect that might ensue from theartifact of differential MDL values across PAH analytes. The PAH distribution forthe prey tissues from both oiled sites (Figure 5A) and reference sites (Figure 5B) isdominated by pyrogenic PAHs, as evidenced by elevated concentrations of parentcompounds (fluorene, phenanthrene, fluoranthene/pyrene, and chrysene; labeledwith red arrows) relative to their alkylated homologs. The oiled site-prey also demon-strate a minor weathered petrogenic component as evidenced by the progressivelyincreasing homologous series of alkylated dibenzothiophenes and alkylated fluo-ranthenes/pyrenes (ascending arrows in Figure 5A). However, the distribution ofchrysenes is pyrogenic (C0 > C1 > C2 > C3 > C4) (descending arrow in Figure 5A)
Hum. Ecol. Risk Assess. Vol. 18, No. 2, 2012 295

M. A. Harwell et al.
Table 8E Harlequin Duck model results: Doubled FMR sensitivity analysis.Average daily dose TPAH (mg·kg−1·day−1).
Oiled Reference
99.9% 99.9%Mean Median Quantile Mean Median Quantile
A.) Adult FemaleSummer
Mean 0.00740 0.00735 0.00986 0.00589 0.00587 0.00714CV (%) 0.01% 0.02% 0.53% 0.03% 0.03% 0.19%
WinterMean 0.00757 0.00753 0.01009 0.00603 0.00601 0.00731CV (%) 0.01% 0.02% 0.53% 0.03% 0.03% 0.19%
B.) Adult MaleSummer
Mean 0.00712 0.00708 0.00949 0.00567 0.00566 0.00688CV (%) 0.01% 0.02% 0.53% 0.03% 0.03% 0.19%
WinterMean 0.00725 0.00721 0.00966 0.00577 0.00576 0.00700CV (%) 0.01% 0.02% 0.53% 0.03% 0.03% 0.19%
C. Juvenile FemaleSummer
Mean 0.00828 0.00824 0.01104 0.00659 0.00658 0.00800CV (%) 0.02% 0.03% 0.38% 0.01% 0.02% 0.17%
WinterMean 0.00776 0.00772 0.01035 0.00618 0.00616 0.00750CV (%) 0.02% 0.03% 0.38% 0.01% 0.02% 0.17%
D. Juvenile MaleSummer
Mean 0.00799 0.00794 0.01065 0.00636 0.00634 0.00771CV (%) 0.02% 0.03% 0.38% 0.03% 0.03% 0.19%
WinterMean 0.00741 0.00737 0.00988 0.00590 0.00589 0.00716CV (%) 0.01% 0.02% 0.53% 0.01% 0.02% 0.17%
and not that of weathered EVO (e.g., Bence et al . 2007). The relative abundancesof the C2- and C3-dibenzothiophenes (labeled Alk Diben) relative to the C2- andC3-phenanthrenes (labeled Alk Phen) suggest a possible correlation to North SlopeAlaska crude (Page et al . 1995). The distribution of PAHs for the reference-site prey(Figure 5B) indicates a minor biogenic component (perylene, labeled Per) andpossibly a trace of petrogenic components. Perylene is a naturally occurring 5-ringPAH generated through biogenic processes and through the diagenesis of organicmatter in sediments (Venkatesan 1988).
Thus, the analyses using “0” values for non-detects, rather than the 12
MDL,support the previous conclusion based on assessing the PAH distributions derived
296 Hum. Ecol. Risk Assess. Vol. 18, No. 2, 2012

Current Risks to Harlequin Ducks
Table 8F Harlequin Duck model results: Doubled sediments sensitivity analysis.Average daily dose TPAH (mg·kg−1·day−1).
Oiled Reference
99.9% 99.9%Mean Median Quantile Mean Median Quantile
A.) Adult FemaleSummer
Mean 0.00408 0.00404 0.00606 0.00311 0.00311 0.00378CV (%) 0.02% 0.03% 0.48% 0.02% 0.02% 0.11%
WinterMean 0.00417 0.00414 0.00620 0.00319 0.00318 0.00386CV (%) 0.02% 0.03% 0.48% 0.01% 0.02% 0.26%
B.) Adult MaleSummer
Mean 0.00393 0.00389 0.00582 0.00300 0.00299 0.00364CV (%) 0.03% 0.02% 0.42% 0.03% 0.03% 0.25%
WinterMean 0.00400 0.00396 0.00594 0.00305 0.00304 0.00370CV (%) 0.02% 0.03% 0.48% 0.02% 0.02% 0.11%
C. Juvenile FemaleSummer
Mean 0.00457 0.00453 0.00678 0.00349 0.00348 0.00423CV (%) 0.02% 0.03% 0.48% 0.02% 0.02% 0.11%
WinterMean 0.00428 0.00424 0.00636 0.00327 0.00326 0.00396CV (%) 0.02% 0.03% 0.48% 0.02% 0.02% 0.11%
D. Juvenile MaleSummer
Mean 0.00440 0.00436 0.00653 0.00336 0.00335 0.00408CV (%) 0.03% 0.02% 0.42% 0.03% 0.03% 0.25%
WinterMean 0.00409 0.00405 0.00607 0.00312 0.00311 0.00378CV (%) 0.02% 0.03% 0.48% 0.02% 0.02% 0.11%
from the base model: if there remains any EVOS contribution to the prey PAHs, it isvery limited and clearly is not now a major component of the PAHs in prey tissues.
Sediment-Pathway PAH Contributions
In contrast to the pattern seen for the prey-derived PAHs, the sediments-derivedPAHs are not significantly influenced by detection limits (Table 12), and the 1
2MDL substitution for the few non-detects that did occur has no effect on either thePAH distributions or the TPAH values in the model-input sediment data. The PAHdistribution for the oiled-sediment pathway (Figure 6A), which constitutes <10%
Hum. Ecol. Risk Assess. Vol. 18, No. 2, 2012 297
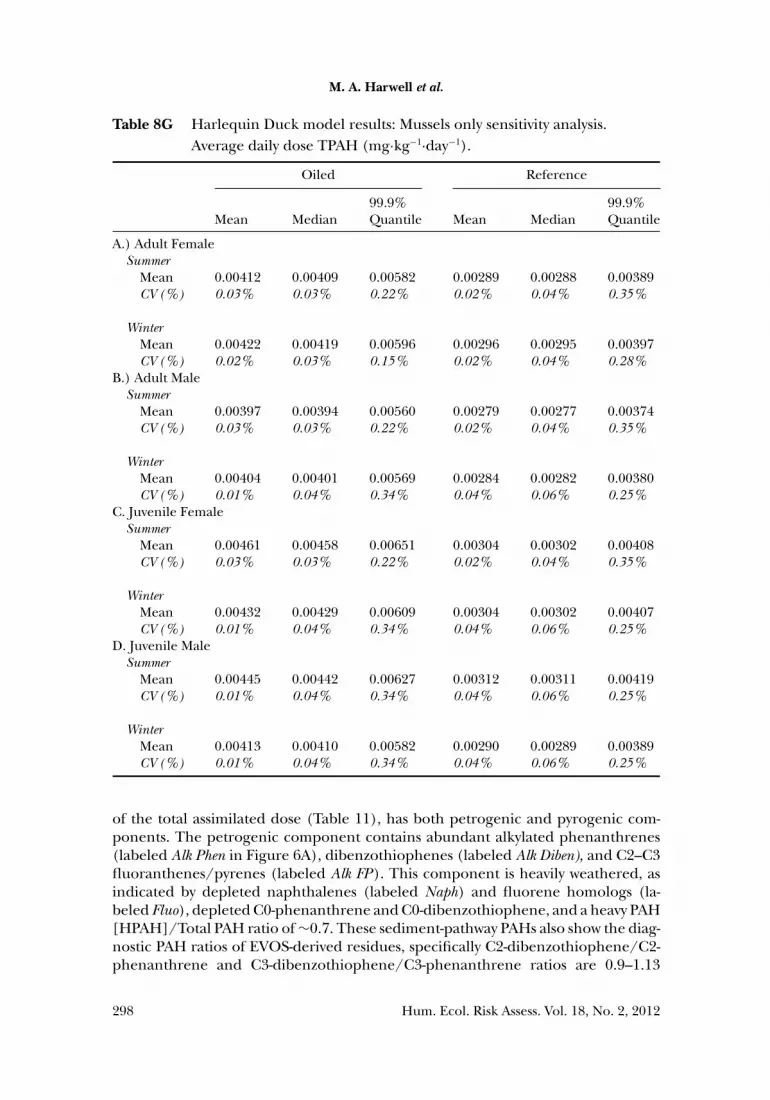
M. A. Harwell et al.
Table 8G Harlequin Duck model results: Mussels only sensitivity analysis.Average daily dose TPAH (mg·kg−1·day−1).
Oiled Reference
99.9% 99.9%Mean Median Quantile Mean Median Quantile
A.) Adult FemaleSummer
Mean 0.00412 0.00409 0.00582 0.00289 0.00288 0.00389CV (%) 0.03% 0.03% 0.22% 0.02% 0.04% 0.35%
WinterMean 0.00422 0.00419 0.00596 0.00296 0.00295 0.00397CV (%) 0.02% 0.03% 0.15% 0.02% 0.04% 0.28%
B.) Adult MaleSummer
Mean 0.00397 0.00394 0.00560 0.00279 0.00277 0.00374CV (%) 0.03% 0.03% 0.22% 0.02% 0.04% 0.35%
WinterMean 0.00404 0.00401 0.00569 0.00284 0.00282 0.00380CV (%) 0.01% 0.04% 0.34% 0.04% 0.06% 0.25%
C. Juvenile FemaleSummer
Mean 0.00461 0.00458 0.00651 0.00304 0.00302 0.00408CV (%) 0.03% 0.03% 0.22% 0.02% 0.04% 0.35%
WinterMean 0.00432 0.00429 0.00609 0.00304 0.00302 0.00407CV (%) 0.01% 0.04% 0.34% 0.04% 0.06% 0.25%
D. Juvenile MaleSummer
Mean 0.00445 0.00442 0.00627 0.00312 0.00311 0.00419CV (%) 0.01% 0.04% 0.34% 0.04% 0.06% 0.25%
WinterMean 0.00413 0.00410 0.00582 0.00290 0.00289 0.00389CV (%) 0.01% 0.04% 0.34% 0.04% 0.06% 0.25%
of the total assimilated dose (Table 11), has both petrogenic and pyrogenic com-ponents. The petrogenic component contains abundant alkylated phenanthrenes(labeled Alk Phen in Figure 6A), dibenzothiophenes (labeled Alk Diben), and C2–C3fluoranthenes/pyrenes (labeled Alk FP). This component is heavily weathered, asindicated by depleted naphthalenes (labeled Naph) and fluorene homologs (la-beled Fluo), depleted C0-phenanthrene and C0-dibenzothiophene, and a heavy PAH[HPAH]/Total PAH ratio of ∼0.7. These sediment-pathway PAHs also show the diag-nostic PAH ratios of EVOS-derived residues, specifically C2-dibenzothiophene/C2-phenanthrene and C3-dibenzothiophene/C3-phenanthrene ratios are 0.9–1.13
298 Hum. Ecol. Risk Assess. Vol. 18, No. 2, 2012

Current Risks to Harlequin Ducks
Table 9 Sensitivity analyses hazard quotients oiled maximum-exposed HarlequinDucks.
Factor Below Threshold
Sensitivity Analyses NOAEL HQ LOAEL HQ NOAEL LOAEL
No MDLAdult Female
Summer 0.00126 0.00012 796 8192Winter 0.00129 0.00013 776 7983
Adult MaleSummer 0.00129 0.00013 775 7566Winter 0.00131 0.00013 762 7435
Juvenile FemaleSummer 0.00140 0.00014 712 7325Winter 0.00132 0.00013 760 7815
Juvenile MaleSummer 0.00145 0.00015 691 6751Winter 0.00134 0.00014 745 7270
Full MDLAdult Female
Summer 0.00348 0.00034 288 2959Winter 0.00356 0.00035 281 2888
Adult MaleSummer 0.00358 0.00037 279 2727Winter 0.00365 0.00037 274 2673
Juvenile FemaleSummer 0.00390 0.00038 257 2640Winter 0.00365 0.00036 274 2817
Juvenile MaleSummer 0.00401 0.00041 249 2433Winter 0.00373 0.00038 268 2620
Upper 10%Adult Female
Summer 0.00432 0.00042 231 2381Winter 0.00442 0.00043 226 2330
Adult MaleSummer 0.00444 0.00046 225 2198Winter 0.00451 0.00046 222 2163
Juvenile FemaleSummer 0.00483 0.00047 207 2129Winter 0.00453 0.00044 221 2270
Juvenile MaleSummer 0.00498 0.00051 201 1962Winter 0.00462 0.00047 216 2114
+KN136Adult Female
Summer 0.00861 0.00084 116 1195Winter 0.00882 0.00086 113 1167
Adult MaleSummer 0.00886 0.00091 113 1102Winter 0.00901 0.00092 111 1083
(Continued on next page)
Hum. Ecol. Risk Assess. Vol. 18, No. 2, 2012 299

M. A. Harwell et al.
Table 9 Sensitivity analyses hazard quotients oiled maximum-exposed HarlequinDucks. (Continued)
Factor Below Threshold
Sensitivity Analyses NOAEL HQ LOAEL HQ NOAEL LOAEL
Juvenile FemaleSummer 0.00964 0.00094 104 1068Winter 0.00904 0.00088 111 1138
Juvenile MaleSummer 0.00993 0.00102 101 983Winter 0.00928 0.00095 108 1053
Doubled FMRAdult Female
Summer 0.00461 0.00045 217 2233Winter 0.00472 0.00046 212 2182
Adult MaleSummer 0.00474 0.00049 211 2060Winter 0.00482 0.00049 207 2025
Juvenile FemaleSummer 0.00516 0.00050 194 1993Winter 0.00484 0.00047 207 2216
Juvenile MaleSummer 0.00532 0.00054 188 1837Winter 0.00493 0.00051 203 1980
Doubled SedimentsAdult Female
Summer 0.00283 0.00028 353 3632Winter 0.00290 0.00028 345 3549
Adult MaleSummer 0.00291 0.00030 344 3358Winter 0.00296 0.00030 337 3293
Juvenile FemaleSummer 0.00317 0.00031 315 3244Winter 0.00297 0.00029 336 3461
Juvenile MaleSummer 0.00326 0.00033 307 2996Winter 0.00303 0.00031 330 3220
Mussels Only DietAdult Female
Summer 0.00272 0.00026 368 3784Winter 0.00278 0.00027 359 3695
Adult MaleSummer 0.00280 0.00029 358 3491Winter 0.00284 0.00029 352 3437
Juvenile FemaleSummer 0.00304 0.00030 328 3379Winter 0.00285 0.00028 351 3613
Juvenile MaleSummer 0.00313 0.00032 320 3121Winter 0.00291 0.00030 344 3361
300 Hum. Ecol. Risk Assess. Vol. 18, No. 2, 2012

Current Risks to Harlequin Ducks
Table 10 Sensitivity analyses hazard quotients reference maximum-exposedHarlequin Ducks.
Factor Below Threshold
Sensitivity Analyses NOAEL HQ LOAEL HQ NOAEL LOAEL
No MDLAdult Female
Summer 0.00058 0.00006 1719 17688Winter 0.00060 0.00006 1677 17254
Adult MaleSummer 0.00060 0.00006 1671 16319Winter 0.00061 0.00006 1642 16037
Juvenile FemaleSummer 0.00061 0.00006 1634 16813Winter 0.00061 0.00006 1638 16856
Juvenile MaleSummer 0.00067 0.00007 1491 14559Winter 0.00062 0.00006 1606 15681
Full MDLAdult Female
Summer 0.00288 0.00028 347 3568Winter 0.00295 0.00029 339 3484
Adult MaleSummer 0.00297 0.00030 337 3290Winter 0.00302 0.00031 331 3236
Juvenile FemaleSummer 0.00323 0.00031 310 3186Winter 0.00303 0.00029 330 3398
Juvenile MaleSummer 0.00333 0.00034 301 2935Winter 0.00309 0.00032 324 3161
Upper 10%Adult Female
Summer 0.00167 0.00016 599 6162Winter 0.00171 0.00017 585 6020
Adult MaleSummer 0.00172 0.00018 583 5687Winter 0.00175 0.00018 572 5587
Juvenile FemaleSummer 0.00187 0.00018 535 5503Winter 0.00175 0.00017 571 5875
Juvenile MaleSummer 0.00192 0.00020 520 5074Winter 0.00179 0.00018 560 5465
+KN136Adult Female
Summer 0.00167 0.00016 599 6162Winter 0.00171 0.00017 585 6020
Adult MaleSummer 0.00172 0.00018 582 5685Winter 0.00175 0.00018 572 5587
(Continued on next page)
Hum. Ecol. Risk Assess. Vol. 18, No. 2, 2012 301

M. A. Harwell et al.
Table 10 Sensitivity analyses hazard quotients reference maximum-exposedHarlequin Ducks. (Continued)
Factor Below Threshold
Sensitivity Analyses NOAEL HQ LOAEL HQ NOAEL LOAEL
Juvenile FemaleSummer 0.00187 0.00018 535 5503Winter 0.00175 0.00017 570 5869
Juvenile MaleSummer 0.00193 0.00020 519 5072Winter 0.00178 0.00018 560 5472
Doubled FMRAdult Female
Summer 0.00334 0.00032 300 3083Winter 0.00342 0.00033 293 3012
Adult MaleSummer 0.00343 0.00035 291 2844Winter 0.00349 0.00036 286 2795
Juvenile FemaleSummer 0.00374 0.00036 267 2752Winter 0.00350 0.00034 285 2936
Juvenile MaleSummer 0.00385 0.00039 260 2537Winter 0.00357 0.00037 280 2732
Doubled SedimentsAdult Female
Summer 0.00176 0.00017 567 5830Winter 0.00181 0.00018 554 5695
Adult MaleSummer 0.00182 0.00019 551 5377Winter 0.00185 0.00019 541 5286
Juvenile FemaleSummer 0.00198 0.00019 506 5207Winter 0.00185 0.00018 540 5556
Juvenile MaleSummer 0.00204 0.00021 491 4797Winter 0.00189 0.00019 529 5169
Mussels OnlyAdult Female
Summer 0.00182 0.00018 550 5664Winter 0.00186 0.00018 538 5538
Adult MaleSummer 0.00187 0.00019 535 5226Winter 0.00190 0.00019 527 5141
Juvenile FemaleSummer 0.00191 0.00019 525 5398Winter 0.00190 0.00019 525 5404
Juvenile MaleSummer 0.00209 0.00021 478 4668Winter 0.00194 0.00020 515 5027
302 Hum. Ecol. Risk Assess. Vol. 18, No. 2, 2012

Current Risks to Harlequin Ducks
Table 11 Allocation of assimilated doses of PAHs across exposure pathways foradult female Harlequin Duck in winter with “oiled” exposuresa.
Pathway
Scenario Prey Sediments Seawater TOTAL
Base Model 90.67% 9.30% 0.03% 100.00%No MDL 77.09% 22.88% 0.02% 100.00%Full MDL 94.13% 5.85% 0.03% 100.00%+KN136 93.51% 6.48% 0.02% 100.00%2FMR 90.68% 9.30% 0.01% 100.00%2X Sediments 82.15% 17.83% 0.02% 100.00%Mussels Only 92.84% 7.13% 0.02% 100.00%
aSee text for description of each sensitivity analysis.
(Page et al . 1995). The pyrogenic component in the oiled sediments contains abun-dant parent chrysene (labeled C0) and other 4–6-ring PAHs.
For the reference-site sediments pathway (Figure 6B), the dominant PAH is pery-lene (∼25% of TPAH). Visual observations indicated that the reference sedimentsamples had particularly high organic carbon content, which could support high
Table 12. Frequency of PAH analytes in samples below analytical detectionlimits.a,b
Sample Type n Frequency of Non-Detects
A. Oiled SamplesPrey
Gastropods 1040 79.9%Mussels 3840 79.1%Clams 2160 67.1%Crustaceans 600 77.5%Fish 480 83.1%Other invertebrates 1040 62.4%
Sediments 2040 34.1%Seawater 920 90.0%
B. Reference SamplesPrey
Gastropods 280 77.6%Mussels 1080 84.0%Clams 480 79.0%Crustaceans 160 73.8%Fish 920 78.5%Other invertebrates 240 75.8%
Sediments 1080 17.9%Seawater 480 95.8%
aSee text for data sources; all data available online at: http://www.valdezsciences.com/polycyclic aromatic hydrocarbon.cfmbBased on the sample-specific Method Detection Limit (MDL); see text for details.
Hum. Ecol. Risk Assess. Vol. 18, No. 2, 2012 303

M. A. Harwell et al.
microbial activity, a likely explanation for the very high levels of perylene. The assim-ilated doses derived from reference-site sediments also have a high HPAH/TPAHratio (0.58), driven largely by a very high perylene concentration relative to theother 4- to-6-ring PAHs. Reference-site sediments also have a small petrogenic com-ponent. The relative proportions of the alkylated phenanthrenes and dibenzoth-iophenes (e.g., C2-dibenzothiophene [labeled D2]:C2-phenanthrene [labeled P2]ratio ∼0.2) suggest that this component could be related to the natural petrogenicbackground, rather than to EVOS residues (Page et al . 1995; Bence et al . 1996).
These results indicate that some of the sediment samples at oiled sites (6 of the 51sediment samples analyzed) showed an EVOS signal in the constituent PAHs whencollected in 2007, with TPAH concentrations on average about double that of thebackground (non-oiled) sediments (Table 5B). However, sediment-derived PAHscontribute less than 10% of the total assimilated dose to the modeled HarlequinDucks (i.e., the sediment-derived doses, if occurring alone, would result in assimi-lated doses that are 3 and 4 orders of magnitude less than the NHQs and LHQs,respectively). Thus, the continuing EVOS signal seen in some sediment PAHs is notecologically significant.
Sensitivity Analyses
The sensitivity analyses (Tables 8–10) illustrate how differing model parametersaffect the results of the simulations. The sensitivity analyses in which the concentra-tions for every non-detectable PAH in the prey tissues were set to zero, rather thanthe 1
2MDL substitution of the base model, resulted in a reduction in the HQs by
about one-half for the maximum-exposed Harlequin Ducks in oiled locations andby about two-thirds for the reference locations. Similarly, in the Full MDL sensitivityanalyses, in which the non-detects were assigned the MDL values, the results were50% higher than the base case for oiled and about 75% higher for reference scenar-ios. These results reflect the fact that the background PAH concentrations in preytissues, whether in oiled locations or elsewhere in PWS, are very low, essentially closeto the detection limits in most cases. Substituting the 1
2MDL value for non-detects
is the best estimate of the actual concentrations, but they may be anywhere from 0to up to the full MDL, although, in many cases, PAH concentrations were in factreported substantially less than the MDL. The significant changes in HQs when notassigning non-zero values to the non-detects indicates how much the estimated riskis directly attributable to the detection-limit issue.
The relative frequencies of PAHs in assimilated doses for all pathways for the Up-per 10% adult females (winter scenario) (Figure 7) reveals increasing relative pro-portions of C1-C3 fluorenes (labeled Alk Fluo), C1-C3 phenanthrenes (labeled AlkPhen), C1-C3 dibenzothiophenes (labeled Alk Diben), C1-C3 fluoranthene/pyrenes(labeled Alk FP), and C1-C4 chrysenes (labeled Alk Chrys). In addition, the ratioC2-dibenzithiophene/C2-phenanthrene is ∼1.2. These trends are consistent withthe presence of weathered EVO. A slight increase in the proportions of alkylatedchrysenes relative to the base case (i.e., using the base model to simulate the adultfemale, winter scenario; compare Figure 7 to Figure 4A) probably reflects a slightly
304 Hum. Ecol. Risk Assess. Vol. 18, No. 2, 2012

Current Risks to Harlequin Ducks
Figure 4. Relative frequencies of 40 PAH analytes in assimilated doses from preypathways (adult female winter base model). Frequencies calculated asportion of TPAH contributed by each PAH analyte. Base model resultsfor adult female Harlequin Duck in winter (n = 500,000) (note: verysimilar results occurred for all other classes of seaducks). (A) AssimilatedPAHs from oiled-site prey pathways only. (B) Assimilated PAHs fromreference-site prey pathways only.
Hum. Ecol. Risk Assess. Vol. 18, No. 2, 2012 305

M. A. Harwell et al.
increased contribution from weathered EVO in the Upper 10% scenario. The Up-per 10% sensitivity analyses result in an increased risk by ∼88% for the maximum-exposed individuals, similar to the Full MDL sensitivity analyses. The HQs remainabout 200–230 times lower than the NOAEL and about 2,000–2,400 times lower thanthe thresholds of observed effects. This sensitivity analysis result means that even if aHarlequin Duck fed exclusively at a site that was at the upper 10% quantile of PAHconcentrations, there would still an additional 2–3 orders-of-magnitude increase inexposures required to cause a significant risk from residual PAHs.
Figure 5. Relative frequencies of 40 PAH analytes in assimilated doses from preypathways only—sensitivity analyses of adult female winter model withNo MDL substitutions. Frequencies calculated as portion of TPAH con-tributed by each PAH analyte. Model results for adult female HarlequinDuck in winter (n = 500,000) without the 1
2MDL substitution for non-
detects in the input PAH data (i.e., recorded as “0”; see http://www.valdezsciences.com/polycyclic aromatic hydrocarbon.cfm) (note: verysimilar results occurred for all other classes of seaducks). (A) AssimilatedPAHs from oiled prey pathways only. Note that C(1)Naphthalenes value= 0.140, and Phenanthrene value = 0.120; y-axis scale here truncated toshow other PAHs more clearly. Red arrows represent parent compounds;ascending arrows represent homologous series with increasing concen-trations; descending arrow represents homologous series with decreas-ing concentrations. (B) Assimilated PAHs from reference prey pathwaysonly. Note that C(1)Naphthalenes value = 0.252, and Phenanthrene value= 0.186; y-axis scale here truncated to show other PAHs more clearly.Red arrows represent parent compounds; descending arrow representshomologous series with decreasing concentrations. (Continued)
306 Hum. Ecol. Risk Assess. Vol. 18, No. 2, 2012

Current Risks to Harlequin Ducks
Figure 5. (Continued)
Similarly, including the prey-tissue data from the peat bog site (KN136) results inan increase in risk compared to the base case by a factor of ∼3.7, with the resultingHQs about 100 times and 1,000 times lower than the NOAEL and LOAEL thresholds,respectively. Under that scenario, an additional increase by 2–3 orders of magnitudewould still be required to reach an effect of concern. The mean values of exposuresand HQs (i.e., the exposures to the 50% quantile individuals) increased by onlyabout 40% above the base case, reflecting the importance of the few higher-PAHconcentrations on the upper tail of the distribution of assimilated doses.
The sensitivity analysis in which the metabolic rates for the modeled seaduckswere doubled resulted in doubling both the oiled and reference effects, because theindividuals in each location consumed twice as much prey and sediments, therebydoubling the assimilated dose. Under this higher-metabolic-rate scenario, the HQsremain about 200 times and 2,000 times lower than NOAEL and LOAEL thresholds,respectively, clearly not changing the conclusions from the base model results. Whenthe proportion of the diet consumed as sediments was doubled, the doses to themaximum-exposed seaducks increased by ∼23%. When the diet was assigned to be100% mussels, the doses to the maximum-exposed seaducks increased by ∼18%,indicating that the results are not sensitive to variability in the Harlequin Duck’scoastal marine diet. Thus, each of these results again shows only a modest elevationin risk from the sensitivity analyses.
The results of the sensitivity analyses that were designed to reach the effectsthresholds are shown in Figures 8 and 9. In these simulations, the input TPAHvalues were heuristically increased by selected multiplication factors (Table 13).Each prey category contributes to the food consumed in proportion to the dietaryfrequency (Table 2), and the assimilated dose contributions of the diet, sediments,
Hum. Ecol. Risk Assess. Vol. 18, No. 2, 2012 307

M. A. Harwell et al.
and seawater are in the same proportion as the base model (Table 11). Therefore,the hypothetical effective mean TPAH concentration in the environment for eachmultiplicative factor was calculated as weighted contributions from each PAH source(Table 13).
The various quantile lines illustrate the NHQ (Figure 8A) and LHQ (Figure 8B)values for different fractions of the exposed population. For example, for the 99.9%quantile assimilated dose (maximum-exposed individuals) to reach the HQ = 1level, the TPAH concentrations would have to be ∼425 times higher than actuallyexist in the PWS environment for the NOAEL threshold and ∼4,300 times higher
Figure 6. Relative frequencies of 40 PAH analytes in assimilated doses from sedi-ment pathways (adult female winter base model). Frequencies calculatedas portion of TPAH contributed by each PAH analyte. Base model re-sults for adult female Harlequin Duck in winter (n = 500,000) (note:very similar results occurred for all other classes of seaducks). (A) Assim-ilated PAHs from oiled-site sediments pathways only. Ascending arrowsrepresent homologous series with increasing concentrations; descend-ing arrows represent homologous series with decreasing concentrations.Alkylated naphthalene homologs labeled Alk Naph; alkylated fluorenehomologs labeled Alk Fluo; alkylated phenanthrene homologs labeledAlk Phen; alkylated dibenzothiophene homologs labeled Alk Diben; alky-lated fluoranthene/pyrene homologs labeled Alk FP ; HPAH = High-Molecular-Weight PAHs (having 4–6 rings). (B) Assimilated PAHs fromreference-site sediments pathways only. Note that for the referencesediments, the PAH analyte Perylene value = 0.252; y-axis here trun-cated to show other PAHs more clearly. C2-dibenzothiophene labeledD2; C2-phenanthrene labeled P2; perylene labeled Per ; HPAH = High-Molecular-Weight PAHs (having 4–6 rings). (Continued)
308 Hum. Ecol. Risk Assess. Vol. 18, No. 2, 2012

Current Risks to Harlequin Ducks
Figure 6. (Continued)
Figure 7. Relative frequencies of 40 PAH analytes in assimilated doses from allpathways under oiled conditions—upper 10% sensitivity analyses. Fre-quencies calculated as portion of TPAH contributed by each PAH an-alyte. Model results for adult female Harlequin Duck in winter (n =500,000) under the Upper 10% scenario (see text for details) (note:very similar results occurred for all other classes of seaducks). Ascend-ing arrows represent increasing homologous series; alkylated fluorenehomologs labeled Alk Fluo; alkylated phenanthrene homologs labeledAlk Phen; alkylated dibenzothiophenes homologs labeled Alk Diben; alky-lated fluoranthene/pyrene homologs labeled Alk FP ; alkylated chrysenehomologs labeled Alk Chrys.
Hum. Ecol. Risk Assess. Vol. 18, No. 2, 2012 309

M. A. Harwell et al.
Figure 8. Results from the HQ = 1 sensitivity analyses (Hazard Quotients). Plotsof Hazard Quotients from adult female winter model with heuristic in-crease in environmental PAHs (see text for details) (note: very similarresults occurred for all other classes of seaducks). Each line representsa different quantile level (from 99.9% quantile [maximum-exposed in-dividuals] down to the 50% quantile [median individuals]) for each ofsix multiplicative factors applied to the extant PWS environmental PAHlevels. See Table 13 for conversion of multiplicative factors to mean envi-ronmental PAH concentrations. Also shown is the HQ = 1 line, at whichthe assimilated average daily doses equal the toxicity reference values.(A) NOAEL Hazard Quotients. (B) LOAEL Hazard Quotients.
310 Hum. Ecol. Risk Assess. Vol. 18, No. 2, 2012

Current Risks to Harlequin Ducks
Figure 9. Results from the HQ = 1 sensitivity analyses (quantile levels). Plot ofquantile levels (%) at which HQ = 1 from adult female winter model withheuristic increase in environmental PAHs (ppm) (see text for details)(note: very similar results occurred for all other classes of seaducks).(A) NOAEL Hazard Quotients series. (B) LOAEL Hazard Quotientsseries.
for the LOAEL threshold; these correspond to hypothetical environmental TPAHconcentrations of ∼16 ppm and ∼160 ppm, respectively (assuming the same relativecontributions from each prey category and from prey, sediments, and seawater).Similarly, for the 95% quantile thresholds to be reached, hypothetical environmentalTPAH concentrations would have to be ∼18 ppm and ∼185 ppm, respectively; forthe 75% quantile, the respective concentrations would be about 20 and 210 ppm.
Hum. Ecol. Risk Assess. Vol. 18, No. 2, 2012 311

M. A. Harwell et al.
Table 13. Multiplicative factors applied in the HQ = 1 sensitivity analyses andassociated mean environmental TPAH concentrations.a
Multiplicative Mean Environmental Mean EnvironmentalFactor TPAH (ppb) TPAH (ppm)
400 1.48E+04 14.76425 1.57E+04 15.68450 1.66E+04 16.60475 1.75E+04 17.53500 1.84E+04 18.45600 2.21E+04 22.14700 2.58E+04 25.83800 2.95E+04 29.52900 3.32E+04 33.21
1000 3.69E+04 36.902000 7.38E+04 73.793000 1.11E+05 110.694000 1.48E+05 147.594250 1.57E+05 156.814500 1.66E+05 166.044750 1.75E+05 175.265000 1.84E+05 184.486000 2.21E+05 221.38
aSee text for description of HQ = 1 sensitivity analyses. Mean environmental TPAHconcentrations were derived as the average of TPAHs of each source of PAHs (i.e., each preyclass, sediments and seawater) weighted to reflect the relative contribution of each source tothe total assimilated doses of the Harlequin Ducks in the base model.
The purpose of assessing effects at different quantile levels is to assist in translatingindividual-level effects to population-level effects. For example, even if the PAHexposures to the maximum-exposed individuals were sufficient to reach the TRVs,no population-level effect would result, as still only 1 out of 1000 members ofthe population would be affected, a level clearly insufficient to be detected in thepopulation. Conversely, if the 50% quantile reached the effects threshold, then halfthe members of the population would be affected, and a population-level effectwould likely be anticipated.
There is no generic threshold value that can be used to determine whenpopulation-level effects occur, but we can examine alternate levels of what couldbe considered to constitute a population-level effect. For example, USFWS (2001)suggested that for the Spectacled Eider (Somateria fischeri), a species listed as Threat-ened in Alaska, a 5% increase in mortality (in this case, from native Alaskan harvest-ing) would not lead to the loss of the population but might impede recovery. Thiscorresponds to the 95% quantile results in our study, or ∼18 ppm for the NOAELand ∼185 ppm for the LOAEL HQ = 1 thresholds. Alternatively, the natural in-terannual variability of the population could be used as a guide for selecting thequantile level at which population-level effects would be expected. Examination ofthe available Harlequin Duck population data reported in Wiens et al . (2010) yields
312 Hum. Ecol. Risk Assess. Vol. 18, No. 2, 2012

Current Risks to Harlequin Ducks
a CV of ∼20–30% (which corresponds to our 75% quantile level). The mean envi-ronmental TPAH concentrations for this level would need to be ∼20 ppm and 210ppm, respectively (Figures 9A and B). Other values could be selected, but the rela-tive closeness of the family of curves indicates that this is not a sensitive parameter(see Figures 8 and 9). Thus, we conclude that somewhere between 15–20 ppm (no-observed-effects threshold) and 150–200 ppm (lowest-observed-effects threshold)TPAH in the environment would lead to population-level effects being anticipated.
For context, it is useful to compare these hypothetical values with the actual TPAHconcentrations measured in PWS prey tissues shortly after EVOS. Two databasesare relevant: (1) the data collected for the Natural Resource Damage Assessment(NRDA) conducted by NOAA, the US Departments of Interior and Agriculture,and the State of Alaska Departments of Law, Fish & Game, and EnvironmentalConservation, labeled PWSOIL (see the Exxon Valdez Trustees Database [EVTHD],reported in Short and Nelson 1998); and (2) the ad hoc Oil Spill Health Task Force(OSHTF) assessments conducted by scientists from federal, state, and local agencies(including public health) and from Exxon (cited in Bence and Burns 1995).
The OSHTF data (reported on a wet-weight basis only, with water content notreported) for 1989 show: 1 (∼2%) mussel out of 42 sampled had a TPAH of 18.5ppm wet weight (or ∼180 ppm dry weight assuming a 90% water content); 3 (∼7%)had about 2–4 ppm (∼20–40 ppm dry weight); and the rest were less than 1 ppm(∼10 ppm dry weight). In 1990, a total of 11 (∼8%) mussels out of 140 sampledhad TPAH between 1.7 and 5.5 ppm dry weight (∼17–55 ppm dry weight), andthe rest were less than 1 ppm; and none of the 180 mussels sampled in 1991–1993exceeded 1 ppm (∼10 ppm dry weight). The OSHTF database for clams showednone exceeding 1 ppm wet weight (∼10 ppm dry weight) at any time following thespill.
The PWSOIL/EVTHD mussel data (dry-weight basis; n = 970 for 1989, 1990,and 1991) showed 18 (∼2%) of the samples collected in 1989 in the 10–40 ppmrange, and ∼12% between 1 and 10 ppm; however, no mussels exceeded 10 ppm dryweight at any point in time beyond 90 days after the oil spill. Moreover, no musselsexceeded 1 ppm in 1991. For clams, the PWSOIL database (dry-weight basis; n =347 for 1989, 1990, and 1991) showed 6 clams in the 10–35 ppm range about 6weeks after the spill, but none exceeding 10 ppm later in 1989 or in 1990, and noneexceeding 1 ppm in 1991.
These data and the results of the HQ = 1 sensitivity analyses demonstrate thateven as early as 90 days after EVOS, the mean measured environmental TPAH levelsin PWS did not reach concentrations sufficient to cause individual-level chronic-exposure toxicological effects on Harlequin Ducks.
SYNTHESIS
This quantitative assessment of the potential for continuing toxicological risksto Harlequin Ducks in PWS caused by EVOS-derived PAHs has been conducted toevaluate the plausibility of published suggestions that continuing effects do exist onthat Harlequin Duck population and that those effects are attributable to EVOS,even two decades after the event (Bodkin et al. 2002, 2003; Esler et al. 2002; Short
Hum. Ecol. Risk Assess. Vol. 18, No. 2, 2012 313

M. A. Harwell et al.
et al. 2006; Esler 2008; EVOSTC 2010). In contrast to those assertions, Wiens et al.(2004) concluded that any population-level effect may be explained more readilyby differences in habitats between the oiled sites in western PWS and the unoiledsites on Montague Island that were used for comparisons. Moreover, in a qualitativeassessment of the plausibility of current risks from remnant EVO, Wiens (2007)concluded that it is highly unlikely that the spill currently has continuing effectson Harlequin Ducks through ingestion of hydrocarbon-contaminated mussels inspill-affected shorelines of PWS.
In the present study, we use the USEPA ecological risk assessment framework(USEPA 1992, 1998; Gentile et al. 1993) to evaluate systematically and quantita-tively the hypothesis that the Harlequin Duck population of Prince William Soundcontinues to be at-risk from EVOS. This quantitative toxicological risk assessmentcompares the PAH exposures from initially oiled areas with those from never-oiledareas in PWS in order to evaluate whether those differences could plausibly lead toeffects on individual Harlequin Ducks, with the highly conservative assumption thatany such differences are solely attributable to EVOS.
By quantifying all plausible pathways by which PAHs from oiled sites could getinto an individual Harlequin Duck living under PWS conditions, we have confidencethat this risk assessment has captured the key components of risk. Using the mostrecent actual measured PAH concentrations in prey, sediments, and seawater in theoiled and reference sites of PWS, we base the analyses on empirical data that capturethe range of existing toxicological conditions in PWS. By developing a stochasticmodel that explicitly uses the distributions derived from empirical data, we capturethe variability that is expected among the doses assimilated by PWS HarlequinDucks. By simulating a population of 500,000 individual ducks within each of fourage/gender classes of Harlequin Ducks and two seasons, we have captured thevariability of the Harlequin Duck population characteristics as they exist in PWS.In essence, we let the prey and sediments integrate the various sources of PAHs,whether from initially oiled or from never-oiled sites in PWS. Similarly, the modeledHarlequin Ducks integrate the PAHs from the various prey, sediment, and seawatersources. Consequently, the final model projections give the best insights into actualrisks to Harlequin Ducks in PWS from PAHs at the present time.
By consistently incorporating conservative assumptions into the risk-assessmentmodel, we have confidence that the estimates of risk are at the upper end of the rangeof plausible values. Those conservative assumptions include: (1) attributing any PAHdifferences between oiled sites and reference sites solely to EVO-derived PAHs; (2)assigning the modeled Harlequin Duck to feeding solely within the oiled areas; and(3) assuming that all ingested PAHs are completely bioavailable and assimilatedas dose, including those that are tightly bound to sediments (e.g., Kow values upto 10−6; Durrell et al. 2006). By conservatively focusing the effects assessments onthe 1-in-1,000th most-exposed individuals, we have even greater confidence that theactual risks to the Harlequin Duck population in PWS are considerably less than theprojected values. By conducting sensitivity analyses on selected model parameters,we demonstrate that the model projections are robust. By following a carefullydesigned and implemented QA regime, we are confident that the model projectionsare reliable and reproducible.
314 Hum. Ecol. Risk Assess. Vol. 18, No. 2, 2012
Current Risks to Harlequin Ducks
The results of the quantitative modeling clearly demonstrate that there currentlyis no plausible risk from PAHs in the oiled areas of PWS to Harlequin Ducks. Sincethe chronic assimilated doses of TPAH to the maximum-exposed individuals at theoiled sites are about 400 times lower than the no-observed-adverse-effects thresh-old and about 4,000 times lower than the lowest-observed-adverse-effects threshold,it is unreasonable to expect any individual health effects attributable to the oiledsites and, by implication, to continuing EVOS effects. Because the various sensitivityanalyses also are at least two orders of magnitude less than NOAEL effects, and atleast three orders of magnitude less than LOAEL effects, this conclusion is robust.Moreover, the sensitivity analysis of not substituting 1
2MDL for the non-detectable
PAH concentrations in prey tissues showed just how low the background PAH con-centrations actually are in PWS, whether at oiled sites or elsewhere in the Sound.This result highlights the very low risks associated with PAHs remaining from resid-ual EVOS sources, driven by the fact that both the oiled-site and reference-site preytissues are essentially at or less than detection limits. Moreover, the analyses of thedistributions of PAHs in the assimilated doses indicate that the differences betweenthe prey at oiled sites and the reference sites do not point to an enhanced EVOS- orother petrogenic-based signal in the oiled sites; rather, the additional PAHs seem tobe pyrogenic or biogenic in origin and, thus, clearly are not attributable to EVOS.
Some of the sediments from oiled sites, on the other hand, do demonstrate asignal that is consistent with residual EVO that is not seen in the reference-sitesediments. However, because the assimilated dose to the Harlequin Ducks fromsediments is projected to be no more than 10% of the total assimilated dose, thesediments from oiled shorelines contribute a dose to the most highly exposed sea-ducks that is more than 3–4 orders of magnitude less than NOAEL and LOAELvalues. As a result, while the EVOS signal is detectable in PWS sediments, it does notconstitute a risk to the Harlequin Ducks because of the extremely low assimilateddoses.
Some authors have suggested that in 2009 there continued to be a differencebetween the exposure biomarker CYP1A in PWS Harlequin Ducks at oiled sitescompared to reference sites (Esler et al . 2010), although as discussed previously,attributing CYP1A responses solely to EVOS-derived PAHs is problematic. However,whether or not an exposure biomarker difference exists in PWS is not the issue: AsAnderson and Lee (2006) and (Esler et al . 2010) correctly pointed out, biomarkersonly reflect that an exposure has occurred, but do not indicate either the magnitudeof the exposure or the ecological effects that could potentially occur. Similarly, Eslerand Iverson (2010) suggested that while presently there may be sufficient exposureto trigger biomarker induction, evidence indicates that demographic effects nolonger exist.
By contrast, the risk assessment conducted here provides a complete risk charac-terization (USEPA 1992, 1998), including quantification of both the amount of theexposure that occurs and the potential for any effects that might result from thatexposure. Based on our quantitative risk assessment results, the magnitude of theexposures to PAHs that are presently occurring in PWS are well below any possibil-ity of health effects to the Harlequin Ducks, irrespective of whether that exposurewould be sufficient to cause CYP1A induction.
Hum. Ecol. Risk Assess. Vol. 18, No. 2, 2012 315

M. A. Harwell et al.
Moreover, in order for there to be a population-level effect caused by differencesin PAH concentrations between oiled and reference sites, there would have to beindividual-level effects on literally hundreds or thousands of Harlequin Ducks inPWS. However, since the ecotoxicological risk model demonstrates that not even asingle Harlequin Duck out of the millions of individuals simulated would experiencean assimilated dose that is closer than 3 orders of magnitude less than the thresholdfor observable adverse toxicological effects, that eventuality is not plausible basedon the model projections.
The results also show that the assimilated doses to both the average and themaximum-exposed individuals increase linearly with concentrations of environmen-tal PAHs. In one set of sensitivity analyses, the model was modified heuristically toassign TPAH concentrations sufficient to cause a health-effects risk. Under this hy-pothetical scenario, the mean TPAH concentrations in the PWS environment wouldhave to be at least ∼16 ppm for the maximum-exposed individuals to reach theNOAEL threshold, and increase by yet another order of magnitude (i.e., ∼160 ppm)for the LOAEL threshold. Additionally, population-level effects on PWS HarlequinDucks would require continuous exposures to mean environmental TPAH concen-trations on the order of between 15–20 and 150–200 ppm, irrespective of whatthreshold one chose between 0.1% and 30% for population-level effects to occur.Such mean environmental TPAH concentrations are higher than have been re-ported in the PWS environment since 1990 and an order-of-magnitude higher thanany reported since the clean-up was completed in 1991. Consequently, the resultsfrom this risk assessment are clear: PAH concentrations in PWS now two decades af-ter the oil spill could not plausibly lead to any adverse health effects on any individualHarlequin Duck, much less on the PWS population.
Based on this quantitative toxicological risk assessment, we conclude that theresidual PAHs derived from the Exxon Valdez oil spill that occurred two decadesago cannot be a cause of adverse effects on any individual Harlequin Duck and,as a result, cannot be affecting the PWS population of Harlequin Ducks. Conse-quently, if there are any subpopulation-level differences for Harlequin Ducks inPWS, they may be attributable to habitat variation across the Sound, breeding con-ditions, or other pre-existing conditions in the PWS ecosystem. Many other stressorsalso affect the PWS ecosystem. In particular, those stressors deriving from climateand oceanographic variability fundamentally affect the entire ecosystem throughaltering primary and secondary productivity and the PWS trophic structure (asshown in the PWS conceptual model presented in Harwell et al. 2010b). In lightof these results and the other environmental factors operating in PWS, the risk tothe Harlequin Ducks of PWS that can be attributable to EVOS is essentially non-existent.
ACKNOWLEDGMENTS
The authors acknowledge the participants in the workshops that were convenedto develop the pathways conceptual model and the data for the parameterization ofthe quantitative toxicological risk assessment model, specifically: Drs. Paul Boehm,
316 Hum. Ecol. Risk Assess. Vol. 18, No. 2, 2012

Current Risks to Harlequin Ducks
John Brown, Susan Kane Driscoll, David Garshelis, Ray Highsmith, Rick Johnson,and David Page. We also thank these scientists for their comments and suggestionson earlier drafts of the article. Additionally, Dr. Highsmith provided very useful in-sights and unpublished information on the fat innkeeper in Prince William Sound.Dr. Ken Cummins provided very useful insights on measurements of energy densityin tissues of prey species relevant to the risk assessment. We particularly appreciatethe careful reviews and suggestions of three peer reviewers on the pre-submissiondraft of the article—Drs. Ken Dickson, David Weinstein, and Terry Young, and theformal peer reviewers selected by the editors of Human and Ecological Risk Assess-ment—Drs. Donald DeAngelis, Jean-Pierre Savard, and Christopher Teaf. Finally, weacknowledge the financial support provided by ExxonMobil Corporation for thetime needed to prepare this article.
AUTHOR-DIRECTED PEER REVIEW
This manuscript was prepared under HERA’s author-directed peer review process,wherein a manuscript’s authors nominate proposed peer reviewers to HERA’s Man-aging Editor for approval or revision. The following persons reviewed and approvedthe publication of this manuscript:
• Dr. Donald DeAngelis, theoretical ecologist and ecological modeler, U.S. Geo-logical Survey, Department of Biology, University of Miami, Coral Gables, FL,USA;
• Dr. Jean-Pierre L. Savard, migratory bird research scientist, EnvironmentCanada, Canadian Wildlife Service Office, Sainte-Foy, Quebec, Canada;
• Dr. Christopher Teaf, toxicologist and risk assessment specialist, Associate Di-rector, Center for Biomedical & Toxicological Research, Florida State Univer-sity, Tallahassee, FL, USA
GLOSSARY OF ABBREVIATIONS
ADEC: Alaska Department of Environmental ConservationADNR: Alaska Department of Natural ResourcesAIA: acid-insoluble ashASTM: American Society of Testing and MaterialsCV: coefficient of variationCYP1A: biomarker for cytochrome P4501ADEE: daily energy expenditureDoubled FMR: sensitivity analysis with field metabolic rate doubledDoubled Sediments: sensitivity analysis with fraction of diet consumed as sedi-
ments doublede-CFR: electronic Code of Federal Regulations; available online at:
http://ecfr.gpoaccess.govEcoSSL: Ecological Soil Screening Level; from USEPA (2005, 2007)
Hum. Ecol. Risk Assess. Vol. 18, No. 2, 2012 317

M. A. Harwell et al.
EVO: Exxon Valdez oilEVOS: Exxon Valdez oil spillEVOSTC: Exxon Valdez Oil Spill Trustee CouncilFMR: field metabolic rateFull MDL: sensitivity analysis with MDL value entered for non-detects
in PAH analysesGC/MS: gas chromatography/mass spectrometryGOA: Gulf of AlaskaHAZMAT: NOAA Hazardous Materials Response and Assessment Divi-
sionHOR: heavy oil residue (highest visual oiling level for SSOR)HPAH: heavy PAHHQ: hazard quotient; ratio of assimilated dose to TRVITZ: intertidal zoneKow: octanol/water partitioning coefficientKN136: peat bog site on Knight Island+KN136: sensitivity analysis adding prey data from KN136 siteLITZ: lower intertidal zoneLOAEL: lowest-observed-adverse-effects levelMDL: Method Detection LimitMITZ: middle intertidal zoneMussels Only: sensitivity analysis with diet consisting of 100% musselsNKI: northern Knight IslandNo MDL: sensitivity analysis with “0” entered for non-detects in PAH
analysesNOAA: U.S. National Oceanic and Atmospheric AdministrationNOAEL: no-observed-adverse-effects levelNRC: National Research CouncilPAHs: polycyclic aromatic hydrocarbonsPWS: Prince William SoundQA: quality assuranceSIM: selected ion monitoringSOR: surface oil residuesSSOR: subsurface oil residuesTPAH: total PAHTRV: toxicity reference valueUITZ: upper intertidal zoneUpper 10%: sensitivity analysis using upper 10% of modeled TPAH daily
doses to generate secondary distributions to calculate aver-age daily doses
USEPA: U.S. Environmental Protection AgencyUSFWS: U.S. Fish & Wildlife ServiceUSGS: U.S. Geological SurveyWEVC: weathered Exxon Valdez crude oil12
MDL: sensitivity analysis with 12
MDL value entered for non-detectsin PAH Analyses
318 Hum. Ecol. Risk Assess. Vol. 18, No. 2, 2012

Current Risks to Harlequin Ducks
REFERENCES
Adams PA, Robertson GJ, and Jones IL. 2000. Time-activity budgets of Harlequin Ducksmolting in the Gannet Islands, Labrador. Condor 102(3):703–8
ADNR (Alaska Department of Natural Resources). 1996a. Exxon Valdez Oil Spill–ShorelineOiling-PWS Fall/89–Spring/90. Alaska Department of Natural Resources, Anchorage, AK,USA. Available at http://dnr.alaska.gov/SpatialUtility/SUC?cmd=vmd&layerid=1281
ADNR. 1996b. Exxon Valdez Oil Spill–Shoreline Oiling–PWS Spring 91. Alaska Departmentof Natural Resources, Anchorage, AK, USA. Available at http://dnr.alaska.gov/mdfiles/evos oiling pws 1991.html
Ainley DG, Grau CR, Roudybush TE, et al. 1981. Petroleum ingestion reduces reproductionin Cassin’s Auklets. Marine Pollut Bull 12(9):314–7
Albers PH. 1979. Transfer of crude oil from contaminated water to bird eggs. Environ Res22(2):307–14
Anderson JW and Lee RF. 2006. Use of biomarkers in oil spill risk assessment in the marineenvironment. Hum Ecol Risk Assess 12(6):1192–222
Andres BA. 1999. Effects of persistent shoreline oil on breeding success and chick growth inBlack Oystercatchers. Auk 116(3):640–50
Ax P. 2000. Multicellular Animals, vol II. The Phylogenetic System of the Metazoa. Springer-Verlag, Heidelberg, Germany
Bence AE and Burns WA. 1995. Fingerprinting hydrocarbons in the biological resources ofthe Exxon Valdez spill area. In: Wells PG, Butler JN, and Hughes JS (eds), Exxon Valdez OilSpill: Fate and Effects in Alaskan Waters, pp 84–140. ASTM Special Technical PublicationNo. 1219. American Society of Testing and Materials, Philadelphia, PA, USA
Bence AE, Kvenvolden KA, and Kennicutt MC. 1996. Organic chemistry applied to environ-mental assessments of Prince William Sound, Alaska, after the Exxon Valdez oil spill—Areview. Org Geochem 24(1):7–42
Bence AE, Page DS, and Boehm PD. 2007. Advances in forensic techniques for petroleumhydrocarbons: The Exxon Valdez experience. In: Wang Z and Stout SA (eds), Oil SpillEnvironmental Forensics, Fingerprinting and Source Identification, pp 449–87. AcademicPress, San Diego, CA, USA
Bennett DC. 2002. Effect of Saline Intake on Osmotic Homeostasis in Ducks. Ph.D. disserta-tion, University of British Columbia, Vancouver, BC, Canada
Bennett D, Gray D, and Hughes M. 2003. Effect of saline intake on water flux and os-motic homeostasis in Pekin ducks (Anas platyrhynchos). J Comp Physiol Part B 173(1):27–36
Bennett DC and Hughes MR. 2003. Comparison of renal and salt gland function in threespecies of wild ducks. J Exp Biol 206:3273–84
Beyer WN, Perry MC, and Osenton PC. 2008. Sediment ingestion rates in waterfowl (Anati-dae) and their use in environmental risk assessment. Integrated Environ Assess Manage4(2):246–51
Birt-Friesen VL, Montevecchi WA, Cairns DK, et al. 1989. Activity-specific metabolic rates offree-living Northern Gannets and other seabirds. Ecology 70:357–67
Bishop MA and Green SP. 2001. Predation on Pacific herring (Clupea pallasi) spawn by birdsin Prince William Sound, Alaska. Fisheries Oceanography 10 (Suppl 1):149–58
Bodkin JL, Ballachey BE, Dean TA, et al. 2002. Sea otter population status and the process ofrecovery from the 1989 “Exxon Valdez” oil spill. Mar Ecol Progr Ser 241:237–53
Bodkin J, Ballachey B, Esler D, et al. 2003. Patterns and Processes of Population Changein Selected Nearshore Predators. EVOS Project No. 423. Report prepared for the ExxonValdez Oil Spill Trustee Council. US Geological Survey, Alaska Science Center and Centrefor Wildlife Ecology, Simon Fraser University, Delta, BC, Canada
Hum. Ecol. Risk Assess. Vol. 18, No. 2, 2012 319

M. A. Harwell et al.
Boehm PD, Douglas GS, Burns WA, et al. 1997. Application of petroleum hydrocarbon chem-ical fingerprinting and allocation techniques after the Exxon Valdez oil spill. Mar PollutBull 34(8):599–613
Boehm PD, Page DS, Brown JS, et al. 2004. Polycyclic aromatic hydrocarbon levels in musselsfrom Prince William Sound, Alaska, USA, document the return to baseline conditions.Environ Toxicol Chem 23(12):2916–29
Boehm PD, Page DS, Neff, JM, et al. 2007a. Potential for sea otter exposure to remnants ofburied oil from the Exxon Valdez oil spill. Environ Sci Technol 41(19):6860–7
Boehm PD, Neff JM, and Page DS. 2007b. Assessment of polycyclic aromatic hydrocarbonexposure in the waters of Prince William Sound after the Exxon Valdez oil spill: 1989–2005.Mar Pollut Bull 54(3):339–67
Boehm PD, Page DS, Brown JS, et al. 2008. Distribution and weathering of crude oil residueson shorelines 18 years after the Exxon Valdez spill. Environ Sci Technol 42(24):9210–6
Bond JC and Esler D. 2006. Nutrient acquisition by female Harlequin Ducks prior to spring mi-gration and reproduction: Evidence for body mass optimization. Can J Zool 84(9):1223–9
Bourget D, Savard J-L, and Guillemette M. 2007. Distribution, diet, and dive behavior ofBarrow’s and Common Goldeneyes during spring and autumn in the St. Lawrence estuary.Waterbirds 30(2):230–40
Brannon EL, Collins KC, Cronin MA, et al. 2007. Risk of weathered residual Exxon Valdez oilto pink salmon embryos in Prince William Sound. Environ Toxicol Chem 26(4):780–6
Brassell SC and Eglinton G. 1980. Environmental chemistry—An interdisciplinary subject.Natural and pollutant organic compounds in contemporary aquatic sediments. In: AlgaigesJ (ed), Analytical Techniques in Environmental Chemistry, pp 1–22. Pergamon Press,Oxford, UK
Brinkman AG, Ens BJ, and Kats R. 2003. Modelling the Energy Budget and Prey Choice ofEider Ducks. Alterra-rapport No. 839. Alterra, Wageningen, The Netherlands
Burger J and Tsipoura N. 1998. Experimental oilings of sanderlings (Calidris alba): Behaviorand weight changes. Environ Toxicol Chem 17(6):1154–8
Burns WA, Mankiewicz PJ, Bence AE, et al. 1997. A principal-component and least-squaresmethod for allocating polycyclic aromatic hydrocarbons in sediments to multiple sources.Environ Toxicol Chem 16(6):1119–31
Butler RG, Harfenist A, Leighton FA, et al. 1988. Impact of sublethal oil and emulsion exposureon the reproductive success of Leach’s Storm Petrels: Short and long-term effects. J ApplEcol 25:125–43
Calkins DG. 1978. Feeding behavior and major prey species of the sea otter, Enhydra lutris, inMontague Strait, Prince William Sound, Alaska. Fish Bull 76(1):125–31
Cavanaugh KP and Holmes WN. 1982. Effects of ingested petroleum on plasma levels of ovar-ian steroid hormones in photostimulated mallard ducks. Arch Environ Contam Toxicol11(4):503–8
Cavanaugh KP and Holmes WN. 1987. Effects of ingested petroleum on the development ofovarian endocrine function in photostimulated ducks (Anas platyrhychos). Arch EnvironContam Toxicol 16(2):247–53
Cavanaugh KP, Goldsmith AR, Holmes WN, et al. 1983. Effects of ingested petroleum on theplasma prolactin levels during incubation and on the breeding success of paired mallardducks. Arch Environ Contam Toxicol 12(2):335–341
Coon NC and Dieter MP. 1981. Responses of adult Mallard Ducks to ingested south Louisianacrude oil. Environ Res 24(2):309–14
Crowley DW. 1999. Productivity of Harlequin Ducks breeding in Prince William Sound,Alaska. In: Goudie RI, Petersen MR, and Robertson GJ (eds), Behaviour and Ecology ofSea Ducks, pp 14–20. Canadian Wildlife Service Occasional Paper Series No. 100. Ottawa,ON, Canada
320 Hum. Ecol. Risk Assess. Vol. 18, No. 2, 2012

Current Risks to Harlequin Ducks
CSL (Central Science Laboratory). 2007. Improved Estimates of Food and Water Intake forRisk Assessment. SID5 Research Project Final Report, PS2330. Department for Environ-ment, Food and Rural Affairs, London, UK
Cummins KW and Wuycheck JC. 1971. Caloric Equivalents for Investigations in EcologicalEnergetics. International Association of Theoretical and Applied Limnology, Stuttgart,Germany
Day RH, Murphy SM, Wiens JA, et al. 1995. Use of oil-affected habitats by birds after the ExxonValdez oil spill. In: Wells PG, Butler JN, and Hughes JS (eds), Exxon Valdez Oil Spill: Fateand Effects in Alaskan Waters, pp 726–61. ASTM Special Technical Publication No. 1219.American Society of Testing and Materials, Philadelphia, PA, USA
Day RH, Murphy SM, Wiens JA, et al. 1997. Effects of the Exxon Valdez oil spill on habitat useby birds in Prince William Sound, Alaska. Ecol Appl 7(2):593–613
de Leeuw JJ, van Eerden MR, and Visser GH. 1999. Wintering Tufted Ducks Aythya fuliguladiving for zebra mussels Dreissena polymorpha balance feeding costs within narrow marginsof their energy budgets. J Avian Biol 30:182–92
de Vries J and van Eerden MR. 1995. Thermal conductance in aquatic birds in relation tothe degree of water contact, body mass, and body fat: Energetic implications of living in astrong cooling environment. Physiol Zool 68(6):1143–63
Dean TA, Bodkin JL, Fukuyama AK, et al. 2002. Food limitation and the recovery of sea ottersfollowing the Exxon Valdez oil spill. Mar Ecol Progr Ser 241:255–70
DeAngelis DL and Gross LJ. 1992. Individual-Based Models and Approaches in Ecology:Populations, Communities and Ecosystems. Chapman and Hall, New York, NY, USA
DeVink JMA, Gilchrist HG, and Diamond AW. 2005. Effects of water salinity on growth andsurvival of Common Eider (Somateria mollissima) ducklings. Auk 122(2):523–9
Di Toro DM and McGrath JA. 2000. Technical basis for narcotic chemicals and poly-cyclic aromatic hydrocarbon criteria: II. Mixtures and sediments. Environ Toxicol Chem19(8):1971–82
Douglas GS, Burns WA, Bence AE, et al. 2004. Optimizing detection limits for the analy-sis of petroleum hydrocarbons in complex environmental samples. Environ Sci Technol38(4):3958–64
Durrell G, Utvik TR, Johnsen S, et al. 2006. Oil well produced water discharges to the NorthSea. Part I. Comparison of deployed mussels (Mytilus edulis), semi-permeable membranedevices, and the DREAM model predictions to estimate the dispersion of polycyclic aro-matic hydrocarbons. Mar Environ Res 62(3):194–223
Dzinbal KA and Jarvis RL. 1984. Coastal feeding ecology of Harlequin Ducks in Prince WilliamSound, Alaska, during summer. In: Marine Birds: Their Feeding Ecology and CommercialFisheries Relationships, pp 6–10. Canadian Wildlife Service Special Publication, Ottawa,ON, Canada
e-CFR (Electronic Code of Federal Regulations). 2009. Title 40 Protection of Environment.Part 300 National Oil and Hazardous Substances Pollution Contingency Plan. AppendixC Swirling Flask Dispersant Effectiveness Test, Revised Standard Dispersant Toxicity Test,and Bioremediation Agent Effectiveness Test. Section 4.6.3.2. GC/MS analysis procedure.Available at http://ecfr.gpoaccess.gov
Eadie JM, Mallory ML, and Lumsden HG. 1995. Common Goldeneye (Bucephala clangula).In: Poole A (ed), The Birds of North America Online, Cornell Lab of Ornithology Ithaca,NY, USA. Available at http://bna.birds.cornell.edu/bna/species/170
Eadie JM, Savard J-P L, and Mallory ML. 2000. Barrow’s Goldeneye (Bucephala islandica). In:Poole A (ed), The Birds of North America Online, Cornell Lab of Ornithology Ithaca,NY, USA. Available at http://bna.birds.cornell.edu/bna/species/548 doi:10.2173/bna.548
Hum. Ecol. Risk Assess. Vol. 18, No. 2, 2012 321

M. A. Harwell et al.
Elliott KH and Gaston AJ. 2008. Mass-length relationships and energy content of fishes andinvertebrates delivered to nestling Thick-billed Murres Uria lomvia in the Canadian Arctic,1981–2007. Marine Ornithology 36(1):25–34
Esler D. 2008. Quantifying Temporal Variation in Harlequin Duck Cytochrome P4501A Induc-tion. Exxon Valdez Oil Spill Trustee Council Restoration Project Final Report (RestorationProject 050777), Centre for Wildlife Ecology, Simon Fraser University, Delta, BC, Canada
Esler D and Iverson SA. 2010. Female harlequin duck winter survival 11 to 14 years after theExxon Valdez oil spill. J Wildlife Manage 74(3):471–8
Esler D, Schmutz JA, Jarvis RL, et al. 2000. Winter survival of adult female Harlequin Ducksin relation to history of contamination by the Exxon Valdez oil spill. J Wildlife Manage64:839–47
Esler D, Bowman TD, Trust KA, et al. 2002. Harlequin Duck population recovery followingthe Exxon Valdez oil spill: Progress, process and constraints. Mar Ecol Progr Ser 241:271–86
Esler D, Trust KA, Ballachey BE, et al. 2010. Cytochrome P450A biomarker indication of oilexposure in harlequin ducks up to 20 years after the Exxon Valdez oil spill. Environ ToxicolChem 29(5):1138–45
Evans M, Hastings NAJ, and Peacock JB. 1993. Statistical Distributions, 3rd edit. John Wiley& Sons, New York, NY, USA
EVOSTC (Exxon Valdez Oil Spill Trustee Council). 2006. Update on Injured Resources andServices 2006. Exxon Valdez Oil Spill Trustee Council, Anchorage, AK, USA
EVOSTC. 2008. Exxon Valdez Hydrocarbon Database. NOAA National Marine Fisheries Ser-vice, Auke Bay Laboratories, Juneau, AK, USA. Available at http://www.afsc.noaa.gov/ABL/Habitat/ablhab exxonvaldez hydrocarbon database.htm
EVOSTC. 2010. Exxon Valdez Oil Spill Trustee Council, 2010 Update. Injured Resourcesand Services, Exxon Valdez Oil Spill Trustee Council, Anchorage, AK, USA. Available athttp://www.evostc.state.ak.us/recovery/status.cfm)
Fischer JB. 1998. Feeding Behavior, Body Condition, and Oil Contamination of WinteringHarlequin Ducks (Histrionicus histrionicus) at Shemya Island, Alaska. M.S. thesis, Universityof Massachusetts, Amherst, MA, USA
Fischer JB and Griffin CR. 2000. Feeding behavior and food habits of wintering HarlequinDucks at Shemya Island, Alaska. Wilson Bull 112(3):318–25
Fletcher GL and Holmes WN. 1968. Observations on the intake of water and electrolytes bythe duck (Anas platyrhynchos) maintained on fresh water and on hypertonic saline. J ExpBiol 49:325–9
Fry DM and Lowenstine LJ. 1985. Pathology of Common Murres and Cassin’s Auklets exposedto oil. Arch Environ Contam Toxicol 14(6):725–37
Fry DM, Swenson J, Addiego LA, et al. 1986. Reduced reproduction of wedge-tailed shearwatersexposed to weathered Santa Barbara crude oil. Arch Environ Contam Toxicol 15(4):453–63
Gaines WL and Fitzner RE. 1987. Winter diet of the Harlequin Duck at Sequim Bay, PugetSound, Washington. Northwest Sci 61(4):213–5
Gentile JH, Harwell MA, van der Schalie W, et al. 1993. Ecological risk assessment: A scientificperspective. J Hazard Mater 35(2):241–53
Gorsline J and Holmes WN. 1982. Ingestion of petroleum by breeding mallard ducks: Someeffects on neonatal progeny. Arch Environ Contam Toxicol 12(2):147–53
Goudie RI and Ankney CD. 1986. Body size, activity budgets, and diets of sea ducks winteringin Newfoundland. Ecology 67(6):1475–82
Goudie RI and Ryan PC. 1991. Diets and morphology of digestive organs of five species of seaducks wintering in Newfoundland. J Yamashina Institute of Ornithology 22(1):1–8
Grebmeier JM and Harrison NM. 1992. Seabird feeding on benthic amphipods facilitated bygray whale activity in the northern Bering Sea. Mar Ecol Progr Ser 80:125–33
322 Hum. Ecol. Risk Assess. Vol. 18, No. 2, 2012

Current Risks to Harlequin Ducks
Guillemette M, Pelletier D, Grandbois JM, et al. 2007. Flightlessness and the energetic cost ofwing molt in a large sea duck. Ecology 88(11):2936–45
Harriman AE. 1967. Laughing gulls offered saline in preference and survival tests. PhysiolZool 40(3):273–8
Harrison CS. 1979. The association of marine birds and feeding gray whales. Condor81(1):93–5
Hartung R and Hunt GS. 1966. Toxicity of some oils to waterfowl. J Wildl Manage 30(3):564–70Harwell MA, Gentile JH, Johnson CB, et al. 2010a. A quantitative ecological risk assessment of
the toxicological risks from Exxon Valdez subsurface oil residues to sea otters at NorthernKnight Island, Prince William Sound, Alaska. Hum Ecol Risk Assess 16(4):727–61
Harwell, MA, Gentile JH, Cummins KW, et al. 2010b. A conceptual model of the natural andanthropogenic drivers and their influence on the Prince William Sound, Alaska, ecosystem.Hum Ecol Risk Assess 16(4):672–726
Hayes MO and Michel J. 1999. Factors determining the long-term persistence of Exxon Valdezoil in gravel beaches. Mar Pollut Bull 38(2):92–101
Hayes MO, Michel J, and Betenbaugh DV. 2010. The intermittently exposed, coarse-grainedgravel beaches of Prince William Sound, Alaska: Comparison with open-ocean gravelbeaches. J Coastal Research 26(1):4–30
Hayward JL and Verbeek NA. 2008. Glaucous-winged Gull (Larus glaucescens). In: Poole A(ed), The Birds of North America Online, Cornell Lab of Ornithology Ithaca, NY, USA.Available at http://bna.cornell.edu/bna/species/059 doi:10.2173/bna.59
HAZMAT (NOAA Hazardous Materials Response and Assessment Division). 1996. AerialObservations of Oil at Sea. HAZMAT Report 96-7, April 1996. National Oceanic andAtmospheric Administration Office of Ocean Resources Conservation and Assessment,Seattle, WA, USA
Hines AH and Loughlin TR. 1980. Observations of sea otters digging for clams at MontereyHarbor, California. Fish Bull 78(1):159–63
Hoffman DJ and Gay ML. 1981. Embrotoxic effects of benzo(a)pyrene, chrysene, and 7,12-dimethylbenz(a)anthracene in petroleum hydrocarbon mixtures in mallard ducks. J Tox-icol Environ Health Part A 7(5):775–87
Holland-Bartels L, Ballachey B, Bishop MA, et al. 1998. Mechanisms of Impact and Poten-tial Recovery of Nearshore Vertebrate Predators, Exxon Valdez Oil Spill Annual Report(Restoration Project 97025), Exxon Valdez Oil Spill Trustee Council, Anchorage, AK, USA
Holmes WN and Cavanaugh KP. 1990. Some evidence for an effect of ingested petroleumon the fertility of the mallard drake (Anas platychynchos). Arch Environ Contam Toxicol19(6):898–901
Holmes WN, Cavanaugh KP, and Cronshaw J. 1978a. The effects of ingested petroleum onoviposition and some aspects of reproduction in experimental colonies of mallard ducks(Anas platyrhynchos). J Reproduction Fertility 54:335–47
Holmes WN, Cronshaw J, and Gorsline J. 1978b. Some effects of ingested petroleum onseawater-adapted ducks (Anas platyrhynchos). Environ Res 17(2):177–90
Holmes WN, Gorsline J, and Cronshaw J. 1979. Effects of mild cold stress on the survival ofseawater-adapted Mallard ducks (Anas platyrhynchos) maintained on food contaminatedwith petroleum. Environ Res 20(2):425–44
Houde M, Hoekstra PF, Solomon KR, et al. 2005. Organohalogen contaminants in delphinoidcetaceans. Rev Environ Contam Toxicol 184:1–57
Huggett RJ, Stegeman JJ, Page DS, et al. 2003. Biomarkers in fish from Prince William Soundand the Gulf of Alaska: 1999–2000. Environ Sci Technol 37(18):4043–51
Integral (Integral Consulting Inc.). 2006. Information Synthesis and Recovery Recommenda-tions for Resources and Services Injured by the Exxon Valdez Oil Spill. Restoration Project060783 Final Report, Exxon Valdez Oil Spill Trustee Council, Anchorage, AK, USA
Hum. Ecol. Risk Assess. Vol. 18, No. 2, 2012 323
M. A. Harwell et al.
Irons DB, Kendall SJ, Erickson WP, et al. 2000. Nine years after the Exxon Valdez oil spill: Effectson marine bird populations in Prince William Sound, Alaska. Condor 102(4):723–37
Iverson SA and Esler D. 2006. Site fidelity and the demographic implications of winter move-ments by a migratory bird, the Harlequin Duck Histrionicus histrionicus. J Avian Biology37(3):219–28
Kaplan IR and Venkatesan MI. 1981. Characterization of Organic Matter in Sediments fromGulf of Alaska, Bering and Beaufort Seas. Final Report to Outer Continental Shelf En-vironmental Assessment Program, US Department of Commerce and US Department ofInterior, Boulder, CO, USA
Kenyon KW. 1961. Birds of Amchitka Island, Alaska. Auk 78:305–26King JG and Sanger GA. 1979. Oil vulnerability index for marine oriented birds. In: Bartonek
JC and Nettleship DN (eds), Conservation of Marine Birds of Northern North America,pp 227–39. Wildlife Research Report No. 11. US Fish and Wildlife Service, Washington,DC, USA
Koth T and Vauk-Hentzelt E. 1988. Influence of plumage and stomach oiling on body andorgan growth in young Kittiwakes. Mar Pollut Bull 19(2):71–3
Kvenvolden KA, Hostettler FD, Rapp JB, et al. 1993. Hydrocarbon in oil residues on beachesof islands of Prince William Sound, Alaska. Mar Pollut Bull 26(1):24–9
Kvitek RG, Fukuyama AK, Anderson BS, et al. 1988. Sea otter foraging on deep-burrowingbivalves in a California coastal lagoon. Mar Biol 98(2):157–67
Landis (Landis Associates Inc). 1985. A Dietary LC50 Study in the Bobwhite Quail with Naph-thalene (Final Report). Report to the US Environmental Protection Agency, EPA/OTS.Doc #86-870000551, Ref ID: 27393. Washington, DC, USA
Leighton FA. 1993. The toxicity of petroleum oils to birds. Environ Rev 1:92–103McKinney RA and McWilliams SR. 2005. A new model to estimate daily energy expenditure
for wintering waterfowl. Wilson Bull 117(1):44–55McKinney RA, Glatt SM, and McWilliams SR. 2004. Allometric length-weight relationships for
benthic prey of aquatic wildlife in coastal marine habitats. Wildlife Biol 10(4):214–49McKnight A, Sullivan K, Irons DB, et al. 2006. Marine Bird and Sea Otter Population Abun-
dance of Prince William Sound, Alaska: Trends Following the T/V Exxon Valdez Oil Spill,1989–2005. Exxon Valdez Oil Spill Restoration Project Annual Report (Restoration Projects040159/050751), Exxon Valdez Oil Spill Trustee Council, Anchorage, AK, USA
Michel J, Nixon Z, and Cotsapas L. 2006. Evaluation of Oil Remediation Technologies forLingering Oil from the Exxon Valdez Oil Spill in Prince William Sound, Alaska. RestorationProject 050778 Final Report. Research Planning Inc., Columbia, SC, USA
Murphy SM, Day RH, Wiens JA, et al. 1997. Effects of the Exxon Valdez oil spill on birds: Com-parisons of pre- and post-spill surveys in Prince William Sound, Alaska. Condor 99(2):299–313
Nagy KA and Peterson CC. 1988. Scaling of water flux rate in animals. University of CaliforniaPublications in Zoology 120:131–72
Nagy KA, Girard IA, and Brown TK. 1999. Energetics of free-ranging mammals, reptiles, andbirds. Ann Rev Nutr 19:247–77
Neff JM. 2002. Polycyclic aromatic hydrocarbons in the ocean. In: Neff JM (ed), Bioaccumu-lation in Marine Organisms, Effects of Contaminants from Oil Well Produced Water, pp241–318. Elsevier Science Publishers, Amsterdam, The Netherlands
Neff JM, Owens EH, Stoker SW, et al. 1995. Shoreline oiling conditions in Prince WilliamSound following the Exxon Valdez oil spill. In: Wells PG, Butler JN, and Hughes JS (eds),Exxon Valdez Oil Spill: Fate and Effects in Alaskan Waters, pp 312–45. ASTM SpecialTechnical Publication No. 1219. American Society of Testing and Materials, Philadelphia,PA, USA
324 Hum. Ecol. Risk Assess. Vol. 18, No. 2, 2012

Current Risks to Harlequin Ducks
Neff JM, Bence AE, Parker KR, et al. 2006. Bioavailability of polycyclic aromatic hydrocarbonsfrom buried shoreline residues thirteen years after the Exxon Valdez oil spill: A multispeciesassessment. Environ Toxicol Chem 25(4):947–61
Nehls G. 1995. Strategien der Ernahrung und ihre Bedeutung fur Energiehaushalt undOkologie der Eiderente. Ph.D. dissertation. University of Kiel, Germany
NOAA (National Oceanic and Atmospheric Administration). 2007. ESI Atlas, Prince WilliamSound, Digital Data Release, April 2007. National Oceanic and Atmospheric Administra-tion, Office of Response and Restoration, Seattle, WA, USA
NRC (National Research Council). 1985. Oil in the Sea. National Academy Press, Washington,DC, USA
Nystrom KGK and Pehrsson O. 1988. Salinity as a constraint affecting food and habitat choiceof mussel-feeding diving ducks. Ibis 130(1):94–110
Page DS, Boehm PD, Douglas GS, et al. 1995. Identification of hydrocarbon sources in thebenthic sediments of Prince William Sound and the Gulf of Alaska following the ExxonValdez oil spill. In: Wells PG, Butler JN, and Hughes JS (eds), Exxon Valdez Oil Spill: Fateand Effects in Alaskan Waters, pp 41–83. ASTM Special Technical Publication No. 1219.American Society of Testing & Materials, Philadelphia, PA, USA
Page DS, Boehm PD, Douglas GS, et al. 1996. The natural petroleum hydrocarbon back-ground in subtidal sediments of Prince William Sound, Alaska, USA. Environ ToxicolChem 15(8):1266–81
Page DS, Boehm PD, Douglas GS, et al. 1999. Pyrogenic polycyclic aromatic hydrocarbons insediments record past human activity: A case study in Prince William Sound, Alaska. MarPollut Bull 38(4):247–60
Page DS, Bence AE, Burns WA, et al. 2002. A holistic approach to hydrocarbon source allo-cation in the subtidal sediments of Prince William Sound, Alaska, embayments. EnvironForensics 3:331–40
Page DS, Huggett RJ, Stegeman JJ, et al. 2004. Polycyclic aromatic hydrocarbon sources relatedto biomarker levels in fish from Prince William Sound and the Gulf of Alaska. Environ SciTechnol 38(19):4928–36
Page DS, Boehm PD, Brown JS, et al. 2005. Mussels document loss of bioavailable polycyclicaromatic hydrocarbons and the return to baseline conditions for oiled shorelines in PrinceWilliam Sound, Alaska. Mar Environ Res 60(4):422–36
Parker KR and Wiens JA. 2005. Assessing recovery following environmental accidents: En-vironmental variation, ecological assumptions, and strategies. Ecol Appl 15(6):2037–51
Patten, SM, Jr., Crowe T, Gustin R, et al. 2000. Assessment of Injury to Sea Ducks from Hydro-carbon Uptake in Prince William Sound and the Kodiak Archipelago, Alaska, Followingthe Exxon Valdez Oil Spill, vol 1, pp 1–167. Bird Study Number 11 Final Report. AlaskaDepartment of Fish and Game, Anchorage, AK, USA
Patton JF and Dieter MP. 1980. Effects of petroleum hydrocarbons on hepatic function in theduck. Comparative Biochem Physiol Part C 65(1):33–6
Peakall DB, Hallett DJ, Bend JR, et al. 1982. Toxicity of Prudhoe Bay crude oil and its aromaticfractions to nestling herring gulls. Environ Res 27(1):206–15
Piatt JF, Lensink CJ, Butler W, et al. 1990. Immediate impact of the “Exxon Valdez” oil spillon marine birds. Auk 107:387–97
Pickford GE. 1964. Spoon, a worm. Encyclopedia Britannica 7:898–901. Available at http://www.stelio.net/archive/sp-worm.html
Portugal SJ, Gree JA, and Butler PJ. 2007. Annual changes in body mass and restingmetabolism in captive barnacle geese (Branta leucopsis): The importance of wing moult. JExp Biol 210:1391–7
Hum. Ecol. Risk Assess. Vol. 18, No. 2, 2012 325

M. A. Harwell et al.
Ricca MA, Miles AK, Ballachey BE, et al. 2010. PCB exposure in sea otters and harlequinducks in relation to history of contamination by the Exxon Valdez oil spill. Mar Poll Bull60(6):861–72
Rice SD, Short JW, Carls MG, et al. 2007. The Exxon Valdez oil spill. In: Spies RB (ed), Long-Term Ecological Change in the Northern Gulf of Alaska, pp 419–520. Elsevier, Amsterdam,The Netherlands
Robert M and Cloutier L. 2001. Summer food habits of Harlequin Ducks in eastern NorthAmerica. Wilson Bull 113(1):78–84
Robertson GJ and Goudie RI. 1999. Harlequin Duck (Histrionicus histrionicus). In: Poole A(ed), The Birds of North America Online, Cornell Lab of Ornithology Ithaca, NY, USA.Available at http://bna.birds.cornell.edu/bna/species/466
Rocke TE, Yuill TM, and Hinsdill RD. 1984. Oil and related toxicant effects on Mallardimmune defenses. Environ Res 33(2):343–52
Rodway MS and Cooke F. 2002. Use of fecal analysis to determine seasonal changes in the dietof wintering Harlequin Ducks at a herring spawning site. J Field Ornithology 73(4):363–71
Rosenberg DH and Petrula MJ. 1998. Status of Harlequin Ducks in Prince William Sound,Alaska, after the Exxon Valdez Oil Spill, 1995–1997, pp 1–64 + appendices. Exxon Valdez OilSpill Restoration Project Final Report (Restoration Project 97427), Exxon Valdez Oil SpillTrustee Council, Anchorage, AK, USA
Rosenberg DH, Petrula MJ, Hill DD, et al. 2005. Harlequin Duck Population Dynamics: Mea-suring Recovery from the Exxon Valdez Oil Spill, pp 1–47. Exxon Valdez Oil Spill RestorationProject Final Report (Restoration Project 040407), Exxon Valdez Oil Spill Trustee Council,Anchorage, AK, USA
Schmidt-Nielsen K and Kim YT. 1964. The effect of salt intake on the size and function of thesalt gland of ducks. Auk 81:160–72
Shimek SJ and Monk A. 1977. Daily activity of sea otters off the Monterey Peninsula, California.J Wildl Manage 41(2):277–83
Short JW and Nelson BD. 1998. Hydrocarbon Data Analysis, Interpretation and DatabaseMaintenance for Restoration and NRDA Environmental Samples Associated with theExxon Valdez Oil Spill. Exxon Valdez Oil Spill Restoration Project Annual Report (Restora-tion Project 97290). National Oceanic and Atmospheric Administration, National MarineFisheries Service, Juneau, AK, USA
Short JW, Kvenvolden KA, Carlson PR, et al. 1999. Natural hydrocarbon background in benthicsediments in Prince William Sound, Alaska: Oil vs coal. Environ Sci Technol 33(1):34–42
Short JW, Lindeberg MR, Harris PM, et al. 2004. Estimate of oil persisting on the beachesof Prince William Sound 12 years after the Exxon Valdez oil spill. Environ Sci Technol38(1):19–25
Short JW, Maselko JM, Lindeberg MR, et al. 2006. Vertical distribution and probability ofencountering intertidal Exxon Valdez oil on shorelines of three embayments within PrinceWilliam Sound, Alaska. Environ Sci Technol 40(12):3723–9
Short JW, Irvine GV, Mann DH, et al. 2007. Slightly weathered Exxon Valdez oil persists on Gulfof Alaska beach sediments after 16 years. Environ Sci Technol 41(4):1245–50
Speakman JR. 1998. The history and theory of the doubly labeled water technique. Am J ClinNutr 68 (Suppl):932S–938S
Stubblefield WA, Hancock GA, Ford WH, et al. 1995a. Acute and subchronic toxicity ofnaturally weathered Exxon Valdez crude oil in mallards and ferrets. Environ Toxicol Chem14(11):1941–50
Stubblefield WA, Hancock GA, Prince HH, et al. 1995b. Effects of naturally weathered ExxonValdez crude oil on mallard reproduction. Environ Sci Technol 14(11):1951–60
Szaro RC, Dieter MP, Heinz GH, et al. 1978. Effects of chronic ingestion of south Louisianacrude oil on mallard ducklings. Environ Res 17(3):426–36
326 Hum. Ecol. Risk Assess. Vol. 18, No. 2, 2012

Current Risks to Harlequin Ducks
Szaro RC, Hensler G, and Heinz GH. 1981. Effects of chronic ingestion of no. 2 fuel oil onmallard ducklings. J Toxicol Environ Health Part A 7(5):789–99
Taylor E and Reimer D. 2008. Oil persistence on beaches in Prince William Sound—A reviewof SCAT surveys conducted from 1989 to 2002. Mar Pollut Bull 56(3):458–74
Trapp JL. 1979. Variation in summer diet of Glaucous-winged Gulls in the western AleutianIslands: An ecological interpretation. Wilson Bull 91(3):412–9
Trust KA, Fairbrother A and , Hopper MJ. 1994. Effects of 7,12-dimethylbenz[A]anthraceneon immune function and mixed-function oxygenase activity in the European starling.Environ Toxicol Chem 13(5):821–30
Trust KA, Esler D, Woodin BR, et al. 2000. Cytochrome P4001A induction in sea ducksinhabiting nearshore areas of Prince William Sound, Alaska. Mar Poll Bull 40(5):397–403
USARMY (US Army). 2000. Standard Practice for Wildlife Toxicity Reference Values. Tech-nical Guide No. 254. US Army Center for Health Promotion and Preventive Medicine,Environmental Health Risk Assessment Program, Washington, DC, USA
USEPA (US Environmental Protection Agency). 1991. EPA Region 3 Guidance on HandlingChemical Concentration Data Near the Detection Limit in Risk Assessments. U.S. Envi-ronmental Protection Agency Region 3, Philadelphia, PA, USA
USEPA. 1992. Framework for Ecological Risk Assessment. EPA/630/R-92/001. Risk Assess-ment Forum, Washington, DC, USA
USEPA. 1993. Wildlife Exposure Factors Handbook, vol I. Office of Development and Re-search, Washington, DC, USA
USEPA. 1998. Guidelines for Ecological Risk Assessment. EPA/630/R-95/002F. Risk Assess-ment Forum, Washington, DC, USA
USEPA. 2001. Test Methods for Evaluating Solid Wastes—Physical and Chemical Methods.Laboratory Methods, vol 1B (SW-846). Office of Solid Waste and Emergency Response,Washington, DC, USA
USEPA. 2005. Guidance for Developing Ecological Soil Screening Levels. OSWER Directive9285.7-55. Office of Solid Waste Emergency Response, Washington, DC, USA
USEPA. 2007. Ecological Soil Screening Levels for Polycyclic Aromatic Hydrocarbons. In-terim Final OSWER Directive 9285.7-78. Office of Solid Waste and Emergency Response,Washington, DC, USA
USFWS (US Fish & Wildlife Service). 2001. Endangered and threatened wildlife and plants;final determination of critical habitat for the spectacled eider. Final rule. 50 CFR 17. FedReg 66(25):9146–85
USGS (US Geological Survey). 2004. Large Earthquakes in the United State and the World.Prince William Sound, Alaska. USGS Earthquake Hazards Program, US Department ofthe Interior, Washington DC, USA. Available at http://neic.usgs.gov/neis/eq depot/usa/1964 03 28.html
Vanglider LD and Peterle TJ. 1980. South Louisiana crude oil and DDE in the diet of mallardhens: Effects on reproduction and duckling survival. Bull Environ Contam Toxicol 25:23–8
Venables WN and Ripley BD. 2002. Modern Applied Statistics with S+ 4th edit. SpringerScience + Business Media, New York, NY, USA
Venkatesan MI. 1988. Occurrence and possible sources of perylene in marine sediments—Areview. Mar Chem 25(1):1–27
Vermeer K. 1983. Diet of the Harlequin Duck in the Strait of Georgia, British Columbia.Murrelet 64:54–7
Wacasey JW and Atkinson EG. 1987. Energy values of marine benthic invertebrates from theCanadian Arctic. Mar Ecol Prog Ser 39:243–50
Walter A and Hughes MR. 1978. Total body water volume and turnover rate in fresh waterand sea water adapted Glaucous-winged gulls, Larus glaucescens. Comp Biochem Physiol A61:233–7
Hum. Ecol. Risk Assess. Vol. 18, No. 2, 2012 327

M. A. Harwell et al.
Wiens JA. 1995. Recovery of seabirds following the Exxon Valdez oil spill: An overview. In: WellsPG, Butler JN, and Hughes JS (eds), Exxon Valdez Oil Spill: Fate and Effects in AlaskanWaters, pp 854–893. ASTM Special Technical Publication No. 1219. American Society ofTesting and Materials, Philadelphia, PA, USA
Wiens JA. 2007. Applying ecological risk assessment to environmental accidents: Harlequinducks and the Exxon Valdez oil spill. BioScience 57(9):769–77
Wiens JA, Crist TO, Day RH, et al. 1996. Effects of the Exxon Valdez oil spill on marine birdcommunities in Prince William Sound, Alaska. Ecol Appl 6(3):828–41
Wiens JA, Day RH, Murphy SM, et al. 2004. Changing habitat and habitat use by birds afterthe Exxon Valdez oil spill, 1989–2001. Ecol Appl 14(6):1806–25
Wiens JA, Day RH, Murphy SM, et al. 2010. Assessing cause-effect relationships in environ-mental accidents: Harlequin Ducks and the Exxon Valdez oil spill. Current Ornithology17:131–189
Wolfe DA, Hameedi MJ, Galt JA, et al. 1994. The fate of the oil spilled from the Exxon Valdez.Environ Sci Tech 28(13):560A–8A
328 Hum. Ecol. Risk Assess. Vol. 18, No. 2, 2012


