Embed Size (px)
Citation preview

ORIGINAL RESEARCH Open Access
Quantitative lung SPECT applied on simulatedearly COPD and humans with advanced COPDPernilla Norberg1*, Hans Lennart Persson2, Gudrun Alm Carlsson3, Björn Bake4, Magnus Kentson5,Michael Sandborg1 and Agnetha Gustafsson6
Abstract
Background: Reduced ventilation in lung regions affected by chronic obstructive pulmonary disease (COPD),reflected as inhomogeneities in the single-photon emission computed tomography (SPECT) lung image, iscorrelated to disease advancement. An analysis method for measuring these inhomogeneities is proposed in thiswork. The first aim was to develop a quantitative analysis method that could discriminate between Monte Carlosimulated normal and COPD lung SPECT images. A second aim was to evaluate the ability of the present methodto discriminate between human subjects with advanced COPD and healthy volunteers.
Methods: In the simulated COPD study, different activity distributions in the lungs were created to mimic thehealthy lung (normal) and different levels of COPD. Gamma camera projections were Monte Carlo simulated,representing clinically acquired projections of a patient who had inhaled 125 MBq 99mTc-Technegas followed by a10-min SPECT examination. Reconstructions were made with iterative ordered subset expectation maximisation. Thecoefficient of variance (CV) was calculated for small overlapping volumes covering the 3D reconstructed activitydistribution. A CV threshold value (CVT) was calculated as the modal value of the CV distribution of the simulatednormal. The area under the distribution curve (AUC), for CV values greater than CVT, AUC(CVT), was then calculated.Moreover, five patients with advanced emphysema and five healthy volunteers inhaled approximately 75 MBq99mTc-Technegas immediately before the 20-min SPECT acquisition. In the human study, CVT was based on themean CV distribution of the five healthy volunteers.
Results: A significant difference (p < 0.001) was found between the Monte-Carlo simulated normal and COPD lungSPECT examinations. The present method identified a total reduction of ventilation of approximately 5%, not visibleto the human eye in the reconstructed image. In humans the same method clearly discriminated between the fivehealthy volunteers and five patients with advanced COPD (p < 0.05).
Conclusions: While our results are promising, the potential of the AUC(CVT) method to detect less advanced COPDin patients needs further clinical studies.
Keywords: Quantitative lung SPECT; Ventilation; Iterative reconstruction; Lung disorder; Monte Carlo; COPD
BackgroundChronic obstructive pulmonary disease (COPD) is cha-racterised by obstructed airways and parenchymal destruc-tion. Characteristically, varying degrees of abnormalitiesare found in different parts of the COPD lung, and someparts of the lung may even be normal. Consequently,
abnormal ventilation distribution is the first abnormalityto be detected in the early stages of the disease [1].COPD starts with inflammation and obstruction in
peripheral airways [2,3] where the resistance is very low[4]. Therefore, conventional lung function tests (spiro-metry) are insensitive [5]. Imaging techniques primarilyaim at localising lesions, but as these techniques becomedigital, new interpretative possibilities are now arising. Byusing high-resolution computed tomography (HRCT),mild emphysema may be assessed by quantification of thedensity distribution [6]. Although computed tomography
* Correspondence: [email protected] of Medical and Health Sciences, Linköping University, andCenter for Medical Image Science and Visualization, and Medical RadiationPhysics, County Council of Östergötland, SE-581 85, Linköping, SwedenFull list of author information is available at the end of the article
© 2013 Norberg et al.; licensee Springer. This is an Open Access article distributed under the terms of the Creative CommonsAttribution License (http://creativecommons.org/licenses/by/2.0), which permits unrestricted use, distribution, and reproductionin any medium, provided the original work is properly cited.
Norberg et al. EJNMMI Research 2013, 3:28http://www.ejnmmires.com/content/3/1/28

is an excellent method for identifying anatomical changesin the lung tissue, it provides little information about lungfunction reduction [6]. In contrast, lung function reduc-tion is both imaged and assessed directly by lung single-photon emission computed tomography (lung SPECT), amethod often used in diagnosis of pulmonary embolism[7,8]. Hence, previous reports have described ventilationand perfusion SPECT as a sensitive method of detectingearly changes in COPD [9]. Moreover, SPECT findingscorrelate significantly with emphysema scored by HRCTand lung function tests [9].It is common to interpret lung SPECT images qualita-
tively. However, quantitative information obtained froma SPECT examination has the potential to provide muchmore information. Different quantitative methods forassessment of lung SPECT images have been reported[10-16]. Xu et al. [11] quantified inhomogeneities in ven-tilation SPECT images of COPD patients using 50 MBqof Technegas (Vita Medical Limited, Sydney, Australia),measuring the coefficient of variance (CV) in the lungelements. In that study, transaxial SPECT slices (1-cmthickness with 3.5-cm spacing) were acquired using a low-energy, general-purpose collimator, filtered back-projectionwith non-homogeneous attenuation correction and a 2DHann post-filter. These were then divided into 2 × 2 × 1cm3 elements. By that method, it was possible to separatenon-smoking healthy subjects and ‘healthy smokers’ fromCOPD patients. Importantly, however, that method wasnot sensitive enough to discriminate between healthynon-smokers and healthy smokers. Our overall aim is todevelop a quantitative method sensitive enough to discri-minate between these two groups. Therefore, the presentstudy is currently followed by a larger clinical study eva-luating the ability of the method used in this paper todifferentiate between healthy non-smokers and healthysmokers.The present study had two aims. Firstly, we wanted to
develop a quantitative method using Monte Carlo simu-lated lung SPECT images of phantom lungs that coulddiscriminate between uniform (healthy, simulated normal)and non-uniform (non-healthy, simulated COPD) activitydistributions corresponding to COPD lung changes ofvarying severity. Secondly, we wished to evaluate theability of the same method in a clinical environment todifferentiate between human subjects with advancedCOPD and healthy volunteers.
MethodsLung phantom and Monte Carlo simulationsThe NCAT phantom [17] with a lung volume (air, bloodand parenchyma) of 4.2 litres was used. The lungvolume corresponded to a 65-year-old male (70 kg,180 cm) in a supine position and in the middle of the re-spiratory cycle [18,19]. The arms were held over the
head (see Figure 1). The respiratory motion and heart-beat of the phantom were employed throughout thestudy, i.e. the phantom was dynamic. The phantomconsisted of a 256 × 256 × 256 matrix with a voxel sizeof 1.65 × 1.65 × 1.65 mm3. Muscle, fat, lung, spine bone,rib bone, blood and heart tissues were selected. Thedensities and elemental compositions of these tissueswere obtained from ICRP 89 [20] and the photon inter-action cross sections from Berger et al. [21].The simulated healthy distribution, in the following
called normal, was represented by a homogeneous activitydistribution in the phantom lung (the ‘uniform’ distribu-tion). Simulated COPD lung changes of varying severitywere represented by eight different non-homogeneousactivity distributions. Small spherical lesions were chosento create inhomogeneous ventilation distributions. Thesedistributions are defined in Table 1. The activity concen-trations in the lesions were 50%, 25% or 0% of the healthysurrounding lung tissue. The reduced activity levels in thelesions reflect the magnitude of the reduced ventilation.No activity was located elsewhere in the body. The densityof the lesions was the same as for the lung. In Table 1,coronal slices are shown including motion artefacts toillustrate the distributions observed by the gamma cameraduring projection acquisition.SPECT projections from these activity distributions
were Monte Carlo simulated using the software SIMIND,version 4.9d [21,22]. The projection data incorporated the
Figure 1 A cross-section of the phantom visualising selectedtissues, respiratory motion and heartbeat. A coronal slice of thephantom in units of linear attenuation coefficients, together with usedgrey scale ranging from μ = 0 cm−1 as black to μ = 0.219 cm−1 as white.
Norberg et al. EJNMMI Research 2013, 3:28 Page 2 of 12http://www.ejnmmires.com/content/3/1/28

Table 1 Phantom activity distribution notations and their descriptions
Distributionnotation
Coronal slice Number Distribution description Total reductionof ventilation (%)
Simulated normal Uniform 1 Homogeneous activity distribution 0
Simulated COPD 1 cm50% 10% evenly 2 Lesions with a diameter of 1 cm with 50%activity concentration, evenly distributedover the lung volume, occupying 10% ofthe total lung volume.
5
1 cm50% 12% centred 3 Lesions with a diameter of 1 cm with 50%activity concentration, centred to the largebronchial tubes, occupying 12% of the totallung volume.
6
1 cm0% 10% evenly 4 Lesions with a diameter of 1 cm with 0%activity concentration, evenly distributedover the lung volume, occupying 10% ofthe total lung volume.
10
1 cm0% 12% centred 5 Lesions with a diameter of 1 cm with 0%activity concentration, centred to the largebronchial tubes, occupying 12% of the totallung volume.
12
2 cm50% 10% evenly 6 Lesions with a diameter of 2 cm with 50%activity concentration, evenly distributedover the lung volume, occupying 10% ofthe total lung volume.
5
2 cm0% 10% evenly 7 Lesions with a diameter of 2 cm with 0%activity concentration, evenly distributedover the lung volume, occupying 10% ofthe total lung volume.
10
2 cm50% 48% evenly 8 Lesions with a diameter of 2 cm with 50%activity concentration, evenly distributedover the lung volume, occupying 48% ofthe total lung volume.
24
2 cm25% 48% evenly 9 Lesions with a diameter of 2 cm with 25%activity concentration, evenly distributedover the lung volume, occupying 48% ofthe total lung volume.
36
Coronal slices of the phantom include simulated motion artefacts.
Norberg et al. EJNMMI Research 2013, 3:28 Page 3 of 12http://www.ejnmmires.com/content/3/1/28

effects of non-uniform attenuation, scatter and motionblurring. The isotope 99mTc was used and the energy win-dow was set between 130 and 154 keV. The gamma camerarotation orbit was non-circular, corresponding to the auto-contouring system used in our clinic. The centre of rotationto collimator distance varied between 17 and 25 cm.Simulations were made for a GE Infinia gamma camera
(9.5-mm thick NaI detector) equipped with a low-energyhigh-resolution collimator (LEHR). Projections were col-lected at 128 different angles, equally spaced, over 360°, in128×128 matrices (3.30 × 3.30 mm2 per detector element).A total of 1.8 × 10¹⁰ photons were simulated with thehomogeneous activity concentration (the simulated normal)resulting in projections with very low noise levels. The coef-ficient of variance CV (see Equation 1 in Additional file 1)of one pixel element within the high-count area of the lungin one single projection determined from three consecutivesimulations was 0.5%.
Normalisation and statistical noiseThe aim of generating low-noise projections was to beable to adjust the mean number of total counts to thatrepresentative of a clinical study, and to generatePoisson noise [23,24] typical of realistic projections. Themean number of counts in the simulated projectionswas set to 3.635 × 10⁶. This value was based on a virtualadministered activity of 125 MBq for each activity distri-bution, an acquisition time of 10 s per projection andthe average sensitivity (cps MBq−1) of 20 planar lungperfusion studies at Linkoping University Hospitalperformed in 2009. The acquisition parameters usedthen were the following: 99mTc macro-aggregated albu-min, LEHR collimator and an energy window of 130-154keV. Before reconstruction, the mean number of countsin individual pixel elements in the projections was re-placed by random deviates drawn from a Poissondistribution.
For each activity distribution, 20 noise realisationswere created, imitating 20 SPECT acquisitions of thesame activity distribution. The CV value of one pixelelement within the high-count area of the lung in oneprojection, based on the 20 noise realisations of the sim-ulated normal, was about 15%.
Human subjects and their data acquisitionThe patient group consisted of five grade 3 (FEV1/VC <0.70, 30% ≤ FEV1 < 50% of predicted) and 4 (FEV1/VC <0.70, FEV1 < 30% of predicted) [25-27] COPD patients(P1 to P5), registered at the department of PulmonaryMedicine, Linkoping University Hospital, all with ad-vanced emphysema demonstrated on HRCT. Meanvalues ± 1 SD (expressed as percentage of predictedvalues) for vital capacity (VC), residual volume (RV),total lung capacity (TLC) and the diffusion capacity ofthe lung for carbon monoxide (DLCO) for the patientgroup were 84 ± 8, 211 ± 39, 127 ± 9 and 38 ± 7, re-spectively. The group of healthy volunteers consisted offive (H1 to H5) life-long non-smokers (>40 years old,FEV1 >80% predicted), without history of allergy. Ob-struction was defined as FEV1/VC < 0.7 for ages <65years and <0.65 for ages ≥65 years according to theSwedish guidelines for COPD [28]. Corresponding meanvalues ± 1 SD for the volunteer group were 104 ± 11,126 ± 10, 110 ± 8 and 99 ± 16, respectively. All humansubjects were included after informed and writtenconsent were obtained. Additional characteristics of thesubjects are presented in Table 2. The regional EthicsReview Board at the University of Linkoping approvedthe study protocol.Technetium (99mTc) was generated (Covidien, Dublin,
Ireland) and thereafter Technegas was prepared anddelivered from the Technegas generator according to themanufacturer’s instructions. Starting from functionalresidual capacity, subjects inhaled a deep breath of
Table 2 Subjects’ gender, age, FEV1, FEV1/VC and AUC(CVT)
Subject Label Gender Age (years) FEV1 (% predicted) FEV1/VC AUC(CVT) (%)
Healthy volunteers H1 F 51 132 0.85 52
H2 F 68 98 0.77 75
H3 M 75 122 0.73 57
H4 M 69 89 0.69 72
H5 M 50 111 0.83 71
Patients P1 M 81 43 0.33 99
P2 M 84 30 0.25 100
P3 F 71 22 0.21 100
P4 F 73 51 0.43 100
P5 F 52 28 0.30 100
FEV1, forced expiratory volume in one second (% predicted; predicted normal values according to Hedenstrom [26,27]), obstruction was defined as FEV1/VC < 0.7for ages <65 years and <0.65 for ages ≥65 years according to the Swedish guidelines for COPD [28], AUC(CVTc, area under the curve defined by the CVT value (fordetails see ‘Methods’).
Norberg et al. EJNMMI Research 2013, 3:28 Page 4 of 12http://www.ejnmmires.com/content/3/1/28
Technegas and hold their breath for 2 to 5 s and thenexpired. This manoeuvre was repeated until approxi-mately 75 MBq 99mTc (according to the gamma camera)had been deposited in the lungs. The subjects inhaledthe gas in a supine position immediately before the ven-tilation SPECT acquisition in the same position. Thedata was acquired using a double-headed gamma camera(GE Infinia, Milwaukee, WI, USA) with a LEHR collima-tor. There were 120 projections (20 s each) equallyspaced over 360°, and each projection was a 128 × 128element matrix with a pixel size of 3.45 × 3.45 mm2.Auto-contouring and a 130 to 154 keV energy windowwere employed. The CV value of the two regions ofinterest (3 × 3 pixels) within the high-count area of thelung in two projections, based on the five healthy volun-teers, was about 17%, consistent with the result of thesimulated normal.After the SPECT acquisition, without moving the pa-
tient, a low-dose CT examination was performed usingthe X-ray equipment mounted on the gamma camera(Hawkeye, GE Infinia, Milwaukee, WI, USA).The effective dose for this protocol is estimated to be
3.1 mSv (1.1 mSv for SPECT [29] and 2 mSv for CT),which required a total acquisition time of 25 min.
SPECT reconstruction and filteringEach set of 20 noisy projections in the simulated COPDstudy and subject projections in the human study wasreconstructed using the iterative ordered subset expec-tation maximisation reconstruction software developedat Johns Hopkins University, Baltimore, MD, USA.The reconstruction included correction for attenuation,scatter and collimator detector response (CDR). In thesimulated COPD study, the phantom attenuation wascorrected for using an attenuation map of the phantom,and in the human study the CT scans were used forattenuation correction. Scatter correction was performedusing the effective source scatter estimation (ESSE)[23,30]. The ESSE model requires scatter kernel files,
which were generated using Monte Carlo simulationswith SIMIND. An analytic geometrical model for CDRcompensation was used. Reconstructions were performedusing ten iterations and 16 subsets. The side length of avoxel in a reconstructed image was for the simulatedCOPD study and human study with 3.30 mm and 3.45mm respectively. The reconstructed images were post-filtered with a Butterworth filter [31] with a cut-off fre-quency of 0.5 cm−1 and a power of 6 (i.e. order 3).
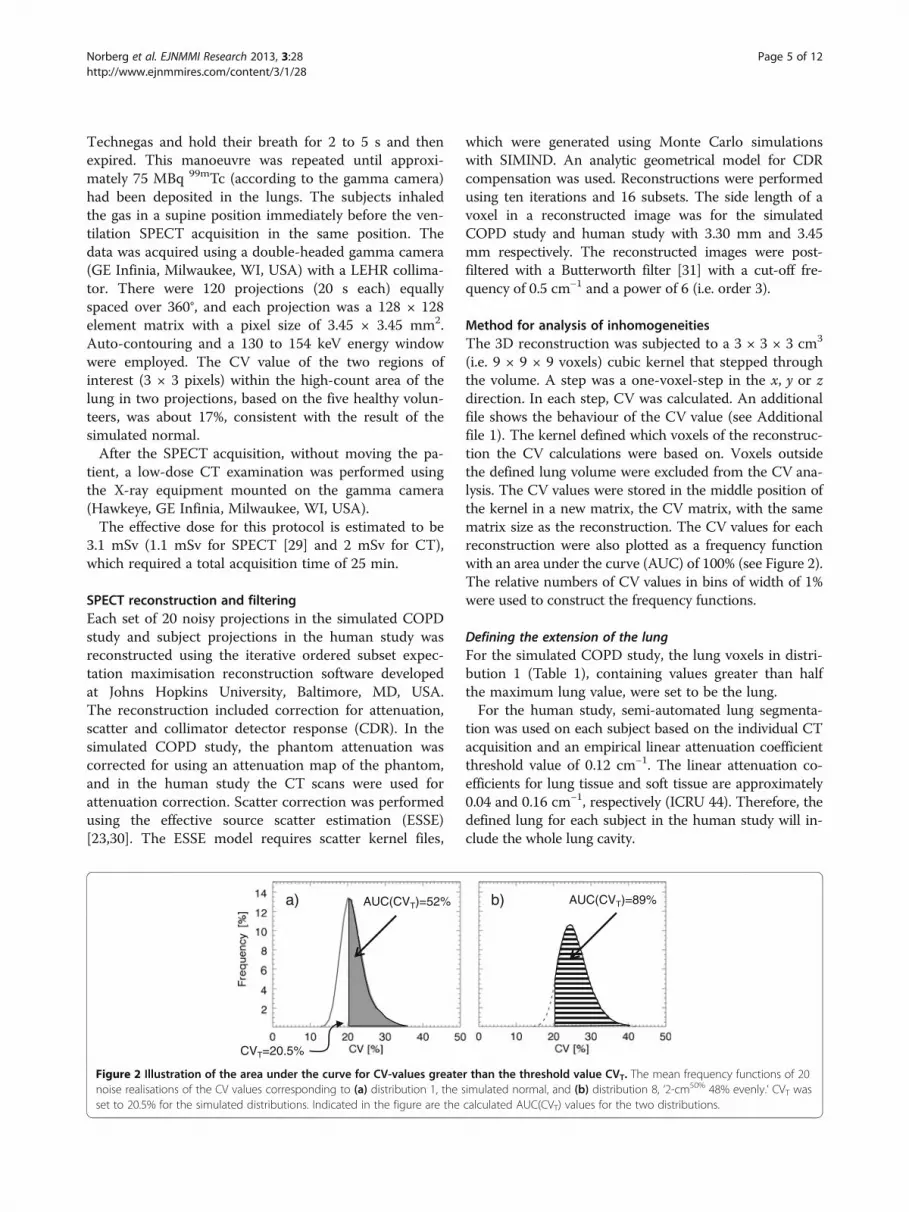
Method for analysis of inhomogeneitiesThe 3D reconstruction was subjected to a 3 × 3 × 3 cm3
(i.e. 9 × 9 × 9 voxels) cubic kernel that stepped throughthe volume. A step was a one-voxel-step in the x, y or zdirection. In each step, CV was calculated. An additionalfile shows the behaviour of the CV value (see Additionalfile 1). The kernel defined which voxels of the reconstruc-tion the CV calculations were based on. Voxels outsidethe defined lung volume were excluded from the CV ana-lysis. The CV values were stored in the middle position ofthe kernel in a new matrix, the CV matrix, with the samematrix size as the reconstruction. The CV values for eachreconstruction were also plotted as a frequency functionwith an area under the curve (AUC) of 100% (see Figure 2).The relative numbers of CV values in bins of width of 1%were used to construct the frequency functions.
Defining the extension of the lungFor the simulated COPD study, the lung voxels in distri-bution 1 (Table 1), containing values greater than halfthe maximum lung value, were set to be the lung.For the human study, semi-automated lung segmenta-
tion was used on each subject based on the individual CTacquisition and an empirical linear attenuation coefficientthreshold value of 0.12 cm−1. The linear attenuation co-efficients for lung tissue and soft tissue are approximately0.04 and 0.16 cm−1, respectively (ICRU 44). Therefore, thedefined lung for each subject in the human study will in-clude the whole lung cavity.
AUC(CVT)=52%
CVT=20.5%
a) b) AUC(CVT)=89%
Figure 2 Illustration of the area under the curve for CV-values greater than the threshold value CVT. The mean frequency functions of 20noise realisations of the CV values corresponding to (a) distribution 1, the simulated normal, and (b) distribution 8, ‘2-cm50% 48% evenly.’ CVT wasset to 20.5% for the simulated distributions. Indicated in the figure are the calculated AUC(CVT) values for the two distributions.
Norberg et al. EJNMMI Research 2013, 3:28 Page 5 of 12http://www.ejnmmires.com/content/3/1/28

Edge layersDue to the limited spatial resolution of the SPECT system,with a full width at half maximum (FWHM) of about 1 to1.5 cm, the reconstructed activity distribution around theedge of the lung will be blurred. Voxels involved in thelung edge will result in high CV values, which are not ne-cessarily correlated to inhomogeneity of the lung activitydistribution. Therefore, a one-voxel-wide layer of the lungwas ‘peeled off ’ from the periphery of the segmented lung,thereby creating a reduced lung volume with most of thisedge effect excluded.
Threshold values and area under curveThe area under the frequency function (AUC) for CVvalues greater than a threshold value for CV, called CVT,was defined as AUC(CVT) and expressed as the percent-age of the total AUC (Figure 2). Since the future aim isto discriminate between healthy distributions and lesssevere COPD distributions, the optimal CVT value wasevaluated by finding the largest separation between cor-responding AUC(CVT) values for the healthy ‘uniform’and the ‘1-cm50% 10% evenly’ distributions (distributions1 and 2 in Table 1) in the simulated COPD study. CVT
values ranging from 1% to 25% were evaluated. Thelargest separation was found for the CV value corre-sponding to the peak value of the mean frequency func-tion of the healthy distributions, i.e. the modal value,plus about 1%. The modal value was used for simplicity.In the simulated COPD study, the healthy mean fre-
quency function is based on the 20 noise realisations ofthe uniform activity distribution; and in the humanstudy, it is based on the activity distributions of the fivehealthy volunteers. AUC(CVT) was then calculated forall activity distributions in both the simulated COPDstudy and the human study.In the simulated COPD study, the group of 20 AUC
(CVT) values, based on the 20 noise realisations of the
simulated normal distribution, was compared with the cor-responding groups of simulated COPD distributions, usingthe non-parametric Mann–Whitney U test and Statistica(version 9, StatSoft, Tulsa, Oklahoma, USA). This test wasused because no assumption of normal distributions wasmade. The same test was performed comparing the fiveCOPD patients with the five healthy volunteers.
Image and computer processingThe addition of Poisson noise, post-filtration and evalu-ation were performed using in-house software developedin Interactive Data Language (IDL; ITT Visual Informa-tion Solutions, Boulder, CO, USA).
Results and discussionResults of the Monte Carlo-simulated COPD studyThe AUC(CVT) was calculated for all simulated activitydistributions using a CVT = 20.5%, as illustrated inFigure 2. Figure 3 shows that the AUC(CVT) valuesfor all simulated COPD distributions tested [reflectingCOPD changes of different severity (distributions 2 to9)] can be separated statistically from the correspondingvalue of the simulated normal distribution of the healthylung (distribution 1). The mean AUC(CVT) value for thesimulated normal distribution is 52% ± 1% (95% confi-dence interval (CI)). For simulated COPD distributionswith lesions with a diameter of 1 cm, correspondingvalues range from 58% to 65%, and for lesions with adiameter of 2 cm, from 82% to 100%. Comparing AUC(CVT) values for distributions with the same lesion sizeand localisation but different activity levels (i.e. compar-ing the distributions 2 with 4, 3 with 5, 6 with 7 and 8with 9) shows that the one with the lowest activity levelin the lesions has the highest AUC(CVT) value with oneexception. For distributions 3 and 5, no difference inAUC(CVT) values are found. There is a statisticallysignificant difference (n1 = n2 = 20, p < < 0.001, two-
Figure 3 The mean AUC(CVT) value for each activity distribution as listed in Table 1. The dark grey bars show simulated normal, and thelight grey bars show simulated COPD. Bars with dashed outline correspond to clustered distributions. The total reduction of ventilation for eachdistribution is written in the bars. The error bars show a 95% CI, based on the 20 noise realisations.
Norberg et al. EJNMMI Research 2013, 3:28 Page 6 of 12http://www.ejnmmires.com/content/3/1/28

tailed) between the AUC(CVT) values for the 20 noiserealisations of distribution 1 (the simulated normal) anddistribution 2 (1 cm50% 10% evenly). Comparing AUC(CVT) values for distributions with the same lesion sizeand activity levels but different localisation shows adifference between distributions 2 and 3 (with a totalreduction of ventilation of 5% and 6% respectively, p <0.002), but not between 4 and 5 (with a total reductionof ventilation of 10% and 12% respectively).Figure 4 shows that the differences shown in
Figure 3 are due to shifts of the frequency functions,i.e. the proportion of high CV values is higher for thesimulated COPD distributions compared to the simu-lated normal. The frequency function of the clustereddistribution 5 (1 cm0% 12% centred) has a larger pro-portion of high CV values compared to the ‘evenly’distributions (see Figure 4). For the clustered distribu-tion 3 (1 cm50% 12% centred) this tale towards highCV values is less pronounced, and its frequency func-tion is in between distribution 4 (1 cm0% 10% evenly)and 5.Figures 3 and 4 show that with the presented
method we can identify a ventilation reduction notvisible to the human eye in the reconstructed images,as shown in Figure 5 (row 2, column B). The CVvalues corresponding to evenly distributed 1 cm le-sions are relatively constant (rows 2 and 3, columnC) compared to the CV values corresponding toevenly distributed 2 cm lesions (distribution 7 row 5,column C) where the surfaces of the lesions are vis-ible. The CV matrix for the clustered distributionclearly shows the surface of the cluster (distribution 5
row 4, column C). Due to the limited number ofcounts in the acquired projections there are fluctua-tions inside the lung even for the simulated normal.Notably, respiratory motions give rise to higher CVvalues at the base of the lung compared to the apex(column C), and, consequently, are not a result of re-duced ventilation.
Results of the human studyFigure 6 shows that the mean AUC(CVT) value for thehealthy volunteers was 65% ± 13% (95% CI), while themean AUC(CVT) value for the patients was 100% ± 1%(95% CI). There was a statistical significant difference(n1 = n2 = 5, p <0.05, two-tailed) between the AUC(CVT) values for the volunteers and the patients.The in vivo study also shows the expected substantial
difference between the healthy volunteers and the pa-tient group when all CV frequency functions aresummarised, Figure 7a. The curves of the healthy volun-teers are gathered to the left on the abscissa and aremore peaked in shape compared to the correspondingcurves of the patients, which are shifted more to theright on the abscissa and are wider in shape. In Figure 7b,the mean CV curve of all five healthy volunteers isshown, from which a CV threshold value, CVT = 22%, isobtained. The calculated AUC(CVT) values of all humansubjects are summarised in Table 2.Figure 8 shows reconstructed images and CV matrices
for healthy volunteer H3 and patient P3. Notably,while the healthy volunteers all demonstrate high CVvalues in the lung bases due to respiratory motions,this was not observed in patients (column C), prob-ably because of restricted movement of the diaphragm.Patients with advanced emphysema are expected todemonstrate hot spots in their ventilation distribu-tions. Cubic-shaped areas with the size of the cubickernel could be seen around the hot spots, and thesecontributed to the wide distribution of the frequencyfunctions of the patients (see Figure 7a). However, alsoin volumes without hot spots, higher CV values werefound in the patients than in the healthy volunteers.
DiscussionIn the present study, we have modified a method by Xuet al. in order to improve the quantification of ventila-tion inhomogeneities in a phantom model of a COPDlung. In contrast to what has been previously reported,our improved method was able to assess even minorCOPD changes by using the AUC(CVT) value, as aglobal value of ventilation inhomogeneities, and todiscriminate these changes from a model of a healthyhomogeneous lung. The present pilot study also showsthat our way of performing lung SPECT and calculating
Figure 4 Frequency functions of the CV- values for simulateddistributions. The mean frequency functions of 20 noise realisationsof the CV values corresponding to distribution 1, the simulatednormal (solid line); distribution 4, ‘1 cm0% 10% evenly’ (dash-dotted);distribution 5, ‘1 cm0% 12% centred’ (dash-dot-dot-dotted); anddistribution 8, ‘2 cm50% 48% evenly’ (dashed).Only four curves out ofnine are shown for clarity.
Norberg et al. EJNMMI Research 2013, 3:28 Page 7 of 12http://www.ejnmmires.com/content/3/1/28

the AUC(CVT) significantly discriminates non-smokinghealthy volunteers from patients with advanced COPD.The NCAT software is able to create thorax voxel
phantoms of a human, based on a fine-segmented male[32]. The NCAT software is flexible since different sizesand shapes of different tissues can be selected andnatural movements caused by heartbeat and respirationcan be modelled. Because most of the COPD patientsare elderly [33], we decided to use a lung volume corre-sponding to a 65-year-old male. Low-ventilated regions,associated with anatomical changes of COPD, are dis-tributed in patients in various ways, and these volumescan vary between 0.5 mm (the size of a few alveoli) andseveral centimetres in diameter. One of the aims of thepresent study was to mimic mild to moderate changes ofCOPD, and therefore small lesions were of interest.Since the spatial resolution of the SPECT system isabout 1 to 1.5 cm (expressed in FWHM), the lesions
Figure 6 The mean AUC(CVT) for the human in vivo study witherror bars representing the 95% CI.
7
A B C
1
2
4
5
0% 180%
Figure 5 Reconstructed images and CV matrices for simulated distributions. Each row shows coronal slices based on the activitydistributions 1, 2, 4, 5 and 7 in Table 1, (A); the activity distribution, (B); a filtered reconstruction and, (C); corresponding CV matrix.
Norberg et al. EJNMMI Research 2013, 3:28 Page 8 of 12http://www.ejnmmires.com/content/3/1/28

modelled had a diameter of 1 and 2 cm. Lacking previ-ous studies on the distribution of ventilation inhomoge-neities in mild COPD, we assumed that COPD lesionsare either evenly distributed in the whole lung volumeor centred in clusters (see Table 1). In this way, ourmethod was evaluated on two groups with completelydifferent lesion distributions. The density of the lesionswas approximated to be the same as for the healthy lungtissue since we aimed to model less severe changes ofCOPD. Indeed, activity distribution 1 cm50% 10% (distri-bution 2 in Table 1) illustrates activity inhomogeneitiesthat are almost too small for the SPECT system to re-solve, and, clearly, not visible to the human eye in thereconstructed image (cf. Figure 5). Thus, we believe thisdistribution would be a good representative of a case ofmild COPD. However, it should be pointed out that theactivity distributions selected in the different cases werenot primarily chosen because of their consistency with
biology, but more because of our ability to unambigu-ously describe them.How does the magnitude of the present volume of ven-
tilation defects compare to reductions of spirometric vari-ables? Fifty percent reduction of the ventilation in 10%of the lung volume (distributions 2 and 6 in Table 1)corresponds to the 5% total reduction of the functioninglung tissue. Although not exactly comparable, reductionsof spirometric variables of similar magnitudes are likelyto remain undetected, as the normal range of spiromet-ric variables is roughly ±15% to 20%. Thus, in our an-thropomorphic phantom, we consider most of the presentvolume of ventilation defects as comparatively small.When considering the result of the presented quantita-
tive method, a number of important parameters have tobe accounted for, e.g. count density (statistical noise),collimator, number of iterations and subsets, reconstruc-tion compensations and post-filtering. In this work we
A B C
H3
P3
0% 180%
Figure 8 Reconstructed images and CV matrices for healthy volunteer H3 and patient P3. One row for healthy volunteer H3 and one rowfor patient P3, showing (A); coronal slices of the attenuation map, (B); a filtered reconstruction and, (C); corresponding CV matrix.
Figure 7 Frequency functions of the CV values for the human study. (a) The frequency functions of the CV values corresponding to healthysubject H1 (solid line), H2 (dotted), H3 (dashed), H4 (dash-dotted), H5 (dash-dot-dotted), and patients with bold line styles; P1 (solid line); P2(dotted); P3 (dashed); P4 (dash-dotted); P5 (dash-dot-dotted). (b) An expanded view of the frequency functions for the healthy subjects and theirmean frequency function (bold line with open circles). The arrow shows the CV threshold value for the human study at 22%.
Norberg et al. EJNMMI Research 2013, 3:28 Page 9 of 12http://www.ejnmmires.com/content/3/1/28

used clinically relevant values for these parameters. Otherimportant factors are the method-specific ones, i.e. thelung edge effects and kernel size that we evaluated. Theresolution of the SPECT system is limited, and therefore,high CV values will always be found in the periphery ofthe healthy lung. Lung edges with low activity lesions willinstead give lower CV values. High CV values due tohealthy edges reduce the differences between frequencyfunctions from healthy and unhealthy activity distribu-tions; i.e. they also reduce the separation between corre-sponding AUC(CVT) values. Therefore, the CV analysiswas performed in a volume that had part of the edge effectexcluded. Exclusion of a one-voxel layer, however, removes21% of the phantom lung and 20% to 29% of the humanlung parenchyma from the analysis, which is why smalllesions in the periphery might not be detected. The kernelapproach used does not exclude any additional volume ofthe lung in the analysis. Kernels with five different sidelengths were evaluated in the simulated COPD study, i.e.1.0, 1.7, 2.3, 3.0, 3.6 and 4.3 cm. Increasing the side lengthresulted in an increasing differentiation between the AUC(CVT) values of the simulated normal and 1 cm50% 10%evenly distribution (distributions 1 and 2 in Table 1).However, for the two largest cube sizes tested, in combin-ation with some values of the above-mentioned parame-ters (e.g. LEHR collimator, a Butterworth post-filter with acut-off frequency of 0.3 cm−1 and a power of 6, 125 MBq,ten iterations and 16 subsets and no exclusion of edgevoxels), the CV frequency functions of the simulated nor-mal distribution were double peaked. Therefore, to minim-ise the risk of double peaks in a clinical setting, we chose akernel with the side length of 3 cm, including 729 voxels.The present method of quantitative analysis has two
major advantages. Firstly, it discriminates cases with thesame loss of ventilation, but with inhomogeneities differ-ently distributed and with different lesion sizes, from thesimulated normal lung, even when COPD changes areminor. For example, distributions 2 (1 cm50% 10% evenly),3 (1 cm50% 12% centred) and 6 (2 cm50% 10% evenly) inFigure 3 all represent only a 5% to 6% total reduction ofventilation, but their resulting AUC(CVT) values are wellabove the value of the normal lung. The same holds truefor distributions 4 (1 cm0% 10% evenly), 5 (1 cm0% 12%centred) and 7 (2 cm0% 10% evenly), which all correspondto a 10% to 12% total reduction of ventilation. Secondly,for the same lesion size, increasing AUC(CVT) values tendto correlate with decreasing total ventilation. For example,distribution 6 (2 cm50% 10% evenly) in Figure 3, corre-sponding to a 5% total reduction of ventilation, gives alower AUC(CVT) value than distribution 7 (2 cm0% 10%evenly) corresponding to a 10% total reduction of ventila-tion. But clearly, even with the same loss of ventilation,activity distributions with a few large lesions (≥1.5 cm) withlow activity will give higher AUC(CVT) values than activity
distributions with many small lesions (≤1.5 cm) with rela-tively high activity in each lesion (e.g. see Figure 3 andFigure 5, distributions 4 and 7 at rows 3 and 5, column C).It is desirable that distributions with the same total
reduction of ventilation result in the same level of AUC(CVT) values independent of lesion shape and distribu-tion. This is the case of the evenly distribution 4 and theclustered distribution 5 (with a total reduction of venti-lation of 10% to 12%). However, the difference in distri-bution can be seen in the frequency functions (Figure 4)and in corresponding CV matrices (Figure 5). Clusterspositioned in other parts of the lung have not been in-vestigated. Factors influencing the result are the volumeand activity concentration of the spheres in the clusterand the size of the cluster’s surface area towards the uni-form part of the lung, and not where in the lung thecluster is positioned.One limitation of the present method is its loss of
sensitivity when COPD changes become more advanced.An activity distribution with an AUC(CVT) value closeto 100% can easily be separated from the simulatednormal distribution; however, further reduction of venti-lation will only result in an almost unchanged AUC(CVT) value (because 100% is the highest possible value).On the other hand, the present method is customised todetect early and minor COPD changes and not to be adiagnostic for advanced emphysema, for which methodssuch as HRCT are more useful. Furthermore, in cases ofadvanced COPD, the appearance of the frequency func-tion of CV values can be used directly, without calcula-ting the CVT and the AUC(CVT), to estimate the COPDseverity.The activity distribution in healthy humans is not as
homogeneous as the simulated normal distribution usedin the simulated COPD study, which might be due tothe shape of the bronchial tree and the gravity influen-cing the lung. This difference is seen in the defined CVT
values, 20.5% for the simulated COPD study and 22.0%for the human study. Furthermore, the human thoraxexhibits a large variety of sizes and shapes. In order todecrease the influence of the lung size, AUC(CVT)values are presented in a percentage of total lung volumeinstead of absolute values. This prevents large healthylungs giving high AUC(CVT) values and small inhomo-geneous lungs giving low AUC(CVT) values. However, alarger 95% CI of the AUC(CVT) value of the healthyvolunteers of ±13% around the mean compared to thesimulated COPD study of ±1% was found. This large vari-ation of the healthy volunteers might be due to geneticvariations, age effects, different histories of occupationaland environmental exposures of noxious particles andgases e.g. passive exposure to tobacco smoke and varyingtechniques of inhaling the Technegas. The total amountof inhaled Technegas, expressed in megabecquerel, also
Norberg et al. EJNMMI Research 2013, 3:28 Page 10 of 12http://www.ejnmmires.com/content/3/1/28

affects the resulting CV values. A reconstructed ventila-tion distribution based on a low activity level will containhigher statistical noise compared to a distribution basedon a higher activity level. Higher noise levels will result inhigher CV values. A variation in the amount of inhaledTechnegas was observed between the human subjects.Therefore, due to different activity levels, small shiftsalong the CV axis of the frequency functions inFigure 7 are present. Procedures resulting in more repro-ducible amounts of inhaled Technegas and normalisationmethods that after image acquisition can compensate forsuch shifts will be further investigated. Reproducibilitymay be improved also by control of the depth and inhal-ation flow rate of the Technegas administration. In par-ticular, the inhalation flow rate influences the ventilationdistribution in normal subjects [34] and almost certainlyalso the deposition in patients with COPD.The activity distribution in the COPD patients was
characterised by areas of low activity and areas of highactivity i.e. hot spots. Low activity areas are caused byreduced regional ventilation resulting in low Technegasparticle deposition. Reduced regional ventilation may becaused by local obstruction of peripheral airways and/orby emphysematous areas with low elasticity. Hot spotson the other hand, as pointed out by Pellegrino et al.[35], may be caused by obstruction of central airwaysprobably resulting in some Technegas impaction duringinspiration but in particular by facilitating regional air-flow limitation during expiration. Airflow limitation im-plies pronounced and oscillating narrowing of airwaywalls causing strong turbulence resulting in high impac-tion of Technegas particles during expiration [35]. Thesehot spots were included in the assessment of the CVvalues. This might be considered as a weakness of thepresent method, since the intention behind the use ofCV values was to identify low activity volumes as an in-dication of disease and not to generate high CV valuesdue to abnormal uptake. On the other hand, such hotspots are typical of the COPD lung and might thereforebe accepted as contributing to the analysis. How thesehot spots influence the analysis will be evaluated in ourfuture work. Presently, we investigate if the presentmethod is reliable enough for detection of COPD changesin smokers without manifested COPD.
ConclusionThe proposed method generates as a global measure ofventilation inhomogeneities, an AUC (CVT) value thatcan differentiate with statistical significance between theactivity distributions corresponding to varying severity ofCOPD changes and the healthy normal activity distribu-tion in a breathing lung phantom. The method can alsoclearly differentiate between five patients with COPD ofgrades 3 and 4, and five healthy non-smokers. Therefore,
the AUC (CVT) method is promising for assessment ofCOPD inhomogeneities in the lung SPECT ventilationimage. The potential of the AUC(CVT) method to de-tect less advanced COPD in patients, e.g. smokers with-out manifested COPD, needs further investigations.
Additional file
Additional file 1: Figure S1. A slice through a 3D geometry with abackground mean level of 100 and spheres at 55 and 5 with Poissonnoise incorporated, and an outlined kernel, are shown at the top. The CV,SD and mean values for the central position of the kernel are plotted inthe diagram. Measurements above a) correspond to the large spherewith a mean level of 55 at the top to the left, b) to the small 55-levelsphere, second to the right, c) to the large 5-level sphere, third to theright, and d) to the small 5-level sphere at the far right.
AbbreviationsAUC: the area under the curve; AUC(CVT): the area under the curve for CVvalues greater than CVT; CDR: collimator detector response; COPD: chronicobstructive pulmonary disease; CV: the coefficient of variance; CVT: CVthreshold value; DLCO: diffusion capacity of the lung for carbon monoxide;ESSE: effective source scatter estimation; FEV1: forced expiratory volume inone second; FWHM: full width at half maximum; HRCT: high-resolutioncomputed tomography; LEHR: low-energy high-resolution; RV: residualvolume; SPECT: single-photon emission computed tomography; TLC: totallung capacity; VC: vital capacity.
Competing interestsThe authors declare that they have no conflict of interest.
Authors' contributionsPN participated in study planning, selected healthy controls, performed alllung SPECT analysis, evaluated data and wrote the manuscript. HLPparticipated in planning of the human study, selected patients, evaluated thedata and wrote the manuscript. GAC and BB participated in planning andwriting. MK participated in writing. MS and AG planned the study, evaluateddata, oversaw the writing, and provided grant funding. All authors read andapproved the final manuscript.
AcknowledgementsThis work has been conducted within the Center for Medical Image Scienceand Visualization (CMIV) at Linköping University, Sweden. CMIV isacknowledged for provision of financial support and access to a leadingedge research infrastructure. Reconstruction software developed at JohnHopkins University, Baltimore, USA, has been used in this work. Financialsupport was provided by the County Council of Östergötland, Sweden(ALF; grants to AG, MS and HLP) and the Medical Research Council ofSoutheast Sweden (FORSS; grant to AG). The required scatter kernel files forthe ESSE model were generated by Michael Ljungberg from Lund University,Sweden. Furthermore, the authors thank the staff of the Department ofClinical Physiology, County Council of Östergötland, Linköping, Sweden forthe acquisition of spirometry and SPECT data.
Author details1Department of Medical and Health Sciences, Linköping University, andCenter for Medical Image Science and Visualization, and Medical RadiationPhysics, County Council of Östergötland, SE-581 85, Linköping, Sweden.2Department of Medical and Health Sciences, Linköping University, andDepartment of Respiratory Medicine, County Council of Östergötland, SE-58185, Linköping, Sweden. 3Department of Medical and Health Sciences,Linköping University, and Center for Medical Image Science and Visualization,SE-581 85, Linköping, Sweden. 4Department of Internal Medicine, Institute ofMedicine, Sahlgrenska Academy at University of Gothenburg, SE-413 46,Göteborg, Sweden. 5Division of Pulmonary Medicine, Ryhov Hospital, SE-55185, Jönköping, Sweden. 6Department of Medical and Health Sciences,Linköping University, and Center for Medical Image Science and Visualization,
Norberg et al. EJNMMI Research 2013, 3:28 Page 11 of 12http://www.ejnmmires.com/content/3/1/28

and Department of Clinical Physiology, County Council of Östergötland,SE-581 85, Linköping, Sweden.
Received: 18 December 2012 Accepted: 15 March 2013Published: 19 April 2013
References1. Brown R, Woolcock AJ, Vincent NJ, Macklem PT: Physiological effects of
experimental airway obstruction with beads. J Appl Physiol 1969, 27:328–335.2. Macklem PT, Thurlbeck WM, Fraser RG: Chronic obstructive disease of
small airways. Ann Intern Med 1971, 74:167–177.3. Hogg JC, Chu F, Utokaparch S, Woods R, Elliott WM, Buzatu L, Cherniack RM,
Rogers RM, Sciurba FC, Coxson HO, Paré PD: The nature of small-airwayobstruction in chronic obstructive pulmonary disease. N Engl J Med 2004,350:2645–2653.
4. Hogg JC, Macklem PT, Thurlbeck WM: Site and nature of airwayobstruction in chronic obstructive lung disease. N Engl J Med 1968,278:1355–1360.
5. Taplin GV, Tashkin DP, Chopra SK, Anselmi OE, Elam D, Calvarese B, Coulson A,Detels R, Rokaw SN: Early detection of chronic obstructive pulmonary diseaseusing radionuclide lung-imaging procedures. Chest 1977, 71:567–575.
6. Vikgren J, Friman O, Borga M, Boijsen M, Gustavsson S, Ekberg-Jansson A,Bake B, Tylen U: Detection of mild emphysema by computedtomography density measurements. Acta Radiol 2005, 46:237–245.
7. Bajc M, Neilly JB, Miniati M, Schuemichen C, Meignan M, Jonson B: EANMguidelines for ventilation/perfusion scintigraphy: Part 2. Algorithms andclinical considerations for diagnosis of pulmonary emboli with V/P(SPECT) and MDCT. Eur J Nucl Med Mol Imaging 2009, 36:1528–1538.
8. Bajc M, Neilly JB, Miniati M, Schuemichen C, Meignan M, Jonson B: EANMguidelines for ventilation/perfusion scintigraphy: Part 1. Pulmonaryimaging with ventilation/perfusion single photon emission tomography.Eur J Nucl Med Mol Imaging 2009, 36:1356–1370.
9. Jogi J, Ekberg M, Jonson B, Bozovic G, Bajc M: Ventilation/perfusion SPECTin chronic obstructive pulmonary disease: an evaluation by reference tosymptoms, spirometric lung function and emphysema, as assessed withHRCT. Eur J Nucl Med Mol Imaging 2011, 38:1344–1352.
10. Suga K, Kawakami Y, Koike H, Iwanaga H, Tokuda O, Okada M, Matsunaga N:Lung ventilation-perfusion imbalance in pulmonary emphysema:assessment with automated V/Q quotient SPECT. Ann Nucl Med 2010,24:269–277.
11. Xu J, Moonen M, Johansson A, Gustafsson A, Bake B: Quantitative analysisof inhomogeneity in ventilation SPET. Eur J Nucl Med 2001, 28:1795–1800.
12. Nagao M, Murase K, Ichiki T, Sakai S, Yasuhara Y, Ikezoe J: Quantitativeanalysis of Technegas SPECT: evaluation of regional severity ofemphysema. J Nucl Med 2000, 41:590–595.
13. Petersson J, Sanchez-Crespo A, Rohdin M, Montmerle S, Nyren S, JacobssonH, Larsson SA, Lindahl SG, Linnarsson D, Glenny RW, Mure M: Physiologicalevaluation of a new quantitative SPECT method measuring regionalventilation and perfusion. J Appl Physiol 2004, 96:1127–1136.
14. Sando Y, Inoue T, Nagai R, Endo K: Ventilation/perfusion ratios andsimultaneous dual-radionuclide single-photon emission tomographywith krypton-81 m and technetium-99 m macroaggregated albumin.Eur J Nucl Med 1997, 24:1237–1244.
15. Chung HW, Huang YH: Fractal analysis of nuclear medicine images forthe diagnosis of pulmonary emphysema: interpretations, implications,and limitations. AJR Am J Roentgenol 2000, 174:1055–1059.
16. Harris B, Bailey D, Miles S, Bailey E, Rogers K, Roach P, Thomas P, Hensley M,King GG: Objective analysis of tomographic ventilation-perfusionscintigraphy in pulmonary embolism. Am J Respir Crit Care Med 2007,175:1173–1180.
17. Segars WP, Tsui BMW: Study of the efficacy of respiratory gating in myocardialSPECT using the new 4D NCAT phantom. In Nuclear Science SymposiumConference Record, IEEE. 2001:1536–1539. 4–10 Nov. 2001:1536–1539.
18. Quanjer PH, Tammeling GJ, Cotes JE, Pedersen OF, Peslin R, Yernault JC:Lung volumes and forced ventilatory flows. Report Working PartyStandardization of Lung Function Tests, European Community for Steeland Coal. Official Statement of the European Respiratory Society.Eur Respir J Suppl 1993, 16:5–40.
19. Ibanez J, Raurich JM: Normal values of functional residual capacity in thesitting and supine positions. Intensive Care Med 1982, 8:173–177.
20. ICRP: Basic anatomical and physiological data for use in radiologicalprotection: reference values. ICRP Publication 89. Annals of the ICRP 2003,32:1–277.
21. Berger MJ, Hubbel JH, Seltzer SM, Chang J, Coursey JS, Sukumar R, ZuckerDS, Olsen K: The National Institute of Standards and Technology (NIST).http://www.nist.gov/pml/data/xcom/index.cfm].
22. Ljungberg M, Strand S-E: A Monte Carlo program for the simulation ofscintillation camera characteristics. Comput Meth Prog Biomed 1989,29:257–272.
23. Larsson A, Mo SJ, Ljungberg M, Riklund K: Dopamine D2 receptor SPECTwith (123)I-IBZM: evaluation of collimator and post-filtering when usingmodel-based compensation-a Monte Carlo study. Phys Med Biol 2010,55:1971–1988.
24. Norberg P, Bake B, Jacobsson L, Carlsson GA, Gustafsson A: Evaluation ofreconstruction techniques for lung single photon emission tomography:a Monte Carlo study. Nucl Med Commun 2007, 28:929–936.
25. Global Initiative for Chronic Obstructive Lung Disease (GOLD). 2011,[http://www.goldcopd.org/].
26. Hedenström H, Malmberg P, Agarwal K: Reference values for lung functiontests in females. Regression equations with smoking variables. Bull EurPhysiopathol Respir 1985, 21:551–557.
27. Hedenström H, Malmberg P, Fridriksson H: Reference values for lungfunction tests in men: regression equations with smoking variables.Upsala J Med Sci 1986, 91:299–310.
28. National Health Care program for COPD (updated 2008). [www.slmf.se/KOL_nat_progr.].
29. ICRP: Radiation dose to patients from radiopharmaceuticals. In InternationalCommission on Radiological Protection. ICRP Publication 80. 2000.
30. Frey EC, Tsui BMW: A new method for modelling the spatially-variant,object-dependant scatter response function in SPECT. In IEEE NuclearScience Symp 1996, 1996:1082–1086.
31. Ott RJ, Flower MA, Babich JW, Marsden PK: The physics of radioisotopeimaging. In The Physics of Medical Imaging. Edited by Webb S. London: IOPPublishing Ltd; 1988. 142:318.
32. Visual Human Project CT dataset: US National Library of Medicine.[http://www.nlm.nih.gov/research/visible/].
33. Siafakas NM, Vermeire P, Pride NB, Paoletti P, Gibson J, Howard P, YernaultJC, Decramer M, Higenbottam T, Postma DS, et al: Optimal assessment andmanagement of chronic obstructive pulmonary disease (COPD). TheEuropean Respiratory Society Task Force. Eur Respir J 1995, 8:1398–1420.
34. Bake B, Wood L, Murphy B, Macklem PT, Milic-Emili J: Effect of inspiratoryflow rate on regional distribution of inspired gas. J Appl Physiol 1974,37:8–17.
35. Pellegrino R, Biggi A, Papaleo A, Camuzzini G, Rodarte JR, Brusasco V:Regional expiratory flow limitation studied with Technegas in asthma.J Appl Physiol 2001, 91:2190–2198.
doi:10.1186/2191-219X-3-28Cite this article as: Norberg et al.: Quantitative lung SPECT applied onsimulated early COPD and humans with advanced COPD. EJNMMIResearch 2013 3:28.
Submit your manuscript to a journal and benefi t from:
7 Convenient online submission
7 Rigorous peer review
7 Immediate publication on acceptance
7 Open access: articles freely available online
7 High visibility within the fi eld
7 Retaining the copyright to your article
Submit your next manuscript at 7 springeropen.com
Norberg et al. EJNMMI Research 2013, 3:28 Page 12 of 12http://www.ejnmmires.com/content/3/1/28

![[Functional imaging (PET and SPECT) in epilepsy]](https://img.pdfslide.net/doc/110x75/63555615b4909beae3004b2b/functional-imaging-pet-and-spect-in-epilepsy.jpg)


![[Acute exacerbation in COPD and asthma]](https://img.pdfslide.net/doc/110x75/63471bb3f88a53192c092893/acute-exacerbation-in-copd-and-asthma.jpg)


