Embed Size (px)
Citation preview
1 INTRODUCTIONQuantitative research is a more consistent, coherent anddata-resulted means of arriving in measuring of what peoplethink from a statistical point of view. Quantitativeresearch can gather prominent amount of data can easily bearranged and controlled into reports for analysis. Inquantitative research, numerical data are gathered andmathematical based methods are used for analysisQuantitative research is basically about gatheringnumerical data to explicate a development especially thatneeds prompt answers using quantitative methods. It is usedto measure mental outlook, beliefs, demeanors, and otherdefined variables that can be used to generalized resultsfrom prominent sample populationsQuantitative research pertains to taxonomical of practicalthorough check of social developments by the way ofstatistical, mathematical or computational proficiencies.Quantitative research data are gathered by surveys, audits,purchase points and so on. Quantitative research is quantifiable data to develop thetruth or facts and reveal practices in research
2 DEFINITIONSQuantitative research is an established experimental methodthat utilizes an approved format of creating hypothesis andthis hypothesis can only be verified by mathematical andstatistical means and is the foundation in which the wholeexperiment is designed. The aim or goal of quantitative research is to establishand make use of mathematical models, theories andhypotheses relevant to developments
1
3 GENERAL CHARACTERISTICS1 The data is consistently collected utilizing morestructured research instruments2. The outcomes are founded or established on bigger sizeswhich are characteristics or typical of the population3 High reliability can be achieved by repeating orduplicating the research study4 The researcher is seeking objective answers to theresearch questions that have been precisely defined5 Before the researcher start gathering the data, all thefacet of the study must have been designed6 Data are in the pattern of statistics and numbers7 The final report of the study can be used forgeneralizations of concepts, phenomena, future results canbe predicted or examine casual relationship8 Researchers uses questionnaire, surveys, secondarydata, experiments etc to gather numerical data9 Researcher likely to remain objectively distinguishedfrom the subject matter
4 KEY FEATURESa. ControlControl is the most vital constituent in quantitativeresearch because it gives opportunity to the researcher todiscover the causes of his or her observations. Experimentsconducted is to answer some questions about what causessomething to happen, what are the circumstances that makesit to happen, why does it happen. Control is important tofurnish specific answers to the aforementioned questions. b. Operational definitionOperational definition means that the words used in the
2
study to quantify them must be clearly defined to removeconfusion in meaning and communicationc. DuplicationDuplication is necessary because for the data collectedfrom the experiment to be reliable, the outcome of theresult must be repeated several times. d. Hypothesis testing
5 DATA SOURCE AND DATA COLLECTIONData sourceThere are two kinds of data source namely:1 .Primary 2 .Secondary
PRIMARY SOURCEPrimary source is when data is collected from theinformation source which has not sustained analysis beforeembodied or admitted in the appraisal needs. Primary datais gathered right away from the concerned population by theevaluator’s team by the way of fieldwork. Primary data is gathered by the researcher for a particularobjective or analysis under examination. The researcher orevaluators in the data analysis are conversant with theresearch design and data gathering procedure. Examples ofprimary data in quantitative research are1. Questionnaire2. Structured Interview3 .Phone Interview4 .E-mailsIn quantitative research, the data is called "quantitativebecause it is in numerical pattern and it can be measured.Quantitative research data are difficult, thorough,
3
scientific, believable and dependable. It is important toknow at this point in time that all quantitative data isfounded upon qualitative reasoning and understanding; allqualitative data can be illustrated and controllednumerically. The researcher may develop an instrument on'motivation', he need to consider the understanding of thesubject matter by the respondents which will affect thewording and the design of the instrument. For example, heneeds to define the concept, separate or differentiate itfrom other related concept, settings it could be used in,ethics and language constraints.
6 QUESTIONNAIRESQuestionnaire is used in broad scope of context to collectinformation about beliefs and character of individual,group of people and respondents involved in the researchstudy. The researcher should be stringent and thorough whendesigning and executing a questionnaire by the researcherbecause it will have impact both on the respondents and theresearcher when analyzing and executing the data. Thereliability and validity of the questionnaire should betested to avoid negative impact on the outcome of thestudy. It is also of the utmost importance that theresearcher should take cognizance of the target populationin accepting the questionnaire because the respondents mustbe willing to to take in the process. Steps in designing a Questionnaire1. Defining the research questions and population to bestudiedAt the beginning of the study, it is vital that theresearcher should define the aim of the study in a clearand specific term, target population and research
4
questions. As l mentioned earlier the respondents arelikely to respond to the questions easily if theyunderstand the issues being discussed, is at their level ofunderstanding and conversant with the language used inpreparing the Questionnaire. It is advisable that the aimof the study should be visited often during the process sothat the researcher will not loose focus of the study. 2. Taking decision on how the questionnaire will beadministeredDecision on how the questionnaire will be administered willdepend on fund availability, time frame and the issues tobe investigated by the researcher. There are two types of interview used in questionnairenamely structured and unstructured interviews.
7 Structured InterviewsIt requires a researcher asking respondents presetquestions on a subject that have been carefully selectedand fixed. The interviewer is permitted to explain thequestions or further clarification of the questions to theinterviewee also known as respondents.
Advantages1. Interviewer has the opportunity to clarify the unclearquestions to the respondents2. Open-ended can be utilized to gather a scope of possibleanswers3. The researcher is confidence that the questions areanswered by the intended respondent's4. It allows the researcher to investigate the level ofunderstanding a respondent has about a specific topic
5
5. Structured Interview can be used to examine theimpression of a respondent about a specific topic beforeapplying observation method to gather a better depth ofinformation6. Structured Interview can be used as an effective toolpattern of developmental assessment7. Structured Interview is a type of research method thatis well standardize because the respondents are asked thesame questions8. Structured Interview furnishes a reliable source ofquantitative data9. Through structured interview, the researcher is able tocover large number of people rapidly, easily andexpeditiously10. It is comparatively quick and easy to produce, encryptor cipher and interpret.11. There is a conventional rapport between the researcherand the respondents and the researcher is acquainted withthe reasons why the respondents were unable to answer allthe questions
Disadvantages1. It is time consuming because the researcher must bephysically present during the distribution of thestructured interview most especially if it is big samplegroup 2. The quality and utility of the information is extremelydependent upon the quality of the questions asked by theresearcher3. A significant amount of pre-planning is expected fromthe researcher4. Complex matters cannot be investigated by the researcher
6
because of the questionnaire format5. The respondents cannot answer the questions in detailbecause of the way the questions are structured6. The response may be biased because the presence of theresearcher may affect the respondents psychologically8 Another method of administering questionnaire is ‘Self-complete' questionnaireSelf-complete or Self-administered questionnaire methodIn this method the researcher c distribute thequestionnaire to the respondents by mail, E-mail orInternet and the respondents fill the questionnaire withoutassistance from the researcher .The respondents fill thequestionnaire at its own time and pace
Advantages1. It is cheap to administer2. They are comparatively simple to administer and examine3. Majority of people are used with the idea of aQuestionnaire4. The researcher's bias is reduced because the researcherhas no influence on the respondents5. The respondents can fill questionnaire at his own timeand a place of his convenience Disadvantages1. The researcher has no control over the actual peoplethat complete the questionnaire2. Illiteracy problem3. Low response rate particularly when the questions aredifficult a complicated.
Formulating questions in order to answer the research
7
questionsa. The researcher should catalog all the informationrequired to answer the research questionsb. Examine closely the literature review related to thequestionsc. Adjust and clarify the available questions to theresearch questions d. The researcher should now develop his own questionswhere it is important to do soe. The researcher should make the questions as simple aspossible so that the respondents will not give up orprovide inaccurate answersf .The questions should be short, , specific and carefullyworded
Principles of wording questions Simple language should be used Ensure the questions are short and unambiguous Prevent double negatives in the questions Refrain from leading questions Refrain from hypothetical questions Ensure that the questions are readable Avoid assumption questions The questions should accommodate all likely answers The questions should make the respondents remorseful
g. The researcher should decide on the type of scale ofmeasurement he will like to useh. The researcher should resolve the statistical techniquesthat is going to use for the analysisi. Arrangement of the questions The researcher should arrange the questions
8
sequentially The researcher should start simple, interesting andnice questions that is appealing to the respondentsj. Ask the experts for their inputk. Conform to ethical standards4. Specify systematically the responses
a. Types of questionsA Questionnaire generally comprises of a mixture of thefollowing types of questions:i. Factual questions: they are generally backgroundquestions related to demography, hobbies or habits. Forexample age, gender, qualifications, hobbies and so onii. Opinion-related questions: they are usually questionsthat disclose respondents’ character or understanding ofthe number of times of a specific behavioriii. Aggressive or sensitive and non-aggressive or non-sensitive questions: they are generally related toquestions on sexual behavior, drug use, alcohol, illegaldealings etc The researcher should try as much as possibleto avoid this type of questions because the respondentsdoes not give correct answers iii .Open-ended questions: they are questions that have nopre-encrypted answers
Advantagesa .They are useful in determining the scope of possibleresponses where no previous existing datab. It gives chance to respondents to “air" their viewsabout a topicc. It prevent the researcher from influencing therespondents by providing a checklist of likely answers
9
Disadvantagesa. It is time consuming because the questions are encryptedafter the surveyb. Sometimes the responses are not useful to the researcherbecause of inability of the respondents to interpret thequestions correctly c. Illiterate respondents will avoid the questionnaire,even if he collected it, he might throw it awayiv. Closed questions: they are also called multiple choicequestions. In closed questions, the respondents areexpected to select from the response categories provided bythe researcher.When designing closed questions, the researcher should bearthe following in mind: The instructions on how to fill the questionnaire bythe respondents should be clearly stated The response alternatives should be all-inclusive ieall likely answers should be provided the researcher The alternative should be mutually exclusive The researcher should include Not Applicable where thequestions don't apply to the respondents
b. Types of response categoriesi .Yes/No response categoriesExampleHave you heard about Atlantic International University?YES NOii. Extent of agreement, frequency of behavior or level of
10
frequencyExampleTo what extent do you agree with this statement?Atlantic International University is one the best onlinedistance learningiii. RankingsSometimes respondents are asked to rate different optionsin order of importanceExampleArrange the following in order of importance as it relatesto the performance of Atlantic International University byallocating 1 to the most important performance, 2 to thesecond-most important and proceed in this manner until youallocate 4 to the least important performance Student services Academic tutor Academic adviser Technical servicesRanking questions should be used at the worst scenario
9. LEVELS OF MEASUREMENT Nominal measurementsNominal measurement is when people are categories intomutually exclusive according to the measurement. The peoplein the category have the same characteristics that differfrom other classification. An individual can only belong toone category. For example, gender: is either male orfemale; Faculty: a student or staff must belong one facultyonly etc
Ordinal measurementsOrdinal measurements have additional feature in that the
11
classification can be arranged in an orderly pattern, forexample from low to high. Each classification therefore,has more of the pertinent feature than the one precedingit. For example, course of study
Intermission dimensionIn intermission quantification, there are equal quantifyingbetween the distinctive classifications. In this type ofquantification, magnitude are assigned the so thatdimension between the magnitude correlates or coincide withthe degree to which the feature is present. For example apatient’s temperature reads 34oc and patient's temperatureis 60oC, then we can say the temperature difference betweenthe two patients is 26oC and also the first patient'stemperature is okay compare to the second patient Ratio measurementsThe difference between interval measurements and ratiomeasurements is that ratio measurements is having absolutezero which is an additional feature. In an absolute zerovalue, it means that the '0' symbolizes or shows a totalabsence of the variable.
10 .THE FORMAT OF A QUESTIONNAIREA .Question orderi .The researcher should grouped the questions in logicalorder that pertinent to a specific topicii .A questionnaire should be seen as a conversation,consequently the topic before the next one should be dealtwith. iii .General questions should come before specificquestionsiv .The researcher should place biographical information at
12
beginning of the questionnaire since this type ofinformation is not vulnerable and they are factualinformationv .Movement between questions or from one question to theother should flow smoothlyB .Length of the QuestionnaireThe researcher should ensure that the questionnaire is ofappreciable length so as to achieve high response rate. C .Pattern and LayoutThis is concern about the physical appearance of theQuestionnaire. It should be readable There should be space in between the questions to prerespondents from missing questions The questionnaire should be printed on a good qualitypaper The questions should be written on a white paper toprevent respondents from being boring The instructions to the respondents must be clearlystatedPre-pilot the questions and layoutThe aim of pre-pilot of the Questionnaire is diagnose anyvagueness in the questions and to establish the scope oflikely responses for each question. Pre-pilot is not aconventional method but of information gathering activity.The researcher sit down with small group of peoplesometimes his colleagues, they go through the questionstogether to identify any initial problems. The identifiedones are corrected and re- pilots is to another group. Thisis repeated several times until the questionnaire is
13
suitable, free from any uncertainty and acceptable torespondents. Pilot study to test the questionnaireQuestionnaires pass through a conventional pilot for threereasons, namely1 .Validity2. Reliability3 .Acceptability 1 .Validity testingA Questionnaire is valid if it measures what is expected toquantify by covering the scope of the research questions.Validity test of a Questionnaire have different typesnamely:The researcher should investigation the Facial expressioncogency of through telephone or physically present with thepeople after the respondents finished filling the form. Thepurpose of this test is to confirm whether the respondent'sresponse on paper correlates with his actual options. Whentesting face validity, the wording of the interviewquestions must be different from that of questionnaire. Standard cogency can be evaluated through contrasting theactual quantification with standardized rule2 .Reliability testingReliability is defined as the appraisal of theduplicability and firmness of an instrumentIn self-complete questionnaire, two types of reliabilityshould be investigated. Test-retest reliability is carried out by requesting therespondents to fill the questionnaire on separate occasionsand then compare them statistically.The researcher can also measure internal firmness of aninstrument by asking questions in different ways within the
14
questionnaire and the responses from the respondent are nowcompared. 3 .Acceptability testingThe researcher can request the respondents to make remarkswith respect to form filled on another paper and also tofind out from them the time used to fill the form. Allthese information can be let in cover letter that willaccompany the questionnaire.
11 .PLANNING THE CODING SCHEMECoding is the procedure of changing questionnaire data intosignificant classes to ease analysis. The researcher shouldnumber the tick boxes for each question and this willpermit the researcher to record the data directly into thedatabase for analysis. Another method is by coding theresponses in another paper and insert the data from thecoding paper into the database for analysis. To minimizeunreliability and bias, the coding scheme should be testedduring the pilot study. In addition to this, the researchershould consult the statistician to correct any mistakesthat may arise in the questionnaire Data codingIt is beneficial pattern for a researcher to go througheach completed questionnaire for any missing data ln orderto solve the problem of missing data, two methods can beused. 1 .The researcher should investigate all the responses to aquestion, work out classification for the answers and thencode the data in similar way to the closed responsequestion.2 .The researchers can quote the respondents word for wordin the final report.
15
The data from the open-ended questions in the questionnaireis now inserted into a computer program for analysis. 12 DATA CLEANINGData cleaning is the method of discovering and fixing wrongcoding, wrong reading of written codes, wrong sensing ofblackened marks, absent data, etcThere are two kinds of data cleaning that needs to beaccomplished to data setsa .Probable code cleaningProbable code cleaning is the method of inspecting to findout that only the codes allocated to the answer choices foreach question emerge in the data file. For example 1 fordata communications 2 for information management, 3 forintroduction to Pascal and 0 for no answer. If theresearcher now found a respondent coded 5 for thisvariable, this is an error. In this example data cleaningis required. In recent times, computer programs are now used to detectan error either when the data is being inputted or in thedata file. The computer beeps when it detected an error. If the researcher is not utilizing computer program thatexamines coding errors during data input activity, he candetect errors by investigating the distribution ofresponses to each item in the datab .Exigency data cleaningThis second type of data cleaning is more difficult compareto probable data cleaning. It is the method of inspectingthat only those cases that should have data on a specific variable is the one that has it.
ADVANTAGES OF QUESTIONNAIRE
16
1 .Questionnaire aid the researcher to have access to largenumber of respondents easily and economically2 .The answers from Questionnaire can easily be analyzed
DISADVANTAGES OF QUESTIONNAIRE1 .There is a limited choice of response to a question,which means right answer to the question might not be amongthe options provided by the researcher2 There are various responses to a question which may bedifferent to analyze
13 SECONDARY SOURCESSecondary source is when data gathered by researchers isbeing used by another researcher that was not involved inthe present appraisal and has sustained at least for oneyear of analysis before incorporation in appraisal needsThe researcher fake or pretenses the questions that aretreated through the analysis of a data set that they didn'ttake part in gathering. It is vital to know that secondarydata may be primary data to a researcher and be secondarydata to another researcher. UsageSince the researcher is not involved in the collection ofthe data, he needs to study the data and get familiar tosuch information as: who are the population study, methodof data collection, response classification for eachquestion, scaling method used etc. Examples of secondarydata are online materials, journal, articles, magazines,records of an institution, organizations and corporations,published research etc.
ADVANTAGES
17
a .Economical: Through secondary data, the researcher saveda lot of time, money, energy because most of the data haspassed the process of cleaning and stored in electronicformat, consequently he focused on data analysis. b. Wider geographical area is covered and larger populationalsoMost of the research embark upon by Federal government isnationwide with larger population which may be difficultfor a researcher to cover because of time and fund.c .Secondary data gathering procedures is frequently led byprofessionalism or expert which individual researcher maynot afford or possess the expertise
DISADVANTAGESa .Since the researcher is not the original collectors ofthe data, the secondary data may not answer his research questions, population might notsuitable for him and may find it difficult to analyze thedatab .The classification of variables in the secondary datamight be quite different from researcher's choice. c .The researcher is not privileged to know how the datawas collected, problems surrounding the collection such asresponse rate and other related issues which willdefinitely affect his analysis.
13 DATA ANALYSISIntroduction to data analysisData analysis is the sequence of interdependent and linkedprocedure of appraising data utilizing analytical andintelligent reasoning to investigate each component of the
18
data provided. This mode of analysis is one of the stepsthat must be finished or accomplished when carrying outresearch experiment.Data Analysis is the procedure of methodically employingstatistical and effective techniques to explain,demonstrate, compress and synopsis, and appraise or assessdataData analysis is the procedure of converting raw datainformation that is useful in a way that can add importantto the statistical output. Issues to be considered in data analysisi .The researcher must have essential ability, competency,experience and aptitude to analyzeThe investigators have taken it for granted that thetraining acquired is adequate to prove high standard ofresearch practice. In a real sense, investigators shouldhave to a large extent more than elementary or fundamentalunderstanding the reasoning for choosing one method ofanalysis over the the other. The usual practice is that theinvestigators always leave the aspect of analytic procedureto statisticians to handle. ii Simultaneously choosing methods of data collection andsuitable analysisThe analytic process to be used must have been decided ortaken into consideration at the initial stage of theresearch study by the researcheriii .Making unbiased or impartial decisionThe primary aim of analysis is to differentiate betweenfalse and true situation. Bias can occur when collectingthe data, choosing the method of data analysis, samplingfrom the population etc, It is important to know that oncethere is bias in the analysis, definitely inferences from
19
the study will be affected. iv .Ensuing acceptable standard for disciplinesThe acceptable norm are established on two determinantsa .the characteristics of the variables usedb .presumption about population from which the data istaken. If the researcher utilized unacceptable norm, he should explain the new method ofanalysis and how is different from the acceptable orstandardized norm. v .Deciding statistical importanceiv .Furnishing candid and precise analysisvii .Ways of presenting dataviii .Training of staff that are going to carry out theanalysisThe plan of action that the researcher may embark upon inorder to maintain data probity area .Regular watch carefully of ratersb. Constant or regular trainingc. Clearly asserting a catalogue of analyses processes inthe rules of conduct manual (code manual)ix . Dependability and effectivenessFactors that can affect dependabilitya. Balance or equilibriumb. Replicationc. Precisex . Lack of clearly defined and objective outcomemeasurementsxi Range of analysisWhile researcher is using statistical method for analysis,he should not pact with data probity. After coding the textmaterial for subject analysis, raters should allocate eachcode into a suitable classification of a cross reference
20
grid. Despite of using computer software for frequencycount, additional analysis should be carried out to findout the depth of the data set or recognize fundamentalvariables that are significant.
Data Analysis ProcedureThe researcher must have taken quantitative data analysisinto consideration during the design phase . The steps orstages are as followsa .Data cleaning (discussed in)b .Classification of data into different Variables(discussed in)c .Sample size-regression analysisd. Univariate analysis-frequency, diagrams, mean,dispersion and so one .Bivariate analysis-nominal variable, chi-square,Cramer's V, and so onf .Multivariate analysis
Basic concept in Quantitative analysisi .Population: the studying of things that can be seen,felt, perceived, phenomena, number of individualscollectively, organization, and total set of individuals bythe researcher is called population. For example studyingthe revenue generation in Nigerian Railway Corporation, thepopulation is Nigerian Railway Corporation.
Population is the number of individuals collectively ofinterest to the researcher. It is the group that theresearcher will like to use the result of the study forgeneralizations
21
Target population is the population that the researcherwill like to generalize. ii .Sample: is a set of a larger set (population) ofpeople, things that can be seen, felt, perceived, groups,or situation that the researcher is studying. For example,a department within the organization. Due to the largeness of the group of study, geographicalissue, time and money, the researcher always like to selector choose sample from the population. Consequently, a goodsample is the only that represent the population very well.Steps in sampling are:i .Recognition of the populationii .Determine the sample sizeiii .Choice of the sample
14 SAMPLINGProbability SamplingThere are four sampling methods under probability samplingnamelyi .Random sampling: is the series of action in choosing asample in manner that all the person in the target grouphave an adequate and interdependent opportunity chosen forthe sampleSteps of random samplinga .Discover and define the populationb .Decide the desired sample sizec .Catalog all members of the sampled .Allocate all individuals on the catalog a straight orsequent number from zero to the required numbere .Choose discretionary number in the table of randomnumbersf .Correspond or couple the chosen number with the
22
allocated number to individuals in the populationg .The 'f' step should be repeated until the wanted numberof individuals have been chosen for the sample
Advantagesi .Forward looking supplementary information constituentsin the sample universe is not neededii .Each choice is autonomous of other choices, and everypotential combination of sampling units has adequate andautonomous opportunity of being chosen. iii .It is broadly easier to interpret and convey to othersiv .It necessitates easier statistical methods or processesfor analyzing calculate data errors. Disadvantagesi .A sampling frame of constituents in the direct orobjective sampling universe is neededii .It have more prominent sampling errors and withoutaccuracyiii .It is more expensive to collect the data because therespondents are scatterediv .It may not give enough numbers of constituents in smallsubgroups. ii .Stratified sampling: is the series of action ofchoosing a sample in a manner that describes subgroups inthe population are depicted in the sample in the samerelative amount or fraction that they exist in thepopulation. Steps of stratified sampling'a .Describe and define the populationb .Decide craved or wanted samplec. The researcher should describe the variable and
23
subgroups that he can pledge suitable representationd .Classification of all members of the population as oneof the described subgroups. e .Randomly choose a suitable number of individuals fromeach of the subgroupsAdvantages. i .It has more outstanding power to make illations betweena class and comparison across classesii .The knowledge the researcher possess about thepopulation is taken as an advantageiii .Allows dissimilar research methods and process to beutilized in dissimilar classiv .Allows analyses of inside-stratum form and classifydescribing of the results for each stratumDisadvantages. i .Needs information on the fraction of the entire sampleuniverse that goes into each classii .The information for each constituents is needed onclassification variablesiii .It takes a lot of time, money and complexiv .If a research entails a bigger number of variables, itmay be hard to choose classification variablesv .To compute sampling approximates, not less than twoconstituents is neededvi .The data gathered is more composite to analyzeiii .Cluster sampling is it is inconceivable, orunrealistic to collect an unlimited catalog of subject thatform the target group. Generally, the population elementsare grouped into subgroups and catalog of those subgroupspreviously produced. For the researcher to carry on acluster sample, he first chooses groups and the group, hechooses the
24
person either by simple random sampling or systematicrandom sampling. He may decide to use the whole cluster ifthe group is small.Cluster sampling is just a manner to haphazardly selectsmaller and smaller geographic areas until a point that itcan originate a catalog of elements in order to do simpleor taxonomical haphazardly sampling. Advantagesi .More logistically executable in scattered samplinguniverseii .It does not need a finished catalogiii .It is inexpensive, prompt, fast and tardilyDisadvantagesi .There is a decreased in accuracy due to small samplesizeii .There is complication in the calculation of confidenceintervals and p valuesiii .The result of the study can be skewed iv .Systematic sampling: necessitates commencing with asampling universe with size of N, and choosing every Kthfactor. This choosing is a continuous procedure until thewanted number of constituents is attained. The procedure isrepeated. Defining kk=no of constituents in the sample universe no of constituents in the sampleIt is a trying process of a haphazard choice, 1stconstituent for trial, and then later constituents chosenutilizing determined intermission until the wanted samplesize is attained Stepsi .Set the direct sample universe
25
ii .Decide the wanted sample size (n)iii .Name an existent sampling frame of the direct samplinguniverseiv .Assess or measure under inclusion, over inclusion,multiple inclusion and make modifications where requiredv .Decide the number of constituents in the sampling framevi . i= N n where N=no ofconstituents in the sampling frame n = directsample universe i =sampling interval
Advantagesi .Since the choice procedure is done by hand, it saves alot of time, easier, simpler and is cost-effective
ii .If there is a physical representation, the directsampling universe and sampling frame is not required to becounted and collected respectivelyiii .Systematic sampling may give outcome related to simplerandom sampling if the numbering of the constituents in thesampling frame is haphazardlyiv It removes the chances of autocorrelationv. It checks that the sample is disseminated across thesampling universe
15 UNIVARIATE ANALYSESIn a univariate analysis, the researcher investigates theconsequences of the independent variable on one dependent
26
variable. The researcher is attempting to show or proveoccasional relationship among the independent variable andvariation in the dependent variable. It is vital to knowthat the researcher may have two independent variables butdependent variable must be one. Generally, univariate analysis is for descriptive at theearly stage of the research. Set of measures used in Univariate analysisa .Frequency distributionb .Central tendencyc .Statistical dispersiond .Skewness and kurtosise .RangeExample of frequency distribution table Marital status Number of casesPercent Married 413, 33 Widowed 826.67 Divorced 620.00 Separated 413.33 Never married 826.67Total cases:30Example of Central tendencyi .Averageii .Medianiii .Modei .Mean-The mean score constitute a numerical mean for a
27
set of answer
Example 4+8+6+4+8/5 =6 Median is numerical middle score that divide thedistribution in half for a specific variableMedian= 4, 8, 6, 4, 8The middle number is 6Mode is the majority common number score for a specificvariableThere two score that is of majority: 4 and 8Therefore, Median=4+8/2=6Mean=Median=Mode=6Variance: amount of distribution of a data set Variance=1/N
Interval/groupingExample10, 8, 2, 4, 5, 8, 7, 5, 3, 8, 5, 7, 2, 2, 2, 7, 8, 7, 4, 5 Class intervalFrequency 0-24 3-57 6-88 > 9
FREQUENCY TABLE
28
INTERVAL EXAMPLE1, 1, 2, 4,2,7,4,7,9,3,3,2,2,8,5,4,5,7,7,10 SCORES FREQUENCY 0-2 6 3-5 7 6-8
5
>9 2
RANGE: difference amongst lowest and highest values in adataEXAMPLEFrom the data above: highest=10: lowest =1Range=10-1=9
The Average Average= 1/N mi∑Example(1+1+2 +4+2+7+4+7+9+3+3+2+2+8+5+4+5+7+7+10)/20=4.65
MEDIAN1,1,2,2,2,2,3,3,4,4,4,5,5,7,7,7,7,8,9,10 =4MODE=4
VARIANCEIt is the quantity of distribution of a data set. VARIANCE= 1/N (mi–m)²∑
EXAMPLE4,5,6,7,8,9,Average=( 6+9+4+7+8+5)/6=6.5Variance={(4-6.5)² +(5-6.5)² +(6-6.5)² +(7-6.5) +(8-6.5)²+(9-6.5)²}/6 =2.92STANDARD DEVIATION Is root of the variance =({(4-6.5)² +(5-6.5)² +(6-6.5)²+(7-6.5) +(8-6.5)² +(9-6.5)²}/6)½
29
= 1.71
HistogramHistogram is a column chart of frequency tablePIE CHART
BAR CHART
Cat 1 4.3 2.4 2Cat 2 2.5 4.4 2Cat 3 3.5 1.8 3Cat 4 4.5 2.8 5
30
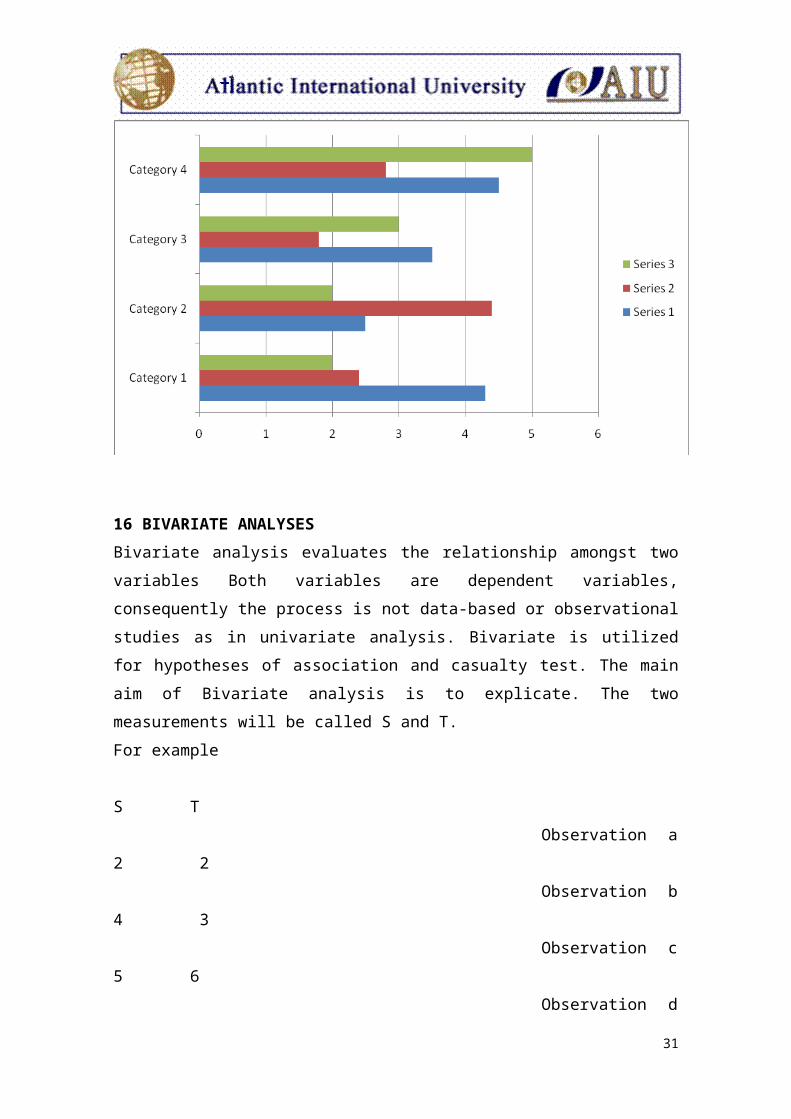
16 BIVARIATE ANALYSESBivariate analysis evaluates the relationship amongst twovariables Both variables are dependent variables,consequently the process is not data-based or observationalstudies as in univariate analysis. Bivariate is utilizedfor hypotheses of association and casualty test. The mainaim of Bivariate analysis is to explicate. The twomeasurements will be called S and T.For example S T Observation a2 2 Observation b4 3 Observation c5 6 Observation d
31
4 1 Observation e3 5 Observation f7 4 Observation g3 7In Bivariate simple haphazard sample can be stated (S1, T1), (S2, T2) ... (Sn, Tn)
Each observation is a pair of values, for instance (S2, T2)is the second observationThe vital graphical sum-up of Bivariate data is the scatterplot. The important characteristics in a scatter plot isthe association, or trend amongst S and TIf S and T have an association, so1 .S could cause T to change2 .T could cause S to change3 .a third unmeasured variables U could cause both S and Tto changeCorrelation CoefficientThe majority widely known proficiency for showing therelationship amongst variables is correlation. It is amathematical quantity of correlated variation, connectionor affiliation amongst two variables. Covariance is thedegree or magnitude to which changes in one variablerepresents or match consistently to a change in another. Pearson product is the correlation estimate or approximateaffiliation amongst continuous variables + r equates+1.0while - r equates-1.0.
BIVARIATE ANALYSIS
32
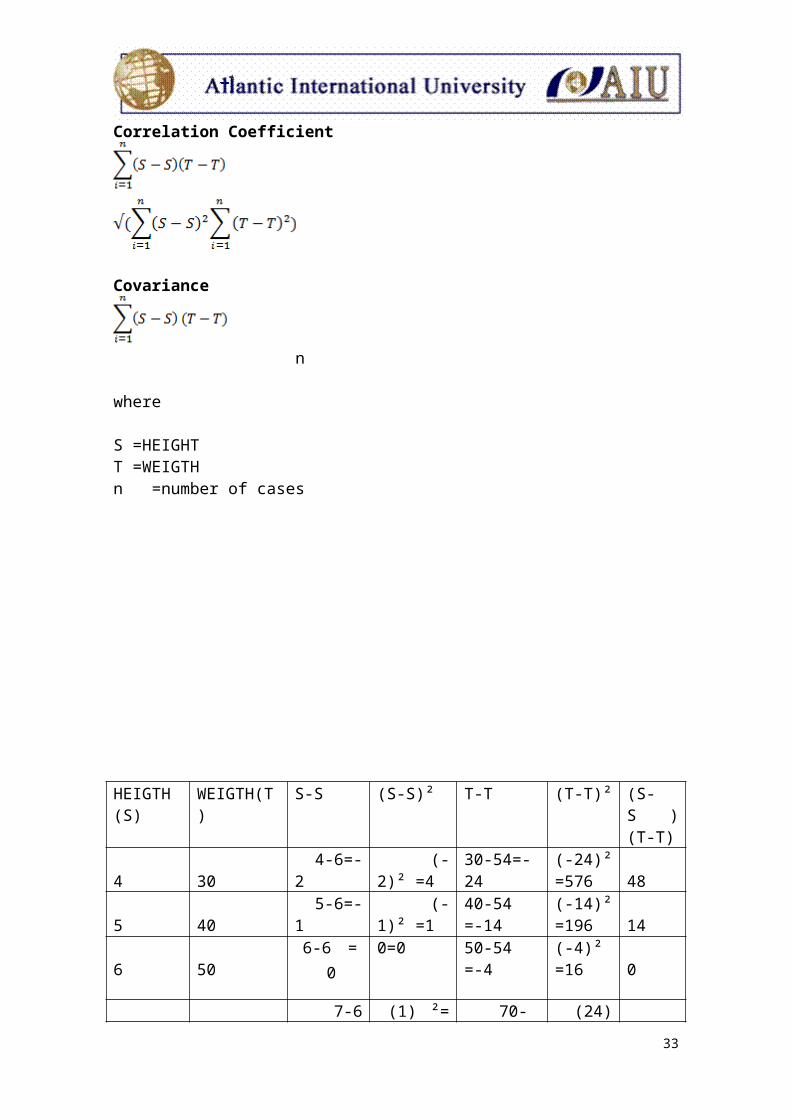
Correlation Coefficient
Covariance
n
where
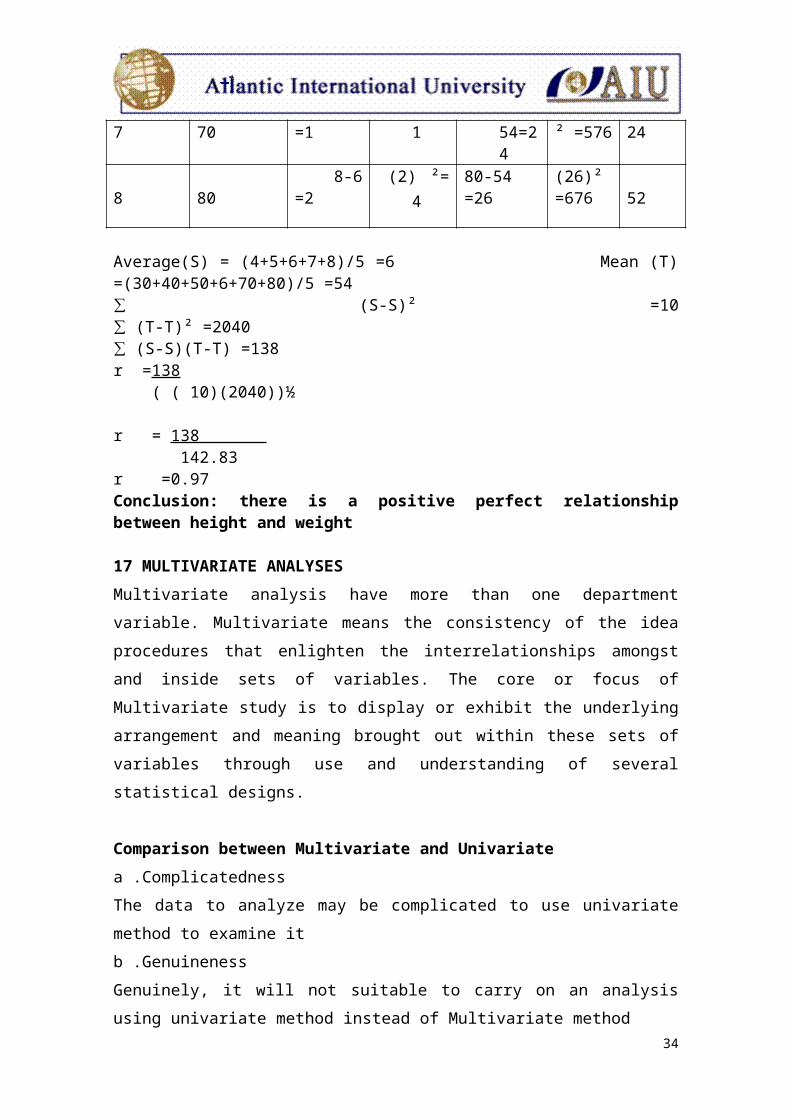
S =HEIGHTT =WEIGTHn =number of cases
HEIGTH(S)
WEIGTH(T)
S-S (S-S)² T-T (T-T)² (S-S )(T-T)
4
30
4-6=-2
(-2)² =4
30-54=-24
(-24)²=576
48
5
40
5-6=-1
(-1)² =1
40-54=-14
(-14)²=196
14
6
50
6-6 =0
0=0 50-54=-4
(-4)²=16
0
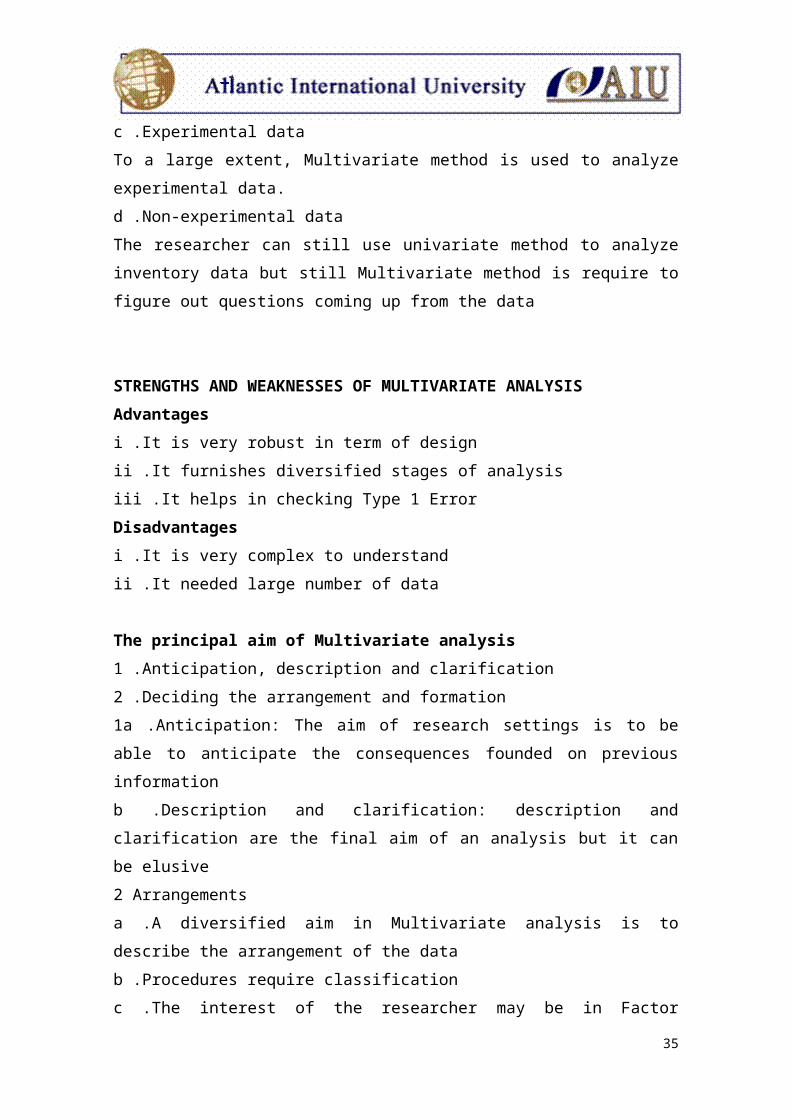
7-6 (1) ²= 70- (24) 33
7 70 =1 1 54=24
² =576 24
8
80
8-6=2
(2) ²=4
80-54=26
(26)²=676
52
Average(S) = (4+5+6+7+8)/5 =6 Mean (T)=(30+40+50+6+70+80)/5 =54
(S-S)² =10∑ (T-T)² =2040∑ (S-S)(T-T) =138∑
r =138 ( ( 10)(2040))½
r = 138 142.83r =0.97Conclusion: there is a positive perfect relationshipbetween height and weight
17 MULTIVARIATE ANALYSESMultivariate analysis have more than one departmentvariable. Multivariate means the consistency of the ideaprocedures that enlighten the interrelationships amongstand inside sets of variables. The core or focus ofMultivariate study is to display or exhibit the underlyingarrangement and meaning brought out within these sets ofvariables through use and understanding of severalstatistical designs.
Comparison between Multivariate and Univariatea .Complicatedness The data to analyze may be complicated to use univariatemethod to examine itb .GenuinenessGenuinely, it will not suitable to carry on an analysisusing univariate method instead of Multivariate method
34
c .Experimental dataTo a large extent, Multivariate method is used to analyzeexperimental data.d .Non-experimental dataThe researcher can still use univariate method to analyzeinventory data but still Multivariate method is require tofigure out questions coming up from the data
STRENGTHS AND WEAKNESSES OF MULTIVARIATE ANALYSISAdvantagesi .It is very robust in term of designii .It furnishes diversified stages of analysisiii .It helps in checking Type 1 ErrorDisadvantagesi .It is very complex to understandii .It needed large number of data
The principal aim of Multivariate analysis1 .Anticipation, description and clarification2 .Deciding the arrangement and formation1a .Anticipation: The aim of research settings is to beable to anticipate the consequences founded on previousinformationb .Description and clarification: description andclarification are the final aim of an analysis but it canbe elusive2 Arrangementsa .A diversified aim in Multivariate analysis is todescribe the arrangement of the datab .Procedures require classificationc .The interest of the researcher may be in Factor
35
analysis, Cluster analysis or Stimulus arrangementAnticipation and ArrangementThe aim of the analysis by the researcher may be for bothanticipation and arrangement.
Things researchers must look at when using Multivariateanalysis1 .Selection of primary variable2 . Conversance with former research3 . Instruments the researcher is going to use4 .The researcher need to be an expert in the field ofstudy5 .Most often times, the researcher need to use his commonsense 6 .Prelude analyses will help the researcher to have a fulldescription of any research and improve grip of what isgoing on or taking place in the data 7 .Normality: fundamental premises of General linearPattern; related with an egg-shaped model of remainder forthe data, for instance Skewness :the score is disseminated in a leant form Kurtosis: level of highest data8 .One-dimensionality: the shape of the data when plottedis related to an oval line9 Homoscedasticity is also called uniformity of variance inANOVA methods.10 Uniformity of regression11 .Multiple-correlation and multiple-regression12 . Perpendicularity13 Deviations
How many variables will a researcher consider in his study?
36
It depends on the following:a .Researcher must look ati .The cost of the studyii .Availability of the respondents, secondary data and sooniii .The appealing of the study to the individual,organizations and society at large. iv .The theory being tested by the researcherb .Fewest variables is recommended for easy understandingand effectiveness
Statistical power and effect size 1 .It is vital for the researcher to know that he requireslarge quantities of data in Multivariate analysis and alsoeffect size and model fit should be stressed2 .The matrices in Multivariate analysisa .Data matrixb .Correlation matrix, Rc .Variance/Covarianced .Sum of Squares and cross-products, Se .Predecessor to the Variance/Covariancef Variable's sum of the squared deviations from its averageon the diagonalg .The sum of the multiplications of the difference scoresfor the two variables in the off-diagonal elements.
Overview of Multivariate analysis1 .The Multivariate methods are powerful set of tools foranalyzing various various variables. 2 .They permit in depth investigation of variables3 .Multivariate methods permit the researcher to analyzedifficult numerous variables with less error and high
37
validity
18 ADVANTAGES AND DISADVANTAGES OF QUANTITATIVE RESEARCHAdvantagesi .Constructed theories regarding how and why developmenttake place is tested and validated by quantitative researchii .Quantitative research aid to test the hypotheses thatwere formulated ere the data are gatherediii .When the data are established on haphazard samples ofample size, quantitative research can be used togeneralized the research findingsiv .Quantitative research can be used to generalized aresearch findings that is repeated on many dissimilar populations and subpopulationsv .Quantitative research is helpful for getting data thatpermit quantitative anticipation or forecasting to be madevi .Through the use of quantitative research, a researchermay retrace position that eradicates the confusinginfluence of many variables, permitting one or more tenablyestablish cause-effect relationshipsvii .Data gathering utilizing quantitative procedures iscomparatively fastviii .Quantitative research furnishes accurate, valued,numerical dataix .Quantitative data analysis is comparatively less timeconsumingx .Quantitative research outcomes are comparatively doesnot depend on the researcher xi .
38
xi .It is valuable for studying prominent number of peopleDisadvantagesi .Knowledge acquired might be too theoretical and commonfor explicit use to particular local place, settings andindividualsii .The researcher theories used might not mirror localconstituencies' understandingiii .The researcher might miss out development occurringdue to confirmation bias.
19 CONCLUSIONSThe paper covers the following areas of quantitativeresearch analysis: definitions, general characteristics,key features, data source and data collection,questionnaire, structured interview, levels of measurement,coding scheme, data cleaning, data analysis, data analysisprocedure, sampling, univariate analysis, bivariateanalysis, multivariate analysis, advantages anddisadvantages of quantitative research. Quantitative research is adequate when a researcher ismostly concerned about gathering numerical data toexplicate a specific or detail developments and to answerspecific or special questions It is vital to know that quantitative research utilizesstatistical and mathematical tools to analyze data.Quantitative research method is used because researchersneed to answer research questions with quantitativeanswers, testing of hypothesis and to find out therelationship between dependent and independent variables,relationship among two dependent variables and relationshipamong multiple dependent variables.Quantitative research method is more adequate in searching
39

for the significance of a special cases, consequences andeffects.The paper explained univariate ,bivariate and multivariateanalysis using statistical tools with examples .
40
BIBLIOGRAPHYAnderson,M.L and Taylor..(2009).Sociology: TheEssentials.Belmont.CA: Thompson Wadsmorth. Babbie Earl R. “The Practice of Social Research“12thEdition.Belmont, CA: Wardsworth Cengage,2010.Barbour, Rose.(2007) Doing focus groups. Thousand Oaks, CA:Sage PublicationsBrian Leonard et al.(2011).”Empirical Political Analysis”:Quantitative and Qualitative Research Methods:8th ed, Boston, MA: LongmanChristina Hughes(2014).”Quantitative approaches “Departmentof Sociology, University of Warwick CV47ALDavid,H. R(2008).Research Methods in Public Administrationand Nonprofit Management: Quantitative and Qualitative Approaches:2nd ed.Armonk, NY: Sharps. Hellerstein,Joseph M.(2008).Quantitative Data Cleaning forLarge Databases.EECS Computer Science Division, UC Berkeley.Johnson,H. “Writing a Quantitative Research Thesis”International Journal of Educational Science 1 2009:19-32Nzaboniampa Jean Providence (2009) “Quantitative Analysis”created by Sage
41

Publications 2014.How to write and analyze questionnaire, University ofBristol Dental School,Bristol, Journal of Orthodontics, Vol30, 2003, 245-252.
42


