Embed Size (px)
Citation preview
Quest SQL Optimizer for SAP ASE 3.9
User Guide
Copyright 2018 Quest Software Inc. ALL RIGHTS RESERVED.
This guide contains proprietary information protected by copyright. The software described in this guide is furnished under asoftware license or nondisclosure agreement. This software may be used or copied only in accordance with the terms of theapplicable agreement. No part of this guide may be reproduced or transmitted in any form or by any means, electronic ormechanical, including photocopying and recording for any purpose other than the purchaser’s personal use without the writtenpermission of Quest Software Inc.
The information in this document is provided in connection with Quest Software products. No license, express or implied, byestoppel or otherwise, to any intellectual property right is granted by this document or in connection with the sale of Quest Softwareproducts. EXCEPT AS SET FORTH IN THE TERMS AND CONDITIONS AS SPECIFIED IN THE LICENSE AGREEMENT FORTHIS PRODUCT, QUEST SOFTWARE ASSUMES NO LIABILITY WHATSOEVER AND DISCLAIMS ANY EXPRESS, IMPLIEDOR STATUTORY WARRANTY RELATING TO ITS PRODUCTS INCLUDING, BUT NOT LIMITED TO, THE IMPLIEDWARRANTY OF MERCHANTABILITY, FITNESS FOR A PARTICULAR PURPOSE, OR NON-INFRINGEMENT. IN NO EVENTSHALL QUEST SOFTWARE BE LIABLE FOR ANY DIRECT, INDIRECT, CONSEQUENTIAL, PUNITIVE, SPECIAL ORINCIDENTAL DAMAGES (INCLUDING, WITHOUT LIMITATION, DAMAGES FOR LOSS OF PROFITS, BUSINESSINTERRUPTION OR LOSS OF INFORMATION) ARISING OUT OF THE USE OR INABILITY TO USE THIS DOCUMENT,EVEN IF QUEST SOFTWARE HAS BEEN ADVISED OF THE POSSIBILITY OF SUCH DAMAGES. Quest Software makes norepresentations or warranties with respect to the accuracy or completeness of the contents of this document and reserves the rightto make changes to specifications and product descriptions at any time without notice. Quest Software does not make anycommitment to update the information contained in this document.
If you have any questions regarding your potential use of this material, contact:
Quest Software Inc.
Attn: LEGAL Dept
4 Polaris Way
Aliso Viejo, CA 92656
Refer to our Web site (www.quest.com) for regional and international office information.Patents
Quest Software is proud of our advanced technology. Patents and pending patents may apply to this product. For the most currentinformation about applicable patents for this product, please visit our website at www.quest.com/legal.Trademarks
Quest, and the Quest logo are trademarks and registered trademarks of Quest Software Inc. in the U.S.A. and other countries. Fora complete list of Quest Software trademarks, please visit our website at www.quest.com/legal. All other trademarks, servicemarks,registered trademarks, and registered servicemarks are the property of their respective owners.Legend
WARNING: A WARNING icon indicates a potential for property damage, personal injury, or death.
CAUTION: A CAUTION icon indicates potential damage to hardware or loss of data if instructions arenot followed.
IMPORTANT, NOTE, TIP, MOBILE, or VIDEO: An information icon indicates supporting information.
SQL Optimizer for SAP ASE User GuideUpdated - 31 Jul, 2018Version - 3.9
Contents
Introduction to Quest SQL Optimizer for SAP® ASE 24Performance Diagnostics 24
Performance Optimization 24Performance Management 24Database Administration 24Development 25Functionality 25
New in This Release 25Database Versions Supported 25User Logon Privileges 25Adaptive Server Configuration 28
SELECT permission on database objects 29sa_role privilege 29Create privileges 29Adaptive Server monitoring tables 30mon_role privilege 30Configuration Parameters 30
Enter Authorization Key 32Connect to the Database 32Synchronize the Data Dictionary 33About Product Improvement Program 33SQL Inspector Tutorial 34
Create the Inspector for Monitor Tables 34Create the Inspector for QP Metrics 34Start the Inspector 35View the results 35
SQL Collector for Monitor Server Tutorial 35To use the collector 35
SQL Scanner Tutorial 36Open a Scanner Group 36Add Scanner Jobs 37Scan Jobs 37View scanning results 37
Performance Monitor Tutorial 38Retrieve statistics from monitoring tables 38
SQL Optimizer Tutorial 38Optimize a SQL statement 38Compare SQL alternatives 39
SQL Optimizer for SAP ASE 3.9 User Guide 3
Batch test SQL alternatives 39Review test results 41
Index Advisor Tutorial 42Create Index candidates 42Test index candidates 42
Abstract Plan Manager Tutorial 43Manage Abstract Plans 43
SQL Repository Tutorial 44Add SQL to the SQL Repository 44
Save SQL to the SQL Repository from other modules Tutorial 44Save SQL to SQL Repository 44
Configuration Analyzer Tutorial 45Analyzer Page 45Select SQL Page 45Configuration Page 45Reviewing Configuration Analyzer Results 46
Migration Analyzer Tutorial 46Analyzer Page 46Select SQL Tab 46Migration Page 47Destination Configuration Page 47Reviewing Migration Analyzer Results 47
Index Impact Analyzer Tutorial 48Analyzer Page 48Select SQL Page 48Index Page 48Review Index Impact Analysis Results 49
Index Usage Analyzer Tutorial 49Analyzer Page 50Select SQL Page 50Review Unused Index Analyzer Results 50
Database Explorer Tutorial 50Browse Database Objects 50
Object Extractor Tutorial 51Extract DDL 51
SQL Worksheet Tutorial 51Executing SQL or Transact-SQL 51
Code Finder Tutorial 52Search for Text 52
SQL Formatter Tutorial 52User-Defined Temp Tables Tutorial 53
Create Temporary Tables 53
SQL Optimizer for SAP ASE 3.9 User Guide 4
SQL History Tutorial 53Find Previously Used SQL Statements 53
Preferences Overview 54Optimization Settings for Pre-ASE 15 54Intelligence (Optimization for Pre-ASE 15 Tab) 54Optimization (Optimization Tab) 56Forces (Pre-ASE 15) 58Quota (Pre-ASE 15) 59Abstract Plan (Optimization Tab) 60Optimization Settings for ASE 15 61Intelligence (Optimization for ASE 15 Tab) 62Optimization (Optimization Tab) 63Forces/Goal (ASE 15) 65Criteria 67
Join 67Union Distinct 67Union All 68Group By 68Distinct 68Individual 69
Quota (ASE 15) 70Abstract Plan (Optimization Tab) 71Index Advisor 72Directory Setup 74Directory (1) 74Directory (2) 76Activity Log 77SQL History 78Plan 79SQL Worksheet 80SQL Scanner 81Options (SQL Scanner Tab) 82Abstract Plan (SQL Scanner Tab) 84General (SQL Scanner Tab) 84SQL Classification 86Problematic SQL 87Complex SQL 88Simple SQL 89Invalid SQL 89
No privilege to tables or views 89Using the wrong database or user 90Dynamic SQL statements 90
General (General Tab) 90Message (General Tab) 92
SQL Optimizer for SAP ASE 3.9 User Guide 5
Result Set (General Tab) 93Batch Run (General Tab) 93Editor 93Database Setting 95DDL 96Performance Monitor Preferences 97General Tab 97
Refresh Data Setting 98Preserve Data 99Chart Data Normalization Factor (CNF) 99Show confirmation before closing application (Default = checked) 100
Chart Setting Tab 100Chart Setting 101
Information Tab 102SQL statement 103Highlight selected column 103SQL Filter (executing SQL only) 103Display Connection Information window only when insufficient privileges (Default =checked) 103
Top-N Display Tab 104Syntax Highlight 105
Element options 105Elements 105Foreground color 106Background color 106Editor options 106Reset Default button 106
Auto Correction 107Member and Argument Lookup 108
Member lookup (Default) 109Argument lookup (Default) 109Delay (Default = 0.75 sec, Range = 0.5 to 1.5 sec) 109
Indent and Outdent Text 109Comment and Uncomment Text 109Change Text to Uppercase and Lowercase 110Bracket Pairing 110Customize Editable Panes 111Editor Functions 111Editor Panes Shortcuts 112Send SQL Statement to SQL Optimizer 113
Supported SQL Statements 114Setting Database and User 114SQL from the SQL Scanner 114SQL in a Cursor 114
SQL Optimizer for SAP ASE 3.9 User Guide 6
SQL with Temporary Tables 114Copy to SQL Worksheet 115Send to Index Advisor 115Open SQL from SQL Repository 115Save SQL to SQL Repository 116Create Benchmark Factory Import File 116SQL Navigation 117Modify Data 117
Navigate Data 117Edit a Record 118Insert a Record 118Delete a Record 118Refresh Data 118
Copy Data from a Single Cell 118Comments 119Parameters 119Parameters Window 119Filter Database Objects 121SQL Information Pane 122
Query Plan 122Abstract Plan 122Trace On 122Information 123All Records 123First Record 123Scanner Temp Table (SQL Scanner) 124Checked Details (SQL Scanner) 124Index Advisor Window (Index Advisor) 124Query Plan Overview 124Review Query Plans 125Query Plan Options 126Animate Query Plans 126Copy Query Plans 127Plan Detail 127Quick Find 129Find 129
Options 129Scope 129Direction 130Origin 130
Find Next 130Replace 130
SQL Optimizer for SAP ASE 3.9 User Guide 7
Goto Line 131Performance Monitor Overview 131Performance Monitor Privileges 132Supported Monitor Tables 132
Performance Monitor Window 134Left pane 135
Right Pane for Database Statistics Summary 135Right Pane for Monitor Statistics 135
ASE Overall State Statistics 135ASE Engines Statistics 135Open Database Statistics 136Open Objects 136Cache Statistics 137I/O Statistics 137Device I/O 137I/O Queue 137Network I/O 138Process Statistics 138
Right Pane for Information 138Cache Information 138Process Information 138SQL Statement Information 139Locks Information 139Sys Worker Threads 139Sys Waits 139Error Log 139
Status Bar 140Open the Performance Monitor 140Connect and Disconnect from Database 140
View connection information 141Start and Stop the Performance Monitor 141Manual Refresh Data 142Hide and Show Console Tree 142
Display View for Performance Monitor Charts 142Chart Drill Down 143Lock and Unlock Chart 143Chart Zoom 143Copy Chart 144Print Chart 144Save Chart 144
Performance Monitor Functions 144Performance Monitor Preferences 145General Tab 145
Refresh Data Setting 146
SQL Optimizer for SAP ASE 3.9 User Guide 8
Preserve Data 147Chart Data Normalization Factor (CNF) 147Show confirmation before closing application (Default = checked) 148
Chart Setting Tab 148Chart Setting 149
Information Tab 150SQL statement 151Highlight selected column 151SQL Filter (executing SQL only) 151Display Connection Information window only when insufficient privileges (Default =checked) 151
Top-N Display Tab 152SQL Inspector Overview 153SQL Inspector Privileges 153Performance Statistics - Monitor Tables 154Performance Statistics - QP Metrics 155Data Directory Setting 155Open SQL Inspector 156SQL Inspector Window 156
Inspector List pane 157Statistics Graphs pane 157Statistics pane 157SQL Text pane 158Status Bar Information 158Add/Modify Inspector 158General Information 159Monitor Process (Monitoring Tables) 159Retrieval Criteria (Monitoring Tables) 160Schedule Settings (Monitoring Tables) 162Retrieval Criteria (QP Metrics) 163Schedule Time (QP Metrics) 164
Inspect 165Ad-hoc Inspect 166Abort Inspect 166Scan Inspector 167Find Inspector 167Delete Marked Inspector 168View Inspector Properties 168Place Bookmarks in SQL Inspector Window 169Create Benchmark Factory Import File 169View and Add Charts 169
Statistics 169
SQL Optimizer for SAP ASE 3.9 User Guide 9
No. of Top Consumption SQLs and Percentage of Total Consumption sliders 170Add another chart 170Select the SQL Filtering Criteria 170
Show SQL Satisfying All Charts 170Show SQL Satisfying Any Chart 170
View the SQL text 171Scan Inspected SQL 171Sum Statistics for a Stored Procedure 171SQL Inspector Functions 172SQL Collector for Monitor Server Overview 173Adaptive Server Configuration Parameters for SQL Collector 174
Adaptive Server Version 174Adaptive Server Enterprise Monitor Server 174Monitor Server Name on Client SQL.INI and Server must match. 174Monitor Server Name in Collector setup must match 174Tempdb size 174Logon Privilege 174Adaptive Server parameter 175
Data Directory Setting 175SQL Collector Window 176
Collector List 176SQL Text 177SQL Information 177Status Bar 177
Open SQL Collector for Monitor Server 178Add or Modify a Collector 178General Information 178Monitor Process 179Collecting Criteria 180Schedule Settings 182
Query Plan 183Monitored SQL Statement Types 183
Problematic SQL 183Complex SQL 183Simple SQL 184SQL without Plan 184
Monitor 184Ad-hoc Monitor 185Abort Monitor 185Why use the SQL Scanner to Identify Problematic SQL Statements 186Scan Collectors 186Place Bookmarks in SQL Collector 186
SQL Optimizer for SAP ASE 3.9 User Guide 10
View Particular Types of SQL Statement 187Find Specific Information in Collectors 188
Find Tab 188Text to find 188Options 188
Advanced Tab 188Text to find 188Type 189Search Results 189
Find SQL Statement 189Generate a Report for Monitored SQL Statements 189Collector Properties 190SQL Collector Functions 191SQL Scanner Overview 192SQL Scanner Window 193
Job List Pane 193SQL Text Pane 195
SQL Information Pane 195Status Bar 195
Group Manager Window 196View Group Summary 196View Group Properties 197
General tab 197SQL Summary tab 197
Embedded and Dynamic SQL Statements 198Embedded SQL Statements 198Dynamic SQL Statements 198
What files does SQL Scanner scan? 198Database Objects 198Abstract Plan Groups 198SQL Collector for Monitor Server Files 198SQL Inspector Files 199Text/Binary Files 199COBOL Files 199
Data Directory Setting 199Open SQL Scanner 200
Add Jobs to SQL Scanner 200Add Options 200Summary Options 200
Add Database Objects (Add Jobs Wizard) 201Add Abstract Plan Groups (Add Jobs Wizard) 202Add SQL Collectors from the SQL Collector (Add Jobs Wizard) 202Add SQL Inspectors (Add Jobs Wizard) 203
SQL Optimizer for SAP ASE 3.9 User Guide 11
Add Source Code (Add Jobs Wizard) 204Summary (Add Jobs Wizard) 205
Use Current DB & User 205Scan 206Scan Source Code with Temp Tables 206
Source Code 206After scanning 207
SQL1 207SQL2 207
Review Scanned SQL 207Find Jobs 208Find SQL Using a Text String 209View Job Properties 209
General tab 209SQL Summary tab 210
Open Group Manager while SQL Scanner is Open 210Check Scanned SQL 210
Marking a Scanned SQL Statement as Checked. 211Checked Details 212Unmarking a Checked Scanned SQL Statement. 212Adding the Scanned SQL Statement to Checked List Automatically 212Preserving Checked SQL when rescanning 212
Mark and Unmark All Jobs 213Move or Copy Jobs to Other Group 213Switch Database and User 213Modify a Job 214Place Bookmarks in SQL Scanner 214Open in SQL Collector 214Open in SQL Inspector 215Create Benchmark Factory Import File 215View a Particular SQL Type 215Generate Report for Scanned SQL 216Save Abstract Plan 217Create Benchmark Factory Import File 218SQL Scanner Functions 218
SQL Conversion Overview 220Trigger Conversion 220
Original SQL statement 220After conversion 221
External Parameter Conversion 221Original SQL statement 221After conversion 222
SQL Optimizer for SAP ASE 3.9 User Guide 12
Local Variable Conversion 222Original SQL statement before scanning 222After conversion 222
Cursor Query Plan Conversion 222Into Clause Conversion 223
Original SQL statement 223After conversion 223
COBOL Conversion 223Conversion for variable name 223Conversion for comment 223Conversion for concatenate character 224Original SQL statement 224After conversion 224
Index Advisor Overview 224Index Advisor Window 224
Top Pane 225Left Bottom Pane 225Right Bottom Pane 225Bottom Left Pane 226Bottom Right Pane - SQL Information Pane 227
SQL for Cursor Checkbox 227Cursor Arguments 227
Run Time Tab 228Privileges 229
Statistics Tab 229Chart Tab 230Filter the Run Time Results 232Advise Index Alternatives 232Index Advising Details 233Add Index Alternatives 234
Add user-defined indexes 235Create function-based indexes 235
Create Index Sets 235Delete User-defined Indexes 236Add Index Sets 236Delete user-defined Index Set 236Add and remove index from Index Set 236
Batch Show Plan 236Create Indexes 237Analyze Impact of New Indexes 237Clear All Index Alternatives 237Index Advisor Functions 238
Determine Best Performing Index Alternative 239
SQL Optimizer for SAP ASE 3.9 User Guide 13
Create Indexes for Batch Run 240Selected Index Set 240SQL Termination (Options) 242SQL Termination (Percentage Delay) 243Batch Termination 244
No termination 244Terminate Batch Run if the specified number of index sets fall in the criteria. 244
Run Time Mode 245Batch Run Schedule 246
Schedule setting 247View Batch Run Details 248
SQL Optimizer Overview 248SQL Syntax Transformation 248Applying Adaptive Server Optimization Techniques 249Eliminating Duplicate Query Plan 249Testing for Best Alternative 249Intelligence Level Settings 249Create Your Own Alternative SQL 249
Optimization Engine 250Common Coding Errors in SQL Statements 250What Function Should l Use to Retrieve the Run Time? 251Unsatisfactory Performance Results 251SQL Optimizer Functions 252
SQL Editor Functions 252SQL Editor and Optimized SQL Functions 252Optimized SQL Functions 253SQL Optimizer Window 254
SQL Text 254SQL Information 255Run Time Information 255
Enter Original SQL Statement 255Retrieve Query plan 256Show Default Plan 256Optimize Original SQL Statement 257SQL for Cursor Checkbox 257
Cursor Arguments 258Optimize Using Abstract Plan Only 258Insert User-Defined SQL 259Open Optimized SQL 259Create Benchmark Factory Import File 260Optimized SQL 261
SQL Text 261SQL Information 262Run Time Information 262
SQL Optimizer for SAP ASE 3.9 User Guide 14
Optimization Details Window 262Input Parameter Values 263Analyze Time and Statistics Results 263Analyze Run Time Results 263Analyze Statistics Results 265Analyze Chart Results 267Filter Run Time Results 269Find SQL Using a Text String 270Generate a Report for Optimized SQL 270Verify Correctness of Optimized SQL Statements 270
Run Result 271Number of Records 271First Record 271
Insert User-Defined SQL 271Check Abstract Plan Compatibility 272Save Abstract Plan 273Test for Scalability 274
Save Optimized SQL 274Open Optimized SQL 275View Open Optimized SQL Details 276Refresh Plan Details Window 277Retrieve Run Time for a Group of SQL 278Selected SQL 279SQL Termination (Options) 280SQL Termination (Percentage Delay) 281Batch Termination 282Run Time Mode 284Batch Run Schedule 285Commit or Rollback 287View Batch Run Details 287Run Time 287Retrieve Run Time 288Terminate a Run Time SQL Statement 289Retrieve Run Result 289Commit or Rollback 290Terminate Retrieval of Run Result 290SQL Comparer Overview 290SQL Comparer Window 291Open SQL Comparer Window 292Start and Stop Comparison 292Switch View in SQL Comparer Window 292SQL Comparer Functions 293
Activity Log Overview 293Start Recording Activities to the Activity Log 294
Activity to be logged 294Information to be logged 294
SQL Optimizer for SAP ASE 3.9 User Guide 15
View Activity Log Report 295User Information 295Activity Information 296
Purge Activity Log Data 297Stop Recording Activities 297
SQL Worksheet Overview 298SQL Worksheet Window 298
Command List 298Object Explorer 299Editor Pane 299Information Pane 299
Message Log 299Result 299
Status Bar 299Progress Bar 299Num, Insert, Caps, Scroll 299Modified 300n:n 300nnn bytes 300SPID 300
Execute SQL or Transact SQL 300Retrieve Description of Tables and Views 301Modify Data 301New Database Session 302
Temporary Tables 302Changes to the Data Dictionary 302
Command List 302Save Commands 302Load Commands 302Clear Commands 303
Bookmarks 303SQL Worksheet Functions 304SQL Formatter Overview 305SQL Formatter Window 305
Left Pane (Original SQL) 306Right Pane (Formatted SQL) 306
Format a SQL statement 306Parameters within SQL Formatter 307SQL Formatter Functions 308Database Explorer Overview 309Database Explorer Window 309
Left Pane (Database Objects) 310Right Pane (Object Information) 310
SQL Optimizer for SAP ASE 3.9 User Guide 16
Database Explorer Privileges 310Open Database Explorer 311Modify Data 312Copy column names to another window 312Database Explorer Functions 313Code Finder Overview 313Code Finder Window 314
Search Criteria 314Where to Search 315Search Result 315
Search Database Objects and Files 316For database objects 316For directories and files 316
Regular Expression 316Open Database Object or File in SQL Worksheet 318Extract Object DDL to File 318Save Search Results 319Code Finder Functions 319Object Extractor Overview 320Object Extractor Window 320
Select objects to be extracted [left pane] 321Objects to extract [right pane] 321DDL [bottom pane] 322Buttons 322
Extract Object DDL and Dependencies 322Extraction Criteria 323
Place a DROP command before the object 323Qualify object with database and user name 323Include indexes for table 323Place comments in script 323Show on next extraction 323
Object Extractor Functions 324SQL Repository Overview 324SQL Repository Window 325
SQL Listing [Left pane] 325SQL Listing Details [Top right pane] 325SQL Information Details [Bottom right pane] 326
Properties button 326SQL Information button 326
Save the Abstract Plan 326Add SQL to SQL Repository 326
SQL Optimizer for SAP ASE 3.9 User Guide 17
Add SQL Wizard: General Page 328Add SQL Wizard: SQL Information Page 329
Left pane 329Right Pane 329Check SQL button 329
Add SQL Wizard: Settings Page 330SQL Settings section 330Abstract Plan section 330Database Settings section 330
Refresh SQL Query Plan 331Modify SQL 331Rename SQL 332Delete SQL 332Create Benchmark Factory Import File 333SQL Repository Functions 333Index Impact Analyzer Overview 334
Index Impact Analyzer Window 334Left pane - Analyzer List 335Right Pane 335
Right Pane for Analyzers 336Properties Button 336
Right Pane for Scenarios Analyzed Folder 336Summary button 336Chart button 336
Right Pane for Scenarios 336Properties button 336Prognosis button 337Create/Drop Indexes button 337
Right Pane for SQL Analyzed Folder 337Cost Summary button 337Cost Classification button 337
Right Pane for SQL Statements 338Properties button 338SQL Information button 338Saving the Abstract Plan 338
Create an Index Impact Analyzer 338New Analysis Wizard: Analyzer Page 339
Creating a new Analyzer and select SQL to be analyzed 340Continuing an existing Analyzer using the Analyzer's selected SQL 340Do not drop the indexes after the analysis is finished 340
New Analysis Wizard: Select SQL Page 340Select SQL to check for performance changes: 341SQL query plans to be analyzed: 341
New Analysis Wizard: Index Page 342Query plans will be grouped under a Scenario 342
SQL Optimizer for SAP ASE 3.9 User Guide 18
Enter and select indexes to be analyzed 343Add Index Wizard 343New Analysis Wizard: Abstract Plan Page 345
Baseline Plan 345Scenario 346
Drop Indexes 346, View Index Impact Analysis Details 347Add SQL to an Index Impact Analysis 347Add a Scenario 348
Method One 348Method Two 348
Delete an Index Impact Analysis 349Modify an Index Impact Analyzer 349Regenerate 349Rename an Index Impact Analyzer 350Index Impact Analyzer Functions 350Index Usage Analyzer Overview 351
Index Usage Analyzer Window 351Left pane - Analyzer List 351Right Pane 351
Right Pane for Analyzers 352Index Usage Chart [Top right pane] 352Analysis Information [Bottom right pane] 352
Right Pane for Tables Analyzed 352Summary button 352Chart button 352
Right Pane for Analyzed Table Information 353Prognosis Button 353Unused Index Button 353Table Information Button 353
Right Pane for SQL Analyzed Folder 354Index Used 354
Right Pane for SQL Statements 354Properties button 354SQL Information button 354Index Used button 354
Create an Index Usage Analysis 355New Analysis Wizard: Analyzer Page 355New Analysis Wizard: Select SQL Page 356
Select SQL to check for unused indexes: 357Bottom Pane 357
Update an Index Usage Analysis 357View Index Usage Analysis Details 358Modify an Index Usage Analysis 359
SQL Optimizer for SAP ASE 3.9 User Guide 19
Rename an Index Usage Analysis 359Delete an Index Usage Analysis 360Index Usage Analyzer Functions 360Configuration Analyzer Overview 360
Configuration Analyzer Window 361Left pane - Analyzer List 361Right Pane 362
Right Pane for Analyzers 362Properties Button 362
Right Pane for Scenarios Analyzed 362Summary button 363Chart button 363
Right Pane for Scenarios 363Properties button 363Prognosis button 363Configuration Parameters button 363Apply/Undo Changes button 364
Right Pane for SQL Analyzed Folder 364Cost Summary button 364Cost Classification button 364
Right Pane for SQL Statement 364Properties button 364SQL Information button 364Saving the Abstract Plan 365
Create a Configuration Analysis 365New Analysis Wizard: Analyzer Page 366
Creating a new Analyzer and select SQL to be analyzed 366Continuing an existing Analyzer using the Analyzer's selected SQL 366Do not rollback changes to the ASE configuration parameters 366
New Analysis Wizard: Select SQL page 367Select SQL to check for performance changes: 368SQL query plans will be analyzed: 368
New Analysis Wizard: Configuration Page 368New Analysis Wizard: Abstract Plan 370
Regenerate a Configuration Scenario 372Add a Scenario 372
Method One 373Method Two 373
View Configuration Analysis Details 373Rollback Changes to Configuration Parameters 374Add SQL to a Configuration Analysis 374Modify a Configuration Analysis 375Rename a Configuration Analysis or Scenario 375Delete a Configuration Analysis or Scenario 376
SQL Optimizer for SAP ASE 3.9 User Guide 20
Modify a Configuration Scenario 376Configuration Analyzer Functions 376Migration Analyzer Overview 377
Migration Analyzer Window 377Left pane - Analyzer List 378Right Pane 378
Right Pane for Analyzers 379Properties Button 379
Right Pane for Scenarios Analyzed 379Summary button 379Charts button 379
Right Pane for Scenarios 380Properties button 380Prognosis button 380Database Properties button 380Configuration Parameters button 380Apply/Undo Changes button 380
Right Pane for SQL Analyzed Folder 381Cost Summary button 381Cost Classification button 381
Right Pane for SQL Statement 381Properties button 381SQL Information button 381Saving the Abstract Plan 381
Create a Migration Analysis 382New Analysis Wizard: Analyzer Page 383
Creating a new Analyzer and select SQL to be analyzed 383Continuing an existing Analyzer using the Analyzer's selected SQL 383Do not rollback changes to the ASE configuration parameters 383
New Analysis Wizard: Select SQL Page 384Select SQL to check for performance changes: 385SQL query plans will be analyzed: 385
New Analysis Wizard: Migration Page 386New Analysis Wizard: Destination Configuration Page 387New Analysis Wizard: Abstract Plan 389
Baseline Plan 389Scenario 390
View Migration Analysis Details 390Migration Analysis Results 391
Properties Button 391Prognosis Button 391
Chart Tab 391Summary Tab 392
Configuration Parameters Button 392Apply Changes 392
SQL Optimizer for SAP ASE 3.9 User Guide 21
Add a Scenario 392Method One 392Method Two 393
Rollback Changes to Configuration Parameters 393Add SQL to a Migration Analysis 393Modify a Migration Analysis 394Regenerate a Migration Scenario 394Delete a Migration Analysis or Scenario 395Rename a Migration Analysis or Scenario 395Modify a Migration Scenario 395Migration Analyzer Functions 396Abstract Plan Manager Overview 396Abstract Plan Group 397Why Save the Abstract Plan? 398Abstract Plan Compatibility with Original SQL 399Abstract Plan Manager Window 400
Left Pane 401Right Pane 401
Open the Abstract Plan Manager 401Abstract Plan Group Functions 402Export a Group to a Table 402Import an Abstract Plan for each User 403Abstract Plan ID Functions 404
Viewing the text of the SQL statement 404Use Saved Abstract Plans 405
Using Abstract Plans for Specific Applications 405Using the Abstract Plans Server Wide 405
User-Defined Temp Table Overview 406Create Temporary Tables 406Parameters in Temporary Table SQL 408View SQL scripts of temporary tables 409Drop Temporary Tables 410Example of Temporary Tables in SQL Scanner 410Copy SQL with Temporary Tables to SQL Optimizer 412Create Alternative SQL Which Uses Temporary Tables 412
Original SQL 413SQL1 Alternative 413
Preference Settings for Handling Temporary Tables 413SQL Scanner Tab 413Optimization Tab 414
SQL History Overview 414
SQL Optimizer for SAP ASE 3.9 User Guide 22
SQL History Window 414SQL Text drop-down field 415Last Connection drop-down field 415Last Action drop-down field 415Apply Filter Button 415Button Bar 416Grid 416
Filter SQL Statements 416Recall a SQL Statement 417SQL History Functions 418
SQL Optimizer for SAP ASE 3.9 User Guide 23
Introduction to Quest SQL Optimizer forSAP® ASEQuest SQL Optimizer for SAP ASE enables IT professionals to analyze, predict, preempt, diagnose, optimizeand manage performance changes to ensure that mission-critical business applications run optimally. Itmaximizes application performance by focusing on those database factors that contribute up to 90% ofperformance problems: SQL statements, indexes, and database changes. Quest SQL Optimizer for SAP ASEallows for the management and prediction of performance changes; therefore, changes that will affect thedatabase environment can be managed with the highest degree of certainty. It is the optimal performancechange management solution for production and quality assurance teams.SQL Optimizer has the following main modules and functionality:
Performance Diagnosticsl SQL Inspector
l SQL Collector for Monitor Server
l SQL Scanner
l Performance Monitor
Performance Optimizationl SQL Optimizer
l Index Advisor
l Abstract Plan Manager
Performance Managementl Configuration Analyzer
l Migration Analyzer
l Index Impact Analyzer
l Index Usage Analyzer
Database Administrationl Database Explorer
l Object Extractor
l SQL Worksheet
SQL Optimizer for SAP ASE 3.9 User Guide 24
Developmentl SQL Formatter
l Code Finder
Functionalityl User-Defined Temp Table
l SQL History
l SQL Repository
l Editor Functions
l Activity Log
New in This ReleaseQuest SQL Optimizer for SAP® ASE 3.9 is a maintenance release containing bug fixes and enhancements.
Database Versions SupportedAdaptive Server 15.0 or later is supported.
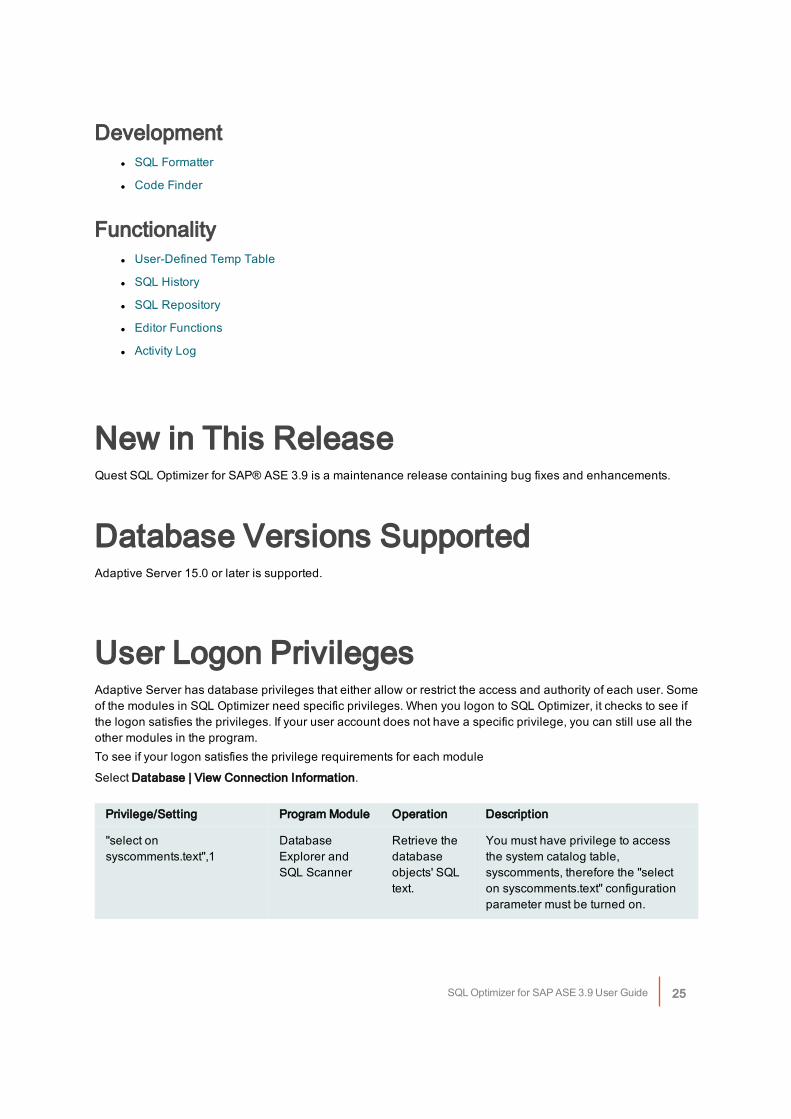
User Logon PrivilegesAdaptive Server has database privileges that either allow or restrict the access and authority of each user. Someof the modules in SQL Optimizer need specific privileges. When you logon to SQL Optimizer, it checks to see ifthe logon satisfies the privileges. If your user account does not have a specific privilege, you can still use all theother modules in the program.To see if your logon satisfies the privilege requirements for each module
Select Database | View Connection Information.
Privilege/Setting Program Module Operation Description
"select onsyscomments.text",1
DatabaseExplorer andSQL Scanner
Retrieve thedatabaseobjects' SQLtext.
You must have privilege to accessthe system catalog table,syscomments, therefore the "selecton syscomments.text" configurationparameter must be turned on.
SQL Optimizer for SAP ASE 3.9 User Guide 25
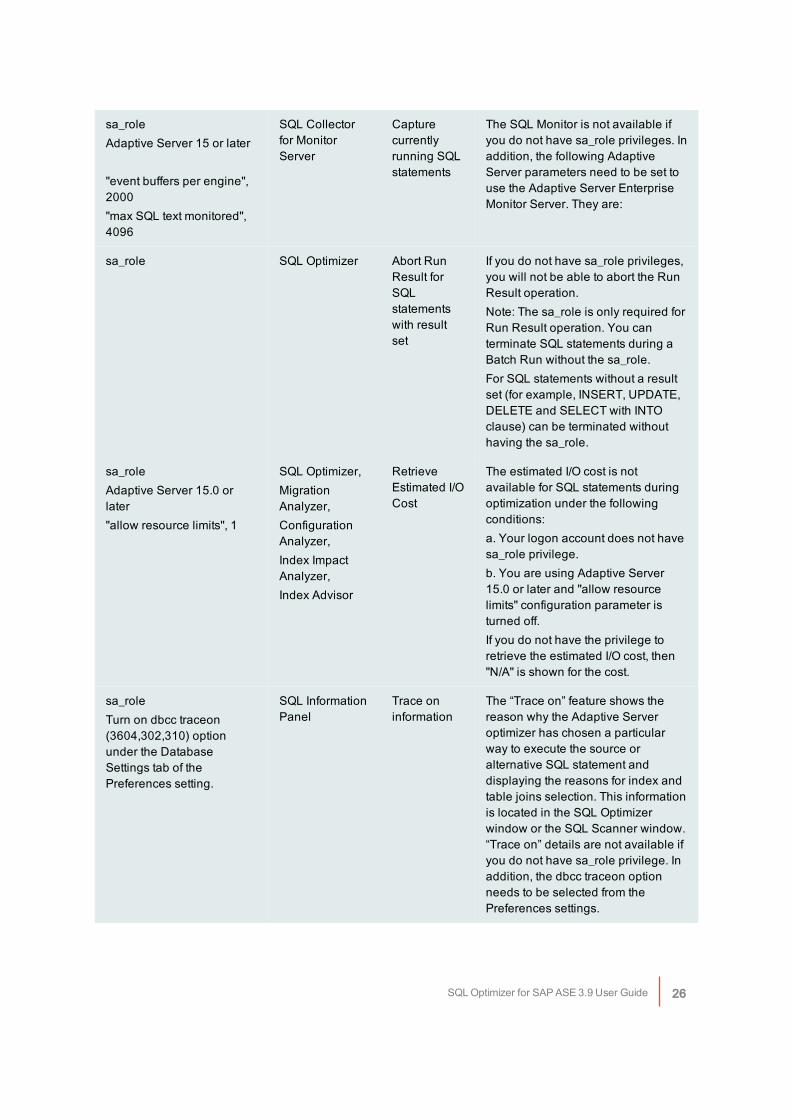
sa_roleAdaptive Server 15 or later
"event buffers per engine",2000"max SQL text monitored",4096
SQL Collectorfor MonitorServer
Capturecurrentlyrunning SQLstatements
The SQL Monitor is not available ifyou do not have sa_role privileges. Inaddition, the following AdaptiveServer parameters need to be set touse the Adaptive Server EnterpriseMonitor Server. They are:
sa_role SQL Optimizer Abort RunResult forSQLstatementswith resultset
If you do not have sa_role privileges,you will not be able to abort the RunResult operation.Note: The sa_role is only required forRun Result operation. You canterminate SQL statements during aBatch Run without the sa_role.For SQL statements without a resultset (for example, INSERT, UPDATE,DELETE and SELECT with INTOclause) can be terminated withouthaving the sa_role.
sa_roleAdaptive Server 15.0 orlater"allow resource limits", 1
SQL Optimizer,MigrationAnalyzer,ConfigurationAnalyzer,Index ImpactAnalyzer,Index Advisor
RetrieveEstimated I/OCost
The estimated I/O cost is notavailable for SQL statements duringoptimization under the followingconditions:a. Your logon account does not havesa_role privilege.b. You are using Adaptive Server15.0 or later and "allow resourcelimits" configuration parameter isturned off.If you do not have the privilege toretrieve the estimated I/O cost, then"N/A" is shown for the cost.
sa_roleTurn on dbcc traceon(3604,302,310) optionunder the DatabaseSettings tab of thePreferences setting.
SQL InformationPanel
Trace oninformation
The “Trace on” feature shows thereason why the Adaptive Serveroptimizer has chosen a particularway to execute the source oralternative SQL statement anddisplaying the reasons for index andtable joins selection. This informationis located in the SQL Optimizerwindow or the SQL Scanner window.“Trace on” details are not available ifyou do not have sa_role privilege. Inaddition, the dbcc traceon optionneeds to be selected from thePreferences settings.
SQL Optimizer for SAP ASE 3.9 User Guide 26
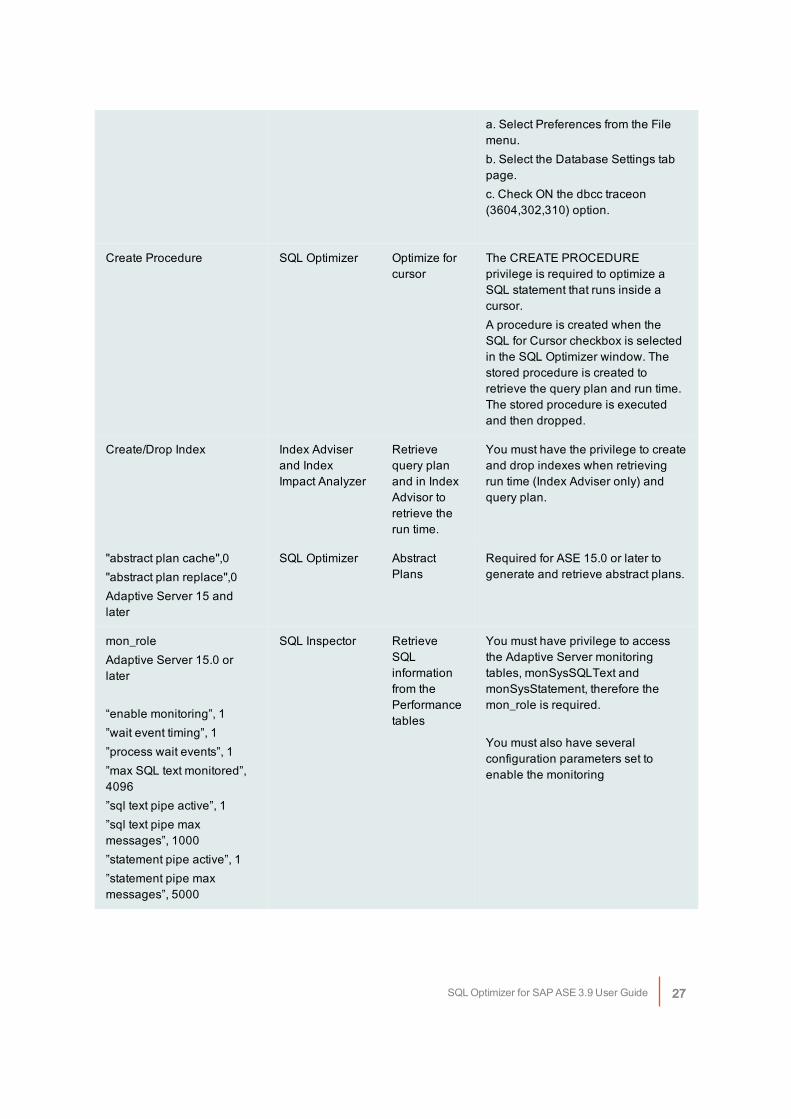
a. Select Preferences from the Filemenu.b. Select the Database Settings tabpage.c. Check ON the dbcc traceon(3604,302,310) option.
Create Procedure SQL Optimizer Optimize forcursor
The CREATE PROCEDUREprivilege is required to optimize aSQL statement that runs inside acursor.A procedure is created when theSQL for Cursor checkbox is selectedin the SQL Optimizer window. Thestored procedure is created toretrieve the query plan and run time.The stored procedure is executedand then dropped.
Create/Drop Index Index Adviserand IndexImpact Analyzer
Retrievequery planand in IndexAdvisor toretrieve therun time.
You must have the privilege to createand drop indexes when retrievingrun time (Index Adviser only) andquery plan.
"abstract plan cache",0"abstract plan replace",0Adaptive Server 15 andlater
SQL Optimizer AbstractPlans
Required for ASE 15.0 or later togenerate and retrieve abstract plans.
mon_roleAdaptive Server 15.0 orlater
“enable monitoring”, 1 ”wait event timing”, 1 ”process wait events”, 1 ”max SQL text monitored”,4096 ”sql text pipe active”, 1 ”sql text pipe maxmessages”, 1000”statement pipe active”, 1 ”statement pipe maxmessages”, 5000
SQL Inspector RetrieveSQLinformationfrom thePerformancetables
You must have privilege to accessthe Adaptive Server monitoringtables, monSysSQLText andmonSysStatement, therefore themon_role is required.
You must also have severalconfiguration parameters set toenable the monitoring
SQL Optimizer for SAP ASE 3.9 User Guide 27
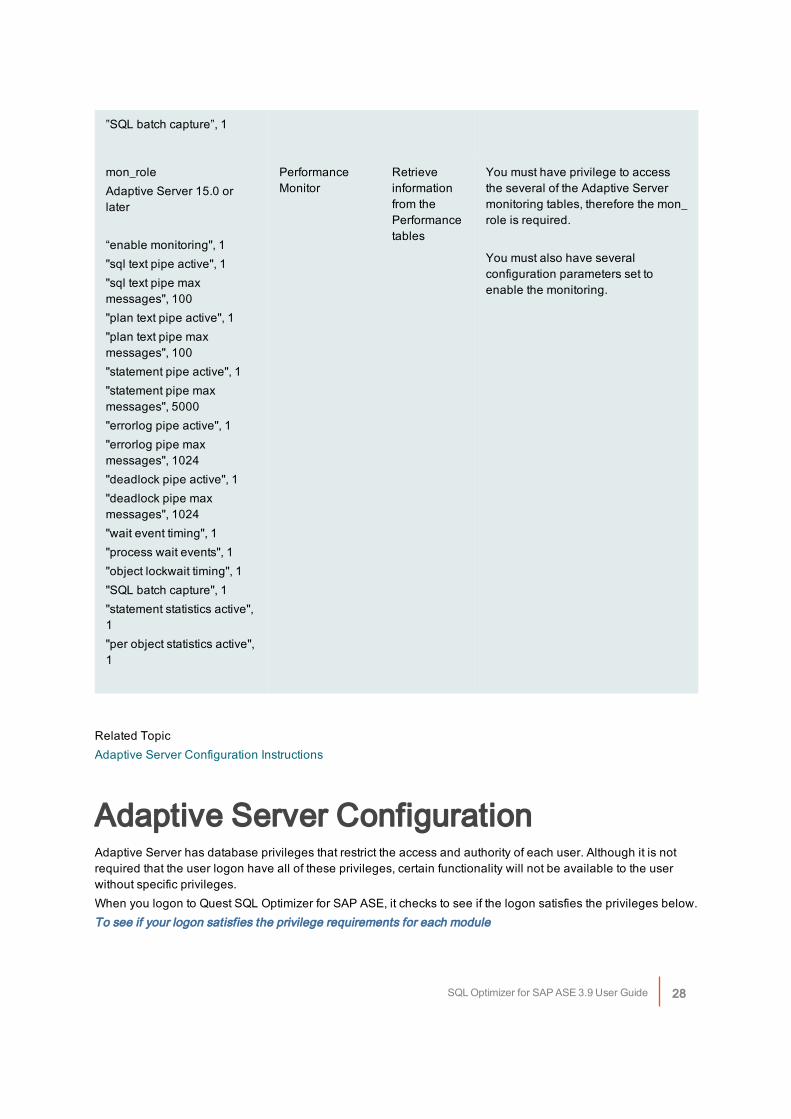
”SQL batch capture”, 1
mon_roleAdaptive Server 15.0 orlater
“enable monitoring", 1"sql text pipe active", 1"sql text pipe maxmessages", 100"plan text pipe active", 1"plan text pipe maxmessages", 100"statement pipe active", 1"statement pipe maxmessages", 5000"errorlog pipe active", 1"errorlog pipe maxmessages", 1024"deadlock pipe active", 1"deadlock pipe maxmessages", 1024"wait event timing", 1"process wait events", 1"object lockwait timing", 1"SQL batch capture", 1"statement statistics active",1"per object statistics active",1
PerformanceMonitor
Retrieveinformationfrom thePerformancetables
You must have privilege to accessthe several of the Adaptive Servermonitoring tables, therefore the mon_role is required.
You must also have severalconfiguration parameters set toenable the monitoring.
Related TopicAdaptive Server Configuration Instructions
Adaptive Server ConfigurationAdaptive Server has database privileges that restrict the access and authority of each user. Although it is notrequired that the user logon have all of these privileges, certain functionality will not be available to the userwithout specific privileges.When you logon to Quest SQL Optimizer for SAP ASE, it checks to see if the logon satisfies the privileges below.To see if your logon satisfies the privilege requirements for each module
SQL Optimizer for SAP ASE 3.9 User Guide 28
1. Select Database | View Connection Information.
2. Determine which of the following database setup and user privileges are needed for your environmentand follow the steps under the following sections.
l SELECT Permission on database objects
l sa_role
l CREATE PROCEDURE
l Adaptive Server Monitor Tables
l mon_role
l Adaptive Server Configuration Parameters
SELECT permission on database objectsIf the user is not the owner of the database objects, the user logon account must have the SELECT permissionon the objects. If the user logon account does not have access to database objects in Adaptive Server, thenthese objects cannot be used or viewed in Quest SQL Optimizer for SAP ASE.
sa_role privilegeThe sa_role privilege is needed for a few functions in Quest SQL Optimizer for SAP ASE. If the logon does nothave this privilege, most of the functionality of Quest SQL Optimizer for SAP ASE is still available.Assign 'sa_role' to the logins needing the following functionality:
l Use the SQL Collector for Monitor Server module.
l Abort Run Result function for SQL statements that return data.
l Retrieve Trace On (dbcc) information
Grant sa_role to the logon using the following command in the SQL Worksheet or ISQL:sp_role 'grant', sa_role, logon_name
Create privilegesThe CREATE PROCEDURE privilege is required to optimize a SQL statement that runs inside a cursor. Aprocedure is created when the SQL for Cursor checkbox is selected in the SQL Optimizer window (in the SQLOptimizer module) or when the SQL Scanner finds a SQL statement that is executed within a cursor declaration.The stored procedure is created to retrieve the query plan and run time. The stored procedure is executed andthen dropped.If the user logon does not have sa_role which includes this privilege, then grant this privilege to the logon usingthe following command in the SQL Worksheet or ISQL:grant create procedure to logon_name
SQL Optimizer for SAP ASE 3.9 User Guide 29
Adaptive Server monitoring tablesThe SQL Inspector and Performance Monitor require installation of the Adaptive Server monitoring table. Laterversions of Adaptive Server create the monitoring tables are by default when you install Adaptive Server. Sodepending on the version of Adaptive Server you are running, you may find these tables already installed. The tables are creating using the installmontables script which is included in the Adaptive Server install and islocated in the $SYBASE/ASE-version/scripts directory (%SYBASE%/ASE-version/scripts for NT). This scriptrequires that a server named "loopback" be included in sysservers.If the monitoring tables are not installed yet in your Adaptive Server, follow these steps to for installing the tables.
1. Create a loopback server entry either using ISQL or SQL Optimizer.In SQL Optimizer:
a. Logon to Quest SQL Optimizer for SAP ASE with sa.
b. In the bottom left corner of the window, set the database to Master.
c. In the SQL Worksheet module, execute: sp_addserver 'loopback', null,server_name
In ISQL
a. Logon to Adaptive Server with sa.
b. Execute: sp_addserver 'loopback', null, serve_name go
2. Execute the installmontables script located in the $SYBASE/ASE-version/scripts directory(%SYBASE%/ASE-version/scripts for NT).
isql -Usa -P<sa password> -Sserver_name-n -i%SYBASE%/%SYBASE_ASE%/scripts/installmontables
mon_role privilegeThe mon_role privilege is needed to run the SQL Inspector and Performance Monitor modules. The sa logondoes not have this role by default, so it needs to be added to the sa logon and any other user logon. Assign'mon_role' to the logins using the SQL Worksheet module or ISQL with this command.
sp_role 'grant', mon_role, logon_name
Configuration ParametersThe following modules require specific settings for Adaptive Server configuration parameters. (You can copy,paste and execute the following script into the SQL Worksheet module)./* parameters for SQL Inspector and Performance Monitor modules using monitoring tables *//* requires Adaptive Server 12.5.0.3 and later */sp_configure "enable monitoring",1gosp_configure "sql text pipe active",1
SQL Optimizer for SAP ASE 3.9 User Guide 30
gosp_configure "sql text pipe max messages",1024gosp_configure "plan text pipe active",1gosp_configure "plan text pipe max messages",5000gosp_configure "statement pipe active",1gosp_configure "statement pipe max messages",5000gosp_configure "errorlog pipe active",1gosp_configure "errorlog pipe max messages",1024gosp_configure "deadlock pipe active",1gosp_configure "deadlock pipe max messages",1024gosp_configure "wait event timing",1gosp_configure "process wait events",1gosp_configure "object lockwait timing",1gosp_configure "SQL batch capture",1gosp_configure "statement statistics active",1gosp_configure "per object statistics active",1gosp_configure "max SQL text monitored",4096go/* parameters for SQL Inspector module using the QP Metrics *//* requires Adaptive Server 15.0 and later */sp_configure 'enable metrics capture',1go/* parameters for Abstract Plan Manager module *//* requires Adaptive Server 12.0 and later */sp_configure "abstract plan cache",0gosp_configure "abstract plan replace",0go/* parameters for retrieving Estimated I/O Cost for query plans */
SQL Optimizer for SAP ASE 3.9 User Guide 31
sp_configure "allow resource limits",1go/* parameters for SQL Collector for Monitor Server module*/sp_configure "event buffers per engine",2000gosp_configure "max SQL text monitored",4096go
/* parameter to access syscomments system table to retrieve DDL for database objects. */
/*Access to the system catalog table, syscomments, is needed to view SQL text for procedures,triggers, views, default and rules objects. If you do not have access to the syscomments systemtable, a message <SQL Text unavailable> will be presented in the Text tab of the DatabaseExplorer window, and you will be unable to scan database object in the SQL Scanner module. */
sp_configure "select on syscomments.text",1go
Enter Authorization KeySQL Optimizer requires an authorization key to use the program. When it is first installed it has a trial key that isgood for thirty days.
To enter another trial key or to enter the production key
1. Select Help | Register.
2. Enter the key.
3. When you enter a production key after purchasing the product, you must also enter the Site Messageinformation.
4. Click OK.
Connect to the DatabaseWhen SQL Optimizer starts, a User Logon dialog field displays for you to connect to the AdaptiveServer database.
Item Description
Login name Enter the login name required to connect to the database.
Password Enter the password associated with the login name.
Server name Enter the Adaptive Server name as defined in the client configuration.
SQL Optimizer for SAP ASE 3.9 User Guide 32
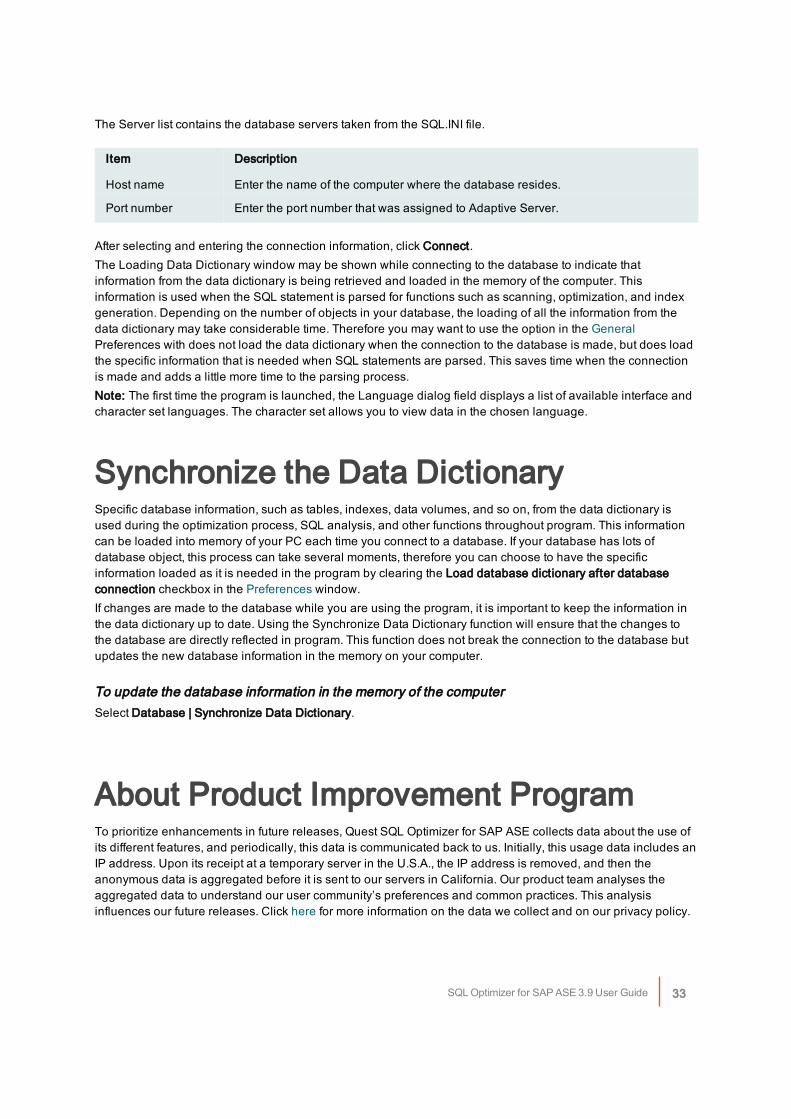
The Server list contains the database servers taken from the SQL.INI file.
Item Description
Host name Enter the name of the computer where the database resides.
Port number Enter the port number that was assigned to Adaptive Server.
After selecting and entering the connection information, click Connect.The Loading Data Dictionary window may be shown while connecting to the database to indicate thatinformation from the data dictionary is being retrieved and loaded in the memory of the computer. Thisinformation is used when the SQL statement is parsed for functions such as scanning, optimization, and indexgeneration. Depending on the number of objects in your database, the loading of all the information from thedata dictionary may take considerable time. Therefore you may want to use the option in the GeneralPreferences with does not load the data dictionary when the connection to the database is made, but does loadthe specific information that is needed when SQL statements are parsed. This saves time when the connectionis made and adds a little more time to the parsing process.Note: The first time the program is launched, the Language dialog field displays a list of available interface andcharacter set languages. The character set allows you to view data in the chosen language.
Synchronize the Data DictionarySpecific database information, such as tables, indexes, data volumes, and so on, from the data dictionary isused during the optimization process, SQL analysis, and other functions throughout program. This informationcan be loaded into memory of your PC each time you connect to a database. If your database has lots ofdatabase object, this process can take several moments, therefore you can choose to have the specificinformation loaded as it is needed in the program by clearing the Load database dictionary after databaseconnection checkbox in the Preferences window.If changes are made to the database while you are using the program, it is important to keep the information inthe data dictionary up to date. Using the Synchronize Data Dictionary function will ensure that the changes tothe database are directly reflected in program. This function does not break the connection to the database butupdates the new database information in the memory on your computer.
To update the database information in the memory of the computerSelect Database | Synchronize Data Dictionary.
About Product Improvement ProgramTo prioritize enhancements in future releases, Quest SQL Optimizer for SAP ASE collects data about the use ofits different features, and periodically, this data is communicated back to us. Initially, this usage data includes anIP address. Upon its receipt at a temporary server in the U.S.A., the IP address is removed, and then theanonymous data is aggregated before it is sent to our servers in California. Our product team analyses theaggregated data to understand our user community’s preferences and common practices. This analysisinfluences our future releases. Click here for more information on the data we collect and on our privacy policy.
SQL Optimizer for SAP ASE 3.9 User Guide 33
l No personal information is collected
l You can stop participating at any time
To initiate participation in Product Improvement ProgramSelect Help | Product Improvement Program and select Yes, I want to participate
To cancel participation in Product Improvement ProgramSelect Help | Product Improvement Program and select No, thank you
SQL Inspector TutorialThe SQL Inspector monitors SQL statements and extracts SQL performance statistics from the Adaptive Servermonitoring tables. The SQL Inspector also extracts SQL statements from the QP Metrics (sysquerymetrics view).The SQL Inspector graphically displays and compares SQL activity statistics to diagnose performancebottlenecks. With the SQL Inspector you can identify the Top-N most resource intensive SQL statements.
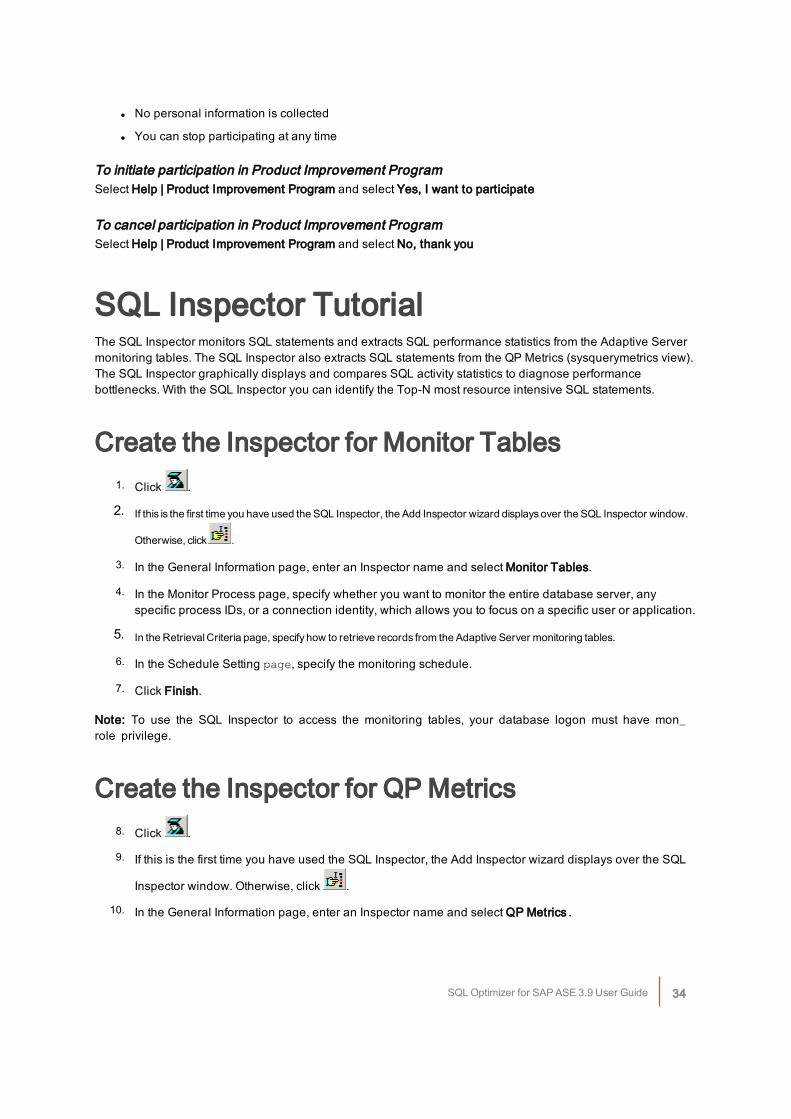
Create the Inspector for Monitor Tables1. Click .
2. If this is the first time you have used the SQL Inspector, the Add Inspector wizard displays over the SQL Inspector window.
Otherwise, click .
3. In the General Information page, enter an Inspector name and select Monitor Tables.
4. In the Monitor Process page, specify whether you want to monitor the entire database server, anyspecific process IDs, or a connection identity, which allows you to focus on a specific user or application.
5. In the Retrieval Criteria page, specify how to retrieve records from the Adaptive Server monitoring tables.
6. In the Schedule Setting page, specify the monitoring schedule.
7. Click Finish.
Note: To use the SQL Inspector to access the monitoring tables, your database logon must have mon_role privilege.
Create the Inspector for QP Metrics8. Click .
9. If this is the first time you have used the SQL Inspector, the Add Inspector wizard displays over the SQL
Inspector window. Otherwise, click .
10. In the General Information page, enter an Inspector name and select QP Metrics.
SQL Optimizer for SAP ASE 3.9 User Guide 34
11. In the Retrieval Criteria page, select the Users and Group IDs for the SQL you would like to extract andthe number of SQL statements you would like.
12. In the Schedule Time page, specify when to start the inspection.
13. Click Finish.
Start the Inspector14. Click .
View the results15. Review the Top-N SQL statements chart used for filtering statements and a table with detailed SQL
performance statistics.
16. Click if you want to add multiple charts to filter captured SQL statements by specifying a Top-N SQLcriteria of performance statistics.
17. To filter collected SQL statements, use the No. of Top Consumption SQL and Percentage of TotalConsumption sliders.
18. Click the performance statistics line on the grid to view the SQL text in the bottom pane of the window.
19. Once you have identified potentially problematic SQL statements you can send the SQL using the Editmenu to the SQL Optimizer or Index Advisor.
Related TopicSQL Inspector Overview
SQL Collector for Monitor Server TutorialThe SQL Collector for Monitor Server allows you to capture from the ASE Monitor Server any currently executingSQL statements according to your user-defined criteria. Each SQL statement captured is categorized accordingto suspected levels of performance problem.
To use the collector1. Create the Collector
a. Click . The SQL Collector window displays, followed by the Add Collector wizard if you have
not created a Collector before. If the Add Collector wizard does not display, click .
SQL Optimizer for SAP ASE 3.9 User Guide 35
b. Enter a Collector name and the Adaptive Server Enterprise Monitor Server name. Check that theother settings satisfy your requirements. Define a monitoring end time on the Schedule page onthe Add Collector wizard.
c. Click Finish.
2. Start the Collector
a. Click to begin capturing executing statements.
b. Details display in the SQL Collector grid as the information accumulates.
c. The monitoring process stops at the end time you define under the Schedule page in theAdd Collector wizard.
3. View the results
a. To view the retrieve SQL statements, select the newly added Collector row.
b. In the SQL Text pane, click the tabs, SQL1, SQL2, and so forth to see the captured SQLstatements. The SQL Information pane displays the query plan information.
c. Select one SQL statement you want to analyze for performance improvement. Clickto optimize the SQL statement in the SQL Optimizer. Alternatively, you can also send the
SQL statement to the Index Advisor. Click .
Related TopicSQL Collector for Monitor Server Overview
SQL Scanner TutorialUse the SQL Scanner to analyze SQL statements embedded within database objects, text/binary files, AbstractPlan Groups, SQL Collector for Monitor Server files, SQL Inspector files, and application source code. The SQLScanner extracts each SQL statement embedded within the scanned database objects and files, retrieves theirrespective query plans from Adaptive Server, and then performs an analysis that determines which of these SQLstatements may be a performance bottleneck. You can copy the SQL statements analyzed as problematic (toppriority) or complex (second priority) into the SQL Optimizer, or Index Advisor, and/or examine the extracted SQLstatements with their query plans.
Open a Scanner Group1. Click .
2. When you scan the database objects or the application files, you first create a Group to store the itemsyou want to scan.
SQL Optimizer for SAP ASE 3.9 User Guide 36
3. If this is the first time you have used the SQL Scanner, the Create Group window displays. Otherwise,click Create in the Group Manager window.
4. Enter a new Group name, e.g. "Test." Click OK to close the Create Group window.
5. Check that your new Group name is highlighted in the list field. Click Open.
Add Scanner Jobs6. The selected group is opened in the SQL Scanner window. For a new Group, the Add Jobs wizard is
automatically opened so you can select what files or database objects you want to scan.
Note: If you are using an existing Group, click .
7. In the Add Jobs wizard, select the page for the item that you want to scan. You can select DatabaseObjects, Abstract Plan Groups, SQL Collector for Monitor Server files, SQL Inspector files, andapplication Source Code in text or binary format. Click Finish.
Scan Jobs8. Click .
9. Details are filled in the Job List as the scanning process completes each job. It will show you how manySQL statements found in the Job and how each SQL statement is classified.
View scanning results10. To view the scanned SQL statements, highlight the job by clicking the row.
11. The first SQL statement found is shown in the SQL Text pane. Click the tabs, e.g. SQL1, SQL2, SQL3,etc., at the bottom left of the pane to view the other SQL statements.
12. Notice the buttons on the top of the SQL Information pane. These buttons display in the, the query plan,the abstract plan, Trace On information, the SQL classification and connection information, the DDL fortemporary tables used by the SQL, and the Checked SQL information about SQL statement that youare reviewing.
13. You can narrow the number of original SQL statements to view only the problematic and/or complexstatements with View | Problematic SQL and/or View | Complex SQL.
14. Select one SQL statement you want to analyze for performance improvement. Click to copy the SQLstatement to the SQL Optimizer window and start the optimization process. Alternatively, you can also
send the SQL statement to the Index Advisor. Click to copy the SQL statement to the Index Advisorwindow and generate index options.
Related Topic
SQL Optimizer for SAP ASE 3.9 User Guide 37
SQL Scanner Overview
Performance Monitor TutorialThe Performance Monitor monitors and retrieved database performance statistics and performance diagnosticsmetrics from the Adaptive Server (15.0 and later) monitoring tables. The collected statistics are presentedgraphically and provides a Top-N view that displays the overall database performance health. The graphicalview makes it possible to drill down to get the details of different performance statistics such as engines, CPU,devices, processes, cache, lock, and others.
Retrieve statistics from monitoring tables1. Click .
2. In the Performance Monitor window enable on the left tree view the detailed performance statistics thatyou want to monitor. By default, general performance statistics are enabled for monitoring.
3. Click to start the monitoring process.
4. Click to stop the monitoring process.
Note: Monitor options and refresh intervals can be changed by in File | Preferences.
Related TopicPerformance Monitor Overview
SQL Optimizer TutorialDue to complex nature SQL, there may be many SQL statements that return the same result set, but only a fewthat may be efficient. The SQL Optimizer applies advanced SQL transformation technology to generate a list ofsemantically equivalent SQL statements. To identify the most efficient SQL statement for your databaseenvironment you can benchmark test the SQL alternatives in your database.
Optimize a SQL statement1. Open the SQL Optimizer window by clicking .
2. After entering a SQL statement in the SQL Editor pane of the window, click . This step launches theSQL Optimizer that automatically transforms the SQL statement.Notes:
l The use of forces and other optimization options such as temp table generation, ANSI
SQL Optimizer for SAP ASE 3.9 User Guide 38
JOIN syntax are optional and configurable in the Preferences.
l The intensity of the SQL transformation process is controlled by the Intelligence Level inthe Preferences. The Intelligence Levels control how many forces are applied totransformed SQL and how many SQL alternatives are created.
l If your SQL statement uses a temporary table, see section User-Defined Temp Table forthe steps to create a temporary table in the User-Defined Temp Table module.
3. After optimization, the Optimization Details window shows the total number of semantically equivalentSQL statements, the number of alternative statements with query plans different from your original SQLstatement, and a warning message if the number of SQL transformations reaches any of the optimizationquotas set in the Preferences.
4. Click OK to close the Optimization Details window.
5. In the SQL Optimizer window, look at the tabs which are labeled ALT1, ALT2, ALT3, etc. By clickingthe tabs you can see the alternative SQL statements that were created by the SQL optimization process.The query plan for each SQL statement displays beside the SQL text.
6. At the bottom left of the SQL Optimizer window are three tabs, Time, Statistics, and Charts, whichdisplay the statistics for each SQL statement after it is executed. At this point since you have not yet runthe SQL statements, it displays only the Estimated I/O Cost values. These are only estimations of howeach statement will perform. You need to test each statement to obtain its actual run time statistics.
7. In the SQL Optimizer window, look at the right pane to see the query plan for the SQL statement.
Compare SQL alternatives8. To see how an alternative SQL statement differs from your original SQL, you can compare these
statements side-by-side.
l Click . Your original SQL statement displays in one pane of the window and analternative statement in another pane. Blue highlighted items in one pane show the areawhere there is a difference from the SQL statement displayed in the other pane.
l At the bottom of the SQL Comparer window, click the Show query plan checkbox todisplay the query plan for both SQL statements.
l Select File | Close SQL Comparer.
Batch test SQL alternatives9. To prepare to execute the original and the alternative SQL statements, click .
10. In the Batch Run Criteria window, select the SQL statements that you would like to run in batch. Noticethe tabs at the top of the Batch Run Criteria window.
11. Selected SQL Tab
SQL Optimizer for SAP ASE 3.9 User Guide 39
l Select which SQL statements are to be executed. The blue checkmark in the left columnindicates that the SQL statement is selected. By default, all statements are executed.
l To deselect a statement, click that SQL statement in the SQL column, forinstance click ALT1.
l To deselect all the SQL statements, right-click and select Unselect All.
l To save time when testing run all generated alternatives, a filter function is provided tohelp you to precisely select the alternatives to test run. Click the Apply SQL Selection
filter checkbox. Click to select and apply criteria to narrow down the SQL alternativesto test run.
12. SQL Termination TabSelect the option for terminating the execution of your original and the alternative SQL statements. TheSQL Optimizer generated all the alternative SQL statements in order to find the optimal SQL. Some ofthose alternatives may run faster than the original SQL, others may run longer. Therefore, you can setthe termination criteria to cancel the longer running SQL statements and save database-processing timefor the overall batch test. You have these options for terminating your SQL.
l Original SQL: Terminate the SQL statement when it has run as long as the original SQL.
l Best running time SQL: Run the first SQL statement and use the time from that statementas the termination time. When a SQL statement runs faster than this time, use the fastertime as the new termination time, so you are always using the fastest run time as thetermination time for the next SQL statement.
l User-defined time: Set your own termination time. If your original SQL statement takes along time to execute and there are many alternative statements, executing all statementsmay take considerable time. In that event, consider setting an aggressive user-definedtermination time. If the original takes 1 hour, try a 5-minute termination time. If noalternative statements execute in under that period, raise the termination time to 10minutes, etc.
l You can also combine User-defined time with Original SQL or Best running time SQL byclicking the Or User-defined time checkbox next to each one.
13. Batch Termination TabSelect the option for terminating the Batch Run.
l No termination: Specify to run the Batch Run to completion.
l Terminate Batch Run if the specified number of SQL falls in the criteria:
Specify to terminate the Batch Run when a specified number of SQL statements are found thatmeet the following requirements for terminating the Batch Run.
Number of SQL (excluding Original): Specify how many SQL statements must be found thata show performance improvement over the Original SQL.Count the SQL if it elapsed time is faster than: Specify one of the following criteria todetermine how the performance improvement is determined.
Original SQL: Count all SQL statements that run faster than the run time from theOriginal SQL.Original SQL with a percentage of improvement: Count all SQL statements wherethe run time for the alternative SQL statement is the specified percentage faster thantime for the Original SQL statement.
SQL Optimizer for SAP ASE 3.9 User Guide 40
User-defined time (mins/secs): Count all SQL statements that run faster than aspecified number of minutes and/or seconds.
14. Run Time Mode Tab
l Run to retrieve: Select First Record to find the time to process the first record. Select All Records to findthe time to process all records. You must run the Batch Run twice to get both times.
l Retrieve the run time by executing: Select the number of times to run each SQL alternative. SQLstatements can be run more than once to eliminate data caching time and obtain more accurate run timestatistics.
Note: The Batch Run function provides an efficient way of benchmarking SQL. It runs the selected SQLstatements in the database and the SQL statements that exceed the termination time are cancelled. The BatchRun retrieves the time the SQL statement executes in the database and does not retrieve the result set from thedatabase server to the client; so it does not create additional network traffic. For SQL statements such asSELECT...INTO, INSERT, DELETE and UPDATE, each statement is run in a transaction that is ROLLBACK,therefore maintaining the consistency of your data.
15. Batch Run Schedule Tab
l Start: Select the time you would like the Batch Run to starting executing.
l Until: Select the option for when the Batch Run should finish.
16. To execute the original and the selected alternative SQL statements, click OK. The Batch Run windowopens enabling you to view the results as each statement executes.
17. At the completion of the entire job, the Batch Run Details window replaces the Batch Run window. Thiswindow provides greater detail about each SQL statement. Click OK.
Review test results18. Click the Time tab in the SQL Optimizer window to see the columns in the SQL Run Time pane which
contain the time to execute the entire statement (all records) and/or the time to retrieve only the firstrecord for each SQL statement from the Batch Run.
19. Once you have identified the most-efficient alternative SQL statement to deploy it:
l You can copy and paste it back in your application.
l If your SQL statement comes from a database objects, you can open the database object source code inthe SQL Worksheet anYou can save the alternative SQL statement in a text file either individually ormultiple SQL statements in the optimized SQL report. d modify the SQL with the best alternative.
l You can save your SQL optimization results for later review. Select SQL | Saved Optimized SQL.
l If you want to use abstract plans to implement the most-efficient query plan, you should have enabledbefore optimization dump abstract plan in the Optimization Preferences. If abstract plans are displayed in
the SQL Optimizer window, click . Select the abstract plan group and check that the abstract plan iscorrect. Only save abstract plans that are compatible. Select Save. This process saves the abstract planto the database in the specified abstract plan group, so the next time you execute the same SQLstatement, the saved abstract plan determines the query plan.
Related Topic
SQL Optimizer for SAP ASE 3.9 User Guide 41
SQL Optimizer Overview
Index Advisor TutorialThe Index Advisor analyzes the syntax of a SQL statement and the database structure and then proposes newindex candidates to help improve performance. It provides detailed information on the suggested indexes, suchas, space requirements and selectivity. The index recommendations can be benchmarked to identify whichindex yields the greatest performance gain. It also enables you to create your own indexes for testing.
Create Index candidates1. Click .
2. In the top pane under the SQL Editor tab, enter the SQL statement for which you want to analyze forindex recommendations.
Note: To copy a SQL statement from other windows such as SQL Scanner or SQL Optimizer, click .
3. Click to see the current query plan and get a list of the indexes used in the current query plan. Thisindex information displays in the Used Index tab of the bottom pane.
4. Click .
5. From the Select Tables to Provide Indexes window, select the tables on which you wantrecommendations for new indexes and specify the sampling size of each table to calculateselectivity. Click OK.
6. Once the advising process is completed, the Index Advising Details window displays detailing the indexcandidates. Click OK.
7. The index candidates are displayed on the bottom left pane on the tabs labeled Index1, Index2,…IndexN. The Used Index tab displays the DDL for the index(es) currently used by the original SQLstatement. The corresponding query plan, abstract plan, SQL classification, trace on and Sort Resourceinformation are displayed in the SQL Information pane at the bottom right.
8. You can add your own index candidates using . This option displays a GUI for you to create indexesfor analysis.
Test index candidates9. To get the actual run time information for the SQL statement under every index scenario, click .
Select your benchmarking options in the Batch Run Criteria window. Click OK.
Important Note: This process may impact your database server. Specify the index creation options such as thesegment where the index is going to be physically created, and then dropped, and the number of consumers.
SQL Optimizer for SAP ASE 3.9 User Guide 42
10. The Batch Run window opens enabling you to view the results as each statement executes.
11. At the completion of the entire job, the Batch Run Details window replaces the Batch Run window. Thiswindow provides greater detail about each SQL statement. Click OK.
12. Click the Time tab in the Index Advisor window to see the results of the Batch Run.
13. To analyze the impact of every index alternative on the query plans of other SQL statements, click .
Related TopicIndex Advisor Overview
Abstract Plan Manager TutorialThe Abstract Plan Manager provides a window for you to easily view, create, delete and modify your abstractplan groups.In Adaptive Server version 15 and later, the abstract plan enables you to influence the optimization of a SQLstatement without having to modify the SQL statement syntax. If you cannot change the source code thatcontains your SQL statement, you can use the abstract plan to force Adaptive Server to use a specific query planfor a SQL statement. This is particularly useful if you have third party applications where you do not have accessto the source code.
Manage Abstract Plans1. Click to open the Abstract Plan Manager window.
2. You can navigate within the Abstract Plan Manager to work with abstract plan groups or individual planswithin any database, and all functions within this module are available from the right-click menu.
3. To create a new abstract plan group, right-click and select Group | Create.
4. Select under which database you want this group created (or if you want this created in all databases,select the checkbox Create in all databases) and name your abstract plan group.
5. With already created groups, there are many functions you can employ by right-clicking a groupincluding dropping or purging a plan group, performing an import or export of a plan group, or evencomparing plan groups.
6. Locating an abstract plan can be done at any level in the tree structure by selecting Find Abstract Plan |Text, or ID.
7. Individually plans can be manipulated by drilling down to a specific Plan ID and specifying whether youwould like to drop, copy, or edit an individual abstract plan.
Related TopicAbstract_Plan_Manager_Overview
SQL Optimizer for SAP ASE 3.9 User Guide 43
SQL Repository TutorialThe SQL Repository stores the SQL statements that are used in the analysis of database performance. Thesemay be SQL statements that you have identified as critical to the performance of your database application.
Add SQL to the SQL Repository1. Click to open the SQL Repository window. If no SQL exists in the SQL Repository, then the Add SQL
wizard displays automatically. Otherwise, you can open the Add SQL wizard by clicking .
2. In the Add SQL wizard enter the SQL text in the SQL Information page.
The SQL syntax is checked and the query plan retrieved before adding a new node to the SQL tree view withthe SQL name. Each SQL statement added to the SQL Repository contains a query plan, SQL classificationtype (Simple, Complex or Problematic) and the current connection information (login name, server name,database and user). The query plan stored with the SQL statement is important as it indicates the currentperformance of the SQL.
Related TopicSQL Repository Overview
Save SQL to the SQL Repository fromother modules TutorialYou can save SQL statements to the SQL Repository from the SQL Inspector, SQL Collector for Monitor Server,SQL Scanner, SQL Optimizer, and SQL Worksheet.
Save SQL to SQL Repository1. Click .
2. Select the location in which to save the SQL statements and click OK.
Note: If you are using this function from the SQL Scanner or SQL Inspector window you need to select whichJob or Inspector to be added first. Only valid SQL statements are saved to the SQL Repository.
Related TopicSQL_Repository_Overview
SQL Optimizer for SAP ASE 3.9 User Guide 44
Configuration Analyzer TutorialThe Configuration Analyzer evaluates the effect on SQL performance when changing Adaptive Serverparameter settings. It enables you to analyze whether the database performance may improve before you makeconfiguration parameter changes permanent.
1. Click .
2. Click . If this is your first time in the Configuration Analyzer, the New Analysis wizard automatically opens.
Analyzer Page3. In the New Analysis wizard, under the Analyzer page, specify if you want to check the effects of configuration changes by
either Creating a new Analyzer or Continuing an existing Analyzer.
4. Give the analysis a name and description for easy reference.
5. If you would like to create a folder for better organization of your analysis, click .
Select SQL Page6. Select the source of the SQL statements for Analysis: SQL Repository or SQL Scanner.
7. Select the SQL statement(s) to add to the Analysis from your predefined SQL statements, or you may add
a statement to this Analysis by clicking .
8. Under the SQL Query Plans will be analyzed section, select the options for retrieving your query plan.
l Using existing query plan saved with the SQLThis option uses the query plan that was saved with the SQL statement at the time thatstatement was saved to the SQL Repository, or scanned in the SQL Scanner.
l Obtaining a new query plan under the current connectionThis option retrieves the query plan with the current database logon. This current
query plan is compared to the query plan that is retrieved after executing theconfiguration changes.
Configuration Page9. Select to view the configuration parameters for the various options within Adaptive Server.
10. Make any parameter changes by inserting a value in the New Value column.
11. Click Finish to perform the analysis.
SQL Optimizer for SAP ASE 3.9 User Guide 45
Reviewing Configuration Analyzer Results12. After the analysis, you can see the overall results by clicking the Analyzer, and its related information, in
the tree structure in the left pane and viewing the corresponding information in the panes to the right.
13. In the right pane for the Scenarios, click Prognosis to see overall performance changes and SQL details.
Related TopicConfiguration_Analyzer_Overview
Migration Analyzer TutorialThe Migration Analyzer helps you to preempt performance degradation when performing database migrations,upgrades, and application rollouts. It ensures reliable database performance by tracking query plan and costchanges. You have an option to integrate abstract plan management to help stabilize SQL performance duringmigrations.
1. Click .
2. Click . If this is your first time in the Migration Analyzer, the New Analysis wizardautomatically opens.
Analyzer Page3. In the New Analysis wizard, under the Analyzer page, specify if you want to check the effects of database
migration by either Creating a new Analyzer or Continuing an existing Analyzer.
4. Give your analysis a name and description for easy reference.
5. If you want to create a folder for better organization of your analysis, click .
Select SQL Tab6. Select the source of the SQL statements for Analysis: SQL Repository or SQL Scanner.
7. Select the SQL statement(s) to add to the Analysis from your predefined SQL statements, or you may add
a statement to this Analysis by clicking .
SQL Optimizer for SAP ASE 3.9 User Guide 46
8. Under the SQL Query Plans will be analyzed section, select the options for retrieving your query plan.
l Using existing query plan saved with the SQLThis option uses the query plan that was saved with the SQL statement at the time that statementwas saved to the SQL Repository, or scanned in the SQL Scanner.
l Obtaining a new query plan under the current connectionThis option retrieves the query plan with the current database logon that is assumed to be thesource Adaptive Server instance you are migrating from. This current query plan is compared tothe query plan that is retrieved from the destination Adaptive Server instance for the migration.
Migration Page9. Give a name and description to your Analysis Scenario (i.e. "Migration to ASE 15.0").
10. Specify the connection information of the destination Adaptive Server instance including login name,
password, and server name. If you want to test the specified connection, click .
11. Select whether to use the default database and user or whether you want to login with different databaseand user information.
Destination Configuration PageThe Destination Configuration page is used to change the database parameters on the migration database andonly available after you have entered your migrating database connection information on the Migration page.
12. You can switch the list of configuration parameters for Adaptive Server available in the parameter grid byselecting the parameter category from the Show configuration parameters for drop-down list
13. Make any parameter changes by inserting a value in the New Value column.
14. Click OK to perform the analysis.
Reviewing Migration Analyzer Results15. After the analysis, you can see the overall results by clicking the Analyzer, and its related information, in
the tree structure in the left pane and viewing the corresponding information in the panes to the right.
16. In the right pane for the scenario, click Prognosis to see overall performance changes and SQL details.
Related TopicMigration Analyzer Overview
SQL Optimizer for SAP ASE 3.9 User Guide 47
Index Impact Analyzer TutorialIndex Impact Analyzer allows you to analyze the impact of new indexes on other SQL statements inyour database.Note: The indexes that are used in these scenarios will be physically created in order to retrieve the query plansfor analysis and then dropped.
1. Click .
2. Click New Analysis. If this is your first time in the Index Impact Analyzer, the New Analysis wizardautomatically opens.
Analyzer Page3. In the New Analysis wizard, under the Analyzer page, select to check the effects of index creation by
either Creating a new Analyzer ... or Continuing an existing Analyzer ....
4. Give the analysis a name and description for easy reference.
5. If you would like to create a folder for better organization of your analysis, click .
Select SQL Page6. Choose the source of the SQL statements for Analysis: SQL Repository or SQL Scanner.
7. Select the SQL statement(s) to add to the Analysis from your predefined SQL statements, or you may add
a statement to this Analysis by selecting .
8. Under the SQL Query Plans will be analyzed section, select the options for retrieving your query plan.
l Using existing query plan saved with the SQLThis option uses the query plan that was saved with the SQL statement at the timethat statement was saved to the SQL Repository, or scanned in the SQL Scanner.
l Obtaining a new query plan under the current connectionThis option retrieves the query plan with the current database logon. This
current query plan is compared to the query plan that is retrieved after creatingthe new index(es).
Index Page9. Name the Index Scenario and enter an optional description for easy reference.
10. Selecting the segment for the index scenario to be created in and the number of consumers.
SQL Optimizer for SAP ASE 3.9 User Guide 48
11. If the Index Impact Analysis was called from the Index Advisor, the index scenarios are automaticallydisplay and you can choose the index scenarios to include for analysis.
12. To manually add indexes click .
l Give the index a name for easy reference.
l In the Index based on section of this page, specify in which database to create this index and specifythe owner to use, and then specify the table that contains the column(s) to include in the index.
l The columns of the table display in the Table columns page and can be selected to use in the indexscenario, under the Index columns page, by double clicking them or using the right arrow button.
l Specify the Index type by checking the option to have the indexUniqueand whether to create theindex as Clustered or NonClustered.
13. Click OK to perform the Index Impact Analysis.
Note: The indexes are physically created in the database, and then the query plans for the selected SQLstatements are retrieved. After the query plan retrieval, the indexes are dropped.
Review Index Impact Analysis Results14. After the analysis, you can see the overall results by clicking the Analyzer, and its related information, in
the tree structure in the left pane and viewing the corresponding information in the panes to the right.
15. In the right pane for the scenarios, click Prognosis to see overall performance changes and SQL details.
Related TopicIndex Impact Analyzer Overview
Index Usage Analyzer TutorialThe Index Usage Analyzer identifies unused indexes by analyzing query plans from SQL statements in yourdatabase applications. It examines their query plans and reports any indexes in the database that are not used.You can use this module to quickly identify the indexes in databases that are not contributing to the performanceof the database applications These unused indexes can then be deleted to free up space and improve thespeed of the database applications and maintenance.
1. Click .
2. Click . If this is your first time in the Index Usage Analyzer, the New Analysis wizardautomatically opens.
SQL Optimizer for SAP ASE 3.9 User Guide 49
Analyzer Page3. Give the analysis a name and description for easy reference.
4. For better organization, create a folder for the analysis you are creating by clicking .
Select SQL Page5. Select the source of the SQL statements for Analysis: SQL Repository or SQL Scanner.
6. Select the SQL statement(s) to add to the Analysis from your predefined SQL statements or you may add
a statement to this Analysis by selecting .
7. Click OK.
Review Unused Index Analyzer Results8. After the analysis, you can see the overall results by clicking the Analyzer, and its related information, in
the tree structure in the left pane and viewing the corresponding information in the panes to the right.
9. In the right pane, click Index Summary to see a list of indexes used and unused.
Related TopicIndex Usage Analyzer Overview
Database Explorer TutorialThe Database Explorer displays detailed information about database objects including columns, indexes, keys,statistics, DDL, procedure text, and data from the tables.
Browse Database ObjectsTo browse database objects
1. Click .
2. The left pane of the window displays database objects that relate to your user logon. The right panedisplays information about a selected database object.Note: Access to database objects depends on your database privileges.
SQL Optimizer for SAP ASE 3.9 User Guide 50
3. In the left pane, expand the branches to select a database object.
4. Use the tabs at the bottom of the right pane to view information about the selected database object.
Related TopicDatabase Explorer Overview
Object Extractor TutorialThe Object Extractor extracts the DDL for creating database objects from the database. As an option, objectdependencies can also be retrieved ordering them by the lowest dependencies first.
Extract DDL1. Click .
2. Select the objects to extract from the left pane [Select objects to be extracted]. Click Add to add theselected objects to the right pane [Objects to extract].
3. Click Extract DDL to display the DDL script on the bottom pane. Or, click Extract to file to save the DDLscript directly to a file.
4. In the Extraction Criteria window, select options to generate the DDL script.
5. Click OK.
6. Extraction preferences can be changed by selecting File | Preferences and selecting the DDL tab.
Related TopicObject_Extractor_Overview
SQL Worksheet TutorialThe SQL Worksheet enables you to create and execute Transact-SQL code, database objects andSQL commands.
Executing SQL or Transact-SQL1. Click .
2. Enter your SQL statement or Transact-SQL code in the Editor pane.
SQL Optimizer for SAP ASE 3.9 User Guide 51
3. Click .
4. Use the drop down field at the top of the Editor pane to review and reuse any code executed in the SQLWorksheet during your session.
Related TopicSQL_Worksheet_Overview
Code Finder TutorialThe Code Finder identifies database objects and files that contain specific text.
Search for Text1. Click .
2. Enter the text string to search for in the Text field in the Search Criteria section.
3. Use the Quick Find, Database Objects and Directory/Files tabs to select what to search. You cansearch in database objects (Tables, Views, Procedures, Triggers, Rules, Defaults, etc.) and/or files.
4. Click Search.
5. Double-click an item in the Search Result pane to open the matched database object or file in theSQL Worksheet.
Related TopicCode Finder Overview
SQL Formatter TutorialThe SQL Formatter formats SQL statements, verifies syntax, and color-codes variables, invalid field or tablenames, optimization forces and comments. The use of indenting and highlighting gives SQL statements astandard of formatting that is easy to read.
To format a SQL statement
1. Click .
2. After entering a SQL statement in the left pane of the window, click .
Comments, bind variables, optimizer forces, invalid column or table names, and variables are highlighted indifferent colors. If there is a syntax error, an error message from Adaptive Server displays.
SQL Optimizer for SAP ASE 3.9 User Guide 52
Related TopicSQL Formatter Overview
User-Defined Temp Tables TutorialWhen your SQL statement uses a temporary table, you must create a temporary table before you use the SQLstatement in several modules. When you exit from the program or connect to another session, all the temporarytables you created are dropped.
Create Temporary Tables 1. Click .
2. On the Creation tab, type in the statements for creating the temp table. You may include CREATE,SELECT INTO, INSERT, UPDATE and DELETE statements.
3. Click Execute.
Related TopicUser-Defined Temp Tables Overview
SQL History TutorialThroughout the use of the product, SQL statements are saved in the SQL History so that you can use themagain. They are stored in a file so that they are available even if you exit the program.
Find Previously Used SQL Statements1. Click .
2. To lookup SQL statements, enter the text string to search for in the SQL Text field. You can specify if youwant to search in the last connection or last action. In the Last Action field, select an action from the dropdown field. Only actions that have occurred in the present session will be available.
3. Select the SQL statement and click one of the buttons in the window to copy the SQL statement toanother module.
Related TopicSQL History Overview
SQL Optimizer for SAP ASE 3.9 User Guide 53
Preferences OverviewPreferences allow the alteration of the default settings used in several of the modules.
To open the Preferences window
Click .When you change the settings, your latest settings are always saved and restored each time to exit and restartthe program. You can also save several sets of preference settings either by saving settings from one or moretab pages or by saving all the preference settings.
To save specific settings so that you can use them later
1. Select the Preferences settings.
2. Click Save.
3. Enter a filename for the saved settings. Click Save.
4. From the Save Preferences Profile window, select the tab pages for the setting you want tosave. Click OK.
To restore the saved settings
1. In the Preferences window, click Load.
2. In the Open File window, select the filename.
3. Click Open.
Optimization Settings for Pre-ASE 15The Optimization for Pre-ASE 15 tab on the Preferences window consists of 5 buttons that allow users to selectthe level of optimization intelligence and options for optimization while using the SQL Optimizer module whenconnected to Adaptive Server 12.5.2 or earlier.
Related TopicSQL Optimizer Overview
Intelligence (Optimization for Pre-ASE 15 Tab)View Optimization for Pre-ASE 15--Intelligence
SQL Optimizer for SAP ASE 3.9 User Guide 54
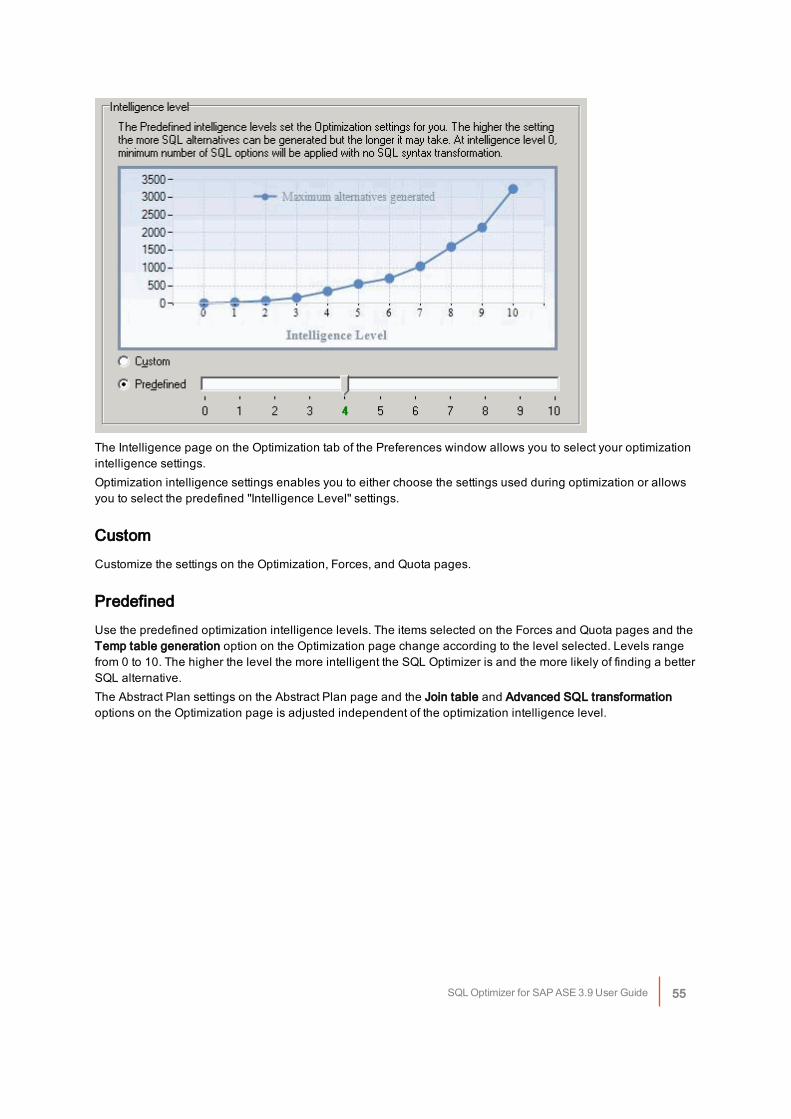
The Intelligence page on the Optimization tab of the Preferences window allows you to select your optimizationintelligence settings.Optimization intelligence settings enables you to either choose the settings used during optimization or allowsyou to select the predefined "Intelligence Level" settings.
CustomCustomize the settings on the Optimization, Forces, and Quota pages.
PredefinedUse the predefined optimization intelligence levels. The items selected on the Forces and Quota pages and theTemp table generation option on the Optimization page change according to the level selected. Levels rangefrom 0 to 10. The higher the level the more intelligent the SQL Optimizer is and the more likely of finding a betterSQL alternative.The Abstract Plan settings on the Abstract Plan page and the Join table and Advanced SQL transformationoptions on the Optimization page is adjusted independent of the optimization intelligence level.
SQL Optimizer for SAP ASE 3.9 User Guide 55
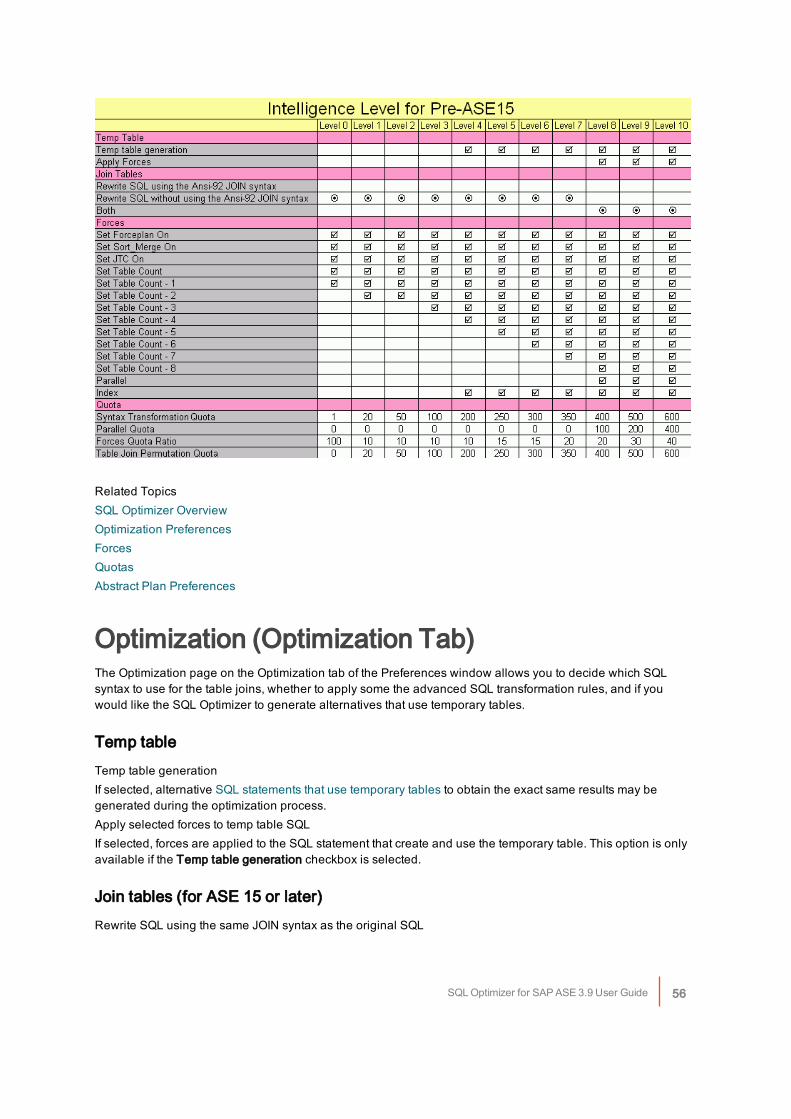
Related TopicsSQL Optimizer OverviewOptimization PreferencesForcesQuotasAbstract Plan Preferences
Optimization (Optimization Tab)The Optimization page on the Optimization tab of the Preferences window allows you to decide which SQLsyntax to use for the table joins, whether to apply some the advanced SQL transformation rules, and if youwould like the SQL Optimizer to generate alternatives that use temporary tables.
Temp tableTemp table generationIf selected, alternative SQL statements that use temporary tables to obtain the exact same results may begenerated during the optimization process.Apply selected forces to temp table SQLIf selected, forces are applied to the SQL statement that create and use the temporary table. This option is onlyavailable if the Temp table generation checkbox is selected.
Join tables (for ASE 15 or later)Rewrite SQL using the same JOIN syntax as the original SQL
SQL Optimizer for SAP ASE 3.9 User Guide 56
Specify that the alternative SQL statements join the tables in the FROM clause using the same SQL syntax thatis used in the original SQL statement. If the original SQL statement contains both syntax types, then theoptimization process will rewrite the syntax using the Ansi-92 JOIN syntax. The outer join is not including in thisconversion.Rewrite SQL using the Ansi-92 JOIN syntaxSpecify to use the JOIN clause from the Ansi-92 SQL standard when generating the SQL alternatives. Duringthe optimization, the SQL statement is converted to the Ansi-92 SQL standard and then SQL syntaxtransformation rules are applied to rewrite the converted SQL statement. Next, the ASE optimization forces,goals, and criteria are applied to the original SQL and the transformed SQL. So you may see SQL alternativesthat use the JOIN syntax from the original SQL and not the Ansi-92 JOIN syntax, but these SQL alternatives aresimply the original SQL with the ASE optimization options applied.The outer join is not including in this conversion because Ansi-92 OUTER JOIN syntax does not always retrievethe same result set as the outer join using the (+) operator. So to avoid producing the wrong result set, theconversion of the outer join syntax cannot be applied.For example:
SELECT DPT_ID
FROM EMPLOYEE
INNER JOIN DEPARTMENT
ON EMP_DEPT = DPT_ID
Rewrite SQL without using the Ansi-92 JOIN syntaxSpecify to join tables in the FROM clause without the JOIN syntax or using comma. The join analysis occurs inthe WHERE clause which specifies the column in one table that is compared to a column in another table.During the optimization, the SQL statement is converted from the Ansi-92 SQL standard and then SQL syntaxtransformation rules are applied to rewrite the converted SQL. Next, the ASE optimization forces, goals, andcriteria are applied to the original SQL and the transformed SQL. So you may see SQL alternatives that use theJOIN syntax from the original SQL, but these SQL alternatives are simply the original SQL with the ASEoptimization options applied.The outer join is not including in this conversion because Ansi-92 OUTER JOIN syntax does not always retrievethe same result set as the outer join using the (+) operator. So to avoid producing the wrong result set, theconversion of the outer join syntax cannot be applied.For example:
SELECT DPT_ID
FROM EMPLOYEE,
DEPARTMENT
WHERE DPT_ID = EMP_DEPT
Rewrite SQL with and without using the ANSI-92 JOIN syntaxSpecify to join tables using either one of the JOIN syntax methods. The OUTER JOIN is not including in thisconversion because Ansi-92 JOIN syntax is needed to define an OUTER JOIN.
Advanced SQL transformationEnable transformation that adds COALESCE.Specify to apply the SQL syntax transformation rule that adds COALESCE to a column. When the data isretrieved, the COALSECE function, which in this case is not actually doing anything to change the value of thecolumn, causes a full table scan or the database to pick another index to use. For example:
SELECT *
SQL Optimizer for SAP ASE 3.9 User Guide 57
FROM EMPLOYEE,
DEPARTMENT
WHERE COALESCE(DPT_ID, DPT_ID) = EMP_DEPT
Related TopicsSQL Optimizer OverviewIntelligence Level (Pre-ASE 15)Intelligence Level (ASE 15)Forces (Pre-ASE 15)Forces (ASE 15)Criteria (ASE 15)Quotas (Pre-ASE 15)Quotas (ASE 15)Abstract Plan Preferences
Forces (Pre-ASE 15)The Forces page on the Optimization for Pre-ASE 15 tab of the Preferences window allows you to decide if youwould like to have the Adaptive Server forces applied to alternative SQL statements. By adding an AdaptiveServer force, you can force the Adaptive Server’s internal optimizer to choose a particular query plan.
SetSet Forceplan OnSpecify whether to enforce the tables to be joined in the order specified in the FROM clause.Set Sort_Merge On/Off{Adaptive Server 15 or later}Specify whether to consider using merge joins. If selected, the parameter will toggle against the server sort_merge setting.Set JTC On/Off{Adaptive Server 15 or later}Specify whether to use join transitive closure. If selected, the parameter will toggle against the serverJTC setting.Set Table Count{Adaptive Server 15 or later}Specify the number of tables that the optimizer considers at one time while determining table join order.
Parallel forcePARALLELSpecify whether to enforce the use of a particular parallelism degree to access the table if parallel query isenabled in the database server.
Index forceINDEX
SQL Optimizer for SAP ASE 3.9 User Guide 58
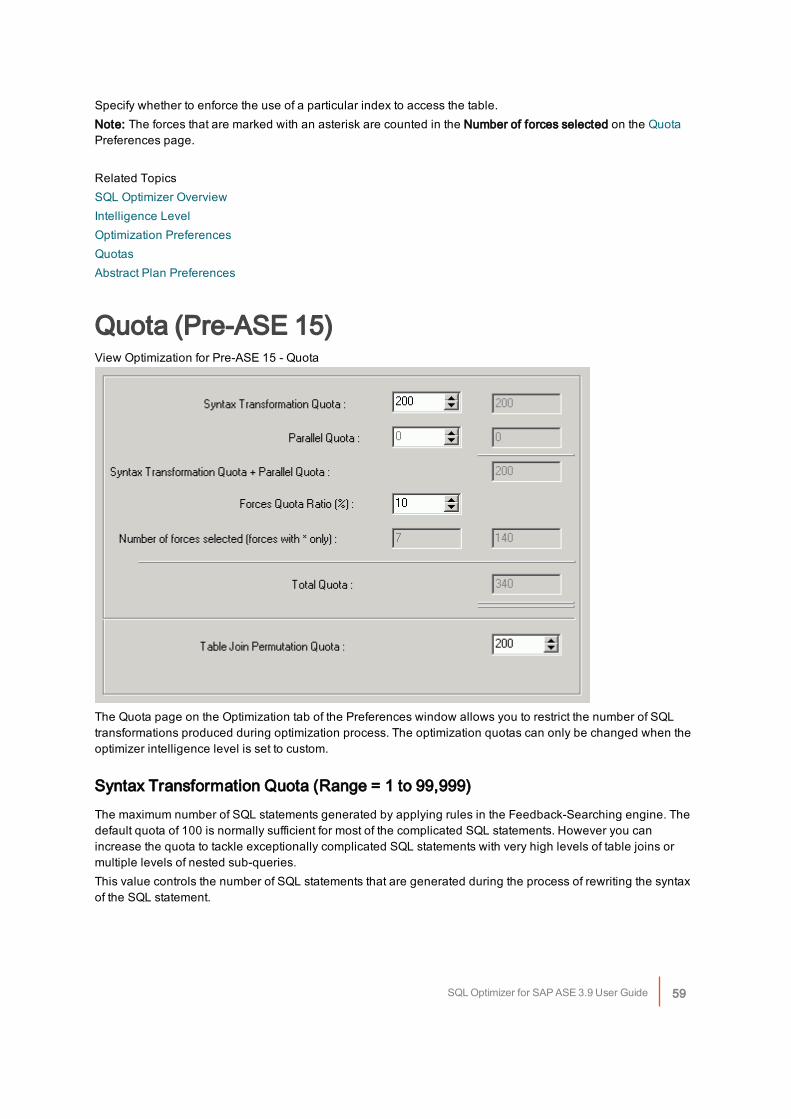
Specify whether to enforce the use of a particular index to access the table.Note: The forces that are marked with an asterisk are counted in the Number of forces selected on the QuotaPreferences page.
Related TopicsSQL Optimizer OverviewIntelligence LevelOptimization PreferencesQuotasAbstract Plan Preferences
Quota (Pre-ASE 15)View Optimization for Pre-ASE 15 - Quota
The Quota page on the Optimization tab of the Preferences window allows you to restrict the number of SQLtransformations produced during optimization process. The optimization quotas can only be changed when theoptimizer intelligence level is set to custom.
Syntax Transformation Quota (Range = 1 to 99,999)The maximum number of SQL statements generated by applying rules in the Feedback-Searching engine. Thedefault quota of 100 is normally sufficient for most of the complicated SQL statements. However you canincrease the quota to tackle exceptionally complicated SQL statements with very high levels of table joins ormultiple levels of nested sub-queries.This value controls the number of SQL statements that are generated during the process of rewriting the syntaxof the SQL statement.
SQL Optimizer for SAP ASE 3.9 User Guide 59
Parallel Quota (Range = 10 to 99,999)The maximum number of SQL statements generated by applying the degree of parallelism in the Feedback-Searching engine. Only applicable if the MAXDOP checkbox is selected.
Forces Quota Ratio (Range = 1% to 100%)The percentage used to calculate the maximum number of SQL statements to apply forces.This value determines the number of SQL alternatives that are generated by applying the Forces to the originalSQL and the SQL alternatives that were created by transforming the SQL syntax.
Number of forces selected (forces with * only)A read only field indicating the number of forces selected. Only the forces that have an * after the name on theForces page are counted. This figure is used to calculate the maximum number of SQL statements generated byapplying forces, ((Syntax Transformation Quota + Parallel Quota )* Forces Quota Ratio%)*Number of ForcesSelected = Forces Quota.
Total QuotaThe maximum number of SQL statements generated during optimization, this figure consists of: SyntaxTransformation Quota + Parallel Quota + Forces Quota.
Table Join Permutation Quota (Range = 50 to 999,999)The maximum number of table joins rearrangements to generate a new table join access path duringoptimization.Note: You should bear in mind that the higher the quota, the longer it might take to optimize a complicatedSQL statement.
Related TopicsSQL Optimizer OverviewIntelligence LevelOptimization PreferencesForcesAbstract Plan Preferences
Abstract Plan (Optimization Tab)The Abstract Plan page on the Optimization tab of the Preferences window allows you to include the retrieval ofthe abstract plan for the SQL statements. This requires Adaptive Server 15 or later.
Dump abstract planSpecify whether to retrieve the abstract plan for the SQL statement whenever the query plan is retrieved. Theabstract plan displays in the SQL Optimizer window. The abstract plan is not saved on the database until youdeliberately save it.
SQL Optimizer for SAP ASE 3.9 User Guide 60
When this checkbox is selected, the selected abstract plan icon and the abstract plan group name display onthe bottom right of the main status bar.Note: For third-party package applications, you are able to optimize SQL statements without changing thesource code by saving the abstract plan.
Group nameSpecify the abstract plan group name where the abstract plans are saved. The default group names in AdaptiveServer are: ap_stdout and ap_stdin. These groups are usually used by the Database Administrator to enableserver-wide abstract plan capturing and retrieving.ap_stdout is used by default to capture an abstract plan.ap_stdin is used by default to retrieve the abstract plan associated with a SQL statement during the execution ofthe SQL statement.
Abstract Plan Manager buttonOpens the Abstract Plan Manager window to view, create, and modify abstract plan group.
Check compatibility with Original SQLSpecify whether you want to check the compatibility of the optimized SQL statements with the original SQL.When this option is selected, the AP Compatibility column displays on the SQL Run Time pane of the SQLOptimizer window and in the Batch Run Criteria window.Note: A SQL statement may have many different "semantically equivalent" SQL statements. Each statement hasan abstract plan. Even though SQL statements are "semantically equivalent", the abstract plans may not becompatible with the original SQL statement. When you check this option, the alternative abstract plans that arecompatible with your original SQL are identified.
Related TopicsSQL Optimizer OverviewIntelligence Level (Pre-ASE 15)Intelligence Level (ASE 15)Optimization PreferencesForces (Pre-ASE 15)Forces (ASE 15)Criteria (ASE 15)Quotas (Pre-ASE 15)Quotas (ASE 15)
Optimization Settings for ASE 15The Optimization for ASE 15 tab on the Preferences window consists of six buttons that allow users to select thelevel of optimization intelligence and options for optimization while using the SQL Optimizer module whenconnected to Adaptive Server 15.
Related TopicSQL Optimizer Overview
SQL Optimizer for SAP ASE 3.9 User Guide 61
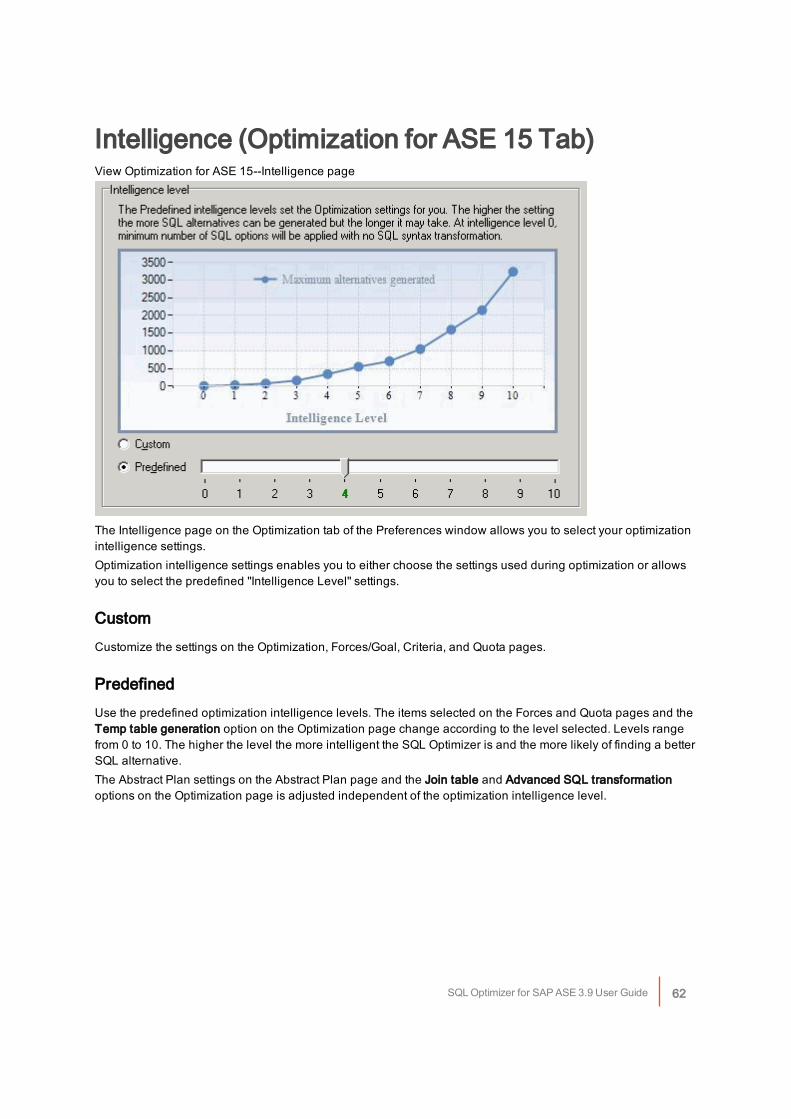
Intelligence (Optimization for ASE 15 Tab)View Optimization for ASE 15--Intelligence page
The Intelligence page on the Optimization tab of the Preferences window allows you to select your optimizationintelligence settings.Optimization intelligence settings enables you to either choose the settings used during optimization or allowsyou to select the predefined "Intelligence Level" settings.
CustomCustomize the settings on the Optimization, Forces/Goal, Criteria, and Quota pages.
PredefinedUse the predefined optimization intelligence levels. The items selected on the Forces and Quota pages and theTemp table generation option on the Optimization page change according to the level selected. Levels rangefrom 0 to 10. The higher the level the more intelligent the SQL Optimizer is and the more likely of finding a betterSQL alternative.The Abstract Plan settings on the Abstract Plan page and the Join table and Advanced SQL transformationoptions on the Optimization page is adjusted independent of the optimization intelligence level.
SQL Optimizer for SAP ASE 3.9 User Guide 62
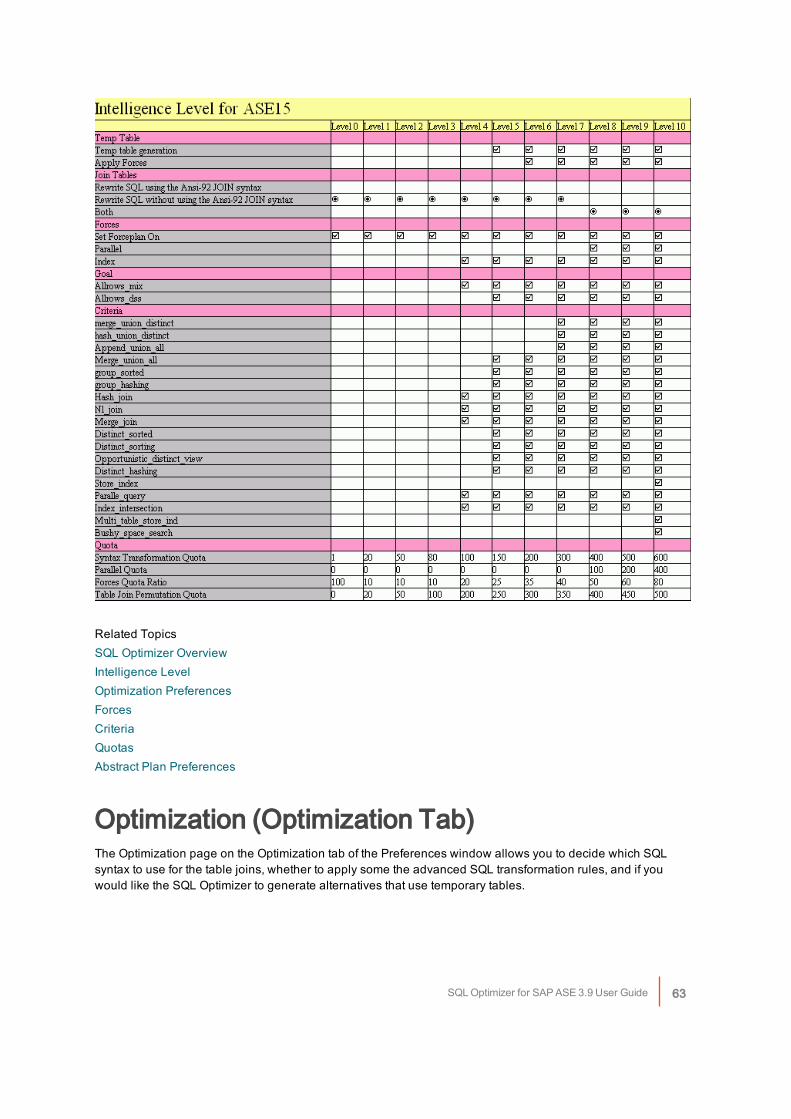
Related TopicsSQL Optimizer OverviewIntelligence LevelOptimization PreferencesForcesCriteriaQuotasAbstract Plan Preferences
Optimization (Optimization Tab)The Optimization page on the Optimization tab of the Preferences window allows you to decide which SQLsyntax to use for the table joins, whether to apply some the advanced SQL transformation rules, and if youwould like the SQL Optimizer to generate alternatives that use temporary tables.
SQL Optimizer for SAP ASE 3.9 User Guide 63
Temp tableTemp table generationIf selected, alternative SQL statements that use temporary tables to obtain the exact same results may begenerated during the optimization process.Apply selected forces to temp table SQLIf selected, forces are applied to the SQL statement that create and use the temporary table. This option is onlyavailable if the Temp table generation checkbox is selected.
Join tables (for ASE 15 or later)Rewrite SQL using the same JOIN syntax as the original SQLSpecify that the alternative SQL statements join the tables in the FROM clause using the same SQL syntax thatis used in the original SQL statement. If the original SQL statement contains both syntax types, then theoptimization process will rewrite the syntax using the Ansi-92 JOIN syntax. The outer join is not including in thisconversion.Rewrite SQL using the Ansi-92 JOIN syntaxSpecify to use the JOIN clause from the Ansi-92 SQL standard when generating the SQL alternatives. Duringthe optimization, the SQL statement is converted to the Ansi-92 SQL standard and then SQL syntaxtransformation rules are applied to rewrite the converted SQL statement. Next, the ASE optimization forces,goals, and criteria are applied to the original SQL and the transformed SQL. So you may see SQL alternativesthat use the JOIN syntax from the original SQL and not the Ansi-92 JOIN syntax, but these SQL alternatives aresimply the original SQL with the ASE optimization options applied.The outer join is not including in this conversion because Ansi-92 OUTER JOIN syntax does not always retrievethe same result set as the outer join using the (+) operator. So to avoid producing the wrong result set, theconversion of the outer join syntax cannot be applied.For example:
SELECT DPT_ID
FROM EMPLOYEE
INNER JOIN DEPARTMENT
ON EMP_DEPT = DPT_ID
Rewrite SQL without using the Ansi-92 JOIN syntaxSpecify to join tables in the FROM clause without the JOIN syntax or using comma. The join analysis occurs inthe WHERE clause which specifies the column in one table that is compared to a column in another table.During the optimization, the SQL statement is converted from the Ansi-92 SQL standard and then SQL syntaxtransformation rules are applied to rewrite the converted SQL. Next, the ASE optimization forces, goals, andcriteria are applied to the original SQL and the transformed SQL. So you may see SQL alternatives that use theJOIN syntax from the original SQL, but these SQL alternatives are simply the original SQL with the ASEoptimization options applied.The outer join is not including in this conversion because Ansi-92 OUTER JOIN syntax does not always retrievethe same result set as the outer join using the (+) operator. So to avoid producing the wrong result set, theconversion of the outer join syntax cannot be applied.For example:
SELECT DPT_ID
FROM EMPLOYEE,
DEPARTMENT
WHERE DPT_ID = EMP_DEPT
SQL Optimizer for SAP ASE 3.9 User Guide 64
Rewrite SQL with and without using the ANSI-92 JOIN syntaxSpecify to join tables using either one of the JOIN syntax methods. The OUTER JOIN is not including in thisconversion because Ansi-92 JOIN syntax is needed to define an OUTER JOIN.
Advanced SQL transformationEnable transformation that adds COALESCE.Specify to apply the SQL syntax transformation rule that adds COALESCE to a column. When the data isretrieved, the COALSECE function, which in this case is not actually doing anything to change the value of thecolumn, causes a full table scan or the database to pick another index to use. For example:
SELECT *
FROM EMPLOYEE,
DEPARTMENT
WHERE COALESCE(DPT_ID, DPT_ID) = EMP_DEPT
Related TopicsSQL Optimizer OverviewIntelligence Level (Pre-ASE 15)Intelligence Level (ASE 15)Forces (Pre-ASE 15)Forces (ASE 15)Criteria (ASE 15)Quotas (Pre-ASE 15)Quotas (ASE 15)Abstract Plan Preferences
Forces/Goal (ASE 15)View Optimization for ASE 15 - Forces/Goals page
SQL Optimizer for SAP ASE 3.9 User Guide 65
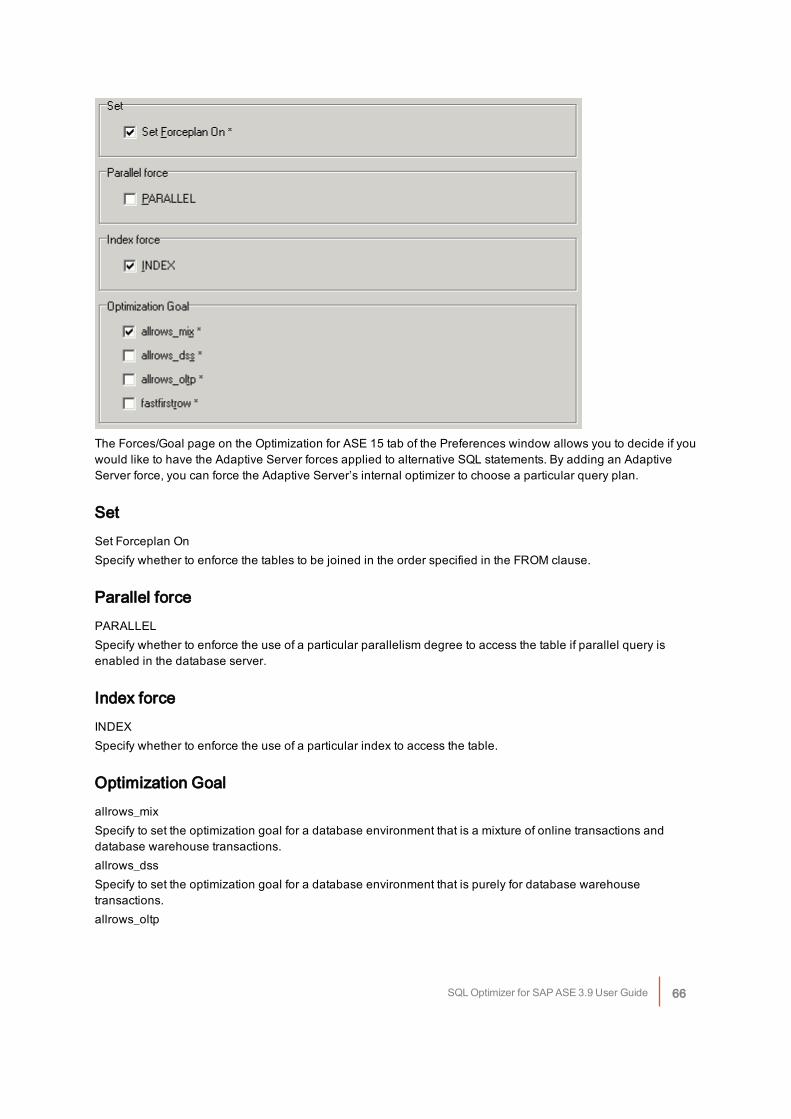
The Forces/Goal page on the Optimization for ASE 15 tab of the Preferences window allows you to decide if youwould like to have the Adaptive Server forces applied to alternative SQL statements. By adding an AdaptiveServer force, you can force the Adaptive Server’s internal optimizer to choose a particular query plan.
SetSet Forceplan OnSpecify whether to enforce the tables to be joined in the order specified in the FROM clause.
Parallel forcePARALLELSpecify whether to enforce the use of a particular parallelism degree to access the table if parallel query isenabled in the database server.
Index forceINDEXSpecify whether to enforce the use of a particular index to access the table.
Optimization Goalallrows_mixSpecify to set the optimization goal for a database environment that is a mixture of online transactions anddatabase warehouse transactions.allrows_dssSpecify to set the optimization goal for a database environment that is purely for database warehousetransactions.allrows_oltp
SQL Optimizer for SAP ASE 3.9 User Guide 66
Specify to set the optimization goal for a database environment that is purely for oltp (online transactionprocessing) transactions.fastfirstrowSpecify to set the optimization goal to retrieve the first row as fast as possible.Note: The forces that are marked with an asterisk are counted in the Number of forces selected on the QuotaPreferences page.
Related TopicsSQL Optimizer OverviewIntelligence LevelOptimization PreferencesCriteriaQuotasAbstract Plan Preferences
CriteriaThe Optimization Criteria are session level settings. Each criteria represents a specific algorithm or relationaltechniques that the Adaptive Server Optimizer may choose to use when it is retrieving the query plan. They areused to fine-tune the Adaptive Server optimizer to provide the best performance for your database environment.Although you may specify that Adaptive Server optimizer use a specific algorithm or relational technique, theoptimizer may not choose what you have specified.
JoinOptimization Criteria Description
hash_join Specify that the Adaptive Server optimizer uses the hash joinalgorithm. This is valuable when a large number of rows satisfy thejoin condition or when the joining columns do not have usefulindexes. However, the hash join algorithm may consume more runtime resources that other join algorithms.
nl_join Specify that the Adaptive Server optimizer uses the nested-loop-joinalgorithm.
merge_join Specify that the Adaptive Server optimizer uses the merge joinalgorithm. This relies on ordered input and is most valuable when theinput is ordered on the merge key.
Union DistinctOptimization Criteria Description
merge_union_distinct Specify that the Adaptive Server optimizer uses the merge algorithmfor the UNION ALL. It is similar to merge_union_all except thatduplicate rows are eliminated.
SQL Optimizer for SAP ASE 3.9 User Guide 67
hash_union_distinct Specify that the Adaptive Server optimizer uses the hash distinctalgorithm. This will be inefficient if most of the rows are distinct.
Union AllOptimization Criteria Description
append_union_all Specify that the Adaptive Server optimizer uses the append union allalgorithm.
merge_union_all Specify that the Adaptive Server optimizer uses the merge algorithmfor the UNION ALL. This means that it will maintain the ordering of theresult row from the union input.
Group ByOptimization Criteria Description
group_sorted Specify that the Adaptive Server optimizer uses an on-the-flyalgorithm. This algorithm relies on an input stream sorted on thegrouping column and preserves this order in its output.
group_hashing Specify that the Adaptive Server optimizer uses the use a grouphashing algorithm to process aggregates.
DistinctOptimization Criteria Description
distinct_sorted Specify that the Adaptive Server optimizer uses a single-passalgorithm to eliminate duplicate rows. This algorithm relies on anordered input stream.
distinct_sorting Specify that the Adaptive Server optimizer uses the sorting algorithmto eliminate duplicate rows. This algorithm is useful when the input isnot ordered.
opportunistic_distinct _view Specify that the Adaptive Server optimizer uses a more flexiblealgorithm when enforcing distinctness.
distinct_hashing Specify that the Adaptive Server optimizer uses the hashing algorithmto eliminate duplicates, which is very efficient when there are only afew distinct values in comparison to the number of rows.
SQL Optimizer for SAP ASE 3.9 User Guide 68
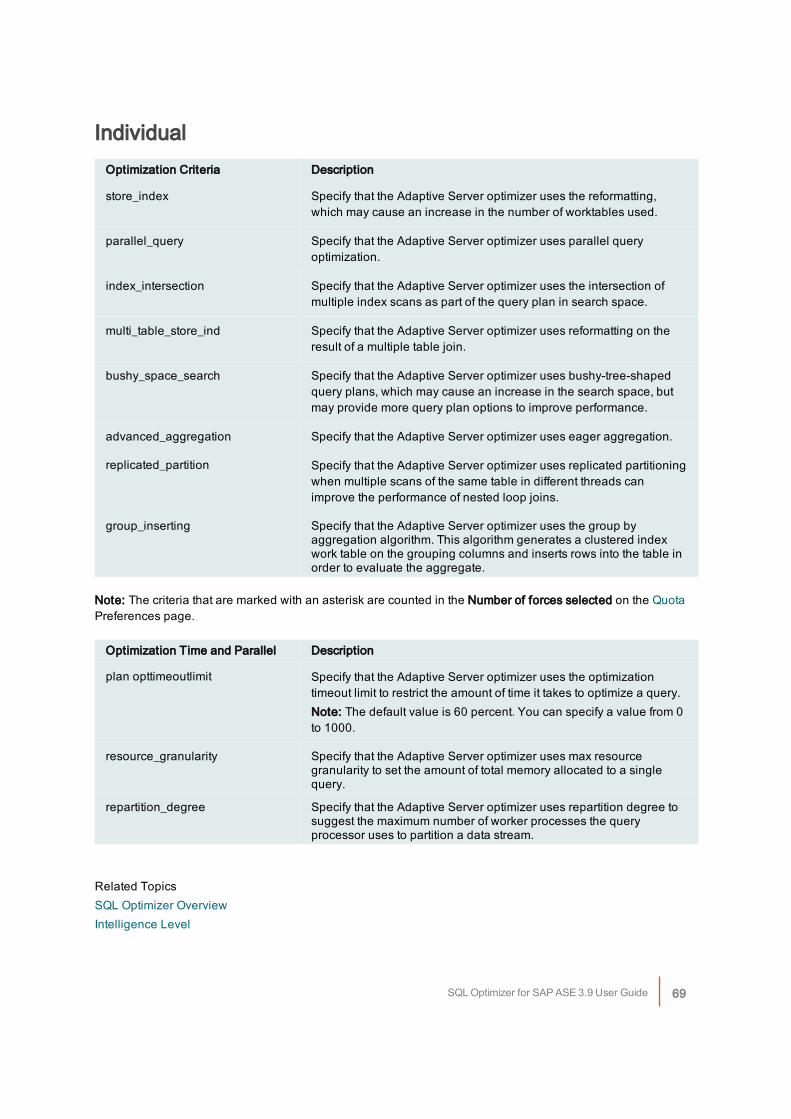
IndividualOptimization Criteria Description
store_index Specify that the Adaptive Server optimizer uses the reformatting,which may cause an increase in the number of worktables used.
parallel_query Specify that the Adaptive Server optimizer uses parallel queryoptimization.
index_intersection Specify that the Adaptive Server optimizer uses the intersection ofmultiple index scans as part of the query plan in search space.
multi_table_store_ind Specify that the Adaptive Server optimizer uses reformatting on theresult of a multiple table join.
bushy_space_search Specify that the Adaptive Server optimizer uses bushy-tree-shapedquery plans, which may cause an increase in the search space, butmay provide more query plan options to improve performance.
advanced_aggregation Specify that the Adaptive Server optimizer uses eager aggregation.
replicated_partition Specify that the Adaptive Server optimizer uses replicated partitioningwhen multiple scans of the same table in different threads canimprove the performance of nested loop joins.
group_inserting Specify that the Adaptive Server optimizer uses the group byaggregation algorithm. This algorithm generates a clustered indexwork table on the grouping columns and inserts rows into the table inorder to evaluate the aggregate.
Note: The criteria that are marked with an asterisk are counted in the Number of forces selected on the QuotaPreferences page.
Optimization Time and Parallel Description
plan opttimeoutlimit Specify that the Adaptive Server optimizer uses the optimizationtimeout limit to restrict the amount of time it takes to optimize a query.Note: The default value is 60 percent. You can specify a value from 0to 1000.
resource_granularity Specify that the Adaptive Server optimizer uses max resourcegranularity to set the amount of total memory allocated to a singlequery.
repartition_degree Specify that the Adaptive Server optimizer uses repartition degree tosuggest the maximum number of worker processes the queryprocessor uses to partition a data stream.
Related TopicsSQL Optimizer OverviewIntelligence Level
SQL Optimizer for SAP ASE 3.9 User Guide 69
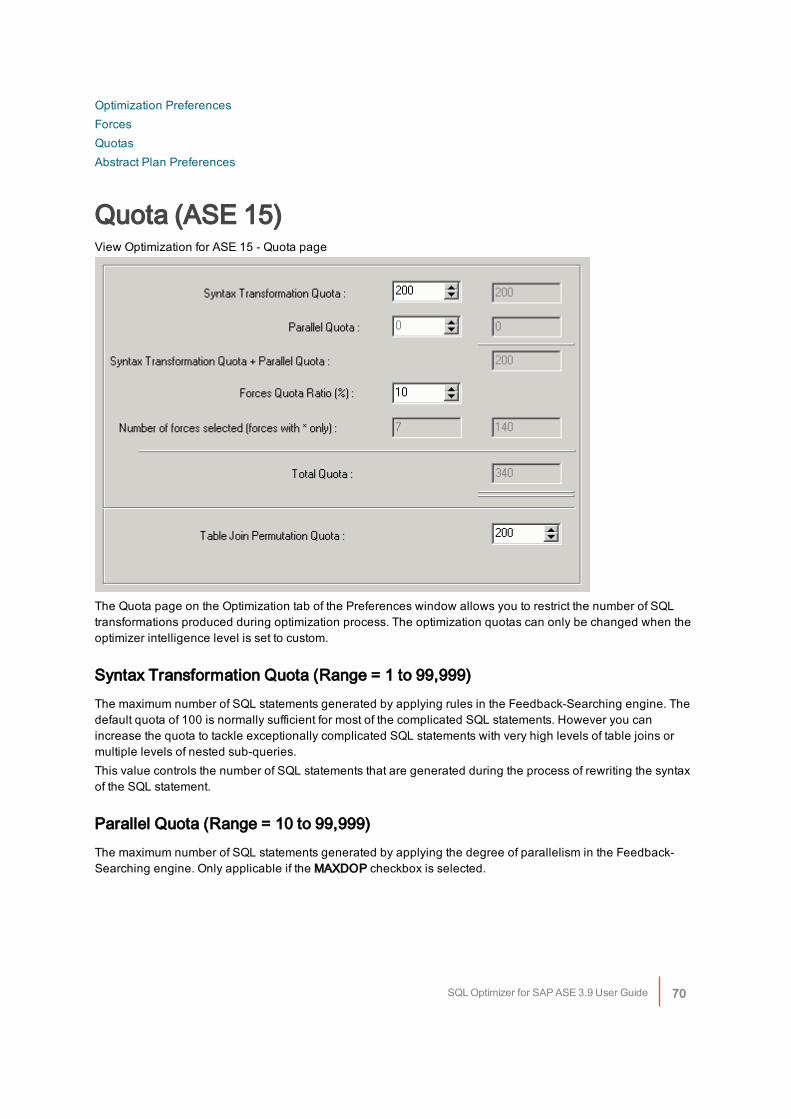
Optimization PreferencesForcesQuotasAbstract Plan Preferences
Quota (ASE 15)View Optimization for ASE 15 - Quota page
The Quota page on the Optimization tab of the Preferences window allows you to restrict the number of SQLtransformations produced during optimization process. The optimization quotas can only be changed when theoptimizer intelligence level is set to custom.
Syntax Transformation Quota (Range = 1 to 99,999)The maximum number of SQL statements generated by applying rules in the Feedback-Searching engine. Thedefault quota of 100 is normally sufficient for most of the complicated SQL statements. However you canincrease the quota to tackle exceptionally complicated SQL statements with very high levels of table joins ormultiple levels of nested sub-queries.This value controls the number of SQL statements that are generated during the process of rewriting the syntaxof the SQL statement.
Parallel Quota (Range = 10 to 99,999)The maximum number of SQL statements generated by applying the degree of parallelism in the Feedback-Searching engine. Only applicable if the MAXDOP checkbox is selected.
SQL Optimizer for SAP ASE 3.9 User Guide 70
Forces Quota Ratio (Range = 1% to 100%)The percentage used to calculate the maximum number of SQL statements to apply forces.This value determines the number of SQL alternatives that are generated by applying the Forces to the originalSQL and the SQL alternatives that were created by transforming the SQL syntax.
Number of forces selected (forces with * only)A read only field indicating the number of forces, goals, and criteria selected. Only the items that have an * afterthe name on the Forces/Goals and the Criteria pages are counted. This figure is used to calculate the maximumnumber of SQL statements generated by applying these selections, ((Syntax Transformation Quota + ParallelQuota) * Forces Quota Ratio%) * Number of Forces Selected = Forces Quota.
Total QuotaThe maximum number of SQL statements generated during optimization, this figure consists of: SyntaxTransformation Quota + Parallel Quota + Forces Quota.
Table Join Permutation Quota (Range = 50 to 999,999)The maximum number of table joins rearrangements to generate a new table join access path duringoptimization.Note: You should bear in mind that the higher the quota, the longer it might take to optimize a complicatedSQL statement.
Related TopicsSQL Optimizer OverviewIntelligence LevelOptimization PreferencesForcesCriteriaQuotasAbstract Plan Preferences
Abstract Plan (Optimization Tab)The Abstract Plan page on the Optimization tab of the Preferences window allows you to include the retrieval ofthe abstract plan for the SQL statements. This requires Adaptive Server 15 or later.
Dump abstract planSpecify whether to retrieve the abstract plan for the SQL statement whenever the query plan is retrieved. Theabstract plan displays in the SQL Optimizer window. The abstract plan is not saved on the database until youdeliberately save it.When this checkbox is selected, the selected abstract plan icon and the abstract plan group name display onthe bottom right of the main status bar.
SQL Optimizer for SAP ASE 3.9 User Guide 71
Note: For third-party package applications, you are able to optimize SQL statements without changing thesource code by saving the abstract plan.
Group nameSpecify the abstract plan group name where the abstract plans are saved. The default group names in AdaptiveServer are: ap_stdout and ap_stdin. These groups are usually used by the Database Administrator to enableserver-wide abstract plan capturing and retrieving.ap_stdout is used by default to capture an abstract plan.ap_stdin is used by default to retrieve the abstract plan associated with a SQL statement during the execution ofthe SQL statement.
Abstract Plan Manager buttonOpens the Abstract Plan Manager window to view, create, and modify abstract plan group.
Check compatibility with Original SQLSpecify whether you want to check the compatibility of the optimized SQL statements with the original SQL.When this option is selected, the AP Compatibility column displays on the SQL Run Time pane of the SQLOptimizer window and in the Batch Run Criteria window.Note: A SQL statement may have many different "semantically equivalent" SQL statements. Each statement hasan abstract plan. Even though SQL statements are "semantically equivalent", the abstract plans may not becompatible with the original SQL statement. When you check this option, the alternative abstract plans that arecompatible with your original SQL are identified.
Related TopicsSQL Optimizer OverviewIntelligence Level (Pre-ASE 15)Intelligence Level (ASE 15)Optimization PreferencesForces (Pre-ASE 15)Forces (ASE 15)Criteria (ASE 15)Quotas (Pre-ASE 15)Quotas (ASE 15)
Index AdvisorView Index Advisor page
SQL Optimizer for SAP ASE 3.9 User Guide 72
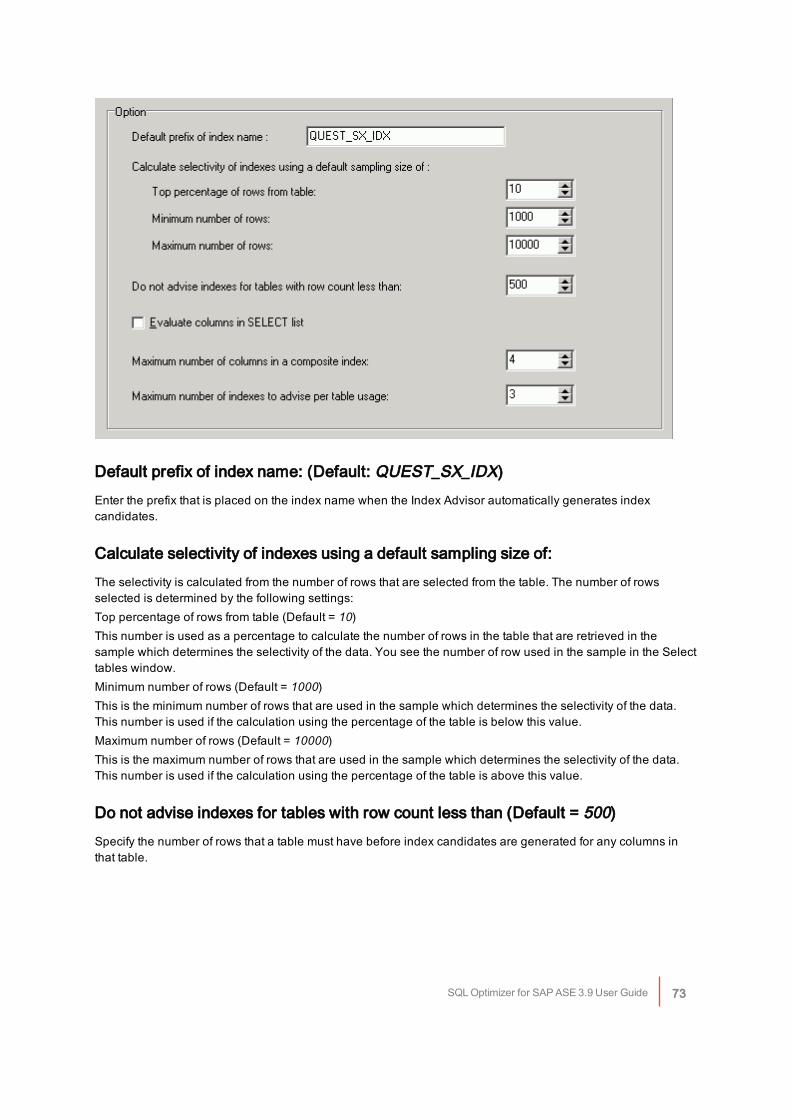
Default prefix of index name: (Default: QUEST_SX_IDX)Enter the prefix that is placed on the index name when the Index Advisor automatically generates indexcandidates.
Calculate selectivity of indexes using a default sampling size of:The selectivity is calculated from the number of rows that are selected from the table. The number of rowsselected is determined by the following settings:Top percentage of rows from table (Default = 10)This number is used as a percentage to calculate the number of rows in the table that are retrieved in thesample which determines the selectivity of the data. You see the number of row used in the sample in the Selecttables window.Minimum number of rows (Default = 1000) This is the minimum number of rows that are used in the sample which determines the selectivity of the data.This number is used if the calculation using the percentage of the table is below this value.Maximum number of rows (Default = 10000)This is the maximum number of rows that are used in the sample which determines the selectivity of the data.This number is used if the calculation using the percentage of the table is above this value.
Do not advise indexes for tables with row count less than (Default = 500)Specify the number of rows that a table must have before index candidates are generated for any columns inthat table.
SQL Optimizer for SAP ASE 3.9 User Guide 73
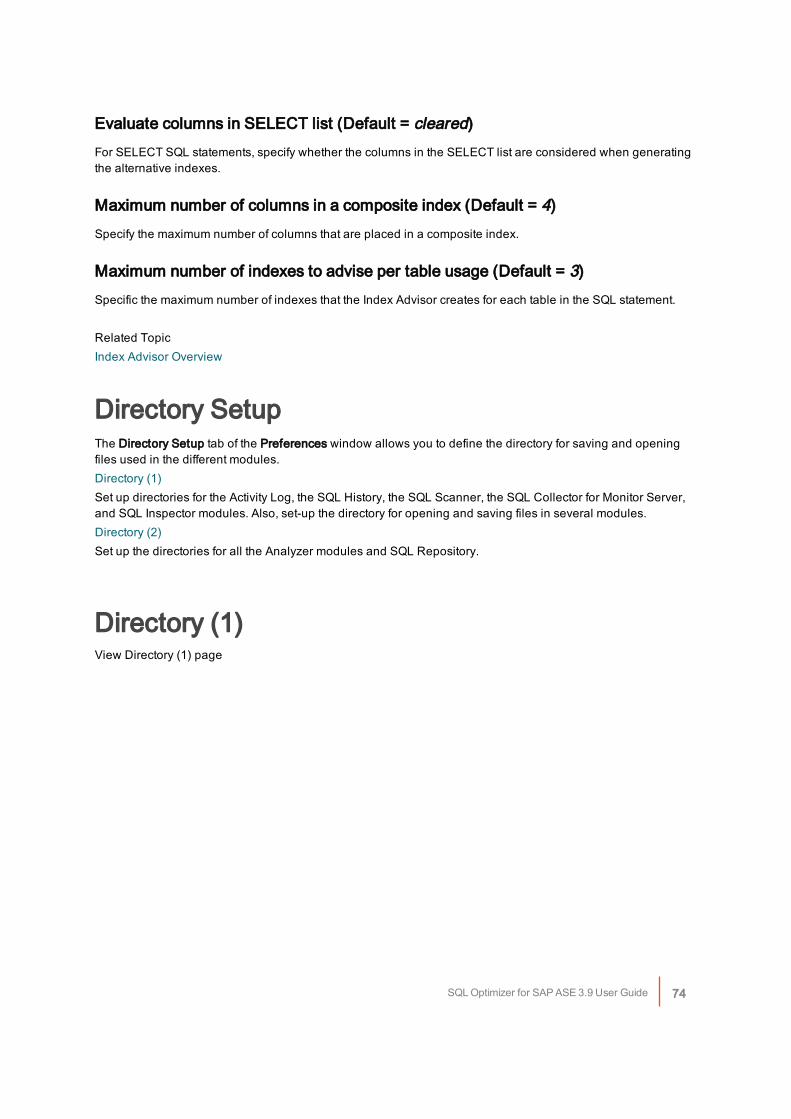
Evaluate columns in SELECT list (Default = cleared)For SELECT SQL statements, specify whether the columns in the SELECT list are considered when generatingthe alternative indexes.
Maximum number of columns in a composite index (Default = 4)Specify the maximum number of columns that are placed in a composite index.
Maximum number of indexes to advise per table usage (Default = 3)Specific the maximum number of indexes that the Index Advisor creates for each table in the SQL statement.
Related TopicIndex Advisor Overview
Directory SetupThe Directory Setup tab of the Preferences window allows you to define the directory for saving and openingfiles used in the different modules.Directory (1)Set up directories for the Activity Log, the SQL History, the SQL Scanner, the SQL Collector for Monitor Server,and SQL Inspector modules. Also, set-up the directory for opening and saving files in several modules.Directory (2)Set up the directories for all the Analyzer modules and SQL Repository.
Directory (1)View Directory (1) page
SQL Optimizer for SAP ASE 3.9 User Guide 74
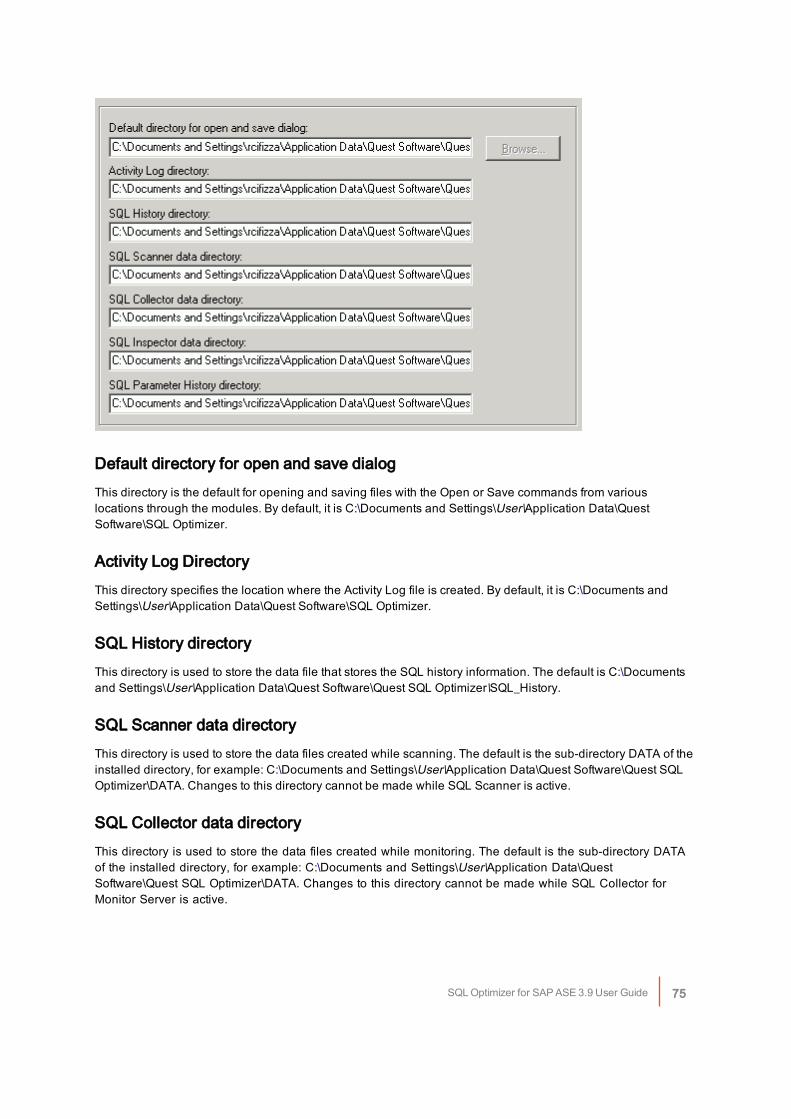
Default directory for open and save dialogThis directory is the default for opening and saving files with the Open or Save commands from variouslocations through the modules. By default, it is C:\Documents and Settings\User\Application Data\QuestSoftware\SQL Optimizer.
Activity Log DirectoryThis directory specifies the location where the Activity Log file is created. By default, it is C:\Documents andSettings\User\Application Data\Quest Software\SQL Optimizer.
SQL History directoryThis directory is used to store the data file that stores the SQL history information. The default is C:\Documentsand Settings\User\Application Data\Quest Software\Quest SQL Optimizer\SQL_History.
SQL Scanner data directoryThis directory is used to store the data files created while scanning. The default is the sub-directory DATA of theinstalled directory, for example: C:\Documents and Settings\User\Application Data\Quest Software\Quest SQLOptimizer\DATA. Changes to this directory cannot be made while SQL Scanner is active.
SQL Collector data directoryThis directory is used to store the data files created while monitoring. The default is the sub-directory DATAof the installed directory, for example: C:\Documents and Settings\User\Application Data\QuestSoftware\Quest SQL Optimizer\DATA. Changes to this directory cannot be made while SQL Collector forMonitor Server is active.
SQL Optimizer for SAP ASE 3.9 User Guide 75
SQL Inspector data directoryThis directory is used to store the data files created while capturing SQL from the system tables. Thedefault is the sub-directory DATA of the installed directory, for example: C:\Documents andSettings\User\Application Data\Quest Software\SQL Optimizer\DATA. Changes to this directory cannot bemade while SQL Inspector is active.Note: It is advisable not to change the data directory after selection, as files already created are kept in theoriginal directory and are not moved to the new directory.
Directory (2)View Directory (2) page
SQL Repository data directoryBy default, it is C:\Documents and Settings\User\Application Data\Software\Quest Software\SQL Optimizer.
Index Impact Analyzer data directoryBy default, it is C:\Documents and Settings\User\Application Data\Software\Quest Software\SQL Optimizer.
Index Usage Analyzer data directoryBy default, it is C:\Documents and Settings\User\Application Data\Software\Quest Software\SQL Optimizer.
SQL Optimizer for SAP ASE 3.9 User Guide 76
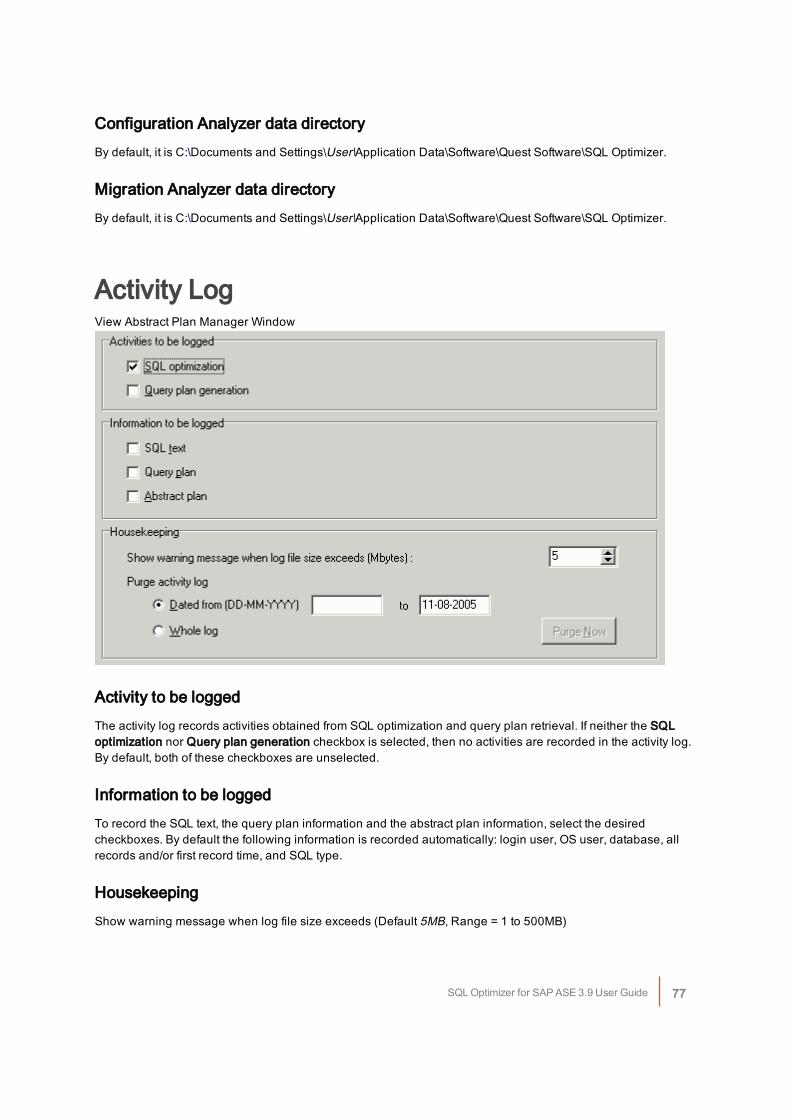
Configuration Analyzer data directoryBy default, it is C:\Documents and Settings\User\Application Data\Software\Quest Software\SQL Optimizer.
Migration Analyzer data directoryBy default, it is C:\Documents and Settings\User\Application Data\Software\Quest Software\SQL Optimizer.
Activity LogView Abstract Plan Manager Window
Activity to be loggedThe activity log records activities obtained from SQL optimization and query plan retrieval. If neither the SQLoptimization nor Query plan generation checkbox is selected, then no activities are recorded in the activity log.By default, both of these checkboxes are unselected.
Information to be loggedTo record the SQL text, the query plan information and the abstract plan information, select the desiredcheckboxes. By default the following information is recorded automatically: login user, OS user, database, allrecords and/or first record time, and SQL type.
HousekeepingShow warning message when log file size exceeds (Default 5MB, Range = 1 to 500MB)
SQL Optimizer for SAP ASE 3.9 User Guide 77
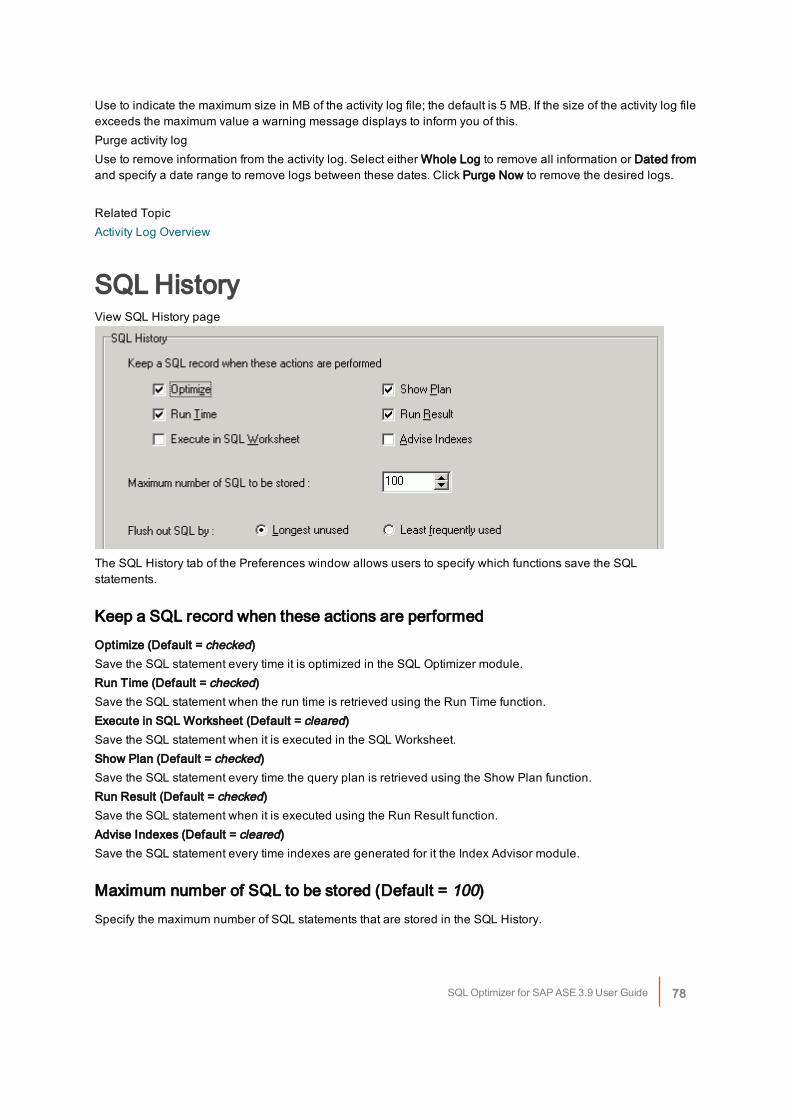
Use to indicate the maximum size in MB of the activity log file; the default is 5 MB. If the size of the activity log fileexceeds the maximum value a warning message displays to inform you of this.Purge activity logUse to remove information from the activity log. Select either Whole Log to remove all information or Dated fromand specify a date range to remove logs between these dates. Click Purge Now to remove the desired logs.
Related TopicActivity Log Overview
SQL HistoryView SQL History page
The SQL History tab of the Preferences window allows users to specify which functions save the SQLstatements.
Keep a SQL record when these actions are performedOptimize (Default = checked)Save the SQL statement every time it is optimized in the SQL Optimizer module.Run Time (Default = checked)Save the SQL statement when the run time is retrieved using the Run Time function.Execute in SQL Worksheet (Default = cleared)Save the SQL statement when it is executed in the SQL Worksheet.Show Plan (Default = checked)Save the SQL statement every time the query plan is retrieved using the Show Plan function.Run Result (Default = checked)Save the SQL statement when it is executed using the Run Result function.Advise Indexes (Default = cleared)Save the SQL statement every time indexes are generated for it the Index Advisor module.
Maximum number of SQL to be stored (Default = 100)Specify the maximum number of SQL statements that are stored in the SQL History.
SQL Optimizer for SAP ASE 3.9 User Guide 78
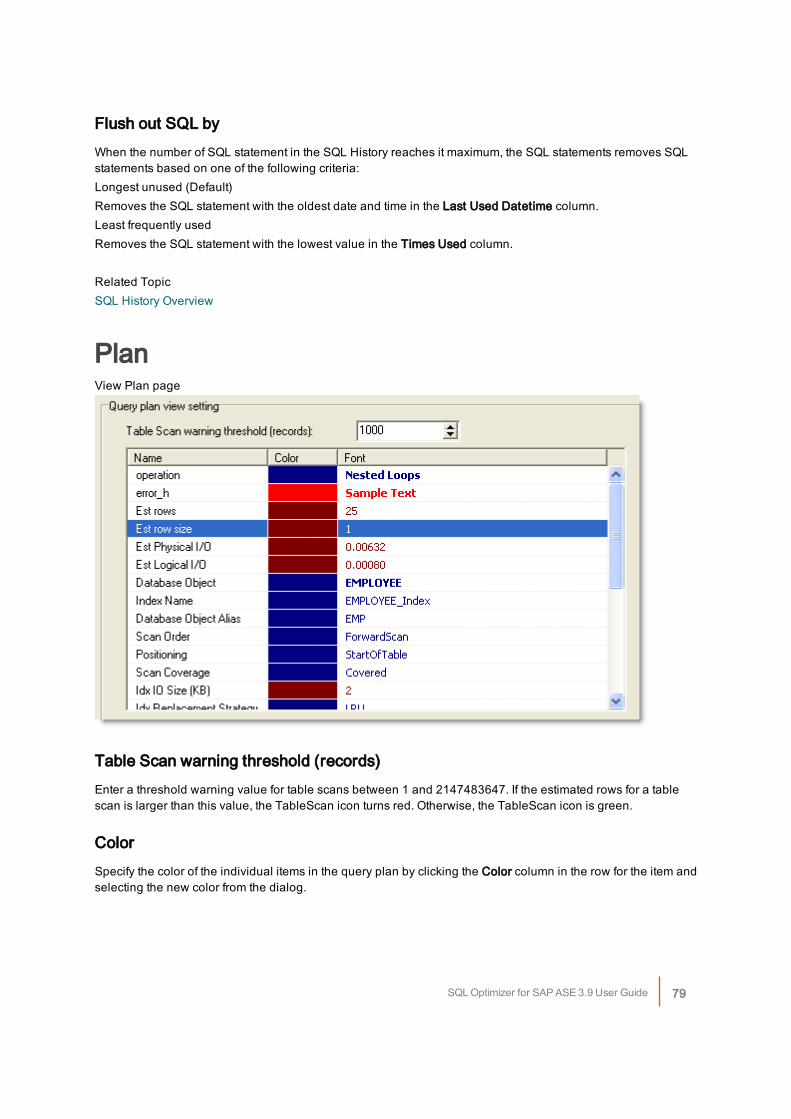
Flush out SQL byWhen the number of SQL statement in the SQL History reaches it maximum, the SQL statements removes SQLstatements based on one of the following criteria:Longest unused (Default)Removes the SQL statement with the oldest date and time in the Last Used Datetime column.Least frequently usedRemoves the SQL statement with the lowest value in the Times Used column.
Related TopicSQL History Overview
PlanView Plan page
Table Scan warning threshold (records)Enter a threshold warning value for table scans between 1 and 2147483647. If the estimated rows for a tablescan is larger than this value, the TableScan icon turns red. Otherwise, the TableScan icon is green.
ColorSpecify the color of the individual items in the query plan by clicking the Color column in the row for the item andselecting the new color from the dialog.
SQL Optimizer for SAP ASE 3.9 User Guide 79
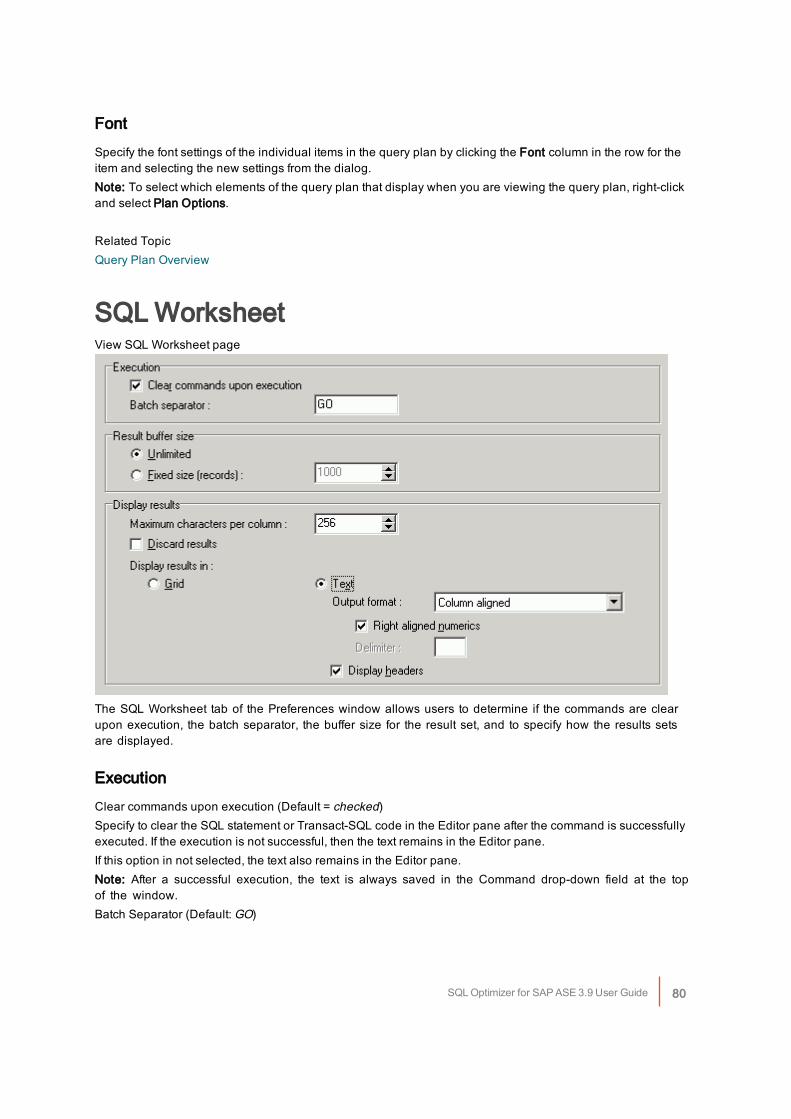
FontSpecify the font settings of the individual items in the query plan by clicking the Font column in the row for theitem and selecting the new settings from the dialog.Note: To select which elements of the query plan that display when you are viewing the query plan, right-clickand select Plan Options.
Related TopicQuery Plan Overview
SQL WorksheetView SQL Worksheet page
The SQL Worksheet tab of the Preferences window allows users to determine if the commands are clearupon execution, the batch separator, the buffer size for the result set, and to specify how the results setsare displayed.
ExecutionClear commands upon execution (Default = checked)Specify to clear the SQL statement or Transact-SQL code in the Editor pane after the command is successfullyexecuted. If the execution is not successful, then the text remains in the Editor pane.If this option in not selected, the text also remains in the Editor pane.Note: After a successful execution, the text is always saved in the Command drop-down field at the topof the window.Batch Separator (Default: GO)
SQL Optimizer for SAP ASE 3.9 User Guide 80
Specify the separator used to signal the end of a batch of Transact-SQL statements.
Result buffer sizeUnlimited or Fixed size (records)Select Unlimited to return all records. Select Fixed size and then in the text field, set the maximum number ofrecords to be returned. (Default fixed size: 1000)
Display resultsMaximum characters per column: (Default: 256)Specify how wide each column should be in the Resultn tab in the lower pane of the SQL Worksheet window.Discard results: (Default: cleared)Specify whether to show the results on the Resultn tab, or to just show the number of affected records on theMessage Log tab.Display results in
Grid or Text: Select between displaying the results in a grid or in plain text.Under the Text option you can also select:
Output format (Default: Column aligned)Select between Column aligned, Comma separated (CSV), Tab delimited, or Other delimiter.Right aligned numerics: (Default: cleared)When you select Column aligned for the Output format, specify whether or not to right alignnumber columns.DelimiterWhen you select Other delimiter for the Output format, specify the character to be used as thedelimiter between the columns.Display headers:Specify whether or not the column names are displayed.
Related TopicSQL Workshop Overview
SQL ScannerThe SQL Scanner settings are used to define the requirements for the SQL Scanner module.SQL Scanner Options SettingsSQL Scanner Abstract Plan SettingsSQL Scanner General SettingsThe settings in the SQL Classification tab are used by the SQL Scanner to help you identify which SQLstatements are likely to be causing performance problems by classifying the SQL as Problematic,Complex, or Simple.SQL Classification Settings
Related TopicSQL Scanner Overview
SQL Optimizer for SAP ASE 3.9 User Guide 81
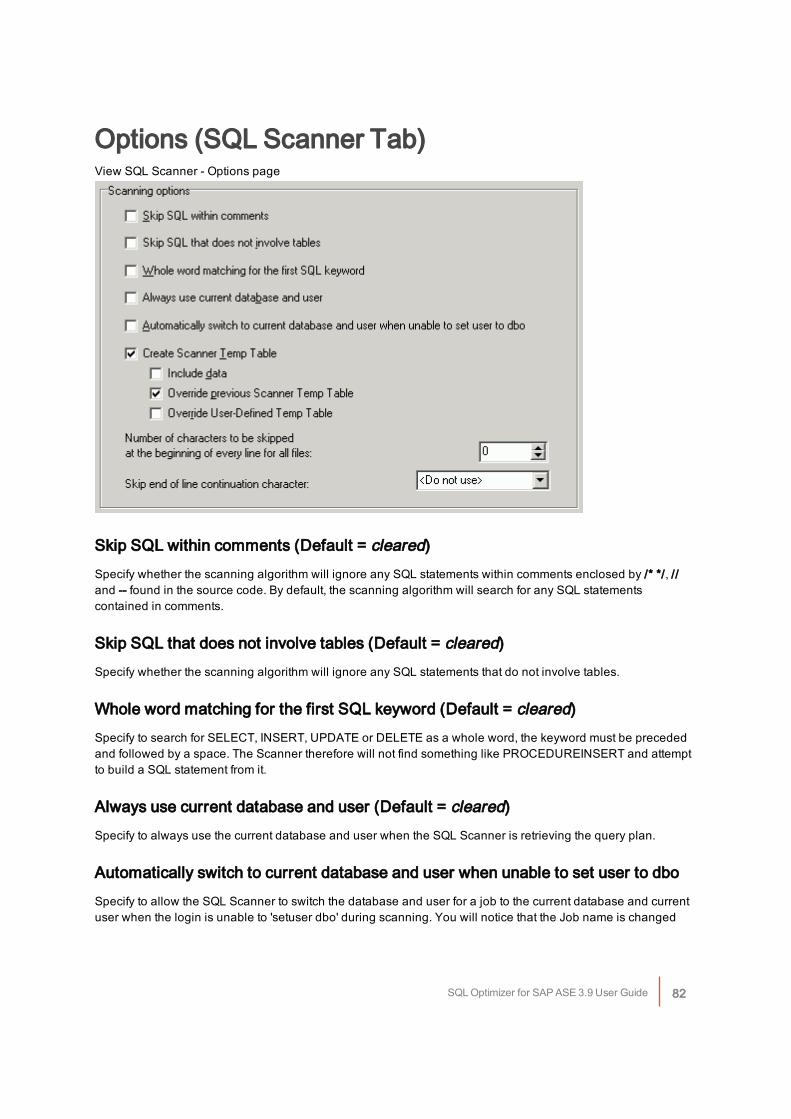
Options (SQL Scanner Tab)View SQL Scanner - Options page
Skip SQL within comments (Default = cleared)Specify whether the scanning algorithm will ignore any SQL statements within comments enclosed by /* */, //and -- found in the source code. By default, the scanning algorithm will search for any SQL statementscontained in comments.
Skip SQL that does not involve tables (Default = cleared)Specify whether the scanning algorithm will ignore any SQL statements that do not involve tables.
Whole word matching for the first SQL keyword (Default = cleared)Specify to search for SELECT, INSERT, UPDATE or DELETE as a whole word, the keyword must be precededand followed by a space. The Scanner therefore will not find something like PROCEDUREINSERT and attemptto build a SQL statement from it.
Always use current database and user (Default = cleared)Specify to always use the current database and user when the SQL Scanner is retrieving the query plan.
Automatically switch to current database and user when unable to set user to dboSpecify to allow the SQL Scanner to switch the database and user for a job to the current database and currentuser when the login is unable to 'setuser dbo' during scanning. You will notice that the Job name is changed
SQL Optimizer for SAP ASE 3.9 User Guide 82
from "[xx] [dbo] yyy" to "[current db][current user] yyy" when the 'setuser dbo' fails. Also, in the information pane inthe SQL Scanner window under "Connection Information," this line is added "Scanned using the currentdatabase and user setting".When this option is not selected and the login is unable to ‘set user to dbo’, the SQL Scanner displays the‘cannot set dbo’ status message in the Status column and it skips the Job.
Create Scanner Temp Table (Default = checked)If selected, the scanning algorithm automatically creates a temporary table during scanning when a CREATETABLE #TEMP or a SELECT INTO #TEMP statement is found. Tables created during the scanning process aredropped at the end of the process.Include data (Default = cleared)If selected, the SQL Scanner automatically executes any INSERT, DELETE, UPDATE, and SELECT INTO SQLstatement that modifies a temporary table that is created by the SQL Scanner.If this option is not selected, then a WHERE 0 =1 clause is added to the SELECT INTO statement so that no datais included when the temporary table is created.Note: Selecting the Include data option may affect the total scanning time.Override previous Scanner Temp Table (Default = checked)If this option is selected, a temporary table is created with the first ‘CREATE TABLE #TEMP’ statement. Ifanother ‘CREATE TABLE #TEMP’ with the same name is found, it will drop the current table and create a newone for every time if find a new ‘CREATE TABLE #TEMP’.This option will not override any temporary tables created in User-Defined Temp Table window.Override User-Defined Temp Table (Default = cleared)If selected, a previous User-Defined Temp Table is overwritten if the SQL Scanner finds another createtemporary table statement using the same table name. This option will not override any temporary tablescreated in the SQL Scanner.
Number of characters to be skipped at the beginning of every line for all files(Default = 0)When a file is scanned, the SQL Scanner skips the number of characters specified at the beginningof every line.
Skip end of line continuation character (Default = <do not use>)If the text of the SQL statement is on more than one physical line and there is a continuation character at the endof each physical line of the SQL text, then specify what the continuation character is so that it will be skipped. Ifthis character is not skipped, it may cause the SQL Scanner to miss part of the SQL statement. Three options areincluded: <Do not use>, / (forward slash character), and _ (underscore character). In addition, you may add yourown character. This character will be saved in the field as long as it is the selected character. Once you makeanother selection, your own character will not be remembered.
Related TopicsSQL Scanner OverviewExample of Temporary Tables in SQL ScannerOptions (SQL Scanner Tab)Abstract Plan (SQL Scanner Tab)General (SQL Scanner Tab)
SQL Optimizer for SAP ASE 3.9 User Guide 83
Abstract Plan (SQL Scanner Tab)The Abstract Plan page on the SQL Scanner tab of the Preferences window allows you to include the retrieval ofthe abstract plan for the SQL statements. This requires Adaptive Server 15 or later.
Dump abstract plan (Default = cleared)Specify whether to retrieve the abstract plan for the SQL statement whenever the query plan is retrieved. Theabstract plan displays in the SQL Scanner window. The abstract plan is not saved on the database.When this checkbox is selected, the selected abstract plan icon and the abstract plan group name display onthe bottom right of the main status bar.Note: For third-party package applications, you are able to optimize SQL statements without changing thesource code by saving the abstract plan.
Group name (Default = blank)Specify the abstract plan group name where the abstract plans are saved. The default groups names inAdaptive Server are: ap_stdout and ap_stdin. These groups are usually used by the Database Administrator toenable server-wide abstract plan capturing and retrieving.ap_stdout is used by default to capture an abstract plan.ap_stdin is used by default to retrieve the abstract plan associated with a SQL statement during the execution ofthe SQL statement.
Abstract Plan Manager buttonOpens the Abstract Plan Manager window to view, create, and modify abstract plan group.
Related TopicsSQL Scanner OverviewOptions (SQL Scanner Tab)General (SQL Scanner Tab)
General (SQL Scanner Tab)View SQL Scanner - General page)
SQL Optimizer for SAP ASE 3.9 User Guide 84
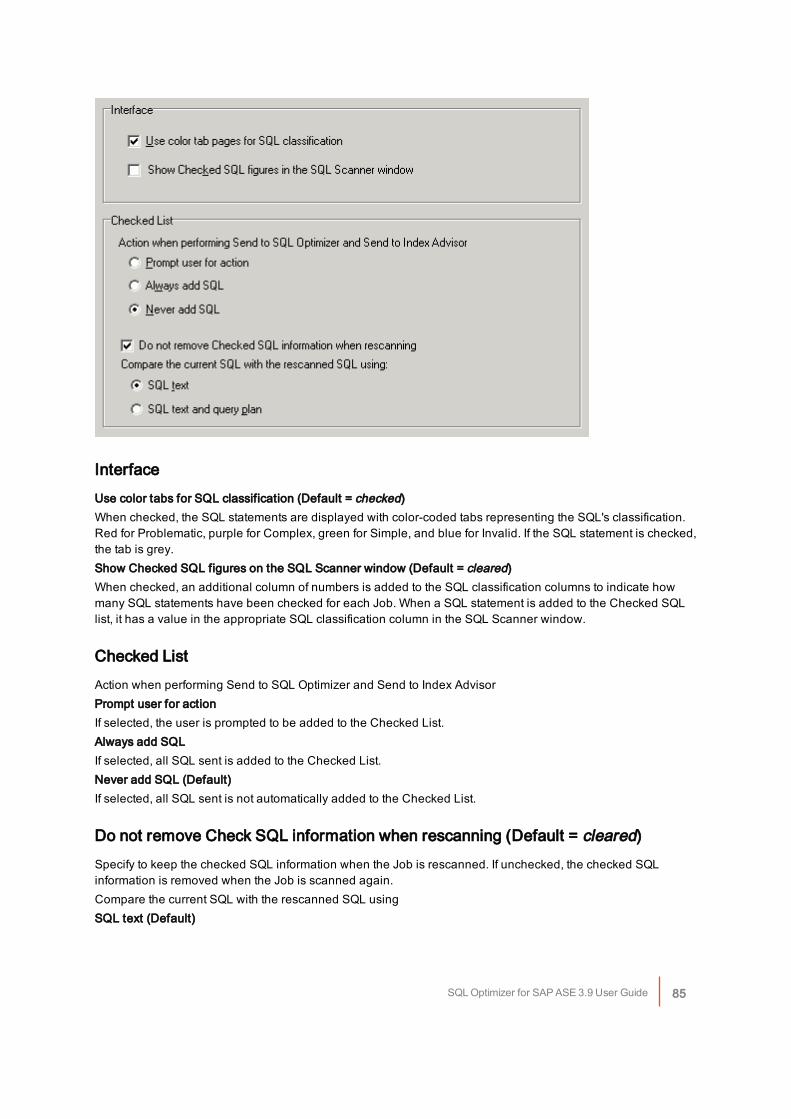
InterfaceUse color tabs for SQL classification (Default = checked)When checked, the SQL statements are displayed with color-coded tabs representing the SQL's classification.Red for Problematic, purple for Complex, green for Simple, and blue for Invalid. If the SQL statement is checked,the tab is grey.Show Checked SQL figures on the SQL Scanner window (Default = cleared)When checked, an additional column of numbers is added to the SQL classification columns to indicate howmany SQL statements have been checked for each Job. When a SQL statement is added to the Checked SQLlist, it has a value in the appropriate SQL classification column in the SQL Scanner window.
Checked ListAction when performing Send to SQL Optimizer and Send to Index AdvisorPrompt user for actionIf selected, the user is prompted to be added to the Checked List.Always add SQLIf selected, all SQL sent is added to the Checked List.Never add SQL (Default)If selected, all SQL sent is not automatically added to the Checked List.
Do not remove Check SQL information when rescanning (Default = cleared)Specify to keep the checked SQL information when the Job is rescanned. If unchecked, the checked SQLinformation is removed when the Job is scanned again.Compare the current SQL with the rescanned SQL usingSQL text (Default)
SQL Optimizer for SAP ASE 3.9 User Guide 85
Specify to match the SQL statements from the previous time the Job was scanned with the current scanningusing only the SQL text as a comparison for the match. The checked SQL information is preserved for those SQLstatements where the SQL text matches.SQL text and query planSpecify to match the SQL statements from the previous time the Job was scanned with the current scanningusing the SQL text and the query plan as a comparison for the match. The checked SQL information is onlypreserved for those SQL statements where the query plan and the SQL text match.
Related TopicsSQL Scanner OverviewOptions (SQL Scanner Tab)Abstract Plan (SQL Scanner Tab)
SQL ClassificationBased on the query plan, a SQL statement is classified according to the characteristics of the query plan. If thequery plan is not retrieved successfully, then these SQL statements are classified as Invalid SQL. A SQLstatement can be invalid if the database object it references does not exist, the database user does not haveprivileges to access it, or the incorrect database and user are used to scan the Job.All valid SQL statements are further classified as Simple, Complex, or Problematic SQL statements.
Problematic SQL StatementsProblematic SQL statements are potentially under performing SQL statements that should be optimized.Problematic SQL satisfy one of the following criteria:
l The number of tables referenced in the query plan of a SQL statement exceeds the upper limit of theComplex table scan operations range.
l Single full table scan with table size larger than the threshold size.
l Single full table scan in a nested loop with table size larger than the threshold size.
l The number of worktables is greater than or equal to the defined value if the With Worktable checkbox isselected in the Preferences window.
l The number of reformatting.
Complex SQL StatementComplex SQL statements are complicated SQL statements where there is room for improvement. Complex SQLsatisfy one of the following criteria:
l If the number of tables referenced in the query plan of an SQL statement falls into the Complex tablescan operations range defined in the Preferences window.
l SQL statements with full index scan.
SQL Optimizer for SAP ASE 3.9 User Guide 86
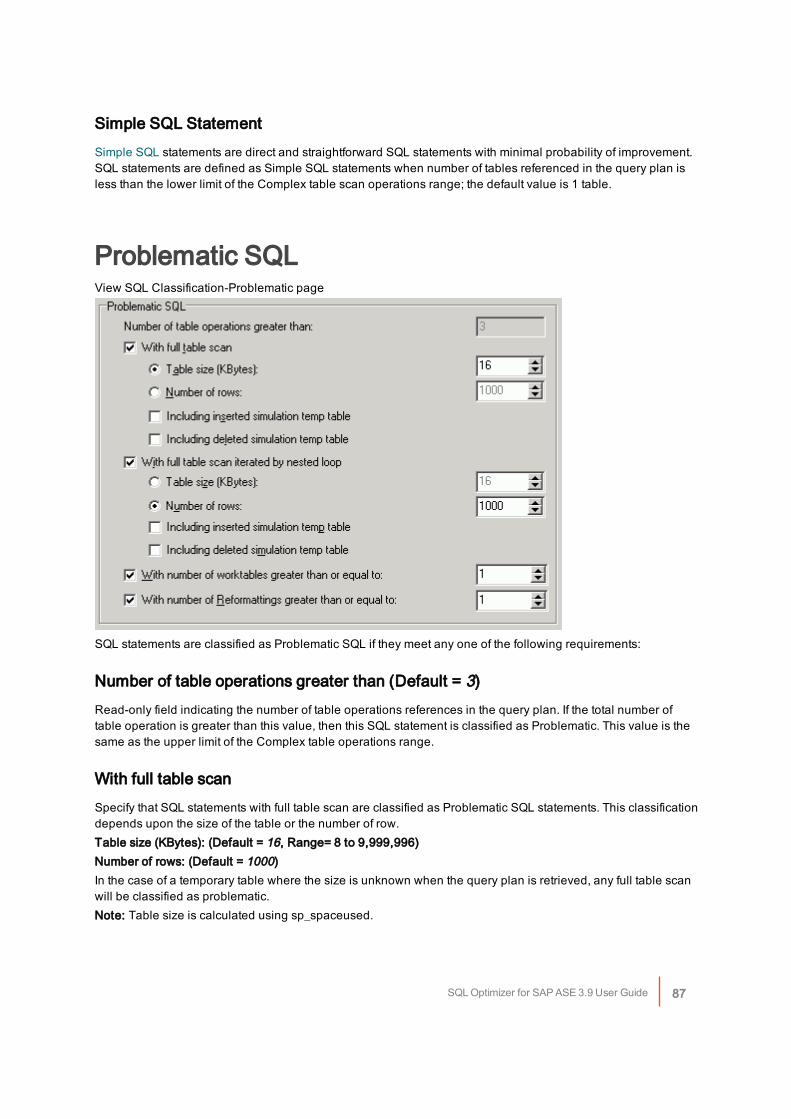
Simple SQL StatementSimple SQL statements are direct and straightforward SQL statements with minimal probability of improvement.SQL statements are defined as Simple SQL statements when number of tables referenced in the query plan isless than the lower limit of the Complex table scan operations range; the default value is 1 table.
Problematic SQLView SQL Classification-Problematic page
SQL statements are classified as Problematic SQL if they meet any one of the following requirements:
Number of table operations greater than (Default = 3)Read-only field indicating the number of table operations references in the query plan. If the total number oftable operation is greater than this value, then this SQL statement is classified as Problematic. This value is thesame as the upper limit of the Complex table operations range.
With full table scanSpecify that SQL statements with full table scan are classified as Problematic SQL statements. This classificationdepends upon the size of the table or the number of row.Table size (KBytes): (Default = 16, Range= 8 to 9,999,996)Number of rows: (Default = 1000)In the case of a temporary table where the size is unknown when the query plan is retrieved, any full table scanwill be classified as problematic.Note: Table size is calculated using sp_spaceused.
SQL Optimizer for SAP ASE 3.9 User Guide 87
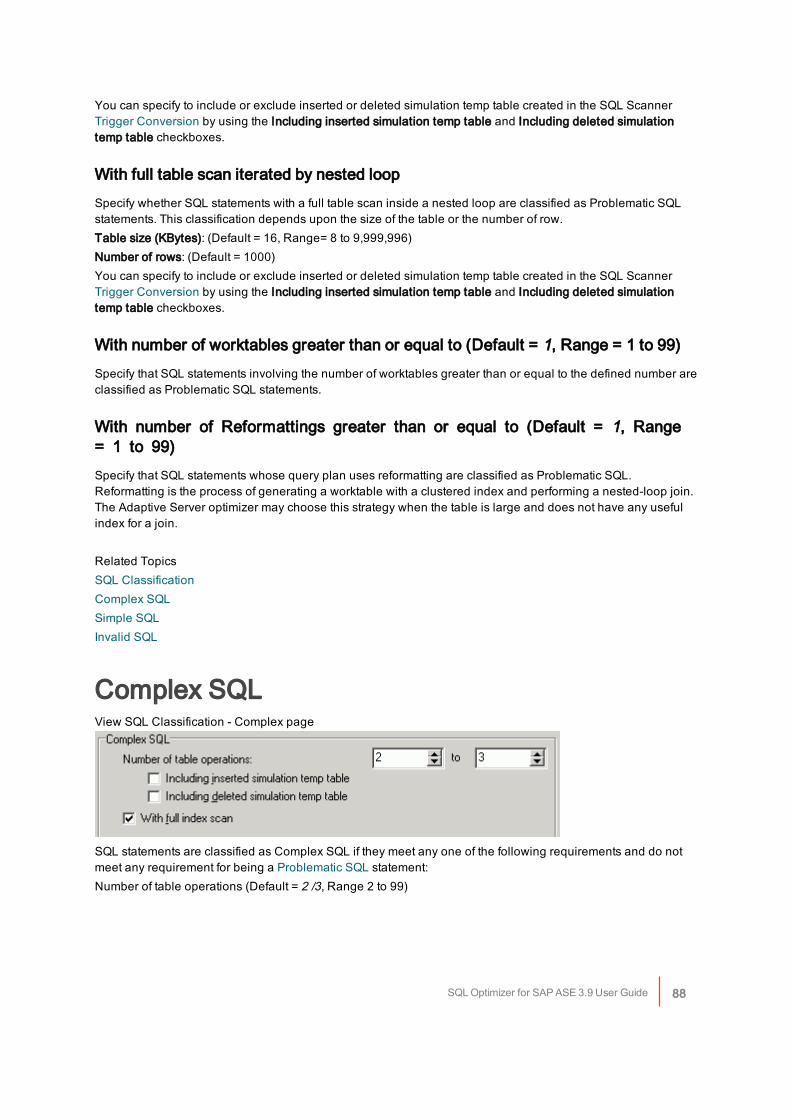
You can specify to include or exclude inserted or deleted simulation temp table created in the SQL ScannerTrigger Conversion by using the Including inserted simulation temp table and Including deleted simulationtemp table checkboxes.
With full table scan iterated by nested loopSpecify whether SQL statements with a full table scan inside a nested loop are classified as Problematic SQLstatements. This classification depends upon the size of the table or the number of row.Table size (KBytes): (Default = 16, Range= 8 to 9,999,996)Number of rows: (Default = 1000)You can specify to include or exclude inserted or deleted simulation temp table created in the SQL ScannerTrigger Conversion by using the Including inserted simulation temp table and Including deleted simulationtemp table checkboxes.
With number of worktables greater than or equal to (Default = 1, Range = 1 to 99)Specify that SQL statements involving the number of worktables greater than or equal to the defined number areclassified as Problematic SQL statements.
With number of Reformattings greater than or equal to (Default = 1, Range= 1 to 99)Specify that SQL statements whose query plan uses reformatting are classified as Problematic SQL.Reformatting is the process of generating a worktable with a clustered index and performing a nested-loop join.The Adaptive Server optimizer may choose this strategy when the table is large and does not have any usefulindex for a join.
Related TopicsSQL ClassificationComplex SQLSimple SQLInvalid SQL
Complex SQLView SQL Classification - Complex page
SQL statements are classified as Complex SQL if they meet any one of the following requirements and do notmeet any requirement for being a Problematic SQL statement:Number of table operations (Default = 2 /3, Range 2 to 99)
SQL Optimizer for SAP ASE 3.9 User Guide 88
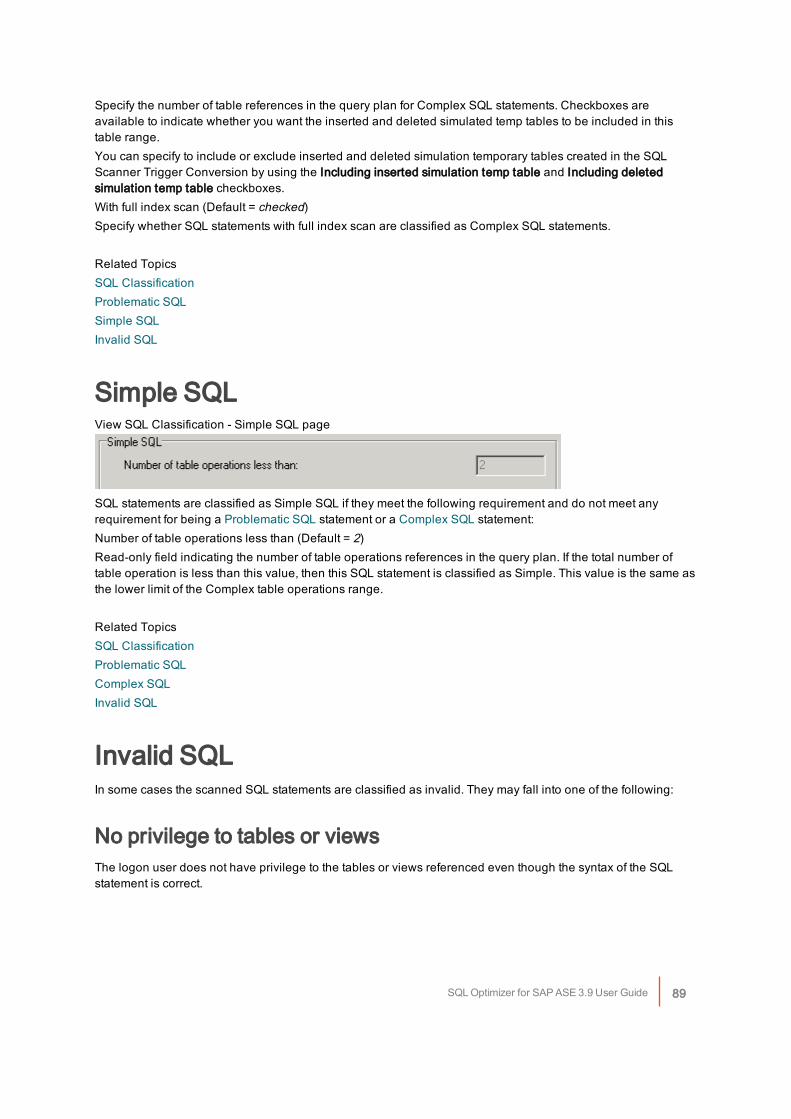
Specify the number of table references in the query plan for Complex SQL statements. Checkboxes areavailable to indicate whether you want the inserted and deleted simulated temp tables to be included in thistable range.You can specify to include or exclude inserted and deleted simulation temporary tables created in the SQLScanner Trigger Conversion by using the Including inserted simulation temp table and Including deletedsimulation temp table checkboxes.With full index scan (Default = checked)Specify whether SQL statements with full index scan are classified as Complex SQL statements.
Related TopicsSQL ClassificationProblematic SQLSimple SQLInvalid SQL
Simple SQLView SQL Classification - Simple SQL page
SQL statements are classified as Simple SQL if they meet the following requirement and do not meet anyrequirement for being a Problematic SQL statement or a Complex SQL statement:Number of table operations less than (Default = 2)Read-only field indicating the number of table operations references in the query plan. If the total number oftable operation is less than this value, then this SQL statement is classified as Simple. This value is the same asthe lower limit of the Complex table operations range.
Related TopicsSQL ClassificationProblematic SQLComplex SQLInvalid SQL
Invalid SQLIn some cases the scanned SQL statements are classified as invalid. They may fall into one of the following:
No privilege to tables or viewsThe logon user does not have privilege to the tables or views referenced even though the syntax of the SQLstatement is correct.
SQL Optimizer for SAP ASE 3.9 User Guide 89
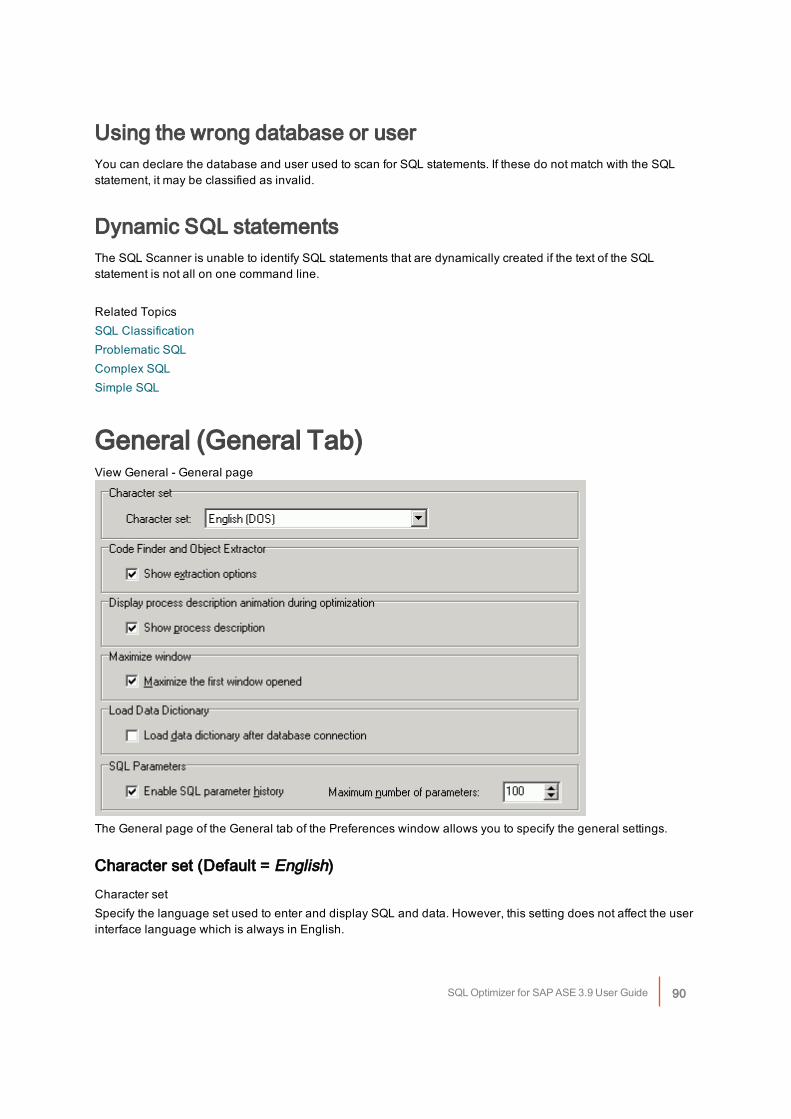
Using the wrong database or userYou can declare the database and user used to scan for SQL statements. If these do not match with the SQLstatement, it may be classified as invalid.
Dynamic SQL statementsThe SQL Scanner is unable to identify SQL statements that are dynamically created if the text of the SQLstatement is not all on one command line.
Related TopicsSQL ClassificationProblematic SQLComplex SQLSimple SQL
General (General Tab)View General - General page
The General page of the General tab of the Preferences window allows you to specify the general settings.
Character set (Default = English)Character setSpecify the language set used to enter and display SQL and data. However, this setting does not affect the userinterface language which is always in English.
SQL Optimizer for SAP ASE 3.9 User Guide 90
Code Finder and Object Extractor (Default = checked)Show extraction optionsSpecify whether to show the Extraction Criteria window when extracting object DDL in the Code Finder moduleand Objector Extractor module. The Extraction Criteria window allows the specification of the script information.
Display process description animation during optimizationShow process description (Default = checked)Specify whether to show during the optimization process the animated explanation (displayed in the Informationpane of the SQL Optimizer window) describing the optimization process.
Maximize windowMaximize the first window opened (Default = cleared)Specify that the first window you open is maximized. Every window that you open after that alsoopens maximized.If you "restore down" a window, then all open windows are "restored down" and any other window that isopen is not maximized as it is open. Once all windows are closed, the next window that is open ismaximized as it is opened.
Load Data DictionaryLoad database dictionary after database connection (Default = cleared)Specify that the database dictionary is not automatically loaded into the memory of the computer every time youconnect to a database. With this option unselected, the specific information that you need from the database isloaded when the SQL statement is parsed for functions such as scanning, optimization, and index generation.With this option unselected, the member lookup function used in text editing will not have all of the informationabout every database object.
SQL parametersEnable SQL parameter history (Default = checked)Specify to save the parameter information that you enter into the Parameters window so that next time that youare prompted to enter the values for the parameters, the data type and value that you last used for a parametername are automatically entered for you. The parameter names are case sensitive, so dpt_id and DPT_ID aretreated as two different parameters.Maximum number of parameters (Default = 100, Range 10 - 9999)Specify the maximum number of parameters that will be saved. When the maximum number is reached, theparameter name that is the longest unused will be removed from the file when a new parameter name is added.
Related TopicsSynchronizing the data dictionaryInput Parameter Values
SQL Optimizer for SAP ASE 3.9 User Guide 91
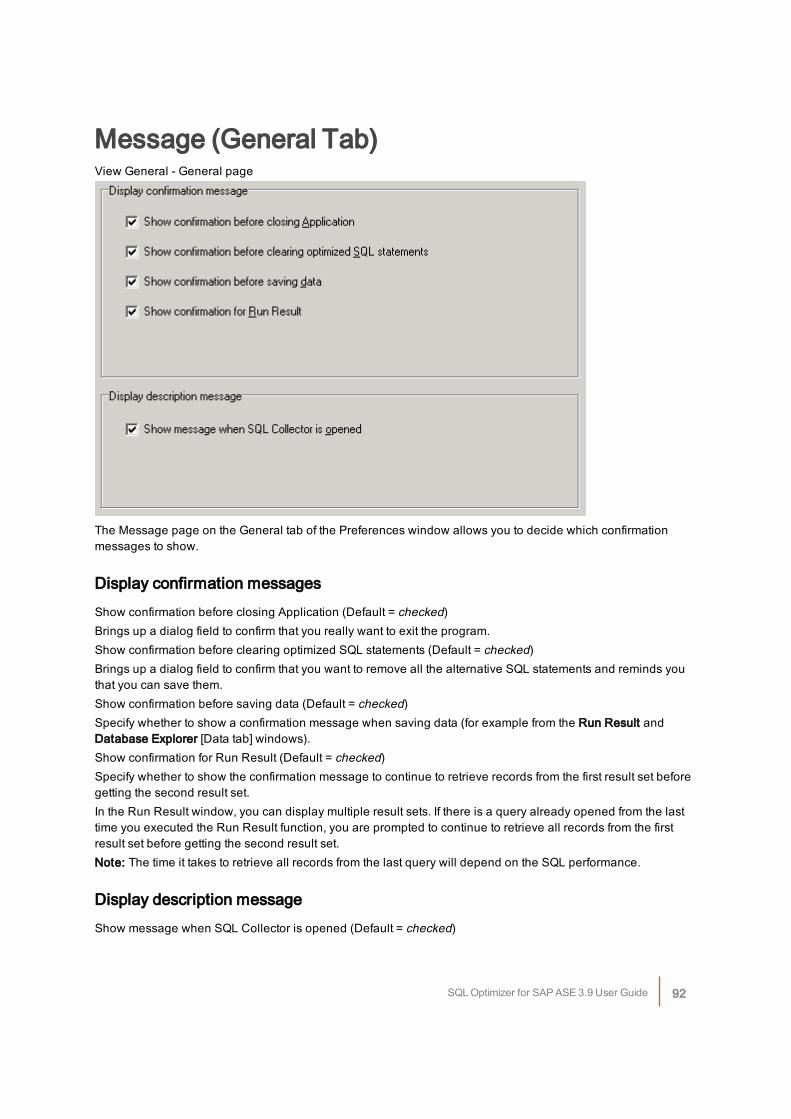
Message (General Tab)View General - General page
The Message page on the General tab of the Preferences window allows you to decide which confirmationmessages to show.
Display confirmation messagesShow confirmation before closing Application (Default = checked)Brings up a dialog field to confirm that you really want to exit the program.Show confirmation before clearing optimized SQL statements (Default = checked)Brings up a dialog field to confirm that you want to remove all the alternative SQL statements and reminds youthat you can save them.Show confirmation before saving data (Default = checked)Specify whether to show a confirmation message when saving data (for example from the Run Result andDatabase Explorer [Data tab] windows).Show confirmation for Run Result (Default = checked)Specify whether to show the confirmation message to continue to retrieve records from the first result set beforegetting the second result set.In the Run Result window, you can display multiple result sets. If there is a query already opened from the lasttime you executed the Run Result function, you are prompted to continue to retrieve all records from the firstresult set before getting the second result set.Note: The time it takes to retrieve all records from the last query will depend on the SQL performance.
Display description messageShow message when SQL Collector is opened (Default = checked)
SQL Optimizer for SAP ASE 3.9 User Guide 92
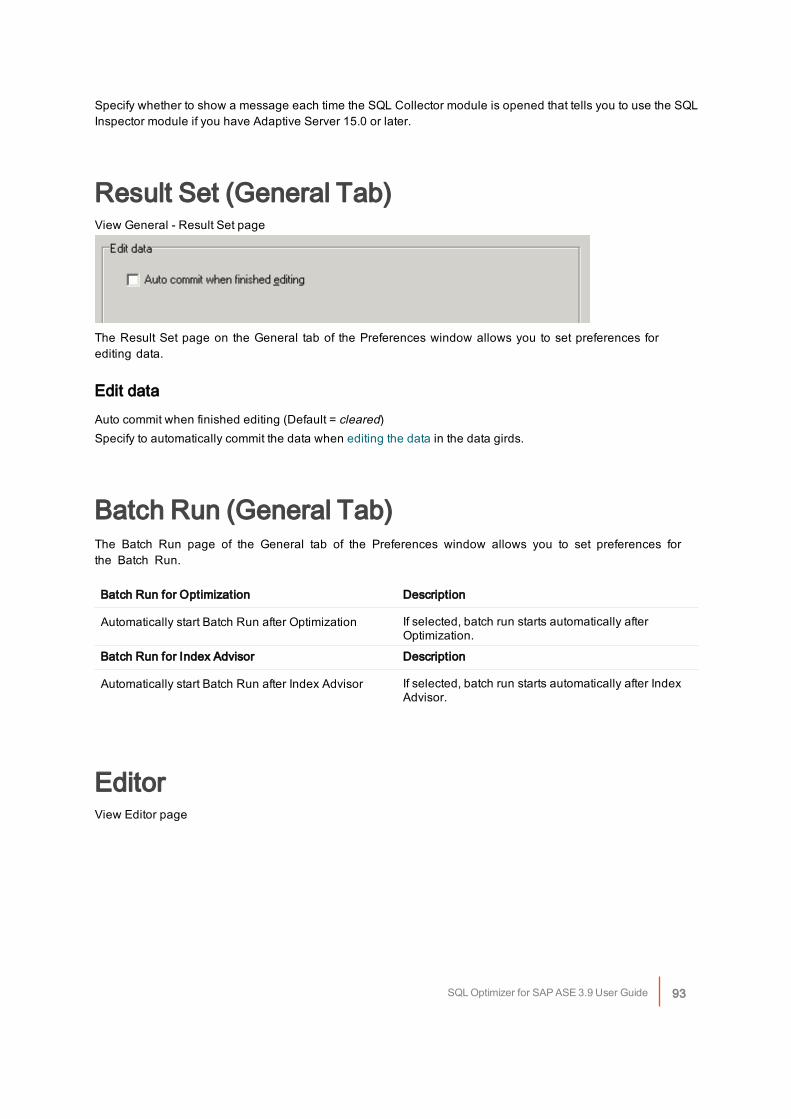
Specify whether to show a message each time the SQL Collector module is opened that tells you to use the SQLInspector module if you have Adaptive Server 15.0 or later.
Result Set (General Tab)View General - Result Set page
The Result Set page on the General tab of the Preferences window allows you to set preferences forediting data.
Edit dataAuto commit when finished editing (Default = cleared)Specify to automatically commit the data when editing the data in the data girds.
Batch Run (General Tab)The Batch Run page of the General tab of the Preferences window allows you to set preferences forthe Batch Run.
Batch Run for Optimization Description
Automatically start Batch Run after Optimization If selected, batch run starts automatically afterOptimization.
Batch Run for Index Advisor Description
Automatically start Batch Run after Index Advisor If selected, batch run starts automatically after IndexAdvisor.
EditorView Editor page
SQL Optimizer for SAP ASE 3.9 User Guide 93
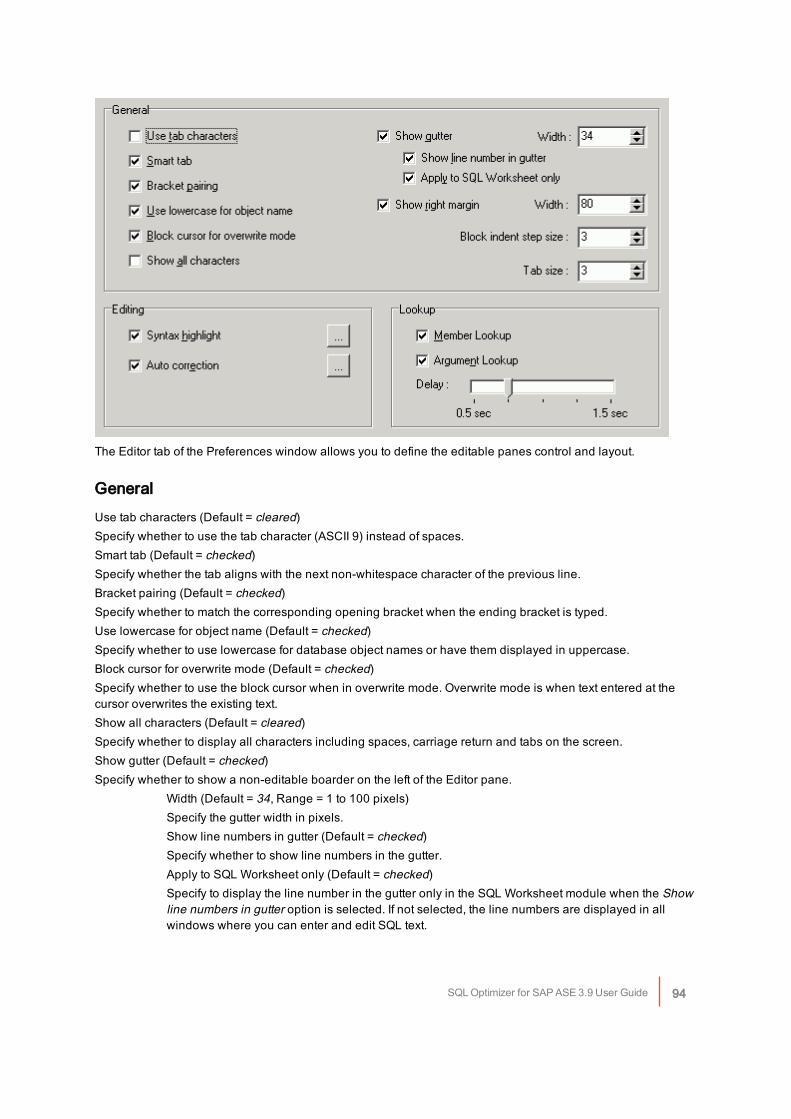
The Editor tab of the Preferences window allows you to define the editable panes control and layout.
GeneralUse tab characters (Default = cleared)Specify whether to use the tab character (ASCII 9) instead of spaces.Smart tab (Default = checked)Specify whether the tab aligns with the next non-whitespace character of the previous line.Bracket pairing (Default = checked)Specify whether to match the corresponding opening bracket when the ending bracket is typed.Use lowercase for object name (Default = checked)Specify whether to use lowercase for database object names or have them displayed in uppercase.Block cursor for overwrite mode (Default = checked)Specify whether to use the block cursor when in overwrite mode. Overwrite mode is when text entered at thecursor overwrites the existing text.Show all characters (Default = cleared)Specify whether to display all characters including spaces, carriage return and tabs on the screen.Show gutter (Default = checked)Specify whether to show a non-editable boarder on the left of the Editor pane.
Width (Default = 34, Range = 1 to 100 pixels)Specify the gutter width in pixels.Show line numbers in gutter (Default = checked)Specify whether to show line numbers in the gutter.Apply to SQL Worksheet only (Default = checked)Specify to display the line number in the gutter only in the SQL Worksheet module when the Showline numbers in gutter option is selected. If not selected, the line numbers are displayed in allwindows where you can enter and edit SQL text.
SQL Optimizer for SAP ASE 3.9 User Guide 94
Show right margin ((Default = checked)Specify whether to show a vertical line at the right margin.
Width (Default = 80, Range = 1 to 1000 characters)Specify the width of the page or the right margin position.Block indent size (Default = 3, Range = 1 to 20)Specify the block indent size in characters.Tab size (Default = 3, Range = 1 to 20)Specify the character length of a tab.
EditingSyntax highlight (Default = checked)Specify whether to use syntax highlight. If selected, it is possible to define the format for the following syntax:reserved word, SQL function, comment, identifier, quoted identifier, string, number, symbol, data type, globalvariable, local variable, temporary table, system procedure, invalid object, force, difference highlight (for SQLComparer), text selection, member lookup and argument lookup.Auto correction (Default = checked)Specify whether to automatically correct typing errors and abbreviations as characters are typed. Allows theaddition, editing and deletion of the auto correction entries. Also allows the specification of the action key thattriggers the automatic replacement.
LookupMember Lookup (Default = checked)Specify whether to show the lookup hint for database object members. For example, displays a list columnnames when a table name or alias name is followed by a period.Argument Lookup ((Default = checked)Specify whether to show the argument parameters hint for database functions and procedures. These hintsdisplay when the opening bracket is typed.Delay (Default = 0.75 sec, Range = 0.5 to 1.5 sec)Specify the delay time before the lookup hint displays.
Related TopicEditor Functions Overview
Database SettingThe Database settings are Adaptive Server configuration parameter settings. These settings should correspondto how you have these parameters set in Adaptive Server.
Set Ansinull (Default = Use database default)Specify the option with regards to comparison of NULL values. Select Use database default to have theprogram check how the Set Ansinull parameter is set on Adaptive Server and set this parameter the same as itis set on the database.
SQL Optimizer for SAP ASE 3.9 User Guide 95
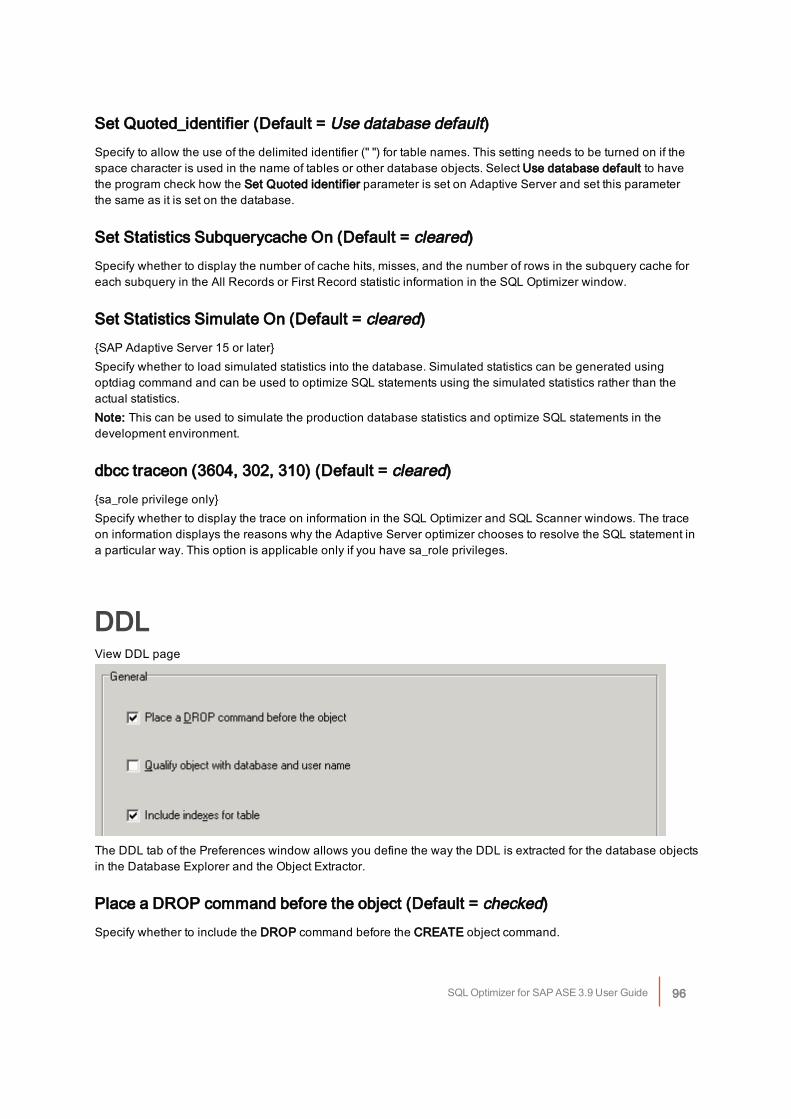
Set Quoted_identifier (Default = Use database default)Specify to allow the use of the delimited identifier (" ") for table names. This setting needs to be turned on if thespace character is used in the name of tables or other database objects. Select Use database default to havethe program check how the Set Quoted identifier parameter is set on Adaptive Server and set this parameterthe same as it is set on the database.
Set Statistics Subquerycache On (Default = cleared)Specify whether to display the number of cache hits, misses, and the number of rows in the subquery cache foreach subquery in the All Records or First Record statistic information in the SQL Optimizer window.
Set Statistics Simulate On (Default = cleared){SAP Adaptive Server 15 or later}Specify whether to load simulated statistics into the database. Simulated statistics can be generated usingoptdiag command and can be used to optimize SQL statements using the simulated statistics rather than theactual statistics.Note: This can be used to simulate the production database statistics and optimize SQL statements in thedevelopment environment.
dbcc traceon (3604, 302, 310) (Default = cleared){sa_role privilege only}Specify whether to display the trace on information in the SQL Optimizer and SQL Scanner windows. The traceon information displays the reasons why the Adaptive Server optimizer chooses to resolve the SQL statement ina particular way. This option is applicable only if you have sa_role privileges.
DDLView DDL page
The DDL tab of the Preferences window allows you define the way the DDL is extracted for the database objectsin the Database Explorer and the Object Extractor.
Place a DROP command before the object (Default = checked)Specify whether to include the DROP command before the CREATE object command.
SQL Optimizer for SAP ASE 3.9 User Guide 96
Qualify object with database and user name (Default = cleared)Specify whether to place the database and user name in front of every object in the DDL.
Include indexes for table (Default = checked)Specify whether to include the CREATE INDEX command when the DDL for a table is extracted.Note: The settings for this tab are also changed from the Extraction Criteria window that can be optionallydisplayed at the beginning of the extraction process in the Object Extractor.
Performance Monitor PreferencesPreferences allow the alteration of the default settings used by the Performance Monitor.
To change the preferences
In the Performance Monitor module, click .
Related TopicPerformance Monitor Overview
General TabView Performance Monitor - General page
SQL Optimizer for SAP ASE 3.9 User Guide 97

The General tab on the Preferences window for the Performance Monitor is for setting the statistics retrievalfrequency for how often the statistics are refreshed, how many refresh intervals are saved and the normalizationfactor for accurate comparisons of the statistics.
Refresh Data SettingThe Refresh setting allows you to collect the database performance statistics at regular intervals once you havestarted the monitoring process. If you have selected the Schedule option, then the monitoring starts and ends atthe specified time. If the Schedule option is not selected, then the monitoring starts immediately and does notend until you stop it.
Refresh Interval (Default = 5 seconds)
The refresh interval specifies how often the database performance statistics are collected. It can be set toseconds, minutes, hours, or days. Since most of the statistics for Adaptive Server are cumulative counters storedin the columns of monitoring tables, the Performance Monitor keeps track of those statistics changes andpresents the delta values for each time interval in the line charts, bar charts, and pie charts. This makes it easyto pinpoint the resource consumption peak time by reviewing those graphical presentations.For example, you can check for database performance by taking snapshots of the database statistics for each15 minutes by setting a Refresh Interval at 15 minutes with Preserve Data number of intervals set at 200. ThePerformance Monitor starts monitoring the database statistics until you manually stop monitoring. ThePerformance Monitor keeps up to 200 *15 minutes = 3000 minutes (50 hours) of statistics data in memory for
SQL Optimizer for SAP ASE 3.9 User Guide 98
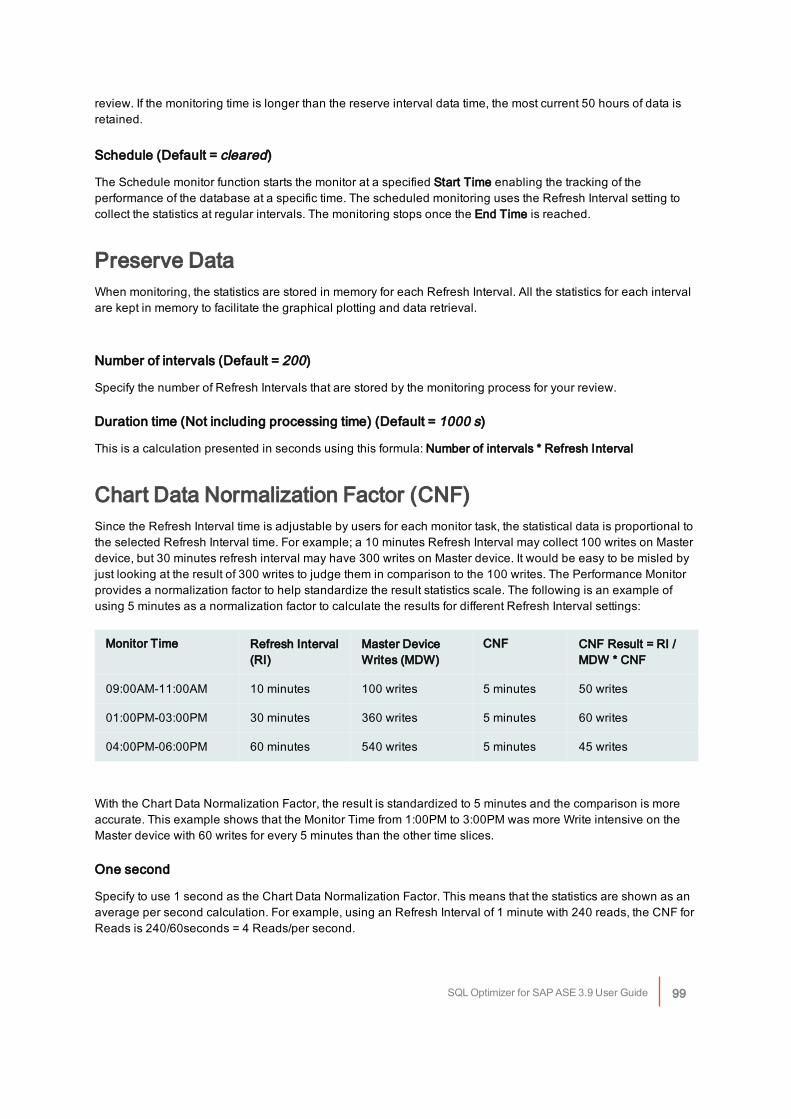
review. If the monitoring time is longer than the reserve interval data time, the most current 50 hours of data isretained.
Schedule (Default = cleared)
The Schedule monitor function starts the monitor at a specified Start Time enabling the tracking of theperformance of the database at a specific time. The scheduled monitoring uses the Refresh Interval setting tocollect the statistics at regular intervals. The monitoring stops once the End Time is reached.
Preserve DataWhen monitoring, the statistics are stored in memory for each Refresh Interval. All the statistics for each intervalare kept in memory to facilitate the graphical plotting and data retrieval.
Number of intervals (Default = 200)
Specify the number of Refresh Intervals that are stored by the monitoring process for your review.
Duration time (Not including processing time) (Default = 1000 s)
This is a calculation presented in seconds using this formula: Number of intervals * Refresh Interval
Chart Data Normalization Factor (CNF)Since the Refresh Interval time is adjustable by users for each monitor task, the statistical data is proportional tothe selected Refresh Interval time. For example; a 10 minutes Refresh Interval may collect 100 writes on Masterdevice, but 30 minutes refresh interval may have 300 writes on Master device. It would be easy to be misled byjust looking at the result of 300 writes to judge them in comparison to the 100 writes. The Performance Monitorprovides a normalization factor to help standardize the result statistics scale. The following is an example ofusing 5 minutes as a normalization factor to calculate the results for different Refresh Interval settings:
Monitor Time Refresh Interval(RI)
Master DeviceWrites (MDW)
CNF CNF Result = RI /MDW * CNF
09:00AM-11:00AM 10 minutes 100 writes 5 minutes 50 writes
01:00PM-03:00PM 30 minutes 360 writes 5 minutes 60 writes
04:00PM-06:00PM 60 minutes 540 writes 5 minutes 45 writes
With the Chart Data Normalization Factor, the result is standardized to 5 minutes and the comparison is moreaccurate. This example shows that the Monitor Time from 1:00PM to 3:00PM was more Write intensive on theMaster device with 60 writes for every 5 minutes than the other time slices.
One second
Specify to use 1 second as the Chart Data Normalization Factor. This means that the statistics are shown as anaverage per second calculation. For example, using an Refresh Interval of 1 minute with 240 reads, the CNF forReads is 240/60seconds = 4 Reads/per second.
SQL Optimizer for SAP ASE 3.9 User Guide 99

Refresh Interval (Default)
Specify to use the Refresh Interval as the Chart Data Normalization Factor.
User Defined
Specify in seconds the Chart Data Normalization Factor.The range of this setting is dependent upon the Refresh Interval measurement you select. The measurement isalways in seconds.Range for seconds: 1 - 60 (1 minute)Range for minutes: 1 - 3600 (1 hour)Range for hours: 1 - 216000 (60 hours)Range for days: 1 - 4665600 (54 days)
Chart Data Normalization Factor text field
If the User Defined option is not selected, this seconds text field is dimmed and the calculation from the Onesecond or Refresh Interval displays in this field.
Show confirmation before closing application (Default =checked)Brings up a dialog field to confirm that you really want to exit the Performance Monitor.
Related TopicsPerformance Monitor OverviewChart Setting TabInformation TabTop-N Display Tab
Chart Setting TabView Performance Monitor - Chart Setting page
SQL Optimizer for SAP ASE 3.9 User Guide 100

The Chart Setting tab on the Preferences window for the Performance Monitor is for controlling the display ofthe charts.
Chart Setting
Highlight Selected Series (Default = checked)The following settings affect the chart display of the selected statistic when you have drilled down to the bottomlevel of information.
Line Width (Default: 2 Range: 2 - 10)
Specify the width of the line for the statistic that you have selected in the left pane. This is used to enable thestatistic selected in the left pane to stand out from the other statistics in the chart.
Line Color (Default = Red)
Select the color for the selected statistic from the drop-down list.
Background Color (Default = Sky Blue)
Select the color for the chart background from the drop-down list.
SQL Optimizer for SAP ASE 3.9 User Guide 101

Time Axis Format (Default = hh:mm)
Select the format for displaying the date and time on the chart from the drop-down list.
Related TopicsPerformance Monitor OverviewGeneral TabInformation TabTop-N Display Tab
Information TabView Performance Monitor - Information page
The Information tab on the Preferences window for the Performance Monitor determines which of the top SQLstatements are highlighted, sets highlighting colors, and sets the automatic display of the connection informationwhen logging on.
SQL Optimizer for SAP ASE 3.9 User Guide 102

SQL statementIn the left pane of the Performance Monitor window, individual SQL statements are displayed when you drilldown from Information to Process Information to the Executing SQL Statements. The following settingsdetermine how many SQL statements are highlighted, by what criteria they are sorted, and the color that is usedfor highlighting.
Highlight Top N SQL Statements (Default = checked)
The top SQL statements are highlighted for you to quickly identify which SQL statements are consuming themost resources.
Top-N (Default = 10)Specify the number of SQL statements to be highlighted.Order By (Default = CPU Time(ms))Select the statistic to sort the SQL statements from the drop-down field.Highlight Color (Default = Yellow)Select the color from the drop-down field.
Highlight selected columnWhen you drill down to the lowest level of the charts, the data from the table displays in a grid underneath thechart. The column for the statistic that is selected in the left pane is highlighted.
Highlight Color (Default = Sky Blue)
Select the color from the drop-down field.
SQL Filter (executing SQL only)Ignore SQL executed from SQL Optimizer Default = checked)
Specify to exclude the SQL statements that are generated by any of the modules in SQL Optimizer but thePerformance Monitor.
Ignore SQL executed from Performance Monitor (Default = checked)
Specify to exclude the SQL statements that are generated by the Performance Monitor.
Display Connection Information window only when insufficientprivileges (Default = checked)Specify to display the Connection Information window each time you logon if the user logon does not have thedatabase privileges needed for the modules.
Related TopicsPerformance Monitor Overview
SQL Optimizer for SAP ASE 3.9 User Guide 103
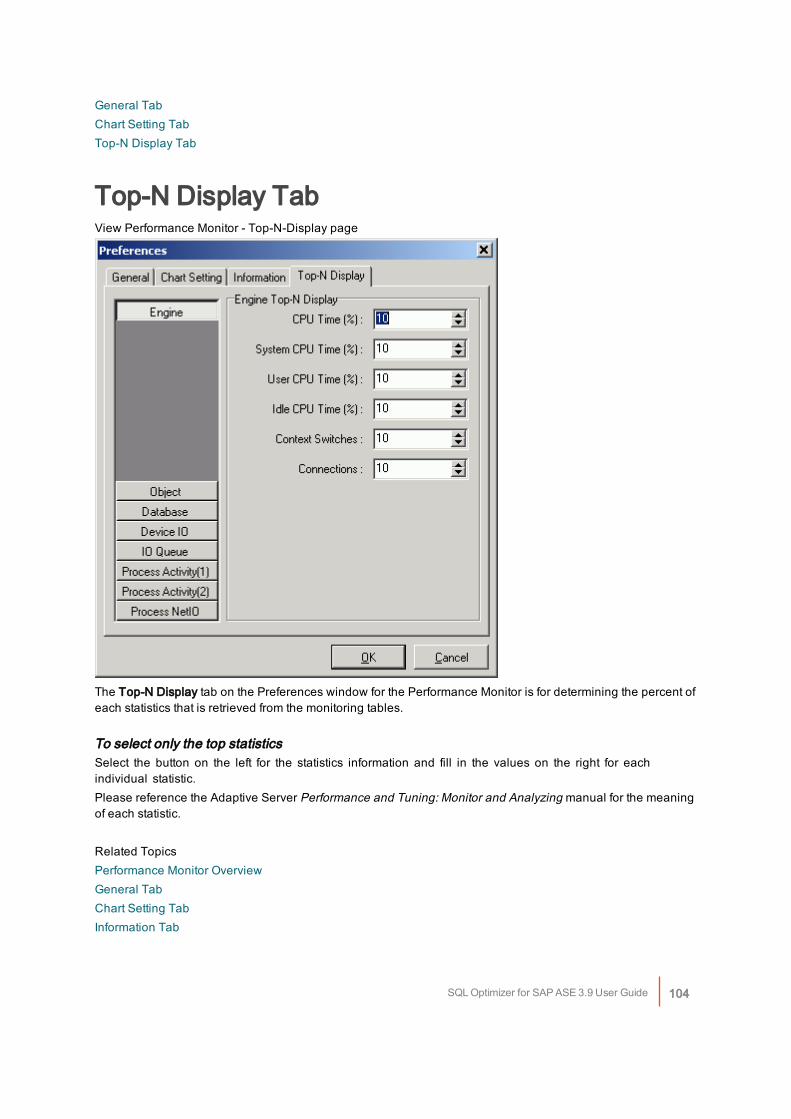
General TabChart Setting TabTop-N Display Tab
Top-N Display TabView Performance Monitor - Top-N-Display page
The Top-N Display tab on the Preferences window for the Performance Monitor is for determining the percent ofeach statistics that is retrieved from the monitoring tables.
To select only the top statisticsSelect the button on the left for the statistics information and fill in the values on the right for eachindividual statistic.Please reference the Adaptive Server Performance and Tuning: Monitor and Analyzing manual for the meaningof each statistic.
Related TopicsPerformance Monitor OverviewGeneral TabChart Setting TabInformation Tab
SQL Optimizer for SAP ASE 3.9 User Guide 104
Syntax HighlightSyntax highlighting changes the colors and attributes of the text in the SQL statement display panes, making iteasier to quickly identify parts of the code. The text colors and attributes for syntax highlights are defined withinthe Preferences window.
To change display attributes of the SQL text
1. Click Preferences
2. Select the Editor tab.
3. Under the Editing section, the Syntax highlight checkbox is used to apply the syntax highlight to thecode. By default this option is selected.
4. To modify the colors and attributes, click the corresponding button to open the Syntax HighlightSettings window.
Element options
ElementsIt is possible to define the font format and color for the following elements:
Element Description
Reserved Word Adaptive Server SQL reserved words.For example: ADD, ALL, ALTER, AND, ANY, AS, ASC, BACKUP, BEGIN
Function Adaptive Server build-in functions.For example: ABS, ACOS, ASCII, ASIN, ATAN, ATAN2, CEILING, CHARINDEX
Comment Comment delimiters ( -- ).
Identifier Any text that does not fall in the above categories.
Quoted Identifier Database object identifier within quotes.
String Text enclosed in single quotes ( ' ' ).
Number Numbers 0 to 9 and floating point.
Symbol Symbols.For example: !, %, ^, &, *, (, ), -, =, +, {, }, ;, ~, <, >, ,, ., /, <=, >=
Data Type Adaptive Server data type.
SQL Optimizer for SAP ASE 3.9 User Guide 105
For example: BIT, INT, SMALLINT, DEC, CHAR, VARCHAR, BINARY
Global Variable @@variable accessed by a any program block.
Local Variable @variable accessed by a single program block.
Temporary Table User-Defined Temporary Tables created for the current session.
System Procedure Procedures from the System catalog.
Invalid object Unrecognized database object under the current database and user.
Force Optimizer hints that influence choices of the SQL Server optimizer.
Difference highlight The differences between two SQL for the SQL Comparer window.
Text Selection Text selection highlighting.
Member Lookup Member lookup field.
Argument Lookup Argument lookup field.
Foreground color
Specify the foreground color of the selected element; use the drop-down list or to select the desired color.Select the Use default foreground color checkbox to use the Windows default text color.
Background color
Specify the background color of the selected element; use the drop-down list or click to select the desiredcolor. Select the Use default background color checkbox to use the Windows default background color. Bydefault, this checkbox is selected for all elements.
Editor optionsSpecify the font style and size of all editable panes.
Reset Default buttonReset the default settings for syntax highlight for all settings.
To change the color and attribute of a particular element
1. Select the syntax name from the Element option list-box or select the text from the Preview section andchange the attributes accordingly.
2. Changes are reflected on the Preview section, click Apply to implement the changes.
SQL Optimizer for SAP ASE 3.9 User Guide 106
Related TopicEditor Functions Overview
Auto CorrectionAuto correction automatically corrects any typo and spelling errors, if the auto correction option is turned on. Forexample, if "teh" is typed followed by a space, it will automatically be corrected to "the". You can use this tocreate your own abbreviations of text you frequently type. For example, if you set up your own auto correction tohave "si" replace with "SELECT INTO".Auto correction entries are user-defined and can be modified in the Preferences window.
To open the Auto Correction window
1. Click Preferences .
2. Select the Editor tab.
3. Under the Editing section, the Auto correction checkbox is used to enable auto correction. By default, thisoption is selected.
4. To modify the auto correction entries, click the corresponding button to open the Auto CorrectionSettings window.
Available auto correction entries are listed on the list-box. Each entry has a REPLACE text (the original texttyped) and WITH text (the replacement text).Action keys are the keystrokes that activate the auto correction. When you type the REPLACE text and follow itby any action key, the replacement takes place. No whitespaces are needed to separate each action key. Bydefault, the action keys are ";,:=[]\n\t\s" representing the following:
Action Key Keyboard Function
; semi-colon
, comma
: colon
= equal
[ ] right and left brackets
\n enter key
\t tab key
\s spacebar
SQL Optimizer for SAP ASE 3.9 User Guide 107
To add an auto correction entry
1. Click Add
2. Enter the original [Replace] and replacement text [With]
3. Click OK.
To modify an auto correction entry1. Select the entry to be modified from the Auto correction list-box and click Edit.
2. Modify the text
3. Click OK.
To delete an auto correction entry
l Select the entry to delete from the Auto correction field and click Delete.
To implement all changes
l Click Apply on the Auto Correction Settings window.
Related TopicEditor Functions Overview
Member and Argument LookupMember lookup enables you to select the database objects or column names from a list as you create a SQLstatement. Argument lookup provides hints for functions and procedures to help construct SQL statements. Bothof these functions automatically display as you type the appropriate corresponding text in the SQL statement.Member lookup displays the list of database object members for databases, users, tables, views and alias. Forexample, if a table name or alias is typed followed by "." then the corresponding lookup hint is the columnnames. You select the item from the list and it is entered in to the text. The [Ctrl+Space] can be used a short-cutkey to bring up the member lookup.Argument lookup displays the next argument parameter for functions and procedures. For example, if aprocedure name is typed followed by "(" then the list of arguments is shown highlighting the next enterableargument. You cannot select items from the Argument lookup list. It provides a guide to help you determine whatyou should enter as a value for the function or procedure. The [Ctrl+Shift+Space] can be used as a short-cutkey to bring up the argument lookup.
To enable or disable the member and argument lookup
1. Click Preferences .
2. Select the Editor tab.
SQL Optimizer for SAP ASE 3.9 User Guide 108
3. Under the Lookup section, specify whether to use the lookups hints.
Member lookup (Default)Specify whether to show the lookup hint for database object members.
Argument lookup (Default)Specify whether to show the argument parameters hint for functions and procedures.
Delay (Default = 0.75 sec, Range = 0.5 to 1.5 sec)Specify the minimum delay time before the lookup hint displays.
Related TopicEditor Functions Overview
Indent and Outdent TextThe text can be shifted from left to right or right to left using the Indent and Outdent functions. The number ofcharacters shifted is dependent on the Block indent size (default = 3 characters) parameter in thePreferences window.
To indent text
Highlight the text or place the cursor on the line to be indented and click Indent .
To outdent text
Highlight the text or place the cursor on the line to be outdented and click Outdent .
Related TopicEditor Functions Overview
Comment and Uncomment TextYou can comment or uncomment a line of text by selecting the line or highlighting the text and using theComment and Uncomment functions. These two functions use the single line comment delimiter "- -".Commenting out a line means that the line is ignored during execution.
SQL Optimizer for SAP ASE 3.9 User Guide 109
To comment a line of text
Select the text or place the cursor on the line to be commented and click Comment . Notice that thebeginning of a text or line prefix is marked with the " - - " delimiter.
To uncomment a line of text
Select the text or place the cursor on the line to be uncommented and click Uncomment . Notice the firstoccurrence of the " - - " comment delimiter is removed.
Related TopicEditor Functions Overview
Change Text to Uppercase andLowercaseText can be changed from uppercase and lowercase by selecting the text and using the Uppercase andLowercase functions.
To change text to uppercase
Select the text and click Uppercase .
To change text to lowercase
Select the text and click Lowercase .
Related TopicEditor Functions Overview
Bracket PairingSimple mistakes are often made during SQL construction because of uneven left and right brackets. Withbracket pairing, the corresponding open bracket is matched with the closing bracket as you type theclosing bracket.
To enable bracket pairing
1. Click Preferences
2. Select the Editor tab.
3. Under the General section, select Bracket Pairing.
SQL Optimizer for SAP ASE 3.9 User Guide 110
Bracket pairing matches brackets for the parentheses ( ), the curly brackets { }, and the square brackets [ ].
Related TopicEditor Functions Overview
Customize Editable PanesYou can customize the behavior of editable panes in many ways. The editor options can be set in thePreferences window under the Editor tab. These options include:
l Use tab characters
l Smart tab
l Use lowercase for object name
l Block cursor for overwrite
l Show all characters
l Right margin
l Gutter
l Block indent size
l Tab Size
Related TopicEditor Functions Overview
Editor FunctionsBelow is a list of available functions within the editable panes.
Button or Menu Function
Syntax Highlight
Auto Correction
Bracket Pairing
Argument Lookup
Member Lookup
Edit Menu Indent
SQL Optimizer for SAP ASE 3.9 User Guide 111
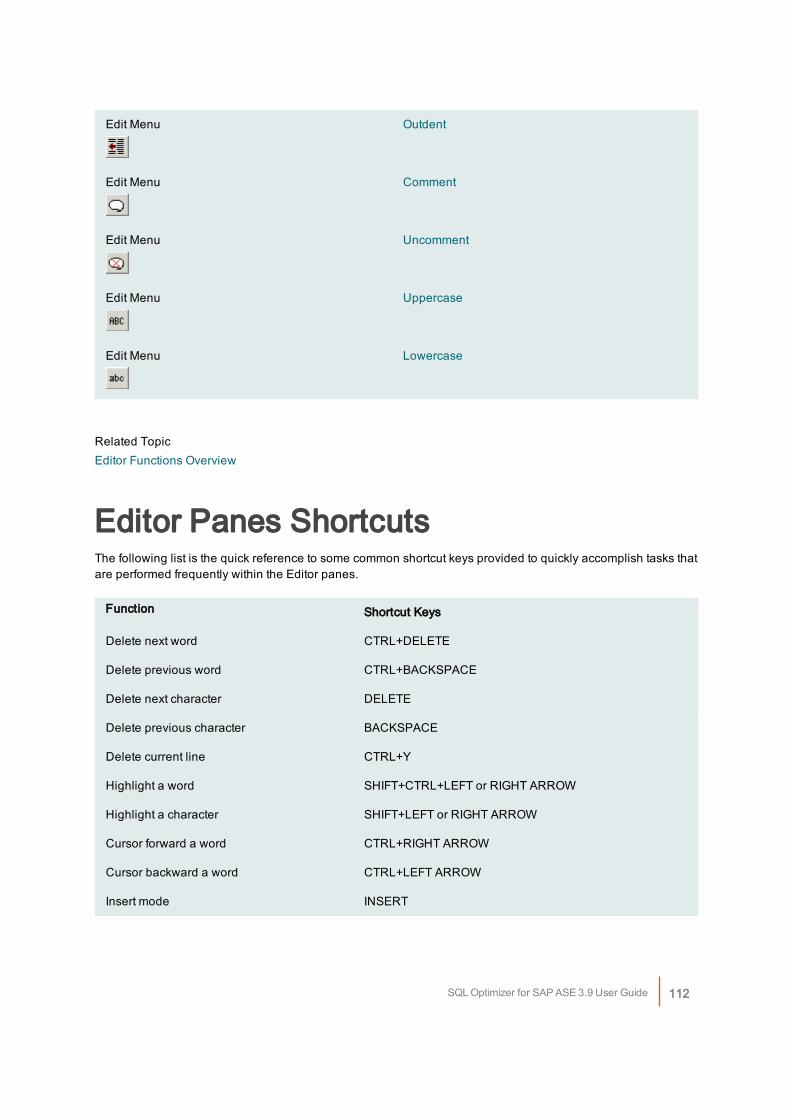
Edit Menu Outdent
Edit Menu Comment
Edit Menu Uncomment
Edit Menu Uppercase
Edit Menu Lowercase
Related TopicEditor Functions Overview
Editor Panes ShortcutsThe following list is the quick reference to some common shortcut keys provided to quickly accomplish tasks thatare performed frequently within the Editor panes.
Function Shortcut Keys
Delete next word CTRL+DELETE
Delete previous word CTRL+BACKSPACE
Delete next character DELETE
Delete previous character BACKSPACE
Delete current line CTRL+Y
Highlight a word SHIFT+CTRL+LEFT or RIGHT ARROW
Highlight a character SHIFT+LEFT or RIGHT ARROW
Cursor forward a word CTRL+RIGHT ARROW
Cursor backward a word CTRL+LEFT ARROW
Insert mode INSERT
SQL Optimizer for SAP ASE 3.9 User Guide 112
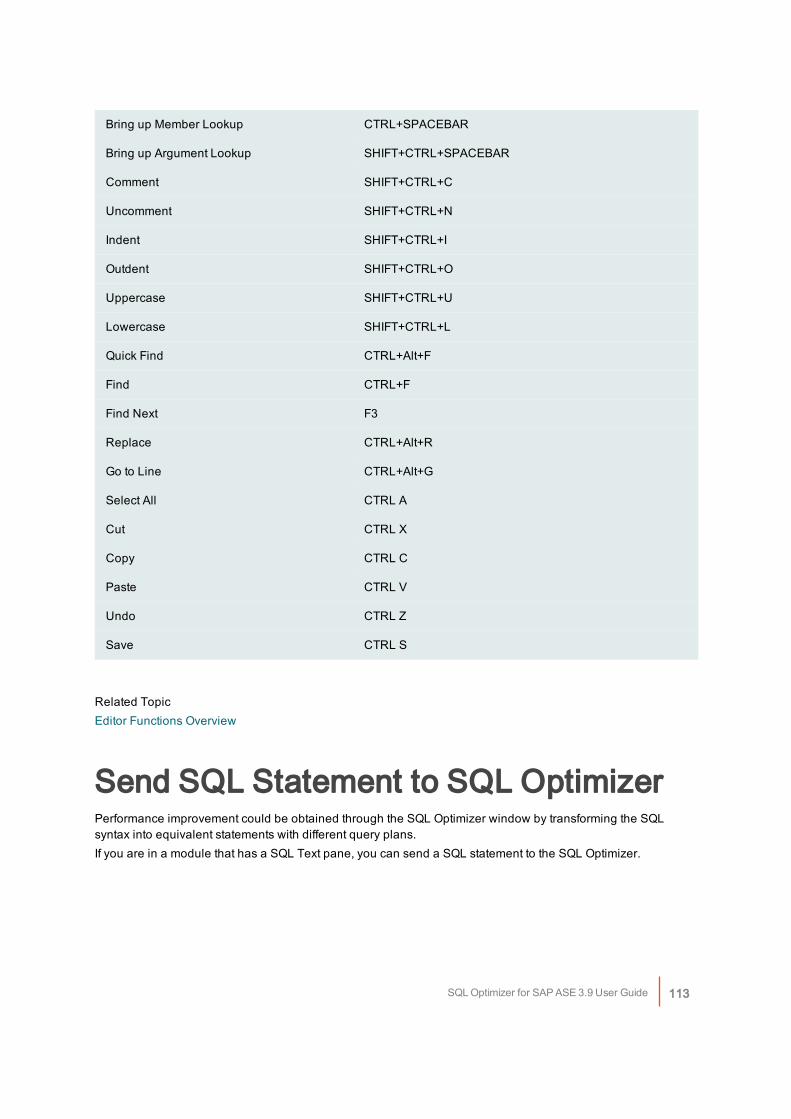
Bring up Member Lookup CTRL+SPACEBAR
Bring up Argument Lookup SHIFT+CTRL+SPACEBAR
Comment SHIFT+CTRL+C
Uncomment SHIFT+CTRL+N
Indent SHIFT+CTRL+I
Outdent SHIFT+CTRL+O
Uppercase SHIFT+CTRL+U
Lowercase SHIFT+CTRL+L
Quick Find CTRL+Alt+F
Find CTRL+F
Find Next F3
Replace CTRL+Alt+R
Go to Line CTRL+Alt+G
Select All CTRL A
Cut CTRL X
Copy CTRL C
Paste CTRL V
Undo CTRL Z
Save CTRL S
Related TopicEditor Functions Overview
Send SQL Statement to SQL OptimizerPerformance improvement could be obtained through the SQL Optimizer window by transforming the SQLsyntax into equivalent statements with different query plans.If you are in a module that has a SQL Text pane, you can send a SQL statement to the SQL Optimizer.
SQL Optimizer for SAP ASE 3.9 User Guide 113
To send a SQL statement to the SQL Optimizer and automatically start the optimization process
1. Select the SQL statement you want to optimize.
2. Click Send to SQL Optimizer .
Supported SQL StatementsThe SQL Optimizer only supports a single SELECT, SELECT INTO, INSERT, UPDATE or DELETESQL statement.
Setting Database and UserWhen you optimize a SQL statement, create a temp table, or execute a SQL statement, you must have the rightdatabase selected and your logon must have access to the tables used in the SQL statement.In the bottom left corner of the main window are find two drop-down lists: one for databases and theother for users. Select the appropriate database and user. This is equivalent to perform a USE andSETUSER commands.
SQL from the SQL ScannerYou receive the following warning message if your current database and user do not match the one previouslyused to retrieve the query plan of the SQL statement. Click Yes to have the database and user automaticallychanged for you and continue with the optimization process."Your current connection is not the same as the scanned SQL statement. Do you want to change the databaseto 'database_name' and user to 'username' now to continue with the optimization?
SQL in a CursorIf the SQL statement is used within a cursor declaration the SQL for cursor checkbox is automatically selected.
SQL with Temporary TablesIf the SQL statement uses a temporary table and the SQL Scanner found the CREATE TABLE or SELECT INTOstatement for creating the table, then the User-Defined Temp Table window is automatically opened and theDDL for creating and populating is entered ready for you to execute it.
Related TopicSQL Optimizer Overview
SQL Optimizer for SAP ASE 3.9 User Guide 114
Copy to SQL WorksheetSQL statements can be executed in the SQL Worksheet. If you are in a module that has a SQL Text pane, youcan copy a SQL statement to the SQL Worksheet.
To copy a SQL statement to the SQL Worksheet
1. Select the SQL statement you want to execute.
2. Click Copy to SQL Worksheet .
The selected SQL statement is copied to Editor pane of the SQL Worksheet window.
Related TopicSQL Worksheet Overview
Send to Index AdvisorPerformance improvement for a SQL statement could be obtained by creating indexes to reduce I/Oconsumption. By sending a SQL statement to the Index Advisor module, you can obtain recommendations fornew indexes that could change SQL performance.If you are in a module that has a SQL Text pane, you can send a SQL statement to the Index Advisor.
To send a SQL statement to the Index Advisor and automatically start the indexrecommendation process
1. Select the SQL statement you want to generate indexes for.
2. Click Send to Index Advisor .
Note: The Index Advisor only supports a single SELECT, INSERT, UPDATE and DELETE SQL statement.
Related TopicIndex Advisor Overview
Open SQL from SQL RepositorySQL statements saved in the SQL Repository can be copied into the SQL Optimizer, SQL Formatter, orSQL Worksheet.
SQL Optimizer for SAP ASE 3.9 User Guide 115
To open a SQL statement from the SQL Repository
1. In the SQL Optimizer, SQL Formatter, or SQL Worksheet., select Edit | Open SQL from SQL Repository.
2. Navigate through the tree structure and select the SQL statement.
3. Either double-click the SQL statement, or click Open.
Related TopicSQL Repository Overview
Save SQL to SQL RepositoryIf you are using this function from the SQL Scanner, you can send multiple SQL statements to the SQLRepository. If you are using this function from the other modules, you can send one SQL statement to the SQLRepository.
To save multiple SQL statements to the SQL Repository module
1. In the SQL Scanner, select the Job which contains the SQL statements. In the SQL Inspector, click in theSQL Text pane.
2. Click Save SQL to SQL Repository .
3. Select the location in which to save the SQL statements and click OK.
To save a SQL statement to the SQL Repository module
1. In the modules with a SQL Text window, select a SQL statement.
2. Click Save SQL to SQL Repository .
3. Select the location in which to save the SQL statements and click OK.
Only valid SQL statements are added to the SQL Repository.Note: The SQL Repository only supports a single SELECT, INSERT, UPDATE or DELETE SQL statement.
Related TopicSQL Repository Overview
Create Benchmark Factory Import FileAll the SQL statements can be saved in a text file from the SQL Scanner, the SQL Repository, the SQLInspector, and the SQL Optimizer windows. These SQL statements can then be imported into BenchmarkFactory 4.6 or later.
SQL Optimizer for SAP ASE 3.9 User Guide 116
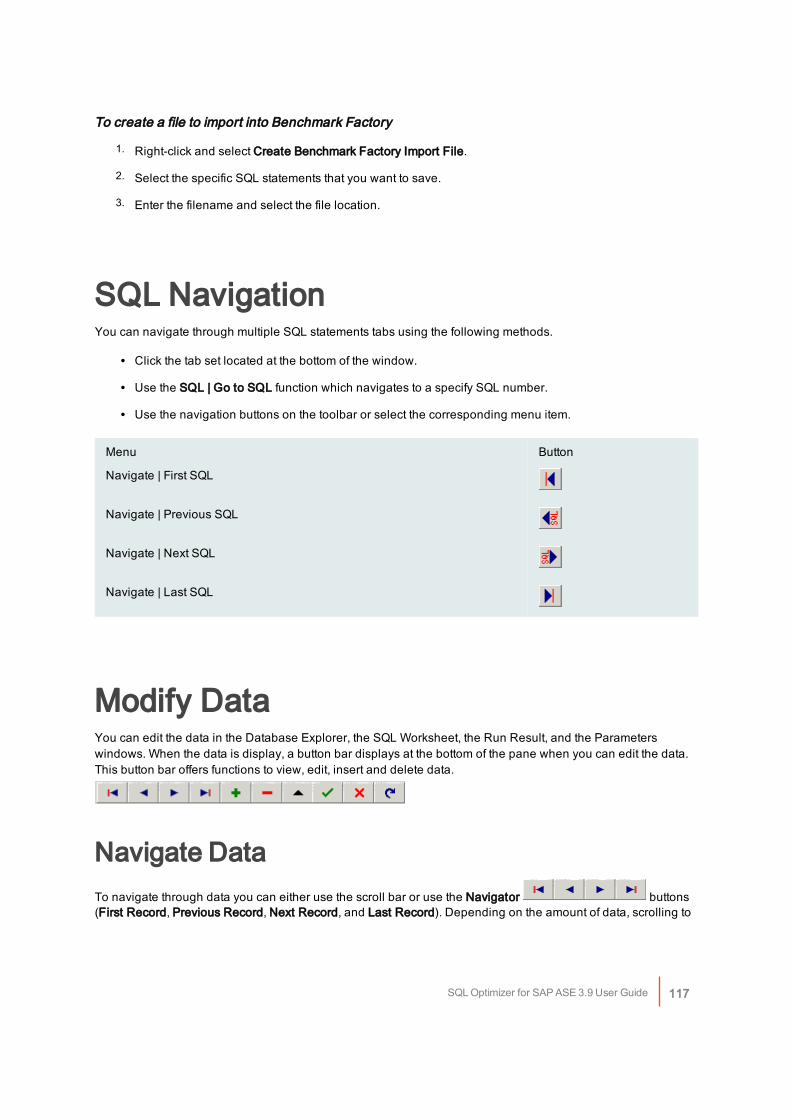
To create a file to import into Benchmark Factory
1. Right-click and select Create Benchmark Factory Import File.
2. Select the specific SQL statements that you want to save.
3. Enter the filename and select the file location.
SQL NavigationYou can navigate through multiple SQL statements tabs using the following methods.
l Click the tab set located at the bottom of the window.
l Use the SQL | Go to SQL function which navigates to a specify SQL number.
l Use the navigation buttons on the toolbar or select the corresponding menu item.
Menu Button
Navigate | First SQL
Navigate | Previous SQL
Navigate | Next SQL
Navigate | Last SQL
Modify DataYou can edit the data in the Database Explorer, the SQL Worksheet, the Run Result, and the Parameterswindows. When the data is display, a button bar displays at the bottom of the pane when you can edit the data.This button bar offers functions to view, edit, insert and delete data.
Navigate DataTo navigate through data you can either use the scroll bar or use the Navigator buttons(First Record, Previous Record, Next Record, and Last Record). Depending on the amount of data, scrolling to
SQL Optimizer for SAP ASE 3.9 User Guide 117
the bottom of the page or executing the Last Record function may take a long time as all records are retrievedfrom the database.
Edit a RecordTo edit the record's column, place the cursor on the record that you want to edit and click Edit Record .You can change the data in the grid. Press the tab key or use the mouse to move to the next column. Once you
complete the modification, click Commit or Rollback .
Insert a RecordTo insert a new record, place the cursor on the record that you want the new record inserted before and click
Insert Record . Enter data for each column, press the tab key or use the mouse to move to the next
column. Once you have completed entering the data, click Commit or Rollback .
Delete a RecordTo delete a record, place the cursor on the record that you want to delete and click Delete Record . ClickOK on the confirmation dialog to confirm that the record you want to delete is correct. The Delete Record isautomatically committed on your database.
Refresh DataTo refresh the data, click Refresh .Note: Not all Views are updateable; a general rule is that any UPDATE, DELETE, or INSERT statement on ajoin view can be modified if only one underlying base table exists.
Related TopicResult Set (General Tab)
Copy Data from a Single CellYou can copy the data from a single cell into the windows clipboard from the Database Explorer, the SQLWorksheet, the Run Result, and the Parameters windows.
To copy data
1. Highlight the cell with data.
2. Right-click and select Copy.
SQL Optimizer for SAP ASE 3.9 User Guide 118
CommentsThe three most popular comment delimiters used within SQL statements are recognized as valid SQL syntax:
l A single line comment using --
l A single line comment using //
l A block comment starting with /* and ending with */
Other comment delimiters are not accepted as valid SQL syntax. Due to the lack of uniform standards inthe presentation of comments within source code, it is not practical to implement each and everycommenting indicator.
ParametersParameters, also called variables, can be embedded in a SQL statement without pre-defining the data type andvalue. All variable names are highlighted in red (by default) after the formatting. Variables with or without a "@"sign are recognized. When you optimize the SQL statement or retrieve the query plan, run time, the run result fora SQL statement that uses a parameter, you are prompted to enter the variables using the Parameters window.Note: You can retrieve the query plan for a SQL statement that has a variable without the need to enter the datatype or value by executing the Show Default Plan function from the SQL menu.
Related TopicParameters WindowInput Parameter Values
Parameters WindowView Parameters Window
SQL Optimizer for SAP ASE 3.9 User Guide 119
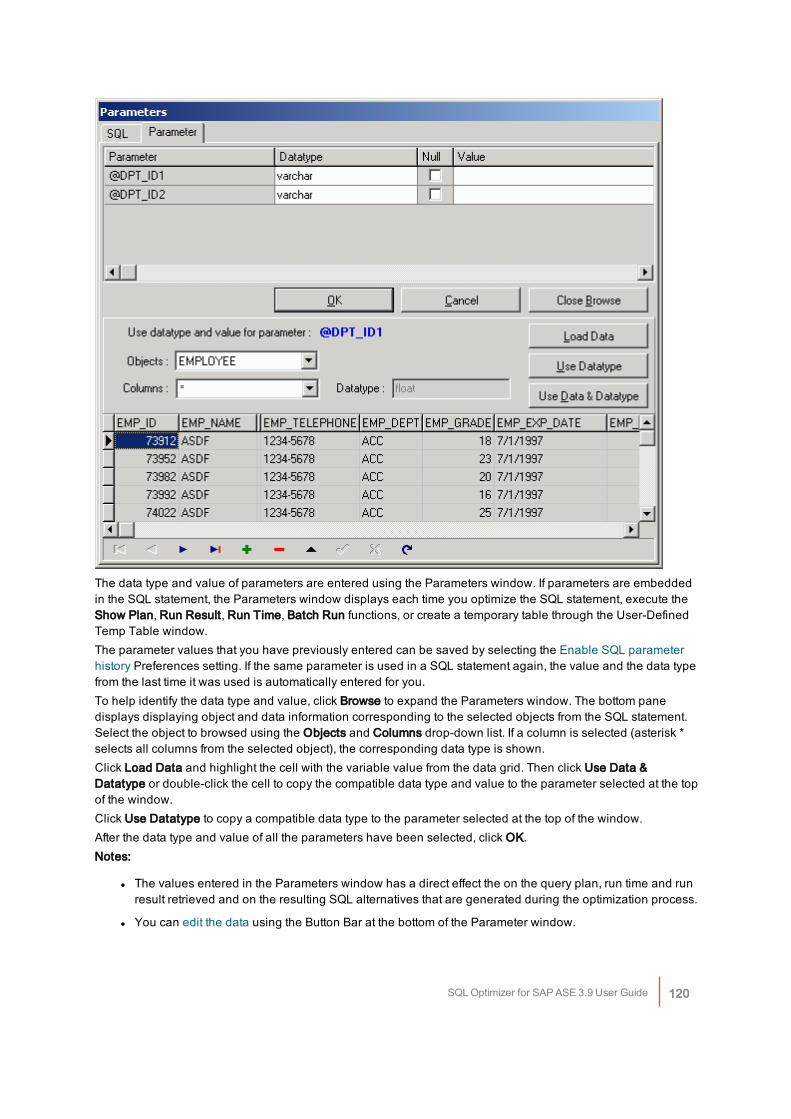
The data type and value of parameters are entered using the Parameters window. If parameters are embeddedin the SQL statement, the Parameters window displays each time you optimize the SQL statement, execute theShow Plan, Run Result, Run Time, Batch Run functions, or create a temporary table through the User-DefinedTemp Table window.The parameter values that you have previously entered can be saved by selecting the Enable SQL parameterhistory Preferences setting. If the same parameter is used in a SQL statement again, the value and the data typefrom the last time it was used is automatically entered for you.To help identify the data type and value, click Browse to expand the Parameters window. The bottom panedisplays displaying object and data information corresponding to the selected objects from the SQL statement.Select the object to browsed using the Objects and Columns drop-down list. If a column is selected (asterisk *selects all columns from the selected object), the corresponding data type is shown.Click Load Data and highlight the cell with the variable value from the data grid. Then click Use Data &Datatype or double-click the cell to copy the compatible data type and value to the parameter selected at the topof the window.Click Use Datatype to copy a compatible data type to the parameter selected at the top of the window.After the data type and value of all the parameters have been selected, click OK.Notes:
l The values entered in the Parameters window has a direct effect the on the query plan, run time and runresult retrieved and on the resulting SQL alternatives that are generated during the optimization process.
l You can edit the data using the Button Bar at the bottom of the Parameter window.
SQL Optimizer for SAP ASE 3.9 User Guide 120
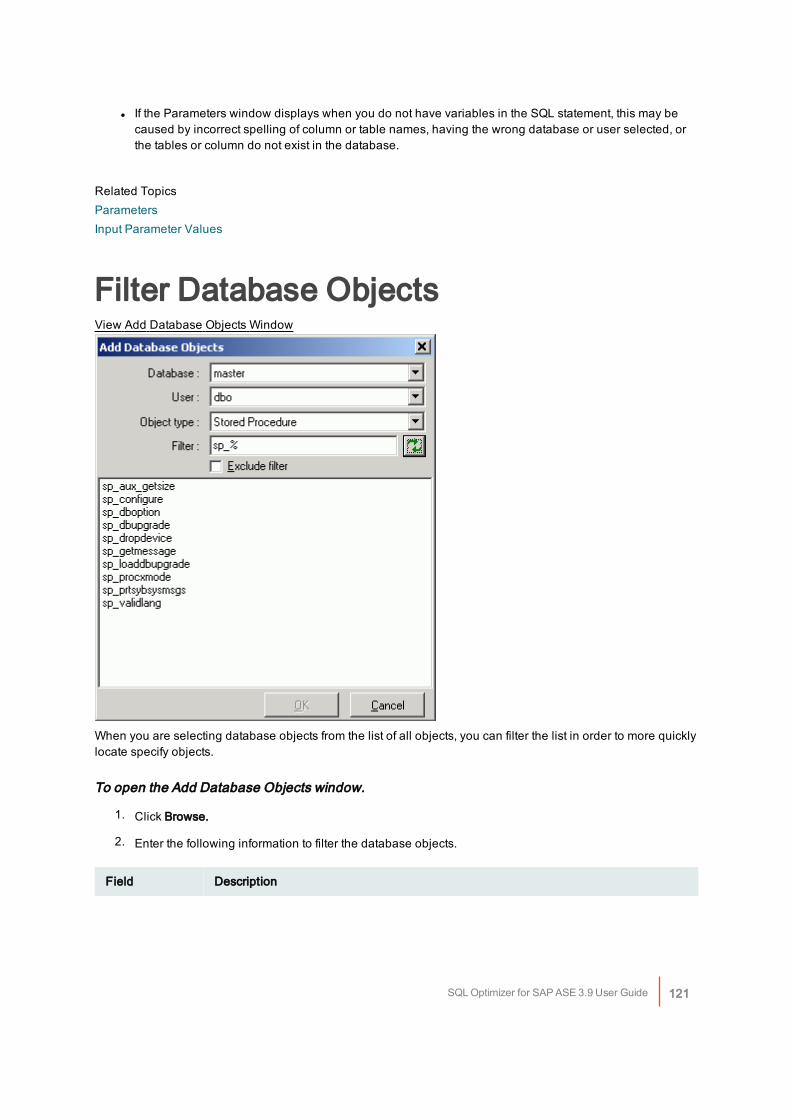
l If the Parameters window displays when you do not have variables in the SQL statement, this may becaused by incorrect spelling of column or table names, having the wrong database or user selected, orthe tables or column do not exist in the database.
Related TopicsParametersInput Parameter Values
Filter Database ObjectsView Add Database Objects Window
When you are selecting database objects from the list of all objects, you can filter the list in order to more quicklylocate specify objects.
To open the Add Database Objects window.
1. Click Browse.
2. Enter the following information to filter the database objects.
Field Description
SQL Optimizer for SAP ASE 3.9 User Guide 121
Database Specify the database name where the objects reside.
User Specify the owner of the database objects.
Object type Select the database object type from the list.
Filter Using the % wildcard that replaces multiple characters, enter the filtering criteria. Thefilter is case sensitive, so you must match the upper or lowercase characters of thedatabase object name.
Related TopicAdd Database Objects (Add Jobs Wizard)
SQL Information PaneThe SQL Information pane displays in several modules. It provides a variety of information about the SQLstatement like the query plan, abstract plan, trace on and run time information. The specific information isdependent upon the function of the module.The SQL Information pane displays SQL information according to the button you select from the button bar
at the top of this pane. The exact buttons that you find at the topof this pane varies from one module to the next. These buttons include: query plan, abstract plan, trace on, otherinformation (SQL classification, connection information, warning messages, etc), all records statistics, first recordstatistics, Scanner temp table and checked details.
Query PlanDisplays the SQL query plan. When two SQL Information panes are displayed side-by-side, as in the SQLComparer module and the Analyzer modules, the differences between the operations are highlighted in green.
Abstract PlanThe Abstract Plan button is only available for Adaptive Server 15 or later and you have selected Dump abstractplan option in the Preferences window.Displays the abstract plan which describes the query plan using a language created for that purpose. Thislanguage contains operators to specify the choices and actions that can be generated by the optimizer.
Trace OnThe Trace On button is only available if you have selected dbcc traceon (3604, 302, 310) option in thePreferences window and have sa_role privilege.Trace on shows the reason why the Adaptive Server optimizer chose a particular way of executing the originalSQL statement, displaying the reasons for index and table joins selection.
SQL Optimizer for SAP ASE 3.9 User Guide 122
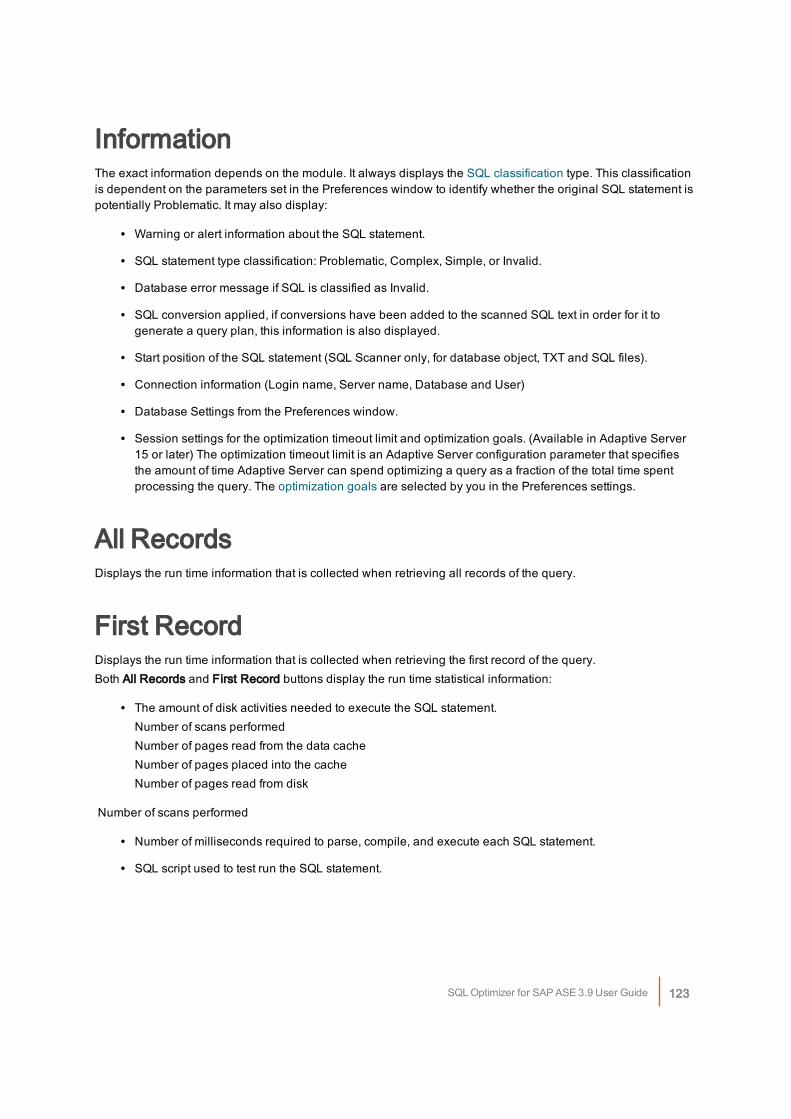
InformationThe exact information depends on the module. It always displays the SQL classification type. This classificationis dependent on the parameters set in the Preferences window to identify whether the original SQL statement ispotentially Problematic. It may also display:
l Warning or alert information about the SQL statement.
l SQL statement type classification: Problematic, Complex, Simple, or Invalid.
l Database error message if SQL is classified as Invalid.
l SQL conversion applied, if conversions have been added to the scanned SQL text in order for it togenerate a query plan, this information is also displayed.
l Start position of the SQL statement (SQL Scanner only, for database object, TXT and SQL files).
l Connection information (Login name, Server name, Database and User)
l Database Settings from the Preferences window.
l Session settings for the optimization timeout limit and optimization goals. (Available in Adaptive Server15 or later) The optimization timeout limit is an Adaptive Server configuration parameter that specifiesthe amount of time Adaptive Server can spend optimizing a query as a fraction of the total time spentprocessing the query. The optimization goals are selected by you in the Preferences settings.
All RecordsDisplays the run time information that is collected when retrieving all records of the query.
First RecordDisplays the run time information that is collected when retrieving the first record of the query.Both All Records and First Record buttons display the run time statistical information:
l The amount of disk activities needed to execute the SQL statement.Number of scans performedNumber of pages read from the data cacheNumber of pages placed into the cacheNumber of pages read from disk
Number of scans performed
l Number of milliseconds required to parse, compile, and execute each SQL statement.
l SQL script used to test run the SQL statement.
SQL Optimizer for SAP ASE 3.9 User Guide 123
Scanner Temp Table (SQL Scanner)Displays the temporary table SQL statement assumed to create or modify the temporary table used on thescanned SQL statement if the SQL Scanner finds it in the source.
Checked Details (SQL Scanner)If the selected SQL statement is checked, then this page displays the date time of when the SQL statement waschecked, the name of person who checked the SQL, the status, and the checked description.
Index Advisor Window (Index Advisor)Displays information about how the index will be created and the estimated amount of space requiredfor the index.
Query Plan OverviewView Query Plan Pane
The query plan is the steps the Adaptive Server optimizer follows as it executes a SQL statement. Each linerepresents how the Adaptive Server optimizer will physically retrieve rows of data from the database or how thedata is prepared. The Adaptive Server optimizer performs the child step before the parent step. Depending onthe SQL statement, the parent step may be executed when a single row has been returned from the child step.Some query plans may require all rows to be returned from the child step before executing the parent step.
SQL Optimizer for SAP ASE 3.9 User Guide 124
By examining the query plan, you can see exactly how the database executes your SQL statement, helping youjudge whether the SQL statement is the most efficient.You can use the Query Plan page of the SQL Information pane to view the steps Adaptive Server follows toexecute the SQL statement. You can animate the plan to show you the progression of the plan steps. You canlook up the explanation of the query plan operations.
Related TopicsReview Query PlansQuery Plan OptionsAnimate Query PlansCopy Query PlansPlan Detail
Review Query PlansThe query plan can be displayed in different ways to help you get a clear picture of or detailed information aboutthe steps that Adaptive Server is taking to execute the SQL statement.Note: These different display modes are only available when you are connected to Adaptive Server15.0 or later.
To change how the query plan displays
1. Right-click the Query Plan window and select View Plan.
2. Select one of the following display options.
l As Tree Plan
l As Plain Language Plan
l As Graphic Plan
l As MS Graphic Plan
l As Text
l As XML
When you are viewing the query plan as Tree Plan or as Plain Language Plan, the following functions areavailable from the button pane at the right edge of the query plan.
Button Action Description
Go to First Step Highlights the first execution step.
Go to Previous Step Highlights the previous execution step.
Go to Next Step Highlights the next execution step.
Show Plan Detail Displays the Plan Detail window. The informationdisplayed is dependent on the highlighted row.
SQL Optimizer for SAP ASE 3.9 User Guide 125
Related TopicsQuery Plan OverviewQuery Plan OptionsAnimate Query PlansCopy Query PlansPlan Detail
Query Plan OptionsThe display of the Query Plan page can be customized for each module in which it is included. You can selectwhich elements of the execution plan you would like displayed in the text of the query plan. You can also havethe element displayed in a separate column.
To customize the Query Plan page
1. Right-click the query plan and select Plan Options.
2. In the Visible column, select the elements you want displayed in the execution plan text.
3. In the As Column column, select the elements for which you want a column added to the display in theQuery Plan page.
4. Click OK.
Related TopicsQuery Plan OverviewReview Query PlansAnimate Query PlansCopy Query PlansPlan Detail
Animate Query PlansYou can have the steps in the execution plan highlighted one-by-one in the order they are executed.
To animate the plan or cancel the animation
1. Right-click the Query Plan window and select View Plan | As Tree Plan or As MS Graphic Plan.
2. Right-click the Query Plan window and select Animate Plan Steps.
Related TopicsQuery Plan OverviewReview Query PlansQuery Plan OptionsCopy Query Plans
SQL Optimizer for SAP ASE 3.9 User Guide 126
Plan Detail
Copy Query PlansYou can copy the query plan to the clipboard.
To copy a query planRight-click the Query Plan window and select Copy.
When the query plan displays as Tree Plan and Plan Text Language the query plan can be pasted as text or asa bitmap picture. Graphic applications, such as MS Paint, only paste the query plan as a bitmap. Textapplications, such as Notepad, only paste it in a text format. Applications that handle both text and graphics,such as Microsoft Word, allow you to choose the format if you select the Paste Special option to paste theimage. This option is usually found on the Edit menu.
Related TopicsQuery Plan OverviewReview Query PlansQuery Plan OptionsAnimate Query PlansPlan Detail
Plan DetailThe Plan Detail window provides detailed information on the selected branch of the query plan. This window isopened in two different ways depending on which display view you have selected for the query plan.
To view the Plan Detail – if you are viewing the query plan as Tree Plan, Plain Language Plan,Graphic Plan, or Microsoft Graphic Plan
1. Select the query plan step.
2. Click Plan Detail .
To view the Plan Detail – if you are viewing the query plan as TextClick the query plan step.Note: Help | Show Plan Detail must be selected. If you clear this menu option, then the Plan Detail will not bedisplayed in the Text view of the query plan.The Plan Detail provides the following information on each branch of the query plan:
Item Description
StmtText Text of the transact-SQL statement.
PhysicalOp Physical implementation algorithm for the node.
SQL Optimizer for SAP ASE 3.9 User Guide 127
LogicalOp Relational algebraic operator for the node.
Argument Supplemental information about the operation being performed, the contentdepends on the physical operator.
DefinedValues A list of values introduced by the operator.
EstimateRows Estimated number of output rows by the operator.
EstimateIO Estimated I/O cost for the operator.
EstimateCPU Estimated CPU cost for the operator.
AvgRowSize Estimated average row size (in bytes) of the row being passed through theoperator.
TotalSubtreeCost Cumulated estimated cost of the operation and all child operation.
OutputList List of columns being projected by the operation.
Warnings List of warning messages related to the operation.
Type Node type.
Parallel Indicator of whether the operator is running in parallel (0 represents theoperator is not running in parallel, while 1 represents the operator is runningin parallel).
EstimateExecutions Estimated number of times the operator will be executed while running thecurrent query.
Table/View DetailThe Plan Detail also provides detailed information about the table and views used by the SQL statement.
To see the table or view details
1. Click the table or view name in the left pane of the Plan Detail window.
2. Click one of the five tabs at the bottom of the right pane to see specific information about the definition,columns, indexes, constraints/key or data for the table or view.
Related TopicsQuery Plan OverviewReview Query PlansQuery Plan OptionsAnimate Query PlansCopy Query Plans
SQL Optimizer for SAP ASE 3.9 User Guide 128
Quick FindThe Quick Find search function searches for the text that is highlighted and moves the line containing the searchstring to the top of the text pane.
To search with Quick FindWith text highlighted in the active window, select Search | Quick Find [Ctrl + Alt + F]
Related TopicsSearch FunctionsFindFind NextReplaceGoto Line
FindThe Find search function brings up the Find Text window where you can select the search criteria.
To search with FindSelect Search | Find [Ctrl + F]The search is refined using the following settings:
Optionsl Case sensitive
l Searches for the text in exact case that you enter it.
l Whole word only
l Searches for words only, or in other words, searches for a text string that is preceded and followed by aspace or punctuation mark.
l Regular expression
l Specify whether to recognize regular expressions in the search string.
Scopel Global
l Searches the entire text pane.
l Selected text
l Searches only the highlighted text.
SQL Optimizer for SAP ASE 3.9 User Guide 129
Directionl Forward
l Searches from the cursor to the end of the text pane.
l Backward
l Searches from the cursor to the top of the text pane.
Originl From cursor
l Searches from the cursor either forward or backward depending on the Direction setting.
l Entire scope
l Searches the entire text pane. If the Direction setting is forward, it starts at the top of the pane. If theDirection setting is backward, it starts at the bottom of the pane.
Related TopicsSearch FunctionsQuick FindFind NextReplaceGoto Line
Find NextThe Quick Find search function finds the next occurrence of the text search string that was previously searchedfor. The function is not available until after you have done an initial search.
To search with Find NextSelect Search | Find Next [F3]
Related TopicsSearch FunctionsQuick FindFindReplaceGoto Line
ReplaceThe Replace search function brings up the Replace Text window where you can enter
SQL Optimizer for SAP ASE 3.9 User Guide 130
To replace textSelect Search | Replace [Ctrl + Alt + R]
Related TopicsSearch FunctionsQuick FindFindFind NextGoto Line
Goto LineThe Goto Line search function brings up the Goto Line window where you can enter the line number that youwant to move the cursor to. It is not necessary to have the line numbers displayed in the gutter to use thisfunction, but it would certainly be helpful to see the line numbers in order to select the line number to movethe cursor to.
To go to a specific lineSelect Search | Goto Line [Ctrl + Alt + G]
Related TopicsSearch FunctionsQuick FindFindFind NextReplace
Performance Monitor OverviewThe Performance Monitor is a module to facilitate monitoring the performance of Adaptive Server. ThePerformance Monitor is based on the sophisticated build-in monitoring tables in Adaptive Server (15.0 or later),which provides database statistical and diagnostic information. You can easily understand the performancebehavior of Adaptive Server by monitoring its run time statistics by means of snapshots, real time monitoring,and scheduled monitoring. The monitor result is presented graphically from the overall database performancedown to the statistics of an individual process.The Performance Monitor displays what is happening on the database. It helps to identify a CPU or I/O intensiveserver that may require some configuration tuning in the operating system or Adaptive Server. In addition, it alsohelps to illustrate that the tuning of application code and database design are where the most performanceimprovement can normally be gained. A missing index on a table or a poorly constructed SQL statement maycause poor performance on the database causing a chain reaction from high CPU, I/O, and Lock Waits to evenmore Dead Locks. The Performance Monitor can easily help to locate the symptom, but you still need the othermodules for solving the performance problems, using the Index Advisor to locate a missing index or the SQLOptimizer to rewrite a poorly performing SQL statement.
SQL Optimizer for SAP ASE 3.9 User Guide 131
The Performance Monitor monitors for the statistics that are consuming the most resources. It identifies wherethe top resource consumption occurs through various performance statistics and thereby filtering outunnecessary information so that performance problems are easier to pin point.A daily monitoring of the performance of the database can be achieved by setting up a periodic capture time forretrieving the performance statistics. For example; to review the database performance on daily basis, a 15minutes to 60 minutes refresh interval can provide a pretty clear picture of the system performance and resourceconsumption status; such as CPU, Devices IO, Network I/O, Lock/Dead Lock, etc. For troubleshooting on anextremely slow database, a frequent polling to the database may be too intrusive, so the manual refresh optionwhich takes snapshots from the database may be more appropriate.
Related TopicsPerformance Monitor WindowOpen the Performance MonitorStart and Stop the Performance MonitorPerformance Monitor FunctionsPerformance Monitor Preferences
Performance Monitor PrivilegesOnly users with the mon_role role have access to monitoring tables in Adaptive Server. You can provide extrarole-based security by modifying the CIS proxy table definitions provided with the monitoring tables. Forinformation about acquiring roles, see Chapter 11, "Managing User Permissions," in the Adaptive ServerPerformance and Tuning: Monitor and Analyzing manual. Because the Performance Monitor collects theperformance statistics from the monitoring tables in Adaptive Server, version 15.0 or later is required.
Supported Monitor TablesThe Performance Monitor supports both dynamic performance information and static information from thefollowing Adaptive Server monitoring tables:
Table Name Description
monState Provides information regarding the overall state of the Adaptive Server.
monEngine Provides statistics regarding Adaptive Server engines.
monDataCache Provides statistics relating to data cache usage.
monProcedureCache Provides server wide information related to cached procedures.
monOpenDatabases Provides state and statistical information for databases that are currently inuse (i.e. open databases).
monSysWorkerThread Provides server-wide statistics about worker threads.
monNetworkIO Provides server-wide statistics about network I/O.
SQL Optimizer for SAP ASE 3.9 User Guide 132
monErrorLog Provides the most recent error messages raised by Adaptive Server. Themaximum number of messages returned can be tuned by use of the "errorlogpipe max messages" configuration option.
monLocks Provides information for all locks that are being held, and those that havebeen requested, by any process, for every object.
monDeadLock Provides information about the most recent deadlocks that have occurred.The maximum number of messages returned can be tuned by use of the"deadlock pipe max messages" configuration option.
monWaitClassInfo Provides a textual description for all of the wait classes, e.g. "waiting for adisk read to complete". All wait events (see monWaitEventInfo table) havebeen grouped into the appropriate wait class.
monWaitEventInfo Provides a textual description for every possible situation where a process isforced to wait for an event, e.g. "wait for buffer read to complete".
monCachedObject Provides statistics for all objects and indexes that currently have pagescached within a data cache.
monCachePool Provides statistics for all pools allocated for all caches.
monOpenObjectActivity Provides statistics for all open objects.
monIOQueue Provides device IO statistics broken down into data and log IO, for normaland temporary databases on each device.
monDeviceIO Provides statistical information about devices.
monSysWaits Provides a server-wide view of events that processes are waiting for.
monProcess Provides information about processes that are currently executing or waiting.
monProcessLookup Provides information enabling processes to be tracked to an application,user, client machine, etc.
monProcessActivity Provides statistics about process activity.
monProcessWorkerThread Provides information about process use of worker threads.
monProcessNetIO Provides statistics about process network I/O activity.
monProcessObject Provides statistical information about process object access.
monProcessWaits Provides information about processes currently waiting for an event.
monProcessStatement Provides statistics for currently executing statements.
monSysStatement Provides statistics for the most recently executed statements. The maximumnumber of statement statistics returned can be tuned by use of the "statementpipe max messages" configuration option.
monProcessSQLText Provides the SQL text that is currently being executed. The maximum size of
SQL Optimizer for SAP ASE 3.9 User Guide 133
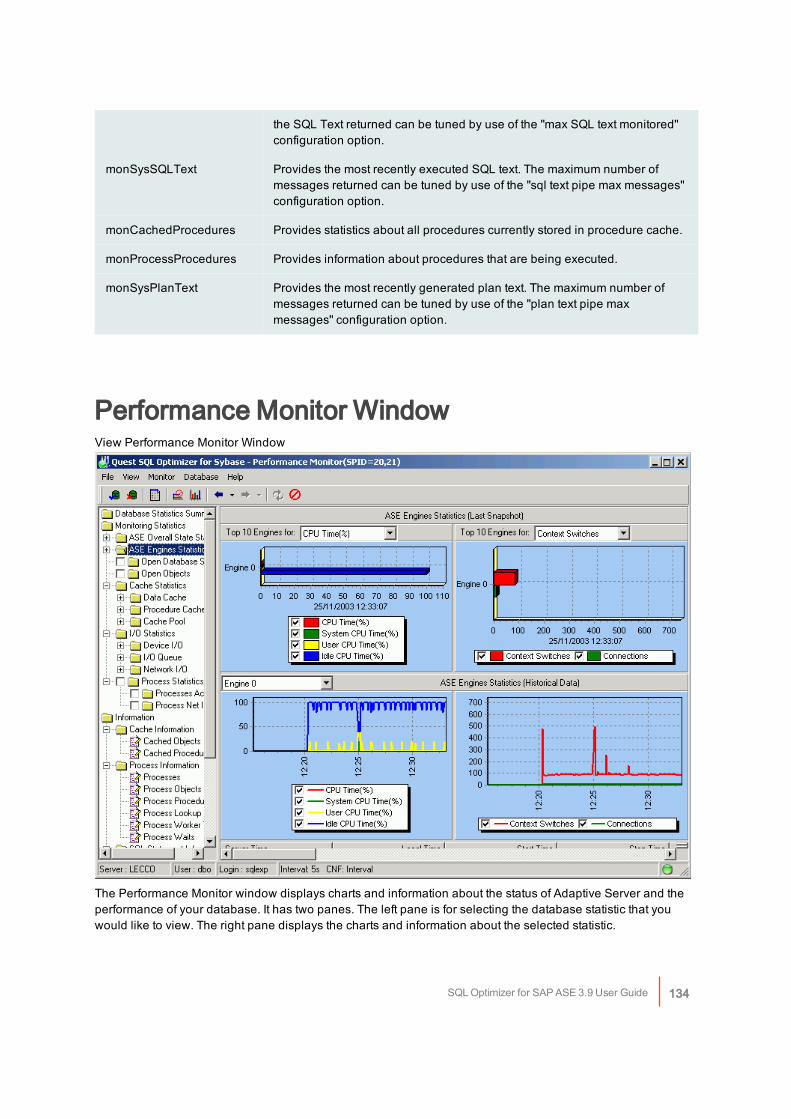
the SQL Text returned can be tuned by use of the "max SQL text monitored"configuration option.
monSysSQLText Provides the most recently executed SQL text. The maximum number ofmessages returned can be tuned by use of the "sql text pipe max messages"configuration option.
monCachedProcedures Provides statistics about all procedures currently stored in procedure cache.
monProcessProcedures Provides information about procedures that are being executed.
monSysPlanText Provides the most recently generated plan text. The maximum number ofmessages returned can be tuned by use of the "plan text pipe maxmessages" configuration option.
Performance Monitor WindowView Performance Monitor Window
The Performance Monitor window displays charts and information about the status of Adaptive Server and theperformance of your database. It has two panes. The left pane is for selecting the database statistic that youwould like to view. The right pane displays the charts and information about the selected statistic.
SQL Optimizer for SAP ASE 3.9 User Guide 134
Left paneThe top-level headings for selecting the information and statistics to review are Database Statistics Summary,Monitor Statistics, and Information.The charts and information displayed in the right pane are dependent upon what is selected in the left pane:Right pane for Database Statistics SummaryRight pane for Monitor StatisticsRight pane for InformationThe status information for the Performance Monitor is display on the status bar at the bottom of the window.
Related TopicPerformance Monitor Overview
Right Pane for Database Statistics SummaryThe Database Statistics Summary in the Performance Monitor provides an overview of database performance.Important information is displayed on this screen and provides a high level view of the overall performance onCPU utilization for Top N Engines, Device I/O, Network I/O, Data Cache status, and Lock Waits information.Bottlenecks of those statistics can be spotted and you can drill down to and individual process, device, or SQLstatement. You can drill down to specific items on the chart by double-clicking on a data point.
Related TopicPerformance Monitor Window
Right Pane for Monitor StatisticsThe Monitor Statistics in the Performance Monitor displays various charts that correspond to the statisticselected in the left pane. You can drill down and zoom in or out on these charts.
ASE Overall State StatisticsProvides information regarding the overall performance state of Adaptive Server. Information includes numberof lock waits which exceeded the lock wait threshold, number of dead locks, and number of connections.At the bottom of the right pane is the Information Box that has some static information of overall performancestate of Adaptive Server. To see this information, move the cursor right above the word "Information" until thecursor changes and you can drag and expand the Information Box.
ASE Engines StatisticsIn a system with multiple CPUs, you can enhance performance by configuring Adaptive Server to run usingmultiple Adaptive Server engines. Each engine is a single operating system process that yields highperformance when you configure one engine per CPU. In the Adaptive Server Engines Statistics, multipleengines can be monitored at the same time. Various CPU statistics are displayed on the latest snapshot and
SQL Optimizer for SAP ASE 3.9 User Guide 135
historical line chart format. A number of definitions are introduced by the Performance Monitor that are notdocumented in the Adaptive Server Performance and Tuning: Monitor and Analyzing manual.
Statistic Definition
Statistic Definition
CPU (%) (SystemCPUTime + UserCPUTime) / CPUTimeEngine * 100%
System CPU Time (%) SystemCPUTime / CPUTimeEngine * 100%
User CPU Time (%) UserCPUTime / CPUTimeEngine * 100%
Idle CPU Time (%) IdleCPUTime / CPUTimeEngine * 100%
Variables Definition
Variable Definition
SystemCPUTime Time (in seconds) the enginehas executed systemdatabase services in lastinterval.
UserCPUTime Time (in seconds) the enginehas executed usercommands in last interval.
CPUTimeEngine Total time (in seconds) theengine has run in lastinterval.
IdleCPUTime Time (in seconds) the enginewas in idle spin mode in lastinterval.
Open Database StatisticsProvides state and statistical information pertaining to databases that are currently in use. Two dynamicstatistical items are monitored for individual databases in the Open Database Statistics section: Append LogRequests and Append Log Waits. These items are displayed on a snapshot bar chart and a historical line chart.These statistics are not collected unless the checkbox in front of the option is checked. Since the enabling of thismonitor option may result in the capture of a large amount of information from the database, it is notrecommended to turn it on if you do not need to troubleshoot a current database performance problem.
Open ObjectsFor open database objects such as tables, indexes, views, and stored procedures, statistical information isconsolidated by database, statistics item, and object type.These statistics are not collected unless the checkbox in front of the option is checked. Since the enabling of thismonitor option may result in the capture of a large amount of information from the database, it is notrecommended to turn it on if you do not need to troubleshoot a current database performance problem.
SQL Optimizer for SAP ASE 3.9 User Guide 136
Cache StatisticsCache Statistics are used to monitor the Data Cache, Procedure Cache, and Cache Pool information. Most ofthe statistics displayed in this section are directly extracted from the monitoring tables, but the following itemsare calculations from these retrieved statistics:Data Cache Hit Ratio for the data cache for the life of Adaptive Server.Data Cache Hit Ratio(%) = LogicalReads * 100 / CacheSearchesData Cache Hit Ratio for the data cache in the last interval.Data Cache Delta Hit Ratio(%) = Delta_LogicalReads * 100 / Delta_CacheSearchesProcedure Cache Hit Ratio for the procedure cache for the life of Adaptive Server.Procedure Cache Hit Ratio(%) = (Requests - Loads) * 100 / RequestsProcedure Cache Hit Ratio for the procedure cache in last intervalProcedure Cache Delta Hit Ratio(%) = (Delta_Requests - Delta_Loads) * 100 / RequestsNote: The "Delta_" in the above equations denotes that the difference in the statistics values for the lastpolling interval.Normally, a Hit Ratio greater than 90% is considered healthy and indicates that no extra memory is necessary.But there are some situations that a large Hit Ratio is only contributed by a small piece of a procedure or fromData Pages resident in memory that have been executed million times during the day. So, carefully review thesefigures to understand the behavior your applications. Do not rely only on these figures to judge the healthinessof memory usage on your systems.
I/O StatisticsThe I/O Statistic provides a compressive view of the I/O activity on Adaptive Server. It is broken down into DeviceI/O, I/O Queue and Network I/O.
Device I/OThe Top-N I/O devices are displayed on this monitor section to keep track of individual device I/O trends or theI/O devices which are most active on a real time basis. An intensive I/O device may need further investigation orreallocation of hard disks. Reads for user devices and temporary database reads/writes may result from poorlyperforming SQL statements.
I/O QueueThe I/O Queue statistics are broken down into data and log I/O for normal (User) and temporary databases oneach device. I/O statistics include the information of I/O Operations and I/O Time. Too many I/O Operations andI/O Time on temporary databases means that there may be many temporary table operations in your applicationprocesses; or your SQL statements are using too many worktable operations or sorting operations. An Index orSQL syntax restructure may help to improve the problem. SQL Optimizer provides the SQL Optimizer and IndexAdvisor to help identify missing indexes and to optimize SQL.
SQL Optimizer for SAP ASE 3.9 User Guide 137
Network I/ONetwork IO statistics for both Received and Sent information are displayed in this monitor section. For a highPacket/Byte Received situation, you should consider converting your dynamic SQL or Transact-SQL into StoredProcedure calls to Adaptive Server. Thousands of dynamic SQL calls within a loop is normally the problem inmost applications, it not only increases the network traffic, but also introduces extra workloads to AdaptiveServer. If there are high values for Packet/Byte Sent, look to see if the applications are sending unnecessarydata to the Client application. For example; in some online queries, the users may need only the first fewrecords to review, a filtering criteria should be added to those applications to narrow the result set beingretrieved from the database. Furthermore, some development tools, such as PowerBuilder, provide options toretrieve necessary data only if users want to see more by pressing a next-page button. Stored Procedures canbe created in the SQL Worksheet module in SQL Optimizer.
Process StatisticsThe Process Statistics provides very comprehensive information for all executing processes.These statistics are not collected unless the checkbox in front of the option is checked. Since the enabling of thismonitor option may result in the capture of a large amount of information from the database, it is notrecommended to turn it on, if you do not need to troubleshoot a current database performance problem. Whenyou are troubleshooting use Manual Refresh Data to take a snapshot, which provides very good insight onprocesses running status, such as Top-N CPU intensive processes. Processes that are blocked by otherprocesses are marked with a special icon and the related blocking processes can also be displayed.
Related TopicPerformance Monitor Window
Right Pane for InformationThe Information section in the Performance Monitor provides information about Cache, Processes, SQLStatements, Locks, Sys Worker Threads, Sys Waits and the Error Log.
Cache InformationThe Cache Information section has the following information:
Statistic Description
Cached Objects Provides statistics for all objects and indexes with pages currently in a datacache.
Cached Procedures Provides statistics for all procedures currently stored in the procedure cache.
Process InformationThe Process Information section has the following information:
SQL Optimizer for SAP ASE 3.9 User Guide 138
Statistic Description
Processes Provides detailed statistics about processes that are currently executing orwaiting.
Process Objects Provides statistical information regarding database objects that have beenaccessed by processes.
Process Procedures Provides a list of all procedures that are being executed by processes.
Process Lookup Provides information enabling processes to be tracked to an application, user,client machine, and so on.
Process WorkerThread
Provides information about process use of worker threads.
Process Waits Provides a server-wide view of where processes are waiting for an event.
SQL Statement InformationThis SQL Statement Information section provides information about currently executing SQL statements andrecently executed SQL statement.
Statistic Description
Executing SQL Provides information for currently executing statements.
Executed SQL Provides statistics pertaining to the most recently executed statements. Themaximum number of statement statistics returned can be set with statementpipe max messages Adaptive Server configuration parameter.
Locks InformationReturns a list of all locks that are being held, and those that have been requested, by any process, forevery object.
Sys Worker ThreadsProvides server-wide statistics related to worker threads.
Sys WaitsProvides a server-wide view of where processes are waiting for an event.
Error LogReturns the most recent error messages from the Adaptive Server error log. The maximum number of messagesreturned can be set with the errorlog pipe max messages Adaptive Server configuration parameter.
SQL Optimizer for SAP ASE 3.9 User Guide 139
Related TopicPerformance Monitor Window
Status BarThe status bar at the bottom of the Performance Monitor window has the following information.
Item Description
Server Adaptive Server name
User Default user for the login account
Login Login account name
Interval Interval setting for retrieving the statistics from the monitoring tables from thePreferences settings.
CNF The Chart Data Normalization Factor from the Preferences settings.
Monitor Status Icon When the Monitor Status icon at the far right of the status bar is green , thePerformance Monitor is idle. When the Status icon at the far right of the status baris red , it is retrieving the statistics from the monitoring tables.
Related TopicPerformance Monitor Window
Open the Performance MonitorTo open the Performance Monitor window
Click .
Related TopicPerformance Monitor Window
Connect and Disconnect from DatabaseWhen the Performance Monitor window is opened from within SQL Optimizer, the current SQL Optimizerlogon is used.If you open Performance Monitor window outside of SQL Optimizer, you are prompted to logon to a server. Youcan disconnect from or reconnect to a server without closing the Performance Monitor window.
SQL Optimizer for SAP ASE 3.9 User Guide 140
To connect to a different server
Click .
To disconnect from a server
Click .
View connection informationTo find out if the server has the necessary parameter settings and your current logon has the necessaryprivileges needed to run the Performance Monitor, select Database | View Connection Information.The Connection Information window confirms that your logon has the necessary the privileges to run thePerformance Monitor or tells which privileges your logon is lacking under the Privilege Information tab.Certain Adaptive Server configuration parameters are needed to run the Performance Monitor. TheConfiguration Information tab in the Connection Information window shows the current settings for theseparameters and the parameter values that are necessary. If the current parameter value does not meet therequired value, the line for configuration parameter is highlighted in red.
Related TopicPerformance Monitor Overview
Start and Stop the Performance MonitorThe Performance Monitor provides three ways to monitor the database performance: immediate monitoring,scheduled monitoring, and manual refresh.The settings on the General tab in Preferences window determine whether the monitoring process beginsimmediately or at a scheduled time. The monitoring continues to collect the statistics at the refresh interval untilyou stop the monitoring or until the scheduled end time.
To start the monitoring processing for collecting the database performance statistics
Click .
To stop the monitoring process
Click .The manual refresh of the statistics collects the statistics immediately and only collects them once.
Related TopicPerformance Monitor Overview
SQL Optimizer for SAP ASE 3.9 User Guide 141
Manual Refresh DataThe Manual Refresh Data option is used to check the database performance on ad-hoc basis. The performancesnapshot is taken once. This function provides a more flexible statistics retrieval method for troubleshooting aperformance problem that is currently happening on the database. It only retrieves the statistics from themonitoring tables when you specifically do the refresh. It retrieves the statistics once and then waits until youmanual refresh the data again.
To manually refresh data
Click .You can set up the monitoring to automatically poll the monitoring tables at regular intervals.The collection of the Open Database, Open Objects, and the Process statistics are not collected unless thecheckbox in front of the statistic is checked in the left pane. The enabling of the retrieval of the statistics for thesemonitoring options may result in the capture of a large amount of information from the database. Therefore it isnot recommended to turn it on when you are using Auto Refresh to continuously monitor the activity of AdaptiveServer. But when you need to troubleshoot a current database performance problem, enabling the retrieval ofthese statistics can help you to quickly identify the problem. Using Manual Refresh Data to take a snapshot canprovide good insight on processes running, such as Top N CPU intensive processes information. Processesthat are blocked by other processes are marked with a special icon and the related blocking processes can alsobe displayed.
Related TopicPerformance Monitor Overview
Hide and Show Console TreeThe display of the Console Tree [left pane] in the Performance Monitor window can be toggled betweenshow and hide.
To hide/show the Console Tree
Click .
Display View for Performance Monitor ChartsYou can switch the x and y axis for the charts for the Monitor Statistics in the Performance Monitor.
To display horizontal bar charts
Click .
SQL Optimizer for SAP ASE 3.9 User Guide 142
To display vertical bar charts
Click .
Chart Drill DownIn the Performance Monitor. you can click a data point in a higher-level chart to drill down to a chart for thatspecific statistic.
Lock and Unlock ChartWhen the Performance Monitor is capturing statistics, the display is updated every time the statistics aregathered. This means that you could be reviewing some statistics and they would change while you are viewingthem. The Lock Chart function freezes the display with the current time slice but the Performance Monitor stillcaptures the new information from the database.
To lock the current display
Click .
To unlock the display
Click .
Chart ZoomYou can zoom in on a selected range of data on a chart in the Performance Monitor.
To zoom-in on a specific portion of the chartClick and hold down the left-hand mouse button to draw a rectangular field from top left to bottom right of theselected area of the chart. You can see a rectangle around the selected area. Release the left-hand mousebutton. You can zoom-in more than once.
To zoom-outHold down the left-hand mouse button to draw a reverse rectangular field from bottom right to top left. Click holddown the left-hand mouse button anywhere in the chart and drag to the left. Release the left-hand mouse buttonto restore the chart to the last zoom-in scale.
SQL Optimizer for SAP ASE 3.9 User Guide 143
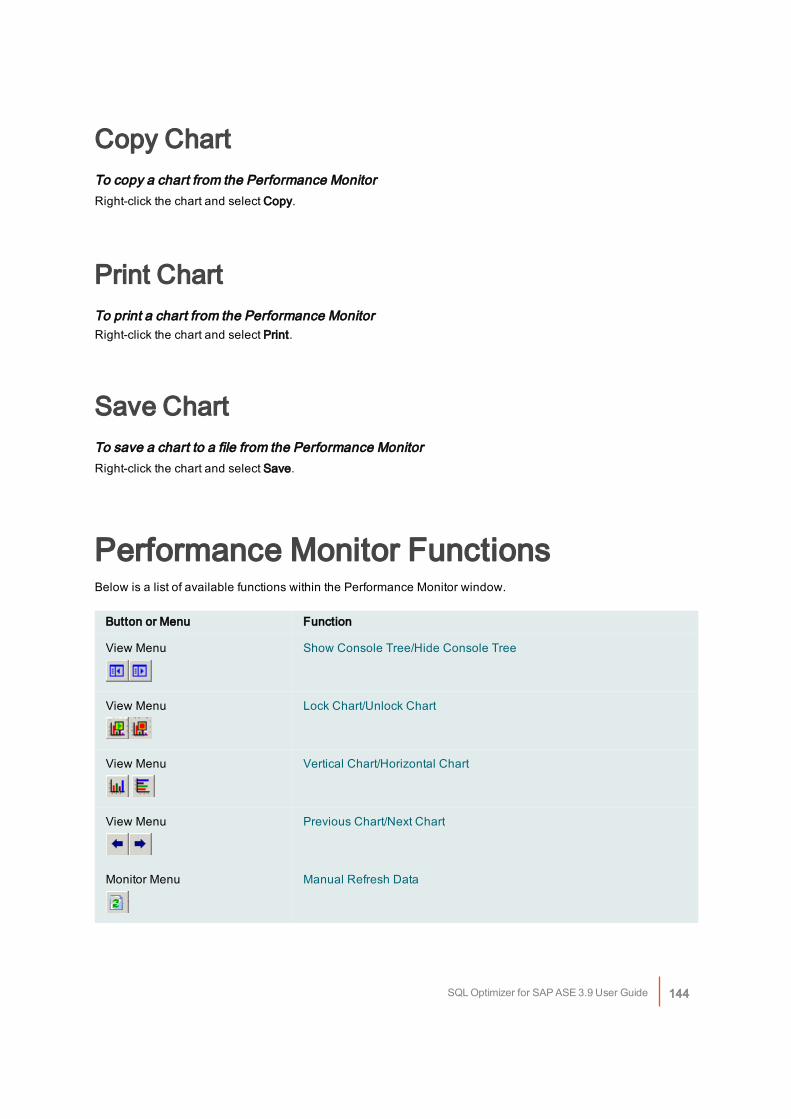
Copy ChartTo copy a chart from the Performance MonitorRight-click the chart and select Copy.
Print ChartTo print a chart from the Performance MonitorRight-click the chart and select Print.
Save ChartTo save a chart to a file from the Performance MonitorRight-click the chart and select Save.
Performance Monitor FunctionsBelow is a list of available functions within the Performance Monitor window.
Button or Menu Function
View Menu Show Console Tree/Hide Console Tree
View Menu Lock Chart/Unlock Chart
View Menu Vertical Chart/Horizontal Chart
View Menu Previous Chart/Next Chart
Monitor Menu Manual Refresh Data
SQL Optimizer for SAP ASE 3.9 User Guide 144
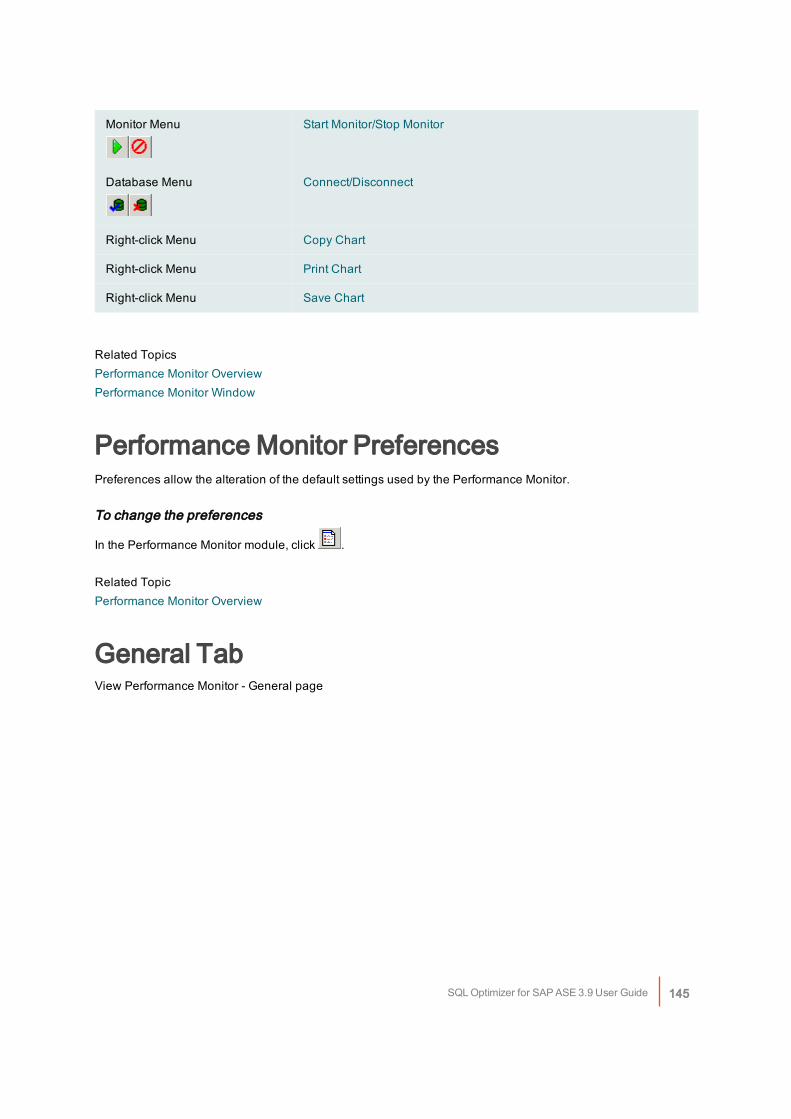
Monitor Menu Start Monitor/Stop Monitor
Database Menu Connect/Disconnect
Right-click Menu Copy Chart
Right-click Menu Print Chart
Right-click Menu Save Chart
Related TopicsPerformance Monitor OverviewPerformance Monitor Window
Performance Monitor PreferencesPreferences allow the alteration of the default settings used by the Performance Monitor.
To change the preferences
In the Performance Monitor module, click .
Related TopicPerformance Monitor Overview
General TabView Performance Monitor - General page
SQL Optimizer for SAP ASE 3.9 User Guide 145
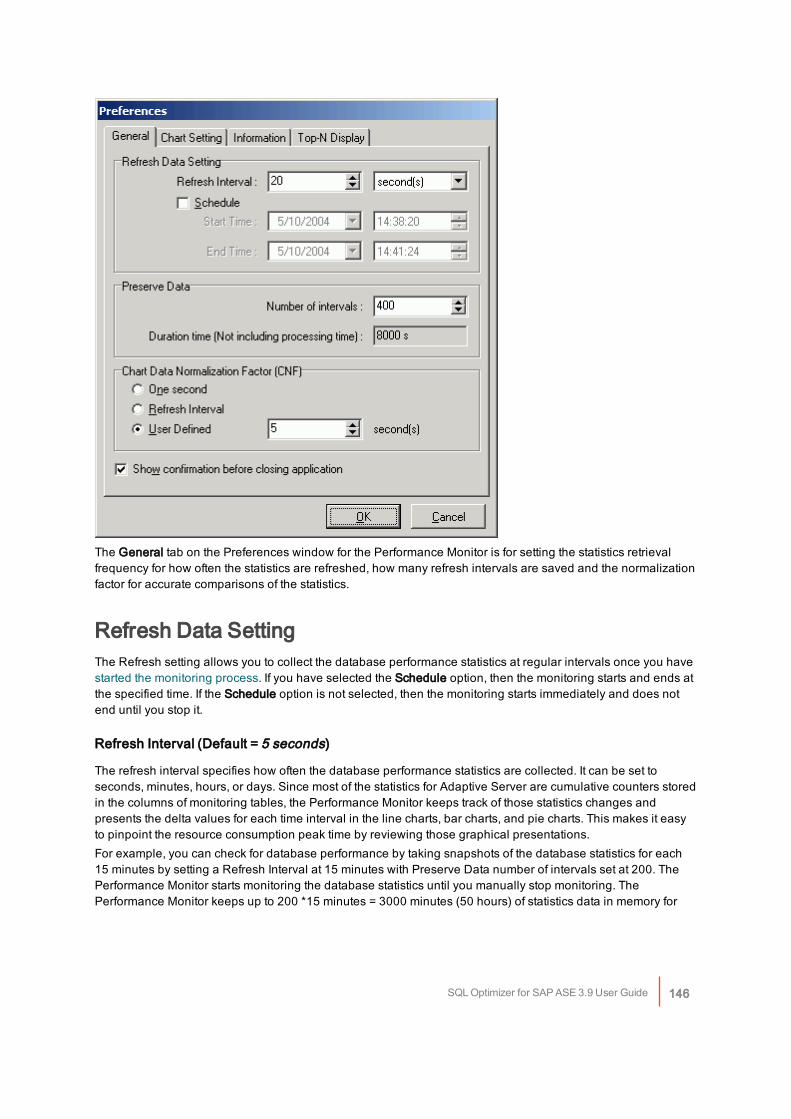
The General tab on the Preferences window for the Performance Monitor is for setting the statistics retrievalfrequency for how often the statistics are refreshed, how many refresh intervals are saved and the normalizationfactor for accurate comparisons of the statistics.
Refresh Data SettingThe Refresh setting allows you to collect the database performance statistics at regular intervals once you havestarted the monitoring process. If you have selected the Schedule option, then the monitoring starts and ends atthe specified time. If the Schedule option is not selected, then the monitoring starts immediately and does notend until you stop it.
Refresh Interval (Default = 5 seconds)
The refresh interval specifies how often the database performance statistics are collected. It can be set toseconds, minutes, hours, or days. Since most of the statistics for Adaptive Server are cumulative counters storedin the columns of monitoring tables, the Performance Monitor keeps track of those statistics changes andpresents the delta values for each time interval in the line charts, bar charts, and pie charts. This makes it easyto pinpoint the resource consumption peak time by reviewing those graphical presentations.For example, you can check for database performance by taking snapshots of the database statistics for each15 minutes by setting a Refresh Interval at 15 minutes with Preserve Data number of intervals set at 200. ThePerformance Monitor starts monitoring the database statistics until you manually stop monitoring. ThePerformance Monitor keeps up to 200 *15 minutes = 3000 minutes (50 hours) of statistics data in memory for
SQL Optimizer for SAP ASE 3.9 User Guide 146

review. If the monitoring time is longer than the reserve interval data time, the most current 50 hours of data isretained.
Schedule (Default = cleared)
The Schedule monitor function starts the monitor at a specified Start Time enabling the tracking of theperformance of the database at a specific time. The scheduled monitoring uses the Refresh Interval setting tocollect the statistics at regular intervals. The monitoring stops once the End Time is reached.
Preserve DataWhen monitoring, the statistics are stored in memory for each Refresh Interval. All the statistics for each intervalare kept in memory to facilitate the graphical plotting and data retrieval.
Number of intervals (Default = 200)
Specify the number of Refresh Intervals that are stored by the monitoring process for your review.
Duration time (Not including processing time) (Default = 1000 s)
This is a calculation presented in seconds using this formula: Number of intervals * Refresh Interval
Chart Data Normalization Factor (CNF)Since the Refresh Interval time is adjustable by users for each monitor task, the statistical data is proportional tothe selected Refresh Interval time. For example; a 10 minutes Refresh Interval may collect 100 writes on Masterdevice, but 30 minutes refresh interval may have 300 writes on Master device. It would be easy to be misled byjust looking at the result of 300 writes to judge them in comparison to the 100 writes. The Performance Monitorprovides a normalization factor to help standardize the result statistics scale. The following is an example ofusing 5 minutes as a normalization factor to calculate the results for different Refresh Interval settings:
Monitor Time Refresh Interval(RI)
Master DeviceWrites (MDW)
CNF CNF Result = RI /MDW * CNF
09:00AM-11:00AM 10 minutes 100 writes 5 minutes 50 writes
01:00PM-03:00PM 30 minutes 360 writes 5 minutes 60 writes
04:00PM-06:00PM 60 minutes 540 writes 5 minutes 45 writes
With the Chart Data Normalization Factor, the result is standardized to 5 minutes and the comparison is moreaccurate. This example shows that the Monitor Time from 1:00PM to 3:00PM was more Write intensive on theMaster device with 60 writes for every 5 minutes than the other time slices.
One second
Specify to use 1 second as the Chart Data Normalization Factor. This means that the statistics are shown as anaverage per second calculation. For example, using an Refresh Interval of 1 minute with 240 reads, the CNF forReads is 240/60seconds = 4 Reads/per second.
SQL Optimizer for SAP ASE 3.9 User Guide 147
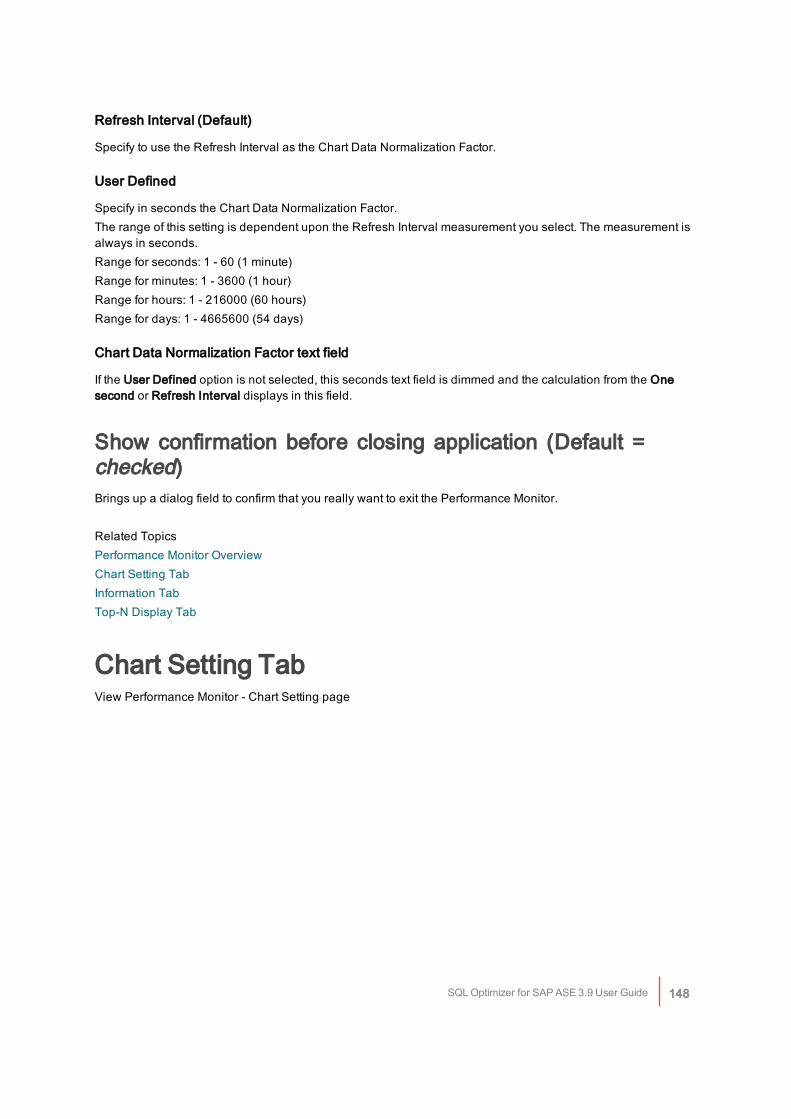
Refresh Interval (Default)
Specify to use the Refresh Interval as the Chart Data Normalization Factor.
User Defined
Specify in seconds the Chart Data Normalization Factor.The range of this setting is dependent upon the Refresh Interval measurement you select. The measurement isalways in seconds.Range for seconds: 1 - 60 (1 minute)Range for minutes: 1 - 3600 (1 hour)Range for hours: 1 - 216000 (60 hours)Range for days: 1 - 4665600 (54 days)
Chart Data Normalization Factor text field
If the User Defined option is not selected, this seconds text field is dimmed and the calculation from the Onesecond or Refresh Interval displays in this field.
Show confirmation before closing application (Default =checked)Brings up a dialog field to confirm that you really want to exit the Performance Monitor.
Related TopicsPerformance Monitor OverviewChart Setting TabInformation TabTop-N Display Tab
Chart Setting TabView Performance Monitor - Chart Setting page
SQL Optimizer for SAP ASE 3.9 User Guide 148
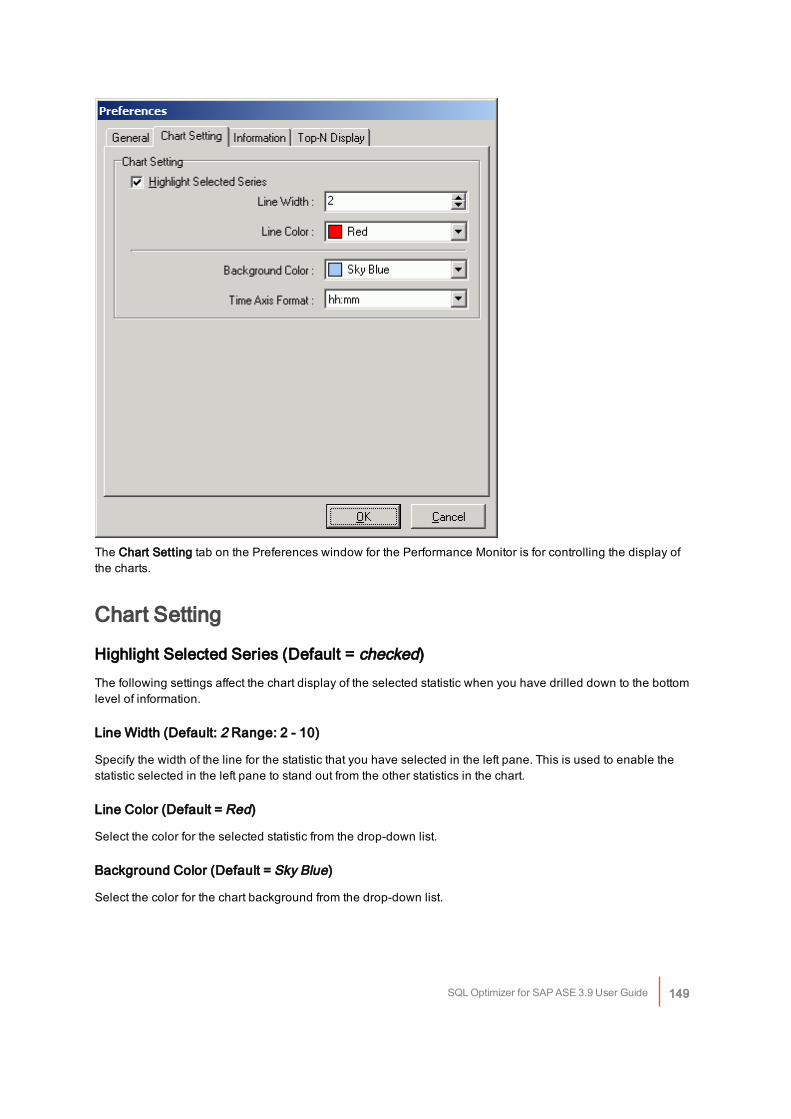
The Chart Setting tab on the Preferences window for the Performance Monitor is for controlling the display ofthe charts.
Chart Setting
Highlight Selected Series (Default = checked)The following settings affect the chart display of the selected statistic when you have drilled down to the bottomlevel of information.
Line Width (Default: 2 Range: 2 - 10)
Specify the width of the line for the statistic that you have selected in the left pane. This is used to enable thestatistic selected in the left pane to stand out from the other statistics in the chart.
Line Color (Default = Red)
Select the color for the selected statistic from the drop-down list.
Background Color (Default = Sky Blue)
Select the color for the chart background from the drop-down list.
SQL Optimizer for SAP ASE 3.9 User Guide 149
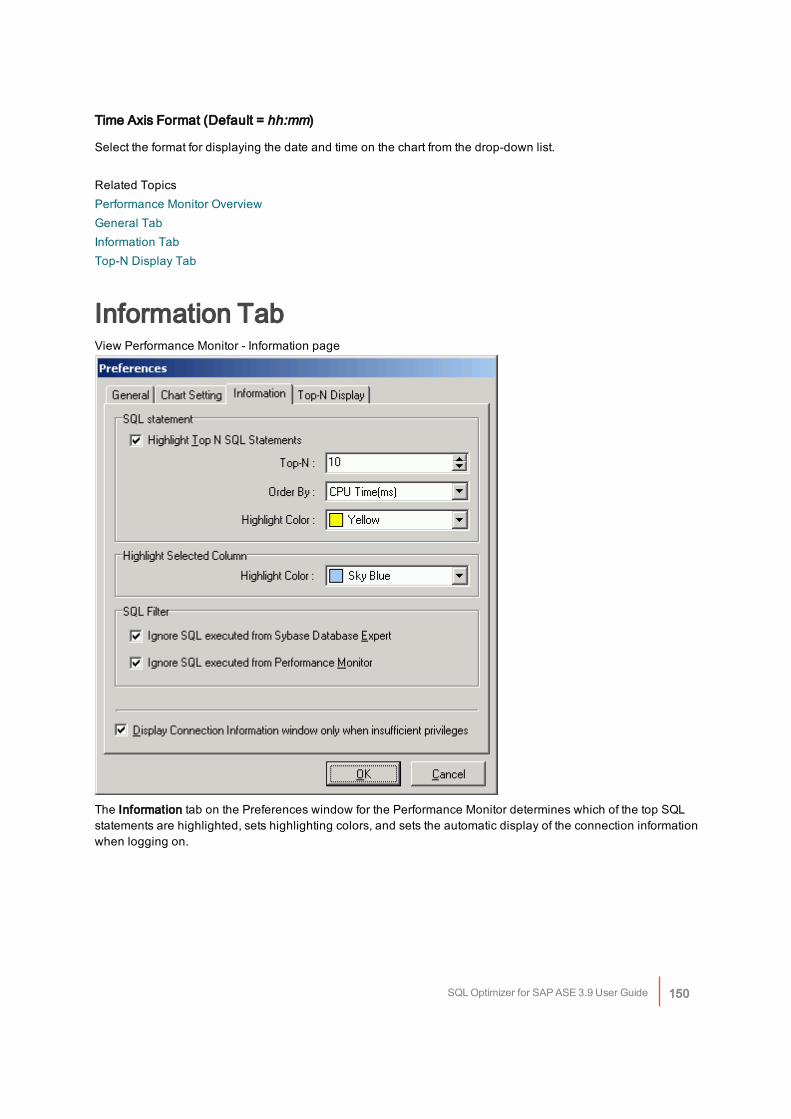
Time Axis Format (Default = hh:mm)
Select the format for displaying the date and time on the chart from the drop-down list.
Related TopicsPerformance Monitor OverviewGeneral TabInformation TabTop-N Display Tab
Information TabView Performance Monitor - Information page
The Information tab on the Preferences window for the Performance Monitor determines which of the top SQLstatements are highlighted, sets highlighting colors, and sets the automatic display of the connection informationwhen logging on.
SQL Optimizer for SAP ASE 3.9 User Guide 150
SQL statementIn the left pane of the Performance Monitor window, individual SQL statements are displayed when you drilldown from Information to Process Information to the Executing SQL Statements. The following settingsdetermine how many SQL statements are highlighted, by what criteria they are sorted, and the color that is usedfor highlighting.
Highlight Top N SQL Statements (Default = checked)
The top SQL statements are highlighted for you to quickly identify which SQL statements are consuming themost resources.
Top-N (Default = 10)Specify the number of SQL statements to be highlighted.Order By (Default = CPU Time(ms))Select the statistic to sort the SQL statements from the drop-down field.Highlight Color (Default = Yellow)Select the color from the drop-down field.
Highlight selected columnWhen you drill down to the lowest level of the charts, the data from the table displays in a grid underneath thechart. The column for the statistic that is selected in the left pane is highlighted.
Highlight Color (Default = Sky Blue)
Select the color from the drop-down field.
SQL Filter (executing SQL only)Ignore SQL executed from SQL Optimizer Default = checked)
Specify to exclude the SQL statements that are generated by any of the modules in SQL Optimizer but thePerformance Monitor.
Ignore SQL executed from Performance Monitor (Default = checked)
Specify to exclude the SQL statements that are generated by the Performance Monitor.
Display Connection Information window only when insufficientprivileges (Default = checked)Specify to display the Connection Information window each time you logon if the user logon does not have thedatabase privileges needed for the modules.
Related TopicsPerformance Monitor Overview
SQL Optimizer for SAP ASE 3.9 User Guide 151

General TabChart Setting TabTop-N Display Tab
Top-N Display TabView Performance Monitor - Top-N-Display page
The Top-N Display tab on the Preferences window for the Performance Monitor is for determining the percent ofeach statistics that is retrieved from the monitoring tables.
To select only the top statisticsSelect the button on the left for the statistics information and fill in the values on the right for eachindividual statistic.Please reference the Adaptive Server Performance and Tuning: Monitor and Analyzing manual for the meaningof each statistic.
Related TopicsPerformance Monitor OverviewGeneral TabChart Setting TabInformation Tab
SQL Optimizer for SAP ASE 3.9 User Guide 152
SQL Inspector OverviewThe SQL Inspector identifies SQL statements with performance problems by extracting SQL statements and SQLperformance statistics from the QP Metrics (Adaptive Server 15 or later). The SQL Inspector graphically displaysand compares SQL activity statistics to diagnose performance bottlenecks. With the SQL Inspector you canidentify the top N most resource intensive SQL statements.With the SQL Inspector, you can schedule the date and time and the frequency that the SQL statistics arecollected in order to identify the impact of SQL activities on database performance. By displaying the statisticson a graph you can see which SQL statements are consuming the most database resources, hence identifyingproblematic SQL statements quickly and efficiently.The SQL Inspector window provides a work area for you to add and delete Inspectors, storing information on theInspector name and description, number of SQL captured, start time, end time, and duration. It offers a way toview the statistics from the SQL statements captured in charts and a grid format. It provides a view of the top Nworst performing SQL statements. SQL statements can be sorted by different AND/OR conditions of SQLperformance statistics such as number of executions, CPU time, logical reads, physical reads, and others.SQL statements collected in Inspector files can be also be analyzed with the SQL Scanner module. Once youhave identified potentially problematic SQL statements you can send the SQL from the SQL Inspector to the SQLOptimizer, Index Advisor, the SQL Worksheet, or save them to the SQL Repository.Note: This module is available for Adaptive Server 15 and later and requires that the Adaptive Servermonitoring tables are installed.Or, if you have Adaptive Server 15.0 or later, you can retrieve the SQL statements and performance statisticsusing QP Metrics if you have access to the sysquerymetrics view.
Related TopicsSQL Inspector PrivilegesAdd/Modify InspectorPerformance Statistics - Monitoring TablesPerformance Statistics - QP MetricsInspectView and Add ChartsSQL Inspector Functions
SQL Inspector PrivilegesTo use the SQL Inspector module you must have access to the sysquerymetrics view in Adaptive Server15.0 or later.You must also set up specific configuration parameters in Adaptive Server.
Related TopicSQL Inspector Overview
SQL Optimizer for SAP ASE 3.9 User Guide 153
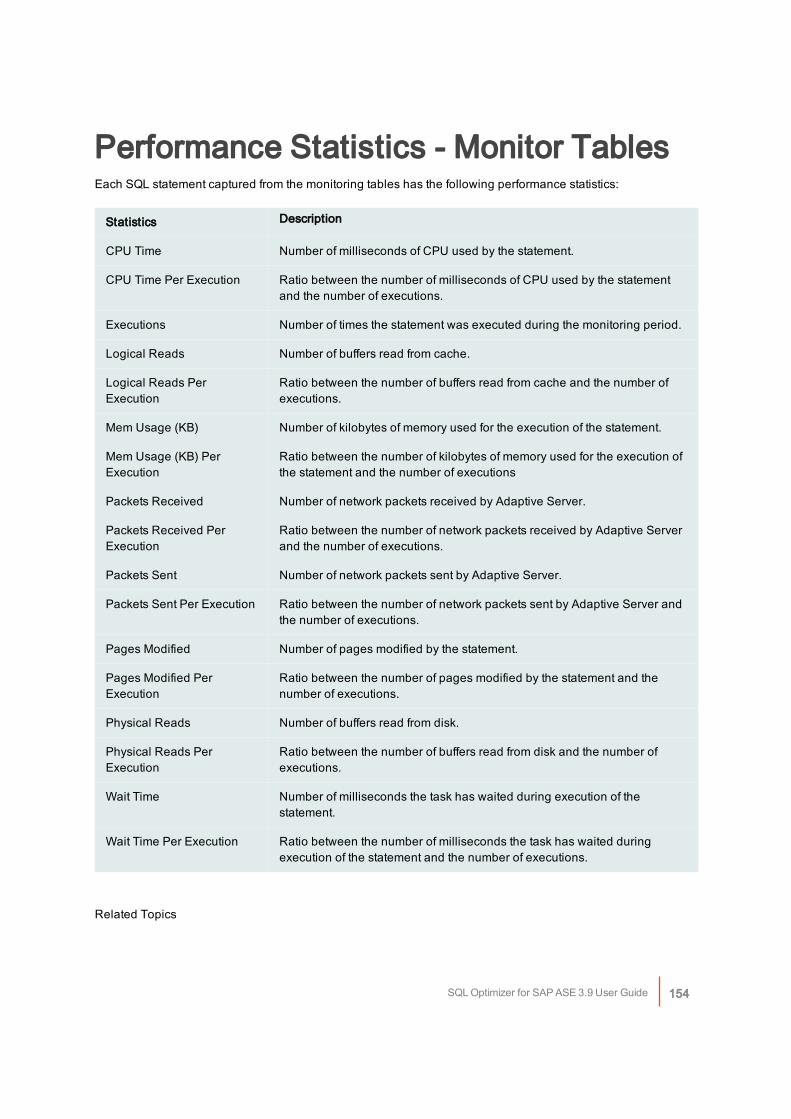
Performance Statistics - Monitor TablesEach SQL statement captured from the monitoring tables has the following performance statistics:
Statistics Description
CPU Time Number of milliseconds of CPU used by the statement.
CPU Time Per Execution Ratio between the number of milliseconds of CPU used by the statementand the number of executions.
Executions Number of times the statement was executed during the monitoring period.
Logical Reads Number of buffers read from cache.
Logical Reads PerExecution
Ratio between the number of buffers read from cache and the number ofexecutions.
Mem Usage (KB) Number of kilobytes of memory used for the execution of the statement.
Mem Usage (KB) PerExecution
Ratio between the number of kilobytes of memory used for the execution ofthe statement and the number of executions
Packets Received Number of network packets received by Adaptive Server.
Packets Received PerExecution
Ratio between the number of network packets received by Adaptive Serverand the number of executions.
Packets Sent Number of network packets sent by Adaptive Server.
Packets Sent Per Execution Ratio between the number of network packets sent by Adaptive Server andthe number of executions.
Pages Modified Number of pages modified by the statement.
Pages Modified PerExecution
Ratio between the number of pages modified by the statement and thenumber of executions.
Physical Reads Number of buffers read from disk.
Physical Reads PerExecution
Ratio between the number of buffers read from disk and the number ofexecutions.
Wait Time Number of milliseconds the task has waited during execution of thestatement.
Wait Time Per Execution Ratio between the number of milliseconds the task has waited duringexecution of the statement and the number of executions.
Related Topics
SQL Optimizer for SAP ASE 3.9 User Guide 154
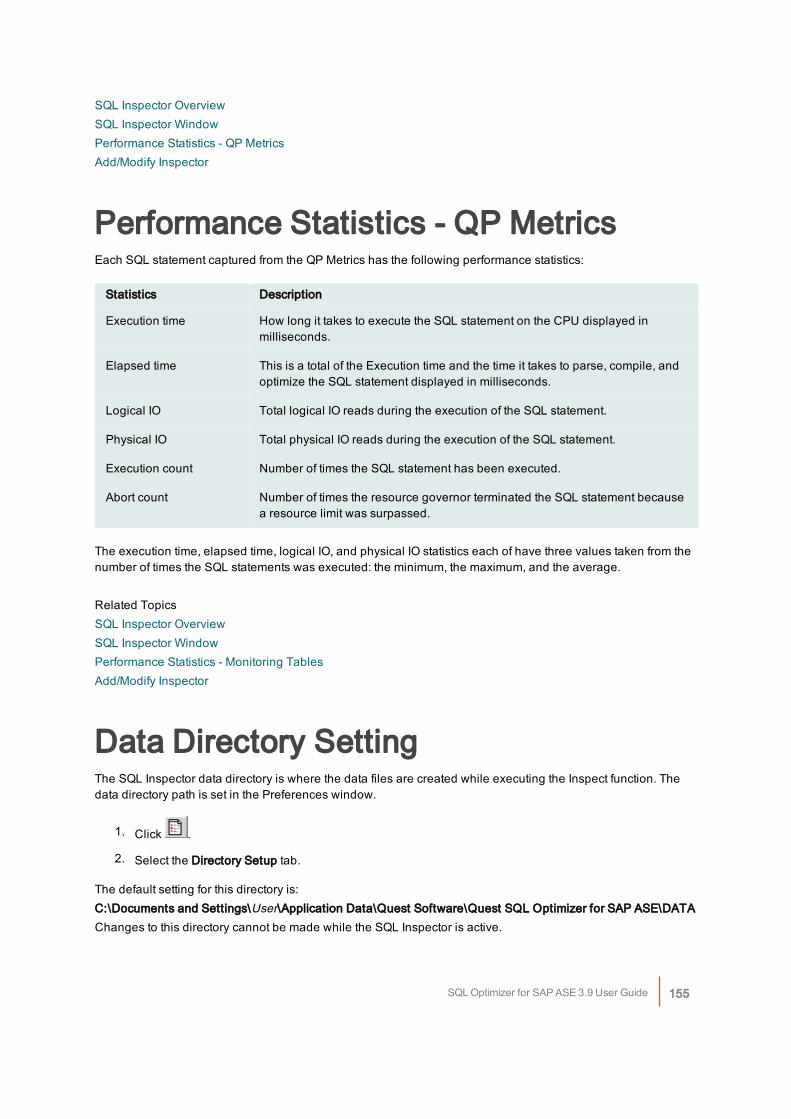
SQL Inspector OverviewSQL Inspector WindowPerformance Statistics - QP MetricsAdd/Modify Inspector
Performance Statistics - QP MetricsEach SQL statement captured from the QP Metrics has the following performance statistics:
Statistics Description
Execution time How long it takes to execute the SQL statement on the CPU displayed inmilliseconds.
Elapsed time This is a total of the Execution time and the time it takes to parse, compile, andoptimize the SQL statement displayed in milliseconds.
Logical IO Total logical IO reads during the execution of the SQL statement.
Physical IO Total physical IO reads during the execution of the SQL statement.
Execution count Number of times the SQL statement has been executed.
Abort count Number of times the resource governor terminated the SQL statement becausea resource limit was surpassed.
The execution time, elapsed time, logical IO, and physical IO statistics each of have three values taken from thenumber of times the SQL statements was executed: the minimum, the maximum, and the average.
Related TopicsSQL Inspector OverviewSQL Inspector WindowPerformance Statistics - Monitoring TablesAdd/Modify Inspector
Data Directory SettingThe SQL Inspector data directory is where the data files are created while executing the Inspect function. Thedata directory path is set in the Preferences window.
1. Click .
2. Select the Directory Setup tab.
The default setting for this directory is:C:\Documents and Settings\User\Application Data\Quest Software\Quest SQL Optimizer for SAP ASE\DATAChanges to this directory cannot be made while the SQL Inspector is active.
SQL Optimizer for SAP ASE 3.9 User Guide 155
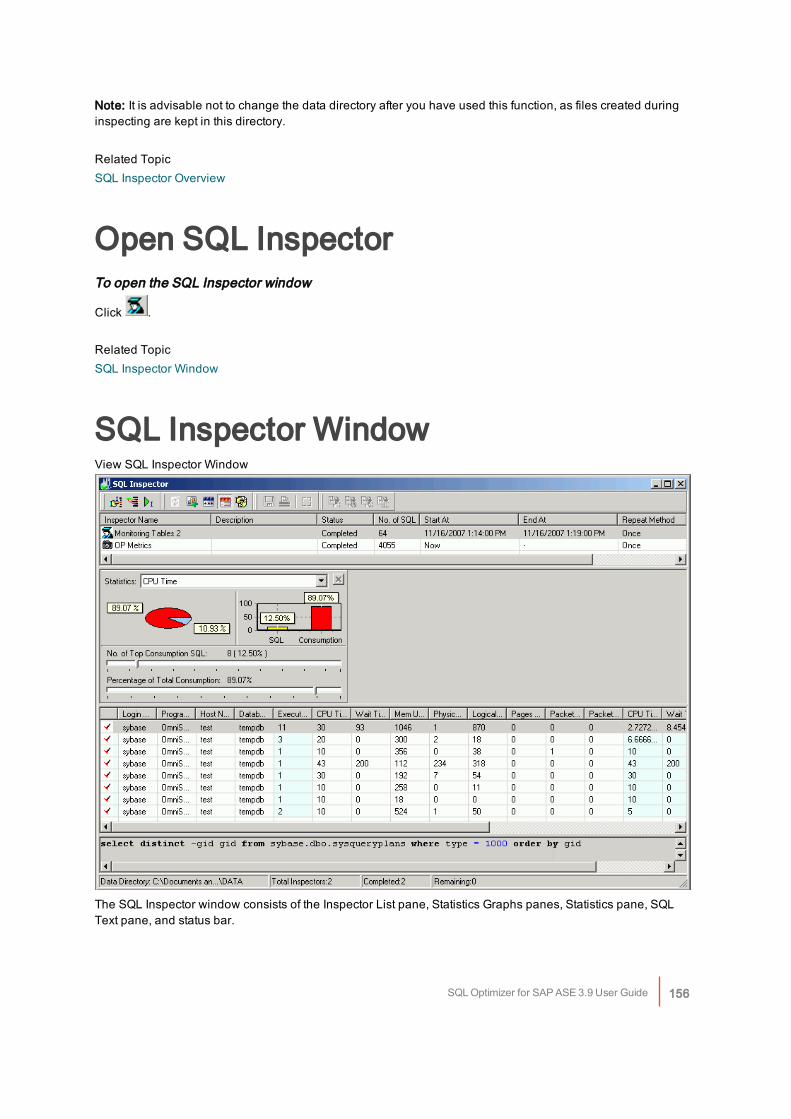
Note: It is advisable not to change the data directory after you have used this function, as files created duringinspecting are kept in this directory.
Related TopicSQL Inspector Overview
Open SQL InspectorTo open the SQL Inspector window
Click .
Related TopicSQL Inspector Window
SQL Inspector WindowView SQL Inspector Window
The SQL Inspector window consists of the Inspector List pane, Statistics Graphs panes, Statistics pane, SQLText pane, and status bar.
SQL Optimizer for SAP ASE 3.9 User Guide 156
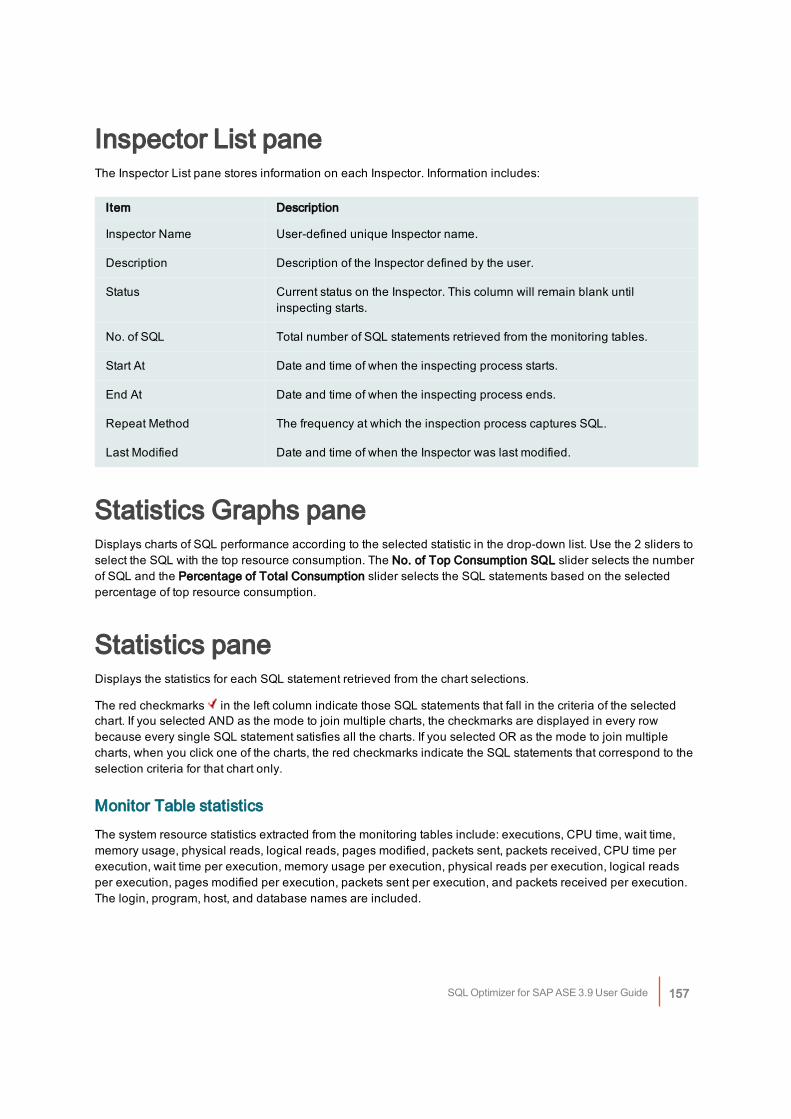
Inspector List paneThe Inspector List pane stores information on each Inspector. Information includes:
Item Description
Inspector Name User-defined unique Inspector name.
Description Description of the Inspector defined by the user.
Status Current status on the Inspector. This column will remain blank untilinspecting starts.
No. of SQL Total number of SQL statements retrieved from the monitoring tables.
Start At Date and time of when the inspecting process starts.
End At Date and time of when the inspecting process ends.
Repeat Method The frequency at which the inspection process captures SQL.
Last Modified Date and time of when the Inspector was last modified.
Statistics Graphs paneDisplays charts of SQL performance according to the selected statistic in the drop-down list. Use the 2 sliders toselect the SQL with the top resource consumption. The No. of Top Consumption SQL slider selects the numberof SQL and the Percentage of Total Consumption slider selects the SQL statements based on the selectedpercentage of top resource consumption.
Statistics paneDisplays the statistics for each SQL statement retrieved from the chart selections.
The red checkmarks in the left column indicate those SQL statements that fall in the criteria of the selectedchart. If you selected AND as the mode to join multiple charts, the checkmarks are displayed in every rowbecause every single SQL statement satisfies all the charts. If you selected OR as the mode to join multiplecharts, when you click one of the charts, the red checkmarks indicate the SQL statements that correspond to theselection criteria for that chart only.
Monitor Table statisticsThe system resource statistics extracted from the monitoring tables include: executions, CPU time, wait time,memory usage, physical reads, logical reads, pages modified, packets sent, packets received, CPU time perexecution, wait time per execution, memory usage per execution, physical reads per execution, logical readsper execution, pages modified per execution, packets sent per execution, and packets received per execution.The login, program, host, and database names are included.
SQL Optimizer for SAP ASE 3.9 User Guide 157
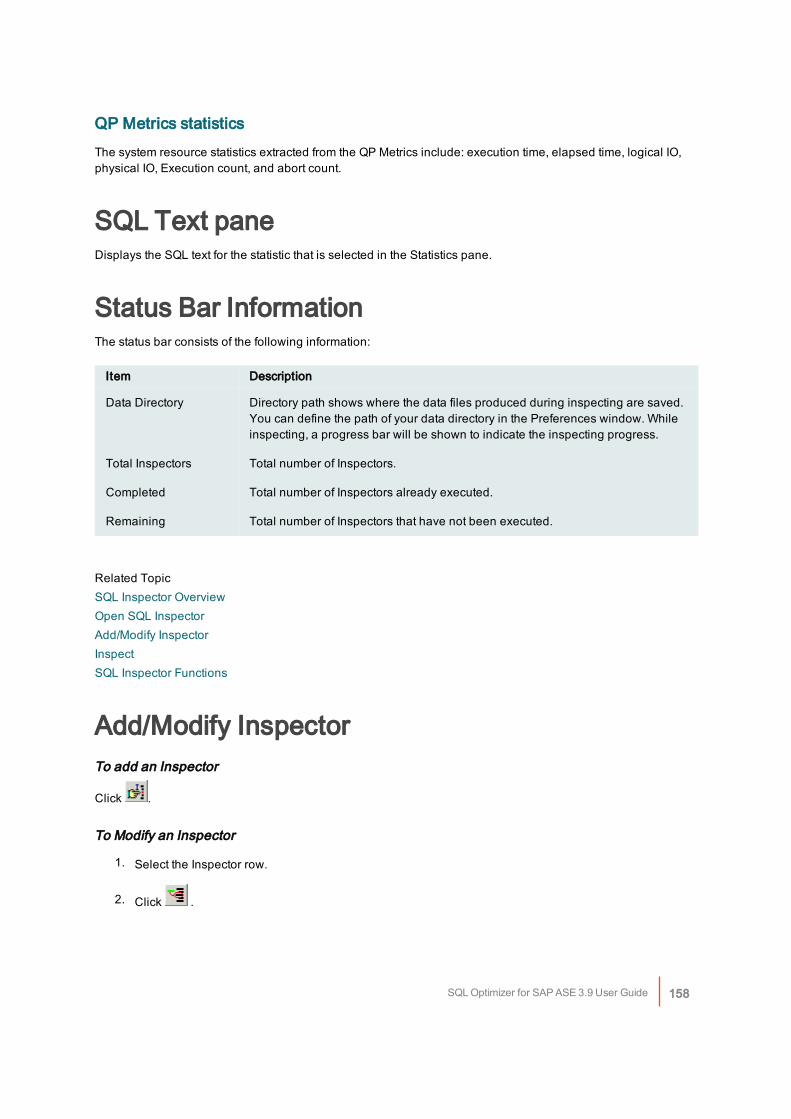
QP Metrics statisticsThe system resource statistics extracted from the QP Metrics include: execution time, elapsed time, logical IO,physical IO, Execution count, and abort count.
SQL Text paneDisplays the SQL text for the statistic that is selected in the Statistics pane.
Status Bar InformationThe status bar consists of the following information:
Item Description
Data Directory Directory path shows where the data files produced during inspecting are saved.You can define the path of your data directory in the Preferences window. Whileinspecting, a progress bar will be shown to indicate the inspecting progress.
Total Inspectors Total number of Inspectors.
Completed Total number of Inspectors already executed.
Remaining Total number of Inspectors that have not been executed.
Related TopicSQL Inspector OverviewOpen SQL InspectorAdd/Modify InspectorInspectSQL Inspector Functions
Add/Modify InspectorTo add an Inspector
Click .
To Modify an Inspector
1. Select the Inspector row.
2. Click .
SQL Optimizer for SAP ASE 3.9 User Guide 158
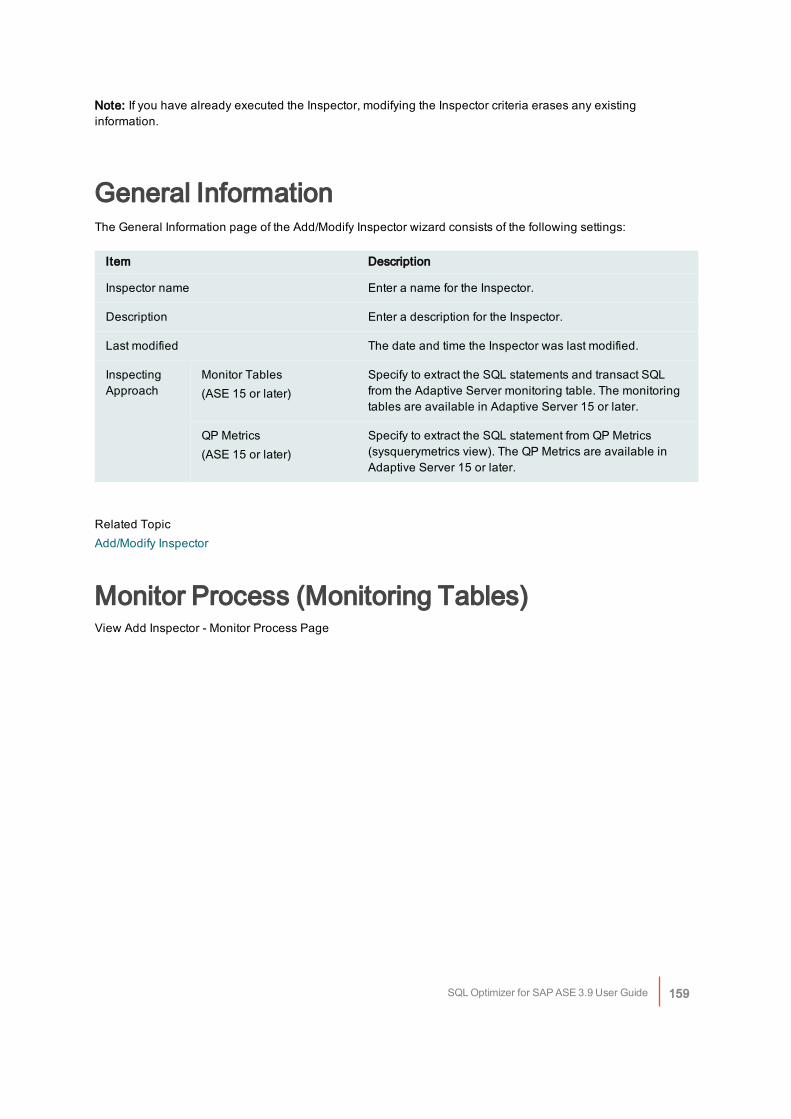
Note: If you have already executed the Inspector, modifying the Inspector criteria erases any existinginformation.
General InformationThe General Information page of the Add/Modify Inspector wizard consists of the following settings:
Item Description
Inspector name Enter a name for the Inspector.
Description Enter a description for the Inspector.
Last modified The date and time the Inspector was last modified.
InspectingApproach
Monitor Tables(ASE 15 or later)
Specify to extract the SQL statements and transact SQLfrom the Adaptive Server monitoring table. The monitoringtables are available in Adaptive Server 15 or later.
QP Metrics(ASE 15 or later)
Specify to extract the SQL statement from QP Metrics(sysquerymetrics view). The QP Metrics are available inAdaptive Server 15 or later.
Related TopicAdd/Modify Inspector
Monitor Process (Monitoring Tables)View Add Inspector - Monitor Process Page
SQL Optimizer for SAP ASE 3.9 User Guide 159
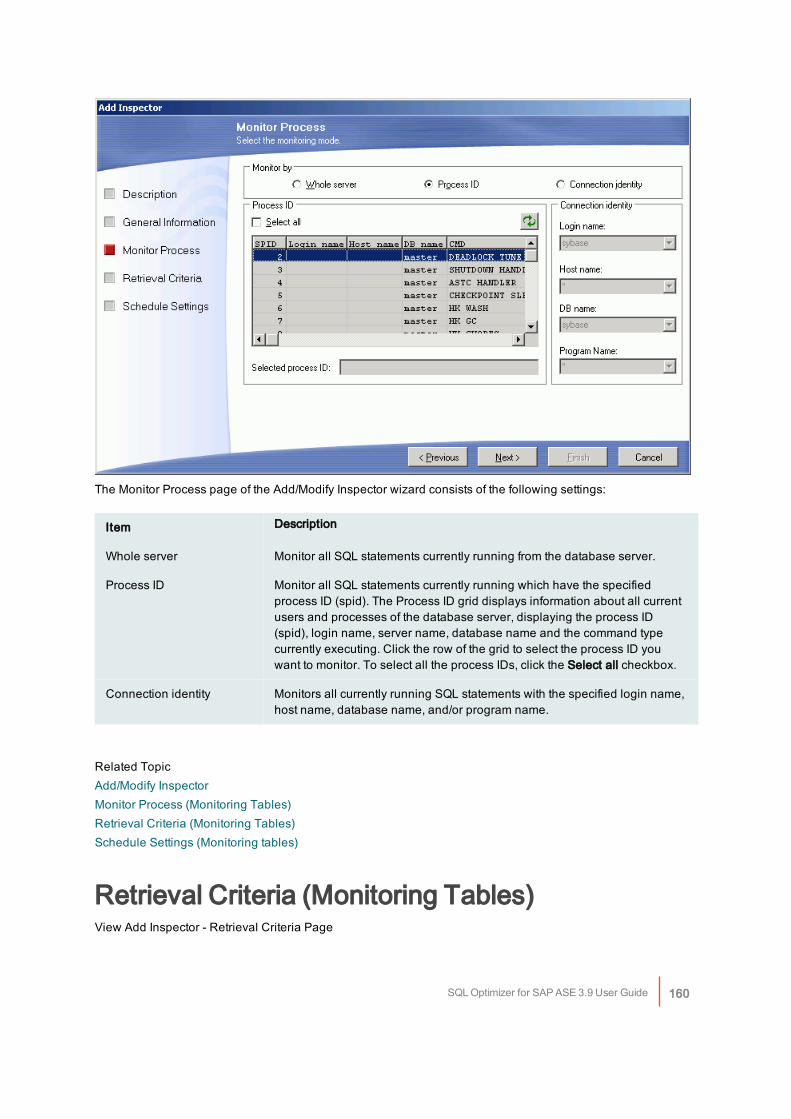
The Monitor Process page of the Add/Modify Inspector wizard consists of the following settings:
Item Description
Whole server Monitor all SQL statements currently running from the database server.
Process ID Monitor all SQL statements currently running which have the specifiedprocess ID (spid). The Process ID grid displays information about all currentusers and processes of the database server, displaying the process ID(spid), login name, server name, database name and the command typecurrently executing. Click the row of the grid to select the process ID youwant to monitor. To select all the process IDs, click the Select all checkbox.
Connection identity Monitors all currently running SQL statements with the specified login name,host name, database name, and/or program name.
Related TopicAdd/Modify InspectorMonitor Process (Monitoring Tables)Retrieval Criteria (Monitoring Tables)Schedule Settings (Monitoring tables)
Retrieval Criteria (Monitoring Tables)View Add Inspector - Retrieval Criteria Page
SQL Optimizer for SAP ASE 3.9 User Guide 160
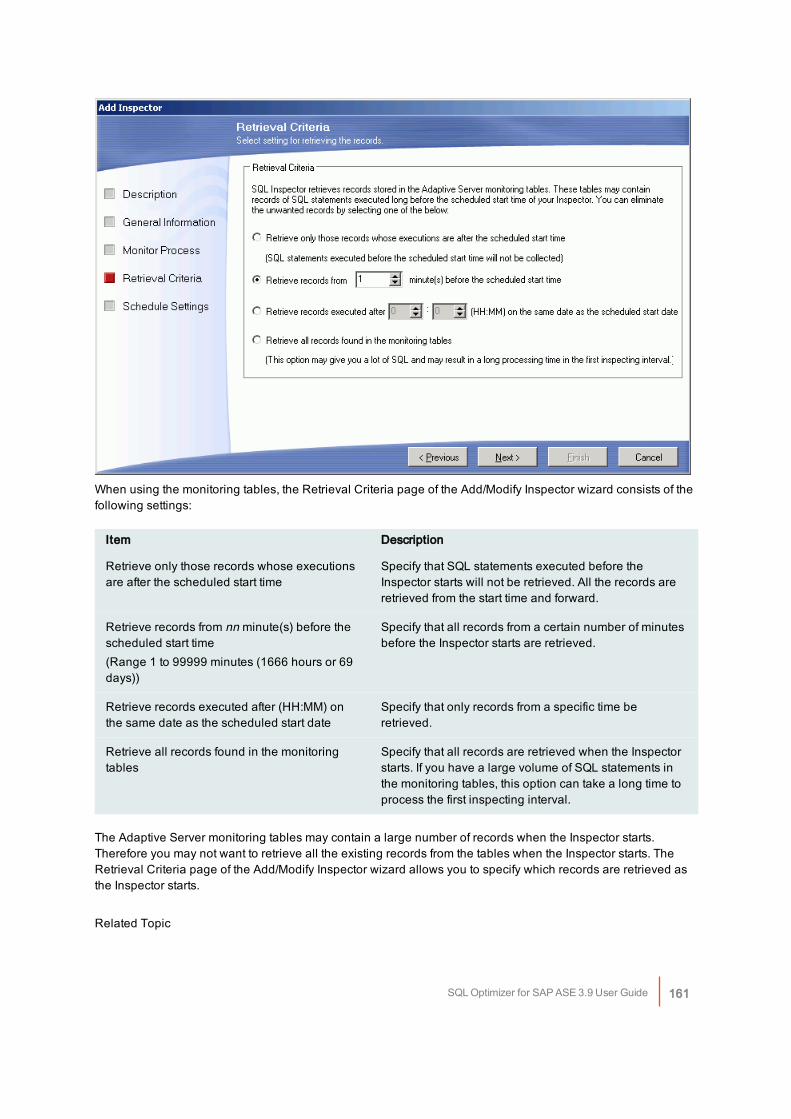
When using the monitoring tables, the Retrieval Criteria page of the Add/Modify Inspector wizard consists of thefollowing settings:
Item Description
Retrieve only those records whose executionsare after the scheduled start time
Specify that SQL statements executed before theInspector starts will not be retrieved. All the records areretrieved from the start time and forward.
Retrieve records from nn minute(s) before thescheduled start time(Range 1 to 99999 minutes (1666 hours or 69days))
Specify that all records from a certain number of minutesbefore the Inspector starts are retrieved.
Retrieve records executed after (HH:MM) onthe same date as the scheduled start date
Specify that only records from a specific time beretrieved.
Retrieve all records found in the monitoringtables
Specify that all records are retrieved when the Inspectorstarts. If you have a large volume of SQL statements inthe monitoring tables, this option can take a long time toprocess the first inspecting interval.
The Adaptive Server monitoring tables may contain a large number of records when the Inspector starts.Therefore you may not want to retrieve all the existing records from the tables when the Inspector starts. TheRetrieval Criteria page of the Add/Modify Inspector wizard allows you to specify which records are retrieved asthe Inspector starts.
Related Topic
SQL Optimizer for SAP ASE 3.9 User Guide 161
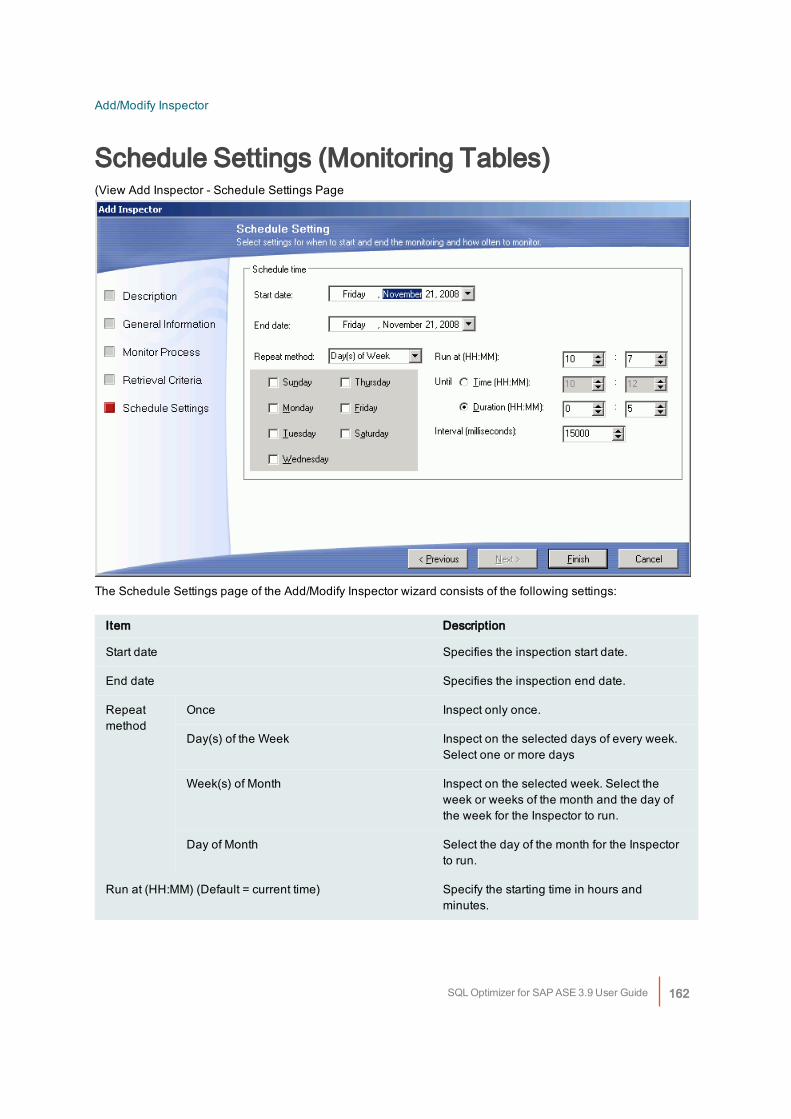
Add/Modify Inspector
Schedule Settings (Monitoring Tables)(View Add Inspector - Schedule Settings Page
The Schedule Settings page of the Add/Modify Inspector wizard consists of the following settings:
Item Description
Start date Specifies the inspection start date.
End date Specifies the inspection end date.
Repeatmethod
Once Inspect only once.
Day(s) of the Week Inspect on the selected days of every week.Select one or more days
Week(s) of Month Inspect on the selected week. Select theweek or weeks of the month and the day ofthe week for the Inspector to run.
Day of Month Select the day of the month for the Inspectorto run.
Run at (HH:MM) (Default = current time) Specify the starting time in hours andminutes.
SQL Optimizer for SAP ASE 3.9 User Guide 162
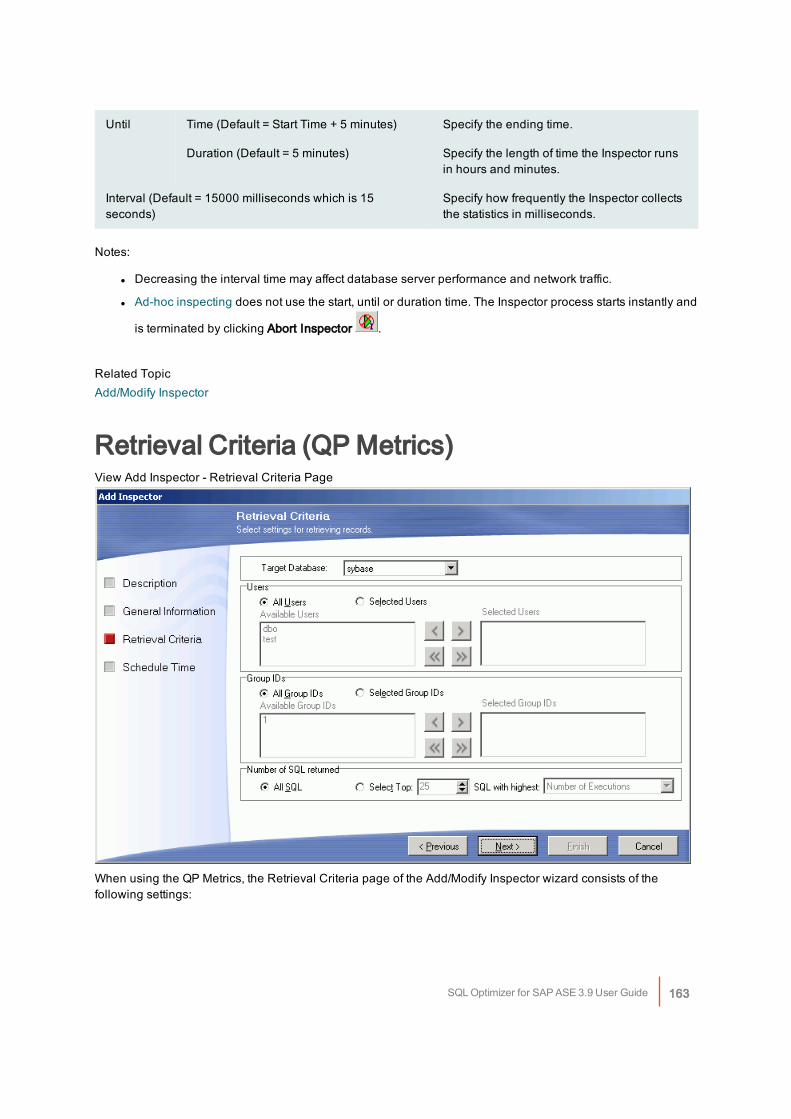
Until Time (Default = Start Time + 5 minutes) Specify the ending time.
Duration (Default = 5 minutes) Specify the length of time the Inspector runsin hours and minutes.
Interval (Default = 15000 milliseconds which is 15seconds)
Specify how frequently the Inspector collectsthe statistics in milliseconds.
Notes:
l Decreasing the interval time may affect database server performance and network traffic.
l Ad-hoc inspecting does not use the start, until or duration time. The Inspector process starts instantly and
is terminated by clicking Abort Inspector .
Related TopicAdd/Modify Inspector
Retrieval Criteria (QP Metrics)View Add Inspector - Retrieval Criteria Page
When using the QP Metrics, the Retrieval Criteria page of the Add/Modify Inspector wizard consists of thefollowing settings:
SQL Optimizer for SAP ASE 3.9 User Guide 163
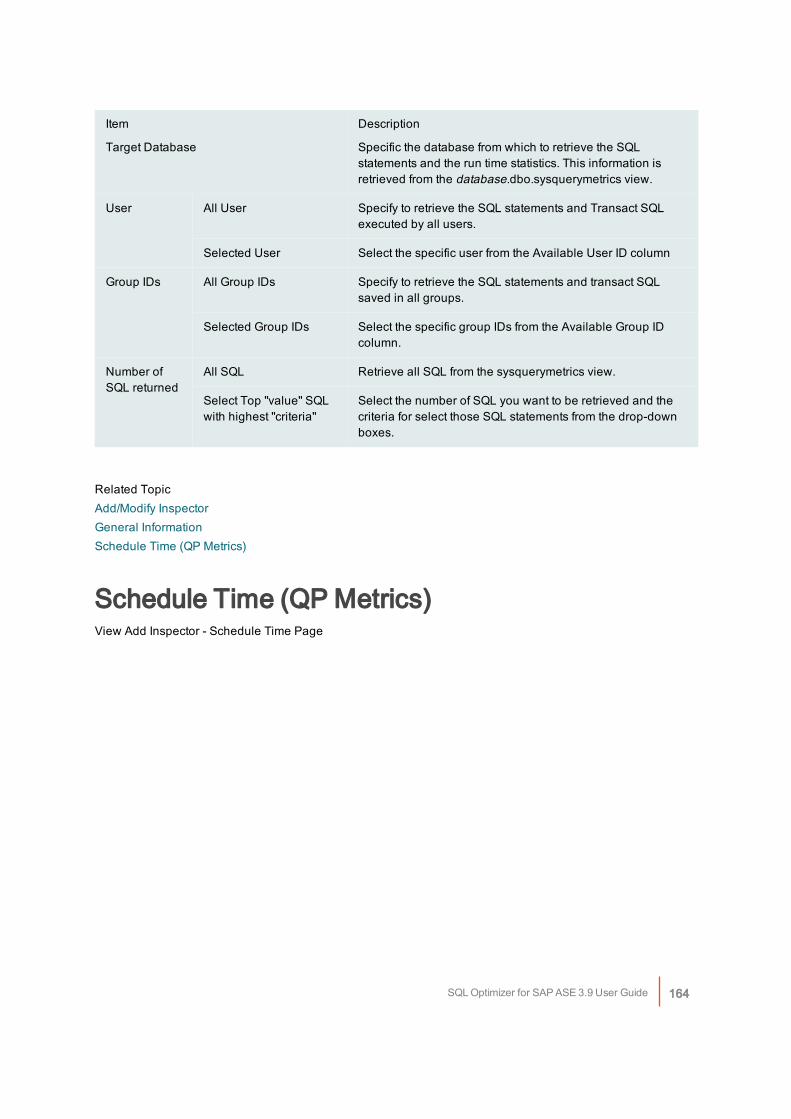
Item Description
Target Database Specific the database from which to retrieve the SQLstatements and the run time statistics. This information isretrieved from the database.dbo.sysquerymetrics view.
User All User Specify to retrieve the SQL statements and Transact SQLexecuted by all users.
Selected User Select the specific user from the Available User ID column
Group IDs All Group IDs Specify to retrieve the SQL statements and transact SQLsaved in all groups.
Selected Group IDs Select the specific group IDs from the Available Group IDcolumn.
Number ofSQL returned
All SQL Retrieve all SQL from the sysquerymetrics view.
Select Top "value" SQLwith highest "criteria"
Select the number of SQL you want to be retrieved and thecriteria for select those SQL statements from the drop-downboxes.
Related TopicAdd/Modify InspectorGeneral InformationSchedule Time (QP Metrics)
Schedule Time (QP Metrics)View Add Inspector - Schedule Time Page
SQL Optimizer for SAP ASE 3.9 User Guide 164
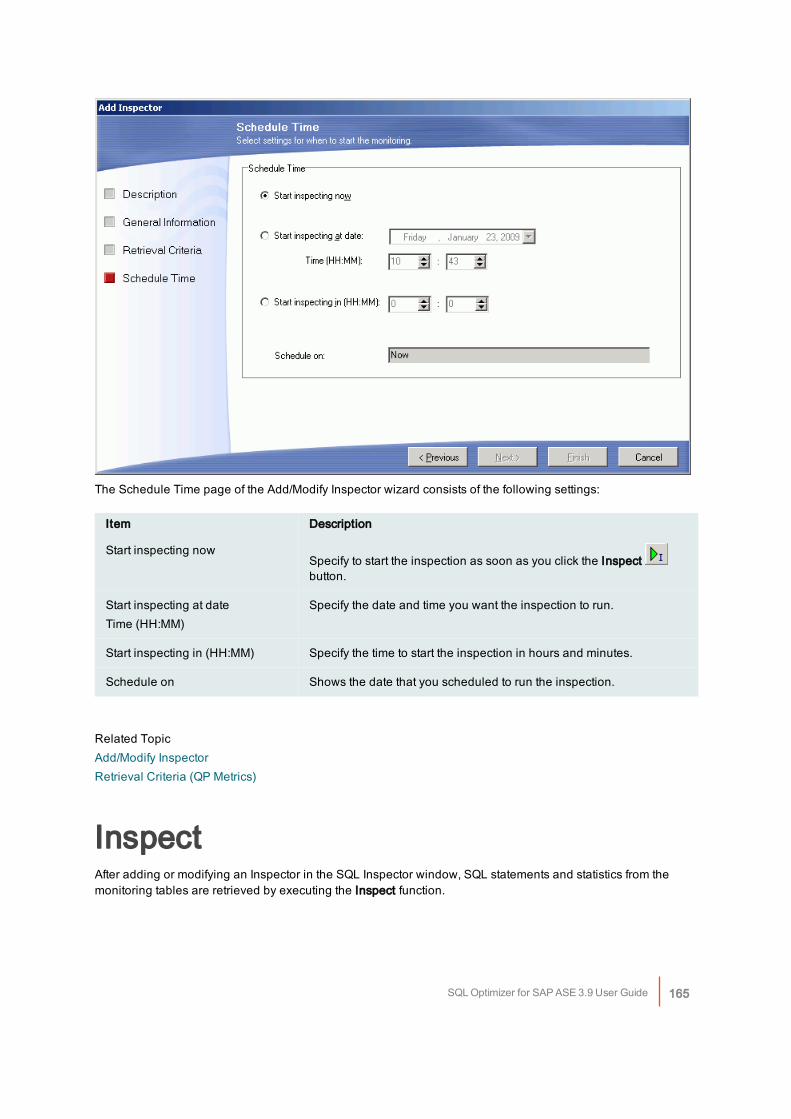
The Schedule Time page of the Add/Modify Inspector wizard consists of the following settings:
Item Description
Start inspecting nowSpecify to start the inspection as soon as you click the Inspectbutton.
Start inspecting at dateTime (HH:MM)
Specify the date and time you want the inspection to run.
Start inspecting in (HH:MM) Specify the time to start the inspection in hours and minutes.
Schedule on Shows the date that you scheduled to run the inspection.
Related TopicAdd/Modify InspectorRetrieval Criteria (QP Metrics)
InspectAfter adding or modifying an Inspector in the SQL Inspector window, SQL statements and statistics from themonitoring tables are retrieved by executing the Inspect function.
SQL Optimizer for SAP ASE 3.9 User Guide 165
To start the inspecting process
Click .If the start time of the Inspector has not been reached, the SQL Inspector waits until it is time to begin. Duringand at the end of the inspecting, information is updated on the SQL Inspector window. Inspect terminatesautomatically once the end time is reached, except for ad-hoc inspecting. The ad-hoc inspecting process has noending time so it must be terminated manually.
To abort the inspecting
Click .Note: If you have already executed the Inspect function for an Inspector, re-executing the Inspect function willerase all existing information.
Related TopicsAd-hoc InspectSQL Inspector OverviewSQL Inspector Window
Ad-hoc InspectAd-hoc inspect allows the retrieval of the SQL performance statistics without considering or setting thescheduled start date and time.
To start an ad-hoc inspection
1. Mark an Inspector by clicking the Inspector row. A green checkmark is prefixed to the Inspector Namecolumn to indicate that the Inspector is marked.
2. Right-click and select Ad-hoc Inspect.
The process will not stop until you click .
Abort InspectAfter the Inspect function has been executed from the SQL Inspector window, it can be aborted at any time.
To abort the inspecting
Click .It may take several seconds for all the events to close down.
Related TopicsInspect
SQL Optimizer for SAP ASE 3.9 User Guide 166
Ad-hoc InspectSQL Inspector OverviewSQL Inspector Window
Scan InspectorThe SQL statements collected by the Inspector can be scanned in the SQL Scanner to classify the SQLstatements to help identify which SQL statements are likely to be causing performance problems.
To scan an Inspector from the SQL Inspector window:
1. Mark an Inspector by clicking the Inspector row.
2. Right-click and select Scan.
The selected Inspector is copied to the SQL Scanner window for scanning. If the SQL Scanner window is notopened then you will need to first select or create a job group from the Group Manager window. Once added,the scanning starts automatically.
Related TopicsSQL Scanner OverviewScan Inspected SQLSQL Inspector OverviewSQL Inspector Window
Find InspectorTo search for a specified text in all Inspectors
1. Select Inspector | Find Inspector.
2. Enter the search text string
3. Click Find.
Related TopicsSQL Inspector OverviewSQL Inspector Window
SQL Optimizer for SAP ASE 3.9 User Guide 167
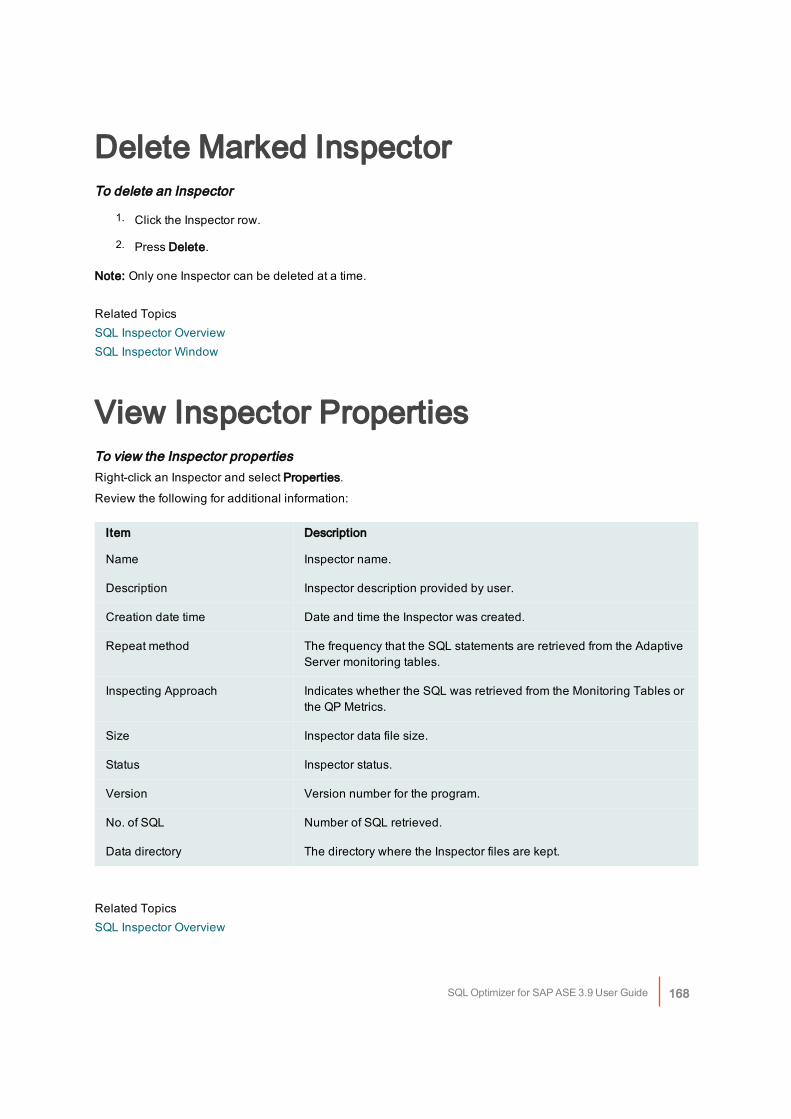
Delete Marked InspectorTo delete an Inspector
1. Click the Inspector row.
2. Press Delete.
Note: Only one Inspector can be deleted at a time.
Related TopicsSQL Inspector OverviewSQL Inspector Window
View Inspector PropertiesTo view the Inspector propertiesRight-click an Inspector and select Properties.
Review the following for additional information:
Item Description
Name Inspector name.
Description Inspector description provided by user.
Creation date time Date and time the Inspector was created.
Repeat method The frequency that the SQL statements are retrieved from the AdaptiveServer monitoring tables.
Inspecting Approach Indicates whether the SQL was retrieved from the Monitoring Tables orthe QP Metrics.
Size Inspector data file size.
Status Inspector status.
Version Version number for the program.
No. of SQL Number of SQL retrieved.
Data directory The directory where the Inspector files are kept.
Related TopicsSQL Inspector Overview
SQL Optimizer for SAP ASE 3.9 User Guide 168
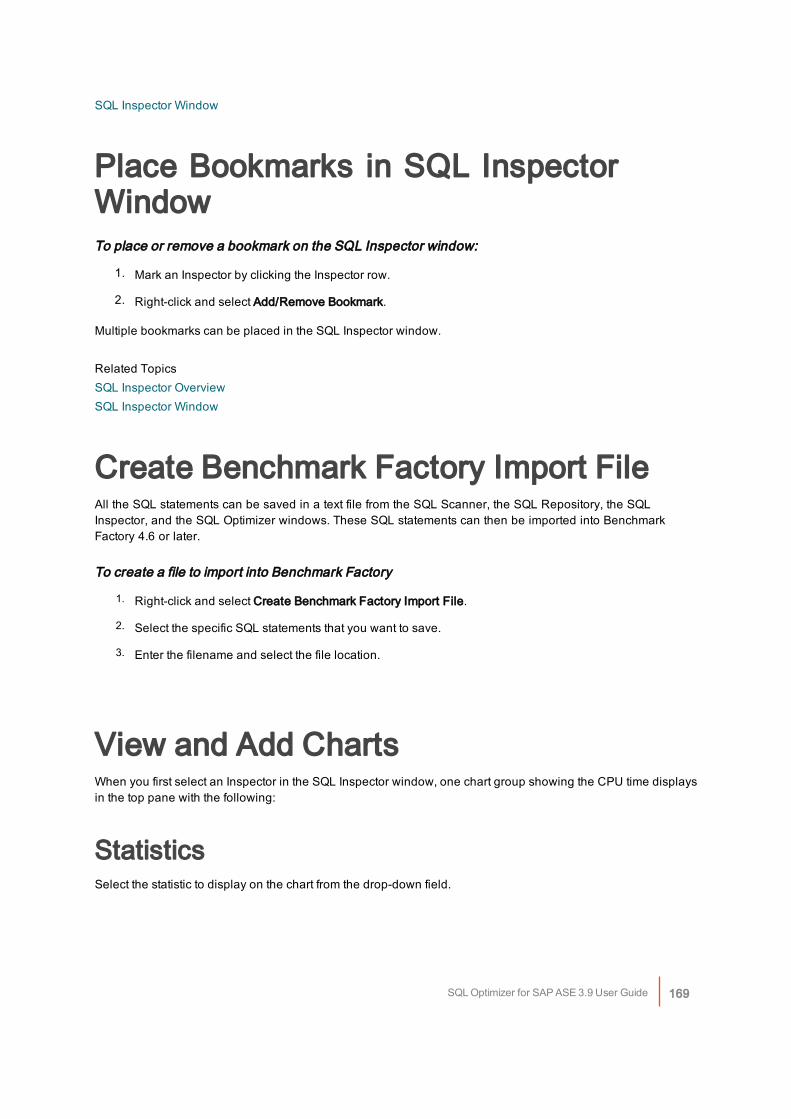
SQL Inspector Window
Place Bookmarks in SQL InspectorWindowTo place or remove a bookmark on the SQL Inspector window:
1. Mark an Inspector by clicking the Inspector row.
2. Right-click and select Add/Remove Bookmark.
Multiple bookmarks can be placed in the SQL Inspector window.
Related TopicsSQL Inspector OverviewSQL Inspector Window
Create Benchmark Factory Import FileAll the SQL statements can be saved in a text file from the SQL Scanner, the SQL Repository, the SQLInspector, and the SQL Optimizer windows. These SQL statements can then be imported into BenchmarkFactory 4.6 or later.
To create a file to import into Benchmark Factory
1. Right-click and select Create Benchmark Factory Import File.
2. Select the specific SQL statements that you want to save.
3. Enter the filename and select the file location.
View and Add ChartsWhen you first select an Inspector in the SQL Inspector window, one chart group showing the CPU time displaysin the top pane with the following:
StatisticsSelect the statistic to display on the chart from the drop-down field.
SQL Optimizer for SAP ASE 3.9 User Guide 169
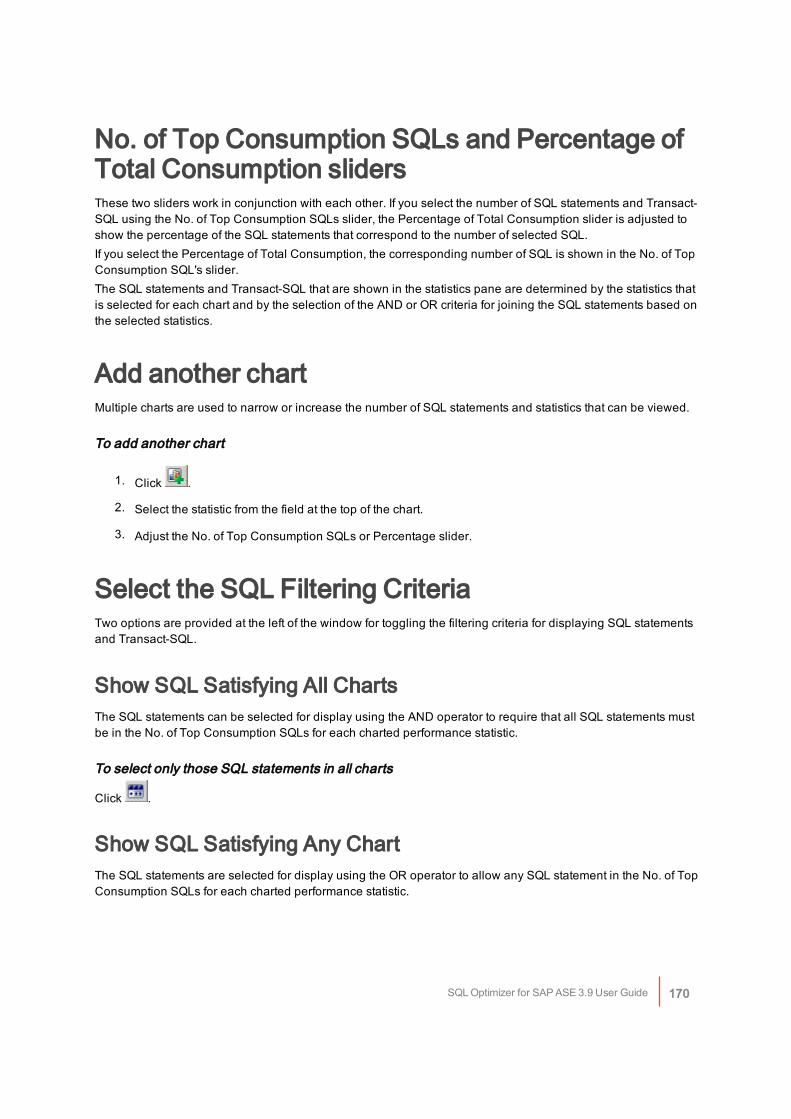
No. of Top Consumption SQLs and Percentage ofTotal Consumption slidersThese two sliders work in conjunction with each other. If you select the number of SQL statements and Transact-SQL using the No. of Top Consumption SQLs slider, the Percentage of Total Consumption slider is adjusted toshow the percentage of the SQL statements that correspond to the number of selected SQL.If you select the Percentage of Total Consumption, the corresponding number of SQL is shown in the No. of TopConsumption SQL's slider.The SQL statements and Transact-SQL that are shown in the statistics pane are determined by the statistics thatis selected for each chart and by the selection of the AND or OR criteria for joining the SQL statements based onthe selected statistics.
Add another chartMultiple charts are used to narrow or increase the number of SQL statements and statistics that can be viewed.
To add another chart
1. Click .
2. Select the statistic from the field at the top of the chart.
3. Adjust the No. of Top Consumption SQLs or Percentage slider.
Select the SQL Filtering CriteriaTwo options are provided at the left of the window for toggling the filtering criteria for displaying SQL statementsand Transact-SQL.
Show SQL Satisfying All ChartsThe SQL statements can be selected for display using the AND operator to require that all SQL statements mustbe in the No. of Top Consumption SQLs for each charted performance statistic.
To select only those SQL statements in all charts
Click .
Show SQL Satisfying Any ChartThe SQL statements are selected for display using the OR operator to allow any SQL statement in the No. of TopConsumption SQLs for each charted performance statistic.
SQL Optimizer for SAP ASE 3.9 User Guide 170
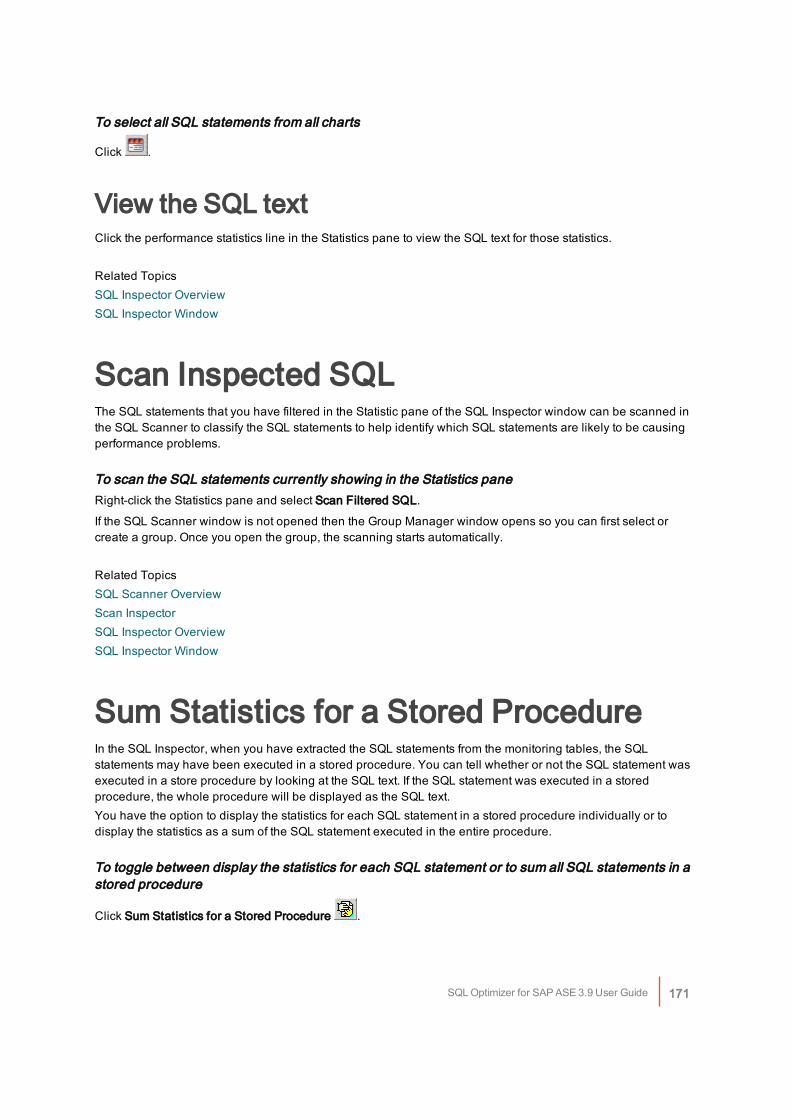
To select all SQL statements from all charts
Click .
View the SQL textClick the performance statistics line in the Statistics pane to view the SQL text for those statistics.
Related TopicsSQL Inspector OverviewSQL Inspector Window
Scan Inspected SQLThe SQL statements that you have filtered in the Statistic pane of the SQL Inspector window can be scanned inthe SQL Scanner to classify the SQL statements to help identify which SQL statements are likely to be causingperformance problems.
To scan the SQL statements currently showing in the Statistics paneRight-click the Statistics pane and select Scan Filtered SQL.
If the SQL Scanner window is not opened then the Group Manager window opens so you can first select orcreate a group. Once you open the group, the scanning starts automatically.
Related TopicsSQL Scanner OverviewScan InspectorSQL Inspector OverviewSQL Inspector Window
Sum Statistics for a Stored ProcedureIn the SQL Inspector, when you have extracted the SQL statements from the monitoring tables, the SQLstatements may have been executed in a stored procedure. You can tell whether or not the SQL statement wasexecuted in a store procedure by looking at the SQL text. If the SQL statement was executed in a storedprocedure, the whole procedure will be displayed as the SQL text.You have the option to display the statistics for each SQL statement in a stored procedure individually or todisplay the statistics as a sum of the SQL statement executed in the entire procedure.
To toggle between display the statistics for each SQL statement or to sum all SQL statements in astored procedure
Click Sum Statistics for a Stored Procedure .
SQL Optimizer for SAP ASE 3.9 User Guide 171
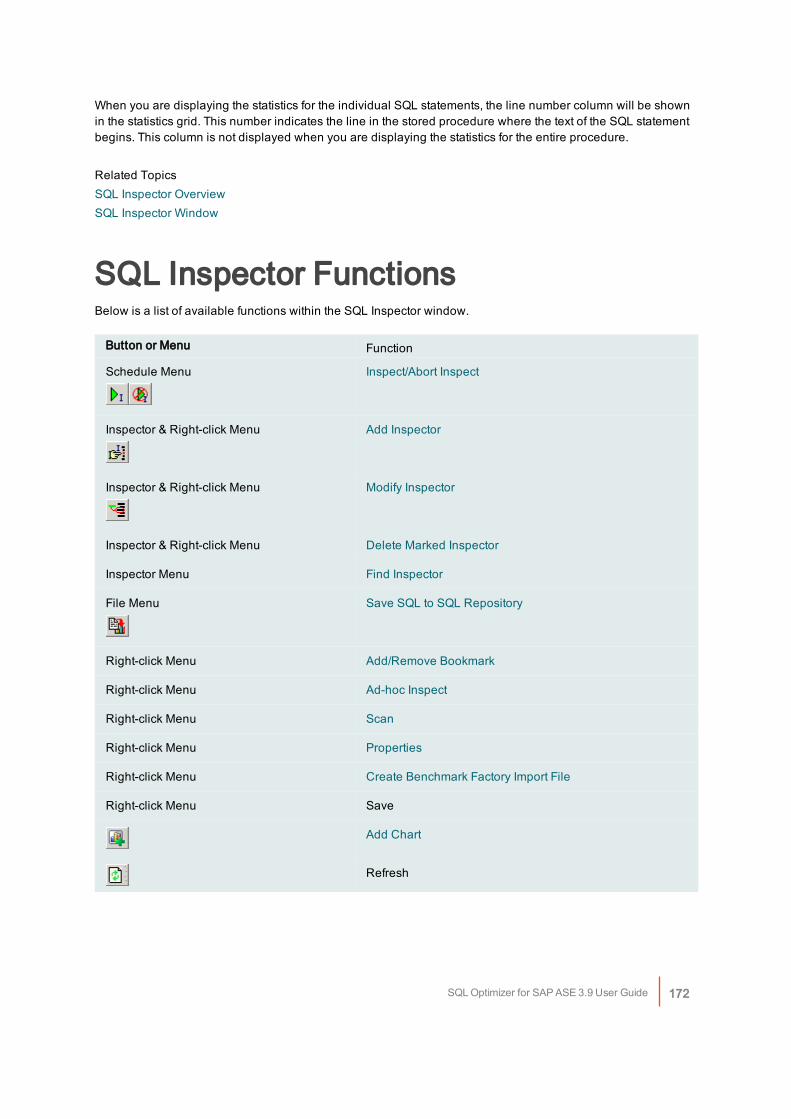
When you are displaying the statistics for the individual SQL statements, the line number column will be shownin the statistics grid. This number indicates the line in the stored procedure where the text of the SQL statementbegins. This column is not displayed when you are displaying the statistics for the entire procedure.
Related TopicsSQL Inspector OverviewSQL Inspector Window
SQL Inspector FunctionsBelow is a list of available functions within the SQL Inspector window.
Button or Menu Function
Schedule Menu Inspect/Abort Inspect
Inspector & Right-click Menu Add Inspector
Inspector & Right-click Menu Modify Inspector
Inspector & Right-click Menu Delete Marked Inspector
Inspector Menu Find Inspector
File Menu Save SQL to SQL Repository
Right-click Menu Add/Remove Bookmark
Right-click Menu Ad-hoc Inspect
Right-click Menu Scan
Right-click Menu Properties
Right-click Menu Create Benchmark Factory Import File
Right-click Menu Save
Add Chart
Refresh
SQL Optimizer for SAP ASE 3.9 User Guide 172
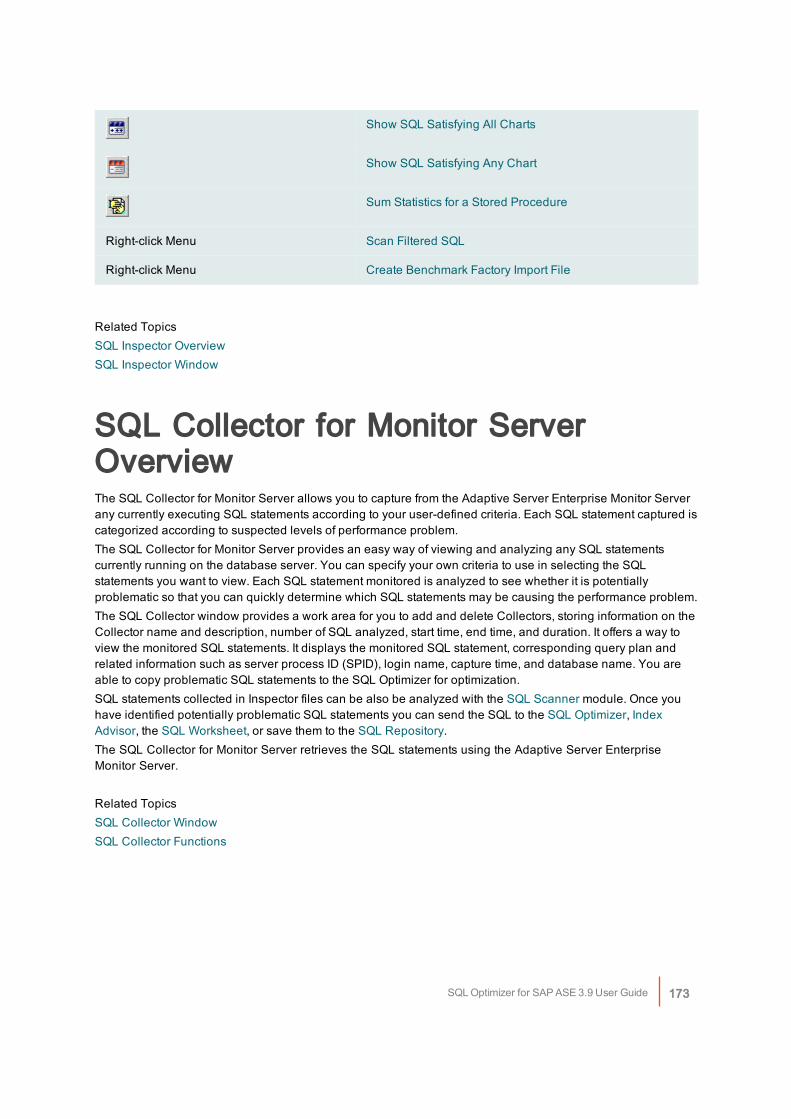
Show SQL Satisfying All Charts
Show SQL Satisfying Any Chart
Sum Statistics for a Stored Procedure
Right-click Menu Scan Filtered SQL
Right-click Menu Create Benchmark Factory Import File
Related TopicsSQL Inspector OverviewSQL Inspector Window
SQL Collector for Monitor ServerOverviewThe SQL Collector for Monitor Server allows you to capture from the Adaptive Server Enterprise Monitor Serverany currently executing SQL statements according to your user-defined criteria. Each SQL statement captured iscategorized according to suspected levels of performance problem.The SQL Collector for Monitor Server provides an easy way of viewing and analyzing any SQL statementscurrently running on the database server. You can specify your own criteria to use in selecting the SQLstatements you want to view. Each SQL statement monitored is analyzed to see whether it is potentiallyproblematic so that you can quickly determine which SQL statements may be causing the performance problem.The SQL Collector window provides a work area for you to add and delete Collectors, storing information on theCollector name and description, number of SQL analyzed, start time, end time, and duration. It offers a way toview the monitored SQL statements. It displays the monitored SQL statement, corresponding query plan andrelated information such as server process ID (SPID), login name, capture time, and database name. You areable to copy problematic SQL statements to the SQL Optimizer for optimization.SQL statements collected in Inspector files can be also be analyzed with the SQL Scanner module. Once youhave identified potentially problematic SQL statements you can send the SQL to the SQL Optimizer, IndexAdvisor, the SQL Worksheet, or save them to the SQL Repository.The SQL Collector for Monitor Server retrieves the SQL statements using the Adaptive Server EnterpriseMonitor Server.
Related TopicsSQL Collector WindowSQL Collector Functions
SQL Optimizer for SAP ASE 3.9 User Guide 173
Adaptive Server ConfigurationParameters for SQL CollectorThe SQL Collector for Monitor Server uses the Adaptive Server Enterprise Monitor Server to capture SQLstatements that are currently running on the database. The following items need to be set before using the SQLCollector for Monitor Server:
Adaptive Server VersionYou must have Adaptive Server 15.0 or later in order to have the Adaptive Server Enterprise Monitor Server.
Adaptive Server Enterprise Monitor ServerThe Monitor Server must be currently running. It must be configured on the same machine as the databaseserver you want to monitor. With Dsedit, you can PING the remote Monitor Server to ensure that a connection isavailable from the PC.
Monitor Server Name on Client SQL.INI andServer must match.The Adaptive Server and Monitor Server are defined in the \sybase\ini\sql.ini file on the client PC. The namesin the SQL.INI file must match exactly the name of the Adaptive Server and the Monitor Server on theDatabase Server.
Monitor Server Name in Collector setup mustmatchWhen adding a new Collector in the Add Collector window, the name for the Monitor Server must match exactlythe name of the Monitor Server in the SQL.INI file.
Tempdb sizeThe tempdb system segment should be at least 20 MB.
Logon PrivilegeYou must have sa_role privilege assigned to your logon.
SQL Optimizer for SAP ASE 3.9 User Guide 174
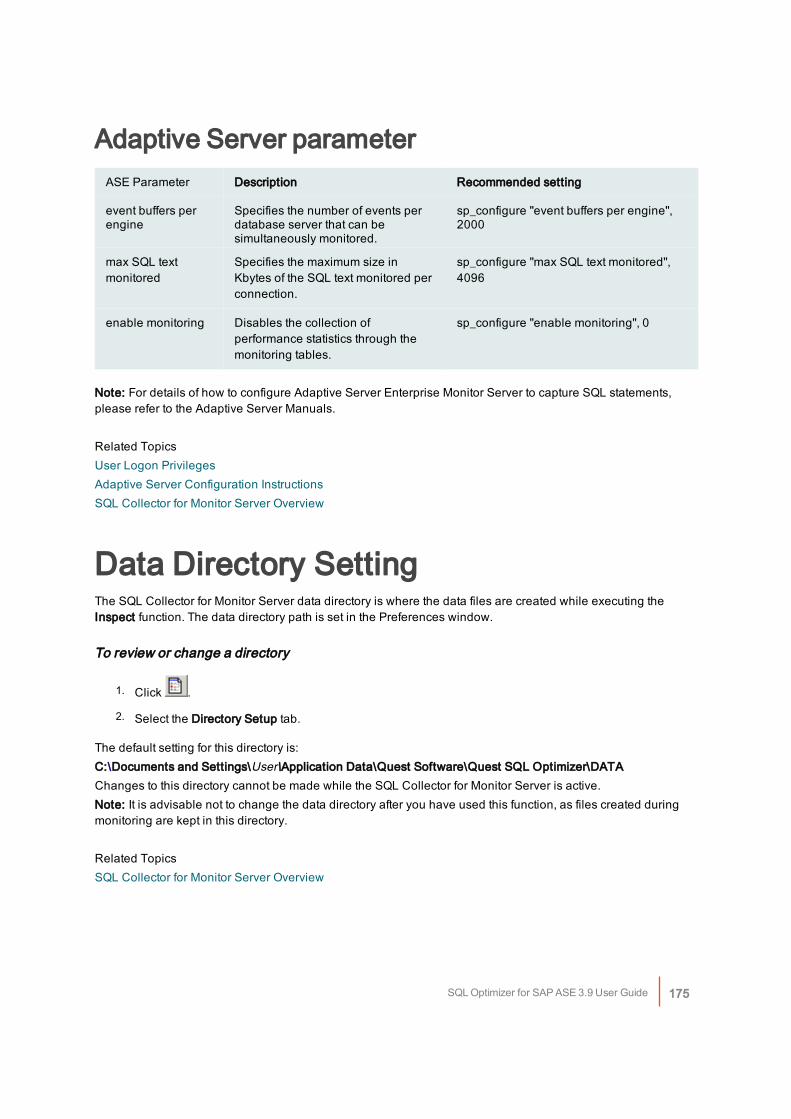
Adaptive Server parameterASE Parameter Description Recommended setting
event buffers perengine
Specifies the number of events perdatabase server that can besimultaneously monitored.
sp_configure "event buffers per engine",2000
max SQL textmonitored
Specifies the maximum size inKbytes of the SQL text monitored perconnection.
sp_configure "max SQL text monitored",4096
enable monitoring Disables the collection ofperformance statistics through themonitoring tables.
sp_configure "enable monitoring", 0
Note: For details of how to configure Adaptive Server Enterprise Monitor Server to capture SQL statements,please refer to the Adaptive Server Manuals.
Related TopicsUser Logon PrivilegesAdaptive Server Configuration InstructionsSQL Collector for Monitor Server Overview
Data Directory SettingThe SQL Collector for Monitor Server data directory is where the data files are created while executing theInspect function. The data directory path is set in the Preferences window.
To review or change a directory
1. Click .
2. Select the Directory Setup tab.
The default setting for this directory is:C:\Documents and Settings\User\Application Data\Quest Software\Quest SQL Optimizer\DATAChanges to this directory cannot be made while the SQL Collector for Monitor Server is active.Note: It is advisable not to change the data directory after you have used this function, as files created duringmonitoring are kept in this directory.
Related TopicsSQL Collector for Monitor Server Overview
SQL Optimizer for SAP ASE 3.9 User Guide 175
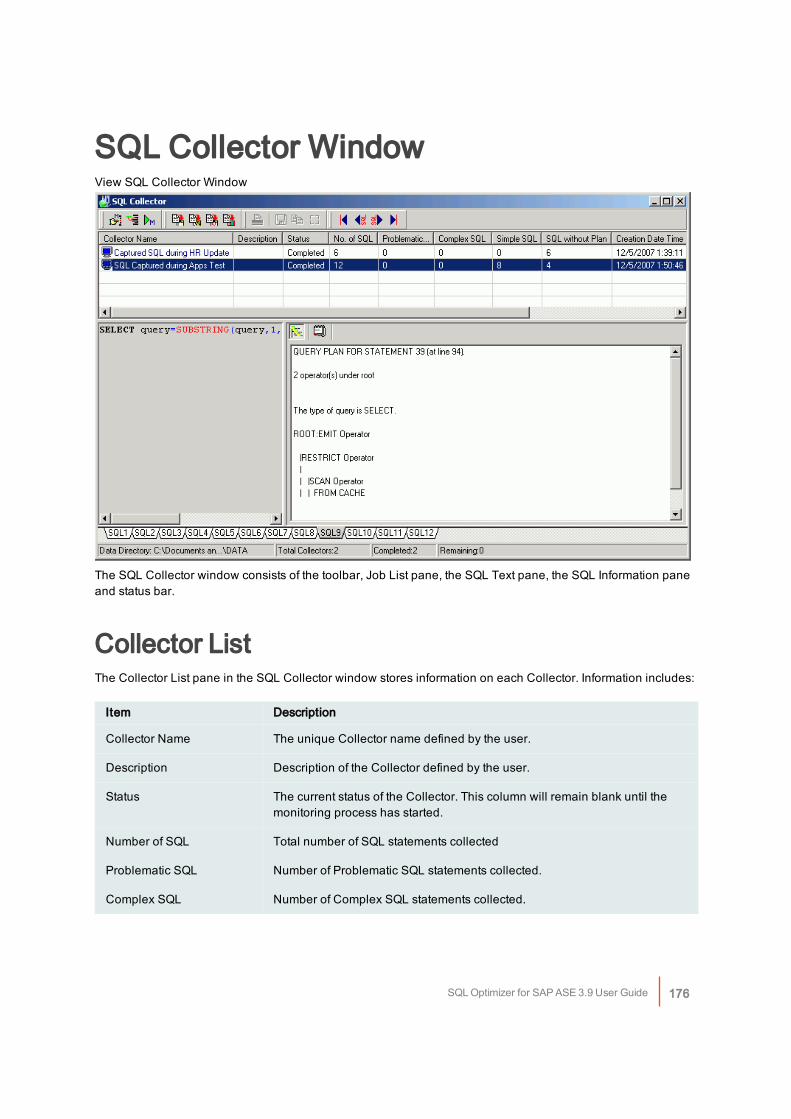
SQL Collector WindowView SQL Collector Window
The SQL Collector window consists of the toolbar, Job List pane, the SQL Text pane, the SQL Information paneand status bar.
Collector ListThe Collector List pane in the SQL Collector window stores information on each Collector. Information includes:
Item Description
Collector Name The unique Collector name defined by the user.
Description Description of the Collector defined by the user.
Status The current status of the Collector. This column will remain blank until themonitoring process has started.
Number of SQL Total number of SQL statements collected
Problematic SQL Number of Problematic SQL statements collected.
Complex SQL Number of Complex SQL statements collected.
SQL Optimizer for SAP ASE 3.9 User Guide 176
Simple SQL Number of Simple SQL statements collected.
SQL without Plan Number of SQL statements collected without a query plan.
Creation Date Time Date and time of when the Collector was created.
Start Time Start time of when the monitoring process starts.
End Time End time of when the monitoring process ends.
Server Name Monitor Server name.
Note: The definitions of Problematic, Complex, and Simple SQL statements are provided in the SQL CollectorCriteria tab of the Add Collector wizard.
SQL TextThe SQL Text pane displays the monitored SQL statements for a particular Collector. The layout of the SQLstatement is unformatted and displayed according to how it is retrieved from the Adaptive Server EnterpriseMonitor Server. SQL statements captured from the Monitor Server may consist of transact-SQL and storedprocedures. Therefore to identify the SQL statements that you may want to optimize, you should use the SQLScanner to identify the SELECT, UPDATE, INSERT and DELETE SQL statements that are contained with thestored procedures or transact-SQL .
SQL InformationIf the query plan is retrieved for the monitored SQL statement the query plan and other details will be displayedin the SQL Information Pane
Status BarThe status bar at the bottom of the SQL Collector window shows the following details:
Item Description
Data Directory Path showing where all the data files produced during monitoring are saved.While monitoring, a progress bar displays to show the monitoring progress.
Total Collectors Total number of Collectors.
Completed Total number of Collectors already monitored.
Remaining Total number of Collectors that have not been monitored.
Note: The SQL Collector window must remain open during the monitoring process. If you have started themonitoring process, but the scheduled time has not arrived, this window must remain open for the monitoringprocess to start and run to completion.
SQL Optimizer for SAP ASE 3.9 User Guide 177
Related TopicsSQL Collector for Monitor Server OverviewAdd or Modify a CollectorSQL Collector Functions
Open SQL Collector for Monitor ServerTo display the SQL Collector window
Click .
Related TopicsSQL Collector for Monitor Server OverviewSQL Collector Window
Add or Modify a CollectorTo add a Collector to the SQL Collector window
Click to display the Add Collectors wizard.
To modify a Collector
1. Highlight the Collector row.
2. Click .
Note: If you have already monitored the Collector, by modifying the Collector criteria you will erase any existinginformation.
Related TopicsSQL Collector for Monitor Server OverviewSQL Collector Window
General InformationView Add Collector - General Information Page
SQL Optimizer for SAP ASE 3.9 User Guide 178
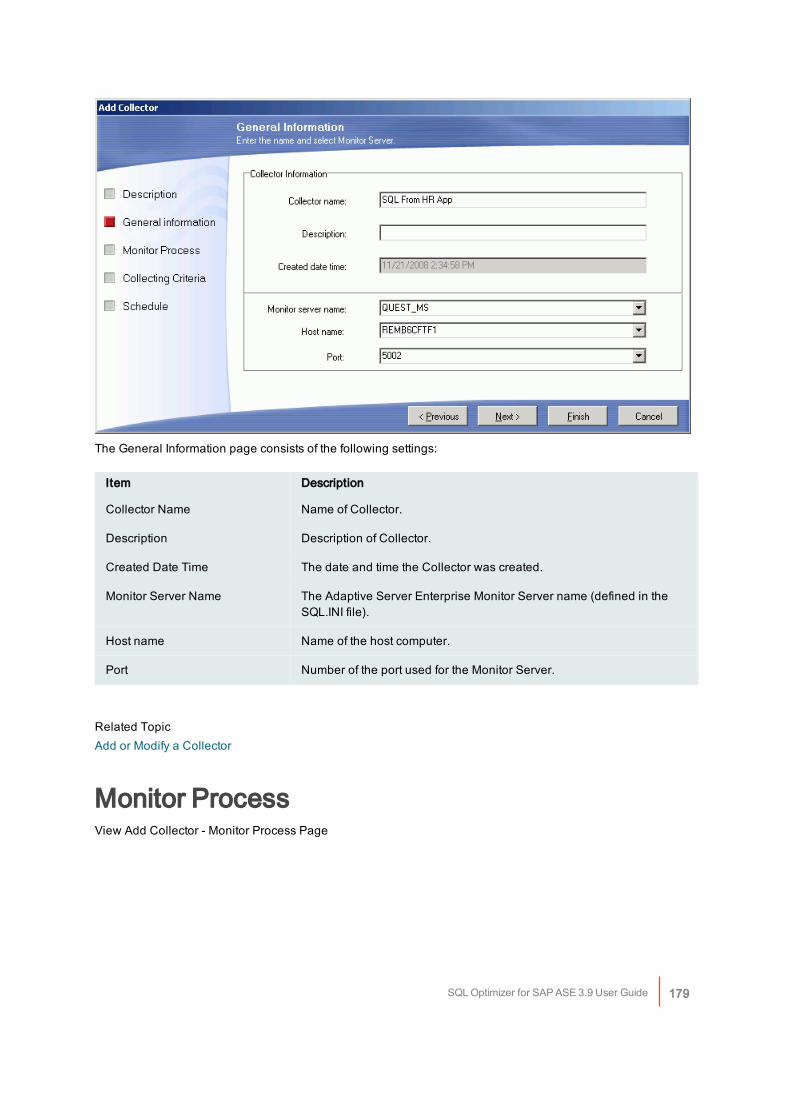
The General Information page consists of the following settings:
Item Description
Collector Name Name of Collector.
Description Description of Collector.
Created Date Time The date and time the Collector was created.
Monitor Server Name The Adaptive Server Enterprise Monitor Server name (defined in theSQL.INI file).
Host name Name of the host computer.
Port Number of the port used for the Monitor Server.
Related TopicAdd or Modify a Collector
Monitor ProcessView Add Collector - Monitor Process Page
SQL Optimizer for SAP ASE 3.9 User Guide 179
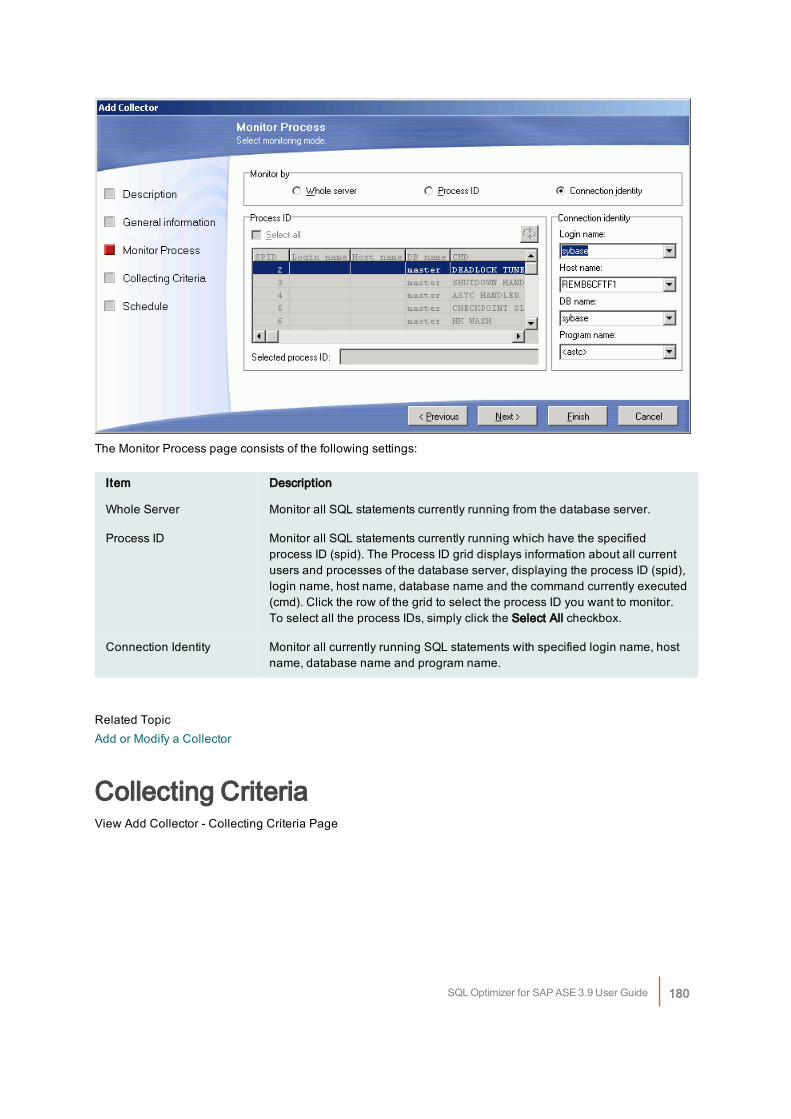
The Monitor Process page consists of the following settings:
Item Description
Whole Server Monitor all SQL statements currently running from the database server.
Process ID Monitor all SQL statements currently running which have the specifiedprocess ID (spid). The Process ID grid displays information about all currentusers and processes of the database server, displaying the process ID (spid),login name, host name, database name and the command currently executed(cmd). Click the row of the grid to select the process ID you want to monitor.To select all the process IDs, simply click the Select All checkbox.
Connection Identity Monitor all currently running SQL statements with specified login name, hostname, database name and program name.
Related TopicAdd or Modify a Collector
Collecting CriteriaView Add Collector - Collecting Criteria Page
SQL Optimizer for SAP ASE 3.9 User Guide 180
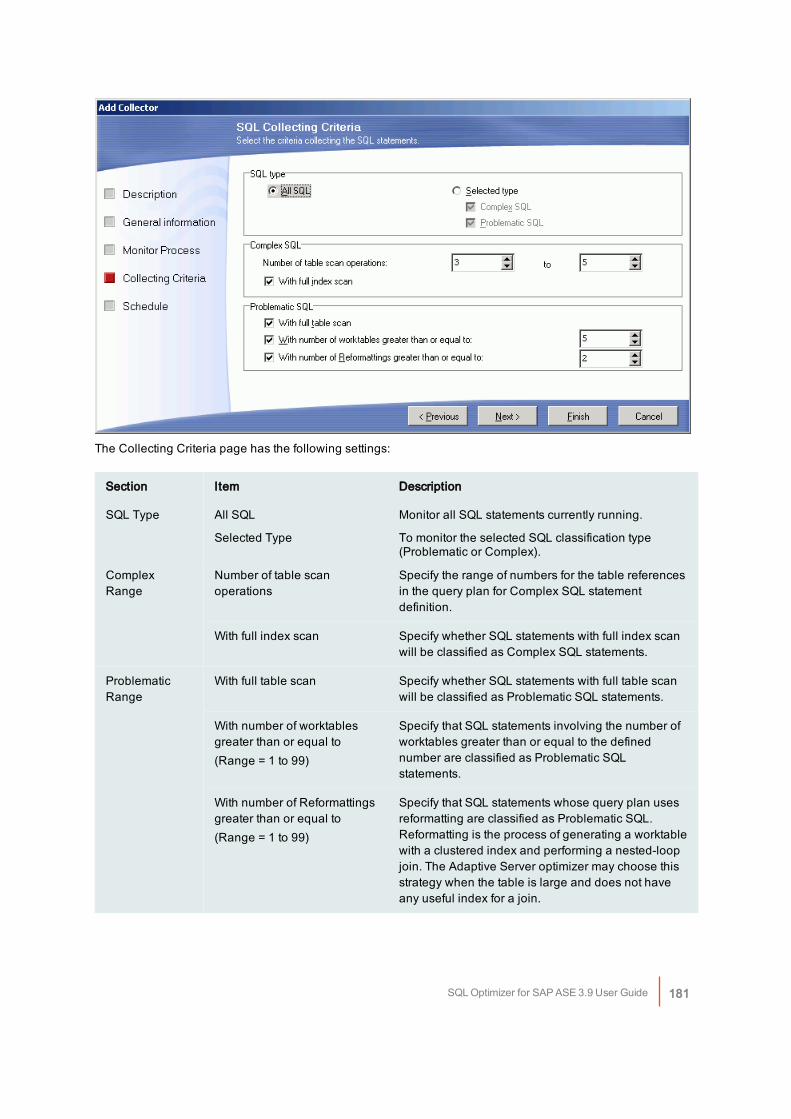
The Collecting Criteria page has the following settings:
Section Item Description
SQL Type All SQL Monitor all SQL statements currently running.
Selected Type To monitor the selected SQL classification type(Problematic or Complex).
ComplexRange
Number of table scanoperations
Specify the range of numbers for the table referencesin the query plan for Complex SQL statementdefinition.
With full index scan Specify whether SQL statements with full index scanwill be classified as Complex SQL statements.
ProblematicRange
With full table scan Specify whether SQL statements with full table scanwill be classified as Problematic SQL statements.
With number of worktablesgreater than or equal to(Range = 1 to 99)
Specify that SQL statements involving the number ofworktables greater than or equal to the definednumber are classified as Problematic SQLstatements.
With number of Reformattingsgreater than or equal to(Range = 1 to 99)
Specify that SQL statements whose query plan usesreformatting are classified as Problematic SQL.Reformatting is the process of generating a worktablewith a clustered index and performing a nested-loopjoin. The Adaptive Server optimizer may choose thisstrategy when the table is large and does not haveany useful index for a join.
SQL Optimizer for SAP ASE 3.9 User Guide 181
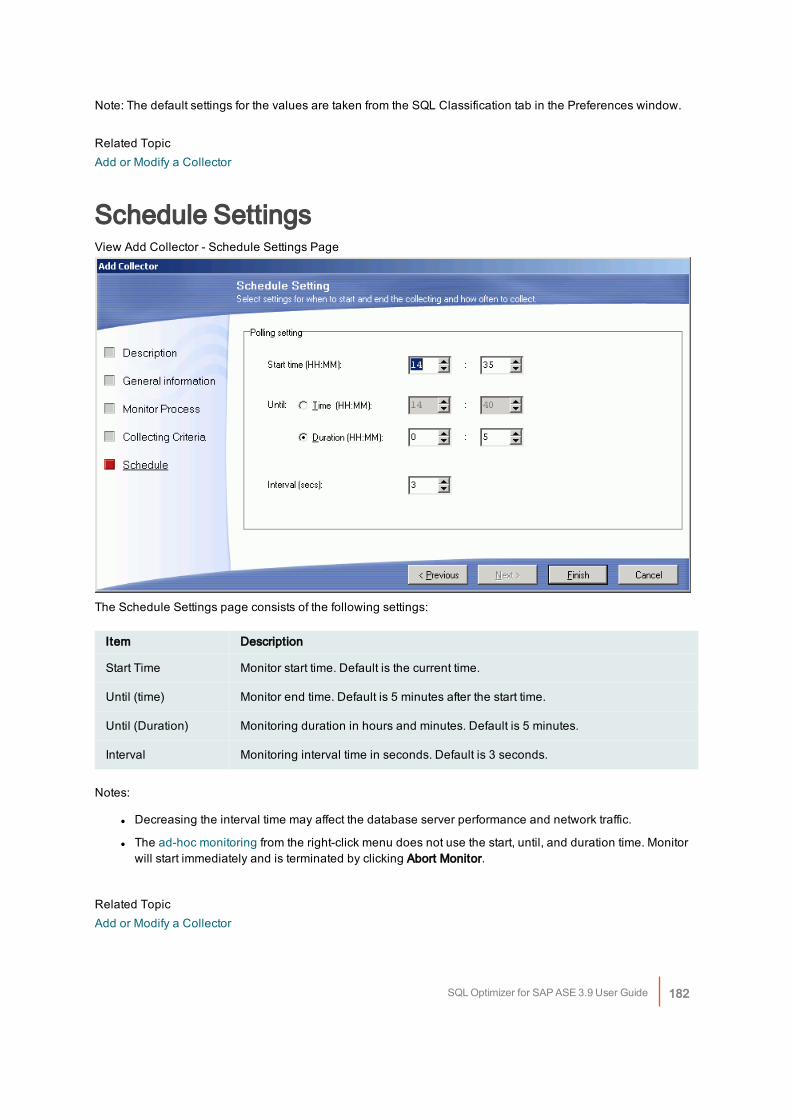
Note: The default settings for the values are taken from the SQL Classification tab in the Preferences window.
Related TopicAdd or Modify a Collector
Schedule SettingsView Add Collector - Schedule Settings Page
The Schedule Settings page consists of the following settings:
Item Description
Start Time Monitor start time. Default is the current time.
Until (time) Monitor end time. Default is 5 minutes after the start time.
Until (Duration) Monitoring duration in hours and minutes. Default is 5 minutes.
Interval Monitoring interval time in seconds. Default is 3 seconds.
Notes:
l Decreasing the interval time may affect the database server performance and network traffic.
l The ad-hoc monitoring from the right-click menu does not use the start, until, and duration time. Monitorwill start immediately and is terminated by clicking Abort Monitor.
Related TopicAdd or Modify a Collector
SQL Optimizer for SAP ASE 3.9 User Guide 182
Query PlanSQL statements captured in the SQL Collector for Monitor Server modules are displayed with correspondingquery plan using the sp_showplan stored procedure. If the query plan is not available, then the Query Plan panewindow remains blank and the SQL is classified as SQL without PlanNote: It is not guarantee that using the sp_showplan stored procedure to retrieve the query plan will obtain aquery plan that corresponds to the SQL statement.
Related TopicSQL Collector Window
Monitored SQL Statement TypesSQL statements captured in the SQL Collector for Monitor Server are classified as Problematic, Complex,Simple, or SQL without Plan. The classification settings are found on the SQL Collecting Criteria of the AddCollector wizard.
Problematic SQLProblematic SQL statements are potentially problem SQL statements that should be optimized. Problematic SQLmust satisfy one of the following criteria:
l The number of tables referenced in the query plan exceeds the upper limit of the Complex SQLTable Range.
l SQL statements with a full table scan if With Full Table Scan option is selected.
l SQL statements with the number of worktables greater than or equal to the value defined in the Withnumber of worktables greater than or equal to option.
l SQL statements whose number of reformattings is greater than or equal to the value defined in the Withnumber of Reformattings greater than or equal to option.
Complex SQLComplex SQL statements are complicated SQL statements where there is room for improvement. Complex SQLmust satisfy one of the following criteria:
l The number of tables referenced in the query plan falls into the Complex SQL Table Range.
l SQL statements with full index scan if With Full Index Scan selected.
SQL Optimizer for SAP ASE 3.9 User Guide 183
Simple SQLSimple SQL statements are direct and straight forward SQL statements with minimal probability of improvement.Simple SQL are SQL statements with the number of tables referenced in the query plan less than the lower limitof the Complex SQL Table Range.
SQL without PlanSQL statements for which the query plan cannot be retrieved using sp_showplan stored procedure.For SQL statements without Plan you can use the SQL Scanner module to scan the Collector and obtain a queryplan for all the captured SQL statements.Note: The parameter settings for Problematic, Complex, and Simple SQL statements may be different betweenSQL Collector for Monitor Server and SQL Scanner modules. The settings for the SQL Classification for the SQLCollector for Monitor Server are set in the Add/Modify Collector window and settings for the SQL Classificationfor the SQL Scanner are set in the Preferences window.
Related TopicsSQL Collector for Monitor Server OverviewSQL Collector WindowQuery Plan
MonitorFor the Monitor function to be enabled, you must first mark the Collector you want to monitor in the SQLCollector window. To mark a Collector, simply click the row you want to monitor.
To start monitoring
Click .Warning: If you have already monitored the Collector, re-monitoring erases your existing information.If the start time of the Collector has not been reached, SQL Collector for Monitor Server will wait until it is time tobegin. During and after monitoring, information acquired is updated in the SQL Collector window.The SQL Collector window must remain open during the monitoring process. If you have started the monitoringprocess, but the scheduled time has not arrived, this window must remain open for the monitoring process tostart and run to completion.Monitor is terminated automatically once the end time is reached.At the end of the monitoring process, duplicated SQL statements are eliminated. This may take a few minutesto complete.Note: The ad-hoc monitoring from the right-click menu does not use the start, until, and duration time. The ad-hoc monitoring starts immediately and is only terminated by clicking Abort Monitor.
Related TopicsAd-hoc Monitoring
SQL Optimizer for SAP ASE 3.9 User Guide 184
Abort MonitorSQL Collector for Monitor Server OverviewSQL Collector Window
Ad-hoc MonitorAd-hoc monitoring allows you to analyze the SQL statements currently running without taking consideration ofstart, until, and duration time.
To start ad-hoc monitoring
1. Mark an existing Collector
2. Right-click and select Ad-hoc Monitor to start monitoring.
To stop ad-hoc monitoring
Click .Warning: If you have already monitored the Collector, ad-hoc monitoring erases any existing information.
Related TopicsMonitorSQL Collector for Monitor Server OverviewSQL Collector Window
Abort MonitorTo abort the monitoring process
Click .Note: Duplicated SQL statements are eliminated. This may take a few minutes to complete.
Related TopicsMonitorAd-hoc MonitoringSQL Collector for Monitor Server OverviewSQL Collector Window
SQL Optimizer for SAP ASE 3.9 User Guide 185
Why use the SQL Scanner to IdentifyProblematic SQL StatementsThe SQL Collector for Monitor Server offers you a way of identifying problematic SQL statements by analyzingthe query plan retrieved using the sp_showplan procedure. However, Adaptive Server does not guarantee thatthe query plan retrieved from sp_showplan corresponds to the SQL statement. Therefore, it is recommendedthat you use the SQL Scanner to retrieve the query plan and identify which ones are problematic.Note: The settings for the SQL classification for Problematic, Complex and Simple SQL statements may differbetween SQL Collector for Monitor Server module and SQL Scanner module. The settings for the SQL Collectorfor Monitor Server module are found SQL Collecting Criteria tab in the Add Collector window. The settings forthe SQL Scanner are found SQL Classification tab in the Preferences window.
Related TopicsSQL Scanner OverviewScan CollectorsSQL Collector for Monitor Server Overview
Scan CollectorsThe SQL statements captured by the SQL Collector for Monitor Server can be scanned in the SQLScanner to classify the SQL statements to help identify which SQL statements are likely to be causingperformance problems.
To scan a Collector from the SQL Collector window
1. Mark a Collector by clicking the Collector row. A green checkmark is prefixed to the Collector Namecolumn to indicate that the Collector is marked.
2. Right-click and select Scan.
Related TopicsWhy use the SQL Scanner to Identify Problematic SQL StatementsSQL Collector for Monitor Server OverviewSQL Collector Window
Place Bookmarks in SQL CollectorBookmarks are used to mark a Collector in the SQL Collector window to indicate such things as:
SQL Optimizer for SAP ASE 3.9 User Guide 186
l You are currently working on a Collector.
l You have finished reviewing a Collector.
l You have determined the critical Collectors to be reviewed first.
If the row contains a bookmark, the complete row text will be displayed in fuchsia color. You can havemultiple bookmarks.
To place or remove a bookmarkRight-click and select Add/Remove Bookmark on the selected row.
Related TopicsSQL Collector for Monitor Server OverviewSQL Collector Window
View Particular Types of SQL StatementAfter the SQL statements are captured, all the SQL statements found in the selected Collector are displayed.However, you can restrict the SQL statements shown by selecting the type of SQL statement by selecting themenu items available under the View menu. The SQL Collector window's title bar displays your chosen option.You can view one or more types of SQL statement by selecting or clearing the menu items.
To display the simple SQL statementsSelect View | Simple SQL.
To display the complex SQL statementsSelect View | Complex SQL.
To display the problematic SQL statementsSelect View | Problematic SQL.
To display the SQL statements without a query planSelect View | SQL without Plan.
To display all SQL statementsSelect View | All SQL.
Related TopicsSQL Collector for Monitor Server OverviewSQL Collector Window
SQL Optimizer for SAP ASE 3.9 User Guide 187
Find Specific Information in CollectorsFrom the SQL Collector window, you can search for SQL statements in Collectors that have specific text in theSQL text, the query plan, and/or a certain SQL classification.
To open the Find Collectors windowSelect Collector | Find Collector.The Find Collector window has two tabs to specify what text to search for. If you select multiple items, thesearch is combined as an AND search so that it searches for SQL statements that include all the selecteditems. After you have selected the search criteria, click Find to search for the SQL statements which containsall search criteria.
Find Tab
Text to findl Under the Find tab, specify the text to search for in the SQL text.
l SQL
l Specify the text to search for in the SQL text.
Optionsl Case sensitive
l Specify whether to search for the text in exact case that you enter it.
l Whole word only
l Specify whether to search for words only.
Advanced Tab
Text to findl Under the Advanced tab, specify the text to search for in the SQL Information Pane.
l Query plan
l Specify the text to search for in the query plan.
l Abstract plan
l Specify the text to search for in the abstract plan.
l Trace On Information
l Specify the text to search for in the dbcc trace on information.
SQL Optimizer for SAP ASE 3.9 User Guide 188
l Information
l Specify the text to search for in the SQL classification Monitored SQL information.
TypeCheck the SQL Classification type defined for the Collector.
Search ResultsThe search results are displayed at the bottom of the Find Collectors window. It displays the Collector name andthe SQL name for the SQL statements which contain the search criteria.
Related TopicsFind SQL StatementSQL Collector for Monitor Server OverviewSQL Collector Window
Find SQL StatementThe Find SQL function is available in the SQL Collector window. It locates the SQL statements that contain aspecified word for a particular Collector taking into account the View criteria.
To find a text string
1. Select SQL | Find SQL.
2. Enter the text you want to search for.
3. Click Find.
To continue searching for the same text stringSelect SQL | Find Next SQL [Ctrl + F3].
Related TopicsFind Specific Information in CollectorsSQL Collector for Monitor Server OverviewSQL Collector Window
Generate a Report for Monitored SQLStatementsView Monitored SQL Report Criteria Window
SQL Optimizer for SAP ASE 3.9 User Guide 189
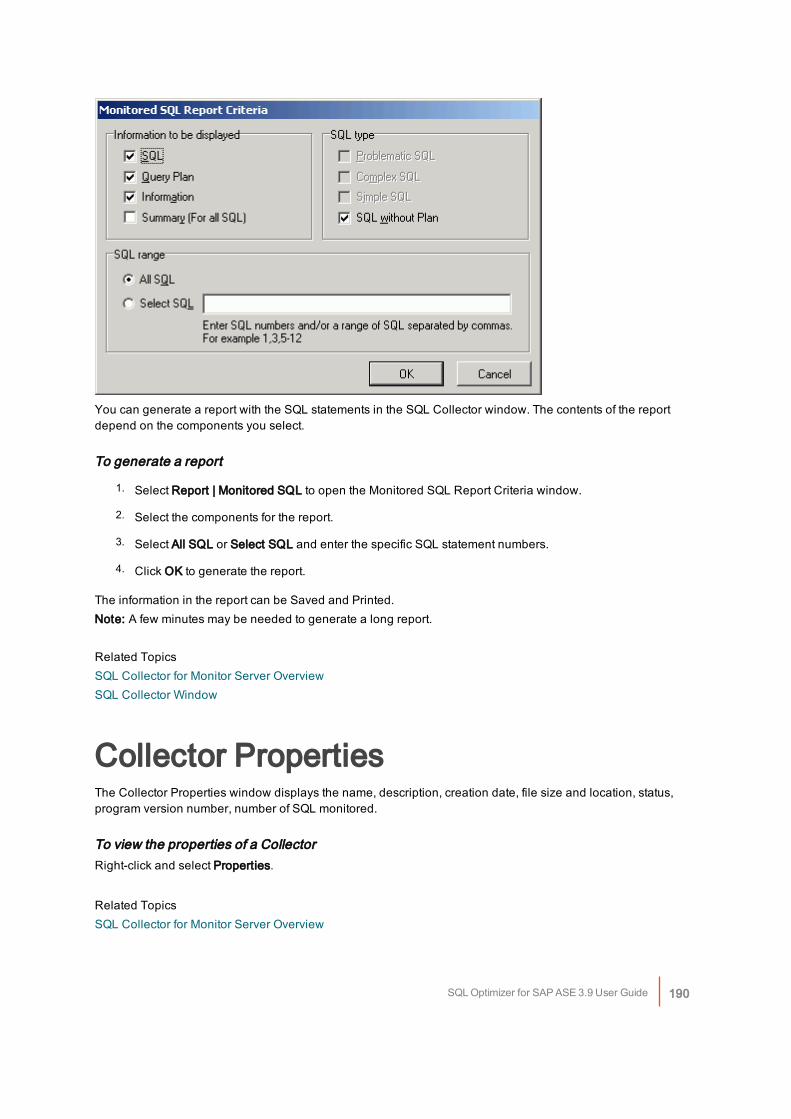
You can generate a report with the SQL statements in the SQL Collector window. The contents of the reportdepend on the components you select.
To generate a report
1. Select Report | Monitored SQL to open the Monitored SQL Report Criteria window.
2. Select the components for the report.
3. Select All SQL or Select SQL and enter the specific SQL statement numbers.
4. Click OK to generate the report.
The information in the report can be Saved and Printed.Note: A few minutes may be needed to generate a long report.
Related TopicsSQL Collector for Monitor Server OverviewSQL Collector Window
Collector PropertiesThe Collector Properties window displays the name, description, creation date, file size and location, status,program version number, number of SQL monitored.
To view the properties of a CollectorRight-click and select Properties.
Related TopicsSQL Collector for Monitor Server Overview
SQL Optimizer for SAP ASE 3.9 User Guide 190
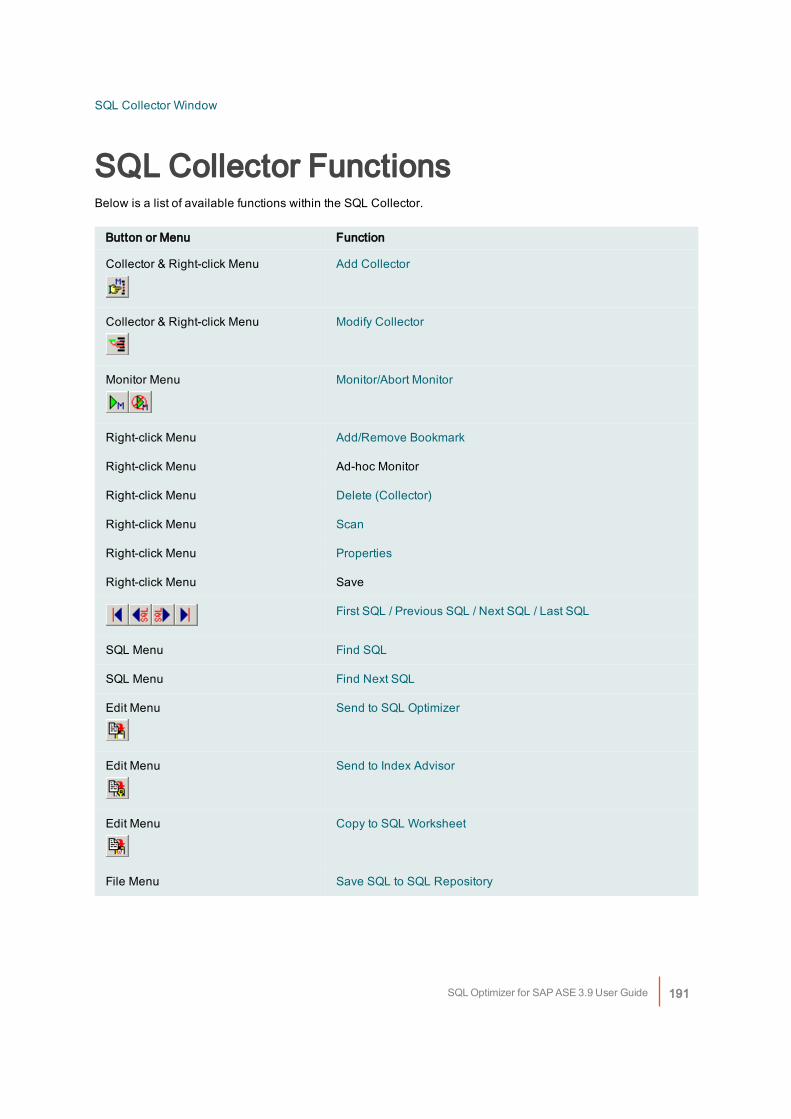
SQL Collector Window
SQL Collector FunctionsBelow is a list of available functions within the SQL Collector.
Button or Menu Function
Collector & Right-click Menu Add Collector
Collector & Right-click Menu Modify Collector
Monitor Menu Monitor/Abort Monitor
Right-click Menu Add/Remove Bookmark
Right-click Menu Ad-hoc Monitor
Right-click Menu Delete (Collector)
Right-click Menu Scan
Right-click Menu Properties
Right-click Menu Save
First SQL / Previous SQL / Next SQL / Last SQL
SQL Menu Find SQL
SQL Menu Find Next SQL
Edit Menu Send to SQL Optimizer
Edit Menu Send to Index Advisor
Edit Menu Copy to SQL Worksheet
File Menu Save SQL to SQL Repository
SQL Optimizer for SAP ASE 3.9 User Guide 191
View Menu All SQL
View Menu Simple SQL
View Menu Complex SQL
View Menu Problematic SQL
View Menu SQL without Plan
Report Menu Monitored SQL
Related TopicsSQL Collector for Monitor Server OverviewSQL Collector Window
SQL Scanner OverviewThe SQL Scanner is a unique module which extracts SQL statements embedded in applications, databaseobjects or files without any execution of programs. It retrieves and analyzes in batch the query plans for theextracted SQL to categorize the SQL statements according to the complexity of the query plan and suspectlevels of performance problems. The SQL Scanner allows you to quickly review SQL in existing code and detectpotential SQL performance problems. With this approach, the SQL Scanner allows you to be proactive in thedetection of performance problems. The task of extracting, reviewing and analyzing many SQL statements issimplified and automated with the SQL Scanner.Typically database applications contain thousands of SQL statements. Without the SQL Scanner, you have toextract and review each SQL statement manually. This a very tedious and time consuming task. Once theseSQL statements have been extracted, you need to manually analyze each SQL statement’s query plan to see ifthe query plan represents a potential performance problem. The SQL Scanner does this task for you.Once you have identified potentially problematic SQL statements you can send the SQL to the SQL Optimizer,Index Advisor, the SQL Worksheet, or save them to the SQL Repository.
Related TopicsSQL Scanner WindowGroup Manager WindowOpen SQL ScannerAdd Jobs to SQL ScannerScanScan Source Code with Temp TablesSQL Scanner FunctionsSQL Conversion Overview
SQL Optimizer for SAP ASE 3.9 User Guide 192
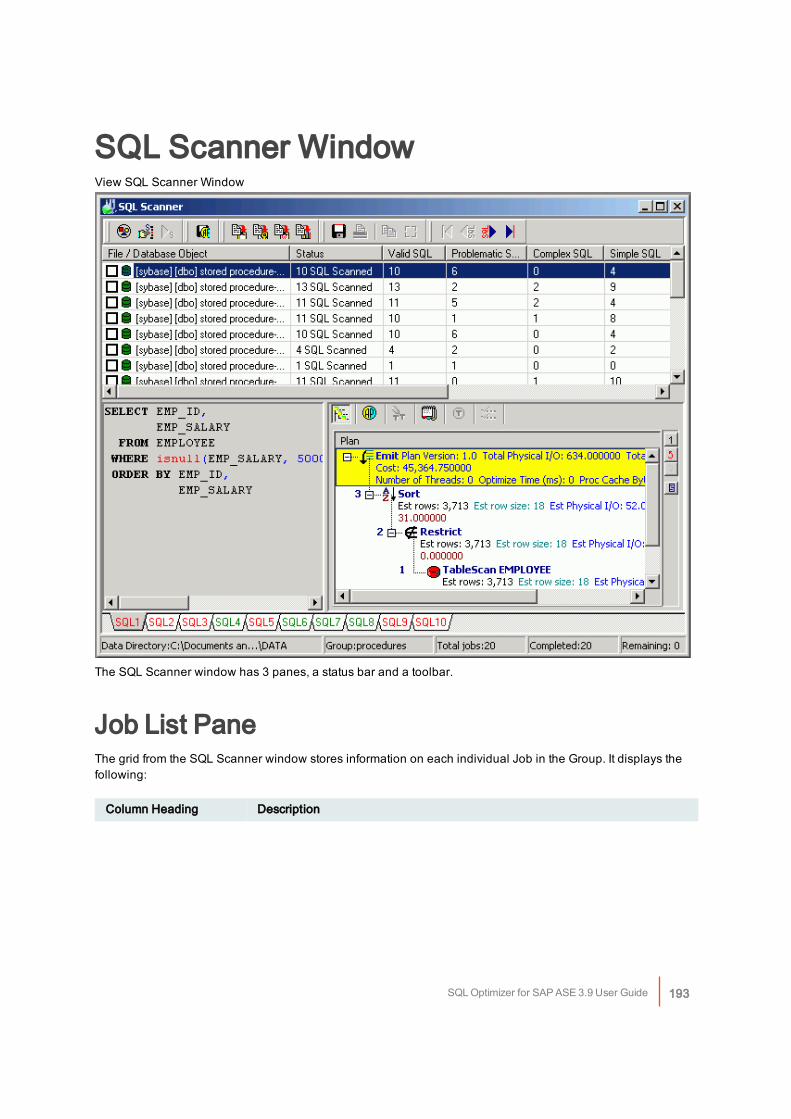
SQL Scanner WindowView SQL Scanner Window
The SQL Scanner window has 3 panes, a status bar and a toolbar.
Job List PaneThe grid from the SQL Scanner window stores information on each individual Job in the Group. It displays thefollowing:
Column Heading Description
SQL Optimizer for SAP ASE 3.9 User Guide 193
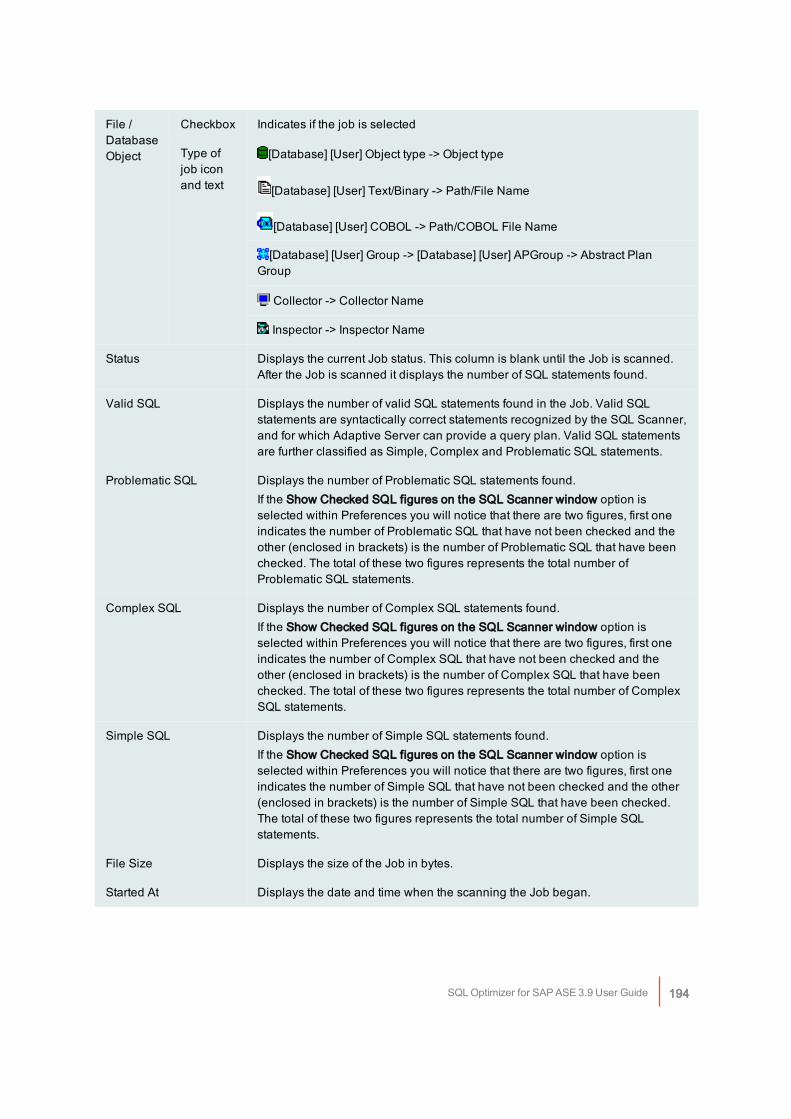
File /DatabaseObject
Checkbox Indicates if the job is selected
Type ofjob iconand text
[Database] [User] Object type -> Object type
[Database] [User] Text/Binary -> Path/File Name
[Database] [User] COBOL -> Path/COBOL File Name
[Database] [User] Group -> [Database] [User] APGroup -> Abstract PlanGroup
Collector -> Collector Name
Inspector -> Inspector Name
Status Displays the current Job status. This column is blank until the Job is scanned.After the Job is scanned it displays the number of SQL statements found.
Valid SQL Displays the number of valid SQL statements found in the Job. Valid SQLstatements are syntactically correct statements recognized by the SQL Scanner,and for which Adaptive Server can provide a query plan. Valid SQL statementsare further classified as Simple, Complex and Problematic SQL statements.
Problematic SQL Displays the number of Problematic SQL statements found.If the Show Checked SQL figures on the SQL Scanner window option isselected within Preferences you will notice that there are two figures, first oneindicates the number of Problematic SQL that have not been checked and theother (enclosed in brackets) is the number of Problematic SQL that have beenchecked. The total of these two figures represents the total number ofProblematic SQL statements.
Complex SQL Displays the number of Complex SQL statements found.If the Show Checked SQL figures on the SQL Scanner window option isselected within Preferences you will notice that there are two figures, first oneindicates the number of Complex SQL that have not been checked and theother (enclosed in brackets) is the number of Complex SQL that have beenchecked. The total of these two figures represents the total number of ComplexSQL statements.
Simple SQL Displays the number of Simple SQL statements found.If the Show Checked SQL figures on the SQL Scanner window option isselected within Preferences you will notice that there are two figures, first oneindicates the number of Simple SQL that have not been checked and the other(enclosed in brackets) is the number of Simple SQL that have been checked.The total of these two figures represents the total number of Simple SQLstatements.
File Size Displays the size of the Job in bytes.
Started At Displays the date and time when the scanning the Job began.
SQL Optimizer for SAP ASE 3.9 User Guide 194
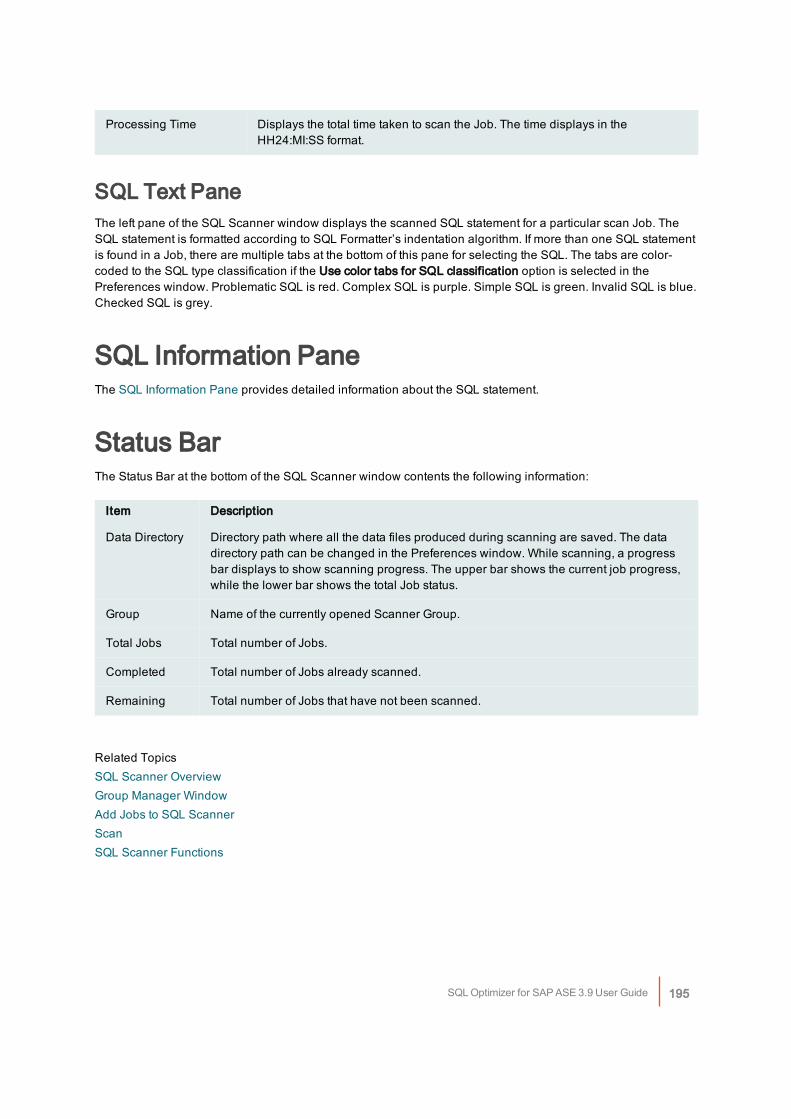
Processing Time Displays the total time taken to scan the Job. The time displays in theHH24:MI:SS format.
SQL Text Pane The left pane of the SQL Scanner window displays the scanned SQL statement for a particular scan Job. TheSQL statement is formatted according to SQL Formatter’s indentation algorithm. If more than one SQL statementis found in a Job, there are multiple tabs at the bottom of this pane for selecting the SQL. The tabs are color-coded to the SQL type classification if the Use color tabs for SQL classification option is selected in thePreferences window. Problematic SQL is red. Complex SQL is purple. Simple SQL is green. Invalid SQL is blue.Checked SQL is grey.
SQL Information PaneThe SQL Information Pane provides detailed information about the SQL statement.
Status BarThe Status Bar at the bottom of the SQL Scanner window contents the following information:
Item Description
Data Directory Directory path where all the data files produced during scanning are saved. The datadirectory path can be changed in the Preferences window. While scanning, a progressbar displays to show scanning progress. The upper bar shows the current job progress,while the lower bar shows the total Job status.
Group Name of the currently opened Scanner Group.
Total Jobs Total number of Jobs.
Completed Total number of Jobs already scanned.
Remaining Total number of Jobs that have not been scanned.
Related TopicsSQL Scanner OverviewGroup Manager WindowAdd Jobs to SQL ScannerScanSQL Scanner Functions
SQL Optimizer for SAP ASE 3.9 User Guide 195
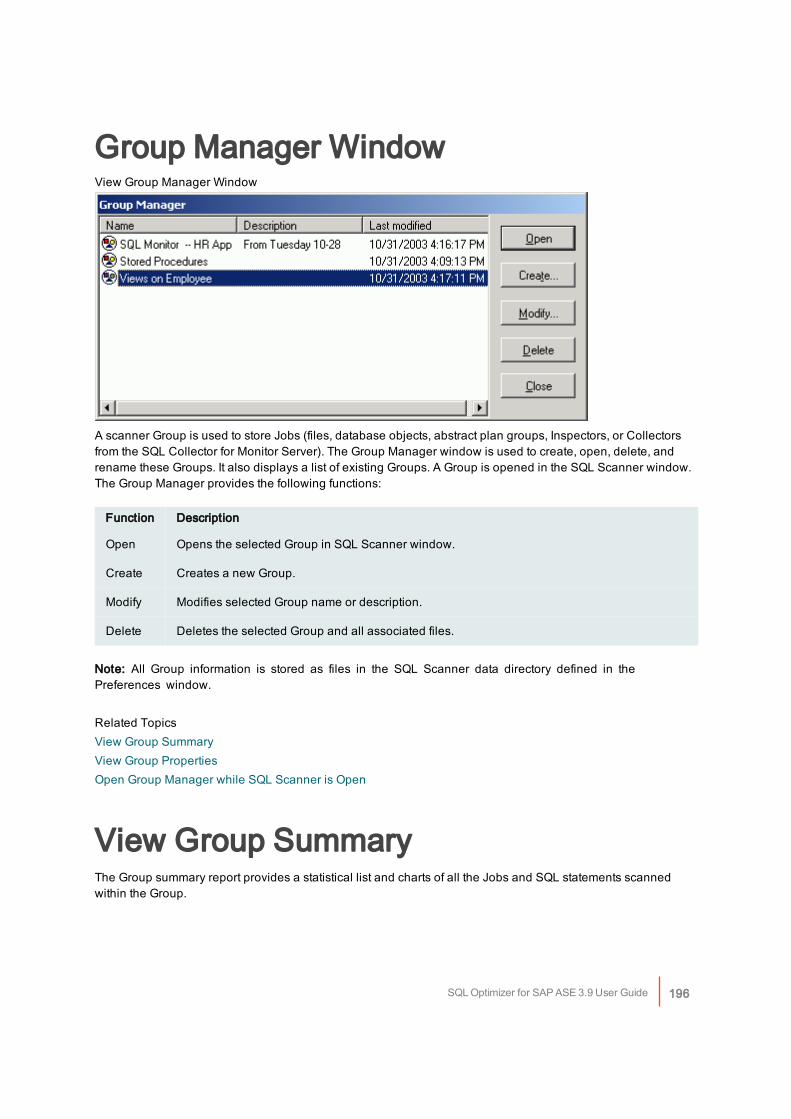
Group Manager WindowView Group Manager Window
A scanner Group is used to store Jobs (files, database objects, abstract plan groups, Inspectors, or Collectorsfrom the SQL Collector for Monitor Server). The Group Manager window is used to create, open, delete, andrename these Groups. It also displays a list of existing Groups. A Group is opened in the SQL Scanner window.The Group Manager provides the following functions:
Function Description
Open Opens the selected Group in SQL Scanner window.
Create Creates a new Group.
Modify Modifies selected Group name or description.
Delete Deletes the selected Group and all associated files.
Note: All Group information is stored as files in the SQL Scanner data directory defined in thePreferences window.
Related TopicsView Group SummaryView Group PropertiesOpen Group Manager while SQL Scanner is Open
View Group SummaryThe Group summary report provides a statistical list and charts of all the Jobs and SQL statements scannedwithin the Group.
SQL Optimizer for SAP ASE 3.9 User Guide 196
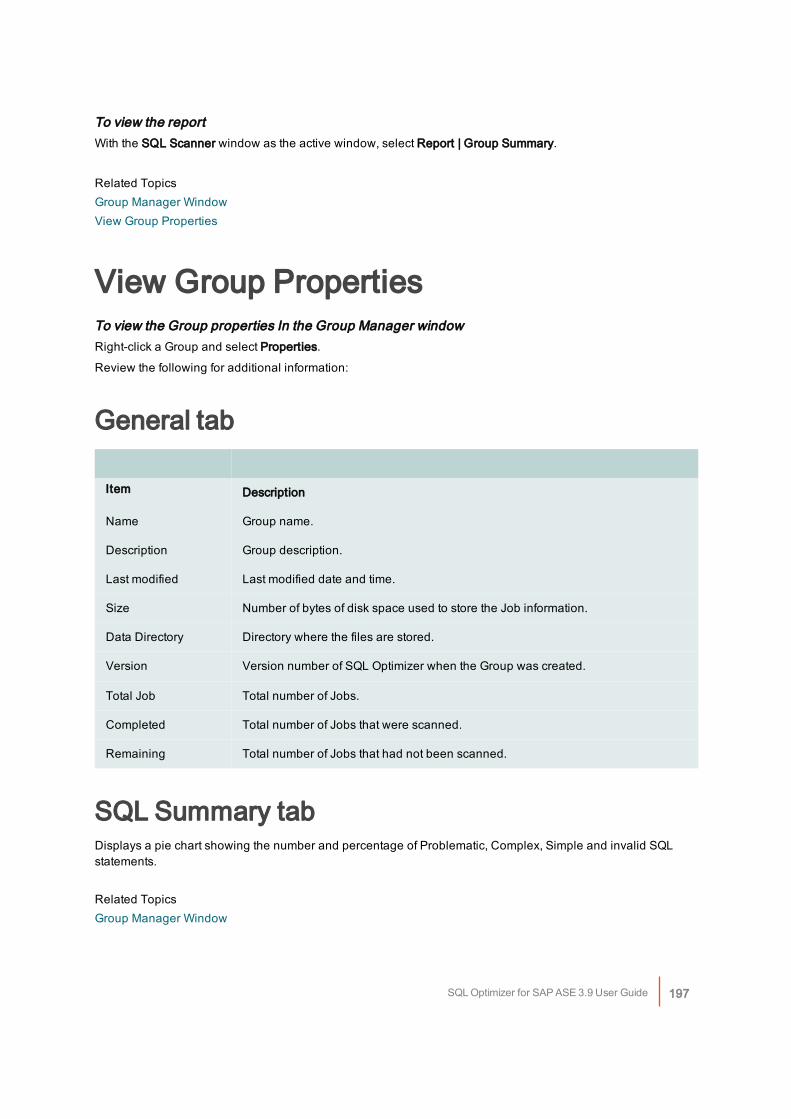
To view the reportWith the SQL Scanner window as the active window, select Report | Group Summary.
Related TopicsGroup Manager WindowView Group Properties
View Group PropertiesTo view the Group properties In the Group Manager windowRight-click a Group and select Properties.
Review the following for additional information:
General tab
Item Description
Name Group name.
Description Group description.
Last modified Last modified date and time.
Size Number of bytes of disk space used to store the Job information.
Data Directory Directory where the files are stored.
Version Version number of SQL Optimizer when the Group was created.
Total Job Total number of Jobs.
Completed Total number of Jobs that were scanned.
Remaining Total number of Jobs that had not been scanned.
SQL Summary tabDisplays a pie chart showing the number and percentage of Problematic, Complex, Simple and invalid SQLstatements.
Related TopicsGroup Manager Window
SQL Optimizer for SAP ASE 3.9 User Guide 197
View Group Summary
Embedded and Dynamic SQLStatementsGenerally speaking, there are two types of SQL statements found in source code.
Embedded SQL StatementsEmbedded SQL statements refer to SQL statements that are placed within the source programs and areconstructed at compilation time.
Dynamic SQL StatementsDynamic SQL statements are SQL statements constructed at run time.
Related TopicSQL Scanner Overview
What files does SQL Scanner scan?The SQL Scanner extracts SQL statements from the following:
Database ObjectsDatabase objects with embedded SQL statements. This includes: stored procedures, triggers, views, rules anddefaults. Depending on your database privileges, the available database objects can be selected by objectname, object type, or user name.
Abstract Plan GroupsSQL statements saved in abstract plans.
SQL Collector for Monitor Server FilesSQL statements captured in the SQL Collector for Monitor Server module during execution.
SQL Optimizer for SAP ASE 3.9 User Guide 198
SQL Inspector FilesSQL statements retrieved in the SQL Inspector module from the Adaptive Server monitoring tables.
Text/Binary FilesText and binary files that contain embedded SQL statements.
COBOL FilesCOBOL source code that contain embedded SQL statements.Note: If your SQL statements are dynamic SQL statement generated on the fly or at run time, you can use theSQL Collector for Monitor Server to capture the SQL statements. Then the SQL Scanner can be used to analyzethe captured SQL statements.
Related TopicsSQL Scanner OverviewAdd Jobs to SQL Scanner
Data Directory SettingThe SQL Scanner data directory is used to store the data files created while executing the Scan function. Thedata directory path is stored in the Preferences window.
To change the data directory
1. Click .
2. Select the Directory Setup tab.
The default setting for this directory is:C:\Documents and Settings\User\Application Data\Quest Software\SQL Optimizer\DATAChanges to this directory cannot be made while the SQL Scanner is active.Note: It is advisable not to change the data directory after selection, as files created during scanning are kept inthis directory.
Related TopicSQL Scanner Overview
SQL Optimizer for SAP ASE 3.9 User Guide 199
Open SQL ScannerTo open the SQL Scanner
1. Click .
2. After creating a new Group or selecting an existing Group, click Open.
The SQL Scanner window displays after opening the working Group. If it is an empty group, the Add Jobs wizardalso displays.
Related TopicsSQL Scanner OverviewSQL Scanner Window
Add Jobs to SQL ScannerThe Add Jobs wizard enables you to select the database objects, abstract plan groups, Inspectors from theSQL Inspector, Collectors from the SQL Collector for Monitor Server module, SQL Inspector files, andapplication source or binary files that you want to scan. The Summary page enables you to control the userand database used.
To add Jobs to the SQL Scanner window
Click to display the Add Jobs wizard. The Add Jobs wizard displays automatically when the SQL Scannerwindow is opened if no Job exists in the SQL Scanner window.
Add OptionsThe following pages are for selecting which database objects, abstract plan groups, or files to scan.Database ObjectsAbstract Plan GroupSQL Collectors from the SQL Collector for Monitor ServerSQL InspectorsSource Code
Summary OptionsThe summary page is for selecting to scan the jobs with the current database and user.Use Current DB & UserWhen you have selected a large number of database objects, it may take a long to insert all of them into the SQLScanner window. If you click Abort, the objects and files that have already been inserted to the SQL Scannerwindow remain in the window.
SQL Optimizer for SAP ASE 3.9 User Guide 200
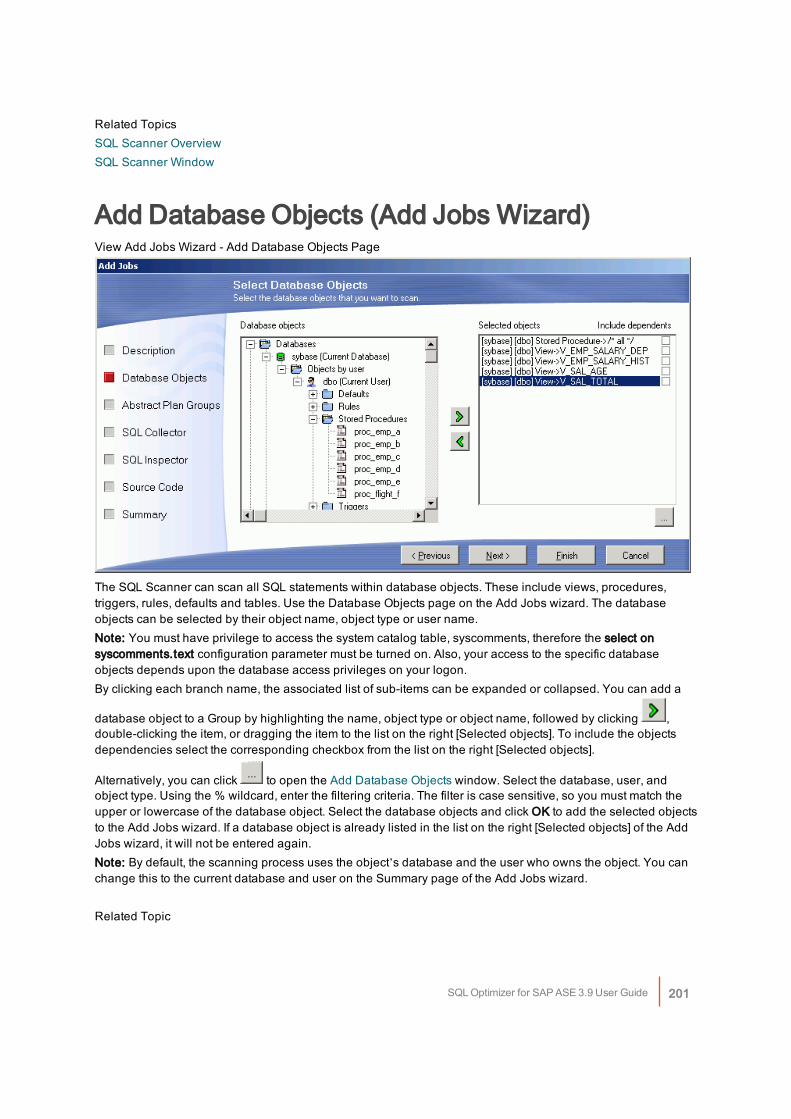
Related TopicsSQL Scanner OverviewSQL Scanner Window
Add Database Objects (Add Jobs Wizard)View Add Jobs Wizard - Add Database Objects Page
The SQL Scanner can scan all SQL statements within database objects. These include views, procedures,triggers, rules, defaults and tables. Use the Database Objects page on the Add Jobs wizard. The databaseobjects can be selected by their object name, object type or user name.Note: You must have privilege to access the system catalog table, syscomments, therefore the select onsyscomments.text configuration parameter must be turned on. Also, your access to the specific databaseobjects depends upon the database access privileges on your logon.By clicking each branch name, the associated list of sub-items can be expanded or collapsed. You can add a
database object to a Group by highlighting the name, object type or object name, followed by clicking ,double-clicking the item, or dragging the item to the list on the right [Selected objects]. To include the objectsdependencies select the corresponding checkbox from the list on the right [Selected objects].
Alternatively, you can click to open the Add Database Objects window. Select the database, user, andobject type. Using the % wildcard, enter the filtering criteria. The filter is case sensitive, so you must match theupper or lowercase of the database object. Select the database objects and click OK to add the selected objectsto the Add Jobs wizard. If a database object is already listed in the list on the right [Selected objects] of the AddJobs wizard, it will not be entered again.Note: By default, the scanning process uses the object’s database and the user who owns the object. You canchange this to the current database and user on the Summary page of the Add Jobs wizard.
Related Topic
SQL Optimizer for SAP ASE 3.9 User Guide 201
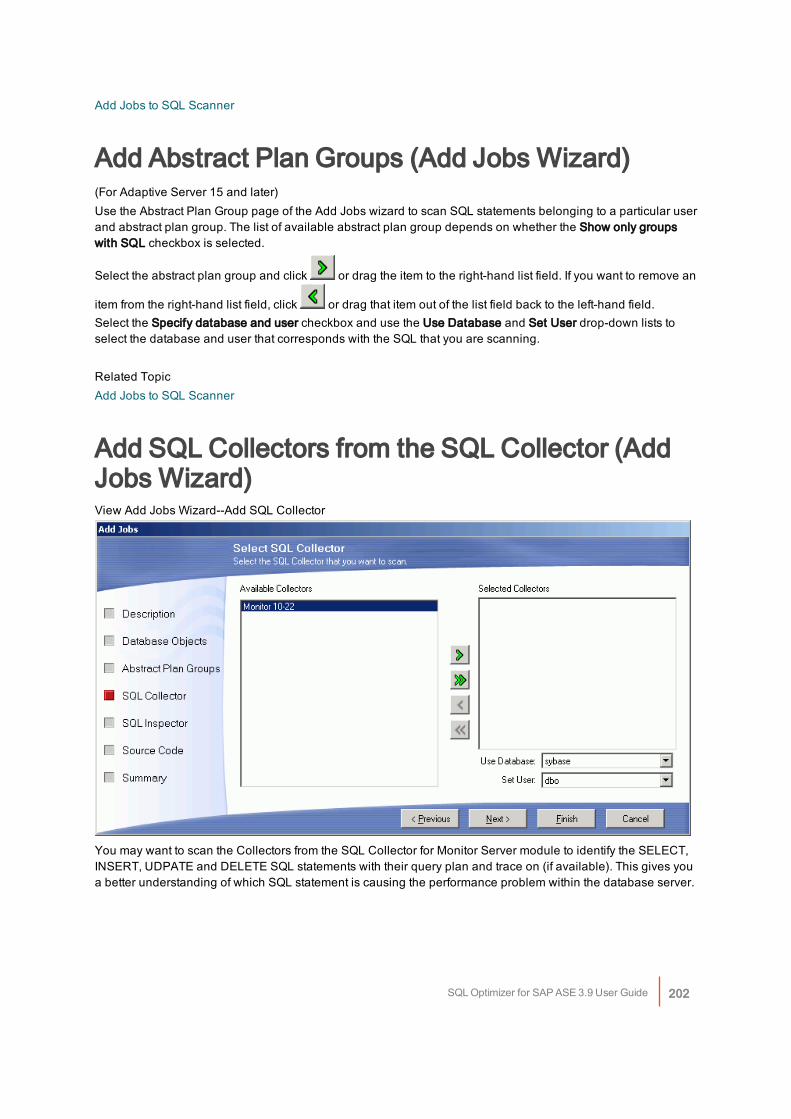
Add Jobs to SQL Scanner
Add Abstract Plan Groups (Add Jobs Wizard)(For Adaptive Server 15 and later)Use the Abstract Plan Group page of the Add Jobs wizard to scan SQL statements belonging to a particular userand abstract plan group. The list of available abstract plan group depends on whether the Show only groupswith SQL checkbox is selected.
Select the abstract plan group and click or drag the item to the right-hand list field. If you want to remove an
item from the right-hand list field, click or drag that item out of the list field back to the left-hand field.Select the Specify database and user checkbox and use the Use Database and Set User drop-down lists toselect the database and user that corresponds with the SQL that you are scanning.
Related TopicAdd Jobs to SQL Scanner
Add SQL Collectors from the SQL Collector (AddJobs Wizard)View Add Jobs Wizard--Add SQL Collector
You may want to scan the Collectors from the SQL Collector for Monitor Server module to identify the SELECT,INSERT, UDPATE and DELETE SQL statements with their query plan and trace on (if available). This gives youa better understanding of which SQL statement is causing the performance problem within the database server.
SQL Optimizer for SAP ASE 3.9 User Guide 202
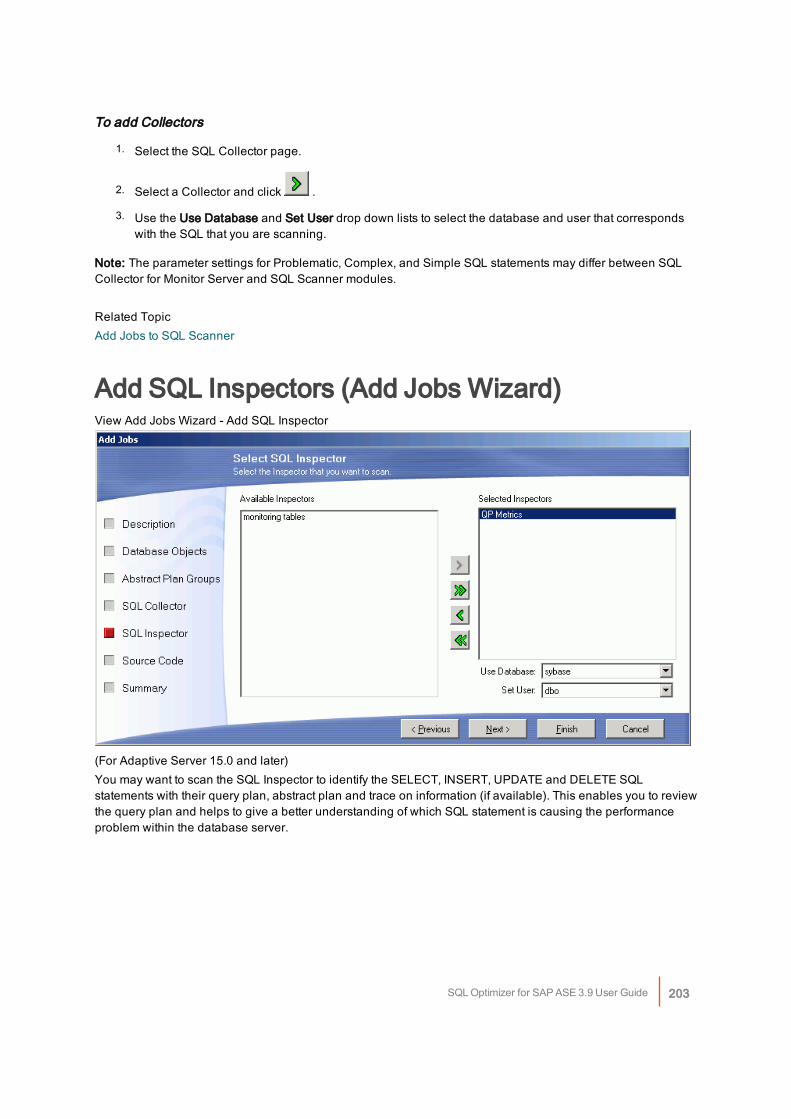
To add Collectors
1. Select the SQL Collector page.
2. Select a Collector and click .
3. Use the Use Database and Set User drop down lists to select the database and user that correspondswith the SQL that you are scanning.
Note: The parameter settings for Problematic, Complex, and Simple SQL statements may differ between SQLCollector for Monitor Server and SQL Scanner modules.
Related TopicAdd Jobs to SQL Scanner
Add SQL Inspectors (Add Jobs Wizard)View Add Jobs Wizard - Add SQL Inspector
(For Adaptive Server 15.0 and later)You may want to scan the SQL Inspector to identify the SELECT, INSERT, UPDATE and DELETE SQLstatements with their query plan, abstract plan and trace on information (if available). This enables you to reviewthe query plan and helps to give a better understanding of which SQL statement is causing the performanceproblem within the database server.
SQL Optimizer for SAP ASE 3.9 User Guide 203
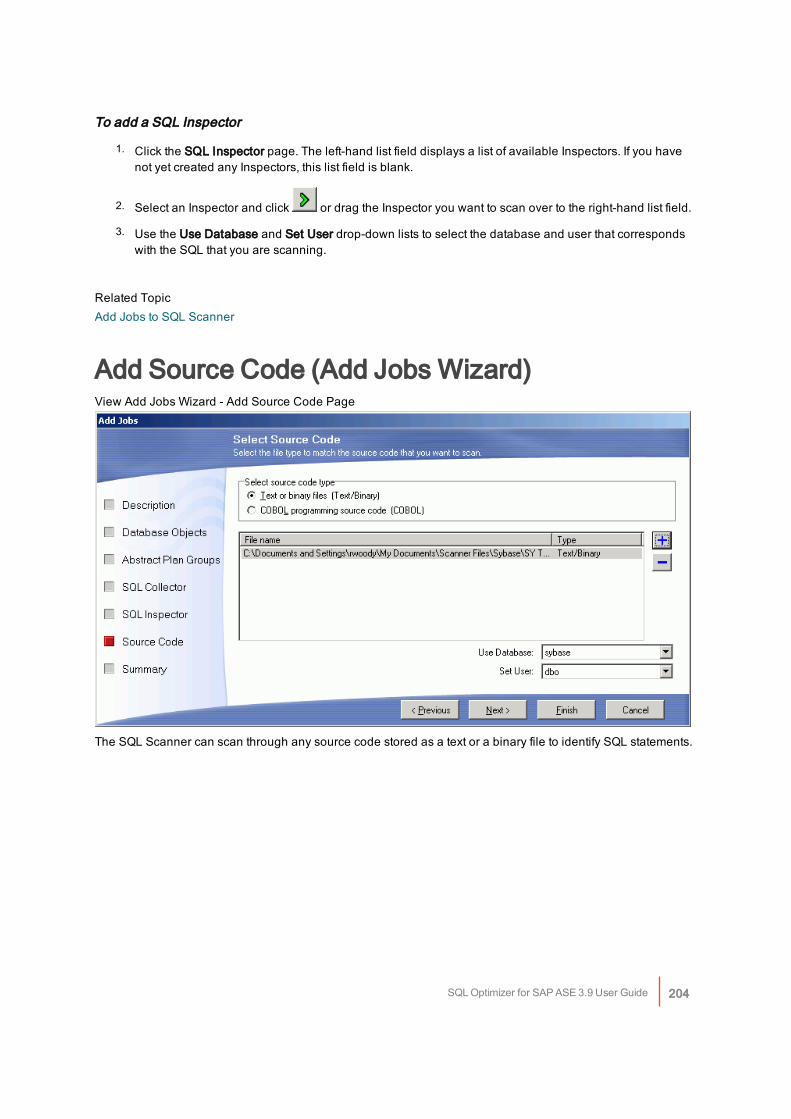
To add a SQL Inspector
1. Click the SQL Inspector page. The left-hand list field displays a list of available Inspectors. If you havenot yet created any Inspectors, this list field is blank.
2. Select an Inspector and click or drag the Inspector you want to scan over to the right-hand list field.
3. Use the Use Database and Set User drop-down lists to select the database and user that correspondswith the SQL that you are scanning.
Related TopicAdd Jobs to SQL Scanner
Add Source Code (Add Jobs Wizard)View Add Jobs Wizard - Add Source Code Page
The SQL Scanner can scan through any source code stored as a text or a binary file to identify SQL statements.
SQL Optimizer for SAP ASE 3.9 User Guide 204
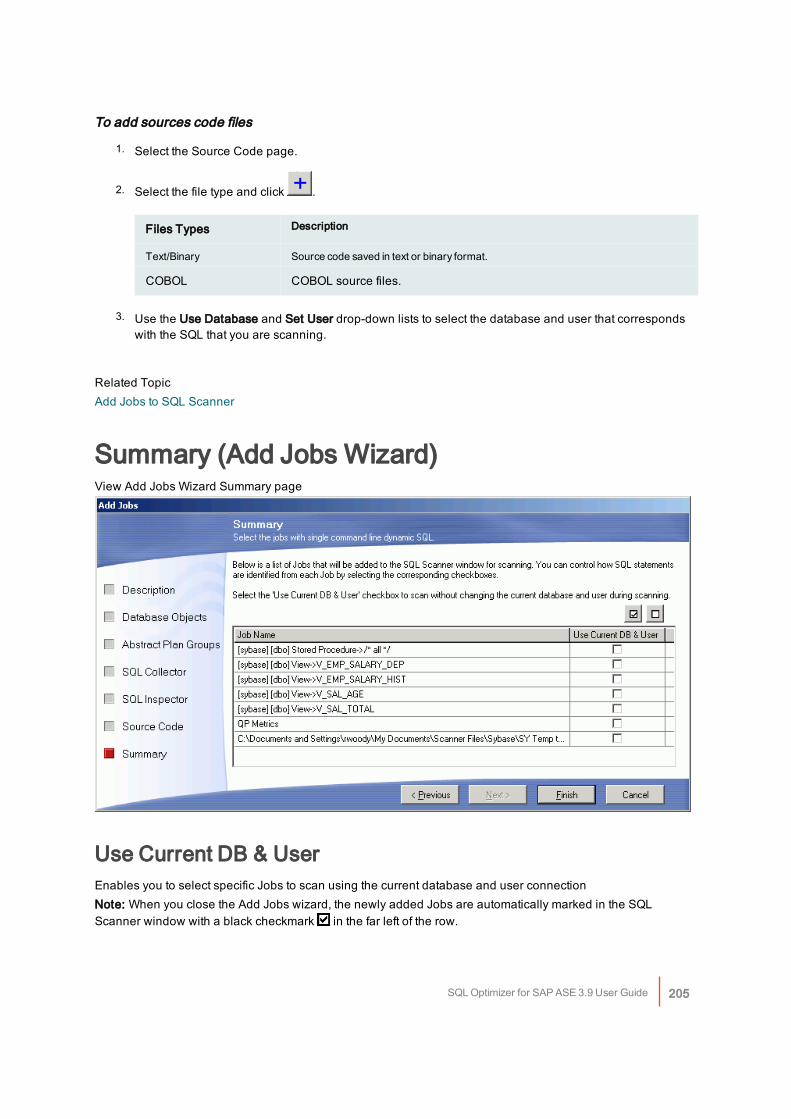
To add sources code files
1. Select the Source Code page.
2. Select the file type and click .
Files Types Description
Text/Binary Source code saved in text or binary format.
COBOL COBOL source files.
3. Use the Use Database and Set User drop-down lists to select the database and user that correspondswith the SQL that you are scanning.
Related TopicAdd Jobs to SQL Scanner
Summary (Add Jobs Wizard)View Add Jobs Wizard Summary page
Use Current DB & UserEnables you to select specific Jobs to scan using the current database and user connectionNote: When you close the Add Jobs wizard, the newly added Jobs are automatically marked in the SQLScanner window with a black checkmark in the far left of the row.
SQL Optimizer for SAP ASE 3.9 User Guide 205
Related TopicAdd Jobs to SQL Scanner
ScanTo prepare a Job for scanningMark the Job on the SQL Scanner window by clicking the row to be scanned. The black checkmark prefixesthe File / Database Object column. Multiple Jobs can be marked.
To start scanning
Click .During scanning, information is updated on the SQL Scanner window. The time required to scan a Job dependson the processor speed of your computer, the file size, the number of valid and invalid SQL statementsidentified, and the time it takes to retrieve the query plan for each SQL statement.
To abort the scan
Click .
Related TopicsScan Source Code with Temp TablesSQL Scanner OverviewSQL Scanner Window
Scan Source Code with Temp TablesDuring scanning, if the scanned SQL statement is used to create or modify a temp table these SQL statementsare automatically executed if the Create Scanner Temp Table option in the Preferences is selected. Thecreated Scanner Temp Tables are dropped after the Job finishes scanning.For example:
Source Codeselect EMP_ID,
EMP_NAME
into #a
from EMPLOYEE
select *
from #a
SQL Optimizer for SAP ASE 3.9 User Guide 206
After scanning
SQL1select EMP_ID,
EMP_NAME
into #a
from EMPLOYEE
SQL2select *
from #2
The DDL for creating the temporary tables displays under Scanner Temp Table in the bottom pane. Thisincludes the DDL found by the SQL Scanner or the DDL used to create the User-Defined Temp Table.select EMP_ID,
EMP_NAME
into #a
from EMPLOYEE
Related TopicsScanSQL Scanner OverviewSQL Scanner Window
Review Scanned SQLThe SQL Text pane and the SQL Information pane in SQL Scanner window enables the viewing and analysisof the SQL statements scanned. The following information is provided:
l Formatted scanned SQL statement
l Query plan
l Abstract plan
l Trace on
l SQL Information
o SQL statement type classification: Problematic, Complex, Simple, or Invalid.
o Database error message if SQL is classified as Invalid.
SQL Optimizer for SAP ASE 3.9 User Guide 207
o Information about any SQL conversion the SQL Scanner applied to the SQL statement inorder for it to generate a query plan.
o Line and column where the SQL statement was found in the source (for database objectand source code files only)
l SQL statement used to create and populate any temporary tables the SQL Scanner created
l Checked SQL Information (if the SQL has been marked as checked)
o Date time of when the SQL statement was checked
o Name of who checked the SQL
o Status
o Checked description are displayed
Note: When the SQL Scanner finds a SQL statement that contains a variable, it will assign the BINARY datatype to the variable as it retrieves the execution plan.
To assign a different data type to the variable
1. Copy the SQL statement to the SQL Editor pane in the SQL Optimizer window.
2. Click Show Plan .
3. Select the data type from the Parameters window which automatically displays when you have avariable in a SQL statement.
4. Click OK.
Related TopicSQL Scanner Window
Find JobsIn the SQL Scanner window, you can find a contain that contains a specific text string,
To search for a text string in all Jobs
1. Select Job | Find Job.
2. Enter the text to be located.
3. Click Find.
All Jobs and SQL number that satisfy the search criteria are listed.
Related TopicSQL Scanner Window
SQL Optimizer for SAP ASE 3.9 User Guide 208
Find SQL Using a Text StringThe Find SQL function is available in the SQL Scanner window. This enables the location of SQL statementsthat contain a specified text string within a particular Job taking the View criteria into account.
To find SQL with specific text
1. Select SQL | Find SQL to open the Find SQL window.
2. Enter the text string to be found.
3. Click Find.
To continue searching for the same textSelect SQL | Find Next SQL [Ctrl + F3].
Related TopicSQL Scanner Window
View Job PropertiesTo view the Job properties in the SQL Scanner windowRight-click the Job and select Properties.
Review the following for additional information:
General tabItem Description
Name Job name.
Type Type of Job scanned (text/binary file, COBOL file, abstract plan group,Collectors from SQL Collector for Monitor Server, SQL Inspector file, databaseobject).
Description Job description.
Last modified Last modified date and time.
Size The amount of disk space required to store the job.
Data Directory Directory where the SQL Scanner files are stored.
Status Job status.
SQL Optimizer for SAP ASE 3.9 User Guide 209
Version Version number of SQL Optimizer when the Job was last scanned.
SQL Summary tabDisplays a pie chart showing the number and percentage of Problematic, Complex, Simple and invalid SQLstatements.
Related TopicsSQL Scanner OverviewSQL Scanner Window
Open Group Manager while SQLScanner is OpenTo open the Group Manager
Click .
Related TopicGroup Manager Window
Check Scanned SQLView Checked Scanner SQL Window
SQL Optimizer for SAP ASE 3.9 User Guide 210
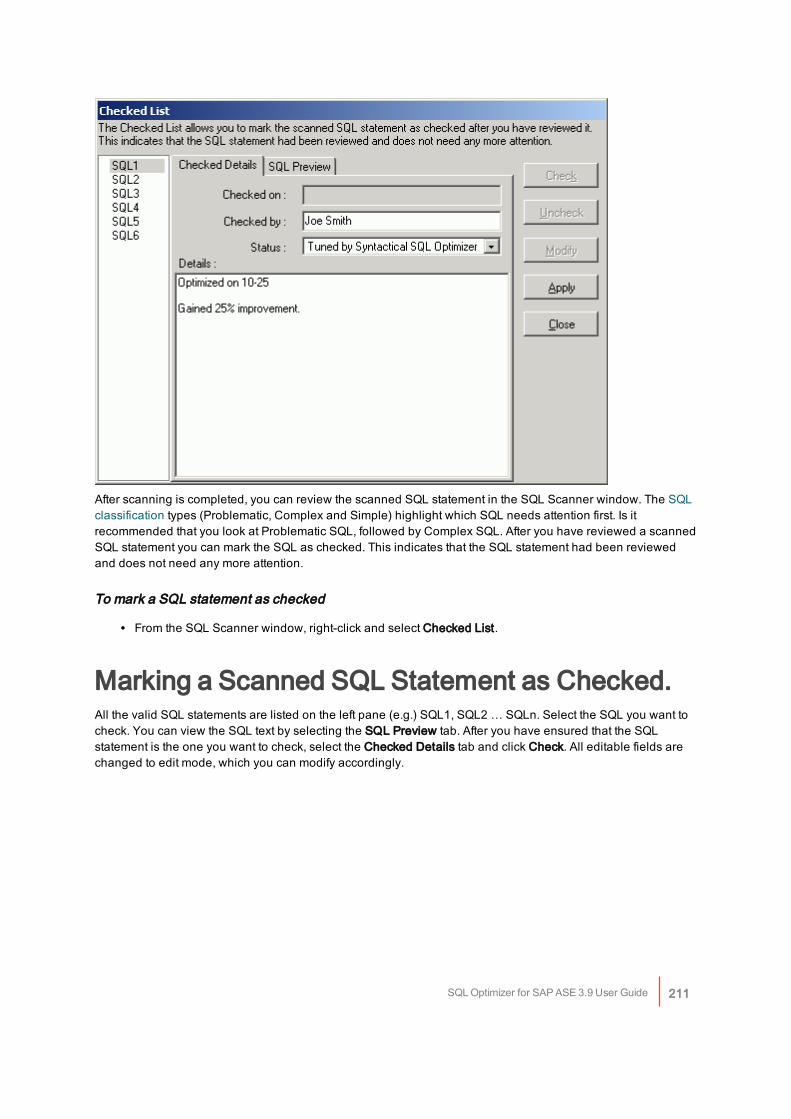
After scanning is completed, you can review the scanned SQL statement in the SQL Scanner window. The SQLclassification types (Problematic, Complex and Simple) highlight which SQL needs attention first. Is itrecommended that you look at Problematic SQL, followed by Complex SQL. After you have reviewed a scannedSQL statement you can mark the SQL as checked. This indicates that the SQL statement had been reviewedand does not need any more attention.
To mark a SQL statement as checked
l From the SQL Scanner window, right-click and select Checked List.
Marking a Scanned SQL Statement as Checked.All the valid SQL statements are listed on the left pane (e.g.) SQL1, SQL2 … SQLn. Select the SQL you want tocheck. You can view the SQL text by selecting the SQL Preview tab. After you have ensured that the SQLstatement is the one you want to check, select the Checked Details tab and click Check. All editable fields arechanged to edit mode, which you can modify accordingly.
SQL Optimizer for SAP ASE 3.9 User Guide 211
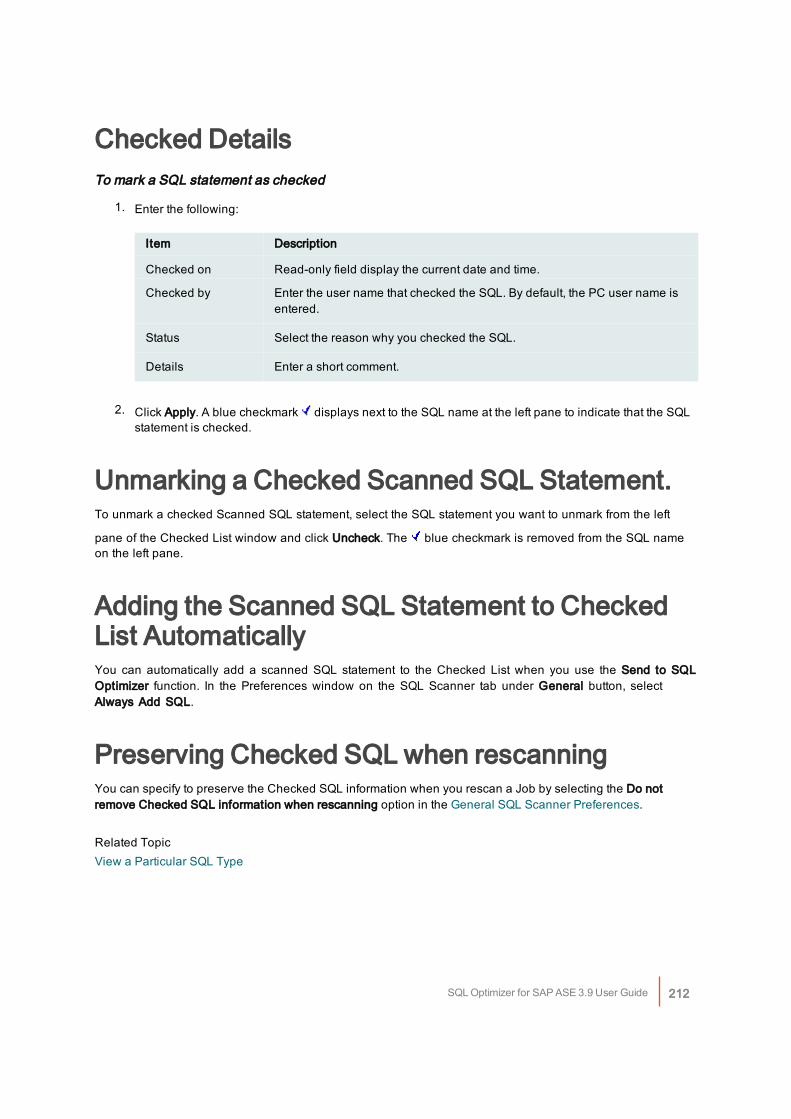
Checked DetailsTo mark a SQL statement as checked
1. Enter the following:
Item Description
Checked on Read-only field display the current date and time.
Checked by Enter the user name that checked the SQL. By default, the PC user name isentered.
Status Select the reason why you checked the SQL.
Details Enter a short comment.
2. Click Apply. A blue checkmark displays next to the SQL name at the left pane to indicate that the SQLstatement is checked.
Unmarking a Checked Scanned SQL Statement.To unmark a checked Scanned SQL statement, select the SQL statement you want to unmark from the left
pane of the Checked List window and click Uncheck. The blue checkmark is removed from the SQL nameon the left pane.
Adding the Scanned SQL Statement to CheckedList AutomaticallyYou can automatically add a scanned SQL statement to the Checked List when you use the Send to SQLOptimizer function. In the Preferences window on the SQL Scanner tab under General button, selectAlways Add SQL.
Preserving Checked SQL when rescanningYou can specify to preserve the Checked SQL information when you rescan a Job by selecting the Do notremove Checked SQL information when rescanning option in the General SQL Scanner Preferences.
Related TopicView a Particular SQL Type
SQL Optimizer for SAP ASE 3.9 User Guide 212
Mark and Unmark All JobsThe black checkmark is used to indicate that the job is marked; any appended symbol is removed to indicatethat the job is unmarked in the SQL Scanner window.
To mark or unmark all JobsSelect Group | Mark All [Ctrl + M] or select Group | Unmark All [Ctrl + U].
Related TopicSQL Scanner Window
Move or Copy Jobs to Other GroupTo move or copy Jobs in the SQL Scanner to another Group
1. Mark the Jobs to be moved or copied.
2. Select Group | Move to Other Group or select Group | Copy to Other Group.
3. Select Group where the Jobs are being moved or copied from the list.
4. Click OK.
Related TopicSQL Scanner Window
Switch Database and UserTo change the database used to scan a particular Job in the SQL Scanner window
1. Right-click the job and select Use Database.
2. Select the database name.
To change the user used to scan a particular Job in the SQL Scanner window
1. Right-click the job and select Set User.
2. Select the user name.
Related TopicSQL Scanner Window
SQL Optimizer for SAP ASE 3.9 User Guide 213
Modify a JobTo modify a Job in the SQL Scanner windowRight-click and select Modify.The Modify Job dialog field allows you to do the following:
l Modify Job description
l Change the file type
l Eliminate duplicate SQL while scanning.
When modifications are made to a Job, it must be rescanned.
Related TopicSQL Scanner Window
Place Bookmarks in SQL ScannerBookmarks are used to mark a Job in the SQL Scanner window to indicate such things as:
l You are currently working on a Job.
l You have finished reviewing a Job.
l You have determined the critical Jobs to be reviewed first.
If the row contains a bookmark, the complete row text is displayed in fuchsia color. You can havemultiple bookmarks.
To place or remove a bookmark in the SQL Scanner windowRight-click on a job and select Add/Remove Bookmark.
Related TopicSQL Scanner Window
Open in SQL CollectorIn the SQL Scanner if the Job is a Collector file, you can open the Collector file in the SQL Collector window toview the SQL statements.
To open the SQL Collector windowRight-click the job that want to open in the Job List pane and select Open in SQL Collector.
SQL Optimizer for SAP ASE 3.9 User Guide 214
Related TopicsSQL Scanner WindowSQL Collector for Monitor Server Overview
Open in SQL InspectorIn the SQL Scanner if the selected Job is an Inspector file or the selected SQL statement, you can open theInspector file in the SQL Inspector window to view the statistics and charts.
To open the SQL Inspector and display the statisticsRight-click the job that want to open in the Job List pane and select Open in SQL Inspector.
Related TopicsSQL Scanner WindowSQL Inspector Overview
Create Benchmark Factory Import FileAll the SQL statements can be saved in a text file from the SQL Scanner, the SQL Repository, the SQLInspector, and the SQL Optimizer windows. These SQL statements can then be imported into BenchmarkFactory 4.6 or later.
To create a file to import into Benchmark Factory
1. Right-click and select Create Benchmark Factory Import File.
2. Select the specific SQL statements that you want to save.
3. Enter the filename and select the file location.
View a Particular SQL TypeIn the SQL Scanner window, initially all SQL statements in the selected Job are shown. Customization of theview allows the displaying of: All, Simple, Problematic, Complex, and/or Invalid SQL statements. In addition,you can view the Checked and/or Unchecked SQL statements. The title bar of the SQL Scanner windowdisplays the chosen criteria. One or more types of SQL statements can be viewed by selecting or de-selectingthe menu items.:
To display SQL statementsSelect View | option.
Related Topics
SQL Optimizer for SAP ASE 3.9 User Guide 215
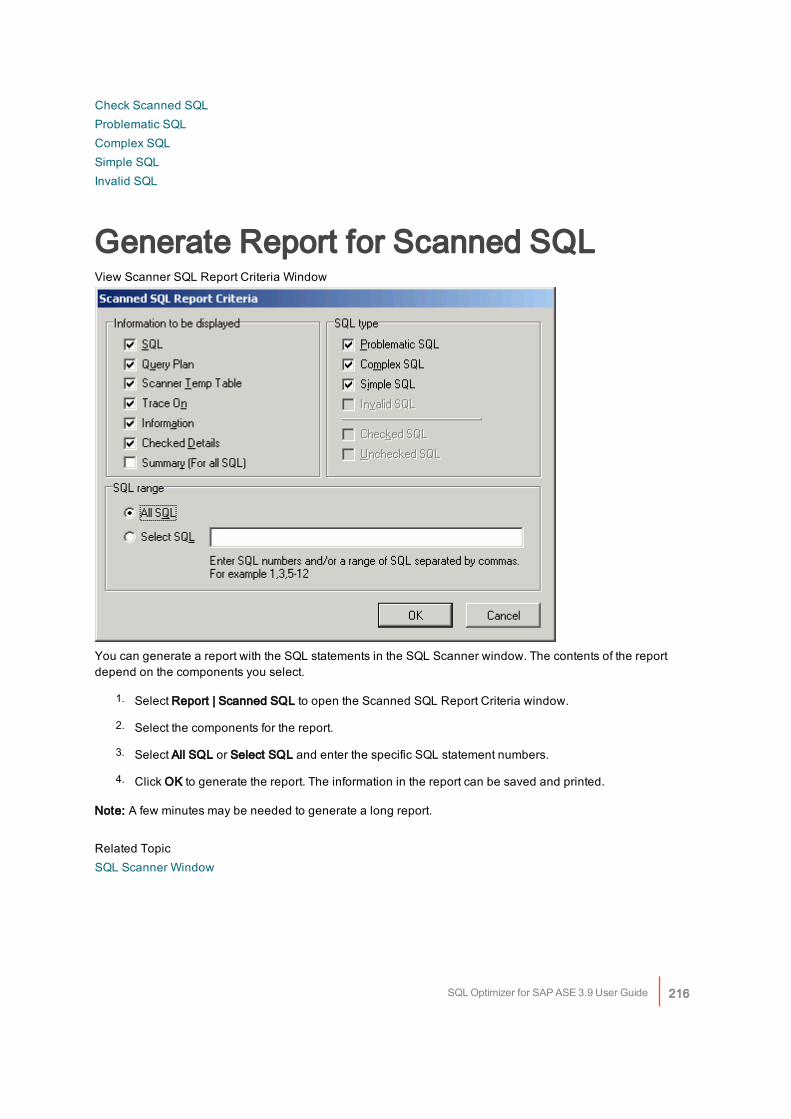
Check Scanned SQLProblematic SQLComplex SQLSimple SQLInvalid SQL
Generate Report for Scanned SQLView Scanner SQL Report Criteria Window
You can generate a report with the SQL statements in the SQL Scanner window. The contents of the reportdepend on the components you select.
1. Select Report | Scanned SQL to open the Scanned SQL Report Criteria window.
2. Select the components for the report.
3. Select All SQL or Select SQL and enter the specific SQL statement numbers.
4. Click OK to generate the report. The information in the report can be saved and printed.
Note: A few minutes may be needed to generate a long report.
Related TopicSQL Scanner Window
SQL Optimizer for SAP ASE 3.9 User Guide 216
Save Abstract PlanTo save the abstract plan from the SQL Scanner to the database
1. Click .
2. In the Save to group drop-down field, select the group where you want to store your abstract plan.
3. Click Save.
When the Abstract Plan is saved, it is only saved for the user that you are logged on as. In order for another userto use this abstract plan, you must export/import the plan to another user.At the prompt "Plan has been created successfully. The id is nnnnnnnnnn". Click OK. The abstract plan issaved in Adaptive Server.Notes:
l Adaptive Server saves the abstract plan in the sysqueryplans system table. When a query is executed,Adaptive Server looks in the sysqueryplans table for a stored SQL text that matches the query. If a matchis found, the saved abstract plan is used to execute the query.Saving the abstract plan onto the database means that when the same SQL statement is executed, thequery plan is based on the abstract plan.
l When saving the abstract plan, Adaptive Server automatically trims the white-spaces from the SQL textreplacing it with one space. You need to make sure the SQL statement you execute in your application isthe same as the original SQL text that you saved with the abstract plan. If the SQL text does not match,then the abstract plan will not be used.
Here are some examples you need to be aware of:Spaces in between functionswhere substring ( EMP_NAME, 1, 5 ) = 'SMITH'
This is not the same aswhere substring(EMP_NAME,1,5) = 'SMITH'
Spaces in between database, scheme and object namefrom sqlexp . sqlexp . EMPLOYEE
This is not the same asfrom sqlexp.sqlexp.EMPLOYEE
Parameter replacementwhere EMP_ID = @var_a
This is not the same asif @var_a = 56
where EMP_ID = 56
Commentswhere EMP_ID =123 /* comment */
This is not the same aswhere EMP_ID = 123
SQL Optimizer for SAP ASE 3.9 User Guide 217
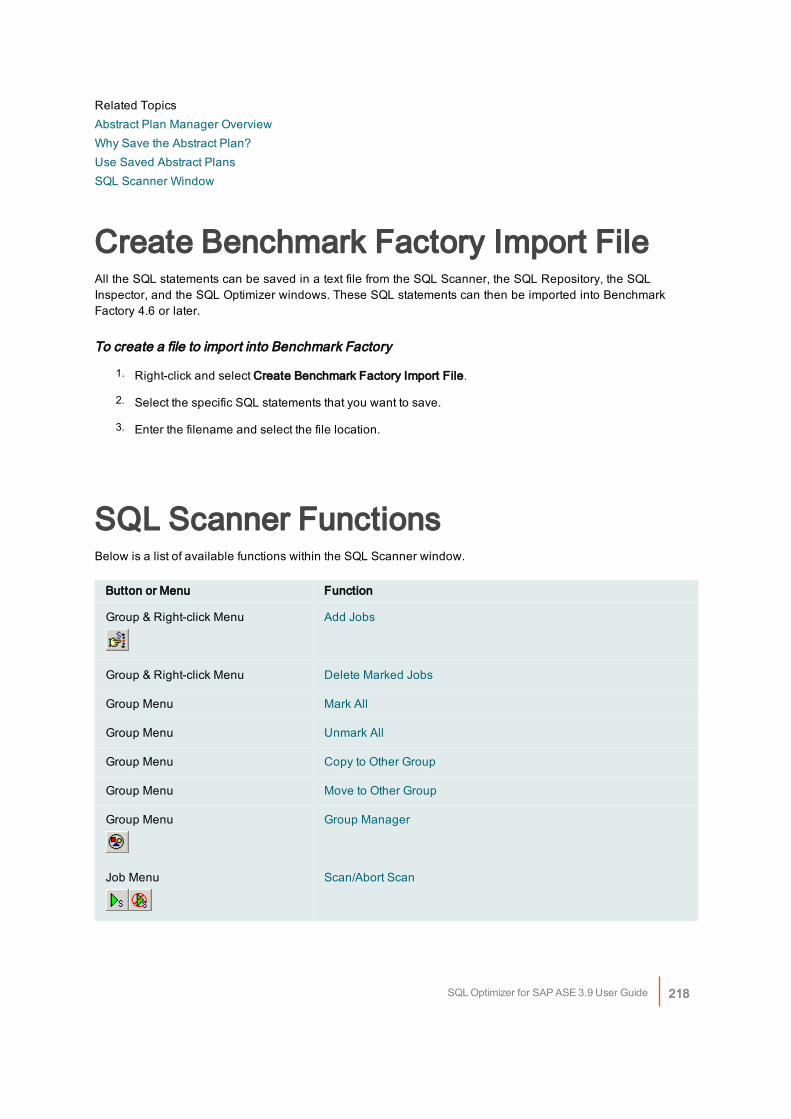
Related TopicsAbstract Plan Manager OverviewWhy Save the Abstract Plan?Use Saved Abstract PlansSQL Scanner Window
Create Benchmark Factory Import FileAll the SQL statements can be saved in a text file from the SQL Scanner, the SQL Repository, the SQLInspector, and the SQL Optimizer windows. These SQL statements can then be imported into BenchmarkFactory 4.6 or later.
To create a file to import into Benchmark Factory
1. Right-click and select Create Benchmark Factory Import File.
2. Select the specific SQL statements that you want to save.
3. Enter the filename and select the file location.
SQL Scanner FunctionsBelow is a list of available functions within the SQL Scanner window.
Button or Menu Function
Group & Right-click Menu Add Jobs
Group & Right-click Menu Delete Marked Jobs
Group Menu Mark All
Group Menu Unmark All
Group Menu Copy to Other Group
Group Menu Move to Other Group
Group Menu Group Manager
Job Menu Scan/Abort Scan
SQL Optimizer for SAP ASE 3.9 User Guide 218
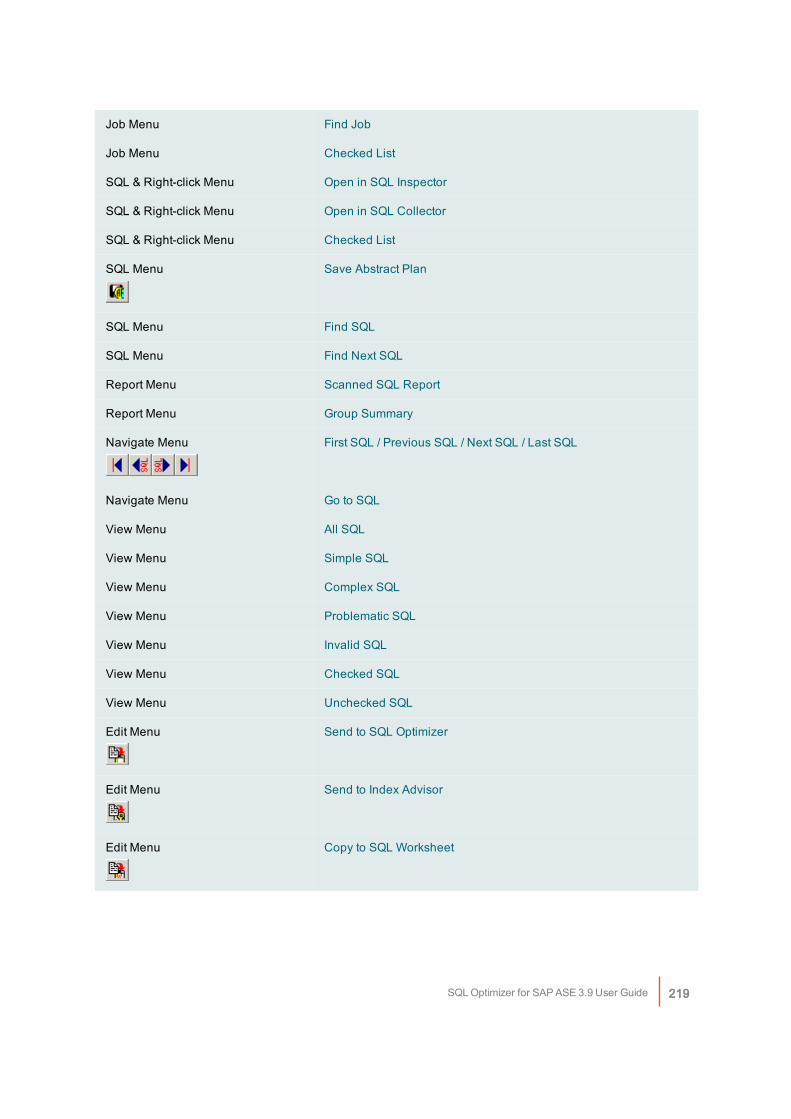
Job Menu Find Job
Job Menu Checked List
SQL & Right-click Menu Open in SQL Inspector
SQL & Right-click Menu Open in SQL Collector
SQL & Right-click Menu Checked List
SQL Menu Save Abstract Plan
SQL Menu Find SQL
SQL Menu Find Next SQL
Report Menu Scanned SQL Report
Report Menu Group Summary
Navigate Menu First SQL / Previous SQL / Next SQL / Last SQL
Navigate Menu Go to SQL
View Menu All SQL
View Menu Simple SQL
View Menu Complex SQL
View Menu Problematic SQL
View Menu Invalid SQL
View Menu Checked SQL
View Menu Unchecked SQL
Edit Menu Send to SQL Optimizer
Edit Menu Send to Index Advisor
Edit Menu Copy to SQL Worksheet
SQL Optimizer for SAP ASE 3.9 User Guide 219
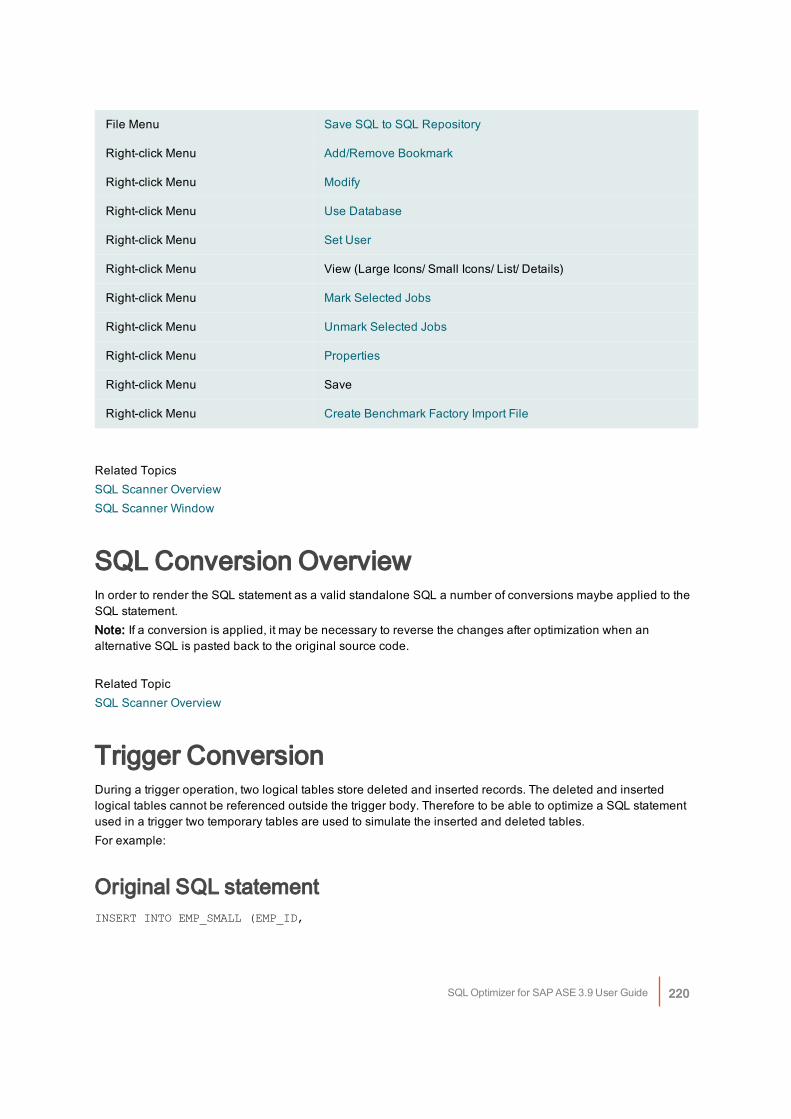
File Menu Save SQL to SQL Repository
Right-click Menu Add/Remove Bookmark
Right-click Menu Modify
Right-click Menu Use Database
Right-click Menu Set User
Right-click Menu View (Large Icons/ Small Icons/ List/ Details)
Right-click Menu Mark Selected Jobs
Right-click Menu Unmark Selected Jobs
Right-click Menu Properties
Right-click Menu Save
Right-click Menu Create Benchmark Factory Import File
Related TopicsSQL Scanner OverviewSQL Scanner Window
SQL Conversion OverviewIn order to render the SQL statement as a valid standalone SQL a number of conversions maybe applied to theSQL statement.Note: If a conversion is applied, it may be necessary to reverse the changes after optimization when analternative SQL is pasted back to the original source code.
Related TopicSQL Scanner Overview
Trigger ConversionDuring a trigger operation, two logical tables store deleted and inserted records. The deleted and insertedlogical tables cannot be referenced outside the trigger body. Therefore to be able to optimize a SQL statementused in a trigger two temporary tables are used to simulate the inserted and deleted tables.For example:
Original SQL statementINSERT INTO EMP_SMALL (EMP_ID,
SQL Optimizer for SAP ASE 3.9 User Guide 220
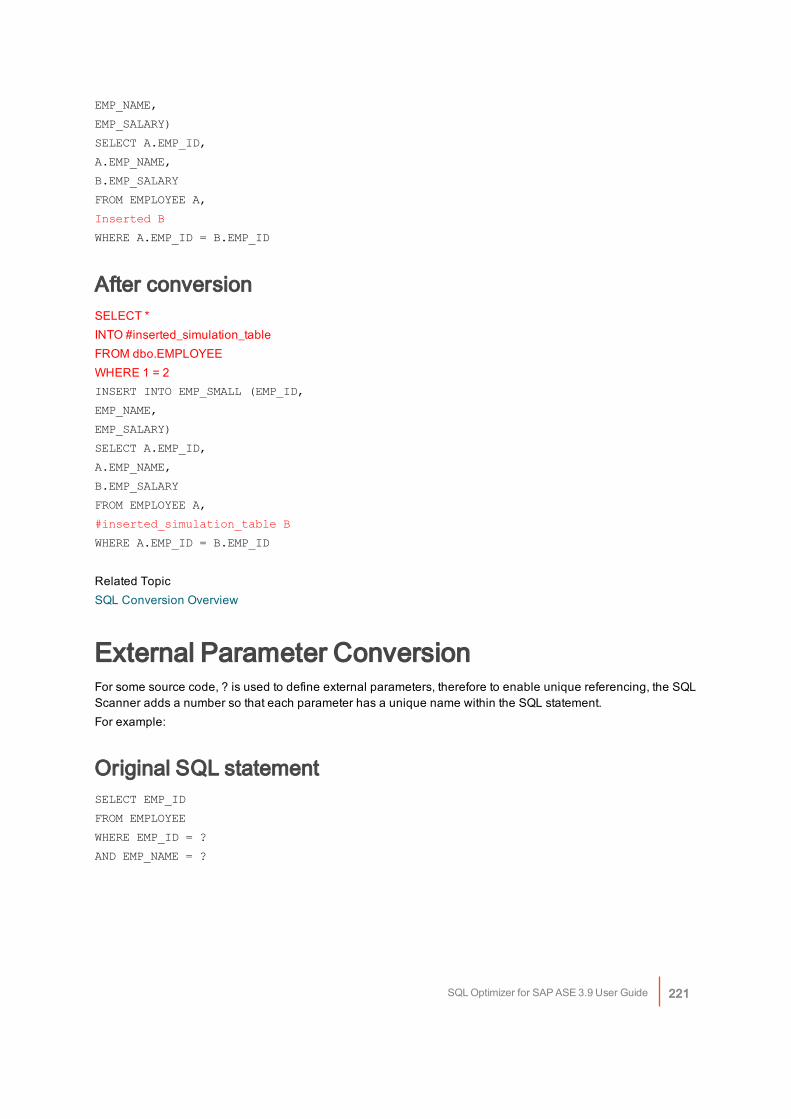
EMP_NAME,
EMP_SALARY)
SELECT A.EMP_ID,
A.EMP_NAME,
B.EMP_SALARY
FROM EMPLOYEE A,
Inserted B
WHERE A.EMP_ID = B.EMP_ID
After conversionSELECT *INTO #inserted_simulation_tableFROM dbo.EMPLOYEE WHERE 1 = 2 INSERT INTO EMP_SMALL (EMP_ID,
EMP_NAME,
EMP_SALARY)
SELECT A.EMP_ID,
A.EMP_NAME,
B.EMP_SALARY
FROM EMPLOYEE A,
#inserted_simulation_table B
WHERE A.EMP_ID = B.EMP_ID
Related TopicSQL Conversion Overview
External Parameter ConversionFor some source code, ? is used to define external parameters, therefore to enable unique referencing, the SQLScanner adds a number so that each parameter has a unique name within the SQL statement.For example:
Original SQL statementSELECT EMP_ID
FROM EMPLOYEE
WHERE EMP_ID = ?
AND EMP_NAME = ?
SQL Optimizer for SAP ASE 3.9 User Guide 221
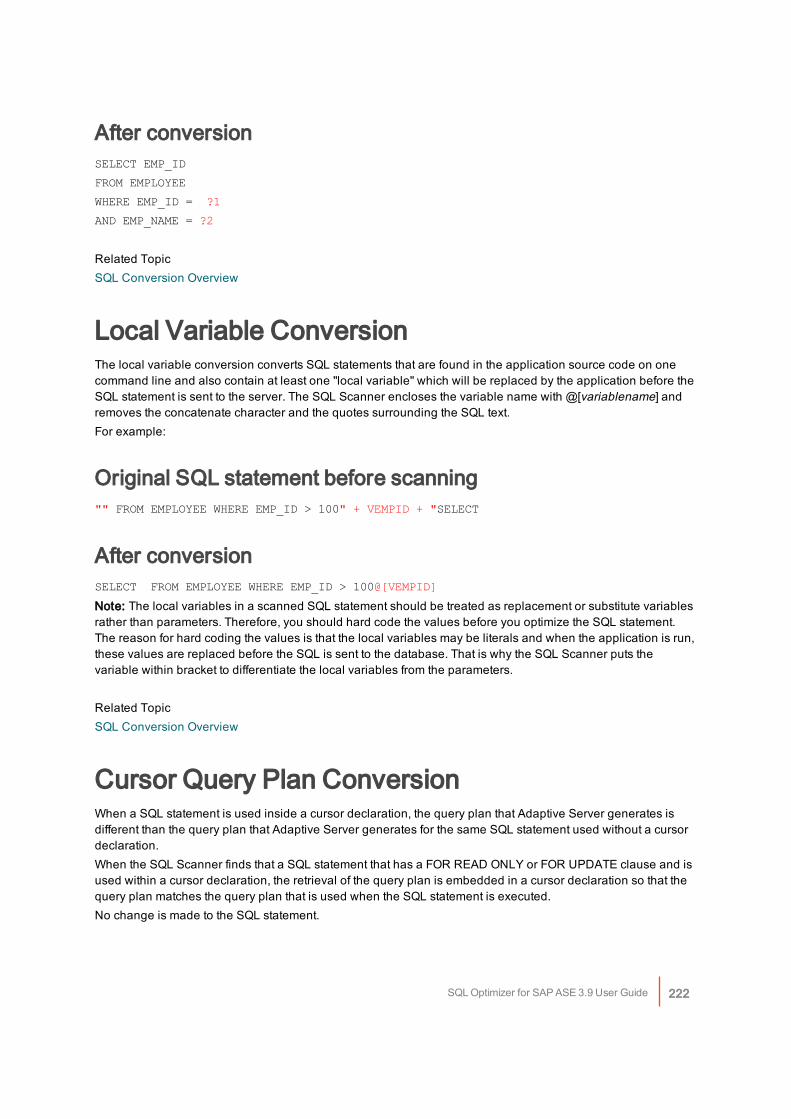
After conversionSELECT EMP_ID
FROM EMPLOYEE
WHERE EMP_ID = ?1
AND EMP_NAME = ?2
Related TopicSQL Conversion Overview
Local Variable ConversionThe local variable conversion converts SQL statements that are found in the application source code on onecommand line and also contain at least one "local variable" which will be replaced by the application before theSQL statement is sent to the server. The SQL Scanner encloses the variable name with @[variablename] andremoves the concatenate character and the quotes surrounding the SQL text.For example:
Original SQL statement before scanning"" FROM EMPLOYEE WHERE EMP_ID > 100" + VEMPID + "SELECT
After conversionSELECT FROM EMPLOYEE WHERE EMP_ID > 100@[VEMPID]
Note: The local variables in a scanned SQL statement should be treated as replacement or substitute variablesrather than parameters. Therefore, you should hard code the values before you optimize the SQL statement.The reason for hard coding the values is that the local variables may be literals and when the application is run,these values are replaced before the SQL is sent to the database. That is why the SQL Scanner puts thevariable within bracket to differentiate the local variables from the parameters.
Related TopicSQL Conversion Overview
Cursor Query Plan ConversionWhen a SQL statement is used inside a cursor declaration, the query plan that Adaptive Server generates isdifferent than the query plan that Adaptive Server generates for the same SQL statement used without a cursordeclaration.When the SQL Scanner finds that a SQL statement that has a FOR READ ONLY or FOR UPDATE clause and isused within a cursor declaration, the retrieval of the query plan is embedded in a cursor declaration so that thequery plan matches the query plan that is used when the SQL statement is executed.No change is made to the SQL statement.
SQL Optimizer for SAP ASE 3.9 User Guide 222
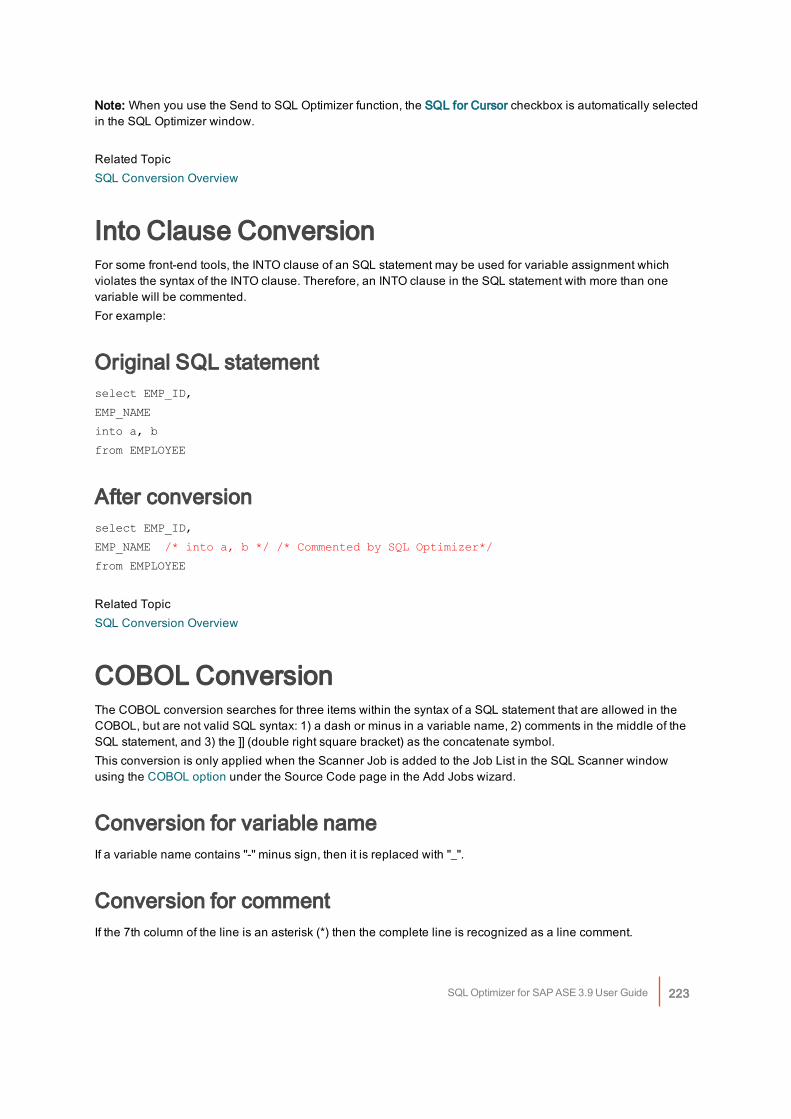
Note: When you use the Send to SQL Optimizer function, the SQL for Cursor checkbox is automatically selectedin the SQL Optimizer window.
Related TopicSQL Conversion Overview
Into Clause ConversionFor some front-end tools, the INTO clause of an SQL statement may be used for variable assignment whichviolates the syntax of the INTO clause. Therefore, an INTO clause in the SQL statement with more than onevariable will be commented.For example:
Original SQL statementselect EMP_ID,
EMP_NAME
into a, b
from EMPLOYEE
After conversionselect EMP_ID,
EMP_NAME /* into a, b */ /* Commented by SQL Optimizer*/
from EMPLOYEE
Related TopicSQL Conversion Overview
COBOL ConversionThe COBOL conversion searches for three items within the syntax of a SQL statement that are allowed in theCOBOL, but are not valid SQL syntax: 1) a dash or minus in a variable name, 2) comments in the middle of theSQL statement, and 3) the ]] (double right square bracket) as the concatenate symbol.This conversion is only applied when the Scanner Job is added to the Job List in the SQL Scanner windowusing the COBOL option under the Source Code page in the Add Jobs wizard.
Conversion for variable nameIf a variable name contains "-" minus sign, then it is replaced with "_".
Conversion for commentIf the 7th column of the line is an asterisk (*) then the complete line is recognized as a line comment.
SQL Optimizer for SAP ASE 3.9 User Guide 223
Conversion for concatenate characterIf ]] (two right square brackets) are used to concatenate column names, they are replaced with a +.For example:
Original SQL statementSELECT *
FROM EMPLOYEE
* Get the department number
WHERE EMP_ID > :employee-id
AND :name-job = ENAME]]JOB
After conversionSELECT *FROM EMPLOYEE -- * Get the department numberWHERE EMP_ID > @employee_idAND ENAME + JOB = @name_jobNote: If your COBOL file has tags at the beginning of the lines of code, you need to use the Number ofcharacters to be skipped at the beginning of every line for all files option found on the SQL Scanner tab in thePreferences window.
Related TopicSQL Conversion Overview
Index Advisor OverviewThe Index Advisor provides the index candidates by analyzing the structure of a SQL statement and identifyingall the related tables and indexes currently used by the SQL statement. By looking into the search argumentsand table join conditions of the SQL statement, different index candidates are generated for you to evaluate theeffect new indexes may have on database performance. You can further investigate index possibilities bycreating your own candidates and grouping the candidates into Index Sets.
Related TopicIndex Advisor WindowIndex Advisor Functions
Index Advisor WindowView Index Advisor Window
SQL Optimizer for SAP ASE 3.9 User Guide 224
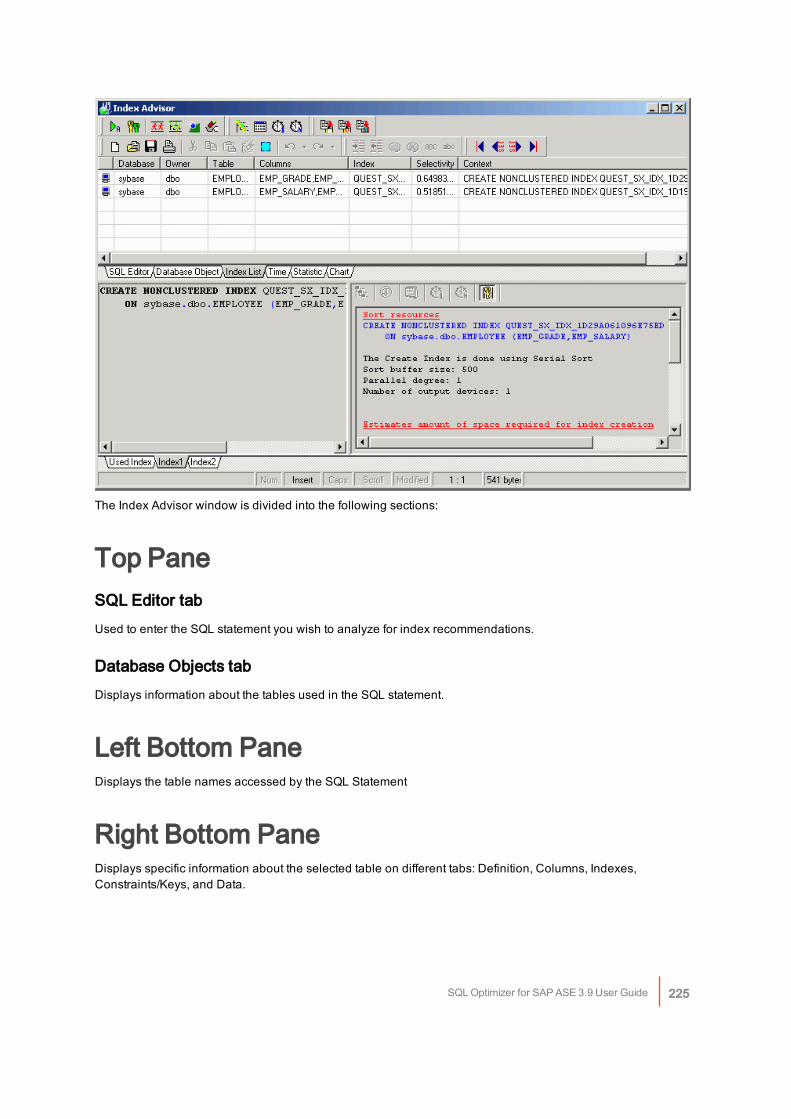
The Index Advisor window is divided into the following sections:
Top PaneSQL Editor tabUsed to enter the SQL statement you wish to analyze for index recommendations.
Database Objects tabDisplays information about the tables used in the SQL statement.
Left Bottom PaneDisplays the table names accessed by the SQL Statement
Right Bottom PaneDisplays specific information about the selected table on different tabs: Definition, Columns, Indexes,Constraints/Keys, and Data.
SQL Optimizer for SAP ASE 3.9 User Guide 225
Index List tabDisplays a list of the individual index candidates proposed by the Index Advisor. These are the indexes used inthe Index alternatives displayed in the bottom left pane. The following information displays on this page:
Item Description
Database Database where index resides
Owner Owner of the index
Table Indexed table
Columns Indexed column(s)
Index Index name. All indexes generated by SQL Optimizer will be prefixed with QUEST_SX_IDX_.
Selectivity Selectivity value. The selectivity is the percentage of rows in the table that the SQLstatement selects. A SQL statement that selects a small percentage of the rows from atable has good selectivity, while a query that selects a large percentage of rows haspoor selectivity. The maximum selectivity value is 1 and it corresponds to the bestselectivity.Note: A Sample Block of the actual table data is used to calculate the selectivity valuetherefore it is possible that the value may vary according to what Sample Block is used.
Context Index DDL for creating the index.
Time tabDisplays the run time information for the SQL statement using the alternative indexes. The values are filled inafter the Show Plan, Batch Run, Run for First Record, or Run for All Records functions are executed.
Statistics tabDisplays the run time statistics for the SQL statement using the alternative indexes. These values are filled inafter the Batch Run, the Run for First Record, or Run for All Record functions are executed. An is placed inthe far left column if for some reason the index is not created when the SQL statement is executed.
Chart tabCharts the run time statistics for the SQL statement using the alternative indexes.
Bottom Left PaneDisplays the Used Index which is the index(es) that are currently used by the SQL statement, the Indexcandidates which are generated by the Index Advisor, or the Index Sets that are created using the User-DefinedIndex window.
SQL Optimizer for SAP ASE 3.9 User Guide 226
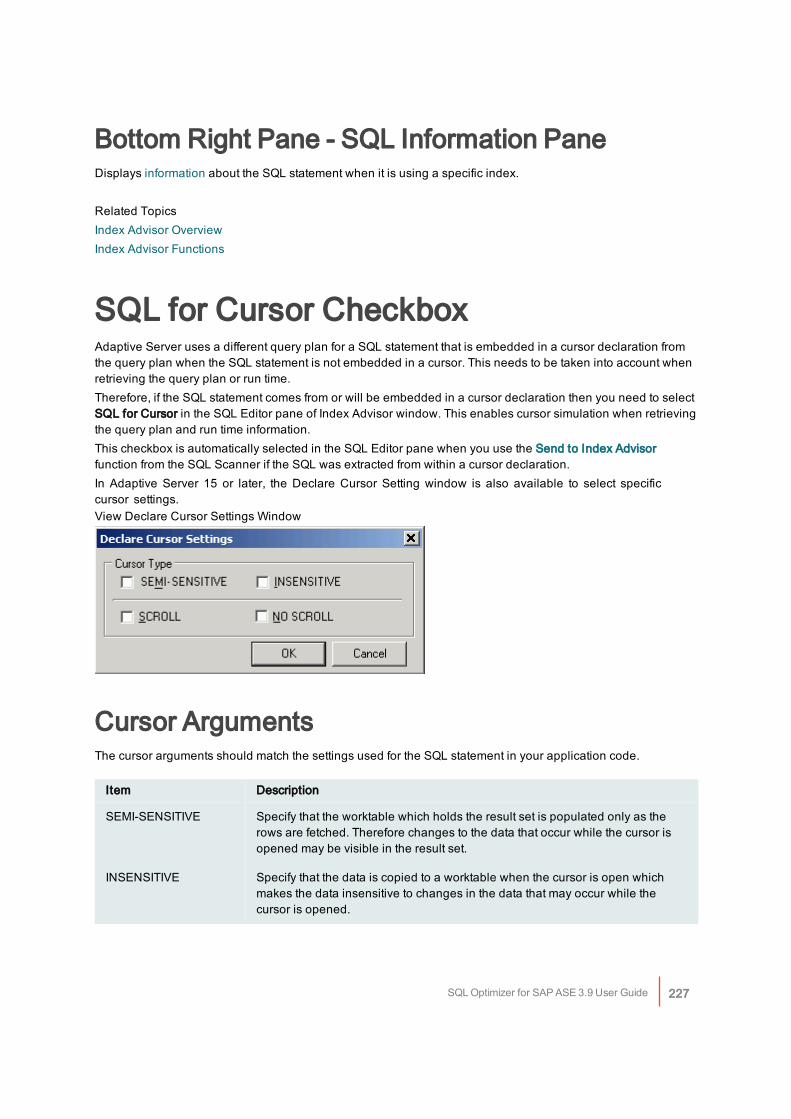
Bottom Right Pane - SQL Information PaneDisplays information about the SQL statement when it is using a specific index.
Related TopicsIndex Advisor OverviewIndex Advisor Functions
SQL for Cursor CheckboxAdaptive Server uses a different query plan for a SQL statement that is embedded in a cursor declaration fromthe query plan when the SQL statement is not embedded in a cursor. This needs to be taken into account whenretrieving the query plan or run time.Therefore, if the SQL statement comes from or will be embedded in a cursor declaration then you need to selectSQL for Cursor in the SQL Editor pane of Index Advisor window. This enables cursor simulation when retrievingthe query plan and run time information.This checkbox is automatically selected in the SQL Editor pane when you use the Send to Index Advisorfunction from the SQL Scanner if the SQL was extracted from within a cursor declaration.In Adaptive Server 15 or later, the Declare Cursor Setting window is also available to select specificcursor settings.View Declare Cursor Settings Window
Cursor ArgumentsThe cursor arguments should match the settings used for the SQL statement in your application code.
Item Description
SEMI-SENSITIVE Specify that the worktable which holds the result set is populated only as therows are fetched. Therefore changes to the data that occur while the cursor isopened may be visible in the result set.
INSENSITIVE Specify that the data is copied to a worktable when the cursor is open whichmakes the data insensitive to changes in the data that may occur while thecursor is opened.
SQL Optimizer for SAP ASE 3.9 User Guide 227
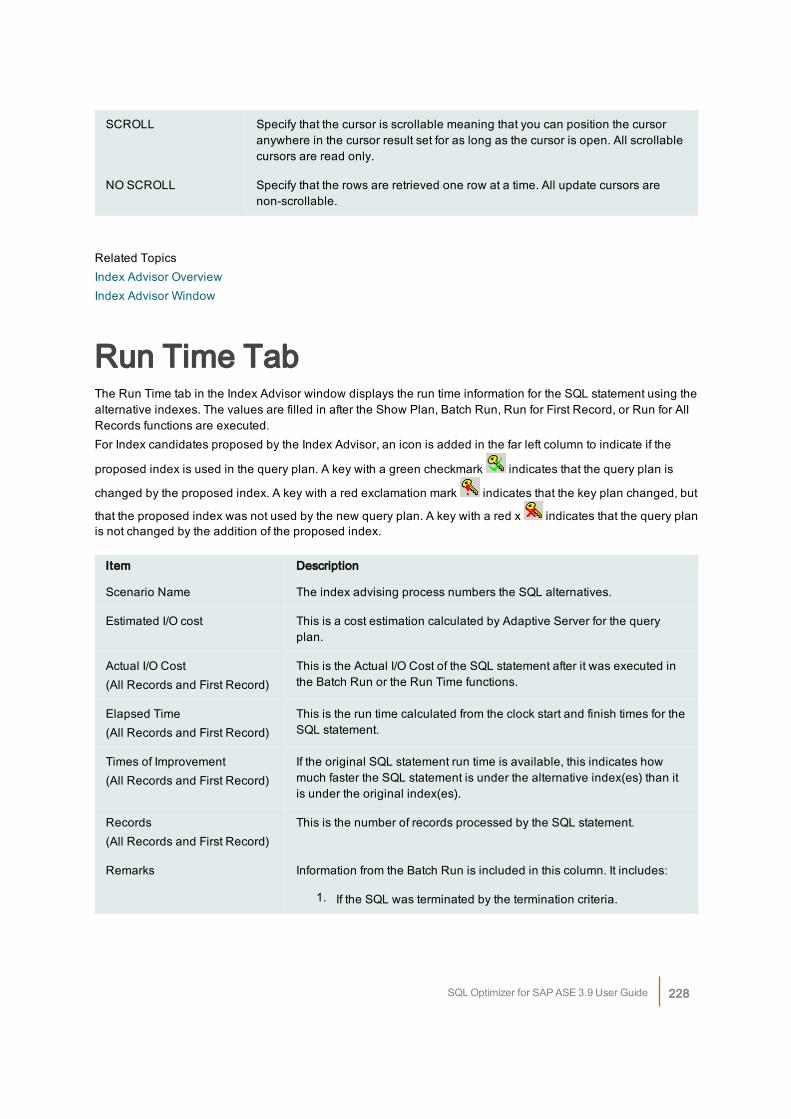
SCROLL Specify that the cursor is scrollable meaning that you can position the cursoranywhere in the cursor result set for as long as the cursor is open. All scrollablecursors are read only.
NO SCROLL Specify that the rows are retrieved one row at a time. All update cursors arenon-scrollable.
Related TopicsIndex Advisor OverviewIndex Advisor Window
Run Time TabThe Run Time tab in the Index Advisor window displays the run time information for the SQL statement using thealternative indexes. The values are filled in after the Show Plan, Batch Run, Run for First Record, or Run for AllRecords functions are executed.For Index candidates proposed by the Index Advisor, an icon is added in the far left column to indicate if the
proposed index is used in the query plan. A key with a green checkmark indicates that the query plan is
changed by the proposed index. A key with a red exclamation mark indicates that the key plan changed, but
that the proposed index was not used by the new query plan. A key with a red x indicates that the query planis not changed by the addition of the proposed index.
Item Description
Scenario Name The index advising process numbers the SQL alternatives.
Estimated I/O cost This is a cost estimation calculated by Adaptive Server for the queryplan.
Actual I/O Cost(All Records and First Record)
This is the Actual I/O Cost of the SQL statement after it was executed inthe Batch Run or the Run Time functions.
Elapsed Time(All Records and First Record)
This is the run time calculated from the clock start and finish times for theSQL statement.
Times of Improvement(All Records and First Record)
If the original SQL statement run time is available, this indicates howmuch faster the SQL statement is under the alternative index(es) than itis under the original index(es).
Records(All Records and First Record)
This is the number of records processed by the SQL statement.
Remarks Information from the Batch Run is included in this column. It includes:
1. If the SQL was terminated by the termination criteria.
SQL Optimizer for SAP ASE 3.9 User Guide 228
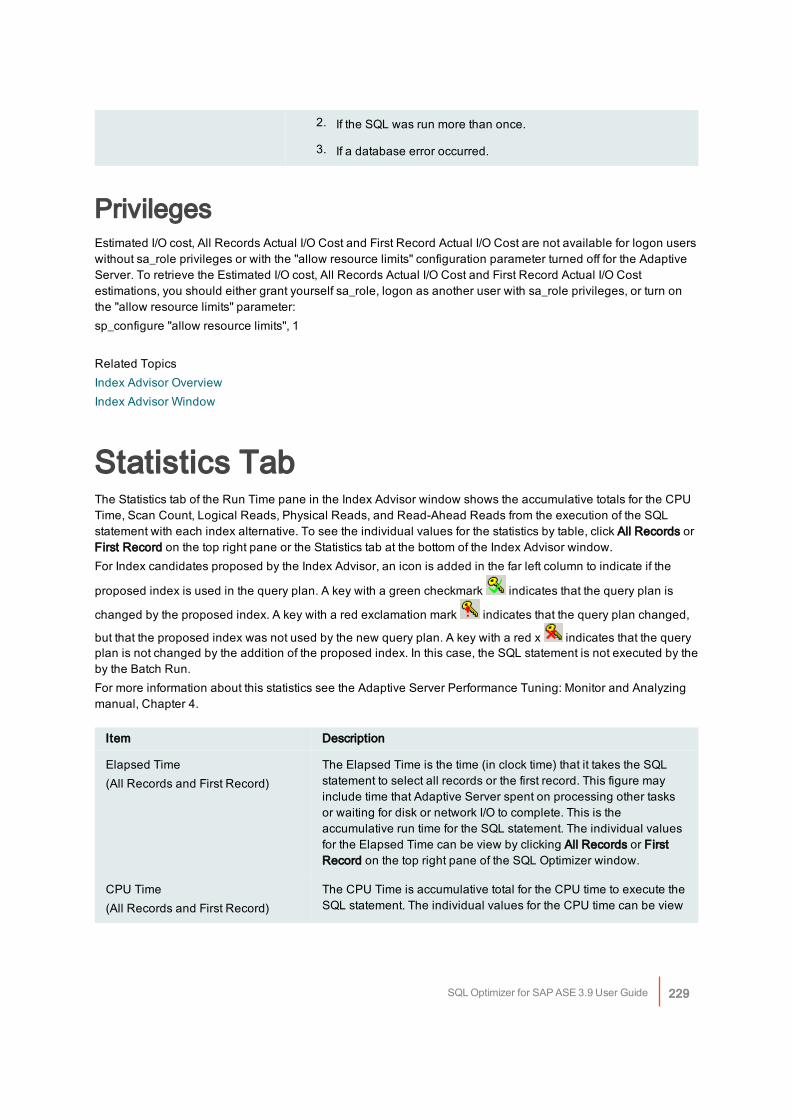
2. If the SQL was run more than once.
3. If a database error occurred.
PrivilegesEstimated I/O cost, All Records Actual I/O Cost and First Record Actual I/O Cost are not available for logon userswithout sa_role privileges or with the "allow resource limits" configuration parameter turned off for the AdaptiveServer. To retrieve the Estimated I/O cost, All Records Actual I/O Cost and First Record Actual I/O Costestimations, you should either grant yourself sa_role, logon as another user with sa_role privileges, or turn onthe "allow resource limits" parameter:sp_configure "allow resource limits", 1
Related TopicsIndex Advisor OverviewIndex Advisor Window
Statistics TabThe Statistics tab of the Run Time pane in the Index Advisor window shows the accumulative totals for the CPUTime, Scan Count, Logical Reads, Physical Reads, and Read-Ahead Reads from the execution of the SQLstatement with each index alternative. To see the individual values for the statistics by table, click All Records orFirst Record on the top right pane or the Statistics tab at the bottom of the Index Advisor window.For Index candidates proposed by the Index Advisor, an icon is added in the far left column to indicate if the
proposed index is used in the query plan. A key with a green checkmark indicates that the query plan is
changed by the proposed index. A key with a red exclamation mark indicates that the query plan changed,
but that the proposed index was not used by the new query plan. A key with a red x indicates that the queryplan is not changed by the addition of the proposed index. In this case, the SQL statement is not executed by theby the Batch Run.For more information about this statistics see the Adaptive Server Performance Tuning: Monitor and Analyzingmanual, Chapter 4.
Item Description
Elapsed Time(All Records and First Record)
The Elapsed Time is the time (in clock time) that it takes the SQLstatement to select all records or the first record. This figure mayinclude time that Adaptive Server spent on processing other tasksor waiting for disk or network I/O to complete. This is theaccumulative run time for the SQL statement. The individual valuesfor the Elapsed Time can be view by clicking All Records or FirstRecord on the top right pane of the SQL Optimizer window.
CPU Time(All Records and First Record)
The CPU Time is accumulative total for the CPU time to execute theSQL statement. The individual values for the CPU time can be view
SQL Optimizer for SAP ASE 3.9 User Guide 229
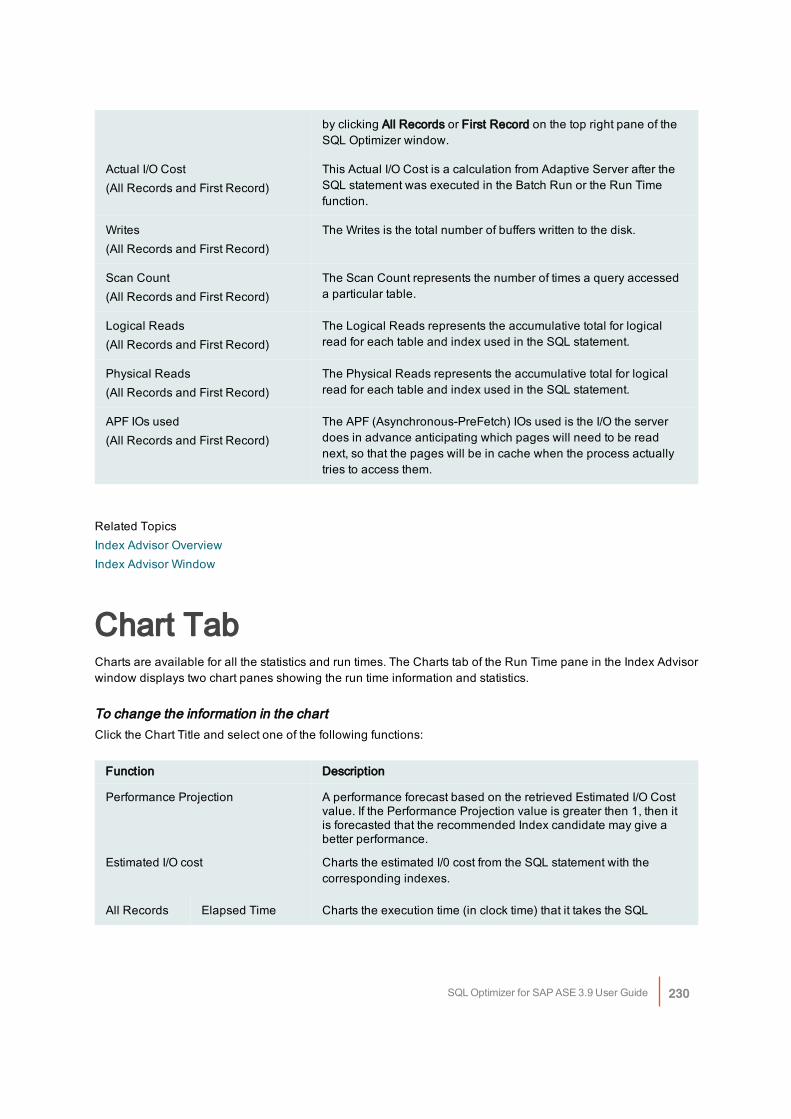
by clicking All Records or First Record on the top right pane of theSQL Optimizer window.
Actual I/O Cost(All Records and First Record)
This Actual I/O Cost is a calculation from Adaptive Server after theSQL statement was executed in the Batch Run or the Run Timefunction.
Writes(All Records and First Record)
The Writes is the total number of buffers written to the disk.
Scan Count(All Records and First Record)
The Scan Count represents the number of times a query accesseda particular table.
Logical Reads(All Records and First Record)
The Logical Reads represents the accumulative total for logicalread for each table and index used in the SQL statement.
Physical Reads(All Records and First Record)
The Physical Reads represents the accumulative total for logicalread for each table and index used in the SQL statement.
APF IOs used(All Records and First Record)
The APF (Asynchronous-PreFetch) IOs used is the I/O the serverdoes in advance anticipating which pages will need to be readnext, so that the pages will be in cache when the process actuallytries to access them.
Related TopicsIndex Advisor OverviewIndex Advisor Window
Chart TabCharts are available for all the statistics and run times. The Charts tab of the Run Time pane in the Index Advisorwindow displays two chart panes showing the run time information and statistics.
To change the information in the chartClick the Chart Title and select one of the following functions:
Function Description
Performance Projection A performance forecast based on the retrieved Estimated I/O Costvalue. If the Performance Projection value is greater then 1, then itis forecasted that the recommended Index candidate may give abetter performance.
Estimated I/O cost Charts the estimated I/0 cost from the SQL statement with thecorresponding indexes.
All Records Elapsed Time Charts the execution time (in clock time) that it takes the SQL
SQL Optimizer for SAP ASE 3.9 User Guide 230
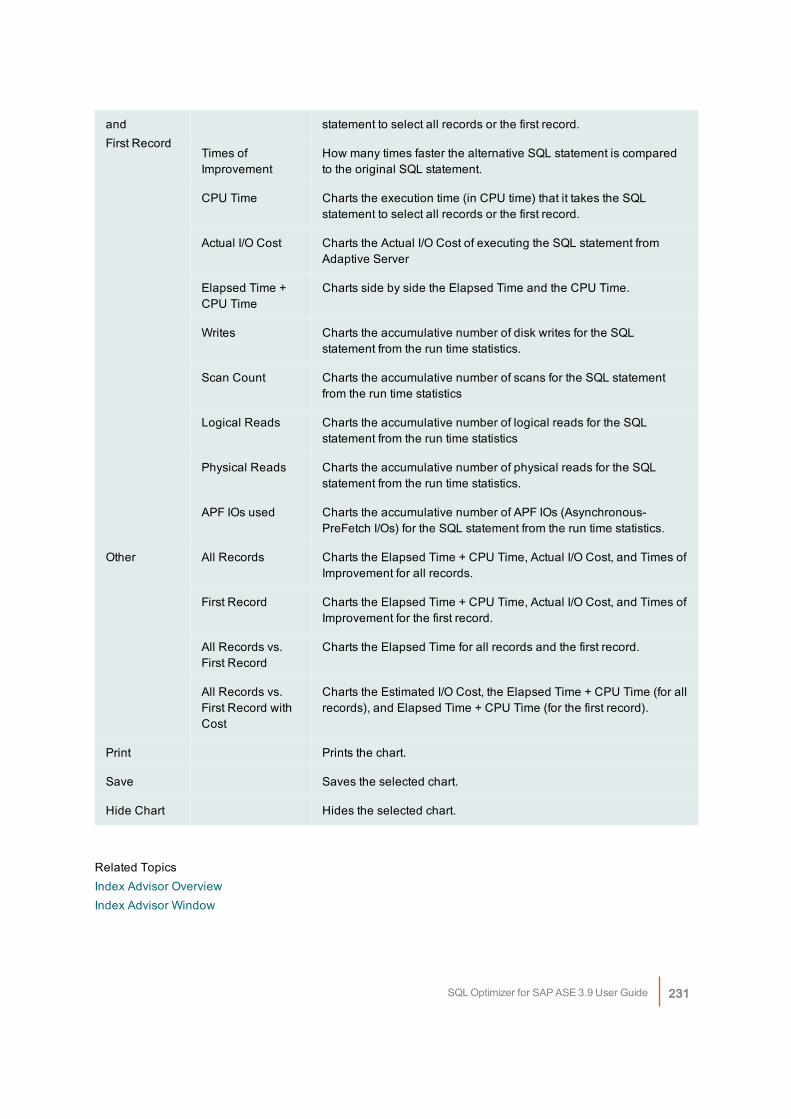
andFirst Record
statement to select all records or the first record.
Times ofImprovement
How many times faster the alternative SQL statement is comparedto the original SQL statement.
CPU Time Charts the execution time (in CPU time) that it takes the SQLstatement to select all records or the first record.
Actual I/O Cost Charts the Actual I/O Cost of executing the SQL statement fromAdaptive Server
Elapsed Time +CPU Time
Charts side by side the Elapsed Time and the CPU Time.
Writes Charts the accumulative number of disk writes for the SQLstatement from the run time statistics.
Scan Count Charts the accumulative number of scans for the SQL statementfrom the run time statistics
Logical Reads Charts the accumulative number of logical reads for the SQLstatement from the run time statistics
Physical Reads Charts the accumulative number of physical reads for the SQLstatement from the run time statistics.
APF IOs used Charts the accumulative number of APF IOs (Asynchronous-PreFetch I/Os) for the SQL statement from the run time statistics.
Other All Records Charts the Elapsed Time + CPU Time, Actual I/O Cost, and Times ofImprovement for all records.
First Record Charts the Elapsed Time + CPU Time, Actual I/O Cost, and Times ofImprovement for the first record.
All Records vs.First Record
Charts the Elapsed Time for all records and the first record.
All Records vs.First Record withCost
Charts the Estimated I/O Cost, the Elapsed Time + CPU Time (for allrecords), and Elapsed Time + CPU Time (for the first record).
Print Prints the chart.
Save Saves the selected chart.
Hide Chart Hides the selected chart.
Related TopicsIndex Advisor OverviewIndex Advisor Window
SQL Optimizer for SAP ASE 3.9 User Guide 231
Filter the Run Time ResultsYou can filter the Index Sets displayed on the Time tab and the Statistics tab of the Index Advisor window by anyof the run time statistics after you have executed the SQL statement with the Index Sets.The current filter displays in the bottom left corner of the Time or Statistics pane.
To filter the Index Sets
1. Click the downward pointing arrow to the right of a column heading.
2. Select one of the following:
Item Description
All Displays all the SQL statements.
Custom… Opens the Custom AutoFilter window where you can select the options forfiltering the SQL statements based on specific values for the selected column.
Blanks Select all the SQL statements which do not have a value in the selected column.
NonBlanks Select all the SQL statements which do have a value in the selected column.
Specific Value Select all SQL statements that have one specific value.
You can repeat steps 1 and 2 to add as many filters as you would like.
To clear the filterClick at the bottom left corner of the Time or Statistics pane.
Related TopicsIndex Advisor OverviewIndex Advisor Window
Advise Index AlternativesTo have the Index Advisor propose Index candidates for a SQL statement
1. Click .
2. Enter the original SQL statement for which you want to analyze for new indexes that could be created tochange SQL performance. You can also copy the SQL statement directly from another window using theSend to Index Advisor function.
3. Click to generate new Index candidates for the original SQL statement.
SQL Optimizer for SAP ASE 3.9 User Guide 232
4. In the Select tables window, select the tables for which you want the index candidates generated inthe Selected column.
The Sampling Size (Rows) column displays the number of rows that will be used in the datasample that is used to determine the selectivity of the data. These values are calculated using thesettings on the Index Advisor tab in the Preferences window. You can adjust these values to changethe size of the sample.
The Index Advisor identifies columns as index candidates after performing an analysis of the SQL syntax,relation between tables, and selectivity of the data. It displays the DDL for the index candidates in the bottom leftpane of the Index Advisor window.
To terminate the index generation process
Click .It may take a few seconds to terminate all processes.Once the advising process is completed, the Index Advising Details window displays detailing the indexesproposed. The Index candidates are displayed on the bottom left pane on the tabs labeled Index1, Index2…IndexN. The Used Index tab displays the DDL for the index(es) currently used by the original SQL statement.The corresponding query plan, abstract plan, SQL classification, trace on and Sort Resource information aredisplayed in the SQL Information Pane at the bottom right.Summarized index information for the entire index candidates is shown on the Index List tab on the top pane ofthe Index Advisor window.
Related TopicsAnalyze Impact of New IndexesCreate Index(es)Clear All Index AlternativesIndex Advisor OverviewIndex Advisor Window
Index Advising DetailsView Index Advising Details Window
SQL Optimizer for SAP ASE 3.9 User Guide 233
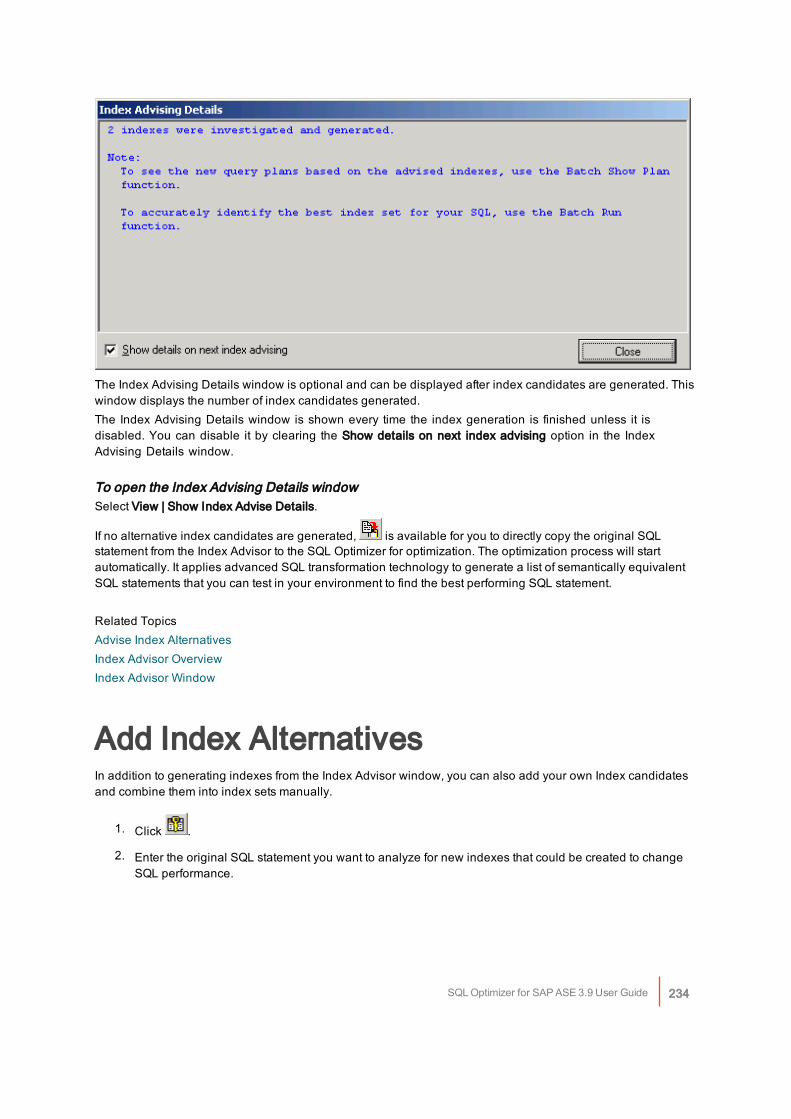
The Index Advising Details window is optional and can be displayed after index candidates are generated. Thiswindow displays the number of index candidates generated.The Index Advising Details window is shown every time the index generation is finished unless it isdisabled. You can disable it by clearing the Show details on next index advising option in the IndexAdvising Details window.
To open the Index Advising Details windowSelect View | Show Index Advise Details.
If no alternative index candidates are generated, is available for you to directly copy the original SQLstatement from the Index Advisor to the SQL Optimizer for optimization. The optimization process will startautomatically. It applies advanced SQL transformation technology to generate a list of semantically equivalentSQL statements that you can test in your environment to find the best performing SQL statement.
Related TopicsAdvise Index AlternativesIndex Advisor OverviewIndex Advisor Window
Add Index AlternativesIn addition to generating indexes from the Index Advisor window, you can also add your own Index candidatesand combine them into index sets manually.
1. Click .
2. Enter the original SQL statement you want to analyze for new indexes that could be created to changeSQL performance.
SQL Optimizer for SAP ASE 3.9 User Guide 234
3. You can also copy the SQL statement directly from another window using the Send to Index Advisorfunction.
It is recommended that you use the Advise Indexes function first to generate Index candidates beforecreating your own.
4. Click .
This window enables you to add new indexes or to construct index sets by combining two or moreindexes together.You need to first create your own index candidates and then group them into Index Sets. If you have generatedIndex candidates using the Advise Indexes function, notice that they are displayed in the User-Defined Indexwindow and can be used to create Index sets.
Add user-defined indexesIf one or no index candidate exists, then the Add Index window displays automatically. Otherwise, click tothe right of the list of indexes to add a new index.The Add Index window enables you to construct your index using a graphical user interface without the need toconstruct the DDL for the index manually. Enter the index name, select the database, owner, table and columnson which you are defining the index and select the index type (Unique and Clustered and Non-clustered).
Create function-based indexesSelect the Function-based index checkbox to create the index as a function-base index. Computed columnsand function-based indexes is a new feature in ASE 15.0. This feature allows developers to define a column as
an expression and create indexes on expressions. Use to select the column to add the operation to it. Use
to add the modified column to the selected columns for the function-based index.
Create Index SetsThree options are available for whether to include the new index in an Index Set:
l Add the index and add it to a new Index Set (Create new Index Set for this index)
l Add the index to an existing User-defined Index Set (Add to existing index set), or
l Add the index without adding it to any Index Set (Do not assign to any index set).
Click OK to add the index to the list of indexes on the left pane list [Create Index here]. If you choose to add anew Index Set, notice that the Index Set is added to right pane list [Create Index Set here]. You can add multipleUser-defined Indexes and Index Sets.
SQL Optimizer for SAP ASE 3.9 User Guide 235
Delete User-defined IndexesSelect the index you want to delete from the top left pane list [Create Index here] and click . You can onlydelete indexes that are not used by any Index Sets.
Add Index SetsYou can create new Index Sets by clicking from the top right pane [Create Index Set here]. In the Add IndexSet window, enter a name for the Index Set and select the indexes you want in the Set. Click OK.
Delete user-defined Index SetSelect the Index Set you want to delete from the top right pane list [Create Index Set here] and click .
Add and remove index from Index SetThe bottom pane of the User-Defined Index window allows you to add and remove indexes from the Index Setby double-clicking the corresponding cell under the Index Set name.Once you have finish creating your index(es) and Index Set(s), click OK. The new Index Sets are added anddisplayed on the tabs in the bottom left pane of the Index Advisor window.
Related TopicsAdvise Index AlternativesIndex Advisor OverviewIndex Advisor Window
Batch Show PlanThe index candidates are either generated with the Advise Index function or manually created by the User-Defined Index function. To evaluate the impact of the index candidates on the SQL statement, the query plan isneeded. You can obtain the query plans for all the index candidates by using the Batch Show Plan.
Click .Note: The indexes are physically created on the database, the query plan is retrieved, and then the indexes aredropped. This process may affect other SQL statements executing on the database during this period.
Related TopicsIndex Advisor OverviewIndex Advisor Window
SQL Optimizer for SAP ASE 3.9 User Guide 236
Create IndexesOnce the index candidates have been reviewed, you can create an index on the database.
To create an index
1. In the bottom right pane of the Index Advisor window, select the Index Set you want to create.
2. Select Index | Create Index(es).
3. The Create Indexes window displays with the CREATE INDEX statement for the selected Index Set.Click Create.
Related TopicsAdvise Index AlternativesIndex Advisor OverviewIndex Advisor Window
Analyze Impact of New IndexesAnalyzing the impact of new indexes on other SQL statements before permanently creating them on yourdatabase is essential. While improving the performance of one SQL statement, new indexes may degrade theperformance of others.First, generate or create the Index candidates for your original SQL statement in the Index Advisor window anddetermined which Index Set(s) give you the most performance for your SQL statement. Before performing theIndex Impact Analysis function, you must save the SQL statements that may be impacted by the creation of newindexes in the SQL Repository or SQL Scanner.
To analyze the impact of creating the new indexes
1. In the Index Advisor window, select the bottom-left pane of the Index Set tab for the indexes that youwant to analyze.
2. Click .
Related TopicCreate an Index Impact AnalyzerIndex Impact Analyzer Overview
Clear All Index AlternativesYou can clear all the Index Sets that have been generated in the Index Advisor window.
SQL Optimizer for SAP ASE 3.9 User Guide 237
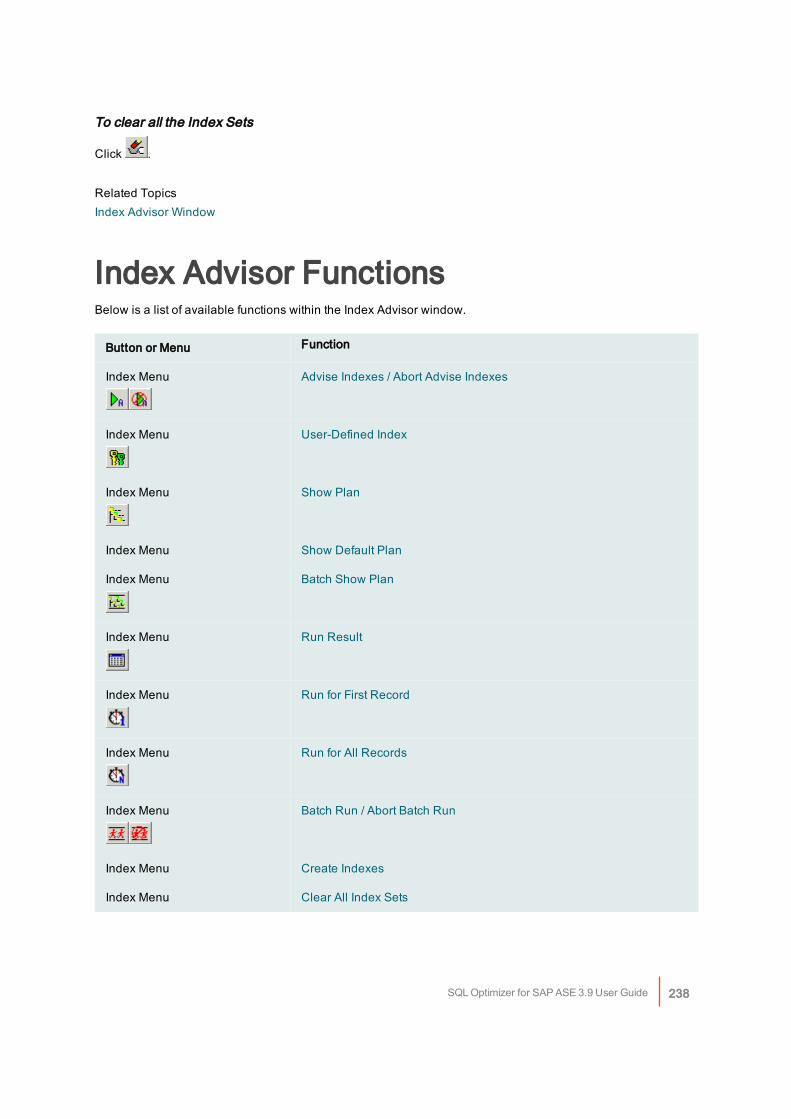
To clear all the Index Sets
Click .
Related TopicsIndex Advisor Window
Index Advisor FunctionsBelow is a list of available functions within the Index Advisor window.
Button or Menu Function
Index Menu Advise Indexes / Abort Advise Indexes
Index Menu User-Defined Index
Index Menu Show Plan
Index Menu Show Default Plan
Index Menu Batch Show Plan
Index Menu Run Result
Index Menu Run for First Record
Index Menu Run for All Records
Index Menu Batch Run / Abort Batch Run
Index Menu Create Indexes
Index Menu Clear All Index Sets
SQL Optimizer for SAP ASE 3.9 User Guide 238
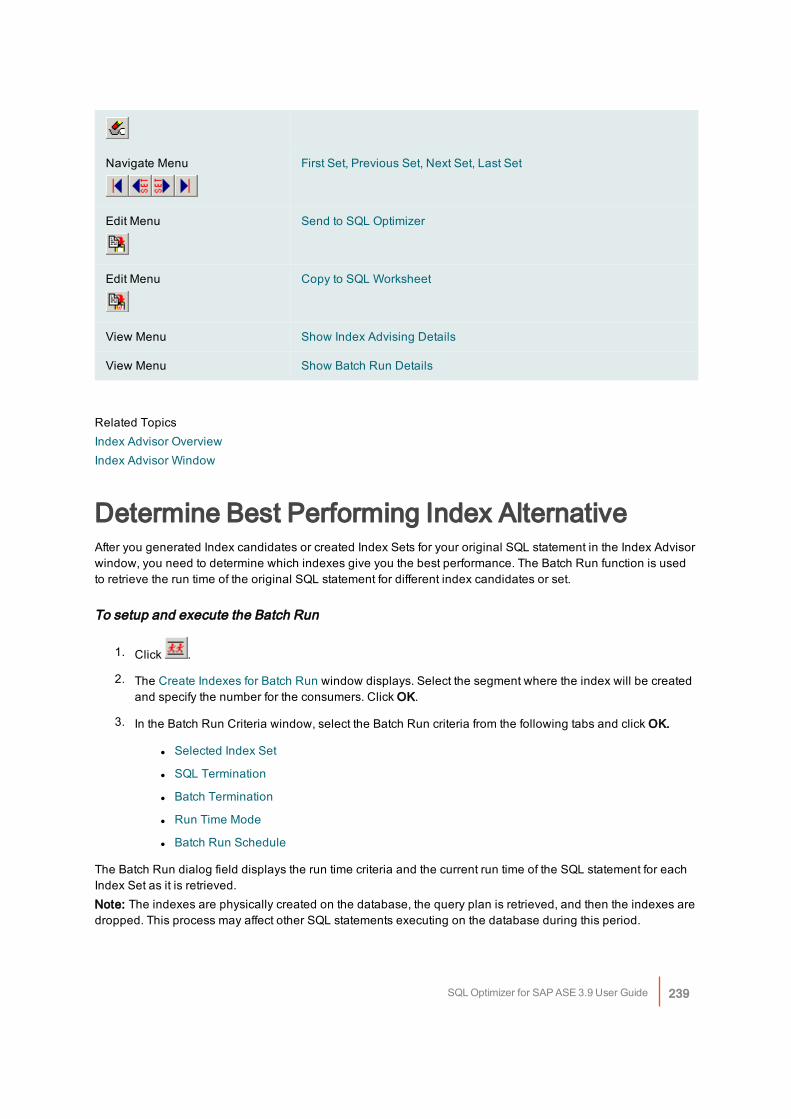
Navigate Menu First Set, Previous Set, Next Set, Last Set
Edit Menu Send to SQL Optimizer
Edit Menu Copy to SQL Worksheet
View Menu Show Index Advising Details
View Menu Show Batch Run Details
Related TopicsIndex Advisor OverviewIndex Advisor Window
Determine Best Performing Index AlternativeAfter you generated Index candidates or created Index Sets for your original SQL statement in the Index Advisorwindow, you need to determine which indexes give you the best performance. The Batch Run function is usedto retrieve the run time of the original SQL statement for different index candidates or set.
To setup and execute the Batch Run
1. Click .
2. The Create Indexes for Batch Run window displays. Select the segment where the index will be createdand specify the number for the consumers. Click OK.
3. In the Batch Run Criteria window, select the Batch Run criteria from the following tabs and click OK.
l Selected Index Set
l SQL Termination
l Batch Termination
l Run Time Mode
l Batch Run Schedule
The Batch Run dialog field displays the run time criteria and the current run time of the SQL statement for eachIndex Set as it is retrieved.Note: The indexes are physically created on the database, the query plan is retrieved, and then the indexes aredropped. This process may affect other SQL statements executing on the database during this period.
SQL Optimizer for SAP ASE 3.9 User Guide 239
To terminate the running of the SQL statement under the current Index setSelect SQL | Stop Current.
To terminate the Batch Run process
Click .
Related TopicIndex Advisor Window
Create Indexes for Batch RunThe Create Indexes for Batch Run window displays when you execute the Batch Run or Batch Show Planfunction. It enables you to specify how you would like the indexes created:
Item Description
Segment Select the segment where you would like the index created from the drop-down list.
Consumer(Default 1 Range 1-20)
Specify the number of consumer processes that should perform the sortoperation for creating the index. The actual number of consumer processesused to sort the index may be smaller than the specified number, if fewerworker processes are available when Adaptive Server executes the sort.
Related TopicDetermine Best Performing Index Alternative
Selected Index SetThe Select Index Set tab of the Batch Run Criteria window is used to select or deselect which Index Sets areapplied before retrieving the run time for the original SQL statement. All Index Sets are selected by default. Byclicking a row, an Index Set can be selected or deselected. The selected Index Sets are prefixed with a Blue
Checkmark .Note: The higher the Estimated I/O value does not necessarily mean lower performance. If possible, it isrecommended that all alternatives be tested.
To select or unselect all the index setsRight click and select Unselect All or Select All.
The Used Index can be de-selected only if the Used Index checkbox is not selected on the SQL Terminationand Batch Termination tab and the Always run Used Index first option in the Selected Index tab is not selected.
SQL Optimizer for SAP ASE 3.9 User Guide 240
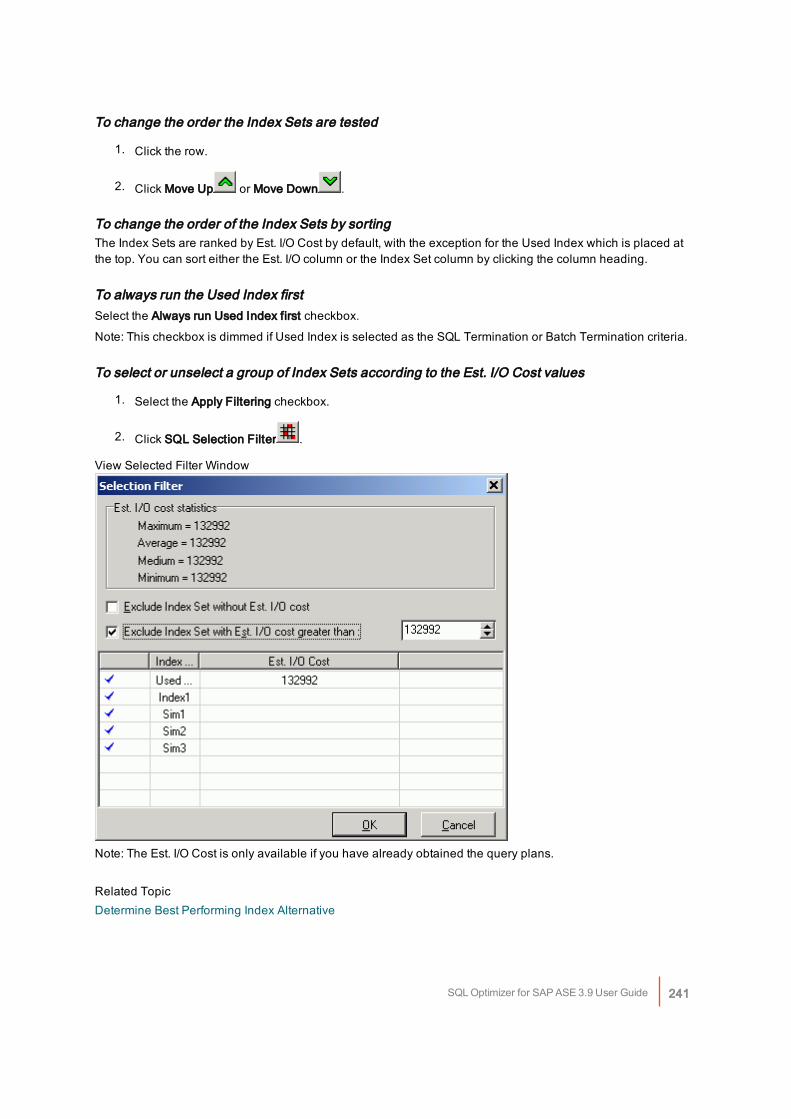
To change the order the Index Sets are tested
1. Click the row.
2. Click Move Up or Move Down .
To change the order of the Index Sets by sortingThe Index Sets are ranked by Est. I/O Cost by default, with the exception for the Used Index which is placed atthe top. You can sort either the Est. I/O column or the Index Set column by clicking the column heading.
To always run the Used Index firstSelect the Always run Used Index first checkbox.
Note: This checkbox is dimmed if Used Index is selected as the SQL Termination or Batch Termination criteria.
To select or unselect a group of Index Sets according to the Est. I/O Cost values
1. Select the Apply Filtering checkbox.
2. Click SQL Selection Filter .
View Selected Filter Window
Note: The Est. I/O Cost is only available if you have already obtained the query plans.
Related TopicDetermine Best Performing Index Alternative
SQL Optimizer for SAP ASE 3.9 User Guide 241
SQL Termination (Options)The Index Advisor provides several index candidates for the SQL statement. The SQL statement will run fasterwith some of these index alternatives and it may run longer with other index alternatives. Therefore, you willwant to terminate SQL statement when it is running longer. The SQL Termination tab is used to set thetermination criteria for the SQL statement with each index set. If the current run time for the SQL statementexceeds the termination time, then it is terminated automatically.Note: The termination time has a percentage delay added to it.
To define your termination criteria select one of the following options
Used IndexThe Used Index option enables you to retrieve the run time of SQL statements that run faster than the originalSQL statement. It terminates the SQL statement when it runs longer using an Index alternative than it ran withthe current or "used" indexes. If you choose this option, the Used Index is automatically selected on theSelected Index Set tab. During the Batch Run, you cannot terminate the SQL statement when it is running withthe Used Indexes because this run time is needed to determine when to terminate the Index alternatives.
Best running time SQLThe Best running time SQL option allows you to retrieve the run time of the SQL statement that is faster than thecurrent best run time. With this option, the run time from the first execution of the SQL statement is used as thetermination time. When a faster run is found, the faster time is used as the new termination time. So you arealways using the current fastest run time as the termination time for the next execution.Note: The first index is either the Used Index or the index with the lowest Est. I/O Cost. This depends on whetherthe Always run Used Index first option is checked on the Selected Index Set tab.
User-defined timeThe User-defined time option retrieves the run time of the SQL statement when it is less than the defined time.
Combining CriteriaYou can also combine User defined time with Used Index or Best running time SQL by clicking the Or user-defined time checkbox next to each one.
Run without TerminationThe Run without termination option allows you to retrieve the run time of the SQL statements without anytermination criteria. The SQL statement is run to completion with each Index Set.
Related TopicDetermine Best Performing Index Alternative
SQL Optimizer for SAP ASE 3.9 User Guide 242
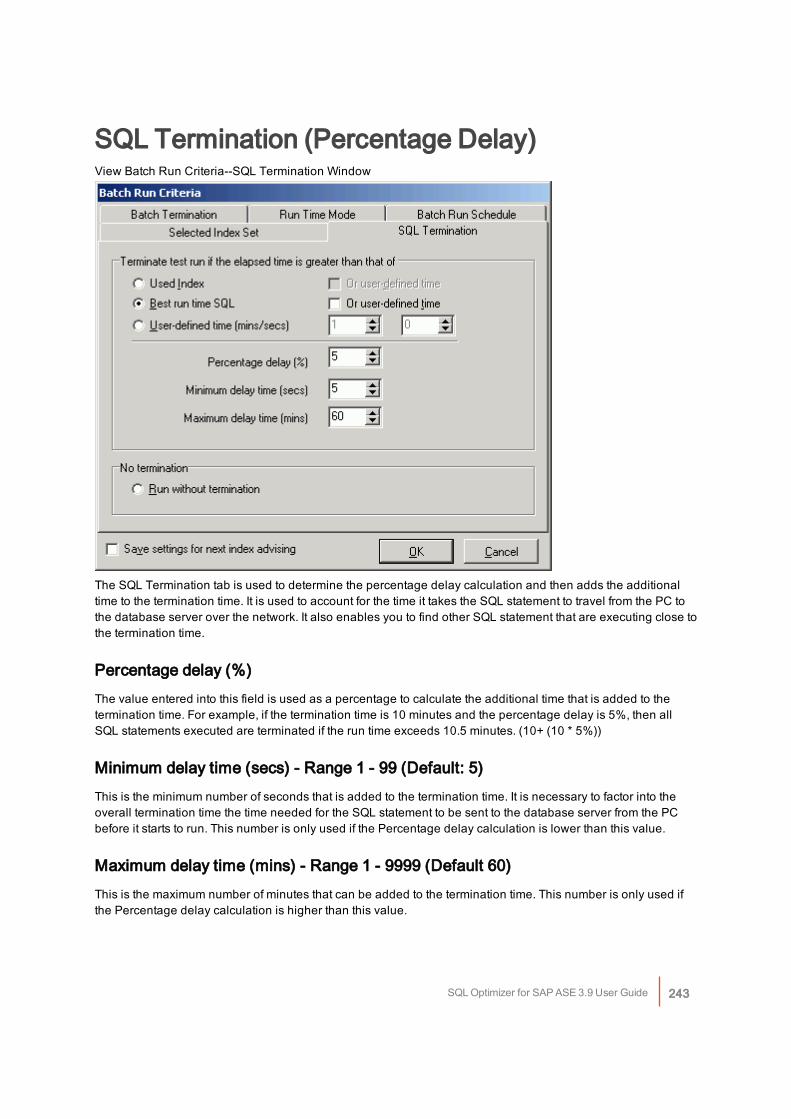
SQL Termination (Percentage Delay)View Batch Run Criteria--SQL Termination Window
The SQL Termination tab is used to determine the percentage delay calculation and then adds the additionaltime to the termination time. It is used to account for the time it takes the SQL statement to travel from the PC tothe database server over the network. It also enables you to find other SQL statement that are executing close tothe termination time.
Percentage delay (%)The value entered into this field is used as a percentage to calculate the additional time that is added to thetermination time. For example, if the termination time is 10 minutes and the percentage delay is 5%, then allSQL statements executed are terminated if the run time exceeds 10.5 minutes. (10+ (10 * 5%))
Minimum delay time (secs) - Range 1 - 99 (Default: 5)This is the minimum number of seconds that is added to the termination time. It is necessary to factor into theoverall termination time the time needed for the SQL statement to be sent to the database server from the PCbefore it starts to run. This number is only used if the Percentage delay calculation is lower than this value.
Maximum delay time (mins) - Range 1 - 9999 (Default 60)This is the maximum number of minutes that can be added to the termination time. This number is only used ifthe Percentage delay calculation is higher than this value.
SQL Optimizer for SAP ASE 3.9 User Guide 243
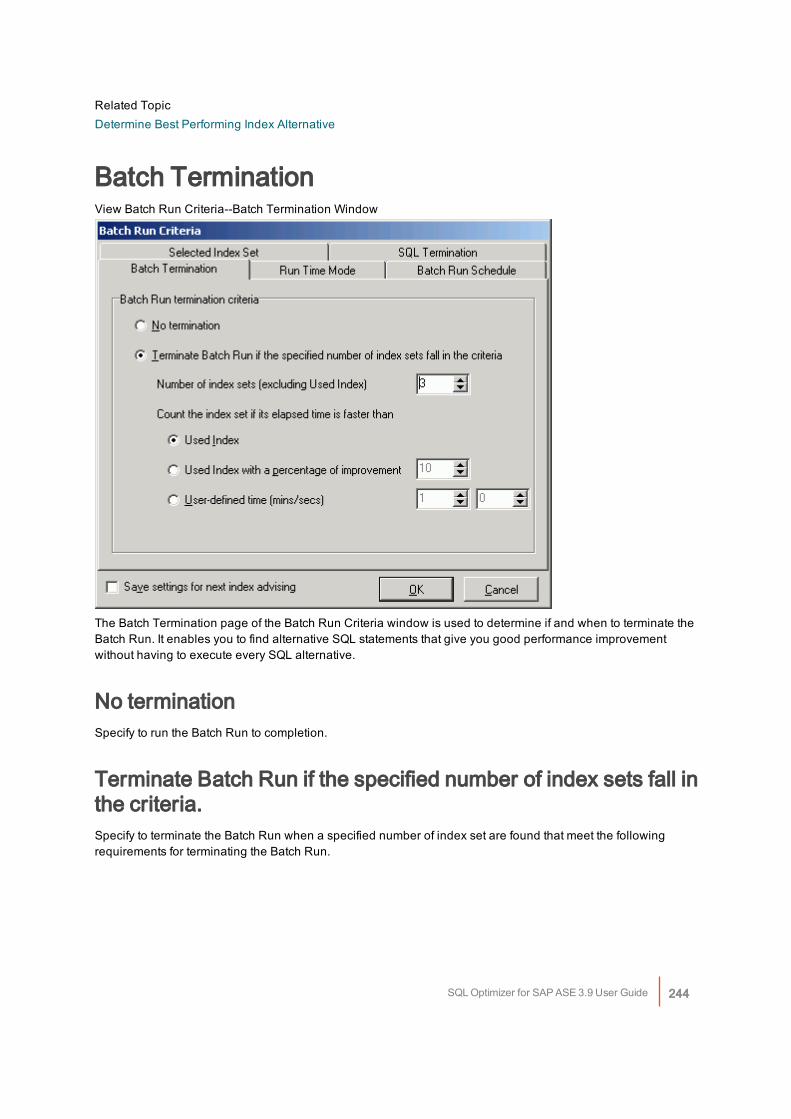
Related TopicDetermine Best Performing Index Alternative
Batch TerminationView Batch Run Criteria--Batch Termination Window
The Batch Termination page of the Batch Run Criteria window is used to determine if and when to terminate theBatch Run. It enables you to find alternative SQL statements that give you good performance improvementwithout having to execute every SQL alternative.
No terminationSpecify to run the Batch Run to completion.
Terminate Batch Run if the specified number of index sets fall inthe criteria.Specify to terminate the Batch Run when a specified number of index set are found that meet the followingrequirements for terminating the Batch Run.
SQL Optimizer for SAP ASE 3.9 User Guide 244
Number of index sets (excluding the Used Index)Specify how many index sets must be found which show performance improvement over any index that iscurrently being used.
Count the index set if its elapsed time is faster thanSpecify one of the following criteria to select how the performance improvement is determined.Used IndexCount each index set where the run time for the SQL statement is faster than the time using the indexescurrently on the database.Used Index with a percentage of improvementCount all index sets where the run time for the SQL statement is the specified percentage faster than the timeusing the indexes currently on the database.User-defined time (mins/secs)Count all index sets where the run time for the SQL statement is faster than a specified number of minutesand/or seconds.
Related TopicDetermine Best Performing Index Alternative
Run Time ModeThe Batch Run is designed to give the most accurate result by providing options for obtaining the most accuraterun time taking into account the effects of caching the data, indexes and the SQL statements. This section allowsyou to select one of the four options best suited to your SQL statement.
Run to retrieve Description
All records Specify to retrieve the run time for processing All Records.
First n Records(s) Specify to retrieve the run time for processing n records where you specify the numberof records retrieved.
Retrieve the runtime by executing
Description
Run SQL options Select one of the following options:
l Run all SQL twice if original SQL runs faster than (seconds)—Combines theOriginal SQL twice and all others once and the All SQL twice options into oneoption and allows you to determine (by the number of seconds a SQL statementruns) which option to use. The original SQL statement always runs twice. TheSQL alternatives run twice if the original SQL statement runs in less time thanthe value specified. Otherwise, the SQL alternatives all run once.
SQL Optimizer for SAP ASE 3.9 User Guide 245
l First one twice using the second run time and others once—The first time youaccess data from table, the data is cached into memory. This process takes afew moments. The next time you access that data, it is already in memory so thefollowing SQL statements run faster. So to have a comparable test, the first SQLstatement is run twice and the time from the second run is compared to the timefrom the other statements.
l All once—For long running SQL statements, there is no need to run them twicesince the effect from caching diminishes over time.
l All twice—Running all SQL statements twice enables you to eliminate somefactors that can affect the accuracy of the results. If some SQL statements havebeen recently executed, then the SQL information is likely to be resident incache and it may execute faster because of that. Also, if the SQL statements usedifferent indexes, some indexes may be resident in cache and the others arenot.Five methods of calculating the run time are available if you select this option:Excluding the first run time, Average, Sum, Maximum, and Minimum.
l Excluding the first run time—Specify to throw out the first run time and use thesecond one when all SQL statements should have the necessary items incache. This minimizes the effect that caching of the SQL statement and theindexes may have on the accuracy of the run time results.
l All multiple times—This option is suitable for SQL statements with very short runtimes. It executes the SQL statements the selected number of times. It calculatesthe run time based upon the selected calculation method. This option helps tonegate the factor of other activity running on the CPU at the same time as theSQL is executed. Since the run time is calculated from the moment the SQLstatement starts running to the time it finishes, if SQL statement shares the CPUwith other activity, the run time includes this other activity. Four methods ofcalculating the run time are available if you select this option: Average, Sum,Maximum, and Minimum.This option is only available for SELECT statements since the INSERT,UPDATE, and DELETE statements would need a rollback between each of themultiple executions.
Related TopicDetermine Best Performing Index Alternative
Batch Run ScheduleView Batch Run Criteria--Batch Run Schedule Window
SQL Optimizer for SAP ASE 3.9 User Guide 246
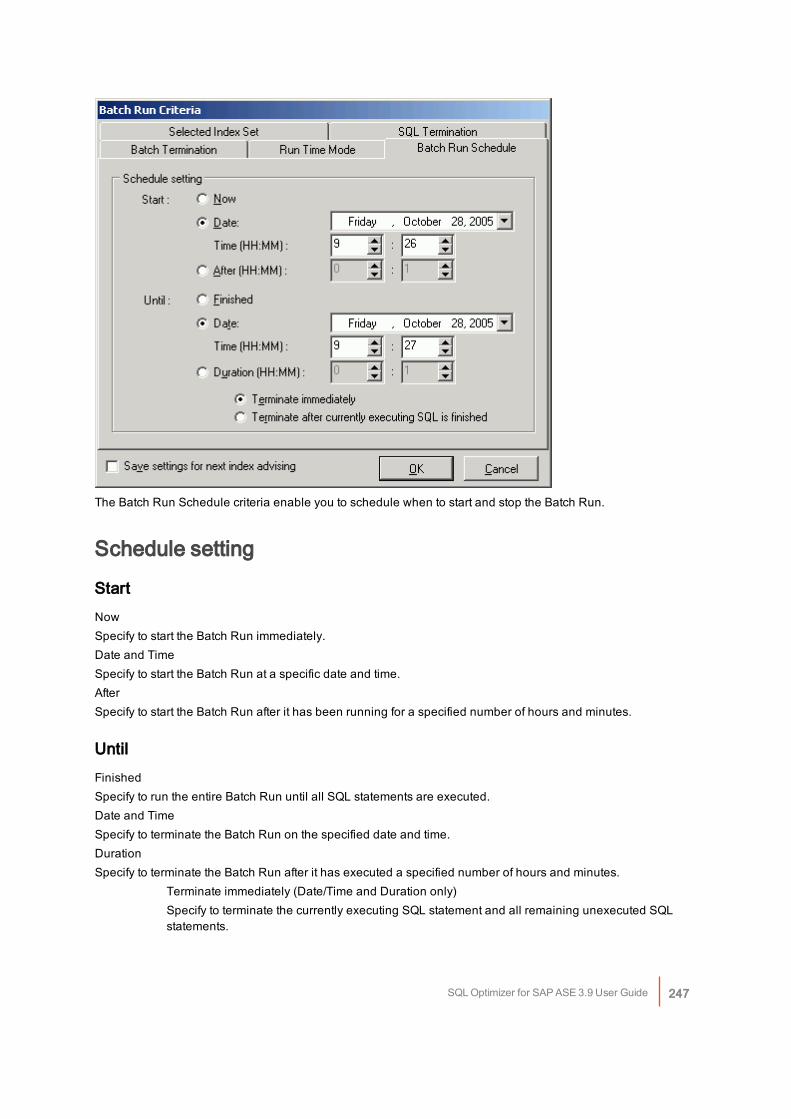
The Batch Run Schedule criteria enable you to schedule when to start and stop the Batch Run.
Schedule setting
StartNowSpecify to start the Batch Run immediately.Date and TimeSpecify to start the Batch Run at a specific date and time.AfterSpecify to start the Batch Run after it has been running for a specified number of hours and minutes.
UntilFinishedSpecify to run the entire Batch Run until all SQL statements are executed.Date and TimeSpecify to terminate the Batch Run on the specified date and time.DurationSpecify to terminate the Batch Run after it has executed a specified number of hours and minutes.
Terminate immediately (Date/Time and Duration only)Specify to terminate the currently executing SQL statement and all remaining unexecuted SQLstatements.
SQL Optimizer for SAP ASE 3.9 User Guide 247
Terminate after currently executing SQL is finished (Date/Time and Duration only)Specify to finish running the currently executing SQL statement and do not create the remainingindexes and benchmark the SQL statement against them.
Related TopicDetermine Best Performing Index Alternative
View Batch Run DetailsThe Batch Run Details window displays a summary of the run time information of the SQL statements with thealternative indexes. The Batch Run Details window displays after the batch run process is completed unless theShow details on next batch run checkbox in the Batch Run Details window is unchecked.You can review the Batch Run Details window after a Batch Run by selecting View | Show Batch Run Detailswhen the Index Advisor window is active.If a SQL statement has a database error during the Batch Run, an explanation of the error is included in theBatch Run details.
Related TopicDetermine Best Performing Index Alternative
SQL Optimizer OverviewThe SQL Optimizer module automates the optimization of SQL statements. It employs a unique engine that usesArtificial Intelligence to generate all the possible SQL alternatives that can be mathematically proven to be"semantically equivalent" to the original SQL statement which guarantees that the SQL alternatives will producethe exact same results as the original SQL statement. After the alternatives are generated, you can compareeach SQL statement to any other SQL statements to see the different SQL coding techniques for achieving thesame results. You can then test these alternative SQL statements in your environment to find the best one foryour database environment.
SQL Syntax TransformationThe first step of this engine transforms the original SQL statement and produces a group of alternative SQLstatements where the syntax was rewritten. Then, the SQL Optimizer rewrites each newly created SQLstatement to produce another group of alternatives. The engine continues rewriting each alternative until all theSQL statements cannot be rewritten any further or until the user-defined quota for the number of SQL statementsgenerated by syntax transformation is reached.In the Optimization settings, you can also control whether the optimization process will generate SQL statementsmake use of temporary tables. You can also select to use the JOIN clause (INNER JOIN, CROSS JOIN) from theAnsi-92 SQL standard or to use the original SQL syntax for joining tables.
SQL Optimizer for SAP ASE 3.9 User Guide 248
Applying Adaptive Server OptimizationTechniquesAfter the SQL Optimizer has exhausted rewriting the syntax of the SQL statement, the various techniquesavailable in Adaptive Server for optimizing a SQL statement are applied to the original SQL statement and eachof the SQL alternatives until all selected options have been applied to all the SQL alternatives or until the user-defined quota is reached.
Eliminating Duplicate Query PlanFor each rewritten SQL statement, the query plan is compared to all the other query plans. One SQL alternativeis selected for each unique query plan. Although the optimization process may generate hundreds of SQLalternatives, you will see only some of the alternatives since the alternatives with a duplicate query plan areeliminated.
Testing for Best AlternativeAlthough all the SQL alternative statements produce the same result, Adaptive Server will likely use a differentpath to retrieve the data for each one. It is difficult to decide which SQL statement will run faster without takinginto account the database structure, indexes, and data volume, so it is important to test the SQL alternatives inyour database environment using the Batch Run to determine the best SQL alternative from the run timestatistics.
Intelligence Level SettingsThe settings in the Optimizer options affect the amount of time it takes and the number of alternatives that aregenerated by the optimization process. You can quickly select to increase or decrease the intensity of theoptimization process using the Intelligence Level settings to automatically select more or less options.
Create Your Own Alternative SQLYou also have the ability to test and compare your own SQL alternatives using the Insert User-DefinedSQL function.
Related TopicOptimization EngineSQL Optimizer WindowSQL Optimizer FunctionsOptimize Original SQL Statement
SQL Optimizer for SAP ASE 3.9 User Guide 249
Optimization EngineDuring optimization, the SQL Optimizer employs a unique optimization engine that uses multiple SQL syntaxtransformation rules to produce a list of semantically equivalent SQL statements. This engine first transforms theoriginal SQL statement, hence producing a group of optimized SQL statements. It then goes on rewriting eachoptimized SQL statement to produce another group of alternatives. The engine continues rewriting until the SQLstatements cannot be rewritten any further or a set of user-defined quotas are reached.One of the searching rules is illustrated in the following example:SELECT *
FROM table_a
WHERE table_a.key in (SELECT table_b.key
FROM table_b)
If table_b.key is an indexed column, the following transformation is executed:SELECT *
FROM table_a
WHERE EXISTS (SELECT 'x'
FROM table_b
WHERE table_b.key = table_a.key)
Although the above two SQL statements produce the same result, the database may evolve two different queryplans. It is difficult to decide which SQL statement will run faster without taking into account the databasestructure, indexes, and data volume, so testing the SQL alternatives in your database environment in importantto the process of selecting the best SQL alternative.
Related TopicSQL Optimizer Overview
Common Coding Errors in SQLStatementsThe performance of database applications can be downgraded simply because common coding errors existingin SQL statements introduced by database changes such as adding a new index. Therefore it is important toreview every SQL statement existing on the database server and source code using the SQL Scanner module.Performance of SQL statements can normally be dramatically improved by correcting common coding errorsbased on database information obtained during login.The SQL Optimizer not only optimizes the input SQL statements but also corrects common coding errors basedon database information obtained during login.The followings are some examples of common mistakes found in SQL statements:Enable index search (Built-in De'Morgan Law Engine is used to solve this problem)SELECT *
FROM table_a
WHERE NOT(table_a.key + 5) > 15
SQL Optimizer for SAP ASE 3.9 User Guide 250
SELECT *
FROM table_a
WHERE table_a.key <= 15 - 5
Remove unnecessary function calls (If A.key is a not null column detected from database)SELECT *
FROM table_a
WHERE ISNULL(table_a.key,0) = 10
SELECT *
FROM table_a
WHERE table_a.key = 10
Related TopicOptimization Engine
What Function Should l Use to Retrievethe Run Time?The SQL Optimizer provides two different measurements of performance; All Records and First Record. Bothmeasurements give you an indication on the fastest running SQL statement but with two different aims. The AllRecords is the time it takes to retrieve all the records from the query. The First Record is the time it takes toretrieve the first record from the query. You must understand the intention of the SQL statement and what type ofsource code it is be embedded in. Generally, if the SQL statement is used for reports, then you should use theRun for All Records or Batch Run with Run Time Mode set to All Records. If the SQL statement is used for on-line query, then use the Run for First Record or Batch Run with Run Time Mode set to First n Record(s).Note: If the aim of the SQL statement is unknown, then use All Records as a performance indication.
Related TopicsRetrieve Run Time for a Group of SQLAnalyze Time and Statistics ResultsAnalyze Run Time ResultsAnalyze Statistics Results
Unsatisfactory Performance ResultsAfter optimization, you may discover that the performance of the optimized SQL statements is still notsatisfactory. To remedy this, first check that the searching quota has not been reached in the OptimizationDetails window. If it has, then you should increase the intelligence level or optimization options in thePreferences window and optimize again to ensure all transformed SQL statements are given. Review the queryplan of the optimized SQL statement to check if there should be any alterations to the database structure, forexample adding a new index.
SQL Optimizer for SAP ASE 3.9 User Guide 251
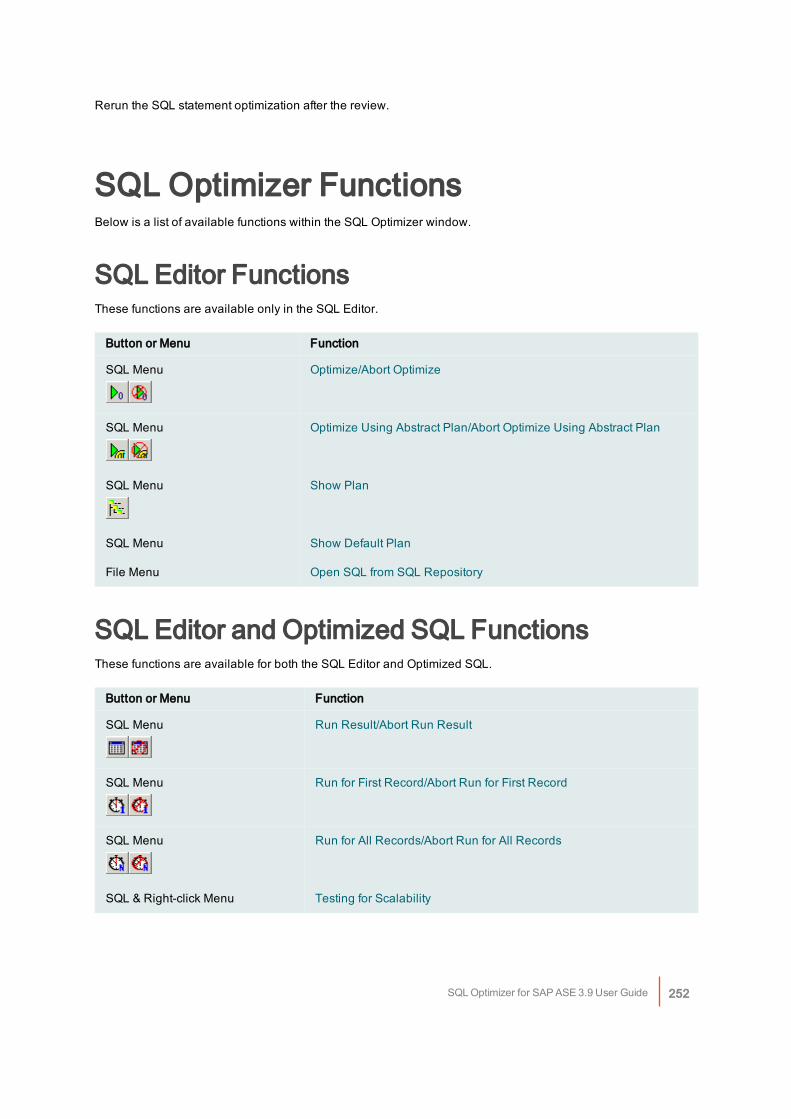
Rerun the SQL statement optimization after the review.
SQL Optimizer FunctionsBelow is a list of available functions within the SQL Optimizer window.
SQL Editor FunctionsThese functions are available only in the SQL Editor.
Button or Menu Function
SQL Menu Optimize/Abort Optimize
SQL Menu Optimize Using Abstract Plan/Abort Optimize Using Abstract Plan
SQL Menu Show Plan
SQL Menu Show Default Plan
File Menu Open SQL from SQL Repository
SQL Editor and Optimized SQL FunctionsThese functions are available for both the SQL Editor and Optimized SQL.
Button or Menu Function
SQL Menu Run Result/Abort Run Result
SQL Menu Run for First Record/Abort Run for First Record
SQL Menu Run for All Records/Abort Run for All Records
SQL & Right-click Menu Testing for Scalability
SQL Optimizer for SAP ASE 3.9 User Guide 252
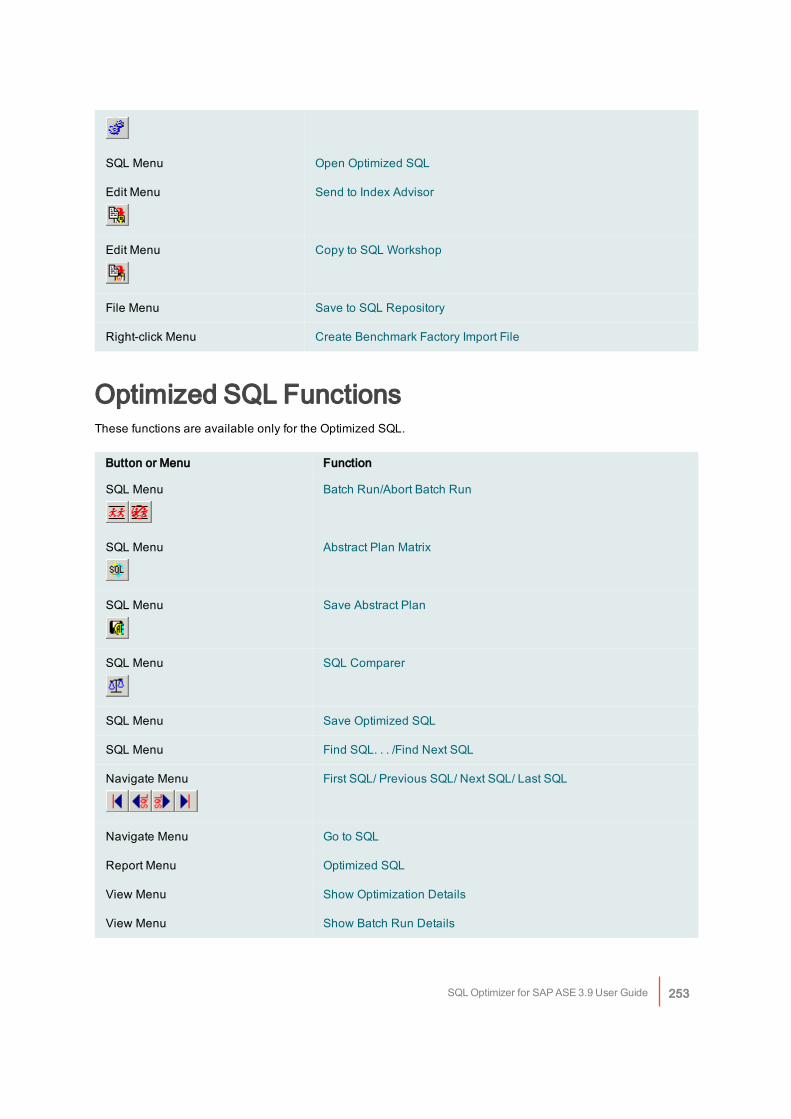
SQL Menu Open Optimized SQL
Edit Menu Send to Index Advisor
Edit Menu Copy to SQL Workshop
File Menu Save to SQL Repository
Right-click Menu Create Benchmark Factory Import File
Optimized SQL FunctionsThese functions are available only for the Optimized SQL.
Button or Menu Function
SQL Menu Batch Run/Abort Batch Run
SQL Menu Abstract Plan Matrix
SQL Menu Save Abstract Plan
SQL Menu SQL Comparer
SQL Menu Save Optimized SQL
SQL Menu Find SQL. . . /Find Next SQL
Navigate Menu First SQL/ Previous SQL/ Next SQL/ Last SQL
Navigate Menu Go to SQL
Report Menu Optimized SQL
View Menu Show Optimization Details
View Menu Show Batch Run Details
SQL Optimizer for SAP ASE 3.9 User Guide 253
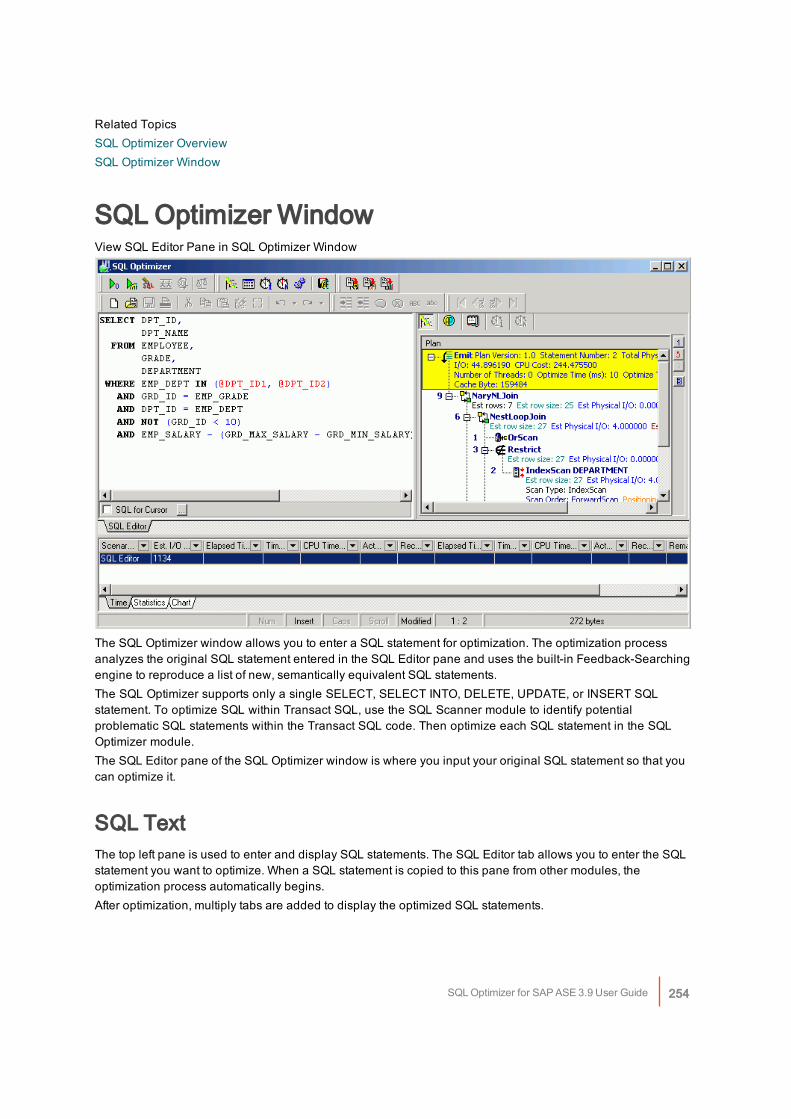
Related TopicsSQL Optimizer OverviewSQL Optimizer Window
SQL Optimizer WindowView SQL Editor Pane in SQL Optimizer Window
The SQL Optimizer window allows you to enter a SQL statement for optimization. The optimization processanalyzes the original SQL statement entered in the SQL Editor pane and uses the built-in Feedback-Searchingengine to reproduce a list of new, semantically equivalent SQL statements.The SQL Optimizer supports only a single SELECT, SELECT INTO, DELETE, UPDATE, or INSERT SQLstatement. To optimize SQL within Transact SQL, use the SQL Scanner module to identify potentialproblematic SQL statements within the Transact SQL code. Then optimize each SQL statement in the SQLOptimizer module.The SQL Editor pane of the SQL Optimizer window is where you input your original SQL statement so that youcan optimize it.
SQL TextThe top left pane is used to enter and display SQL statements. The SQL Editor tab allows you to enter the SQLstatement you want to optimize. When a SQL statement is copied to this pane from other modules, theoptimization process automatically begins.After optimization, multiply tabs are added to display the optimized SQL statements.
SQL Optimizer for SAP ASE 3.9 User Guide 254
SQL InformationThe top right pane [SQL Information] displays SQL information according to the button you select from the buttonbar at the top of this pane. These buttons include: query plan, abstract plan, and Information (SQL classificationand warning messages), All Records, and First Record. The SQL Information Pane provides detailedinformation about the SQL statement.
Run Time InformationThe Run Time information displays in three tabs in the bottom pane.
l Time
l Statistics
l Charts
Related TopicsEnter Original SQL StatementOptimize Original SQL StatementSQL Optimizer OverviewSQL Optimizer Functions
Enter Original SQL StatementThe SQL statement that you want to optimize is referred to as the original SQL statement.
To optimize a SQL statement
1. Click .
2. Enter the SQL statement by typing it in, opening an existing file, or pasting it. Parameters within the SQLstatement can be prefixed with a "@" sign or without.
To help construct a SQL statement use the member lookup, argument lookup, auto correction, indent, outdent ,comment, and uncomment functions.For SQL statements that involve temporary tables, you need to create the temporary table first before optimizingthe SQL statement using the User-Defined Temp Table window.Only one SQL Optimizer window can be opened at any time. The system will prompt you to save the originalSQL statement if you attempt to open another file.You can perform the following functions from the SQL Optimizer window:
l Retrieve the Query plan
l Retrieve the Run Time for All Records and/or First Record
l Retrieve the Run Result
l Optimize a SQL Statement
SQL Optimizer for SAP ASE 3.9 User Guide 255
Note: The SQL Optimizer supports only a single SELECT, SELECT INTO, DELETE, UPDATE and INSERT SQLstatement. To optimize SQL within Transact SQL, use the SQL Scanner module to identify potential problematicSQL statements (e.g. database objects such as Procedures.)
Related TopicsInsert User-Defined SQLSQL Optimizer OverviewSQL Optimizer Window
Retrieve Query planBy examining the query plan, you can see exactly how the database executes your SQL statement, helping youjudge whether the SQL statement is the most efficient or any changes to the table structure are needed such asadding a new index.
To view the query plan of the original SQL statement in the SQL Optimizer window
Click .If parameters exist in the original SQL statement, you are required to define the parameters and data types ofthe parameters before the query plan is retrieved. Or, alternatively use the SQL | Show Default Plan to retrievethe query plan without the need to enter parameter details. Show Default Plan allows you to quickly view thequery plan without the need to enter the data type variables.For more specific information about each step of the query plan, click any text in the step and the Plan Detailwindow displays.
Related TopicsShow Default PlanSQL Optimizer Window
Show Default PlanWhen the original SQL statement has parameters, you need to determine the data type of the parameters whenexecuting the Show Plan, Optimize, Run Result, Run for all Records, or Run for First Record functions.If you would like to view the query plan without needing to enter all the data types and values for theparameters, use the SQL | Show Default Plan to retrieve the query plan. In this case, all the parameters areassumed to have a BINARY data type when executing the Show Plan function. This is useful when you want toquickly investigate the query plan of the original SQL statement.
Related TopicRetrieve Query planSQL Optimizer Window
SQL Optimizer for SAP ASE 3.9 User Guide 256
Optimize Original SQL StatementIf sending a SQL statement from the SQL Scanner, SQL Worksheet, Database Explorer, or SQL Formatter to theSQL Optimizer (Edit | Send to SQL Optimizer), these statements are automatically optimized.
To optimize a SQL statement
1. In the SQL Optimizer window, enter the SQL statement in the SQL Editor pane of the SQL Optimizer.
2. Click .
The time it takes to optimize is dependent on the complexity of the original SQL statement and the quota valuesset in the Preferences window.During optimization, the unique optimization engine uses multiple SQL syntax transformation rules to produce alist of semantically equivalent SQL statements. Selected optimization forces from the Preferences window arealso applied to produce the list of optimized SQL statements.
To stop the optimization process
Click .It may take a few seconds to terminate all processes.Note:When setting the searching quota values that, the higher the quota, the longer it may take to optimize acomplicated SQL statement.
Related TopicOptimize Using Abstract Plan OnlySQL for Cursor CheckboxOpen Optimized SQLSQL Optimizer Window
SQL for Cursor CheckboxAdaptive Server uses a different query plan for a SQL statement that is embedded in a cursor declaration fromthe query plan when the SQL statement is not embedded in a cursor. This needs to be taken into account whenretrieving the query plan or run time and also when generating SQL alternatives.Therefore, if the original SQL statement comes from or will be embedded in a cursor declaration then you needto select SQL for Cursor in the SQL Editor pane of SQL Optimizer window. This enables cursor simulation whenretrieving the query plan and run time information.This checkbox is automatically selected in the SQL Editor pane when you use the Send to SQL Optimizerfunction from the SQL Scanner if the SQL was extracted from within a cursor declaration.In Adaptive Server 15 or later, the Declare Cursor Setting window is also available to select specificcursor settings.View Declare Cursor Settings Window
SQL Optimizer for SAP ASE 3.9 User Guide 257
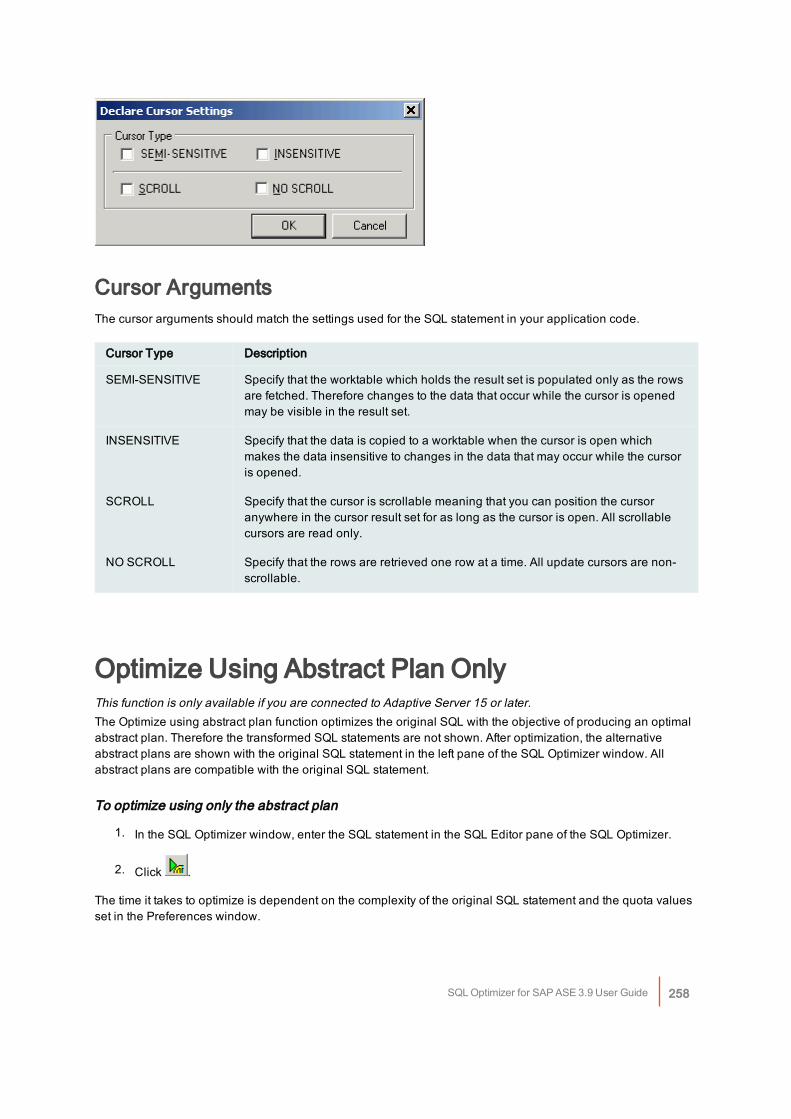
Cursor ArgumentsThe cursor arguments should match the settings used for the SQL statement in your application code.
Cursor Type Description
SEMI-SENSITIVE Specify that the worktable which holds the result set is populated only as the rowsare fetched. Therefore changes to the data that occur while the cursor is openedmay be visible in the result set.
INSENSITIVE Specify that the data is copied to a worktable when the cursor is open whichmakes the data insensitive to changes in the data that may occur while the cursoris opened.
SCROLL Specify that the cursor is scrollable meaning that you can position the cursoranywhere in the cursor result set for as long as the cursor is open. All scrollablecursors are read only.
NO SCROLL Specify that the rows are retrieved one row at a time. All update cursors are non-scrollable.
Optimize Using Abstract Plan OnlyThis function is only available if you are connected to Adaptive Server 15 or later.The Optimize using abstract plan function optimizes the original SQL with the objective of producing an optimalabstract plan. Therefore the transformed SQL statements are not shown. After optimization, the alternativeabstract plans are shown with the original SQL statement in the left pane of the SQL Optimizer window. Allabstract plans are compatible with the original SQL statement.
To optimize using only the abstract plan
1. In the SQL Optimizer window, enter the SQL statement in the SQL Editor pane of the SQL Optimizer.
2. Click .
The time it takes to optimize is dependent on the complexity of the original SQL statement and the quota valuesset in the Preferences window.
SQL Optimizer for SAP ASE 3.9 User Guide 258
To stop the optimization process
Click .It may take a few seconds to terminate all processes.Note: After the optimization, the Abstract Plan page remains blank since the abstract plan displays with theoriginal SQL statement.
Insert User-Defined SQLOnce you have entered the original SQL statement in the SQL Optimizer module, you can add your ownalternative SQL statement. You can do this either before or after you have optimized the original SQL statement.With this feature, you can benchmark test your own SQL alternatives with the alternatives created by the SQLOptimizer. Or, you can simply test your own alternatives against the original SQL statement.
To insert your own SQL alternative
1. Select the original SQL statement or the alternative SQL statement most like the one you want to insert.
2. Click .
3. Create your SQL statement.
The query plan for your SQL statement is checked to see if it matches any of the query plans for the SQLalternatives or the original SQL. If it does, you will be prompted to decide whether to insert your alternative.Note: The User-Defined SQL statements are not checked to see if they are semantically equivalent to theoriginal SQL. When you include a User-Defined SQL in a Batch Run, be sure to check the Remarks columnof Run Time pane to see if the record count for the User-Defined SQL matches the record count for theoriginal SQL.
Related TopicOptimized SQL
Open Optimized SQLAfter you have saved the optimized SQL statements to a file, you can load them back through the SQLOptimizer window:
To load a saved optimized SQL statements and alternatives
1. Select SQL | Open Optimized SQL.
2. Select the file you want to load and click Open. This loads the saved SQL statements to the SQLOptimizer window. The Open Optimized SQL Details window displays the following:
Summary tabOptimization Information
SQL Optimizer for SAP ASE 3.9 User Guide 259
Displays the original connection and optimization settings information.Last Saved Query plan InformationDisplays the saved and current connection information and whether there are any changes in SQL structure andquery plans.
User-Defined Temp Table TabIf the SQL statement uses a temporary table, the User-Defined Temp Table tab displays in this window. Itdisplays the DDL used to create the temporary table.
Changes TabIf there are any changes to the SQL structure or the access plans, the Changes tab displays inI this window. Itdisplays the SQL text along with the saved and current query plan.If there are any changes in either SQL structure or query plans it is advisable that you refresh the query plans sothat the reloaded image is a truth reflection of the current environment before any further testing is done. ClickRefresh Plan from the Open Optimized SQL Details window. If there are changes in the query plan thecorresponding SQL statements run time and statistics information are deleted. All invalid SQL statements areremoved, except for the original SQL statement. You have an option to eliminate SQL statements with duplicatequery plans.After refresh, the Refresh Plan Details window can be displayed. This window displays the number of queryplans refreshed, the total eliminated, and invalid plans.The Open Optimized SQL Details and Refresh Plan Details windows can be reviewed at a later stage.
To view the detailsSelect View | Show Open Optimized SQL Details and View | Refresh Plan Details.
Related TopicsView Open Optimized SQL DetailsRefresh Plan Details WindowSave Optimized SQLOptimized SQL
Create Benchmark Factory Import FileAll the SQL statements can be saved in a text file from the SQL Scanner, the SQL Repository, the SQLInspector, and the SQL Optimizer windows. These SQL statements can then be imported into BenchmarkFactory 4.6 or later.
To create a file to import into Benchmark Factory
1. Right-click and select Create Benchmark Factory Import File.
2. Select the specific SQL statements that you want to save.
3. Enter the filename and select the file location.
SQL Optimizer for SAP ASE 3.9 User Guide 260
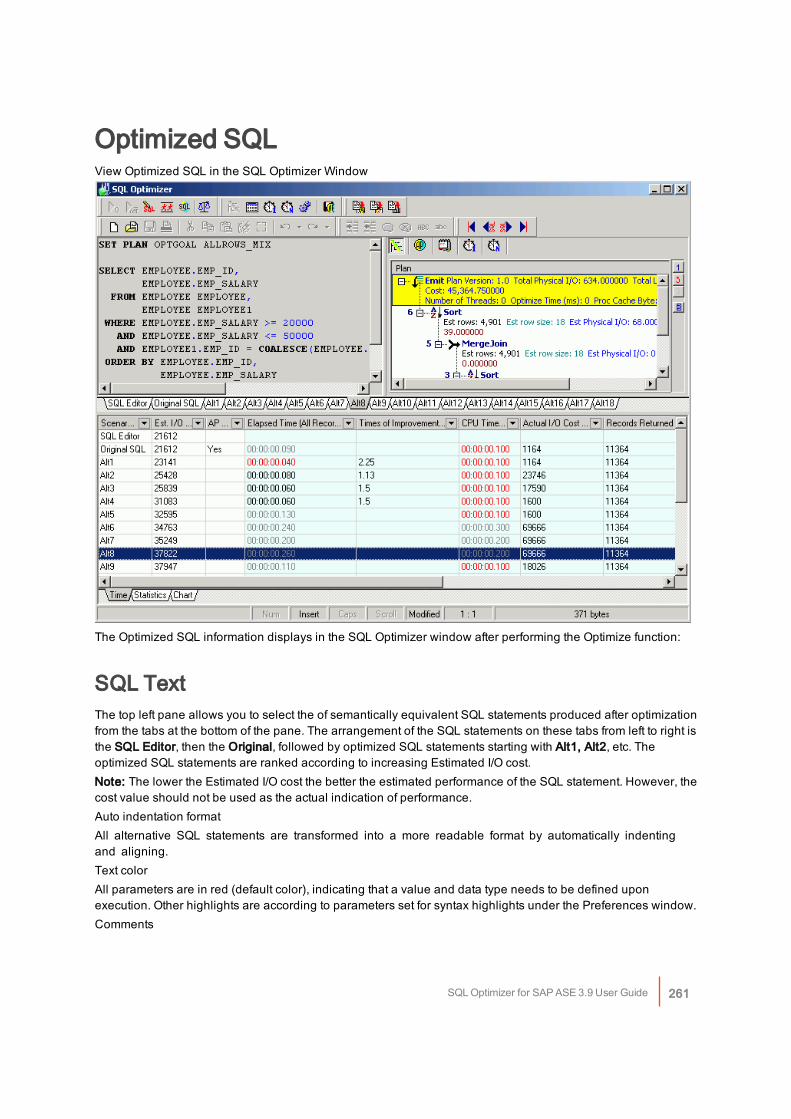
Optimized SQLView Optimized SQL in the SQL Optimizer Window
The Optimized SQL information displays in the SQL Optimizer window after performing the Optimize function:
SQL TextThe top left pane allows you to select the of semantically equivalent SQL statements produced after optimizationfrom the tabs at the bottom of the pane. The arrangement of the SQL statements on these tabs from left to right isthe SQL Editor, then the Original, followed by optimized SQL statements starting with Alt1, Alt2, etc. Theoptimized SQL statements are ranked according to increasing Estimated I/O cost.Note: The lower the Estimated I/O cost the better the estimated performance of the SQL statement. However, thecost value should not be used as the actual indication of performance.Auto indentation formatAll alternative SQL statements are transformed into a more readable format by automatically indentingand aligning.Text colorAll parameters are in red (default color), indicating that a value and data type needs to be defined uponexecution. Other highlights are according to parameters set for syntax highlights under the Preferences window.Comments
SQL Optimizer for SAP ASE 3.9 User Guide 261
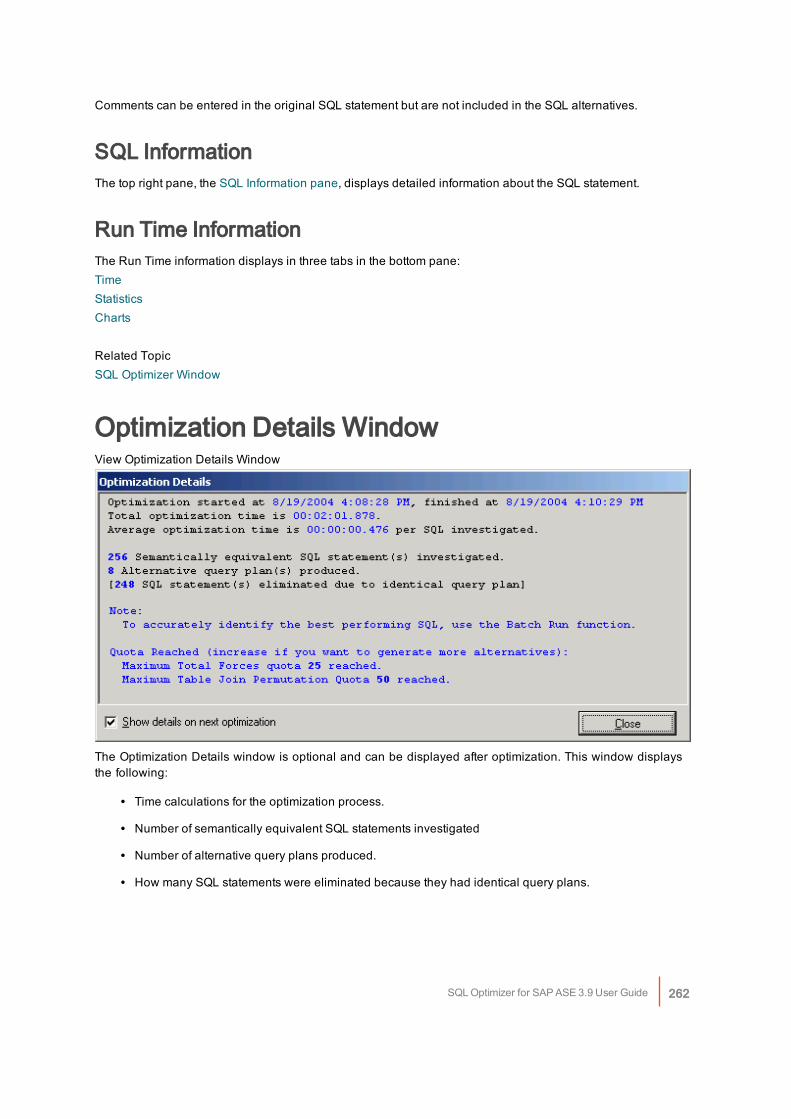
Comments can be entered in the original SQL statement but are not included in the SQL alternatives.
SQL InformationThe top right pane, the SQL Information pane, displays detailed information about the SQL statement.
Run Time InformationThe Run Time information displays in three tabs in the bottom pane:TimeStatisticsCharts
Related TopicSQL Optimizer Window
Optimization Details WindowView Optimization Details Window
The Optimization Details window is optional and can be displayed after optimization. This window displaysthe following:
l Time calculations for the optimization process.
l Number of semantically equivalent SQL statements investigated
l Number of alternative query plans produced.
l How many SQL statements were eliminated because they had identical query plans.
SQL Optimizer for SAP ASE 3.9 User Guide 262
l A warning message if the Syntax Transformation Quota, Total Forces Quota, Parallel Quota, Total Quota,or Join Path Permutation Quota is reached.
Note: Generally speaking, SQL statements with the same query plan will produce the same run time becausethe database executes the SQL statement in the same way. Therefore, newly generated SQL statements withequivalent query plans are eliminated.The Optimization Details window is shown every time optimization is finished unless it is disabled. This is doneby unselecting the Show details on next optimization option in the Optimization Details window.The Optimization Details window can be shown anytime after the optimization process by selecting View | ShowOptimization Details when the SQL Optimizer window is the active window.If no alternatives are available, the Advise Indexes button is shown for you to directly copy the original SQLstatement from the SQL Optimizer to Index Advisor for generation index candidates. The generate process willstart automatically.
Related TopicOptimize Original SQL Statement
Input Parameter Values
The SQL Optimizer identifies variables defined within a SQL statement and highlights them in red in the SQLOptimizer window. When the test run process begins, the SQL Optimizer prompts you to enter a value for thevariable and to select the data type from a list through the Parameters window.Note: The value and data type entered on the Parameters window have a direct affect of the run time and queryplan retrieved.
Analyze Time and Statistics ResultsThe results from the Run for All Records, the Run for First Record, and the Batch Run are placed in the bottomPane of the SQL Optimizer window for you to analyze and pick the SQL statement that is the best performing inyour database environment. These results are displayed in the Time, Statistics, and Charts tab.
l Time
l Statistics
l Charts
Analyze Run Time ResultsView Analyze Run Time Results Pane
SQL Optimizer for SAP ASE 3.9 User Guide 263
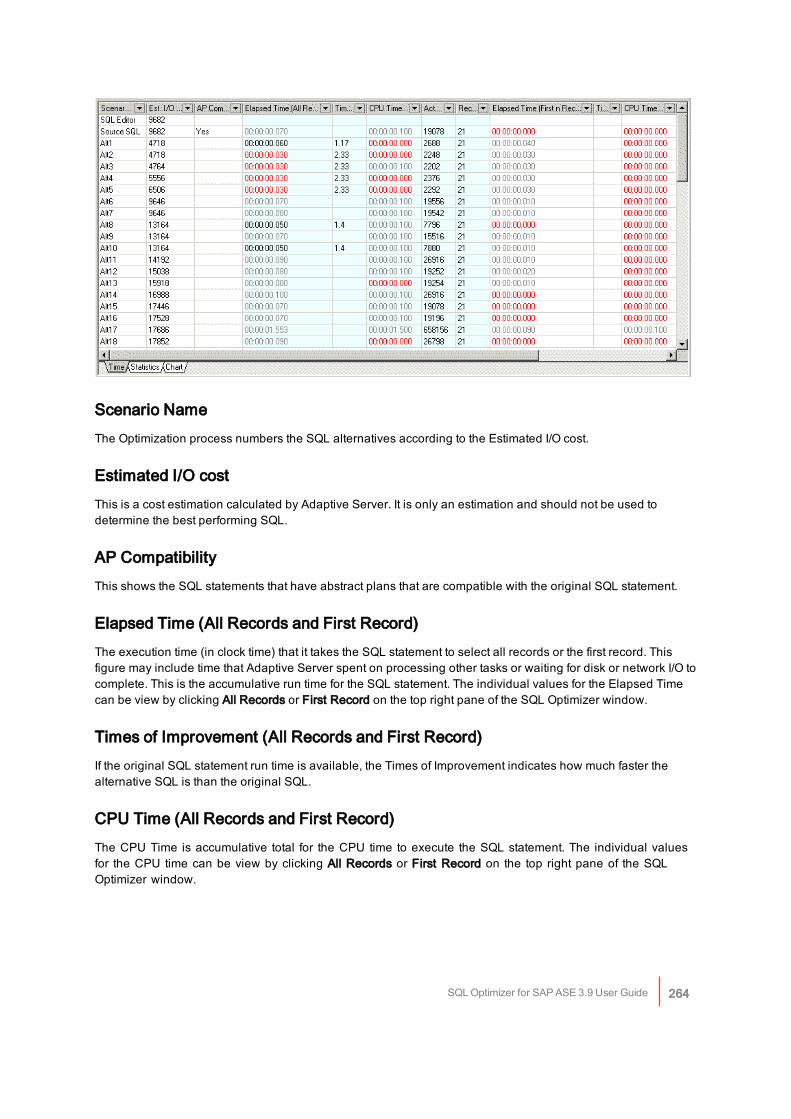
Scenario NameThe Optimization process numbers the SQL alternatives according to the Estimated I/O cost.
Estimated I/O costThis is a cost estimation calculated by Adaptive Server. It is only an estimation and should not be used todetermine the best performing SQL.
AP CompatibilityThis shows the SQL statements that have abstract plans that are compatible with the original SQL statement.
Elapsed Time (All Records and First Record)The execution time (in clock time) that it takes the SQL statement to select all records or the first record. Thisfigure may include time that Adaptive Server spent on processing other tasks or waiting for disk or network I/O tocomplete. This is the accumulative run time for the SQL statement. The individual values for the Elapsed Timecan be view by clicking All Records or First Record on the top right pane of the SQL Optimizer window.
Times of Improvement (All Records and First Record)If the original SQL statement run time is available, the Times of Improvement indicates how much faster thealternative SQL is than the original SQL.
CPU Time (All Records and First Record)The CPU Time is accumulative total for the CPU time to execute the SQL statement. The individual valuesfor the CPU time can be view by clicking All Records or First Record on the top right pane of the SQLOptimizer window.
SQL Optimizer for SAP ASE 3.9 User Guide 264
Actual I/O Cost (All Records and First Record)The Actual I/O Cost is a calculation from Adapter Server after the SQL statement is executed in the Batch Run orthe Run Time function.
Records (All Records and First Record)The Records column shows the number of records processed by the SQL statement. This number should beconstant. It is an indication that the alternative SQL statements are semantically equivalent to the originalSQL statement.
RemarksInformation from the Batch Run is included in this column. It includes:
l If the SQL was terminated by the termination criteria.
l If the SQL was run more than once.
l If a database error occurred.
Note: Estimated I/O cost, All Records Actual I/O Cost and First Record Actual I/O Cost are not available for logonusers without sa_role privileges or with the "allow resource limits" configuration parameter turned off for theAdaptive Server. To retrieve the Estimated I/O Cost, All Records Actual I/O Cost, and First Record Actual I/O Costestimations, you should either grant yourself sa_role, logon as another user with sa_role privileges, or turn onthe "allow resource limits" parameter:sp_configure "allow resource limits", 1
Related TopicAnalyze Time and Statistics Results
Analyze Statistics ResultsView Analyze Statistics Window
SQL Optimizer for SAP ASE 3.9 User Guide 265
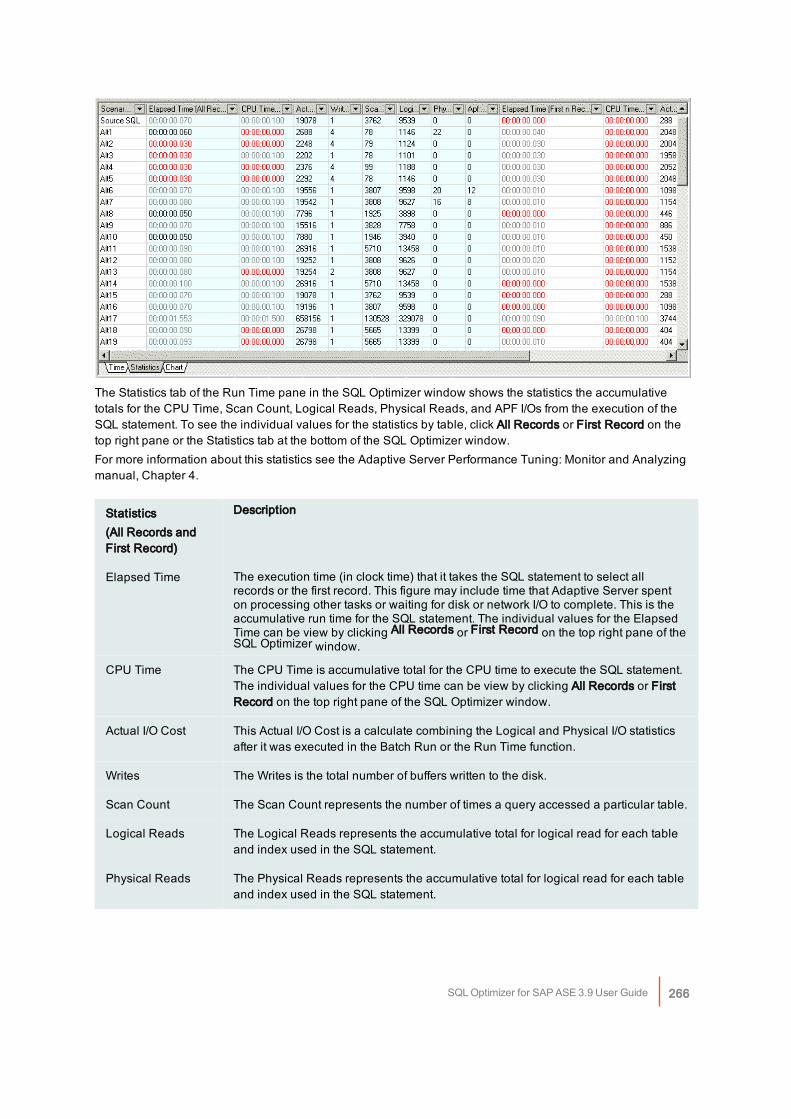
The Statistics tab of the Run Time pane in the SQL Optimizer window shows the statistics the accumulativetotals for the CPU Time, Scan Count, Logical Reads, Physical Reads, and APF I/Os from the execution of theSQL statement. To see the individual values for the statistics by table, click All Records or First Record on thetop right pane or the Statistics tab at the bottom of the SQL Optimizer window.For more information about this statistics see the Adaptive Server Performance Tuning: Monitor and Analyzingmanual, Chapter 4.
Statistics(All Records andFirst Record)
Description
Elapsed Time The execution time (in clock time) that it takes the SQL statement to select allrecords or the first record. This figure may include time that Adaptive Server spenton processing other tasks or waiting for disk or network I/O to complete. This is theaccumulative run time for the SQL statement. The individual values for the ElapsedTime can be view by clicking All Records or First Record on the top right pane of theSQL Optimizer window.
CPU Time The CPU Time is accumulative total for the CPU time to execute the SQL statement.The individual values for the CPU time can be view by clicking All Records or FirstRecord on the top right pane of the SQL Optimizer window.
Actual I/O Cost This Actual I/O Cost is a calculate combining the Logical and Physical I/O statisticsafter it was executed in the Batch Run or the Run Time function.
Writes The Writes is the total number of buffers written to the disk.
Scan Count The Scan Count represents the number of times a query accessed a particular table.
Logical Reads The Logical Reads represents the accumulative total for logical read for each tableand index used in the SQL statement.
Physical Reads The Physical Reads represents the accumulative total for logical read for each tableand index used in the SQL statement.
SQL Optimizer for SAP ASE 3.9 User Guide 266
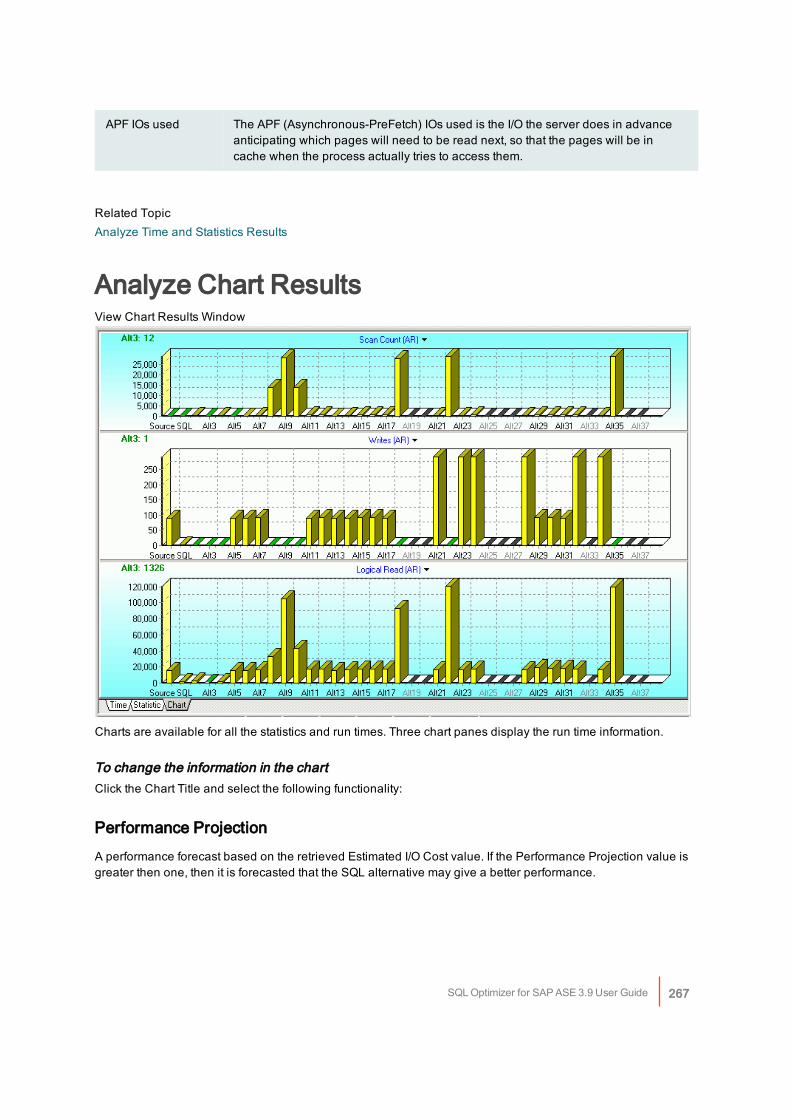
APF IOs used The APF (Asynchronous-PreFetch) IOs used is the I/O the server does in advanceanticipating which pages will need to be read next, so that the pages will be incache when the process actually tries to access them.
Related TopicAnalyze Time and Statistics Results
Analyze Chart ResultsView Chart Results Window
Charts are available for all the statistics and run times. Three chart panes display the run time information.
To change the information in the chartClick the Chart Title and select the following functionality:
Performance ProjectionA performance forecast based on the retrieved Estimated I/O Cost value. If the Performance Projection value isgreater then one, then it is forecasted that the SQL alternative may give a better performance.
SQL Optimizer for SAP ASE 3.9 User Guide 267
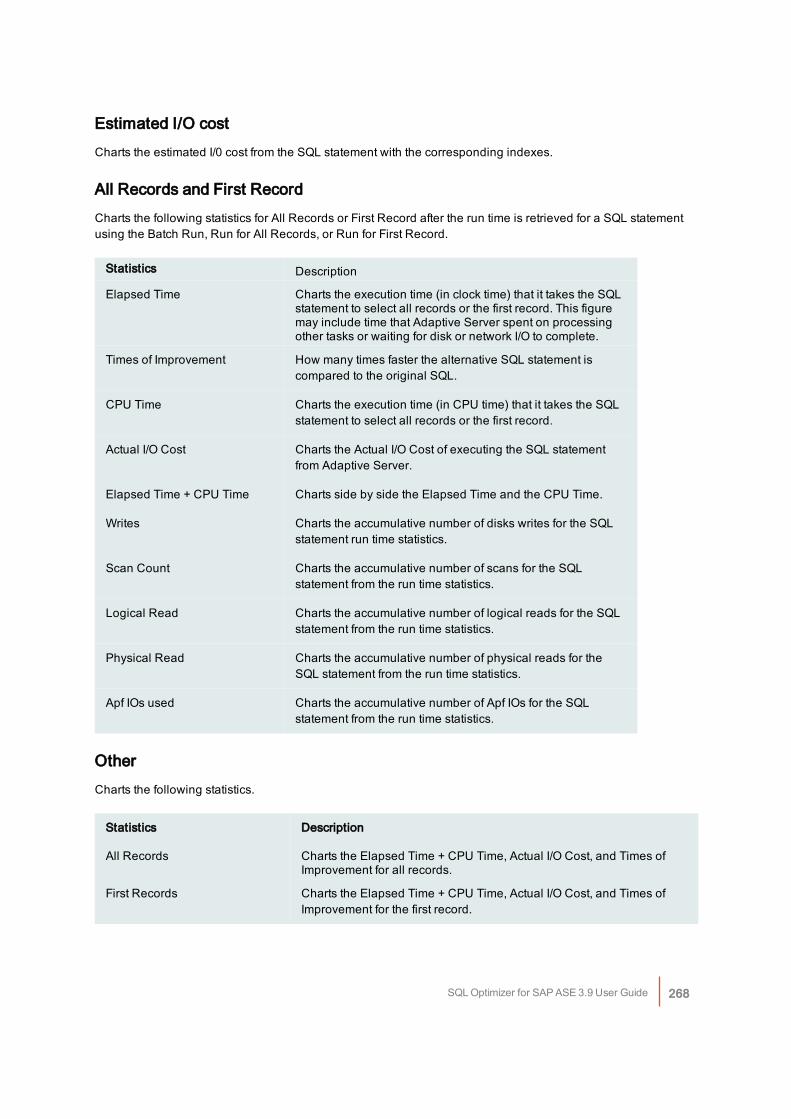
Estimated I/O costCharts the estimated I/0 cost from the SQL statement with the corresponding indexes.
All Records and First RecordCharts the following statistics for All Records or First Record after the run time is retrieved for a SQL statementusing the Batch Run, Run for All Records, or Run for First Record.
Statistics Description
Elapsed Time Charts the execution time (in clock time) that it takes the SQLstatement to select all records or the first record. This figuremay include time that Adaptive Server spent on processingother tasks or waiting for disk or network I/O to complete.
Times of Improvement How many times faster the alternative SQL statement iscompared to the original SQL.
CPU Time Charts the execution time (in CPU time) that it takes the SQLstatement to select all records or the first record.
Actual I/O Cost Charts the Actual I/O Cost of executing the SQL statementfrom Adaptive Server.
Elapsed Time + CPU Time Charts side by side the Elapsed Time and the CPU Time.
Writes Charts the accumulative number of disks writes for the SQLstatement run time statistics.
Scan Count Charts the accumulative number of scans for the SQLstatement from the run time statistics.
Logical Read Charts the accumulative number of logical reads for the SQLstatement from the run time statistics.
Physical Read Charts the accumulative number of physical reads for theSQL statement from the run time statistics.
Apf IOs used Charts the accumulative number of Apf IOs for the SQLstatement from the run time statistics.
OtherCharts the following statistics.
Statistics Description
All Records Charts the Elapsed Time + CPU Time, Actual I/O Cost, and Times ofImprovement for all records.
First Records Charts the Elapsed Time + CPU Time, Actual I/O Cost, and Times ofImprovement for the first record.
SQL Optimizer for SAP ASE 3.9 User Guide 268
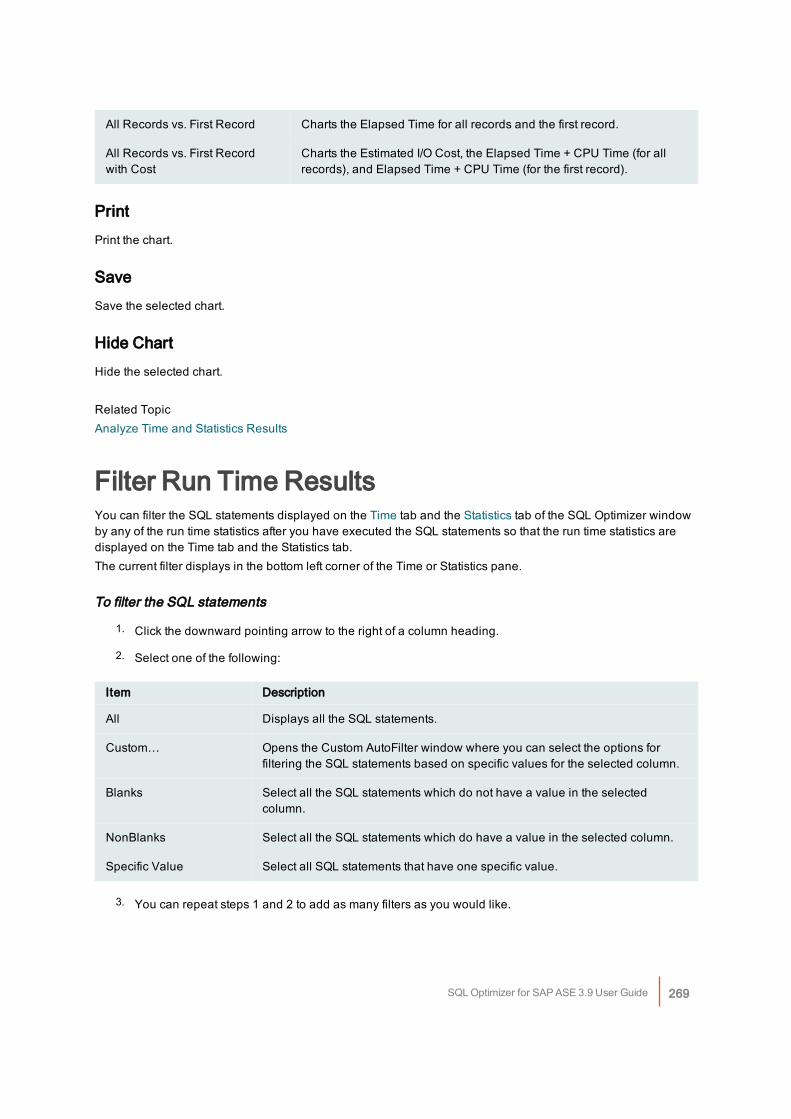
All Records vs. First Record Charts the Elapsed Time for all records and the first record.
All Records vs. First Recordwith Cost
Charts the Estimated I/O Cost, the Elapsed Time + CPU Time (for allrecords), and Elapsed Time + CPU Time (for the first record).
PrintPrint the chart.
SaveSave the selected chart.
Hide ChartHide the selected chart.
Related TopicAnalyze Time and Statistics Results
Filter Run Time ResultsYou can filter the SQL statements displayed on the Time tab and the Statistics tab of the SQL Optimizer windowby any of the run time statistics after you have executed the SQL statements so that the run time statistics aredisplayed on the Time tab and the Statistics tab.The current filter displays in the bottom left corner of the Time or Statistics pane.
To filter the SQL statements
1. Click the downward pointing arrow to the right of a column heading.
2. Select one of the following:
Item Description
All Displays all the SQL statements.
Custom… Opens the Custom AutoFilter window where you can select the options forfiltering the SQL statements based on specific values for the selected column.
Blanks Select all the SQL statements which do not have a value in the selectedcolumn.
NonBlanks Select all the SQL statements which do have a value in the selected column.
Specific Value Select all SQL statements that have one specific value.
3. You can repeat steps 1 and 2 to add as many filters as you would like.
SQL Optimizer for SAP ASE 3.9 User Guide 269
To clear the filterClick at the bottom-left corner of the Time or Statistics pane.
Find SQL Using a Text StringThe Find SQL function is available in the SQL Optimizer window. This enables the location of SQL statementsthat contain a specified text string.
To find text in a SQL statement
1. Select SQL | Find SQL to open the Find SQL window.
2. Enter the text string to be found and click Find.
3. To continue searching for the same text, select SQL | Find Next SQL [Ctrl + F3].
Related TopicSQL Optimizer Window
Generate a Report for Optimized SQLThe details of the SQL statements and run time results in the SQL Optimizer window can be generatedinto a report.
To generate the Optimized SQL report
1. Select Report | Optimized SQL to open the Optimized SQL Report Criteria window.
2. Select the components for the report.
3. Select All SQL or Select SQL and enter the specific SQL statement numbers.
Note: A few minutes may be needed to generate a long report.
Related TopicsOptimized SQLOptimization Details Window
Verify Correctness of Optimized SQL StatementsYou can verify the correctness of optimized SQL statements by comparing it with the original SQL statementusing the Run Result function and by looking at the No. of Records column in the Time tab in the SQL Optimizerwindow after retrieving the run time. This information enables you to see whether the optimized SQL statementprovides the same results as the original SQL statement.
SQL Optimizer for SAP ASE 3.9 User Guide 270
Run ResultThe Run Result function retrieves the queried records from the connected database.
Number of RecordsIn the Run Time pane of the SQL Optimizer window, the No. of Records displays the total number of recordsinfluenced by the SQL statement. This figure should remain constant for both the original and optimized SQLstatements.
First RecordIn the Run Time pane of the SQL Optimizer window, the First Record indicates the first record retrieved either 0or the number of records that was selected for First n Records in the Run Time Mode page in the Batch RunCriteria window . This figure should remain constant for both the original and optimized SQL statements.
Related TopicOptimized SQL
Insert User-Defined SQLOnce you have entered the original SQL statement in the SQL Optimizer module, you can add your ownalternative SQL statement. You can do this either before or after you have optimized the original SQL statement.With this feature, you can benchmark test your own SQL alternatives with the alternatives created by the SQLOptimizer. Or, you can simply test your own alternatives against the original SQL statement.
To insert your own SQL alternative
1. Select the original SQL statement or the alternative SQL statement most like the one you want to insert.
2. Click .
3. Create your SQL statement.
The query plan for your SQL statement is checked to see if it matches any of the query plans for the SQLalternatives or the original SQL. If it does, you will be prompted to decide whether to insert your alternative.Note: The User-Defined SQL statements are not checked to see if they are semantically equivalent to theoriginal SQL. When you include a User-Defined SQL in a Batch Run, be sure to check the Remarks columnof Run Time pane to see if the record count for the User-Defined SQL matches the record count for theoriginal SQL.
Related TopicOptimized SQL
SQL Optimizer for SAP ASE 3.9 User Guide 271
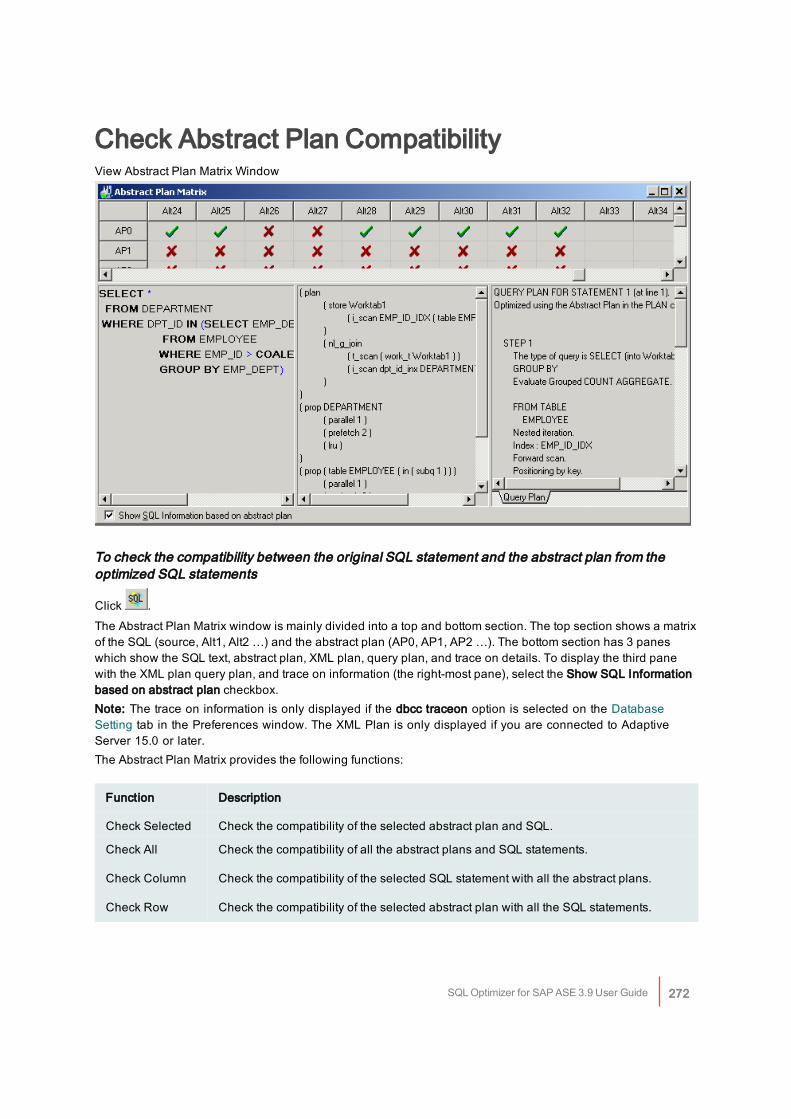
Check Abstract Plan CompatibilityView Abstract Plan Matrix Window
To check the compatibility between the original SQL statement and the abstract plan from theoptimized SQL statements
Click .The Abstract Plan Matrix window is mainly divided into a top and bottom section. The top section shows a matrixof the SQL (source, Alt1, Alt2 …) and the abstract plan (AP0, AP1, AP2 …). The bottom section has 3 paneswhich show the SQL text, abstract plan, XML plan, query plan, and trace on details. To display the third panewith the XML plan query plan, and trace on information (the right-most pane), select the Show SQL Informationbased on abstract plan checkbox.Note: The trace on information is only displayed if the dbcc traceon option is selected on the DatabaseSetting tab in the Preferences window. The XML Plan is only displayed if you are connected to AdaptiveServer 15.0 or later.The Abstract Plan Matrix provides the following functions:
Function Description
Check Selected Check the compatibility of the selected abstract plan and SQL.
Check All Check the compatibility of all the abstract plans and SQL statements.
Check Column Check the compatibility of the selected SQL statement with all the abstract plans.
Check Row Check the compatibility of the selected abstract plan with all the SQL statements.
SQL Optimizer for SAP ASE 3.9 User Guide 272
Related TopicsOptimize Using Abstract Plan OnlyAbstract Plan Manager OverviewAbstract Plan Compatibility with Original SQLSave Abstract Plan
Save Abstract PlanTo save the abstract plan from the SQL Optimizer window to the database
1. Open the Save Abstract Plan window by clicking .
2. In the Save to group drop-down field, select the group where you want to store your abstract plan.
3. In the SQL drop-down field, select the SQL statement you want to associate with an abstract plan. This isusually your original SQL statement.
4. In the Abstract plan from SQL drop-down field, select the SQL statement that you determined is the bestabstract plan for your application.
5. Click Save.
Note: Only save an abstract plan that is compatible with the original SQL text. Otherwise, the abstract plan willnot be used the next time you execute the original SQL.When the Abstract Plan is saved, it is only saved for the user that you are logged on as. In order for another userto use this abstract plan, you must export/import the plan to another user.At the prompt "Plan has been created successfully. The id is nnnnnnnnnn". Click OK. The abstract plan issaved in Adaptive Server.Note: Adaptive Server saves the abstract plan in the sysqueryplans system table. When a query is executed,Adaptive Server looks in the sysqueryplans table for a stored SQL text that matches the query. If a match isfound, the saved abstract plan is used to execute the query.Saving the abstract plan onto the database means that when the same SQL statement is executed, the queryplan is based on the abstract plan.Warning: When saving the abstract plan, Adaptive Server automatically trims the white-spaces from the SQLtext replacing it with one space. You need to make sure the SQL statement you execute in your application isthe same as the original SQL text that you saved with the abstract plan. If the SQL text does not match, then theabstract plan will not be used.Here are some examples you need to be aware of:Spaces in between functionswhere substring ( EMP_NAME, 1, 5 ) = 'SMITH'This is not the same aswhere substring(EMP_NAME,1,5) = 'SMITH'
Spaces in between database, scheme and object namefrom sqlexp . sqlexp . EMPLOYEE
This is not the same asfrom sqlexp.sqlexp.EMPLOYEE
Parameter replacement
SQL Optimizer for SAP ASE 3.9 User Guide 273
where EMP_ID = @var_a
This is not the same asif @var_a = 56
where EMP_ID = 56
Commentswhere EMP_ID =123 /* comment */
This is not the same aswhere EMP_ID = 123
Related TopicsCheck Abstract Plan CompatibilityAbstract Plan Manager OverviewWhy Save the Abstract Plan?Abstract Plan Manager WindowAbstract Plan Compatibility with Original SQLUse Saved Abstract Plans
Test for ScalabilityYou can test a single SQL statement to find out how it will perform under different amounts of data in yourdatabase in Quest's Benchmark Factory program (version 4.6 or later).
To send SQL statement to Benchmark Factory:
1. Optimize the original SQL statement.
2. Select the original or one of the SQL alternatives
3. Click .
Save Optimized SQLYou can save the Optimized SQL statements. Unlike a report, this file is used to reload the SQL back to the SQLOptimizer window using the Open Optimized SQL function.
To save the original SQL and the SQL alternativesSelect SQL | Save Optimized SQL.
Related TopicsOptimized SQLOpen Optimized SQL
SQL Optimizer for SAP ASE 3.9 User Guide 274
Open Optimized SQLAfter you have saved the optimized SQL statements to a file, you can load them back through the SQLOptimizer window:
To load a saved optimized SQL statements and alternatives
1. Select SQL | Open Optimized SQL.
2. Select the file you want to load and click Open. This loads the saved SQL statements to the SQLOptimizer window. The Open Optimized SQL Details window displays the following:
Summary tab
Optimization InformationDisplays the original connection and optimization settings information.Last Saved Query plan InformationDisplays the saved and current connection information and whether there are any changes in SQL structure andquery plans.
User-Defined Temp Table Tab
If the SQL statement uses a temporary table, the User-Defined Temp Table tab displays in this window. Itdisplays the DDL used to create the temporary table.
Changes Tab
If there are any changes to the SQL structure or the access plans, the Changes tab displays inI this window. Itdisplays the SQL text along with the saved and current query plan.If there are any changes in either SQL structure or query plans it is advisable that you refresh the query plans sothat the reloaded image is a truth reflection of the current environment before any further testing is done. ClickRefresh Plan from the Open Optimized SQL Details window. If there are changes in the query plan thecorresponding SQL statements run time and statistics information are deleted. All invalid SQL statements areremoved, except for the original SQL statement. You have an option to eliminate SQL statements with duplicatequery plans.After refresh, the Refresh Plan Details window can be displayed. This window displays the number of queryplans refreshed, the total eliminated, and invalid plans.The Open Optimized SQL Details and Refresh Plan Details windows can be reviewed at a later stage.
To view the detailsSelect View | Show Open Optimized SQL Details and View | Refresh Plan Details.
Related TopicsView Open Optimized SQL DetailsRefresh Plan Details WindowSave Optimized SQLOptimized SQL
SQL Optimizer for SAP ASE 3.9 User Guide 275
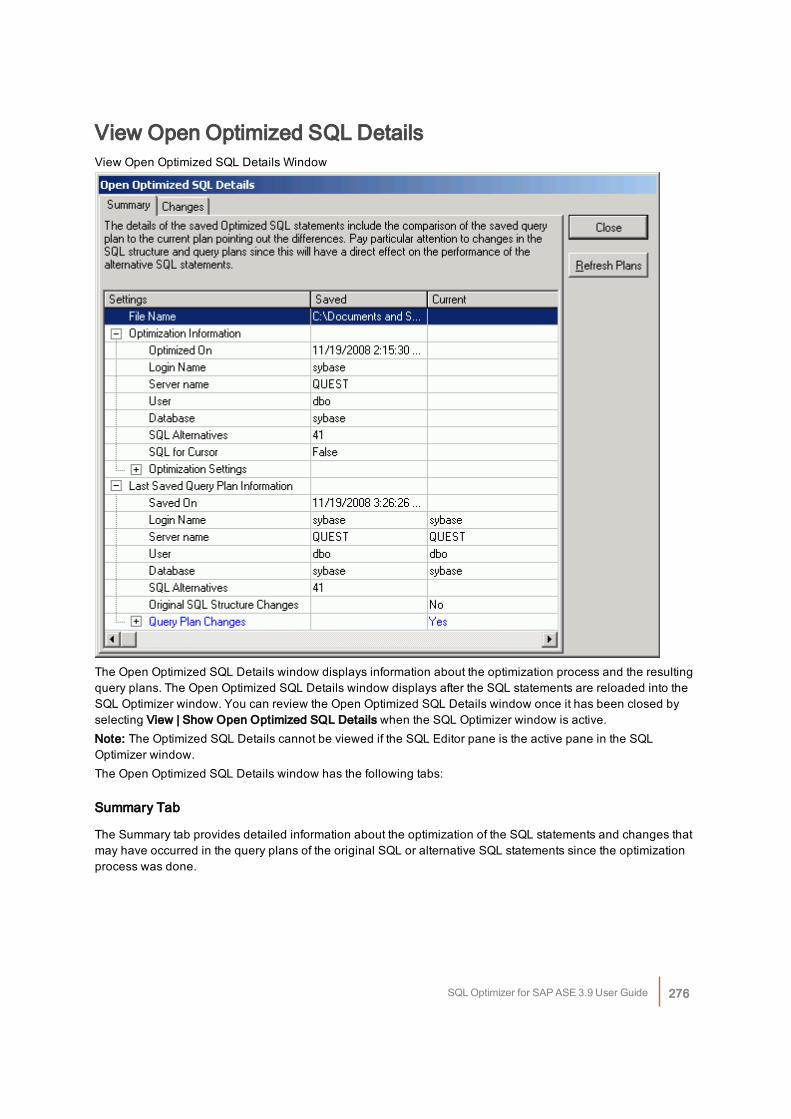
View Open Optimized SQL DetailsView Open Optimized SQL Details Window
The Open Optimized SQL Details window displays information about the optimization process and the resultingquery plans. The Open Optimized SQL Details window displays after the SQL statements are reloaded into theSQL Optimizer window. You can review the Open Optimized SQL Details window once it has been closed byselecting View | Show Open Optimized SQL Details when the SQL Optimizer window is active.Note: The Optimized SQL Details cannot be viewed if the SQL Editor pane is the active pane in the SQLOptimizer window.The Open Optimized SQL Details window has the following tabs:
Summary Tab
The Summary tab provides detailed information about the optimization of the SQL statements and changes thatmay have occurred in the query plans of the original SQL or alternative SQL statements since the optimizationprocess was done.
SQL Optimizer for SAP ASE 3.9 User Guide 276
Optimization Information
The optimization information includes the date and time of the optimization, how many alternatives werecreated, the connection information, and the optimization settings from the Preferences window at the time ofthis optimization.
Last Saved Query Plan Information
The query plan information includes the date and time of the SQL statements that were saved, how manyalternatives were created, the connection information, and if any of the query plans have changed since the timethey were saved.During the process of opening the Save Optimized SQL, the current query plan is retrieved and compared to thesaved query plan. The changes are noted in the Current column as follows:
Current column item Description
Cost only The only change to the query plan was a change in the Estimated I/O cost.
Structure and cost Both the structure and Estimated I/O cost of the query plan changed.
Structure only The structure of the query plan changed but the Estimated I/O cost remainedthe same.
No The current query plan is the same as the query plan that was saved with theSQL statement.
Refresh Plan Button
The Refresh Plan button enables you to replace old query plans with the current plans. This process retrievesthe current query plans, deletes any SQL statement that is now invalid, removes any run time information. Youcan select to eliminate SQL alternatives that now have duplicate query plans. After the query plans arerefreshed, the Refresh Plan Details window displays.Note: The Refresh Plan button is only enabled when there is a difference between the current query plan andthe saved plan.
Changes Tab
The Changes tab displays the text of the SQL statement in the top pane. The bottom pane displays the savedquery plan and the current query plan side by side for comparison.
User-Defined Temp Table Tab
The User-Defined Temp Table tab is available only if the SQL statements use a temporary table. When theOptimized SQL statements were saved, the DDL for creating the temporary table is saved with them and whenthe SQL statements are reloaded the DDL displays.
Refresh Plan Details WindowThe Refresh Plan Details window tells how many SQL statements were refreshed and it any of the SQLalternatives were eliminated due to duplicate query plans or invalid SQL statements. It also displays the SQL for
SQL Optimizer for SAP ASE 3.9 User Guide 277
Cursor setting that was used and tells whether a temporary table was used.This window is only available after the saved query plans were replaced with the current query plans by clickingRefresh Plan on the Open Optimized SQL Details window.
Retrieve Run Time for a Group of SQLThe Batch Run function is used to retrieve the run time of a group of optimized SQL statements.
To start the Batch Run
Click to open the Batch Run Criteria window.The Batch Run Criteria window is divided into the following tabs:
l Selected SQL
l SQL Termination
l Batch Termination
l Run Time Mode
l Batch Run Schedule
Select your batch run criteria and click OK. The Batch Run window displays the run time criteria and the run timeof the SQL statements as it is retrieved. SQL | Stop Current and SQL | Abort Batch Run functions are availableto terminate the currently running SQL statement and stop the batch run process. Each selected SQL statementis execute sequentially retrieving the run time unless terminated.
To terminate the currently running of the SQL statementSelect SQL | Stop Current.
To terminate the batch run process
Click .Note: For UPDATE, INSERT, and DELETE SQL statements, while retrieving the run time and run result you mayencounter the following Adaptive Server error message:
allocate space for object 'syslogs' in database 'sqlexp' because the 'logsegment' segment is full. Ifyou ran out of space in syslogs, dump the transaction log. Otherwise, use ALTER DATABASE orsp_extendsegment to increase the size of the segment
This is due to the lack of space in system table (syslogs) in which all changes to the database arerecorded. Empty the transaction log in the database and re-execute. Use the following command in the SQLWorkshop module:
DUMP TRANSACTION database_name WITH TRUNCATE_ONLYgo
Related TopicsRun Time
SQL Optimizer for SAP ASE 3.9 User Guide 278
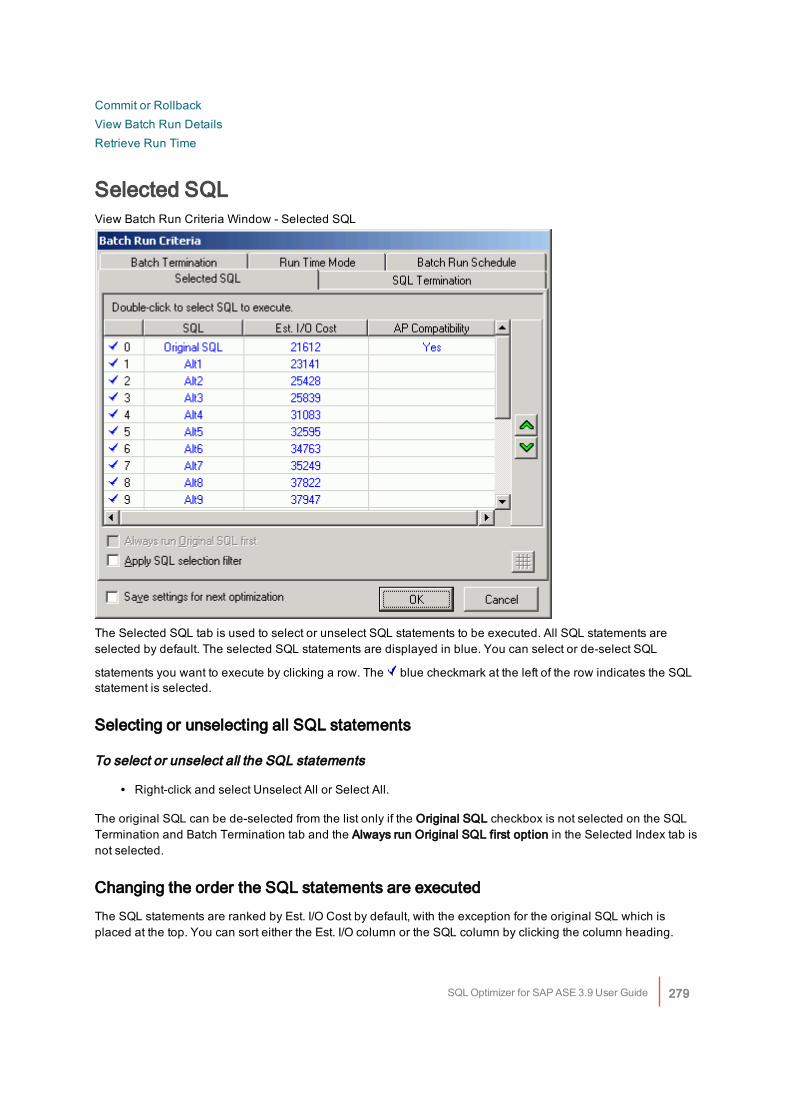
Commit or RollbackView Batch Run DetailsRetrieve Run Time
Selected SQLView Batch Run Criteria Window - Selected SQL
The Selected SQL tab is used to select or unselect SQL statements to be executed. All SQL statements areselected by default. The selected SQL statements are displayed in blue. You can select or de-select SQL
statements you want to execute by clicking a row. The blue checkmark at the left of the row indicates the SQLstatement is selected.
Selecting or unselecting all SQL statements
To select or unselect all the SQL statements
l Right-click and select Unselect All or Select All.
The original SQL can be de-selected from the list only if the Original SQL checkbox is not selected on the SQLTermination and Batch Termination tab and the Always run Original SQL first option in the Selected Index tab isnot selected.
Changing the order the SQL statements are executedThe SQL statements are ranked by Est. I/O Cost by default, with the exception for the original SQL which isplaced at the top. You can sort either the Est. I/O column or the SQL column by clicking the column heading.
SQL Optimizer for SAP ASE 3.9 User Guide 279
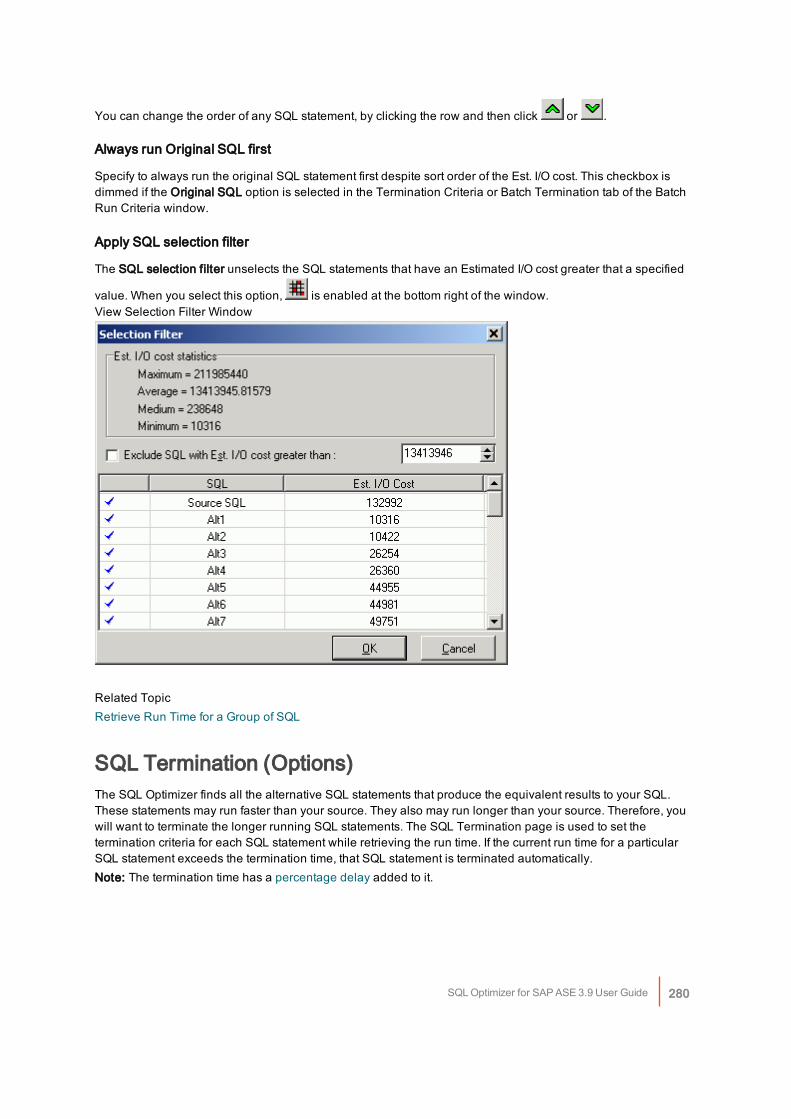
You can change the order of any SQL statement, by clicking the row and then click or .
Always run Original SQL first
Specify to always run the original SQL statement first despite sort order of the Est. I/O cost. This checkbox isdimmed if the Original SQL option is selected in the Termination Criteria or Batch Termination tab of the BatchRun Criteria window.
Apply SQL selection filter
The SQL selection filter unselects the SQL statements that have an Estimated I/O cost greater that a specified
value. When you select this option, is enabled at the bottom right of the window.View Selection Filter Window
Related TopicRetrieve Run Time for a Group of SQL
SQL Termination (Options)The SQL Optimizer finds all the alternative SQL statements that produce the equivalent results to your SQL.These statements may run faster than your source. They also may run longer than your source. Therefore, youwill want to terminate the longer running SQL statements. The SQL Termination page is used to set thetermination criteria for each SQL statement while retrieving the run time. If the current run time for a particularSQL statement exceeds the termination time, that SQL statement is terminated automatically.Note: The termination time has a percentage delay added to it.
SQL Optimizer for SAP ASE 3.9 User Guide 280
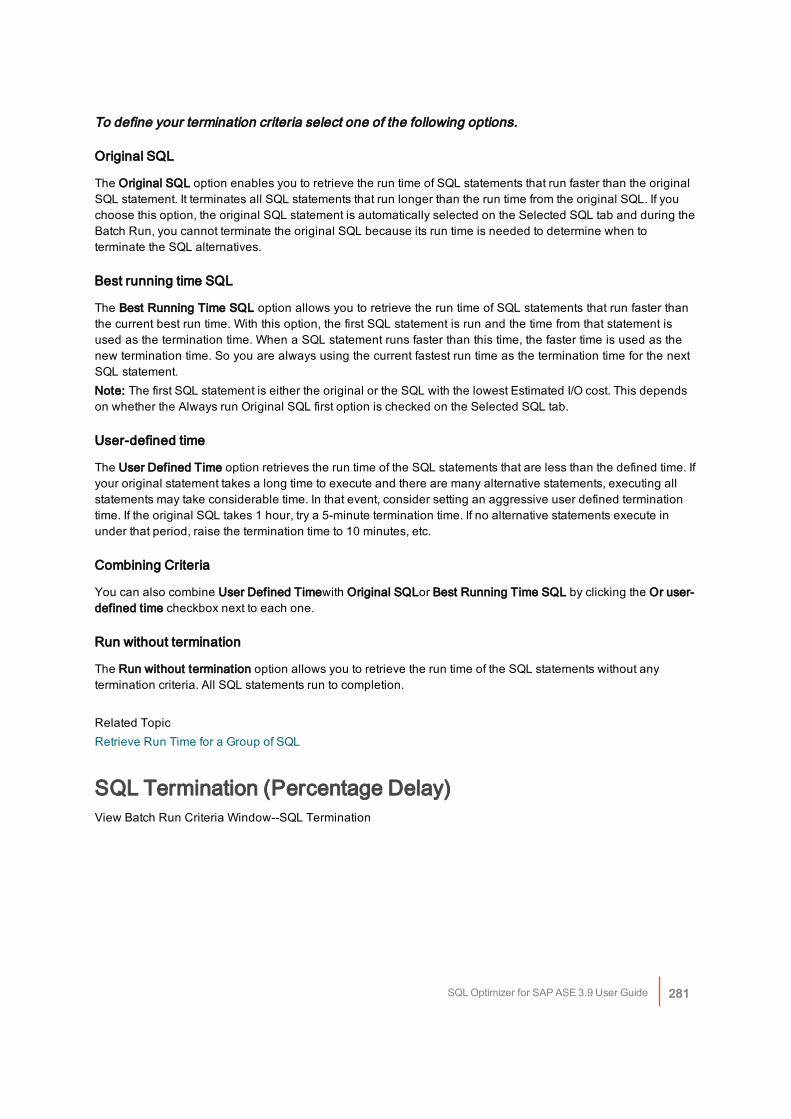
To define your termination criteria select one of the following options.
Original SQL
The Original SQL option enables you to retrieve the run time of SQL statements that run faster than the originalSQL statement. It terminates all SQL statements that run longer than the run time from the original SQL. If youchoose this option, the original SQL statement is automatically selected on the Selected SQL tab and during theBatch Run, you cannot terminate the original SQL because its run time is needed to determine when toterminate the SQL alternatives.
Best running time SQL
The Best Running Time SQL option allows you to retrieve the run time of SQL statements that run faster thanthe current best run time. With this option, the first SQL statement is run and the time from that statement isused as the termination time. When a SQL statement runs faster than this time, the faster time is used as thenew termination time. So you are always using the current fastest run time as the termination time for the nextSQL statement.Note: The first SQL statement is either the original or the SQL with the lowest Estimated I/O cost. This dependson whether the Always run Original SQL first option is checked on the Selected SQL tab.
User-defined time
The User Defined Time option retrieves the run time of the SQL statements that are less than the defined time. Ifyour original statement takes a long time to execute and there are many alternative statements, executing allstatements may take considerable time. In that event, consider setting an aggressive user defined terminationtime. If the original SQL takes 1 hour, try a 5-minute termination time. If no alternative statements execute inunder that period, raise the termination time to 10 minutes, etc.
Combining Criteria
You can also combine User Defined Timewith Original SQLor Best Running Time SQL by clicking the Or user-defined time checkbox next to each one.
Run without termination
The Run without termination option allows you to retrieve the run time of the SQL statements without anytermination criteria. All SQL statements run to completion.
Related TopicRetrieve Run Time for a Group of SQL
SQL Termination (Percentage Delay)View Batch Run Criteria Window--SQL Termination
SQL Optimizer for SAP ASE 3.9 User Guide 281
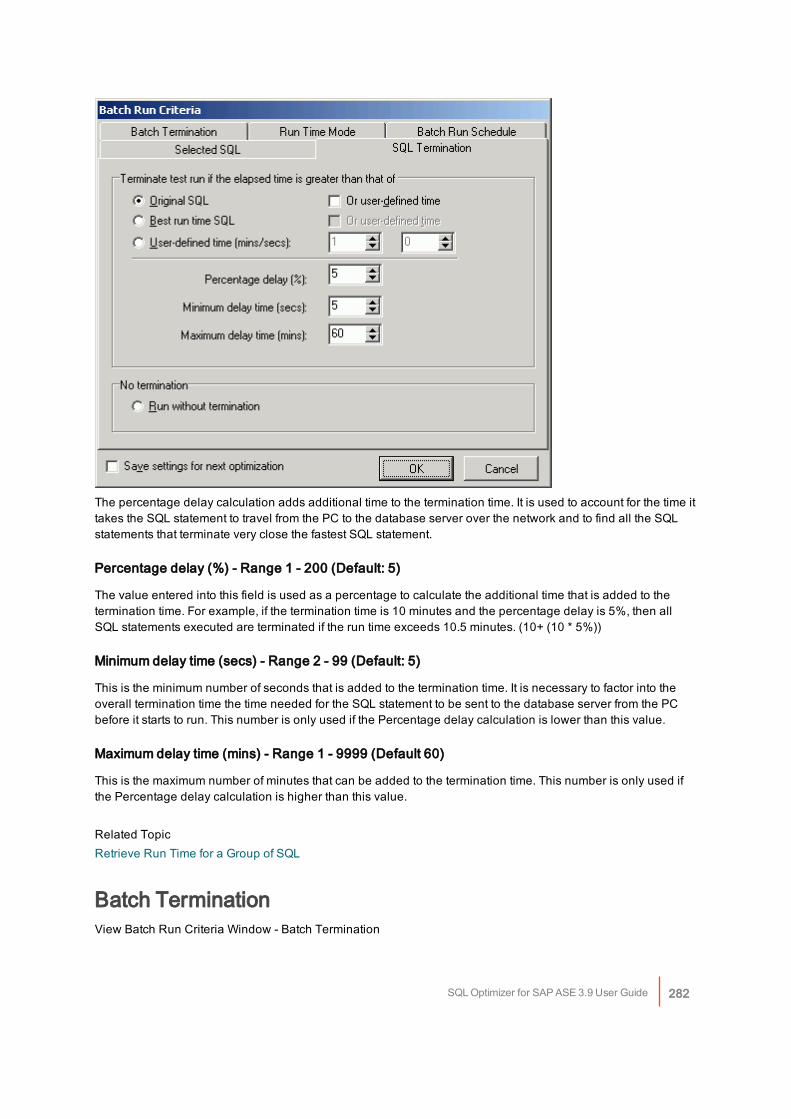
The percentage delay calculation adds additional time to the termination time. It is used to account for the time ittakes the SQL statement to travel from the PC to the database server over the network and to find all the SQLstatements that terminate very close the fastest SQL statement.
Percentage delay (%) - Range 1 - 200 (Default: 5)
The value entered into this field is used as a percentage to calculate the additional time that is added to thetermination time. For example, if the termination time is 10 minutes and the percentage delay is 5%, then allSQL statements executed are terminated if the run time exceeds 10.5 minutes. (10+ (10 * 5%))
Minimum delay time (secs) - Range 2 - 99 (Default: 5)
This is the minimum number of seconds that is added to the termination time. It is necessary to factor into theoverall termination time the time needed for the SQL statement to be sent to the database server from the PCbefore it starts to run. This number is only used if the Percentage delay calculation is lower than this value.
Maximum delay time (mins) - Range 1 - 9999 (Default 60)
This is the maximum number of minutes that can be added to the termination time. This number is only used ifthe Percentage delay calculation is higher than this value.
Related TopicRetrieve Run Time for a Group of SQL
Batch TerminationView Batch Run Criteria Window - Batch Termination
SQL Optimizer for SAP ASE 3.9 User Guide 282
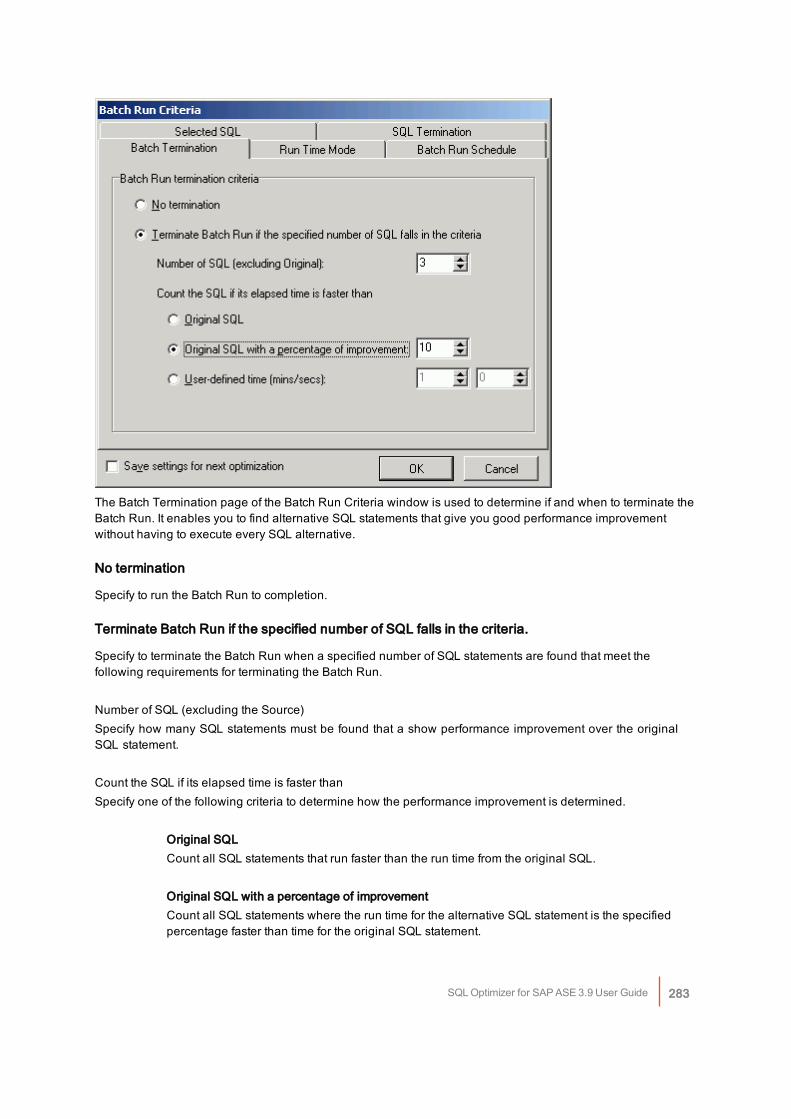
The Batch Termination page of the Batch Run Criteria window is used to determine if and when to terminate theBatch Run. It enables you to find alternative SQL statements that give you good performance improvementwithout having to execute every SQL alternative.
No termination
Specify to run the Batch Run to completion.
Terminate Batch Run if the specified number of SQL falls in the criteria.
Specify to terminate the Batch Run when a specified number of SQL statements are found that meet thefollowing requirements for terminating the Batch Run.
Number of SQL (excluding the Source)Specify how many SQL statements must be found that a show performance improvement over the originalSQL statement.
Count the SQL if its elapsed time is faster thanSpecify one of the following criteria to determine how the performance improvement is determined.
Original SQLCount all SQL statements that run faster than the run time from the original SQL.
Original SQL with a percentage of improvementCount all SQL statements where the run time for the alternative SQL statement is the specifiedpercentage faster than time for the original SQL statement.
SQL Optimizer for SAP ASE 3.9 User Guide 283
User-defined time (mins/secs)Count all SQL statements that run faster than a specified number of minutes and/or seconds.
Related TopicRetrieve Run Time for a Group of SQL
Run Time ModeThe Batch Run is designed to give the most accurate result by providing options for obtaining the most accuraterun time taking into account the effects of caching the data, indexes and the SQL statements. This section allowsyou to select one of the four options best suited to your SQL statement.
Run to retrieve Description
All records Specify to retrieve the run time for processing All Records.
First n Records(s) Specify to retrieve the run time for processing n records where you specify the numberof records retrieved.
Retrieve the runtime by executing
Description
Run SQL options Select one of the following options:
l Run all SQL twice if original SQL runs faster than (seconds)—Combines theOriginal SQL twice and all others once and the All SQL twice options into oneoption and allows you to determine (by the number of seconds a SQL statementruns) which option to use. The original SQL statement always runs twice. TheSQL alternatives run twice if the original SQL statement runs in less time thanthe value specified. Otherwise, the SQL alternatives all run once.
l First one twice using the second run time and others once—The first time youaccess data from table, the data is cached into memory. This process takes afew moments. The next time you access that data, it is already in memory so thefollowing SQL statements run faster. So to have a comparable test, the first SQLstatement is run twice and the time from the second run is compared to the timefrom the other statements.
l All once—For long running SQL statements, there is no need to run them twicesince the effect from caching diminishes over time.
l All twice—Running all SQL statements twice enables you to eliminate somefactors that can affect the accuracy of the results. If some SQL statements havebeen recently executed, then the SQL information is likely to be resident incache and it may execute faster because of that. Also, if the SQL statements usedifferent indexes, some indexes may be resident in cache and the others arenot. Five methods of calculating the run time are available if you select thisoption: Excluding the first run time, Average, Sum, Maximum, and Minimum.
SQL Optimizer for SAP ASE 3.9 User Guide 284
l Excluding the first run time—Specify to throw out the first run time and use thesecond one when all SQL statements should have the necessary items incache. This minimizes the effect that caching of the SQL statement and theindexes may have on the accuracy of the run time results.
l All multiple times—This option is suitable for SQL statements with very short runtimes. It executes the SQL statements the selected number of times. It calculatesthe run time based upon the selected calculation method. This option helps tonegate the factor of other activity running on the CPU at the same time as theSQL is executed. Since the run time is calculated from the moment the SQLstatement starts running to the time it finishes, if SQL statement shares the CPUwith other activity, the run time includes this other activity. Four methods ofcalculating the run time are available if you select this option: Average, Sum,Maximum, and Minimum.This option is only available for SELECT statements since the INSERT,UPDATE, and DELETE statements would need a rollback between each of themultiple executions.
Include tracestatistics
Select this checkbox to include trace statistics in the retrieved SQL.
Related TopicRetrieve Run Time for a Group of SQL
Batch Run ScheduleView Batch Run Criteria Window--Batch Run Schedule
SQL Optimizer for SAP ASE 3.9 User Guide 285
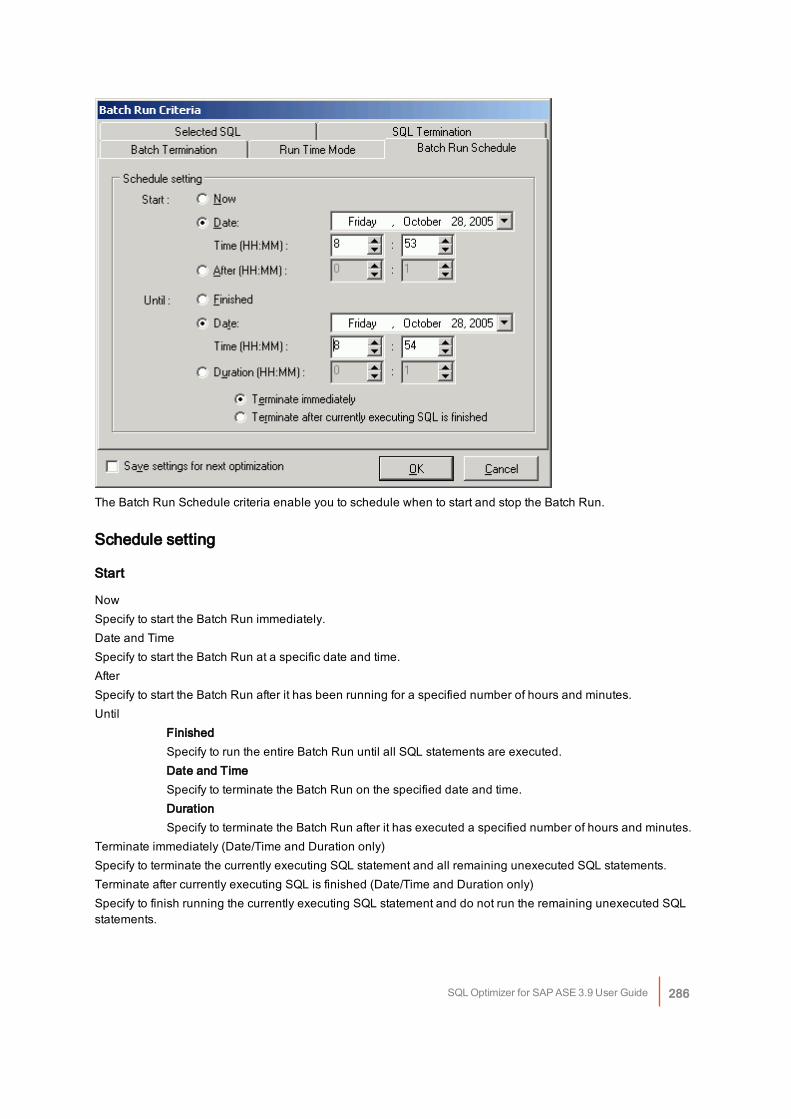
The Batch Run Schedule criteria enable you to schedule when to start and stop the Batch Run.
Schedule setting
Start
NowSpecify to start the Batch Run immediately.Date and TimeSpecify to start the Batch Run at a specific date and time.AfterSpecify to start the Batch Run after it has been running for a specified number of hours and minutes.Until
FinishedSpecify to run the entire Batch Run until all SQL statements are executed.Date and TimeSpecify to terminate the Batch Run on the specified date and time.DurationSpecify to terminate the Batch Run after it has executed a specified number of hours and minutes.
Terminate immediately (Date/Time and Duration only)Specify to terminate the currently executing SQL statement and all remaining unexecuted SQL statements.Terminate after currently executing SQL is finished (Date/Time and Duration only)Specify to finish running the currently executing SQL statement and do not run the remaining unexecuted SQLstatements.
SQL Optimizer for SAP ASE 3.9 User Guide 286
Related TopicRetrieve Run Time for a Group of SQL
Commit or RollbackIn order to obtain the correct result during the Batch Run or Run Time of alternative SQL statement, the SQLstatement executes against the database. However, when executing UPDATE, INSERT, DELETE statements,any changes to the database are rolled back.Note: For UPDATE, INSERT and DELETE SQL statements, while retrieving the run time and run result you mayencounter the following Adaptive Server error message:Can't allocate space for object 'syslogs' in database 'database_name' because the 'logsegment' segment is full.If you ran out of space in syslogs, dump the transaction log. Otherwise, use ALTER DATABASE or sp_extendsegment to increase the size of the segmentThis is due to the lack of space in system table (syslogs), in which all changes to the database arerecorded. Empty the transaction log in the database and re-execute. Use the following command in the SQLWorkshop module:DUMP TRANSACTION database_name WITH TRUNCATE_ONLYgo
Related TopicRetrieve Run Time for a Group of SQL
View Batch Run DetailsThe Batch Run Details window displays a summary of the run time information for all SQL statements executed.The Batch Run Details window displays after the batch run process is completed unless the Show details onnext batch run checkbox in the Batch Run Details window is unchecked.
To review the Batch Run Details window after a Batch RunSelect View | Show Batch Run Details when the SQLOptimizer window is active.
If a SQL statement has a database error during the Batch Run, an explanation of the error is included in theBatch Run details.
Related TopicRetrieve Run Time for a Group of SQL
Run TimeRun time can be generated for the original and optimized SQL statements to help you choose the bestperforming SQL statement that is most suitable for your application. All run times are calculated to the nearestmilliseconds in format HH:MM:SS.MS. The actual execution time of each SQL statement can be obtained byexecuting the Run for First Record, Run for All Records and Batch Run functions.
SQL Optimizer for SAP ASE 3.9 User Guide 287
Excludes network traffic timeThe calculation of the run time is based on the CPU time of the database server. Thus network traffic is excludedfrom the time.
Fluctuation of All Records - or - First Record TimeIf you attempt to execute the SQL statement more than once, you will notice a slight fluctuation in the run time.This fluctuation is due to data cache in the memory and other processes on the CPU and database server.Therefore, for a more stable result, it is advisable to repeat the test run process more than once.
Retrieve run time for cursorFor SQL statements embedded in the cursor, the run time is obtained by creating a stored procedure, executingit, and then dropping it.Note: For UPDATE, INSERT and DELETE SQL statements, while retrieving the run time and run result you mayencounter the following Adaptive Server error message:
Can't allocate space for object 'syslogs' in database 'database_name' because the 'logsegment'segment is full. If you ran out of space in syslogs, dump the transaction log. Otherwise, useALTER DATABASE or sp_extendsegment to increase the size of the segment
This is due to the lack of space in system table (syslogs), in which all changes to the database arerecorded. Empty the transaction log in the database and re-execute. Use the following command in the SQLWorkshop module:
DUMP TRANSACTION database_name WITH TRUNCATE_ONLYgo
Retrieve Run TimeTwo run time functions are available for retrieving how long it takes to run the SQL statement: Run for FirstRecord and Run for All Records. Both of these functions return run time information. You should first determinethe aim of the SQL statement before retrieving the run time information.
If the SQL statement is used for batch job, you want the best time for retrieving all records. Use .If the SQL statement is used for on-line inquiry, then you may also want to know how long it takes to retrieve the
first record. Use .The time displays in the bottom section of the SQL Optimizer window in the Time tab.Note: For UPDATE, INSERT, and DELETE SQL statements, retrieving the First Record information by using theRun for First Record function is irrelevant as these SQL statements are processed all at once. Therefore,retrieving the First Record for UPDATE, INSERT and DELETE SQL statements will give the same result asretrieving the All Records.
Related TopicsCommit or RollbackRetrieve Run Time for a Group of SQL
SQL Optimizer for SAP ASE 3.9 User Guide 288
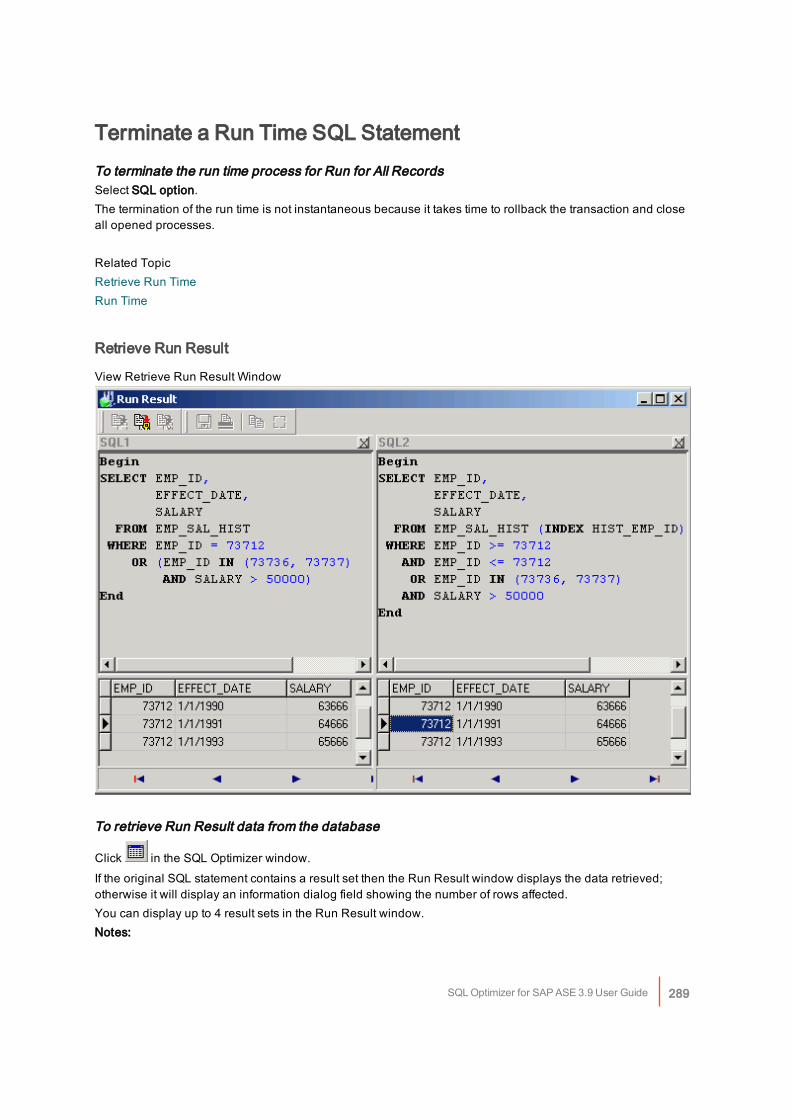
Terminate a Run Time SQL StatementTo terminate the run time process for Run for All RecordsSelect SQL option.The termination of the run time is not instantaneous because it takes time to rollback the transaction and closeall opened processes.
Related TopicRetrieve Run TimeRun Time
Retrieve Run Result
View Retrieve Run Result Window
To retrieve Run Result data from the database
Click in the SQL Optimizer window.If the original SQL statement contains a result set then the Run Result window displays the data retrieved;otherwise it will display an information dialog field showing the number of rows affected.You can display up to 4 result sets in the Run Result window.Notes:
SQL Optimizer for SAP ASE 3.9 User Guide 289
l When you are in the SQL Editor, you are prompted to commit or rollback all affected records forUPDATE, INSERT and DELETE SQL statements.
l For UPDATE, INSERT and DELETE SQL statements, while retrieving the run time and run result youmay encounter the following Adaptive Server error message:Can't allocate space for object 'syslogs' in database 'sqlexp' because the 'logsegment' segment is full. Ifyou ran out of space in syslogs, dump the transaction log. Otherwise, use ALTER DATABASE or sp_extendsegment to increase the size of the segment.
This is due to the lack of space in system table (syslogs), in which all changes to the database arerecorded. Empty the transaction log in the database and re-execute. Use the following command in the SQLWorkshop module:
DUMP TRANSACTION database_name WITH TRUNCATE_ONLY
go
Related TopicTerminate Retrieval of Run Result
Commit or RollbackIf you execute Run Result from within the SQL Editor pane in the SQL Optimizer window, two types of action -commit or rollback - can be made after the Run Result is executed. In this case, you are prompted to commit orrollback for UPDATE, INSERT, DELETE and SELECT INTO SQL statements.For the optimized SQL, all records affected by the UPDATE, INSERT, DELETE, and SELECT INTO SQLstatements are rolled back automatically.
Terminate Retrieval of Run ResultYou must logon with sa to terminate SQL statements with a result set, i.e., SELECT SQL statements. Run Resultfor SQL statements without result set (for example: INSERT, UPDATE, DELETE and SELECT with INTO clause)can be terminated by any logon account.
To terminate the Run Result process
Click .
SQL Comparer OverviewAfter optimization, the SQL Comparer window provides a way for you to easily compare two SQL statements,query plans, statistics, and abstract plan between the original SQL and optimized alternative SQL statements.
Related TopicsOpen SQL Comparer Window
SQL Optimizer for SAP ASE 3.9 User Guide 290
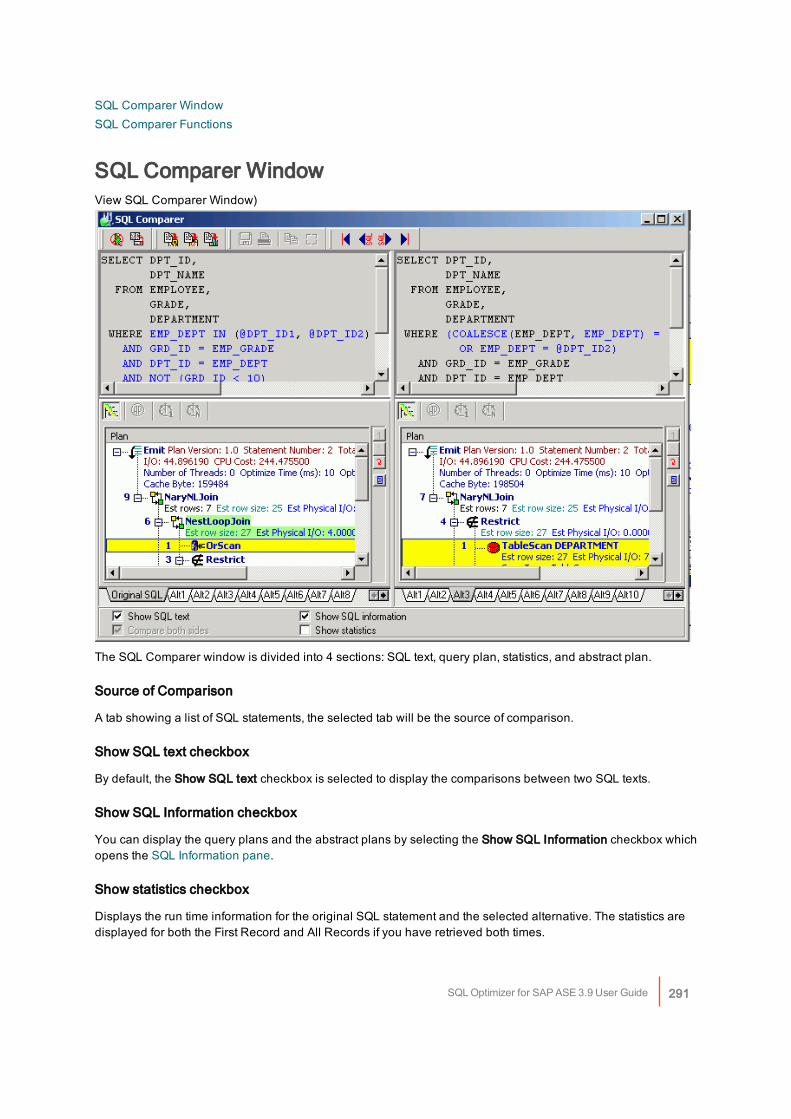
SQL Comparer WindowSQL Comparer Functions
SQL Comparer WindowView SQL Comparer Window)
The SQL Comparer window is divided into 4 sections: SQL text, query plan, statistics, and abstract plan.
Source of Comparison
A tab showing a list of SQL statements, the selected tab will be the source of comparison.
Show SQL text checkbox
By default, the Show SQL text checkbox is selected to display the comparisons between two SQL texts.
Show SQL Information checkbox
You can display the query plans and the abstract plans by selecting the Show SQL Information checkbox whichopens the SQL Information pane.
Show statistics checkbox
Displays the run time information for the original SQL statement and the selected alternative. The statistics aredisplayed for both the First Record and All Records if you have retrieved both times.
SQL Optimizer for SAP ASE 3.9 User Guide 291
Compare both sides checkbox
Specify whether to highlight the differences in both SQL statements by selecting the Compare bothsides checkbox.Note: You can control the color of the highlighting in the Preferences window under the Syntax Highlight on theEditor tab.
Related TopicsOpen SQL Comparer WindowSQL Comparer OverviewSQL Comparer Functions
Open SQL Comparer Window
After optimization and when the SQL Optimizer window is active, click . By default, the original SQLstatement is selected as the source of comparison and the differences are highlighted in blue (default) on theright or bottom pane of the window.Note: To use the SQL Comparer, you must have at least one alternative SQL statement from theoptimization process.
Related TopicsSQL Comparer OverviewSQL Comparer Window
Start and Stop ComparisonWhen SQL Comparer is launched, it automatically highlights the differences between the two SQL statements inSQL text panes. Click the Compare both sides checkbox to see the differences highlighted in both SQL text
panes. If you want to remove the highlighting of the SQL text, click .
To display the comparison
Click .
Related TopicsSQL Comparer OverviewSQL Comparer Window
Switch View in SQL Comparer WindowThe sections of the SQL Comparer window can be switched from horizontal to vertical and vice versa.
SQL Optimizer for SAP ASE 3.9 User Guide 292
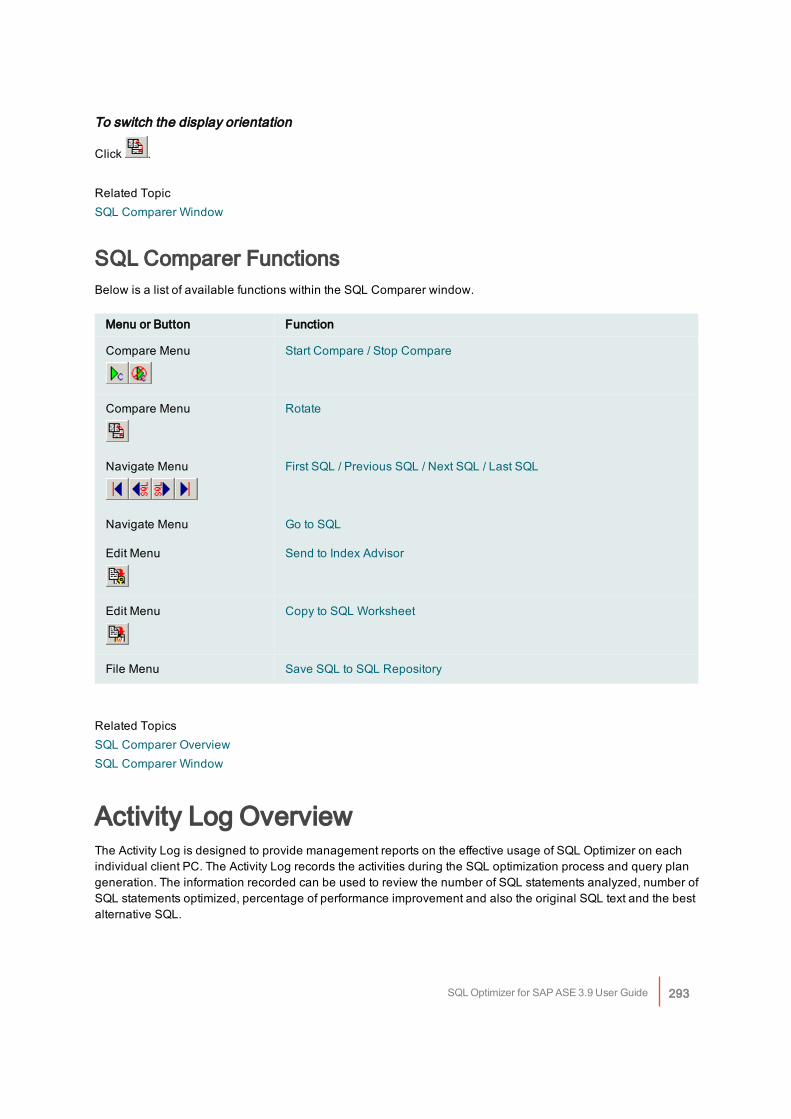
To switch the display orientation
Click .
Related TopicSQL Comparer Window
SQL Comparer FunctionsBelow is a list of available functions within the SQL Comparer window.
Menu or Button Function
Compare Menu Start Compare / Stop Compare
Compare Menu Rotate
Navigate Menu First SQL / Previous SQL / Next SQL / Last SQL
Navigate Menu Go to SQL
Edit Menu Send to Index Advisor
Edit Menu Copy to SQL Worksheet
File Menu Save SQL to SQL Repository
Related TopicsSQL Comparer OverviewSQL Comparer Window
Activity Log OverviewThe Activity Log is designed to provide management reports on the effective usage of SQL Optimizer on eachindividual client PC. The Activity Log records the activities during the SQL optimization process and query plangeneration. The information recorded can be used to review the number of SQL statements analyzed, number ofSQL statements optimized, percentage of performance improvement and also the original SQL text and the bestalternative SQL.
SQL Optimizer for SAP ASE 3.9 User Guide 293
Related TopicsStart Recording Activities to the Activity LogView Activity Log ReportPurge Activity Log DataStop Recording ActivitiesActivity Log Preferences
Start Recording Activities to the Activity LogBy default, the Activity Log is disabled.during the SQL optimization process and query plan retrieval,
To start recording the activities
1. Click .
2. Select the Activity Log tab.
Activity to be loggedSpecify the activity to be logged by selecting the SQL optimization and/or the Query plan generationcheckboxes. If no option is selected, the activity log is disabled.
Information to be loggedSpecify the information to be collected by selecting the SQL text and/or Query plan checkboxes.Note: Only activities executed in the SQL Optimizer window are logged.The following information is recorded automatically for each activity logged:
PC userPC user name.
Logon nameDatabase logon name.
ServerAdaptive Server name.
Activity Log directoryThe Activity Log directory is used to store the log file created while recording the activities. Select the DirectorySetup / Linkage tab to change the directory where the log is written. The default is the installed directory.
SQL Optimizer for SAP ASE 3.9 User Guide 294
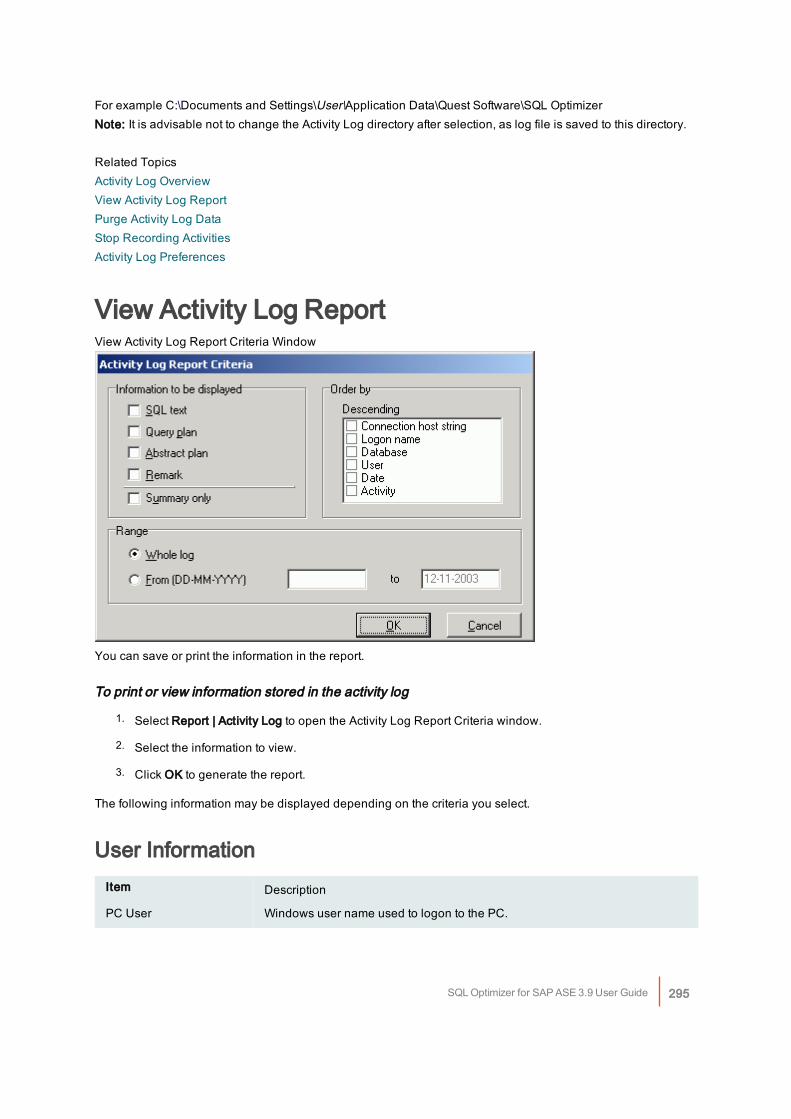
For example C:\Documents and Settings\User\Application Data\Quest Software\SQL OptimizerNote: It is advisable not to change the Activity Log directory after selection, as log file is saved to this directory.
Related TopicsActivity Log OverviewView Activity Log ReportPurge Activity Log DataStop Recording ActivitiesActivity Log Preferences
View Activity Log ReportView Activity Log Report Criteria Window
You can save or print the information in the report.
To print or view information stored in the activity log
1. Select Report | Activity Log to open the Activity Log Report Criteria window.
2. Select the information to view.
3. Click OK to generate the report.
The following information may be displayed depending on the criteria you select.
User InformationItem Description
PC User Windows user name used to logon to the PC.
SQL Optimizer for SAP ASE 3.9 User Guide 295
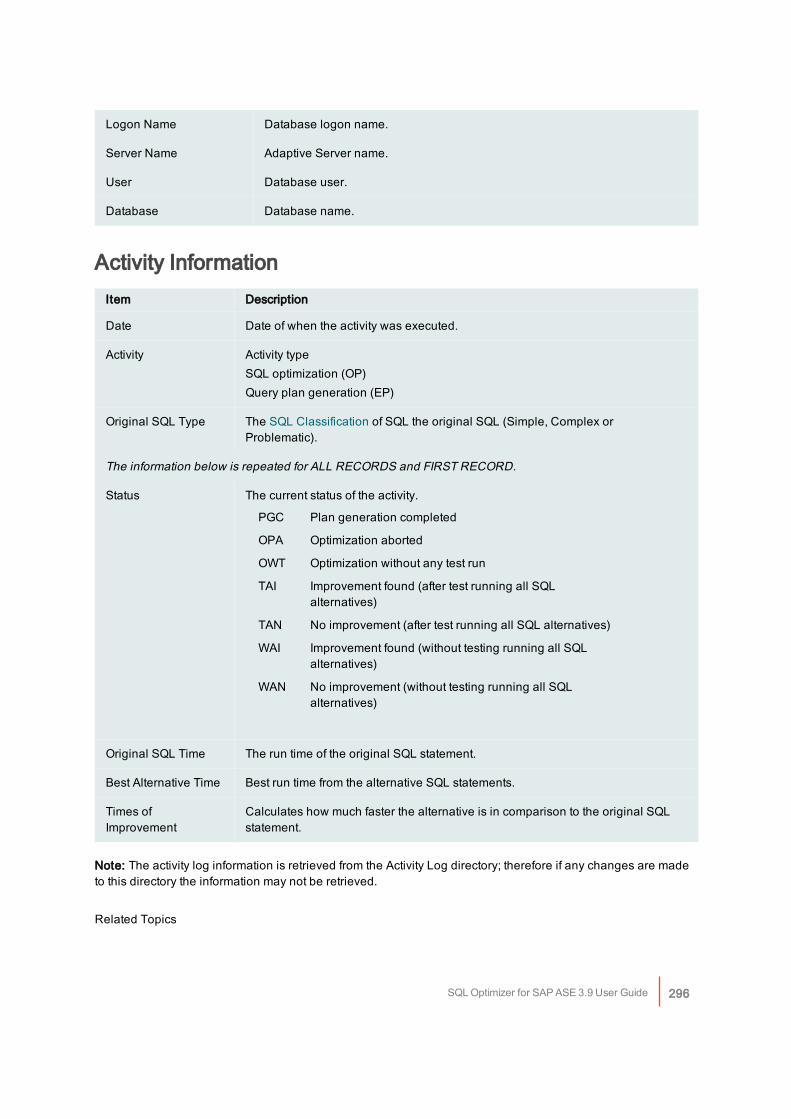
Logon Name Database logon name.
Server Name Adaptive Server name.
User Database user.
Database Database name.
Activity InformationItem Description
Date Date of when the activity was executed.
Activity Activity typeSQL optimization (OP) Query plan generation (EP)
Original SQL Type The SQL Classification of SQL the original SQL (Simple, Complex orProblematic).
The information below is repeated for ALL RECORDS and FIRST RECORD.
Status The current status of the activity.
PGC Plan generation completed
OPA Optimization aborted
OWT Optimization without any test run
TAI Improvement found (after test running all SQLalternatives)
TAN No improvement (after test running all SQL alternatives)
WAI Improvement found (without testing running all SQLalternatives)
WAN No improvement (without testing running all SQLalternatives)
Original SQL Time The run time of the original SQL statement.
Best Alternative Time Best run time from the alternative SQL statements.
Times ofImprovement
Calculates how much faster the alternative is in comparison to the original SQLstatement.
Note: The activity log information is retrieved from the Activity Log directory; therefore if any changes are madeto this directory the information may not be retrieved.
Related Topics
SQL Optimizer for SAP ASE 3.9 User Guide 296
Activity Log OverviewStart Recording Activities to the Activity LogPurge Activity Log DataStop Recording ActivitiesActivity Log Preferences
Purge Activity Log DataTo purge the activity log data
1. Click the .
2. Select the Activity Log tab.
3. Under the Housekeeping section, select either Whole Log to remove all information or specify a daterange to remove logs between these dates.
4. Click Purge Now.
Related TopicsActivity Log OverviewStart Recording Activities to the Activity LogView Activity Log ReportStop Recording ActivitiesActivity Log Preferences
Stop Recording ActivitiesTo stop recording activities to the activity log:
1. Click .
2. Select the Activity Log tab.
3. Under the Activity to be logged, de-select the SQL optimization and Query plan generation checkboxesto disable the activity log.
Related TopicsActivity Log OverviewStart Recording Activities to the Activity LogView Activity Log ReportPurge Activity Log DataActivity Log Preferences
SQL Optimizer for SAP ASE 3.9 User Guide 297
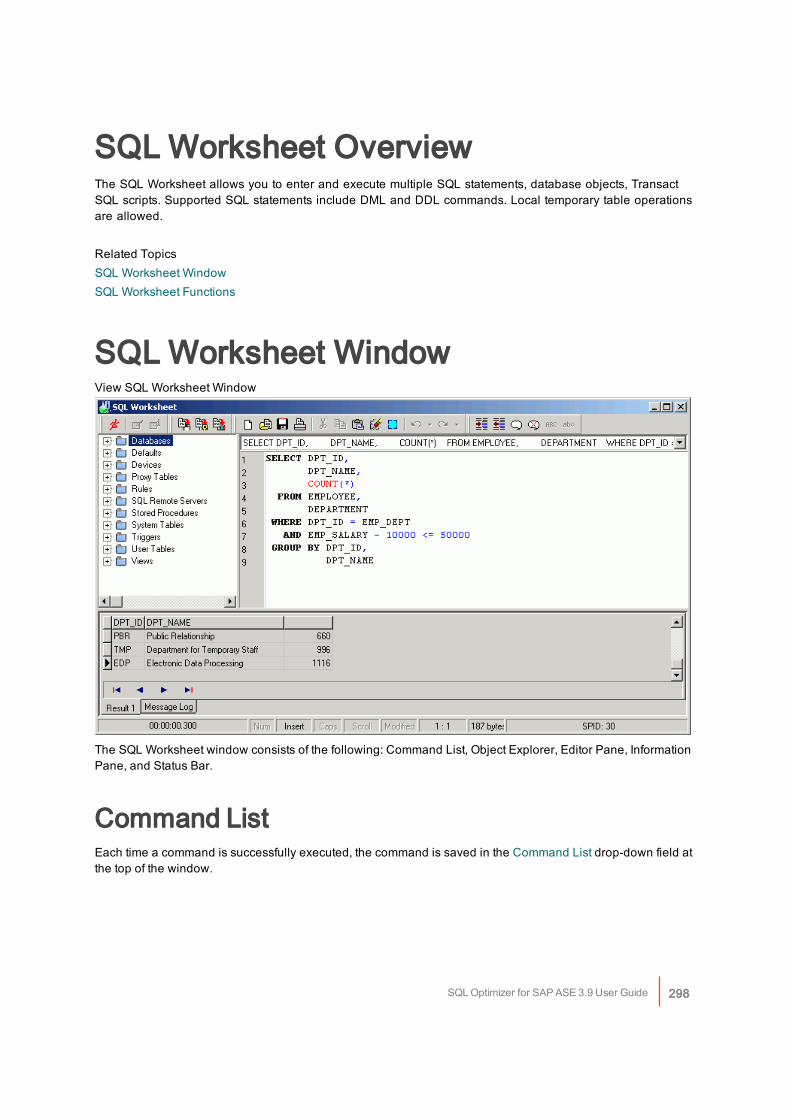
SQL Worksheet OverviewThe SQL Worksheet allows you to enter and execute multiple SQL statements, database objects, TransactSQL scripts. Supported SQL statements include DML and DDL commands. Local temporary table operationsare allowed.
Related TopicsSQL Worksheet WindowSQL Worksheet Functions
SQL Worksheet WindowView SQL Worksheet Window
The SQL Worksheet window consists of the following: Command List, Object Explorer, Editor Pane, InformationPane, and Status Bar.
Command ListEach time a command is successfully executed, the command is saved in the Command List drop-down field atthe top of the window.
SQL Optimizer for SAP ASE 3.9 User Guide 298
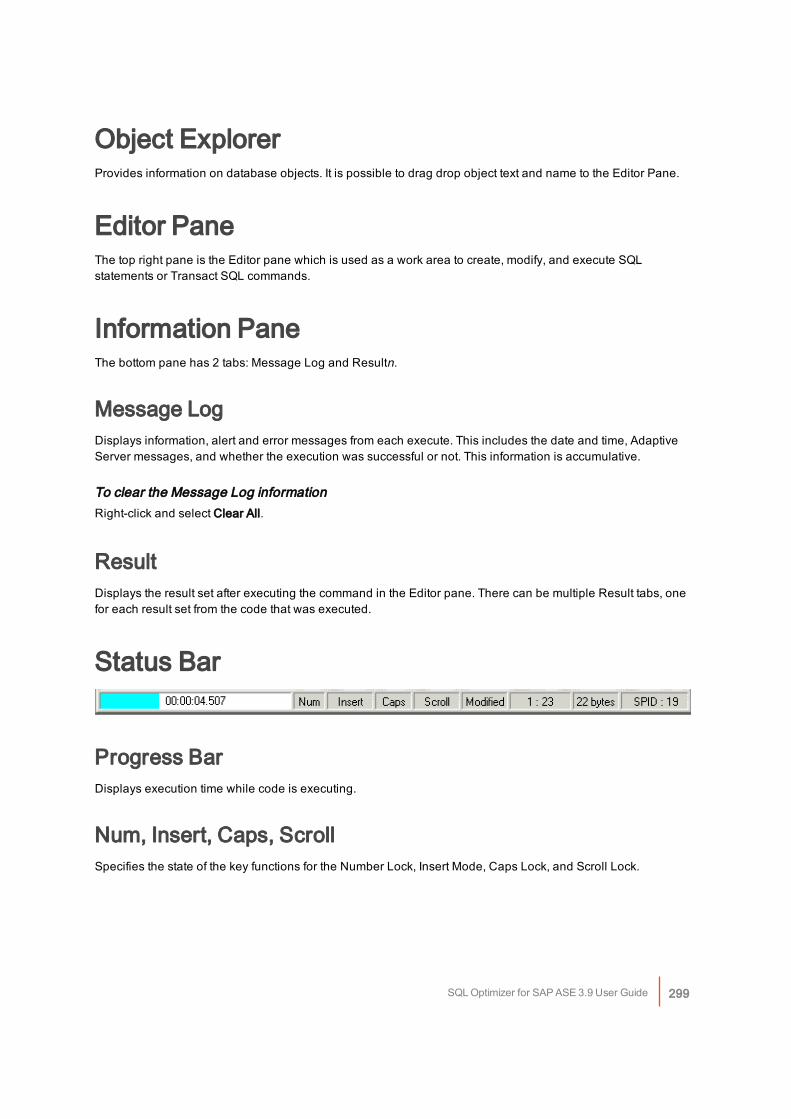
Object ExplorerProvides information on database objects. It is possible to drag drop object text and name to the Editor Pane.
Editor PaneThe top right pane is the Editor pane which is used as a work area to create, modify, and execute SQLstatements or Transact SQL commands.
Information PaneThe bottom pane has 2 tabs: Message Log and Resultn.
Message LogDisplays information, alert and error messages from each execute. This includes the date and time, AdaptiveServer messages, and whether the execution was successful or not. This information is accumulative.
To clear the Message Log informationRight-click and select Clear All.
ResultDisplays the result set after executing the command in the Editor pane. There can be multiple Result tabs, onefor each result set from the code that was executed.
Status Bar
Progress BarDisplays execution time while code is executing.
Num, Insert, Caps, ScrollSpecifies the state of the key functions for the Number Lock, Insert Mode, Caps Lock, and Scroll Lock.
SQL Optimizer for SAP ASE 3.9 User Guide 299
ModifiedSpecifies that a modification was made to the text in the Editor pane.
n:nSpecifies the line and column position of the cursor.
nnn bytesSpecifies the number of bytes of text in the Editor pane.
SPIDSpecifies the SPID for the database session used by the SQL Worksheet. The session is not connect until thefirst time you execute a command.
Related TopicsSQL Worksheet OverviewSQL Worksheet Functions
Execute SQL or Transact SQLTo open the SQL Worksheet window
Click .You can enter text into the SQL Worksheet by
l Copying from the Database Explorer, the SQL Scanner, or the SQL Optimizer. (Click )
l Typing the text.
l Opening a file. (File | Open).
l Opening a file or database object found through the Code Finder. (Right-click and select Open inSQL Worksheet)
To execute your SQL statement or Transact SQL code
Click .
To abort the execution of SQL statement or Transact SQL code
Click .Note: In Adaptive Server when you complete a transaction, it is committed to the database.
SQL Optimizer for SAP ASE 3.9 User Guide 300
Related TopicSQL Worksheet Window
Retrieve Description of Tables and ViewsYou can retrieve the description for a table or view which gives you the column definitions, data type, and lengthof the column. This function is not available until text is highlighted in the Editor pane.
To retrieve the table description
1. In the Editor pane of the SQL Worksheet window, highlight a table or view name.
2. Click .
Note: The information is retrieved from the database using the sp_help procedure. Whatever text you highlightis sent to Adaptive Server as the parameter to sp_help. If you highlight an entire SQL statement, Adaptive Serverexecutes sp_help without a parameter and executes the SQL statement. The SQL Worksheet then displays theresult of both executions.
Related TopicSQL Worksheet Window
Modify DataIn the SQL Worksheet, you can modify the data from a table. The Edit button is not enabled until text ishighlighted in the Editor pane.
To modify the data in a table
1. Highlight a table from the text in the Editor pane in the SQL Worksheet window.
2. Click .
3. Use the Edit button bar at the bottom of the pane to modify the data.
Note: If you create a table and enter data in the SQL Worksheet, you must synchronize the data dictionary byselecting Database | Synchronize Data Dictionary before you can use the Edit command or Edit button tomodify the data.
Related TopicSQL Worksheet Window
SQL Optimizer for SAP ASE 3.9 User Guide 301
New Database SessionThe SQL Worksheet uses a different database session to execute the SQL and Transact SQL from the one thatwas created when you initially logged on. It is important to understand how using a different session affects yourwork in other modules.
Temporary TablesTemporary tables created in the SQL Worksheet are not available throughout the rest of the modules. Forexample, if you create #temp1 in the SQL Worksheet, you are not able to use that temporary table in SQLOptimizer. Also, if you create a temporary table in the User-Defined Temp Table window, you will not be able touse it in the SQL Worksheet.
Changes to the Data DictionaryEach time you logon, information from the data dictionary is loaded into the memory of the local PC. If you makechanges to the data dictionary in the SQL Worksheet, these changes are not reflected in the information thatwas initially stored on the local PC. For example, if you create a new table in the SQL Worksheet and thenoptimize a SQL statement that uses the new table, you will get a message saying that the table does not exist.This is because the data dictionary on the local PC was not updated.
To update the data dictionarySelect Database | Synchronize Data Dictionary.
Related TopicSQL Worksheet Window
Command ListThe Command List stores each command that is successfully executed in a drop-down field at the top of theSQL Worksheet window. The following functions are available from the right-click menu in the Command List.
Save CommandsBrings up the Save Commands window so you can select which commands you would like saved to a file.
Load CommandsBrings up the Open Commands window so you can select which commands to load in the Command List from alist that you saved previously.
SQL Optimizer for SAP ASE 3.9 User Guide 302
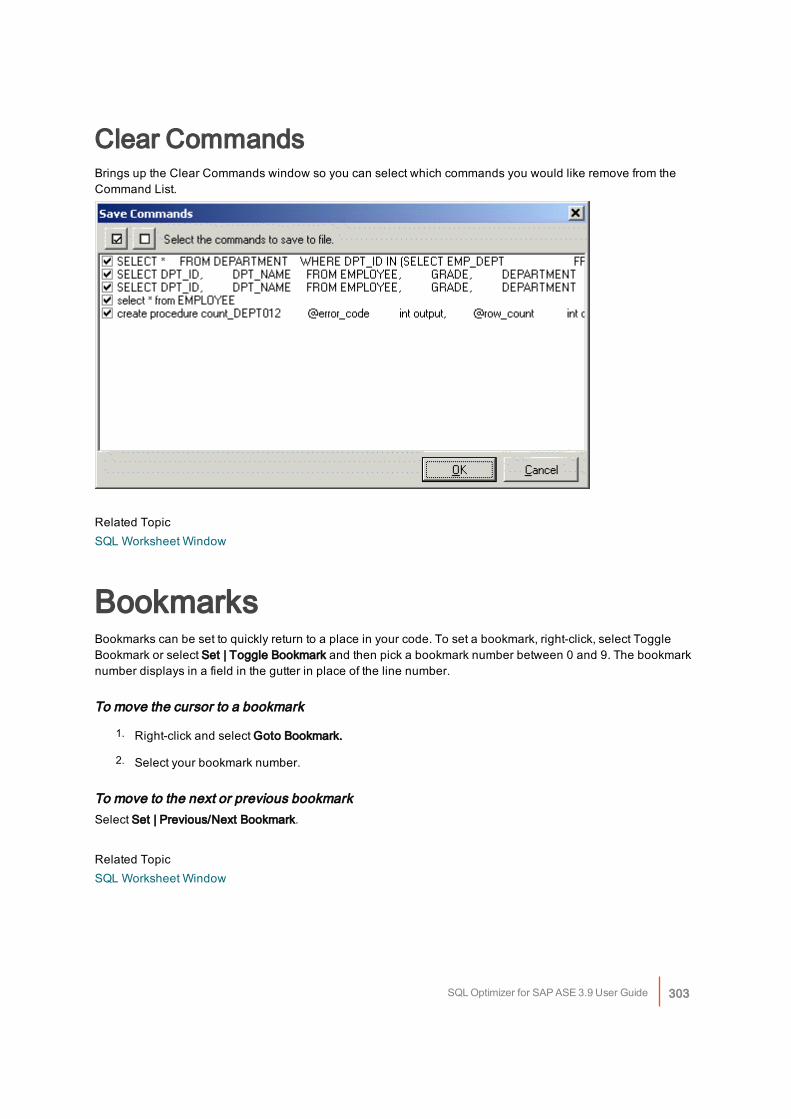
Clear CommandsBrings up the Clear Commands window so you can select which commands you would like remove from theCommand List.
Related TopicSQL Worksheet Window
BookmarksBookmarks can be set to quickly return to a place in your code. To set a bookmark, right-click, select ToggleBookmark or select Set | Toggle Bookmark and then pick a bookmark number between 0 and 9. The bookmarknumber displays in a field in the gutter in place of the line number.
To move the cursor to a bookmark
1. Right-click and select Goto Bookmark.
2. Select your bookmark number.
To move to the next or previous bookmarkSelect Set | Previous/Next Bookmark.
Related TopicSQL Worksheet Window
SQL Optimizer for SAP ASE 3.9 User Guide 303
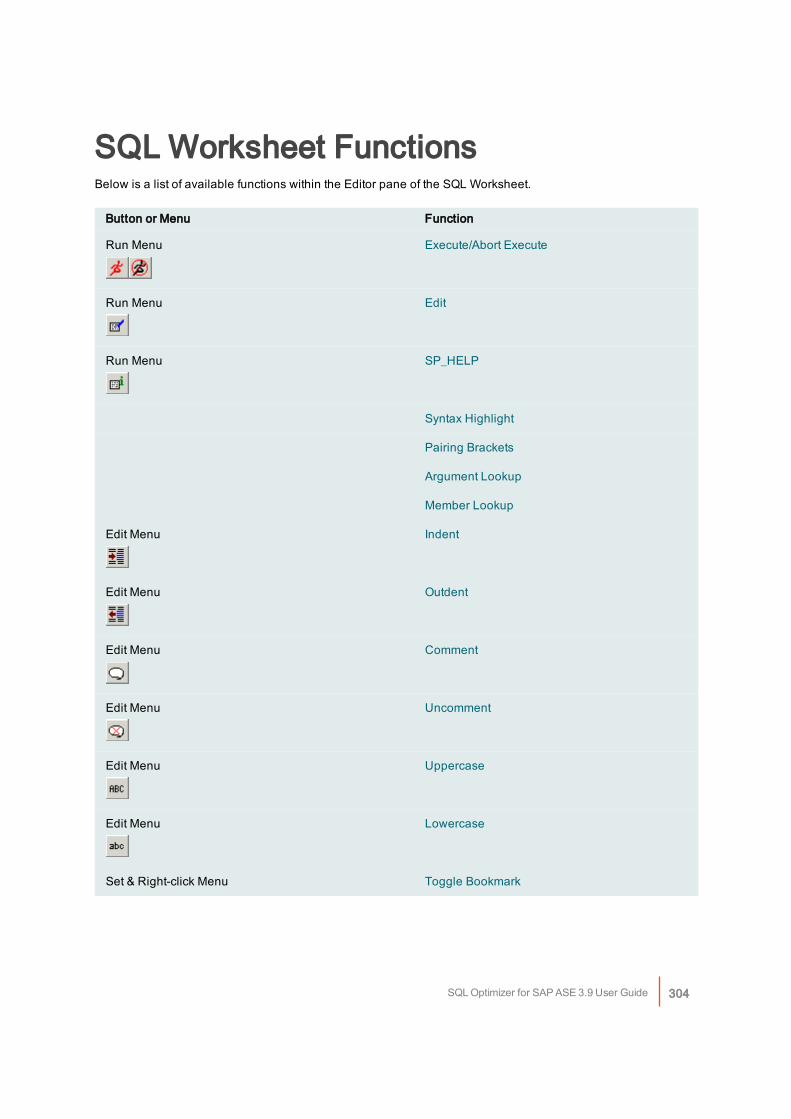
SQL Worksheet FunctionsBelow is a list of available functions within the Editor pane of the SQL Worksheet.
Button or Menu Function
Run Menu Execute/Abort Execute
Run Menu Edit
Run Menu SP_HELP
Syntax Highlight
Pairing Brackets
Argument Lookup
Member Lookup
Edit Menu Indent
Edit Menu Outdent
Edit Menu Comment
Edit Menu Uncomment
Edit Menu Uppercase
Edit Menu Lowercase
Set & Right-click Menu Toggle Bookmark
SQL Optimizer for SAP ASE 3.9 User Guide 304
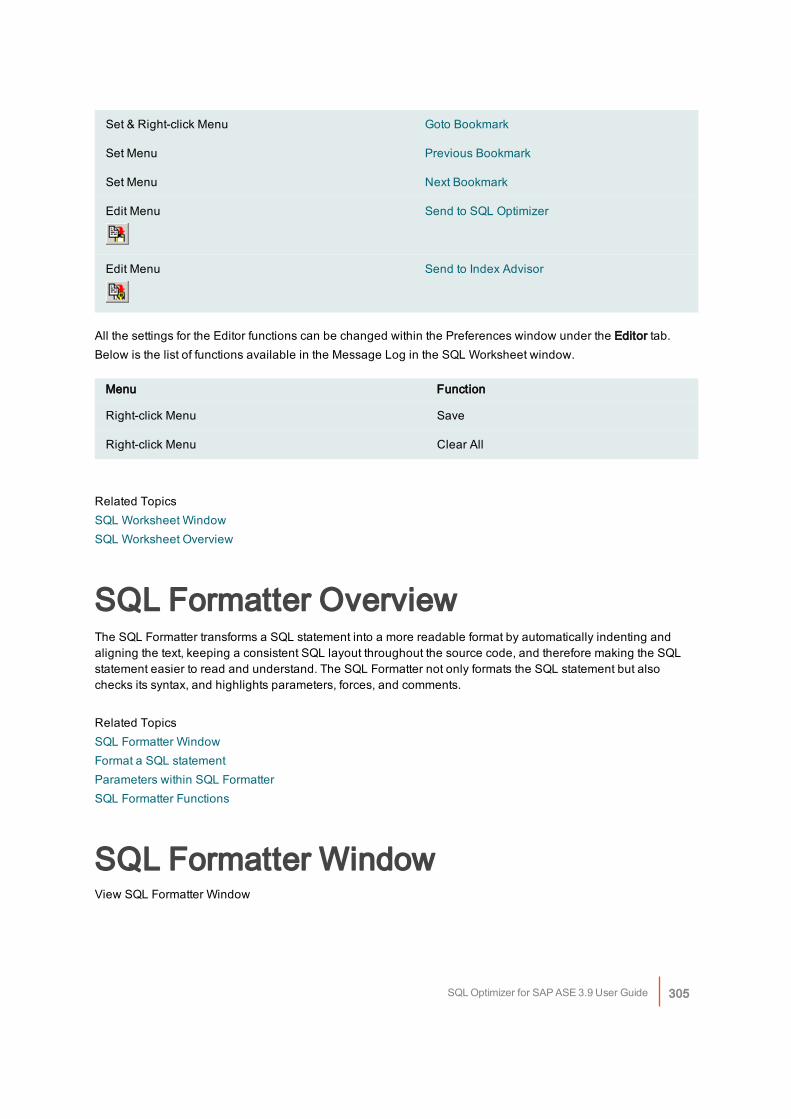
Set & Right-click Menu Goto Bookmark
Set Menu Previous Bookmark
Set Menu Next Bookmark
Edit Menu Send to SQL Optimizer
Edit Menu Send to Index Advisor
All the settings for the Editor functions can be changed within the Preferences window under the Editor tab.Below is the list of functions available in the Message Log in the SQL Worksheet window.
Menu Function
Right-click Menu Save
Right-click Menu Clear All
Related TopicsSQL Worksheet WindowSQL Worksheet Overview
SQL Formatter OverviewThe SQL Formatter transforms a SQL statement into a more readable format by automatically indenting andaligning the text, keeping a consistent SQL layout throughout the source code, and therefore making the SQLstatement easier to read and understand. The SQL Formatter not only formats the SQL statement but alsochecks its syntax, and highlights parameters, forces, and comments.
Related TopicsSQL Formatter WindowFormat a SQL statementParameters within SQL FormatterSQL Formatter Functions
SQL Formatter WindowView SQL Formatter Window
SQL Optimizer for SAP ASE 3.9 User Guide 305
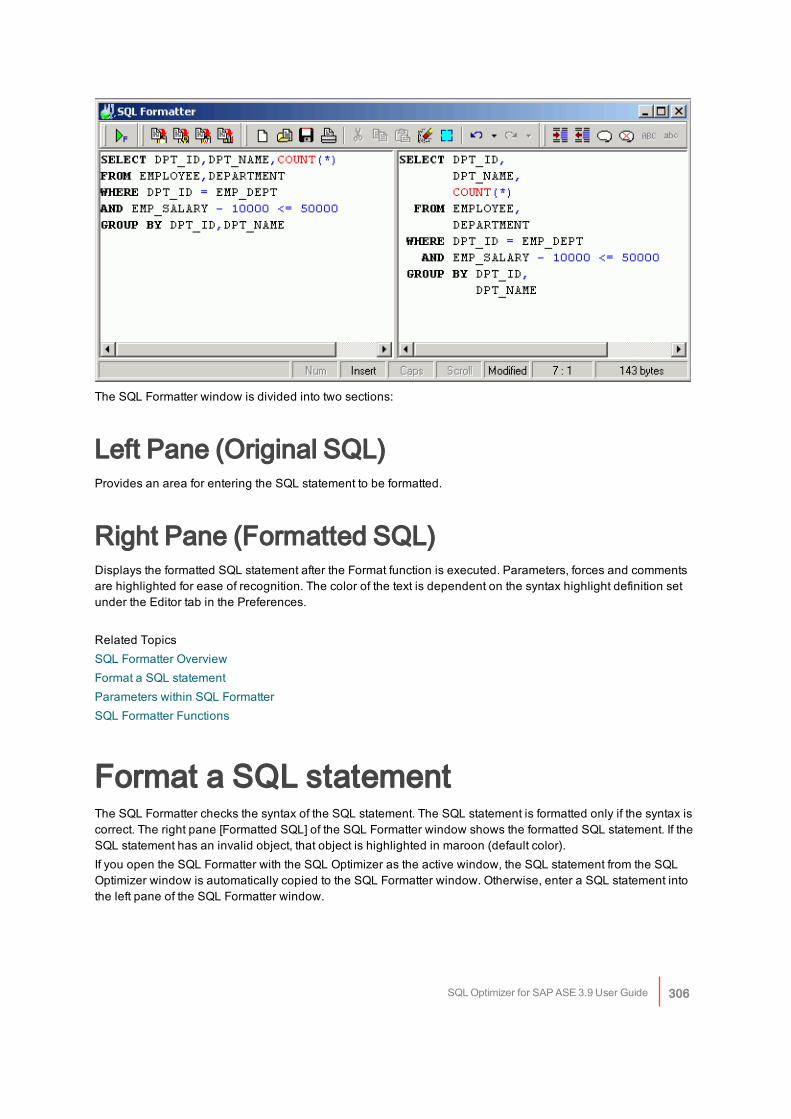
The SQL Formatter window is divided into two sections:
Left Pane (Original SQL)Provides an area for entering the SQL statement to be formatted.
Right Pane (Formatted SQL)Displays the formatted SQL statement after the Format function is executed. Parameters, forces and commentsare highlighted for ease of recognition. The color of the text is dependent on the syntax highlight definition setunder the Editor tab in the Preferences.
Related TopicsSQL Formatter OverviewFormat a SQL statementParameters within SQL FormatterSQL Formatter Functions
Format a SQL statementThe SQL Formatter checks the syntax of the SQL statement. The SQL statement is formatted only if the syntax iscorrect. The right pane [Formatted SQL] of the SQL Formatter window shows the formatted SQL statement. If theSQL statement has an invalid object, that object is highlighted in maroon (default color).If you open the SQL Formatter with the SQL Optimizer as the active window, the SQL statement from the SQLOptimizer window is automatically copied to the SQL Formatter window. Otherwise, enter a SQL statement intothe left pane of the SQL Formatter window.
SQL Optimizer for SAP ASE 3.9 User Guide 306
To format a SQL statement
1. Click .
2. Enter the SQL text.
3. Click to format the SQL statement.
To help in the construction of SQL statementsUse these functions:
l Auto Correction
l Member and Argument Lookup
l Indent
l Outdent
l Uppercase
l Lowercase
l Comment
l Uncomment
To terminate the format process
Click .Note: The SQL Format supports only a single SELECT, SELECT INTO, DELETE, UPDATE, and INSERTSQL statement.
Related TopicsSQL Formatter OverviewSQL Formatter WindowParameters within SQL FormatterSQL Formatter Functions
Parameters within SQL FormatterSQL statements can have parameters either prefixed with a "@" sign or without the "@". If parameters arerecognized, they are highlighted in red (default color) after executing the Format function.Note: If table names are in maroon (default color) it indicates that the table and corresponding columns are notrecognized. Check that:
l The login user has sufficient privilege to access the table.
l You are connected to the correct database or set user.
SQL Optimizer for SAP ASE 3.9 User Guide 307
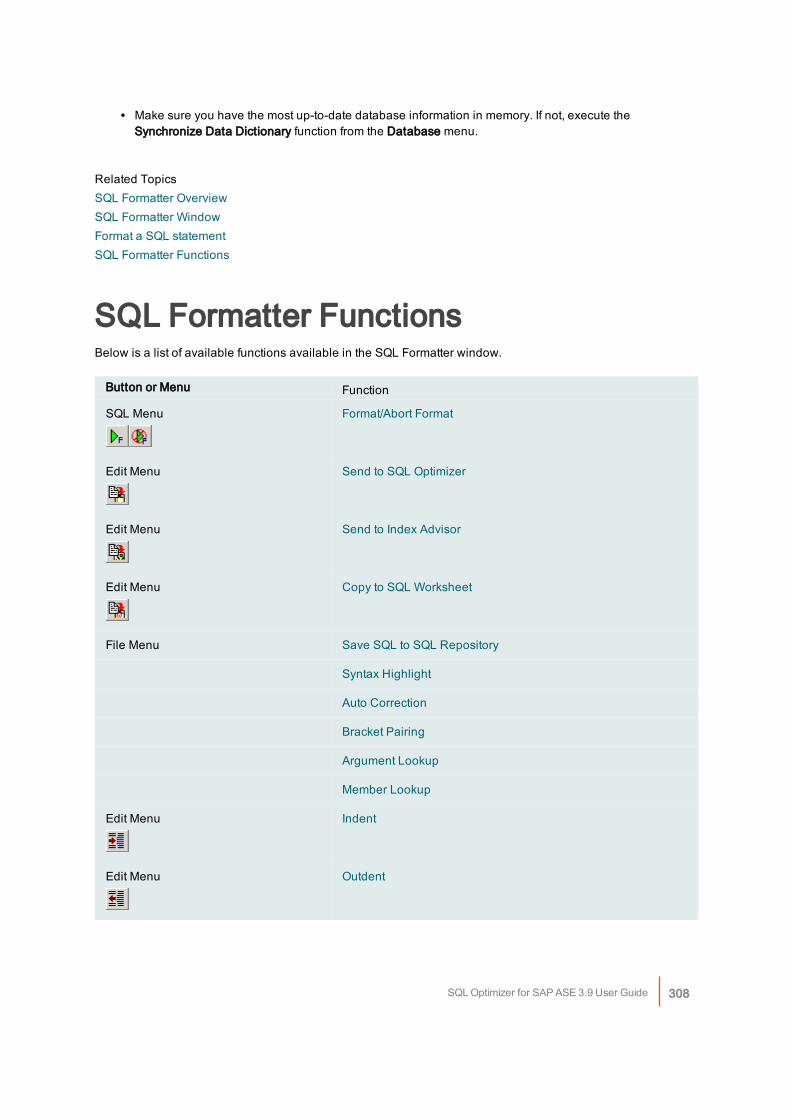
l Make sure you have the most up-to-date database information in memory. If not, execute theSynchronize Data Dictionary function from the Database menu.
Related TopicsSQL Formatter OverviewSQL Formatter WindowFormat a SQL statementSQL Formatter Functions
SQL Formatter FunctionsBelow is a list of available functions available in the SQL Formatter window.
Button or Menu Function
SQL Menu Format/Abort Format
Edit Menu Send to SQL Optimizer
Edit Menu Send to Index Advisor
Edit Menu Copy to SQL Worksheet
File Menu Save SQL to SQL Repository
Syntax Highlight
Auto Correction
Bracket Pairing
Argument Lookup
Member Lookup
Edit Menu Indent
Edit Menu Outdent
SQL Optimizer for SAP ASE 3.9 User Guide 308
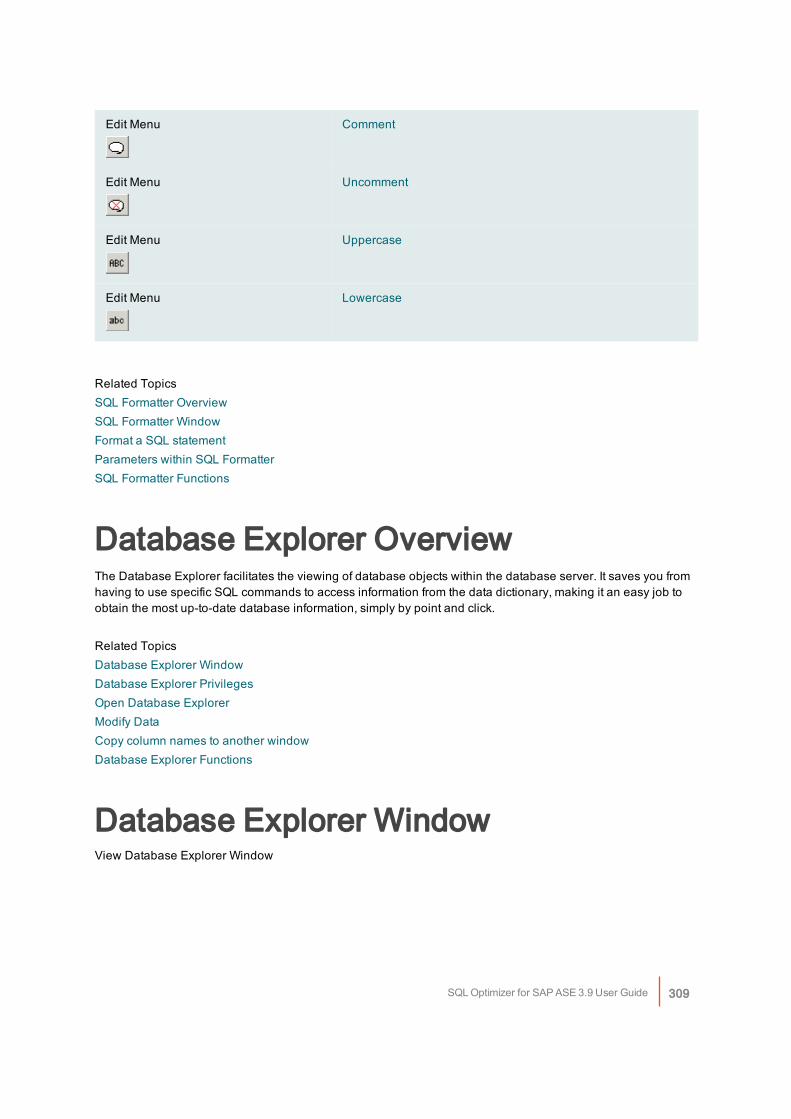
Edit Menu Comment
Edit Menu Uncomment
Edit Menu Uppercase
Edit Menu Lowercase
Related TopicsSQL Formatter OverviewSQL Formatter WindowFormat a SQL statementParameters within SQL FormatterSQL Formatter Functions
Database Explorer OverviewThe Database Explorer facilitates the viewing of database objects within the database server. It saves you fromhaving to use specific SQL commands to access information from the data dictionary, making it an easy job toobtain the most up-to-date database information, simply by point and click.
Related TopicsDatabase Explorer WindowDatabase Explorer PrivilegesOpen Database ExplorerModify DataCopy column names to another windowDatabase Explorer Functions
Database Explorer WindowView Database Explorer Window
SQL Optimizer for SAP ASE 3.9 User Guide 309
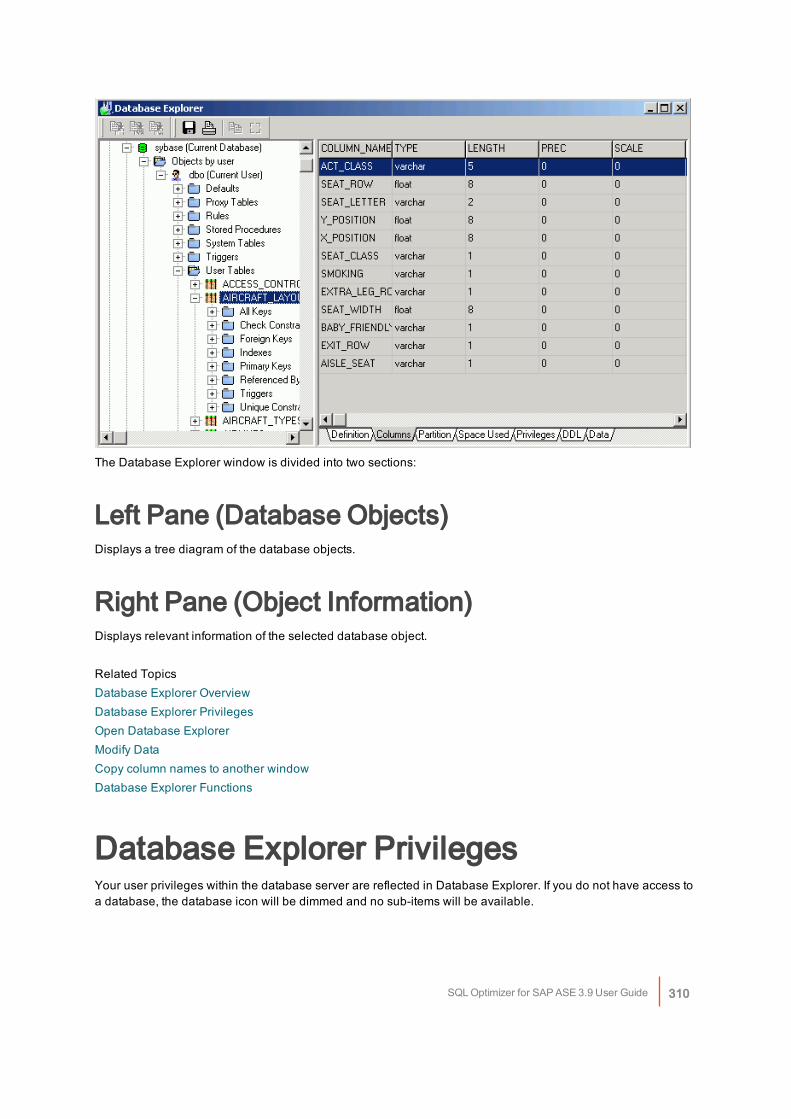
The Database Explorer window is divided into two sections:
Left Pane (Database Objects)Displays a tree diagram of the database objects.
Right Pane (Object Information)Displays relevant information of the selected database object.
Related TopicsDatabase Explorer OverviewDatabase Explorer PrivilegesOpen Database ExplorerModify DataCopy column names to another windowDatabase Explorer Functions
Database Explorer PrivilegesYour user privileges within the database server are reflected in Database Explorer. If you do not have access toa database, the database icon will be dimmed and no sub-items will be available.
SQL Optimizer for SAP ASE 3.9 User Guide 310
When you expand the first component of the tree you will notice that the database icon is either gray or green, toindicate which databases you have access to.Access to the system catalog table, syscomments, is needed to view SQL text for procedures, triggers, views,default and rules objects. If you do not have access to the syscomments system table, a message "SQL Textunavailable" will be presented in the Text tab.Note: For Adaptive Server, you are able to access the syscomments system catalog table by turning the "selecton syscomments.text" parameter on, use the command:sp_configure "select on syscomments.text", 1
Related TopicsDatabase Explorer OverviewDatabase Explorer WindowOpen Database ExplorerModify DataCopy column names to another windowDatabase Explorer Functions
Open Database ExplorerTo open the Database Explorer window
Click .The tree diagram displays database objects in the form of a tree layout. The behavior of this module is verysimilar to Windows-based applications. To expand or collapse the associated list of sub-items, click eachbranch name. To display the details of a database object, click the object name and the correspondinginformation will be displayed in the right pane of the window.The Object Information displays information about the selected database object. By clicking a tab located at thebottom of the right pane, related details about the database object are displayed.
Related TopicsDatabase Explorer OverviewDatabase Explorer WindowDatabase Explorer PrivilegesModify DataCopy column names to another windowDatabase Explorer Functions
SQL Optimizer for SAP ASE 3.9 User Guide 311
Modify DataTo modify table or view data
1. Select the table or view you want to modify from the left pane of the Database Explorer window.
2. Select the Data tab from the bottom of the right pane
3. Use the button bar at the bottom of the pane to select an editing option.
Note: Not all Views are updateable; a general rule is that any UPDATE, DELETE, or INSERT statement on ajoin view can be modified if only one underlying base table exists.
Related TopicsDatabase Explorer OverviewDatabase Explorer WindowDatabase Explorer PrivilegesOpen Database ExplorerCopy column names to another windowDatabase Explorer Functions
Copy column names to another windowTo facilitate the construction of a SQL statement, copy the selected column names to the SQL Optimizer or SQLFormatter windows.
To copy column names
1. Select the table or view name displayed on the tree diagram in the left pane [Database Objects] of the DatabaseExplorer window.
2. Make sure the Column tab is active and select the column names by clicking the left-hand mouse buttonwith the Shift key for multiple selections.
3. Right-click and select Copy columns to SQL Optimizer to copy the column names to the SQLOptimizer window or select Copy columns to SQL Formatter to copy the column names to the SQLFormatter window.
A new line and a comma separate each column name after the copy.
Related TopicsDatabase Explorer OverviewDatabase Explorer WindowDatabase Explorer PrivilegesOpen Database ExplorerModify Data
SQL Optimizer for SAP ASE 3.9 User Guide 312
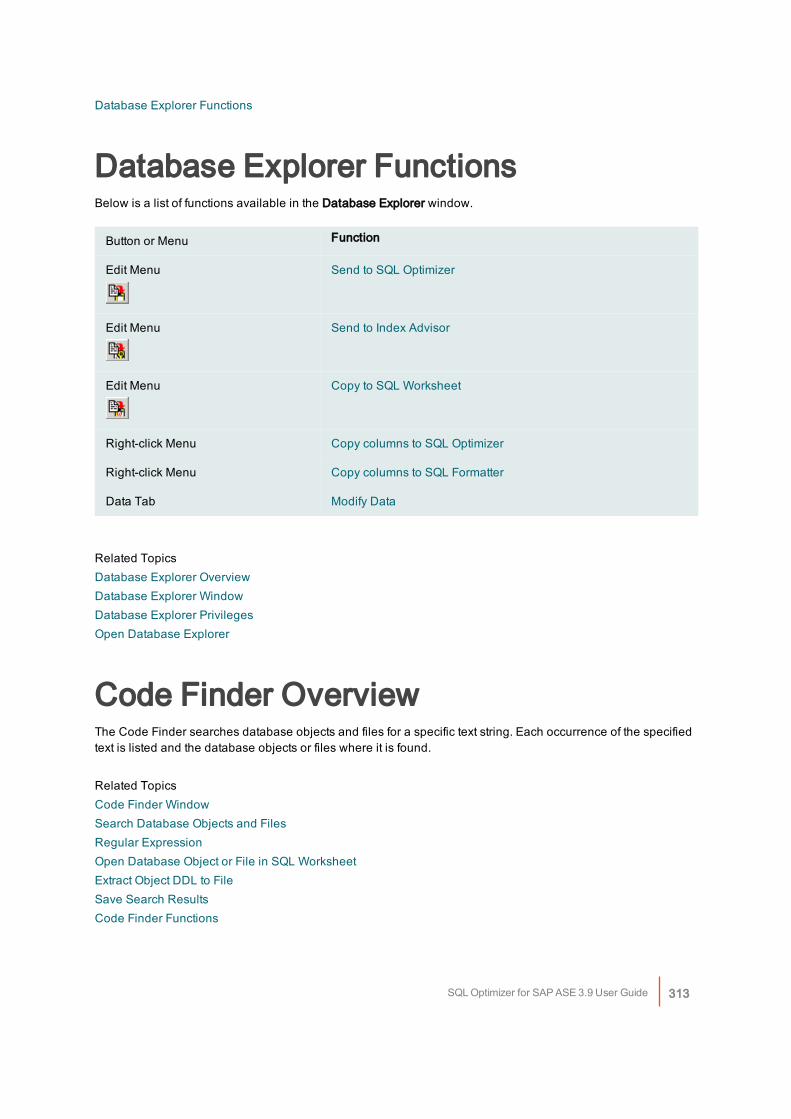
Database Explorer Functions
Database Explorer FunctionsBelow is a list of functions available in the Database Explorer window.
Button or Menu Function
Edit Menu Send to SQL Optimizer
Edit Menu Send to Index Advisor
Edit Menu Copy to SQL Worksheet
Right-click Menu Copy columns to SQL Optimizer
Right-click Menu Copy columns to SQL Formatter
Data Tab Modify Data
Related TopicsDatabase Explorer OverviewDatabase Explorer WindowDatabase Explorer PrivilegesOpen Database Explorer
Code Finder OverviewThe Code Finder searches database objects and files for a specific text string. Each occurrence of the specifiedtext is listed and the database objects or files where it is found.
Related TopicsCode Finder WindowSearch Database Objects and FilesRegular ExpressionOpen Database Object or File in SQL WorksheetExtract Object DDL to FileSave Search ResultsCode Finder Functions
SQL Optimizer for SAP ASE 3.9 User Guide 313
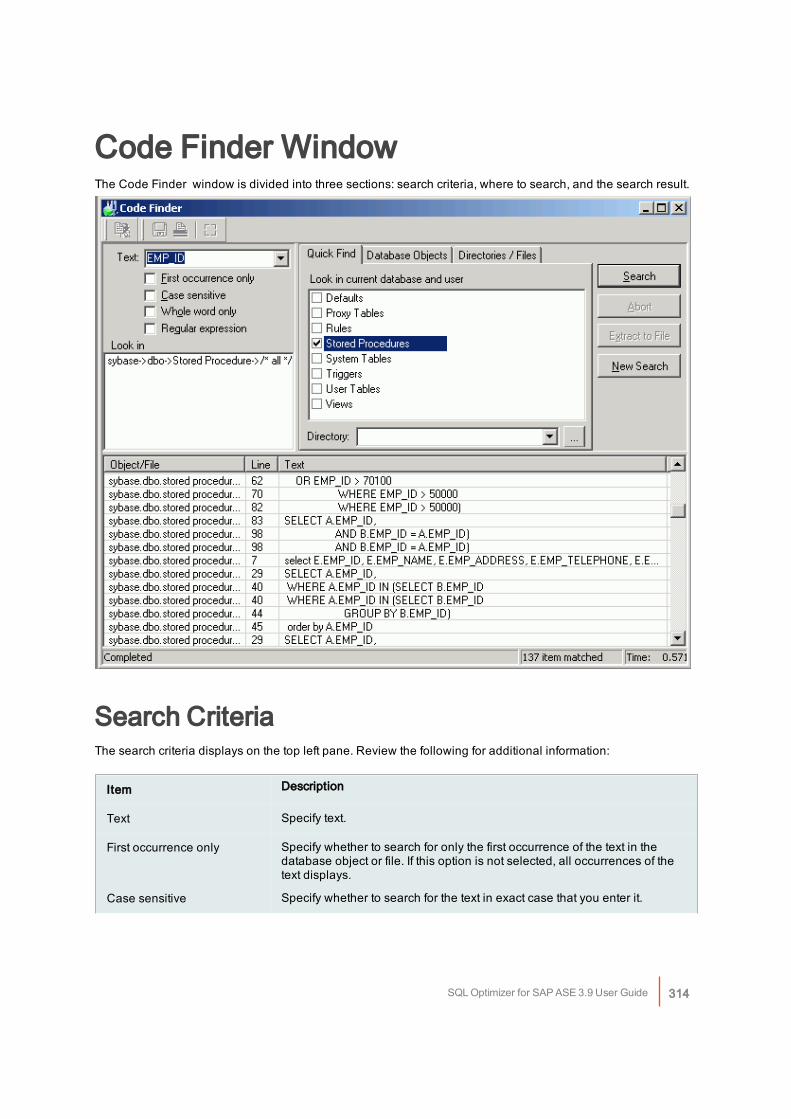
Code Finder WindowThe Code Finder window is divided into three sections: search criteria, where to search, and the search result.
Search CriteriaThe search criteria displays on the top left pane. Review the following for additional information:
Item Description
Text Specify text.
First occurrence only Specify whether to search for only the first occurrence of the text in thedatabase object or file. If this option is not selected, all occurrences of thetext displays.
Case sensitive Specify whether to search for the text in exact case that you enter it.
SQL Optimizer for SAP ASE 3.9 User Guide 314
Whole word only Specify whether to search for words only
Regular Expression Specify whether to recognize regular expressions in the search string.
Where to SearchSelect where you want to search. Review the following for additional information:
Item Description
Look in Displays the list of selected objects and files to search.
Quick Find Allows the selection of the database objects belonging to the current database and user(Tables, Views, Procedures, Triggers, Rules, Defaults) and/or the selection of all filesbelonging to the selected directory.
DatabaseObjects
Allows the browsing and selection of database objects from different databases and users.
Directories/Files Allows the browsing and selection of directories or files. .
Search ResultThe lower pane displays the list of items that matches the search criteria. Review the following for additionalinformation:
Item Description
Name Database object or file name.
Line Line number of matched specified text.
Text Line of text showing the matched specified text.
Related TopicsCode Finder WindowSearch Database Objects and FilesOpen Database Object or File in SQL WorksheetExtract Object DDL to FileSave Search ResultsCode Finder Functions
SQL Optimizer for SAP ASE 3.9 User Guide 315
Search Database Objects and FilesTo display the Code Finder window
Click .Enter a search text or use the down arrow next to the input field to select from a list of previously entered searchtext. The First occurrence only, Case sensitive, Whole word only andRegular expression checkboxes lets yourefine the search.
For database objectsSelect the Quick Find tab to select objects belonging to the current database and user. Or, select the DatabaseObjects tab. Expand the object and select user, object type or object name and click Add. The selected objectdisplays in the Look in pane on the top left indicating that the selected objects will be searched. No duplicateobjects can be selected.
For directories and filesSelect the Directories/Files tab. Select the directory and enter a file mask or click the down arrow to select froma list of previously entered file marks. If blank, *.* is used indicating that all files will be searched. To search inthe sub-directory, select Include sub-directories checkbox. Click Add to select the directory and files. Noduplicate files can be selected.
To start searchingClick Search.
To stop the searchClick Abort.
Related TopicsCode Finder OverviewCode Finder WindowOpen Database Object or File in SQL WorksheetExtract Object DDL to FileSave Search ResultsCode Finder Functions
Regular ExpressionRegular expressions are characters that customize a text search string. They formulate a more complex search.You must select the Regular expression checkbox to use these advanced search features.
SQL Optimizer for SAP ASE 3.9 User Guide 316
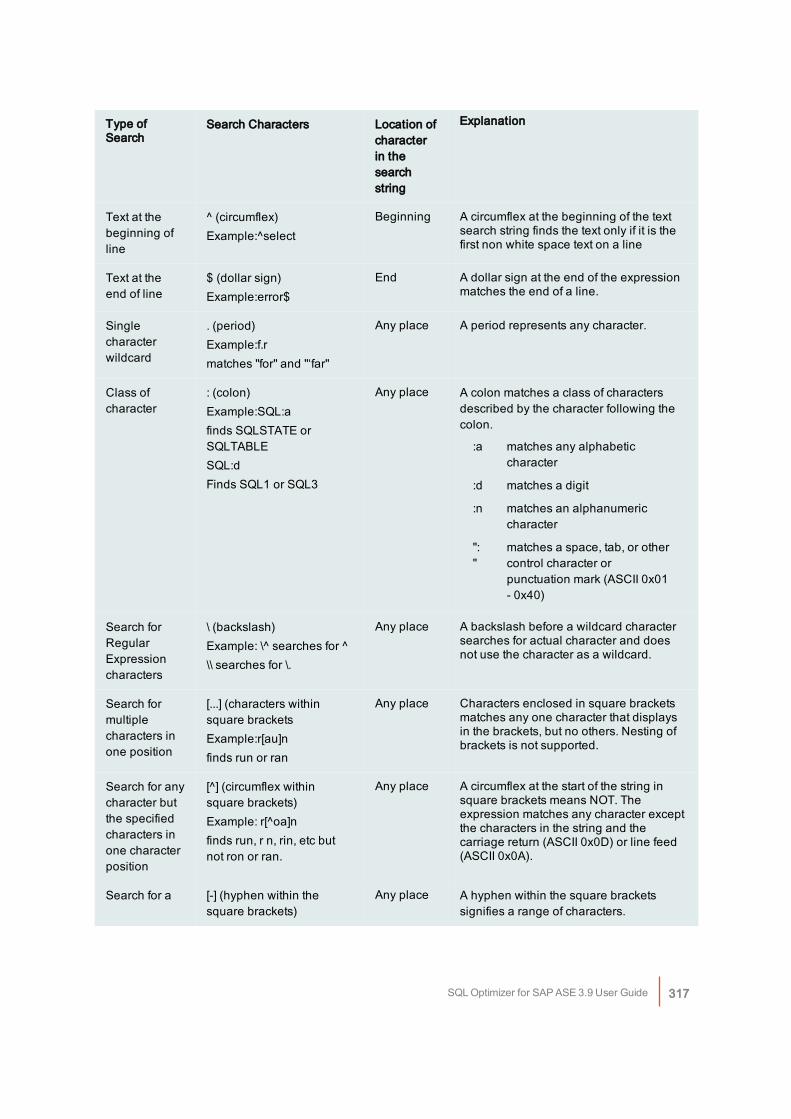
Type ofSearch
Search Characters Location ofcharacterin thesearchstring
Explanation
Text at thebeginning ofline
^ (circumflex)Example:^select
Beginning A circumflex at the beginning of the textsearch string finds the text only if it is thefirst non white space text on a line
Text at theend of line
$ (dollar sign)Example:error$
End A dollar sign at the end of the expressionmatches the end of a line.
Singlecharacterwildcard
. (period)Example:f.rmatches "for" and "‘far"
Any place A period represents any character.
Class ofcharacter
: (colon)Example:SQL:afinds SQLSTATE orSQLTABLESQL:dFinds SQL1 or SQL3
Any place A colon matches a class of charactersdescribed by the character following thecolon.
:a matches any alphabeticcharacter
:d matches a digit
:n matches an alphanumericcharacter
":"
matches a space, tab, or othercontrol character orpunctuation mark (ASCII 0x01- 0x40)
Search forRegularExpressioncharacters
\ (backslash)Example: \^ searches for ^\\ searches for \.
Any place A backslash before a wildcard charactersearches for actual character and doesnot use the character as a wildcard.
Search formultiplecharacters inone position
[...] (characters withinsquare bracketsExample:r[au]nfinds run or ran
Any place Characters enclosed in square bracketsmatches any one character that displaysin the brackets, but no others. Nesting ofbrackets is not supported.
Search for anycharacter butthe specifiedcharacters inone characterposition
[^] (circumflex withinsquare brackets)Example: r[^oa]nfinds run, r n, rin, etc butnot ron or ran.
Any place A circumflex at the start of the string insquare brackets means NOT. Theexpression matches any character exceptthe characters in the string and thecarriage return (ASCII 0x0D) or line feed(ASCII 0x0A).
Search for a [-] (hyphen within thesquare brackets)
Any place A hyphen within the square bracketssignifies a range of characters.
SQL Optimizer for SAP ASE 3.9 User Guide 317
range ofcharacters inone characterposition
Example: SQL[1-3]finds SQL1, SQL2 andSQL3
Note: the range must be in a progressiveorder, i.e. "[a-x]" matches any characterfrom a through x while "[x-a]" does notmatch anything.
Related TopicsCode Finder OverviewCode Finder WindowSearch Database Objects and FilesOpen Database Object or File in SQL WorksheetExtract Object DDL to FileSave Search ResultsCode Finder Functions
Open Database Object or File in SQLWorksheetYou can open the matched database objects and files in the SQL Worksheet after performing the Searchfunction in the Code Finder window.
To open the database object or file in the SQL WorksheetRight-click the object or file and select Open in SQL Worksheet.The database object’s DDL or the file opens on the SQL Worksheet window and the cursor displays at thebeginning of the matching text.
Related TopicsCode Finder OverviewCode Finder WindowSearch Database Objects and FilesRegular ExpressionExtract Object DDL to FileSave Search ResultsCode Finder Functions
Extract Object DDL to FileIn the Code Finder window, you can extract the DDL to a file for the database objects that contain thesearch string.
SQL Optimizer for SAP ASE 3.9 User Guide 318
To extract the DDL from an object
1. Perform a search.
2. Select the object from the lower pane.
3. Click Extract to file.
4. Enter a name for the DDL file.
Related TopicsCode Finder OverviewCode Finder WindowSearch Database Objects and FilesRegular ExpressionOpen Database Object or File in SQL WorksheetExtract Object DDL to FileSave Search ResultsCode Finder Functions
Save Search ResultsYou can save the search results from the Code Finder in a file.
To save the search results
1. Right-click and select Save.
2. Select to formate the file as Text, HTML, or Excel Convertible (Spreadsheet).
Related TopicsCode Finder OverviewCode Finder WindowSearch Database Objects and FilesRegular ExpressionOpen Database Object or File in SQL WorksheetExtract Object DDL to FileCode Finder Functions
Code Finder FunctionsBelow is a list of available functions within the Code Finder window.
SQL Optimizer for SAP ASE 3.9 User Guide 319
Menu Function
Search
Abort
Extract to File
New Search
Right-click Menu Open in SQL Worksheet
Right-click Menu Save
Related TopicsSearch Database Objects and FilesExtract Object DDL to FileOpen Database Object or File in SQL WorksheetSave Search ResultsCode Finder OverviewCode Finder WindowRegular Expression
Object Extractor OverviewThe Object Extractor allows the retrieval of the DDL text for creating the database objects. You can also retrievethe DDL for the object dependencies ordered by the lowest dependencies first.
Related TopicsObject Extractor WindowExtract Object DDL and DependenciesExtraction CriteriaObject Extractor Functions
Object Extractor WindowView Object Extractor Window
SQL Optimizer for SAP ASE 3.9 User Guide 320
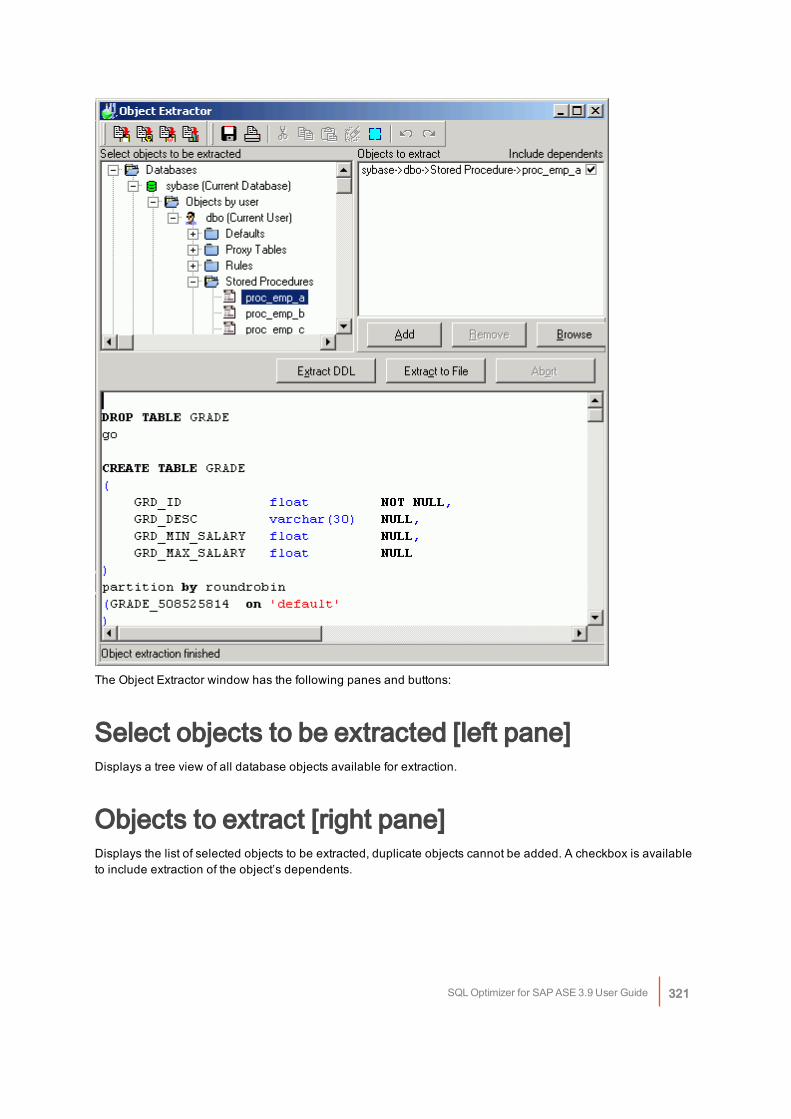
The Object Extractor window has the following panes and buttons:
Select objects to be extracted [left pane]Displays a tree view of all database objects available for extraction.
Objects to extract [right pane]Displays the list of selected objects to be extracted, duplicate objects cannot be added. A checkbox is availableto include extraction of the object’s dependents.
SQL Optimizer for SAP ASE 3.9 User Guide 321
DDL [bottom pane]Displays the DDL script when Extract DDL is selected.
ButtonsButton Function
Extract DDL Extract the DDL of the selected object(s) to the bottom pane.
Extract to file Extract the DDL of the selected object(s) directly to a file.
Abort Abort the extraction process.
Related TopicsObject Extractor OverviewExtract Object DDL and DependenciesExtraction CriteriaObject Extractor Functions
Extract Object DDL and DependenciesTo open the Object Extractor window
Click .From the left pane [Select objects to be extracted], select the objects to extract. You can select the user name (allobjects belonging to the selected user), object type (all objects of the selected type belonging to the selectedobject) and a specific object name.
To select the objects for retrieving the DDL, use one of the following
l Select the tree node from the left pane and click Add.
l Click Browse and use the Add Database Objects window to select the database objects.
l Double-click the database object or tree node.
l Drag and drop the object over to the right pane [Objects to extract].
By default, all selected objects are extracted with dependents. Deselect the corresponding checkbox if you donot want to include dependents in the [Objects to extract] pane.
To display the DDL script on the bottom paneClick Extract DDL.
SQL Optimizer for SAP ASE 3.9 User Guide 322
To save the DDL script directly to fileClick Extract to file.Before the object DDL is extracted, the Extraction Criteria window displays. This window allows you to selecthow the object DDL displays. If you disable this window, the DDL script is generated according to the selectedparameters on the DDL tab in the Preferences window.
To abort the extraction of the DDLClick Abort.
Related TopicsObject Extractor OverviewObject Extractor WindowExtraction CriteriaObject Extractor Functions
Extraction CriteriaThe Extraction Criteria window provides options on how the object DDL displays. These options include:
Place a DROP command before the objectSpecify whether to include the DROP command before the CREATE object command.
Qualify object with database and user nameSpecify whether to place the database and user name in front of every object in the DDL.
Include indexes for tableSpecify whether to include the CREATE INDEX command when the DDL for a table is extracted.
Place comments in scriptSpecify whether to place a comment before and after the DDL script for each object. The comment includesinformation on the database, user, object name and date and time of generation.
Show on next extractionSpecify whether to show the Extraction Criteria window next time DDL is extracted. If this window is not shownthen the extraction option will be according to last selection.
SQL Optimizer for SAP ASE 3.9 User Guide 323
Related TopicsObject Extractor OverviewObject Extractor WindowExtract Object DDL and DependenciesObject Extractor Functions
Object Extractor FunctionsBelow is a list of available functions within the Object Extractor window.
Button or Menu Function
Extract DDL
Extract to File
Abort
Edit Menu Send to SQL Optimizer
Edit Menu Send to Index Advisor
Edit Menu Copy to SQL Worksheet
Related TopicsObject Extractor OverviewObject Extractor WindowExtraction Criteria
SQL Repository OverviewThe SQL Repository stores the SQL statements that are used in the analysis of database performance. Thesemay be SQL statements that you have identified as critical to the performance of your database application.
Related TopicsSQL Repository WindowSQL Repository FunctionsAdd SQL to SQL Repository
SQL Optimizer for SAP ASE 3.9 User Guide 324
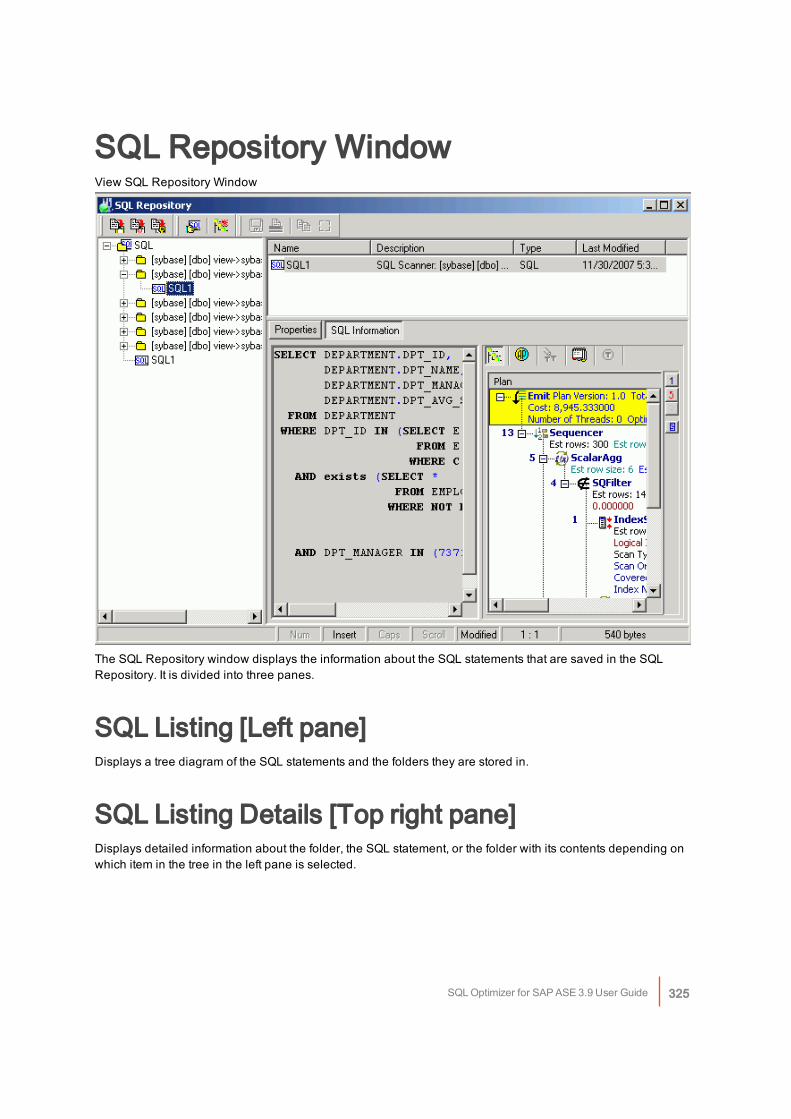
SQL Repository WindowView SQL Repository Window
The SQL Repository window displays the information about the SQL statements that are saved in the SQLRepository. It is divided into three panes.
SQL Listing [Left pane]Displays a tree diagram of the SQL statements and the folders they are stored in.
SQL Listing Details [Top right pane]Displays detailed information about the folder, the SQL statement, or the folder with its contents depending onwhich item in the tree in the left pane is selected.
SQL Optimizer for SAP ASE 3.9 User Guide 325
SQL Information Details [Bottom right pane]The detailed information about the SQL statement displays in the button pages. The buttons for displayingspecific information are found at the top of this pane.
Properties buttonDisplays general information, the SQL name, where the SQL statement was copied from, the logon connection,and database and other settings.
SQL Information buttonDisplays the SQL text, the query plan, the abstract plan, trace on information, SQL classification, and DDL forany temporary tables used in the SQL statement.
Save the Abstract PlanThe abstract plan for a SQL statement can be saved from this pane. In order to save the abstract plan, it musthave been retrieved when the SQL statement was created in the SQL Repository. Before the SQL statement iscreated, you must enable the dumping of the Abstract Plan in the Optimization or the Scanner Preferences. Ifyou are connected to Adaptive Server 15, use the Abstract Plan settings in the Optimization for ASE 15 tab.Otherwise, use the Abstract Plan settings in the Optimization for Pre-ASE 15 tab.
To save the abstract plan
1. Select the SQL statement in the left pane.
2. Click in the right pane.
3. Click .
4. In the Save to group field, select the abstract plan group.
5. Click Save.
Related TopicsSQL Repository OverviewSQL Repository Function
Add SQL to SQL RepositorySQL statements are stored in the SQL Repository for use in an Index Impact Analysis, an Index Usage Analysis,a Migration Analysis, or a Configuration Analysis. From within the SQL Repository window, you can add a singleSQL statement, some or all SQL statements found by the SQL Scanner, and SQL statements that referencespecific tables or views. SQL statements can also be added to the SQL Repository from other modules.
SQL Optimizer for SAP ASE 3.9 User Guide 326
To add a single SQL statement
1. Click .
2. If no SQL exists in the SQL Repository, then the Add SQL wizard displays automatically. Otherwise,
click Add SQL .
3. The Add SQL wizard has three pages to selects the options for saving the SQL statement to the SQLRepository.
l General
l SQL Information
l Database Settings
4. After making the selections from the three tabs, click OK to save the SQL to the SQL Repository.
The SQL syntax is checked and the query plan retrieved before adding a new node to the SQL tree view withthe SQL name. Each SQL statement added to the SQL Repository contains a query plan, SQL classificationtype (Simple, Complex or Problematic) and the current connection information (login name, server name,database and user). The query plan stored with the SQL statement is important as it indicates the currentperformance of the SQL.
To add SQL from the SQL Scanner
1. From the SQL Repository window, select SQL | Add SQL from SQL Scanner.
2. On the General page of the wizard, select the location to save the SQL statements.
3. On the SQL Scanner page, select the Groups or Jobs that contain the SQL you want to add.
4. Click Finish.
To add all SQL statements that references a specific table or view
1. From the SQL Repository window, select SQL | Add SQL by Database Object.
2. In the Database object pane, select the tables or views that you want the SQL to reference.
3. Click Extract. The Save SQL to SQL Repository wizard displays.
4. On the General page, select the location to save the SQL statements.
5. Click Finish.
Related TopicsSQL Repository OverviewSQL Repository Functions
SQL Optimizer for SAP ASE 3.9 User Guide 327
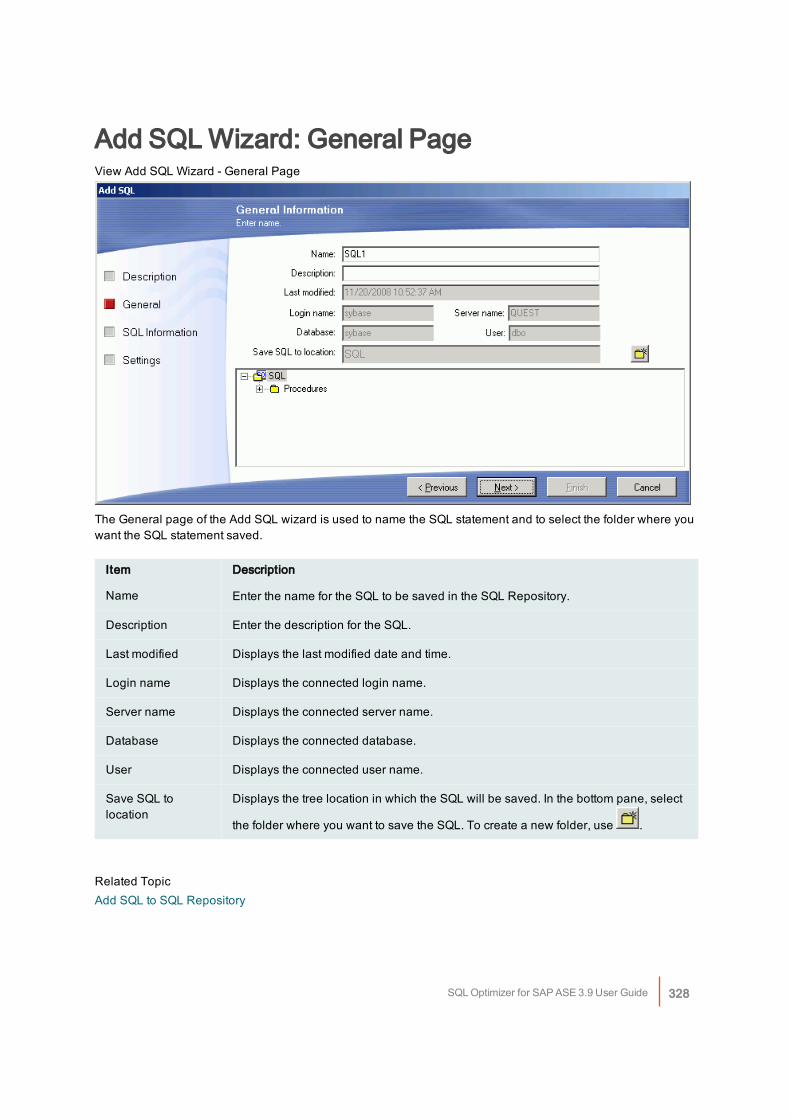
Add SQL Wizard: General PageView Add SQL Wizard - General Page
The General page of the Add SQL wizard is used to name the SQL statement and to select the folder where youwant the SQL statement saved.
Item Description
Name Enter the name for the SQL to be saved in the SQL Repository.
Description Enter the description for the SQL.
Last modified Displays the last modified date and time.
Login name Displays the connected login name.
Server name Displays the connected server name.
Database Displays the connected database.
User Displays the connected user name.
Save SQL tolocation
Displays the tree location in which the SQL will be saved. In the bottom pane, select
the folder where you want to save the SQL. To create a new folder, use .
Related TopicAdd SQL to SQL Repository
SQL Optimizer for SAP ASE 3.9 User Guide 328
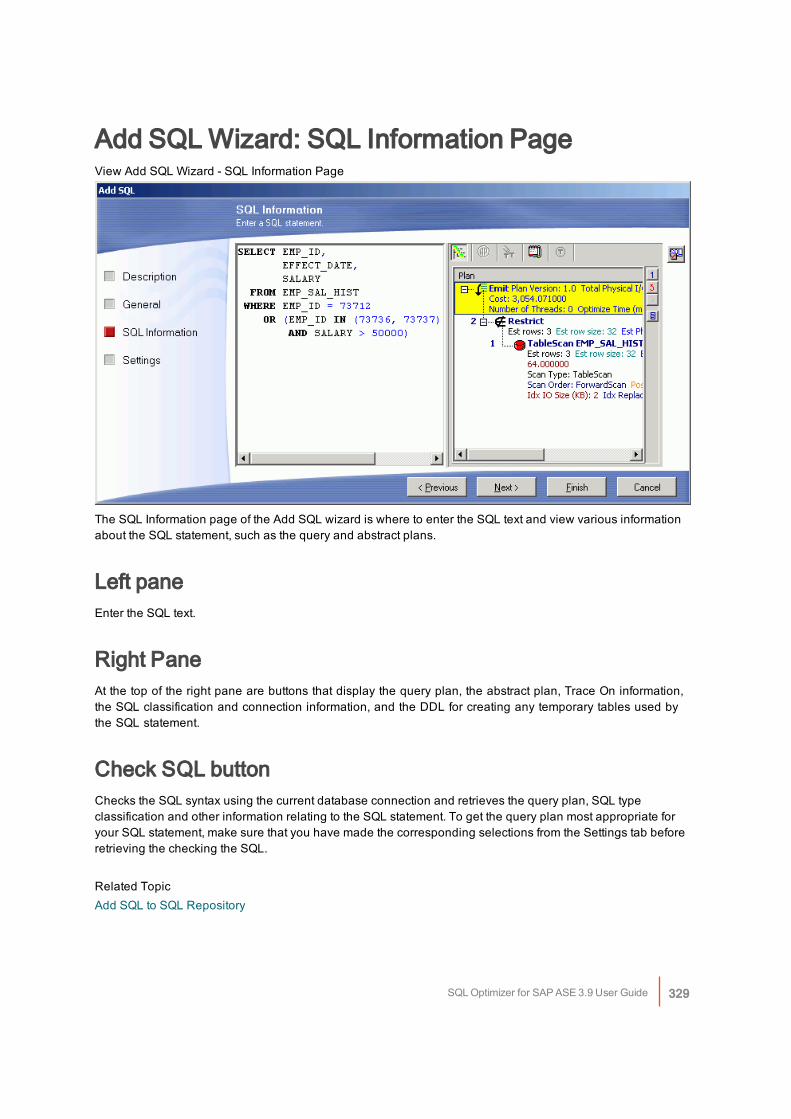
Add SQL Wizard: SQL Information PageView Add SQL Wizard - SQL Information Page
The SQL Information page of the Add SQL wizard is where to enter the SQL text and view various informationabout the SQL statement, such as the query and abstract plans.
Left paneEnter the SQL text.
Right PaneAt the top of the right pane are buttons that display the query plan, the abstract plan, Trace On information,the SQL classification and connection information, and the DDL for creating any temporary tables used bythe SQL statement.
Check SQL buttonChecks the SQL syntax using the current database connection and retrieves the query plan, SQL typeclassification and other information relating to the SQL statement. To get the query plan most appropriate foryour SQL statement, make sure that you have made the corresponding selections from the Settings tab beforeretrieving the checking the SQL.
Related TopicAdd SQL to SQL Repository
SQL Optimizer for SAP ASE 3.9 User Guide 329
Add SQL Wizard: Settings PageThe Settings page of the Add SQL wizard is used to set various parameters that affect the retrieval of the queryplan for the SQL statement.
SQL Settings section
SQL for CursorAdaptive Server uses a difference query plan for a SQL statement that is embedded in a cursor declaration fromthe query plan when the SQL statement is not embedded in a cursor. This needs to be taken into account whenretrieving the query plan or run time and also when generating SQL alternatives.Therefore, if the original SQL statement comes from or will be embedded in a cursor declaration then you needto select the SQL for Cursor checkbox. This enables cursor simulation when retrieving the query plan.
Use Default PlanThis option uses the BINARY data type when executing the Show Plan function for all variables in the SQLstatement. This is useful when you want to quickly investigate the query plan of the original SQL statementwithout having to select the data type for each variable.
Abstract Plan section
Dump abstract planSpecify whether to retrieve the abstract plan for the SQL statement whenever the query plan is retrieved. Theabstract plan is not saved on the database until you deliberately save it. The default group names in AdaptiveServer are: ap_stdout and ap_stdin. These groups are usually used by the Database Administrator to enableserver-wide abstract plan capturing and retrieving.Group nameSpecify the abstract plan group name where the abstract plan for this SQL statement is saved.Abstract Plan Manager buttonOpens the Abstract Plan Manager window to view, create, and modify abstract plan group.
Database Settings section
Set Ansinull OnSpecify the option with regards to comparison of NULL values.
Set Quoted_identifier OnSpecify whether to allows the use of delimited identifier (" ") for table names.
SQL Optimizer for SAP ASE 3.9 User Guide 330
Set Statistics Simulate On SAP ASE 15 or later)Specify whether to load simulated statistics into the database. Simulated statistics can be generated usingoptdiag command and can be used to optimize SQL statements using the simulated statistics rather than theactual statistics.
dbcc traceon (3604, 302, 310) (sa_role privilege only)Specify whether to retrieve the trace on information which displays the reasons why the Adaptive Serveroptimizer chooses to resolve the SQL statement in a particular way. This option is applicable only if you havesa_role privileges.
Related TopicAdd SQL to SQL Repository
Refresh SQL Query PlanIf you feel the query plan stored with the SQL statement in the SQL Repository does not represent the currentindication of performance due to database changes, you can retrieve the current query plan from the database.
To refresh the query plan in the SQL Repository
1. Select the SQL.
2. Select SQL | Refresh Plan or right-click the tree view and select Refresh Plan to open the RefreshPlan window.
3. The original query plan displays on the left pane while the newly retrieved query plan is displayed on theright pane for comparison. You can view and analyze the newly retrieved query plan, abstract plan, andSQL classification before saving the new query plan with the SQL statement.
4. Click Save to replace the original query plan with the newly retrieved one.
Related TopicSQL Repository Window
Modify SQLYou can only modify the SQL name and description of the SQL statement stored in the SQL Repository.
To modify SQL name or description
1. From the SQL Repository window, select the SQL you want to modify from the left pane.
2. Right-click and select Modify.
SQL Optimizer for SAP ASE 3.9 User Guide 331
3. Modify the name and/or description. Click OK to save changes to the SQL Repository. The Last modifiedfield will automatically be updated once the information is saved.
Note: SQL text cannot be modified. You must delete the current SQL and recreating a new one to changethe SQL text.
Related TopicSQL Repository Window
Rename SQLYou can rename a SQL statement stored in the SQL Repository window in two ways:
To rename SQL
1. Right-click the SQL and select Rename. A highlighted field is placed around the SQL name in the tree toindicate that you can edit the name.
2. Change the name and press Enter or click any where outside the field.
Note: You can also right-click the SQL and select Modify to open the Modify SQL window. Modify the name.Click OK to save changes to the SQL Repository.
Related TopicSQL Repository Window
Delete SQLWhen you delete a SQL statement from the SQL Repository, it also deletes all references to this SQL statementin the Analyzer modules.
To delete a SQL statement stored in the SQL Repository
1. Right-click the SQL and select Delete or highlight the SQL statement and press DELETE.
2. If the SQL statement is in an Index Impact Analysis, an Index Usage Analysis, a Migration Analysis, or aConfiguration Analysis, you will be prompted before it is deleted.
Related TopicSQL Repository Window
SQL Optimizer for SAP ASE 3.9 User Guide 332
Create Benchmark Factory Import FileAll the SQL statements can be saved in a text file from the SQL Scanner, the SQL Repository, the SQLInspector, and the SQL Optimizer windows. These SQL statements can then be imported into BenchmarkFactory 4.6 or later.
To create a file to import into Benchmark Factory
1. Right-click and select Create Benchmark Factory Import File.
2. Select the specific SQL statements that you want to save.
3. Enter the filename and select the file location.
SQL Repository FunctionsBelow is a list of available functions within the SQL Repository window.
Button or Menu Function
SQL & Right-click Menu Add SQL
SQL Menu Add SQL from SQL Scanner
SQL & Right-click Menu Add SQL by Database Object
SQL & Right-click Menu Refresh Plan
SQL & Right-click Menu Add Folder
Right-click Menu Modify
Right-click Menu Delete
Right-click Menu Rename
SQL & Right-click Menu Save Abstract Plan
Right-click Menu Create Benchmark Factory Import File
Related TopicSQL Repository Overview
SQL Optimizer for SAP ASE 3.9 User Guide 333
SQL Repository Window
Index Impact Analyzer OverviewThe Index Impact Analyzer analyzes the performance impact of new indexes on SQL statements before theindexes are permanently created on your database. New indexes may improve the performance of one SQL butdowngrade the performance of several others. Index Impact Analyzer evaluates the performance effect thatgiven indexes might have on SQL statements, thereby removing the uncertainty associated with index creation.The Index Impact Analyzer analyzes the performance impact of index creation on SQL statements retrieved fromthe SQL Repository or the SQL Scanner. To analyze the impact the creation of new indexes might have on SQLperformance, the proposed indexes are created on the database. Then new query plans are retrieved showingthe impact the new indexes have on the query plans of individual SQL statements. The new indexes aredropped after the retrieval of the query plans.After the analysis is complete, the Index Impact Analyzer provides metrics of the overall performance changesand allows you to identify which SQL statements experienced query plan changes with the proposed indexes.
Related TopicsCreate an Index Impact AnalyzerIndex Impact Analyzer WindowIndex Impact Analyzer Functions
Index Impact Analyzer WindowView Index Impact Analyzer Window
SQL Optimizer for SAP ASE 3.9 User Guide 334
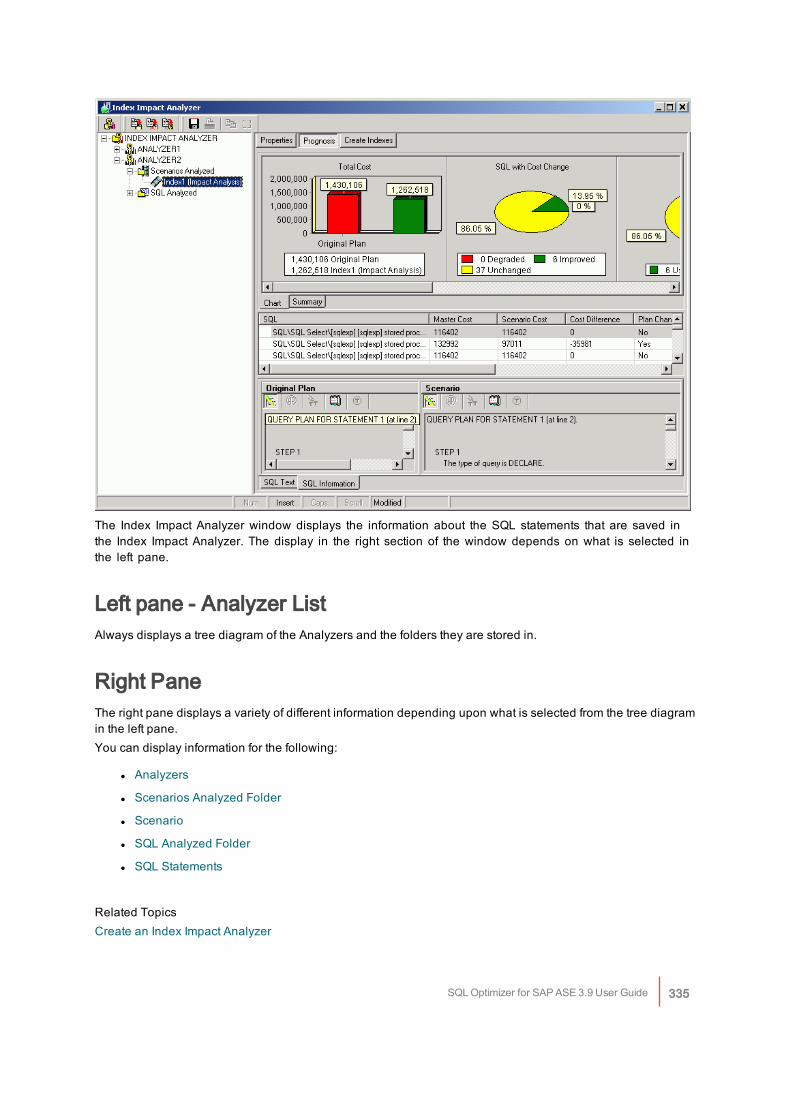
The Index Impact Analyzer window displays the information about the SQL statements that are saved inthe Index Impact Analyzer. The display in the right section of the window depends on what is selected inthe left pane.
Left pane - Analyzer ListAlways displays a tree diagram of the Analyzers and the folders they are stored in.
Right PaneThe right pane displays a variety of different information depending upon what is selected from the tree diagramin the left pane.You can display information for the following:
l Analyzers
l Scenarios Analyzed Folder
l Scenario
l SQL Analyzed Folder
l SQL Statements
Related TopicsCreate an Index Impact Analyzer
SQL Optimizer for SAP ASE 3.9 User Guide 335
Index Impact Analyzer OverviewIndex Impact Analyzer Functions
Right Pane for AnalyzersIn the Index Impact Analyzer window, when an Analyzer is selected in the left pane, the following informationdisplays in the right pane.
Properties ButtonDisplays general information about the analysis, information on the connection used to retrieve the query plansand the SQL statements used in the analysis.
Related TopicIndex Impact Analyzer Window
Right Pane for Scenarios Analyzed FolderIn the Index Impact Analyzer window, when the Scenarios Analyzed Folder is selected in the left pane, thefollowing information displays in the right pane.
Summary buttonProvides a summary of the Estimated I/O Cost and SQL classification for the SQL statements before and afterthe proposed indexes were created.
Chart buttonCharts the total Estimated I/O Cost of the SQL statements with and without the proposed indexes.
Related TopicIndex Impact Analyzer Window
Right Pane for ScenariosIn the Index Impact Analyzer window, when the Scenario folder is selected in the left pane, the followinginformation displays in the right pane.
Properties buttonDisplays general information about the analysis and the index name.
SQL Optimizer for SAP ASE 3.9 User Guide 336
Prognosis buttonDisplays 3 panes in the right section of the window.Charts and Summary tabs [Top right pane]The Chart tab displays five charts of the comparison information for the query plans from before the analysisand during the analysis.The Summary tab displays summarized statistics for the Scenario,SQL Classification and Plan Change Comparisons [Middle right pane]A grid displays the information about each query plan from before the analysis and during the analysis in acomparison format.SQL Text and SQL Information tabs [Bottom right pane]The SQL statement that is highlight in the middle right pane is the one that displays in this pane.The SQL Text tab displays the text of the SQL statement.The SQL Information tab displays two SQL Information panes, one for the SQL information before the analysisand one for the SQL Information with the parameter changes.
Create/Drop Indexes button
Displays the script for creating and dropping the index sets. Click Execute located at the right of the IndexImpact Analyzer window to create the new index or drop the index.
Related TopicIndex Impact Analyzer Window
Right Pane for SQL Analyzed FolderIn the Index Impact Analyzer window, when the SQL Analyzed folder is selected in the left pane, the followinginformation displays in the right pane.
Cost Summary buttonDisplays all the SQL statements and shows the Estimated I/O Cost with and without the proposed indexes.
Cost Classification buttonDisplays all the SQL statements and shows the SQL Classification (Simple, Complex, and Problematic) with andwithout the proposed indexes.
Related TopicIndex Impact Analyzer Window
SQL Optimizer for SAP ASE 3.9 User Guide 337
Right Pane for SQL StatementsIn the Index Impact Analyzer window, when a SQL statement is selected in the left pane, the followinginformation displays in the right pane.
Properties buttonDisplays general information about the analysis, information on the connection used to retrieve the query plansand the database settings at the time of the analysis.
SQL Information buttonDisplays the SQL statement selected, as well as, two SQL Information panes that show the query plans for thestatement before and after the index Scenario is in place. In the query plan, the operations that are differentbetween the two plans are highlighted in green.
Saving the Abstract PlanThe abstract plan for a SQL statement can be saved from this pane. In order to save the abstract plan, it must beretrieved when the SQL was selected to be analyzed. This is done from the Abstract Plan page of the NewAnalysis wizard.
1. Select the SQL statement in the left pane.
2. Click SQL Information section of the right pane. This enables the Save Abstract Plan button.
3. Click Save Abstract Plan .
4. In the Save to group field, select the abstract plan group.
5. Click Save.
Related TopicIndex Impact Analyzer Window
Create an Index Impact AnalyzerTo create an Index Impact Analyzer
1. Click to open the Index Impact Analyzer window.
2. If no analysis exists in the Index Impact Analyzer then the New Analysis wizard displays automatically.
Otherwise, click to open the New Analysis wizard.
SQL Optimizer for SAP ASE 3.9 User Guide 338
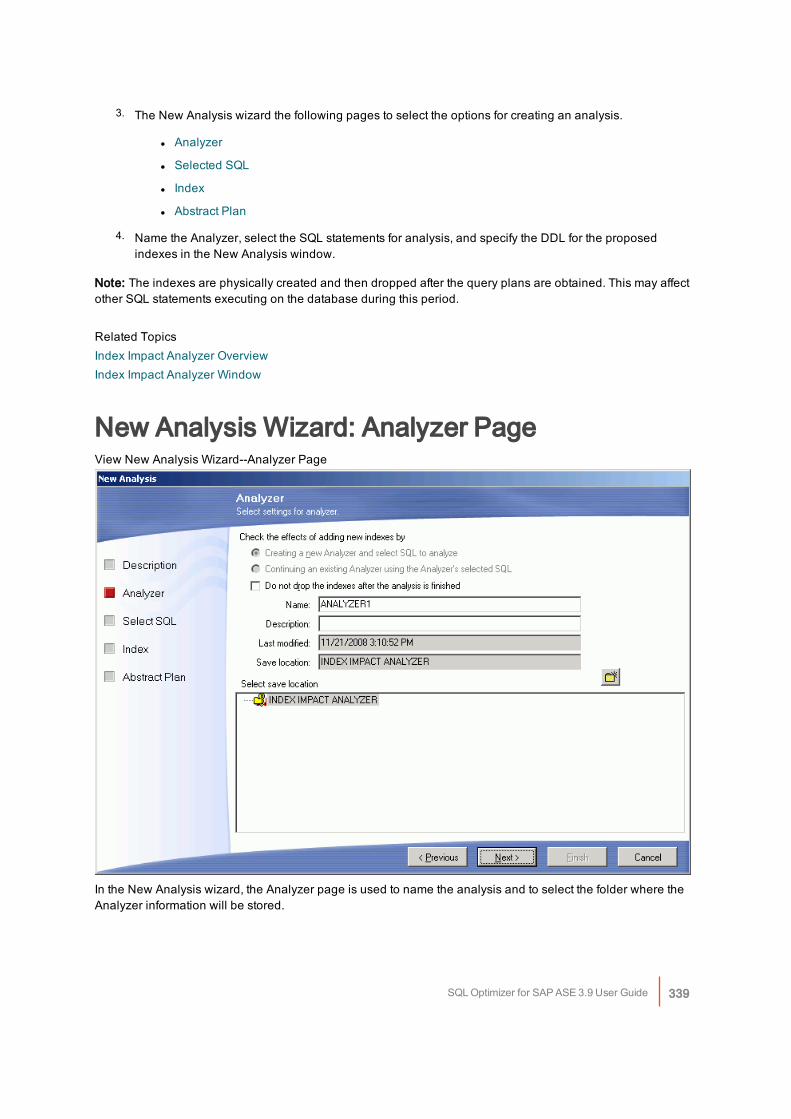
3. The New Analysis wizard the following pages to select the options for creating an analysis.
l Analyzer
l Selected SQL
l Index
l Abstract Plan
4. Name the Analyzer, select the SQL statements for analysis, and specify the DDL for the proposedindexes in the New Analysis window.
Note: The indexes are physically created and then dropped after the query plans are obtained. This may affectother SQL statements executing on the database during this period.
Related TopicsIndex Impact Analyzer OverviewIndex Impact Analyzer Window
New Analysis Wizard: Analyzer PageView New Analysis Wizard--Analyzer Page
In the New Analysis wizard, the Analyzer page is used to name the analysis and to select the folder where theAnalyzer information will be stored.
SQL Optimizer for SAP ASE 3.9 User Guide 339
Creating a new Analyzer and select SQL to be analyzedSelect this option to create a new analysis using a different set of SQL statements.
Continuing an existing Analyzer using the Analyzer'sselected SQLSelect this option to use the same set of SQL statements that is stored in an existing Analyzer. This option addsanother Scenario under an existing Analyzer and does not retrieve a new set of query plans for the SQLstatements. It uses the query plans that were originally saved with the SQL statements.
Do not drop the indexes after the analysis is finishedSpecific to leaves the new indexes that you create under the Index tab after the analysis is finished. Otherwise,these changes are dropped at the end of the analysis processing. After the analysis is complete, theCreate/Drop Indexes button displays at the top of the Index Impact Analyzer window which displays theCreate Indexes, Drop Indexes, and the Drop All Indexes panes. These panes contain the scripts to create ordrop the indexes.
Item Description
Name Enter the name for the analysis.
Description Enter the description for the analysis.
Last modified Displays the last modified date and time.
Save location Displays the folder in the tree where the Analyzer is saved.
Folder Tree In the bottom pane, select the folder where you want to save the Analyzer.
To create a new folder, click Add Folder.
Related TopicCreate an Index Impact Analyzer
New Analysis Wizard: Select SQL PageView New Analysis Wizard - Select SQL Page
SQL Optimizer for SAP ASE 3.9 User Guide 340
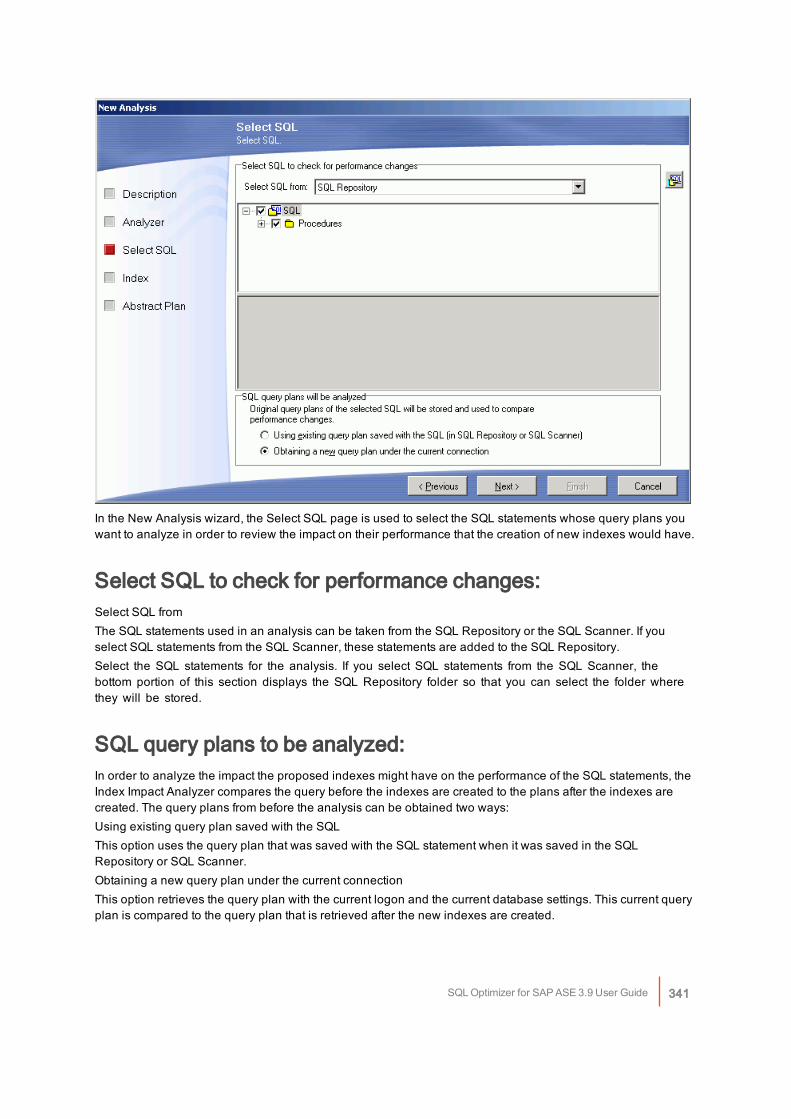
In the New Analysis wizard, the Select SQL page is used to select the SQL statements whose query plans youwant to analyze in order to review the impact on their performance that the creation of new indexes would have.
Select SQL to check for performance changes:Select SQL fromThe SQL statements used in an analysis can be taken from the SQL Repository or the SQL Scanner. If youselect SQL statements from the SQL Scanner, these statements are added to the SQL Repository.Select the SQL statements for the analysis. If you select SQL statements from the SQL Scanner, thebottom portion of this section displays the SQL Repository folder so that you can select the folder wherethey will be stored.
SQL query plans to be analyzed:In order to analyze the impact the proposed indexes might have on the performance of the SQL statements, theIndex Impact Analyzer compares the query before the indexes are created to the plans after the indexes arecreated. The query plans from before the analysis can be obtained two ways:Using existing query plan saved with the SQLThis option uses the query plan that was saved with the SQL statement when it was saved in the SQLRepository or SQL Scanner.Obtaining a new query plan under the current connectionThis option retrieves the query plan with the current logon and the current database settings. This current queryplan is compared to the query plan that is retrieved after the new indexes are created.
SQL Optimizer for SAP ASE 3.9 User Guide 341
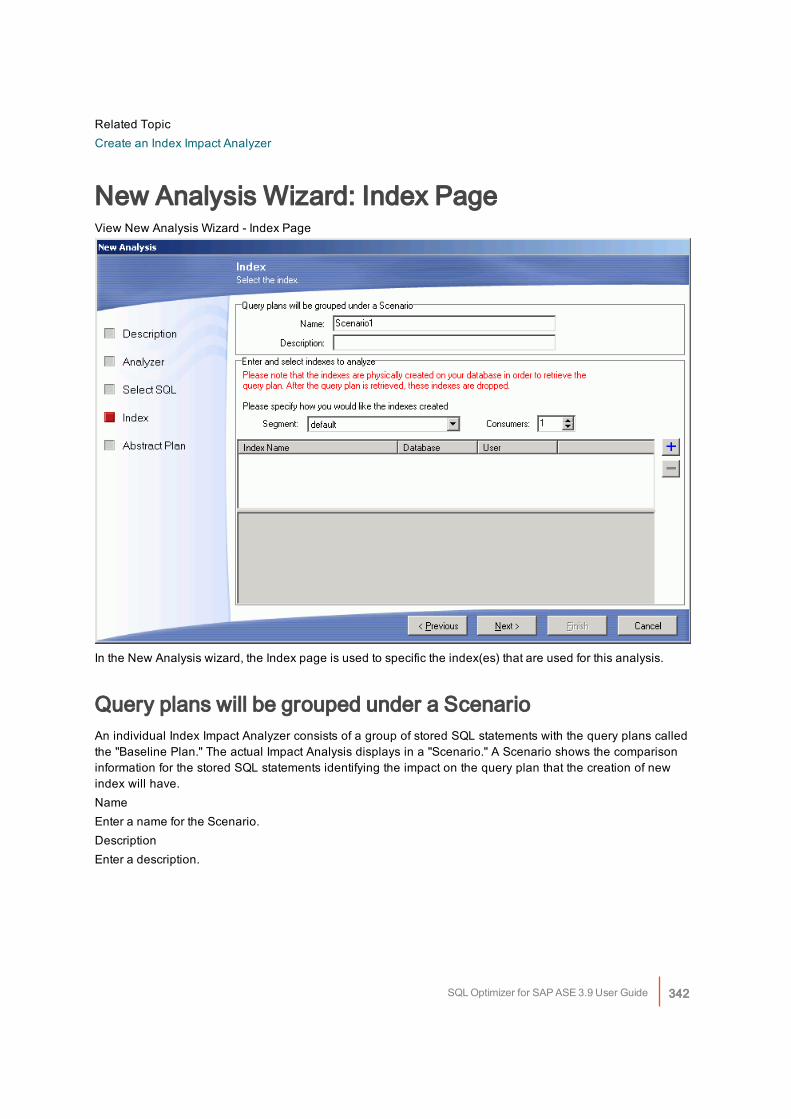
Related TopicCreate an Index Impact Analyzer
New Analysis Wizard: Index PageView New Analysis Wizard - Index Page
In the New Analysis wizard, the Index page is used to specific the index(es) that are used for this analysis.
Query plans will be grouped under a ScenarioAn individual Index Impact Analyzer consists of a group of stored SQL statements with the query plans calledthe "Baseline Plan." The actual Impact Analysis displays in a "Scenario." A Scenario shows the comparisoninformation for the stored SQL statements identifying the impact on the query plan that the creation of newindex will have.NameEnter a name for the Scenario.DescriptionEnter a description.
SQL Optimizer for SAP ASE 3.9 User Guide 342
Enter and select indexes to be analyzedUse Add Index to add the indexes for this Scenario.SegmentSelect the segment where you would like the index created from the drop-down list.Consumer (Default 1 Range 1-20)Specify the number of consumer processes that should perform the sort operation for creating the index. Theactual number of consumer processes used to sort the index may be smaller than the specified number, if fewerworker processes are available when Adaptive Server executes the sort.
To add an index
Click Add Index to bring up the Add Index wizard.
To remove an index
Select the index and click Remove Index .After you have created the first Scenario, you can add more Scenarios.
Related TopicCreate an Index Impact Analyzer
Add Index WizardView Add Index Wizar
SQL Optimizer for SAP ASE 3.9 User Guide 343
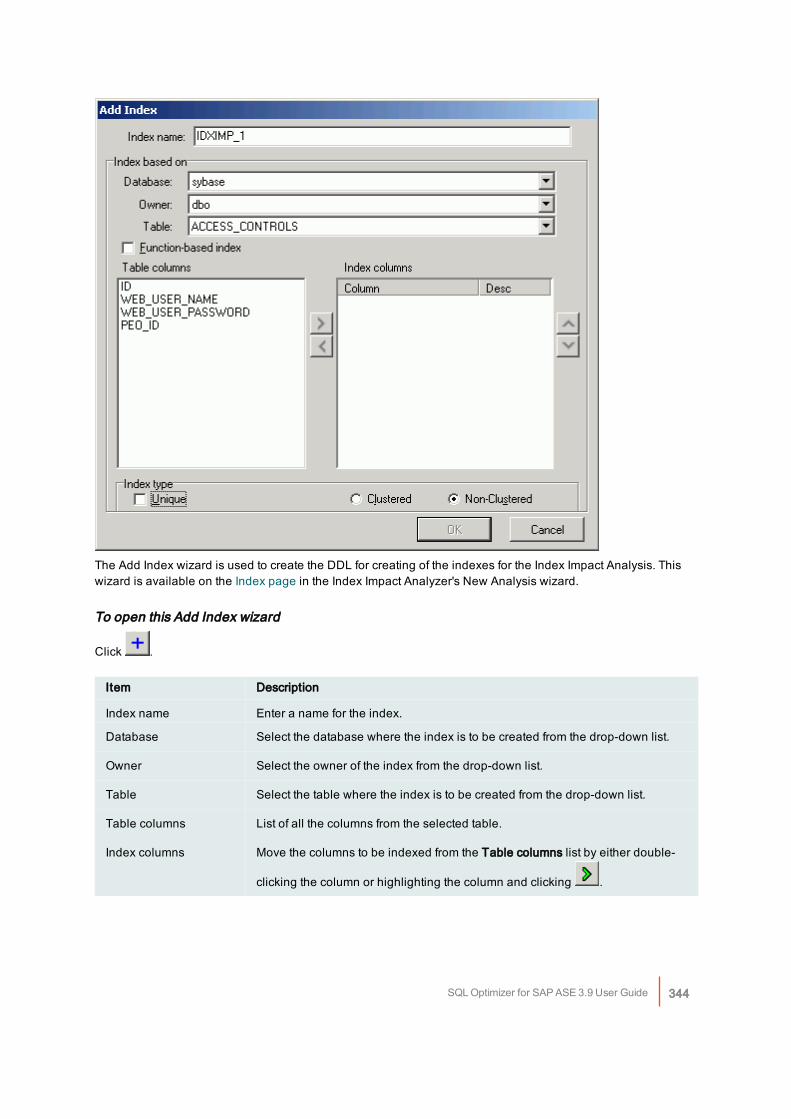
The Add Index wizard is used to create the DDL for creating of the indexes for the Index Impact Analysis. Thiswizard is available on the Index page in the Index Impact Analyzer's New Analysis wizard.
To open this Add Index wizard
Click .
Item Description
Index name Enter a name for the index.
Database Select the database where the index is to be created from the drop-down list.
Owner Select the owner of the index from the drop-down list.
Table Select the table where the index is to be created from the drop-down list.
Table columns List of all the columns from the selected table.
Index columns Move the columns to be indexed from the Table columns list by either double-
clicking the column or highlighting the column and clicking .
SQL Optimizer for SAP ASE 3.9 User Guide 344
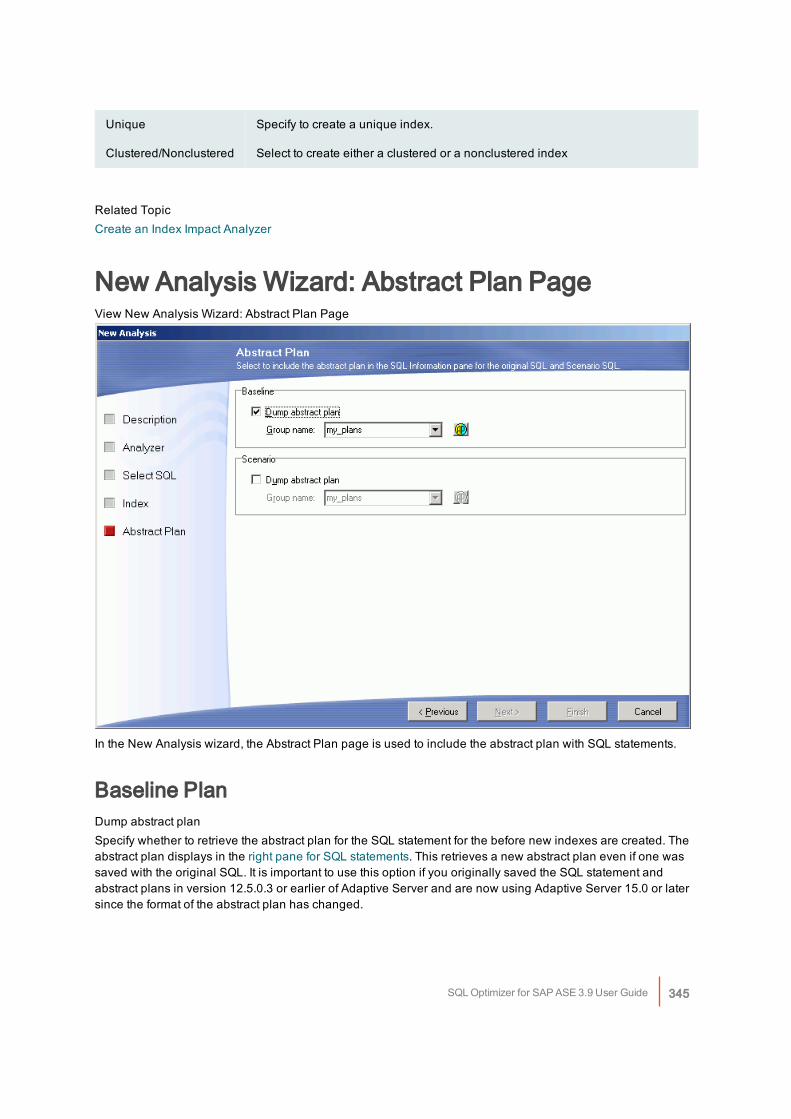
Unique Specify to create a unique index.
Clustered/Nonclustered Select to create either a clustered or a nonclustered index
Related TopicCreate an Index Impact Analyzer
New Analysis Wizard: Abstract Plan PageView New Analysis Wizard: Abstract Plan Page
In the New Analysis wizard, the Abstract Plan page is used to include the abstract plan with SQL statements.
Baseline PlanDump abstract planSpecify whether to retrieve the abstract plan for the SQL statement for the before new indexes are created. Theabstract plan displays in the right pane for SQL statements. This retrieves a new abstract plan even if one wassaved with the original SQL. It is important to use this option if you originally saved the SQL statement andabstract plans in version 12.5.0.3 or earlier of Adaptive Server and are now using Adaptive Server 15.0 or latersince the format of the abstract plan has changed.
SQL Optimizer for SAP ASE 3.9 User Guide 345
Note: This option is disabled if you have selected Using existing query plan saved with the SQL on theSelect SQL page.Group nameSpecify the abstract plan group name where the abstract plans are saved. The default group names in AdaptiveServer are: ap_stdout and ap_stdin. These groups are usually used by the Database Administrator to enableserver-wide abstract plan capturing and retrieving.ap_stdout is used by default to capture an abstract plan.ap_stdin is used by default to retrieve the abstract plan associated with a SQL statement during the execution ofthe SQL statement.Abstract Plan Manager buttonOpens the Abstract Plan Manager window to view, create, and modify abstract plan group.
ScenarioDump abstract planSpecify whether to retrieve the abstract plan for the SQL statement after the indexes are created. The abstractplan is displayed in the right pane for SQL statements.Group nameSpecify the abstract plan group name where the abstract plans are saved. The default group names in AdaptiveServer are: ap_stdout and ap_stdin. These groups are usually used by the Database Administrator to enableserver-wide abstract plan capturing and retrieving.ap_stdout is used by default to capture an abstract plan.ap_stdin is used by default to retrieve the abstract plan associated with a SQL statement during the execution ofthe SQL statement.Abstract Plan Manager buttonOpens the Abstract Plan Manager window to view, create, and modify abstract plan group.
Related TopicCreate an Index Impact Analyzer
Drop IndexesThe Index Impact analysis first creates the indexes on your database. Then it retrieves the query plan for eachSQL statement that you have selected for your analyzer. When you set up the individual scenarios, youdetermine if you would like the indexes dropped or to leave them on your database.If you do not have the analysis process drop the indexes, you can drop them in any one of the following ways:
l In the tree pane (left pane), right-click the scenario name and select Go To Drop Indexes.
l When you close the Index Impact Analyzer window, you are prompted to drop the indexes. Click Yes.
l In the tree pane (left pane), click the scenario name and select the Create/Drop Indexes button at the top
of the right pane. Click next to the Drop Indexes or Drop All Indexes pane.
You can make the changes permanent, in one of the following ways:
SQL Optimizer for SAP ASE 3.9 User Guide 346
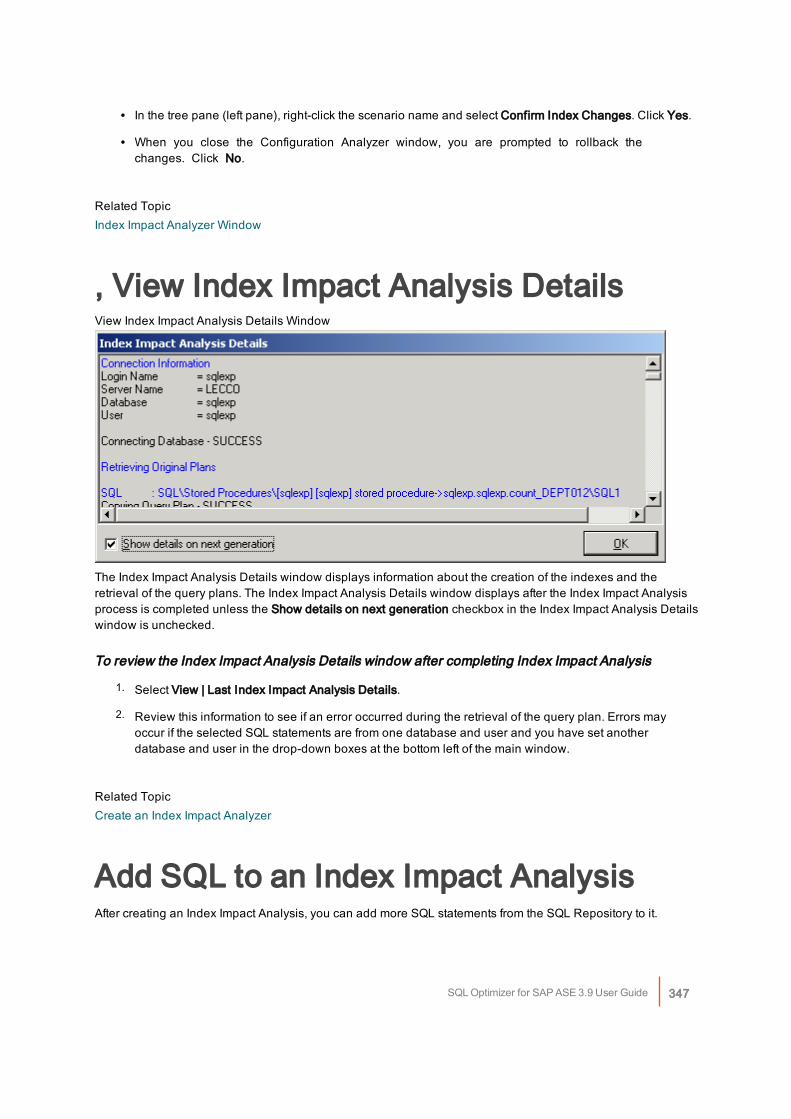
l In the tree pane (left pane), right-click the scenario name and select Confirm Index Changes. Click Yes.
l When you close the Configuration Analyzer window, you are prompted to rollback thechanges. Click No.
Related TopicIndex Impact Analyzer Window
, View Index Impact Analysis DetailsView Index Impact Analysis Details Window
The Index Impact Analysis Details window displays information about the creation of the indexes and theretrieval of the query plans. The Index Impact Analysis Details window displays after the Index Impact Analysisprocess is completed unless the Show details on next generation checkbox in the Index Impact Analysis Detailswindow is unchecked.
To review the Index Impact Analysis Details window after completing Index Impact Analysis
1. Select View | Last Index Impact Analysis Details.
2. Review this information to see if an error occurred during the retrieval of the query plan. Errors mayoccur if the selected SQL statements are from one database and user and you have set anotherdatabase and user in the drop-down boxes at the bottom left of the main window.
Related TopicCreate an Index Impact Analyzer
Add SQL to an Index Impact AnalysisAfter creating an Index Impact Analysis, you can add more SQL statements from the SQL Repository to it.
SQL Optimizer for SAP ASE 3.9 User Guide 347
To add more SQL statements to an Analysis
1. From the left pane, select the Analyzer in which you want to add the SQL.
2. Right-click and select Add SQL.
3. In the Add SQL window under the Select SQL to be added pane, check the SQL statementsyou want added.
4. Under the Select Scenario to include SQL pane, check the Scenarios you want the SQL added to.
5. Click OK to add the SQL, retrieve the query plans and re-execute the Scenario.
Related TopicIndex Impact Analyzer Window
Add a ScenarioAfter creating an Index Impact Analysis, you can add more Scenarios to it.
To add a Scenario
Method One1. In the left pane, right-click the Analyzer and select Add Scenario.
2. In the Add Scenario wizard, select the Index page and specify the information for the proposed newindexes. Click OK.
Method Two1. In the left pane, right-click on an Analyzer and select New Analysis.
2. In the New Analysis wizard, select the Continuing an existing Analyzer using the Analyzer’s selectedSQL option.
3. From the Select Analyzer field, click the Analyzer name.
4. Select the Index page and specify the information for the proposed new indexes. Click OK.
Related TopicIndex Impact Analyzer Window
SQL Optimizer for SAP ASE 3.9 User Guide 348
Delete an Index Impact AnalysisTo delete an analysis
1. Select the analysis.
2. Right-click and select Delete or press Delete.
Related TopicIndex Impact Analyzer Window
Modify an Index Impact AnalyzerYou can only modify the analysis name and description.
To modify an Analysis
1. From the Index Impact Analyzer window, select the Analyzer you want to modify from the left pane.
2. Right-click and select Modify to open the Modify Analyzer window.
3. Modify the name and/or description. Click OK to save the changes.
Related TopicIndex Impact Analyzer Window
RegenerateThe Index Impact Analyzer Scenario can be re-executed using the same indexes. You can choose to retrievethe query plans for all SQL statements in the Scenario or select specific SQL to retrieve the query plan againusing the same indexes. This function is useful if changes have occurred in the database environment, such asdata volume changes, that may affect query plans.
To regenerate an analysis
1. Select the Scenario from the left pane.
2. Right-click and select Regenerate.
3. From the Regenerate Scenario window, check the SQL statements whose current query plans youwould like retrieved again.
Related Topic
SQL Optimizer for SAP ASE 3.9 User Guide 349
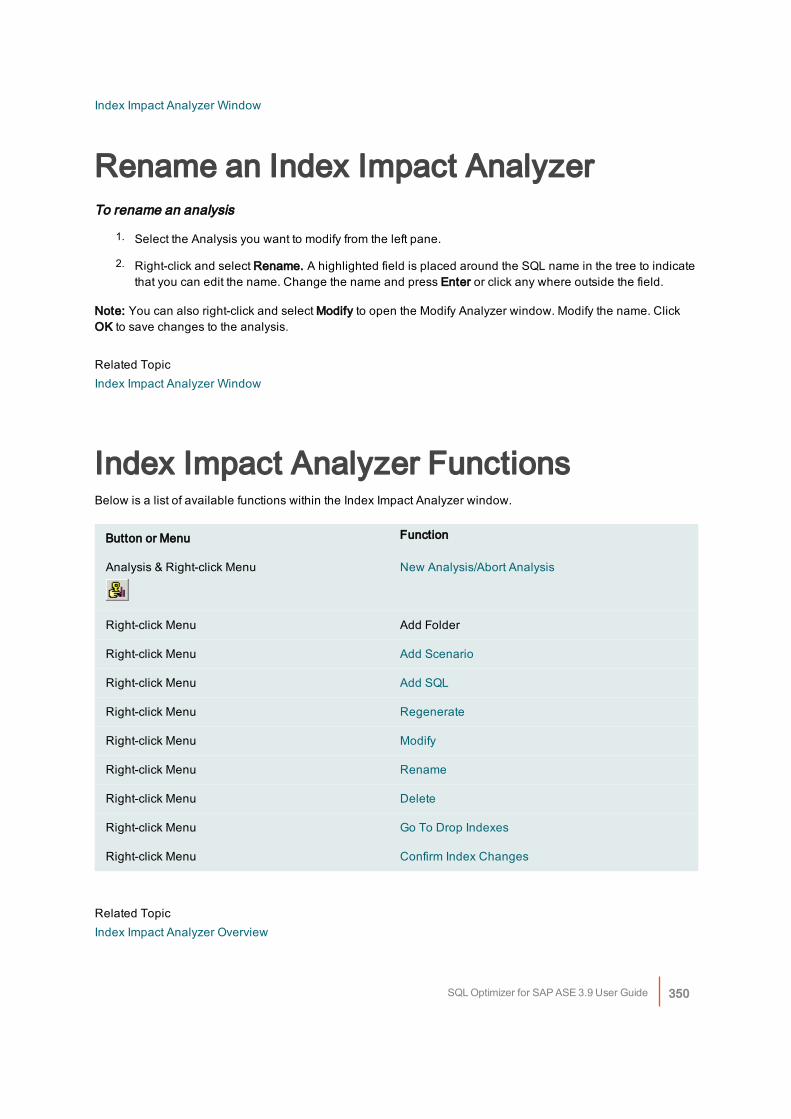
Index Impact Analyzer Window
Rename an Index Impact AnalyzerTo rename an analysis
1. Select the Analysis you want to modify from the left pane.
2. Right-click and select Rename. A highlighted field is placed around the SQL name in the tree to indicatethat you can edit the name. Change the name and press Enter or click any where outside the field.
Note: You can also right-click and select Modify to open the Modify Analyzer window. Modify the name. ClickOK to save changes to the analysis.
Related TopicIndex Impact Analyzer Window
Index Impact Analyzer FunctionsBelow is a list of available functions within the Index Impact Analyzer window.
Button or Menu Function
Analysis & Right-click Menu New Analysis/Abort Analysis
Right-click Menu Add Folder
Right-click Menu Add Scenario
Right-click Menu Add SQL
Right-click Menu Regenerate
Right-click Menu Modify
Right-click Menu Rename
Right-click Menu Delete
Right-click Menu Go To Drop Indexes
Right-click Menu Confirm Index Changes
Related TopicIndex Impact Analyzer Overview
SQL Optimizer for SAP ASE 3.9 User Guide 350
Index Impact Analyzer Window
Index Usage Analyzer OverviewThe Index Usage Analyzer identifies unused indexes by analyzing query plans from SQL statements in yourdatabase applications. It examines their query plans and reports any indexes in the database that are not used.You can use this module to quickly identify the indexes in databases that are not contributing to the performanceof the database applications. These unused indexes can then be deleted to free up space and improve thespeed of the database applications and maintenance.The Index Usage Analyzer identifies:
l Tables that are referenced in the SQL statements
l Indexes in each table that are used in the query plans, and the number of referenced SQL for each index
l Indexes in each table that are not used in the query plans
The selected SQL statements that the Index Usage Analyzer analyzes are from SQL that you have saved in theSQL Repository or SQL statements from the SQL Scanner.
Related TopicsIndex Usage Analyzer WindowIndex Usage Analyzer Functions
Index Usage Analyzer WindowThe Index Usage Analyzer window displays the information about the SQL statements that are saved inthe Index Usage Analyzer. The display in the right section of the window depends on what is selected inthe left pane.
Left pane - Analyzer ListAlways displays a tree diagram of the Analyses and the folders they are stored in.
Right PaneThe right pane displays a variety of different information depending upon what is selected from the tree diagramin the left pane.You can display information for the following:
l Analyzers
l Scenarios Analyzed
l Table Information
l SQL Analyzed Folder
l SQL Statements
SQL Optimizer for SAP ASE 3.9 User Guide 351
Related TopicsCreate an Index Usage AnalysisIndex Usage Analyzer OverviewIndex Usage Analyzer Functions
Right Pane for AnalyzersIn the Index Usage Analyzer window, when an Analyzer is selected in the left pane, the following informationdisplays in the right pane.
Index Usage Chart [Top right pane]Displays the total number of indexes in the tables used in all the selected SQL statements and the number ofused and unused indexes. Charts the percentage of the indexes that are used by the query plans for theselected SQL statements.
Analysis Information [Bottom right pane]The detailed information about the Analysis displays in the button pages. The buttons for displaying specificinformation are found at the top of this pane.Properties buttonDisplays general information about the analysis, information on the connection used to retrieve the query plansand the SQL statements used in the analysis.Index Summary buttonDisplays the indexes that are used by the selected SQL statements in black text and highlights in red theindexes that are not used. Use the Right-click menu to Save the list of indexes or Drop Index.
Related TopicIndex Usage Analyzer Window
Right Pane for Tables AnalyzedIn the Index Usage Analyzer window, when the Tables Analyzed is selected in the left pane, the followinginformation displays in the right pane.
Summary buttonProvides a summary of the use of indexes for each table. It gives the total number of SQL that use the table andif the SQL statement accesses the table with a full table scan or uses an index to access the table.
Chart buttonCharts the number of SQL statements that use the table.
SQL Optimizer for SAP ASE 3.9 User Guide 352
Related TopicIndex Usage Analyzer Window
Right Pane for Analyzed Table InformationIn the Index Usage Analyzer window, when a table is selected under the Tables Analyzed section is selected inthe left pane, the following information displays in the right pane.
Prognosis ButtonItem Description
Top Pane - Summary Information Displays a summary of the indexes in the table that are used orunused.
Middle Pane - Index UsedInformation
Displays the indexes used by the SQL statement.
Bottom Left Pane - SQL Text Displays the text of the SQL statement.
Bottom Right Pane - SQLInformation
Displays the query plan, abstract plan, traceon information, SQLClassification, and the temporary table DDL for the selected SQLstatement in the SQL Information Pane.
Unused Index ButtonLists the indexes and the key for all indexes in the table that are not used. Use the Right-click menu to Save thelist of indexes or Drop Index.
Table Information ButtonItem Description
Definition Tab Displays when and where the table was created.
Columns Tab Displays the column information for the table.
Index Tab Displays the index information for the table.
DDL Tab Displays the DDL for creating the table and indexes.
Related TopicIndex Usage Analyzer Window
SQL Optimizer for SAP ASE 3.9 User Guide 353
Right Pane for SQL Analyzed FolderIn the Index Usage Analyzer window, when the SQL Analyzed folder is selected in the left pane, the followinginformation displays in the right pane.
Index UsedDisplays all the SQL statements and shows the tables and indexes used.
Related TopicIndex Usage Analyzer Window
Right Pane for SQL StatementsWhen a SQL statement is selected in the left pane, the following information displays in the right pane.
Properties buttonDisplays general information about the analysis, information on the connection used to retrieve the query plansand the database settings at the time of the analysis.
SQL Information buttonDisplays the query plan and the SQL Information pane.
Index Used buttonDisplays the table name, the index name, and the index key for the indexes used by the SQL statement. Use theRight-click menu to Save the list of indexes.
Related TopicIndex Usage Analyzer Window
SQL Optimizer for SAP ASE 3.9 User Guide 354
Create an Index Usage AnalysisTo create an Index Usage Analysis
1. Click to open the Index Usage Analyzer window.
2. If no analysis exists in the Index Usage Analyzer then the New Analysis wizard displays automatically.
Otherwise, click .
3. The New Analysis wizard has two pages to select the options for creating an analysis.
l Analyzer
l Selected SQL
4. Make the selections from these two tab page. Click OK.
When the analysis is finished, the Index Usage Analysis Details window displays with information about theretrieval of the query plan for each SQL statement.
Related TopicsIndex Usage Analyzer OverviewIndex Usage Analyzer Window
New Analysis Wizard: Analyzer PageView New Analysis Wizard: Analyzer Page
SQL Optimizer for SAP ASE 3.9 User Guide 355
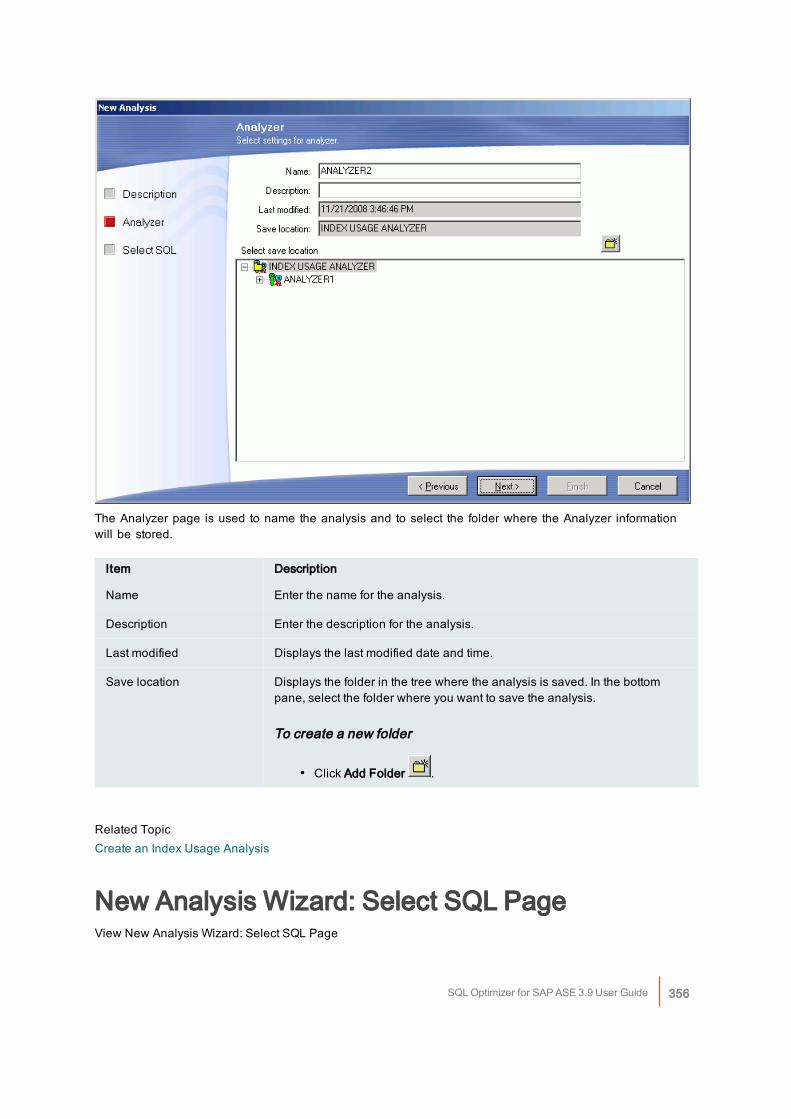
The Analyzer page is used to name the analysis and to select the folder where the Analyzer informationwill be stored.
Item Description
Name Enter the name for the analysis.
Description Enter the description for the analysis.
Last modified Displays the last modified date and time.
Save location Displays the folder in the tree where the analysis is saved. In the bottompane, select the folder where you want to save the analysis.
To create a new folder
l Click Add Folder .
Related TopicCreate an Index Usage Analysis
New Analysis Wizard: Select SQL PageView New Analysis Wizard: Select SQL Page
SQL Optimizer for SAP ASE 3.9 User Guide 356
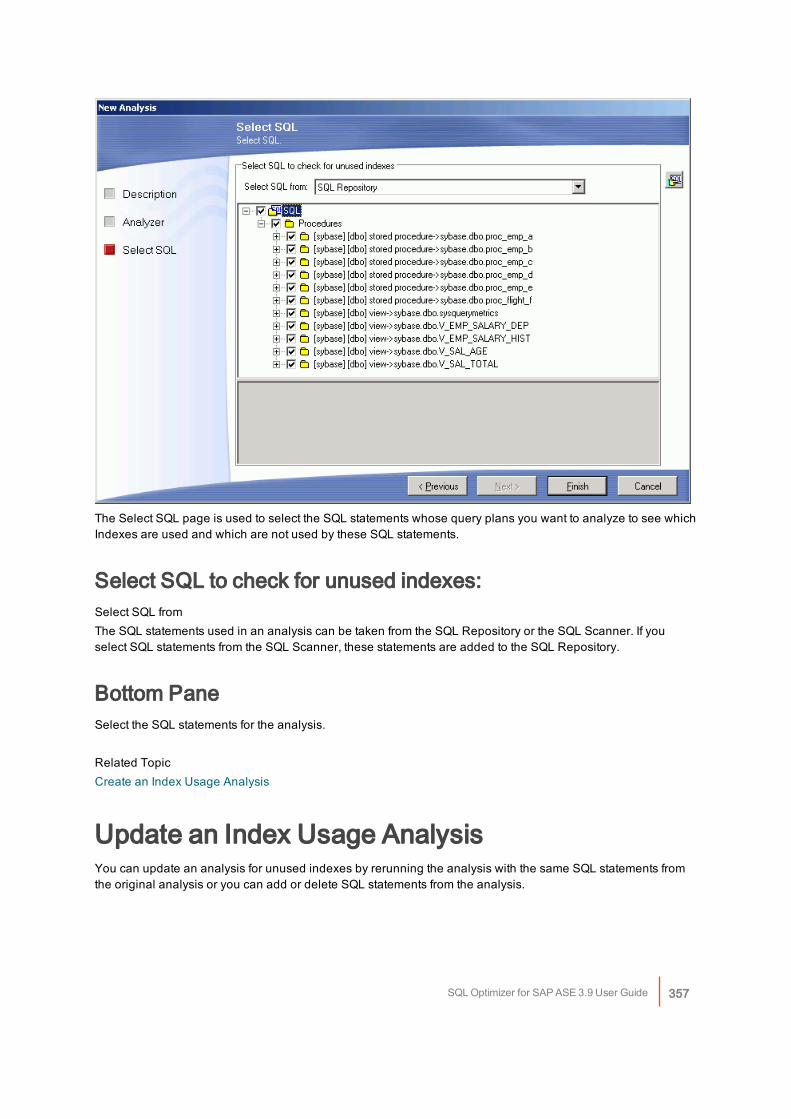
The Select SQL page is used to select the SQL statements whose query plans you want to analyze to see whichIndexes are used and which are not used by these SQL statements.
Select SQL to check for unused indexes:Select SQL fromThe SQL statements used in an analysis can be taken from the SQL Repository or the SQL Scanner. If youselect SQL statements from the SQL Scanner, these statements are added to the SQL Repository.
Bottom PaneSelect the SQL statements for the analysis.
Related TopicCreate an Index Usage Analysis
Update an Index Usage AnalysisYou can update an analysis for unused indexes by rerunning the analysis with the same SQL statements fromthe original analysis or you can add or delete SQL statements from the analysis.
SQL Optimizer for SAP ASE 3.9 User Guide 357
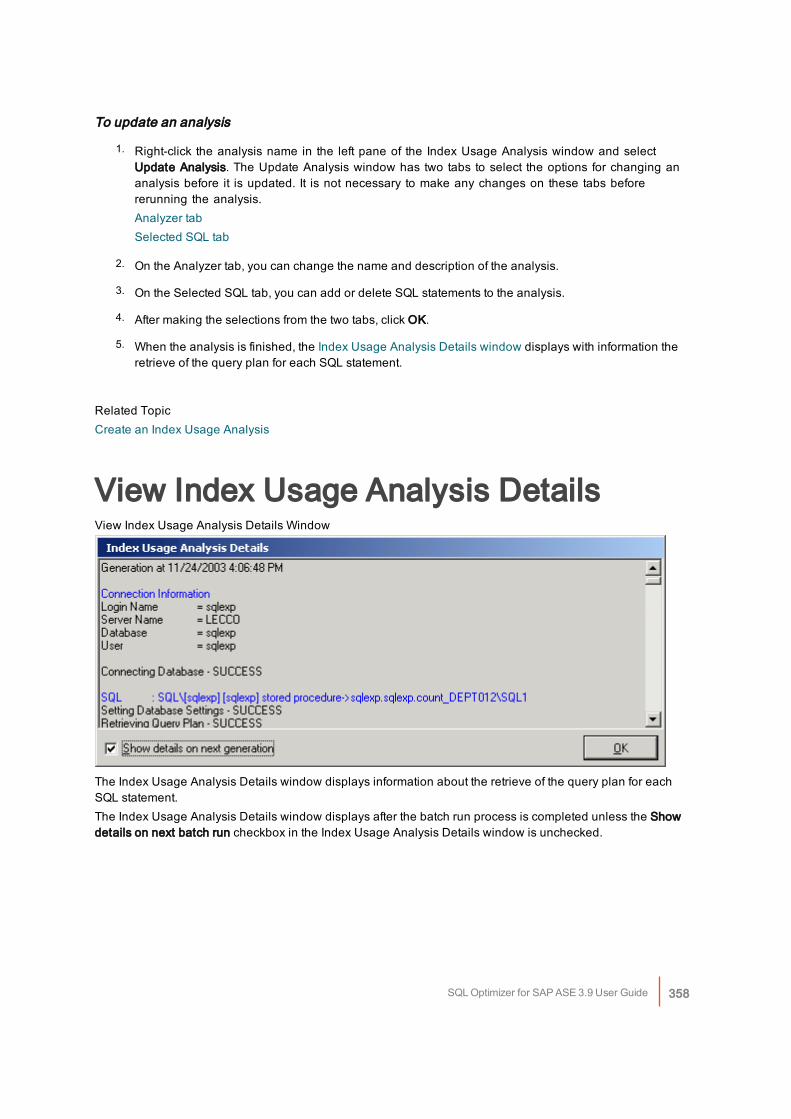
To update an analysis
1. Right-click the analysis name in the left pane of the Index Usage Analysis window and selectUpdate Analysis. The Update Analysis window has two tabs to select the options for changing ananalysis before it is updated. It is not necessary to make any changes on these tabs beforererunning the analysis.Analyzer tabSelected SQL tab
2. On the Analyzer tab, you can change the name and description of the analysis.
3. On the Selected SQL tab, you can add or delete SQL statements to the analysis.
4. After making the selections from the two tabs, click OK.
5. When the analysis is finished, the Index Usage Analysis Details window displays with information theretrieve of the query plan for each SQL statement.
Related TopicCreate an Index Usage Analysis
View Index Usage Analysis DetailsView Index Usage Analysis Details Window
The Index Usage Analysis Details window displays information about the retrieve of the query plan for eachSQL statement.The Index Usage Analysis Details window displays after the batch run process is completed unless the Showdetails on next batch run checkbox in the Index Usage Analysis Details window is unchecked.
SQL Optimizer for SAP ASE 3.9 User Guide 358
To review the Index Usage Analysis Details window after an analysis
1. Select View | Show Index Usage Analysis Details when the Index Usage Analysis window is active.
2. Review this information to see if an error occurred during the retrieval of the query plan. Errors mayoccur if the selected SQL statements are from one database and user and you have set anotherdatabase and user in the drop-down boxes at the bottom left of the main window.
Related TopicIndex Usage Analyzer Window
Modify an Index Usage AnalysisYou can only modify the analysis name and description.
To modify an Analysis
1. Select the Analyzer you want to modify from the left pane.
2. Right-click and select Modify.
3. Modify the name and/or description.
Related TopicIndex Usage Analyzer Window
Rename an Index Usage AnalysisYou can rename an analysis in the Index Usage Analyzer window in two ways.
To rename an Analysis
1. Right-click the Analysis you want to modify from the left pane and select Rename. A highlighted field isplaced around the SQL name in the tree to indicate that you can edit the name.
2. Change the name and press Enter or click any where outside the field.
Note: You can also right-click and select Modify. Modify the name.
Related TopicIndex Usage Analyzer Window
SQL Optimizer for SAP ASE 3.9 User Guide 359
Delete an Index Usage AnalysisTo delete an analysis
1. Select the analysis you want to delete in the left pane.
2. Right-click and select Delete.
Related TopicIndex Usage Analyzer Window
Index Usage Analyzer FunctionsBelow is a list of available functions within the Index Usage Analyzer window.
Menu Function
Analysis & Right-click Menu New Analysis/Abort Analysis
Right-click Menu Update Analysis
Right-click Menu Add Folder
Right-click Menu Modify
Right-click Menu Rename
Right-click Menu Delete
View Menu Last Index Usage Analysis Details
Right-click Menu Drop Index
Right-click Menu Save
Related TopicsIndex Usage Analyzer OverviewIndex Usage Analyzer Window
Configuration Analyzer OverviewThe Configuration Analyzer evaluates the effect on SQL performance when changing sp_configure AdaptiveServer parameter settings. It enables you to analyze whether the database performance may improve beforeyou make any Adaptive Server parameter changes permanent.
SQL Optimizer for SAP ASE 3.9 User Guide 360
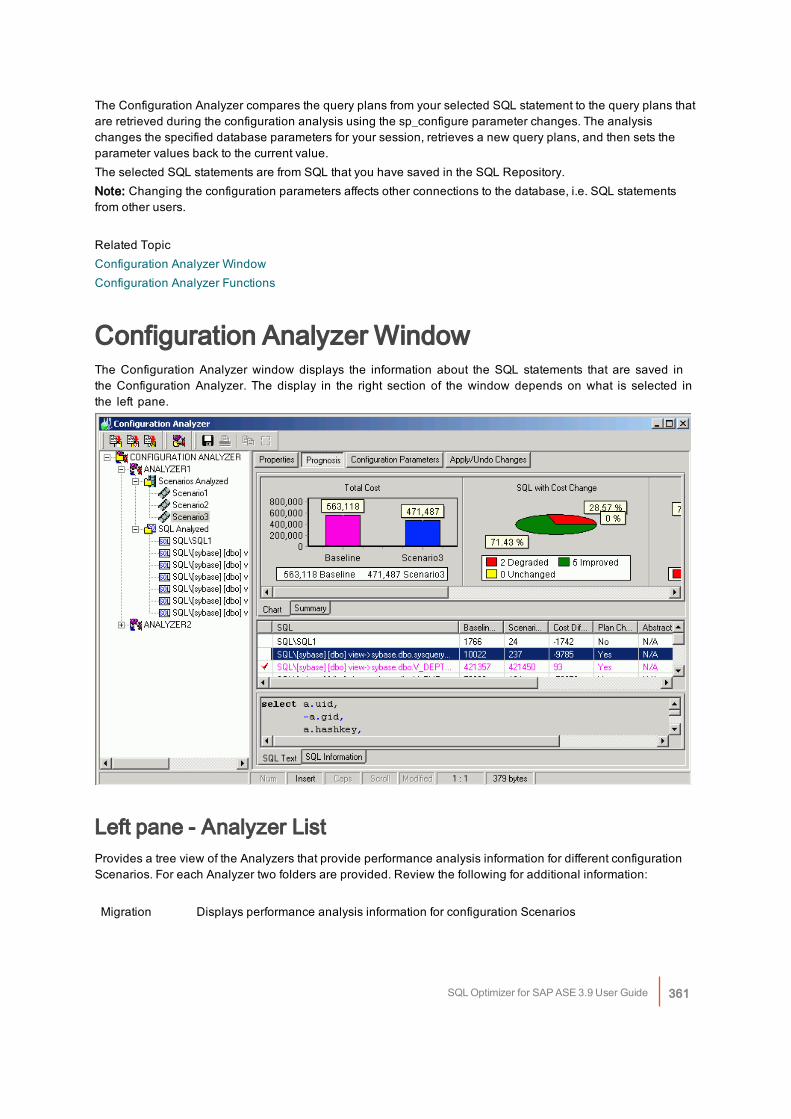
The Configuration Analyzer compares the query plans from your selected SQL statement to the query plans thatare retrieved during the configuration analysis using the sp_configure parameter changes. The analysischanges the specified database parameters for your session, retrieves a new query plans, and then sets theparameter values back to the current value.The selected SQL statements are from SQL that you have saved in the SQL Repository.Note: Changing the configuration parameters affects other connections to the database, i.e. SQL statementsfrom other users.
Related TopicConfiguration Analyzer WindowConfiguration Analyzer Functions
Configuration Analyzer WindowThe Configuration Analyzer window displays the information about the SQL statements that are saved inthe Configuration Analyzer. The display in the right section of the window depends on what is selected inthe left pane.
Left pane - Analyzer ListProvides a tree view of the Analyzers that provide performance analysis information for different configurationScenarios. For each Analyzer two folders are provided. Review the following for additional information:
Migration Displays performance analysis information for configuration Scenarios
SQL Optimizer for SAP ASE 3.9 User Guide 361
Information
SQL Analyzed Displays the SQL statements selected from the SQL Repository for analysis and the queryplans for each of the Scenarios.
Right PaneThe right pane displays a variety of different information depending upon what is selected from the tree diagramin the left pane. Review the following for additional information:
Analyzers .Right Pane for Analyzers
Scenarios Analyzed Folder Right Pane for Scenarios
Scenario Right Pane for Scenarios
SQl Analyzed Folder Right Pane for SQL Analyzed Folder
SQL Statements Right Pane for SQL Statement
Related TopicsCreate a Configuration AnalysisConfiguration Analyzer OverviewConfiguration Analyzer Functions
Right Pane for AnalyzersIn the Configuration Analyzer window, when an Analyzer is selected in the left pane, the following informationdisplays in the right pane.
Properties ButtonDisplays general information about the analysis, information on the connection used to retrieve the query plansand the SQL statements used in the analysis.
Related TopicConfiguration Analyzer Window
Right Pane for Scenarios AnalyzedIn the Configuration Analyzer window, when Scenarios Analyzed is selected in the left pane, the followinginformation displays in the right pane.
SQL Optimizer for SAP ASE 3.9 User Guide 362
Summary buttonProvides a summary of the Estimated I/O Cost and SQL classification for the SQL statements before and afterthe configuration parameters were changed.
Chart buttonCharts the total Estimated I/O Cost of the SQL statements before and after the configuration parameterswere changed.
Related TopicConfiguration Analyzer Window
Right Pane for ScenariosIn the Configuration Analyzer window, when a specific Scenario is selected in the left pane, the detailedinformation about the Scenario displays in the button pages in the right pane. The buttons for displaying specificinformation are found at the top of this pane.
Properties buttonDisplays general information about the SQL statement and the database settings at the time of the analysis.
Prognosis buttonDisplays 3 panes in the right section of the window.Charts and Summary tabs [Top right pane]The Chart tab displays five charts of the comparison information for the query plans from before the analysis andduring the analysis.The Summary tab displays summarized statistics for the Scenario,SQL Classification and Plan Change Comparisons [Middle right pane]A grid displays the information about each query plan from before the analysis and during the analysis in acomparison format.SQL Text and SQL Information tabs [Bottom right pane]The SQL statement that is highlight in the middle right pane is the one that displays in this pane.The SQL Text tab displays the text of the SQL statement.The SQL Information tab displays two SQL Information panes, one for the SQL information before the analysisand one for the SQL Information with the parameter changes.
Configuration Parameters buttonDisplays the database parameter changes used in this analysis displaying the parameter name, the valueduring the analysis and the old value for the parameters that were changed.
SQL Optimizer for SAP ASE 3.9 User Guide 363
Apply/Undo Changes button
Displays the scripts for changing the configuration parameter on Adaptive Server. Click Execute located atthe right of the Configuration Analyzer window to run the script.
Related TopicConfiguration Analyzer Window
Right Pane for SQL Analyzed FolderIn the Configuration Analyzer window, when the SQL Analyzed folder is selected in the left pane, the followinginformation displays in the right pane.
Cost Summary buttonDisplays all the SQL statements and shows the Estimated I/O Cost before and after the configuration parameterswere changed.
Cost Classification buttonDisplays all the SQL statements and shows the SQL Classification (Simple, Complex, and Problematic) beforeand after the configuration parameters were changed.
Related TopicConfiguration Analyzer Window
Right Pane for SQL StatementThe detailed information about the SQL statements used in the Analysis displays in the button pages. Thebuttons for displaying specific information are found at the top of this pane.
Properties buttonDisplays general information about the SQL statement and the database settings at the time of the analysis.
SQL Information buttonDisplays the SQL text in the top portion of the right pane and two SQL Information panes, one for theSQL information before the analysis and one for the SQL information with the parameter changes, in thebottom right pane.
SQL Optimizer for SAP ASE 3.9 User Guide 364
Saving the Abstract PlanThe abstract plan for a SQL statement can be saved from this pane. In order to save the abstract plan, it must beretrieved when the SQL was selected to be analyzed. This is done from the Abstract Plan page of the NewAnalysis wizard.
1. Select the SQL statement in the left pane.
2. Click SQL Information section of the right pane. This enables the Save Abstract Plan button.
3. Click Save Abstract Plan .
4. In the Save to group field, select the abstract plan group.
5. Click Save.
Related TopicConfiguration Analyzer Window
Create a Configuration AnalysisTo create a Configuration Analysis:
1. Click to open the Configuration Analyzer window.
2. If no analysis exists in the Configuration Analyzer then the New Analysis wizard displays automatically.
Otherwise, click to open the New Analysis window.
3. The New Analysis wizard has three pages for selecting the options for creating an analysis:
Page See...
Analyzer New Analysis Wizard: Analyzer Page
Selected SQL New Analysis Wizard: Select SQL page
Configuration New Analysis Wizard: Configuration Page
Abstract Plan New Analysis Wizard: Abstract Plan
4. After making your selection, click OK.
To abort the Configuration analysisSelect Analysis | Abort Analysis.
Related TopicsConfiguration Analyzer OverviewConfiguration Analyzer Window
SQL Optimizer for SAP ASE 3.9 User Guide 365
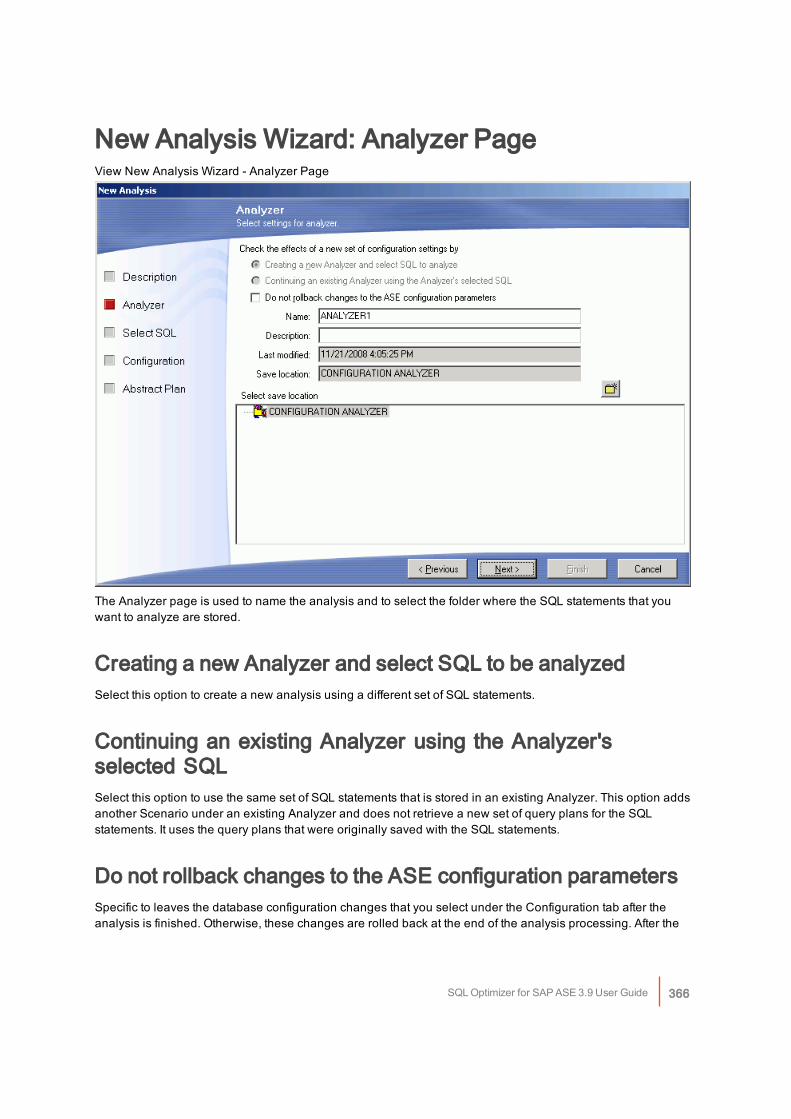
New Analysis Wizard: Analyzer PageView New Analysis Wizard - Analyzer Page
The Analyzer page is used to name the analysis and to select the folder where the SQL statements that youwant to analyze are stored.
Creating a new Analyzer and select SQL to be analyzedSelect this option to create a new analysis using a different set of SQL statements.
Continuing an existing Analyzer using the Analyzer'sselected SQLSelect this option to use the same set of SQL statements that is stored in an existing Analyzer. This option addsanother Scenario under an existing Analyzer and does not retrieve a new set of query plans for the SQLstatements. It uses the query plans that were originally saved with the SQL statements.
Do not rollback changes to the ASE configuration parametersSpecific to leaves the database configuration changes that you select under the Configuration tab after theanalysis is finished. Otherwise, these changes are rolled back at the end of the analysis processing. After the
SQL Optimizer for SAP ASE 3.9 User Guide 366
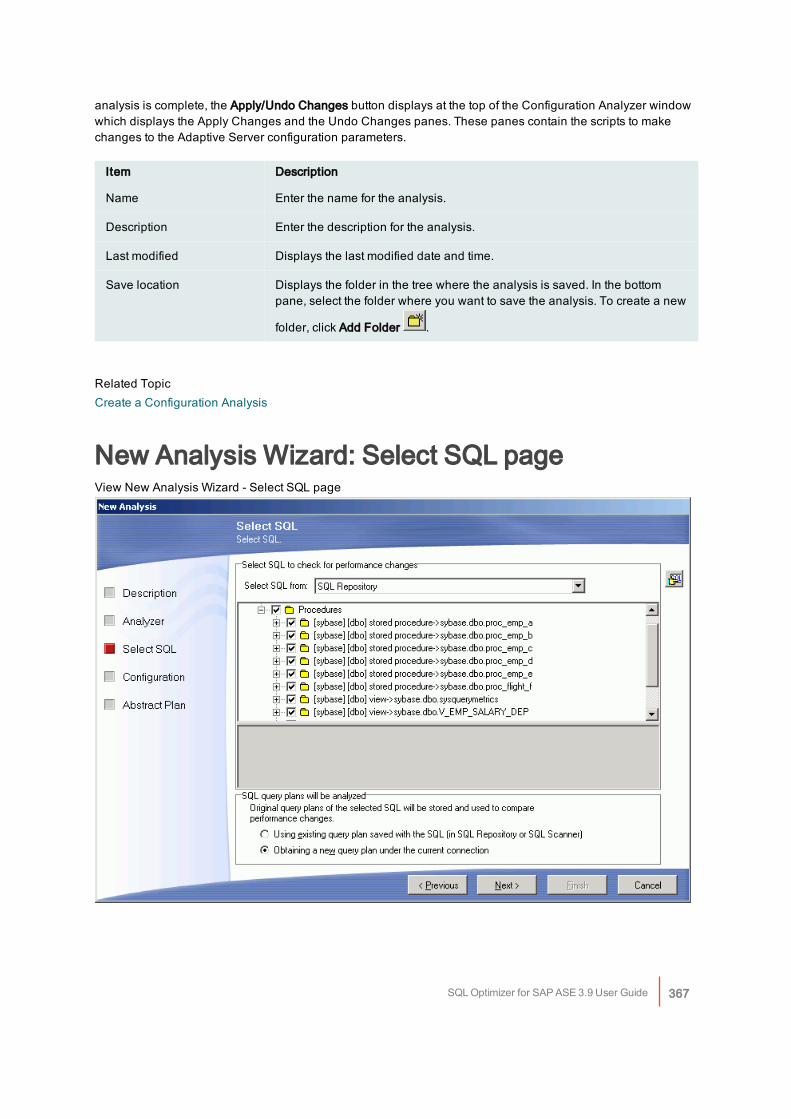
analysis is complete, the Apply/Undo Changes button displays at the top of the Configuration Analyzer windowwhich displays the Apply Changes and the Undo Changes panes. These panes contain the scripts to makechanges to the Adaptive Server configuration parameters.
Item Description
Name Enter the name for the analysis.
Description Enter the description for the analysis.
Last modified Displays the last modified date and time.
Save location Displays the folder in the tree where the analysis is saved. In the bottompane, select the folder where you want to save the analysis. To create a new
folder, click Add Folder .
Related TopicCreate a Configuration Analysis
New Analysis Wizard: Select SQL pageView New Analysis Wizard - Select SQL page
SQL Optimizer for SAP ASE 3.9 User Guide 367
The Select SQL page is used to select the SQL statements whose query plans you want to analyze whenvarious database parameters are changed.
Select SQL to check for performance changes:Select SQL fromThe SQL statements used in an analysis can be taken from the SQL Repository or the SQL Scanner. If youselect SQL statements from the SQL Scanner, these statements are added to the SQL Repository.
SQL query plans will be analyzed:In the Configuration Analyzer, the query plans for the selected SQL statements before the configuration changeare compared to the query plans after the change. The following options allow you to determine the "before"query plans.Using existing query plan saved with the SQLThis option uses the query plan that was saved with the SQL statement when it was saved in the SQLRepository or SQL Scanner.Obtaining a new query plan under the current connectionThis option retrieves the query plan with the current logon and the current database settings. This current queryplan is compared to the query plan that is retrieved after the configuration changes are made.
Related TopicCreate a Configuration Analysis
New Analysis Wizard: Configuration PageView New Analysis Wizard - Configuration Page
SQL Optimizer for SAP ASE 3.9 User Guide 368
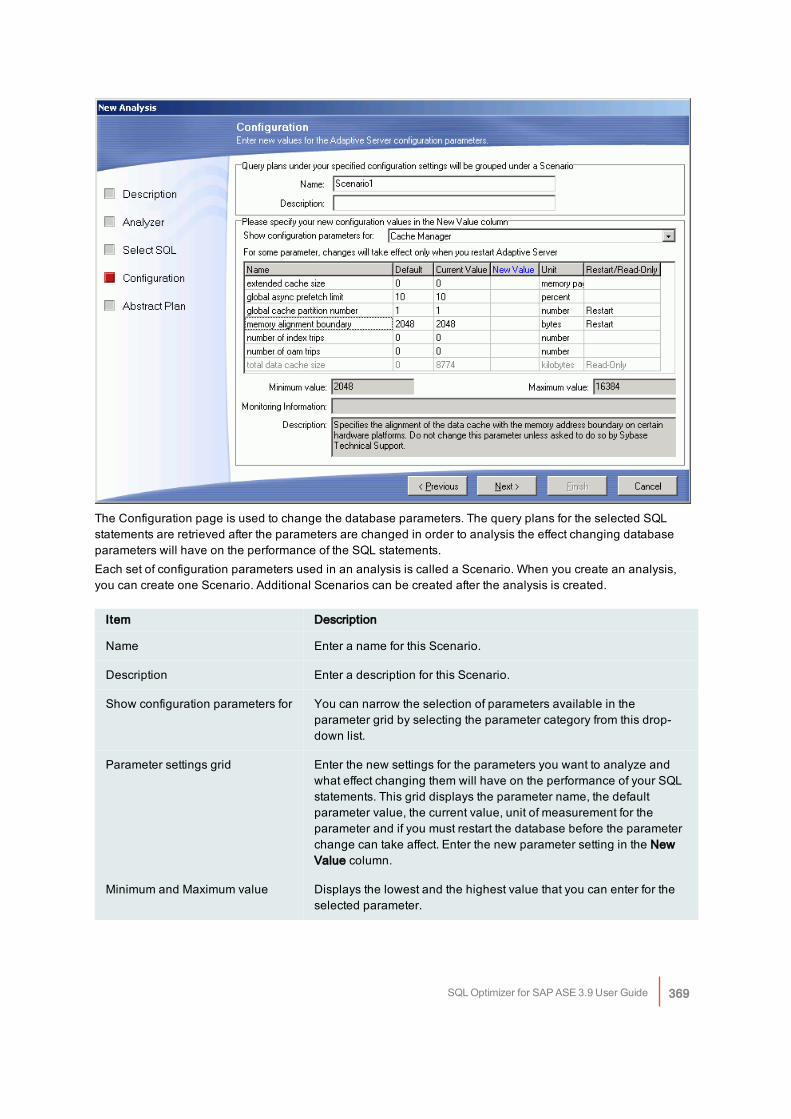
The Configuration page is used to change the database parameters. The query plans for the selected SQLstatements are retrieved after the parameters are changed in order to analysis the effect changing databaseparameters will have on the performance of the SQL statements.Each set of configuration parameters used in an analysis is called a Scenario. When you create an analysis,you can create one Scenario. Additional Scenarios can be created after the analysis is created.
Item Description
Name Enter a name for this Scenario.
Description Enter a description for this Scenario.
Show configuration parameters for You can narrow the selection of parameters available in theparameter grid by selecting the parameter category from this drop-down list.
Parameter settings grid Enter the new settings for the parameters you want to analyze andwhat effect changing them will have on the performance of your SQLstatements. This grid displays the parameter name, the defaultparameter value, the current value, unit of measurement for theparameter and if you must restart the database before the parameterchange can take affect. Enter the new parameter setting in the NewValue column.
Minimum and Maximum value Displays the lowest and the highest value that you can enter for theselected parameter.
SQL Optimizer for SAP ASE 3.9 User Guide 369
Monitor Information Displays the following information. This information is only availablefor some of the Adaptive Server configuration parameters.
num_free
Amount of scan descriptors, both metadata andauxiliary, which are not currently in use.
num_active
Amount of scan descriptors, both metadata andauxiliary, which are installed in cache and thereforeare in use.
pct_act
Percentage of the total number of scan descriptorsthat are installed in cache and therefore are in use.
Max_Used
Maximum amount of scan descriptors, both metadataand auxiliary, which were in use at any one timesince starting the server was started.
Reuse Number of scan descriptors reused.
Description Provides an explanation of the function of the selected AdaptiveServer configuration parameter.
Related TopicCreate a Configuration Analysis
New Analysis Wizard: Abstract PlanIn the New Analysis wizard, the Abstract Plan page is used to include the abstract plan with SQL statements.
SQL Optimizer for SAP ASE 3.9 User Guide 370
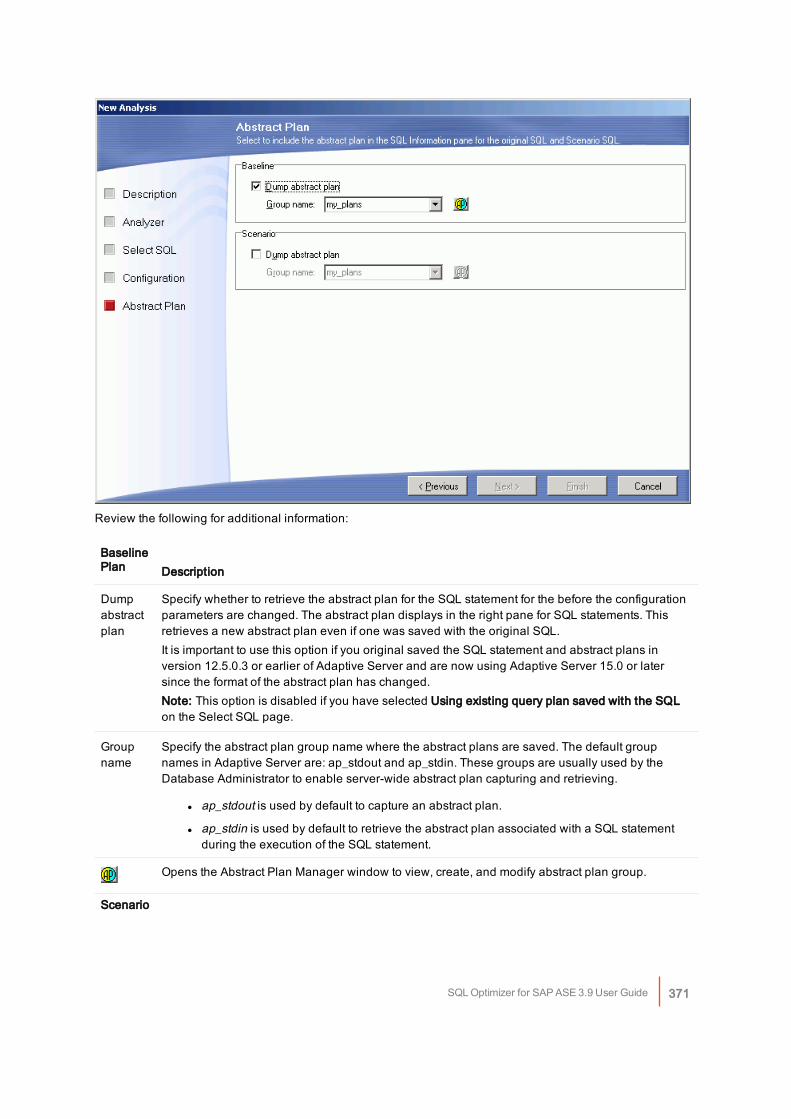
Review the following for additional information:
BaselinePlan Description
Dumpabstractplan
Specify whether to retrieve the abstract plan for the SQL statement for the before the configurationparameters are changed. The abstract plan displays in the right pane for SQL statements. Thisretrieves a new abstract plan even if one was saved with the original SQL.It is important to use this option if you original saved the SQL statement and abstract plans inversion 12.5.0.3 or earlier of Adaptive Server and are now using Adaptive Server 15.0 or latersince the format of the abstract plan has changed.Note: This option is disabled if you have selected Using existing query plan saved with the SQLon the Select SQL page.
Groupname
Specify the abstract plan group name where the abstract plans are saved. The default groupnames in Adaptive Server are: ap_stdout and ap_stdin. These groups are usually used by theDatabase Administrator to enable server-wide abstract plan capturing and retrieving.
l ap_stdout is used by default to capture an abstract plan.
l ap_stdin is used by default to retrieve the abstract plan associated with a SQL statementduring the execution of the SQL statement.
Opens the Abstract Plan Manager window to view, create, and modify abstract plan group.
Scenario
SQL Optimizer for SAP ASE 3.9 User Guide 371
Description
Dumpabstractplan
Specify whether to retrieve the abstract plan for the SQL statement after the configurationparameters are changed. The abstract plan displays in the right pane for SQL statements.
Groupname
Specify the abstract plan group name where the abstract plans are saved. The default groupnames in Adaptive Server are: ap_stdout and ap_stdin. These groups are usually used by theDatabase Administrator to enable server-wide abstract plan capturing and retrieving.
l ap_stdout is used by default to capture an abstract plan.
l ap_stdin is used by default to retrieve the abstract plan associated with a SQL statementduring the execution of the SQL statement.
Opens the Abstract Plan Manager window to view, create, and modify abstract plan group.
Related TopicCreate a Configuration Analysis
Regenerate a Configuration ScenarioThe Scenario can be re-executed using the exact same parameter settings. You can choose to retrieve thequery plans from using the same parameter settings for all SQL statements in the Scenario or select specificSQL to retrieve the query plan using the parameter setting.The function is useful if changes have occurred in the database environment, such as data volumes, that maychange the query plans.
To regenerate
1. Select the Scenario you want to modify from the left pane.
2. Right-click and select Regenerate.
3. From the Regenerate Scenario window, check the SQL statements whose current query plans youwould like retrieved using the parameter changes.
Related TopicConfiguration Analyzer Window
Add a ScenarioAfter creating a configuration analysis, you can add more Scenarios to it. A Scenario can be added in two ways.
SQL Optimizer for SAP ASE 3.9 User Guide 372
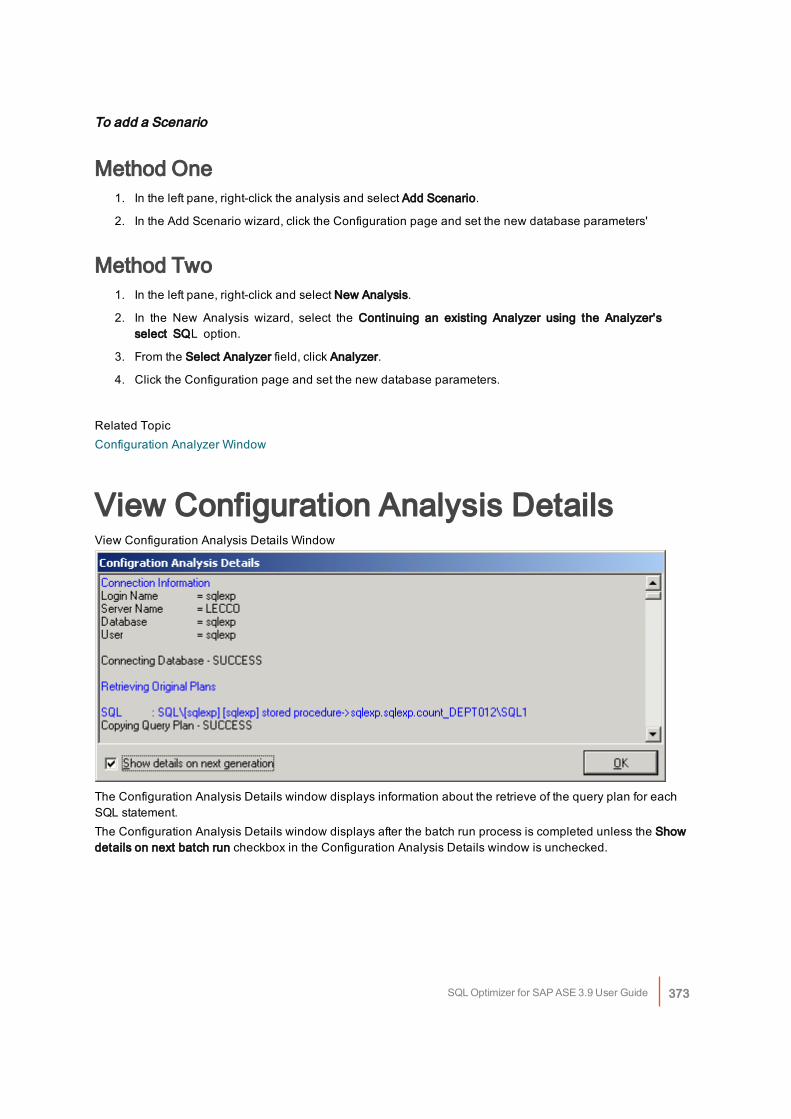
To add a Scenario
Method One1. In the left pane, right-click the analysis and select Add Scenario.
2. In the Add Scenario wizard, click the Configuration page and set the new database parameters'
Method Two1. In the left pane, right-click and select New Analysis.
2. In the New Analysis wizard, select the Continuing an existing Analyzer using the Analyzer'sselect SQL option.
3. From the Select Analyzer field, click Analyzer.
4. Click the Configuration page and set the new database parameters.
Related TopicConfiguration Analyzer Window
View Configuration Analysis DetailsView Configuration Analysis Details Window
The Configuration Analysis Details window displays information about the retrieve of the query plan for eachSQL statement.The Configuration Analysis Details window displays after the batch run process is completed unless the Showdetails on next batch run checkbox in the Configuration Analysis Details window is unchecked.
SQL Optimizer for SAP ASE 3.9 User Guide 373
To view the Configuration Analysis Details window after an analysis
1. Select View | Show Configuration Analysis.
2. Review this information to see if an error occurred during the retrieval of the query plan. Errors mayoccur if the selected SQL statements are from one database and user and you have set anotherdatabase and user in the drop-down boxes at the bottom left of the main window.
Related TopicCreate a Configuration Analysis
Rollback Changes to ConfigurationParametersThe Configuration analysis first executes the configuration parameter changes that you have selected on yourdatabase. Then it retrieves the query plan for each SQL statement that you have selected for your analyzer.When you set up the individual scenarios, you determine if you would like the configuration parameter changesrolled back or to leave them set on Adaptive Server.If you do not have the analysis process rollback the configuration changes, you can roll them back in any one ofthe following ways:
l In the tree pane (left pane), right-click the scenario name and select Go To Undo Changes.
l When you close the Configuration Analyzer window, you are prompted to rollback thechanges. Click Yes.
l In the tree pane (left pane), click the scenario name and select the Apply/Undo Changes button at the
top of the right pane. Click next to the Undo Change pane.
You can make the changes permanent, in one of the following ways:
l In the tree pane (left pane), right-click the scenario name and select Confirm Changes.
l When you close the Configuration Analyzer window, you are prompted to rollback thechanges. Click No.
Related TopicConfiguration Analyzer Window
Add SQL to a Configuration AnalysisAfter creating a configuration analysis, you can add more SQL statements from the SQL Repository to it.
SQL Optimizer for SAP ASE 3.9 User Guide 374
To add SQL to an existing configuration analysis
1. From the left pane, select the analysis in which you want to add the SQL.
2. Right-click and select Add SQL.
3. From the Add SQL window under the Select SQL to be added pane, check the SQL statements you want added.
4. Under the Select Scenario to include SQL pane, check the Scenarios you want the SQL added to.
5. Click OK to add the SQL, retrieve the query plans and re-execute the Scenario.
Related TopicConfiguration Analyzer Window
Modify a Configuration AnalysisYou can only modify the analysis name and description of a configuration analysis.
To modify a Configuration Analysis
1. From the Configuration Analyzer window, select the Analysis name you want to modify fromthe left pane.
2. Right-click and select Modify.
3. Modify the name and/or description
Related TopicConfiguration Analyzer Window
Rename a Configuration Analysis orScenarioYou can rename an Analysis or Scenario in the Configuration Analyzer window in two ways.
To rename an Analysis or Scenario
1. Right-click the Analysis or Scenario and select Rename. A highlighted field is placed around the namein the tree to indicate that you can edit the name.
2. Change the name and press Enter or click any where outside the field.
or
SQL Optimizer for SAP ASE 3.9 User Guide 375
1. Right-click the Analysis or Scenario and select Modify.
2. Modify the name.
3. Click OK to save the changes.
Related TopicConfiguration Analyzer Window
Delete a Configuration Analysis orScenarioTo delete an analysis or a Scenario
1. Select the item you want to delete in the left pane.
2. Right-click and select Delete.
Related TopicConfiguration Analyzer Window
Modify a Configuration ScenarioYou can only modify the Scenario name and description of the Scenario.
To modify a Configuration Scenario
1. Select the Scenario name you want to modify from the left pane.
2. Right-click and select Modify to open the Modify Scenario window.
3. Modify the name and/or description.
Related TopicConfiguration Analyzer Window
Configuration Analyzer FunctionsBelow is a list of available functions within the Configuration Analyzer window.
Menu Function See...
SQL Optimizer for SAP ASE 3.9 User Guide 376
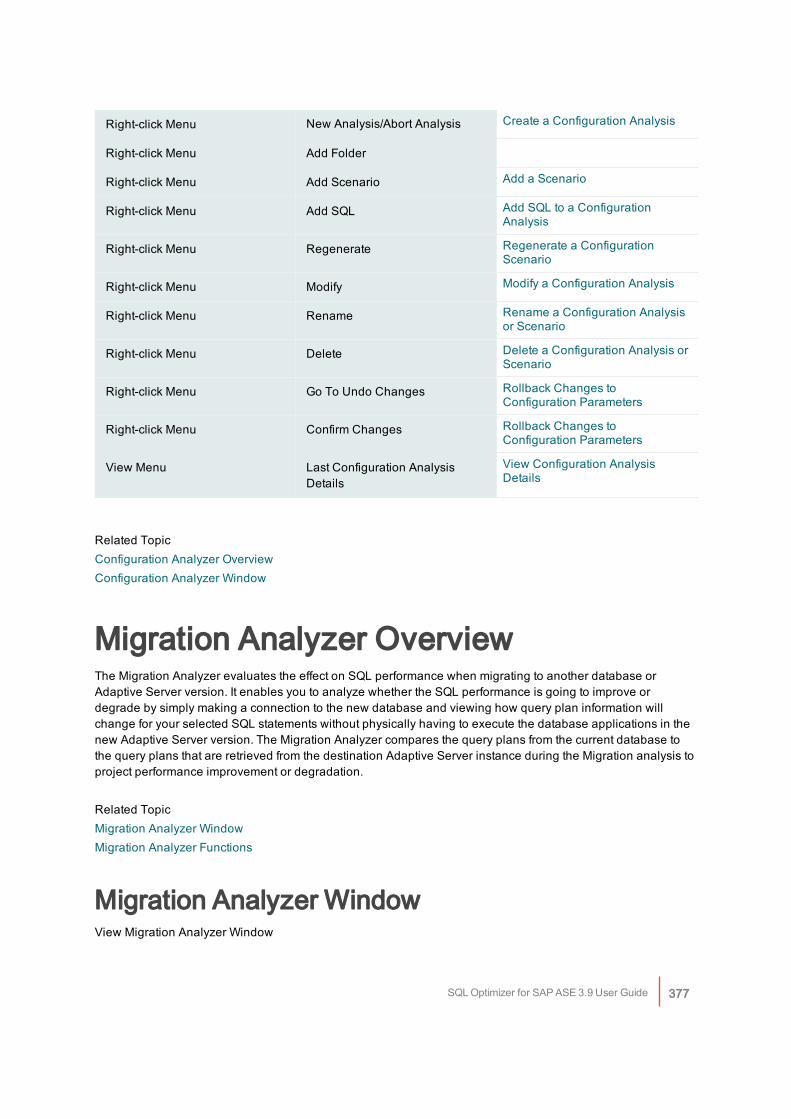
Right-click Menu New Analysis/Abort Analysis Create a Configuration Analysis
Right-click Menu Add Folder
Right-click Menu Add Scenario Add a Scenario
Right-click Menu Add SQL Add SQL to a ConfigurationAnalysis
Right-click Menu Regenerate Regenerate a ConfigurationScenario
Right-click Menu Modify Modify a Configuration Analysis
Right-click Menu Rename Rename a Configuration Analysisor Scenario
Right-click Menu Delete Delete a Configuration Analysis orScenario
Right-click Menu Go To Undo Changes Rollback Changes toConfiguration Parameters
Right-click Menu Confirm Changes Rollback Changes toConfiguration Parameters
View Menu Last Configuration AnalysisDetails
View Configuration AnalysisDetails
Related TopicConfiguration Analyzer OverviewConfiguration Analyzer Window
Migration Analyzer OverviewThe Migration Analyzer evaluates the effect on SQL performance when migrating to another database orAdaptive Server version. It enables you to analyze whether the SQL performance is going to improve ordegrade by simply making a connection to the new database and viewing how query plan information willchange for your selected SQL statements without physically having to execute the database applications in thenew Adaptive Server version. The Migration Analyzer compares the query plans from the current database tothe query plans that are retrieved from the destination Adaptive Server instance during the Migration analysis toproject performance improvement or degradation.
Related TopicMigration Analyzer WindowMigration Analyzer Functions
Migration Analyzer WindowView Migration Analyzer Window
SQL Optimizer for SAP ASE 3.9 User Guide 377
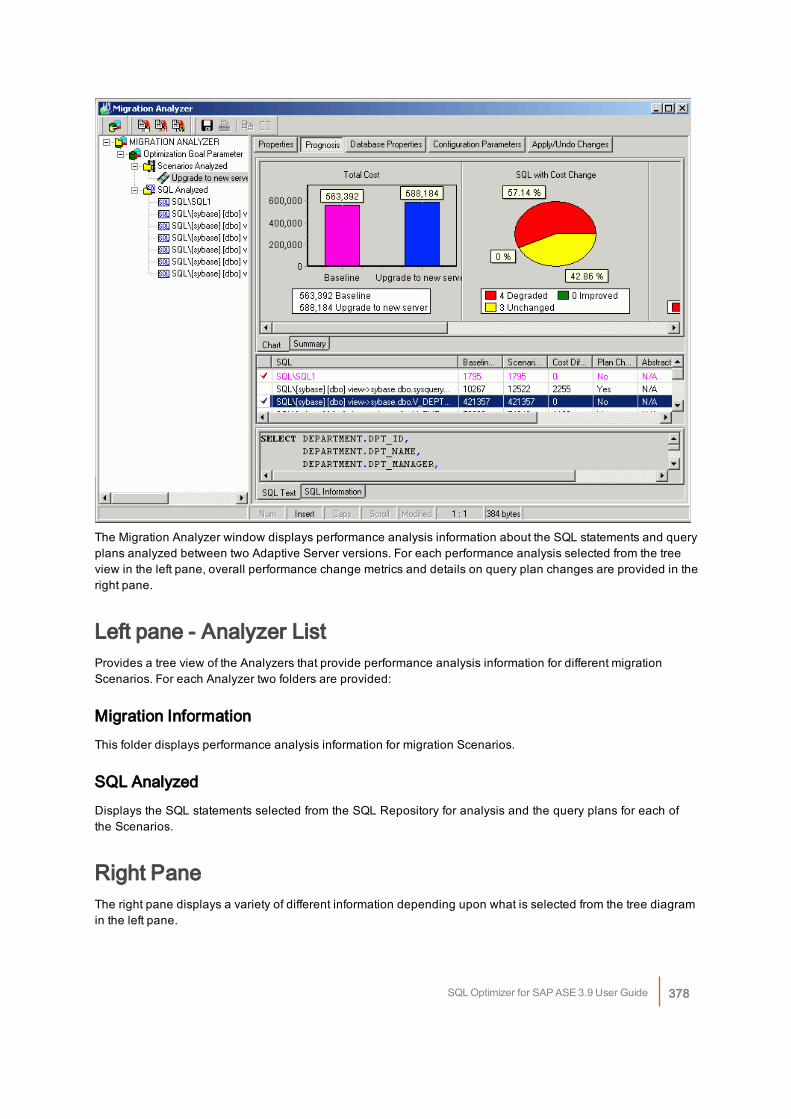
The Migration Analyzer window displays performance analysis information about the SQL statements and queryplans analyzed between two Adaptive Server versions. For each performance analysis selected from the treeview in the left pane, overall performance change metrics and details on query plan changes are provided in theright pane.
Left pane - Analyzer ListProvides a tree view of the Analyzers that provide performance analysis information for different migrationScenarios. For each Analyzer two folders are provided:
Migration InformationThis folder displays performance analysis information for migration Scenarios.
SQL AnalyzedDisplays the SQL statements selected from the SQL Repository for analysis and the query plans for each ofthe Scenarios.
Right PaneThe right pane displays a variety of different information depending upon what is selected from the tree diagramin the left pane.
SQL Optimizer for SAP ASE 3.9 User Guide 378
You can display information for the following:AnalyzersScenarios Analyzed FolderScenarioSQL Analyzed FolderSQL Statements
Related TopicsCreate a Migration AnalysisMigration Analyzer OverviewMigration Analyzer Functions
Right Pane for AnalyzersIn the Migration Analyzer window, when an Analyzer is selected from the tree in the left pane, the followinginformation displays in the right pane.
Properties ButtonDisplays general information about the analysis, information on the connection used to retrieve the query plansand the SQL statements used in the analysis.
Related TopicMigration Analyzer Window
Right Pane for Scenarios AnalyzedIn the Migration Analyzer window, when Scenarios Analyzed is selected in the left pane, the followinginformation displays in the right pane.
Summary buttonProvides a summary of the Estimated I/O Cost and SQL classification for the SQL statements from the currentAdaptive Server instance and from the destination Adaptive Server instance for the migration.
Charts buttonCharts the total Estimated I/O Cost of the SQL statements from the current Adaptive Server instance and from thedestination Adaptive Server instance for the migration.
Related TopicMigration Analyzer Window
SQL Optimizer for SAP ASE 3.9 User Guide 379
Right Pane for ScenariosIn the Migration Analyzer window, when a specific Scenario is selected in the left pane, the detailed informationabout the Scenario displays in the button pages in the right pane. The buttons for displaying specific informationare found at the top of this pane.
Properties buttonDisplays general information about the SQL statement and the database settings at the time of the analysis.
Prognosis buttonDisplays 3 panes in the right section of the window.Charts and Summary tabs [Top right pane]The Chart tab displays charts of the comparison information for the query plans from before the analysis andduring the analysis.The Summary tab displays summarized statistics for the Scenario.SQL Classification and Plan Change Comparisons [Middle right pane]A grid displays the comparison information about the query plan from the current Adaptive Server instance andthe query plan on the destination Adaptive Server instance for the migration.SQL Text and SQL Information tabs [Bottom right pane]The SQL statement that is highlight in the middle right pane is the one that displays in this pane.The SQL Text tab displays the text of the SQL statement.The SQL Information tab displays two SQL Information panes, one for the SQL information on the currentAdaptive Server instance and the query plan on the destination Adaptive Server instance for the migration.
Database Properties buttonDisplays the Adaptive Server database options and the devices from the current Adaptive Server instance andfrom the destination Adaptive Server instance for the migration.
Configuration Parameters buttonDisplays the Adaptive Server configuration changes used on the destination Migration Adaptive Serverinstance, showing the parameter name, the value applied during the analysis, and the old value for theparameters that were changed.Note: The Configuration Parameters only displays if configuration changes were made for this analysis.
Apply/Undo Changes button
Displays the script that changes the configuration parameters for the migration database. Click Executelocated at the right of the Migration Analyzer window to run the script.
SQL Optimizer for SAP ASE 3.9 User Guide 380
Related TopicMigration Analyzer Window
Right Pane for SQL Analyzed FolderIn the Migration Analyzer window, when the SQL Analyzed folder is selected in the left pane, the followinginformation displays in the right pane.
Cost Summary buttonDisplays all the SQL statements and shows the Estimated I/O Cost from the current Adaptive Server instanceand from the destination Adaptive Server instance for the migration.
Cost Classification buttonDisplays all the SQL statements and shows the SQL Classification (Simple, Complex, and Problematic) from thecurrent Adaptive Server instance and from the destination Adaptive Server instance for the migration.
Related TopicMigration Analyzer Window
Right Pane for SQL StatementDisplays detailed information about the SQL statements used in the Analysis. The buttons for displaying specificinformation are found at the top of this pane.
Properties buttonDisplays general information about the SQL statement and the database settings on the current database at thetime of the analysis.
SQL Information buttonDisplays the SQL statement information for comparison of possible performance changes between the currentAdaptive Server instance and on the destination Adaptive Server instance for the migration. The SQL text is inthe top portion of the right pane. The bottom portion of the window has two SQL Information panes, forcomparison of the query plans, abstract plans, Trace On information, SQL classification, and DDL for anytemporary tables that are required by the SQL statement.
Saving the Abstract PlanThe abstract plan for a SQL statement can be saved from this pane. In order to save the abstract plan, it must beretrieved when the SQL was selected to be analyzed. This is done from the Abstract Plan page of the NewAnalysis wizard.
SQL Optimizer for SAP ASE 3.9 User Guide 381
To save an abstract plan
1. Select the SQL statement in the left pane.
2. Click SQL Information section of the right pane. This enables the Save Abstract Plan button.
3. Click Save Abstract Plan .
4. In the Save to group field, select the abstract plan group.
5. Click Save.
Related TopicMigration Analyzer Window
Create a Migration AnalysisTo create a Migration Analysis
1. Click to open the Migration Analyzer window.
2. If no analysis exists in the Migration Analyzer then the New Analysis wizard displays automatically.
Otherwise, click .
3. The New Analysis wizard has four pages for selecting the options for creating an analysis.
l Analyzer
l Select SQL
l Migration
l Destination Configuration
l Abstract Plan
4. After making the selections from these four tabs, click OK.
To abort the Migration analysisSelect Analysis | Abort Analysis.
When the analysis is finished, the Migration Analysis Details window displays with information the retrieve of thequery plan for each SQL statement.
Related TopicsMigration Analyzer OverviewMigration Analyzer Window
SQL Optimizer for SAP ASE 3.9 User Guide 382
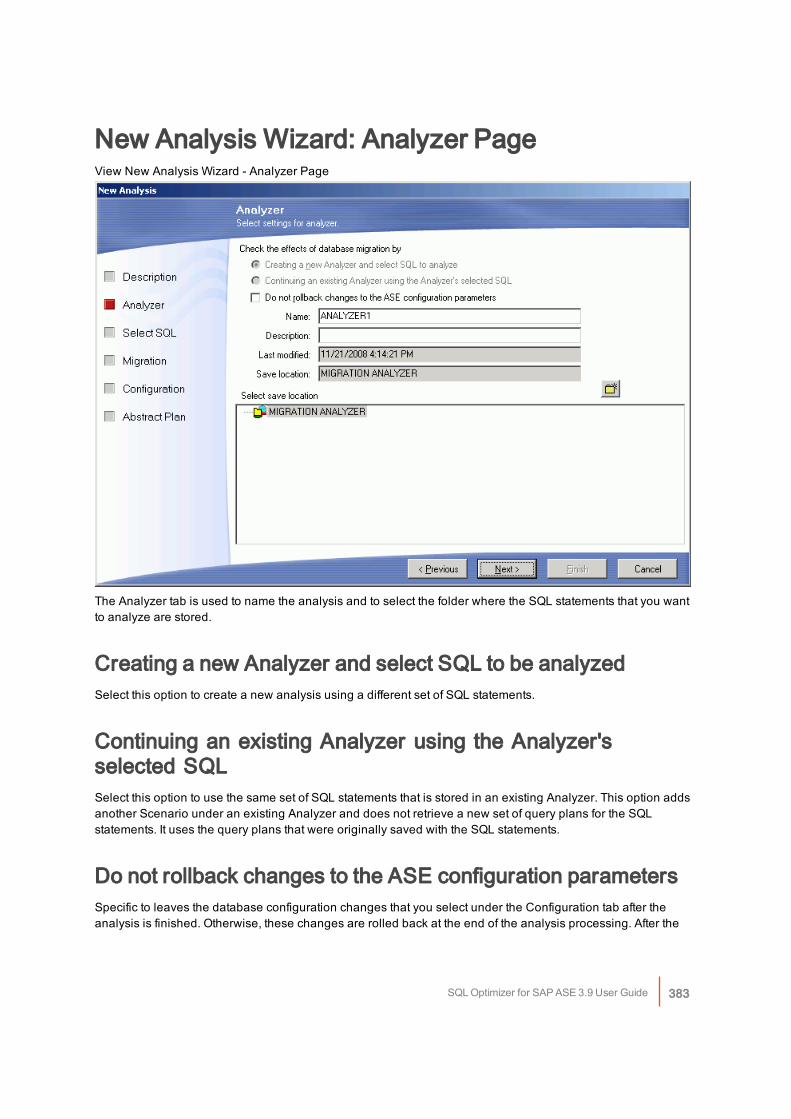
New Analysis Wizard: Analyzer PageView New Analysis Wizard - Analyzer Page
The Analyzer tab is used to name the analysis and to select the folder where the SQL statements that you wantto analyze are stored.
Creating a new Analyzer and select SQL to be analyzedSelect this option to create a new analysis using a different set of SQL statements.
Continuing an existing Analyzer using the Analyzer'sselected SQLSelect this option to use the same set of SQL statements that is stored in an existing Analyzer. This option addsanother Scenario under an existing Analyzer and does not retrieve a new set of query plans for the SQLstatements. It uses the query plans that were originally saved with the SQL statements.
Do not rollback changes to the ASE configuration parametersSpecific to leaves the database configuration changes that you select under the Configuration tab after theanalysis is finished. Otherwise, these changes are rolled back at the end of the analysis processing. After the
SQL Optimizer for SAP ASE 3.9 User Guide 383
analysis is complete, the Apply/Undo Changes button displays at the top of the Migration Analyzer windowwhich displays the Apply Changes and the Undo Changes panes. These panes contain the scripts to makechanges to the Adaptive Server configuration parameters.
Item Description
Name Enter the name for the analysis.
Description Enter the description for the analysis.
Last modified Displays the last modified date and time.
Save location Displays the folder in the tree where the analysis is saved. In the bottom pane,select the folder where you want to save the analysis.
To create a new folder
Click Add Folder .
Related TopicCreate a Migration Analysis
New Analysis Wizard: Select SQL PageView New Analysis Wizard - Select SQL Page
SQL Optimizer for SAP ASE 3.9 User Guide 384
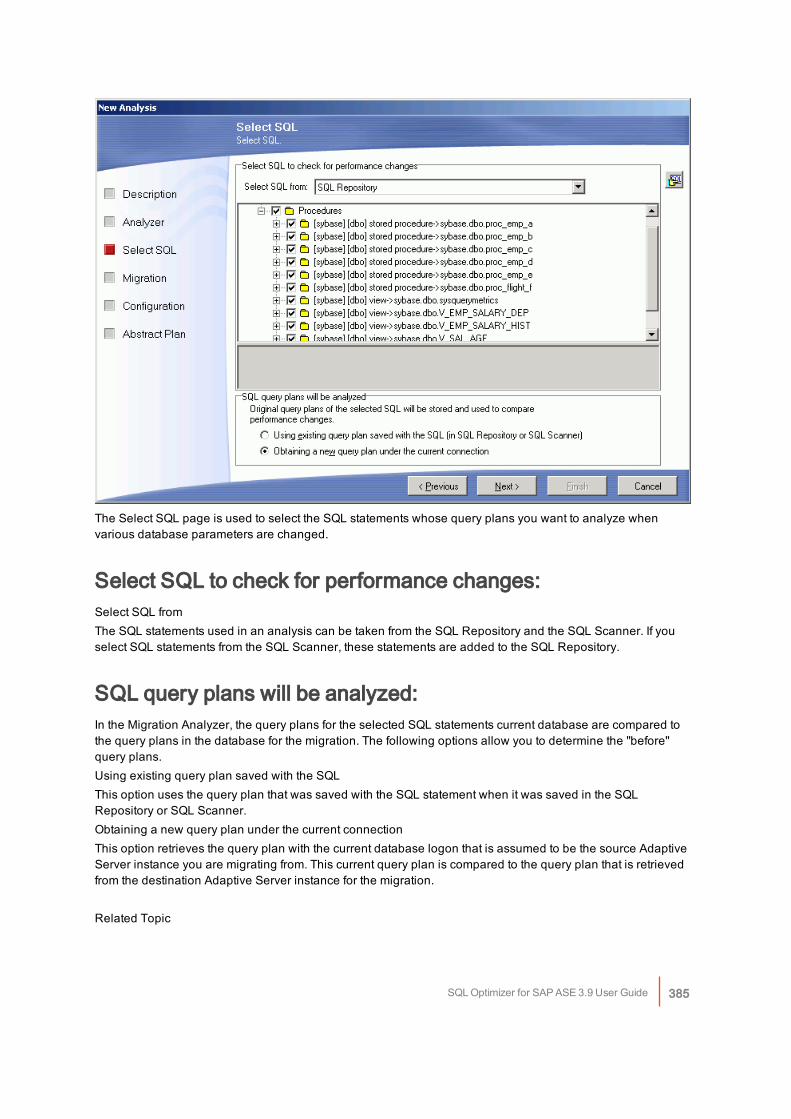
The Select SQL page is used to select the SQL statements whose query plans you want to analyze whenvarious database parameters are changed.
Select SQL to check for performance changes:Select SQL fromThe SQL statements used in an analysis can be taken from the SQL Repository and the SQL Scanner. If youselect SQL statements from the SQL Scanner, these statements are added to the SQL Repository.
SQL query plans will be analyzed:In the Migration Analyzer, the query plans for the selected SQL statements current database are compared tothe query plans in the database for the migration. The following options allow you to determine the "before"query plans.Using existing query plan saved with the SQLThis option uses the query plan that was saved with the SQL statement when it was saved in the SQLRepository or SQL Scanner.Obtaining a new query plan under the current connectionThis option retrieves the query plan with the current database logon that is assumed to be the source AdaptiveServer instance you are migrating from. This current query plan is compared to the query plan that is retrievedfrom the destination Adaptive Server instance for the migration.
Related Topic
SQL Optimizer for SAP ASE 3.9 User Guide 385
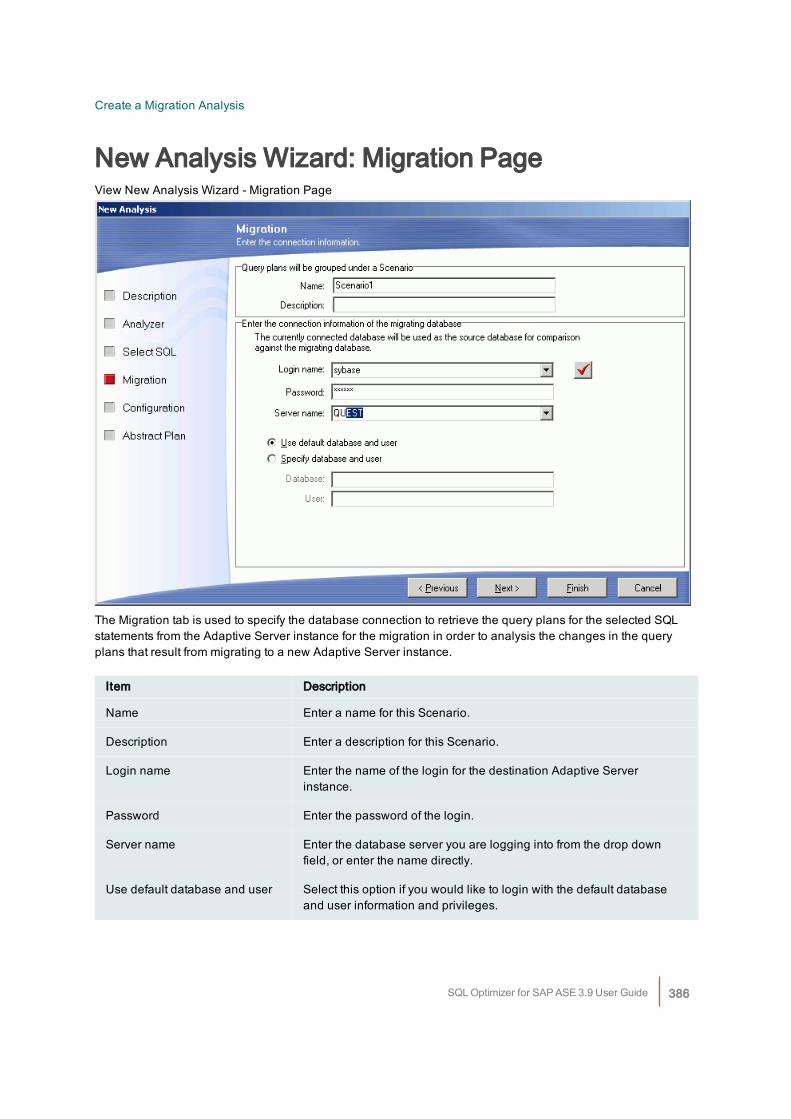
Create a Migration Analysis
New Analysis Wizard: Migration PageView New Analysis Wizard - Migration Page
The Migration tab is used to specify the database connection to retrieve the query plans for the selected SQLstatements from the Adaptive Server instance for the migration in order to analysis the changes in the queryplans that result from migrating to a new Adaptive Server instance.
Item Description
Name Enter a name for this Scenario.
Description Enter a description for this Scenario.
Login name Enter the name of the login for the destination Adaptive Serverinstance.
Password Enter the password of the login.
Server name Enter the database server you are logging into from the drop downfield, or enter the name directly.
Use default database and user Select this option if you would like to login with the default databaseand user information and privileges.
SQL Optimizer for SAP ASE 3.9 User Guide 386
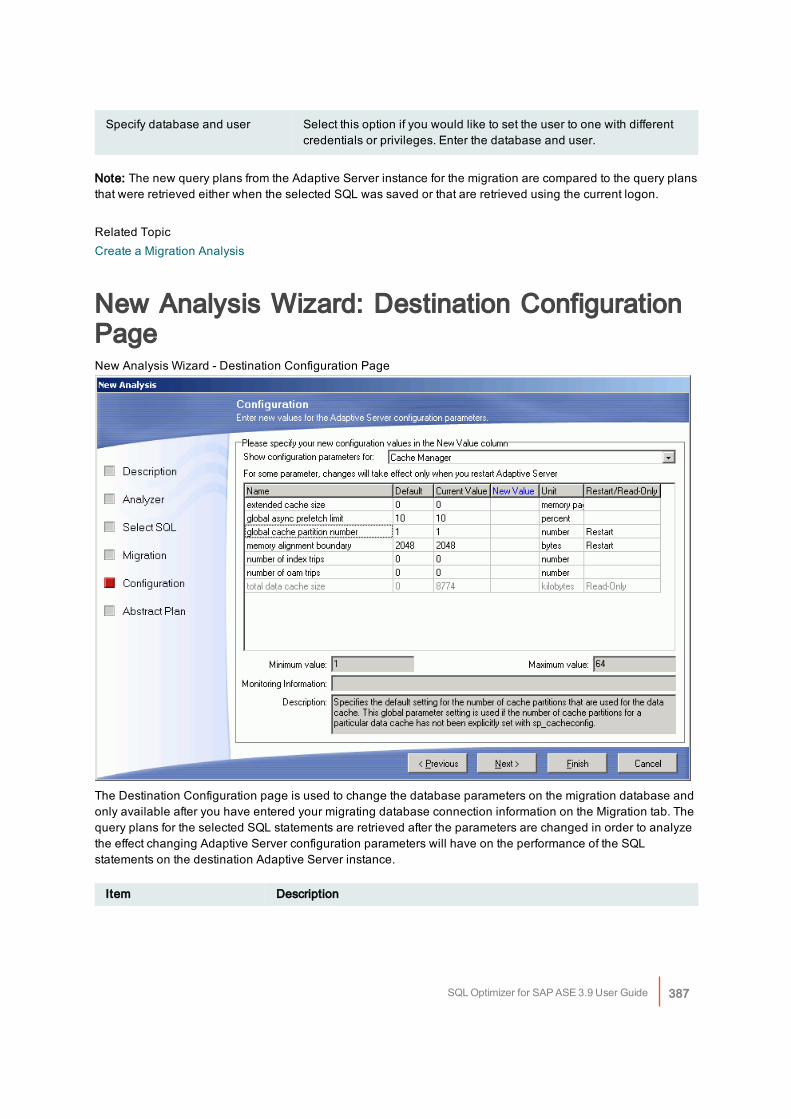
Specify database and user Select this option if you would like to set the user to one with differentcredentials or privileges. Enter the database and user.
Note: The new query plans from the Adaptive Server instance for the migration are compared to the query plansthat were retrieved either when the selected SQL was saved or that are retrieved using the current logon.
Related TopicCreate a Migration Analysis
New Analysis Wizard: Destination ConfigurationPageNew Analysis Wizard - Destination Configuration Page
The Destination Configuration page is used to change the database parameters on the migration database andonly available after you have entered your migrating database connection information on the Migration tab. Thequery plans for the selected SQL statements are retrieved after the parameters are changed in order to analyzethe effect changing Adaptive Server configuration parameters will have on the performance of the SQLstatements on the destination Adaptive Server instance.
Item Description
SQL Optimizer for SAP ASE 3.9 User Guide 387
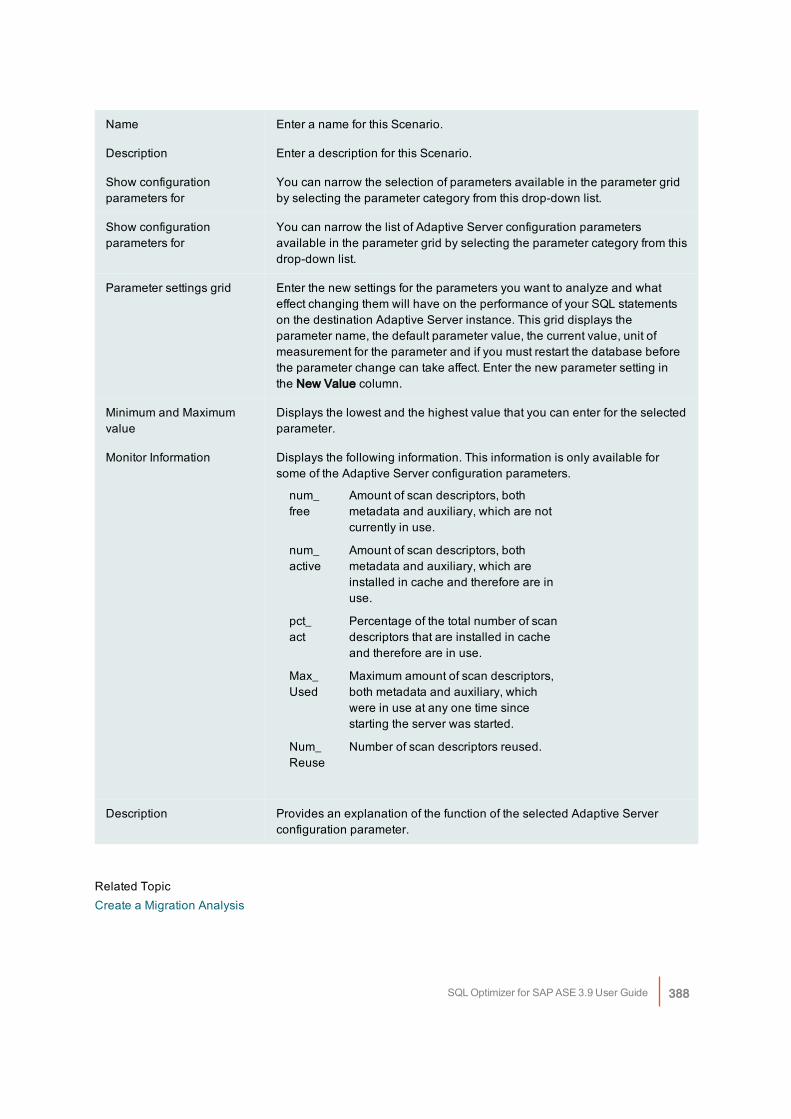
Name Enter a name for this Scenario.
Description Enter a description for this Scenario.
Show configurationparameters for
You can narrow the selection of parameters available in the parameter gridby selecting the parameter category from this drop-down list.
Show configurationparameters for
You can narrow the list of Adaptive Server configuration parametersavailable in the parameter grid by selecting the parameter category from thisdrop-down list.
Parameter settings grid Enter the new settings for the parameters you want to analyze and whateffect changing them will have on the performance of your SQL statementson the destination Adaptive Server instance. This grid displays theparameter name, the default parameter value, the current value, unit ofmeasurement for the parameter and if you must restart the database beforethe parameter change can take affect. Enter the new parameter setting inthe New Value column.
Minimum and Maximumvalue
Displays the lowest and the highest value that you can enter for the selectedparameter.
Monitor Information Displays the following information. This information is only available forsome of the Adaptive Server configuration parameters.
num_free
Amount of scan descriptors, bothmetadata and auxiliary, which are notcurrently in use.
num_active
Amount of scan descriptors, bothmetadata and auxiliary, which areinstalled in cache and therefore are inuse.
pct_act
Percentage of the total number of scandescriptors that are installed in cacheand therefore are in use.
Max_Used
Maximum amount of scan descriptors,both metadata and auxiliary, whichwere in use at any one time sincestarting the server was started.
Num_Reuse
Number of scan descriptors reused.
Description Provides an explanation of the function of the selected Adaptive Serverconfiguration parameter.
Related TopicCreate a Migration Analysis
SQL Optimizer for SAP ASE 3.9 User Guide 388
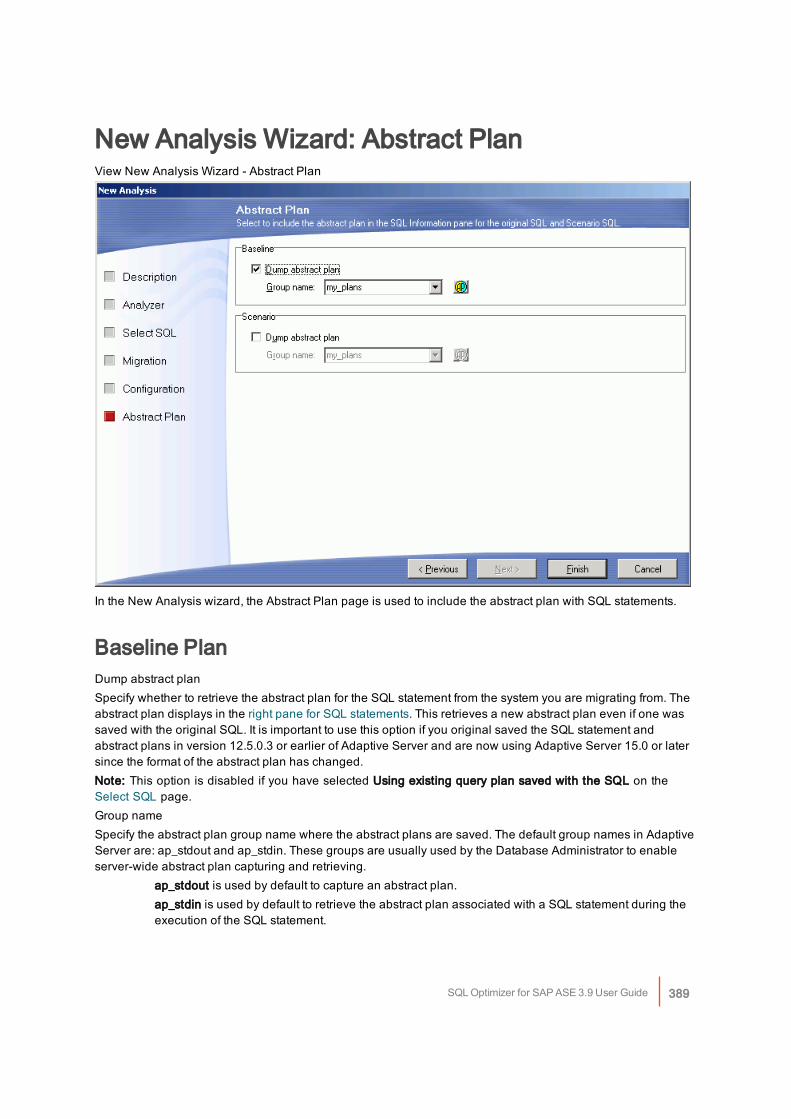
New Analysis Wizard: Abstract PlanView New Analysis Wizard - Abstract Plan
In the New Analysis wizard, the Abstract Plan page is used to include the abstract plan with SQL statements.
Baseline PlanDump abstract planSpecify whether to retrieve the abstract plan for the SQL statement from the system you are migrating from. Theabstract plan displays in the right pane for SQL statements. This retrieves a new abstract plan even if one wassaved with the original SQL. It is important to use this option if you original saved the SQL statement andabstract plans in version 12.5.0.3 or earlier of Adaptive Server and are now using Adaptive Server 15.0 or latersince the format of the abstract plan has changed.Note: This option is disabled if you have selected Using existing query plan saved with the SQL on theSelect SQL page.Group nameSpecify the abstract plan group name where the abstract plans are saved. The default group names in AdaptiveServer are: ap_stdout and ap_stdin. These groups are usually used by the Database Administrator to enableserver-wide abstract plan capturing and retrieving.
ap_stdout is used by default to capture an abstract plan.ap_stdin is used by default to retrieve the abstract plan associated with a SQL statement during theexecution of the SQL statement.
SQL Optimizer for SAP ASE 3.9 User Guide 389
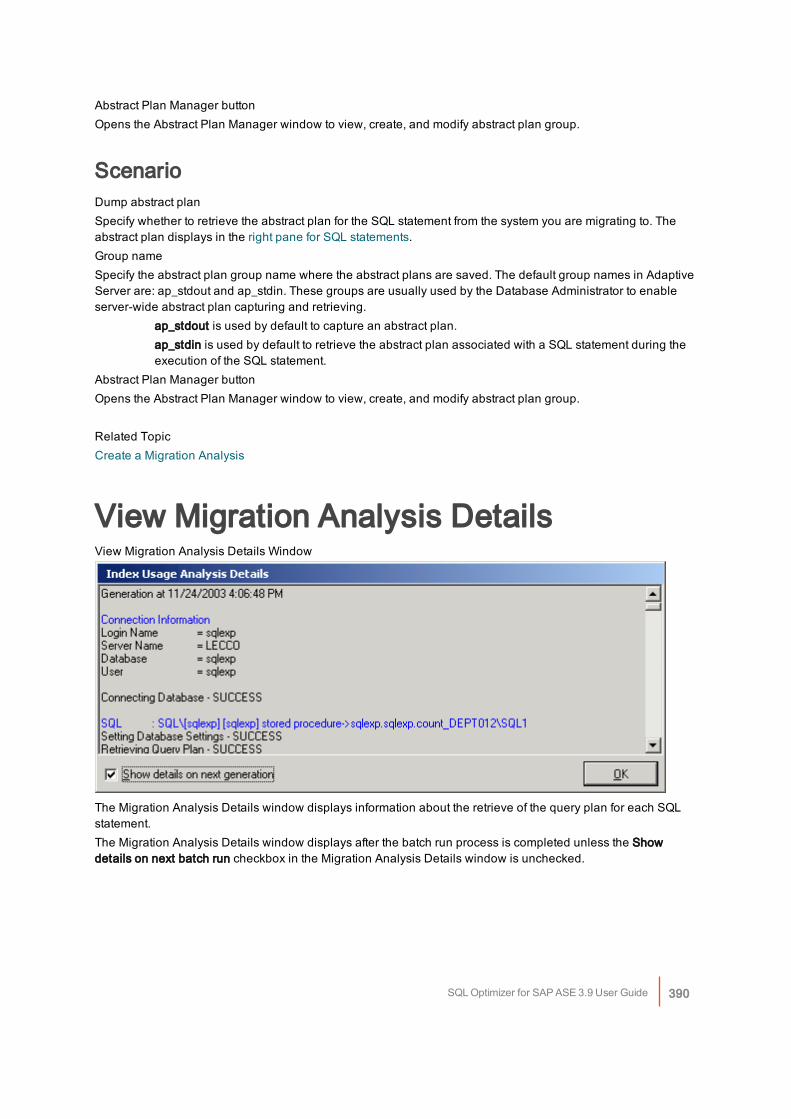
Abstract Plan Manager buttonOpens the Abstract Plan Manager window to view, create, and modify abstract plan group.
ScenarioDump abstract planSpecify whether to retrieve the abstract plan for the SQL statement from the system you are migrating to. Theabstract plan displays in the right pane for SQL statements.Group nameSpecify the abstract plan group name where the abstract plans are saved. The default group names in AdaptiveServer are: ap_stdout and ap_stdin. These groups are usually used by the Database Administrator to enableserver-wide abstract plan capturing and retrieving.
ap_stdout is used by default to capture an abstract plan.ap_stdin is used by default to retrieve the abstract plan associated with a SQL statement during theexecution of the SQL statement.
Abstract Plan Manager buttonOpens the Abstract Plan Manager window to view, create, and modify abstract plan group.
Related TopicCreate a Migration Analysis
View Migration Analysis DetailsView Migration Analysis Details Window
The Migration Analysis Details window displays information about the retrieve of the query plan for each SQLstatement.The Migration Analysis Details window displays after the batch run process is completed unless the Showdetails on next batch run checkbox in the Migration Analysis Details window is unchecked.
SQL Optimizer for SAP ASE 3.9 User Guide 390
To view the Migration Analysis Details window after an analysis
1. Select View | Show Migration Analysis Details.
2. Review this information to see if an error occurred during the retrieval of the query plan. Errors mayoccur if the selected SQL statements are from one database and user and you have set anotherdatabase and user in the drop-down boxes at the bottom left of the main window.
Related TopicCreate a Migration Analysis
Migration Analysis ResultsUpon completion of the migration analysis process, a summary of the analysis is the Migration Analysis Detailswindow, which tells if any of the query plans retrieval failed for any of the SQL in the Scenario. The comparisonof the query plans, estimated I/O cost, abstract plans, Trace On information, and SQL Classification displays inthe right pane of the Migration Analyzer window.Once the analysis is complete, the best way to compare the behavior of the SQL in the analysis is to select theScenario from the left tree structure.
Properties ButtonThe initial view is of the Properties of the Scenario and it gives a basic summary of the analysis including theconfiguration parameters that were specified as different between the databases.
Prognosis ButtonThe Prognosis section of an analysis is the best way to analyze the results to see how the performance of theSQL statements will be affected by the migration. The Prognosis has two tabs in the top pane that provide theoverview of the impact of the migration on SQL performance: Chart and Summary. Specific information aboutthe individual SQL statements displays in the middle and bottom panes.Click any portion of the chart and the SQL statements represented are highlighted in the grid below the charts.
Chart TabTotal Cost ChartThis chart shows the overall Estimated I/O cost differences of the SQL statements when connected to the currentAdaptive Server instance and when connected to the destination Adaptive Server instance.SQL with Cost Change ChartThis chart represents those specific statements whose query plans undergo a change in Estimated I/O cost.Click any portion of the chart and the SQL statements represented are highlighted in the grid below the charts.SQL with Plan Structure Change Chart
SQL Optimizer for SAP ASE 3.9 User Guide 391
This chart represents those statements that experience a structure change in their query plan, regardless of anycost changes.Classification Changes ChartThis chart indicates any SQL statements whose query plans undergo a change in classification (Simple,Complex, and Problematic). The statements that experience degradation in performance would be the beststatements to work with to optimize before migrating to the new Adaptive Server instance, since they are thestatements that could potentially cause performance problems.SQL Classification ChartThis chart gives the aggregate view of the classifications of the SQL statements in the analysis.
Summary TabPresents a summary of the analysis in text format showing the statistics that are used in the charts.
Configuration Parameters ButtonDisplays the configuration parameters for the destination Adaptive Server instance. For each parameter itdisplays current value and the old parameter value before the analysis. The Configuration Parameters pane isonly displayed if changes to configuration parameters were specified for the destination instance during themigration analysis.
Apply ChangesDisplays the script for making the configuration parameters changes on Adaptive Server. Press Execute torun the script.
Related TopicMigration Analyzer Window
Add a ScenarioAfter creating a migration analysis, you can add more Scenarios to it. A Scenario can be added in two ways:
To add a Scenario
Method One1. In the left pane, right-click the analysis and select Add Scenario.
2. In the Add Scenariowizard, click the Migration page and set the user connection information.
3. Click the Destination Configuration page and set the new database parameters.
SQL Optimizer for SAP ASE 3.9 User Guide 392
Method Two1. In the left pane, right-click and select New Analysis.
2. In the New Analysis wizard, select the Continuing an existing Analyzer using the Analyzer’sselect SQL option.
3. From the Select Analyzer field, click the Analyzer name.
4. Click the Migration page and set the user connection information
5. Click the Destination Configuration page and set the new database parameters.
Related TopicMigration Analyzer Window
Rollback Changes to ConfigurationParametersThe Migration analysis connects to the database you are migrating to and first executes the configurationparameter changes that you have selected on your database. Then it retrieves the query plan for each SQLstatement that you have selected for your analyzer. When you set up the individual scenarios, you determine ifyou would like the configuration parameter changes rolled back or to leave them set on Adaptive Server.If you do not have the analysis process rollback the configuration changes, you can roll them back in any one ofthe following ways:
l In the tree pane (left pane), right-click the scenario name and select Go To Undo Changes.
l When you close the Migration Analyzer window, you are prompted to rollback the changes. Click Yes.
l In the tree pane (left pane), click the scenario name and select the Apply/Undo Changes button at the
top of the right pane. Click next to the Undo Change pane.
You can make the changes permanent, in one of the following ways:
l In the tree pane (left pane), right-click the scenario name and select Confirm Changes. Click Yes.
l When you close the Migration Analyzer window, you are prompted to rollback the changes. Click No.
Related TopicMigration Analyzer Window
Add SQL to a Migration AnalysisAfter creating a migration analysis, you can add more SQL statements to it.
SQL Optimizer for SAP ASE 3.9 User Guide 393
To add SQL to an Analysis
1. From the left pane, select the analysis in which you want to add the SQL.
2. Right-click and select Add SQL.
3. From the Add SQL window under the Select SQL to be added pane, check the SQL statements you want added.
4. Under the Select Scenario to include SQL pane, check the Scenarios you want the SQL added to.
5. Click OK to add the SQL, retrieve the query plans and re-execute the Scenario.
Related TopicMigration Analyzer Window
Modify a Migration AnalysisYou can only modify the analysis name and description of a Migration analysis.
To modify an Analysis
1. Select the Analysis name you want to modify from the left pane.
2. Right-click and select Modify to open the Modify Analyzer window.
3. Modify the name and/or description.
Related TopicMigration Analyzer Window
Regenerate a Migration ScenarioThe Scenario can be re-executed using the exact same logon and configuration parameters. You can choose toretrieve the query plans for all SQL statements in the Scenario or select specific SQL to retrieve the query planusing the same logon and configuration parameters.The function is useful if changes have occurred in the database environment, such as data volumes, that maychange the query plans.
To regenerate a Scenario
1. Select the Scenario you want to modify from the left pane.
2. Right-click and select Regenerate.
3. From the Regenerate Scenario window, check the SQL statements whose current query plans youwould like retrieved using the logon and parameter settings.
SQL Optimizer for SAP ASE 3.9 User Guide 394
Related TopicMigration Analyzer Window
Delete a Migration Analysis or ScenarioTo delete an analysis or a Scenario
1. Select the item you want to delete in the left pane.
2. Right-click and select Delete or press Delete
Related TopicMigration Analyzer Window
Rename a Migration Analysis or ScenarioYou can rename an analysis or Scenario in the Migration Analyzer window in two ways.
To rename an Analysis or Scenario
1. Right-click the Analysis or Scenario and select Rename. A highlighted field is placed around the namein the tree to indicate that you can edit the name.
2. Change the name and press Enter or click any where outside the field.
or
1. Right-click the Analysis or Scenario and select Modify to open the Modify Analyzer or ModifyScenario window.
2. Modify the name.
3. Click OK to save the changes.
Related TopicMigration Analyzer Window
Modify a Migration ScenarioYou can only modify the Scenario name and description of the Scenario. From the Migration Analyzer window:
SQL Optimizer for SAP ASE 3.9 User Guide 395
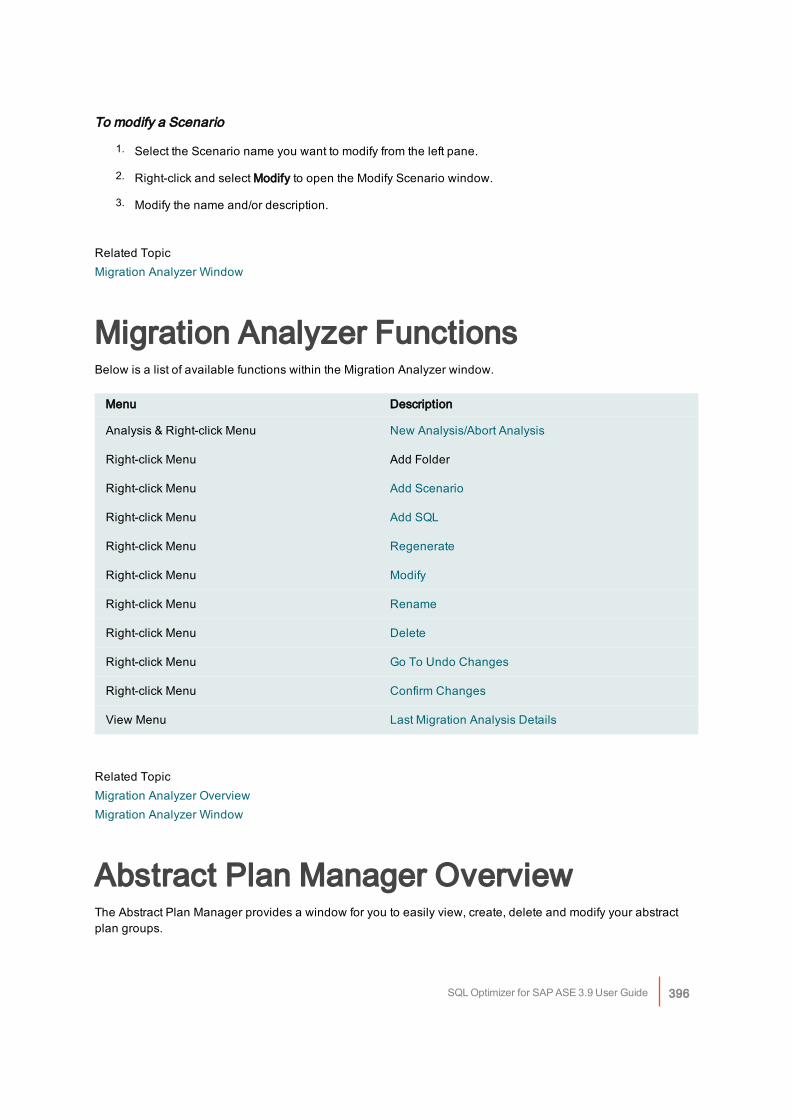
To modify a Scenario
1. Select the Scenario name you want to modify from the left pane.
2. Right-click and select Modify to open the Modify Scenario window.
3. Modify the name and/or description.
Related TopicMigration Analyzer Window
Migration Analyzer FunctionsBelow is a list of available functions within the Migration Analyzer window.
Menu Description
Analysis & Right-click Menu New Analysis/Abort Analysis
Right-click Menu Add Folder
Right-click Menu Add Scenario
Right-click Menu Add SQL
Right-click Menu Regenerate
Right-click Menu Modify
Right-click Menu Rename
Right-click Menu Delete
Right-click Menu Go To Undo Changes
Right-click Menu Confirm Changes
View Menu Last Migration Analysis Details
Related TopicMigration Analyzer OverviewMigration Analyzer Window
Abstract Plan Manager OverviewThe Abstract Plan Manager provides a window for you to easily view, create, delete and modify your abstractplan groups.
SQL Optimizer for SAP ASE 3.9 User Guide 396
In Adaptive Server version 15 and above, the abstract plan enables you to influence the optimization of a SQLstatement without having to modify the SQL statement syntax. If you cannot change the source code thatcontains your SQL statement, you can use the abstract plan to force Adaptive Server to use a specific query planfor a SQL statement. This is particularly useful if you have third party applications where you do not have accessto the source code.Another use of the abstract plan is to protect the performance from changes to the database. When changes aremade to a database, Adaptive Server may choose a different query plan for a SQL statement as a result of thechanges. The abstract plans provide a means for system administrators and performance tuners to protect theoverall performance of a SQL statement from these changes since the abstract plan will cause Adaptive Serverto always choose the same query plan.In the SQL Optimizer window, you can find alternate abstract plans in one of two ways while you are optimizinga SQL statement. First, you can optimize to find only the compatible alternative abstract plans. Second, you canoptimize to find the semantically equivalent SQL statements with alternative query plans and then choose theones with compatible alternative abstract plans.
Related TopicsAbstract Plan GroupWhy Save the Abstract Plan?Abstract Plan Compatibility with Original SQLAbstract Plan Manager WindowOpen the Abstract Plan ManagerAbstract Plan Group FunctionsExport a Group to a TableImport an Abstract Plan for each UserAbstract Plan ID FunctionsUse Saved Abstract Plans
Abstract Plan GroupAbstract plans are saved to an abstract plan group. The group has the following elements associated with it:
l Database
l User-ID
l SQL statement
l Abstract Plan
When you save an abstract plan, you specify the database, group and user. This means that you can have adifferent abstract plan for different users. It enables SQL optimization to be based on the user’s individualactivities.Here is an example of where you might want to have a different abstract plan for different users. In this example,the column emp_sex is indexed.select * from employee where emp_sex=:var_sex
If 90% employees are male, then the SQL statement to retrieve the records where the employees are maleshould not be indexed for the best results.But the SQL statement to retrieve the 10% of the employees who are female should be indexed.
SQL Optimizer for SAP ASE 3.9 User Guide 397
For Group A users, who always select "male" employees, the Abstract Plan should do full table scan. For GroupB users, who always select "female" employees, the Abstract Plan should use an index scan.If you use the default group of ap_stdin, you can set Adaptive Server to use this group server-wide. You mustsave each abstract plan that you want to use system-wide in this group.You can set up Adaptive Server to use different abstract plans for the same SQL statement from differentapplications. In this case, you create a different group for each application. For each user that you want to use aspecific abstract plan, you must save that abstract plan in the group.
Related TopicsAbstract Plan Manager OverviewWhy Save the Abstract Plan?Abstract Plan Compatibility with Original SQLAbstract Plan Manager WindowOpen the Abstract Plan ManagerAbstract Plan Group FunctionsAbstract Plan Manager OverviewExport a Group to a TableImport an Abstract Plan for each UserAbstract Plan ID FunctionsUse Saved Abstract Plans
Why Save the Abstract Plan?Saving the abstract plan for a SQL statement preserves how the SQL statement is executed. Therefore,when changes occur in the database environment, the query plan used to execute the SQL statementremains constant.One major advantage of saving the abstract plan is that you can optimize the SQL statement without altering theSQL text. This is an ideal solution for when you do not have the source code from a vendor but want to improvethe performance of the database application. The saving of the abstract plan can be very useful when you areconsidering making changes to the configuration parameters or you are migrating to another version ofAdaptive Server and you want to preserve the current performance of SQL statements that are critical to theperformance of your applications.These database environment changes may include:
l Parallel degree
l Table partitioning
l Indexing
l Database software upgrades
l Changes in data columns
You can save an abstract plan from the following modules:
To save in... See:
SQL Optimizer for SAP ASE 3.9 User Guide 398
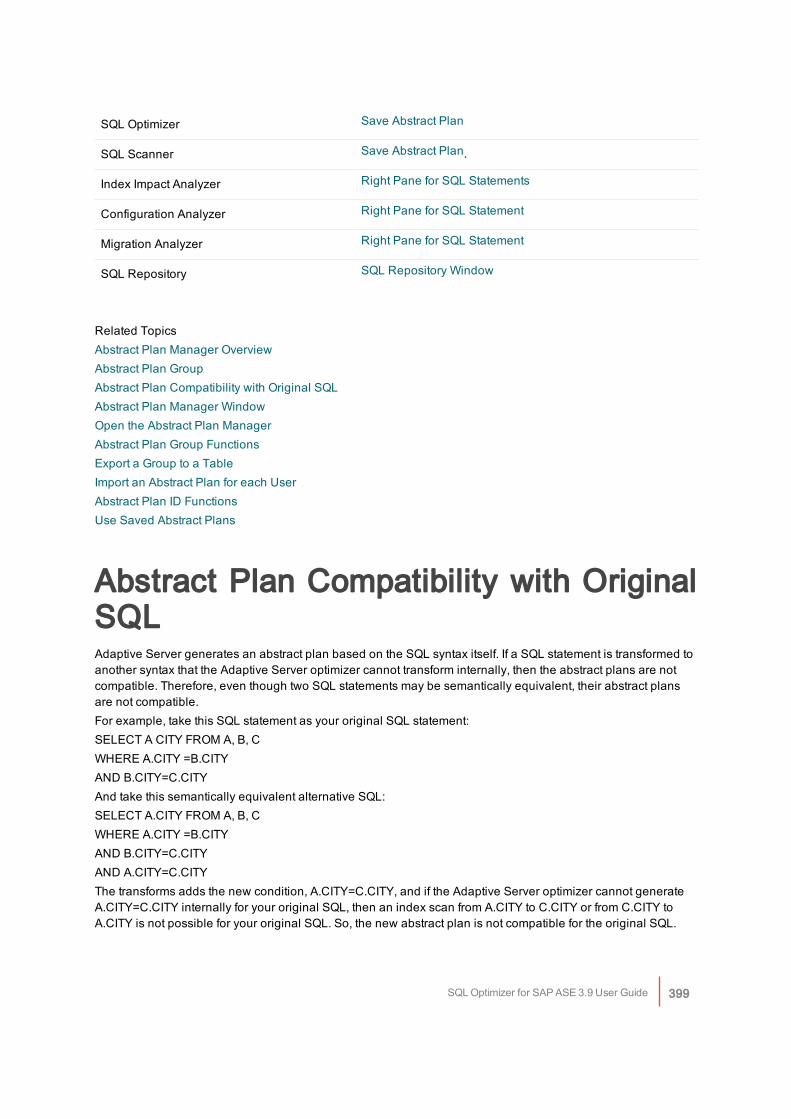
SQL Optimizer Save Abstract Plan
SQL Scanner Save Abstract Plan.
Index Impact Analyzer Right Pane for SQL Statements
Configuration Analyzer Right Pane for SQL Statement
Migration Analyzer Right Pane for SQL Statement
SQL Repository SQL Repository Window
Related TopicsAbstract Plan Manager OverviewAbstract Plan GroupAbstract Plan Compatibility with Original SQLAbstract Plan Manager WindowOpen the Abstract Plan ManagerAbstract Plan Group FunctionsExport a Group to a TableImport an Abstract Plan for each UserAbstract Plan ID FunctionsUse Saved Abstract Plans
Abstract Plan Compatibility with OriginalSQLAdaptive Server generates an abstract plan based on the SQL syntax itself. If a SQL statement is transformed toanother syntax that the Adaptive Server optimizer cannot transform internally, then the abstract plans are notcompatible. Therefore, even though two SQL statements may be semantically equivalent, their abstract plansare not compatible.For example, take this SQL statement as your original SQL statement:SELECT A CITY FROM A, B, CWHERE A.CITY =B.CITYAND B.CITY=C.CITYAnd take this semantically equivalent alternative SQL:SELECT A.CITY FROM A, B, CWHERE A.CITY =B.CITYAND B.CITY=C.CITYAND A.CITY=C.CITYThe transforms adds the new condition, A.CITY=C.CITY, and if the Adaptive Server optimizer cannot generateA.CITY=C.CITY internally for your original SQL, then an index scan from A.CITY to C.CITY or from C.CITY toA.CITY is not possible for your original SQL. So, the new abstract plan is not compatible for the original SQL.
SQL Optimizer for SAP ASE 3.9 User Guide 399
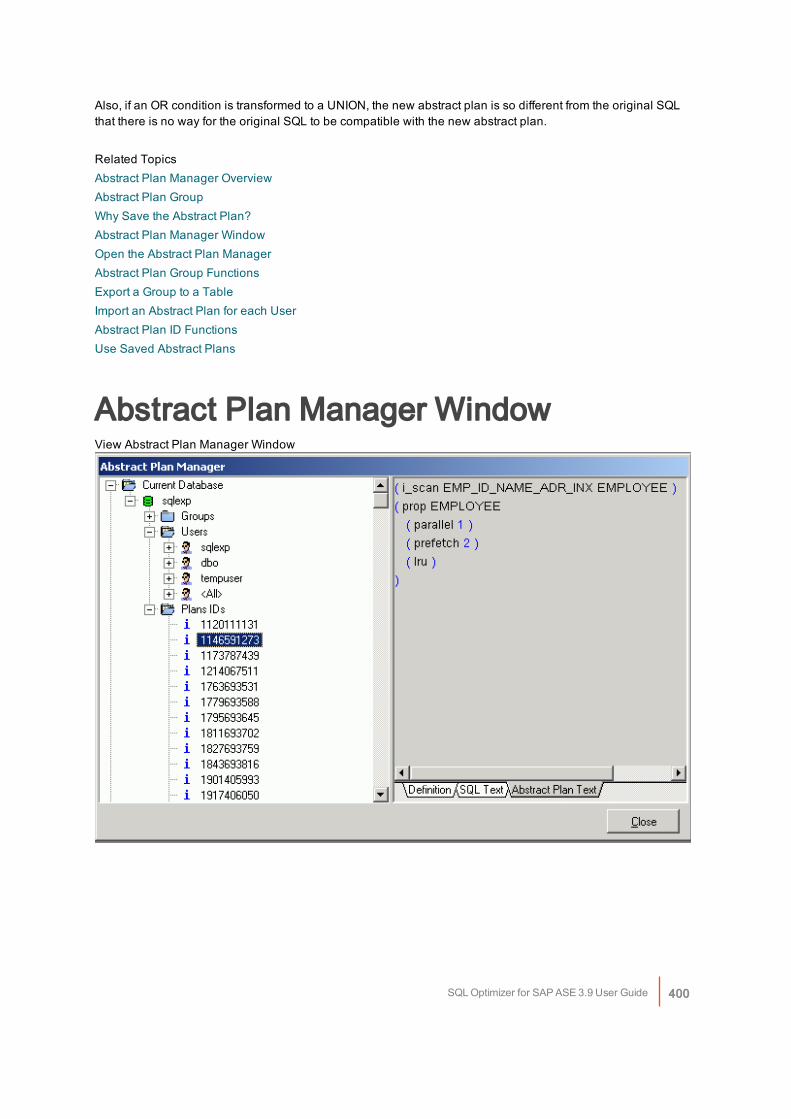
Also, if an OR condition is transformed to a UNION, the new abstract plan is so different from the original SQLthat there is no way for the original SQL to be compatible with the new abstract plan.
Related TopicsAbstract Plan Manager OverviewAbstract Plan GroupWhy Save the Abstract Plan?Abstract Plan Manager WindowOpen the Abstract Plan ManagerAbstract Plan Group FunctionsExport a Group to a TableImport an Abstract Plan for each UserAbstract Plan ID FunctionsUse Saved Abstract Plans
Abstract Plan Manager WindowView Abstract Plan Manager Window
SQL Optimizer for SAP ASE 3.9 User Guide 400
Left PaneThe left pane is a tree structure for the managing of the elements of the abstract plan: Groups, Users,and Plan IDs.Right-click any element to bring up the right-click menu with the functionality for that element.
Right PaneThe right pane displays the information that corresponds to the group, users, or plan ID that is selected inthe left pane.
Related TopicsAbstract Plan Manager OverviewAbstract Plan GroupWhy Save the Abstract Plan?Abstract Plan Compatibility with Original SQLOpen the Abstract Plan ManagerAbstract Plan Group FunctionsExport a Group to a TableImport an Abstract Plan for each UserAbstract Plan ID FunctionsUse Saved Abstract Plans
Open the Abstract Plan ManagerTo open the Abstract Plan Manager
Click . .
Related TopicsAbstract Plan Manager OverviewAbstract Plan GroupWhy Save the Abstract Plan?Abstract Plan Compatibility with Original SQLAbstract Plan Manager WindowAbstract Plan Group FunctionsExport a Group to a TableImport an Abstract Plan for each UserAbstract Plan ID FunctionsUse Saved Abstract Plans
SQL Optimizer for SAP ASE 3.9 User Guide 401
Abstract Plan Group FunctionsThe following are the functions that are performed on abstract plan groups.
To use these functionsRight-click the group name in the left pane and select one of the following functions.
Item Description
Create Creates a new abstract plan group
Drop Drops the select abstract plan group.
Purge Deletes all abstract plans in the selected group
Copy All Plan Copies all abstract plans in the selected group to another group.
Rename Renames the abstract plan group.
Export Exports the abstract plan group to a table.
Import Imports an exported table to a database, user and group
Compare Compares the differences between two groups.
Related TopicsAbstract Plan Manager OverviewAbstract Plan GroupWhy Save the Abstract Plan?Abstract Plan Compatibility with Original SQLAbstract Plan Manager WindowOpen the Abstract Plan ManagerAbstract Plan Manager OverviewExport a Group to a TableImport an Abstract Plan for each UserAbstract Plan ID FunctionsUse Saved Abstract Plans
Export a Group to a TableIn order to move the saved abstract plan from one user to another or from one database to other, you firstexport the group in which it is saved to a table in your database, and then you import the group to anotheruser or database.
SQL Optimizer for SAP ASE 3.9 User Guide 402
To export a group
1. In the left pane of the Abstract Plan Manager, right-click and select Group | Export.
2. In the Export Plan window under the Export from section, select the name of the database, user, andabstract plan group where you saved the abstract plan.
3. Under the Export to section, select the database and user. Enter a new table name to store the group in.You cannot use an existing table.
Related TopicsAbstract Plan Manager OverviewAbstract Plan GroupWhy Save the Abstract Plan?Abstract Plan Compatibility with Original SQLAbstract Plan Manager WindowOpen the Abstract Plan ManagerAbstract Plan Group FunctionsImport an Abstract Plan for each UserAbstract Plan ID FunctionsUse Saved Abstract Plans
Import an Abstract Plan for each UserOnce the abstract plan group is exported to a table in your database, you can import it to as many users ordatabases as you would like.
To import an abstract plan for each user
1. In the left pane of the Abstract Plan Manager, right-click and select Group | Import.
2. In the Import Plan window under the Import from section, select the database, user and table namewhere you exported the group.
3. Under the Import to section, select the name of the database, user, and abstract plan group where youwant to import the abstract plans.
Related TopicsAbstract Plan Manager OverviewAbstract Plan GroupWhy Save the Abstract Plan?Abstract Plan Compatibility with Original SQLAbstract Plan Manager WindowOpen the Abstract Plan ManagerAbstract Plan Group Functions
SQL Optimizer for SAP ASE 3.9 User Guide 403
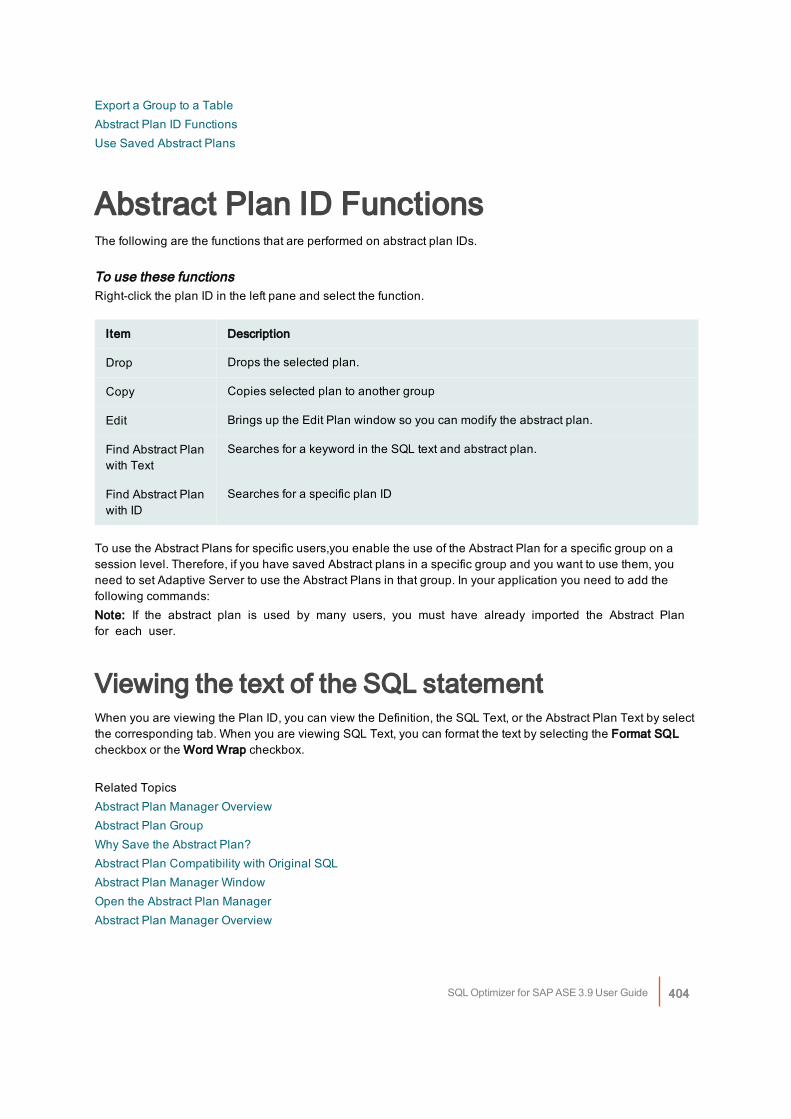
Export a Group to a TableAbstract Plan ID FunctionsUse Saved Abstract Plans
Abstract Plan ID FunctionsThe following are the functions that are performed on abstract plan IDs.
To use these functionsRight-click the plan ID in the left pane and select the function.
Item Description
Drop Drops the selected plan.
Copy Copies selected plan to another group
Edit Brings up the Edit Plan window so you can modify the abstract plan.
Find Abstract Planwith Text
Searches for a keyword in the SQL text and abstract plan.
Find Abstract Planwith ID
Searches for a specific plan ID
To use the Abstract Plans for specific users,you enable the use of the Abstract Plan for a specific group on asession level. Therefore, if you have saved Abstract plans in a specific group and you want to use them, youneed to set Adaptive Server to use the Abstract Plans in that group. In your application you need to add thefollowing commands:Note: If the abstract plan is used by many users, you must have already imported the Abstract Planfor each user.
Viewing the text of the SQL statementWhen you are viewing the Plan ID, you can view the Definition, the SQL Text, or the Abstract Plan Text by selectthe corresponding tab. When you are viewing SQL Text, you can format the text by selecting the Format SQLcheckbox or the Word Wrap checkbox.
Related TopicsAbstract Plan Manager OverviewAbstract Plan GroupWhy Save the Abstract Plan?Abstract Plan Compatibility with Original SQLAbstract Plan Manager WindowOpen the Abstract Plan ManagerAbstract Plan Manager Overview
SQL Optimizer for SAP ASE 3.9 User Guide 404
Export a Group to a TableImport an Abstract Plan for each UserUse Saved Abstract Plans
Use Saved Abstract PlansTo use the abstract plan in your applications you have to either enable the abstract plan loading in the server-wide mode or enable the Abstract Plan loading for the session-level inside your applicationThe abstract plans that you want all applications to use must be saved in the ap_stdin group. If you wantdifferent abstract plans for different applications, you must save them in a group and associate it with a user.
Using Abstract Plans for Specific ApplicationsTo use the Abstract Plans for specific users, you enable the use of the Abstract Plan for a specific group on asession level. Therefore, if you have saved abstract plans in a specific group and you want to use them, youneed to tell Adaptive Server to use the abstract plans in that group. In your application you need to add thefollowing commands:Note: If the abstract plan is used by many users, you must have already imported the abstract planfor each user.Example:set plan load group_name on
go
*some queries*
go
set plan load off
go
Using the Abstract Plans Server WideYou can enable Adaptive Server to use the abstract plans server-wide from the default group of ap_stdin.To use the same abstract plan for all applications, the system administrator must set the abstract plan load sp_configure parameter to 1. Adaptive Server then uses the stored abstract plans from the default group ap_stdin.Note: You can override the use of the abstract plan from ap_stdin for a specific SQL statement with the session-level "set plan load" command in the application.
Related TopicsAbstract Plan Manager OverviewAbstract Plan GroupWhy Save the Abstract Plan?Abstract Plan Compatibility with Original SQLAbstract Plan Manager WindowOpen the Abstract Plan ManagerAbstract Plan Group Functions
SQL Optimizer for SAP ASE 3.9 User Guide 405
Export a Group to a TableImport an Abstract Plan for each UserAbstract Plan ID Functions
User-Defined Temp Table OverviewThe technique of creating temporary tables to extract data from permanent tables is often used. Because theexistent of the local temp table is session related, you need to create these temporary tables in your currentsession. The User-Defined Temp Table window allows you to create temp tables to use so that you mayoptimize and analyze SQL statements that use temporary tables. Besides temporary table that you create usingthe User-Defined Temp Table window, temporary table may also be created during the scanning by the SQLScanner and during the optimization process by the SQL Optimizer.Note: Temporary Tables created in the User-Defined Temp Table module are not available in the SQLWorksheet module since a new database session is used to execute commands in the SQL Worksheet.
Related TopicsCreate Temporary TablesParameters in Temporary Table SQLView SQL scripts of temporary tablesDrop Temporary TablesExample of Temporary Tables in SQL ScannerCopy SQL with Temporary Tables to SQL OptimizerCreate Alternative SQL Which Uses Temporary TablesPreference Settings for Handling Temporary Tables
Create Temporary TablesView User-Defined Temp Table Window
SQL Optimizer for SAP ASE 3.9 User Guide 406
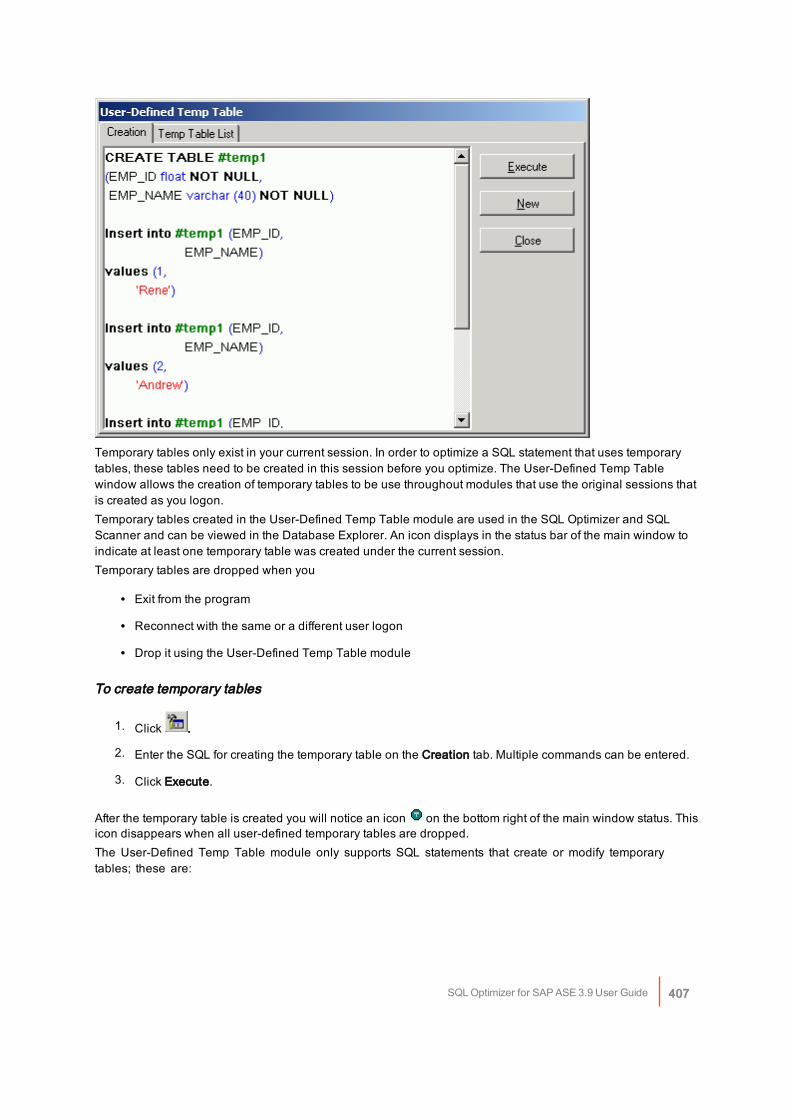
Temporary tables only exist in your current session. In order to optimize a SQL statement that uses temporarytables, these tables need to be created in this session before you optimize. The User-Defined Temp Tablewindow allows the creation of temporary tables to be use throughout modules that use the original sessions thatis created as you logon.Temporary tables created in the User-Defined Temp Table module are used in the SQL Optimizer and SQLScanner and can be viewed in the Database Explorer. An icon displays in the status bar of the main window toindicate at least one temporary table was created under the current session.Temporary tables are dropped when you
l Exit from the program
l Reconnect with the same or a different user logon
l Drop it using the User-Defined Temp Table module
To create temporary tables
1. Click .
2. Enter the SQL for creating the temporary table on the Creation tab. Multiple commands can be entered.
3. Click Execute.
After the temporary table is created you will notice an icon on the bottom right of the main window status. Thisicon disappears when all user-defined temporary tables are dropped.The User-Defined Temp Table module only supports SQL statements that create or modify temporarytables; these are:
SQL Optimizer for SAP ASE 3.9 User Guide 407
l SELECT INTO
l CREATE TABLE
l CREATE INDEX
l DROP INDEX
l DROP TABLE
l INSERT
l UPDATE
l DELETE
Note: Temporary tables created within the User-Defined Temp Table window can be used in all modules butthe SQL Worksheet. The SQL Worksheet module creates a separate session so temporary tables created in theUser-Defined Temp Table cannot be used in the SQL Worksheet and vice versa.
Related TopicsUser-Defined Temp Table OverviewParameters in Temporary Table SQLView SQL scripts of temporary tablesDrop Temporary TablesExample of Temporary Tables in SQL ScannerCopy SQL with Temporary Tables to SQL OptimizerCreate Alternative SQL Which Uses Temporary TablesPreference Settings for Handling Temporary Tables
Parameters in Temporary Table SQLIn the User-Defined Temp Table window, if the commands for creating the temporary table contain parameters,you are prompted to enter the data types and values on the Parameters window after you click Execute.
Related TopicsUser-Defined Temp Table OverviewCreate Temporary TablesView SQL scripts of temporary tablesDrop Temporary TablesExample of Temporary Tables in SQL ScannerCopy SQL with Temporary Tables to SQL OptimizerCreate Alternative SQL Which Uses Temporary TablesPreference Settings for Handling Temporary Tables
SQL Optimizer for SAP ASE 3.9 User Guide 408
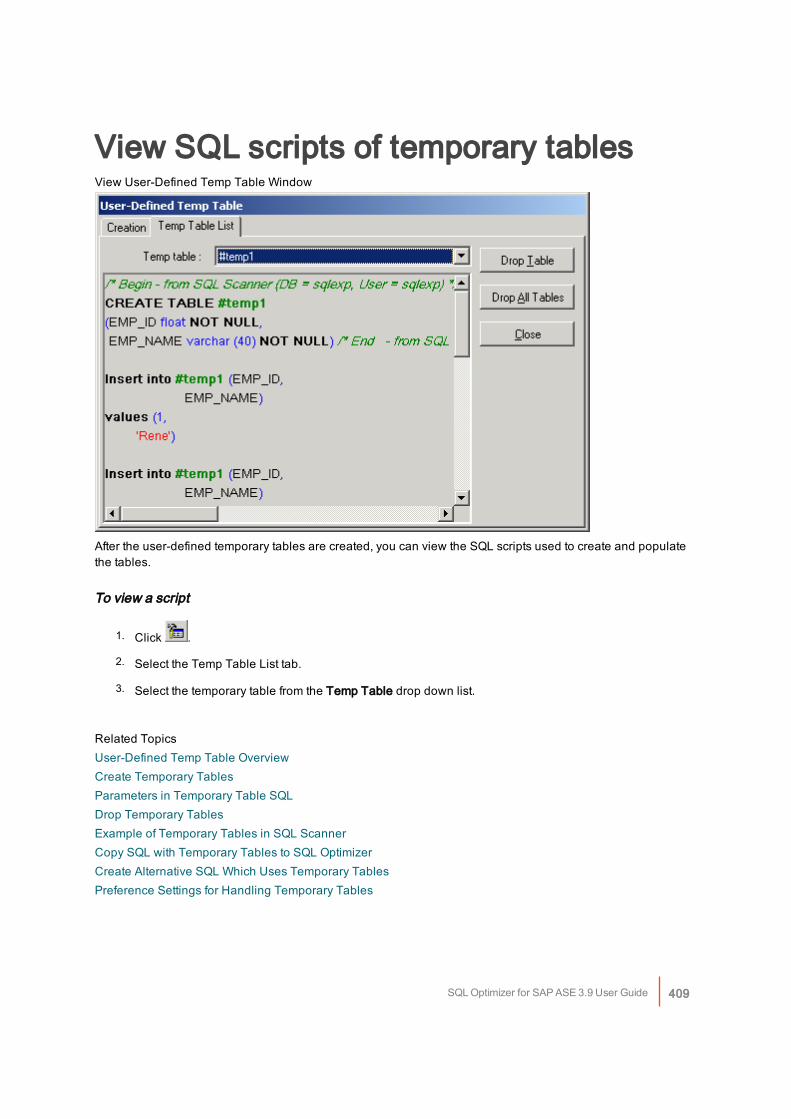
View SQL scripts of temporary tablesView User-Defined Temp Table Window
After the user-defined temporary tables are created, you can view the SQL scripts used to create and populatethe tables.
To view a script
1. Click .
2. Select the Temp Table List tab.
3. Select the temporary table from the Temp Table drop down list.
Related TopicsUser-Defined Temp Table OverviewCreate Temporary TablesParameters in Temporary Table SQLDrop Temporary TablesExample of Temporary Tables in SQL ScannerCopy SQL with Temporary Tables to SQL OptimizerCreate Alternative SQL Which Uses Temporary TablesPreference Settings for Handling Temporary Tables
SQL Optimizer for SAP ASE 3.9 User Guide 409
Drop Temporary TablesAfter the User-Defined temporary tables are created, you can drop them.
To drop temporary tables
1. Click .
2. Select the Temp Table List tab.
3. If you want to remove all temp tables, click Drop All Table.
Related TopicsUser-Defined Temp Table OverviewCreate Temporary TablesParameters in Temporary Table SQLView SQL scripts of temporary tablesExample of Temporary Tables in SQL ScannerCopy SQL with Temporary Tables to SQL OptimizerCreate Alternative SQL Which Uses Temporary TablesPreference Settings for Handling Temporary Tables
Example of Temporary Tables in SQLScannerExample with CREATE TABLE in the source code containing the following SQL statements:/* SQL1 */CREATE TABLE #temp1([EMP_ID] float NOT NULL,[EMP_NAME] varchar (40) NOT NULL)
/* SQL2 */Insert into #temp1 (EMP_ID, EMP_NAME)values (1, 'Rene')
/* SQL3 */Insert into #temp1 (EMP_ID, EMP_NAME)values (2, 'Andrew')
/* SQL4 */Insert into #temp1 (EMP_ID, EMP_NAME)
SQL Optimizer for SAP ASE 3.9 User Guide 410
values (3, 'Claudia')
/* SQL5 */Select * from #temp1In the above example, when the SQL Scanner finds the first INSERT statement, it executes the CREATE TABLEstatement, so that the temporary table #temp1 is created. The query plan for the INSERT statement is obtainedand the statement is classified as to how likely it is to be causing a performance problem. In the SQL InformationPane of the SQL Scanner window, the Scanner Temp Table pane displays the SQL statements used to createthe temporary table. At then end of scanning process, the temporary table is dropped unless you have set theOverride User-Defined Temp Table option.In the Preferences, an option is provided to include the data in the temporary table. When you select the Includedata option, the INSERT, UPDATE and DELETE statements that populate the temporary table are alsoexecuted. These statements are displayed along with the CREATE TABLE command in the Information Pane inthe SQL Scanner window.From the example above, the SQL Scanner window shows the following for SQL5 (select * from #temp1) underthe Scanner Temp Table button. It shows the SQL statement used to create the temporary table and the datathat is inserted into it during the scanning process./* with Included data option selected in Preferences */CREATE TABLE #temp1([EMP_ID] float NOT NULL,[EMP_NAME] varchar (40) NOT NULL)Insert into #temp1 (EMP_ID, EMP_NAME)values (1,'Rene')Insert into #temp1 (EMP_ID, EMP_NAME)values (2,'Andrew')Insert into #temp1 (EMP_ID, EMP_NAME)values (3,'Claudia')Example using SELECT INTO to create the temporary table.After scanning, the SQL Scanner window shows the following two statements:/* SQL1 */
select EMP_ID,
EMP_NAME
into #temp1
from EMPLOYEE
/* SQL2 */
select *
from #temp1
For SQL2, the Scanner Temp Table pane shows that the SELECT INTO SQL statement was used to create thetemporary table.select EMP_ID,
EMP_NAME
into #temp1
from EMPLOYEE
SQL Optimizer for SAP ASE 3.9 User Guide 411
Related TopicsOptions (SQL Scanner Tab)User-Defined Temp Table OverviewCreate Temporary TablesParameters in Temporary Table SQLView SQL scripts of temporary tablesDrop Temporary TablesCopy SQL with Temporary Tables to SQL OptimizerCreate Alternative SQL Which Uses Temporary TablesPreference Settings for Handling Temporary Tables
Copy SQL with Temporary Tables toSQL OptimizerWhen you copy a SQL statement from the SQL Scanner to the SQL Optimizer module, the Send to SQLOptimizerfunction automates this process for you. It copies the SQL statement, opens the SQL Optimizer windowand inserts the SQL statement in the SQL Editor pane. When the SQL statement you are copying also includes atemporary table, the Send to SQL Optimizer function also copies the SQL statements for creating and populatingthe temporary table to the User-Defined Temp Table module.Two items need to be considered when the SQL statements are automatically copied in the User-Defined TempTable module. Is there SQL text already in the module? And does the temporary table already exist with thesame or different data?If SQL text is already entered into the User-Defined Temp Table module, you are prompted to save the currentSQL to an ASCII file before it is overlaid with the new text. Saving the text enables you to use it again.If a table with the same name already exists and you would like to recreate it with either a new definition ordifferent data, then you must drop the table before executing the new SQL text. You can drop temporary tablefrom the Temp Table List tab in the User-Defined Temp Table module.
Related TopicsUser-Defined Temp Table OverviewCreate Temporary TablesParameters in Temporary Table SQLView SQL scripts of temporary tablesDrop Temporary TablesCreate Alternative SQL Which Uses Temporary TablesPreference Settings for Handling Temporary Tables
Create Alternative SQL Which UsesTemporary TablesOne of the techniques for improving the performance of a SQL statement is to create a temporary table. Whenthe SQL Optimizer rewrites the original SQL statement, some of the alternatives may involve this technique.
SQL Optimizer for SAP ASE 3.9 User Guide 412
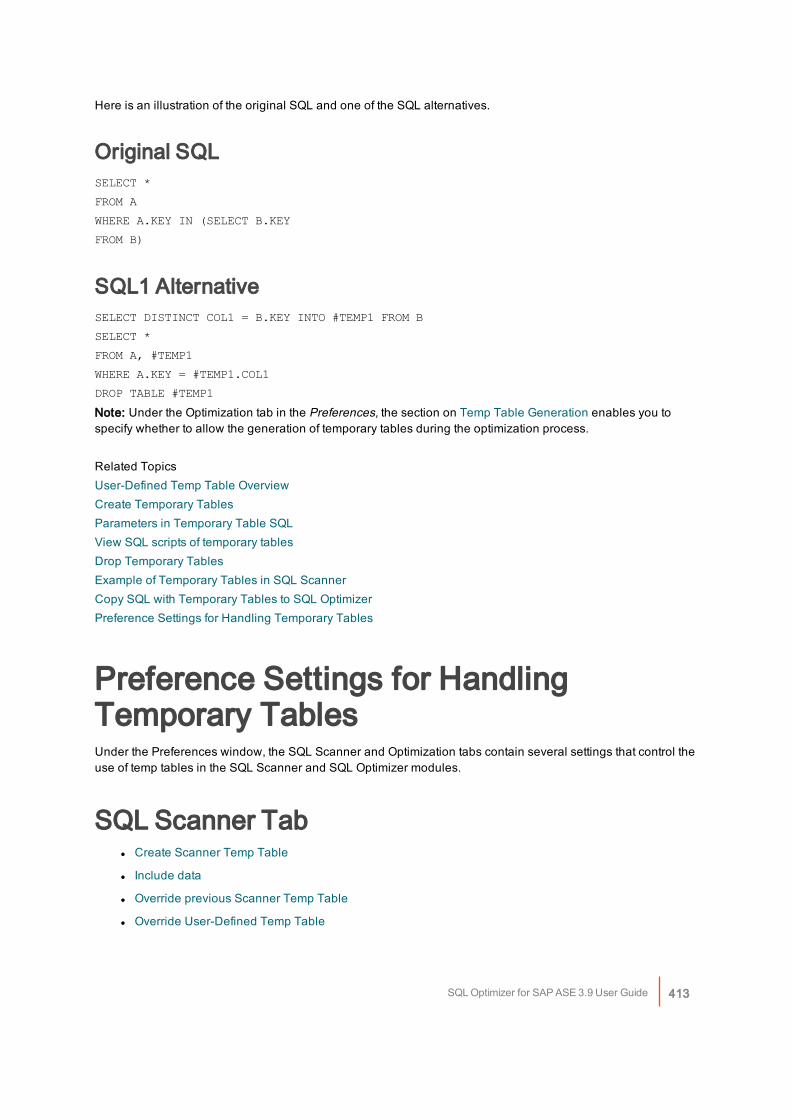
Here is an illustration of the original SQL and one of the SQL alternatives.
Original SQLSELECT *
FROM A
WHERE A.KEY IN (SELECT B.KEY
FROM B)
SQL1 AlternativeSELECT DISTINCT COL1 = B.KEY INTO #TEMP1 FROM B
SELECT *
FROM A, #TEMP1
WHERE A.KEY = #TEMP1.COL1
DROP TABLE #TEMP1
Note: Under the Optimization tab in the Preferences, the section on Temp Table Generation enables you tospecify whether to allow the generation of temporary tables during the optimization process.
Related TopicsUser-Defined Temp Table OverviewCreate Temporary TablesParameters in Temporary Table SQLView SQL scripts of temporary tablesDrop Temporary TablesExample of Temporary Tables in SQL ScannerCopy SQL with Temporary Tables to SQL OptimizerPreference Settings for Handling Temporary Tables
Preference Settings for HandlingTemporary TablesUnder the Preferences window, the SQL Scanner and Optimization tabs contain several settings that control theuse of temp tables in the SQL Scanner and SQL Optimizer modules.
SQL Scanner Tabl Create Scanner Temp Table
l Include data
l Override previous Scanner Temp Table
l Override User-Defined Temp Table
SQL Optimizer for SAP ASE 3.9 User Guide 413
Optimization Tabl Temp table generation
l Apply selected forces to temp table
Related TopicsUser-Defined Temp Table OverviewCreate Temporary TablesParameters in Temporary Table SQLView SQL scripts of temporary tablesDrop Temporary TablesExample of Temporary Tables in SQL ScannerCopy SQL with Temporary Tables to SQL OptimizerCreate Alternative SQL Which Uses Temporary Tables
SQL History OverviewThroughout the program, SQL statements are saved in the SQL History so that you can use them again. Theyare stored in a file so that they are always available to work with again.
Related TopicsSQL History WindowSQL History Functions
SQL History WindowView SQL History Window
SQL Optimizer for SAP ASE 3.9 User Guide 414
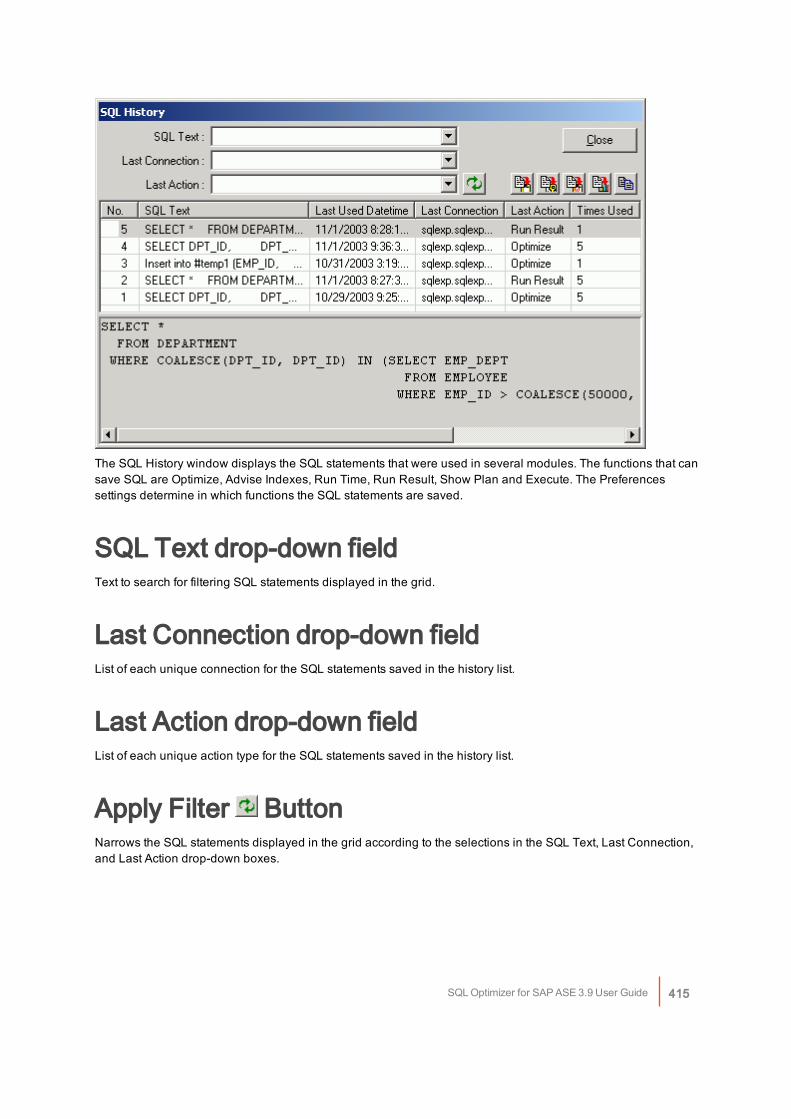
The SQL History window displays the SQL statements that were used in several modules. The functions that cansave SQL are Optimize, Advise Indexes, Run Time, Run Result, Show Plan and Execute. The Preferencessettings determine in which functions the SQL statements are saved.
SQL Text drop-down fieldText to search for filtering SQL statements displayed in the grid.
Last Connection drop-down fieldList of each unique connection for the SQL statements saved in the history list.
Last Action drop-down fieldList of each unique action type for the SQL statements saved in the history list.
Apply Filter ButtonNarrows the SQL statements displayed in the grid according to the selections in the SQL Text, Last Connection,and Last Action drop-down boxes.
SQL Optimizer for SAP ASE 3.9 User Guide 415
Button BarButtons for copying the selected SQL statement to other modules: Send to SQL Optimizer, Send to IndexAdvisor, Save SQL to SQL Repository, Copy to SQL Worksheet, and Copy SQL and Close Window.
GridItem Description
No The SQL statements are numbered as they are saved in sequential order.
SQL Text The text of the SQL statement. When you click a line, the full text of the SQLstatement displays in the bottom pane of the window.
Last Used Datetime The date and time the SQL was last used in one of the modules.
Last Connection The connection information for the last time the SQL statement was used.
Last Action The action that was used which caused the SQL statement to be saved.
Times Used The number of times the SQL statement has been saved in the SQL History.
Related TopicsSQL History OverviewFilter SQL StatementsRecall a SQL StatementSQL History Functions
Filter SQL StatementsThe SQL statements can be filtered to help you locate the specific SQL statement that you are looking for. Threedrop-down boxes provide you with the filtering options.
To filter the display of the SQL statements
1. Select the filtering criteria from one or more of the list:
List Description
SQL Text Enter or select text to filter the SQL statements displayed in the grid.
Last Connection Select the connection that you want used to filter the SQL statements displayed inthe grid. This drop-down list contains a list of the unique connections in the SQLHistory list.
SQL Optimizer for SAP ASE 3.9 User Guide 416
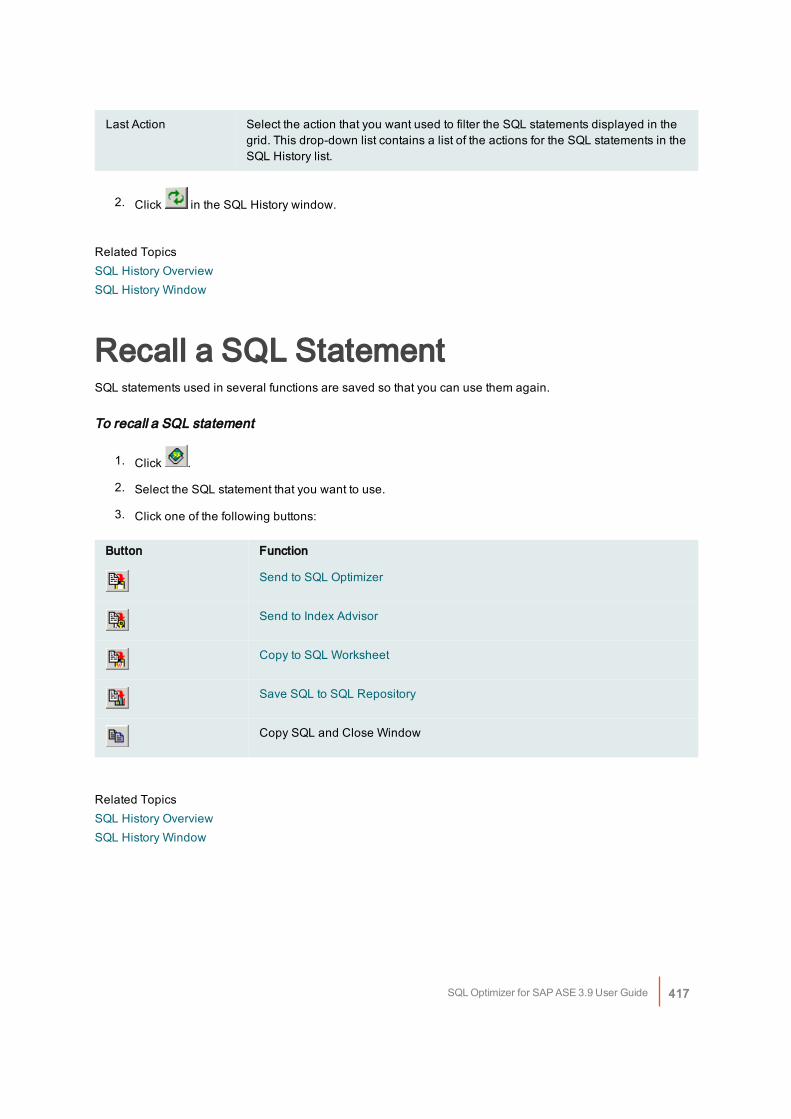
Last Action Select the action that you want used to filter the SQL statements displayed in thegrid. This drop-down list contains a list of the actions for the SQL statements in theSQL History list.
2. Click in the SQL History window.
Related TopicsSQL History OverviewSQL History Window
Recall a SQL StatementSQL statements used in several functions are saved so that you can use them again.
To recall a SQL statement
1. Click .
2. Select the SQL statement that you want to use.
3. Click one of the following buttons:
Button Function
Send to SQL Optimizer
Send to Index Advisor
Copy to SQL Worksheet
Save SQL to SQL Repository
Copy SQL and Close Window
Related TopicsSQL History OverviewSQL History Window
SQL Optimizer for SAP ASE 3.9 User Guide 417
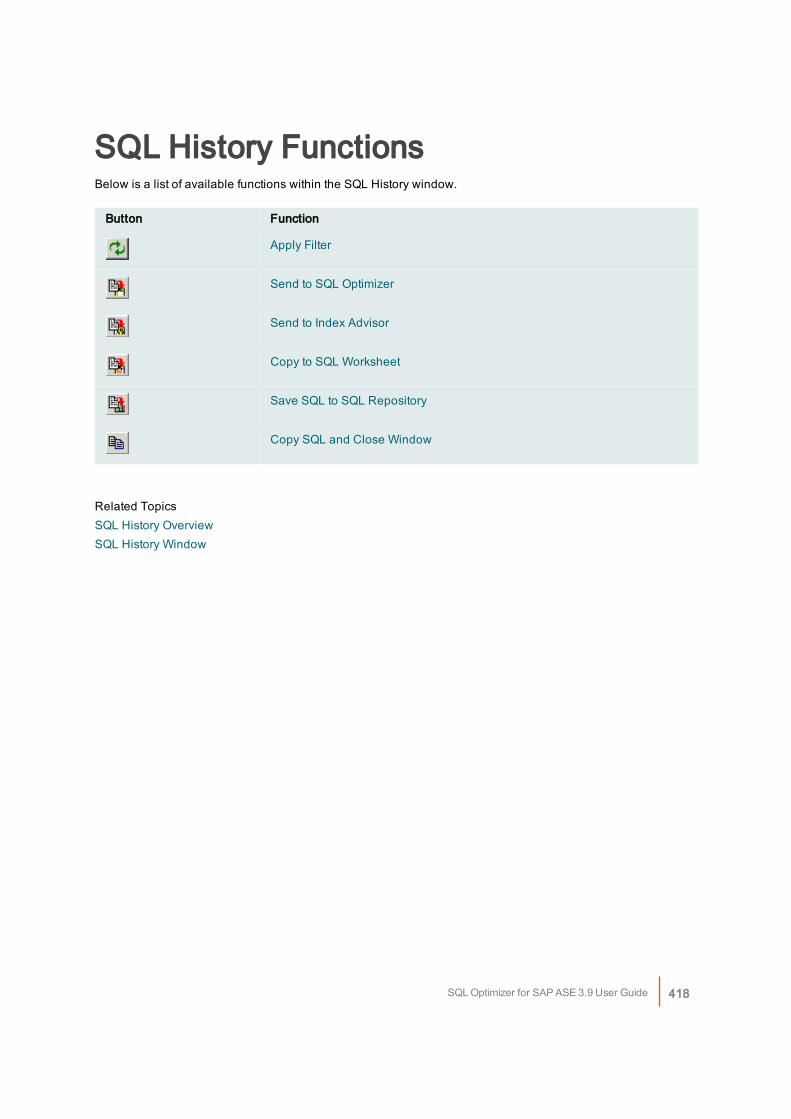
SQL History FunctionsBelow is a list of available functions within the SQL History window.
Button Function
Apply Filter
Send to SQL Optimizer
Send to Index Advisor
Copy to SQL Worksheet
Save SQL to SQL Repository
Copy SQL and Close Window
Related TopicsSQL History OverviewSQL History Window
SQL Optimizer for SAP ASE 3.9 User Guide 418


![AC 07-006 STS PPL-ASE CAAV[2]2018-1.fm](https://img.pdfslide.net/doc/110x75/63244b7eb104cba27a091365/ac-07-006-sts-ppl-ase-caav22018-1fm.jpg)


